UNITED STATES
SECURITIES AND EXCHANGE COMMISSION
Washington, D.C. 20549
FORM
(Mark One)
ANNUAL REPORT PURSUANT TO SECTION 13 OR 15(d) OF THE SECURITIES EXCHANGE ACT OF 1934 |
For the fiscal year ended
OR
TRANSITION REPORT PURSUANT TO SECTION 13 OR 15(d) OF THE SECURITIES EXCHANGE ACT OF 1934 |
For the transition period from ________to________
Commission File Number
(Exact name of Registrant as specified in its Charter)
|
||
(State or other jurisdiction of incorporation or organization) |
|
(IRS Employer Identification No.) |
|
|
|
|
||
(Address of principal executive office) |
|
(zip code) |
Registrant’s telephone number, including area code (
Securities registered pursuant to Section 12(b) of the Act:
Title of each class |
|
Trading Symbol(s) |
|
Name of each exchange on which registered |
|
|
Securities registered pursuant to Section 12(g) of the Act:
None
Indicate by check mark if the registrant is a well-known seasoned issuer, as defined in Rule 405 of the Securities Act. Yes ☐
Indicate by check mark if the registrant is not required to file reports pursuant to Section 13 or 15(d) of the Act. Yes ☐
Indicate by check mark whether the registrant: (1) has filed all reports required to be filed by Section 13 or 15(d) of the Securities Exchange Act of 1934 during the preceding 12 months (or for such shorter period that the registrant was required to file such reports), and (2) has been subject to such filing requirements for the past 90 days.
Indicate by check mark whether the registrant has submitted electronically every Interactive Data File required to be submitted pursuant to Rule 405 of Regulation S-T (§232.405 of this chapter) during the preceding 12 months (or for such shorter period that the registrant was required to submit such files).
Indicate by check mark whether the registrant is a large accelerated filer, an accelerated filer, a non-accelerated filer, a smaller reporting company, or an emerging growth company. See the definition of “large accelerated filer,” “accelerated filer” “smaller reporting company” and “emerging growth company” in Rule 12b-2 of the Exchange Act.
Large accelerated filer |
|
☐ |
|
☒ |
|
|
|
|
|
|
|
Non-accelerated filer |
|
☐ |
Small reporting company |
|
|
|
|
|
|
|
|
|
|
|
Emerging growth company |
|
If an emerging growth company, indicate by check mark if the registrant has elected not to use the extended transition period for complying with any new or revised financial accounting standards provided pursuant to Section 13(a) of the Exchange Act. ☐
Indicate by check mark whether the registrant has filed a report on and attestation to its management’s assessment of the effectiveness of its internal control over financial reporting under Section 404(b) of the Sarbanes-Oxley Act (15 U.S.C. 7262(b)) by the registered public accounting firm that prepared or issued its audit report.
If securities are registered pursuant to Section 12(b) of the Act, indicate by check mark whether the financial statements of the registrant included in the filing reflect the correction of an error to previously issued financial statements.
Indicate by check mark whether any of those error corrections are restatements that required a recovery analysis of incentive-based compensation received by any of the registrant’s executive officers during the relevant recovery period pursuant to §240.10D-1(b). ☐
Indicate by check mark whether the registrant is a shell company (as defined in Rule 12b-2 of the Act). Yes ☐ No
As of June 30, 2023 the last business day of the registrant’s most recently completed second fiscal quarter, the aggregate market value of the registrant’s voting and non-voting common equity held by non-affiliates of the registrant was $
Indicate the number of shares outstanding of each of the registrant’s classes of common stock, as of the latest practicable date.
|
Shares outstanding as of February 29, 2024 |
Common Stock, par value $1.00 per share |
DOCUMENTS INCORPORATED BY REFERENCE
None.
Table of Contents
Cautionary Note Regarding Forward-looking statements
|
|
|
|
Page |
PART I |
|
|
|
|
Item 1. |
|
|
1 |
|
Item 1A. |
|
|
14 |
|
Item 1B. |
|
|
27 |
|
Item 1C. |
|
|
27 |
|
Item 2. |
|
|
30 |
|
Item 3. |
|
|
30 |
|
Item 4. |
|
|
30 |
|
|
|
|
|
|
PART II |
|
|
|
|
Item 5. |
|
|
31 |
|
Item 6. |
|
|
32 |
|
Item 7. |
|
Management’s Discussion and Analysis of Financial Condition and Results of Operations |
|
33 |
Item 7A. |
|
|
52 |
|
Item 8. |
|
|
53 |
|
Item 9. |
|
Changes in and Disagreements With Accountants on Accounting and Financial Disclosure |
|
107 |
Item 9A. |
|
|
107 |
|
Item 9B. |
|
|
107 |
|
Item 9C. |
|
Disclosure Regarding Foreign Jurisdictions That Prevent Inspections |
|
|
|
|
|
|
|
PART III |
|
|
|
|
Item 10. |
|
Directors, Executive Officers and Corporate Governance |
|
109 |
Item 11. |
|
|
114 |
|
Item 12. |
|
Security Ownership of Certain Beneficial Owners and Management and Related Stockholder Matters |
|
133 |
Item 13. |
|
Certain Relationships and Related Transactions, and Director Independence |
|
135 |
Item 14. |
|
Principal Accountant Fees and Services |
|
136 |
|
|
|
|
|
PART IV |
|
|
|
|
Item 15. |
|
|
138 |
|
Item 16. |
|
|
141 |
|
|
|
|
142 |
TERMINOLOGY
The terms “we,” “our,” “us,” “CapStar,” “the Company,” “CSTR” and “CapStar Financial” that appear in this Annual Report on Form 10-K (this “Report”) refer to CapStar Financial Holdings, Inc. and its wholly-owned subsidiary, CapStar Bank, which we sometimes refer to as “CapStar Bank,” “our bank subsidiary,” “the Bank” and “our Bank”. The term “Old National” refers to Old National Bancorp, an Indiana corporation.
i
CAUTIONARY NOTE REGARDING FORWARD-LOOKING STATEMENTS
This Report contains certain "forward-looking statements" within the meaning of Section 27A of the Securities Act of 1933, as amended (the "Securities Act"), and Section 21E of the Securities Exchange Act of 1934, as amended (the "Exchange Act"). These forward-looking statements reflect our current views with respect to, among other things, statements relating to the Company’s assets, business, cash flows, condition (financial or otherwise), credit quality, financial performance, liquidity, short and long-term performance goals, prospects, results of operations, strategic initiatives, the benefits, cost and synergies of completed acquisitions or dispositions, and the timing, benefits, costs and synergies of future acquisitions, disposition and other growth opportunities. These statements are often, but not always, made through the use of words or phrases such as “may,” “should,” “could,” “predict,” “potential,” “believe,” “will likely result,” “expect,” “continue,” “will,” “anticipate,” “seek,” “aspire,” “estimate,” “intend,” “plan,” “project,” “projection,” “forecast,” “roadmap,” “goal,” “target,” “would,” and “outlook,” or the negative version of those words or other comparable words of a future or forward-looking nature. Forward-looking statements express only management's beliefs regarding future results or events and are subject to inherent uncertainty, risks and changes in circumstances, many of which are outside of management's control. Uncertainty, risks, changes in circumstances and other factors could cause the Company's actual results to differ materially from those projected in the forward-looking statements. Factors that could cause actual results to differ from those discussed in such forward-looking statements include, but are not limited to: (1) difficulty attracting and retaining highly-effective employees; (2) our ability to successfully execute our business plan; (3) difficulty growing or sustaining deposit and loan balances; (4) changes in consumer preferences, spending and borrowing habits, and demand for our products and services; (5) negative economic and political conditions that adversely affect the general economy, especially in the communities and markets in which we conduct our business, the banking sector housing prices, the real estate market, the job market, consumer confidence, the financial condition of our borrowers and consumer spending habits, which may affect, among other things, the levels of non-performing assets, charge-offs and provision expense; (6) credit risk, including the risk that negative credit quality trends may lead to a deterioration of asset quality, risk that our allowance for credit losses may not be sufficient to absorb actual losses in our loan portfolio, and risk from concentrations within our loan portfolio; (7) market risk, including interest rate and liquidity risk; (8) operational risk, including cybersecurity risk and risk of fraud, data processing system failures, and network breaches; (9) increased competition, including competition from non-bank financial institutions; (10) changes in regulations, laws, taxes, government policies, monetary policies and accounting policies affecting bank holding companies and their subsidiaries; (11) regulatory enforcement actions and adverse legal actions; (12) the potential effects of events beyond our control that may have a destabilizing effect on financial markets and the economy, such as inflation or recession, terrorist activities, wars and other foreign conflicts, climate change, disruptions in our customers’ supply chains, disruptions in transportation, essential utility outages or trade disputes and related tariffs; (13) other economic, competitive, technological, operational, governmental, regulatory, and market factors affecting our operations; and (14) risks relating to our proposed acquisition by Old National Bancorp, including, without limitation, (i) the risk that the proposed merger may not be completed in a timely manner or at all; (ii) the occurrence of any event, change or other circumstance that could give rise to the termination of the merger agreement; (iii) effect of the announcement or pendency of the proposed merger on the Company’s business relationships, operating results and business generally; (iv) risks that the proposed transaction disrupts current plans and operations of the Company; (v) potential difficulties in retaining the Company’s customers and employees as a result of the proposed transaction; (vi) diversion of management’s attention from ongoing business operations and opportunities; (vii) certain restrictions during the pendency of the proposed transaction that may impact the Company’s ability to pursue certain business opportunities; and (vii) expected cost savings, synergies and other financial benefits from the merger not being realized within the expected time frames and costs or difficulties relating to integration matters being greater than expected. The foregoing factors should not be construed as exhaustive and should be read in conjunction with the section entitled “Risk Factors” included in this Report and in future reports and other documents that we file with the Securities and Exchange Commission. If one or more events related to these or other risks or uncertainties materialize, or if our underlying assumptions prove to be incorrect, actual results may differ materially from our forward-looking statements. Accordingly, you should not place undue reliance on any such forward-looking statements. Any forward-looking statement speaks only as of the date of this Report, and we do not undertake any obligation to publicly update or review any forward-looking statement, whether as a result of new information, future developments or otherwise, except as required by law. New risks and uncertainties may emerge from time to time, and it is not possible for us to predict their occurrence or how they will affect us.
ii
PART I
ITEM 1. BUSINESS
OVERVIEW
We are a bank holding company that is headquartered in Nashville, Tennessee. We operate primarily through our wholly owned subsidiary, CapStar Bank. CapStar provides traditional banking and other financial services through its 31 bank locations and 360 associates. As of December 31, 2023, we had total assets of $3.1 billion, total deposits of $2.7 billion, total net loans of $2.2 billion, and shareholders’ equity of $361.6 million.
Proposed Acquisition by Old National
On October 26, 2023, Old National and the Company entered into a definitive merger agreement for Old National (the "Old National Merger Agreement") to acquire CapStar in an all-stock transaction with an aggregate value of approximately $344 million, or $16.64 per share of CapStar common stock, based on Old National’s 30-day volume weighted average closing stock price ending October 25, 2023 (the "Merger"). Under the terms of the Old National Merger Agreement, shareholders of the Company will receive, in respect of each share of common stock of the Company held by them, 1.155 shares of common stock of Old National. Following the Merger (on a date to be determined by Old National), CapStar Bank will merge with and into Old National Bank, a wholly-owned subsidiary of Old National, with Old National Bank as the surviving bank (the "Bank Merger"). On February 21, 2024, the Company disclosed that the Board of Governors of the Federal Reserve System approved the Merger and the Office of the Comptroller of the Currency approved the Bank Merger. On February 29, 2024, the Company's shareholders approved the Merger at a special meeting.
Business Highlights
The primary products and services provided by CapStar are:
Our strategy is to maintain broadly diversified loan and deposit portfolios in terms of the type of loan product, the type of client and the industries in which our business clients are engaged.
Commercial and industrial loans consist of loans to small to mid-sized businesses and other legal entities. Commercial and industrial loans are reliant on the ability of a borrower’s cash flow from operations to repay the loan. Most commercial and industrial loans are secured with the collateral securing these loans being inventory, receivables, and equipment. Lending products include commercial loans, business term loans, equipment financing and lines of credit to a diversified mix of small and medium sized businesses. As of December 31, 2023, commercial and industrial loans totaled $501.9 million or 22.1% of the Company’s loan portfolio.
Commercial real estate loans consist of owner-occupied and non-owner-occupied commercial real estate loans. Owner-occupied commercial real estate loans having many of the characteristics of commercial and industrial loans with the primary source of repayment reliant on the ability of the borrower’s cash flow to repay the loan. Non-owner occupied commercial real estate loans finance well-managed income producing properties supported by a history of profitable operations and cash flows, and proven operating stability. As of December 31, 2023, owner-occupied and non-owner-occupied commercial real estate loans totaled $281.2 million and $761.2 million or 12.4% and 33.5%, respectively, of the Company’s loan portfolio.
Residential real estate loans consist of loans to individuals secured by first priority liens for the purchase or refinance of a residence as well as first priority lien home equity loans which allow individuals to borrow against equity in their home. Residential mortgages primarily consist of three- and five-year adjustable-rate mortgages with amortization up to 30 years as well as longer-term fixed rate loans produced by our mortgage division with the intent to sell in the
1
secondary market. Home equity loans include lines of credit as well as amortizing term loans on which may be first or second liens. As of December 31, 2023, residential real estate loans totaled $423.3 million or 18.7% of the Company’s loan portfolio.
Construction and land development loans consist of loans where the repayment is dependent on the successful completion and operation and/or sale of the related real estate project. Construction and land development loans include 1-4 family construction projects and commercial construction endeavors such as warehouses, apartments, office and retail space and land acquisition and development. As of December 31, 2023, construction and land development loans totaled $212.5 million or 9.4% of the Company’s loan portfolio.
Consumer loans consist of loans secured by automobiles, boats, recreational vehicles, certificates of deposit, other personal property, or in a limited case may be unsecured. As of December 31, 2023, consumer loans totaled $48.8 million or 2.1% of the Company’s loan portfolio.
Other loans consists of all loans not included in the classes of loans above and leases. As of December 31, 2023, other loans totaled $40.8 million or 1.8% of the Company’s loan portfolio.
CapStar’s underwriting guidelines are reviewed regularly and approved annually by our Board of Directors. Our underwriting process includes:
Our underwriting processes collaboratively engage our bankers and credit underwriters in the analysis of each loan request. We manage our credit risks by analyzing metrics in order to maintain a conservative and well-diversified loan portfolio reflective of our assessment of various subsets within our market. Based upon our aggregate exposure to any given borrower relationship, we employ a tiered review of loan originations that may involve joint line and credit authorization, our bank’s Credit Committee or, ultimately, our full board of directors.
Our strategy for credit risk management includes the disciplined underwriting process described above and ongoing risk monitoring and review processes for all loan exposures. Our Chief Credit Officer provides bank-wide credit oversight and regularly reviews the loan portfolio to ensure that the underwriting and risk identification processes are functioning properly. We strive to identify potential problem loans early in an effort to aggressively seek resolution of these situations before the loans become delinquent or impaired, record any necessary charge-offs promptly and maintain adequate allowance levels for probable loan losses inherent in the loan portfolio. Annually, we submit ourselves to review by independent third parties to validate our internal oversight.
Market Area and Competition
CapStar operates in the community markets of Athens, Lawrenceburg/Waynesboro, and Manchester, Tennessee as well as the metropolitan markets of Asheville, North Carolina and Chattanooga, Knoxville, and Nashville, Tennessee which are included among the fastest growing nationally. The bank seeks business development and serves customers through a team of commercial relationship managers and its 23 banking locations. The financial services industry is highly competitive and each of these markets has a significant presence of other financial service providers. In particular, we estimate that, as of June 30, 2023, Tennessee included more than 83 financial institutions with over $117.6 billion in deposits. We compete directly with other bank and nonbank institutions located within our market area, internet-based banks, and out-of-market banks that advertise in or otherwise serve our market area, along with money market and mutual funds, brokerage houses, mortgage companies, and insurance companies or other commercial entities that offer financial services products. Competition involves efforts to retain current clients, obtain new loans and deposits, increase the scope and type of services offered, and offer competitive interest rates paid on deposits and charged on loans. Many of our competitors enjoy competitive advantages, including greater financial resources, a wider geographic presence, the ability to offer additional services, more favorable pricing alternatives,
2
and lower origination and operating costs. Some of our competitors have been in business for a long time and have an established client base and name recognition. We expect to continue to face increasing competition.
Human Capital
As of December 31, 2023, we had 360 total employees. As a service-oriented business, our long-term success depends on our people and we are committed to taking a multi-dimensional approach to talent and culture. Our people and culture are critical to the Company’s long-term success. The Company maintains a strong focus on engagement and performs an annual study using a third party consultant to access the Company's engagement. For 2023, the Company received a favorable ranking at 73rd percentile for engagement nationally based on an independent survey conducted by Gallup, Inc.
As such, our talent vision and strategy focus on:
SUPERVISION AND REGULATION
General
Insured banks, their holding companies and their affiliates are extensively regulated under federal and state law. As a result, our growth and earnings performance and that of our subsidiaries may be affected not only by management decisions and general economic conditions, but also by the requirements of federal and state statutes and by the regulations and policies of various bank regulatory agencies, including the Tennessee Department of Financial Institutions ("TDFI"), the Board of Governors of the Federal Reserve System (the “Federal Reserve”), the Federal Deposit Insurance Corporation (“FDIC”), the Office of the Comptroller of the Currency (“OCC”) and the Consumer Financial Protection Bureau (“CFPB”). Furthermore, tax laws administered by the Internal Revenue Service (“IRS”) and state taxing authorities, accounting rules developed by the Financial Accounting Standards Board (“FASB”), securities laws administered by the Securities and Exchange Commission (“SEC”) and state securities authorities, anti-money laundering laws enforced by the U.S. Department of the Treasury and mortgage related rules, including with respect to loan securitizations and servicing by the U.S. Department of Housing and Urban Development and agencies such as Ginnie Mae and Freddie Mac, have an impact on our business. The effect of these statutes, regulations, regulatory policies and rules are significant to our operations and results and those of our bank, and the nature and extent of future legislative, regulatory or other changes affecting financial institutions are impossible to predict with any certainty.
Federal and state banking laws impose a comprehensive system of supervision, regulation and enforcement on the operations of insured banks, their holding companies and affiliates that are intended primarily for the protection of the depositors of banks, rather than their shareholders. These federal and state laws, and the regulations of the bank regulatory agencies issued under them, affect, among other things, the scope of business, the kinds and amounts of investments banks may make, reserve requirements, capital levels relative to operations, the nature and amount of collateral for loans, the establishment of branches, the ability to merge, consolidate and enter into acquisitions with other companies, dealings with insiders and affiliates and the payment of dividends.
This supervisory and regulatory framework subjects banks and bank holding companies to regular examination by their respective primary federal regulators, which results in examination reports and ratings that, while not publicly available, can impact the conduct and growth of their businesses. These examinations consider not only compliance with applicable laws and regulations, but also capital levels, asset quality and risk, management ability and performance, earnings, liquidity, and various other factors. The regulatory agencies generally have broad discretion to impose restrictions and limitations on the operations of a regulated entity where the agencies determine, among
3
other things, that such operations are unsafe or unsound, fail to comply with applicable law or are otherwise inconsistent with laws and regulations or with the supervisory policies of these agencies.
The following is a summary of the material elements of the supervisory and regulatory framework applicable to us and our bank. It does not describe all of the statutes, regulations and regulatory policies that apply, nor does it restate all of the requirements of those that are described. The descriptions are qualified in their entirety by reference to the particular statutory and regulatory provision.
Bank Holding Company Regulation
Since we own all of the capital stock of our bank, we are a bank holding company under the Bank Holding Company Act of 1956, as amended (“BHC Act”). As a result, we are primarily subject to the supervision, examination and reporting requirements of the BHC Act and the regulations of the Federal Reserve.
Acquisition of Banks
The BHC Act requires every bank holding company to obtain the Federal Reserve’s prior approval before:
Additionally, the BHC Act provides that the Federal Reserve may not approve any of the above transactions if such transaction would result in or tend to create a monopoly or substantially lessen competition or otherwise function as a restraint of trade, unless the anti-competitive effects of the proposed transaction are clearly outweighed by the public interest in meeting the convenience and needs of the community to be served. The Federal Reserve is also required to consider the financial and managerial resources and future prospects of the bank holding companies and banks concerned and the convenience and needs of the community to be served. The Federal Reserve’s consideration of financial resources includes a focus on capital adequacy, which is discussed in the section titled “Item 1. Business—Regulation and Supervision—Capital Adequacy.” The Federal Reserve also considers the effectiveness of the institutions in combating money laundering, including a review of the anti-money laundering program of the acquiring bank holding company and the anti-money laundering compliance records of a bank to be acquired as part of the transaction. Finally, the Federal Reserve takes into consideration the extent to which the proposed transaction would result in greater or more concentrated risks to the stability of the U.S. banking or financial system.
Under the BHC Act, if well-capitalized and well-managed, we or any other bank holding company located in Tennessee may purchase a bank located outside of Tennessee without regard to whether such transaction is prohibited under state law. Conversely, a well-capitalized and well-managed bank holding company located outside of Tennessee may purchase a bank located inside Tennessee without regard to whether such transaction is prohibited under state law. In each case, however, state law may place restrictions on the acquisition of a bank that has only been in existence for a limited amount of time or will result in concentrations of deposits exceeding limits specified by statute. For example, Tennessee law currently prohibits a bank holding company from acquiring control of a Tennessee-based financial institution until the target financial institution has been in operation for at least three years.
Change in Bank Control
Subject to various exceptions, the BHC Act and the Change in Bank Control Act, together with related regulations, require Federal Reserve approval prior to any person or company acquiring “control” of a bank holding company. Under a rebuttable presumption established by the Federal Reserve pursuant to the Change in Bank Control Act, the acquisition of 10% or more of a class of voting stock of a bank holding company would constitute acquisition of “control” of the bank holding company if no other person will own, control, or hold the power to vote a greater percentage of that class of voting stock immediately after the transaction or the bank holding company has registered securities under the Exchange Act. In addition, any person or group of persons acting in concert must obtain the approval of the Federal Reserve under the BHC Act before acquiring 25% (or 5% in the case of an acquirer that is already a bank holding company) or more of the outstanding voting stock of a bank holding company, the right to control in any manner the election of a majority of the company’s directors, or otherwise obtaining control or a “controlling influence” over the bank holding company.
4
Permitted Activities
Under the BHC Act, a bank holding company is generally permitted to engage in or acquire direct or indirect control of the voting shares of any company engaged in the following activities:
Activities that the Federal Reserve has found to be so closely related to banking as to be a proper incident to the business of banking include:
The Federal Reserve may order a bank holding company or its subsidiaries to terminate any of these activities or to terminate its ownership or control of any subsidiary when it has reasonable cause to believe that the bank holding company’s continued ownership, activity or control constitutes a serious risk to the financial safety, soundness, or stability of it or any of its bank subsidiaries.
Support of Subsidiary Institutions
The Federal Deposit Insurance Act and Federal Reserve policy require a bank holding company to serve as a source of financial and managerial strength to its bank subsidiaries. As a result of a bank holding company’s source of strength obligation, a bank holding company may be required to provide funds to a bank subsidiary in the form of subordinate capital or other instruments which qualify as capital under bank regulatory rules. Any loans from the holding company to such subsidiary banks likely would be unsecured and subordinated to such bank’s depositors and perhaps to other creditors of the bank.
Repurchase or Redemption of Securities
A bank holding company is generally required to give the Federal Reserve prior written notice of any purchase or redemption of its own then outstanding equity securities if the gross consideration for the purchase or redemption, when combined with the net consideration paid for all such purchases or redemptions during the preceding 12 months, is equal to 10% or more of the company’s consolidated net worth. The Federal Reserve may disapprove such a purchase or redemption if it determines that the proposal would constitute an unsafe and unsound practice, or would violate any law, regulation, Federal Reserve order or directive, or any condition imposed by, or written agreement with, the Federal Reserve. The Federal Reserve has adopted an exception to this approval requirement for well-capitalized bank holding companies that meet certain conditions. The Federal Reserve also expects a bank holding company to inform the Federal Reserve prior to any repurchase or redemption that would result in a net reduction as
5
of the end of the quarter in the amount of such equity instruments outstanding compared with the beginning of the quarter in which the redemption or repurchase occurred.
Bank Regulation and Supervision
Our bank is subject to extensive federal and state banking laws and regulations that impose restrictions on and provide for general regulatory oversight of the operations of our bank. These laws and regulations are generally intended to protect the safety and soundness of our bank and our bank’s depositors, rather than our shareholders. The following discussion describes the material elements of the regulatory framework that applies to our bank.
Since our bank is a commercial bank chartered under the laws of the state of Tennessee and is a member of the Federal Reserve System, it is primarily subject to the supervision, examination and reporting requirements of the Federal Reserve and the TDFI. The Federal Reserve and the TDFI regularly examine our bank’s operations and have the authority to approve or disapprove mergers, the establishment of branches and similar corporate actions. Both regulatory agencies have the power to take enforcement action to prevent the development or continuance of unsafe or unsound banking practices or other violations of law. Our bank’s deposits are insured by the FDIC to the maximum extent provided by law. Our bank is also subject to numerous federal and state statutes and regulations that affect its business, activities and operations.
Branching
Under current Tennessee law, our bank may open branch offices throughout Tennessee with the prior approval of, or prior notice to, the TDFI and the Federal Reserve. In addition, with prior regulatory approval, our bank may acquire branches of existing banks located in Tennessee. Under federal law, our bank may establish branch offices with the prior approval of the Federal Reserve. While prior law imposed various limits on the ability of banks to establish new branches in states other than their home state, the Dodd-Frank Act allows a bank to branch into a new state by setting up a new branch if, under the laws of the state in which the branch is to be located, a state bank chartered by that state would be permitted to establish the branch. This makes it much simpler for banks to open de novo branches in other states.
FDIC Insurance and Other Assessments
The Bank pays deposit insurance assessments to the Deposit Insurance Fund, which is determined through a risk-based assessment system. The Bank’s deposit accounts are currently insured by the Deposit Insurance Fund, generally up to a maximum of $250,000 per separately insured depositor, per ownership category. The Bank pays assessments to the FDIC for such deposit insurance. Under the current assessment system, the assessment rate is determined by the risk category assigned to an institution based on the institution’s most recent supervisory and capital evaluations which are designed to measure risk, with riskier institutions paying a higher assessment rate. Under the Federal Deposit Insurance Act, the FDIC may terminate a bank’s deposit insurance upon a finding that the institution has engaged in unsafe and unsound practices, is in an unsafe or unsound condition to continue operations, or has violated any applicable law, regulation, rule, order, agreement or condition imposed by the FDIC.
Community Reinvestment Act
The Community Reinvestment Act (“CRA”) requires that, in connection with examinations of financial institutions within their respective jurisdictions, the federal banking agencies will evaluate the record of each financial institution in meeting the needs of its local community, including low- and moderate-income neighborhoods. Our bank’s record of performance under the CRA is publicly available. A bank’s CRA performance is also considered in evaluating applications seeking approval for mergers, acquisitions, and new offices or facilities. Failure to adequately meet these criteria could result in additional requirements and limitations being imposed on the bank. Additionally, we must publicly disclose the terms of certain CRA-related agreements. As of December 31, 2023, the Bank had a CRA rating of “Satisfactory.”
Interest Rate Limitations
Interest and other charges collected or contracted for by our bank are subject to applicable state usury laws and federal laws concerning interest rates.
6
Federal Laws Applicable to Consumer Credit and Deposit Transactions
Our bank’s loan and deposit operations are subject to a number of federal consumer protection laws, including:
Capital Adequacy
Pursuant to the Dodd-Frank Act, under the adopted regulations, the Basel member central bank and federal bank regulators approved the Basel Capital Adequacy Accord, or Basel III. The U.S. Basel III rule’s minimum capital to risk-weighted assets, or RWA, requirements are as follows: (1) a common equity Tier 1 capital ratio of 4.5%, (2) a Tier 1 capital ratio of 6.0%, and (3) a total capital ratio of 8.0%. The minimum leverage ratio (Tier 1 capital to total assets) is 4.0%. The rule also changed the definition of capital, mainly by adopting stricter eligibility criteria for regulatory capital instruments, and new constraints on the inclusion of minority interests, mortgage-servicing assets, deferred tax assets, and certain investments in the capital of unconsolidated financial institutions. In addition, the U.S. Basel III rule requires that most regulatory capital deductions be made from common equity Tier 1 capital.
Under the U.S. Basel III rule, in order to avoid limitations on capital distributions, including dividend payments and certain discretionary bonus payments to executive officers, a banking organization must maintain a capital conservation buffer composed of common equity Tier 1 capital above its minimum risk-based capital requirements. The buffer is measured relative to RWA. Phase-in of the capital conservation buffer requirements began on January 1, 2016, and the requirements became fully phased in on January 1, 2019. A banking organization maintaining capital levels in excess of the fully phased-in capital conservation buffer of 2.5% would not be subject to limits on capital distributions or discretionary bonus payments; however, a banking organization with a buffer of less than 2.5% would be subject to increasingly stringent limitations as the buffer approaches zero. A banking organization also would be prohibited from making distributions or discretionary bonus payments during any quarter if its eligible retained income is negative in that quarter and its capital conservation buffer ratio was less than 2.5% at the beginning of the quarter. Effectively, the Basel III framework requires us to meet minimum risk-based capital ratios of (i) 7% for common equity Tier 1 capital, (ii) 8.5% Tier 1 capital, and (iii) 10.5% total capital. The eligible retained income of a banking organization is defined as its net income for the four calendar quarters preceding the current calendar quarter, based on the organization’s quarterly regulatory reports, net of any distributions and associated tax effects not already reflected in net income. With the capital conservation buffer fully phased in, the minimum capital requirements plus the capital conservation buffer will exceed the prompt corrective action, or PCA, well-capitalized thresholds.
7
Failure to meet statutorily mandated capital guidelines or more restrictive ratios separately established for a banking institution could subject the institution to a variety of enforcement remedies available to federal regulatory authorities, including issuance of a capital directive, the termination of deposit insurance by the FDIC, a prohibition on accepting or renewing brokered deposits, limitations on the rates of interest that the institution may pay on its deposits, and other restrictions on its business.
The Company's capital position is discussed in the Capital Adequacy section of "Item 7. Management's Discussion and Analysis of Financial Condition and Results of Operations" and in Note 16 to the "Notes to Consolidated Financial Statements."
Prompt Corrective Action
The Federal Deposit Insurance Corporation Improvement Act of 1991 (“FDICIA”) establishes a system of “prompt corrective action” (“PCA”) to resolve the problems of undercapitalized insured depository institutions. Under this system, the federal banking regulators have established five capital categories (well capitalized, adequately capitalized, undercapitalized, significantly undercapitalized and critically undercapitalized) into which all insured depository institutions are placed. The federal banking agencies have specified by regulation the relevant capital thresholds and other qualitative requirements for each of those categories. For an insured depository institution to be “well capitalized” under the PCA framework, it must have a common equity Tier 1 capital ratio of 6.5%, Tier 1 capital ratio of 8.0%, a total capital ratio of 10.0%, and a Tier 1 leverage ratio of 5.0%, and must not be subject to any written agreement, order or capital directive, or prompt corrective action directive issued by its primary federal regulator to meet and maintain a specific capital level for any capital measure. As of December 31, 2023, our bank qualified for the “well capitalized” category.
Federal banking regulators are required to take various mandatory supervisory actions and are authorized to take other discretionary actions with respect to institutions in the three undercapitalized categories. The severity of the action depends upon the capital category in which the institution is placed. For example, institutions in all three undercapitalized categories are automatically restricted from paying distributions and management fees, whereas only an institution that is significantly undercapitalized or critically undercapitalized is restricted in its compensation paid to senior executive officers. Generally, subject to a narrow exception, the banking regulator must appoint a receiver or conservator for an institution that is critically undercapitalized.
An institution that is categorized as undercapitalized, significantly undercapitalized, or critically undercapitalized is required to submit an acceptable capital restoration plan to its appropriate federal banking agency. A bank holding company must guarantee that a subsidiary depository institution meets its capital restoration plan, subject to various limitations. The controlling holding company’s obligation to fund a capital restoration plan is limited to the lesser of (i) 5% of an undercapitalized subsidiary’s assets at the time it became undercapitalized and (ii) the amount required to meet regulatory capital requirements. An undercapitalized institution is also generally prohibited from increasing its average total assets, making acquisitions, establishing any branches or engaging in any new markets or product offerings, except under an accepted capital restoration plan or with Federal Reserve approval.
The regulations also establish procedures for downgrading an institution to a lower capital category based on supervisory factors other than capital.
Liquidity
Financial institutions are subject to significant regulatory scrutiny regarding their liquidity positions. This scrutiny has increased following events of the first half of 2023, as the magnitude and speed of deposit outflows at a few financial institutions was unprecedented. Various bank regulatory publications, including the Addendum to the Interagency Policy Statement on Funding and Liquidity Risk Management: Importance of Contingency Funding Plans (July 28, 2023), Federal Reserve SR 10-6 (Funding and Liquidity Risk Management) and FDIC Financial Institution Letter FIL-84-2008 (Liquidity Risk Management), address the identification, measurement, monitoring and control of funding and liquidity risk by financial institutions.
The Company's liquidity is discussed in the Liquidity Risk section of "Item 7. Management's Discussion and Analysis of Financial Condition and Results of Operations."
8
Payment of Dividends
We are a legal entity separate and distinct from our bank. Our principal source of cash flow, including cash flow to pay dividends to our shareholders, is dividends our bank pays to us as our bank’s sole shareholder. Statutory and regulatory limitations apply to our bank’s payment of dividends to us as well as to our payment of dividends to our shareholders. The requirement that a bank holding company must serve as a source of strength to its subsidiary banks also results in the position of the Federal Reserve that a bank holding company should not maintain a level of cash dividends to its shareholders that places undue pressure on the capital of its bank subsidiaries or that can be funded only through additional borrowings or other arrangements that may undermine the bank holding company’s ability to serve as a source of strength. Our ability to pay dividends is also subject to the provisions of Tennessee corporate law which prevents payment of dividends if, after giving effect to such payment, we would not be able to pay our debts as they become due in the usual course of business or our total assets would be less than the sum of our total liabilities plus any amounts needed to satisfy any preferential rights if we were dissolving. In addition, in deciding whether or not to declare a dividend of any particular size, our board of directors must consider our and our bank’s current and prospective capital, liquidity, and other needs.
The TDFI also regulates our bank’s dividend payments. Under Tennessee law, a state-chartered bank may not pay a dividend without prior approval of the Commissioner of the TDFI if the total of all dividends declared by its board of directors in any calendar year will exceed (i) the total of its retained net income for that year, plus (ii) its retained net income for the preceding two years.
Our bank’s payment of dividends may also be affected or limited by other factors, such as the requirement to maintain adequate capital above regulatory guidelines. The federal banking agencies have indicated that paying dividends that deplete a depository institution’s capital base to an inadequate level would be an unsafe and unsound banking practice. Under FDICIA, a depository institution may not pay any dividends if payment would cause it to become undercapitalized or if it already is undercapitalized. Moreover, the federal agencies have issued policy statements providing that bank holding companies and insured banks should generally only pay dividends out of current operating earnings.
Information regarding the Company's dividends is provided in various sections including "Item 7.Management's Discussion and Analysis of Financial Condition and Results of Operations - Market and Liquidity Risk Management," "Item 8. Financial Statements and Supplementary Data" and Note 16 to the "Notes to Consolidated Financial Statements."
Restrictions on Transactions with Affiliates and Insiders
Our bank is subject to Section 23A of the Federal Reserve Act, which places limits on the amount of the bank’s transactions with its affiliates.
Subject to various exceptions, the total amount of the bank’s transactions with affiliates is limited in amount, as to any one affiliate, to 10% of a bank’s capital and surplus and, as to all affiliates combined, to 20% of a bank’s capital and surplus. In addition to the limitation on the amount of these transactions, transactions with affiliates also must meet specified collateral requirements and safety and soundness requirements. Our bank must also comply with provisions prohibiting the acquisition of low-quality assets from an affiliate.
Our bank is also subject to Section 23B of the Federal Reserve Act, which, among other things, prohibits a bank from engaging in transactions with affiliates, as well as other types of transactions set forth in Section 23B, unless the transactions are on terms substantially the same, or at least as favorable to the bank, as those prevailing at the time for comparable transactions with nonaffiliated companies.
9
Our bank is also subject to restrictions on extensions of credit to its executive officers, directors, principal shareholders and their related interests. These extensions of credit (i) must be made on substantially the same terms, including interest rates and collateral, as those prevailing at the time for comparable transactions between the bank and third parties, and (ii) must not involve more than the normal risk of repayment or present other unfavorable features. There are also individual and aggregate limitations on loans to insiders and their related interests. The aggregate amount of insider loans generally cannot exceed the institution’s total unimpaired capital and surplus. Insiders and banks are subject to enforcement actions for knowingly entering into insider loans in violation of applicable restrictions.
Single Borrower Credit Limits
Under Tennessee law, total loans and extensions of credit to a borrower may not exceed 15% of our bank’s capital, surplus and undivided profits. However, such loans may be in excess of that percentage, but not above 25%, if each loan in excess of 15% is first submitted to and approved in advance in writing by the board of directors and a record is kept of such written approval and reported to the board of directors quarterly.
Commercial Real Estate Concentration
In December 2006, the federal banking regulators issued guidance entitled “Concentrations in Commercial Real Estate Lending, Sound Risk Management Practices” to address increased concentrations in commercial real estate, or CRE, loans. In addition, in December 2015, the federal banking agencies issued additional guidance entitled “Statement on Prudent Risk Management for Commercial Real Estate Lending.” Together, these guidelines describe the criteria the agencies will use as indicators to identify institutions potentially exposed to CRE concentration risk. An institution that has (i) experienced rapid growth in CRE lending, (ii) notable exposure to a specific type of CRE, (iii) total reported loans for construction, land development, and other land representing 100% or more of the institution’s capital, or (iv) total CRE loans representing 300% or more of the institution’s capital, and the outstanding balance of the institutions CRE portfolio has increased by 50% or more in the prior 36 months, may be identified for further supervisory analysis of the level and nature of its CRE concentration risk. As of December 31, 2023, our bank’s total CRE loans represented 243.05% of total capital.
Privacy
Financial institutions are required to disclose their policies for collecting and protecting non-public personal information of their clients. Clients generally may prevent financial institutions from sharing non-public personal information with nonaffiliated third parties except under certain circumstances, such as the processing of transactions requested by the consumer or when the financial institution is jointly offering a product or service with a nonaffiliated financial institution. Additionally, financial institutions generally are prohibited from disclosing consumer account numbers to any nonaffiliated third party for use in telemarketing, direct mail marketing or other marketing to consumers.
Consumer Credit Reporting
The Fair Credit Reporting Act (“FCRA”) imposes, among other things:
10
Anti-Terrorism and Money Laundering Legislation
Our bank is subject to the Bank Secrecy Act and USA Patriot Act. These statutes and related rules and regulations impose requirements and limitations on specified financial transactions and accounts and other relationships intended to guard against money laundering and terrorism financing. Our bank has established an anti-money laundering program pursuant to the Bank Secrecy Act and customer identification program pursuant to the USA Patriot Act. The bank also maintains records of cash purchases of negotiable instruments, files reports of certain cash transactions exceeding $10,000 (daily aggregate amount), and reports suspicious activity that might signify money laundering, tax evasion, or other criminal activities pursuant to the Bank Secrecy Act. Our bank otherwise has implemented policies and procedures to comply with the foregoing requirements.
Overdraft Fees
Federal Reserve Regulation E restricts banks’ abilities to charge overdraft fees. The rule prohibits financial institutions from charging fees for paying overdrafts on ATM and one-time debit card transactions, unless a consumer consents, or opts in, to the overdraft service for those types of transactions.
The Dodd-Frank Act
As final rules and regulations implementing the Dodd-Frank Act have been adopted, this law significantly changed and continues to significantly affect the bank regulatory framework and the lending, deposit, investment, trading and operating activities of banks and their holding companies. The Dodd-Frank Act requires various federal agencies to adopt a broad range of new implementing rules and regulations and to prepare numerous studies and reports for Congress. The federal agencies are given significant discretion in drafting the implementing rules and regulations, and consequently, many of the details and much of the impact of the Dodd-Frank Act will depend on the rules and regulations that implement it.
A number of the effects of the Dodd-Frank Act are described or otherwise accounted for in various parts of this “Supervision and Regulation” section. The following items provide a brief description of certain other provisions of the Dodd-Frank Act that may be relevant to us and our bank.
11
The Volcker Rule
On December 10, 2013, five U.S. financial regulators, including the Federal Reserve, adopted a final rule implementing the “Volcker Rule.” The Volcker Rule was created by Section 619 of the Dodd-Frank Act, which generally prohibits any “banking entity” from engaging in proprietary trading or retaining an ownership interest in, sponsoring, or having certain relationships with covered funds (i.e., hedge funds or private equity funds). In addition, the Volcker Rule requires each regulated entity to establish an internal compliance program that is consistent with the extent to which it engages in activities covered by the Volcker Rule.
On October 8, 2019, the agencies finalized revisions to the Volcker Rule that, among other things, simplified and streamlined compliance requirements for banking entities that do not have significant trading activities, while banking entities with significant trading activity would become subject to more stringent compliance requirements. Further, the revisions to the Volcker Rule implemented Section 203 of the Economic Growth, Regulatory Relief, and Consumer Protection Act (EGRRCPA), which amended the definition of “banking entity” to exclude certain community banks from the definition of insured depository institution, the general result of which was to exclude such banks and their affiliates and subsidiaries from the scope of the Volcker Rule. Under EGRRCPA, a community bank and its affiliates are generally excluded from the definition of “banking entity” if the bank and all companies that control the bank have total consolidated assets equal to $10 billion or less and trading assets and liabilities equal to five percent or less of total consolidated assets. Based on these criteria the Company is excluded from the definition of "banking entity" and thus is not impacted by the Volcker Rule. These revisions became effective on January 1, 2020, with a required compliance date of January 1, 2021.
Limitations on Incentive Compensation
In April 2016, the Federal Reserve and other federal financial agencies re-proposed restrictions on incentive-based compensation pursuant to Section 956 of the Dodd-Frank Act for financial institutions with $1 billion or more in total consolidated assets. For institutions with at least $1 billion but less than $50 billion in total consolidated assets, such as the Company and our bank, the proposal imposes principles-based restrictions that are broadly consistent with existing interagency guidance on incentive-based compensation. Such institutions are prohibited from entering into incentive compensation arrangements that encourage inappropriate risks by the institution (1) by providing an executive officer, employee, director, or principal shareholder with excessive compensation, fees, or benefits, or (2) that could lead to material financial loss to the institution. The proposal also imposes certain governance and recordkeeping requirements on institutions of the Company’s and our bank’s size. The Federal Reserve reserves the authority to impose more stringent requirements on institutions of the Company’s and our bank’s size.
Cybersecurity and the handling of personal information
Cybersecurity is a high-priority item for legislators and regulators at the federal and state levels, as well as internationally. State and federal banking regulators have issued various policy statements and, in some cases, regulations, emphasizing the importance of technology risk management and supervision. Such policy statements and regulations indicate that financial institutions should design multiple layers of security controls to establish lines of defense and to ensure that their risk management processes also address the risk posed by compromised customer credentials, including security measures to reliably authenticate customers accessing internet-based services of the financial institution. A financial institution’s management is expected to maintain sufficient business continuity planning processes to ensure the rapid recovery, resumption and maintenance of the institution’s operations after a cyberattack involving destructive malware. A financial institution is expected to develop appropriate processes to enable recovery of data and business operations and address rebuilding network capabilities and restoring data if the institution or its critical service providers fall victim to this type of cyberattack. These requirements, including state regulatory rules such as the detailed and extensive cybersecurity rules issued in 2016 by the New York State Department of Financial Services, may cause us to incur significant additional compliance costs and in some cases may impact our growth prospects. Additionally, if we fail to observe federal or state regulatory guidance, we could be subject to various regulatory sanctions, including financial penalties.
In the ordinary course of business, we rely on electronic communications and information systems to conduct our operations and store sensitive data. We employ an in-depth, layered, defensive approach that leverages people, processes and technology to manage and maintain cybersecurity controls. We also employ a variety of preventative and detective tools to monitor, block, and provide alerts regarding suspicious activity, as well as to report on any suspected advanced persistent threats. Notwithstanding the strength of our defensive measures, the threat from cyberattacks is severe, as attacks are sophisticated and increasing in volume and complexity, and attackers respond rapidly to changes in defensive measures. Our systems and those of our customers and third-party service providers are under constant threat, and it is possible that we or they could experience a significant event in the future that could adversely affect our business or operations. As cybersecurity threats continue to evolve, we may be required to expend
12
significant additional resources to continue to modify or enhance our protective measures or to investigate and remediate any information security vulnerabilities. Financial expenditures may also be required to meet regulatory changes in the information security and cybersecurity domains. Risks and exposures related to cybersecurity attacks are expected to remain high for the foreseeable future due to the rapidly evolving nature and sophistication of these threats, as well as the expanding use of internet banking, mobile banking and other technology-based products and services by us and our customers. See “Item 1A. – Risk Factors” and "Item 1C. - Cybersecurity" in this Annual Report for a further discussion of risks related to cybersecurity, how we manage those risks and our governance structure regarding cybersecurity.
Federal statutes and regulations, including the Gramm-Leach-Bliley Act (“GLBA”) and the Right to Financial Privacy Act of 1978, limit our ability to disclose non-public information about consumers, customers and employees to nonaffiliated third parties. Specifically, the GLBA requires us to disclose our privacy policies and practices relating to sharing non-public information and enables retail customers to opt out of our ability to share information with unaffiliated third parties under certain circumstances. The GLBA also requires us to implement a comprehensive information security program that includes administrative, technical and physical safeguards to ensure the security and confidentiality of customer records and information and, if applicable state law is more protective of customer privacy than the GLBA, financial institutions, including our bank, will be required to comply with such state law. Other laws and regulations impact our ability to share certain information with affiliates and non-affiliates for marketing and/or non-marketing purposes. These regulations affect how consumer information is transmitted through diversified financial companies and conveyed to outside vendors. In connection with the regulations governing the privacy of consumer financial information, the federal banking agencies, including the FDIC, have adopted guidelines for establishing information security standards and programs to protect such information.
Proposed or new legislation and regulations may also significantly increase our compliance cost and impede our ability to grow into specific markets. There are a number of proposals that have either recently been adopted or are currently pending before federal, state, and foreign legislative and regulatory bodies. For example, the European Union adopted the General Data Protection Regulation (the “GDPR”), which became effective on May 25, 2018. In addition, California passed the California Consumer Privacy Act of 2018 (the “CCPA”) on June 28, 2018. Both the GDPR and the CCPA impose additional obligations on companies regarding the handling of personal data and provide certain individual privacy rights to persons whose data is stored. In the event of a data breach, there are mandatory reporting requirements that may hamper the ability to fully assess an incident prior to external reporting. We must maintain awareness of additional legal and regulatory requirements that apply to existing and future subsets of the customer base for protection against legal, reputational, and financial risk due to compliance failures.
AVAILABLE INFORMATION
We file reports with the SEC including annual reports on Form 10-K, quarterly reports on Form 10-Q, current reports on Form 8-K, and proxy statements, as well as any amendments to those reports and statements. The SEC maintains an internet site that contains reports, proxy and information statements and other information regarding issuers that file electronically with the SEC at http://www.sec.gov. Our annual reports on Form 10-K, quarterly reports on Form 10-Q, current reports on Form 8-K, proxy statements and amendments to those reports and statements filed or furnished pursuant to section 13(a) or 15(d) of the Exchange Act are also accessible at no cost on our website at http://www.ir.capstarbank.com after they are electronically filed with the SEC. Reference to our website does not constitute incorporation by reference of the information contained on the website and should not be considered part of this Report.
We have also posted our Corporate Governance Guidelines, Code of Ethics and Conflicts of Interest Policy for directors, officers and employees, and the charters of our Audit Committee, Risk Committee, Nominating and Corporate Governance Committee, and Compensation and Human Resources Committee of our board of directors on the Corporate Governance section of our website at www.ir.capstarbank.com. We will make any legally required disclosures regarding amendments to, or waivers of, provisions of our Corporate Governance Guidelines, Code of Ethics and Conflicts of Interest Policy, or current committee charters on our website. We will also provide a copy of our Corporate Governance Guidelines, Code of Ethics and Conflicts of Interest Policy, and any committee charters without charge upon written request sent to 1201 Demonbreun Street, Suite 700, Nashville, Tennessee 37203, Attention: Investor Relations.
13
ITEM 1A. RISK FACTORS
This Item outlines specific risks that could affect the ability of our various businesses to compete, change our risk profile or materially affect our assets, business, cash flow, condition (financial or otherwise), liquidity, prospects and results of operations. Many of these risks are beyond our control, though efforts are made to manage those risks while optimizing financial and operational results, and our operating environment continues to evolve and new risks continue to emerge. This Item highlights risks that could affect us in material ways by causing future results to differ materially from past results, by causing future results to differ materially from current expectations, or by causing material changes in our financial condition. Some of these risks are interrelated and the occurrence of one or more of them may exacerbate the effect of others. You should carefully read and consider the following risks factors, together with the other information contained in or incorporated by reference into this Report before investing in shares of our common stock.
Risks Related To Our Business
Outbreaks of communicable diseases, (such as COVID-19 and its variants), have led to periods of significant volatility in financial, commodities (including oil and gas) and other markets, adversely affected our ability to conduct normal business, adversely affected our clients, and are likely to harm our businesses, financial condition and results of operations.
Pandemics and widespread outbreaks of communicable diseases (such as COVID-19) have caused and may continue to cause significant disruption in the international and United States economies and financial markets and have had an adverse effect on our business and results of operations. This has recently been accompanied by a surge in flu and other respiratory illnesses of varying seriousness and magnitude. The spread of these diseases, including COVID variants, has caused illness and death resulting in quarantines, cancellation of events and travel, business and school shutdowns, reduction in business activity and financial transactions, supply chain interruptions, and overall economic and financial market instability. In response to the COVID-19 pandemic, the governments of the states in which we have branches, and most other states, periodically took preventative or protective actions, such as imposing restrictions on travel and business operations, advising or requiring individuals to limit or forego their time outside of their homes, and ordering temporary closures of businesses that have been deemed to be non-essential. These restrictions and other consequences of public health issues resulted in significant adverse effects for many different types of businesses, including, among others, those in the hospitality (including hotels and lodging) and restaurant industries, and resulted in a significant number of layoffs and furloughs of employees nationwide and in the regions in which we operate.
As a business operating in the financial services industry, our business and operations may be adversely affected in numerous and complex ways by weak economic conditions.
Our business and operations, which primarily consist of lending money to clients in the form of loans, borrowing money from clients in the form of deposits and investing in securities, are sensitive to general business and economic conditions in the United States. If the U.S. economy weakens, our growth and profitability from our lending, deposit and investment operations could be constrained. Uncertainty about the federal fiscal policymaking process, the medium- and long-term fiscal outlook of the federal government, and future tax rates is a concern for businesses, consumers and investors in the United States. In addition, economic and other conditions in foreign countries could affect the stability of global financial markets, which could hinder United States economic growth.
Weak economic conditions may be characterized by numerous factors; such as deflation, fluctuations in debt and equity capital markets, a lack of liquidity and/or depressed prices in the secondary market for mortgage loans, increased delinquencies on mortgage, consumer and commercial loans, residential and commercial real estate price declines and lower home sales and commercial activity. All of these factors can individually or in the aggregate be detrimental to our business, and the interplay between these factors can be complex and unpredictable. Adverse economic conditions could have a material adverse effect on our assets, business, cash flow, condition (financial or otherwise), liquidity, prospects and results of operations.
Our business and operations are concentrated in our Target Market (References herein to our “Target Market” includes the state of Tennessee, Asheville, NC, and geographical areas within a 100-mile radius of any of our
14
banking locations), and we are more sensitive than our more geographically diversified competitors to adverse changes in the local economy.
Unlike with many of our larger competitors that maintain significant operations located outside our market area, substantially all of our clients are individuals and businesses located and doing business in our Target Market. As of December 31, 2023, approximately 90% of the loans in our loan portfolio (measured by dollar amount) were made to borrowers who live or conduct business in our Target Market. Therefore, our success will depend in large part upon the general economic conditions in this area, which we cannot predict with certainty. As a result, our operations and profitability may be more adversely affected by a local economic downturn in our Target Market than those of larger, more geographically diverse competitors. From time to time, our bank may provide financing to clients who own or have companies or properties located outside our Target Market. In such cases, we would face similar local market risk in those communities for these clients.
Competition from financial institutions and other financial service providers may adversely affect our profitability.
The banking business is highly competitive, and we experience competition in our market from many other financial institutions. We compete with commercial banks, credit unions, savings and loan associations, mortgage banking firms, internet banks, consumer finance companies, securities brokerage firms, insurance companies, money market funds, and other mutual funds, as well as other community banks and super-regional and national financial institutions that operate offices in our service area. These competitors have differing levels of marketing resources, capital, regulatory requirements, and funding.
We compete with these other financial institutions both in attracting deposits, in making loans, and in hiring staff. Our profitability depends upon our continued ability to successfully compete with an array of financial institutions in our service area.
We are dependent on the services of our management team and board of directors, and the unexpected loss of key personnel or directors may adversely affect our business and operations.
We are led by an experienced management team with substantial experience in the markets that we serve, and our operating strategy focuses on providing products and services through long-term relationship managers and ensuring that our largest clients have relationships with our senior management team. Accordingly, our success depends in large part on the performance of these key personnel, as well as on our ability to attract, motivate and retain highly qualified senior and middle management. Competition for employees is intense, and the process of locating key personnel with the combination of skills and attributes required to execute our business plan may be lengthy. If any of our executive officers, other key personnel, or directors leaves us or our bank, our operations may be adversely affected. Additionally, our directors’ community involvement and diverse and extensive local business relationships are important to our success.
Our reputation is critical to our business, and damage to it could have a material adverse effect on us.
The Company faces threats to its reputation from many sources, including adverse sentiment about financial institutions generally, unethical practices, employee misconduct, failure to deliver expected standards of service or quality, regulatory compliance deficiencies, and questionable or fraudulent activities of the Company’s employees and customers. Negative publicity may arise regarding the Company’s business, employees, or customers, with or without merit, and could result in the loss of customers, investors and employees, costly litigation, a decline in revenue, and increased regulatory oversight.
Credit and Interest Rate Risks
The Company is subject to lending risk, and the impacts of interest rate changes could adversely impact the Company.
There are inherent risks associated with the Company’s lending activities. These risks include, among other things, the impact of changes in interest rates and changes in the economic conditions in the markets where the Company operates. Increases in interest rates and/or weakening economic conditions could adversely impact the ability of borrowers to repay outstanding loans or the value of the collateral securing these loans. The Company is also subject to various laws and regulations that affect its lending activities. Failure to comply with applicable laws and regulations
15
could subject the Company to regulatory enforcement action that could result in restrictions of the Company's activities or the assessment of significant civil money penalties against the Company.
As of December 31, 2023, approximately 33.5% of our loan portfolio was composed of non-owner occupied commercial real estate loans, 12.4% of owner occupied commercial real estate loans, 18.7% consumer real estate loans, and 9.4% construction and land development loans. The Company's concentration of loans secured by real estate may subject the Company to additional risk, such as fluctuations in market value of collateral, environmental liability associated with hazardous or toxic substances found on, in or around the collateral, and difficulty monitoring income-producing property serving as a source of repayment and collateral. Additionally, non-owner occupied commercial real estate loans typically involve repayment dependent upon income generated, or expected to be generated, by the property securing the loan in amounts sufficient to cover operating expenses and debt service. Weak economic conditions or other market factors can result in increased vacancy rates for retail, office and industrial property. The adequacy of such income for repayment may be adversely affected by changes in the economy or local market conditions.
Additionally, we target small and medium sized businesses as loan clients. Because of their size, these borrowers may be less able to withstand competitive, economic or financial pressures than larger borrowers in periods of economic weakness. If loan losses occur at a level where the allowance for loan losses is not sufficient to cover actual loan losses, our earnings will decrease.
We may not be able to adequately assess and limit our credit risk, which could adversely affect our profitability.
A primary component of our business involves making loans to clients. The business of lending is inherently risky because the principal or interest on the loan may not be repaid timely or at all or the value of any collateral supporting the loan may be insufficient to cover our outstanding exposure. These risks may be affected by the strength of the borrower’s business sector and local, regional and national market and economic conditions. Our risk management practices, such as monitoring our loan applicants and the concentration of our loans and our credit approval practices, may not adequately assess credit risk, and our credit administration personnel, policies and procedures may not adequately adapt to changes in economic or any other conditions affecting clients and the quality of the loan portfolio. A failure to effectively assess and limit the credit risk associated with our loan portfolio could have a material adverse effect on our assets, business, cash flow, condition (financial or otherwise), liquidity, prospects and results of operations.
Our allowance for credit losses may prove to be insufficient to absorb losses inherent in our loan portfolio.
We maintain an allowance for credit losses that represents management’s best estimate of the credit losses and risks inherent in our loan portfolio. The level of the allowance reflects management’s continuing evaluation of concentrations, specific credit risks, loan loss experience, current loan portfolio quality, present economic, political and regulatory conditions and unidentified losses inherent in the current loan portfolio. The determination of the appropriate level of the allowance for credit losses is highly subjective and requires us to make significant estimates of current credit risks and future trends, all of which may undergo material changes in a relatively short time period. Inaccurate management assumptions, continuing deterioration of economic conditions affecting borrowers, new information regarding existing loans, identification of additional problem loans and other factors, both within and outside of our control, may require us to increase our allowance for loan losses. In addition, our regulators, as an integral part of their examination process, periodically review our loan portfolio and the adequacy of our allowance for credit losses and may require adjustments based upon judgments that are different than those of management. Further, if actual charge-offs in future periods exceed the amounts allocated to the allowance for credit losses, we may need to increase our provision for credit losses to restore the adequacy of our allowance for such losses. If we are required to materially increase our level of allowance for credit losses for any reason, our assets, business, cash flow, condition (financial or otherwise), liquidity, prospects and results of operations could be materially and adversely affected.
The value of real estate collateral may fluctuate significantly resulting in an under-collateralized loan portfolio.
The market value of real estate, particularly real estate held for investment, can fluctuate significantly in a short period of time as a result of market conditions in the geographic area in which the real estate is located. If the value of the real estate serving as collateral for the Company's loan portfolio were to decline materially, a significant part of the Company's loan portfolio could become under-collateralized. If the loans that are collateralized by real estate become troubled during a time when market conditions are declining or have declined, then, in the event of foreclosure, we may not be able to realize the amount of collateral that we anticipated at the time of originating the loan. This could
16
have a material adverse effect on the Company's provision for credit losses and the Company's operating results and financial condition.
We engage in lending secured by real estate and may be forced to foreclose on the collateral and own the underlying real estate, subjecting us to the costs and potential risks associated with the ownership of the real property.
Since we originate loans secured by real estate, we may have to foreclose on the collateral property to protect our investment and may thereafter own and operate such property, in which case we would be exposed to the risks inherent in the ownership of real estate. The amount that we, as a mortgagee, may realize after a default is dependent upon factors outside of our control, including, but not limited to general or local economic conditions, environmental cleanup liability, neighborhood assessments, interest rates, real estate tax rates, operating expenses of the mortgaged properties, supply of and demand for rental units or properties, ability to obtain and maintain adequate occupancy of the properties, zoning laws, governmental and regulatory rules, fiscal policies, and natural disasters. Our inability to manage the amount of costs or size of the risks associated with the ownership of real estate, or write-downs in the value of other real estate owned, could have a material adverse effect on our assets, business, cash flow, condition (financial or otherwise), liquidity, prospects and results of operations.
We have several large depositor relationships, the loss of which could force us to fund our business through more expensive and less stable sources.
As of December 31, 2023, our ten largest non-brokered depositors accounted for approximately 10% of our total deposits. Withdrawals of deposits by any one of our largest depositors could force us to rely more heavily on borrowings and other sources of funding for our business and withdrawal demands, adversely affecting our net interest margin and results of operations.
Liquidity risk could impair our ability to fund operations and meet our obligations as they become due, and our funding sources may be insufficient to fund our future growth.
Liquidity is essential to our business. An inability to raise funds, at competitive rates or at all, through deposits, borrowings, the sale of loans and other sources could have a substantial negative effect on our liquidity. Approximately 75.3% of our bank’s deposits as of December 31, 2023, were checking accounts and other liquid deposits, which are payable on demand or upon several days’ notice, while by comparison, 72.2% of the assets of our bank were loans at December 31, 2023, which cannot be called or sold in the same time frame. Our access to funding sources in amounts adequate to finance our activities or on terms that are acceptable to us could be impaired by factors that affect us specifically or the financial services industry or economy in general.
Factors that could negatively impact our access to liquidity sources include a decrease of our business activity as a result of a downturn in the markets in which our loans are concentrated, adverse regulatory action against us, or our inability to attract and retain deposits. Market conditions or other events could also negatively affect the level or cost of funding, affecting our ongoing ability to accommodate liability maturities and deposit withdrawals, meet contractual obligations and fund asset growth and new business transactions at a reasonable cost, in a timely manner and without adverse consequences.
Additionally, secondary market residential loans may require us to repurchase or substitute mortgage loans, or indemnify buyers against losses, in the event we breach representations or warranties to purchasers, guarantors and insurers, including government-sponsored entities, about the mortgage loans and the manner in which they were originated. In addition, we may be required to repurchase mortgage loans as a result of early payment default of the borrower on a mortgage loan. If repurchase and indemnity demands increase and such demands are valid claims and are in excess of our provision for potential losses, our liquidity, results of operations and financial condition may be adversely affected.
Any substantial, unexpected or prolonged change in the level or cost of liquidity could have a material adverse effect on our ability to meet deposit withdrawals and other client needs, which could have a material adverse effect on our asset growth, new business transactions, cash flow, condition (financial or otherwise), liquidity, prospects and results of operations.
Changes to interest rates could impact the financial outcomes of the Company.
Changes in monetary policy, including changes in interest rates, could influence not only the interest income the Company receives on loans and securities and the amount of interest it pays on deposits and borrowings, but such changes could also affect (i) the Company’s ability to originate loans and obtain deposits, (ii) the fair value of the Company’s financial assets and liabilities, and (iii) the average duration of the Company’s mortgage-backed securities portfolio. The Company’s earnings and cash flows are largely dependent upon its net interest income. Net interest income is the difference between interest income earned on interest-earning assets, such as loans and securities, and
17
interest expense paid on interest-bearing liabilities, such as deposits and borrowed funds. Interest rates are highly sensitive to many factors that are beyond the Company’s control, including general economic conditions and policies of various governmental and regulatory agencies and, in particular, the Board of Governors of the Federal Reserve System. If the interest rates paid on deposits and other borrowings increase at a faster rate than the interest rates received on loans and other investments, the Company’s net interest income, and therefore its earnings and net profit, could be adversely affected. Earnings also could be adversely affected if the interest rates received on loans and other investments fall more quickly than the interest rates paid on deposits and other borrowings. Changes in interest rates may also negatively affect the ability of the Company's borrowers to repay their loans, particularly as interest rates rise and adjustable-rate loans become more expensive.
Although management believes it has implemented effective asset and liability management strategies, including the use of derivatives as hedging instruments, to reduce the potential effects of changes in interest rates on the Company’s results of operations, any substantial, unexpected, prolonged change in market interest rates could have a material adverse effect on the Company’s financial condition and results of operations. Additionally, as indicated, many of our obligations, hedging transactions and portfolio loans have variable rate pricing that, following the transition from LIBOR, now are based upon other benchmark rates, such as SOFR - any uncertainties associated with these benchmark rates may affect our ability to effectively manage interest rate risk.
See the section Item 7, “Management’s Discussion and Analysis of Financial Condition and Results of Operations – Market and Liquidity Risk Management – Interest Rate Simulation Sensitivity Analysis" located elsewhere in this report for further discussion related to the Company’s management of interest rate risk.
The fair value of our investment securities could fluctuate because of factors outside of our control, which could have a material adverse effect on us.
Factors beyond our control could significantly affect the fair value of our investment securities. These factors include, but are not limited to, rating agency actions in respect of the securities, defaults by the issuer or with respect to the underlying securities, changes in market interest rates and instability in the capital markets. Any of these factors, among others, could cause realized and/or unrealized losses in future periods and declines in earnings and/or other comprehensive income (loss), which could materially and adversely affect our assets, business, cash flow, condition (financial or otherwise), liquidity, prospects and results of operations. The process for determining whether impairment of a security triggers a provision for credit losses usually requires complex, subjective judgments about the future financial performance and liquidity of the issuer, any collateral underlying the security as well as the Company’s intent and ability to hold the security for a sufficient period of time to allow for any anticipated recovery in fair value in order to assess the probability of receiving all contractual principal and interest payments on the security. Our failure to assess any impairments or losses with respect to our securities could have a material adverse effect on our assets, business, cash flow, condition (financial or otherwise), liquidity, prospects and results of operations.
Strategic Risks
Acquisition and other growth opportunities may present challenges
Any future acquisitions may result in unforeseen difficulties, which could require significant time and attention from the Company’s management that would otherwise be directed at developing its existing business and managing expenses. In addition, the Company could discover undisclosed liabilities resulting from any acquisitions for which it may become responsible. Further, the benefits that the Company anticipates from these acquisitions may not develop. We may experience difficulty integrating businesses acquired through mergers and acquisitions and may fail to realize the expected revenue increases, cost savings, increases in market presence, and other projected benefits from acquisition activity. Acquisitions utilizing the Company’s common stock as consideration may dilute the value of the Company’s common stock, which dilution may not be recouped or recovered for a significant amount of time after the acquisition, if ever.
Any merger or acquisition opportunity that we decide to pursue will ultimately be subject to regulatory approval and other closing conditions. We may expend significant time and resources pursing potential acquisitions that are never consummated due to lack of regulatory approval or other issues. Competition for acquisition candidates in the banking industry is intense. We may expend significant time and resources evaluating acquisition candidates and conducting due diligence that does not lead to an acquisition opportunity.
The Company may implement new lines of business, enter new market areas, or offer new products and services from time to time. There can be substantial risks and uncertainties associated with these efforts. The Company may invest
18
significant time and resources in developing and marketing new lines of business, but the benefits that the Company anticipates from these activities may not develop as expected. External factors, such as compliance with regulations, competitive alternatives, and shifting market preferences may impact the Company’s ability to successfully implement organic growth strategies. Failure to successfully manage these risks could have a material adverse effect on the Company’s financial condition and results of operations.
Our continued pace of growth may require us to raise additional capital in the future to fund such growth, and the unavailability of additional capital on terms acceptable to us could adversely affect us or our growth.
We believe that we have sufficient capital to meet our capital needs for our immediate growth plans. However, we will continue to need capital to support our longer-term growth plans. If capital is not available on favorable terms when we need it, we may have to either issue common stock or other securities on less than desirable terms or reduce our rate of growth until market conditions become more favorable. Either of such events could have a material adverse effect on our assets, business, cash flow, condition (financial or otherwise), liquidity, prospects and results of operations.
Operational Risks
Deterioration in the fiscal position of the U.S. federal government and downgrades in the U.S. Department of the Treasury and federal agency securities could adversely affect us and our banking operations.
In addition to causing economic and financial market disruptions, any future downgrade, failure to raise the U.S. statutory debt limit, or deterioration in the fiscal outlook of the U.S. federal government, could, among other things, materially adversely affect the market value of the U.S. and other government and governmental agency securities that we hold, the availability of those securities as collateral for borrowing, and our ability to access capital markets on favorable terms. In particular, such events could increase interest rates and disrupt payment systems, money markets, and long-term or short-term fixed income markets, adversely affecting the cost and availability of funding, which could negatively affect our profitability. Also, the adverse consequences of any downgrade could extend to those to whom we extend credit and could adversely affect their ability to repay their loans. Any of these developments could have a material adverse effect on our assets, business, cash flow, condition (financial or otherwise), liquidity, prospects and results of operations.
We are subject to losses resulting from fraudulent and negligent acts on the part of loan applicants, our borrowers, other third parties, and our employees.
When we originate loans, we rely heavily upon information supplied by third parties, including the information contained in the loan application, property appraisal, title information and employment and income documentation. If any of this information is intentionally or negligently misrepresented and such misrepresentation is not detected prior to loan funding, the fair value of the loan may be significantly lower than expected. Whether a misrepresentation is made by the loan applicant, the borrower, another third party or one of our employees, we generally bear the risk of loss associated with the misrepresentation. The persons and entities involved in such a misrepresentation are often difficult to locate, and we are often unable to collect any monetary losses that we have suffered from them.
19
We may bear costs associated with the proliferation of computer theft and cyber-crime.
We necessarily collect, use and hold sensitive data concerning individuals and businesses with whom we have a banking relationship. Threats to data security, including unauthorized access and cyber-attacks, rapidly emerge and change, exposing us to additional costs for protection or remediation and competing time constraints to secure our data in accordance with client expectations and statutory and regulatory requirements. Although we actively invest in the security of our technological infrastructure, it is not feasible to defend against every risk posed by rapid technological development and the increasing sophistication of cyber criminals. Patching and other measures to protect existing systems and servers could be inadequate, especially on systems that are being retired. Controls employed by our information technology department and third-party vendors could prove inadequate. We could also experience a breach by intentional or negligent conduct on the part of our employees or other internal sources, software bugs or other technical malfunctions, or other causes. As a result of any of these threats, our client accounts may become vulnerable to account takeover schemes or cyber-fraud. Our systems and those of our third-party vendors may also become vulnerable to damage or disruption due to circumstances beyond our or their control, such as from network failures, viruses and malware, power anomalies or outages, natural disasters and catastrophic events. Additionally, the use of artificial intelligence could exacerbate many of these risks.
A breach of our security or the security of our third-party vendors that results in unauthorized access to our data could expose us to a disruption or challenges relating to our daily operations as well as to data loss, litigation, damages, fines and penalties, client notification requirements, significant increases in compliance costs, and reputational damage, any of which could individually or in the aggregate have a material adverse effect on our assets, business, cash flow, condition (financial or otherwise), liquidity, prospects and results of operations.
Our risk management framework may not be effective in mitigating risks and/or losses to us.
Our risk management framework is comprised of various processes, systems and strategies and is designed to manage the types of risk to which we are subject, including, among others, credit, liquidity, capital, financial performance, asset/liability, operational, compliance and regulatory, Community Reinvestment Act, or CRA, strategic and reputational, information technology and legal. Our framework also includes financial or other modeling methodologies that involve management assumptions and judgment. Our risk management framework may not be effective under all circumstances, including if our management fails to follow our credit policies and procedures, and thus, it may not adequately mitigate any risk or loss to us. If our framework is not effective, we could suffer unexpected losses and our assets, business, cash flow, condition (financial or otherwise), liquidity, prospects and results of operations could be materially and adversely affected. We may also be subject to potentially adverse regulatory consequences.
We depend on our information technology and telecommunications systems, and any systems failures or interruptions could adversely affect our operations and financial condition.
We rely heavily on communications and information systems to conduct our business. Any failure or interruption in the operation of these systems could impair or prevent the effective operation of our client relationship management, general ledger, deposit, lending or other functions. While we have policies and procedures designed to prevent or limit the effect of a failure or interruption in the operation of our information systems, there can be no assurance that any such failures or interruptions will not occur or, if they do occur, that they will be adequately addressed. The occurrence of any failures or interruptions impacting our information systems could damage our reputation, result in a loss of clients, and expose us to additional regulatory scrutiny, civil litigation, and possible financial liability, any of which could have a material adverse effect on our financial condition and results of operations.
We are dependent upon outside third parties for the processing and handling of our records and data.
We rely on software developed by third-party vendors to process various transactions. In some cases, we have contracted with third parties to run their proprietary software on our behalf. These systems include, but are not limited to, general ledger, payroll, employee benefits, loan and deposit processing, and securities portfolio accounting. For example, one vendor provides our core banking system through a service bureau arrangement. While we perform a review of controls instituted by the applicable vendors over these programs in accordance with industry standards and perform our own testing of user controls, we rely on the continued maintenance of controls by these third-party vendors, including safeguards over the security of client data. We may incur a temporary disruption in our ability to conduct business or process transactions, or incur damage to our reputation, if the third-party vendor fails to adequately maintain internal controls or institute necessary changes to systems. We may need to switch third-party service providers from time-to-time, which could result in disruption to our business processes, damage to our reputation and
20
a breach of our data security measures. Such a disruption or breach of security may have a material adverse effect on our business. In addition, we may not be able to obtain or continue to obtain licenses and technologies from these third parties on reasonable terms or at all.
We encounter technological change continually and have fewer resources than certain of our competitors to invest in technological improvements.
The financial services industry is undergoing rapid technological changes, with frequent introductions of new technology-driven products and services. In addition to serving clients better, the effective use of technology increases efficiency and enables financial institutions to reduce costs. Our success will depend in part on our ability to address our clients’ needs by using technology to provide products and services that will satisfy client demands for convenience, as well as to create additional efficiencies in our operations. Certain of our competitors have substantially greater resources to invest in technological improvements than us, and in the future, we may not be able to implement new technology-driven products and services timely, effectively or at all or be successful in marketing these products and services to our clients. For example, companies which claim to offer applications and services based on artificial intelligence are beginning to compete much more directly with traditional financial services companies in areas involving personal advice, including high-margin services such as financial planning and wealth management. As these technologies are improved in the future, we may, in order to remain competitive, be required to make significant capital expenditures, which may increase our overall expenses and have a material adverse effect on our net income. There is also no guarantee that any such investment in these products and services will create additional efficiencies in our operations.
We may be adversely affected by the lack of soundness of other financial institutions.
Our ability to engage in routine funding transactions could be adversely affected by the actions and soundness of other financial institutions. Financial services companies are interrelated as a result of trading, clearing, counterparty, and other relationships. We have exposure to different industries and counterparties, and through transactions with counterparties in the financial services industry, including brokers and dealers, commercial banks, investment banks, and other institutional clients. Defaults by, or even rumors or questions about, one or more financial services companies, or the financial services industry generally, have led to market-wide liquidity problems in the past and could lead to losses or defaults by us or by other institutions in the future. These losses or defaults could have a material adverse effect on our assets, business, cash flow, condition (financial or otherwise), liquidity, prospects and results of operations.
By engaging in derivative transactions, we are exposed to additional credit and market risk.
We use interest rate swaps to help manage our interest rate risk from recorded financial assets and liabilities when they can be demonstrated to effectively hedge a designated asset or liability and the asset or liability exposes us to interest rate risk. Hedging interest rate risk is a complex process, requiring sophisticated models and routine monitoring, and is not a perfect science. As a result of interest rate fluctuations, hedged assets and liabilities will appreciate or depreciate in market value. The effect of this unrealized appreciation or depreciation will generally be offset by income or loss on the derivative instruments that are linked to the hedged assets and liabilities. We also have derivatives that result from a service we provide to certain qualifying clients approved through our credit process, and therefore, are not used to manage interest rate risk in our assets or liabilities. By engaging in derivative transactions, we are exposed to credit and market risk. If the counterparty fails to perform, credit risk exists to the extent of the uncollateralized fair value gain in the derivative. Market risk exists to the extent that interest rate changes cause the value of our derivatives to decline – though to the extent the derivatives are effective hedges, changes in the value of derivatives could be largely offset by changes in the fair value of the hedged item. The existence of credit and market risk associated with our derivative instruments could adversely affect our net interest income and, therefore, could have a material adverse effect on our assets, business, cash flow, condition (financial or otherwise), liquidity, prospects and results of operations.
The Company’s controls and procedures may fail or be circumvented.
Any failure or circumvention of the Company’s controls and procedures or failure to comply with regulations related to controls and procedures could have a material adverse effect on the Company’s business, results of operations and financial condition. Management regularly reviews and updates the Company’s internal controls, disclosure controls and procedures, and corporate governance policies and procedures. Any system of controls, no matter how well designed and operated, is based in part on certain assumptions and can provide only reasonable, not absolute, assurances that the objectives of the system are met.
21
Changes in tax law and accounting standards could materially affect the Company's operations.
Changes in tax laws, or changes in the interpretation of existing tax laws, could materially adversely affect the Company’s operations. Similarly, new accounting standards, changes to existing accounting standards, and changes to the methods of preparing financial statements could impact the Company’s reported financial condition and results of operations. These factors are outside the Company’s control and it is impossible to predict changes that may occur and the effect of such changes.
If our allowance for credit losses was required to be increased because it is not large enough to cover expected losses in our loan portfolio, our results of operations and financial condition could be materially and adversely affected.
We maintain an allowance for credit losses ("ACL"), which is a reserve established through a provision for credit losses charged to expense. After adopting ASC 326, the ACL reflects our assessment of the current expected losses over the life of the loan using historical experience, current conditions and reasonable and supportable forecasts. CECL has created more volatility in the level of our ACL because it relies on macroeconomic forecasts. It is possible that CECL may increase the cost of lending in the industry and result in slower loan growth and lower levels of net income. The level of the allowance reflects our continuing evaluation of factors including current economic forecasts, historical loss experience, the volume and types of loans, and specific credit risks. The determination of the appropriate level of the ACL inherently involves subjectivity in our modeling and requires us to make estimates of current credit risks and future trends, all of which may undergo material changes or vary from our historical experience. Deterioration in economic conditions affecting borrowers, changing economic forecasts, new information regarding existing loans, identification of additional problem loans and other factors, both within and outside of our control, may require an increase in the ACL. If we are required to materially increase our level of ACL for any reason, such increase could adversely affect our business, financial condition and results of operations.
In addition, bank regulatory agencies periodically review our ACL and may require an increase in the provision for credit losses or the recognition of further loan charge-offs, based on judgments different than those of management. Furthermore, if charge-offs in future periods exceed the ACL, we will need additional provisions to increase the ACL. Any increases in the ACL will result in a decrease in net income and, possibly, capital, and may have a material adverse effect on our business, financial condition and results of operations. See the section Item 7, “Management’s Discussion and Analysis of Financial Condition and Results of Operations" located elsewhere in this Report for further discussion related to our process for determining the appropriate level of the ACL.
Small Business Administration lending and other government guaranteed lending is an important part of our business. Our government guaranteed lending programs are dependent upon the U.S. federal government, and we face specific risks associated with originating SBA and other government guaranteed loans.
Our SBA lending program is dependent upon the U.S. federal government. As an approved participant in the SBA Preferred Lender’s Program (an “SBA Preferred Lender”), we enable our customers to obtain SBA loans without being subject to the potentially lengthy SBA approval process necessary for lenders that are not SBA Preferred Lenders. The SBA periodically reviews the lending operations of participating lenders to assess, among other things, whether the lender exhibits prudent risk management. When weaknesses are identified, the SBA may request corrective actions or impose enforcement actions, including revocation of the lender’s SBA Preferred Lender status. If we lose our status as an SBA Preferred Lender, we may lose some or all of our customers to lenders who are SBA Preferred Lenders, and as a result we could experience a material adverse effect to our financial results. Any changes to the SBA program, changes to program-specific rules impacting volume eligibility under the guaranty program, as well as changes to the program amounts authorized by Congress, may also have a material adverse effect on our business. In addition, any default by the U.S. government on its obligations or any prolonged government shutdown could impede our ability to originate SBA loans or other government guaranteed loans or sell such loans in the secondary market, which could materially adversely affect our business, results of operations, and financial condition.
Generally, we sell the guaranteed portion of our SBA 7(a) loans in the secondary market. These sales result in premium income for us at the time of sale and create a stream of future servicing income, as we retain the servicing rights to these loans. For the reasons described above, we may not be able to continue originating these loans or sell them in the secondary market. Furthermore, even if we are able to continue to originate and sell SBA 7(a) loans in the secondary market, we might not continue to realize premiums upon the sale of the guaranteed portion of these loans, or the premiums may decline due to economic and competitive factors. When we originate SBA loans, we incur credit
22
risk on the non-guaranteed portion of the loans, and if a customer defaults on a loan, we share any loss and recovery related to the loan pro-rata with the SBA. If the SBA establishes that a loss on an SBA guaranteed loan is attributable to significant technical deficiencies in the manner in which the loan was originated, funded, or serviced by us, the SBA may seek recovery of the principal loss related to the deficiency from us. Generally, we do not maintain reserves or loss allowances for such potential claims and any such claims could materially adversely affect our business, financial condition, or results of operations.
The laws, regulations and standard operating procedures that are applicable to government guaranteed loan products may change in the future. We cannot predict the effects of these changes on our business and profitability. Because government regulation greatly affects the business and financial results of all commercial banks and bank holding companies and especially our organization, changes in the laws, regulations and procedures applicable to government guaranteed loans could adversely affect our ability to operate profitably.
The recognition of gains on the sale of loans and servicing asset valuations reflect certain assumptions.
We continue to expect that gains on the sale of U.S. government guaranteed loans will continue to comprise a significant component of our revenue. The gain on such sales recognized for year ended December 31, 2023 was $3.3 million. The determination of these gains is based on assumptions regarding the value of unguaranteed loans retained, servicing rights retained and deferred fees and costs, and net premiums paid by purchasers of the guaranteed portions of U.S. government guaranteed loans. The value of retained unguaranteed loans and servicing rights are determined based on market-derived factors such as prepayment rates, current market conditions and recent loan sales. Deferred fees and costs are determined using internal analysis of the cost to originate loans. Significant errors in assumptions used to compute gains on sale of loans or servicing asset valuations could result in material revenue misstatements, which may have a material adverse effect on our business, results of operations and profitability. In addition, while we believe these valuations reflect fair value and such valuations are subject to validation by an independent third-party, if such valuations are not reflective of fair market value then our business, results of operations and financial condition may be materially and adversely affected.
Severe weather, natural disasters, nuclear fallout, acts of war or terrorism, and other external events could significantly impact the Company's business.
Severe weather, natural disasters, nuclear fallout, health emergencies, acts of war or terrorism, and other adverse external events, especially those that directly affect the Company’s market areas, could have a significant impact on the Company’s ability to conduct business. These events could adversely affect the ability of borrowers to repay outstanding loans, decrease the value of collateral securing loans, cause significant property and infrastructure damage, and affect the stability of the Company’s deposit base. The Company may experience decreased revenue, increased charge-offs, and other expenses.
Climate change and societal responses to climate change could adversely affect our business and results of operations, including indirectly through impact to our customers.
The current and anticipated effects of climate change are creating an increasing level of concern for the state of the global environment. As a result, political and social attention to the issue of climate change has increased. In recent years, governments across the world have entered into international agreements to attempt to reduce global temperatures, in part by limiting greenhouse gas emissions. The United States Congress, state legislatures and federal and state regulatory agencies have continued to propose and advance numerous legislative and regulatory initiatives seeking to mitigate the effects of climate change. These agreements and measures may result in the imposition of taxes and fees, the required purchase of emission credits and the implementation of significant operational changes, each of which may require businesses to expend significant capital and incur compliance, operating, maintenance and remediation costs. Consumers and businesses also may change their behavior on their own as a result of these concerns. It is not possible to predict how climate change may impact our financial condition and operations; however, we operate in areas where our business and the activities of our customers could be impacted by the effects of climate change. The effects of climate change may include increased frequency or severity of weather-related events, such as severe storms, hurricanes, flooding and droughts and rising sea levels. These effects can disrupt business operations, damage property, devalue assets and change customer and business preferences, which may adversely affect borrowers, increase credit risk and reduce demand for our products and services. The Company and our customers will need to respond to new laws and regulations as well as consumer and business preferences resulting from climate change concerns. As a result, the Company and our customers may face cost increases, asset value reductions, operating process changes and the like. The impact to our customers will likely vary depending on their specific
23
attributes, including reliance on or role in carbon intensive activities. In addition, we could face reductions in creditworthiness on the part of some customers or in the value of assets securing loans.
Regulatory, Compliance, and Legal Risks
We operate in an extensively regulated industry.
The Company operates in a highly regulated environment and industry which is subject to supervision and regulation by a number of governmental regulatory agencies, including the Federal Reserve Board, the OCC, the TDFI and the FDIC. Regulations adopted by these agencies, which are generally intended to provide protection for depositors and customers rather than for the benefit of shareholders, govern a comprehensive range of matters including but not limited to (i) ownership and control of the Company's equity, (ii) acquisition of other companies and businesses, (iii) permissible activities, (iv) maintenance of adequate capital levels and (v) other operational aspects. Compliance with banking regulations is costly and restricts certain of our activities, including the payment of dividends, mergers and acquisitions, investments, loan amounts and concentrations, interest rates, opening and closing branch locations, and other activities. The bank regulatory agencies also possess broad authority to prevent or remedy unsafe or unsound practices or violations of law. These agencies have significant discretion in their ability to enforce penalties and further limit the Company's activities if the Company fails to comply with applicable regulations.
The Dodd-Frank Act instituted major changes to the bank and financial institutions regulatory regimes, and additional changes continue to be proposed and implemented by various regulatory agencies. Other changes to statutes, regulations or regulatory policies, including changes in interpretation or implementation of statutes, regulations or policies, could affect the Company in substantial and unpredictable ways. Such changes could subject the Company to reduced revenues, additional costs, limit the types of financial services and products the Company may offer and/or increase the ability of non-banks to offer competing financial services and products, among other things. The burden and expenses associated with regulatory compliance have been increasing and may continue to increase. Failure to comply with laws, regulations or policies could result in sanctions by regulatory agencies, civil money penalties and/or reputation damage, which could have a material adverse effect on the Company's business, financial condition and results of operations. Proposals to change the laws and regulations governing financial institutions are frequently raised in Congress and before bank regulatory authorities. Changes in applicable laws or regulations could materially affect the Company’s business, and the likelihood of any major changes in the future and their effects are impossible to determine. Moreover, it is impossible to predict the ultimate form any proposed legislation might take or how it might affect the Company.
We are required to act as a source of financial and managerial strength for our bank in times of stress.
Under federal law and long-standing Federal Reserve policy, we are expected to act as a source of financial and managerial strength to our bank, and to commit resources to support our bank if necessary. We may be required to commit additional resources to our bank at times when we may not be in a financial position to provide such resources or when it may not be in our, or our shareholders’ or creditors,’ best interests to do so. A requirement to provide such support is more likely during times of financial stress for us and our bank, which may make any capital we are required to raise to provide such support more expensive than it might otherwise be. In addition, any capital loans we make to our bank are subordinate in right of repayment to deposit liabilities of our bank. In the event of our bankruptcy, any commitment by us to a federal banking regulator to maintain the capital of our bank will be assumed by the bankruptcy trustee and entitled to priority of payment over general unsecured creditor claims.
We are or may become involved from time to time in suits, legal proceedings, information-gathering requests, investigations and proceedings by governmental and self-regulatory agencies that may lead to adverse consequences.
Many aspects of our business involve substantial risk of legal liability. From time to time, we are, or may become, the subject of lawsuits and related legal proceedings, governmental and self-regulatory agency information-gathering requests, reviews, investigations and proceedings and other forms of regulatory inquiry, including by bank regulatory agencies, the Securities and Exchange Commission, or SEC, and law enforcement authorities. The results of such proceedings could lead to significant civil or criminal penalties, including monetary penalties, damages, adverse judgments, settlements, fines, injunctions, restrictions on the way in which we conduct our business, or reputational harm.
24
Although we establish accruals for legal proceedings when information related to the loss contingencies represented by those matters indicates both that a loss is probable and that the amount of loss can be reasonably estimated, we may not have accruals for all legal proceedings where we face a risk of loss. In addition, due to the inherent subjectivity of the assessments and unpredictability of the outcome of legal proceedings, amounts accrued may not represent the ultimate loss to us from the legal proceedings or government or other inquiries. Thus, our ultimate losses may be higher, and possibly materially so, than the amounts accrued for legal loss contingencies, which could adversely affect our financial condition and results of operations.
Risks Related to Our Common Stock
Even though our common stock is currently traded on the Nasdaq Stock Market's Global Select Market, it has less liquidity than many other stocks quoted on a national securities exchange.
The trading volume in our common stock on the Nasdaq Global Select Market has been relatively low when compared with larger companies listed on the Nasdaq Global Select Market or other stock exchanges. Because of this, it may be more difficult for shareholders to sell a substantial number of shares for the same price at which shareholders could sell a smaller number of shares.
We cannot predict the effect, if any, that future sales of our common stock in the market, or the availability of shares of common stock for sale in the market, will have on the market price of our common stock. We can give no assurance that sales of substantial amounts of common stock in the market, or the potential for large amounts of sales in the market, would not cause the price of our common stock to decline or impair our future ability to raise capital through sales of our common stock.
The market price of our common stock has fluctuated significantly, and may fluctuate in the future. These fluctuations may be unrelated to our performance. General market or industry price declines or overall market volatility in the future could adversely affect the price of our common stock, and the current market price may not be indicative of future market prices.
A future issuance or future issuances of stock could dilute the value of our common stock.
Our charter permits us to issue up to an aggregate of 25.0 million shares of common stock. As of December 31, 2023, 20,707,356 shares of our common stock were issued and outstanding, including 203,161 shares of restricted common stock that have yet to vest. Those shares outstanding do not include the potential issuance, as of December 31, 2023, of 92,865 shares of our common stock subject to issuance upon exercise of outstanding stock options under the Stock Incentive Plan, and 1,046,291 additional shares of our common stock that were reserved for issuance under the Stock Incentive Plan. A future issuance of any new shares of our common stock would, and equity-related securities could, cause further dilution in the value of our outstanding shares of common stock.
Significant sales of our common stock by certain shareholders could affect the market value of our common stock.
Certain shares owned by larger shareholders represent a significant number of our issued and outstanding shares of common stock, and, if sold in the market all at once or at about the same time, could depress the market price of our common stock and could further affect our ability to raise equity capital. Further, we cannot predict the size or the effect, if any, that sales of these shares, or the perception that such sales could occur, may have on the market price of our shares of common stock or our ability to raise additional capital through the sale of equity securities. Any significant sales of these shares could have a materially adverse impact on our affairs, assets, business, cash flows, condition (financial or otherwise), credit quality, financial performance, liquidity, short- and long-term performance goals, prospects and results of operations or the trading price of our common stock.
We have the ability to incur debt and pledge our assets, including our stock in our bank, to secure that debt.
We have the ability to incur debt and pledge our assets to secure that debt. Absent special and unusual circumstances, a holder of indebtedness for borrowed money has rights that are superior to those of holders of our common stock. For example, interest must be paid to a lender before dividends can be paid to our shareholders, and, in the case of liquidation, our borrowings must be repaid before we can distribute any assets to our shareholders. Furthermore, we would have to make principal and interest payments on our indebtedness, which could reduce our profitability or result in net losses on a consolidated basis even if our bank were profitable.
25
The rights of our common shareholders would likely be subordinate to the rights of the holders of any preferred stock that we may issue in the future.
Our charter authorizes our board of directors to issue an aggregate of up to five million shares of preferred stock without any further action on the part of our shareholders. Our board of directors also has the power, without shareholder approval, to set the terms of any series of preferred stock that may be issued, including voting rights, dividend rights, and preferences over our common stock with respect to dividends or in the event of a dissolution, liquidation or winding up and other terms. Accordingly, you should assume that any shares of preferred stock that we may issue in the future will also be senior to our common stock. In the event that we issue preferred stock in the future that has preference over our common stock with respect to payment of dividends or upon our liquidation, dissolution or winding up, or if we issue preferred stock with voting rights that dilute the voting power of our common stock, the rights of the holders of our common stock or the market price of our common stock could be adversely affected.
We and our bank are subject to capital and other legal and regulatory requirements which restrict our ability to pay dividends.
We are subject to certain restrictions on the payment of cash dividends as a result of banking laws, regulations and policies. In addition, because our bank is our only material asset, our ability to pay dividends to our shareholders depends on our receipt of dividends from the bank, which is also subject to restrictions on dividends as a result of banking laws, regulations and policies.
Risks Related to the Proposed Merger With Old National
Failure to complete the Merger could negatively impact the Company.
If the Merger is not completed for any reason, there may be various adverse consequences and the Company may experience negative reactions from the financial markets and from its customers and employees. For example, the Company’s business may have been impacted adversely by the failure to pursue other beneficial opportunities due to the focus of management on the Merger, without realizing any of the anticipated benefits of completing the Merger. Additionally, if the Old National Merger Agreement is terminated, the market price of the Company common stock could decline to the extent that current market prices reflect a market assumption that the Merger will be beneficial and will be completed. The Company also could be subject to litigation related to any failure to complete the Merger or to proceedings commenced against the Company to perform its obligations under the Old National Merger Agreement. If the Old National Merger Agreement is terminated under certain circumstances, the Company may be required to pay a termination fee of $11.25 million to Old National.
Additionally, the Company has incurred and will incur substantial expenses in connection with the negotiation and completion of the transactions contemplated by the Old National Merger Agreement, as well as the costs and expenses of preparing, filing, printing, and mailing the proxy statement/prospectus, and all filing and other fees paid in connection with the Merger. If the Merger is not completed, the Company would have to pay these expenses without realizing the expected benefits of the Merger.
The Company will be subject to business uncertainties and contractual restrictions while the Merger is pending.
Uncertainty about the effect of the Merger on employees and customers may have an adverse effect on the Company. These uncertainties may impair the Company’s ability to attract, retain and motivate key personnel until the Merger is completed, and could cause customers and others that deal with the Company to seek to change existing business relationships with the Company. In addition, due to certain restrictions in the Old National Merger Agreement on the conduct of business prior to completing the Merger, we may be unable, during the pendency of the Merger to pursue certain actions, even if such actions would prove beneficial, and we may have to forgo certain opportunities we might otherwise pursue.
The Old National Merger Agreement may be terminated in accordance with its terms and the Merger may not be completed.
The Old National Merger Agreement is subject to a number of conditions which must be fulfilled in order to complete the Merger. These conditions to the closing may not be fulfilled in a timely manner or at all, and, accordingly, the
26
Merger may not be completed. In addition, the parties can mutually decide to terminate the Old National Merger Agreement at any time or Old National or the Company may elect to terminate the Old National Merger Agreement in certain other circumstances.
Because the market price of Old National common stock may fluctuate, the Company shareholders cannot be certain of the market value of the Merger consideration they will receive.
In the Merger, each share of Company common stock issued and outstanding immediately prior to the effective time, will be converted into 1.155 shares of Old National common stock. This exchange ratio is fixed and will not be adjusted for changes in the market price of either Old National common stock or the Company common stock. Changes in the price of Old National common stock between now and the time of the Merger will affect the value that the Company shareholders will receive in the Merger. Neither Old National nor the Company is permitted to terminate the Old National Merger Agreement as a result of any increase or decrease in the market price of Old National common stock or the Company common stock.
Stock price changes may result from a variety of factors, including general market and economic conditions, changes in Old National’s and the Company’s businesses, operations and prospects, the volatility in the prices of securities in global financial markets, including market prices of Old National, the Company and other banking companies, the effects of regulatory considerations and tax laws, many of which are beyond Old National’s and the Company’s control. Therefore, the Company shareholders will not know the market value of the consideration that they will receive until the effective time.
ITEM 1B. UNRESOLVED STAFF COMMENTS
None.
ITEM 1C. CYBERSECURITY
Cybersecurity is a high-priority item for legislators and regulators at the federal and state levels, as well as internationally. State and federal banking regulators have issued various policy statements and, in some cases, regulations, emphasizing the importance of technology risk management and supervision. These policy statements and regulations indicate that financial institutions should design multiple layers of security controls to establish lines of defense and to ensure that their risk management processes also address the risk posed by compromised customer credentials, including security measures to reliably authenticate customers accessing internet-based services of the financial institution. For example, a financial institution’s management is expected to maintain sufficient business continuity planning processes to ensure the rapid recovery, resumption and maintenance of the institution’s operations after a cyberattack involving destructive malware. Additionally, financial institutions are expected to develop appropriate processes to enable recovery of data and business operations and address rebuilding network capabilities and restoring data if the institution or its critical service providers fall victim to cyberattacks.
There are a number of state and federal laws and regulations that govern financial privacy and cybersecurity. At the federal level, this includes the privacy protection provisions of the Graham Leach Bliley Act (“GLBA”) and related regulations, including Regulation P, which govern the treatment of nonpublic personal information. Under these privacy protection provisions, we are limited in our ability to disclose non-public information about consumers to nonaffiliated third parties. These limitations require disclosure of privacy policies and notices to consumers and, in some circumstances, allow consumers to prevent disclosure of certain personal information to a nonaffiliated third party. Consumers also must be notified in the event of a data breach under applicable state laws. On April 1, 2022, a final rule issued by federal financial regulatory agencies became effective – that rule imposes upon banking organizations and their service providers notification requirements for significant cybersecurity incidents. Specifically, the rule requires banking organizations to notify their primary federal regulator as soon as possible and no later than 36 hours after the discovery of a “computer-security incident” that rises to the level of a “notification incident” as those terms are defined in the rule. Banks’ service providers are required under that rule to notify any affected bank to or on behalf of which the service provider provides services “as soon as possible” after determining that it has experienced an incident that materially disrupts or degrades, or is reasonably likely to materially disrupt or degrade, covered services provided to such bank for as much as four hours.
27
Additionally, effective December 9, 2022, the FTC’s amendments to the GLBA’s Safeguards Rule went into effect. That rule requires financial institutions to: (i) appoint a qualified individual to oversee and implement their information security programs; (ii) implement additional criteria for information security risk assessments; (iii) implement safeguards identified by assessments, including access controls, data inventory, data disposal, change management, and monitoring, among other things; (iv) implement information system monitoring in the form of either “continuous monitoring” or “periodic penetration testing;” (v) implement additional controls including training for security personnel, periodic assessment of service providers, written incident response plans, and periodic reports from the qualified individual to the board of directors. Additionally, multiple states and Congress are considering laws or regulations which could create new individual privacy rights and impose increased obligations on companies handling personal data.
Risk management and strategy.
In the ordinary course of business, we rely on electronic communications and information systems to conduct our operations and store sensitive data. “Information systems” means electronic information resources that we own or use, including physical or virtual infrastructure controlled by these information resources, or components thereof, organized for the collection, processing, maintenance, use, sharing, dissemination, or disposition of the information necessary to maintain or support our operations. Because cybersecurity threats continue to evolve, we have been required and may continue to be required to expend significant resources to continue to implement, modify or enhance our protective measures or to investigate and remediate any information security vulnerabilities. Financial expenditures may also be required to meet regulatory changes in the information security and cybersecurity domains. Risks and exposures related to cybersecurity attacks are expected to remain high for the foreseeable future due to the rapidly evolving nature and sophistication of these threats, as well as the expanding use of internet banking, mobile banking and other technology-based products and services by us and our customers. See “Item 1A. – Risk Factors” in this Report for a further discussion of risks related to cybersecurity.
To address cybersecurity threats (defined as potential unauthorized occurrences on or conducted through our information systems that may result in adverse effects on the confidentiality, integrity, or availability of those systems or any information residing in those systems therein), we have implemented an incident response policy (“IRP”), which includes our cybersecurity policy, plan, and associated playbooks. The IRP is a component of our overall enterprise risk management and business continuity frameworks. We employ an in-depth, layered, defensive approach that leverages people, processes and technology to manage and maintain cybersecurity controls. We also employ a variety of preventative and detective tools to monitor, block, and provide alerts regarding suspicious activity relative to our information systems, as well as to report on any suspected advanced persistent threats. The IRP is designed to allow for the detection and timely and efficient recovery from cybersecurity incidents (defined as unauthorized occurrences, or a series of related unauthorized occurrences, on or conducted through our information systems that jeopardize the confidentiality, integrity, or availability of those systems or any information residing therein) and events by providing a well-defined, organized approach for handling any potential threats to the confidentiality, integrity, and/or availability of our information systems.
The IRP generally is overseen by our Incident Response Team (“IRT”), which has designated an Incident Response Team Coordinator (“IRTC”). The IRTC is responsible for maintaining the IRP as well as testing and reporting to the appropriate internal committees, and our Board and its designated committee. Our Information Security Officer is the primary IRTC, however, if necessary we may assign the specific IRTC duties to a different staff member (technical staff or outsourced vendor if appropriate) for specific matters.
We contract with a third-party vendor who monitors our information systems for suspicious activity, such as unauthorized intrusions. Suspected or confirmed threats, incidents, or events, however, also may be reported by bank employees, customers, intrusion detection systems, third-party servicers, or government entities. Once reported, cybersecurity incidents are to be brought to the attention of the IRTC.
After receiving notice of a cybersecurity incident, the IRTC is responsible for investigating the threat to determine whether an actual incident has occurred and, if so, whether a more thorough assessment by the entire IRT is appropriate. During these assessments, steps may be taken to isolate affected systems. Outside advisors may be employed regarding the cybersecurity threat, including to conduct of legal and forensic investigations and work with other third-parties who might be engaged to assist in any response and associated publicity.
28
During or at the conclusion of an assessment of a cybersecurity incident, we will respond to the incident. The response will vary based upon the severity of the incident or event. In determining the level of response, we have identified four general classification levels for incidents. Incident and risk event levels each vary from no (or low) risk to high risk. The determination of the incident and risk level will dictate the level of personnel that will be responsible for addressing the incident, controlling the effects of the incident and formulating the response to the incident. Responses may include, when appropriate and/or required, notification to regulatory agencies (e.g., FDIC, FinCEN, SEC), authorities (e.g., F.B.I., Department of Justice), customers, third parties or internal personnel.
The IRT is responsible for providing an orderly response to security incidents and risk events; preventing a serious loss of profits, public confidence, or information assets by providing an immediate, effective, and skillful response to any unexpected event which negatively impacts the confidentiality, integrity, and/or availability of our systems, network, or the non-public personal information of its customers, interruptions to customers’ experiences, or other anomalous situations; taking the steps it deems necessary to contain, mitigate, or resolve a security incident or risk event; and investigating suspected security incidents and risk events in a timely and cost effective manner, reporting findings to management, determining an appropriate course of action, and coordinating communications to customers, regulatory authorities, and law enforcement agencies as necessary. Investigations at the lowest level of risk are coordinated by the IRTC. The IRT has increasing levels of responsibility and involvement in the next three levels of risk.
Following a cybersecurity incident, and during its investigation and the formulation of a response, our processes also envision measures designed to contain and/or eradicate the incident and prevent further effects. Once it is determined that the incident has been resolved, we then work to establish appropriate controls (if applicable) to address similar future events and/or prevent another similar event from occurring in the future. To date, we have not experienced any cybersecurity incidents that have materially affected or are reasonably likely to materially affect our business strategy, results of operations, or financial condition.
Governance.
As indicated above, reports of cybersecurity incidents initially are to be brought to the attention of the IRTC, who determined the extent of involvement of the IRT. The IRT is comprised of the following core members who are to be included in the investigation of all cybersecurity incidents:
IRT |
Information Security Officer - Lead Chief Operations Officer Director of Information Technology Chief Risk and Compliance Officer Lead IT Systems Specialist |
Depending upon the type of incident or event, representatives from other areas of the Company (e.g., senior executives such as our Chief Financial Officer and Chief Executive Officer, Legal/Compliance, Corporate Security, Internal Audit, Human Resources, Directors of Banking and Mortgage, Corporate Communications) may be included on any of these teams from time to time for a particular investigation/response.
The principal management personnel that are responsible for the assessment and management of our cybersecurity risks include:
Position |
Relevant Expertise |
Information Security Officer |
• 18 years’ experience in banking. With emphasis in fields as Merchant Service Provider, Electronic Banking, Security, IT-Help Desk, BSA, Vendor Management, Internal Audits with Compliance Officer. • 10 years (2006-2016) of work and experience in Disaster Risk and Business Continuity Planning, along with Incident Response Planning. Formulated Continuity Planning and Disaster Recovery Plans for the Financial Institution with 8 Branches. |
29
|
• 4 years as Merchant Services Provider, ensuring more than 400 merchant card terminals were uploaded to PCI Compliance Standards for Security at the merchant level. • 3 years of Branch Incident Security monitoring including security video monitoring and reporting of incidents. |
Director of Information Technology |
• Total of over 30 years’ experience in Information Technology and Information Security in financial institutions. • 19 years’ previous experience, prior to CapStar merger, with merged organization, with responsibilities overseeing information technology and information security. • Previously certified as community bank technology officer. • Five years’ previous experience in auditing, including information technology and information security, with two other financial institutions. • Three years previous experience as a Tennessee bank regulatory where responsibilities included IT and Information Security examination responsibilities. |
As part of its oversight responsibilities over the Company risks and controls, the Board ultimately is responsible for overseeing our cyber and information security risks, including our program for GLBA compliance. The Board has delegated this responsibility to its Risk Committee. The highest-level rated incidents are brought immediately to the attention of the Chair of the Board and/or the Chair of the Risk Committee. At each regular meeting of the Risk Committee, our ISO reports to the Risk Committee regarding any level one through three events (non-critical to medium) threats, as well as security testing, training, audits, key cybersecurity metrics, and our efforts to identify, prepare for, prevent, and respond to critical threats. The Risk Committee receives regular updates on the status of our information security program, penetration testing results, infrastructure assessments, threat environment, security operations, operational events, vendor and supply chain security, and application/data security.
ITEM 2. PROPERTIES
We lease our headquarters and main branch office, which are located at 1201 Demonbreun Street, Suites 700 and 103, respectively, Nashville, Tennessee 37203. The Company owns 22 and leases nine banking locations or other properties, respectively, and leases three locations utilized by the Bank's Southland Finance subsidiary.
ITEM 3. LEGAL PROCEEDINGS
We and our subsidiaries may be involved from time to time in various routine legal proceedings incidental to our respective businesses. Neither we nor any of our subsidiaries are currently engaged in any pending material legal proceedings. However, see Part II, Item 9.B of this Annual Report on Form 10-K.
ITEM 4. MINE SAFETY DISCLOSURES
Not applicable.
30
PART II
ITEM 5. MARKET FOR REGISTRANT’S COMMON EQUITY, RELATED STOCKHOLDER MATTERS AND ISSUER PURCHASES OF EQUITY SECURITIES
CapStar Financial’s common stock is traded on the Nasdaq Global Select Market under the symbol “CSTR” and has traded on that market since September 22, 2016. Prior to that time, there was no established public trading market for our stock.
As of January 22, 2024, there were approximately 452 holders of record of shares of our common stock.
Dividend Policy
The Company generally pays dividends on a quarterly basis. As a Tennessee corporation and bank holding company, dividend payments are subject to numerous limitations. For additional information, see “Item 1. Business—Supervision and Regulation—Bank Regulation and Supervision—Payment of Dividends”, "Item 7. Management's Discussion and Analysis of Financial Condition and Results of Operations - Market and Liquidity Risk Management," and Note 16 of Notes to Consolidated Financial Statements.
Stock Performance Graph
The following stock performance graphs compare total shareholders' return (assuming reinvestment of dividends) on our common stock for the five year period ended December 31, 2023, as well as the Russell 2000 Index and ABA Nasdaq Community Bank Index for the same period.
|
|
12/31/2018 |
|
|
12/31/2019 |
|
|
12/31/2020 |
|
|
12/31/2021 |
|
|
12/31/2022 |
|
|
12/31/2023 |
|
||||||
CapStar Financial Holdings, Inc. (CSTR) |
|
|
100 |
|
|
|
114 |
|
|
|
103 |
|
|
|
149 |
|
|
|
127 |
|
|
|
139 |
|
ABA Nasdaq Community Bank Index (ABAQ) |
|
|
100 |
|
|
|
120 |
|
|
|
103 |
|
|
|
136 |
|
|
|
124 |
|
|
|
117 |
|
Russell 2000 (RUT) |
|
|
100 |
|
|
|
125 |
|
|
|
150 |
|
|
|
173 |
|
|
|
137 |
|
|
|
161 |
|
31
Issuer Purchases of Equity Securities
The following table shows information relating to the repurchase of shares of common stock by the Company during the three months ended December 31, 2023.
|
|
Total number of |
|
|
Average price paid |
|
Total number of |
|
|
Maximum remaining |
|
||||
October 1 - October 31 |
|
|
43,310 |
|
|
$ |
14.67 |
|
|
43,310 |
|
|
$16.49 million |
|
|
November 1 - November 30 |
|
|
— |
|
|
|
— |
|
|
— |
|
|
|
— |
|
December 1 - December 31 |
|
|
— |
|
|
|
— |
|
|
— |
|
|
|
— |
|
Total |
|
|
43,310 |
|
|
$ |
14.67 |
|
|
43,310 |
|
|
|
— |
|
(1) On May 25, 2023 the board of directors approved an update to the Company’s share repurchase program which authorized the Company to repurchase up to $20 million of shares of common stock after the previous $10 million program was completed. Related to the merger agreement with Old National Bancorp (NASDAQ: ONB), the plan was terminated effective October 27, 2023. The Company had repurchased $3.5 million of our common stock under the plan through termination date.
ITEM 6. [RESERVED]
32
ITEM 7. MANAGEMENT’S DISCUSSION AND ANALYSIS OF FINANCIAL CONDITION AND RESULTS OF OPERATIONS
The following is a discussion of our financial condition and our results of operations as of and for the years ended December 31, 2023 and 2022. The purpose of this discussion is to focus on information about our financial condition and results of operations which is not otherwise apparent from the Consolidated Financial Statements appearing under the caption “Part II., Item 8—Financial Statements and Supplementary Data” in this Report. The following discussion and analysis should be read together with our Consolidated Financial Statements, the notes to our Consolidated Financial Statements and the other financial information included elsewhere in this Report. In addition to historical information, this discussion and analysis contains forward-looking statements that involve risks, uncertainties, estimates and assumptions that could cause actual results to differ materially from our current expectations. Factors that could cause such differences are discussed in the sections entitled “Risk Factors” and “Cautionary Note Regarding Forward-Looking Statements” appearing elsewhere in this Report. We assume no obligation to update any of these forward-looking statements except to the extent required by applicable law.
The following discussion and analysis pertains to our historical results on a consolidated basis. However, because we conduct all of our material business operations through our wholly-owned subsidiary, CapStar Bank, the following discussion and analysis relates to activities primarily conducted at the subsidiary level.
All dollar amounts in the tables in this section are in thousands of dollars, except per share data or when otherwise specifically noted. Unless specifically noted in this Report, all references in this section to the fiscal years 2021, 2022 and 2023 mean our fiscal years ended December 31, 2021, 2022, and 2023, respectively.
Recent Events
On October 26, 2023, Old National and the Company entered into a definitive merger agreement for Old National (the "Old National Merger Agreement") to acquire CapStar in an all-stock transaction with an aggregate value of approximately $344 million, or $16.64 per share of CapStar common stock, based on Old National’s 30-day volume weighted average closing stock price ending October 25, 2023 (the "Merger"). Under the terms of the Old National Merger Agreement, shareholders of the Company will receive, in respect of each share of common stock of the Company held by them, 1.155 shares of common stock of Old National. Following the Merger (on a date to be determined by Old National), CapStar Bank will merge with and into Old National Bank, a wholly-owned subsidiary of Old National, with Old National Bank as the surviving bank (the "Bank Merger"). On February 21, 2024, the Company disclosed that the Board of Governors of the Federal Reserve System approved the Merger and the Office of the Comptroller of the Currency approved the Bank Merger. On February 29, 2024, the Company's shareholders approved the Merger at a special meeting.
Critical Accounting Estimates
Our accounting and reporting policies are in accordance with GAAP and conform to general practices within the banking industry. Application of these policies requires management to make numerous estimates, assumptions or judgments that affect the amounts reported in the financial statements and the accompanying notes. These estimates are based on information available as of the date of the financial statements; accordingly, as this information changes, it could materially and adversely affect our reported results and financial position for the current period or future periods. The use of estimates, assumptions, and judgments are necessary when financial assets and liabilities are required to be recorded at, or adjusted to reflect, fair value. Assets carried at fair value inherently result in more financial statement volatility. Fair values and information used to record valuation adjustments for certain assets and liabilities are either based on quoted market prices or are provided by other independent third-party sources, when available. When such information is not available, management estimates valuation adjustments based upon historical experience and on various other assumptions that we believe to be reasonable under the circumstances. Management evaluates our estimates and assumptions on an ongoing basis. Changes in underlying factors, assumptions or estimates in any of these areas could have a material impact on our future financial condition and results of operations.
Our Consolidated Financial Statements are prepared based on the application of certain accounting policies, the most significant of which are described in Note 1 to our Consolidated Financial Statements for the year ended December 31, 2023, which are contained elsewhere in this Report. Certain policies inherently have a greater reliance on the use of estimates, assumptions or judgments and as such, have a greater possibility of producing results that could be materially different than originally reported. We have identified the following accounting policies and estimates that, due to the difficult, subjective or complex judgments and assumptions inherent in those policies and estimates and the
33
potential sensitivity of our financial statements to those judgments and assumptions, are critical to an understanding of our financial condition and results of operations. We believe that the judgments, estimates and assumptions used in the preparation of our financial statements are reasonable and appropriate.
Allowance for Credit Losses ("ACL")
Since the adoption of CECL on January 1, 2023, the ACL represents management’s estimate of credit losses for the remaining estimated life of financial instruments, with particular applicability on our balance sheet to loans and unfunded loan commitments. Estimating the amount of the ACL requires significant judgment and the use of estimates related to historical experience, current conditions, reasonable and supportable forecasts, and the value of collateral on collateral-dependent loans. The loan portfolio also represents the largest asset type on our consolidated balance sheet. Loan losses are charged against the allowance, while recoveries of amounts previously charged off are credited to the allowance. A provision for credit losses is charged to operations based on management’s periodic evaluation of the factors previously mentioned, as well as other pertinent factors.
There are many factors affecting the ACL; some are quantitative while others require qualitative judgment. Although management believes its process for determining the allowance adequately considers all the potential factors that could potentially result in credit losses, the process includes subjective elements and is susceptible to significant change. To the extent actual outcomes differ from management estimates, additional provision for credit losses could be required that could adversely affect our earnings or financial position in future periods.
Note 1 to the consolidated financial statements includes additional information on accounting policies related to the ACL.
Income Taxes
Deferred income tax assets and liabilities are computed using the asset and liability method, which recognizes a liability or asset representing the tax effects, based on current tax law, of future deductible or taxable amounts attributable to events recognized in the financial statements. A valuation allowance may be established to the extent necessary to reduce the deferred tax asset to a level at which it is “more likely than not” that the tax asset or benefit will be realized. Realization of tax benefits depends on having sufficient taxable income, available tax loss carrybacks or credits, the reversal of taxable temporary differences and/or tax planning strategies within the reversal period, and that current tax law allows for the realization of recorded tax benefits.
Fair Valuation of Financial Instruments
Certain assets and liabilities are measured at fair value on a recurring basis, including securities and derivative instruments. Assets and liabilities carried at fair value inherently include subjectivity and may require the use of significant assumptions, adjustments and judgment including, among others, discount rates, rates of return on assets, cash flows, default rates, loss rates, terminal values and liquidation values. A significant change in assumptions may result in a significant change in fair value, which in turn, may result in a higher degree of financial statement volatility and could result in significant impact on our results of operations, financial condition or disclosures of fair value information.
The fair value hierarchy requires use of observable inputs first and subsequently unobservable inputs when observable inputs are not available. Our fair value measurements involve various valuation techniques and models, which involve inputs that are observable (Level 1 or Level 2 in fair value hierarchy), when available. The level of judgment required to determine fair value is dependent on the methods or techniques used in the process. Assets and liabilities that are measured at fair value using quoted prices in active markets (Level 1) do not require significant judgment while the valuation of assets and liabilities when quoted market prices are not available (Levels 2 and 3) may require significant judgment to assess whether observable or unobservable inputs for those assets and liabilities provide reasonable determination of fair value. See Note 22 to the Consolidated Financial Statements for additional information regarding the fair values measured at each level of the fair value hierarchy, additional discussion regarding fair value measurements, and a brief description of how fair value is determined for categories that have unobservable inputs.
34
Results of Operations
The following is a summary of our results of operations:
|
|
|
|
|
2023 - 2022 |
|
|
|
|
|
2022-2021 |
|
||||||||
|
|
Year Ended |
|
|
Percent |
|
|
Year Ended |
|
|
Percent |
|
||||||||
|
|
December 31, |
|
|
Increase |
|
|
December 31, |
|
|
Increase |
|
||||||||
|
|
2023 |
|
|
2022 |
|
|
(Decrease) |
|
|
2021 |
|
|
(Decrease) |
|
|||||
Interest income |
|
$ |
158,188 |
|
|
$ |
113,533 |
|
|
|
39.3 |
% |
|
$ |
98,459 |
|
|
|
15.3 |
% |
Interest expense |
|
|
72,307 |
|
|
|
17,441 |
|
|
|
314.6 |
% |
|
|
7,289 |
|
|
|
139.3 |
% |
Net interest income |
|
|
85,881 |
|
|
|
96,092 |
|
|
|
(10.6 |
)% |
|
|
91,170 |
|
|
|
5.4 |
% |
Provision for (recovery of) credit losses |
|
|
849 |
|
|
|
2,474 |
|
|
|
(65.7 |
)% |
|
|
(1,066 |
) |
|
|
(332.1 |
)% |
Net interest income after provision for loan losses |
|
|
85,032 |
|
|
|
93,618 |
|
|
|
(9.2 |
)% |
|
|
92,236 |
|
|
|
1.5 |
% |
Noninterest income |
|
|
26,151 |
|
|
|
24,522 |
|
|
|
6.6 |
% |
|
|
42,681 |
|
|
|
(42.5 |
)% |
Noninterest expense |
|
|
74,984 |
|
|
|
69,370 |
|
|
|
8.1 |
% |
|
|
73,541 |
|
|
|
(5.7 |
)% |
Net income before income taxes |
|
|
36,199 |
|
|
|
48,770 |
|
|
|
(25.8 |
)% |
|
|
61,376 |
|
|
|
(20.5 |
)% |
Income tax expense |
|
|
6,395 |
|
|
|
9,753 |
|
|
|
(34.4 |
)% |
|
|
12,699 |
|
|
|
(23.2 |
)% |
Net income |
|
$ |
29,804 |
|
|
$ |
39,017 |
|
|
|
(23.6 |
)% |
|
$ |
48,677 |
|
|
|
(19.8 |
)% |
|
|
|
|
|
|
|
|
|
|
|
|
|
|
|
|
|||||
Basic net income per share of common stock |
|
$ |
1.41 |
|
|
$ |
1.77 |
|
|
|
(20.3 |
)% |
|
$ |
2.20 |
|
|
|
(19.5 |
)% |
Diluted net income per share of common stock |
|
$ |
1.41 |
|
|
$ |
1.77 |
|
|
|
(20.3 |
)% |
|
$ |
2.19 |
|
|
|
(19.2 |
)% |
The following sections provide a more detailed analysis of significant factors affecting our operating results.
Net Interest Income
The largest component of our net income is net interest income – the difference between the interest income earned on loans, investment securities and other interest earning assets and interest expense on deposit accounts and other interest-bearing liabilities. Net interest income calculated on a tax-equivalent basis divided by total average interest-earning assets represents our net interest margin. The major factors that affect net interest income and net interest margin are changes in volumes, mix, the yield on interest-earning assets and the cost of interest-bearing liabilities. Our margin can also be affected by economic conditions, the competitive environment, loan demand and deposit flow. Our ability to respond to changes in these factors by using effective asset-liability management techniques is critical to maintaining the stability of the net interest margin and our net interest income.
35
The following table sets forth the average balances, interest income or interest expense for each category of interest-earning assets and interest-bearing liabilities and the average interest rate for interest-earning assets and interest-bearing liabilities, net interest spread and net interest margin for the years ended December 31, 2023, 2022 and 2021:
|
|
For the Year Ended December 31, |
|
|||||||||||||||||||||||||||||||||
|
|
2023 |
|
|
2022 |
|
|
2021 |
|
|||||||||||||||||||||||||||
|
|
Average |
|
|
Interest |
|
|
Average |
|
|
Average |
|
|
Interest |
|
|
Average |
|
|
Average |
|
|
Interest |
|
|
Average |
|
|||||||||
Interest-Earning Assets |
|
|
|
|
|
|
|
|
|
|
|
|
|
|
|
|
|
|
|
|
|
|
|
|
|
|
|
|||||||||
Loans (1) |
|
$ |
2,337,475 |
|
|
$ |
136,136 |
|
|
|
5.82 |
% |
|
$ |
2,176,073 |
|
|
$ |
97,759 |
|
|
|
4.49 |
% |
|
$ |
1,910,115 |
|
|
$ |
84,368 |
|
|
|
4.42 |
% |
Loans held for sale |
|
|
32,890 |
|
|
|
936 |
|
|
|
2.85 |
% |
|
|
84,171 |
|
|
|
3,742 |
|
|
|
4.45 |
% |
|
|
152,482 |
|
|
|
4,851 |
|
|
|
3.18 |
% |
Securities: |
|
|
|
|
|
|
|
|
|
|
|
|
|
|
|
|
|
|
|
|
|
|
|
|
|
|
|
|||||||||
Taxable investment securities (2) |
|
|
336,391 |
|
|
|
8,975 |
|
|
|
2.67 |
% |
|
|
400,204 |
|
|
|
8,427 |
|
|
|
2.11 |
% |
|
|
441,495 |
|
|
|
7,213 |
|
|
|
1.63 |
% |
Investment securities exempt from federal income tax (3) |
|
|
52,582 |
|
|
|
1,218 |
|
|
|
2.93 |
% |
|
|
55,310 |
|
|
|
1,267 |
|
|
|
2.90 |
% |
|
|
61,438 |
|
|
|
1,408 |
|
|
|
2.90 |
% |
Total securities |
|
|
388,973 |
|
|
|
10,193 |
|
|
|
2.62 |
% |
|
|
455,514 |
|
|
|
9,694 |
|
|
|
2.20 |
% |
|
|
502,933 |
|
|
|
8,621 |
|
|
|
1.79 |
% |
Cash balances in other banks |
|
|
203,462 |
|
|
|
10,729 |
|
|
|
5.27 |
% |
|
|
172,746 |
|
|
|
2,262 |
|
|
|
1.31 |
% |
|
|
317,406 |
|
|
|
598 |
|
|
|
0.19 |
% |
Funds sold |
|
|
2,700 |
|
|
|
194 |
|
|
|
7.19 |
% |
|
|
7,546 |
|
|
|
76 |
|
|
|
1.01 |
% |
|
|
14,640 |
|
|
|
21 |
|
|
|
0.14 |
% |
Total interest-earning assets |
|
|
2,965,500 |
|
|
|
158,188 |
|
|
|
5.33 |
% |
|
|
2,896,050 |
|
|
|
113,533 |
|
|
|
3.93 |
% |
|
|
2,897,576 |
|
|
|
98,459 |
|
|
|
3.41 |
% |
Noninterest-earning assets |
|
|
235,080 |
|
|
|
|
|
|
|
|
|
242,384 |
|
|
|
|
|
|
|
|
|
224,776 |
|
|
|
|
|
|
|
||||||
Total assets |
|
$ |
3,200,580 |
|
|
|
|
|
|
|
|
$ |
3,138,434 |
|
|
|
|
|
|
|
|
$ |
3,122,352 |
|
|
|
|
|
|
|
||||||
Interest-Bearing Liabilities |
|
|
|
|
|
|
|
|
|
|
|
|
|
|
|
|
|
|
|
|
|
|
|
|
|
|
|
|||||||||
Interest bearing deposits: |
|
|
|
|
|
|
|
|
|
|
|
|
|
|
|
|
|
|
|
|
|
|
|
|
|
|
|
|||||||||
Interest-bearing transaction accounts |
|
|
869,216 |
|
|
|
21,344 |
|
|
|
2.46 |
% |
|
|
856,344 |
|
|
|
4,479 |
|
|
|
0.52 |
% |
|
|
955,553 |
|
|
|
1,626 |
|
|
|
0.17 |
% |
Savings and money market deposits |
|
|
631,294 |
|
|
|
16,454 |
|
|
|
2.61 |
% |
|
|
689,825 |
|
|
|
5,102 |
|
|
|
0.74 |
% |
|
|
594,652 |
|
|
|
1,203 |
|
|
|
0.20 |
% |
Time deposits |
|
|
779,524 |
|
|
|
29,990 |
|
|
|
3.85 |
% |
|
|
450,005 |
|
|
|
5,421 |
|
|
|
1.20 |
% |
|
|
417,770 |
|
|
|
2,873 |
|
|
|
0.69 |
% |
Total interest-bearing deposits |
|
|
2,280,034 |
|
|
|
67,788 |
|
|
|
2.97 |
% |
|
|
1,996,174 |
|
|
|
15,002 |
|
|
|
0.75 |
% |
|
|
1,967,975 |
|
|
|
5,702 |
|
|
|
0.29 |
% |
Borrowings and repurchase agreements |
|
|
87,154 |
|
|
|
4,519 |
|
|
|
5.19 |
% |
|
|
66,051 |
|
|
|
2,439 |
|
|
|
3.69 |
% |
|
|
30,574 |
|
|
|
1,587 |
|
|
|
5.19 |
% |
Total interest-bearing liabilities |
|
|
2,367,188 |
|
|
|
72,307 |
|
|
|
3.05 |
% |
|
|
2,062,225 |
|
|
|
17,441 |
|
|
|
0.85 |
% |
|
|
1,998,549 |
|
|
|
7,289 |
|
|
|
0.36 |
% |
Noninterest-bearing deposits |
|
|
440,591 |
|
|
|
|
|
|
|
|
|
676,617 |
|
|
|
|
|
|
|
|
|
725,075 |
|
|
|
|
|
|
|
||||||
Total funding sources |
|
|
2,807,779 |
|
|
|
|
|
|
|
|
|
2,738,842 |
|
|
|
|
|
|
|
|
|
2,723,624 |
|
|
|
|
|
|
|
||||||
Noninterest-bearing liabilities |
|
|
43,661 |
|
|
|
|
|
|
|
|
|
36,339 |
|
|
|
|
|
|
|
|
|
34,969 |
|
|
|
|
|
|
|
||||||
Shareholders’ equity |
|
|
349,140 |
|
|
|
|
|
|
|
|
|
363,253 |
|
|
|
|
|
|
|
|
|
363,759 |
|
|
|
|
|
|
|
||||||
Total liabilities and shareholders’ equity |
|
$ |
3,200,580 |
|
|
|
|
|
|
|
|
$ |
3,138,434 |
|
|
|
|
|
|
|
|
$ |
3,122,352 |
|
|
|
|
|
|
|
||||||
Net interest spread (4) |
|
|
|
|
|
|
|
|
2.28 |
% |
|
|
|
|
|
|
|
|
3.09 |
% |
|
|
|
|
|
|
|
|
3.05 |
% |
||||||
Net interest income/margin (5) |
|
|
|
|
$ |
85,881 |
|
|
|
2.91 |
% |
|
|
|
|
$ |
96,092 |
|
|
|
3.33 |
% |
|
|
|
|
$ |
91,170 |
|
|
|
3.16 |
% |
|||
36
The following table reflects, for the periods indicated, the changes in our net interest income due to changes in the volume of interest-earning assets and interest-bearing liabilities and the associated rates earned or paid on these assets and liabilities.
|
|
2023 Compared to 2022 |
|
|
2022 Compared to 2021 |
|
||||||||||||||||||
|
|
Increase (decrease) due to |
|
|
Increase (decrease) due to |
|
||||||||||||||||||
|
|
Volume |
|
|
Rate |
|
|
Net |
|
|
Volume |
|
|
Rate |
|
|
Net |
|
||||||
Interest-Earning Assets |
|
|
|
|
|
|
|
|
|
|
|
|
|
|
|
|
|
|
||||||
Loans |
|
$ |
7,252 |
|
|
$ |
31,126 |
|
|
$ |
38,378 |
|
|
$ |
11,747 |
|
|
$ |
1,644 |
|
|
$ |
13,391 |
|
Loans held for sale |
|
|
(2,280 |
) |
|
|
(527 |
) |
|
|
(2,807 |
) |
|
|
(2,173 |
) |
|
|
1,064 |
|
|
|
(1,109 |
) |
Securities: |
|
|
|
|
|
|
|
|
|
|
|
|
|
|
|
|
|
|
||||||
Taxable investment securities |
|
|
(1,343 |
) |
|
|
1,892 |
|
|
|
549 |
|
|
|
(675 |
) |
|
|
1,889 |
|
|
|
1,214 |
|
Investment securities exempt from federal income tax |
|
|
(62 |
) |
|
|
12 |
|
|
|
(50 |
) |
|
|
(140 |
) |
|
|
(1 |
) |
|
|
(141 |
) |
Total securities |
|
|
(1,405 |
) |
|
|
1,904 |
|
|
|
499 |
|
|
|
(815 |
) |
|
|
1,888 |
|
|
|
1,073 |
|
Cash balances in other banks |
|
|
402 |
|
|
|
8,065 |
|
|
|
8,467 |
|
|
|
(273 |
) |
|
|
1,937 |
|
|
|
1,664 |
|
Funds Sold |
|
|
(49 |
) |
|
|
167 |
|
|
|
118 |
|
|
|
(10 |
) |
|
|
65 |
|
|
|
55 |
|
Total interest-earning assets |
|
|
3,920 |
|
|
|
40,735 |
|
|
|
44,655 |
|
|
|
8,476 |
|
|
|
6,598 |
|
|
|
15,074 |
|
|
|
|
|
|
|
|
|
|
|
|
|
|
|
|
|
|
|
|
||||||
Interest-Bearing Liabilities |
|
|
|
|
|
|
|
|
|
|
|
|
|
|
|
|
|
|
||||||
Interest-bearing transaction accounts |
|
|
67 |
|
|
|
16,798 |
|
|
|
16,865 |
|
|
|
(169 |
) |
|
|
3,022 |
|
|
|
2,853 |
|
Savings and money market deposits |
|
|
(433 |
) |
|
|
11,785 |
|
|
|
11,352 |
|
|
|
192 |
|
|
|
3,707 |
|
|
|
3,899 |
|
Time deposits |
|
|
3,969 |
|
|
|
20,600 |
|
|
|
24,569 |
|
|
|
222 |
|
|
|
2,326 |
|
|
|
2,548 |
|
Borrowings and repurchase agreements |
|
|
779 |
|
|
|
1,301 |
|
|
|
2,080 |
|
|
|
1,841 |
|
|
|
(989 |
) |
|
|
852 |
|
Total interest-bearing liabilities |
|
|
4,382 |
|
|
|
50,484 |
|
|
|
54,866 |
|
|
|
2,086 |
|
|
|
8,066 |
|
|
|
10,152 |
|
Net Interest Income |
|
$ |
(462 |
) |
|
$ |
(9,749 |
) |
|
$ |
(10,211 |
) |
|
$ |
6,390 |
|
|
$ |
(1,468 |
) |
|
$ |
4,922 |
|
2023 compared to 2022
Our net interest income decreased $10.2 million, or 10.6%, from 2023 to 2022 primarily due to an increase of 222 basis points in the yield on interest-bearing deposits due to the rising rate environment since early 2022 as deposits repriced more quickly than loans and customers shifted into higher cost deposit categories.
Net interest margin for the year ended December 31, 2023 decreased 42 basis points to 2.91% from 3.33% for the year ended December 31, 2022. The decrease primarily related to the increase in the yield on interest-bearing deposits previously mentioned, which accounted for $50.5 million of the $54.9 million increase in interest expense.
2022 compared to 2021
Our net interest income increased $4.9 million, or 5.4%, from 2021 to 2022 primarily due to a 13.9% increase in average loans held for investment partially offset by a 46 basis point increase in the average cost of interest-bearing deposits as market rates increased sharply throughout 2022 and customers shifted into higher cost deposit categories.
The $266.0 million increase in average loans held for investment is primarily attributable to the expansion into the Asheville, Chattanooga, and Knoxville markets, and the transfer of Tri-Net loans held for sale to loans held for investment offset by PPP loan forgiveness and paydowns. Our expansion into these new markets contributed $236.4 million to the increase in average loans while loans transferred from held for sale contributed $66.4 million to the increase. The transfer of Tri-Net loans held for sale to loans held for investment was due to the adverse impact of rapidly rising interest rates on pricing and investor demand. Average PPP loans decreased $123.7 million in 2022 when compared to 2021. PPP fees recognized as income totaled $0.7 million and $7.2 million for the years ended December 31, 2022 and 2021, respectively.
Net interest margin for the year ended December 31, 2022 also benefited from a 76 basis point or 80.0% increase in yields on average cash balances in other banks, federal funds sold, and investment securities which was offset by a decrease in their average balances of $199.2 million, or 23.9% as the Federal Reserve increased interest rates over the year ended December 31, 2022 compared to historically low levels experienced in the year ended December 31, 2021.
37
Provision for credit losses
Prior to January 1, 2023, the allowance for credit losses was based on the then-applicable incurred loss model and represented an estimate of probable incurred losses in the loan portfolio and unfunded commitments at the end of each reporting period. Since the adoption of CECL on January 1, 2023, the allowance for credit losses represents management’s estimate of life of loan credit losses in the loan portfolio and unfunded loan commitments and debt securities. The allowance for unfunded commitments, which is included in other liabilities in the consolidated balance sheets, represents expected losses on unfunded loan commitments that are expected to result in outstanding loan balances. Management’s estimate of credit losses under CECL is determined using a model that relies on reasonable and supportable forecasts and historical loss information to determine the balance of the ACL and resulting provision for credit losses.
Our allowance for credit losses for the loan portfolio as a percentage of total loans held for investment was 1.07%, 1.03% and 1.10% at December 31, 2023, 2022 and 2021, respectively. Our allowance for credit losses for unfunded commitments as a percentage of total unfunded commitments was 0.27% as of December 31, 2023, and 0.04% as of December 31, 2022 prior to the adoption of CECL.
2023 compared to 2022
The year ended December 31, 2023, yielded a recovery of provision expense of $0.8 million , which included the $2.0 million provision expense on the Signature subordinated debt on available-for-sale securities, compared to a $2.5 million provision of credit losses in 2022.
Net charge-offs for the year ended December 31, 2023 were $0.8 million compared to $0.4 million for the comparable period of 2022. Our ACL on loans at December 31, 2023 was 1.07% of total loans held for investment compared to 1.03% as of December 31, 2022. The recovery of provision during the year ended December 31, 2023 is largely driven by a decrease in loan volume as well as an improvement in economic metrics such as forecasted unemployment rates.
The Company recorded a $2.0 million provision on available-for-sale securities related to the expected credit losses on the Signature subordinated debt following its first quarter 2023 failure. A corresponding ACL is recorded on the balance sheet in available-for-sale debt securities. Should such expected credit losses have been experienced under the incurred loss model prior to our adoption of CECL on January 1, 2023, they would have been recorded in other noninterest expense as other than temporary impairment with no corresponding allowance on the balance sheet.
2022 compared to 2021
The year ended December 31, 2022, yielded a $2.5 million provision compared to a $1.1 million release of loan loss reserves in 2021. This increase was primarily attributable to an increase in loans during the year ended December 31, 2022 and other qualitative factors offset by a release of pandemic-related reserves.
Net charge-offs for 2022 were $0.4 million compared to $0.5 million for 2021, while our allowance for loan losses as a percentage of total loans held for investment decreased from 1.10% at December 31, 2021 to 1.03% at December 31, 2022. Similarly, these decreases were attributable to an increase in loan balances during the year ended December 31, 2022 and a release of pandemic-related reserves offset by an increase in other qualitative factors.
See “Notes to Consolidated Financial Statements — Note 4 — Loans and Allowance for Credit Losses on Loans” and Note 3 — "Investment Securities" for additional information on our allowance for credit losses.
Noninterest Income
In addition to net interest income, we generate recurring noninterest income. Our banking operations generate revenue from service charges on deposit accounts, interchange and debit card transaction fees, originating and selling mortgage, commercial real estate and SBA loans, wealth management and gains (losses) on sales of securities. In addition to these types of recurring noninterest income, we own insurance on several key employees and record income within "Other noninterest income" based upon the increase in the cash surrender value of these policies.
38
The following table sets forth the principal components of noninterest income for the periods indicated.
|
|
|
|
|
|
|
|
2023 - 2022 |
|
|
|
|
|
2022 - 2021 |
|
|||||
|
|
Year Ended |
|
|
Percent |
|
|
Year Ended |
|
|
Percent |
|
||||||||
|
|
December 31, |
|
|
Increase |
|
|
December 31, |
|
|
Increase |
|
||||||||
|
|
2023 |
|
|
2022 |
|
|
(Decrease) |
|
|
2021 |
|
|
(Decrease) |
|
|||||
Noninterest income: |
|
|
|
|
|
|
|
|
|
|
|
|
|
|
|
|||||
Deposit service charges |
|
$ |
5,289 |
|
|
$ |
4,781 |
|
|
|
10.6 |
% |
|
$ |
4,515 |
|
|
|
5.9 |
% |
Interchange and debit card transaction fees |
|
|
4,879 |
|
|
|
5,053 |
|
|
|
(3.4 |
)% |
|
|
4,816 |
|
|
|
4.9 |
% |
Mortgage banking |
|
|
3,383 |
|
|
|
5,073 |
|
|
|
(33.3 |
)% |
|
|
16,058 |
|
|
|
(68.4 |
)% |
Tri-Net |
|
|
84 |
|
|
|
78 |
|
|
|
7.7 |
% |
|
|
8,613 |
|
|
|
(99.1 |
)% |
Wealth management |
|
|
1,710 |
|
|
|
1,687 |
|
|
|
1.4 |
% |
|
|
1,850 |
|
|
|
(8.8 |
)% |
SBA lending |
|
|
3,323 |
|
|
|
2,501 |
|
|
|
32.9 |
% |
|
|
2,060 |
|
|
|
21.4 |
% |
Net gain on sale of securities |
|
|
5 |
|
|
|
8 |
|
|
|
(37.5 |
)% |
|
|
28 |
|
|
|
(71.4 |
)% |
Bank owned life insurance |
|
|
3,942 |
|
|
|
2,996 |
|
|
|
31.6 |
% |
|
|
1,829 |
|
|
|
63.8 |
% |
Other noninterest income |
|
|
3,536 |
|
|
|
2,345 |
|
|
|
50.8 |
% |
|
|
2,912 |
|
|
|
(19.5 |
)% |
Total noninterest income |
|
$ |
26,151 |
|
|
$ |
24,522 |
|
|
|
6.6 |
% |
|
$ |
42,681 |
|
|
|
(42.5 |
)% |
2023 compared to 2022
Deposit service charges increased for the year ended December 31, 2023 compared to the same period in 2022. These amounts originate from our commercial and consumer deposit accounts.
Interchange and debit card transaction fees fluctuate based upon transaction volumes, which were lower during the year ended December 31, 2023 compared to the same period in 2022.
Mortgage banking income consists of fees and gains from the origination of loans in our markets that are subsequently sold to third-party investors. Generally, mortgage banking income increases in lower interest rate environments and more robust housing markets and declines in rising interest rate environments and more challenging housing markets. Mortgage banking income will fluctuate from period to period as the rate environment changes. The declines above are indicative of the mortgage market responding to the higher rate environment.
Tri-Net represents a line of business which generally originates and sells commercial real estate loans to third-party investors. All of these loan sales transfer servicing rights to the buyer. Tri-Net activity remained limited in 2023 as the Company assessed market pricing. Comparatively, in 2022, the Company transferred $105.5 million from loans held for sale to loans held for investment due to the adverse impact of rapidly rising interest rates on pricing and investor demand. This resulted in a $1.3 million realized loss on sale of loans and $2.4 million unrealized loss on loans transferred to held for investment, partially offset by a $1.6 million gain on related hedge instruments.
Noninterest income for SBA lending, which represents gains on sales of guaranteed portions of SBA loans, increased for the year ended December 31, 2023 compared to 2022 as the Company expanded the SBA team in the fourth quarter of 2022.
Other noninterest income primarily consists of loan related fees, bank-owned life insurance, and other service-related fees. Servicing income, SBIC income, and death benefit income from bank-owned life insurance increased when compared to 2022.
39
2022 compared to 2021
A decrease in mortgage banking and Tri-Net income drove a decrease in total noninterest income of $18.2 million to $24.5 million, or 17.8% of total revenue, for the year ended December 31, 2022 compared to $42.7 million, or 30.3% of total revenue, for the year ended December 31, 2021.
Mortgage banking income consists of mortgage fee income from the origination and sale of mortgage loans. These mortgage fees are for loans originated in our markets that are subsequently sold to third-party investors. Generally, mortgage origination fees increase in lower interest rate environments and more robust housing markets and decrease in rising interest rate environments and more challenging housing markets. Mortgage origination fees will fluctuate from period to period as the rate environment changes. Mortgage banking income decreased 68.4% from 2021 to 2022 primarily due to the Federal Reserve rate increases over 2022, and corresponding increases in mortgage rates, resulting in fewer lending transactions.
Revenue for Tri-Net, a business launched in the fourth quarter of 2016, is derived from the origination and sale of commercial real estate loans to third-party investors. Income from Tri-Net sales decreased significantly compared to the prior year primarily due to the adverse impact of rapidly rising interest rates on pricing and investor demand. As a result of this impact, the Company transferred $105.5 million of Tri-Net loans from loans held for sale to loans held for investment. Tri-Net results include a $1.3 million realized loss on sale of loans and a $2.4 million unrealized loss on loans transferred to held for investment, partially offset by a $1.6 million gain on related hedge instruments. The Company paused any further commitments to originate such loans early in the third quarter of 2022, noting that originations would restart only when clear indications of market stabilization and liquidity normalization are observed. The Company announced plans to test a limited pool of Tri-Net originations in the 1st half of 2023.
SBA loan sales revenue also increased $0.4 million, or 21.4%, when compared to the prior year due to increased volumes and premiums as we continue to invest in and grow our government guaranteed lending division.
Income on bank owned life insurance increased $1.2 million, or 63.8%, in the year ended December 31, 2022 when compared to the year ended December 31, 2021 primarily due to the gain on death benefits.
Other noninterest income primarily consists of loan related fees and other service-related fees.
Noninterest Expense
The following table presents the primary components of noninterest expense for the periods indicated.
|
|
|
|
|
|
|
|
2023 - 2022 |
|
|
|
|
|
2022 - 2021 |
|
|||||
|
|
Year Ended |
|
|
Percent |
|
|
Year Ended |
|
|
Percent |
|
||||||||
|
|
December 31, |
|
|
Increase |
|
|
December 31, |
|
|
Increase |
|
||||||||
|
|
2023 |
|
|
2022 |
|
|
(Decrease) |
|
|
2021 |
|
|
(Decrease) |
|
|||||
Noninterest expense: |
|
|
|
|
|
|
|
|
|
|
|
|
|
|
|
|||||
Salaries and employee benefits |
|
$ |
40,314 |
|
|
$ |
38,065 |
|
|
|
5.9 |
% |
|
$ |
41,758 |
|
|
|
(8.8 |
)% |
Data processing and software |
|
|
12,884 |
|
|
|
11,152 |
|
|
|
15.5 |
% |
|
|
11,248 |
|
|
|
(0.9 |
)% |
Occupancy |
|
|
4,514 |
|
|
|
4,299 |
|
|
|
5.0 |
% |
|
|
4,205 |
|
|
|
2.2 |
% |
Equipment |
|
|
2,592 |
|
|
|
2,988 |
|
|
|
(13.3 |
)% |
|
|
3,507 |
|
|
|
(14.8 |
)% |
Professional services |
|
|
3,067 |
|
|
|
2,175 |
|
|
|
41.0 |
% |
|
|
2,155 |
|
|
|
0.9 |
% |
Regulatory fees |
|
|
1,806 |
|
|
|
1,080 |
|
|
|
67.2 |
% |
|
|
1,031 |
|
|
|
4.8 |
% |
Acquisition related expenses |
|
|
1,682 |
|
|
|
— |
|
|
|
— |
|
|
|
323 |
|
|
|
(100.0 |
)% |
Amortization of intangibles |
|
|
1,441 |
|
|
|
1,690 |
|
|
|
(14.7 |
)% |
|
|
1,939 |
|
|
|
(12.8 |
)% |
Other operating expense |
|
|
6,684 |
|
|
|
7,921 |
|
|
|
(15.6 |
)% |
|
|
7,375 |
|
|
|
7.4 |
% |
Total noninterest expense |
|
$ |
74,984 |
|
|
$ |
69,370 |
|
|
|
8.1 |
% |
|
$ |
73,541 |
|
|
|
(5.7 |
)% |
40
2023 compared to 2022
Total noninterest expense for 2023 increased $5.6 million, or 8.1%, to $75.0 million compared to $69.4 million for 2022 with salaries and employee benefits increasing $2.2 million, or 5.9%. In 2022, our executives elected to voluntarily forego their annual bonuses which totaled $0.9 million in an effort to establish a culture of operational excellence following two operational losses and losses in the Company's Tri-Net division. Additionally, noninterest expense in 2022 includes $1.5 million in operational losses for which the bank recovered $0.5 million in 2023.
Our efficiency ratio was 66.9% and 57.51% for 2023 and 2022, respectively. The efficiency ratio is the ratio of noninterest expense to the sum of net interest income and noninterest income and measures the amount of expense that is incurred to generate a dollar of revenue.
2022 compared to 2021
Total noninterest expense for 2022 decreased $4.2 million, or 5.7%, to $69.4 million compared to $73.5 million for 2021 primarily due to a decrease in salaries and employee benefits of $3.7 million, or 8.8%. While our base employee count stayed consistent at 397, our incentive compensation decreased in 2022 in relation to net income, Tri-Net activity, and mortgage banking activities. Additionally, in 2022, our executives elected to voluntarily forego their annual bonuses which totaled $0.9 million in an effort to establish a culture of operational excellence following two operational losses and losses in the Company's Tri-Net division.
Other noninterest expense in 2022 includes $1.5 million in operational losses for which the bank sought recovery.
Our efficiency ratio was 57.51% and 54.94% for 2022 and 2021, respectively. The efficiency ratio is the ratio of noninterest expense to the sum of net interest income and noninterest income and measures the amount of expense that is incurred to generate a dollar of revenue.
Income Taxes
2023 compared to 2022
We recorded income tax expense of $6.4 million and $9.8 million in 2023 and 2022, respectively. Our effective income tax rate for 2023 and 2022 was 17.7% and 20.0%, respectively. Our effective tax rate differs from the statutory tax rate due to our investments in qualified municipal securities, tax benefits from the Bank's real estate investment trust, company owned life insurance, state tax credits, net of the effect of certain non-deductible expenses and the recognition of excess tax benefits related to stock compensation. Higher income on bank owned life insurance contracts contributed to the lower effective tax rate in 2023 compared to 2022.
2022 compared to 2021
We recorded income tax expense of $9.8 million and $12.7 million in 2022 and 2021, respectively. Our effective income tax rate for 2022 and 2021 was 20.0% and 20.7%, respectively. Our effective tax rate differs from the statutory tax rate due to our investments in qualified municipal securities, tax benefits from the Bank's real estate investment trust, company owned life insurance, state tax credits, net of the effect of certain non-deductible expenses and the recognition of excess tax benefits related to stock compensation. The lower effective tax rate in 2022 compared to 2021 is mainly the result of higher income on bank owned life insurance contracts and an increase in Tennessee state tax credits offset by fewer adjustments related to excess stock compensation expense.
41
Financial Condition
2023 compared to 2022
Total assets increased from $3,117.2 million at December 31, 2022 to $3,142.2 million at December 31, 2023. Loans held for investment decreased 1.9% from $2,312.8 million at December 31, 2022 to $2,269.7 million at December 31, 2023. Loans held for sale decreased $12.4 million or 27.8%, during 2023 which is primarily related to the pausing of Tri-Net originations and declines in mortgage banking volumes offset by increases in SBA lending. Cash and cash equivalents increased $124.3 million or 91.9% during 2023 in comparison to 2022.
Total liabilities increased from $2,763.0 million at December 31, 2022 to $2,780.6 million at December 31, 2023. Deposits decreased $17.5 million to $2,662.3 million at December 31, 2023 compared to $2,679.8 million at December 31, 2022. While in the short-term the Company is experiencing a period of increased competition for deposits driven by high interest rates, a key longer-term strategic initiative is to create a stronger deposit-led culture with an emphasis on lower cost relationship-based deposits. As of December 31, 2023 versus December 31, 2022, noninterest bearing transaction deposits declined $151.7 million while interest bearing transaction, money market and saving balances increased $188.0 million, customer time deposits increased $102.1 million and brokered time deposits declined $156.0 million.
2022 compared to 2021
Total assets decreased from $3,133.0 million at December 31, 2021 to $3,117.2 million at December 31, 2022. Loans held for investment grew from $1,965.8 million at December 31, 2021 to $2,312.8 million at December 31, 2022, a 17.7% increase. The increase was supported by organic loan growth as well as transfers of loans from held for sale. Loans held for sale decreased $39.0 million or 46.6%, during 2022 which is primarily related to the pausing of Tri-Net originations and declines in mortgage banking volumes. Cash and cash equivalents decreased $279.8 million or 67.4% as the Company deployed its excess liquidity experienced in 2021 to fund loan originations, the repurchase of common stock, and dividends in 2022.
42
Total liabilities increased from $2,753.0 million at December 31, 2021 to $2,763.0 million at December 31, 2022. Deposits decreased $4.5 million to $2,679.8 million at December 31, 2022 compared to $2,684.2 million at December 31, 2021. While in the short-term the Company is experiencing a period of increased competition for deposits driven by high interest rates, a key longer-term strategic initiative is to create a stronger deposit-led culture with an emphasis on lower cost relationship-based deposits. As of December 31, 2022, the Company’s lowest cost deposit category, noninterest bearing, decreased $213.1 million from December 31, 2021 to December 31, 2022, while higher cost time deposits increased $335.6 million or 90.0%. Other changes in deposits from 2021 to 2022 included a $194.7 million decrease or 20.6% in interest-bearing transaction deposits and a $67.7 million or 10.6% increase in savings and money market accounts.
Investment Securities
The investment portfolio plays a key role in the management of liquidity and interest rate risk and provides another source of interest income. In managing the composition of the balance sheet, we seek a balance between earnings sources and credit and liquidity considerations. We manage our investment portfolio according to a written investment policy approved by our board of directors. Balances in our investment portfolio are subject to change over time based on our funding needs and interest rate risk management objectives. Our liquidity levels take into account anticipated future cash flows and all available sources of funds and are maintained at levels we believe are appropriate to assure future flexibility in meeting our anticipated funding needs.
Our investment portfolio consists primarily of securities issued by U.S. government-sponsored agencies, agency mortgage-backed securities, obligations of states and political subdivisions, asset-backed securities and other debt securities, all with varying contractual maturities. However, these maturities do not necessarily represent the expected life of the securities as some of these securities may be called or paid down without penalty prior to their stated maturities. The investment portfolio is regularly reviewed by the Asset Liability Management committee, or ALCO, of the Bank to ensure an appropriate risk and return profile as well as for adherence to the investment policy. Our investment portfolio totaled $359.3 million, $397.7 million, and $461.2 million as of December 31, 2023, 2022 and 2021, respectively. The Company recorded a provision for credit loss on available-for-sale securities and a corresponding ACL of $2.0 million during the first quarter of 2023 related to ownership in Signature Bank ("Signature") subordinated debt securities which, following Signature's first quarter failure, were deemed to have significant credit losses. The Company has performed an assessment of its corporate debt securities which is largely made up of other financial institution investment grade subordinated debt based on various factors including liquidity and soundness of the underlying financial institution and credit rating and no other such credit losses are expected to be present in the Company's portfolio as of December 31, 2023. The investment portfolio declined versus 2022 as management elected not to reinvest security paydowns and maturities. See Note 3 to our Consolidated Financial Statements for additional information on our investment securities.
43
The following table presents the fair value of our securities as of December 31, 2023 by their stated maturities (this maturity schedule excludes security prepayment and call features), as well as the weighted average yields for each maturity range.
|
|
Due in one year or less |
|
|
Due in one year to five years |
|
|
Due in five years to ten years |
|
|
Due after ten years |
|
||||||||||||||||||||
|
|
Fair Value |
|
|
Weighted Average Yield |
|
|
Fair Value |
|
|
Weighted Average Yield |
|
|
Fair Value |
|
|
Weighted Average Yield |
|
|
Fair Value |
|
|
Weighted Average Yield |
|
||||||||
Securities available for sale: |
|
|
|
|
|
|
|
|
|
|
|
|
|
|
|
|
|
|
|
|
|
|
|
|
||||||||
U. S. government agency securities |
|
$ |
— |
|
|
|
— |
|
|
$ |
794 |
|
|
|
2.2 |
% |
|
$ |
8,503 |
|
|
|
2.2 |
% |
|
$ |
2,307 |
|
|
|
1.9 |
% |
State and municipal securities |
|
|
— |
|
|
|
— |
|
|
|
9,407 |
|
|
|
2.1 |
% |
|
|
31,125 |
|
|
|
1.9 |
% |
|
|
27,520 |
|
|
|
2.8 |
% |
Mortgage-backed securities |
|
|
1,390 |
|
|
|
3.3 |
% |
|
|
7,404 |
|
|
|
2.8 |
% |
|
|
43,260 |
|
|
|
2.5 |
% |
|
|
168,011 |
|
|
|
1.4 |
% |
Asset-backed securities |
|
|
— |
|
|
|
— |
|
|
|
— |
|
|
|
— |
|
|
|
— |
|
|
|
— |
|
|
|
3,146 |
|
|
|
6.5 |
% |
Other debt securities |
|
|
1,076 |
|
|
|
2.4 |
% |
|
|
10,039 |
|
|
|
5.0 |
% |
|
|
45,338 |
|
|
|
3.7 |
% |
|
|
— |
|
|
|
— |
|
Total securities available for sale |
|
$ |
2,466 |
|
|
|
2.9 |
% |
|
$ |
27,644 |
|
|
|
3.4 |
% |
|
$ |
128,226 |
|
|
|
2.8 |
% |
|
$ |
200,984 |
|
|
|
1.7 |
% |
Securities held to maturity: |
|
|
|
|
|
|
|
|
|
|
|
|
|
|
|
|
|
|
|
|
|
|
|
|
||||||||
State and municipal securities |
|
$ |
— |
|
|
|
— |
|
|
$ |
— |
|
|
|
— |
|
|
$ |
— |
|
|
|
— |
|
|
$ |
— |
|
|
|
— |
|
Total securities held to maturity |
|
$ |
— |
|
|
|
— |
|
|
$ |
— |
|
|
|
— |
|
|
$ |
— |
|
|
|
— |
|
|
$ |
— |
|
|
|
— |
|
Loans and Leases
Loans and leases are our largest category of earning assets and typically provide higher yields than other types of earning assets. Associated with the higher loan yields are the inherent credit and liquidity risks that we attempt to control and counterbalance.
The composition of gross loans and leases at December 31 for each of the past three years and the percentage of each classification to total loans are summarized as follows:
|
|
December 31, 2023 |
|
|
December 31, 2022 |
|
|
December 31, 2021 |
|
|||||||||||||||
|
|
Amount |
|
|
Percent |
|
|
Amount |
|
|
Percent |
|
|
Amount |
|
|
Percent |
|
||||||
Commercial real estate - owner occupied |
|
$ |
281,219 |
|
|
|
12.4 |
% |
|
$ |
246,109 |
|
|
|
10.7 |
% |
|
$ |
209,261 |
|
|
|
10.6 |
% |
Commercial real estate - non-owner occupied |
|
|
761,225 |
|
|
|
33.5 |
% |
|
|
803,611 |
|
|
|
34.7 |
% |
|
|
616,023 |
|
|
|
31.3 |
% |
Consumer real estate |
|
|
423,338 |
|
|
|
18.7 |
% |
|
|
402,615 |
|
|
|
17.4 |
% |
|
|
326,412 |
|
|
|
16.6 |
% |
Construction and land development |
|
|
212,528 |
|
|
|
9.4 |
% |
|
|
229,972 |
|
|
|
9.9 |
% |
|
|
214,310 |
|
|
|
10.9 |
% |
Commercial and industrial |
|
|
501,912 |
|
|
|
22.1 |
% |
|
|
496,347 |
|
|
|
21.5 |
% |
|
|
497,615 |
|
|
|
25.3 |
% |
Consumer |
|
|
48,758 |
|
|
|
2.1 |
% |
|
|
53,382 |
|
|
|
2.3 |
% |
|
|
46,811 |
|
|
|
2.4 |
% |
Other |
|
|
40,766 |
|
|
|
1.8 |
% |
|
|
80,762 |
|
|
|
3.5 |
% |
|
|
55,337 |
|
|
|
2.9 |
% |
Total loans |
|
$ |
2,269,746 |
|
|
|
100.0 |
% |
|
$ |
2,312,798 |
|
|
|
100.0 |
% |
|
$ |
1,965,769 |
|
|
|
100.0 |
% |
Our principal market for lending is the State of Tennessee and adjacent states that can be effectively accessed from our banking offices. Our target borrower profile includes consumers, small to medium sized businesses, professional firms, real estate investors and developers, and their owners and managers. Our growth since 2018 has been concentrated in borrowers meeting that profile. Our primary competition is community, regional, and national banks operating in our primary markets. In seeking customer banking relationships, we rely on a model of delivering services through a qualified banker meeting all the banking service needs of the business and its primary stakeholders.
At December 31, 2023, our loan portfolio composition remained relatively consistent versus December 31, 2022. Our loan growth since inception has been reflective of the target market that we serve with commercial real estate loans making up 46% of the portfolio. The repayment of owner-occupied properties is largely dependent on the operations
44
of the tenant, while non-owner occupied properties are dependent upon the operation, refinance, or sale of the underlying real estate.
The repayment of loans is a source of additional liquidity for us. The following table details maturities and sensitivity to interest rate changes for our loan portfolio at December 31, 2023.
|
|
December 31, 2023 |
|
|||||||||||||||||
|
|
Due in 1 year or less |
|
|
Due in 1-5 years |
|
|
Due after 5-15 years |
|
|
Due after 15 years |
|
|
Total |
|
|||||
Commercial real estate - owner occupied |
|
$ |
5,628 |
|
|
$ |
190,469 |
|
|
$ |
75,972 |
|
|
$ |
9,150 |
|
|
$ |
281,219 |
|
Commercial real estate - non-owner occupied |
|
|
93,147 |
|
|
$ |
457,733 |
|
|
$ |
199,136 |
|
|
$ |
11,209 |
|
|
$ |
761,225 |
|
Consumer real estate |
|
|
15,070 |
|
|
|
111,362 |
|
|
|
212,555 |
|
|
|
84,351 |
|
|
|
423,338 |
|
Construction and land development |
|
|
45,464 |
|
|
|
142,999 |
|
|
|
14,194 |
|
|
|
9,871 |
|
|
|
212,528 |
|
Commercial and industrial |
|
|
143,566 |
|
|
|
183,941 |
|
|
|
147,082 |
|
|
|
27,323 |
|
|
|
501,912 |
|
Consumer |
|
|
9,976 |
|
|
|
34,812 |
|
|
|
3,916 |
|
|
|
54 |
|
|
|
48,758 |
|
Other |
|
|
6,308 |
|
|
|
12,859 |
|
|
|
21,163 |
|
|
|
436 |
|
|
|
40,766 |
|
Gross loans |
|
$ |
319,159 |
|
|
$ |
1,134,175 |
|
|
$ |
674,018 |
|
|
$ |
142,394 |
|
|
$ |
2,269,746 |
|
|
|
|
|
|
|
|
|
|
|
|
|
|
|
|
|
|||||
Interest rate sensitivity |
|
|
|
|
|
|
|
|
|
|
|
|
|
|
|
|||||
Fixed interest rates |
|
|
96,234 |
|
|
|
845,057 |
|
|
|
320,386 |
|
|
|
13,587 |
|
|
|
1,275,264 |
|
Floating or adjustable interest rates |
|
|
222,925 |
|
|
|
289,117 |
|
|
|
353,634 |
|
|
|
128,806 |
|
|
|
994,482 |
|
Total gross loans |
|
$ |
319,159 |
|
|
$ |
1,134,174 |
|
|
$ |
674,020 |
|
|
$ |
142,393 |
|
|
$ |
2,269,746 |
|
The information presented in the table above is based upon the contractual maturities of the individual loans, which may be renewed at their contractual maturity. Renewal of such loans is subject to review and credit approval, as well as modification of terms at their maturity. Consequently, we believe that this treatment presents fairly the maturity structure of the loan portfolio.
Asset Quality
One of our key objectives is to maintain a high level of asset quality in our loan portfolio. We utilize disciplined and thorough underwriting processes that collaboratively engage our seasoned and experienced business bankers and credit underwriters in the analysis of each loan request. Based upon our aggregate exposure to any given borrower relationship, we employ scaled review of loan originations that may involve senior credit officers, our Chief Credit Officer, our Chief Credit Policy Officer, the Bank’s Credit Committee or, ultimately, our full board of directors. In addition, we have adopted underwriting guidelines to be followed by our lending officers that require senior management review of proposed extensions of credit exceeding certain thresholds. When delinquencies exist, we monitor the levels of such delinquencies for any negative or adverse trends. Our loan review procedures include approval of lending policies and underwriting guidelines by the board of directors of our bank, an independent loan review, approval of larger credit relationships by our bank’s Credit Committee and loan quality documentation procedures. Like other financial institutions, we are subject to the risk that our loan portfolio will be subject to increasing pressures from deteriorating borrower credit due to general economic conditions.
We target small and medium sized businesses, the owners and operators of such businesses and other consumers and high net worth individuals as loan clients. Because of their size, these borrowers may be less able to withstand competitive or economic pressures than larger borrowers in periods of economic weakness. If loan losses occur at a level where the allowance for loan losses is not sufficient to cover actual loan losses, our earnings will decrease. We use an independent consulting firm to review our loans for quality in addition to the reviews that may be conducted internally and by bank regulatory agencies as part of their examination process. The Bank has procedures and processes in place intended to assess whether losses exceed the potential amounts documented in our bank’s impairment analyses and to reduce potential losses in the remaining performing loans within our loan portfolio. These procedures and processes include the following:
45
The Bank categorizes loans into risk categories based on relevant information about the ability of borrowers to service their debt such as: current financial information, historical payment experience, credit documentation, public information, and current economic trends, among other factors. The Bank analyzes loans individually by classifying each loan as to credit risk. This analysis includes all commercial loans and consumer relationships with an outstanding balance greater than $500,000, individually. This analysis is performed on a regular basis by the relationship managers and credit department personnel. On at least an annual basis an independent party performs a formal credit risk review of a sample of the loan portfolio. Among other things, this review assesses the appropriateness of the risk rating of each loan in the sample. See Note 4 to our Consolidated Financial Statements for a table that provides the risk category of loans by applicable class of loans.
Non-Performing Loans and Assets
Information summarizing non-performing assets, including non-accrual loans follows.
|
|
December 31, 2023 |
|
|
December 31, 2022 |
|
||
Non-accrual loans: |
|
|
|
|
|
|
||
Commercial real estate - owner occupied |
|
$ |
1,720 |
|
|
$ |
4,982 |
|
Commercial real estate - non-owner occupied |
|
|
454 |
|
|
|
— |
|
Consumer real estate |
|
|
5,194 |
|
|
|
456 |
|
Construction and land development |
|
|
4 |
|
|
|
8 |
|
Commercial and industrial |
|
|
5,229 |
|
|
|
4,065 |
|
Consumer |
|
|
1,783 |
|
|
|
54 |
|
Other |
|
|
414 |
|
|
|
— |
|
PCI (Under incurred loss methodology) |
|
|
— |
|
|
|
1,149 |
|
Non-accrual loans |
|
$ |
14,798 |
|
|
$ |
10,714 |
|
|
|
|
|
|
|
|
||
Non-performing loans |
|
|
14,798 |
|
|
|
10,714 |
|
Other real estate owned |
|
|
11 |
|
|
|
— |
|
Non-performing assets |
|
$ |
14,809 |
|
|
$ |
10,714 |
|
|
|
|
|
|
|
|
||
Non-performing loans to loans held for investment |
|
|
0.66 |
% |
|
|
0.46 |
% |
Non-performing assets to total assets |
|
|
0.47 |
% |
|
|
0.34 |
% |
Non-accrual loans to total loans increased to 0.66% at December 31, 2023 compared to 0.46% at December 31, 2022. The increase in non-accrual loans is principally related to three relationships that total $8.5 million. These loans are primarily made up of one relationship totaling $4.1 million that is mainly secured by real estate, with no loss expected. The other two relationships are related to SBA borrowers, with most loans carrying government guaranties ranging from 50% to 75%. No loss is expected on one of these relationships, while a specific reserve of $0.5 million has been taken on the other.
We have established a policy to discontinue accruing interest on loans (that is, place the loans on non-accrual status) after they have become 90 days delinquent as to payment of principal or interest, unless the loans are considered to be well-collateralized and are in the process of collection. Consumer loans and any accrued interest are typically charged off no later than 180 days past due. In addition, a loan will not be placed on non-accrual status before it becomes 90 days delinquent unless management believes that the collection of all principal and interest is not expected in a timely manner. Interest previously accrued but uncollected on such loans is reversed and charged against interest income when the receivable is determined to be uncollectible. If we believe that a loan will not be collected in full, we will increase the allowance for loan losses to reflect management’s estimate of any potential exposure or loss. Generally, payments received on non-accrual loans are applied directly to principal. As of December 31, 2023, there were no
46
loans, outside of those included in the table above, that cause management to have serious doubts as to the ability of borrowers to comply with present repayment terms.
Due to the weakening credit status of a borrower, we may elect to formally restructure certain loans to facilitate a repayment plan that seeks to minimize the potential losses, if any, that we might incur. Loans that have been restructured that are on non-accruing status as of the date of restructuring, are included in the nonperforming loan balances as discussed above and are classified as impaired loans. Loans that have been restructured that are on accrual status as of the restructure date are not included in nonperforming loans; however, such loans are still considered impaired.
47
Allowance for Credit Losses ("ACL")
Our allowance for credit losses represents our estimate of probable inherent credit losses in the loan portfolio. We determine the allowance based on an ongoing evaluation of risk as it correlates to potential losses within the portfolio. Increases in the allowance are made by charges to the provision for loan losses. Loans deemed to be uncollectible are charged against the allowance. Recoveries of previously charged-off amounts are credited to our allowance. The judgments and estimates associated with our allowance determination are described under “Critical Accounting Policies and Estimates” above and in Notes 1 and 4 to the “Notes to Consolidated Financial Statements.”
While no portion of our allowance is in any way restricted to any individual loan or group of loans and the entire allowance is available to absorb losses from any and all loans, the following tables represent management’s allocation of our allowance to specific loan categories for the periods indicated.
|
|
December 31, 2023 |
|
|
December 31, 2022 |
|
|
December 31, 2021 |
|
|||||||||||||||||||||||||||
|
|
Net Charge-Offs (Recoveries) |
|
|
Average Loans |
|
|
Ratio (Annualized) |
|
|
Net Charge-Offs (Recoveries) |
|
|
Average Loans |
|
|
Ratio (Annualized) |
|
|
Net Charge-Offs (Recoveries) |
|
|
Average Loans |
|
|
Ratio (Annualized) |
|
|||||||||
Commercial real estate - owner occupied |
|
$ |
— |
|
|
$ |
277,322 |
|
|
|
— |
|
|
$ |
— |
|
|
$ |
276,515 |
|
|
|
— |
|
|
$ |
— |
|
|
$ |
205,562 |
|
|
|
— |
|
Commercial real estate - non-owner occupied |
|
|
— |
|
|
|
792,326 |
|
|
|
— |
|
|
|
(213 |
) |
|
|
701,559 |
|
|
|
(0.03 |
)% |
|
|
— |
|
|
|
521,540 |
|
|
|
— |
|
Consumer real estate |
|
|
4 |
|
|
|
422,140 |
|
|
|
— |
|
|
|
2 |
|
|
|
358,201 |
|
|
|
— |
|
|
|
(17 |
) |
|
|
331,274 |
|
|
|
(0.01 |
)% |
Construction and land development |
|
|
— |
|
|
|
224,173 |
|
|
|
— |
|
|
|
— |
|
|
|
208,385 |
|
|
|
— |
|
|
|
— |
|
|
|
196,098 |
|
|
|
— |
|
Commercial and industrial |
|
|
444 |
|
|
|
527,238 |
|
|
|
0.08 |
% |
|
|
172 |
|
|
|
501,132 |
|
|
|
0.03 |
% |
|
|
189 |
|
|
|
552,561 |
|
|
|
0.03 |
% |
Consumer |
|
|
205 |
|
|
|
52,251 |
|
|
|
0.39 |
% |
|
|
220 |
|
|
|
50,945 |
|
|
|
0.43 |
% |
|
|
123 |
|
|
|
45,263 |
|
|
|
0.27 |
% |
Other |
|
|
152 |
|
|
|
42,025 |
|
|
|
0.36 |
% |
|
|
185 |
|
|
|
79,336 |
|
|
|
0.23 |
% |
|
|
186 |
|
|
|
57,817 |
|
|
|
0.32 |
% |
Total net charge-offs (recoveries) |
|
$ |
805 |
|
|
$ |
2,337,475 |
|
|
|
0.03 |
% |
|
$ |
366 |
|
|
$ |
2,176,073 |
|
|
|
0.02 |
% |
|
$ |
481 |
|
|
$ |
1,910,115 |
|
|
|
0.03 |
% |
Changes in the allocation of the allowance from year to year in various categories are influenced by the level of net charge-offs in respective categories and other factors including, but not limited to, an evaluation of the impact of current economic conditions and trends, risk allocations tied to specific loans or groups of loans and changes in qualitative allocations. Management believes that allocations for each loan category are reasonable and reflective of risk inherent in the portfolio.
48
Deposits
Client deposits are the primary funding source for our loan growth. The following table presents the average balance and average rate paid on deposits for each of the following categories for the periods indicated.
|
|
Year ended December 31, |
|
|||||||||||||||||||||
|
|
2023 |
|
|
2022 |
|
|
2021 |
|
|||||||||||||||
|
|
Average Balance |
|
|
Average Rate Paid |
|
|
Average Balance |
|
|
Average Rate Paid |
|
|
Average Balance |
|
|
Average Rate Paid |
|
||||||
Types of Deposits: |
|
|
|
|
|
|
|
|
|
|
|
|
|
|
|
|
|
|
||||||
Noninterest-bearing demand deposits |
|
$ |
440,591 |
|
|
|
— |
|
|
$ |
676,617 |
|
|
|
— |
|
|
$ |
725,075 |
|
|
|
— |
|
Interest-bearing transaction accounts |
|
|
869,216 |
|
|
|
2.46 |
% |
|
|
856,344 |
|
|
|
0.52 |
% |
|
|
955,553 |
|
|
|
0.17 |
% |
Money market accounts |
|
|
494,533 |
|
|
|
3.28 |
% |
|
|
524,661 |
|
|
|
0.93 |
% |
|
|
451,947 |
|
|
|
0.23 |
% |
Savings accounts |
|
|
136,761 |
|
|
|
0.18 |
% |
|
|
165,164 |
|
|
|
0.13 |
% |
|
|
142,705 |
|
|
|
0.11 |
% |
Time deposits |
|
|
779,524 |
|
|
|
3.85 |
% |
|
|
450,005 |
|
|
|
1.20 |
% |
|
|
417,770 |
|
|
|
0.69 |
% |
Total deposits |
|
$ |
2,720,625 |
|
|
|
2.97 |
% |
|
$ |
2,672,791 |
|
|
|
0.56 |
% |
|
$ |
2,693,050 |
|
|
|
0.21 |
% |
Total average deposits remained relatively stable in 2023 compared to 2022 and 2021. Increased pricing pressure during the year ended December 31, 2023 resulted in a shift to higher cost deposit categories during the year but the Company continues to focus on building and expanding client relationships to deliver on our core deposit-led strategy.
The maturities of time deposits that exceed the FDIC insurance limit of $250 thousand at December 31, 2023 are as follows ($ in thousands):
|
|
|
|
December 31, 2023 |
|
|||||||||||||||||
|
|
Three months or less |
|
|
Over three through six months |
|
|
Over six through twelve months |
|
|
Over twelve months |
|
|
Total |
|
|||||||
Time deposits in excess of FDIC insurance limit |
|
$ |
35,600 |
|
|
$ |
25,137 |
|
|
$ |
47,164 |
|
|
$ |
12,692 |
|
|
$ |
120,593 |
|
||
Capital Adequacy
As of December 31, 2023, CapStar Financial’s capital ratios were as follows.
|
|
Well Capitalized Guidelines |
|
|
December 31, 2023 |
|
||
Total risk-based capital |
|
|
10.00 |
% |
|
|
15.78 |
% |
Tier 1 risk-based capital |
|
|
8.00 |
% |
|
|
13.77 |
% |
Common equity tier 1 capital |
|
|
6.50 |
% |
|
|
13.77 |
% |
Tier 1 leverage |
|
|
5.00 |
% |
|
|
11.22 |
% |
See Note 16 to the “Notes to Consolidated Financial Statements” for additional information related to our capital position.
Market Risk
Our objective is to manage assets and liabilities to provide a satisfactory, consistent level of profitability within the framework of our established liquidity, loan, investment, borrowing, and capital policies. Our ALCO is charged with the responsibility of monitoring these policies, which are designed to ensure an acceptable composition of asset/liability mix. Two critical areas of focus for ALCO are interest rate sensitivity and liquidity risk management.
Managing interest rate risk is fundamental for the financial services industry. By considering both on and off-balance sheet financial instruments, management evaluates interest rate sensitivity while attempting to optimize net interest income within the constraints of prudent capital adequacy, liquidity needs, market opportunities and customer requirements.
Interest Rate Simulation Sensitivity Analysis
49
We use earnings at risk, or EAR, simulations to assess the impact of changing rates on earnings under a variety of scenarios and time horizons. The simulation model is designed to reflect the dynamics of interest earning assets, interest bearing liabilities and off-balance sheet financial instruments. These simulations utilize both instantaneous and parallel changes in the level of interest rates, as well as gradual and non-parallel changes such as changing slopes and twists of the yield curve. Static simulation models are based on current exposures and assume a constant balance sheet with no growth. By estimating the effects of interest rate increases and decreases, the model can reveal approximate interest rate risk exposure. The simulation model is used by management to gauge approximate results given a specific change in interest rates at a given point in time. The model is therefore a tool to indicate earnings trends in given interest rate scenarios and does not indicate actual expected results.
At December 31, 2023, our EAR static simulation results indicated that our net interest income over the next year is estimated to benefit modestly from further rate increases while being adversely impacted by falling interest rates. This indicates that our assets generally reprice faster than our liabilities, which results in a favorable impact to net interest income when market interest rates increase and an unfavorable impact to net interest income when market interest rates decline. Many assumptions are used to calculate the impact of interest rate fluctuations on our net interest income, such as asset prepayments, non-maturity deposit price sensitivity, and key rate drivers. Because of the inherent use of these estimates and assumptions in the model, our actual results may, and most likely will, differ from our static EAR results. In addition, static EAR results do not include actions that our management may undertake to manage the risks in response to anticipated changes in interest rates or client behavior. For example, as part of our asset/liability management strategy, management has the ability to increase asset duration and/or decrease liability duration in order to reduce asset sensitivity, or to decrease asset duration and/or increase liability duration in order to increase asset sensitivity.
The following table illustrates the results of our EAR analysis regarding the extent to which our net interest income over the next 12 months would change if prevailing interest rates increased or decreased immediately by the specified amounts.
|
|
Net |
Increase 300bp |
|
6.4% |
Increase 200bp |
|
3.3% |
Increase 100bp |
|
1.5% |
Decrease 100bp |
|
(1.9)% |
Decrease 200bp |
|
(3.3)% |
Decrease 300bp |
|
(4.1)% |
Liquidity Risk
Liquidity risk is the risk that we will be unable to meet our obligations as they become due because of an inability to liquidate assets or obtain adequate funding. Management has established a comprehensive management process for identifying, measuring, monitoring and controlling liquidity risk. Because of its critical importance to the viability of the Bank, liquidity risk management is fully integrated into our risk management processes. Critical elements of our liquidity risk management include: effective corporate governance consisting of oversight by the board of directors and active involvement by management; appropriate strategies, policies, procedures, and limits used to manage and mitigate liquidity risk; comprehensive liquidity risk measurement and monitoring systems (including assessments of the current and prospective cash flows or sources and uses of funds) that are commensurate with the complexity and business activities of the Bank; active management of intraday liquidity and collateral; an appropriately diverse mix of existing and potential future funding sources; adequate levels of highly liquid marketable securities free of legal, regulatory, or operational impediments, that can be used to meet liquidity needs in stressful situations; comprehensive contingency funding plans that sufficiently address potential adverse liquidity events and emergency cash flow requirements; and internal controls and internal audit processes sufficient to determine the adequacy of the institution’s liquidity risk management process.
The role of liquidity management is to ensure funds are available to meet depositors’ withdrawal and borrowers’ credit demands while at the same time optimizing financial results within our corporate guidelines. This is accomplished by balancing changes in demand for funds with changes in the supply of those funds. Liquidity is provided by short-term
50
liquid assets that can be converted to cash, investment securities available-for-sale, various lines of credit available to us, and the ability to attract funds from external sources, principally deposits.
Overall liquidity sources total $1.6 billion as of December 31, 2023. Our most liquid assets are comprised of cash and due from banks, and available-for-sale marketable investment securities. The fair value of the available-for-sale investment portfolio was $359.3 million at December 31, 2023. We pledge portions of our investment securities portfolio to secure public fund deposits, derivative positions and Federal Home Loan Bank (“FHLB”) advances. At December 31, 2023, total investment securities pledged for these purposes comprised 53% of the estimated fair value of the entire investment portfolio, leaving $168.4 million of unpledged securities.
Other sources of funds available to meet daily needs include FHLB advances. As a member of the FHLB of Cincinnati, the Company has access to credit products offered by the FHLB. At December 31, 2023, available credit from the FHLB totaled $414.0 million. Additionally, we had available credit from the Federal Reserve of $284.8 million and available federal funds purchased lines with correspondent banks totaling $90.0 million at December 31, 2023. We also have the ability to issue an additional $332.0 million of brokered CDs based on internal limits.
The Company has a diversified deposit portfolio comprised 92% of customer deposits and 8% of brokered deposits. Correspondent Banking customers account for 12% of customer deposits. As of December 31, 2023, 68.2% of deposits were insured or collateralized.
The principal source of cash for CapStar Financial Holdings, Inc. (the "Parent Company") is dividends paid to it as the sole shareholder of the Bank. At December 31, 2023, the Bank was able to pay up to $74.6 million in dividends to CapStar Financial without regulatory approval subject to the ongoing capital requirements of the Bank.
Accordingly, management believes that our funding sources are at sufficient levels to satisfy our short-term and long-term liquidity needs.
Contractual Obligations
The following provides an overview of the Company's significant contractual obligations as of December 31, 2023.
Short-term borrowings and long-term debt - The Company issued $30.0 million of fixed-to-floating rate subordinated notes during the third quarter of 2020, which were recorded net of issuance costs of $0.6 million, that mature June 30, 2030. Beginning on or after June 30, 2025, the Company may redeem the notes, in whole or in part, at their principal amount plus any accrued and unpaid interest. The carrying value of subordinated notes was $29.8 million at December 31, 2023. The Company had FHLB advances of $50.0 million which matured in January of 2024.
Operating Lease Obligations - We are party to operating lease agreements for many of our branch locations, ATMs, loan production offices and operation centers. For qualifying leases with a term exceeding one year we record a lease liability and right-of-use ("ROU") asset on our balance sheet. As of December 31, 2023, the lease liability and ROU asset totaled $10.3 million and $9.5 million, respectively.
As of December 31, 2023, the remaining terms of our leases ranged from one to 9 years. Certain of our leases contain options to renew the lease at the end of the current term. Unless we have determined we are reasonably likely to renew the lease, these options have been excluded from the calculation of our lease liability and ROU asset. Additional information regarding operating leases is provided in Note 7 to the consolidated financial statements.
Capital Resources
As of December 31, 2023, shareholders' equity increased to $361.6 million compared to $354.2 million as of December 31, 2022. The increase was due to net income offset by share repurchases, dividend payments, and the impact of the CECL adoption on January 1, 2023. As of December 31, 2023, the Company and the Bank were well-capitalized under the regulatory framework for prompt corrective action.
Off-Balance Sheet Arrangements
In the normal course of business, we enter into various transactions that, in accordance with GAAP, are not included in our consolidated balance sheets. We enter into these transactions to meet the financing needs of our clients. These transactions include commitments to extend credit and standby letters of credit, which involve, to varying degrees, elements of credit risk and interest rate risk in excess of the amounts recognized in our consolidated balance sheets. Most of these commitments mature within two years and are expected to expire without being drawn upon. Standby
51
letters of credit as well as commitments to extend credit are included in the determination of the amount of risk-based capital that the Company and the Bank are required to hold.
We enter into contractual loan commitments to extend credit, normally with fixed expiration dates or termination clauses, at specified rates and for specific purposes. Substantially all of our commitments to extend credit are contingent upon clients maintaining specific credit standards until the time of loan funding.
Standby letters of credit are written conditional commitments issued by us to guarantee the performance of a client to a third party. In the event that the client does not perform in accordance with the terms of the agreement with the third party, we would be required to fund the commitment. The maximum potential amount of future payments we could be required to make is represented by the contractual amount of the commitment. If the commitment is funded, we would be entitled to seek recovery from the client. Our policies generally require that standby letter of credit arrangements contain security and debt covenants similar to those contained in loan agreements.
We minimize our exposure to loss under loan commitments and standby letters of credit by subjecting them to the same credit approval and monitoring procedures as we do for on-balance sheet instruments. We assess the credit risk associated with certain commitments to extend credit and establish a liability for probable credit losses. The effect on our revenue, expenses, cash flows and liquidity of the unused portions of these commitments cannot be reasonably predicted because there is no guarantee that the lines of credit will be used.
Our off-balance sheet arrangements are summarized in the following table for the periods indicated.
|
|
Contract or notional amount |
|
|||||||||
|
|
December 31, 2023 |
|
|
December 31, 2022 |
|
|
December 31, 2022 |
|
|||
Financial instruments whose contract amounts represent |
|
|
|
|
|
|
|
|
|
|||
Unused commitments to extend credit |
|
$ |
988,464 |
|
|
$ |
1,112,950 |
|
|
$ |
831,075 |
|
Standby letters of credit |
|
|
7,742 |
|
|
|
7,288 |
|
|
|
10,623 |
|
Total |
|
$ |
996,206 |
|
|
$ |
1,120,238 |
|
|
$ |
841,698 |
|
Impact of Inflation
The consolidated financial statements and related consolidated financial data presented herein have been prepared in accordance with U.S. GAAP and practices within the banking industry which require the measurement of financial position and operating results in terms of historical dollars without considering the changes in the relative purchasing power of money over time due to inflation. Unlike most industrial companies, virtually all the assets and liabilities of a financial institution are monetary in nature. As a result, interest rates have a more significant impact on a financial institution's performance than the effects of general levels of inflation.
ITEM 7A. QUANTITATIVE AND QUALITATIVE DISCLOSURES ABOUT MARKET RISK
Information required by this item is included in Item 7, “Management’s Discussion and Analysis of Financial Condition and Results of Operations – Market and Liquidity Risk Management – Interest Rate Simulation Sensitivity Analysis” and is incorporated herein by reference.
52
ITEM 8. FINANCIAL STATEMENTS AND SUPPLEMENTARY DATA
INDEX TO FINANCIAL STATEMENTS
|
Page(s) |
|
|
|
|
Report of Independent Registered Public Accounting Firm- Financial Statements [PCAOB ID |
|
54 |
Report of Independent Registered Public Accounting Firm - Internal Control over Financial Reporting [PCAOB ID 149] |
|
56 |
|
|
|
Consolidated Financial Statements: |
|
|
|
57 |
|
|
58 |
|
|
59 |
|
|
60 |
|
|
61 |
|
|
62 |
|
53
Report of Independent Registered Public Accounting Firm
To the Shareholders and the Board of Directors of CapStar Financial Holdings, Inc.:
Opinion on the Financial Statements
We have audited the accompanying consolidated balance sheets of CapStar Financial Holdings, Inc. and Subsidiary (the “Company”) as of December 31, 2023 and 2022, the related consolidated statements of income, comprehensive income (loss), changes in shareholders' equity and cash flows for each of the three years in the period ended December 31, 2023, and the related notes to the consolidated financial statements (collectively, the financial statements). In our opinion, the financial statements present fairly, in all material respects, the financial position of the Company as of December 31, 2023 and 2022, and the results of its operations and its cash flows for each of the three years in the period ended December 31, 2023, in conformity with accounting principles generally accepted in the United States of America.
We have also audited, in accordance with the standards of the Public Company Accounting Oversight Board (United States) (PCAOB), the Company's internal control over financial reporting as of December 31, 2023, based on criteria established in Internal Control — Integrated Framework issued by the Committee of Sponsoring Organizations of the Treadway Commission in 2013, and our report dated March 12, 2024 expressed an unqualified opinion on the effectiveness of the Company's internal control over financial reporting.
Basis for Opinion
These financial statements are the responsibility of the Company’s management. Our responsibility is to express an opinion on the Company’s financial statements based on our audits. We are a public accounting firm registered with the PCAOB and are required to be independent with respect to the Company in accordance with U.S. federal securities laws and the applicable rules and regulations of the Securities and Exchange Commission and the PCAOB.
We conducted our audits in accordance with the standards of the PCAOB. Those standards require that we plan and perform the audits to obtain reasonable assurance about whether the financial statements are free of material misstatement, whether due to error or fraud. Our audits included performing procedures to assess the risks of material misstatement of the financial statements, whether due to error or fraud, and performing procedures that respond to those risks. Such procedures included examining, on a test basis, evidence regarding the amounts and disclosures in the financial statements. Our audits also included evaluating the accounting principles used and significant estimates made by management, as well as evaluating the overall presentation of the financial statements. We believe that our audits provide a reasonable basis for our opinion.
Change in Accounting Principle
As discussed in Note 1 to the financial statements, the Company has changed its method of accounting for credit losses effective January 1, 2023 due to the adoption of Financial Accounting Standards Board Accounting Standards Codification No. 326, Financial Instruments – Credit Losses (“ASC 326”). The Company adopted the new credit loss standard using the modified retrospective method such that prior period amounts are not adjusted and continue to be reported in accordance with previously applicable generally accepted accounting principles. Our opinion is not modified with respect to this matter. The adoption of the new credit loss standard and its subsequent application is also communicated as a critical audit matter below.
Critical Audit Matters
The critical audit matters communicated below are matters arising from the current period audit of the financial statements that were communicated or required to be communicated to the audit committee and that: (1) relate to accounts or disclosures that are material to the financial statements and (2) involved our especially challenging, subjective, or complex judgments. The communication of critical audit matters does not alter in any way our opinion on the financial statements, taken as a whole, and we are not, by communicating the critical audit matters below, providing separate opinions on the critical audit matters or on the accounts or disclosures to which they relate.
Allowance for Credit Losses
54
The Company reported a gross loan portfolio of $2.3 billion and related allowance for credit losses (“ACL”) of $24.3 million as of December 31, 2023. As described by the Company in Notes 1 and 4, the Company adopted ASC 326 on January 1, 2023. Expected credit losses are measured on a collective basis using a discounted cash flow method. Loans not sharing similar risk characteristics are evaluated on an individual basis. Historical loss rates, which are adjusted for qualitative factors that involve significant management judgment, are applied to the collectively evaluated loan segments. In addition, a 12-month forecast is applied to each segment, based on external sources, with losses reverting back to historical loss rates at the end of the forecast period.
We identified the Company’s estimate of the ACL as a critical audit matter. The principal considerations for our determination of the ACL as a critical audit matter related to the high degree of subjectivity in the Company’s judgments in determining the qualitative factors, model assumptions, forecasts and forecasting periods. Auditing these complex judgments and assumptions by the Company involves especially challenging auditor judgment due to the nature and extent of audit evidence and effort required to address these matters, including the extent of specialized skill or knowledge needed.
The primary procedures we performed to address this critical audit matter included the following:
We have served as the Company's auditor since 2017.
/s/ Elliott Davis, PLLC
Raleigh, North Carolina
March 12, 2024
55
Report of Independent Registered Public Accounting Firm
To the Shareholders and Board of Directors of CapStar Financial Holdings, Inc.:
Opinion on the Internal Control Over Financial Reporting
We have audited CapStar Financial Holdings, Inc. and Subsidiary's (the “Company”) internal control over financial reporting as of December 31, 2023, based on criteria established in Internal Control — Integrated Framework issued by the Committee of Sponsoring Organizations of the Treadway Commission in 2013.In our opinion, the Company maintained, in all material respects, effective internal control over financial reporting as of December 31, 2023, based on criteria established in Internal Control — Integrated Framework issued by the Committee of Sponsoring Organizations of the Treadway Commission in 2013.
We have also audited, in accordance with the standards of the Public Company Accounting Oversight Board (United States) (PCAOB), the consolidated balance sheets of the Company as of December 31, 2023 and 2022 and the related consolidated statements of income, comprehensive income (loss), changes in shareholders’ equity, and cash flows for each of the three years in the period ended December 31, 2023 of the Company and our report dated March 12, 2024 expressed an unqualified opinion.
Basis for Opinion
The Company’s management is responsible for maintaining effective internal control over financial reporting and for its assessment of the effectiveness of internal control over financial reporting in the accompanying Management’s Annual Report on Internal Control over Financial Reporting. Our responsibility is to express an opinion on the Company’s internal control over financial reporting based on our audit. We are a public accounting firm registered with the PCAOB and are required to be independent with respect to the Company in accordance with U.S. federal securities laws and the applicable rules and regulations of the Securities and Exchange Commission and the PCAOB.
We conducted our audit in accordance with the standards of the PCAOB. Those standards require that we plan and perform the audit to obtain reasonable assurance about whether effective internal control over financial reporting was maintained in all material respects. Our audit included obtaining an understanding of internal control over financial reporting, assessing the risk that a material weakness exists, and testing and evaluating the design and operating effectiveness of internal control based on the assessed risk. Our audit also included performing such other procedures as we considered necessary in the circumstances. We believe that our audit provides a reasonable basis for our opinion.
Definition and Limitations of Internal Control Over Financial Reporting
A company's internal control over financial reporting is a process designed to provide reasonable assurance regarding the reliability of financial reporting and the preparation of financial statements for external purposes in accordance with generally accepted accounting principles. A company's internal control over financial reporting includes those policies and procedures that (1) pertain to the maintenance of records that, in reasonable detail, accurately and fairly reflect the transactions and dispositions of the assets of the company; (2) provide reasonable assurance that transactions are recorded as necessary to permit preparation of financial statements in accordance with generally accepted accounting principles, and that receipts and expenditures of the company are being made only in accordance with authorizations of management and directors of the company; and (3) provide reasonable assurance regarding prevention or timely detection of unauthorized acquisition, use or disposition of the company's assets that could have a material effect on the financial statements.
Because of its inherent limitations, internal control over financial reporting may not prevent or detect misstatements. Also, projections of any evaluation of effectiveness to future periods are subject to the risk that controls may become inadequate because of changes in conditions, or that the degree of compliance with the policies or procedures may deteriorate.
/s/
March 12, 2024
56
CAPSTAR FINANCIAL HOLDINGS INC. & SUBSIDIARY
Consolidated Balance Sheets
(Dollars in thousands, except share and per share data)
|
|
December 31, 2023 |
|
|
December 31, 2022 |
|
||
Assets |
|
|
|
|
|
|
||
Cash and due from banks |
|
$ |
|
|
$ |
|
||
Interest-bearing deposits in financial institutions |
|
|
|
|
|
|
||
Federal funds sold |
|
|
|
|
|
|
||
Total cash and cash equivalents |
|
|
|
|
|
|
||
Securities available-for-sale, at fair value net of allowance for credit losses of $ |
|
|
|
|
|
|
||
Securities held-to-maturity, fair value of $ |
|
|
|
|
|
|
||
Loans held for sale, includes $ |
|
|
|
|
|
|
||
Loans held for investment |
|
|
|
|
|
|
||
Less allowance for credit losses on loans |
|
|
( |
) |
|
|
( |
) |
Loans, net |
|
|
|
|
|
|
||
Premises and equipment, net |
|
|
|
|
|
|
||
Restricted equity securities |
|
|
|
|
|
|
||
Accrued interest receivable |
|
|
|
|
|
|
||
Goodwill |
|
|
|
|
|
|
||
Core deposit intangible, net |
|
|
|
|
|
|
||
Other real estate owned, net |
|
|
|
|
|
|
||
Other assets |
|
|
|
|
|
|
||
Total assets |
|
$ |
|
|
$ |
|
||
Liabilities and Shareholders’ Equity |
|
|
|
|
|
|
||
Deposits: |
|
|
|
|
|
|
||
Noninterest-bearing |
|
$ |
|
|
$ |
|
||
Interest-bearing |
|
|
|
|
|
|
||
Savings and money market accounts |
|
|
|
|
|
|
||
Time |
|
|
|
|
|
|
||
Total deposits |
|
|
|
|
|
|
||
Federal Home Loan Bank advances |
|
|
|
|
|
|
||
Subordinated notes |
|
|
|
|
|
|
||
Other liabilities |
|
|
|
|
|
|
||
Total liabilities |
|
|
|
|
|
|
||
Shareholders’ equity: |
|
|
|
|
|
|
||
Common stock, voting, $ |
|
|
|
|
|
|
||
Additional paid-in capital |
|
|
|
|
|
|
||
Retained earnings |
|
|
|
|
|
|
||
Accumulated other comprehensive loss, net of tax |
|
|
( |
) |
|
|
( |
) |
Total shareholders’ equity |
|
|
|
|
|
|
||
Total liabilities and shareholders’ equity |
|
$ |
|
|
$ |
|
||
See accompanying notes to consolidated financial statements.
57
CAPSTAR FINANCIAL HOLDINGS INC. & SUBSIDIARY
Consolidated Statements of Income
(Dollars in thousands, except share and per share data)
|
|
Year Ended December 31, |
|
|||||||||
|
|
2023 |
|
|
2022 |
|
|
2021 |
|
|||
Interest income: |
|
|
|
|
|
|
|
|
|
|||
Loans, including fees |
|
$ |
|
|
$ |
|
|
$ |
|
|||
Securities: |
|
|
|
|
|
|
|
|
|
|||
Taxable |
|
|
|
|
|
|
|
|
|
|||
Tax-exempt |
|
|
|
|
|
|
|
|
|
|||
Federal funds sold |
|
|
|
|
|
|
|
|
|
|||
Restricted equity securities |
|
|
|
|
|
|
|
|
|
|||
Interest-bearing deposits in financial institutions |
|
|
|
|
|
|
|
|
|
|||
Total interest income |
|
|
|
|
|
|
|
|
|
|||
Interest expense: |
|
|
|
|
|
|
|
|
|
|||
Interest-bearing deposits |
|
|
|
|
|
|
|
|
|
|||
Savings and money market accounts |
|
|
|
|
|
|
|
|
|
|||
Time deposits |
|
|
|
|
|
|
|
|
|
|||
Federal funds purchased |
|
|
|
|
|
|
|
|
|
|||
Federal Home Loan Bank advances |
|
|
|
|
|
|
|
|
|
|||
Subordinated notes |
|
|
|
|
|
|
|
|
|
|||
Total interest expense |
|
|
|
|
|
|
|
|
|
|||
Net interest income |
|
|
|
|
|
|
|
|
|
|||
Provision for credit losses: |
|
|
|
|
|
|
|
|
|
|||
(Recovery of) provision for credit losses on loans |
|
|
( |
) |
|
|
|
|
|
( |
) |
|
Provision for credit losses on available-for-sale securities |
|
|
|
|
|
|
|
|
|
|||
Recovery of provision for credit losses on unfunded commitments |
|
|
( |
) |
|
|
|
|
|
|
||
Total provision for credit losses |
|
|
|
|
|
|
|
|
( |
) |
||
Net interest income after provision for credit losses |
|
|
|
|
|
|
|
|
|
|||
Noninterest income: |
|
|
|
|
|
|
|
|
|
|||
Deposit service charges |
|
|
|
|
|
|
|
|
|
|||
Interchange and debit card transaction fees |
|
|
|
|
|
|
|
|
|
|||
Mortgage banking |
|
|
|
|
|
|
|
|
|
|||
Tri-Net |
|
|
|
|
|
|
|
|
|
|||
Wealth management |
|
|
|
|
|
|
|
|
|
|||
SBA lending |
|
|
|
|
|
|
|
|
|
|||
Net gain on sale of securities |
|
|
|
|
|
|
|
|
|
|||
Bank owned life insurance |
|
|
|
|
|
|
|
|
|
|||
Other noninterest income |
|
|
|
|
|
|
|
|
|
|||
Total noninterest income |
|
|
|
|
|
|
|
|
|
|||
Noninterest expense: |
|
|
|
|
|
|
|
|
|
|||
Salaries and employee benefits |
|
|
|
|
|
|
|
|
|
|||
Data processing and software |
|
|
|
|
|
|
|
|
|
|||
Occupancy |
|
|
|
|
|
|
|
|
|
|||
Equipment |
|
|
|
|
|
|
|
|
|
|||
Professional services |
|
|
|
|
|
|
|
|
|
|||
Regulatory fees |
|
|
|
|
|
|
|
|
|
|||
Acquisition related expenses |
|
|
|
|
|
|
|
|
|
|||
Amortization of intangibles |
|
|
|
|
|
|
|
|
|
|||
Other noninterest expense |
|
|
|
|
|
|
|
|
|
|||
Total noninterest expense |
|
|
|
|
|
|
|
|
|
|||
Income before income taxes |
|
|
|
|
|
|
|
|
|
|||
Income tax expense |
|
|
|
|
|
|
|
|
|
|||
Net income |
|
$ |
|
|
$ |
|
|
$ |
|
|||
Per share information: |
|
|
|
|
|
|
|
|
|
|||
Basic net income per share of common stock |
|
$ |
|
|
$ |
|
|
$ |
|
|||
Diluted net income per share of common stock |
|
$ |
|
|
$ |
|
|
$ |
|
|||
Weighted average shares outstanding: |
|
|
|
|
|
|
|
|
|
|||
Basic |
|
|
|
|
|
|
|
|
|
|||
Diluted |
|
|
|
|
|
|
|
|
|
|||
See accompanying notes to consolidated financial statements.
58
CAPSTAR FINANCIAL HOLDINGS INC. & SUBSIDIARY
Consolidated Statements of Comprehensive Income (Loss)
(Dollars in thousands)
|
|
Year Ended December 31, |
|
|||||||||
|
|
2023 |
|
|
2022 |
|
|
2021 |
|
|||
Net income |
|
$ |
|
|
$ |
|
|
$ |
|
|||
Other comprehensive income (loss): |
|
|
|
|
|
|
|
|
|
|||
Unrealized gains (losses) on securities available-for-sale: |
|
|
|
|
|
|
|
|
|
|||
Unrealized gains (losses) arising during the period |
|
|
|
|
|
( |
) |
|
|
( |
) |
|
Reclassification adjustment for gains included in |
|
|
( |
) |
|
|
( |
) |
|
|
( |
) |
Tax effect |
|
|
( |
) |
|
|
|
|
|
|
||
Other comprehensive income (loss), net of tax |
|
|
|
|
|
( |
) |
|
|
( |
) |
|
Comprehensive income (loss) |
|
$ |
|
|
$ |
( |
) |
|
$ |
|
||
See accompanying notes to consolidated financial statements.
59
CAPSTAR FINANCIAL HOLDINGS INC. & SUBSIDIARY
(Dollars in thousands, except share and per share data)
|
|
Common Stock, |
|
|
Additional |
|
|
Retained |
|
|
Accumulated |
|
|
Total |
|
|||||||||
|
|
Shares |
|
|
Amount |
|
|
capital |
|
|
earnings |
|
|
(loss) income |
|
|
equity |
|
||||||
|
|
|
|
|
|
|
|
|
|
|
|
|
|
|
|
|
|
|
||||||
Balance December 31, 2020 |
|
|
|
|
$ |
|
|
$ |
|
|
$ |
|
|
$ |
|
|
$ |
|
||||||
Net issuance of restricted common stock |
|
|
|
|
|
|
|
|
( |
) |
|
|
— |
|
|
|
— |
|
|
|
( |
) |
||
Stock-based compensation expense |
|
|
— |
|
|
|
— |
|
|
|
|
|
|
— |
|
|
|
— |
|
|
|
|
||
Net exercise of common stock options |
|
|
|
|
|
|
|
|
|
|
|
— |
|
|
|
— |
|
|
|
|
||||
Repurchase of common stock |
|
|
( |
) |
|
|
( |
) |
|
|
( |
) |
|
|
— |
|
|
|
— |
|
|
|
( |
) |
Common stock dividends declared ($ |
|
|
— |
|
|
|
— |
|
|
|
— |
|
|
|
( |
) |
|
|
— |
|
|
|
( |
) |
Net income |
|
|
— |
|
|
|
— |
|
|
|
— |
|
|
|
|
|
|
— |
|
|
|
|
||
Other comprehensive loss |
|
|
— |
|
|
|
— |
|
|
|
— |
|
|
|
— |
|
|
|
( |
) |
|
|
( |
) |
Balance December 31, 2021 |
|
|
|
|
$ |
|
|
$ |
|
|
$ |
|
|
$ |
( |
) |
|
$ |
|
|||||
Net issuance of restricted common stock |
|
|
|
|
|
|
|
|
( |
) |
|
|
— |
|
|
|
— |
|
|
|
( |
) |
||
Stock-based compensation expense |
|
|
— |
|
|
|
— |
|
|
|
|
|
|
— |
|
|
|
— |
|
|
|
|
||
Net exercise of common stock options |
|
|
|
|
|
|
|
|
|
|
|
— |
|
|
|
— |
|
|
|
|
||||
Repurchase of common stock |
|
|
( |
) |
|
|
( |
) |
|
|
( |
) |
|
|
— |
|
|
|
— |
|
|
|
( |
) |
Common stock dividends declared ($ |
|
|
— |
|
|
|
— |
|
|
|
— |
|
|
|
( |
) |
|
|
— |
|
|
|
( |
) |
Net income |
|
|
— |
|
|
|
— |
|
|
|
— |
|
|
|
|
|
|
— |
|
|
|
|
||
Other comprehensive loss |
|
|
— |
|
|
|
— |
|
|
|
— |
|
|
|
— |
|
|
|
( |
) |
|
|
( |
) |
Balance December 31, 2022 |
|
|
|
|
$ |
|
|
$ |
|
|
$ |
|
|
$ |
( |
) |
|
$ |
|
|||||
Adoption of new accounting standard |
|
|
- |
|
|
|
- |
|
|
|
- |
|
|
|
( |
) |
|
|
- |
|
|
|
( |
) |
Net issuance of restricted common stock |
|
|
|
|
|
|
|
|
( |
) |
|
|
- |
|
|
|
- |
|
|
|
( |
) |
||
Stock-based compensation expense |
|
|
- |
|
|
|
- |
|
|
|
|
|
|
- |
|
|
|
- |
|
|
|
|
||
Net exercise of common stock options |
|
|
|
|
|
|
|
|
|
|
|
- |
|
|
|
- |
|
|
|
|
||||
Repurchase of common stock |
|
|
( |
) |
|
|
( |
) |
|
|
( |
) |
|
|
- |
|
|
|
- |
|
|
|
( |
) |
Common stock dividends declared ($ |
|
|
- |
|
|
|
- |
|
|
|
- |
|
|
|
( |
) |
|
|
- |
|
|
|
( |
) |
Net income |
|
|
- |
|
|
|
- |
|
|
|
- |
|
|
|
|
|
|
- |
|
|
|
|
||
Other comprehensive income |
|
|
- |
|
|
|
- |
|
|
|
- |
|
|
|
- |
|
|
|
|
|
|
|
||
Balance December 31, 2023 |
|
|
|
|
$ |
|
|
$ |
|
|
$ |
|
|
$ |
( |
) |
|
$ |
|
|||||
See accompanying notes to consolidated financial statements.
60
CAPSTAR FINANCIAL HOLDINGS INC. & SUBSIDIARY
Consolidated Statements of Cash Flows
(Dollars in thousands)
|
|
Year Ended December 31, |
|
|||||||||
|
|
2023 |
|
|
2022 |
|
|
2021 |
|
|||
Cash flows from operating activities: |
|
|
|
|
|
|
|
|
|
|||
Net income |
|
$ |
|
|
$ |
|
|
$ |
|
|||
Adjustments to reconcile net income to net cash |
|
|
|
|
|
|
|
|
|
|||
Provision for (recovery of) credit losses |
|
|
|
|
|
|
|
|
( |
) |
||
Amortization of discounts on acquired loans and deferred fees, net |
|
|
|
|
|
|
|
|
( |
) |
||
Depreciation and amortization |
|
|
|
|
|
|
|
|
|
|||
Net amortization of premiums on investment securities |
|
|
|
|
|
|
|
|
|
|||
Net gain on sale of securities |
|
|
( |
) |
|
|
( |
) |
|
|
( |
) |
|
|
( |
) |
|
|
( |
) |
|
|
( |
) |
|
Tri-Net |
|
|
( |
) |
|
|
( |
) |
|
|
( |
) |
SBA lending |
|
|
( |
) |
|
|
( |
) |
|
|
( |
) |
Net gain on disposal of premises and equipment |
|
|
( |
) |
|
|
( |
) |
|
|
( |
) |
Net gain on sale of other real estate owned |
|
|
|
|
|
( |
) |
|
|
( |
) |
|
Stock-based compensation |
|
|
|
|
|
|
|
|
|
|||
Deferred income tax expense (benefit) |
|
|
|
|
|
|
|
|
( |
) |
||
Origination of loans held for sale |
|
|
( |
) |
|
|
( |
) |
|
|
( |
) |
Proceeds from loans held for sale |
|
|
|
|
|
|
|
|
|
|||
Cash payments arising from operating leases |
|
|
( |
) |
|
|
( |
) |
|
|
( |
) |
Amortization of debt issuance expense |
|
|
|
|
|
|
|
|
|
|||
Net (increase) decrease in accrued interest receivable and other assets |
|
|
|
|
|
( |
) |
|
|
( |
) |
|
Net increase (decrease) in accrued interest payable and other liabilities |
|
|
( |
) |
|
|
( |
) |
|
|
|
|
Net cash provided by (used in) operating activities |
|
|
|
|
|
( |
) |
|
|
|
||
Cash flows from investing activities: |
|
|
|
|
|
|
|
|
|
|||
Activities in securities available-for-sale: |
|
|
|
|
|
|
|
|
|
|||
Purchases |
|
|
|
|
|
( |
) |
|
|
( |
) |
|
Sales |
|
|
|
|
|
|
|
|
|
|||
Maturities, prepayments and calls |
|
|
|
|
|
|
|
|
|
|||
Activities in securities held-to-maturity: |
|
|
|
|
|
|
|
|
|
|||
Maturities, prepayments and calls |
|
|
|
|
|
|
|
|
|
|||
Net redemption (purchase) of restricted equity securities |
|
|
|
|
|
( |
) |
|
|
|
||
Net decrease (increase) in loans |
|
|
|
|
|
( |
) |
|
|
( |
) |
|
Purchase of premises and equipment |
|
|
( |
) |
|
|
( |
) |
|
|
( |
) |
Proceeds from the sale of premises and equipment |
|
|
|
|
|
|
|
|
|
|||
Proceeds from sale of other real estate |
|
|
|
|
|
|
|
|
|
|||
Proceeds from (purchases of) bank owned life insurance |
|
|
|
|
|
|
|
|
( |
) |
||
Net cash provided by (used in) investing activities |
|
|
|
|
|
( |
) |
|
|
( |
) |
|
Cash flows from financing activities: |
|
|
|
|
|
|
|
|
|
|||
Net increase (decrease) in deposits |
|
|
( |
) |
|
|
( |
) |
|
|
|
|
Proceeds from Federal Home Loan Bank advances |
|
|
|
|
|
|
|
|
|
|||
Payments on Federal Home Loan Bank advances |
|
|
( |
) |
|
|
( |
) |
|
|
( |
) |
Repurchase of common stock |
|
|
( |
) |
|
|
( |
) |
|
|
( |
) |
Exercise of common stock options, net of repurchase of restricted shares |
|
|
|
|
|
( |
) |
|
|
|
||
Common stock dividends paid |
|
|
( |
) |
|
|
( |
) |
|
|
( |
) |
Net cash provided by (used in) financing activities |
|
|
( |
) |
|
|
( |
) |
|
|
|
|
Net increase (decrease) in cash and cash equivalents |
|
|
|
|
|
( |
) |
|
|
|
||
Cash and cash equivalents at beginning of period |
|
|
|
|
|
|
|
|
|
|||
Cash and cash equivalents at end of period |
|
$ |
|
|
$ |
|
|
$ |
|
|||
Supplemental disclosures of cash paid: |
|
|
|
|
|
|
|
|
|
|||
Interest paid |
|
$ |
|
|
$ |
|
|
$ |
|
|||
Income taxes paid |
|
|
|
|
|
|
|
|
|
|||
Supplemental disclosures of noncash transactions: |
|
|
|
|
|
|
|
|
|
|||
Cumulative effect adjustment due to adoption of CECL accounting standard under ASC 326, net of taxes |
|
$ |
( |
) |
|
$ |
|
|
$ |
|
||
Transfer of loans to other real estate |
|
|
|
|
|
|
|
|
|
|||
Loans charged off to the allowance for credit losses on loans |
|
|
|
|
|
|
|
|
|
|||
Lease liabilities arising from obtaining right-of-use assets |
|
|
|
|
|
|
|
|
|
|||
Unrealized losses on securities available for sale, net of tax |
|
|
|
|
|
( |
) |
|
|
( |
) |
|
Loans transferred from held for sale to held for investment, net of loans from held-for-investment transferred to held-for-sale |
|
|
|
|
|
|
|
|
|
|||
See accompanying notes to consolidated financial statements.
61
CAPSTAR FINANCIAL HOLDINGS INC. & SUBSIDIARY
Notes to Consolidated Financial Statements
NOTE 1 – SUMMARY OF SIGNIFICANT ACCOUNTING POLICIES
Basis of Presentation
The consolidated financial statements as of December 31, 2023 and 2022 and for each of the three years in the period ended December 31, 2023 include CapStar Financial Holdings, Inc. and its wholly owned subsidiary, CapStar Bank (the “Bank”, together referred to as the “Company”). Significant intercompany transactions and accounts are eliminated in consolidation.
The consolidated financial statements of the Company have been prepared in conformity with U.S. generally accepted accounting principles (“GAAP”) and conform to general practices within the banking industry.
Business Combinations
The Company accounts for business combinations using the acquisition method of accounting. The accounts of an acquired entity are included as of the date of acquisition, and any excess of purchase price over the fair value of the net assets acquired is capitalized as goodwill. Under this method, all identifiable assets acquired, including purchased loans, and liabilities assumed are recorded at fair value.
Nature of Operations
Through the Bank, the Company provides full banking services to consumer and corporate customers located primarily in Tennessee. The Bank operates under a state bank charter and is a member of the Federal Reserve System. As a state member bank, the Bank is subject to regulations of the Tennessee Department of Financial Institutions, the Board of Governors of the Federal Reserve System (the “Federal Reserve”), and the Federal Deposit Insurance Corporation.
Reclassifications
Certain amounts, previously reported, have been reclassified to state all periods on a comparable basis and had no effect on shareholders' equity or net income.
Estimates
The preparation of financial statements in conformity with GAAP requires management to make estimates and assumptions that affect the reported amounts of assets and liabilities and disclosure of contingent assets and liabilities at the date of the financial statements and the reported amounts of revenues and expenses during the reporting period. Actual results could differ from those estimates. Material estimates that are particularly susceptible to significant change relate to the determination of the allowance for credit losses, determination of impairment of intangible assets, including goodwill, the valuation of our investment portfolio, the valuation of loans held for sale, and deferred tax assets.
Adoption of New Accounting Standards
On January 1, 2023, the Company adopted ASU 2016-13 Financial Instruments - Credit Losses (Topic 326): Measurement of Credit Losses on Financial Instruments, as amended ("ASC 326"), which replaced the incurred loss methodology with an expected loss methodology that is referred to as the current expected credit loss ("CECL") methodology. The measurement of expected credit losses under the CECL methodology is applicable to financial assets measured at amortized cost, including loan receivables and held-to-maturity debt securities. It also applies to off-balance sheet credit exposures not accounted for as insurance (loan commitments, standby letters of credit, financial guarantees, and other similar instruments) ("unfunded commitments"). In addition, ASC 326 made changes to the accounting for available-for-sale debt securities. One such change is to require credit losses to be presented as an allowance rather than as a write-down on available-for-sale debt securities management does not intend to sell or believes that it is more likely than not they will be required to sell.
The Company adopted ASC 326 using the modified retrospective method for all financial assets measured at amortized cost and unfunded commitments credit exposures. Results for reporting periods beginning after January 1, 2023 are
62
presented under ASC 326 while prior period amounts continue to be reported in accordance with previously applicable GAAP ("incurred loss"). The Company recorded a net decrease to retained earnings of $
The Company adopted ASC 326 using the prospective transition approach for financial assets purchased with credit deterioration ("PCD") that were previously classified as purchased credit impaired ("PCI") and accounted for under ASC 310-30. In accordance with the standard, management did not reassess whether PCI assets met the criteria of PCD assets as of the date of adoption. On January 1, 2023, the amortized cost basis of the PCD assets were adjusted to reflect the addition of $
Cash and Cash Equivalents
For purposes of reporting cash flows, cash and cash equivalents include cash on hand, amounts due from banks, interest-bearing deposits in financial institutions and federal funds sold. Generally, federal funds are purchased and sold for one-day periods. The Company maintains deposits in excess of the federal insurance amounts with other financial institutions. Management makes deposits only with financial institutions it considers to be financially sound.
Securities
The Bank accounts for securities under the provisions of Financial Accounting Standards Board (“FASB”) Accounting Standards Codification (“ASC”) 320, Investments – Debt and Equity Securities. Under the provisions of FASB ASC 320, securities are to be classified in
Securities Held-to-Maturity - Debt securities are classified as held-to-maturity securities when the Bank has the positive intent and ability to hold the securities to maturity. Securities held to maturity are carried at amortized cost.
Trading Securities - Debt and equity securities that are bought and held principally for the purpose of selling them in the near term are classified as trading securities and reported at fair value, with unrealized gains and losses included in earnings. No securities have been classified as trading securities.
Securities Available-for-Sale - Debt securities not classified as either held-to-maturity securities or trading securities are classified as available for sale securities. Securities available for sale are carried at estimated fair value with unrealized gains and losses excluded from earnings and reported as a separate component of shareholders’ equity in other comprehensive income (loss).
Interest income includes amortization of purchase premiums or discounts. Premiums and discounts on securities are generally amortized on the level-yield method without anticipating prepayments, except for mortgage-backed securities where prepayments are anticipated. Premiums on callable debt securities are amortized to their earliest call date. Gains and losses on sale are recorded on the trade date and determined using the specific identification method.
A debt security is placed on non-accrual status at the time any principal or interest payments become over
ACL - Available-for-Sale Securities
For available-for-sale debt securities in an unrealized loss position, the Company first assesses whether it intends to sell, or if it is more likely than not that it will be required to sell the security before recovery of its amortized cost basis. If either of the criteria regarding intent or requirement to sell is met, the security's amortized cost basis is written down to fair value through income. For debt securities available-for sale that do not meet the aforementioned criteria, the Company evaluated whether the decline in fair value has resulted from credit losses or other factors. In making this assessment, management considered the extent to which fair value is less than amortized cost, any changes to the rating of the security by a rating agency, and adverse conditions specifically related to the security, among other factors. If this assessment indicates that a credit loss exists, the present value of cash flows expected to be collected from the security are compared to the amortized cost basis of the security. If the present value of cash flows expected to be collected is less than the amortized cost basis, a credit loss exists and an ACL is recorded for the credit loss,
63
limited by the amount that the fair value is less than the amortized cost basis. Any impairment that has not been recorded through an ACL is recognized in other comprehensive income.
Changes in the ACL are recorded as credit loss expense (or reversal). Losses are charged against the allowance when management believes the uncollectibility of an available-for-sale security is confirmed or when either of the criteria regarding intent or requirement to sell is met.
Accrued interest receivable on available-for-sale debt securities totaled $
Loans Held For Sale and Fair Value Option
The Company classifies loans as loans held for sale when originated with the intent to sell. As of April 1, 2019, the Company elected the fair value option for all residential mortgage loans originated with the intent to sell. This election allows for a more effective offset of the changes in fair values of the loans and the derivative instruments used to economically hedge them without the burden of complying with the requirements for hedge accounting. The Company has not elected the fair value option for other loans held for sale primarily because they are not economically hedged using derivative instruments. The fair value of residential mortgage loans originated with the intent to sell is based on traded market prices of similar assets. Other loans held for sale, such as SBA loans or Tri-Net loans, that are recorded at lower of cost or fair value may be carried at fair value on a nonrecurring basis when the fair value is less than cost. No SBA loans or Tri-Net loans were measured at fair value as of December 31, 2023. For further information, see Note 22 - Fair Value. The Company does not securitize mortgage loans. If the Company sells loans with servicing rights retained, the carrying value of the mortgage loan sold is reduced by the amount allocated to the servicing right. The changes in fair value are recorded as a component of mortgage banking income and included gains (losses) of $
The following table summarizes the difference between the fair value and the aggregate unpaid principal balance for residential real estate loans held for sale as of December 31, 2023 and 2022 (dollars in thousands):
|
|
Fair Value |
|
|
Aggregate Unpaid Principal Balance |
|
|
Difference |
|
|||
December 31, 2023 |
|
|
|
|
|
|
|
|
|
|||
Residential mortgage loans held for sale |
|
$ |
|
|
$ |
|
|
$ |
|
|||
December 31, 2022 |
|
|
|
|
|
|
|
|
|
|||
Residential mortgage loans held for sale |
|
$ |
|
|
$ |
|
|
$ |
|
|||
Tri-Net Fees
Tri-Net fees are derived from the origination of commercial real estate loans with the intent to sell to third-party investors. All of these loan sales transfer servicing rights to the buyer. Realized gains and losses are recognized when legal title of the loan has transferred to the investor and sales proceeds have been received and are reflected in the accompanying statements of income in Tri-Net fees, net of related costs such as commission expenses. Loans that have not been sold at period end are classified as held for sale on the balance sheet and recorded at the lower of aggregate cost or fair value. Net unrealized losses, if any, are recorded as a valuation allowance and charged to earnings.
Loans
The Company has six classes of loans held for investment: commercial real estate, consumer real estate, construction and land development, commercial and industrial, consumer, and other. The appropriate classification is determined based on the underlying collateral utilized to secure each loan.
Commercial real estate includes both owner-occupied and non-owner occupied properties. The repayment of owner-occupied properties is largely dependent on the operations of the tenant, while non-owner occupied properties is dependent upon the refinance or sale of the underlying real estate.
Consumer real estate consists primarily of 1-4 family residential properties including home equity lines of credit.
64
Construction and land development loans include loans where the repayment is dependent on the successful completion and operation and/or sale of the related real estate project. Construction and land development loans include 1-4 family construction projects and commercial construction endeavors such as warehouses, apartments, office and retail space and land acquisition and development.
Commercial and industrial loans include loans to business enterprises issued for commercial, industrial and/or other professional purposes.
Consumer loans include all loans issued to individuals not included in the consumer real estate class.
Other loans include all loans not included in the classes of loans above and leases.
Loans that management has the intent and ability to hold for the foreseeable future or until maturity or payoff are reported at amortized cost, net of the ACL. Amortized cost is the principal balance outstanding, net of purchase premiums and discounts, and deferred loan fees and costs. Accrued interest receivable is reported in accrued interest receivable on the consolidated balance sheets and is excluded from the estimate of credit losses. Interest income is accrued on the unpaid principal balance. Loan origination fees, net of certain direct origination costs, are deferred and recognized in interest income using the level-yield method without anticipating prepayments.
Interest income on mortgage and commercial loans is discontinued and placed on non-accrual status at the time the loan is
All interest accrued but not received for loans placed on non-accrual is reversed against interest income. Interest received on such loans is accounted for on the cash-basis or cost-recovery method, until qualifying for return to accrual. Under the cost-recovery method, interest income is not recognized until the loan balance is reduced to zero. Under the cash-basis method, interest income is recorded when the payment is received in cash. Loans are returned to accrual status when all the principal and interest amounts contractually due are brought current and future payments are reasonably assured.
Acquired Loans
Acquired loans are accounted for under the acquisition method of accounting. The acquired loans are recorded at their estimated fair values as of the acquisition date. Fair value of acquired loans is determined using a discounted cash flow model based on assumptions regarding the amount and timing of principal and interest payments, estimated prepayments, estimated default rates, estimated loss severity in the event of defaults, and current market rates. Estimated credit losses are included in the determination of fair value; therefore, an allowance for loan losses is not recorded on the acquisition date.
Acquired non-impaired loans are recorded at their initial fair value and adjusted for subsequent advances, pay downs, amortization or accretion of any premium or discount on purchase, charge-offs and additional provisioning that may be required.
Purchase Credit Deteriorated ("PCD") Loans
The Company has purchased loans, some of which have experienced more than insignificant credit deterioration since origination. PCD loans are recorded at the amount paid. An ACL is determined using the same methodology as other loans held for investment. The initial ACL determined on a collective basis is allocated to individual loans. The sum of the loan's purchase price and ACL becomes its initial amortized cost basis. The differences between the initial amortized cost basis and the par value of the loan is a noncredit discount or premium, which is amortized into interest income over the life of the loan. Subsequent changes to the ACL are recorded through credit loss expense.
Upon adoption of ASC 326, the Company elected to maintain pools of loans that were previously accounted for under ASC 310-30 and will continue to account for these pools as a unit of account. Loans are only removed from the existing pools if they are written off, paid off, or sold. Upon adoption of ASC 326, the ACL was determined for each pool and added to the pool's carrying amount to establish a new amortized cost basis. The difference between the unpaid principal balance of the pool and the new amortized cost basis is the noncredit premium or discount which will
65
be amortized into interest income over the remaining life of the pool. Changes to the ACL after adoption are recorded through credit loss expense.
ACL - Loans
The ACL is a valuation account that is deducted from the loans' amortized cost basis to present the net amount expected to be collected on the loans. Loans are charged off against the ACL when management believes the uncollectibility of a loan balance is confirmed. Expected recoveries do not exceed the aggregate of amounts previously charged-off and expected to be charged-off.
Management estimates the ACL balance using relevant available information, from internal and external sources, relating to past events, current conditions, and reasonable and supportable forecasts. Historical credit loss experience provides the basis for the estimation of expected credit losses for the different categories of loans. Qualitative adjustments to estimates are made for differences in underwriting standards, portfolio mix, delinquency level, or term as well as for changes in unemployment rates, property values, or other relevant factors.
The ACL is measured on a collective (pool) basis when similar risk characteristics exist. The Company has identified the following portfolio segments and measures the ACL for each using a discounted cash flow methodology at the loan level, with loss rates, prepayment assumptions and curtailment assumptions driven by each loan’s collateral type.
Owner occupied commercial real estate - Loans in this category are susceptible to business failure and general economic conditions.
Non owner occupied commercial real estate - Common risks for this loan category are declines in general economic conditions, declines in real estate value, declines in occupancy rates, and lack of suitable alternative use for the property.
Commercial & industrial - Risks to this loan category include the inability to monitor the condition of the collateral, which often consists of inventory, accounts receivable and other non-real estate assets. Equipment and inventory obsolescence can also pose a risk. Declines in general economic conditions and other events can cause cash flows to fall to levels insufficient to service debt.
Commercial construction- Risks common to commercial construction loans are cost overruns, changes in market demand for property, inadequate long-term financing arrangements and declines in real estate values.
Residential mortgage - Residential mortgage loans are susceptible to weakening general economic conditions, increases in unemployment rates and declining real estate values.
Home equity lines of credit - Risks common to home equity lines of credit are general economic conditions, including an increase in unemployment rates, and declining real estate values that reduce or eliminate the borrower’s home equity.
Residential construction - Residential construction loans are susceptible to the same risks as residential mortgage loans. Changes in market demand for property lead to longer marketing times resulting in higher carrying costs and declining values.
Consumer - Risks common to consumer direct loans include unemployment and changes in local economic conditions as well as the inability to monitor collateral consisting of personal property.
Loans that do not share risk characteristics are evaluated on an individual basis. Loans evaluated individually are not included in the collective evaluation. When management determines that foreclosure is probable expected credit losses are based on the fair value of the collateral at the reporting date, adjusted for selling costs as appropriate.
Discounted Cash Flow Method
The Company uses the discounted cash flow method to estimate expected credit losses for all loan segments. The Company generates cash flow projections at the instrument level and adjusts payment expectations for estimated prepayment speed, curtailments, time to recovery, probability of default, and loss given default. The modeling of expected prepayment speeds and curtailment rates are based on historical internal data. The prepayment speeds additionally use peer data to backfill a complete time series and utilizes a forward-looking third-party prepayment model, which considers current conditions and reasonable and supportable forecasts of future economic conditions.
66
The Company uses regression analysis of historical internal and peer data when modeling lifetime probability of default and loss given default. This analysis also determines how expected probability of default and loss given default will react to forecasted levels of the loss drivers.
For all discounted cash flow models, management has determined that four quarters represents a reasonable and supportable forecast period. Management leverages economic projections around unemployment rates from the Federal Open Market Committee to determine its loss driver forecasts over the four-quarter forecast period.
The combination of adjustments for credit expectations (default and loss) and timing expectations (prepayment, curtailment, and time to recovery) produces an expected cash flow stream at the instrument level. Instrument effective yield is calculated, net of the impacts of prepayment assumptions, and the instrument expected cash flows are then discounted at that effective yield to produce an instrument-level net present value of expected cash flows (“NPV”). An ACL is established for the difference between the instrument’s NPV and amortized cost basis.
Expected credit losses are estimated over the contractual term of the loans, adjusted for expected prepayments when appropriate. The contractual term excludes expected extensions, renewals, and modifications unless either of the following applies: management has a reasonable expectation at the reporting date that a modification will be executed with an individual borrower or the extension or renewal options included in the original or modified contract at the reporting date are not unconditionally cancellable by the Company.
ACL - Unfunded commitments
The Company estimates expected credit losses over the contractual period in which the Company is exposed to credit risk via a contractual obligation to extend credit, unless that obligation is unconditionally cancellable by the Company. The ACL on unfunded commitments is adjusted through credit loss expense. The estimate includes consideration of the likelihood that funding will occur and an estimate of expected credit losses on commitments expected to be funded over its estimated life. The ACL is calculated using the same aggregate reserve rates calculated for the funded portion of loans at the portfolio level applied to the amount of commitments expected to fund. The Company has identified pools of unfunded commitments which align with loans held for investment. The ACL on unfunded commitments is recorded on the other liabilities line item of the balance sheet.
ASU 2022-02, Financial Instruments - Credit Losses (Topic 326): Troubled Debt Restructurings and Vintage Disclosures
In March 2022, the FASB issued ASU 2022-02, Financial Instruments - Credit Losses (Topic 326): Troubled Debt Restructurings and Vintage Disclosures, which eliminates the accounting guidance for troubled debt restructurings by creditors in ASC 310-40, Receivables - Troubled Debt Restructurings by Creditors, while enhancing disclosure requirements for certain loan refinancings and restructurings involving borrowings that are experiencing financial difficulty. Specifically, rather than applying the troubled debt restructuring recognition and measurement guidance, creditors will evaluate all loan modifications to determine if they result in a new loan or a continuation of the existing loan. Additionally, the Company is required to disclose current-period gross write-offs by year of origination for loan financing receivables and net investment in leases. The Company has adopted the standard as of January 1, 2023 with little to no impact to its accounting and has included the additional required disclosures herein.
Servicing Rights
When mortgage or SBA loans are sold with servicing retained, servicing rights are initially recorded at fair value with the income statement effect recorded in other noninterest income. Fair value is based on market prices for comparable mortgage servicing contracts, when available or alternatively, is based on a valuation model that calculates the present value of estimated future net servicing income. All classes of servicing assets are subsequently measured using the amortization method which requires servicing rights to be amortized into noninterest income in proportion to, and over the period of, the estimated future net servicing income of the underlying loans.
67
Servicing rights are evaluated for impairment based upon the fair value of the rights as compared to carrying amount. Impairment is determined by stratifying rights into groupings based on predominant risk characteristics, such as interest rate, loan type and investor type. Impairment is recognized through a valuation allowance for an individual grouping, to the extent that fair value is less than the carrying amount. If the Company later determines that all or a portion of the impairment no longer exists for a particular grouping, a reduction of the allowance may be recorded as an increase to income. Changes in valuation allowances are reported with other noninterest income on the Consolidated Statements of Income and the associated asset is included in other assets on the Consolidated Balance Sheets. The fair values of servicing rights are subject to significant fluctuations as a result of changes in estimated and actual prepayment speeds and default rates and losses.
Servicing fee income, which is reported on the income statement within other noninterest income, is recorded for fees earned for servicing loans. The fees are based on a contractual percentage of the outstanding principal or a fixed amount per loan and are recorded as income when earned. The amortization of mortgage servicing rights is netted against loan servicing fee income. Net servicing fees totaled $
Premises and Equipment
Premises and equipment are stated at cost less accumulated depreciation and amortization. Depreciation is computed principally by the straight-line method over the estimated useful lives of the assets. Leasehold improvements are amortized by the straight-line method based on the shorter of the asset lives or the expected lease terms. Useful lives for premises and equipment range from to
These assets are reviewed for impairment when events indicate their carrying amount may not be recoverable from future undiscounted cash flows. If impaired, the assets are recorded at fair value.
Leases
The Company recognizes a ROU asset and a corresponding lease liability for all operating leases, in the Consolidated Balance Sheets. For short term leases (term of 12 months or less), a lessee is permitted to make an accounting election not to recognize lease assets and lease liabilities. The lease cost will be allocated over the lease term on a straight-line basis.
Bank Owned Life Insurance
The Bank has purchased life insurance policies on certain key executives. Bank owned life insurance is recorded at the amount that can be realized under the insurance contract at the balance sheet date, which is the cash surrender value adjusted for other charges or other amounts due that are probable at settlement. Bank owned life insurance is included in other assets on the Consolidated Balance Sheets.
Securities Sold under Agreements to Repurchase
The Bank enters into sales of securities under agreements to repurchase at a specified future date. Such repurchase agreements are considered financing arrangements and, accordingly, the obligation to repurchase assets sold is reflected as a liability in the balance sheets of the Bank. Repurchase agreements are collateralized by debt securities which are owned and under the control of the Bank and are included in other liabilities on the Consolidated Balance Sheets.
Goodwill
Goodwill resulting from business combinations is generally determined as the excess of the fair value of the consideration transferred, plus the fair value of any noncontrolling interests in the acquiree, over the fair value of the net assets acquired and liabilities assumed as of the acquisition date. Goodwill and intangible assets acquired in a business combination and determined to have an indefinite useful life are not amortized, but tested for impairment at least annually or more frequently if events and circumstances exists that indicate that a goodwill impairment test should be performed. Qualitative factors are assessed to first determine if it is more likely than not (more than 50%) that the carrying value of goodwill is less than fair value. As of June 2023, given market volatility, following the March failures of several regional banks, the Company determined it did not satisfy the more likely than not qualitative
68
assessment that the carrying value of goodwill is less than fair value. As a result, the Company elected to perform a quantitative assessment, which included a combination of prices of comparable businesses, discounted cash flows and other techniques. The Company performed a similar analysis for the required annual impairment analysis as of the October 31, 2023 election date. Based upon the results of the quantitative assessments, including the proposed merger, we determined the fair value of the reporting unit exceeded the carrying value, resulting in
During the year ended December 31, 2022, qualitative factors indicated it was more likely than not that the carrying value of goodwill was less than fair value, thus there were no indicators of impairment and no quantitative testing was performed.
Intangible assets with definite useful lives are amortized over their estimated useful lives to their estimated residual values. Goodwill is the only intangible asset with an indefinite life on the balance sheet.
Core deposit intangible assets arising from whole bank acquisitions and are amortized on an accelerated method over their estimated useful lives, which range from to
Other Real Estate Owned
Other real estate owned (“OREO”) includes assets that have been acquired in satisfaction of debt through foreclosure and are recorded at estimated fair value less the estimated cost of disposition. Fair value is based on independent appraisals and other relevant factors. Valuation adjustments required at foreclosure are charged to the allowance for loan losses. Subsequent to foreclosure, additional losses resulting from the periodic revaluation of the property are charged to other real estate expense. Costs of operating and maintaining the properties and any gains or losses recognized on disposition are also included in other real estate expense. Improvements made to properties are capitalized if the expenditures are expected to be recovered upon the sale of the properties.
Restricted Equity Securities
The Bank is a member of the FHLB system. Members are required to own a certain amount of stock based upon the level of borrowings and other factors, and may invest additional amounts. FHLB stock is carried at cost, classified as a restricted equity security, and periodically evaluated for impairment based on an assessment of the ultimate recovery of par value. Both cash and stock dividends are reported as interest income on the Consolidated Statements of Income.
The Bank is also a member of the Federal Reserve System, and as such, holds stock of the Federal Reserve Bank of Atlanta (“Federal Reserve Bank”). Federal Reserve Bank stock is carried at cost, classified as a restricted equity security, and periodically evaluated for impairment based on ultimate recovery of par value. Both cash and stock dividends are reported as interest income on the Consolidated Statements of Income.
Income Taxes
Income tax expense is the total of the current year income tax due or refundable and the change in deferred tax assets and liabilities. Deferred tax assets and liabilities are the expected future tax amounts for the temporary differences between carrying amounts and tax bases of assets and liabilities, computed using enacted tax rates. A valuation allowance, if needed, reduces deferred tax assets to the amount expected to be realized.
69
Stock-Based Compensation
Stock-based compensation expense is recognized based on the fair value of the portion of stock-based payment awards that are ultimately expected to vest, reduced for estimated forfeitures. Forfeitures are estimated at the time of grant and revised, if necessary, in subsequent periods, if actual forfeitures differ from those estimates. A Black-Scholes model is utilized to estimate the fair value of stock options, while the market price of the Company’s common stock at the date of grant is used for restricted stock awards. Compensation expense is recognized over the required service period, generally defined as the vesting period. For awards with graded vesting, compensation expense is recognized on a straight-line basis over the requisite service period for the entire award. For awards with performance vesting criteria, anticipated performance is projected to determine the number of awards expected to vest, and the corresponding aggregate expense is adjusted to reflect the elapsed portion of the performance period.
Advertising Costs
Advertising costs are expensed as incurred. Advertising expense was approximately $
Off-Balance Sheet Financial Instruments
In the ordinary course of business, the Bank has entered into off-balance-sheet financial instruments consisting of commitments to extend credit and standby letters of credit. Such financial instruments are recorded in the financial statements when they are funded or related fees are incurred or received.
Derivative Instruments
Derivative instruments are recorded on the balance sheet at their respective fair values. The accounting for changes in fair value (i.e., gains or losses) of a derivative instrument depends on whether it has been designated and qualifies as part of a hedging relationship. If the derivative instrument is not designated as a hedge, the gain or loss on the derivative instrument is recognized in earnings in the period of change.
The Bank enters into interest rate swaps (“swaps”) to facilitate customer transactions and meet their financing needs. Upon entering into these arrangements to meet customer needs, the Bank enters into offsetting positions with large U.S. financial institutions in order to minimize market risk to the Bank. These swaps are derivatives, but are not designated as hedging instruments.
The Bank may also utilize cash flow hedges to manage its future interest rate exposure. These derivative contracts are designated as hedges and, as such, changes in the fair value of these derivative instruments are recorded in other comprehensive income (loss) on the Consolidated Statements of Comprehensive Income (Loss). The Bank prepares written hedge documentation for all derivatives which are designated as hedges. The written hedge documentation includes identification of, among other items, the risk management objective, hedging instrument, hedged item and methodologies for assessing and measuring hedge effectiveness and ineffectiveness, along with support for management’s assertion that the hedge will be highly effective.
The effective portion of the changes in the fair value of a derivative that is highly effective and that has been designated and qualifies as a cash flow hedge are initially recorded in accumulated other comprehensive income (loss) and subsequently reclassified into earnings in the same period during which the hedged item affects earnings. The ineffective portion, if any, would be recognized in current period earnings.
The Bank discontinues hedge accounting when it determines that the derivative is no longer effective in offsetting changes in the cash flows of the hedged item, the derivative is settled or terminates, or treatment of the derivative as a hedge is no longer appropriate or intended. When hedge accounting is discontinued, subsequent changes in fair value of the derivative are recorded as noninterest income. When a cash flow hedge is discontinued but the hedged cash flows or forecasted transactions are still expected to occur, gains or losses that were accumulated in other comprehensive income (loss) are amortized into earnings over the same periods which the hedged transactions will affect earnings.
Cash flows resulting from the derivative financial instruments that are accounted for as hedges are classified in the cash flow statement in the same category as the cash flows of the items being hedged.
70
Commitments to fund mortgage loans to be sold into the secondary market, “interest rate locks”, and forward commitments for the sale of mortgage-backed securities are accounted for as free standing derivatives. The fair value of the interest rate lock is recorded at the time the commitment to fund the mortgage loan is executed and is adjusted for the expected exercise of the commitment before the loan is funded. Fair values of these mortgage derivatives are estimated based on changes in mortgage interest rates from the date the interest rate on the loan is locked. The Company enters into forward commitments for the sale of mortgage-backed securities when interest rate locks are entered into, in order to hedge the change in interest rates resulting from its commitments to fund the loans. Changes in the fair values of these derivatives are included in mortgage banking income on the Consolidated Statements of Income.
Comprehensive Income
Comprehensive income consists of net income and other comprehensive income (loss). Other comprehensive income includes unrealized gains and losses on securities available for sale, unrealized gains and losses on securities transferred to held to maturity and unrealized gains and losses on cash flow hedges which are also recognized as separate components of equity. The Bank’s policy is to release the income tax effects of items in accumulated other comprehensive income (loss) when the item is realized.
Fair Value Measurements
Fair values of financial instruments are estimated using relevant market information and other assumptions, as more fully disclosed in a separate note. Fair value estimates involve uncertainties and matters of significant judgment regarding interest rates, credit risk, prepayments, and other factors, especially in the absence of broad markets for particular items. Changes in assumptions or in market conditions could significantly affect these estimates.
Subsequent Events
Income Per Common Share
Basic net income per share available to common stockholders (“EPS”) is computed by dividing net income available to common stockholders by the weighted average shares of common stock outstanding for the period. Diluted EPS reflects the dilution that could occur if securities or other contracts to issue common stock were exercised or converted. The difference between basic and diluted weighted average shares outstanding is attributable to convertible preferred stock, common stock options and warrants. The dilutive effect of outstanding convertible preferred stock, common stock options and warrants is reflected in diluted EPS by application of the treasury stock method.
The following is a summary of the basic and diluted earnings per share calculation for each of the following years (in thousands except share data):
|
|
Year Ended December 31, |
|
|||||||||
|
|
2023 |
|
|
2022 |
|
|
2021 |
|
|||
Basic net income per share calculation: |
|
|
|
|
|
|
|
|
|
|||
Numerator – Net income |
|
$ |
|
|
$ |
|
|
$ |
|
|||
Denominator – Average common shares outstanding |
|
|
|
|
|
|
|
|
|
|||
Basic net income per share |
|
$ |
|
|
$ |
|
|
$ |
|
|||
Diluted net income per share calculation: |
|
|
|
|
|
|
|
|
|
|||
Numerator – Net income |
|
$ |
|
|
$ |
|
|
$ |
|
|||
Denominator – Average common shares outstanding |
|
|
|
|
|
|
|
|
|
|||
Dilutive shares contingently issuable |
|
|
|
|
|
|
|
|
|
|||
Average diluted common shares outstanding |
|
|
|
|
|
|
|
|
|
|||
Diluted net income per share |
|
$ |
|
|
$ |
|
|
$ |
|
|||
71
Recently Issued Accounting Pronouncements
In March 2020, the FASB issued ASU 2020-04,"Reference Rate Reform (Topic 848): Facilitation of the Effects of Reference Rate Reform on Financial Reporting," which provides temporary optional guidance to ease the potential burden in accounting for reference rate reform. The ASU provides optional expedients and exceptions for applying generally accepted accounting principles to contract modifications and hedging relationships, subject to meeting certain criteria, that reference LIBOR or another reference rate expected to be discontinued. It is intended to help stakeholders during the global market-wide reference rate transition period. In January 2021, the FASB issued ASU 2021-01 which clarifies that certain optional expedients and exceptions in Topic 848 for contract modifications and hedge accounting apply to derivatives that are affected by the discounting transition. The guidance was effective for all entities as of March 12, 2020 through December 31, 2022. The Company implemented its transition plan towards cessation of LIBOR and the modification of its outstanding financial instruments with attributes that are either directly or indirectly influenced by LIBOR. The Company discontinued LIBOR-based originations as of December 31, 2022, and for outstanding LIBOR-based transactions the Company replaced LIBOR with an alternate index as of June 30, 2023. Adoption did not have a material impact on its accounting and disclosures.
In December 2022, the FASB issued ASU 2022-06, “Reference Rate Reform (Topic 848): Deferral of the Sunset Date of Topic 848”. ASU 2022-06 extends the period of time preparers can utilize the reference rate reform relief guidance in Topic 848. The objective of the guidance in Topic 848 is to provide relief during the temporary transition period, so the FASB included a sunset provision within Topic 848 based on expectations of when the London Interbank Offered Rate (LIBOR) would cease being published. In 2021, the UK Financial Conduct Authority (FCA) delayed the intended cessation date of certain tenors of USD LIBOR to June 30, 2023. To ensure the relief in Topic 848 covers the period of time during which a significant number of modifications may take place, the ASU defers the sunset date of Topic 848 from December 31, 2022, to December 31, 2024, after which entities will no longer be permitted to apply the relief in Topic 848. The ASU is effective for all entities upon issuance. The Company has completed its transition away from LIBOR for its loan and other financial instruments.
In March 2023, the FASB issued ASU 2023-02, "Investments - Equity Method and Joint Ventures (Topic 323): Accounting for Investments in Tax Credit Structures Using the Proportional Amortization Method" to allow reporting entities to consistently account for equity investments made primarily for the purpose of receiving income tax credits and other income tax benefits. The amendments are effective for fiscal years beginning after December 15, 2023, including interim periods within those fiscal years. Early adoption is permitted for all entities in any interim period. The Company does not expect these amendments to have a material effect on its financial statements.
In November 2023, the FASB amended ASC 2023-07, "Segment Reporting (Topic 280)" to improve disclosures about a public entity's reportable segments and provide more detailed information about a reportable segment's expense. The amendments are effective for fiscal years beginning after December 15, 2023, and interim periods within fiscal years beginning after December 15, 2024. Early adoption is permitted. The Company does not expect these amendments to have a material effect on its financial statements.
In December 2023, the FASB issued ASU 2023-09, "Income Taxes (Topic 740): Improvements to Income Tax Disclosures" to improve the transparency of income tax disclosures. The amendments are effective for annual periods beginning after December 15, 2024. Early adoption is permitted for annual financial statements that have not yet been issued or made available for issuance. The Company does not expect these amendments to have a material effect on its financial statements.
72
CAPSTAR FINANCIAL HOLDINGS INC. & SUBSIDIARY
Notes to Consolidated Financial Statements
NOTE 2 - BUSINESS COMBINATIONS
Proposed Acquisition by Old National
On October 26, 2023, Old National and the Company entered into a definitive merger agreement for Old National (the "Old National Merger Agreement") to acquire CapStar in an all-stock transaction with an aggregate value of approximately $
Under the terms of the Old National Merger Agreement, shareholders of the Company will receive, in respect of each share of common stock of the Company held by them,
NOTE 3 – INVESTMENT SECURITIES
Investment securities have been classified in the balance sheet according to management’s intent.
|
|
December 31, 2023 |
|
|
December 31, 2022 |
|
||||||||||||||||||||||||||
|
|
Amortized |
|
|
Gross |
|
|
Gross |
|
|
Estimated |
|
|
Amortized |
|
|
Gross |
|
|
Gross |
|
|
Estimated |
|
||||||||
Securities available-for-sale: |
|
|
|
|
|
|
|
|
|
|
|
|
|
|
|
|
|
|
|
|
|
|
|
|
||||||||
U. S. government agency securities |
|
$ |
|
|
$ |
— |
|
|
$ |
( |
) |
|
$ |
|
|
$ |
|
|
$ |
— |
|
|
$ |
( |
) |
|
$ |
|
||||
State and municipal securities |
|
|
|
|
|
|
|
|
( |
) |
|
|
|
|
|
|
|
|
|
|
|
( |
) |
|
|
|
||||||
Mortgage-backed securities |
|
|
|
|
|
— |
|
|
|
( |
) |
|
|
|
|
|
|
|
|
— |
|
|
|
( |
) |
|
|
|
||||
Asset-backed securities |
|
|
|
|
|
— |
|
|
|
( |
) |
|
|
|
|
|
|
|
|
— |
|
|
|
( |
) |
|
|
|
||||
Other debt securities |
|
|
|
|
|
|
|
|
( |
) |
|
|
|
|
|
|
|
|
|
|
|
( |
) |
|
|
|
||||||
Total |
|
$ |
|
|
$ |
|
|
$ |
( |
) |
|
$ |
|
|
$ |
|
|
$ |
|
|
$ |
( |
) |
|
$ |
|
||||||
Securities held-to-maturity: |
|
|
|
|
|
|
|
|
|
|
|
|
|
|
|
|
|
|
|
|
|
|
|
|
||||||||
State and municipal securities |
|
$ |
|
|
$ |
— |
|
|
$ |
— |
|
|
$ |
|
|
$ |
|
|
$ |
— |
|
|
$ |
— |
|
|
$ |
|
||||
Total |
|
$ |
|
|
$ |
— |
|
|
$ |
— |
|
|
$ |
|
|
$ |
|
|
$ |
— |
|
|
$ |
— |
|
|
$ |
|
||||
The amortized cost and fair value of debt and equity securities as of December 31, 2023, by contractual maturity, are shown below (in thousands). Expected maturities will differ from contractual maturities because borrowers may have the right to call or prepay obligations with or without call or prepayment penalties. Securities not due at a single maturity date are shown separately.
|
|
Available-for-sale |
|
|||||
|
|
Amortized |
|
|
Estimated |
|
||
Due in less than one year |
|
$ |
|
|
$ |
|
||
Due one to five years |
|
|
|
|
|
|
||
Due five to ten years |
|
|
|
|
|
|
||
Due beyond ten years |
|
|
|
|
|
|
||
Mortgage-backed securities |
|
|
|
|
|
|
||
Asset-backed securities |
|
|
|
|
|
|
||
Total |
|
$ |
|
|
$ |
|
||
73
CAPSTAR FINANCIAL HOLDINGS INC. & SUBSIDIARY
Notes to Consolidated Financial Statements
Results from sales, maturities, prepayments and calls of securities available for sale were as follows (in thousands):
|
Year Ended December 31, |
|
|||||||||
|
2023 |
|
|
2022 |
|
|
2021 |
|
|||
Proceeds |
$ |
|
|
$ |
|
|
$ |
|
|||
Gross gains |
|
|
|
|
|
|
|
|
|||
Gross losses |
|
( |
) |
|
|
|
|
|
( |
) |
|
Securities with a market value of $
As of December 31, 2023 and 2022, there were
The following tables show the Company’s securities with unrealized losses, aggregated by major security type and length of time in a continuous unrealized loss position (in thousands):
|
|
Less than 12 months |
|
|
12 months or more |
|
|
Total |
|
|||||||||||||||
December 31, 2023 |
|
Estimated |
|
|
Gross |
|
|
Estimated |
|
|
Gross |
|
|
Estimated |
|
|
Gross |
|
||||||
U. S. government agency securities |
|
$ |
|
|
$ |
|
|
$ |
|
|
$ |
( |
) |
|
$ |
|
|
$ |
( |
) |
||||
State and municipal securities |
|
|
|
|
|
( |
) |
|
|
|
|
|
( |
) |
|
|
|
|
|
( |
) |
|||
Mortgage-backed securities |
|
|
|
|
|
|
|
|
|
|
|
( |
) |
|
|
|
|
|
( |
) |
||||
Asset-backed securities |
|
|
|
|
|
|
|
|
|
|
|
( |
) |
|
|
|
|
|
( |
) |
||||
Other debt securities |
|
|
|
|
|
( |
) |
|
|
|
|
|
( |
) |
|
|
|
|
|
( |
) |
|||
Total temporarily impaired securities |
|
$ |
|
|
$ |
( |
) |
|
$ |
|
|
$ |
( |
) |
|
$ |
|
|
$ |
( |
) |
|||
|
|
|
|
|
|
|
|
|
|
|
|
|
|
|
|
|
|
|
||||||
December 31, 2022 |
|
|
|
|
|
|
|
|
|
|
|
|
|
|
|
|
|
|
||||||
U. S. government agency securities |
|
$ |
|
|
$ |
( |
) |
|
$ |
|
|
$ |
( |
) |
|
$ |
|
|
$ |
( |
) |
|||
State and municipal securities |
|
|
|
|
|
( |
) |
|
|
|
|
|
( |
) |
|
|
|
|
|
( |
) |
|||
Mortgage-backed securities |
|
|
|
|
|
( |
) |
|
|
|
|
|
( |
) |
|
|
|
|
|
( |
) |
|||
Asset-backed securities |
|
|
|
|
|
( |
) |
|
|
— |
|
|
|
— |
|
|
|
|
|
|
( |
) |
||
Other debt securities |
|
|
|
|
|
( |
) |
|
|
|
|
|
( |
) |
|
|
|
|
|
( |
) |
|||
Total temporarily impaired securities |
|
$ |
|
|
$ |
( |
) |
|
$ |
|
|
$ |
( |
) |
|
$ |
|
|
$ |
( |
) |
|||
At adoption of ASC 326 on January 1, 2023, calculated credit losses and, thus, the related ACL on held-to-maturity debt securities were not material due to the high credit quality of the portfolio. As a result, no ACL was recorded on the held-to-maturity portfolio at January 1, 2023. There are no held-to-maturity debt securities as of December 31, 2023.
At December 31, 2023, the Company owned certain securities related to Signature Bank ("Signature") which, following the 2023 first quarter failure of Signature, were deemed to have significant credit losses and no probable recovery. As such, a $
At December 31, 2023, there were
74
CAPSTAR FINANCIAL HOLDINGS INC. & SUBSIDIARY
Notes to Consolidated Financial Statements
As of December 31, 2023, the Signature securities for which an ACL has been recorded are on non-accrual. No other securities are past due or on non-accrual. In the first quarter of 2024, the Company sold its holding of Signature subordinated debt securities and will record a $
The following table shows a rollforward of the ACL on available for sale securities for the year ended December 31, 2023:
|
|
Other debt securities |
|
|
Balance as of December 31, 2022 |
|
$ |
|
|
Adoption of CECL |
|
|
|
|
Additions for securities for which no previous expected credit losses were recognized |
|
|
|
|
Total |
|
$ |
|
|
NOTE 4 – LOANS AND ALLOWANCE FOR CREDIT LOSSES
A summary of the loans held for investment portfolio as of December 31, 2023 and 2022 follows (in thousands):
|
|
December 31, 2023 |
|
|
December 31, 2022 |
|
||
Commercial real estate - owner occupied |
|
$ |
|
|
$ |
|
||
Commercial real estate - non-owner occupied |
|
|
|
|
|
|
||
Consumer real estate |
|
|
|
|
|
|
||
Construction and land development |
|
|
|
|
|
|
||
Commercial and industrial |
|
|
|
|
|
|
||
Consumer |
|
|
|
|
|
|
||
Other |
|
|
|
|
|
|
||
Total |
|
|
|
|
|
|
||
Allowance for credit losses on loans |
|
|
( |
) |
|
|
( |
) |
Total loans, net |
|
$ |
|
|
$ |
|
||
Loans Held for Sale
As of December 31, 2023 the Company had $
Non-accrual and Past Due
The following table presents the aging of the recorded investment in past-due loans as of December 31, 2023 and 2022 by class of loans (in thousands):
75
CAPSTAR FINANCIAL HOLDINGS INC. & SUBSIDIARY
Notes to Consolidated Financial Statements
|
|
Accruing |
|
|
|
|
|
|
|
|||||||||||||||||||
|
|
30 - 59 |
|
|
60 - 89 |
|
|
Greater Than |
|
|
|
|
|
|
|
|
|
|
|
|
|
|||||||
|
|
Days |
|
|
Days |
|
|
89 Days |
|
|
Total |
|
|
Loans Not |
|
|
Non-Accrual |
|
|
|
|
|||||||
|
|
Past Due |
|
|
Past Due |
|
|
Past Due |
|
|
Past Due |
|
|
Past Due |
|
|
Loans |
|
|
Total |
|
|||||||
December 31, 2023 |
|
|
|
|
|
|
|
|
|
|
|
|
|
|
|
|
|
|
|
|
|
|||||||
Commercial real estate - owner occupied |
|
$ |
|
|
$ |
— |
|
|
$ |
|
|
$ |
|
|
$ |
|
|
$ |
|
|
$ |
|
||||||
Commercial real estate - non-owner occupied |
|
|
|
|
|
— |
|
|
|
— |
|
|
|
|
|
|
|
|
|
|
|
|
|
|||||
Consumer real estate |
|
|
|
|
|
|
|
|
|
|
|
|
|
|
|
|
|
|
|
|
|
|||||||
Construction and land development |
|
|
|
|
|
— |
|
|
|
— |
|
|
|
|
|
|
|
|
|
|
|
|
|
|||||
Commercial and industrial |
|
|
|
|
|
|
|
|
|
|
|
|
|
|
|
|
|
|
|
|
|
|||||||
Consumer |
|
|
|
|
|
|
|
|
|
|
|
|
|
|
|
|
|
|
|
|
|
|||||||
Other |
|
|
— |
|
|
|
— |
|
|
|
|
|
|
|
|
|
|
|
|
|
|
|
|
|||||
Total |
|
$ |
|
|
$ |
|
|
$ |
|
|
$ |
|
|
$ |
|
|
$ |
|
|
$ |
|
|||||||
|
|
Accruing |
|
|
|
|
|
|
|
|||||||||||||||||||
|
|
30 - 59 |
|
|
60 - 89 |
|
|
Greater Than |
|
|
|
|
|
|
|
|
|
|
|
|
|
|||||||
|
|
Days |
|
|
Days |
|
|
89 Days |
|
|
Total |
|
|
Loans Not |
|
|
Non-Accrual |
|
|
|
|
|||||||
|
|
Past Due |
|
|
Past Due |
|
|
Past Due |
|
|
Past Due |
|
|
Past Due |
|
|
Loans |
|
|
Total |
|
|||||||
December 31, 2022 |
|
|
|
|
|
|
|
|
|
|
|
|
|
|
|
|
|
|
|
|
|
|||||||
Commercial real estate - owner occupied |
|
$ |
— |
|
|
$ |
— |
|
|
$ |
— |
|
|
$ |
— |
|
|
$ |
|
|
$ |
|
|
$ |
|
|||
Commercial real estate - non-owner occupied |
|
|
— |
|
|
|
— |
|
|
|
— |
|
|
|
— |
|
|
|
|
|
|
— |
|
|
|
|
||
Consumer real estate |
|
|
|
|
|
|
|
|
|
|
|
|
|
|
|
|
|
|
|
|
|
|||||||
Construction and land development |
|
|
— |
|
|
|
— |
|
|
|
— |
|
|
|
— |
|
|
|
|
|
|
|
|
|
|
|||
Commercial and industrial |
|
|
|
|
|
|
|
|
|
|
|
|
|
|
|
|
|
|
|
|
|
|||||||
Consumer |
|
|
|
|
|
|
|
|
|
|
|
|
|
|
|
|
|
|
|
|
|
|||||||
Other |
|
|
— |
|
|
|
— |
|
|
|
|
|
|
|
|
|
|
|
|
— |
|
|
|
|
||||
Purchased credit impaired |
|
|
|
|
|
|
|
|
|
|
|
|
|
|
|
|
|
|
|
|
|
|||||||
Total |
|
$ |
|
|
$ |
|
|
$ |
|
|
$ |
|
|
$ |
|
|
$ |
|
|
$ |
|
|||||||
The Company recognized
The following table presents the recorded investment in non-accrual loans by class of loans as of December 31, 2023 (in thousands):
|
|
Non-Accrual loans with no allowance |
|
|
Non-Accrual loans with allowance |
|
|
Total Non-Accrual Loans |
|
|||
Commercial real estate - owner occupied |
|
$ |
— |
|
|
$ |
|
|
$ |
|
||
Commercial real estate - non-owner occupied |
|
|
|
|
|
|
|
|
|
|||
Consumer real estate |
|
|
|
|
|
|
|
|
|
|||
Construction and land development |
|
|
— |
|
|
|
|
|
|
|
||
Commercial and industrial |
|
|
|
|
|
|
|
|
|
|||
Consumer |
|
|
|
|
|
|
|
|
|
|||
Other |
|
|
|
|
|
|
|
|
|
|||
Total |
|
$ |
|
|
$ |
|
|
$ |
|
|||
76
CAPSTAR FINANCIAL HOLDINGS INC. & SUBSIDIARY
Notes to Consolidated Financial Statements
Risk Ratings
The Company categorizes loans into risk categories based on relevant information about the ability of borrowers to service their debt such as: current financial information, historical payment experience, credit documentation, public information, and current economic trends, among other factors. The Company analyzes all commercial loans, and consumer relationships with an outstanding balance greater than $
Pass – Loans in this category are considered to have a low probability of default and do not meet the criteria of the risk categories below.
Special Mention – A special mention asset possesses deficiencies or potential weaknesses deserving of management’s attention. If uncorrected, such weaknesses or deficiencies may expose the Company to an increased risk of loss in the future.
Substandard – A substandard asset is inadequately protected by the current sound net worth and paying capacity of the obligor or of the collateral pledged, if any. Assets so classified must have a well-defined weakness or weaknesses that jeopardize the liquidation of the debt. They are characterized by the distinct possibility that the Company will sustain some loss if deficiencies are not corrected. Loss potential, while existing in the aggregate amount of substandard assets, does not have to exist in individual assets classified substandard.
Doubtful – A doubtful asset has all weaknesses inherent in one classified substandard, with the added characteristic that weaknesses make collection or liquidation in full, on the basis of existing facts, conditions, and values, highly questionable and improbable. The probability of loss is extremely high, but certain important and reasonable specific pending factors which may work to the advantage and strengthening of the asset exist, therefore, its classification as an estimated loss is deferred until a more exact status may be determined. Pending factors include proposed merger, acquisition or liquidation procedures, capital injection, perfecting liens on additional collateral, and refinancing plans.
77
CAPSTAR FINANCIAL HOLDINGS INC. & SUBSIDIARY
Notes to Consolidated Financial Statements
The following table provides the risk category of loans by applicable class of loans and vintage year as of December 31, 2023 (in thousands):
78
CAPSTAR FINANCIAL HOLDINGS INC. & SUBSIDIARY
Notes to Consolidated Financial Statements
|
|
Term Loans by Origination Year |
|
|
|
|
|
|
|
|
|
|
||||||||||||||||||||||||
|
|
2023 |
|
|
2022 |
|
|
2021 |
|
|
2020 |
|
|
2019 |
|
|
Prior |
|
|
Revolvers |
|
|
Revolvers converted to term loans |
|
|
Total |
|
|||||||||
Commercial real estate - owner occupied |
|
|
|
|
|
|
|
|
|
|
|
|
|
|
|
|
|
|
|
|
|
|
|
|
|
|
|
|||||||||
Pass |
|
$ |
|
|
$ |
|
|
$ |
|
|
$ |
|
|
$ |
|
|
$ |
|
|
$ |
|
|
$ |
|
|
$ |
|
|||||||||
Special Mention |
|
|
|
|
|
|
|
|
|
|
|
|
|
|
|
|
|
|
|
|
|
|
|
|
|
|
|
|||||||||
Substandard |
|
|
|
|
|
|
|
|
|
|
|
|
|
|
|
|
|
|
|
|
|
|
|
|
|
|
|
|||||||||
Doubtful |
|
|
|
|
|
|
|
|
|
|
|
|
|
|
|
|
|
|
|
|
|
|
|
|
|
|
|
|||||||||
Total |
|
$ |
|
|
$ |
|
|
$ |
|
|
$ |
|
|
$ |
|
|
$ |
|
|
$ |
|
|
$ |
|
|
$ |
|
|||||||||
Current period gross charge-offs |
|
|
|
|
|
|
|
|
|
|
|
|
|
|
|
|
|
|
|
|
|
|
|
|
|
|
|
|||||||||
|
|
|
|
|
|
|
|
|
|
|
|
|
|
|
|
|
|
|
|
|
|
|
|
|
|
|
|
|||||||||
Commercial real estate - non-owner occupied |
|
|
|
|
|
|
|
|
|
|
|
|
|
|
|
|
|
|
|
|
|
|
|
|
|
|
|
|||||||||
Pass |
|
$ |
|
|
$ |
|
|
$ |
|
|
$ |
|
|
$ |
|
|
$ |
|
|
$ |
|
|
$ |
|
|
$ |
|
|||||||||
Special Mention |
|
|
|
|
|
|
|
|
|
|
|
|
|
|
|
|
|
|
|
|
|
|
|
|
|
|
|
|||||||||
Substandard |
|
|
|
|
|
|
|
|
|
|
|
|
|
|
|
|
|
|
|
|
|
|
|
|
|
|
|
|||||||||
Doubtful |
|
|
|
|
|
|
|
|
|
|
|
|
|
|
|
|
|
|
|
|
|
|
|
|
|
|
|
|||||||||
Total |
|
$ |
|
|
$ |
|
|
$ |
|
|
$ |
|
|
$ |
|
|
$ |
|
|
$ |
|
|
$ |
|
|
$ |
|
|||||||||
Current period gross charge-offs |
|
|
|
|
|
|
|
|
|
|
|
|
|
|
|
|
|
|
|
|
|
|
|
|
|
|
|
|||||||||
|
|
|
|
|
|
|
|
|
|
|
|
|
|
|
|
|
|
|
|
|
|
|
|
|
|
|
|
|||||||||
Consumer real estate |
|
|
|
|
|
|
|
|
|
|
|
|
|
|
|
|
|
|
|
|
|
|
|
|
|
|
|
|||||||||
Pass |
|
$ |
|
|
$ |
|
|
$ |
|
|
$ |
|
|
$ |
|
|
$ |
|
|
$ |
|
|
$ |
|
|
$ |
|
|||||||||
Special Mention |
|
|
|
|
|
|
|
|
|
|
|
|
|
|
|
|
|
|
|
|
|
|
|
|
|
|
|
|||||||||
Substandard |
|
|
|
|
|
|
|
|
|
|
|
|
|
|
|
|
|
|
|
|
|
|
|
|
|
|
|
|||||||||
Doubtful |
|
|
|
|
|
|
|
|
|
|
|
|
|
|
|
|
|
|
|
|
|
|
|
|
|
|
|
|||||||||
Total |
|
$ |
|
|
$ |
|
|
$ |
|
|
$ |
|
|
$ |
|
|
$ |
|
|
$ |
|
|
$ |
|
|
$ |
|
|||||||||
Current period gross charge-offs |
|
|
|
|
|
|
|
|
|
|
|
|
|
|
|
|
|
|
|
|
|
|
|
|
|
|
|
|||||||||
|
|
|
|
|
|
|
|
|
|
|
|
|
|
|
|
|
|
|
|
|
|
|
|
|
|
|
|
|||||||||
Construction and land development |
|
|
|
|
|
|
|
|
|
|
|
|
|
|
|
|
|
|
|
|
|
|
|
|
|
|
|
|||||||||
Pass |
|
$ |
|
|
$ |
|
|
$ |
|
|
$ |
|
|
$ |
|
|
$ |
|
|
$ |
|
|
$ |
|
|
$ |
|
|||||||||
Special Mention |
|
|
|
|
|
|
|
|
|
|
|
|
|
|
|
|
|
|
|
|
|
|
|
|
|
|
|
|||||||||
Substandard |
|
|
|
|
|
|
|
|
|
|
|
|
|
|
|
|
|
|
|
|
|
|
|
|
|
|
|
|||||||||
Doubtful |
|
|
|
|
|
|
|
|
|
|
|
|
|
|
|
|
|
|
|
|
|
|
|
|
|
|
|
|||||||||
Total |
|
$ |
|
|
$ |
|
|
$ |
|
|
$ |
|
|
$ |
|
|
$ |
|
|
$ |
|
|
$ |
|
|
$ |
|
|||||||||
Current period gross charge-offs |
|
|
|
|
|
|
|
|
|
|
|
|
|
|
|
|
|
|
|
|
|
|
|
|
|
|
|
|||||||||
|
|
|
|
|
|
|
|
|
|
|
|
|
|
|
|
|
|
|
|
|
|
|
|
|
|
|
|
|||||||||
Commercial and industrial |
|
|
|
|
|
|
|
|
|
|
|
|
|
|
|
|
|
|
|
|
|
|
|
|
|
|
|
|||||||||
Pass |
|
$ |
|
|
$ |
|
|
$ |
|
|
$ |
|
|
$ |
|
|
$ |
|
|
$ |
|
|
$ |
|
|
$ |
|
|||||||||
Special Mention |
|
|
|
|
|
|
|
|
|
|
|
|
|
|
|
|
|
|
|
|
|
|
|
|
|
|
|
|||||||||
Substandard |
|
|
|
|
|
|
|
|
|
|
|
|
|
|
|
|
|
|
|
|
|
|
|
|
|
|
|
|||||||||
Doubtful |
|
|
|
|
|
|
|
|
|
|
|
|
|
|
|
|
|
|
|
|
|
|
|
|
|
|
|
|||||||||
Total |
|
$ |
|
|
$ |
|
|
$ |
|
|
$ |
|
|
$ |
|
|
$ |
|
|
$ |
|
|
$ |
|
|
$ |
|
|||||||||
Current period gross charge-offs |
|
|
|
|
|
|
|
|
|
|
|
|
|
|
|
|
|
|
|
|
|
|
|
|
|
|
|
|||||||||
|
|
|
|
|
|
|
|
|
|
|
|
|
|
|
|
|
|
|
|
|
|
|
|
|
|
|
|
|||||||||
Consumer |
|
|
|
|
|
|
|
|
|
|
|
|
|
|
|
|
|
|
|
|
|
|
|
|
|
|
|
|||||||||
Pass |
|
$ |
|
|
$ |
|
|
$ |
|
|
$ |
|
|
$ |
|
|
$ |
|
|
$ |
|
|
$ |
|
|
$ |
|
|||||||||
Special Mention |
|
|
|
|
|
|
|
|
|
|
|
|
|
|
|
|
|
|
|
|
|
|
|
|
|
|
|
|||||||||
Substandard |
|
|
|
|
|
|
|
|
|
|
|
|
|
|
|
|
|
|
|
|
|
|
|
|
|
|
|
|||||||||
Doubtful |
|
|
|
|
|
|
|
|
|
|
|
|
|
|
|
|
|
|
|
|
|
|
|
|
|
|
|
|||||||||
Total |
|
$ |
|
|
$ |
|
|
$ |
|
|
$ |
|
|
$ |
|
|
$ |
|
|
$ |
|
|
$ |
|
|
$ |
|
|||||||||
Current period gross charge-offs |
|
|
|
|
|
|
|
|
|
|
|
|
|
|
|
|
|
|
|
|
|
|
|
|
|
|
|
|||||||||
|
|
|
|
|
|
|
|
|
|
|
|
|
|
|
|
|
|
|
|
|
|
|
|
|
|
|
|
|||||||||
Other |
|
|
|
|
|
|
|
|
|
|
|
|
|
|
|
|
|
|
|
|
|
|
|
|
|
|
|
|||||||||
Pass |
|
$ |
|
|
$ |
|
|
$ |
|
|
$ |
|
|
$ |
|
|
$ |
|
|
$ |
|
|
$ |
|
|
$ |
|
|||||||||
Special Mention |
|
|
|
|
|
|
|
|
|
|
|
|
|
|
|
|
|
|
|
|
|
|
|
|
|
|
|
|||||||||
Substandard |
|
|
|
|
|
|
|
|
|
|
|
|
|
|
|
|
|
|
|
|
|
|
|
|
|
|
|
|||||||||
Doubtful |
|
|
|
|
|
|
|
|
|
|
|
|
|
|
|
|
|
|
|
|
|
|
|
|
|
|
|
|||||||||
Total |
|
$ |
|
|
$ |
|
|
$ |
|
|
$ |
|
|
$ |
|
|
$ |
|
|
$ |
|
|
$ |
|
|
$ |
|
|||||||||
Current period gross charge-offs |
|
|
|
|
|
|
|
|
|
|
|
|
|
|
|
|
|
|
|
|
|
|
|
|
|
|
|
|||||||||
|
|
|
|
|
|
|
|
|
|
|
|
|
|
|
|
|
|
|
|
|
|
|
|
|
|
|
|
|||||||||
Total Portfolio |
|
|
|
|
|
|
|
|
|
|
|
|
|
|
|
|
|
|
|
|
|
|
|
|
|
|
|
|||||||||
Pass |
|
$ |
|
|
$ |
|
|
$ |
|
|
$ |
|
|
$ |
|
|
$ |
|
|
$ |
|
|
$ |
|
|
$ |
|
|||||||||
Special Mention |
|
|
|
|
|
|
|
|
|
|
|
|
|
|
|
|
|
|
|
|
|
|
|
|
|
|
|
|||||||||
79
CAPSTAR FINANCIAL HOLDINGS INC. & SUBSIDIARY
Notes to Consolidated Financial Statements
Substandard |
|
|
|
|
|
|
|
|
|
|
|
|
|
|
|
|
|
|
|
|
|
|
|
|
|
|
|
|||||||||
Doubtful |
|
|
|
|
|
|
|
|
|
|
|
|
|
|
|
|
|
|
|
|
|
|
|
|
|
|
|
|||||||||
Total |
|
$ |
|
|
$ |
|
|
$ |
|
|
$ |
|
|
$ |
|
|
$ |
|
|
$ |
|
|
$ |
|
|
$ |
|
|||||||||
Current period gross charge-offs |
|
$ |
|
|
$ |
|
|
$ |
|
|
$ |
|
|
$ |
|
|
$ |
|
|
$ |
|
|
$ |
|
|
$ |
|
The following table provides the risk category of loans by applicable class of loans as of December 31, 2022 (in thousands):
|
|
Non-impaired Loans |
|
|
|
|
|
|
|
|||||||||||||||
December 31, 2022 |
|
Pass |
|
|
Special |
|
|
Substandard |
|
|
Doubtful |
|
|
Total Impaired |
|
|
Total |
|
||||||
Commercial real estate - owner occupied |
|
$ |
|
|
$ |
|
|
$ |
|
|
$ |
— |
|
|
$ |
|
|
$ |
|
|||||
Commercial real estate - non-owner occupied |
|
|
|
|
|
— |
|
|
|
— |
|
|
|
— |
|
|
|
— |
|
|
|
|
||
Consumer real estate |
|
|
|
|
|
|
|
|
|
|
|
— |
|
|
|
|
|
|
|
|||||
Construction and land development |
|
|
|
|
|
— |
|
|
|
— |
|
|
|
— |
|
|
|
|
|
|
|
|||
Commercial and industrial |
|
|
|
|
|
|
|
|
|
|
|
|
|
|
|
|
|
|
||||||
Consumer |
|
|
|
|
|
— |
|
|
|
|
|
|
|
|
|
|
|
|
|
|||||
Other |
|
|
|
|
|
— |
|
|
|
|
|
|
— |
|
|
|
— |
|
|
|
|
|||
Purchased credit impaired |
|
|
|
|
|
|
|
|
|
|
|
|
|
|
— |
|
|
|
|
|||||
Total |
|
$ |
|
|
$ |
|
|
$ |
|
|
$ |
|
|
$ |
|
|
$ |
|
||||||
At December 31, 2023, variable-rate and fixed-rate loans totaled $
Modifications
Occasionally, the Company modifies loans to borrowers in financial distress by providing principal forgiveness, term extension, an other-than-insignificant payment delay or interest rate reduction. When principal forgiveness is provided, the amount of forgiveness is charged-off against the ACL.
In some cases, the Company provides multiple types of concessions on one loan. Typically, one type of concession, such as a term extension, is granted initially. If the borrower continues to experience financial difficulty, another concession, such as principal forgiveness, may be granted.
The following table represents the loans as of December 31, 2023 that were both experiencing financial difficulty and modified during the year ended December 31, 2023, by class and by type of modification. The percentage of loans that were modified to borrowers in financial distress as compared to the total loans of each class is also presented below.
|
|
Payment Delay |
|
|
Term Extension |
|
|
Total Class of Loans |
|
|||
Commercial and industrial |
|
$ |
|
|
$ |
|
|
|
% |
|||
Total |
|
$ |
|
|
$ |
|
|
|
% |
|||
The Company has not committed to lend additional amounts to the borrowers included in the previous table. The Company closely monitors the performance of loans that are modified to borrowers experiencing financial difficulty to understand the effectiveness of its modification efforts. Such loans that had been modified in the last 12 months are all current with no loans past due.
The following table presents the financial effect of the loan modifications represented above to borrowers experiencing financial difficulty for the year ended December 31, 2023 (in thousands).
80
CAPSTAR FINANCIAL HOLDINGS INC. & SUBSIDIARY
Notes to Consolidated Financial Statements
|
|
Weighted-Average |
|
Weighted-Average |
|
|
Payment |
|
Term |
|
|
Delay |
|
Extension |
Commercial and industrial |
|
|
||
Total |
|
|
Upon the Company's determination that a modified loan has subsequently been deemed uncollectible, the loan is written off. Therefore, the recorded investment of the loan is reduced by the uncollectible amount and the allowance for credit losses is adjusted by the same amount.
The following table presents collateral dependent loans, which are individually evaluated to determine expected credit losses, as of December 31, 2023 by class of loan and type of collateral.
|
|
Real Estate |
|
|
Total |
|
||
Commercial real estate - non-owner occupied |
|
$ |
|
|
$ |
|
||
Consumer |
|
|
|
|
|
|
||
Commercial and industrial |
|
|
|
|
|
|
||
Other |
|
|
|
|
|
|
||
Total |
|
$ |
|
|
$ |
|
||
Allowance for Credit Losses
The following table details the changes in the ACL for the years ended December 31, 2023, 2022, and 2021 (in thousands):
|
|
CECL |
|
|||||||||||||||||||||||||
For the year ended December 31, |
|
2023 |
|
|||||||||||||||||||||||||
|
|
Beginning Balance |
|
|
Adoption of CECL |
|
|
Jan. 1, 2023 |
|
|
Charge-Offs |
|
|
Recoveries |
|
|
Provision |
|
|
Ending Balance |
|
|||||||
Commercial real estate - owner occupied |
|
$ |
|
|
$ |
|
|
$ |
|
|
$ |
|
|
$ |
|
|
$ |
|
|
$ |
|
|||||||
Commercial real estate - non-owner occupied |
|
|
|
|
|
( |
) |
|
|
|
|
|
|
|
|
|
|
|
|
|
|
|
||||||
Consumer real estate |
|
|
|
|
|
|
|
|
|
|
|
( |
) |
|
|
|
|
|
|
|
|
|
||||||
Construction and land development |
|
|
|
|
|
( |
) |
|
|
|
|
|
|
|
|
|
|
|
( |
) |
|
|
|
|||||
Commercial and industrial |
|
|
|
|
|
( |
) |
|
|
|
|
|
( |
) |
|
|
|
|
|
|
|
|
|
|||||
Consumer |
|
|
|
|
|
|
|
|
|
|
|
( |
) |
|
|
|
|
|
|
|
|
|
||||||
Other |
|
|
|
|
|
|
|
|
|
|
|
( |
) |
|
|
|
|
|
( |
) |
|
|
|
|||||
Total |
|
$ |
|
|
$ |
|
|
$ |
|
|
$ |
( |
) |
|
$ |
|
|
$ |
( |
) |
|
$ |
|
|||||
|
|
|
|
|
|
|
|
|
|
|
|
|
|
|
|
|
|
|
|
|
|
|||||||
Allowance for credit losses - unfunded commitments |
|
$ |
|
|
$ |
|
|
$ |
|
|
$ |
|
|
$ |
|
|
$ |
( |
) |
|
$ |
|
||||||
81
CAPSTAR FINANCIAL HOLDINGS INC. & SUBSIDIARY
Notes to Consolidated Financial Statements
|
|
Incurred Loss |
|
|
Incurred Loss |
|
||||||||||||||||||||||||||||||||||
For the years ended December 31, |
|
2022 |
|
|
2021 |
|
||||||||||||||||||||||||||||||||||
|
|
Beginning Balance |
|
|
Charge-Offs |
|
|
Recoveries |
|
|
Provision |
|
|
Ending Balance |
|
|
Beginning Balance |
|
|
Charge-Offs |
|
|
Recoveries |
|
|
Provision |
|
|
Ending Balance |
|
||||||||||
Commercial real estate - owner occupied |
|
$ |
|
|
$ |
|
|
$ |
|
|
$ |
|
|
$ |
|
|
$ |
|
|
$ |
|
|
$ |
|
|
$ |
|
|
$ |
|
||||||||||
Commercial real estate - non-owner occupied |
|
|
|
|
|
( |
) |
|
|
|
|
|
|
|
|
|
|
|
|
|
|
( |
) |
|
|
|
|
|
( |
) |
|
|
|
|||||||
Consumer real estate |
|
|
|
|
|
( |
) |
|
|
|
|
|
|
|
|
|
|
|
|
|
|
( |
) |
|
|
|
|
|
|
|
|
|
||||||||
Construction and land development |
|
|
|
|
|
|
|
|
|
|
|
|
|
|
|
|
|
|
|
|
|
|
|
|
|
|
|
|
|
|
||||||||||
Commercial and industrial |
|
|
|
|
|
( |
) |
|
|
|
|
|
|
|
|
|
|
|
|
|
|
( |
) |
|
|
|
|
|
( |
) |
|
|
|
|||||||
Consumer |
|
|
|
|
|
( |
) |
|
|
|
|
|
|
|
|
|
|
|
|
|
|
( |
) |
|
|
|
|
|
|
|
|
|
||||||||
Other |
|
|
|
|
|
( |
) |
|
|
|
|
|
|
|
|
|
|
|
|
|
|
( |
) |
|
|
|
|
|
|
|
|
|
||||||||
Total |
|
$ |
|
|
$ |
( |
) |
|
$ |
|
|
$ |
|
|
$ |
|
|
$ |
|
|
$ |
( |
) |
|
$ |
|
|
$ |
( |
) |
|
$ |
|
|||||||
|
|
|
|
|
|
|
|
|
|
|
|
|
|
|
|
|
|
|
|
|
|
|
|
|
|
|
|
|
|
|
||||||||||
Allowance for credit losses - unfunded commitments |
|
$ |
|
|
$ |
|
|
$ |
|
|
$ |
|
|
$ |
|
|
$ |
|
|
$ |
|
|
$ |
|
|
$ |
|
|
$ |
|
||||||||||
As of December 31, 2023, the Company used a one-year reasonable and supportable forecast period. The changes in loss rates used as the basis for the estimate of credit losses during this period were modeled using both the Company's own historical data and from peer banks and macroeconomic forecast data obtained from a third party vendor. The decrease in the ACL compared to January 1, 2023 was primarily attributable to a decrease in the loan portfolio, changes in various loan attributes at the instrument level, and an improvement in forecasted losses based on forecasted improvements in unemployment rates. For periods beyond the reasonable and supportable forecast period of one year, the Company reverted to historical credit loss information on a straight line basis over one year.
The Company maintains an allowance for unfunded commitments exposures. The allowance for unfunded commitments credit exposures is adjusted as a provision for credit loss expense. The estimate includes consideration of the likelihood that funding will occur, which is based on a historical funding study derived from internal information, and an estimate of expected credit losses on commitments expected to be funded over its estimated life, which are the same loss rates that are used in computing the allowance for credit losses on loans. The decrease in the ACL for unfunded loan commitments compared to January 1, 2023 was attributable to a decline in unfunded loan commitment balances. The ACL for unfunded loan commitments of $
The following table presents the allocation of the ACL for each respective loan category with the corresponding percentage of loans in each category to total loans, net of deferred fees as of December 31, 2023, 2022, and 2021.
|
|
December 31, 2023 |
|
|
December 31, 2022 |
|
||||||||||
|
|
Amount |
|
|
Percent of total |
|
|
Amount |
|
|
Percent of total |
|
||||
Commercial real estate - owner occupied |
|
$ |
|
|
|
% |
|
$ |
|
|
|
% |
||||
Commercial real estate - non-owner occupied |
|
|
|
|
|
|
|
|
|
|
|
|
||||
Consumer real estate |
|
|
|
|
|
|
|
|
|
|
|
|
||||
Construction and land development |
|
|
|
|
|
|
|
|
|
|
|
|
||||
Commercial and industrial |
|
|
|
|
|
|
|
|
|
|
|
|
||||
Consumer |
|
|
|
|
|
|
|
|
|
|
|
|
||||
Other |
|
|
|
|
|
|
|
|
|
|
|
|
||||
Total allowance for credit losses |
|
$ |
|
|
|
% |
|
$ |
|
|
|
% |
||||
Incurred Loss Impairment Methodology
82
CAPSTAR FINANCIAL HOLDINGS INC. & SUBSIDIARY
Notes to Consolidated Financial Statements
A breakdown of the ALL and the loan portfolio by loan category at December 31, 2022 follows (in thousands):
|
|
Commercial real estate - owner occupied |
|
|
Commercial real estate - non-owner occupied |
|
|
Consumer |
|
|
Construction |
|
|
Commercial |
|
|
Consumer |
|
|
Other |
|
|
Total |
|
||||||||
December 31, 2022 |
|
|
|
|
|
|
|
|
|
|
|
|
|
|
|
|
|
|
|
|
|
|
|
|
||||||||
Allowance for Loan Losses: |
|
|
|
|
|
|
|
|
|
|
|
|
|
|
|
|
|
|
|
|
|
|
|
|
||||||||
Collectively evaluated for impairment |
|
$ |
|
|
$ |
|
|
$ |
|
|
$ |
|
|
$ |
|
|
$ |
|
|
$ |
|
|
$ |
|
||||||||
Individually evaluated for impairment |
|
|
— |
|
|
|
— |
|
|
|
— |
|
|
|
— |
|
|
|
|
|
|
— |
|
|
|
— |
|
|
|
|
||
Purchased credit impaired |
|
|
— |
|
|
|
— |
|
|
|
— |
|
|
|
— |
|
|
|
|
|
|
|
|
|
— |
|
|
|
|
|||
Balances, end of period |
|
$ |
|
|
$ |
|
|
$ |
|
|
$ |
|
|
$ |
|
|
$ |
|
|
$ |
|
|
$ |
|
||||||||
Loans: |
|
|
|
|
|
|
|
|
|
|
|
|
|
|
|
|
|
|
|
|
|
|
|
|
||||||||
Collectively evaluated for impairment |
|
$ |
|
|
$ |
|
|
$ |
|
|
$ |
|
|
$ |
|
|
$ |
|
|
$ |
|
|
$ |
|
||||||||
Individually evaluated for impairment |
|
|
|
|
|
— |
|
|
|
|
|
|
|
|
|
|
|
|
|
|
|
— |
|
|
|
|
||||||
Purchased credit impaired |
|
|
|
|
|
|
|
|
|
|
|
|
|
|
|
|
|
|
|
|
|
|
|
|
||||||||
Balances, end of period |
|
$ |
|
|
$ |
|
|
$ |
|
|
$ |
|
|
$ |
|
|
$ |
|
|
$ |
|
|
$ |
|
||||||||
The following table presents additional detail on loans individually evaluated for impairment as previously required by ASC Topic 310 as of December 31, 2022 (in thousands):
|
|
December 31, 2022 |
|
|||||||||
|
|
Recorded |
|
|
Unpaid |
|
|
Related |
|
|||
With no related allowance recorded: |
|
|
|
|
|
|
|
|
|
|||
Commercial real estate - owner occupied |
|
$ |
|
|
$ |
|
|
$ |
— |
|
||
Commercial real estate - non-owner occupied |
|
|
|
|
|
|
|
|
— |
|
||
Consumer real estate |
|
|
|
|
|
|
|
|
— |
|
||
Construction and land development |
|
|
|
|
|
|
|
|
— |
|
||
Commercial and industrial |
|
|
|
|
|
|
|
|
— |
|
||
Consumer |
|
|
|
|
|
|
|
|
— |
|
||
Other |
|
|
— |
|
|
|
— |
|
|
|
— |
|
Subtotal |
|
|
|
|
|
|
|
|
— |
|
||
With an allowance recorded: |
|
|
|
|
|
|
|
|
|
|||
Commercial real estate - owner occupied |
|
|
— |
|
|
|
— |
|
|
|
— |
|
Commercial real estate - non-owner occupied |
|
|
— |
|
|
|
|
|
|
|
||
Consumer real estate |
|
|
— |
|
|
|
— |
|
|
|
— |
|
Construction and land development |
|
|
— |
|
|
|
— |
|
|
|
— |
|
Commercial and industrial |
|
|
|
|
|
|
|
|
|
|||
Consumer |
|
|
— |
|
|
|
— |
|
|
|
— |
|
Other |
|
|
— |
|
|
|
— |
|
|
|
— |
|
Subtotal |
|
|
|
|
|
|
|
|
|
|||
Total |
|
$ |
|
|
$ |
|
|
$ |
|
|||
The recorded investment in loans excludes accrued interest receivable and loan origination fees, net due to immateriality. For purposes of this disclosure, the unpaid principal balance is not reduced for partial charge-offs.
83
CAPSTAR FINANCIAL HOLDINGS INC. & SUBSIDIARY
Notes to Consolidated Financial Statements
The average balances of impaired loans and income recognized on impaired loans while they were considered impaired under the Incurred Loss methodology are below for the years ended December 31, 2022 and 2021 (in thousands):
|
|
December 31, 2022 |
|
|
December 31, 2021 |
|
||||||||||
|
|
Average recorded investment |
|
|
Interest income recognized |
|
|
Average recorded investment |
|
|
Interest income recognized |
|
||||
With no related allowance recorded: |
|
|
|
|
|
|
|
|
|
|
|
|
||||
Commercial real estate - owner occupied |
|
$ |
|
|
$ |
|
|
$ |
|
|
$ |
|
||||
Commercial real estate - non-owner occupied |
|
|
— |
|
|
|
— |
|
|
|
— |
|
|
|
— |
|
Consumer real estate |
|
|
|
|
|
|
|
|
|
|
|
|
||||
Construction and land development |
|
|
|
|
|
— |
|
|
|
|
|
|
|
|||
Commercial and industrial |
|
|
|
|
|
|
|
|
|
|
|
|
||||
Consumer |
|
|
|
|
|
|
|
|
|
|
|
|
||||
Other |
|
|
— |
|
|
|
— |
|
|
|
— |
|
|
|
— |
|
Subtotal |
|
|
|
|
|
|
|
|
|
|
|
|
||||
With an allowance recorded: |
|
|
|
|
|
|
|
|
|
|
|
|
||||
Commercial real estate - owner occupied |
|
|
— |
|
|
|
— |
|
|
|
— |
|
|
|
— |
|
Commercial real estate - non-owner occupied |
|
|
— |
|
|
|
|
|
|
|
|
|
|
|||
Consumer real estate |
|
|
— |
|
|
|
— |
|
|
|
— |
|
|
|
— |
|
Construction and land development |
|
|
— |
|
|
|
— |
|
|
|
— |
|
|
|
— |
|
Commercial and industrial |
|
|
|
|
|
|
|
|
— |
|
|
|
— |
|
||
Consumer |
|
|
— |
|
|
|
— |
|
|
|
— |
|
|
|
— |
|
Other |
|
|
— |
|
|
|
— |
|
|
|
— |
|
|
|
— |
|
Subtotal |
|
|
|
|
|
|
|
|
|
|
|
— |
|
|||
Total |
|
$ |
|
|
$ |
|
|
$ |
|
|
$ |
|
||||
There was
Troubled Debt Restructurings
As of December 31, 2022 the Company had recorded investments in troubled debt restructurings ("TDRs") of $
84
CAPSTAR FINANCIAL HOLDINGS INC. & SUBSIDIARY
Notes to Consolidated Financial Statements
The following table presents loans by class modified as TDR that occurred during the year ended December 31, 2022 (in thousands).
|
|
Number of contracts |
|
|
Pre modification outstanding recorded investment |
|
|
Post modification outstanding recorded investment, net of related allowance |
|
|||
2022 |
|
|
|
|
|
|
|
|
|
|||
Commercial real estate |
|
|
— |
|
|
$ |
— |
|
|
$ |
— |
|
Consumer real estate |
|
|
|
|
|
|
|
|
|
|||
Construction and land development |
|
|
— |
|
|
|
— |
|
|
|
— |
|
Commercial and industrial |
|
|
|
|
|
|
|
|
|
|||
Consumer |
|
|
— |
|
|
|
— |
|
|
|
— |
|
Other |
|
|
— |
|
|
|
— |
|
|
|
— |
|
Total |
|
|
|
|
|
|
|
|
|
|||
Acquired Loans
The following table presents changes in the carrying value of PCI loans for the year ended December 31, 2022 and 2021 (in thousands):
|
|
Year Ended December 31, 2022 |
|
|
Year Ended December 31, 2021 |
|
||
Balance at beginning of period |
|
$ |
|
|
$ |
|
||
Change due to payments received and accretion |
|
|
( |
) |
|
|
( |
) |
Reclassification of discount to allowance for loan losses |
|
|
( |
) |
|
|
( |
) |
Balance at end of period |
|
$ |
|
|
$ |
|
||
The following table presents changes in the accretable yield for PCI loans for the year ended December 31, 2022 and 2021 (in thousands):
|
|
Year Ended December 31, 2022 |
|
|
Year Ended December 31, 2021 |
|
||
Balance at beginning of period |
|
$ |
|
|
$ |
|
||
Accretion |
|
|
( |
) |
|
|
( |
) |
Reclassification from nonaccretable difference |
|
|
|
|
|
|
||
Other, net |
|
|
( |
) |
|
|
|
|
Balance at end of period |
|
$ |
|
|
$ |
|
||
PCI loans had a $
85
CAPSTAR FINANCIAL HOLDINGS INC. & SUBSIDIARY
Notes to Consolidated Financial Statements
NOTE 5 – LOAN SERVICING
Mortgage loans serviced for the Federal Home Loan Mortgage Corporation (“FHLMC”) and SBA loans serviced for others are not reported as assets. The principal balance of these loans at December 31, 2023 and 2022 was $
Activity for loan servicing rights and the related valuation allowance are summarized as follows (in thousands):
|
For the year ended December 31, 2023 |
|
|
For the year ended December 31, 2022 |
|
|
For the year ended December 31, 2021 |
|
|||
Loan servicing rights: |
|
|
|
|
|
|
|
|
|||
Balance at beginning of period |
$ |
|
|
$ |
|
|
$ |
|
|||
Additions |
|
|
|
|
|
|
|
|
|||
Amortized to offset other noninterest income |
|
( |
) |
|
|
( |
) |
|
|
( |
) |
Balance at end of period |
$ |
|
|
$ |
|
|
$ |
|
|||
|
|
|
|
|
|
|
|
|
|||
Valuation allowance: |
|
|
|
|
|
|
|
|
|||
Balance at beginning of period |
$ |
( |
) |
|
$ |
( |
) |
|
$ |
( |
) |
Additions expensed |
|
— |
|
|
|
— |
|
|
|
— |
|
Reductions credited to other noninterest income |
|
|
|
|
|
|
|
|
|||
Direct write-downs |
|
|
|
|
|
|
|
|
|||
Other |
|
( |
) |
|
|
|
|
|
|
||
Balance at end of period |
$ |
( |
) |
|
$ |
( |
) |
|
$ |
( |
) |
NOTE 6 – PREMISES AND EQUIPMENT
Premises and equipment at December 31, 2023 and 2022 are summarized as follows (in thousands):
|
|
Range of |
|
December 31, 2023 |
|
|
December 31, 2022 |
|
||
Land |
|
Not applicable |
|
$ |
|
|
$ |
|
||
Buildings |
|
|
|
|
|
|
|
|||
Leasehold improvements |
|
|
|
|
|
|
|
|||
Furniture and equipment |
|
|
|
|
|
|
|
|||
Fixed assets in process |
|
Not applicable |
|
|
|
|
|
|
||
|
|
|
|
|
|
|
|
|
||
Less accumulated depreciation and amortization |
|
|
|
|
( |
) |
|
|
( |
) |
|
|
|
|
$ |
|
|
$ |
|
||
Premises and equipment depreciation and amortization expense for the years ended December 31, 2023, 2022 and 2021 totaled $
NOTE 7 – LEASES
The Company leases certain premises and equipment under operating leases that expire at various dates, through
Lease costs were as follows (in thousands):
|
|
December 31, 2023 |
|
|
December 31, 2022 |
|
|
December 31, 2021 |
|
|||
Operating lease cost |
|
$ |
|
|
$ |
|
|
$ |
|
|||
Short-term lease cost |
|
|
|
|
|
|
|
|
|
|||
Total lease cost |
|
$ |
|
|
$ |
|
|
$ |
|
|||
86
CAPSTAR FINANCIAL HOLDINGS INC. & SUBSIDIARY
Notes to Consolidated Financial Statements
There were
A maturity analysis of operating lease liabilities and reconciliation of the undiscounted cash flows to the total operating lease liability is as follows (in thousands):
|
|
December 31, 2023 |
|
|
Lease payments due: |
|
|
|
|
2024 |
|
$ |
|
|
2025 |
|
|
|
|
2026 |
|
|
|
|
2027 |
|
|
|
|
2028 |
|
|
|
|
2029 and thereafter |
|
|
|
|
Total undiscounted cash flows |
|
|
|
|
Discount on cash flows |
|
|
( |
) |
Total lease liability |
|
$ |
|
|
NOTE 8 – GOODWILL AND INTANGIBLE ASSETS
Goodwill
The change in goodwill during the years ended December 31, 2023 and 2022 was as follows (in thousands):
|
|
2023 |
|
|
2022 |
|
||
Beginning of year |
|
$ |
|
|
$ |
|
||
Acquired goodwill |
|
|
|
|
|
|
||
Impairment |
|
|
|
|
|
|
||
End of year |
|
$ |
|
|
$ |
|
||
Acquired Intangible Assets
Acquired intangible assets at December 31, 2023 and 2022 were as follows (in thousands):
|
|
December 31, 2023 |
|
|
December 31, 2022 |
|
||||||||||
|
|
Gross |
|
|
Accumulated |
|
|
Gross |
|
|
Accumulated |
|
||||
Amortized intangible assets: |
|
|
|
|
|
|
|
|
|
|
|
|
||||
Core deposit intangibles |
|
$ |
|
|
$ |
( |
) |
|
$ |
|
|
$ |
( |
) |
||
For the years ended December 31, 2023, 2022 and 2021, amortization expense was $
Estimated amortization expense for each of the next five years is as follows (in thousands):
Year ending December 31: |
|
|
|
|
2024 |
|
$ |
|
|
2025 |
|
|
|
|
2026 |
|
|
|
|
2027 |
|
|
|
|
2028 |
|
|
|
|
Thereafter |
|
|
|
|
Total |
|
$ |
|
|
87
CAPSTAR FINANCIAL HOLDINGS INC. & SUBSIDIARY
Notes to Consolidated Financial Statements
NOTE 9 – OTHER REAL ESTATE OWNED
Other real estate owned activity was as follows (in thousands):
|
|
2023 |
|
|
2022 |
|
|
2021 |
|
|||
Beginning balance |
|
$ |
|
|
$ |
|
|
$ |
|
|||
Loans transferred to other real estate owned |
|
|
|
|
|
|
|
|
|
|||
Sales of other real estate owned |
|
|
|
|
|
( |
) |
|
|
( |
) |
|
End of year |
|
$ |
|
|
$ |
|
|
$ |
|
|||
There was
(Income) expenses
|
|
2023 |
|
|
2022 |
|
|
2021 |
|
|||
Net gain on sales |
|
$ |
|
|
$ |
( |
) |
|
$ |
( |
) |
|
Total |
|
$ |
|
|
$ |
( |
) |
|
$ |
( |
) |
|
NOTE 10 – DEPOSITS
Time deposits that exceed the FDIC deposit insurance limit of $
Scheduled maturities of time deposits for the next five years and thereafter are as follows (in thousands):
Maturity: |
|
|
|
|
2024 |
|
$ |
|
|
2025 |
|
|
|
|
2026 |
|
|
|
|
2027 |
|
|
|
|
2028 |
|
|
|
|
Thereafter |
|
|
|
|
|
|
$ |
|
|
Included in time deposits are brokered certificates of deposit of $
NOTE 11 – SHORT-TERM BORROWINGS AND LONG-TERM DEBT
Short-Term Borrowings
The Company had short-term borrowings from the FHLB totaling $
The following is a summary of the contractual maturities and average effective rates of outstanding advances (dollars in thousands):
|
|
December 31, 2023 |
|
|
December 31, 2022 |
|
||||||||||
Year |
|
Amount |
|
|
Interest Rates |
|
|
Amount |
|
|
Interest Rates |
|
||||
2023 |
|
$ |
|
|
|
|
|
$ |
|
|
|
% |
||||
2024 |
|
|
|
|
|
% |
|
|
|
|
|
|
||||
Total |
|
$ |
|
|
|
% |
|
$ |
|
|
|
% |
||||
88
CAPSTAR FINANCIAL HOLDINGS INC. & SUBSIDIARY
Notes to Consolidated Financial Statements
Advances from the FHLB are collateralized by investment securities with a market value of $
Subordinated Notes
The Company issued $
NOTE 12 – ACCUMULATED OTHER COMPREHENSIVE INCOME (LOSS)
The following were changes in accumulated other comprehensive income (loss) by component, net of tax, for the years ended December 31, 2023 and 2022 (in thousands):
|
|
Unrealized Gains |
|
|
|
|
and Losses |
|
|
|
|
on Available |
|
|
|
|
for Sale |
|
|
|
|
Securities |
|
|
Year Ended December 31, 2023 |
|
|
|
|
Beginning balance |
|
$ |
( |
) |
Other comprehensive income before reclassification, net of tax |
|
|
|
|
Amounts reclassified from accumulated other comprehensive loss, net of tax |
|
|
( |
) |
Net current period other comprehensive income |
|
|
|
|
Ending balance |
|
$ |
( |
) |
|
|
|
|
|
Year Ended December 31, 2022 |
|
|
|
|
Beginning balance |
|
$ |
( |
) |
Other comprehensive loss before reclassification, net of tax |
|
|
( |
) |
Amounts reclassified from accumulated other comprehensive loss, net of tax |
|
|
( |
) |
Net current period other comprehensive loss |
|
|
( |
) |
Ending balance |
|
$ |
( |
) |
|
|
|
|
|
Year Ended December 31, 2021 |
|
|
|
|
Beginning balance |
|
$ |
|
|
Other comprehensive loss before reclassification, net of tax |
|
|
( |
) |
Amounts reclassified from accumulated other comprehensive loss, net of tax |
|
|
( |
) |
Net current period other comprehensive loss |
|
|
( |
) |
Ending balance |
|
$ |
( |
) |
89
CAPSTAR FINANCIAL HOLDINGS INC. & SUBSIDIARY
Notes to Consolidated Financial Statements
The following were amounts reclassified out of each component of accumulated other comprehensive income (loss) for the years ended December 31, 2023, 2022 and 2021 (in thousands):
|
|
|
|
|
|
|
|
|
|
|
Affected Line Item |
|||
Details about Accumulated Other |
|
Year Ended December 31, |
|
|
in the Statement Where |
|||||||||
Comprehensive Income (Loss) Components |
|
2023 |
|
|
2022 |
|
|
2021 |
|
|
Net Income is Presented |
|||
Realized gains on available- for-sale securities |
|
$ |
|
|
$ |
|
|
$ |
|
|
Net gain on sale of securities |
|||
|
|
|
( |
) |
|
|
( |
) |
|
|
( |
) |
|
Income tax expense |
|
|
$ |
|
|
$ |
|
|
$ |
|
|
Net of tax |
|||
There were
NOTE 13 – INCOME TAXES
The components of income tax expense are summarized as follows (in thousands):
|
|
2023 |
|
|
2022 |
|
|
2021 |
|
|||
Current: |
|
|
|
|
|
|
|
|
|
|||
Federal |
|
$ |
|
|
$ |
|
|
$ |
|
|||
State |
|
|
|
|
|
|
|
|
|
|||
|
|
|
|
|
|
|
|
|
|
|||
Deferred: |
|
|
|
|
|
|
|
|
|
|||
Federal |
|
|
|
|
|
|
|
|
( |
) |
||
State |
|
|
( |
) |
|
|
|
|
|
( |
) |
|
|
|
|
|
|
|
|
|
|
( |
) |
||
Total |
|
$ |
|
|
$ |
|
|
$ |
|
|||
A reconciliation of actual income tax expense in the financial statements to the “expected” tax expense (computed by applying the statutory federal income tax rate of
|
|
2023 |
|
|
2022 |
|
|
2021 |
|
|||
Computed tax expense at statutory rate |
|
$ |
|
|
$ |
|
|
$ |
|
|||
State income taxes, net of effect of federal income |
|
|
( |
) |
|
|
|
|
|
|
||
Tax-exempt interest income |
|
|
( |
) |
|
|
( |
) |
|
|
( |
) |
Earnings on bank owned life insurance contracts |
|
|
( |
) |
|
|
( |
) |
|
|
( |
) |
Disallowed expenses |
|
|
|
|
|
|
|
|
|
|||
Excess tax (benefit) expense related to stock compensation |
|
|
|
|
|
( |
) |
|
|
( |
) |
|
Nondeductible acquisition related expenses |
|
|
|
|
|
|
|
|
|
|||
Federal tax credits |
|
|
( |
) |
|
|
( |
) |
|
|
( |
) |
Amortization of investment in low-income housing credits |
|
|
|
|
|
|
|
|
|
|||
Other |
|
|
( |
) |
|
|
|
|
|
|
||
Total |
|
$ |
|
|
$ |
|
|
$ |
|
|||
The effective tax rate compared favorably to the statutory federal rate of
90
CAPSTAR FINANCIAL HOLDINGS INC. & SUBSIDIARY
Notes to Consolidated Financial Statements
Significant items that gave rise to deferred taxes at December 31, 2023 and 2022 were as follows (in thousands):
|
|
December 31, 2023 |
|
|
December 31, 2022 |
|
||
Deferred tax assets: |
|
|
|
|
|
|
||
Allowance for loan losses |
|
$ |
|
|
$ |
|
||
Net operating loss carryforward |
|
|
|
|
|
|
||
Organization and preopening costs |
|
|
|
|
|
|
||
Stock-based compensation |
|
|
|
|
|
|
||
Acquired loans |
|
|
|
|
|
|
||
Accrued contributions |
|
|
|
|
|
|
||
Lease liability |
|
|
|
|
|
( |
) |
|
Acquired deposits |
|
|
|
|
|
|
||
Accrued compensation |
|
|
|
|
|
|
||
Deferred loan fees |
|
|
|
|
|
|
||
Unrealized loss on securities available for sale |
|
|
|
|
|
|
||
Contingency reserve |
|
|
|
|
|
|
||
Other |
|
|
|
|
|
|
||
Deferred tax assets |
|
|
|
|
|
|
||
Deferred tax liabilities: |
|
|
|
|
|
|
||
Depreciation |
|
|
|
|
|
|
||
Goodwill |
|
|
|
|
|
|
||
Right of use asset |
|
|
|
|
|
( |
) |
|
Partnership investments |
|
|
|
|
|
|
||
Amortization of core deposit intangible |
|
|
|
|
|
|
||
Other acquired assets |
|
|
|
|
|
|
||
Other |
|
|
|
|
|
|
||
Deferred tax liabilities |
|
|
|
|
|
|
||
Net deferred tax asset |
|
$ |
|
|
$ |
|
||
At December 31, 2023, the Company had federal net operating loss carryforwards of approximately $
There were
NOTE 14 – COMMITMENTS AND CONTINGENCIES
In the normal course of business, the Company has outstanding commitments and contingent liabilities, such as commitments to extend credit and standby letters of credit, which are not included in the accompanying financial statements. The Company’s exposure to credit loss in the event of nonperformance by the other party to the financial instruments for commitments to extend credit and standby letters of credit is represented by the contractual or notional amount of those instruments. The Company uses the same credit policies in making such commitments as it does for instruments that are included in the balance sheet.
The following table sets forth outstanding financial instruments whose contract amounts represent credit risk as of December 31, 2023 and 2022 (in thousands):
|
|
Contract or notional amount |
|
|||||
|
|
December 31, 2023 |
|
|
December 31, 2022 |
|
||
Financial instruments whose contract amounts represent |
|
|
|
|
|
|
||
Unused commitments to extend credit |
|
$ |
|
|
$ |
|
||
Standby letters of credit |
|
|
|
|
|
|
||
Total |
|
$ |
|
|
$ |
|
||
The Company is party to litigation and claims arising in the normal course of business. Management believes that the liabilities, if any, arising from such litigation and claims as of December 31, 2023, will not have a material impact on the financial statements of the Company.
91
CAPSTAR FINANCIAL HOLDINGS INC. & SUBSIDIARY
Notes to Consolidated Financial Statements
The Company was notified of a potential operational loss in the amount of $
NOTE 15 – CONCENTRATION OF CREDIT RISK
Substantially all of the Company’s loans, commitments, and standby letters of credit have been granted to customers in the Company’s market areas. The concentrations of credit by type of loan are set forth in Note 4 to the financial statements.
As of December 31, 2023 and 2022, the Company’s cash and due from banks, federal funds sold and interest-bearing deposits in financial institutions aggregated $
NOTE 16 – REGULATORY MATTERS AND RESTRICTIONS ON DIVIDENDS
The Company and the Bank are subject to regulatory capital requirements administered by the Federal Reserve and the Bank is also subject to the regulatory capital requirements of the Tennessee Department of Financial Institutions. Failure to meet capital requirements can initiate certain mandatory – and possibly additional discretionary – actions by regulators that could, in that event, have a material adverse effect on the institutions’ financial statements. The relevant regulations require the Company and the Bank to meet specific capital adequacy guidelines that involve quantitative measures of their assets, liabilities and certain off-balance-sheet items as calculated under regulatory accounting principles. The capital classifications of the Company and the Bank are also subject to qualitative judgments by their regulators about components, risk weightings, and other factors. Those qualitative judgments could also affect the capital status of the Company and the Bank and the amount of dividends the Company and the Bank may distribute. The final rules implementing the Basel Committee on Banking Supervision’s capital guidelines for U.S. Banks (Basel III rules) became effective for the Company on January 1, 2015 with full compliance with all of the requirements being phased in over a multi-year schedule, and fully phased in by January 1, 2019. The net unrealized gain or loss on available for sale securities is not included in computing regulatory capital. Management believes as of December 31, 2023, the Company and the Bank met all regulatory capital adequacy requirements to which they are subject.
The Federal Deposit Insurance Corporation Improvement Act of 1991 establishes a system of “prompt corrective action” to resolve the problems of undercapitalized insured depository institutions. Under this system, federal banking regulators have established
At December 31, 2023 and 2022, the Company and the Bank were well capitalized under the regulatory framework for prompt corrective action. There have been no conditions or events subsequent to December 31, 2023 that management believes have changed the Company’s or the Bank’s category.
92
CAPSTAR FINANCIAL HOLDINGS INC. & SUBSIDIARY
Notes to Consolidated Financial Statements
The Company’s and the Bank’s capital amounts and ratios are presented in the following table (dollars in thousands):
|
|
Actual |
|
|
Minimum capital |
|
|
Minimum to be |
|
|||||||||||||||
|
|
Amount |
|
|
Ratio |
|
|
Amount |
|
|
Ratio |
|
|
Amount |
|
|
Ratio |
|
||||||
At December 31, 2023: |
|
|
|
|
|
|
|
|
|
|
|
|
|
|
|
|
|
|
||||||
Total capital to risk-weighted assets: |
|
|
|
|
|
|
|
|
|
|
|
|
|
|
|
|
|
|
||||||
CapStar Financial Holdings, Inc. |
|
$ |
|
|
|
% |
|
$ |
|
|
|
% |
|
N/A |
|
|
N/A |
|
||||||
CapStar Bank |
|
|
|
|
|
|
|
|
|
|
|
|
|
$ |
|
|
|
% |
||||||
Tier I capital to risk-weighted assets: |
|
|
|
|
|
|
|
|
|
|
|
|
|
|
|
|
|
|
||||||
CapStar Financial Holdings, Inc. |
|
|
|
|
|
|
|
|
|
|
|
|
|
N/A |
|
|
N/A |
|
||||||
CapStar Bank |
|
|
|
|
|
|
|
|
|
|
|
|
|
|
|
|
|
|
||||||
Common equity Tier 1 capital to risk weighted |
|
|
|
|
|
|
|
|
|
|
|
|
|
|
|
|
|
|
||||||
CapStar Financial Holdings, Inc. |
|
|
|
|
|
|
|
|
|
|
|
|
|
N/A |
|
|
N/A |
|
||||||
CapStar Bank |
|
|
|
|
|
|
|
|
|
|
|
|
|
|
|
|
|
|
||||||
Tier I capital to average assets: |
|
|
|
|
|
|
|
|
|
|
|
|
|
|
|
|
|
|
||||||
CapStar Financial Holdings, Inc. |
|
|
|
|
|
|
|
|
|
|
|
|
|
N/A |
|
|
N/A |
|
||||||
CapStar Bank |
|
|
|
|
|
|
|
|
|
|
|
|
|
|
|
|
|
|
||||||
|
|
|
|
|
|
|
|
|
|
|
|
|
|
|
|
|
|
|
||||||
At December 31, 2022: |
|
|
|
|
|
|
|
|
|
|
|
|
|
|
|
|
|
|
||||||
Total capital to risk-weighted assets: |
|
|
|
|
|
|
|
|
|
|
|
|
|
|
|
|
|
|
||||||
CapStar Financial Holdings, Inc. |
|
$ |
|
|
|
% |
|
$ |
|
|
|
% |
|
N/A |
|
|
N/A |
|
||||||
CapStar Bank |
|
|
|
|
|
|
|
|
|
|
|
|
|
$ |
|
|
|
% |
||||||
Tier I capital to risk-weighted assets: |
|
|
|
|
|
|
|
|
|
|
|
|
|
|
|
|
|
|
||||||
CapStar Financial Holdings, Inc. |
|
|
|
|
|
|
|
|
|
|
|
|
|
N/A |
|
|
N/A |
|
||||||
CapStar Bank |
|
|
|
|
|
|
|
|
|
|
|
|
|
|
|
|
|
|
||||||
Common equity Tier 1 capital to risk weighted |
|
|
|
|
|
|
|
|
|
|
|
|
|
|
|
|
|
|
||||||
CapStar Financial Holdings, Inc. |
|
|
|
|
|
|
|
|
|
|
|
|
|
N/A |
|
|
N/A |
|
||||||
CapStar Bank |
|
|
|
|
|
|
|
|
|
|
|
|
|
|
|
|
|
|
||||||
Tier I capital to average assets: |
|
|
|
|
|
|
|
|
|
|
|
|
|
|
|
|
|
|
||||||
CapStar Financial Holdings, Inc. |
|
|
|
|
|
|
|
|
|
|
|
|
|
N/A |
|
|
N/A |
|
||||||
CapStar Bank |
|
|
|
|
|
|
|
|
|
|
|
|
|
|
|
|
|
|
||||||
(1) |
For the calendar years 2023 and 2022, the Company was required to maintain a capital conservation buffer of Tier 1 common equity capital in excess of minimum risk-based capital ratios by at least |
(2) |
For the Company to be well-capitalized, the Bank must be well-capitalized and the Company must not be subject to any written agreement, order, capital directive, or prompt corrective action directive issued by the Federal Reserve to meet and maintain a specific capital level for any capital measure. |
Under Tennessee banking law, the Bank is subject to restrictions on the payment of dividends. Banking regulations limit the amount of dividends that may be paid without prior approval of the Tennessee Department of Financial Institutions. Under these regulations, the amount of dividends that may be paid in any calendar year without prior approval of the Tennessee Department of Financial Institutions is limited to the current year’s net income, combined with the retained net income of the preceding two years, subject to the capital requirements described above. The Bank’s payment of dividends may also be affected or limited by other factors, such as the requirement to maintain adequate capital above regulatory guidelines. The federal banking agencies have indicated that paying dividends that deplete a depository institution’s capital base to an inadequate level would be an unsafe and unsound banking practice. Under the Federal Deposit Insurance Corporation Improvement Act of 1991, a depository institution may not pay any dividends if payment would cause it to become undercapitalized or if it already is undercapitalized. Moreover, the federal agencies have issued policy statements that provide that Company holding companies and insured banks should generally only pay dividends out of current operating earnings.
93
CAPSTAR FINANCIAL HOLDINGS INC. & SUBSIDIARY
Notes to Consolidated Financial Statements
Based on these regulations, the Bank was eligible to pay $
NOTE 17 – STOCK OPTIONS AND RESTRICTED SHARES
The 2021 Stock Incentive Plan (the "Plan") provides for the grant of stock-based incentives, including stock options, restricted stock units, performance awards and restricted stock, to employees, directors and service providers that are subject to forfeiture until vesting conditions have been satisfied by the award recipient under the terms of the award. The Plan is intended to help align the interests of employees and our shareholders and reward our employees for improved Company performance. The Plan reserved
The Company has recognized stock-based compensation expense, within salaries and employee benefits for employees, and within other noninterest expense for directors, in the consolidated statements of income as follows (in thousands):
|
|
|
For the years ended December 31, |
|
|||||||||
|
|
|
2023 |
|
|
2022 |
|
|
2021 |
|
|||
Stock-based compensation expense before income taxes |
|
|
$ |
|
|
$ |
|
|
$ |
|
|||
Less: deferred tax benefit |
|
|
|
( |
) |
|
|
( |
) |
|
|
( |
) |
Reduction of net income |
|
|
$ |
|
|
$ |
|
|
$ |
|
|||
94
CAPSTAR FINANCIAL HOLDINGS INC. & SUBSIDIARY
Notes to Consolidated Financial Statements
Restricted Shares, Restricted Stock Units, and Performance Stock Units
We grant time-vested restricted stock units and performance stock units to certain key employees and directors under our stock award plan. Compensation expense is recognized over the vesting period of the awards based on the fair value of the stock at the issue date. Awards vest ratably over a , or
Performance stock units vest based upon the attainment of certain performance metrics over a
The recipients have the right to vote and receive dividends but cannot sell, transfer, assign, pledge, hypothecate, or otherwise encumber the restricted stock until the shares have vested.
|
|
|
|
|
Weighted |
|
||
|
|
|
|
|
Average |
|
||
|
|
Restricted |
|
|
Grant Date |
|
||
Nonvested Shares |
|
Shares |
|
|
Fair Value |
|
||
For the Year December 31, 2023 |
|
|
|
|
|
|
||
Nonvested at beginning of period |
|
|
|
|
$ |
|
||
Granted |
|
|
|
|
|
|
||
Vested |
|
|
( |
) |
|
|
|
|
Forfeited |
|
|
( |
) |
|
|
|
|
Nonvested at end of period |
|
|
|
|
$ |
|
||
|
|
|
|
|
|
|
||
For the Year December 31, 2022 |
|
|
|
|
|
|
||
Nonvested at beginning of period |
|
|
|
|
$ |
|
||
Granted |
|
|
|
|
|
|
||
Vested |
|
|
( |
) |
|
|
|
|
Forfeited |
|
|
( |
) |
|
|
|
|
Nonvested at end of period |
|
|
|
|
$ |
|
||
|
|
|
|
|
|
|
||
For the Year December 31, 2021 |
|
|
|
|
|
|
||
Nonvested at beginning of period |
|
|
|
|
$ |
|
||
Granted |
|
|
|
|
|
|
||
Vested |
|
|
( |
) |
|
|
|
|
Forfeited |
|
|
( |
) |
|
|
|
|
Nonvested at end of period |
|
|
|
|
$ |
|
||
As of December 31, 2023, there was $
Stock Options
Option awards are generally granted with an exercise price equal to the fair value of the Company’s common stock at the date of grant. Option awards generally have a
The fair value of each option grant is estimated on the date of grant using the Black-Scholes option pricing model that uses the assumptions noted in the table below. Expected volatility is based on calculations performed by management using industry data. The expected term of options granted was calculated using the “simplified” method for plain
95
CAPSTAR FINANCIAL HOLDINGS INC. & SUBSIDIARY
Notes to Consolidated Financial Statements
vanilla options as permitted under authoritative literature. The risk-free rate for periods within the contractual life of the option is based on the U.S. Treasury yield curve in effect at the time of grant.
There were
A summary of the activity in stock options for years ended December 31, 2023, 2022, and 2021 follows:
|
|
|
|
|
|
|
|
Weighted |
|
|||
|
|
|
|
|
Weighted |
|
|
Average |
|
|||
|
|
|
|
|
Average |
|
|
Remaining |
|
|||
|
|
|
|
|
Exercise |
|
|
Contractual |
|
|||
|
|
Shares |
|
|
Price |
|
|
Term (years) |
|
|||
Year ended December 31, 2023 |
|
|
|
|
|
|
|
|
|
|||
Outstanding at the beginning of period |
|
|
|
|
$ |
|
|
|
|
|||
Granted |
|
|
|
|
|
|
|
|
|
|||
Exercised |
|
|
( |
) |
|
|
|
|
|
|
||
Forfeited or expired |
|
|
( |
) |
|
|
|
|
|
|
||
Outstanding at end of period |
|
|
|
|
$ |
|
|
|
|
|||
Fully vested and expected to vest |
|
|
|
|
$ |
|
|
|
|
|||
Exercisable at end of period |
|
|
|
|
$ |
|
|
|
|
|||
|
|
|
|
|
|
|
|
|
|
|||
Year ended December 31, 2022 |
|
|
|
|
|
|
|
|
|
|||
Outstanding at the beginning of period |
|
|
|
|
$ |
|
|
|
|
|||
Granted |
|
|
|
|
|
|
|
|
|
|||
Exercised |
|
|
( |
) |
|
|
|
|
|
|
||
Forfeited or expired |
|
|
— |
|
|
|
|
|
|
|
||
Outstanding at end of period |
|
|
|
|
$ |
|
|
|
|
|||
Fully vested and expected to vest |
|
|
|
|
$ |
|
|
|
|
|||
Exercisable at end of period |
|
|
|
|
$ |
|
|
|
|
|||
|
|
|
|
|
|
|
|
|
|
|||
Year ended December 31, 2021 |
|
|
|
|
|
|
|
|
|
|||
Outstanding at the beginning of period |
|
|
|
|
$ |
|
|
|
|
|||
Granted |
|
|
|
|
|
|
|
|
|
|||
Exercised |
|
|
( |
) |
|
|
|
|
|
|
||
Forfeited or expired |
|
|
|
|
|
|
|
|
|
|||
Outstanding at end of period |
|
|
|
|
$ |
|
|
|
|
|||
Fully vested and expected to vest |
|
|
|
|
$ |
|
|
|
|
|||
Exercisable at end of period |
|
|
|
|
$ |
|
|
|
|
|||
Information related to stock options during 2023, 2022 and 2021 follows:
|
|
2023 |
|
|
2022 |
|
|
2021 |
|
|||
Intrinsic value of options exercised |
|
$ |
|
|
$ |
|
|
$ |
|
|||
Cash received from option exercises |
|
|
|
|
|
|
|
|
|
|||
Tax benefit realized from option exercises |
|
|
|
|
|
|
|
|
|
|||
Weighted average fair value of options granted |
|
|
|
|
|
|
|
|
|
|||
As of December 31, 2023, all compensation cost related to stock options granted under the Plan has been recognized.
NOTE 18– EMPLOYMENT CONTRACTS
The Company has entered into employment contracts with certain senior executives with various expiration dates. Most of the contracts have an option for annual renewal by mutual agreement. The agreements specify that in certain terminating events the Company will be obligated to provide certain benefits and pay each of the senior executives
96
CAPSTAR FINANCIAL HOLDINGS INC. & SUBSIDIARY
Notes to Consolidated Financial Statements
NOTE 19 – EMPLOYEE BENEFIT PLANS
The Company has a Retirement Savings 401(k) Plan in which employees may participate. The Company has elected a safe harbor 401(k) plan and as such is required to make an annual contribution of
The Company also has a Health Reimbursement Plan in place to offset the cost of healthcare deductibles for employees. At the end of the year, up to one-half of the unused balance in the employee’s account will be available for the following year up to a maximum of the deductible for that employee.
NOTE 20 – DERIVATIVE INSTRUMENTS
The Company utilizes interest rate swap agreements as part of its asset liability management strategy to help manage its interest rate risk position. The notional amount of the interest rate swaps does not represent amounts exchanged by the parties. The amount exchanged is determined by reference to the notional amount and the other terms of the individual interest rate swap agreements.
Interest Rate Swaps Designated as Cash Flow Hedges
There were
Other Interest Rate Swaps
The Company also enters into swaps to facilitate customer transactions and meet their financing needs. Upon entering into these transactions the Company enters into offsetting positions with large U.S. financial institutions in order to minimize market risk to the Company.
|
|
December 31, 2023 |
|
|
December 31, 2022 |
|
||||||||||
|
|
Notional |
|
|
Estimated |
|
|
Notional |
|
|
Estimated |
|
||||
|
|
amount |
|
|
fair value |
|
|
amount |
|
|
fair value |
|
||||
Interest rate swap agreements: |
|
|
|
|
|
|
|
|
|
|
|
|
||||
Pay fixed/receive variable swaps |
|
$ |
|
|
$ |
|
|
$ |
|
|
$ |
( |
) |
|||
Pay variable/receive fixed swaps |
|
|
|
|
|
( |
) |
|
|
|
|
|
|
|||
Total |
|
$ |
|
|
$ |
|
|
$ |
|
|
$ |
|
||||
Mortgage Banking Derivatives
The Company enters into various derivative agreements with customers in the form of interest-rate lock commitments which are commitments to originate mortgage loans whereby the interest rate on the loan is determined prior to funding and the customers have locked into that interest rate. The derivatives are valued using a model that utilizes market interest rates and other unobservable inputs. Changes in the fair value of these commitments due to fluctuations in interest rates that are to be originated to our loans held for sale portfolio are economically hedged through the use of forward sale commitments of mortgage-backed securities. The gains and losses arising from this derivative activity are reflected in current period earnings under mortgage banking income. Interest rate lock commitments are valued using a model with significant unobservable market parameters. Forward sale commitments are valued based on quoted prices for similar assets in an active market with inputs that are observable.
97
CAPSTAR FINANCIAL HOLDINGS INC. & SUBSIDIARY
Notes to Consolidated Financial Statements
The net gains (losses) relating to mortgage banking derivative instruments included in mortgage banking income were as follows (dollars in thousands):
|
|
For the Year Ended December 31, |
|
|||||||||
|
|
2023 |
|
|
2022 |
|
|
2021 |
|
|||
Mortgage loan interest rate lock commitments |
|
$ |
|
|
$ |
|
|
$ |
( |
) |
||
Mortgage-backed securities forward sales commitments |
|
|
( |
) |
|
|
( |
) |
|
|
|
|
Total |
|
$ |
|
|
$ |
|
|
$ |
( |
) |
||
The amount and fair value of mortgage banking derivatives included in the consolidated balance sheets was as follows (dollars in thousands):
|
|
December 31, 2023 |
|
|
December 31, 2022 |
|
||||||||||
|
|
Notional |
|
|
Estimated |
|
|
Notional |
|
|
Estimated |
|
||||
|
|
amount |
|
|
fair value |
|
|
amount |
|
|
fair value |
|
||||
Included in other assets: |
|
|
|
|
|
|
|
|
|
|
|
|
||||
Mortgage loan interest rate lock commitments |
|
$ |
|
|
$ |
|
|
$ |
|
|
$ |
|
||||
Mortgage-backed securities forward sales commitments |
|
|
|
|
|
|
|
|
|
|
|
|
||||
|
|
|
|
|
|
|
|
|
|
|
|
|
||||
NOTE 21 – RELATED PARTY
The Company may enter into loan transactions with certain directors, executive officers, significant shareholders, and their affiliates. Such transactions were made in the ordinary course of business on substantially the same terms, including interest rates and collateral, as those prevailing at the same time for comparable transactions with persons not affiliated with the Company, and did not, in the opinion of management, involve more than normal credit risk or present other unfavorable features.
|
|
Total |
|
|
Total funded |
|
||
Year ended December 31, 2023 |
|
|
|
|
|
|
||
Beginning of period |
|
$ |
|
|
$ |
|
||
New commitments/draw downs |
|
|
|
|
|
|
||
Repayments |
|
|
( |
) |
|
|
( |
) |
End of period |
|
$ |
|
|
$ |
|
||
|
|
|
|
|
|
|
||
Year ended December 31, 2022 |
|
|
|
|
|
|
||
Beginning of period |
|
$ |
|
|
$ |
|
||
New commitments/draw downs |
|
|
|
|
|
|
||
Repayments |
|
|
( |
) |
|
|
( |
) |
End of period |
|
$ |
|
|
$ |
|
||
Deposits from directors, executive officers, significant shareholders and their affiliates as of December 31, 2023 and 2022 were $
98
CAPSTAR FINANCIAL HOLDINGS INC. & SUBSIDIARY
Notes to Consolidated Financial Statements
NOTE 22 – FAIR VALUE
Fair value is the exchange price that would be received for an asset or paid to transfer a liability (exit price) in the principal or most advantageous market for the asset or liability in an orderly transaction between market participants on the measurement date. There are three levels of inputs that may be used to measure fair values:
Level 1: |
|
Quoted prices (unadjusted) for identical assets or liabilities in active markets that the entity has the ability to access as of the measurement date. |
|
|
|
Level 2: |
|
Significant observable inputs other than Level 1 prices, such as quoted prices for similar assets or liabilities, quoted prices in markets that are not active, or other inputs that are observable or can be corroborated by observable market data. |
|
|
|
Level 3: |
|
Significant unobservable inputs that reflect a reporting entity’s own assumptions about the assumptions that market participants would use in pricing an asset or liability. |
The Company used the following methods and significant assumptions to estimate fair value:
Investment Securities: The fair values for investment securities are determined by quoted market prices, if available (Level 1). For securities where quoted prices are not available, fair values are calculated based on market prices of similar securities (Level 2), using matrix pricing. Matrix pricing is a mathematical technique commonly used to price debt securities that are not actively traded and values debt securities by relying on quoted prices for the specific securities and the securities’ relationship to other benchmark quoted securities (Level 2 inputs). For securities where quoted prices or market prices of similar securities are not available, fair values are calculated using discounted cash flows or other market indicators (Level 3). See below for additional discussion of Level 3 valuation methodologies and significant inputs. The fair values of all securities are determined from third party pricing services without adjustment.
Derivatives-Interest Rate Swaps: The fair values of derivatives are based on valuation models using observable market data as of the measurement date (Level 2). The Company’s derivatives are traded in an over-the-counter market where quoted market prices are not always available. Therefore, the fair values of derivatives are determined using quantitative models that utilize multiple market inputs. The inputs will vary based on the type of derivative, but could include interest rates, prices and indices to generate continuous yield or pricing curves, prepayment rates, and volatility factors to value the position. The majority of market inputs are actively quoted and can be validated through external sources, including brokers, market transactions and third-party pricing services. The fair values of all interest rate swaps are determined from third party pricing services without adjustment.
Individually Evaluated Loans: The fair value of individually evaluated loans, formerly "impaired" under incurred loss methodology, with specific allocations of the ACL is generally based on recent appraisals. These appraisals may utilize a single valuation approach or a combination of approaches including comparable sales and the income approach. Adjustments are routinely made in the appraisal process by the independent appraisers to adjust for differences between the comparable sales and income data available for similar loans and collateral underlying such loans. Such adjustments result in a Level 3 classification of the inputs for determining fair value. Collateral may be valued using an appraisal, net book value per the borrower’s financial statements, or aging reports, adjusted or discounted based on management’s historical knowledge, changes in market conditions from the time of the valuation, and management’s expertise and knowledge of the client and client’s business, resulting in a Level 3 fair value classification. Individually evaluated loans are evaluated on at least a quarterly basis for additional impairment and adjusted in accordance with the loan policy.
99
CAPSTAR FINANCIAL HOLDINGS INC. & SUBSIDIARY
Notes to Consolidated Financial Statements
Other Real Estate Owned: Assets acquired through or instead of loan foreclosure are initially recorded at fair value less costs to sell when acquired, establishing a new cost basis. These assets are subsequently accounted for at lower of cost or fair value less estimated costs to sell. Fair value is commonly based on recent real estate appraisals which are updated no less frequently than annually. These appraisals may utilize a single valuation approach or a combination of approaches including comparable sales and the income approach with data from comparable properties. Adjustments are routinely made in the appraisal process by the independent appraisers to adjust for differences between the comparable sales and income data available. Appraisals may be adjusted or discounted based on management’s historical knowledge, changes in market conditions from the time of the valuation, and/or management’s expertise and knowledge of the collateral. Such adjustments result in a Level 3 classification of the inputs for determining fair value. Real estate owned properties are evaluated on a quarterly basis for additional impairment and adjusted accordingly. The Company had
Loans Held For Sale: Loans held for sale are carried at either fair value, if elected, or the lower of cost or fair value on a pool-level basis. Origination fees and costs for loans held for sale recorded at lower of cost or market are capitalized in the basis of the loan and are included in the calculation of realized gains and losses upon sale. Origination fees and costs are recognized in earnings at the time of origination for loans held for sale that are recorded at fair value. Fair value is determined using quoted prices for similar assets, adjusted for specific attributes of that loan or other observable market data, such as outstanding commitments from third party investors (Level 2).
Derivatives-Mortgage Loan Interest Rate Lock Commitments: Interest rate lock commitments that relate to the origination of mortgage loans that will be held for sale are recorded at fair value, determined as the amount that would be required to settle each derivative instrument at the balance sheet date. The fair value of the interest rate lock commitment is derived from the fair value of related mortgage loans, which is based on observable market data and includes the expected net future cash flows related to servicing of the loans. In estimating the fair value of an interest rate lock commitment, the Company assigns a probability to the interest rate lock commitment based on an expectation that it will be exercised and the loan will be funded (a “pull through” rate). The expected pull through rates are applied to the fair value of the unclosed mortgage pipeline, resulting in a Level 3 fair value classification. The pull through rate is a statistical analysis of our actual rate lock fallout history to determine the sensitivity of the residential mortgage loan pipeline compared to interest rate changes and other deterministic values. New market prices are applied based on updated loan characteristics and new fallout ratios (i.e., the inverse of the pull through rate) are applied accordingly. Significant increases (decreases) in the pull through rate in isolation result in a significantly higher (lower) fair value measurement. Changes to the fair value of interest rate lock commitments are recognized based on interest rate changes, changes in the probability that the commitment will be exercised, and the passage of time.
Derivatives-Mortgage-Backed Securities Forward Sales Commitments: The Company utilizes mortgage-backed securities forward sales commitments to hedge mortgage loan interest rate lock commitments. Mortgage-backed securities forward sales commitments are recorded at fair value based on quoted prices for similar assets in an active market with inputs that are observable, resulting in a Level 2 fair value classification.
.
100
CAPSTAR FINANCIAL HOLDINGS INC. & SUBSIDIARY
Notes to Consolidated Financial Statements
Assets and liabilities measured at fair value on a recurring basis are summarized below (in thousands):
|
|
Fair value measurements at December 31, 2023 |
|
|||||||||||||
|
|
|
|
|
Quoted prices |
|
|
|
|
|
|
|
||||
|
|
|
|
|
in active |
|
|
Significant |
|
|
|
|
||||
|
|
|
|
|
markets for |
|
|
other |
|
|
Significant |
|
||||
|
|
|
|
|
identical |
|
|
observable |
|
|
unobservable |
|
||||
|
|
Carrying |
|
|
assets |
|
|
inputs |
|
|
inputs |
|
||||
|
|
Value |
|
|
(Level 1) |
|
|
(Level 2) |
|
|
(Level 3) |
|
||||
Assets: |
|
|
|
|
|
|
|
|
|
|
|
|
||||
Securities available-for-sale: |
|
|
|
|
|
|
|
|
|
|
|
|
||||
U. S. government agency securities |
|
$ |
|
|
$ |
|
|
$ |
|
|
$ |
|
||||
State and municipal securities |
|
|
|
|
|
|
|
|
|
|
|
|
||||
Mortgage-backed securities |
|
|
|
|
|
|
|
|
|
|
|
|
||||
Asset-backed securities |
|
|
|
|
|
|
|
|
|
|
|
|
||||
Other debt securities |
|
|
|
|
|
|
|
|
|
|
|
|
||||
Loans held for sale |
|
|
|
|
|
|
|
|
|
|
|
|
||||
Derivative assets: |
|
|
|
|
|
|
|
|
|
|
|
|
||||
Interest rate swaps - customer related |
|
|
|
|
|
|
|
|
|
|
|
|
||||
Mortgage loan interest rate lock commitments |
|
|
|
|
|
|
|
|
|
|
|
|
||||
Liabilities: |
|
|
|
|
|
|
|
|
|
|
|
|
||||
Derivative liabilities: |
|
|
|
|
|
|
|
|
|
|
|
|
||||
|
|
|
|
|
|
|
|
|
|
|
|
|||||
|
|
Fair value measurements at December 31, 2022 |
|
|||||||||||||
|
|
|
|
|
Quoted prices |
|
|
|
|
|
|
|
||||
|
|
|
|
|
in active |
|
|
Significant |
|
|
|
|
||||
|
|
|
|
|
markets for |
|
|
other |
|
|
Significant |
|
||||
|
|
|
|
|
identical |
|
|
observable |
|
|
unobservable |
|
||||
|
|
Carrying |
|
|
assets |
|
|
inputs |
|
|
inputs |
|
||||
|
|
Value |
|
|
(Level 1) |
|
|
(Level 2) |
|
|
(Level 3) |
|
||||
Assets: |
|
|
|
|
|
|
|
|
|
|
|
|
||||
Securities available-for-sale: |
|
|
|
|
|
|
|
|
|
|
|
|
||||
U. S. government agency securities |
|
$ |
|
|
$ |
|
|
$ |
|
|
$ |
|
||||
State and municipal securities |
|
|
|
|
|
|
|
|
|
|
|
|
||||
Mortgage-backed securities |
|
|
|
|
|
|
|
|
|
|
|
|
||||
Asset-backed securities |
|
|
|
|
|
|
|
|
|
|
|
|
||||
Other debt securities |
|
|
|
|
|
|
|
|
|
|
|
|
||||
Loans held for sale |
|
|
|
|
|
— |
|
|
|
|
|
|
— |
|
||
Derivative assets: |
|
|
|
|
|
|
|
|
|
|
|
|
||||
Interest rate swaps - customer related |
|
|
|
|
|
|
|
|
|
|
|
|
||||
Mortgage loan interest rate lock commitments |
|
|
|
|
|
|
|
|
|
|
|
|
||||
Mortgage-backed securities forward sales commitments |
|
|
|
|
|
|
|
|
|
|
|
|
||||
Liabilities: |
|
|
|
|
|
|
|
|
|
|
|
|
||||
Derivative liabilities: |
|
|
|
|
|
|
|
|
|
|
|
|
||||
Interest rate swaps - customer related |
|
|
|
|
|
|
|
|
|
|
|
|
||||
101
CAPSTAR FINANCIAL HOLDINGS INC. & SUBSIDIARY
Notes to Consolidated Financial Statements
The table below presents a reconciliation of all assets measured at fair value on a recurring basis using significant unobservable inputs (Level 3) for the years ended December 31, 2023 and 2022 (dollars in thousands):
|
|
Mortgage Loan Interest Rate |
|
|||||
|
|
Lock Commitments |
|
|||||
|
|
2023 |
|
|
2022 |
|
||
|
|
|
|
|
|
|
||
Balance of recurring Level 3 assets at January 1st |
|
$ |
|
|
$ |
|
||
Total gains or losses for the period: |
|
|
|
|
|
|
||
|
|
|
|
|
( |
) |
||
Balance of recurring Level 3 assets at December 31st |
|
$ |
|
|
$ |
|
||
The following table presents quantitative information about recurring Level 3 fair value measurements at December 31, 2023 and 2022 (dollars in thousands).
|
|
|
|
|
|
|
|
|
Range |
|
|
|
Fair |
|
|
Valuation |
|
|
|
(Weighted- |
|
December 31, 2023 |
|
Value |
|
|
Technique(s) |
|
Unobservable Input(s) |
|
Average) |
|
Assets: |
|
|
|
|
|
|
|
|
|
|
Non-hedging derivatives: |
|
|
|
|
|
|
|
|
|
|
Mortgage loan interest rate lock commitments |
|
$ |
|
|
|
|
||||
|
|
|
|
|
|
|
|
|
Range |
|
|
|
Fair |
|
|
Valuation |
|
|
|
(Weighted- |
|
December 31, 2022 |
|
Value |
|
|
Technique(s) |
|
Unobservable Input(s) |
|
Average) |
|
Assets: |
|
|
|
|
|
|
|
|
|
|
Non-hedging derivatives: |
|
|
|
|
|
|
|
|
|
|
Mortgage loan interest rate lock commitments |
|
$ |
|
|
|
|
||||
Assets measured at fair value on a nonrecurring basis are summarized below (in thousands):
|
|
|
|
|
Quoted prices |
|
|
|
|
|
|
|
||||
|
|
|
|
|
in active |
|
|
Significant |
|
|
|
|
||||
|
|
|
|
|
markets for |
|
|
other |
|
|
Significant |
|
||||
|
|
|
|
|
identical |
|
|
observable |
|
|
unobservable |
|
||||
|
|
Carrying |
|
|
assets |
|
|
inputs |
|
|
inputs |
|
||||
|
|
Value |
|
|
(level 1) |
|
|
(level 2) |
|
|
(level 3) |
|
||||
Fair value measurements at December 31, 2023 |
|
|
|
|
|
|
|
|
|
|
|
|
||||
Assets: |
|
|
|
|
|
|
|
|
|
|
|
|
||||
Individually evaluated loans: |
|
|
|
|
|
|
|
|
|
|
|
|
||||
Commercial and industrial |
|
$ |
|
|
|
|
|
|
|
|
$ |
|
||||
Commercial real estate - non-owner occupied |
|
|
|
|
|
|
|
|
|
|
|
|
||||
|
|
|
|
|
|
|
|
|
|
|
|
|
||||
Fair value measurements at December 31, 2022 |
|
|
|
|
|
|
|
|
|
|
|
|
||||
Assets: |
|
|
|
|
|
|
|
|
|
|
|
|
||||
Impaired loans: |
|
|
|
|
|
|
|
|
|
|
|
|
||||
Commercial and industrial |
|
$ |
|
|
|
|
|
|
|
|
$ |
|
||||
102
CAPSTAR FINANCIAL HOLDINGS INC. & SUBSIDIARY
Notes to Consolidated Financial Statements
The following table presents quantitative information about Level 3 fair value measurements for assets measured at fair value on a nonrecurring basis (dollars in thousands):
|
|
|
|
|
|
|
|
|
Range |
|
|
|
Fair |
|
|
Valuation |
|
|
|
(Weighted- |
|
December 31, 2023 |
|
Value |
|
|
Technique(s) |
|
Unobservable Input(s) |
|
Average) |
|
Individually evaluated loans: |
|
|
|
|
|
|
|
|
|
|
Commercial and industrial |
|
$ |
|
|
|
|
||||
Commercial real estate - non-owner occupied |
|
|
|
|
|
|
|
|
||
|
|
|
|
|
|
|
|
|
|
|
December 31, 2022 |
|
|
|
|
|
|
|
|
|
|
Impaired loans: |
|
|
|
|
|
|
|
|
|
|
Commercial and industrial |
|
$ |
|
|
|
|
||||
Commercial and industrial |
|
|
|
|
|
|
||||
Fair Value of Financial Instruments
The carrying value and estimated fair values of the Company’s financial instruments at December 31, 2023 and 2022 were as follows (in thousands):
|
|
December 31, 2023 |
|
|
December 31, 2022 |
|
|
|
||||||||||
|
|
Carrying |
|
|
|
|
|
Carrying |
|
|
|
|
|
Fair value |
||||
|
|
amount |
|
|
Fair value |
|
|
amount |
|
|
Fair value |
|
|
level of input |
||||
Financial assets: |
|
|
|
|
|
|
|
|
|
|
|
|
|
|
||||
Cash and due from banks, interest-bearing deposits in |
|
$ |
|
|
$ |
|
|
$ |
|
|
$ |
|
|
Level 1 |
||||
Federal funds sold |
|
|
|
|
|
|
|
|
|
|
|
|
|
Level 1 |
||||
Securities available-for-sale |
|
|
|
|
|
|
|
|
|
|
|
|
|
Level 2 |
||||
Securities held-to-maturity |
|
|
|
|
|
|
|
|
|
|
|
|
|
Level 2 |
||||
Loans held for sale |
|
|
|
|
|
|
|
|
|
|
|
|
|
Level 2 |
||||
Restricted equity securities |
|
|
|
|
N/A |
|
|
|
|
|
N/A |
|
|
N/A |
||||
Loans held for investment |
|
|
|
|
|
|
|
|
|
|
|
|
|
Level 3 |
||||
Accrued interest receivable |
|
|
|
|
|
|
|
|
|
|
|
|
|
Level 2 |
||||
Other assets |
|
|
|
|
|
|
|
|
|
|
|
|
|
Level 2 / Level 3 |
||||
Financial liabilities: |
|
|
|
|
|
|
|
|
|
|
|
|
|
|
||||
Deposits |
|
|
|
|
|
|
|
|
|
|
|
|
|
Level 2 |
||||
Subordinated notes and Federal Home Loan bank advances and other borrowings |
|
|
|
|
|
|
|
|
|
|
|
|
|
Level 2 |
||||
Other liabilities |
|
|
|
|
|
|
|
|
|
|
|
|
|
Level 3 |
||||
The methods and assumptions, not previously presented, used to estimate fair values are described as follows:
For these short-term instruments, the carrying amount is a reasonable estimate of fair value.
Federal funds sold clear on a daily basis. For this reason, the carrying amount is a reasonable estimate of fair value.
103
CAPSTAR FINANCIAL HOLDINGS INC. & SUBSIDIARY
Notes to Consolidated Financial Statements
Loans held for sale include residential mortgage loans, the guaranteed portion of SBA loans, and Tri-Net loans. The fair value of residential mortgage and SBA loans held for sale is measured using an exit price notion. The fair value of Tri-Net loans held for sale is measured using an exit price notion in as much as observable market data is available. Where there is no observable market data, the fair value of Tri-Net loans held for sale is estimated using discounted cash flow models. There were no Tri-Net loans held for sale as of December 31, 2023.
It is not practical to determine the fair value of restricted securities due to restrictions placed on their transferability.
In accordance with the adoption of ASU 2016-01, the fair value of loans is measured using an exit price notion. Fair values for impaired loans are estimated using discounted cash flow models or based on the fair value of the underlying collateral.
The carrying amount of accrued interest approximates fair value.
Included in other assets are bank owned life insurance and certain interest rate swap agreements. The fair values of interest rate swap agreements are based on independent pricing services that utilize pricing models with observable market inputs. For bank owned life insurance, the carrying amount is based on the cash surrender value and is a reasonable estimate of fair value.
The fair value of demand deposits, savings accounts and certain money market deposits is the amount payable on demand at the reporting date. The fair value of certificates of deposit is estimated by discounted cash flow models, using current market interest rates offered on certificates with similar remaining maturities.
The fair value of fixed rate Federal Home Loan Bank Advances and other borrowings is estimated using discounted cash flow models, using current market interest rates offered on certificates, advances and other borrowings with similar remaining maturities.
Included in other liabilities are accrued interest payable and certain interest rate swap agreements. The fair values of interest rate swap agreements are based on independent pricing services that utilize pricing models with observable market inputs. The carrying amounts of accrued interest approximate fair value.
Fair values for off-balance sheet, credit-related financial instruments are based on fees currently charged to enter into similar agreements, taking into account the remaining terms of the agreements and the counterparties’ credit standing. The fair value of commitments is not material.
Fair value estimates are made at a specific point in time, based on relevant market information and information about the financial instruments. These estimates do not reflect any premium or discount that could result from offering for sale at one time the Company’s entire holdings of a particular instrument. Because no market exists for a significant portion of the Company’s financial instruments, fair value estimates are based on judgments regarding future expected loss experience, current economic conditions, risk characteristics of various financial instruments, and other factors. These estimates are subjective in nature and involve uncertainties and matters
104
CAPSTAR FINANCIAL HOLDINGS INC. & SUBSIDIARY
Notes to Consolidated Financial Statements
of significant judgment and, therefore, cannot be determined with precision. Changes in assumptions could significantly affect the estimates.
Fair value estimates are based on estimating on and off-balance sheet financial instruments without attempting to estimate the value of anticipated future business and the value of assets and liabilities that are not considered financial instruments. For example, fixed assets are not considered financial instruments and their value has not been incorporated into the fair value estimates. In addition, the tax ramifications related to the realization of the unrealized gains and losses can have a significant effect on fair value estimates and have not been considered in the estimates.
NOTE 23 – PARENT COMPANY ONLY FINANCIAL INFORMATION
The following information presents the condensed balance sheets of CapStar Financial Holdings, Inc. as of the years ended December 31, 2023 and 2022 (in thousands).
Condensed Balance Sheets
|
|
December 31, 2023 |
|
|
December 31, 2022 |
|
|
||
Assets |
|
|
|
|
|
|
|
||
Cash and cash equivalents |
|
$ |
|
|
$ |
|
|
||
Investment in consolidated subsidiary |
|
|
|
|
|
|
|
||
Other assets |
|
|
|
|
|
|
|
||
Total assets |
|
$ |
|
|
$ |
|
|
||
Liabilities and Shareholders' Equity |
|
|
|
|
|
|
|
||
Subordinated debt |
|
$ |
|
|
$ |
|
|
||
Other liabilities |
|
|
|
|
|
|
|
||
Total shareholders' equity |
|
|
|
|
|
|
|
||
Total liabilities and shareholders' equity |
|
$ |
|
|
$ |
|
|
||
The following information presents the statements of income, and statements of cash flows of CapStar Financial Holdings, Inc. for the years ended December 31, 2023, 2022 and 2021 (in thousands).
Condensed Income Statements
|
|
Year Ended |
|
|
Year Ended |
|
|
Year Ended |
|
|||
|
|
December 31, 2023 |
|
|
December 31, 2022 |
|
|
December 31, 2021 |
|
|||
Income - dividends from subsidiary |
|
$ |
|
|
$ |
|
|
$ |
|
|||
Interest expense subordinated debt |
|
|
|
|
|
|
|
|
|
|||
Other expenses |
|
|
|
|
|
|
|
|
|
|||
Income (loss) before income taxes and equity in undistributed net income of subsidiary |
|
|
|
|
|
|
|
|
|
|||
Income tax benefit |
|
|
( |
) |
|
|
( |
) |
|
|
( |
) |
Income before equity in undistributed net income of subsidiary |
|
|
|
|
|
|
|
|
|
|||
Equity in undistributed net income of subsidiary |
|
|
|
|
|
|
|
|
|
|||
Net income |
|
$ |
|
|
$ |
|
|
$ |
|
|||
105
CAPSTAR FINANCIAL HOLDINGS INC. & SUBSIDIARY
Notes to Consolidated Financial Statements
Condensed Statements of Cash Flow
|
|
Year Ended |
|
|
Year Ended |
|
|
Year Ended |
|
|||
|
|
December 31, 2023 |
|
|
December 31, 2022 |
|
|
December 31, 2021 |
|
|||
Cash flows from operating activities: |
|
|
|
|
|
|
|
|
|
|||
Net income |
|
$ |
|
|
$ |
|
|
$ |
|
|||
Adjustments to reconcile net income to net cash used in operating activities: |
|
|
|
|
|
|
|
|
|
|||
Changes in other assets and liabilities |
|
|
( |
) |
|
|
( |
) |
|
|
( |
) |
Equity in undistributed net income of subsidiary |
|
|
( |
) |
|
|
( |
) |
|
|
( |
) |
Net cash used in operating activities |
|
|
( |
) |
|
|
( |
) |
|
|
( |
) |
Cash flows from investing activities: |
|
|
|
|
|
|
|
|
|
|||
Dividends received from CapStar Bank |
|
|
|
|
|
|
|
|
|
|||
Net cash provided by investing activities |
|
|
|
|
|
|
|
|
|
|||
Cash flows from financing activities: |
|
|
|
|
|
|
|
|
|
|||
Issuance of subordinated debt |
|
|
|
|
|
|
|
|
|
|||
Repurchase of common stock |
|
|
( |
) |
|
|
( |
) |
|
|
( |
) |
Exercise of common stock options and warrants |
|
|
|
|
|
( |
) |
|
|
|
||
Common stock dividends paid |
|
|
( |
) |
|
|
( |
) |
|
|
( |
) |
Net cash used in financing activities |
|
|
( |
) |
|
|
( |
) |
|
|
( |
) |
Net (decrease) increase in cash and cash equivalents |
|
|
|
|
|
( |
) |
|
|
( |
) |
|
Cash and cash equivalents at beginning of period |
|
|
|
|
|
|
|
|
|
|||
Cash and cash equivalents at end of period |
|
$ |
|
|
$ |
|
|
$ |
|
|||
106
ITEM 9. CHANGES IN AND DISAGREEMENTS WITH ACCOUNTANTS ON ACCOUNTING AND FINANCIAL DISCLOSURES
None.
ITEM 9A. CONTROLS AND PROCEDURES
Evaluation of Disclosure Controls and Procedures
Under the supervision and with the participation of our management, including our Chief Executive Officer and Chief Financial Officer, we conducted an evaluation of the effectiveness of the design and operation of its disclosure controls and procedures (as such term is defined in Exchange Act Rule 13a-15(e)) as of December 31, 2023. Based on that evaluation, the Company's Chief Executive Officer and Chief Financial Officer concluded that the Company's disclosure controls and procedures, were effective as of the end of the period covered by this Report.
Changes in Internal Control over Financial Reporting
There were no changes in the Company's internal control over financial reporting (as such term is defined in Exchange Act Rule 13a-15(f)) that occurred during the quarter ended December 31, 2023, that materially affected, or are reasonably likely to materially affect, the Company's internal control over financial reporting.
Management’s Annual Report on Internal Control over Financial Reporting
The management of the Company is responsible for establishing and maintaining adequate internal control over financial reporting. The Company's internal control over financial reporting was designed by, or under the supervision of, the company’s principal executive and principal financial officers and effected by the company’s board of directors, management and other personnel, to provide reasonable assurance regarding the reliability of financial reporting and the preparation of the Company’s financial statements in accordance with U.S. GAAP. Because of its inherent limitations, internal control over financial reporting may not prevent or detect misstatements. Also projections of any evaluation of effectiveness to future periods are subject to the risk that controls may become inadequate because of changes in conditions, or that the degree of compliance with the policies or procedures may deteriorate.
As of December 31, 2023 , management assessed the effectiveness of the Company's internal control over financial reporting based on the criteria for effective internal control over financial reporting established in “Internal Control-Integrated Framework,” issued by the Committee of Sponsoring Organizations (“COSO”) of the Treadway Commission in 2013. Management also conducted an assessment of requirements pertaining to Section 112 of the Federal Deposit Insurance Corporation Improvement Act. This section relates to management’s evaluation of internal control over financial reporting, including controls over the preparation of financial statements in accordance with the instructions to the Consolidated Financial Statements for Bank Holding Companies (Form FR Y-9C) and in compliance with laws and regulations. Our evaluation included a review of the documentation of controls, evaluations of the design of the internal control system and tests of the effectiveness of internal controls. Based on such assessment, management determined that, as of December 31, 2023, the Company’s internal control over financial reporting was effective.
The effectiveness of the Company’s internal control over financial reporting as of December 31, 2023, has been audited by Elliott Davis, PLLC, an independent registered public accounting firm, as stated in their report included on page 56 of this Annual Report on Form 10-K.
ITEM 9B. OTHER INFORMATION
On December 15, 2024,
Reference is made to our Current Report on Form 8-K dated and filed with the SEC on February 16, 2024, reporting under Item 8.01 thereof certain litigation relating to the proposed merger with Old National Bancorp (the "Lawsuit"), which is incorporated herein by this reference. On March 7, 2024, upon motion of the plaintiff, the Lawsuit was dismissed.
Reference is made to our Current Report on Form 8-K filed with the SEC on January 5, 2024, reporting under Item 5.02 thereof that our controller and principal accounting officer was on a leave of absence but was expected to resume her full-time activities in March 2024, which is incorporated herein by this reference. While she still is expected to
107
return in March, on March 8, 2024, the Board named Michael J. Fowler, our Chief Financial Officer, as the Company’s controller. She will be resuming her duties as both principal accounting officer and controller on March 18, 2024, at which time Mr. Fowler will no longer serve as controller.
ITEM 9C. DISCLOSURE REGARDING FOREIGN JURISDICTIONS THAT PREVENT INSPECTIONS
Not applicable.
108
PART III
ITEM 10. DIRECTORS, EXECUTIVE OFFICERS AND CORPORATE GOVERNANCE
(a) Information Regarding Directors and Executive Officers.
Identification of Directors
Our Charter and Amended and Restated Bylaws (“Bylaws”) provide that our Board will consist of between five and 25 directors, with the precise number being determined by our Board from time to time. The size of our Board currently is set at thirteen (13) members.
In accordance with our Bylaws and Tennessee law, our Board oversees the management of the business and affairs of the Company. Our directors are elected annually by our shareholders at our annual meetings of shareholders to serve for one-year terms and until their successors are duly elected and qualified or until their earlier death, resignation, retirement or removal. Our Board also serves as the Board of our wholly-owned bank subsidiary, CapStar Bank.
There are no arrangements or understandings between any of our directors and any other person(s) pursuant to which any of them were selected as a director. There are no family relationships among any of the members of our Board. Our current directors, together with certain information about each of them, are described below:
L. Earl Bentz—Director
Mr. Bentz, age 72, is one of the founders of CapStar Bank and currently serves as Chair of the Risk Committee and a member of the Nominating and Corporate Governance Committee. Mr. Bentz has served on our Board since 2008. Since 2018, he has been Chairman and Chief Executive Officer of Caymas Boats, a company he founded in 2018 located in Ashland City, Tennessee. Mr. Bentz serves on the board of directors of the Country Music Hall of Fame, and has formerly served on the boards of the Middle Tennessee Council, Boy Scouts of America, the Tennessee Wildlife Resources Foundation, the National Association of Boat Manufacturers, the National Marine Manufacturers’ Association, the Recreational Boating and Fishing Foundation and the Congressional Sportsman’s Foundation. Mr. Bentz attended Clemson University and participated in continuing education programs in business finance at Vanderbilt University; he has also completed the Dale Carnegie Human Relations courses and training. We believe that Mr. Bentz’s business background, which also includes extensive experience in commercial real estate development and start-up companies, gives him valuable insight and enables him to make significant contributions as a member of our board.
William T. (“Pete”) DeLay—Director
William T. (Pete) DeLay, age 63, is Chief Executive Officer and Principal of Lynwood Ventures, LLC., a Nashville based investment management company. DeLay is the former president and CEO of Nashville-based Sherman-Dixie Concrete Industries, served as lead consultant at Forterra’s Nashville division of Forterra Pipe & Precast, and served as President and CEO of Micelle BioPharma. His previous service includes Board of Trustees of Sewanee-University of the South, the Board of Directors for the American Concrete Pipe Association, and Nashville Board of Advisors for AmSouth Bank and Regions Financial Corp, former Director and Trustee of Martha O’Bryan Foundation and Center. He currently serves on the Executive Committee and Board of Directors for Cheekwood Estate and Botanical Gardens, Board of Director for Nashville Business Coalition, Board of Trustees of Middle Tennessee State University, the Boy Scouts of America, and Vice Chair of the Board of Trustees of Montgomery Bell Academy where he was recently appointed Co-Chairman of the MBA Capital Campaign. He holds a BA degree in Economics from Sewanee-University of the South. We believe that Mr. DeLay’s extensive business experience gives him valuable insight and enables him to make significant contribute as a member of our Board.
Sam B. DeVane—Director
Mr. DeVane, age 64, serves as the Chair of the Audit Committee and as a member of the Compensation and Human Resources Committee. With more than three decades of public accounting experience serving clients throughout the southeast, Mr. DeVane retired as a Partner of Ernst & Young LLP in 2020. During his career he served as EY’s Nashville Office Managing Partner, as EY’s Tennessee Markets Leader, and as a coordinating partner and lead audit partner. The majority of Mr. DeVane’s career involved service to clients in numerous industries including Dollar General Corporation, Tractor Supply Company, and Ryman Hospitality Corporation. He brings to the Board extensive technical accounting, corporate governance, major transactions, strategy, process automation, financial reporting, and risk management experience. A licensed CPA in Tennessee, Mr. DeVane is a member of the American Institute of Certified Public Accountants and Tennessee Society of Certified Public Accountants. He earned a Bachelor of Science
109
degree from the University of Alabama. Mr. DeVane has served on several distinguished professional boards, including United Way of Middle Tennessee (Chair of the Nashville Campaign), Junior Achievement (Centennial Leadership Award recipient), Harding Academy (Treasurer), and the University of Alabama President’s Cabinet and Accounting Advisory Board. We believe Mr. DeVane’s business experience and involvement in the community give him valuable insight and enable him to make significant contributions as a member of our Board.
Thomas R. Flynn—Director
Mr. Flynn, age 51, serves as a member of the Audit Committee and the Compensation and Human Resources Committee. Mr. Flynn has served on our Board since 2008. Mr. Flynn is the Chief Executive Officer and a director of Flynn Enterprises, LLC, a family owned, multi-national garment manufacturing, sales and distribution company headquartered in Hopkinsville, Kentucky, and serves on the board of Planters Bank, Hopkinsville, for which he is also a member of the audit committee. Mr. Flynn attended Vanderbilt University as a National Merit Scholar, graduating with a bachelor’s degree in English, and subsequently received a law degree from Vanderbilt University Law School. We believe that Mr. Flynn’s leadership in manufacturing and experience as a director in banking, healthcare, and manufacturing concerns, as well as his legal knowledge give him valuable insight and enable him to make significant contributions as a member of our Board.
William H. (“Harrison”) Frist Jr.—Director
William H. (“Harrison”) Frist, age 40, is Chief Executive Officer at naviHealth where he is responsible for the strategic vision and leadership of the organization. Harrison has been with naviHealth since its founding in 2012 and most recently served as naviHealth’s Chief Operating Officer. Prior to joining naviHealth, Harrison worked as an investment professional focused on the financial services industry for The Carlyle Group and as an investment banker in the Financial Institutions Group at Goldman Sachs. He is active in the community and serves on the board of the Martha O’Bryan Center, which empowers children, youth, and adults in poverty to transform their lives, and The Hermitage, the historic home of President Andrew Jackson. He holds an AB degree in History from Princeton University and an MBA from Harvard Business School. We believe that Mr. Frist’s extensive experience in financial services gives him valuable insight and enables him to make significant contributions as a member of our Board.
Louis A. Green III—Director
Mr. Green, age 70, serves on the Risk Committee and the Compensation and Human Resources Committee, and chairs our Advisory Board for Sumner County, which provides guidance to our management regarding that portion of our market. Mr. Green has served on our Board since 2012. He was an incorporator of American Security, which merged with CapStar in July, 2012. Mr. Green is General Partner of Green & Little, a real estate investment company, and President of Green-Little Corporation, a real estate management company. He holds partnership interests in several companies investing in industrial, commercial and retail real estate. Mr. Green has served as director of Commerce Union Bank of Sumner County and as an advisory director of NationsBank. He attended the University of Tennessee. We believe that Mr. Green’s extensive experience in banking and real estate gives him valuable insight and enables him to make significant contributions as a member of our Board.
Valora S. Gurganious—Director
Ms. Gurganious, age 60, serves on the Nominating and Corporate Governance Committee and the Risk Committee. From 2008 through 2023, Ms. Gurganious served as Partner and Senior Management Consultant for Knoxville-based DoctorsManagement, LLC, assisting clients in all medical specialties and providing services related to operational efficiency, workflow optimization, compliance, IT, accounting, marketing, and strategic planning. She also advises physicians and hospitals across the country on practice valuation, startup, contract negotiation and transition of ownership. Prior to joining DoctorsManagement, Ms. Gurganious served as Chief Operating Officer for Central Florida Sports Medicine and Orthopedic Center in Melbourne, and as Director and Vice Chair — Finance for Wuesthoff Foundation, a $10 million Florida health system foundation. She also held the position of senior vice president with Fleet Investment Advisors and Putnam Investments in Boston for seven years and is a licensed Business Broker in the state of Florida. Ms. Gurganious earned a Bachelor of Arts degree in economics and business administration from Vanderbilt University and M.B.A. from Harvard Business School. She is a Certified Healthcare Business Consultant and a member of the National Society of Certified Healthcare Business Consultants (NSCHBC) as well as Executive Women International (EWI). A dynamic and accomplished speaker, Ms. Gurganious uses her expertise to deliver strategic healthcare and financial lectures at medical conferences across the country. We believe that Ms. Gurganious’ business experience and involvement in the community give her valuable insight and enable her to make significant contributions as a member of our Board.
110
Myra NanDora Jenne—Director
Ms. Jenne, age 55, serves as Chair of the Compensation and Human Resources Committee and serves as a member of the Audit Committee. Ms. Jenne has served on our Board since her appointment in 2018. Ms. Jenne began practicing law with Carter, Harrod & Cunningham in Athens, Tennessee, and later practiced in Knoxville with Leitner, Williams, Dooley & Napolitan. She practiced at The Jenne Law Firm in Cleveland, Tennessee, through 2023. Ms. Jenne is also working for Patriot Family Homes, a provider of short term rentals with over three hundred homes in twelve states as a Compliance Officer. Ms. Jenne has served on the board of directors of Athens Federal Community Bank and on the Nalls Sherbakoff Group financial advisory board in Knoxville. She has been involved in various civic and charitable organizations in Cleveland over the past twenty years including serving on the boards at the Museum Center at Five Points and the Cleveland Athens Cotillion. She has also served on the Board of Trustees at Broad Street United Methodist Church. She graduated with Honors with a B.S. from the University of Tennessee at Knoxville, where she served as captain of the Tennessee Dance Team. She went on to attend Samford University’s Cumberland School of Law and graduated with a J.D. in 1994. We believe that Ms. Jenne’s extensive leadership experience and professional experience give her valuable insight and enable her to make significant contributions as a member of our Board.
Joelle J. Phillips—Director
Ms. Phillips, age 57, serves on the Audit Committee and the Compensation and Human Resources Committee. Ms. Phillips has served on our Board since 2020. Ms. Phillips began practicing law as law clerk for Hon. Rhesa H. Barksdale of the U.S. Court of Appeals for the Fifth Circuit, and later practiced in Atlanta, Georgia with Long, Aldridge & Norman LLP and in Nashville with Waller Lansden Dortch & Davis, LLP. After serving as General Attorney for both BellSouth and AT&T Tennessee, she served as the President of AT&T Tennessee from 2013 until her retirement on December 1, 2023. Ms. Phillips is involved in several civic and charitable organizations in Nashville, Tennessee, including serving as the Chair for the Drive to 55 Coalition and serving on the boards of Birmingham-Southern College, Tennessee Business Leadership Coalition and Nashville Repertory Theatre. Furthermore, Ms. Phillips was recognized as the Nashville Business Journal Newsmaker of the Year for 2015, Nashville’s Power 100 list, Nashville’s Women Business Leaders of the Year 2014, Tennessee Board of Regents’ Award for Philanthropy and was named one of Nashville’s Outstanding CEOs for 2017. Ms. Phillips graduated magna cum laude with a B.F.A. from Birmingham-Southern College in 1989 and went on to attend Washington & Lee University School of Law where she graduated summa cum laude with a J.D. in 1995. We believe that Ms. Phillips’ professional experience combined with her long history of involvement in the Nashville community give her valuable insight and enable her to make significant contributions as a member of our Board.
Timothy K. Schools—Director, President and Chief Executive Officer of CapStar Financial Holdings, Inc. and CapStar Bank
Mr. Schools, age 54, has served as a Director, President, and Chief Executive Officer of CapStar Financial Holdings, Inc. and CapStar Bank since 2019. Previously, he served as a Director, President, and Chief Executive Officer of Highlands Bankshares, Inc., President of American Savings Bank, Chief Financial Officer of The South Financial Group, Director of Alabama Power Company Employees Credit Union, Director of First Market Bank, as well as an Advisory Board Member of Nasdaq and OTC. Mr. Schools serves on the boards of the Nashville Downtown Partnership and Nashville Sports Council. He received an M.B.A. from Emory Business School and a B.B.A., magna cum laude, in Information and Decision Science from James Madison University. We believe that Mr. Schools’ role as CapStar’s Chief Executive Officer and extensive experience as an officer at both smaller and larger financial institutions enable him to make significant contributions as a member of our Board.
Stephen B. Smith—Director
Mr. Smith, age 69, serves as Chair of the Nominating and Corporate Governance Committee and serves on the Risk Committee. Mr. Smith has served on our Board since 2008. He is Chairman of Haury & Smith Contractors, Inc., a building and development company. He is active in the community, having served on the Metropolitan Nashville Planning Commission and the Regional Transit Authority and as Chairman of the Metropolitan Nashville Parks and Recreation board of directors. Mr. Smith served as National Finance Co-Chair for Senator Lamar Alexander’s presidential campaigns in 1996 and 2000, and he achieved Super Ranger status in President George W. Bush’s 2004 campaign. He was National Finance Chairman for Senate Majority Leader Bill Frist’s leadership political action committee, VOLPAC, and serves as Finance Chairman for Senator Bill Haggerty. In addition, he has served on the boards of the FHLB of Cincinnati and Franklin Road Academy, and as director of the First Union National Bank community board. He holds a bachelor’s degree from Middle Tennessee State University, where he serves as
111
Chairman of the Board of Trustees. We believe that Mr. Smith’s business experience and his involvement in the community give him valuable insight and enable him to make significant contributions as a member of our Board.
James S. Turner, Jr.—Director
Mr. Turner, age 53, serves as Chairman of the Board of Directors and was a former Chair of the Credit Committee and a former member of the Nominating and Corporate Governance Committee. Mr. Turner has served on our Board since 2008. He joined MarketStreet Enterprises in 1999 and has served as the Managing Director since 2007. Mr. Turner was a member of the board of directors of the Farmers National Bank Financial Corporation in Scottsville, Kentucky, for more than 15 years. He also serves on the boards of Nashville Downtown Partnership and The Country Music Hall of Fame. He received his bachelor’s degree from Vanderbilt University and his law degree from Vanderbilt University Law School. We believe that Mr. Turner’s experience and knowledge in the commercial real estate industry, his community banking board service, as well as his investment and legal knowledge, give him valuable insight and enable him to make significant contributions as a member of our Board.
Toby S. Wilt—Director
Mr. Wilt, age 79, is one of the founders of CapStar Bank and serves as a member of the Audit Committee and the Nominating and Corporate Governance Committee. He has served on our Board since 2008. Mr. Wilt has nearly four decades of experience in the banking industry. Mr. Wilt is a retired, non-practicing certified public accountant, who is no longer affiliated with the Tennessee Association of Accountants or the AICPA. He practiced accountancy with Ernst & Ernst in the 1970s. He has previously served on the boards of directors of banks and public companies including C&S/Sovran Corporation, Commerce Union Bank, Outback Steakhouse and Genesco Inc. Mr. Wilt currently serves as President of TSW Investment Company, Founding President of Golf Club of Tennessee. Mr. Wilt is also a former board member of First American National Bank and served as Chairman of the Board for the Christie Cookie Company. He earned a B.E. in civil engineering from Vanderbilt University and is a former pilot in the United States Air Force. We believe that Mr. Wilt’s significant experience in banking and as a director of banks and public companies, including his service on various audit and human resource committees, gives him valuable insight and enables him to make significant contributions as a member of our Board.
Identification of Executive Officers
Our Nominating and Corporate Governance Committee annually makes recommendations to our Board concerning the appointment or re-appointment of certain officers of the Company and CapStar Bank, including the Chief Executive Officer and Chief Financial Officer.
Set forth below is background information regarding each of our executive officers as of March 12, 2024, other than Mr. Schools whose biography is set forth above under the caption “Identification of Directors.” There are no family relationships among any of our executive officers. Further, other than the employment agreements described in this Annual Report on Form 10-K, there are no arrangements or understandings between the executive officers listed below and any other person(s) pursuant to which he or she was selected as an executive officer.
Michael J. Fowler - Chief Financial Officer, CapStar Financial Holdings, Inc.
Mr. Fowler, age 67, has more than 40 years of banking and finance experience having served in senior financial roles at several regional banks. He joined CapStar following the merger of First Horizon National Corp. and IBERIABANK Corporation. For 8 years he served as IBERIABANK’s Executive Vice President, Director of Financial Risk. He began his career with Texas Commerce Bank in Houston (acquired by Chemical Bank, now JPMorgan Chase) where for 15 years he served in management roles related to financial planning, balance sheet management, ALCO and management accounting. Subsequently, he served as Executive Vice President and Treasurer at First Commerce Bank and South Financial Group, and as CFO at GreenBank, acquired by Capital Bank Financial. He earned a bachelor’s degree in finance from Loyola University New Orleans and MBA from the University of Texas at Austin Red McCombs School of Business.
Ali Jefferson - Controller and Principal Accounting Officer, CapStar Financial Holdings, Inc.
Ms. Jefferson, age 36, served as our interim Controller and Principal Accounting Officer from May 12, 2023 until May 26, 2023, when she assumed the position of Controller and Principal Accounting Officer. Ms. Jefferson has served as Assistant Controller since joining the Company in late 2022. Prior to joining the Company, she acted as SEC Financial Reporting Manager with Sterling Bank and Trust, and previously served as the Chief Accounting Officer and Controller at Reliant Bank. Ms. Jefferson's previous experience includes over 8 years in public accounting,
112
most recently as an audit manager with EY as well as roles with Dixon Hughes Goodman and Horne LLP where she focused on serving publicly traded financial institutions. Ms. Jefferson is a graduate of Eastern Illinois University with a Master of Accountancy from University of Tennessee and is a certified public accountant licensed in the state of Tennessee. On January 2, 2024, Ms. Jefferson began a medical leave of absence, during which time her duties and responsibilities have been divided among and assumed by other members of the Company's accounting and finance staff (including additional consulting resources) under the supervision of the Company's Chief Executive Officer, Timothy K. Schools, and Chief Financial Officer, Michael J. Fowler. Ms. Jefferson is expected to resume her full-time activities in March 2024.
Kevin Lambert - Chief Credit Officer, CapStar Financial Holdings, Inc.
Mr. Lambert, age 60, joined CapStar in 2021 after having most recently served as Senior Regional Credit Officer for Raleigh, North Carolina-based First Citizens Bank. He joined First Citizens in 2006, where he was the senior commercial lender in Tennessee prior to transferring to credit administration. While at First Citizens, he oversaw commercial credit approvals for the states of Tennessee and Maryland, as well as western North Carolina, and northern Virginia. He began his career in 1985 with Sovran Bank and worked as a Commercial Relationship Manager until 1994 with Sovran Bank and its successors, including NationsBank, and Bank of America. Mr. Lambert joined the executive leadership team at American Fidelity Bank in 1994, helping to create a commercial loan department. In 2003, he joined National Bank of Commerce, which was later acquired by SunTrust, where he worked in the Commercial Real Estate Group. Mr. Lambert holds a Bachelor of Business Administration degree from East Tennessee State University. He has past President of the West Knoxville Kiwanis Club, and is active in RIO Revolution Church, where he serves as a congregational pastor, and previously was the church’s deacon chairman.
Christopher G. Tietz - Chief Banking Officer, CapStar Financial Holdings, Inc.
Mr. Tietz, age 61, is the Chief Banking Officer of CapStar Bank. Mr. Tietz joined the Bank in March 2016 and has over 32 years of banking experience starting as a trainee of First American National Bank in Nashville in 1985 and rising to the position of Executive Vice President and Regional Senior Credit Officer for First American’s West Tennessee Region including oversight of credit functions for private banking, business banking, middle-market, and corporate banking functions. Subsequent to his positions at First American, Mr. Tietz held chief credit officer roles at various banks in the Midwest and Tennessee. His experience includes capital raising activities, asset quality resolution, development of lending initiatives to achieve quality asset growth, and management and resolution of regulatory actions. Mr. Tietz holds a bachelor’s degree from the University of Alabama.
Kenneth E. Webb - Chief Operations Officer, CapStar Financial Holdings, Inc.
Mr. Webb, age 70, is the Chief Operations Officer of CapStar Bank. Mr. Webb was one of the original management team members that founded the company in 2007 and initially served as our Chief Development Officer and most recently as our Middle Tennessee Market Chairman before becoming the Interim EVP of Bank Operations in November 2022 and, most recently, Chief Operations Officer. Mr. Webb is an experienced executive with over 46 years of banking experience. Prior to joining CapStar, Mr. Webb worked for First Tennessee Bank from 1993 to 2007. His last position there was in the Business Strategy Group where he was responsible for a wide range of credit-related initiatives. He also served in several roles managing commercial, corporate and treasury management groups and as President of First Tennessee Bank, Nashville. He began his banking career in 1976 with Commerce Union Bank, and its successor banks after its acquisition by NationsBank, from 1976 to 1993. Mr. Webb is active in charitable work, having served over the years on various non-profit boards and in leadership roles for the Boys & Girls Club of Middle Tennessee, TSU College of Business Economic & Finance advisory board, the Nashville Sertoma Club and Foundation, and St. Henry Catholic Church. He is a native of Lawrence County, Tennessee. Mr. Webb is a graduate of Middle Tennessee State University.
(b) Delinquent Section 16(a) Reports. The U.S. securities laws require our executive officers, directors and greater than 10% shareholders to file reports of ownership and changes in ownership on Forms 3, 4 and 5 with the SEC. As a convenience to our directors and executive officers (“company filers”), we (using powers of attorney granted by the company filers to persons in the Company) file these reports on their behalf. Based solely upon a review of the copies of these reports furnished to us during and with respect to 2023, or on written representations that no Form 5 reports were required, we believe that each of those persons filed, on a timely basis, the reports required by Section 16(a) of the Exchange Act, except as follows. Ms. Goodin and Mr. Frist each were late in filing their initial Form 3. As a result of administrative delays, one late Form 4 for one transaction was filed on behalf of Mr. Bentz, Mr. DeVane, Mr.
113
Fowler, Ms. Goodin, Ms. Gurganious, Mr. Green, Ms. Jenne, Ms. Phillips, Mr. Smith, Mr. Turner, and Mr. Wilt, and two late Form 4s were filed on behalf of Messrs. Flynn, Lambert, Tietz, and Schools.
(c) Code of Business Conduct and Ethics. We have adopted a code of ethics that applies to our principal executive officer, principal financial officer, principal accounting officer or controller, or persons performing similar functions (“Code”) meeting the requirements of Item 406 of Regulation S-K. This Code is posted on the “Corporate Governance” section of our Internet website at https://ir.capstarbank.com/corporate-governance/highlights.
(d) Procedures for Shareholders to Recommend Director Nominees. There have been no material changes to the procedures by which security holders may recommend nominees to our Board.
(e) Audit Committee Information. We have a separately-designated standing audit committee established in accordance with section 3(a)(58)(A) of the Exchange Act. Our Audit Committee consists of Mr. DeVane (Committee Chair), Mr. Delay, Mr. Flynn, Ms. Jenne, Ms. Phillips, and Mr. Wilt. Nasdaq rules and our Audit Committee charter require that our Audit Committee be comprised entirely of independent directors. The Audit Committee’s Charter is evaluated annually to ensure compliance with SEC rules and regulations and Nasdaq listing standards and was last reviewed on January 24, 2024. A copy of the Audit Committee’s Charter is available on the Company’s Investor Relations webpage at www.ir.capstarbank.com under the caption “Corporate Governance – Documents & Charters.” The committee is responsible for, among other things: monitoring the integrity of, and assessing the adequacy of, our financial statements, the financial reporting process and our system of internal accounting and financial controls; assisting our Board in ensuring compliance with laws, regulations, policies and procedures; selecting our independent registered public accounting firm and assessing its qualifications, independence and performance; monitoring the internal audit function; reviewing and, if appropriate, pre-approving all auditing and permissible non-audit services performed by the independent public accounting firm; and reviewing and, if appropriate, approving related-party transactions other than those subject to Regulation O. At least once per year, our Audit Committee meets privately with each of our independent registered public accounting firm, management and our internal auditors.
The Board has determined that each of Mr. DeVane, Mr. DeLay, Mr. Flynn, Ms. Jenne, Ms. Phillips, and Mr. Wilt satisfies the requirements for financial literacy under applicable Nasdaq rules, and that each of Mr. DeVane, Mr. Flynn, Ms. Jenne, and Mr. Wilt qualify as an “audit committee financial expert” as defined in the SEC’s rules and regulations.
ITEM 11. EXECUTIVE COMPENSATION
This section provides details of the 2023 compensation for our NEOs: Timothy K. Schools, President and Chief Executive Officer; Michael J. Fowler, Chief Financial Officer; Kevin L. Lambert, Chief Credit Officer; Christopher G. Tietz, Chief Banking Officer; and Kenneth E. Webb, Chief Operations Officer.
Compensation Discussion and Analysis
Overview of Executive Compensation Philosophy
Our Compensation Committee (referred to by CapStar as our Compensation and Human Resources Committee) is responsible for determining the compensation that is paid or awarded to our Company’s executive officers. The quality and loyalty of our executives is critical to the successful execution of our strategic plan and the completion of our strategic initiatives. In line with the Company’s compensation philosophy, the Compensation Committee believes that executives should be provided an opportunity to benefit from outstanding Company performance and shareholder value creation upon delivering outstanding results. To achieve our goal of attracting, motivating, and retaining highly effective and loyal executives, our compensation framework is built upon the following principles:
114
The compensation philosophy is reviewed and approved annually by the Compensation Committee. Decisions made by the Compensation Committee and the Board relative to compensation take all current applicable rules, regulations, and guidance into consideration and are made with the goal of being compliant with all such requirements.
2023 Say-on-Pay Vote
The Compensation Committee viewed last year’s 96% shareholder approval of the executive compensation program at such a level which we believe indicated that a substantial majority of shareholders support our executive compensation program, plan design and governance as being well aligned with our shareholders, their investor experience and business outcomes.
Our Compensation Governance Practices
The Company is committed to sound compensation and governance practices. Our compensation program incorporates the following practices and features:
WHAT WE DO |
|
WHAT WE DON’T DO |
• Focus executive pay on corporate performance |
|
• We do not grant multi-year guaranteed incentive awards for executive officers |
• Provide for more than one metric for vesting under our annual cash bonus and performance unit awards |
|
• We do not provide excise tax “gross-ups” upon a change in control in employment agreements |
• Use balanced performance metrics which consider both the Company’s absolute performance and its relative performance versus peers |
|
• We do not provide any perquisites to NEOs |
• Impose a two-year holding period requirement for earned performance unit awards and restricted stock units |
|
• We do not permit our executives to hedge or pledge Company securities |
• Adopted a clawback policy covering all executive officer incentive-based awards for material misstatement of financial performance |
|
• We do not allow for discounting, reloading, or re-pricing of stock options without shareholder approval |
• Establish separate metrics for our short-term and long-term incentive plan designs to evaluate performance
|
|
• We do not pay dividends or dividend equivalents on shares or units that a participant has not yet earned or that have not vested |
115
Role of Compensation and Human Resources Committee and Management in Determining Compensation for our NEOs
Our Compensation and Human Resources Committee (sometimes referred to in this Annual Report on Form 10-K as the “Compensation Committee”) annually reviews our executive compensation program to ensure it achieves our desired goals and is responsible for approving compensation arrangements for each of our NEOs. As part of this process, the Compensation Committee annually reviews and approves corporate goals and objectives relevant to the compensation of our NEOs and evaluates the performance of the NEOs in light of these goals and objectives. The Compensation Committee approves the compensation levels for the NEOs based on such evaluation, with consideration for each individual’s role and responsibilities within the leadership team. The Compensation Committee annually reviews our incentive compensation arrangements to confirm they do not encourage unnecessary risk-taking. In determining the long-term incentive component of our executive compensation program, the Compensation Committee considers our performance and relative shareholder return, the value of similar incentive awards to comparable executives of our peers and the awards given to our NEOs in past years.
The Compensation Committee is solely responsible for setting the compensation of Mr. Schools, the Company’s CEO. When the Compensation Committee discusses and approves the compensation recommendations of our CEO, our CEO does not play any role with respect to any matter affecting his own compensation and is not present during these discussions. The CEO conducts an annual review of the total compensation of each of the other executive officers. The review typically includes an assessment of each executive officer’s experience, geography, performance and market pay levels. After this review, the CEO consults with the Compensation Committee on the base salaries, target annual and long-term incentive opportunities, any payouts related to the annual cash incentive plan, and the annual equity grants for the executive officers other than the CEO. While the CEO discusses with the Compensation Committee these compensation decision items, the ultimate decisions regarding the compensation for all executive officers, including our NEOs, are made by the Compensation Committee.
Role of Independent Compensation Consultant
The Compensation Committee has the authority under its charter to retain the services of outside advisors. From 2020 through April 2023, the Compensation Committee engaged Aon’s Human Capital Solutions practice, a division of Aon plc (Aon), formerly referred to as McLagan, as its independent compensation consultant. In 2022, Aon assisted in determining the composition of our compensation peer group and reviewed the competitiveness and structure of the compensation programs for our CEO and Board of Directors. During this period, Aon provided the Compensation Committee advice and information on other executive compensation matters, including executive pay components, prevailing market practices, and relevant regulatory requirements.
Beginning in April 2023, the Compensation Committee engaged Meridian Compensation Partners, LLC (Meridian) as its independent consultant to advise on executive and non-employee director compensation matters. Following their appointment, Meridian provided guidance to the Compensation Committee on executive and Board of Director compensation decisions through the remainder of 2023.
Prior to the appointment of Aon and Meridian, the Compensation Committee conducted an evaluation of each advisor’s independence considering all relevant factors, including those set forth in the Exchange Act and in applicable Nasdaq listing rules. The Compensation Committee concluded that the work performed by these firms and the individual consultants employed by Aon and Meridian did not raise any conflict of interest.
Peer Group
The Compensation Committee believes that obtaining relevant market data is very important to making determinations about executive officer compensation. Such information provides a reference point for making compensation decisions even though there are differences and unique aspects of CapStar relative to other companies.
The Compensation Committee takes into consideration the structure and components of, and the amounts paid under, the executive compensation programs of other, comparable peer companies, as derived from public filings and other sources, when making decisions about the structure and component mix of our executive compensation program. The Compensation Committee also considers broader industry practices and the compensation of executives at our competitors for talent.
The peer group developed by Aon in 2022 and used as a reference for the CEO’s 2023 compensation was defined using the following criteria:
116
The peer group used as a reference for the CEO’s 2023 compensation consisted of the top 23 companies from the composite performance ranking that are of similar size and business models as CapStar:
Bank First Corporation |
Preferred Bank |
Blue Ridge Bankshares, Inc. |
Parke Bancorp, Inc. |
City Holding Co. |
PCB Bancorp |
Farmers & Merchants Bancorp |
Premier Financial Corp. |
Farmers National Banc Corp. |
QCR Holdings Inc. |
German American Bancorp Inc. |
Southern First Bancshares, Inc. |
Greene County Bancorp |
Southern Missouri Bancorp, Inc. |
Hingham Institution for Savings |
Stock Yards Bancorp, Inc. |
Horizon Bancorp Inc. |
The First Bancorp, Inc. |
Independent Bank Corp. |
Washington Trust Bancorp Inc. |
Lakeland Financial Corp. |
West Bancorp |
MVB Financial Corp. |
|
The Compensation Committee did not conduct a review of market data with respect to compensation of the other NEOs because no material change was made to the compensation for these NEOs.
2023 Executive Compensation Program
The Compensation Committee selected the components of compensation set forth in the chart below to achieve our executive compensation program objectives. The Compensation Committee annually reviews all components of the program to verify that each executive officer’s total compensation is consistent with our compensation philosophy and objectives and that the component is serving a purpose in supporting the execution of our strategy.
Compensation Element |
Description |
Purpose |
Base Salary |
Fixed cash compensation Determined based on each executive officer’s role, individual skills, experience, performance, geography, and external market value |
Base salaries are intended to provide stable compensation to executive officers, allow us to attract and retain skilled executive talent and maintain a stable leadership team |
117
Short-Term Incentives: Annual Cash Incentive Opportunities |
Variable cash compensation based on the level of achievement of pre-determined annual corporate goals Cash incentives are capped at a maximum of 150% of each NEO’s Target opportunity
|
Annual cash incentive opportunities are designed to ensure that executive officers are motivated to achieve our annual corporate goals and individual performance |
Long-Term Incentives: Annual Equity-Based Compensation |
Variable equity-based compensation Restricted Stock Units (“RSUs”): Restricted stock units that are time-based and vest in three equal annual installments, comprised 40% of award value in 2023 Performance Units (“PSUs”): Performance units that are earned only upon the attainment of 3-year relative performance goals, comprised 60% of award value in 2023 PSUs are capped at 187.5% of each NEO’s target opportunity Earned PSUs and RSUs are subject to a two-year mandatory holding period
|
Equity-based incentive opportunities are designed to balance short-term and long-term corporate objectives and serve as a retention tool for executive officers. |
2023 Target Pay Mix
The Target pay mix supports the core principles of our executive compensation philosophy and objectives of compensating for performance and aligning executive officers’ interests with those of CapStar’s shareholders, by emphasizing both short- and long-term incentives. The graphics below illustrate the mix of fixed, target annual incentive, and target long-term incentive compensation (based on grant date fair value) we provided to our CEO and other NEOs for 2023.
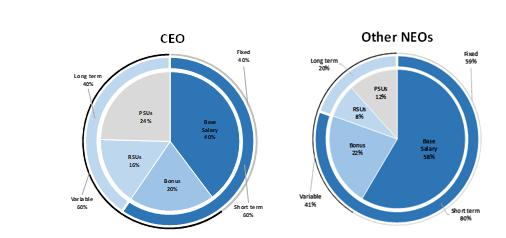
Base Salary
The base salaries of our NEOs are set annually by the Compensation Committee as part of the Company’s performance review process as well as upon the promotion of an executive officer to a new position or other change in job responsibility. In establishing base salaries for our NEOs, the Compensation Committee has relied on external market data and peer data obtained from outside sources, including our independent compensation consultant. In addition to considering the information obtained from such sources, the Compensation Committee has considered:
118
In 2023, the Compensation Committee approved base salary increases for Mr. Fowler (3%), Mr. Lambert (11.4%), Mr. Tietz (3%), and Mr. Webb (3.1%), based on the factors listed above. The Compensation Committee did not make any changes to the 2023 base salary for our CEO, Mr. Schools.
Annual Cash Incentive
The Company provides annual cash incentive awards for our NEOs to motivate and reward the achievement of key short-term objectives. The annual cash incentive provides for cash awards determined based on a set percentage of his or her then-current base salary and the Company’s achievement of pre-defined financial targets for the applicable year and operational results that the Compensation Committee views as critical to the execution of our business strategy.
The three Company performance metrics for the 2023 annual cash incentive included: return on equity, return on assets, and earnings per share. The Compensation Committee chose these three measures to focus the NEOs on the strategic priority of enhancing profitability and growth. The Compensation Committee established the 2023 Company performance metrics based on the expectation that 2023 performance would reflect an increase over 2022 results.
A specific percentage weight was allocated to each of these performance metrics as set forth in the table below. The Compensation Committee also established a Threshold, Target and Maximum performance level for each performance metric.
For 2023, the Compensation Committee also considered individual NEO performance and contributions to Company strategic goals and performance, including leadership and teamwork demonstrated by the NEOs.
Performance Metrics |
Weight |
Threshold (50%) |
Target (100%) |
Maximum (150%) |
Actual 2023 Achievement |
Return on Equity (ROE) |
25% |
11.06% |
12.29% |
13.52% |
8.89% |
Return on Assets (ROA) |
25% |
1.24% |
1.38% |
1.52% |
0.97% |
Earnings Per Share (EPS) |
50% |
$1.84 |
$2.04 |
$2.24 |
$1.47 |
Total Achievement |
Below Threshold |
||||
The Compensation Committee determined payouts under the 2023 annual incentive after reviewing the Company’s total achievement of the Company performance metrics, together with a qualitative assessment of Company and individual performance. In connection with its qualitative assessment of the NEOs’ performance, the Compensation Committee noted that many factors impacted Company profitability metrics in 2023 that were outside of management control. The banking industry experienced significant pressures in 2023 with historic increases in interest rates and several regional bank failures, which created a challenging operating environment. In this environment, significant resources were focused on ensuring the safety and soundness of the Company in 2023. In making determinations regarding payouts for 2023 performance, the Compensation Committee took into consideration the NEOs’ key achievements during an especially challenging year, which included stabilizing deposit balances, improving liquidity ratios, implementing new expense saving initiatives, keeping the credit portfolio strong with limited charge-offs, and
119
maintaining most capital ratios above peer companies. Taking these items into account, as well as the significant efforts of the NEOs with respect to finalizing the merger with Old National Bancorp, the Compensation Committee exercised discretion and approved 2023 annual bonus payouts to NEOs at threshold.
Name Executive Officer |
Target Opportunity (as a % of base salary) |
Target Opportunity ($) |
Bonus Payout (% of Target) |
2023 Actual Annual Bonus Payout |
Timothy K. Schools |
50% |
$262,500 |
50% |
$131,250 |
Michael J. Fowler |
40% |
$113,300 |
50% |
$56,650 |
Kevin L. Lambert |
10% |
$23,100 |
50% |
$11,550 |
Christopher G. Tietz |
40% |
$129,780 |
50% |
$64,890 |
Kenneth E. Webb |
40% |
$100,701 |
50% |
$50,350 |
Long-Term Equity-Based Incentive Compensation
We provide long-term equity-based incentive compensation to our executive officers, including our NEOs, and other key employees. Long-term equity equity-based compensation (such as RSUs and PSUs) are intended to attract and retain key employees and incentivize them to focus on creating long-term shareholder value while also enabling those persons to participate in CapStar’s long-term success. We believe that a portion of each NEO’s compensation should be tied to the performance of the Company, aligning the officer’s interest with that of our shareholders.
In 2020, the Compensation Committee adopted a new incentive award program using a mix of 60% PSUs and 40% RSUs. Dividend equivalents are accrued on the RSUs and PSUs. The dividend equivalents are deemed to have been reinvested in additional shares of CapStar common stock on each ex-dividend date. The dividend equivalents are paid to the recipient only upon vesting or settlement of the underlying award. The RSUs granted in 2023 vest in equal annual installments over three-years, provided the NEO remains employed by CapStar on each vesting date. Additionally, any vested RSUs are subject to a mandatory holding period until the earlier of: (1) the second anniversary of the vesting date, (2) the date of the termination of the NEO’s employment due to death or disability, or (3) the occurrence of a change in control that results in the acceleration of outstanding RSUs.
The PSUs granted in 2023 have the same three operational performance metrics (relative return on average assets, relative earnings per share growth and relative tangible book value per share growth) as the PSUs granted in 2022 and 2021. Each of the operational performance metrics are measured against all banks with assets between $2 billion and $6 billion that are traded on the Nasdaq Stock Market and NYSE to determine the number of shares earned. The Compensation Committee views as a relevant and appropriate comparison measurement over a three-year performance period from January 1, 2023 through December 31, 2025. The weighting of performance metrics are as follows: (1) 58.33% will vest based on relative return on average assets, compared to the group of banks, (2) 20.83% will vest based on relative earnings per share growth, compared to the group of banks, (3) 20.83% will vest based on relative tangible book value per share growth, compared to the group of banks, and the PSU vesting percentage shall be further adjusted by a modifier (up to a 25% increase or decrease) based on the Relative Total Shareholder Return of CapStar’s common stock compared to these same group of banks (“RTSR”).
For each of the three operational performance metrics, the number of PSUs earned by the NEOs will be calculated as follows:
Level of Achievement of Objectives(*) |
Percentile Relative to Peer Group |
% of PSU Target Award Earned |
Below Threshold |
Below 25th percentile |
0% |
120
Threshold |
25th Percentile |
50% |
Target |
50th Percentile |
100% |
Maximum |
75th Percentile |
150% |
(*) linear interpolation will be used to determine the applicable earning percentage between levels.
If RTSR ranks at or above the 75th percentile, the PSU vesting percentage will be increased by 25%, up to a maximum total payout of 187.5% (i.e.,150% x 125%). If RTSR ranks at or below the 25th percentile, the PSU vesting percentage will be decreased by 25%. If CapStar ranks at the median, there will be no change to the PSU vesting percentage, and for ranks in between the 25th and 75th percentile, the modifier will be determined by linear interpolation between levels. The Compensation Committee has continued to use relative metrics to allow for CapStar’s performance to more fairly absorb macroeconomic factors that are not in the control of the Company, such as economic fluctuations, new accounting standards, and tax rate changes, among others. The PSUs earned by our NEOs will vest after the end of the performance period, conditioned upon the continued employment of the executive officer. Further, any earned PSUs will be subject to a mandatory holding period until the earlier of: (1) the second anniversary of the vesting date, (2) the date of the termination of the NEO’s employment due to death or disability, or (3) the occurrence of a change in control.
For 2023, the Compensation Committee determined that the aggregate dollar value of the PSUs and RSUs granted to each NEO equal a percentage of the NEO’s base salary on the date of grant as set forth in the table below, with the RSU and target PSU amounts determined by dividing the applicable percentage of the NEO’s base salary by the fair market value of CapStar’s common stock on the grant date. The percentage of base salary was based on the NEO’s position, responsibilities and historical and expected contributions to CapStar. In 2023, Mr. Webb served in a line related role and therefore only participated in RSU grants.
The Compensation Committee granted the following RSUs and PSUs to each of the NEOs in 2023:
Named Executive Officer |
2023 Long-Term Incentive Awards |
||
Total Target Equity Award Opportunity as a % of Salary |
RSUs (#) |
Target PSUs (#) |
|
Timothy K. Schools |
100% |
11,830 |
17,746 |
Michael J. Fowler |
40% |
2,479 |
3,718 |
Kevin L. Lambert |
15% |
910 |
1,065 |
Christopher G. Tietz |
40% |
2,839 |
4,259 |
Kenneth E. Webb |
10% |
1,377 |
- |
Results of the 2021 PSU Awards
The three-year performance period for the 2021 PSUs granted to Mr. Schools and Mr. Tietz ended on December 31, 2023, and these PSUs will vest only upon the Compensation Committee’s certification of the achievement on the applicable performance metrics against the relevant peer group. As of the filing of this Annual Report on Form 10-K, the Compensation Committee is unable to certify the achievement on the operational performance metrics because the Compensation Committee relies on audited financials from the group of banks, which have not yet been disclosed as of this filing. Results of the 2021 PSU Awards will be determined upon the certification of achievement on these operational performance metrics, and the 2021 PSU Awards will be earned prior to the close of the Merger.
121
Benefits
Our NEOs are eligible to participate in the same benefit plans designed for all of our full-time employees.
401(k) Plan
Our 401(k) plan is designed to provide retirement benefits to all eligible full-time and part-time employees. The 401(k) plan provides employees the opportunity to save for retirement on a tax-favored basis. We have elected a safe harbor 401(k) Plan and as such make annual contributions of 3% of the employees’ salaries annually including the NEOs. An employee does not have to contribute to receive the employer contribution.
Risk Mitigating Features
Clawback. Incentive awards provided to our executive officers, including our NEOs, that are earned based on Company financial metrics are subject to our compensation clawback policy, which is intended to comply with Nasdaq listing requirements and is filed as Exhibit 97 to this Report. This clawback policy allows us to recoup awards that have been previously paid or awarded under certain circumstances, such as a material misstatement of the Company’s financial performance. Annual cash incentive awards paid and equity awards granted to our NEOs are subject to our “clawback” policy.
Anti-Hedging Provision. Our insider trading policy sets forth specific restrictions upon trading, such as specified trading windows and blackout periods, which must be adhered to. We believe it is improper and inappropriate for our personnel to engage in short-term or speculative transactions involving our stock, so those persons who are subject to the policy are prohibited from the following:
Holding Period Requirements. Any earned PSUs and RSUs are subject to a two-year mandatory holding period from the vesting date.
Employment Agreements and Change in Control and Severance Arrangements with NEOs
In 2022, the Company entered into new employment and change in control agreements with Messrs. Fowler, Lambert, Schools, Tietz, and Webb. The Compensation Committee chose to enter new employment and change in control agreements with these NEOs to create consistent agreements across the executive team and to better align with market practice. The new employment agreements with each of these NEOs set forth the executive’s position and duties, term of employment, salary, bonus compensation, equity compensation and other employee benefits, as well as providing them with the opportunity to receive certain post-employment payments and benefits in the case of certain terminations of employment. Each of the new employment agreements has a three-year term, and provides that at the end of each month of the three-year term, the term extends automatically for an additional month, such that the term will expire on the third anniversary of such extension date, until any party provides the other party with advance written notice of its desire to cease extending the term. The new change in control agreements set out the amount and type of compensation to which each executive is entitled in the event of a qualifying termination of employment following or leading up to a change in control. Each of the new change in control agreements also has a three-year term, with extension provisions identical to those set forth in the employment agreements. The terms of the new employment and change in control agreements related to the terminations of an executive’s employment or a qualifying termination upon a change in control are described in detail the section entitled “Potential Payments Upon Termination of Change of Control - Executive Employment Agreements’.
122
On October 26, 2023, the Company entered an amendment to Mr. Schools’ change in control agreement (the “Amendment”). Pursuant to the Amendment, the Company agreed to provide Mr. Schools a pay to integrate award of $1,000,000, which would be payable in cash subject to his continued service through the close of the merger of the Company with Old National Bancorp, an Indiana corporation (the “Merger”). The Amendment also provided that, in the event of Mr. Schools’ termination of employment without cause or for good reason within three years following the close of the Merger, he would also be eligible for a cash payment of $1,000,000 that is intended to enable him to obtain medical insurance following his termination of employment. In consideration for these awards, Mr. Schools agreed to extend his noncompetition covenant from one year to two years following his termination of employment. The Amendment is contingent upon the close of the Merger. The Compensation Committee agreed to provide Mr. Schools with these payments to incentivize him to remain with the Company because Mr. Schools’ services are essential to ensure smooth operations of the Company and the Bank through the consummation of the Merger and for the transition period following the close of the Merger.
On December 13, 2023, the Company entered a letter agreement with Mr. Schools to mitigate potential adverse tax consequences to the Company, Bank and Mr. Schools under Sections 280G and 4999 of the Internal Revenue Code. Specifically, the Company agreed to accelerate into 2023 the pay to integrate award of $1,000,000, which would have been payable upon the close of the Merger, and the payment of $1,000,000 related to post-employment medical insurance, which would have been payable upon a termination of Mr. Schools’ employment without cause or for good reason following the closing of the Merger. The letter agreement provides that Mr. Schools will repay such accelerated amounts if the Merger does not close or his employment terminates prior to the closing of the Merger. Further, Mr. Schools is required to repay the amount that would have been payable upon a termination of employment without cause or for good reason following the close of the Merger if his employment is not terminated under such circumstances.
On October 26, 2023, the Company entered amendments to Mr. Webb’s employment agreement and change in control agreement. Pursuant to these amendments, the severance multiple to be multiplied by the sum of base salary and Annual Bonus Amount specified in each such agreement was increased from 1x to 1.5x.
Summary Compensation Table
The following table provides information on the compensation earned by or paid or awarded to each of our NEOs during 2023, 2022 and 2021.
Name and Principal Position |
|
Year |
|
Salary |
|
|
Stock |
|
|
Nonequity Incentive Plan Compensation |
|
|
All Other |
|
|
Total |
|
|||||
Timothy K. Schools President and Chief Executive Officer - CapStar Financial Holdings, Inc. |
|
2023 |
|
$ |
525,000 |
|
|
$ |
534,734 |
|
|
$ |
131,250 |
|
|
$ |
2,011,350 |
|
|
$ |
3,202,344 |
|
|
2022 |
|
|
525,000 |
|
|
|
499,306 |
|
|
|
- |
|
|
|
8,700 |
|
|
|
1,033,006 |
|
|
|
2021 |
|
|
525,000 |
|
|
|
201,749 |
|
|
|
393,750 |
|
|
|
9,936 |
|
|
|
1,130,435 |
|
|
Michael J. Fowler Chief Financial Officer - CapStar Financial Holdings, Inc. |
|
2023 |
|
$ |
283,250 |
|
|
$ |
112,042 |
|
|
$ |
56,650 |
|
|
$ |
9,159 |
|
|
$ |
461,101 |
|
|
2022 |
|
|
268,125 |
|
|
|
105,021 |
|
|
|
- |
|
|
|
8,063 |
|
|
|
381,209 |
|
|
|
|
|
|
|
|
|
|
|
|
|
|
|
|
|
|
|
||||||
Kevin L. Lambert |
|
2023 |
|
$ |
231,000 |
|
|
$ |
35,642 |
|
|
$ |
11,550 |
|
|
$ |
6,930 |
|
|
$ |
285,122 |
|
Chief Credit Officer - CapStar Financial Holdings, Inc. |
|
|
|
|
|
|
|
|
|
|
|
|
|
|
|
|
|
|
|
|
|
|
Christopher G. Tietz Chief Banking Officer - CapStar Financial Holdings, Inc. |
|
2023 |
|
$ |
324,450 |
|
|
$ |
128,332 |
|
|
$ |
64,890 |
|
|
$ |
10,500 |
|
|
$ |
528,172 |
|
|
2022 |
|
|
315,000 |
|
|
|
120,313 |
|
|
|
- |
|
|
|
8,700 |
|
|
|
444,013 |
|
|
|
2021 |
|
|
315,000 |
|
|
|
158,737 |
|
|
|
189,000 |
|
|
|
34,799 |
|
|
|
697,536 |
|
|
Kenneth E. Webb Chief Operations Officer - CapStar Financial Holdings, Inc. |
|
2023 |
|
$ |
251,752 |
|
|
$ |
24,442 |
|
|
$ |
50,350 |
|
|
$ |
8,152 |
|
|
$ |
334,697 |
|
|
2022 |
|
|
244,017 |
|
|
|
24,193 |
|
|
|
- |
|
|
|
7,320 |
|
|
|
275,530 |
|
|
|
|
|
|
|
|
|
|
|
|
|
|
|
|
|
|
|
||||||
123
Grants of Plan-Based Awards for 2023
The following table sets forth information relating to grants of plan-based awards to the NEOs during 2023. All non-equity incentive plan awards were made under the Company’s Annual Incentive Plan as it was in effect during 2023, and all awards of RSUs and PSUs were made under the 2016 Stock Incentive Plan or the 2021 Stock Incentive Plan.
|
|
|
|
|
|
Estimated Future Payouts Under Non-Equity Incentive Plan Awards |
|
|
Estimated Future Payouts Under Equity Incentive Plan Awards |
|
|
|
|
|
|
|
|
||||||||||||||||||||
Name of Executive |
|
Award Type |
|
Grant Date |
|
Threshold |
|
|
Target |
|
|
Maximum |
|
|
Threshold |
|
|
Target |
|
|
Maximum |
|
|
All Other Stock Awards: Number of Shares of Stock or Restricted Units |
|
|
Grant Date Fair Value of Target Stock Awards |
|
|
||||||||
Timothy K. Schools |
|
|
|
|
|
|
|
|
|
|
|
|
|
|
|
|
|
|
|
|
|
|
|
|
|
|
|
|
|
||||||||
|
|
ACI |
|
|
|
|
131,250 |
|
|
|
262,500 |
|
|
|
393,750 |
|
|
|
|
|
|
|
|
|
|
|
|
|
|
|
|
|
|||||
|
|
PSU |
|
1/18/2023 |
|
|
|
|
|
|
|
|
|
|
|
6,655 |
|
|
|
17,746 |
|
|
|
33,274 |
|
|
|
|
|
|
324,752 |
|
(4) |
||||
|
|
RSU |
|
1/18/2023 |
|
|
|
|
|
|
|
|
|
|
|
|
|
|
|
|
|
|
|
|
11,830 |
|
|
|
209,983 |
|
(5) |
||||||
Michael J. Fowler |
|
|
|
|
|
|
|
|
|
|
|
|
|
|
|
|
|
|
|
|
|
|
|
|
|
|
|
|
|
||||||||
|
|
ACI |
|
|
|
|
56,650 |
|
|
|
113,300 |
|
|
|
169,350 |
|
|
|
|
|
|
|
|
|
|
|
|
|
|
|
|
|
|||||
|
|
PSU |
|
1/18/2023 |
|
|
|
|
|
|
|
|
|
|
|
1,394 |
|
|
|
3,718 |
|
|
|
6,971 |
|
|
|
|
|
|
68,039 |
|
(4) |
||||
|
|
RSU |
|
1/18/2023 |
|
|
|
|
|
|
|
|
|
|
|
|
|
|
|
|
|
|
|
|
2,479 |
|
|
|
44,002 |
|
(5) |
||||||
Kevin L. Lambert |
|
|
|
|
|
|
|
|
|
|
|
|
|
|
|
|
|
|
|
|
|
|
|
|
|
|
|
|
|
||||||||
|
|
ACI |
|
|
|
|
11,550 |
|
|
|
23,100 |
|
|
|
34,650 |
|
|
|
|
|
|
|
|
|
|
|
|
|
|
|
|
|
|||||
|
|
PSU |
|
1/18/2023 |
|
|
|
|
|
|
|
|
|
|
|
399 |
|
|
|
1,065 |
|
|
|
1,997 |
|
|
|
|
|
|
19,490 |
|
(4) |
||||
|
|
RSU |
|
1/18/2023 |
|
|
|
|
|
|
|
|
|
|
|
|
|
|
|
|
|
|
|
|
910 |
|
|
|
16,153 |
|
(5) |
||||||
Christopher G. Tietz |
|
|
|
|
|
|
|
|
|
|
|
|
|
|
|
|
|
|
|
|
|
|
|
|
|
|
|
|
|
||||||||
|
|
ACI |
|
|
|
|
64,890 |
|
|
|
129,780 |
|
|
|
194,670 |
|
|
|
|
|
|
|
|
|
|
|
|
|
|
|
|
|
|||||
|
|
PSU |
|
1/18/2023 |
|
|
|
|
|
|
|
|
|
|
|
1,597 |
|
|
|
4,259 |
|
|
|
7,986 |
|
|
|
|
|
|
77,940 |
|
(4) |
||||
|
|
RSU |
|
1/18/2023 |
|
|
|
|
|
|
|
|
|
|
|
|
|
|
|
|
|
|
|
|
2,839 |
|
|
|
50,392 |
|
(5) |
||||||
Kenneth E. Webb |
|
|
|
|
|
|
|
|
|
|
|
|
|
|
|
|
|
|
|
|
|
|
|
|
|
|
|
|
|
||||||||
|
|
ACI |
|
|
|
|
50,350 |
|
|
|
100,701 |
|
|
|
151,051 |
|
|
|
|
|
|
|
|
|
|
|
|
|
|
|
|
|
|||||
|
|
RSU |
|
1/18/2023 |
|
|
|
|
|
|
|
|
|
|
|
|
|
|
|
|
|
|
|
|
1,377 |
|
|
|
24,442 |
|
(5) |
||||||
124
Narrative Discussion of the Summary Compensation Table and Grant of Plan-Based Awards Table
The material terms of the pay elements included in the Summary Compensation Table for our NEOs are described above in the CD&A and the specific compensation terms in the new employment agreements with Messrs. Schools, Fowler, Lambert, Tietz and Webb are summarized in the table below.
Annual Salary |
Annual Bonus |
Long-Term Incentive |
Other Benefits |
▪ Schools: At least $525,000 ▪ Fowler: At least $275,000 ▪ Lambert: At least $210,000 ▪ Tietz: At least $315,000 ▪ Webb: At least $244,500
|
Target opportunities: ▪ Schools: At least 50% of salary ▪ Fowler, Tietz, Webb: At least 40% of salary ▪ Lambert: At least 10% of salary
All annual bonuses have a threshold payout of 50% of target bonus opportunity and maximum payout of 150% of target |
▪ Schools: Target annual equity opportunity not less than 100% of salary ▪ All other NEOs eligible to participate in the Company’s equity award plan |
§ Schools: Eligible for a charitable match annually up to $25,000 § All NEOs eligible to participate in the employee benefit plans generally applicable to other employees |
Outstanding Equity Awards at Year End
The following table provides information regarding outstanding equity awards held by our NEOs as of December 31, 2023.
125
|
|
Option Awards |
|
|
Stock Awards |
|
||||||||||||||||||||||||||||
Name of Executive |
|
Grant Date |
|
Number of Securities Underlying Unexercised Options Exercisable |
|
|
Number of Securities Underlying Unexercised Options Unexercisable |
|
|
Option |
|
|
Option |
|
|
Number |
|
|
Market |
|
|
Equity Incentive Plan Awards: Number of Unearned Shares, Units or Other Rights That Have Not Vested |
|
|
Equity Incentive Plan Awards: Market or Payout Value of Unearned Shares, Units or Other Rights That Have Not Vested |
|
||||||||
Timothy K. Schools |
|
|
|
|
|
|
|
|
|
|
|
|
|
|
|
|
|
|
|
|
|
|
|
|
|
|
||||||||
|
|
5/22/2019 |
|
|
50,000 |
|
|
|
— |
|
|
$ |
14.84 |
|
|
5/22/2029 |
|
|
|
|
|
|
|
|
|
|
|
|
|
|
|
|
|
|
|
|
1/27/2022 |
|
|
|
|
|
|
|
|
|
|
|
|
|
|
|
|
|
|
1,308 |
|
|
|
24,512 |
|
|
|
5,885 |
|
|
|
110,285 |
|
|
|
4/20/2022 |
|
|
|
|
|
|
|
|
|
|
|
|
|
|
|
|
|
|
1,962 |
|
|
|
36,768 |
|
|
|
8,828 |
|
|
|
165,437 |
|
|
|
1/18/2023 |
|
|
|
|
|
|
|
|
|
|
|
|
|
|
|
|
|
|
7,887 |
|
|
|
147,802 |
|
|
|
17,746 |
|
|
|
332,560 |
|
Michael J. Fowler |
|
|
|
|
|
|
|
|
|
|
|
|
|
|
|
|
|
|
|
|
|
|
|
|
|
|
||||||||
|
|
1/27/2022 |
|
|
|
|
|
|
|
|
|
|
|
|
|
|
|
|
|
|
685 |
|
|
|
12,837 |
|
|
|
3,082 |
|
|
|
57,757 |
|
|
|
1/18/2023 |
|
|
|
|
|
|
|
|
|
|
|
|
|
1,653 |
|
|
30,977 |
|
|
3,718 |
|
|
69,675 |
|
||||||||
Kevin L. Lambert |
|
|
|
|
|
|
|
|
|
|
|
|
|
|
|
|
|
|
|
|
|
|
|
|
|
|
||||||||
|
|
1/27/2022 |
|
|
|
|
|
|
|
|
|
|
|
|
|
|
|
|
|
|
187 |
|
|
|
3,504 |
|
|
|
840 |
|
|
|
15,742 |
|
|
|
1/18/2023 |
|
|
|
|
|
|
|
|
|
|
|
|
|
|
|
|
|
|
607 |
|
|
|
11,375 |
|
|
|
1,065 |
|
|
|
19,958 |
|
|
|
|
|
|
|
|
|
|
|
|
|
|
|
|
|
|
|
|
|
|
|
|
|
|
|
|
|
|
|
|
|
|
|
|
Christopher G. Tietz |
|
|
|
|
|
|
|
|
|
|
|
|
|
|
|
|
|
|
|
|
|
|
|
|
|
|
||||||||
|
|
3/2/2016 |
|
|
25,000 |
|
|
|
— |
|
|
$ |
13.22 |
|
|
|
3/02/2026 |
|
|
|
|
|
|
|
|
|
|
|
|
|
|
|
|
|
|
|
1/27/2022 |
|
|
|
|
|
|
|
|
|
|
|
|
|
|
|
|
|
|
785 |
|
|
|
14,711 |
|
|
|
3,531 |
|
|
|
66,171 |
|
|
|
1/18/2023 |
|
|
|
|
|
|
|
|
|
|
|
|
|
|
|
|
|
|
1,893 |
|
|
|
35,475 |
|
|
|
4,259 |
|
|
|
79,814 |
|
Kenneth E. Webb |
|
|
|
|
|
|
|
|
|
|
|
|
|
|
|
|
|
|
|
|
|
|
|
|
|
|
||||||||
|
|
1/27/2022 |
|
|
|
|
|
|
|
|
|
|
|
|
|
|
|
|
|
|
377 |
|
|
|
7,065 |
|
|
|
— |
|
|
|
— |
|
|
|
1/18/2023 |
|
|
|
|
|
|
|
|
|
|
|
|
|
|
|
|
|
|
1,377 |
|
|
|
25,805 |
|
|
|
— |
|
|
|
— |
|
Option Exercises and Stock Vested
The following table contains information concerning the vesting of RSUs and PSUs during the fiscal year ended December 31, 2023, for the NEOs.
126
|
|
Option Exercises and Stock Vested |
|
||||||
|
|
|
Stock Awards |
|
|||||
|
|
|
|
|
|
|
|
||
|
|
|
Number of Shares |
|
|
Value Realized |
|
||
|
|
|
Acquired on Vesting |
|
|
on Vesting |
|
||
Name |
|
|
(#) (1) |
|
|
($) (2) |
|
||
Timothy K. Schools |
|
|
|
18,298 |
|
|
|
342,905 |
|
Michael J. Fowler |
|
|
|
1,511 |
|
|
|
28,316 |
|
Kevin L. Lambert |
|
|
|
489 |
|
|
|
9,164 |
|
Christopher G. Tietz |
|
|
|
8,383 |
|
|
|
157,097 |
|
Kenneth E. Webb |
|
|
|
6,786 |
|
|
|
127,170 |
|
Potential Payments Upon Termination or Change of Control
Upon termination of a NEO’s employment with the Company, or upon a change in control, the Company maintains certain agreements, arrangements, plans and programs pursuant to which NEOs are eligible to receive cash severance, equity vesting and other benefits. In accordance with SEC rules, we have used certain assumptions in determining the amounts shown in the narrative and table below. We have assumed that the termination of employment or change in control occurred on December 31, 2023.
Executive Employment Agreements
As discussed above in the CD&A, in 2022 the Company entered into employment and change in control agreements with Messrs. Schools, Fowler, Lambert, Tietz, and Webb. Our employment and change in control agreements with Messrs. Schools, Fowler, Lambert, Tietz, and Webb provide for severance payments and other benefits in connection with the termination of their employment with CapStar in certain circumstances. Also, as described above in the CD&A, in 2023, the Company entered into an amended change in control agreement and a letter agreement with Mr. Schools and amended employment and change-in-control agreements with Mr. Webb.
Termination Without Cause or for Good Reason Unrelated to a Change in Control. Specifically, our NEOs are entitled to a severance payment and other benefits in the event we terminate their employment agreements without “cause” or the executive resigns for “good reason,” as such terms are defined in the employment agreements, including:
127
Death or Disability Termination Unrelated to a Change in Control. For a termination of employment due to “death” or “disability” unrelated to a change in control, as such terms are defined in the employment agreements, our NEOs are each entitled to:
Without Cause or Good Reason Termination in Connection with a Change in Control. For a termination of employment without “cause” or for “good reason” occurring within three-years following, or in anticipation of a “change in control,” as such terms are defined in the change in control agreements, our NEOs are entitled to severance and other benefits as follows:
128
Death or Disability Termination in Connection with a Change in Control: For a termination of employment due to “death” or “disability” occurring within three-years following, or in anticipation of a “change in control,” as such terms are defined in the change in control agreements, our NEOs are each entitled:
Following any of the terminations described in this section, our NEOs are subject to non-compete, non-solicitation, non-disparagement, and confidentiality provisions. The non-compete and non-solicitation provisions apply for one-year following the termination of their employment. The non-disparagement and confidentiality provisions apply during the term of employment and survive the end of the term of employment.
Treatment of Equity Awards Upon Termination of Employment for Death or Disability or Change in Control Under Equity Award Agreements
PSUs. Under the terms of the PSU award agreements, upon termination of a NEO’s employment as a result of their death or disability, the outstanding PSUs will vest on such date on a pro-rata basis at target, calculated by multiplying the target number of PSUs by a fraction, the numerator of which equals the number of days between the grant date and the NEO’s death or disability and the denominator equals the total number of days in the performance period. The NEO would be entitled to the payment of any accrued but unpaid dividend equivalents upon such termination as a result of their death or disability. Upon a change in control, the PSU award agreements provide that all unvested PSUs shall vest at the greater of the actual number of PSUs that would have vested if the performance period ended on the date of the change in control or the target number of PSUs and the NEO would be entitled to unpaid dividend equivalents on the PSUs.
RSUs. Under the terms of the RSU award agreements, upon the termination of a NEO’s employment as a result of their death or disability, all unvested RSUs will vest and the NEO would be entitled to the payment of any accrued but unpaid dividend equivalents. None of the NEOs have a contractual entitlement to acceleration of their outstanding RSUs in connection with a change in control under the award agreements.
Options. Under the terms of the option award agreements, upon termination of a NEO’s employment, for any reason other than death of disability, the unvested options will terminate, and the NEO may exercise the vested portion for a period of the earlier of 3 months or the expiration date. Upon termination of an NEO’s employment due to disability, the unvested options will terminate, and the NEO may exercise the vested portion for a period of the earlier of 12 months or expiration date. Upon the NEO’s death, the unvested options terminate and the NEO’s heirs or legal representative may exercise the vested portion for the period of the earlier of up 12 months or expiration date. None of the NEOs have a contractual entitlement to acceleration of their outstanding options in connection with a change in control.
The following table outlines the severance compensation payable to the NEOs, assuming separation from service on December 31, 2023, under various employment termination scenarios:
129
|
|
|
|
With Change in Control |
|
|
Without Change in Control |
|
|
||||||||||||||
|
|
|
|
|
|
|
Without Cause or Good Reason Termination ($) |
|
|
|
|
|
Without Cause or Good Reason Termination ($) |
|
|
|
|
|
|||||
|
|
|
|
|
|
|
|
|
Death or Disability ($) |
|
|
|
|
Death or Disability ($) |
|
|
|||||||
Name |
|
Compensation Component |
|
No Termination ($) |
|
|
|
|
|
|
|
|
|
|
|||||||||
Timothy K. Schools |
|
|
|
|
|
|
|
|
|
|
|
|
|
|
|
|
|
|
|||||
|
|
Cash Severance |
|
- |
|
|
|
2,362,500 |
|
(1) |
- |
|
|
|
2,362,500 |
|
(2) |
- |
|
|
|||
|
|
RSUs |
|
- |
|
|
|
216,166 |
|
(3) |
|
216,166 |
|
(3) |
- |
|
|
|
216,166 |
|
(3) |
||
|
|
PSUs |
|
|
608,282 |
|
(4) |
|
608,282 |
|
(4) |
|
608,282 |
|
(4) |
- |
|
|
|
280,818 |
|
(5) |
|
|
|
Benefit Continuation and Outplacement |
|
- |
|
|
|
130,345 |
|
(6) |
- |
|
|
|
95,445 |
|
(7) |
- |
|
|
|||
|
|
Total: |
|
|
608,282 |
|
|
|
3,317,293 |
|
|
|
824,448 |
|
|
|
2,457,945 |
|
|
|
496,984 |
|
|
Michael J. Fowler |
|
|
|
|
|
|
|
|
|
|
|
|
|
|
|
|
|
|
|||||
|
|
Cash Severance |
|
- |
|
|
|
594,825 |
|
(1) |
- |
|
|
|
396,550 |
|
(2) |
- |
|
|
|||
|
|
RSUs |
|
- |
|
|
|
45,323 |
|
(3) |
|
45,323 |
|
(3) |
- |
|
|
|
45,323 |
|
(3) |
||
|
|
PSUs |
|
|
127,432 |
|
(4) |
|
127,432 |
|
(4) |
|
127,432 |
|
(4) |
- |
|
|
|
61,642 |
|
(5) |
|
|
|
Benefit Continuation and Outplacement |
|
- |
|
|
|
53,823 |
|
(6) |
- |
|
|
|
12,615 |
|
(7) |
- |
|
|
|||
|
|
Total: |
|
|
127,432 |
|
|
|
821,403 |
|
|
|
172,755 |
|
|
|
409,615 |
|
|
|
106,965 |
|
|
Kevin L. Lambert |
|
|
|
|
|
|
|
|
|
|
|
|
|
|
|
|
|
|
|||||
|
|
Cash Severance |
|
- |
|
|
|
381,150 |
|
(1) |
- |
|
|
|
254,100 |
|
(2) |
- |
|
|
|||
|
|
RSUs |
|
- |
|
|
|
15,376 |
|
(3) |
|
15,376 |
|
(3) |
- |
|
|
|
15,376 |
|
(3) |
||
|
|
PSUs |
|
|
35,700 |
|
(4) |
|
35,700 |
|
(4) |
|
35,700 |
|
(4) |
- |
|
|
|
17,117 |
|
(5) |
|
|
|
Benefit Continuation and Outplacement |
|
- |
|
|
|
66,445 |
|
(6) |
- |
|
|
|
21,030 |
|
(7) |
- |
|
|
|||
|
|
Total: |
|
|
35,700 |
|
|
|
498,671 |
|
|
|
51,076 |
|
|
|
275,130 |
|
|
|
32,493 |
|
|
Christopher G. Tietz |
|
|
|
|
|
|
|
|
|
|
|
|
|
|
|
|
|
|
|||||
|
|
Cash Severance |
|
- |
|
|
|
908,460 |
|
(1) |
- |
|
|
|
454,230 |
|
(2) |
- |
|
|
|||
|
|
RSUs |
|
- |
|
|
|
51,914 |
|
(3) |
|
51,914 |
|
(3) |
- |
|
|
|
51,914 |
|
(3) |
||
|
|
PSUs |
|
|
145,985 |
|
(4) |
|
145,985 |
|
(4) |
|
145,985 |
|
(4) |
- |
|
|
|
70,618 |
|
(5) |
|
|
|
Benefit Continuation and Outplacement |
|
- |
|
|
|
56,440 |
|
(6) |
- |
|
|
|
10,770 |
|
(7) |
- |
|
|
|||
|
|
Total: |
|
|
145,985 |
|
|
|
1,162,799 |
|
|
|
197,899 |
|
|
|
465,000 |
|
|
|
122,532 |
|
|
Kenneth E. Webb |
|
|
|
|
|
|
|
|
|
|
|
|
|
|
|
|
|
|
|||||
|
|
Cash Severance |
|
- |
|
|
|
528,680 |
|
(1) |
- |
|
|
|
528,680 |
|
(2) |
- |
|
|
|||
|
|
RSUs |
|
- |
|
|
|
33,705 |
|
(3) |
|
33,705 |
|
(3) |
- |
|
|
|
33,705 |
|
(3) |
||
|
|
PSUs |
|
- |
|
|
- |
|
|
- |
|
|
- |
|
|
- |
|
|
|||||
|
|
Benefit Continuation and Outplacement |
|
- |
|
|
|
71,980 |
|
(6) |
- |
|
|
|
37,080 |
|
(7) |
- |
|
|
|||
|
|
Total: |
|
|
- |
|
|
|
634,365 |
|
|
|
33,705 |
|
|
|
565,760 |
|
|
|
33,705 |
|
|
130
Pension Benefits
The Company does not maintain any benefit plan that provides for payments or other benefits at, following or in connection with retirement, other than the Company’s 401(k) plan.
Nonqualified Deferred Compensation Plans
The Company does not maintain any defined contribution or other plans that provide for the deferral of compensation on a basis that is not tax-qualified.
CEO Pay Ratio Disclosure
As required by Item 402(u) of Regulation S-K, we are providing the following information to disclose the ratio of our median employee’s annual total compensation to the annual total compensation of our President and Chief Executive Officer “(CEO”), using certain permitted methodologies described below. To determine this pay ratio and our median employee, we looked at our employee population and utilized data as of October 15, 2023 (the “Determination Date”).
We identified the median employee in 2022 by aggregating each employee’s wages paid in our payroll system and ranking this compensation measure for our employees from lowest to highest for employees who were employed on the Determination Date. This calculation was performed for all employees, excluding our CEO, whether employed on a full-time, part-time, seasonal or temporary basis. We did not make any material assumptions, adjustments or estimates with respect to total compensation. After identifying the median employee based on total cash compensation, we calculated annual total compensation for our median employee and our CEO using the same methodology we use for our named executive officers as set forth in the Summary Compensation Table in this Annual Report on Form 10-K. In 2023, we calculated the CEO pay ratio using the compensation of the same median employee that we had used in 2022. We believe that is reasonable because there has been no change in our employee population or employee compensation arrangements that we believe would significantly affect the pay ratio disclosure.
For 2023, the combined annual total compensation for our CEO as reported in the Summary Compensation Table, was $3,202,334. The total compensation of our median employee was $58,567, resulting in an estimated pay ratio of 54.7:1. Excluding the two $1.0 million payments paid to Mr. Schools in connection with the Merger that are described above in CD&A, the estimated pay ratio would have been 20.5:1.
The pay ratio reported above is a reasonable estimate calculated in a manner consistent with SEC rules based on our internal records and the methodology described above. Because the SEC rules for identifying the median compensated employee and calculating the pay ratio based on that employee’s annual total compensation allow companies to adopt a variety of methodologies, to apply certain exclusions, and to make reasonable estimates and assumptions that reflect their employee populations and compensation practices, the pay ratio reported by other companies may not be comparable to the pay ratio reported above, as other companies have different employee populations and compensation practices and may utilize different methodologies, exclusions, estimates and assumptions in calculating their own pay ratios.
2023 Director Compensation
During 2023, our non-employee directors received compensation for service and attendance based upon the following compensation program guidelines (“2023 Director Compensation Program”):
131
Other than the retainer for our Chairman of the Board, which was paid in restricted stock awards, director compensation is paid in a combination of cash and restricted stock awards that vest over one year. The following table sets forth information regarding compensation paid during 2023 to our directors who were not named executive officers:
|
|
|
|
|
Fees Earned or Paid in Restricted Stock |
|
|
|
|
|||||||
Name (1) |
|
Fees Earned or ($) |
|
|
Amount ($)(2) |
|
|
Actual Number of Restricted Shares (3) |
|
|
Total ($) |
|
||||
L. Earl Bentz |
|
|
22,000 |
|
|
|
50,009 |
|
|
|
2,653 |
|
|
|
72,009 |
|
William T. (“Pete”) DeLay |
|
|
8,333 |
|
|
|
33,327 |
|
|
|
1,768 |
|
|
|
41,660 |
|
Sam B. DeVane |
|
|
46,000 |
|
|
|
24,995 |
|
|
|
1,326 |
|
|
|
70,995 |
|
Thomas R. Flynn |
|
|
13,500 |
|
|
|
50,009 |
|
|
|
2,653 |
|
|
|
63,509 |
|
William H. (“Harrison”) Frist, Jr. |
|
|
9,000 |
|
|
|
33,327 |
|
|
|
1,768 |
|
|
|
42,327 |
|
Louis A. Green III |
|
|
14,833 |
|
|
|
50,009 |
|
|
|
2,653 |
|
|
|
64,842 |
|
Valora S. Gurganious |
|
|
32,000 |
|
|
|
32,497 |
|
|
|
1,724 |
|
|
|
64,497 |
|
Myra NanDora Jenne |
|
|
44,500 |
|
|
|
24,995 |
|
|
|
1,326 |
|
|
|
69,495 |
|
Joelle J. Phillips |
|
|
38,500 |
|
|
|
24,995 |
|
|
|
1,326 |
|
|
|
63,495 |
|
Stephen B. Smith |
|
|
19,500 |
|
|
|
50,009 |
|
|
|
2,653 |
|
|
|
69,509 |
|
James S. Turner, Jr. |
|
|
0 |
|
|
|
125,013 |
|
|
|
6,632 |
|
|
|
125,013 |
|
Toby S. Wilt |
|
|
30,000 |
|
|
|
32,497 |
|
|
|
1,724 |
|
|
|
62,497 |
|
132
Compensation Committee Interlocks and Insider Participation
No member of our Compensation and Human Resources Committee (i) is or has ever been an employee of the Company or our Bank, (ii) was, during the last completed fiscal year, a participant in any related-party transaction requiring disclosure under Part III, Item 13 of this Annual Report on Form 10-K “Certain Relationships and Related Transactions,” except with respect to loans made to such committee members in the ordinary course of business on substantially the same terms as those prevailing at the time for comparable transactions with unrelated parties or (iii) had, during the last completed fiscal year, any other interlocking relationship requiring disclosure under applicable SEC rules.
Compensation and Human Resources Committee Report
The Compensation and Human Resources Committee has reviewed and discussed with management the Compensation Discussion and Analysis (“CD&A”) required by Item 402(b) of Regulation S-K and contained in this Annual Report on Form 10-K. Based on this review and discussion, the Compensation and Human Resources Committee recommended to the Board that the CD&A be included in this Annual Report on Form 10-K.
This report has been furnished by the Compensation and Human Resources Committee of the Board:
Myra NanDora Jenne (Chair)
Sam DeVane
Thomas R. Flynn
William Harrison Frist, Jr.
Joelle Phillips
The above Compensation and Human Resources Committee Report does not constitute "soliciting material" and shall be deemed "furnished" and not be deemed "filed" and shall not be incorporated by reference into any other CapStar filing under the Securities Act of 1933 or the Securities Exchange Act of 1934, except to the extent CapStar specifically incorporates this report by reference therein.
ITEM 12. SECURITY OWNERSHIP OF CERTAIN BENEFICIAL OWNERS AND MANAGEMENT AND RELATED STOCKHOLDER MATTERS
Security Ownership of Certain Beneficial Owners and Management
The following table sets forth the beneficial ownership of our common stock as of February 29, 2024 by:
133
Name of Beneficial Owner(1) |
|
Amount and Nature |
|
|
Percent of Class (3) |
|
|
||
5% Shareholders Who Are Not Directors |
|
|
|
|
|
|
|
||
Blackrock, Inc. (4) |
|
|
1,688,594 |
|
|
|
8.2 |
% |
|
Gaylon M. Lawrence, Jr. (5) |
|
|
873,886 |
|
|
|
4.2 |
% |
|
Directors |
|
|
|
|
|
|
|
||
L. Earl Bentz (6) (7) |
|
|
251,833 |
|
|
|
1.2 |
% |
|
William T. (“Pete”) DeLay (6) |
|
8,758 |
|
|
* |
|
|
||
Sam B. DeVane (6) |
|
|
10,164 |
|
|
* |
|
|
|
Thomas R. Flynn (6) (8) |
|
|
286,123 |
|
|
|
1.3 |
% |
|
Harrison Frist (6) |
|
|
3,758 |
|
|
* |
|
|
|
Louis A. Green, III (6) (9) |
|
|
123,931 |
|
|
* |
|
|
|
Valora S. Gurganious (6) |
|
|
6,213 |
|
|
* |
|
|
|
Myra NanDora Jenne (6) |
|
|
90,573 |
|
|
* |
|
|
|
Joelle J. Phillips (6) |
|
|
7,083 |
|
|
* |
|
|
|
Timothy K. Schools (6) (10) |
|
|
124,393 |
|
|
* |
|
|
|
Stephen B. Smith (6) (11) |
|
|
61,743 |
|
|
* |
|
|
|
James S. Turner, Jr. (6) (12) |
|
|
572,597 |
|
|
|
2.7 |
% |
|
Toby S. Wilt (6) (13) |
|
|
574,257 |
|
|
|
2.7 |
% |
|
Executive Officers Who Are Not Directors |
|
|
|
|
|
|
|
||
Michael J. Fowler (6) |
|
|
10,067 |
|
|
* |
|
|
|
Alison L. Jefferson |
|
|
- |
|
|
* |
|
|
|
Kevin Lambert (6) (14) |
|
|
3,034 |
|
|
* |
|
|
|
Christopher G. Tietz (6) (15) |
|
|
86,899 |
|
|
* |
|
|
|
Kenneth E. Webb (6) |
|
|
38,309 |
|
|
* |
|
|
|
Directors and Executive Officers as a Group (18 persons) |
|
2,259,735 |
|
|
10.5% |
|
|
||
* Indicates one percent or less.
134
Securities authorized for issuance under equity compensation plans
The following table summarizes information concerning the Company’s equity compensation plans at December 31, 2023:
|
|
|
|
|
|
|
|
Number of shares |
|
|||
|
|
Number of shares |
|
|
|
|
|
remaining |
|
|||
|
|
to be issued |
|
|
Weighted |
|
|
available for |
|
|||
|
|
upon |
|
|
average exercise |
|
|
future issuances |
|
|||
|
|
exercise of |
|
|
price of |
|
|
under equity |
|
|||
|
|
outstanding |
|
|
outstanding |
|
|
compensation |
|
|||
|
|
options, |
|
|
options, |
|
|
plans (excluding |
|
|||
|
|
warrants |
|
|
warrants |
|
|
shares reflected |
|
|||
|
|
and rights |
|
|
and rights |
|
|
in column (a)) |
|
|||
Plan Category |
|
(a) |
|
|
(b) |
|
|
(c) |
|
|||
Equity compensation plans approved by shareholders: |
|
|
|
|
|
|
|
|
|
|||
|
|
|
92,865 |
|
|
$ |
13.24 |
|
|
|
1,046,291 |
|
Equity compensation plans not approved by shareholders |
|
|
— |
|
|
|
— |
|
|
|
— |
|
Total |
|
|
92,865 |
|
|
$ |
13.24 |
|
|
|
1,046,291 |
|
ITEM 13. CERTAIN RELATIONSHIPS AND RELATED TRANSACTIONS, AND DIRECTOR INDEPENDENCE
Banking Transactions with Related Parties
Our Bank has made in the past and, assuming continued satisfaction of generally applicable credit standards, expects to continue to make loans to directors, executive officers, principal shareholders and their affiliates including corporations or organizations for which they serve as officers or directors or in which they have beneficial ownership interests of 10% percent or more. These loans have all been made in the ordinary course of our business on substantially the same terms, including interest rates and collateral, as those prevailing at the time for comparable transactions with persons not related to us. Further, such loans are and will be subject to the policies and procedures regarding related-party transactions discussed below, and they do not present us with more than the normal risk of uncollectibility or other unfavorable characteristics.
Lease of Corporate Headquarters
As of the date of this Form 10-K, we understand that Mr. Gaylon Lawrence or his affiliates, who, as of the most recent Schedule 13D filed by him with the SEC, owns more than 5% of our common stock, may have an economic interest in the lease of our corporate headquarters located at 1201 Demonbreun Street, Suite 700, Nashville, Tennessee via a direct or indirect ownership in the entity that is our landlord. However, as of the date of this Form 10-K, we have been unable to ascertain the extent of the ownership of Mr. Lawrence or his affiliates in the landlord entity, and, therefore, we are unable to approximate the dollar value of the interest of Mr. Lawrence or his affiliates in the lease and whether such amount is material. Mr. Lawrence or his affiliates were not 5% or greater shareholders when we originally entered
135
into the lease. During the fiscal year ended December 31, 2023, the Company paid approximately $1.26 million in rent pursuant to the terms of the lease.
Policies and Procedures Regarding Related-Party Transactions
Transactions involving the Company and/or the Bank and their respective affiliates and insiders are subject to regulatory requirements and restrictions as well as our own policies and procedures. These requirements and restrictions include Sections 23A and 23B of the Federal Reserve Act (which govern certain transactions by our Bank with its affiliates) and the Federal Reserve’s Regulation O (which governs certain loans by our Bank to its executive officers, directors, and principal shareholders). We have adopted policies to comply with these regulatory requirements and restrictions, including provisions in our Loan and Credit Administration Policy that place restrictions on the Bank with respect to loans to our executive officers, directors and principal shareholders. Pursuant to its charter, our Risk Committee is responsible for ensuring that extensions of credit to directors, executive officers and their affiliates comply with all applicable law, reviewing loans that are subject to Regulation O and, if required by Regulation O and where appropriate, recommending such loans to the full Board for approval. Our Audit Committee approves all related-party transactions that are not subject to Regulation O.
In addition, our Board has adopted a written policy governing the approval of related-party transactions that complies with all applicable requirements of the SEC and Nasdaq concerning related-party transactions. Related-party transactions, for purposes of the requirements of the SEC and Nasdaq, are transactions in which we are a participant, the amount involved exceeds $120,000 and a related-party has or will have a direct or indirect material interest. Our related parties include our directors (including nominees for election as directors), executive officers, 5% or greater shareholders and the immediate family members of these persons. Our Chief Financial Officer, in consultation with management and outside counsel, as appropriate, will review potential related-party transactions to determine if they are subject to the policy. If so, the transaction will be referred to our Audit Committee or, if such transaction is a loan subject to Regulation O, our Credit Committee. In determining whether to approve a related-party transaction, our Audit Committee or Credit Committee, as applicable, will consider, among other factors, the fairness of the proposed transaction, the direct or indirect nature of the related-party’s interest in the transaction, the appearance of an improper conflict of interests for any director, executive officer or 5% or greater shareholder, taking into account the size of the transaction and the financial position of the related-party, whether the transaction would impair a director’s independence, the acceptability of the transaction to our regulators and the potential violations of other company policies. Our Related-Party Transactions Policy is available on our website at www.ir.capstarbank.com, as an annex to our Corporate Governance Guidelines.
Director Independence
CapStar’s Board of Directors is committed to strong corporate governance principles and full transparency in all areas of our operations. Our Board has affirmatively determined that, with the exception of Mr. Schools, our Chief Executive Officer, each of our directors identified in Part III, Item 10 of this Form 10-K satisfies the requirements for independence under the rules and regulations established by the SEC, Nasdaq, and the FDIC, as well those prescribed in our Corporate Governance Guidelines and the Nominating/Governance Committee Charter. Our guidelines and committee charters are available on our website at “Investor Relations.”
ITEM 14. PRINCIPAL ACCOUNTANT FEES AND SERVICES
Audit and Non-Audit Fees
The following table presents the aggregate fees billed by Elliott Davis, PLLC for the two most recent fiscal years ended December 31, 2023 and December 31, 2022, respectively:
|
|
2023 |
|
|
2022 |
|
||
Audit Fees (1) |
|
$ |
453,558 |
|
|
$ |
256,000 |
|
Audit-Related Fees (2) |
|
|
15,000 |
|
|
|
14,000 |
|
Tax Fees |
|
|
— |
|
|
|
— |
|
All Other Fees |
|
|
— |
|
|
|
— |
|
Total Fees |
|
$ |
468,558 |
|
|
$ |
270,000 |
|
136
Pre-Approval Policies and Procedures
Pursuant to its charter, the Audit Committee reviews and pre-approves audit and permissible non-audit services performed by the Company’s independent registered public accounting firm as well as the scope, fees, and other terms of such services. The Audit Committee may not approve any service that individually or in the aggregate may impair, in the Audit Committee’s opinion, the independence of the independent registered public accounting firm. The Audit Committee may delegate to one or more designated committee members the authority to grant pre-approvals of audit and permitted non-audit services, provided that any decisions to pre-approve shall be presented to the full Audit Committee at its next scheduled meeting. The Audit Committee has delegated its authority to pre-approve audit, audit-related, and non-audit services to the Chair of the Committee. For the fiscal years 2023 and 2022, respectively, all of the audit and non-audit services provided by the Company’s independent registered public accounting firm were pre-approved by the Audit Committee or the Chair of the Audit Committee in accordance with the Audit Committee Charter.
137
PART IV
ITEM 15. EXHIBIT AND FINANCIAL STATEMENT SCHEDULES
(a) The following is a list of documents filed as a part of this Report:
The following consolidated financial statements of CapStar and its subsidiary and related reports of our independent registered public accounting firm are incorporated into this Item 15 by reference from Part I - Item 8, pages 54 through 109.
Consolidated Balance Sheets as of December 31, 2023 and 2022
Consolidated Statements of Income for the years ended December 31, 2023, 2022, and 2021
Consolidated Statements of Changes in Shareholders' Equity for the years ended December 31, 2023, 2022, 2021
Consolidated Statements of Cash Flows for the years ended December 31, 2023, 2022, 2021
Notes to Consolidated Financial Statements
the required information is not applicable
ITEM 16. FORM 10-K SUMMARY
None.
138
EXHIBIT INDEX
Exhibit |
|
Description |
|
|
|
2.1*** |
|
|
|
|
|
3.1 |
|
|
|
|
|
3.2 |
|
|
|
|
|
4.1 |
|
|
|
|
|
4.2 |
|
|
|
|
|
10.1† |
|
|
|
|
|
10.2† |
|
|
|
|
|
10.3† |
|
|
|
|
|
10.4† |
|
|
|
|
|
10.5† |
|
|
|
|
|
10.6† |
|
|
|
|
|
10.7† |
|
|
|
|
|
139
10.8† |
|
|
|
|
|
10.9† |
|
|
|
|
|
10.10† |
|
|
|
|
|
10.11† |
|
|
|
|
|
10.12† |
|
|
|
|
|
10.13† |
|
|
|
|
|
10.14† |
|
|
|
|
|
10.15† |
|
|
|
|
|
10.16† |
|
|
|
|
|
10.17† |
|
|
|
|
|
10.18† |
|
|
|
|
|
10.19† |
|
|
|
|
|
10.20† |
|
|
|
|
|
140
* Filed with this Annual Report on Form 10-K.
** Furnished with this Annual Report on Form 10-K.
*** Schedules have been omitted pursuant to Item 601(a)(5) of Regulation S-K
† Represents a management contract or a compensatory plan or arrangement.
141
SIGNATURES
Pursuant to the requirements of Section 13 or 15(d) of the Securities Exchange Act of 1934, as amended, the Registrant has duly caused this Report to be signed on its behalf by the undersigned, thereunto duly authorized.
|
|
CAPSTAR FINANCIAL HOLDINGS, INC. |
||
|
|
|
|
|
Date: March 12, 2024 |
|
By: |
|
/s/ Timothy K. Schools |
|
|
|
|
Timothy K. Schools |
|
|
|
|
President and Chief Executive Officer |
POWER OF ATTORNEY
KNOW ALL MEN BY THESE PRESENTS, that each person whose signature appears below constitutes and appoints Timothy K. Schools and Michael J. Fowler, and each of them, as his or her true and lawful attorney-in-fact and agent with full power of substitution and resubstitution, for such individual in any and all capacities, to sign any and all amendments to this Annual Report on Form 10-K, and to file the same, with all exhibits thereto and other documents in connection therewith, with the Securities and Exchange Commission, granting unto said attorneys-in-fact and agents, and each of them, full power and authority to do and perform each and every act and thing requisite and necessary to be done in connection therewith, as fully for all intents and purposes as he or she might or could do in person, hereby ratifying and confirming all that said attorneys-in-fact and agents, or any of them, or the individual’s substitute, may lawfully do or cause to be done by virtue hereof.
Pursuant to the requirements of the Securities Exchange Act of 1934, this report has been signed below by the following persons on behalf of the registrant and in the capacities and on the dates indicated.
Signature |
|
Title |
|
Date |
|
|
|
||
/s/ Timothy K. Schools |
|
Director, President and Chief Executive Officer |
|
March 12, 2024 |
Timothy K. Schools |
|
(Principal Executive Officer) |
|
|
|
|
|
|
|
/s/ Michael J. Fowler |
|
Chief Financial Officer and Controller |
|
March 12, 2024 |
Michael J. Fowler |
|
(Principal Financial Officer and Controller) |
|
|
|
|
|
|
|
/s/ L. Earl Bentz L. Earl Bentz |
|
Director |
|
March 12, 2024 |
|
|
|||
|
|
|
|
|
/s/ William T. Delay |
|
Director |
|
March 12, 2024 |
William T. Delay |
|
|
|
|
|
|
|
|
|
/s/ Sam B. DeVane Sam B. DeVane |
|
Director |
|
March 12, 2024 |
|
|
|||
|
|
|
|
|
/s/ Thomas R. Flynn Thomas R. Flynn |
|
Director |
|
March 12, 2024 |
|
|
|
||
|
|
|
|
|
/s/ William Harrison Frist, Jr. |
|
Director |
|
March 12, 2024 |
W. Harrison Frist, Jr. |
|
|
|
|
|
|
|
|
|
/s/ Louis A. Green III |
|
Director |
|
March 12, 2024 |
Louis A. Green III |
|
|
|
|
|
|
|
|
|
/s/ Valora S. Gurganious |
|
Director |
|
March 12, 2024 |
Valora S. Gurganious |
|
|
|
|
|
|
|
||
/s/ Myra NanDora Jenne |
|
Director |
|
March 12, 2024 |
Myra NanDora Jenne |
|
|
|
|
|
|
|
|
|
Joelle J. Phillips |
|
Director |
|
|
|
|
|||
|
|
|
|
|
Stephen B. Smith |
|
Director |
|
|
|
|
|||
|
|
|
|
|
/s/ James S. Turner, Jr. James S. Turner, Jr. |
|
Director |
|
March 12, 2024 |
|
|
|||
|
|
|
|
|
Toby S. Wilt |
|
Director |
|
|
|
|
|||
142
143