UNITED STATES
SECURITIES AND EXCHANGE COMMISSION
Washington, D.C. 20549
FORM 10-K
(Mark One)
ANNUAL REPORT PURSUANT TO SECTION 13 OR 15(d) OF THE SECURITIES EXCHANGE ACT OF 1934 |
For the fiscal year ended December 31, 2019
or
TRANSITION REPORT PURSUANT TO SECTION 13 OR 15(d) OF THE SECURITIES EXCHANGE ACT OF 1934 |
For the transition period from____ to____
Commission file number: 001-37820
(Exact name of registrant as specified in its charter)
(State or other jurisdiction of | (I.R.S. Employer |
incorporation or organization) | Identification No.) |
(Zip Code) | ||
(Address of principal executive offices) | ||
Registrant’s telephone number, including area code: (832 ) 308-4000
Securities registered pursuant to Section 12(b) of the Act:
Title of each class | Trading Symbol(s) | Name of each exchange on which registered |
Securities registered pursuant to section 12(g) of the Act: None
Indicate by check mark if the registrant is a well-known seasoned issuer, as defined in Rule 405 of the Securities Act. Yes ☑ No ☐
Indicate by check mark if the registrant is not required to file reports pursuant to Section 13 or 15(d) of the Act. Yes ☐ No ☑
Indicate by check mark whether the registrant (1) has filed all reports required to be filed by Section 13 or 15(d) of the Securities Exchange Act of 1934 during the preceding 12 months (or for such shorter period that the registrant was required to file such reports), and (2) has been subject to such filing requirements for the past 90 days. Yes ☑ No ☐
Indicate by check mark whether the registrant has submitted electronically every Interactive Data File required to be submitted pursuant to Rule 405 of Regulation S-T during the preceding twelve months (or for such shorter period that the registrant was required to submit such files). Yes ☑ No ☐
Indicate by check mark whether the registrant is a large accelerated filer, an accelerated filer, a non-accelerated filer, a smaller reporting company, or an emerging growth company. See the definitions of "large accelerated filer," "accelerated filer," "smaller reporting company," and "emerging growth company" in Rule 12b-2 of the Exchange Act.
☑ | Accelerated filer | ☐ | Non-accelerated filer | ☐ | ||
Smaller reporting company | Emerging growth company | |||||
If an emerging growth company, indicate by check mark if the registrant has elected not to use the extended transition period for complying with any new or revised financial accounting standards provided pursuant to Section 13(a) of the Exchange Act. ☐
Indicate by check mark whether the registrant is a shell company (as defined in Rule 12b-2 of the Act). Yes ☐ No ☑
Aggregate market value of common shares held by non-affiliates as June 28, 2019, the last business day of the registrant’s most recently completed second fiscal quarter, based on the reported last sale price of common shares on that date: $1,247,016,838 .
Number of shares outstanding as of February 27, 2020: 44,914,118 Ordinary Shares, nominal value $0.01 per share.
DOCUMENTS INCORPORATED BY REFERENCE
Portions of our definitive proxy statement for the 2020 Annual Meeting of Shareholders, which will be filed with the Securities and Exchange Commission within 120 days of December 31, 2019, are incorporated by reference into Part III of this Annual Report on Form 10-K.
CARDTRONICS PLC
TABLE OF CONTENTS
Page | ||
When we refer to “us,” “we,” “our,” “ours,” “the Company,” or “Cardtronics,” we are describing Cardtronics plc and/or our subsidiaries, unless the context indicates otherwise.
2
CAUTIONARY STATEMENT REGARDING FORWARD-LOOKING STATEMENTS
This Annual Report on Form 10-K for the year ended December 31, 2019 (this “2019 Form 10-K”) contains certain forward-looking statements within the meaning of the Private Securities Litigation Reform Act of 1995, and are intended to be covered by the safe harbor provisions thereof. Forward-looking statements can be identified by words such as “project,” “believe,” “estimate,” “expect,” “future,” “anticipate,” “intend,” “contemplate,” “foresee,” “would,” “could,” “plan,” and similar expressions that are intended to identify forward-looking statements, which are generally not historical in nature. These forward-looking statements are based on management’s current expectations and beliefs concerning future developments and their potential effect on the Company. While management believes that these forward-looking statements are reasonable as and when made, there can be no assurance that future developments affecting the Company will be those that are anticipated. All comments concerning the Company’s expectations for future revenues and operating results are based on its estimates for its existing operations and do not include the potential impact of any future acquisitions. The Company’s forward-looking statements involve significant risks and uncertainties (some of which are beyond its control) and assumptions that could cause actual results to differ materially from its historical experience and present expectations or projections. Known material factors that could cause actual results to differ materially from those in the forward-looking statements include:
• | the Company’s financial outlook and the financial outlook of the automated teller machines and multi-function financial services kiosks (collectively, “ATMs”) industry and the continued usage of cash by consumers at rates near historical patterns; |
• | the Company’s ability to respond to recent and future network and regulatory changes; |
• | the Company’s ability to manage cybersecurity risks and protect against cyber-attacks and manage and prevent cyber incidents, data breaches or losses, or other business disruptions; |
• | the Company’s ability to respond to changes implemented by networks and how they determine interchange, scheduled and potential reductions in the amount of net interchange that it receives from global and regional debit networks due to pricing changes implemented by those networks as well as changes in how issuers route their ATM transactions over those networks; |
• | the Company’s ability to renew its existing merchant relationships on comparable or improved economic terms and add new merchants; |
• | changes in interest rates and foreign currency rates; |
• | the Company’s ability to successfully manage its existing international operations and to continue to expand internationally; |
• | the Company’s ability to manage concentration risks with and changes in the mix of key customers, merchants, vendors, and service providers; |
• | the Company’s ability to prevent thefts of cash and maintain adequate insurance; |
• | the Company’s ability to provide new ATM solutions to retailers and financial institutions including the demand for any such new ATM solutions as well as its ability to place additional banks’ brands on ATMs currently deployed; |
• | the Company’s ATM vault cash rental needs, including potential liquidity issues with its vault cash providers and its ability to continue to secure vault cash rental agreements in the future and once secured, on reasonable economic terms; |
• | the Company’s ability to manage the risks associated with its third-party service providers failing to perform their contractual obligations; |
• | the Company’s ability to renew its existing third-party service provider relationships on comparable or improved economic terms; |
• | the Company’s ability to successfully implement and evolve its corporate strategy; |
• | the Company’s ability to compete successfully with new and existing competitors; |
• | the Company’s ability to meet the service levels required by its service level agreements with its customers; |
• | the additional risks the Company is exposed to in its United Kingdom (“U.K.”) armored transport business; |
• | the Company’s ability to pursue, complete, and successfully integrate acquisitions, strategic alliances, or joint ventures; |
• | the impact of changes in laws, including tax laws that could adversely affect the Company’s business and profitability; |
• | the impact of, or uncertainty related to, the U.K.’s exit from the European Union, including any material adverse effect on the tax, tax treaty, currency, operational, legal, human, and regulatory regime and macro-economic environment to which it will be subject to as a U.K. company; |
• | the Company’s ability to adequately maintain and upgrade its ATM fleet to address changes in industry standards, regulations and consumer behavior patterns; |
• | the Company’s ability to retain its key employees and maintain good relations with its employees; and |
• | the Company’s ability to manage the fluctuation of its operating results, including as a result of the foregoing and other risk factors included in the Company's Annual Report on Form 10-K for the year ended December 31, 2019. |
3
For additional information regarding known material factors that could cause the Company’s actual results to differ from its projected results, see Part I. Item 1A. Risk Factors in this 2019 Form 10-K. Readers are cautioned not to place undue reliance on forward-looking statements contained in this document, which speak only as of the date of this 2019 Form 10-K. Except as required by applicable law, the Company undertakes no obligation to update or revise any forward-looking statements publicly after the date they are made, whether as a result of new information, future events, or otherwise.
4
PART I
ITEM 1. BUSINESS
Overview
Cardtronics plc provides convenient automated consumer financial services through its global network of automated teller machines and multi-function financial services kiosks (collectively referred to as “ATMs”). As of December 31, 2019, we were the world’s largest ATM owner/operator, providing various services to approximately 285,000 ATMs globally.
During 2019, approximately 64% of our revenues were derived from our operations in North America (including our ATM operations in the U.S., Canada, and Mexico), approximately 29% of our revenues were derived from our operations in Europe and Africa (including our ATM operations in the U.K., Ireland, Germany, Spain, and South Africa), and approximately 7% of our revenues were derived from our operations in Australia and New Zealand. As of December 31, 2019, we owned and operated approximately 74,000 ATMs, many located in well-known retail locations across our markets. These company-owned ATMs accounted for approximately 87% of our total ATM operating revenues during 2019.
Also included within our network as of December 31, 2019 were approximately 198,000 ATMs to which we provided processing services or various forms of managed services solutions. Under a managed services arrangement, retailers, financial institutions, and ATM distributors rely on us to handle some or all of the operational aspects associated with operating and maintaining ATMs, typically in exchange for a monthly service fee, a fee per transaction, a fee per service provided, or a combination of these fees.
We provide various ATM-based financial services at retail locations and other high-traffic locations, such as shopping malls, airports, train stations, and casinos. In doing so, we provide our retail partners with a compelling automated financial services solution that helps attract and retain customers. We also partner with financial institutions and other providers of consumer financial services to enable convenient and fee-free access to our ATMs via our surcharge-free solutions. Finally, we provide managed service ATM solutions for retailers and financial institutions with a complete range of service offerings related to ATMs, including electronic funds transfer (“EFT”) transaction processing services, along with many other ATM-related services, depending on the needs of the customer.
We generally operate ATMs under three arrangement types with our retail partners: Company-owned ATM placements, merchant-owned ATM placements, and managed services (which includes transaction processing services). Under Company-owned arrangements, we provide the physical ATM and are typically responsible for all aspects of the ATM’s operations, including transaction processing, managing cash and cash delivery, supplies, and telecommunications, as well as routine and technical maintenance. Under merchant-owned arrangements, the retail merchant, financial institution or an independent distributor owns the ATM and is usually responsible for providing cash and performing simple maintenance tasks, while we generally provide more complex maintenance services, transaction processing, and connection to the EFT networks. We also offer various forms of managed services depending on the needs of our customers. Each managed service arrangement is a customized ATM management solution that can include any combination of the following services: monitoring, maintenance, cash management, cash delivery, customer service, transaction processing, and other types of related services. As of December 31, 2019, approximately 26% of our ATMs operated were Company-owned, and approximately 74% of our ATMs were merchant-owned or operated under a managed services solution. Each of the arrangement types described above are attractive to us and we plan to continue growing our revenues under each arrangement type.
In addition to our retail merchant relationships, we also partner with leading financial institutions to brand selected ATMs within our network, including but not limited to BBVA Compass Bancshares, Inc. (“BBVA”), Citibank, N.A. (“Citibank”), Citizens Financial Group, Inc. (“Citizens”), Cullen/Frost Bankers, Inc. (“Cullen/Frost”), Discover Bank (“Discover”), PNC Bank, N.A. (“PNC Bank”), Santander Bank, N.A. (“Santander”), TD Bank, N.A. (“TD Bank”), United Services Automobile Association ("USAA") in the U.S.; BMO Bank of Montreal (“BMO”), the Bank of Nova Scotia (“Scotiabank”), Canadian Imperial Bank Commerce (“CIBC”), and TD Bank in Canada; the Bank of Queensland Limited (“BOQ”) and HSBC Holdings plc (“HSBC”) in Australia; and Capitec Bank ("Capitec"), Mercantile Bank ("Mercantile") and Old Mutual ("Old Mutual") in South Africa. In Mexico, we partner with Scotiabank and Banco Multiva by putting their brands on our ATMs in exchange for certain services provided by them. As of December 31, 2019, approximately 21,000 of our ATMs were under a bank-branding contract with approximately 500 financial institutions to place their logos on the ATMs and to provide convenient surcharge-free access for their banking customers. We also provide managed service offerings for financial institutions, which generally include full outsourcing of a portion or all of the financial institution's ATMs.
5
We also own and operate the Allpoint network (“Allpoint”), the largest surcharge-free ATM network (based on the number of participating ATMs). Allpoint, with approximately 58,000 participating ATMs, provides surcharge-free ATM access to nearly 1,200 participating credit unions, banks, digital banks, financial technology companies, and stored-value debit card issuers that are principally located in North America. For participants, Allpoint provides scale, density, and convenience of surcharge-free ATMs that surpasses the largest banks in the U.S. In exchange, Allpoint earns a fixed monthly fee per cardholder and/or a fixed fee per transaction that is paid by participants. Allpoint includes a majority of our Company’s ATMs in the U.S., and certain ATMs in the U.K., Canada, Mexico, and Australia. Allpoint also provides services to organizations that manage stored-value debit card programs on behalf of corporate entities and governmental agencies, including general-purpose, payroll, and electronic benefits transfer (“EBT”) cards. Under these programs, the issuing organizations pay us a fee per issued stored-value debit card or per transaction in return for allowing the users of those cards surcharge-free access to Allpoint’s ATM network.
Our revenues are generally recurring in nature and historically have been mainly derived from convenience transaction fees, which are paid by cardholders, as well as other transaction-based fees, including interchange fees, which are paid by the cardholder’s financial institution or card issuer for the use of the ATMs serving their customers and connectivity to the applicable EFT network that transmits data between the ATM and the cardholder’s financial institution. Other revenue sources include: (i) fees from financial institutions that participate in Allpoint, (ii) fees for bank-branding ATMs and providing financial institution cardholders with surcharge-free access, (iii) revenues earned by providing managed services (including transaction processing services) solutions to retailers and financial institutions, (iv) fees earned from foreign currency exchange transactions at the ATM, known as dynamic currency conversion (“DCC”), and (v) revenues from the sale of ATMs and ATM-related equipment and other ancillary services.
Our Strategy
Our strategy is to leverage the expertise, scale, and network we have built in our largest markets and to continue to expand in those markets. We believe there are significant growth opportunities for our business as the consumer financial services industry transforms with new consumer payment options, changes in consumer payments behavior and the evolution of traditional retail banking. These dynamics and trends have caused banks to continue to reduce their physical branch locations across the markets in which we operate, making our ATMs more attractive as digital-to-physical solutions for the customers of both traditional banks and new emerging consumer financial services companies. With our significant network of ATM locations, comprehensive solutions, extensive expertise, and operating history, we believe we can provide value to consumer financial services organizations of all sizes and grow our revenues and profits.
We plan to drive additional transactions at our existing ATMs by making them increasingly attractive to use by banks and their customers by promoting the convenience of our network and offering additional services and capabilities. We also intend to expand our capabilities and service offerings to financial institutions and digital financial service providers, with whom we are seeing increasing demand for outsourcing of ATM-related services, including, in some cases, management of in-branch ATMs. Additional demand for our products and services is, in part, being driven by banks reducing the number of physical branches they operate and bank initiatives to lower their operating and capital costs. Furthermore, many start-up or challenger banks and providers of consumer financial services are increasingly valuing our convenient ATM network to provide physical cash-related services to their customers. Additionally, we seek to deploy additional products and services that will further incentivize consumers to utilize our network of ATMs. We also plan to continue partnering with leading financial institutions and retailers to expand our network of conveniently located ATMs. In the future, we may seek to diversify our revenues beyond the services provided by our ATMs. We seek to capitalize on opportunities to expand our operations through the following efforts:
Expand our relationships with leading financial institutions. Through our extensive network of ATMs as well as our diverse product and service offerings, we believe we can provide financial institution customers with convenient solutions to fulfill their growing ATM and automated consumer financial services requirements. Services currently offered to financial institutions include bank-branding, deposit solutions, surcharge-free access provided to their cardholders, managed services for their ATM portfolios and on-screen marketing and content management. Our EFT transaction processing platforms enable us to provide customized control over the content of the information appearing on the screens of our ATMs and ATMs we process for financial institutions, which increases the types of products and services we are able to offer to financial institutions. We also plan to continue growing the number of ATMs and financial institutions participating in our Allpoint network, which drives higher transaction volumes and profitability on our existing ATMs and increases our value to the retailers where our ATMs are located through increased foot traffic at their stores. We are seeing increasing demand from financial institutions for the outsourcing of ATM-related services, as recent industry trends have caused many banks to reduce their physical footprints and transform their existing branches to focus less on human tellers and increasingly utilize automation, through ATMs and other digital channels, for serving their customers.
Work with non-traditional financial institutions and card issuers to further leverage our extensive ATM network. We believe there are opportunities to develop or expand relationships with non-traditional financial institutions and card issuers, such as reloadable stored-value debit card issuers, digital-only balances held by consumers, and alternative payment networks, which are
6
seeking an extensive and convenient ATM network to complement their card offerings and electronic-based accounts. Additionally, we believe that many of the stored-value debit card issuers in the U.S. can benefit by providing their cardholders with access to our ATM network on a discounted or free-to-use basis. For example, through our Allpoint network, we have sold access to our ATM network to issuers of stored-value debit cards to provide their cardholders with convenient, surcharge-free access to cash. Additionally, challenger digital banks and providers of consumer financial services that lack a physical branch or ATM network of their own have partnered with us to provide their customers with convenient and free access to ATM services.
Increase transaction levels at our existing locations. We believe there are opportunities to increase the number of transactions that are occurring today at our existing ATM locations. On average, only a small fraction of the individuals that enter our retail customers’ locations utilize our ATMs. In addition to our existing initiatives that tend to drive additional transaction volumes to our ATMs, such as bank-branding and network-branding, we have developed and are continuing to develop new initiatives to drive incremental transactions to our existing ATM locations. We also operate and continue to develop programs to steer cardholders of our existing financial institution partners and members of our Allpoint network to visit our ATMs in convenient retail locations. These programs may include incentives to cardholders, such as coupons and rewards, that influence customers to visit our ATMs within our existing retail footprint. We also continue to invest in data analytics to better understand the usage patterns of our ATMs to help us identify opportunities for growth. We also include growth in transaction volumes as an incentive compensation metric for our relationship managers to help drive discussions with our existing financial institution partners to implement programs to drive their customers toward our ATMs. While we are in various stages of developing and implementing many of these programs, we believe that these programs, when properly structured, benefit multiple constituents, (i.e., retailers, financial institutions, and cardholders), in addition to driving increased transaction volumes to our ATMs, creating a synergistic network.
Increase our number of deployed ATMs with existing and new merchant relationships. Certain of our retail customers continue to expand the number of active store locations they operate, either through acquisitions or through new store openings, thus providing us with additional ATM deployment opportunities. Additionally, we seek opportunities to deploy ATMs with new retailers, including retailers that currently do not have ATMs, as well as those that have existing ATM programs, but that are looking for a new ATM provider. We believe our expertise, broad geographic footprint, strong record of customer service, and significant scale positions us to successfully market to and enter into long-term contracts with additional leading merchants.
Develop and provide additional services at our existing ATMs. The majority of our ATMs in service currently offer only cash dispensing and other simple transactions, such as balance inquiries. We believe that there are opportunities to offer additional automated consumer financial services at our ATMs, such as cash and check deposit, cardless cash access, and other products which could provide a compelling and cost-effective solution for financial institutions and stored-value debit card issuers looking to provide convenient and broader financial services to their customers at well-known retail locations. During 2019, we installed nearly one thousand deposit-taking ATMs in select markets throughout the United States and reached agreements with several financial institutions to provide their customers with access to these deposit-taking ATMs. We also allow advertisers to place their messages on our ATMs equipped with on-screen advertising software in the U.S., Canada, and the U.K. Offering additional services at our ATMs, such as advertising or cardless cash access, allows us to create new revenue streams from assets that have already been deployed in addition to providing value to our customers through beneficial offers and convenient services. We are focused on developing additional products and services that can be delivered through our existing ATM network.
Pursue additional managed services opportunities. Over the last several years, we expanded the number of ATMs that are operated under managed services arrangements. Under these arrangements, retailers and financial institutions generally pay us a fixed management fee per ATM and/or a fixed fee per transaction in exchange for handling some or all of the operational aspects associated with operating and maintaining their own ATMs. Surcharge and interchange fees under these arrangements are generally earned by the retailer or the financial institution rather than by us. As a result, in this arrangement type, our revenues are partially protected from fluctuations in transaction levels of these ATMs and changes in network interchange rates. We continue to pursue additional managed services opportunities with leading merchants and financial institutions in the markets in which we operate.
Additionally, we may grow in other markets and potentially expand into new international markets over time in order to enhance our position as a leading global provider of automated consumer financial services. For additional information related to items that may impact our strategy, see Part II. Item 7. Management’s Discussion and Analysis of Financial Condition and Results of Operations - Developing Trends and Recent Events.
Our Products and Services
Under our Company-owned arrangement type, we typically provide all of the services required to operate ATMs, which include monitoring, maintenance, cash management, customer service, and transaction processing. We believe our customers, including our retail and financial institution customers, value our high level of service, industry expertise, and established operating history. In connection with the operation of our ATMs under our traditional ATM services model, we earn revenue on a per transaction
7
basis from the surcharge fees charged to cardholders for the convenience of using our ATMs and from interchange fees charged to cardholders’ financial institutions for processing the transactions conducted on our ATMs. As further described below, we also earn revenues on these ATMs from branding with certain financial institutions and from our surcharge-free network, Allpoint. The Company-owned arrangement currently accounts for approximately 87% of our total ATM operating revenues.
Under our merchant-owned arrangement type, we typically provide transaction processing services, certain customer support functions, and settlement services. We generally earn interchange revenue on a per transaction basis in this arrangement. In some cases, the surcharge is earned completely by the merchant, in which case our revenues are derived solely from interchange revenues. In other arrangements, we also share a portion of the surcharge revenues.
For ATMs under managed services arrangements (including transaction processing arrangements), we typically receive a fixed monthly management fee and/or a fixed fee per transaction in return for providing the agreed-upon service or suite of services. We do not generally receive surcharge and interchange fees in these arrangements, but rather those amounts are earned by our customer.
We also earn revenues from other services at our ATMs, such as DCC fees, on-screen advertising, and other transaction-based fees across our various arrangement types.
The following table summarizes the number of ATMs under our various arrangement types as of December 31, 2019:
ATM Operations | ||||||
Company - Owned | Merchant -Owned, Managed Services and Processing | Total | ||||
Number of ATMs at period end | 74,482 | 212,291 | 286,773 | |||
Percentage of Total ATMs | 26% | 74% | 100% | |||
Percentage of ATM Operating Revenue | 87% | 13% | 100% | |||
We have found that the primary factor affecting transaction volumes at a given ATM is its location. Therefore, our strategy in deploying ATMs, particularly those placed under Company-owned arrangements, is to identify and deploy ATMs at locations that provide high visibility and high retail transaction volume. Our experience has demonstrated that the following locations often meet these criteria: convenience stores, gas stations, grocery stores, drug stores, transportation hubs (e.g., airports and train stations), casinos, and other major regional and national retail outlets.
We have entered into multi-year agreements with many well-known merchant retailers, including Bi-Lo Holdings, LLC, Circle K Procurement and Brands Limited (“Couche-Tard”), Cumberland Farms, Inc., CVS Caremark Corporation (“CVS”), HEB Grocery Company, L.P., The Kroger Co., The Pantry, Inc., Rite Aid Corporation, Safeway, Inc., Speedway LLC (“Speedway”), Target Corporation, and Walgreens Boots Alliance, Inc. (“Walgreens”) in the U.S., BP p.l.c., BT Group plc, Co-operative Food (“Co-op Food”), Martin McColl Ltd., Royal Dutch Shell plc, Southern Railway Ltd., Tates Ltd., Waitrose Ltd., and Welcome Break Holdings Ltd. in the U.K.; 7-Eleven, Inc. in Canada and Australia as well as Coles Supermarket Australia Pty Ltd. in Australia; Massmart Holdings Ltd. and Shoprite Holdings Ltd. in South Africa; and Total in Germany.
We generally operate our ATMs under multi-year contracts that provide a recurring and stable source of revenue and typically have an initial term of approximately five years. For the year ended December 31, 2019, the Company’s top five merchant customers were Co-op Food, Couche-Tard, CVS, Speedway, and Walgreens. No individual customer accounted for more than 6% of the Company’s total revenue in 2019. Together these merchant customers accounted for approximately 22% of our total revenues and had a weighted average remaining life of approximately 3.5 years. For additional information related to the risks associated with our customer mix, see Item 1A. Risk Factors - We derive a substantial portion of our revenue from ATMs placed with a small number of merchants. The expiration, termination or renegotiation of any of these contracts with our top merchants, or if one or more of our top merchants were to cease doing business with us, or substantially reduce their dealings with us, could cause our revenues to decline significantly and our business, financial condition and results of operations could be adversely impacted.
Additionally, we enter into arrangements with financial institutions to brand selected Company-owned ATMs with their logos. These bank-branding arrangements allow a financial institution to expand its geographic presence for less than the cost of building a branch location or placing one of its own ATMs at a new location and can also rapidly increase the bank's number of branded
8
ATM sites and improve its competitive position. Under these arrangements, the financial institution’s customers have access to use the bank-branded ATMs without paying a surcharge fee to us. In return, we typically receive a fixed management fee per ATM from the financial institution, while retaining our standard fee schedule for other cardholders using the bank-branded ATMs. In addition, our bank-branded ATMs typically earn higher interchange revenue as a result of the increased usage of our ATMs by the branding financial institution’s customers and others who prefer to use a bank-branded ATM. In some instances, we have branded an ATM with more than one financial institution. We intend to continue pursuing additional bank-branding arrangements as part of our growth strategy.
In addition to our bank-branding arrangements, we offer credit unions, banks, digital banks, and stored-value debit card issuers and other providers of consumer financial services another type of surcharge-free solution to their customers through our Allpoint surcharge-free ATM network. Under Allpoint, participants pay us a fixed monthly fee per cardholder and/or a fixed fee per transaction in exchange for us providing their cardholders with surcharge-free ATM access to approximately 58,000 participating ATMs in Allpoint, which includes ATMs throughout the U.S., the U.K., Canada, Mexico, and Australia. We also earn interchange revenues on each transaction performed, which is paid to us by the consumer’s financial institution. We believe Allpoint is an attractive option for providers of consumer financial services of all sizes to provide convenient consumer ATM-related services.
For additional information related to the amount of revenue contributed by our various service offerings, see Part II. Item 7. Management’s Discussion and Analysis of Financial Condition and Results of Operations - Components of Revenues, Costs of Revenues, and Expenses - Revenues.
Segment and Geographic Information
We operate in three segments: North America, Europe & Africa, and Australia & New Zealand. Our North America segment includes ATM operations in all 50 states in the U.S., Puerto Rico, Canada, and Mexico, and accounted for approximately 64% of our total revenues for the year ended December 31, 2019. Our Europe & Africa segment includes our ATM operations in the U.K., Ireland, Germany, Spain, and South Africa, and accounted for approximately 29% of our total revenues for the year ended December 31, 2019. Our Australia & New Zealand segment includes ATM operations in Australia and New Zealand and accounted for approximately 7% of our total revenues for the year ended December 31, 2019. While each of the reporting segments provides similar kiosk-based and/or ATM-related services, each segment is managed separately and requires different marketing and business strategies.
For financial information including revenues, earnings, and total assets of our reporting segments, see Part II. Item 8. Financial Statements and Supplementary Data, Note 22. Segment Information. For additional information related to the risks associated with our international operations, see Item 1A. Risk Factors - We operate in many sovereign jurisdictions across the globe and expect to continue to grow our business in new regions. Operating in different countries involves special risks, which could result in a reduction of our gross and net profits.
Sales and Marketing
Our sales and marketing teams are typically organized by customer type across retail and financial industries. We have teams focused on developing new relationships with national, regional, and local merchants, as well as building and maintaining relationships with our existing merchants and ATM distributors. In addition, we have sales and marketing teams focused on developing and managing our relationships with financial institutions, financial technology companies, and stored-value debit card issuers as we look to expand the types of services that we offer to such organizations. Our sales and marketing teams also focus on identifying potential managed services opportunities with financial institutions and retailers alike. We maintain sales teams in each of the geographic markets in which we currently operate.
In addition to targeting new business opportunities, our sales and marketing teams support our customer retention and growth initiatives by building and maintaining relationships with our existing merchants. We seek to identify growth opportunities within merchant accounts by analyzing ATM cardholder patterns and recommending programs that will tend to increase transaction volumes. We also analyze foot traffic and various demographic data to determine the best opportunities for new ATM placements, as well as the potential drivers for increasing same-store ATM transactions that will positively impact merchant store sales. Employees who focus on sales are typically compensated with a combination of incentive-based compensation and base salary.
Technology and Operations
Our technology and operations platforms consist of ATMs, central transaction processing systems, network infrastructure components, (including hardware, software, and telecommunication circuits used to provide real-time ATM monitoring, software distribution, and transaction processing services), cash management and forecasting software tools, customer service, information
9
security, and ATM management infrastructure. In most of our markets, except for our U.K. operations, a portion of our operations are outsourced to other providers, particularly with respect to physical cash delivery and physical maintenance services. Inclusive of both our internal capabilities and our partnerships, we offer end-to-end ATM service solutions for our retailer and financial partners, which we believe is a competitive advantage.
Transaction processing. We place significant emphasis on providing quality service with a high level of security and minimal interruption. We have carefully selected support vendors and systems, as well as developed internal professional staff to optimize the performance of our network. We operate our own EFT transaction processing platforms, which enables us to process and monitor transactions on our ATMs and to control the flow and content of information appearing on the screens of such ATMs. We have also implemented new products and services, such as dynamic currency conversion.
Internal systems. Our internal systems, including our EFT transaction processing platforms, include multiple layers of security to help protect the systems from unauthorized access. We use hardware-based and software-based security features to prevent and report unauthorized access attempts to our systems. We operate user authentication and security measures at multiple levels. These systems are protected by detailed security rules only to allow appropriate access to information based on the employee’s job responsibilities. Changes to systems are controlled by policies and procedures, with automatic prevention and reporting controls that are placed within our processes. Our real-time connections to the various financial institutions’ authorization systems that allow withdrawals, deposits, balance inquiries, transfers, and advanced functionality transactions are accomplished through gateway relationships or direct connections. We use commercially-available and proprietary software that monitors the performance of the ATMs in our network, including details of transactions at each ATM and expenses relating to the ATMs, further allowing us to monitor our online availability and financial profitability at each location. We analyze transaction volume and profitability data to determine whether to continue operating at a given site, to determine how to price various operating arrangements with merchants and bank-branding partners, and to create a profile of successful locations to assist us in deciding the best locations for additional deployments.
Product development. In recent years, we have made investments to develop new technology which we anticipate will drive transaction volume at our ATMs. We have a product development team focused on improving existing products and services as well as delivering new capabilities that generally leverage our existing platform. Internal product development is an increasing focus for us, and we expect, over time, our product development will drive revenue growth. Examples of recent and continued product development include dynamic currency conversion at the ATM, promotional consumer offers, deposit enablement for multiple financial institutions, cardless cash access via a mobile phone and the ability to convert stored value digital currency into cash and cash into stored value digital currency at the ATM. A number of products are currently in various stages of development, pilot, and rollout.
ATM cash management. Our ATM cash management function uses commercially-available software and proprietary analytical models to determine the necessary fill frequency and cash load amount for each ATM. We project vault cash requirements for our Company-owned and cash-serviced ATMs, taking into consideration the ATM's location, the day of the week, the timing of holidays, and other factors such as specific events occurring in the vicinity of the ATM. After receiving a cash order from us, the vault cash provider forwards the request to its vault location nearest to the applicable ATM. Personnel at the vault location then arrange for the requested amount of cash to be set aside and made available for the designated armored courier to access and subsequently transport to the ATM. Our ATM cash management department utilizes data from the vault cash providers, internally-produced data, and a proprietary methodologies to confirm daily orders, audit delivery of cash to armored couriers and ATMs, monitor cash balances for cash shortages, coordinate and manage special cash orders, and audit costs from both armored couriers and vault cash providers. In the U.K., we operate our own armored courier operation which services the majority of our ATMs in the U.K.
Customer service. We believe one of the factors that differentiates us from our competitors is our customer service and proactive approach to managing any downtime experienced by our ATMs. We use advanced software and skilled technicians that monitor our ATMs 24 hours a day for service interruptions and notify our maintenance engineers and vendors for prompt dispatch of necessary service calls.
Finally, we use proprietary software systems to maintain a database of transactions and performance metrics for our ATMs. This data is aggregated into individual merchant and financial institution customer profiles that are used by our customer service team. We believe our proprietary databases enable us to provide superior quality and reliable customer support, together with information on trends that is also valuable to our retail and financial institution partners.
10
Primary Vendor Relationships
To maintain an efficient and flexible operating structure, we outsource certain aspects of our operations, including cash supply and cash delivery, maintenance, and certain transaction processing services. Due to the large number of ATMs we operate, we believe we have obtained favorable pricing terms from most of our major vendors. We contract for the provision of the services described below in connection with our operations.
Transaction processing. We own and operate EFT transaction processing platforms that utilize proprietary as well as commercially-available software. A portion of our withdrawal transactions are processed through third-parties. We plan to convert transaction processing services to our internal EFT transaction processing platforms when economically advantageous to us or as these contracts expire or are terminated.
EFT network services. Our transactions are routed over various EFT networks to obtain authorization for cash disbursements and to provide account balances. EFT networks set the interchange fees that they charge to the financial institutions, as well as the amount paid to us. We attempt to maximize the utility of our ATMs to cardholders by participating in as many EFT networks as practical. Additionally, we own and operate the Allpoint network, the largest surcharge-free network in the U.S. Having this network further enhances our ATM utility by providing certain cardholders surcharge-free access to our ATMs, as well as allowing us to receive network-related economic benefits such as receiving additional transaction-based revenue and setting interchange rates on transactions over this network.
Equipment. We purchase our ATMs from global ATM manufacturers, including, but not limited to, NCR, Hyosung, Triton, Diebold, and Chungho. The large quantity of ATMs that we purchase from these manufacturers enables us to receive favorable pricing and terms. In addition, we maintain close working relationships with these manufacturers in the course of our business, allowing us to stay informed about product updates and to receive prompt attention for any technical problems with purchased ATM equipment. The favorable pricing we receive from these manufacturers also allows us to offer certain of our customers an affordable solution to replace their ATMs with modern technology and to be compliant with new regulatory requirements as they arise.
Maintenance. We generally contract with third-party service providers with national operations for on-site maintenance services in most of our markets. In the U.K., Australia, Canada, and South Africa, maintenance services are , to differing degrees, performed by in-house technicians as well.
ATM cash management. We obtain or use our own cash to fill our Company-owned ATMs, and in some cases, merchant-owned and managed services ATMs, under arrangements with various vault cash providers. We pay a monthly fee based on the average outstanding vault cash balances to our primary vault cash providers under a floating rate formula, which is generally based on various benchmark interest rates such as London Interbank Offered Rates (“LIBOR”). In virtually all cases, beneficial ownership of the cash is retained by the vault cash providers and we have no right to the cash and no access except for the ATMs that are serviced by our wholly-owned armored courier operations in the U.K. While our U.K. armored courier operations have physical access to the cash loaded in the ATMs, beneficial ownership of that cash remains with the vault cash provider at all times. We also contract with third-parties to provide us with certain cash management services, which varies by geography, which may include reporting, armored courier coordination, cash ordering, cash insurance, reconciliation of ATM cash balances, claims processing with armored couriers, financial institutions, and processors.
For the quarter ended December 31, 2019, we had an average outstanding vault cash balance of approximately: $1.9 billion in our North America ATMs.; approximately $1.1 billion in our Europe and Africa ATMs; approximately $0.2 billion in our Australia and New Zealand ATMs. For additional information related to our vault cash agreements and the related risks, see Item 1A. Risk Factors - We rely on third-parties to provide us with the cash we require to operate many of our ATMs. If these third-parties were unable or unwilling to provide us with the necessary cash to operate our ATMs, we would need to locate alternative sources of cash to operate our ATMs or we would not be able to operate our business. Also see, Item 1A. Risk Factors - Changes in interest could increase our operating costs by increasing interest expense under our credit facilities and our vault cash rental costs.
The vault cash that we are contractually responsible for in all of the jurisdictions in which we operate is insured up to certain per location loss limits and subject to per-incident and annual aggregate deductibles through a syndicate of multiple underwriters.
Cash replenishment. We contract with armored courier services to transport and transfer most of the cash to our ATMs. We use leading third-party armored couriers in all of our jurisdictions except for in the U.K., where we primarily utilize our own armored courier operations. Under these arrangements, the armored couriers pick up the cash in bulk using instructions received from us and our vault cash providers to prepare the cash for delivery to each ATM on the designated fill day. Following a
11
predetermined schedule, the armored couriers visit each location on the designated fill day, load cash into each ATM, and then balance each machine and provide cash reporting to the applicable vault cash provider.
Merchant Customers
In each of our markets, we typically deploy our Company-owned ATMs under long-term contracts with major national and regional merchants including convenience stores, gas stations, grocery stores, drug stores, and other high-traffic locations. Our merchant-owned ATMs are typically deployed under arrangements with smaller independent merchants.
The terms of our merchant contracts vary as a result of negotiations at the time of execution. In the case of Company-owned ATMs, the contract terms vary, but typically include the following:
• | a multi-year term, typically approximately five years; |
• | exclusive deployment of ATMs at locations where we install an ATM; |
• | the right to increase surcharge fees, with merchant consent required in some cases; |
• | in the U.S., our right to terminate or remove ATMs or renegotiate the fees payable to the merchant if surcharge fees or interchange fees are reduced or eliminated as a result of regulatory action; and |
• | provisions that make the merchant’s fee dependent on the number of ATM transactions. |
During the year ended December 31, 2019, we derived approximately 22% of our total revenues from ATMs placed at the locations of our top five merchant customers, including revenues from bank branding and Allpoint at these locations, none of which individually contributed more than approximately 6% of our total revenues for the year. The weighted average remaining life of our top five merchant customers is approximately 3.5 years. For additional information related to the risks associated with our customer mix, see Item 1A. Risk Factors - We derive a substantial portion of our revenue from ATMs placed with a small number of merchants. The expiration, termination or renegotiation of any of these contracts with our top merchants, or if one or more of our top merchants were to cease doing business with us, or substantially reduce its dealings with us could cause our revenues to decline significantly and our business, financial condition and results of operations could be adversely impacted.
Seasonality and Tourism
Our overall business is somewhat seasonal in nature with generally fewer transactions occurring in the first quarter of the year. Transaction volumes at our ATMs located in regions affected by strong winter weather patterns typically experience declines in volume during winter months as a result of decreases in the amount of consumer traffic through such locations. We usually see an increase in transactions in the warmer summer months, which are also aided by increased vacation and holiday travel. We expect these fluctuations in transaction volumes to continue in the future. In addition, other factors, such as a recessionary economic, environment or real, or potential health emergencies such as the widespread outbreak of contagious diseases, could hinder travel, reduce the use of cash and may have a negative impact on transaction levels.
Competition
Historically, we have competed with independent ATM deployers (commonly referred to as “IADs”) and financial institutions for ATM placements, new merchant accounts, bank-branding and network-branding relationships, and acquisitions. IADs compete with us for placement rights at merchant locations. Our ATMs compete with the ATMs owned and operated by financial institutions and other IADs for underlying consumer transactions. In certain locations with very high foot traffic, such as airports, major train stations, large arenas, and stadiums, we often see competition from large financial institutions as they may utilize such locations for marketing and advertising purposes, and in some cases are willing to subsidize the operations of the ATM.
We have established relationships with leading regional and national financial institutions, as well as digital banks, other operators of consumer financial services, and stored-value debit card issuers through our bank-branding program and Allpoint. Both of these programs can be cost-efficient alternatives to these organizations in lieu of operating branches and owning and operating extensive ATM networks. We believe the scale of our extensive network, our EFT transaction processing services, comprehensive solutions and our focus on customer service provide us with competitive advantages for providing services to leading financial institutions and newer providers of consumer financial services.
Through Allpoint, we have significantly expanded our relationships with local, regional, and national financial institutions as well as digital banks, providers of consumer financial services and other issuers of stored-value debit card programs in the U.S. With regard to Allpoint, we encounter competition from other organizations’ surcharge-free networks that are seeking to sell their network to retail locations and offer surcharge-free ATM access to issuers of stored-value debit cards, as well as financial institutions that lack large ATM footprints.
12
We work to continually develop the types of services we provide to financial institutions and merchants including management of their ATMs. With respect to our managed services offering, we believe we are well-positioned to offer a comprehensive ATM outsourcing solution with our breadth of services, in-house expertise, and network of existing locations that can leverage the economies of scale required to operate an ATM portfolio. There are several large financial services companies, ATM equipment manufacturers, and service providers that currently offer some of the services we provide, with whom we expect to compete directly in this area. While we have direct competition for providing certain services, we believe that we have unique advantages that will allow us to offer a variety of compelling solutions to financial institutions and retailers alike.
Acquisitions have historically been a consistent part of our strategy and may form part of our strategy in the future. Typically, competition for acquisitions is from other IADs, financial service or payments businesses, and/or private equity sponsors of ATM portfolios.
Finally, we face indirect competition from alternative payment mechanisms, such as card-based payments, including contactless, or other electronic forms of payment, including payment applications on mobile phones. While it has been difficult to specifically quantify the direct effects of alternative payment sources on our transaction volumes, cash-based payments have declined as a percentage of total payments in our primary geographic markets in recent years. Further expansion in electronic payment forms and the entry of new and less traditional competitors could reduce consumer demand for cash. We expect to continue to face competition from emerging payments technology in the future. See Item 1A. Risk Factors - The proliferation of payment options and increasingly frictionless methods of payment other than cash, including credit cards, debit cards, stored-value debit cards, contactless, and mobile payments options could result in a reduced need for cash in the marketplace and a resulting decline in the usage of our ATMs.
Government and Industry Regulation
Our principal business, ATM network ownership and operation, is subject to government (federal, state, or local) and industry regulations. Our failure to comply with applicable laws and regulations could result in restrictions on our ability to provide our products and services in such jurisdictions, as well as the imposition of civil fines. For additional information related to recent regulatory matters that have impacted our operations or are expected to impact us in the future, see Part II. Item 7. Management’s Discussion and Analysis of Financial Condition and Results of Operations – Developing Trends and Recent Events.
Risk Management
We have adopted a formalized Enterprise Risk Management program that seeks to identify and manage the major risks we face. The major risks are prioritized and assigned to a member of the management team who develops mitigation plans, monitors the risk activity, and is responsible for implementation of the mitigation plan, if necessary. The risks, plans, and activities are regularly monitored by our management team and overseen by our Board of Directors (“Board”).
Employees
As of December 31, 2019, we had 1,987 employees, 326 of which were covered by a collective bargaining agreement. We currently believe our relationships with employees represented by the union are good and we have not experienced any work stoppages.
Organizational History and Additional Company Information
We were formed as a Texas corporation in 1993 and originally operated under the name of Cardpro, Inc. In June 2001, Cardtronics Group, Inc. was incorporated under the laws of the state of Delaware and became the parent company for the existing business. In January 2004, Cardtronics Group, Inc. changed its name to Cardtronics, Inc. (“Cardtronics Delaware”), and in December 2007, we completed an initial public offering.
In July 2016, the location of incorporation of the parent company of the Cardtronics group of companies was changed from Delaware to the U.K., whereby Cardtronics plc, a public limited company organized under English law (“Cardtronics plc”), became the new publicly traded corporate parent of the Cardtronics group of companies following the completion of the merger between Cardtronics Delaware and one of its subsidiaries (the “Redomicile”). Upon completion of the Redomicile, Cardtronics plc common shares were listed and began trading on the NASDAQ stock market under the symbol “CATM,” the same symbol under which common shares of Cardtronics Delaware were formerly listed and traded. The Redomicile transaction was accounted for as an internal reorganization of entities under common control, and therefore, Cardtronics Delaware’s assets and liabilities have been accounted for at their historical cost basis and not revalued in the transaction.
13
A large portion of our growth throughout our operating history was driven by acquisitions as we expanded our operations in the U.S. and into several other new geographic markets in North America, Europe, South Africa, Australia and New Zealand. Our largest markets are currently the U.S. and the U.K. Over the past few years, our growth strategy has been primarily focused on organic growth.
General information about us can be found on our website at http://www.cardtronics.com. We file annual, quarterly, and current reports as well as other information electronically with the Securities Exchange Commission (“SEC”) under the Exchange Act. Our Annual Reports on Form 10-K, Quarterly Reports on Form 10-Q, Current Reports on Form 8-K, and any amendments to those reports are available free of charge on our website as soon as reasonably practicable after the reports are filed or furnished electronically with the SEC. The SEC maintains a website that contains reports, proxy and information statements, and other information regarding issuers that file electronically with the SEC at http://www.sec.gov. You may also request an electronic or paper copy of our SEC filings at no cost by writing or telephoning us at the following: Cardtronics plc, Attention: Chief Financial Officer, 2050 West Sam Houston Parkway South, Suite 1300, Houston, Texas 77042; (832) 308-4000. Information on our website is not incorporated into this 2019 Form 10-K or our other securities filings.
ITEM 1A. RISK FACTORS
Risks associated with our industry
The proliferation of payment options and increasingly frictionless methods of payment other than cash, including credit cards, debit cards, stored-value debit cards, contactless, and mobile payments options, could result in a reduced need for cash in the marketplace and a resulting decline in the usage of our ATMs.
The U.S., the U.K., Canada, Australia, Germany, and other developed markets have seen a shift in consumer payment trends since the late 1990s, with more customers now opting for electronic forms of payment (e.g., credit cards and debit cards) for their in-store purchases over traditional paper-based forms of payment (e.g., cash and checks). Additionally, some merchants offer free cash back at the point-of-sale (“POS”) for customers that utilize debit cards for their purchases, thus providing an additional incentive for consumers to use these cards. Increasingly, frictionless payment options, like contactless, are also being used by consumers. According to the Nilson Report issued in December 2018, the percentage of cash transaction counts in the U.S. declined from approximately 31.9% of all payment transactions in 2012 to approximately 25.9% in 2017, with declines also seen in check usage as credit and debit card transactions increased. However, in terms of absolute dollar value, the volume of cash used in payment transactions remained relatively flat at $1.6 trillion from 2012 to 2017. The U.K. has followed a similar trend in absolute terms according to the Access to Cash study in the U.K., with cash making up over a third of all transactions and being the second most common payment method. In Australia, the value of banknotes in circulation increased by 2.5% over 2017, but at a somewhat slower rate than in past years. In their customer payments survey, the Reserve Bank of Australia published that 37% of all payments made in Australia are with cash. According to the 2018 Canadian Payment Methods and Trends study, cash was still the most used payment method at 29.8% of all transactions and while cash has been in decline in recent years, in 2017, the rate of decline showed signs of slowing. On a same-store basis, we have generally seen a single-digit percentage rate of decline in the number of cash withdrawal transactions conducted on our U.K.-based ATMs during the last 12-24 months while we have seen low single-digit rates of growth in our U.S.-based ATMs over the last twelve months, which is partly attributable to increased transactions from our surcharge-free Allpoint network. The continued growth in electronic payment methods, such as mobile phone payments, contactless payments and card only self-service order and payment terminals could result in a reduced need for cash in the marketplace and ultimately, a decline in the usage of ATMs. New payment technology, such as Venmo, Zelle, Square Cash, Facebook Messenger Payments and virtual currencies such as Bitcoin, or other new payment method preferences by consumers could reduce the general population’s need or demand for cash and negatively impact our transaction volumes in the future. The proliferation of payment options and changes in consumer preferences and usage behavior could reduce the need for cash and have a material adverse impact on our operations and cash flows.
14
The ATM industry is highly competitive and such competition may increase, which may adversely affect our profit margins.
The ATM business is and can be expected to remain highly competitive. Our principal direct competition comes from independent ATM companies and financial institutions in all of the countries in which we operate. Our competitors could prevent us from obtaining or maintaining desirable locations for our ATMs, cause us to reduce the revenue generated by transactions at our ATMs, or cause us to pay higher merchant fees, thereby reducing our profits. In addition to our current competitors, new and less traditional competitors may enter the market vertically integrated competitors may offer comprehensive bundled product and service offerings or we may face additional competition associated with the creation, integration, and consolidation of competitors through transactions as well as the introduction of alternative payment mechanisms and emerging payment technologies. Increased competition could result in transaction fee reductions, reduced gross margins, and loss of market share. As a result, the failure to effectively adapt our organization, products, and services to the market could significantly reduce our offerings to gain market acceptance, could significantly reduce our revenue, increase our operating costs, or otherwise adversely impact our operations and cash flows.
Regulatory, legislative or self-regulatory/standard developments regarding privacy and data security matters could adversely affect our ability to conduct our business.
We, along with our partners and customers in the financial services area, are subject to a number of laws and regulations, including, among others, those promulgated under the authority of the Federal Trade Commission, the Electronic Communications Privacy Act, Computer Fraud and Abuse Act, the Gramm Leach Bliley Act and state cybersecurity, privacy, and breach notification laws, the Australian Privacy Act, the Personal Information Protection and Electronic Documents Act in Canada, the E.U. General Data Protection Regulations. These laws, rules and regulations address a range of issues including data privacy and cybersecurity, and restrictions or technological requirements regarding the collection, use, storage, protection, retention or transfer of data.
Such government regulation (together with applicable industry standards) may increase the costs of doing business. Federal, state, municipal and foreign governments and agencies have adopted and could in the future adopt, modify, apply or enforce laws, policies, regulations, and standards covering user privacy, data security, cybersecurity, technologies such as cookies that are used to collect, store and/or process data, marketing online, the use of data to inform marketing, the taxation of products and services, unfair and deceptive practices, and the collection (including the collection of information), use, processing, transfer, storage and/or disclosure of data associated with unique individual internet users. New regulation or legislative actions regarding data privacy and security could have a material adverse impact on our operations and cash flows.
The passage of legislation banning or limiting the fees we receive for transactions conducted on our ATMs would severely impact our revenues and our operations.
We rely on transaction-based revenues in each of our markets and any regulatory fee limits that could be imposed on our transactions may have an adverse impact on our revenues and profits. If legislation were to be enacted in the future in any of our markets, and the amount we were able to charge consumers to use our ATMs was reduced, our revenues and related profitability would be negatively impacted. Furthermore, if such limits were set at levels that are below our current or future costs to operate our ATMs, it would have a material adverse impact on our ability to continue to operate under our current business model and adversely impact our revenues and cash flows. Despite the nationwide acceptance of surcharge fees at ATMs in the U.S. since their introduction in 1996, consumer activists have from time to time attempted to impose local bans or limits on surcharge fees. Even in the few instances where these efforts have passed the local governing body (such as with an ordinance adopted by the city of Santa Monica, California), U.S. federal courts have overturned these local laws on federal preemption grounds. Although Section 1044 of the Dodd-Frank Act contains a provision that will limit the application of federal preemption with respect to state laws that do not discriminate against national banks, federal preemption will not be affected by local municipal laws, where such proposed bans or limits often arise. Additionally, some U.S. federal officials have expressed concern in previous years that surcharge fees charged by banks and non-bank ATM operators are unfair to consumers.
Interchange fees, which comprise a substantial portion of our transaction revenues, may be lowered in some cases at the discretion of the various EFT networks through which our transactions are routed, or through potential regulatory changes, thus reducing our future revenues and operating profits.
Interchange fees, which represented 27.8% of our total ATM operating revenues for the year ended December 31, 2019, are set by the various EFT networks and major interbank networks through which the transactions conducted on our ATMs are routed. These fees vary from one network to the next. During the year ended December 31, 2019, 16.6%, 10.8%, and 0.4% of our total ATM operating revenues were derived from interchange fees in Europe & Africa, North America, and Australia & New Zealand, respectively. Some of these fees are subject to pricing changes that we may be unable to offset through lower payments to merchants. Interchange revenues in the U.K. accounted for 14.7% of our consolidated ATM operating revenues. In the U.K., the
15
significant majority of the interchange revenues we earn are based on rates set by LINK, the major interbank network in that market.
Revenues from our UK based ATMs are highly dependent on interchange and therefore susceptible to changes in interchange rates, with the majority of our UK interchange revenues being determined by the rates set by the LINK scheme. In addition to LINK transactions, a small number of UK financial institutions have issued cards that are not affiliated with the LINK network, but instead route over a Visa or MasterCard network. Transactions conducted on our ATMs from these cards currently represent less than 3% of our annual withdrawal transactions in the U.K. The interchange rates set by Visa and MasterCard have historically been less than the LINK rates. Accordingly, if any major financial institution in the U.K. decided to leave the LINK network in favor of Visa, MasterCard, or another network, and we elected to continue to accept the transactions of their cardholders, such a move could impact the interchange revenues that we currently receive from the related withdrawal transactions conducted on our ATMs by these cardholders in that market. During 2017, some of the major financial institutions that provide the majority of LINK volumes expressed concern about the LINK interchange rate and commenced efforts to significantly lower the interchange rate. As a result, a group of members of LINK (the “Working Group”) developed a new interchange rate setting mechanism and in October 2017, it was decided that an independent “LINK Board” would set interchange rates going forward. On January 31, 2018 the LINK Board issued an update and determined that interchange rates would decrease by 5% from 2017 levels, effective July 1, 2018 and announced the intention to further reduce the interchange rate by three further annual 5% reductions. However, on July 16, 2018, LINK announced that the third interchange rate decrease was canceled and the fourth rate decrease was suspended, pending further review. The first 5% rate reduction occurred on July 1, 2018, and the second scheduled 5% decrease in the LINK interchange rate occurred January 1, 2019. Should there be a significant change in the LINK scheme or its membership, our U.K. interchange revenues and profits could be further adversely impacted.
In past years, certain networks have reduced the net interchange rates paid to ATM deployers for ATM transactions in the U.S. routed across their debit networks through a combination of reducing the transaction rates charged to financial institutions and higher per-transaction fees charged by the networks to ATM operators. Accordingly, if some of the networks through which our ATM transactions are routed were to reduce the interchange rates paid to us or increase their transaction fees charged to us for routing transactions across their network, our future transaction revenues could decline. For example, Visa announced a new acquirer fee for non-monetary transactions in the U.S. that took effect on April 1, 2019. In addition to the impact of net interchange rate decreases, we have seen certain financial institutions migrate their volume away from some networks to take advantage of the lower pricing offered by other networks, resulting in lower net interchange rates per transaction to us. In Canada, the vast majority of transactions route through the Interac network which sets the interchange revenue rates for its network.
In Canada, domestic transactions represent more than 90% of total transaction volume and these route through the Interac network, which sets the interchange revenue rates for the transactions, with the remaining, non-domestic transactions routing primarily to Visa and Mastercard. As a result, if Interac were to reduce the interchange revenue rates or increase their transaction fees for routing transactions across their network, our future transaction revenues could decline.
Future changes in interchange rates, some of which we have minimal or no control over, could have a material adverse impact on our operations and cash flows.
We operate in a changing and unpredictable regulatory environment, which may harm our business. If we are subject to new regulations or legislation regarding the operation of our ATMs, we could be required to make substantial expenditures to comply with that regulation or legislation, which may reduce our net income and our profit margins.
With its initial roots in the banking industry, the U.S. ATM industry is regulated by the rules and regulations of the federal Electronic Funds Transfer Act, which establishes the rights, liabilities, and responsibilities of participants in EFT systems. The vast majority of states have few, if any, licensing requirements. However, legislation related to the U.S. ATM industry is periodically proposed at the state and local level. In past years, certain members of the U.S. Congress called for a re-examination of fees that are charged for an ATM transaction, although no legislation was passed relative to these matters. As a part of the Dodd-Frank Wall Street Reform and Consumer Protection Act (“Dodd-Frank Act”), the Consumer Financial Protection Bureau was created, and it is possible that this governmental agency could enact new or modify existing regulations that could have a direct or indirect impact on our business. For additional information related to this topic, see the risk factor entitled The passage of legislation banning or limiting the fees we receive for transactions conducted on our ATMs would severely impact our revenues and our operations below.
The Americans with Disabilities Act (“ADA”), through implementing regulations, requires that public accommodations be accessible to and independently usable by individuals with disabilities, including visually-impaired or wheel-chair bound persons. The U.S. Department of Justice issued accessibility regulations under the ADA that became effective in March 2012, which provided specific requirements for ATMs. Failure to meet these requirements, and other similar requirements under various states’ laws, could adversely impact our operations and revenues, including through costs incurred in lawsuits and payment of damages,
16
fines or penalties. The Commonwealth of Massachusetts and the National Federation of the Blind (the “NFB”) had pursued a lawsuit against the Company alleging non-compliance with the ADA, its implementing regulations, and court orders. We settled this lawsuit by, among other things, agreeing to certain procedures and standards for voice guidance on ATMs. While we have completed implementation of the operational elements of our settlement agreement, any failure to meet the remaining reporting requirements of our settlement agreement in this matter could adversely impact our operations and revenues, including through the incurrence of damages.
In the U.K., the ATM industry historically has been largely self-regulating. Most ATMs in the U.K. are part of the LINK network and must operate under the network rules set forth by LINK, which operates under the oversight of the Bank of England and its regulatory capacity and since October 2013, the Payment Systems Regulator (“PSR”) oversees any payment system operating in the U.K. and its participants. The PSR is actively engaged in a review of the LINK scheme and the scheme’s direct commissioning and interchange operating procedures. See the risk factor entitled Interchange fees, which comprise a substantial portion of our transaction revenues, may be lowered in some cases at the discretion of the various EFT networks through which our transactions are routed, or through potential regulatory changes, thus reducing our future revenues above.
The amended 2009 Cross Border Payments Regulation requires enhanced consumer disclosure at point of transaction for dynamic currency conversion transactions. The new regulation, which is expected to be introduced over 2020 and 2021 could cause us to suffer losses or other adverse changes in our business that would reduce our net income.
We are also subject to various regulations in other jurisdictions that we operate in, including Germany, Spain, Ireland, Mexico, Canada, Australia, New Zealand and South Africa. Due to the numerous regulations in the jurisdictions in which we operate, there are risks and substantial costs incurred in ensuring consistent compliance with the existing regulatory requirements in those jurisdictions. To the extent we are not successful in complying with the new or existing regulations, non-compliance may have an impact on our ability to continue operating in such jurisdictions or adversely impact our profits. New legislation proposed in any of the jurisdictions in which we operate, or adverse changes in the laws that we are subject to, may materially affect our business through the requirement of additional expenditures to comply with that legislation or other direct or indirect impacts on our business. If regulatory legislation is passed in any of the jurisdictions in which we operate, we could be required to incur substantial expenditures or suffer adverse changes in our business that would reduce our net income. In addition, new product and service offerings such as mobile ATM access and deposit-taking ATMs are often subject to additional regulations which may have an impact on our ability to offer such products. We may not be able to comply with all such regulations for new product and services offerings or may not be able to do so profitability.
Internal control failures, security breaches, including the occurrence of a cyber-incident or a deficiency in our cybersecurity, could harm our business by compromising Company, merchant or vendor data or cardholder information and disrupting our transaction processing services, thus damaging our relationships with our merchant customers, business partners, and generally exposing us to liability.
As part of our transaction processing services, we electronically process and transmit cardholder information. We and our vendors have been, and will continue to be, subjected to cyber-attacks or internal control failures, including accidental or intentional computer or network issues (such as unauthorized parties gaining access to our information technology systems, phishing attacks, viruses, malware or ransomware installation, server malfunction, software or hardware failures, impairment of data integrity, loss of data or other computer assets, adware, or other similar issues), none of which to date have resulted in any material disruption, interruption, or loss. Our vulnerability to attack and our vendors’ vulnerability to attack exists in relation to known threats, against which we work to implement and maintain what we consider to be adequate security controls, as well as other threats, against which we cannot defend because they are unknown. Consequently, the security measures we deploy and our internal processes and procedures are not perfect or impenetrable, and, despite our investment in and maintenance of security controls, we may be unable to anticipate or prevent all unauthorized access attempts made on our systems.
A vulnerability in the cybersecurity of our systems or one or more of our vendors’ systems (which include, among other things, cloud based networks and services outside of the control of the Company) could impair, compromise or shut down one or more of our computing systems, transaction processing systems, or our IT network and infrastructure, which could harm our business or result in harm to our customers or our business partners and result in negative publicity or media coverage. Furthermore, companies that process and transmit cardholder information have been specifically and increasingly targeted in recent years by sophisticated and persistent actors including hacktivists, organized criminal groups, and nation states in an effort to obtain information and utilize it for fraudulent transactions or other purposes. It is also possible that a cyber-attack or information security breach could occur and persist for an extended period of time without detection. We expect that any investigation of a cyber-attack would be inherently unpredictable and that it would take time before the completion of any investigation and before there is availability of full and reliable information. During such time we may not necessarily know the extent of the harm or how best to
17
remediate it, and certain errors or actions could be repeated or compounded before they are discovered and remediated, all or any of which would further increase the costs and consequences of a cyber-attack.
The technical and procedural controls we, our vendors and our other partners use to provide security for storage, processing and transmission of confidential customer and other information may not be effective to protect against control failures, data security breaches or other cyber incidents. The risk of unauthorized circumvention of our security measures has been heightened by advances in computer capabilities and the increasing sophistication of hackers. Unauthorized access to our computer systems, or those of our third-party service providers, could result in the theft or publication of the information or the deletion or modification of sensitive records, and could cause interruptions in our operations. Any inability to prevent security breaches could damage our relationships with our merchant and financial institution customers, cause a decrease in transactions by individual cardholders, expose us to liability including claims from merchants, financial institutions, and cardholders, and subject us to network fines.
Further, we could be forced to expend significant resources in response to a security breach, including repairing system damage and increasing cybersecurity protection costs by deploying additional personnel, each of which could divert the attention of our management and key personnel away from our business operations. These claims also could result in protracted and costly litigation. If unsuccessful in defending that litigation, we might be forced to pay damages and/or change our business practices.
While many of our agreements with partners and third-party vendors contain indemnification provisions and we maintain insurance intended to cover some of these risks, such measures may not be sufficient to cover all of our losses from any future breaches of our systems.
We have a history of making acquisitions and investments, which expose us to additional risk associated with the integration of new information systems, processes, and procedures. We may not adequately identify weaknesses in an acquired entity’s information systems either before or after an acquisition, which could affect the value we are able to derive from the acquisition, expose us to unexpected liabilities or make our own systems more vulnerable to a cyber-attack. We may also not be able to integrate the systems of the businesses we acquire in a timely manner which could further increase these risks until such integration takes place.
As a global company, the cross border movement of data increases our exposure to cybersecurity threats. This cross border data movement must be managed in accordance with an ever changing compliance landscape and the development of cybersecurity guidance and best practice and while we have and will continue to invest in the protection of our systems and the maintenance of what we believe to be adequate security controls over individually identifiable customer, employee and vendor data provided to us, there can be no assurance that we will not suffer material losses relating to cyber-attacks or other security breaches involving our information systems in the future. In addition, we could be impacted by existing and proposed laws and regulations, as well as government policies and practices related to cybersecurity, privacy, and data protection across the various jurisdictions in which we operate which may overlap and potentially conflict with one another. An actual security breach or cyber-incident could have a material adverse impact on our operations and cash flows and costs to remediate any damages to our information technology systems suffered as a result of a cyber-attack could be significantly over and above any obligations arising from any penalties imposed by any regulatory or supervisory authority including in connection with General Data Protection Regulations.
The broad introduction of free-to-use ATMs in Australia has and may continue to adversely impact our revenues and profits.
In September 2017, Australia’s four largest banks, the Commonwealth Bank of Australia (“CBA”), Australia and New Zealand Banking Group Limited (“ANZ”), Westpac Banking Corporation (“Westpac”), and National Australia Bank Limited (“NAB”), each independently announced decisions to remove all direct charges applied to domestic transactions completed at their respective ATM networks effectively creating a free-to-use network of ATM terminals that did not exist previously.
Australia has historically been a direct charge market where cardholders pay a fee (the “direct charge”) to ATM operators for each transaction, unless the ATM where the transaction is completed is part of the cardholder’s issuing bank ATM network. There continues to be no broad interchange arrangement in Australia between card issuers and ATM operators to compensate ATM operators for the cost of providing a service to cardholders in the absence of a direct charge levied on the cardholder directly. In 2019, approximately 78% of our revenues in Australia were sourced from direct charge fees paid by cardholders. As a result, this introduction of free-to-use ATMs in Australia has and may continue to adversely impact our revenues and profits.
In September 2017, we determined that these developments were to be an indicator of impairment of our Australia & New Zealand reporting unit and related long-lived assets. As further discussed in Item 8. Financial Statements and Supplementary Data, Note 1. Basis of Presentation and Summary of Significant Accounting - (l) Goodwill, we recorded an impairment of certain assets in our Australia & New Zealand reporting unit in September 2017.
18
While the direct impact we have experienced has been limited to date, the ultimate impact of this action could increase over time as consumers’ behavior patterns change as a result of the introduction of a free-to-use network in Australia that did not previously exist.
Computer viruses or unauthorized software (malware) could harm our business by disrupting or disabling our systems, including transaction processing services, causing non-compliance with network rules, damaging our relationships with our merchant and financial institution customers, and damaging our reputation causing a decrease in transactions by individual cardholders.
We routinely face cyber and data security threats through computer viruses, malware, attachments to emails, persons inside our organization or persons with access to systems inside our organization and other significant disruptions of our IT networks and related systems (“System Threats”). Any one or more System Threats could result in the infiltration of our systems, as well as those of our customers and partners, and disrupt our delivery of services, cause delays or loss of data or public releases of confidential data or make our applications unavailable, all of which could have a material adverse effect on our revenues and our operations and cash flows. Although we utilize several preventative and detective security controls in our network, we have from time to time experienced System Threats to our data and systems, including but not limited to computer viruses, unauthorized parties gaining access to our information technology systems and similar incidents, none of which to date have resulted in any material disruption, interruption or loss. Our preventative and detective security controls at times have been, and may be at times in the future, ineffective in preventing System Threats, and material consequences arising from the occurrence of any such event could damage our relationships with our customers, cause a decrease in transactions by individual cardholders, cause our reputation to be damaged, require us to make significant expenditures to repair or replace equipment, or cause our non-compliance with applicable network rules and regulations.
Currency design changes may require modifications to our ATMs that could impact our cash flows.
In American Council of the Blind, et. al., v. Timothy F. Geithner, Secretary of the Treasury (Case #1:02-cv-00864) in the U.S. District Court for the District of Columbia (the “Court”) an order was entered that found that U.S. currencies (as currently designed) violated the Rehabilitation Act, a law that prohibits discrimination in government programs on the basis of disability, as the paper currencies issued by the U.S. are identical in size and color, regardless of denomination. As a consequence of this ruling, the U.S. Treasury stated in its semi-annual status report filed with the Court in September 2012, that the Bureau of Engraving and Printing (“BEP”) was making progress towards implementing the Secretary’s decision to provide meaningful access to paper currency by: “(i) adding a raised tactile feature ("RTF") to each Federal Reserve note that the BEP may lawfully redesign, (ii) continuing the BEP’s program of adding large high-contrast numerals and different colors to each denomination that it may lawfully redesign, and (iii) implementing a supplemental currency reader distribution program for blind and other visually impaired U.S. citizens and legal residents.” Of these three steps only the first materially affects the ATM industry. The BEP continues to research the RTF and is engaged in testing samples in conjunction with the Banknote Equipment Manufactures program. Until a selection is made and disclosed by the BEP, the impact, if any, a raised tactile feature will have on the ATM industry, remains unknown. It is possible that such a change or any redesign of currencies could require us to incur additional costs, which could be substantial, to modify our ATMs in order to store and dispense notes with raised or other tactile features.
Additionally, polymer notes have been introduced by a number of countries, including Canada, the U.K. and Australia. Polymer notes were first introduced by the Bank of England in 2016 and are now used, almost exclusively, in our ATMs in the U.K. The introduction of these new currency designs has required upgrades to software and physical ATM components on our ATMs, specifically, software and hardware modifications were completed for the polymer £10s and some minor additional hardware modifications to ATM components are required for polymer £20s. To date, we have not experienced any material adverse financial or operational impact as a result of the new requirements to handle these new notes.
The Reserve Bank of Australia (or “RBA”) has also issued redesigned banknotes beginning with the $5, $10 and $50 Australian dollar banknotes that are currently in circulation . Over 90% of the required polymer upgrades in Australia have been completed and the remaining upgrades are being managed on a case-by-case basis as part of contract extensions or renewals. We expect that the RBA will continue issuing redesigned banknotes to introduce additional security features in subsequent years. The RBA has been progressively releasing new polymer banknotes with a new design and anti-counterfeit security features. The majority of denominations have been released with only the $100 denomination remaining, which is expected to be issued in late 2020. The redesigned banknotes include a raised tactile feature to help the blind and visually impaired community distinguish between different denominations of banknotes and a top-to-bottom clear window in which the banknote is transparent. Any required upgrades or full replacement of our ATMs could require us to incur additional cost which could be substantial and result in ATM downtime which could have a material adverse impact on our operations and cash flows.
19
Risks associated with our business.
We depend on ATM and financial services transaction fees for substantially all of our revenues, and our revenues would, and profits could, be reduced by a decline in the usage of our ATMs or a decline in the number of ATMs that we operate, whether as a result of changes in consumer spending preferences, global economic conditions or otherwise.
Transaction fees charged to cardholders and their financial institutions for transactions processed on our ATMs and multi-function financial services kiosks, including surcharge and interchange transaction fees, have historically accounted for most of our revenues. We expect that transaction fees, including fees we receive through our bank-branding and surcharge-free network offerings, will continue to account for the substantial majority of our revenues for the foreseeable future. Consequently, our future operating results will depend on many factors, including: (i) the market acceptance of our services in our target markets, (ii) the level of transaction fees we receive, (iii) our ability to install, acquire, operate, and retain ATMs, (iv) usage of our ATMs by cardholders and any changes in payment preferences they may have, and (v) our ability to continue to expand our surcharge-free and other automated consumer financial services offerings. If alternative technologies to our services are successfully developed and implemented or there is a significant shift in consumer preferences for other alternative payment methods, we may experience a decline in the usage of our ATMs. Surcharge rates, which are largely market-driven and are often negotiated between us and our merchant partners, could be reduced over time. Further, growth in surcharge-free ATM networks and widespread consumer bias toward these networks could adversely affect our revenues, even though we maintain our own surcharge-free offerings. Many of our ATMs are utilized by consumers that frequent the retail establishments in which our ATMs are located, including convenience stores, gas stations, malls, grocery stores, drug stores, airports, train stations, and other large retailers. If there is a significant slowdown in consumer spending or a change in consumer payment preferences, the number of consumers that frequent the retail establishments in which we operate our ATMs may decline and the number of transactions conducted on those ATMs and our network, and the corresponding transaction fees we earn, may also decline. Additionally, should banks increase the fees they charge to their customers when using an ATM outside of their network (i.e. out of network or foreign bank fees), this would effectively make transactions at our ATM more expensive to consumers and could adversely impact our transaction volumes and revenues.
Should banks or other ATM operators decrease or eliminate the fees they charge to users of their ATMs in any of our markets (as they did in Australia in 2017) or otherwise offer free access to their networks, such action would make transactions at our ATM comparatively more expensive to consumers and could adversely impact our transaction volumes and revenues. A decline in usage of our ATMs by cardholders, in the levels of fees received by us in connection with this usage, or in the number of ATMs that we operate, would have a negative impact on our revenues and cash flows and would limit our future growth potential.
We derive a substantial portion of our revenue from ATMs placed with a small number of merchants. The expiration, termination or renegotiation of any of these contracts with our top merchants, or if one or more of our top merchants were to cease doing business with us, or substantially reduce its dealings with us, could cause our revenues to decline significantly and our business, financial condition and results of operations could be adversely impacted.
For the year ended December 31, 2019, our contracts with our top five merchant customers (Co-op Food (in the U.K.), Couche Tard, CVS, Speedway, and Walgreens) accounted for approximately 22% of our total revenues, the largest of which accounted for approximately 6% of our total revenues. Because a significant percentage of our future revenues and operating income depends upon the successful continuation of our relationship with our top merchant customers, the loss of any of our largest merchants, such as the loss of 7-Eleven in 2017, a decision by any one of them to reduce the number of our ATMs placed in their locations, or a decision to sell or close their locations could result in a decline in our revenues or otherwise adversely impact our business operations. To the extent there is consolidation or contraction within our primary retailer partners, and as a part of that consolidation or contraction, the retailers decide to reduce their store footprint, such an event could materially impact our revenues and profits. Furthermore, if their financial conditions were to deteriorate in the future, and as a result, one or more of these merchants was required to close a significant number of their store locations, our revenues would be significantly impacted. Additionally, these merchants may elect not to renew their contracts when they expire. As of December 31, 2019, the contracts we have with our five largest merchant customers had a weighted average remaining life of approximately 3.5 years.
Even if our major contracts are extended or renewed, the renewal terms may be less favorable to us than the current contracts. If any of our largest merchants enters bankruptcy proceedings and rejects its contract with us, fails to renew its contract upon expiration, or if the renewal terms with any of them are less favorable to us than under our current contracts, it could result in a decline in our revenues and profits and have a material adverse impact on our operations and cash flows.
20
Deterioration in global credit markets, as well as changes in legislative and regulatory requirements, could have a negative impact on financial institutions including those with whom we conduct business and may seek to conduct business.
We have a significant number of customer and vendor relationships with financial institutions in all of our key markets, including relationships in which those financial institutions pay us for the right to place their brands on our ATMs. Additionally, we rely on a small number of financial institution partners to provide us with the cash that we maintain in our Company-owned ATMs and some of our merchant-owned ATMs. Further, we rely on a small number of financial institution partners to provide us with liquidity under our revolving credit facility. Volatility in the global credit markets may have a negative impact on those financial institutions and our relationships with them. In particular, if the liquidity positions of the financial institutions with which we conduct business deteriorate significantly, these institutions may be unable to perform under their existing agreements with us. If these defaults were to occur, we may not be successful in our efforts to identify new bank-branding partners, vault cash providers or lenders, and the underlying economics of any new arrangements may not be consistent with our current arrangements. Furthermore, if our existing bank-branding partners or vault cash providers are acquired by other institutions with assistance from the Federal Deposit Insurance Corporation (“FDIC”), or placed into receivership by the FDIC, it is possible that our agreements may be rejected in part or in their entirety.
We rely on third-parties in the various regions where we operate to provide us with the cash we require to operate many of our ATMs. If these third-parties were unable or unwilling to provide us with the necessary cash to operate our ATMs, we would need to identify alternative sources of cash to operate our ATMs or we would not be able to operate our business.
We primarily rely on several financial institutions in the regions where we operate to provide us with the vault cash that we use in our ATMs where cash is not provided by the merchant, which includes, approximately 41,000 in North America, approximately 19,000 in Europe and Africa, and approximately 4,000 ATMs in Australia and New Zealand. For the quarter ended December 31, 2019, we had an average outstanding vault cash balance of approximately $1.9 billion held in our North America ATMs, approximately $1.1 billion in our ATMs in Europe and Africa and approximately $0.2 billion in our ATMs in Australia and New Zealand.
Our existing vault cash rental agreements expire at various times through June 2023. However, each provider has the right to demand the return of all or any portion of its cash at any time upon the occurrence of certain events. Other key terms of our agreements include the requirement that the vault cash providers provide written notice of their intent not to renew. Such notice provisions typically require a minimum of 180 to 360 days’ notice prior to the actual termination date. If such notice is not received, then the contracts will typically automatically renew for an additional one-year period.
If our vault cash providers were to demand return of their cash or terminate their arrangements with us and remove their cash from our ATMs, or if they fail to provide us with cash as and when we need it for our operations, our ability to operate our ATMs would be jeopardized, and we would need to locate alternative sources of vault cash or potentially suffer significant downtime of our ATMs. In the event this was to happen, the terms and conditions of the new or renewed agreements could potentially be less favorable to us, which would negatively impact our results of operations. Furthermore, restrictions on access to cash to fill our ATMs could severely restrict our ability to keep our ATMs operating, and could subject us to performance penalties under our contracts with our customers. A significant reduction in access to the necessary cash to operate our ATMs could have a material adverse impact on our operations and cash flows.
We rely on third-party EFT network providers, transaction processors, bank sponsors, armored courier providers, and maintenance providers to provide services to our ATMs. If some of these providers that service a significant number of our ATMs fail or otherwise cease, consolidate, or no longer agree to provide their services, we could suffer a temporary loss of transaction revenues, incur significant costs or suffer the permanent loss of any contract with a merchant or financial institution affected by such disruption in service.
We rely on EFT network providers and have agreements with various transaction processors, armored courier providers, and maintenance providers. These service providers enable us to provide card authorization, data capture, settlement, cash management and delivery, and maintenance services to our ATMs. Typically, these agreements are for periods of two or three years each. If we are unable to secure the renewal or replacement of any expiring vendor contracts, or a key vendor fails or otherwise ceases to provide the services for which we have contracted and disruption of service to our ATMs occurs, our relationship with those merchants and financial institutions affected by the disrupted ATM service could suffer.
While we have more than one provider for each of the critical services that we rely on third-parties to perform, certain of these providers currently provide services to or for a significant number of our ATMs. Although we believe we would be able to transition these services to alternative service providers, this could be a time-consuming and costly process. In the event one or more of such service providers was unable to deliver services to us, we could suffer a significant disruption in our business, which
21
could result in a material adverse impact to our financial results. Furthermore, any disruptions in service in any of our markets, whether caused by us or by third-party providers, may continue to result in a loss of revenues under certain of our contractual arrangements that contain minimum service-level requirements and could result in a material adverse impact on our operations and cash flows.
Our operational failures or those of our transaction processors, EFT networks or other service providers could delay or interrupt our products and services and harm our business and our relationships with our merchant and financial institution customers.
Our ability to provide reliable service largely depends on the efficient and uninterrupted operations of our EFT transaction processing platforms, third-party transaction processors, telecommunications network systems, and other service providers as well as availability of hardware and replacement parts from vendors. Accordingly, any damage, destruction, or third-party actions that interrupt our services would severely harm our business and reputation and result in a loss of revenues and profits and could cause us to incur substantial additional expenses. Additionally, if any interruption is caused by us, especially in those situations in which we serve as the primary transaction processor, such interruption could result in the loss of the affected merchants and financial institutions, or damage our relationships with them. Prolonged interruption of our services or network that extends for more than several hours (i.e., where our backup systems are not able to recover) would result in data loss and/or a reduction in revenues as our ATMs would be unable to process transactions. Our systems and operations and those of our transaction processors and our EFT network and other service providers could be exposed to damage or interruption from fire, floods, natural disaster, unlawful acts, terrorist attacks, power loss, telecommunications failure, unauthorized entry, cyber-attack, public health emergencies and computer viruses, among other things. We cannot be certain that any measures we and our service providers have taken to prevent system failures will be successful or that we will not experience service interruptions. Should a significant system failure occur, it could have a material adverse impact on our operations and cash flows. In addition, a significant interruption of service could have a negative impact on our reputation and could cause our present and potential merchant and financial institution customers to choose alternative service providers, as well as subject us to fines or penalties related to contractual service agreements and ultimately cause a material adverse impact on our operations and cash flows.
We maintain a significant amount of vault cash within our Company-owned ATMs, which is subject to potential loss due to theft or other events, including natural disasters.
For the quarter ended December 31, 2019, our average outstanding vault cash balance was $3.2 billion in our ATMs. Any loss of vault cash from our ATMs is generally our responsibility. We typically require that our service providers, who either transport the vault cash or otherwise have access to the ATM safe, maintain adequate insurance coverage in the event cash losses occur as a result of theft, misconduct, or negligence on the part of such providers. Cash losses at the ATM occur in a variety of ways, such as natural disasters (hurricanes, flooding, tornadoes, etc.), fires, vandalism, and physical removal of the entire ATM, defeating the interior safe or by compromising the ATM’s technology components. Because our ATMs are often installed at retail sites, they face exposure to attempts of theft and vandalism. Thefts of vault cash may be the result of an individual acting alone or as a part of a crime group. We have experienced theft of vault cash from our ATMs across the geographic regions in which we operate and have at times temporarily removed ATMs from service to enhance security features or permanently removed ATMs due to security concerns. While we maintain insurance policies to cover significant losses that may occur that are not covered by the insurance policies maintained by our service providers, such insurance coverage is subject to deductibles, exclusions, and limitations that may leave us bearing some or all of those losses. Significant vault cash losses could result in a material adverse impact on our operations and cash flows.
Any increase in the frequency and/or amounts of theft and other losses could negatively impact our operating results by causing higher deductible payments and increased insurance premiums. Certain ATM types have recently been susceptible to coordinated ATM attacks that generally involves a logical or physical compromise of the ATM, which causes the ATM to dispense cash without proper authorization and can be controlled remotely in certain types of these attacks. While we maintain a controls program across many fronts to prevent and quickly detect unauthorized ATM access and theft attempts, there can be no assurance that a significant or successful jackpotting attack attempt could occur on our portfolio. Additionally, in recent periods, we have seen elevated attack attempts and vault cash losses in our U.K. business, in particular. Should these losses continue at an elevated or increasing rate, it could adversely impact our results and impact our ability to obtain insurance for the vault cash used on our ATMs. Also, damage sustained to our merchant customers’ store locations in connection with any ATM-related thefts, if extensive and frequent enough in nature, could negatively impact our relationships with those merchants and impair our ability to deploy ATMs in those existing or new locations of those merchants. Certain merchants have requested, and could request in the future, that we remove ATMs from store locations that have suffered damage as a result of ATM-related thefts, thus negatively impacting our financial results. Finally, we have in the past, and may in the future, voluntarily remove vault cash from certain ATMs on a temporary or permanent basis to mitigate further losses arising from theft or vandalism. Depending on the magnitude and duration of any cash removal, our revenues and profits could be materially and adversely affected.
22
Our armored transport business exposes us to additional risks beyond those currently experienced by us in the ownership and operation of ATMs.
Our armored courier operation in the U.K. delivers cash to and collects residual cash from our ATMs in that market. As of December 31, 2019, we were providing armored courier services to a majority of our ATMs in that market and we currently intend to further expand that operation to service additional ATMs. The armored transport business exposes us to significant risks, including the potential for cash-in-transit losses, employee theft, as well as claims for personal injury, wrongful death, worker’s compensation, punitive damages, and general liability. There can be no assurance that we will avoid significant future claims or adverse publicity related thereto. Furthermore, there can be no assurance that our insurance coverage will be adequate to cover potential liabilities or that insurance coverage will remain available at costs that are acceptable to us. The availability of quality and reliable insurance coverage is an important factor in our ability to successfully operate this aspect of our operations. A loss claim for which insurance coverage is denied or that is in excess of our insurance coverage could have a material adverse effect on our business, financial condition and results of operations and cash flows.
If we fail to adapt our products and services to changes in technology or in the marketplace, or if our ongoing efforts to upgrade our technology are not successful, we could lose customers or have difficulty attracting new customers, which would adversely impact our revenues and our operations.
The markets for our products and services are characterized by constant technological changes, frequent introductions of new products and services and evolving industry standards. Due to a variety of factors, including but not limited to security features, compatibility between systems and software and hardware components, consumer preferences, industry standards, demands of our financial institution and retail customers, and other factors, we regularly update the technology components, including software, on our ATMs. These technology upgrade efforts, in some cases, may result in downtime to our ATMs, and as a result, loss of transactions and revenues. Additionally, our ability to enhance our current products and services and to develop and introduce innovative products and services that address the increasingly sophisticated needs of our customers will significantly affect our future success. Our ability to take advantage of opportunities in the market may require us to invest considerable resources adapting our organization and capabilities to support development of products and systems that can support new services or be integrated with new technologies and incur other expenses in advance of our ability to generate revenue from these products and services. These developmental efforts may require substantial capital investment, divert resources from other potential investments in our businesses, management time and attention from other matters, and these efforts may not lead to the development of viable new products or services on a timely or cost effective basis. We may not be successful in developing, marketing or selling new products and services that meet these changing demands. In addition, we may experience difficulties that could delay or prevent the successful development, introduction or marketing of these products and services, or our new products and services and enhancements may not adequately meet the demands of the marketplace or achieve market acceptance.
Microsoft announced a plan to end technical support and patches for a series of Windows-based operating systems, including Windows 7, which is currently in use on a large number of our ATMs. Microsoft has stated that support for Windows 7 has ended as of January 2020 and that limited support will be available until 2023 for a fee. As a large number of our ATMs currently operate on Windows 7 we are in the process of upgrading or replacing portions of our fleet. As we progress through the upgrades we anticipate the cost will be significant to us and may elevate our capital expenditures. Changing security features, compatibility requirements and end of life capital replenishment may result in upgrade costs and capital costs as well as downtime at some of our ATMs, which could adversely impact revenues and profits.
If we are unsuccessful in offering products or services that gain market acceptance, it could have an adverse impact on our ability to retain existing customers or attract new ones, which could have a material adverse effect on our revenues and our operations.
Errors or omissions in the settlement of merchant funds or in our vault cash reconciliations could damage our relationships with our merchant customers and vault cash providers, respectively and expose us to liability.
We are responsible for maintaining accurate bank account information for certain of our merchant, financial institution customers and vault cash providers and accurate settlements of funds into these accounts based on the underlying transaction activity. This process relies on precise and authorized maintenance of electronic records and internal controls. Although we have controls in place to help ensure the safety and accuracy of our records in the movement and settlement of funds, errors or unauthorized changes to these records or failure to maintain proper controls of the vault cash in transit with our carriers could result in the erroneous or fraudulent movement of funds, thus damaging our relationships with our merchant customers and vault cash providers exposing us to liability and potentially resulting in a material adverse impact on our operations and cash flows.
23
Changes in interest rates could increase our operating costs by increasing interest expense under our credit facilities and our vault cash rental costs.
Interest on amounts borrowed under our revolving credit facility is based on a floating interest rate, and our vault cash rental expense is based primarily on floating interest rates. As a result, our interest expense and cash management costs are sensitive to changes in interest rates. We pay a monthly fee on the average outstanding vault cash balances in our ATMs under floating rate formulas based on a spread above various LIBOR in the U.S., and the U.K. In Germany and Spain, the rate is based on the Euro Interbank Offered Rate (commonly referred to as “Euribor”). In Mexico, the rate is based on the Interbank Equilibrium Interest Rate (commonly referred to as the “TIIE”), in Canada, the rate is based on the Bank of Canada’s Bankers Acceptance Rate and the Canadian prime rate, and in Australia, the formula is based on the Bank Bill Swap Rates (“BBSY”). Although we currently hedge a portion of our vault cash interest exposure and interest on outstanding borrowings on our revolving credit facility by using interest rate swap and cap contracts, we may not be able to enter into similar arrangements for similar amounts in the future. Any significant future increases in interest rates could have a negative impact on our earnings and cash flow by increasing our operating costs and expenses.
On July 27, 2017, the United Kingdom’s Financial Conduct Authority, which regulates LIBOR, publicly announced that it intends to stop compelling banks to submit LIBOR rates after 2021. The announcement indicates that the continuation of LIBOR on the current basis cannot be guaranteed after 2021. While there is no consensus on what rate or rates may become accepted alternatives to LIBOR, a group of large banks, the Alternative Reference Rate Committee (or "ARRC"), selected the Federal Reserve Bank of New York to publish the Secured Overnight Finance Rate or SOFR as an alternative to LIBOR. Beginning in May 2018, SOFR was established as a broad measure of the cost of overnight borrowing collateralized by U.S. Treasury securities. Furthermore, the Bank of England has commenced publication of a reformed Sterling Overnight Index Average (or "SONIA"), comprised of a broader set of overnight Sterling money market transactions. The SONIA has been recommended as the alternative to Sterling LIBOR by the Bank of England’s Working Group on Sterling Risk-Free Reference Rates. At this time, it is not possible to predict whether SOFR, SONIA or other rates will become widely accepted alternatives to LIBOR. As a result, it is also not possible to predict whether LIBOR will continue in place, what changes will be made to it, what rates may replace LIBOR going forward, or how a reference rate will be determined for purposes of loans, securities and derivative instruments that reference LIBOR when and if it ceases to exist. For these reasons, the potential effect of a LIBOR phase out on our operating costs cannot yet be determined. In addition, any further changes or reforms to the determination or supervision of LIBOR may result in an increase or decrease in reported LIBOR. The potential changes could have a negative impact on our earnings and cash flow by increasing our operating costs and expenses.
For additional information, see Part II. Item 7A. Quantitative and Qualitative Disclosures About Market Risk - Interest Rate Risk.
The election by our merchant customers not to participate in our surcharge-free network offerings could impact the effectiveness of our offerings, which would negatively impact our financial results.
Financial institutions that are members of the Allpoint network pay a fee in exchange for allowing their cardholders to use selected Company-owned, managed and/or participating ATMs on a surcharge-free basis. The success of the Allpoint network is dependent upon the participation by our merchant customers in that network. In the event a significant number of our merchants elect not to participate in that network, the benefits and effectiveness of the network would be diminished, thus potentially causing some of the participating financial institutions to not renew their agreements, terminate early with us, and/or trigger financial penalties, thereby having a negative impact on our financial results.
We may be unable to effectively integrate our acquisitions, which could increase our cost of operations, reduce our profitability, or reduce our shareholder value.
We have been an active business acquirer and may be active in the future. The acquisition and integration of businesses involves a number of risks. The core risks are in the areas of valuation (negotiating a fair price for the business based on inherently limited due diligence) and integration (managing the complex process of integrating the acquired company’s personnel, products, processes, technology, and other assets so as to realize the projected value of the acquired company and the synergies projected to be realized in connection with the acquisition).
The process of integrating operations is time consuming and could cause an interruption of, or loss of momentum in, the activities of one or more of our combined businesses and the possible loss of key personnel. The diversion of management’s attention from day-to-day operations, any delays or difficulties encountered in connection with acquisitions, and the integration of the companies’ operations could have an adverse effect on our business, results of operations, financial condition or prospects. The difficulties of integration may be increased by the necessity of coordinating geographically dispersed organizations, integrating
24
personnel with disparate business backgrounds, and combining different corporate cultures. Further, if we cannot successfully integrate an acquired company’s internal control over financial reporting, the reliability of our consolidated financial statements may be impaired and we may not be able to meet our reporting obligations under applicable law. Any such impairment or failure could cause investor confidence and, in turn, the market price of our common shares, to be materially adversely affected.
In addition, even if we are able to integrate acquired businesses successfully, we may not realize the full benefits of the cost efficiency or synergies, or other benefits that we anticipated when selecting our acquisition candidates or these benefits may not be achieved within a reasonable period of time. We may be required to invest significant capital and resources after an acquisition to maintain or grow the business that we acquire. Further, acquired businesses may not achieve anticipated revenues, earnings, or cash flows. Any shortfall in anticipated revenues, earnings, or cash flows could require us to write down the carrying value of the intangible assets associated with any acquired company, which would adversely affect our reported earnings.
Since we were incorporated as Cardtronics Group, Inc. in 2001, we have acquired numerous ATM businesses, a surcharge-free ATM network, a technology product offering that complements our surcharge-free offering, an ATM installation company in the U.K., a Scotland-based provider and developer of marketing and advertising software and services for ATM owners, a U.K.-based provider of secure cash logistics and ATM maintenance, and a transaction processor in the U.S. We have made acquisitions to obtain the assets of deployed ATM networks and the related businesses and their infrastructure, as well as for strategic reasons to enhance the capability of our ATMs and expand our service offerings. We currently anticipate that our future acquisitions, if any, will likely reflect a mix of asset acquisitions and acquisitions of businesses, with each acquisition having its own set of unique characteristics. In the future, we may acquire businesses outside of our traditional areas, which could introduce new risks and uncertainties. To the extent that we elect to acquire an existing company or the operations, technology, and the personnel of the company, we may assume some or all of the liabilities associated with the acquired company and face new and added challenges integrating such acquisition into our operations.
A failure of enterprise resource planning (“ERP”) and other associated information systems changes could adversely impact our business and our results of operations.
The Company has implemented a new cloud based enterprise resource planning and related information systems in order to better manage the business. This implementation required the commitment of significant personnel and financial resources, and entailed risks to business operations. Failure and difficulties encountered with our new ERP and related information systems would result in lost anticipated productivity improvements or cost efficiencies, and/or interruptions in service or other operational difficulties that hinder our ability to effectively manage our business. If we do experience unanticipated failures or other difficulties with the ERP system, we may incur additional costs associated with repairing and/or re-implementing the system, adversely impacting our financial condition and results of operations.
We operate in many sovereign jurisdictions across the globe and expect to continue to grow our business in new regions. Operating in different countries involves special risks which could result in a reduction of our gross and net profits.
We have operations in the U.S., the U.K., Germany, Spain, Ireland, Mexico, Canada, Australia, New Zealand, India and South Africa. We expect to continue to expand in the countries in which we currently operate, and potentially into other countries as opportunities arise. We currently report our consolidated results in U.S. dollars and under generally accepted accounting principles in the U.S. (“U.S. GAAP” or “GAAP”) and expect to do so for the foreseeable future. Operating in various distinct jurisdictions presents a number of risks, including:
• | exposure to currency fluctuations, including the risk that our future reported operating results could be negatively impacted by unfavorable movements in the functional currencies of our international operations relative to the U.S. dollar, which represents our consolidated reporting currency; |
• | the imposition of exchange controls, which could impair our ability to freely move cash; |
• | difficulties in complying with the different laws and regulations in each country and jurisdiction in which we operate, including unique labor and reporting laws and restrictions on the collection, management, aggregation, and use of information; |
• | unexpected changes in laws, regulations, and policies of governments or other regulatory bodies, including changes that could potentially disallow surcharging or that could result in a reduction in the amount of interchange or other transaction-based fees that we receive; |
• | new, existing or unanticipated conflicts, and political and/or social instability that may be experienced; |
• | rising crime rates in certain of the areas we operate in, including increased incidents of crimes on our ATMs and against store personnel where our ATMs are located; |
• | difficulties in staffing and managing foreign operations, including hiring and retaining skilled workers in those countries in which we operate; |
25
• | decreased ATM usage related to decreased travel and tourism or travel restrictions and quarantines in the markets that we operate in; |
• | decreased use or restrictions on the use of cash, or supply chain or staffing interruptions, related to the widespread outbreak of contagious diseases; |
• | exposure to corruption in jurisdictions where we operate; and |
• | potential adverse tax consequences, including restrictions on the repatriation of foreign earnings. |
Any of these factors could have a material adverse impact on us and reduce the revenues and profitability derived from our international operations and thereby adversely impact our consolidated operations and cash flows.
The exit of the U.K. from the European Union could adversely affect us and our shareholders.
On January 31, 2020, the U.K. exited the European Union and is now in a transition period through December 2020. As a significant portion of our operations are located in the U.K. and our parent company is incorporated in the U.K., we face potential risks associated with the exit and transition. The exit of the U.K. from the E.U. and implementation of the resulting changes could materially and adversely affect the tax, tax treaty, currency, operational, legal, human, and regulatory regime as well as the macro-economic environment in which we operate. The effect of any of these risks, were they to materialize, is difficult to quantify, but could materially increase our operating and compliance costs and materially affect our tax position or business, results of operations and financial position.
We derive a significant portion of our revenues and profits from bank-branding relationships with financial institutions and surcharge-free revenue from our Allpoint network. A decline in these revenues as a result of changes in financial institution and card provider demand for these services may have a significant negative impact on our results.
Bank-branding and surcharge-free revenues from our Allpoint network drive a significant portion of our revenues, and if these product offerings were to become less attractive to financial institutions and card providers whereby we lost a significant amount of existing contracts, it could have a material impact on our revenues and profits. In addition, consolidations within the banking industry may impact our bank-branding relationships as existing bank-branding customers are acquired by other financial institutions, some of which may not be existing bank-branding customers. Our bank-branding contracts could be adversely affected by such consolidations.
If we experience additional impairments of our goodwill or other intangible assets, we will be required to record a charge to earnings, which may be significant.
We have a large amount of goodwill and other intangible assets and are required to perform periodic assessments for any possible impairment for accounting purposes. We periodically evaluate the recoverability and the amortization period of our intangible assets under U.S. GAAP and have taken impairment charges following this analysis in the past. Some of the factors that we consider important in assessing whether or not impairment exists include the performance of the related assets relative to the expected historical or projected future operating results, significant changes in the manner of our use of the assets or the strategy for our overall business, and significant negative industry or economic trends. These factors and assumptions, and any changes in them, could result in an impairment of our goodwill and other intangible assets.
During 2019, we recognized a $7.3 million impairment of our goodwill in our Canada reporting unit. Additionally, during 2017, we recognized impairments of our goodwill and other intangible assets of $140.0 million and $54.5 million, respectively, in our Australia & New Zealand reporting unit. See the risk factor entitled, The broad introduction of free-to-use ATMs in Australia has and will continue to adversely impact our revenues and profits, above for additional information regarding the market changes that resulted in this impairment. As of December 31, 2019, we had goodwill and other intangible assets of $752.6 million and $113.9 million, respectively. In the event we determine our goodwill or amortizable intangible assets are impaired in the future, we may be required to record a significant charge to earnings in our consolidated financial statements, which would negatively impact our results of operations and that impact could be material.
We may accumulate excess or obsolete inventory or assets that cannot be used or re-deployed, which could result in unanticipated write-downs and adversely affect our financial results.
To the extent we are not able to re-deploy the assets, we may in future periods incur write-downs of these and other assets which could materially and adversely affect our business, results of operations, and stockholders’ equity.
26
We have a significant amount of indebtedness, which may adversely affect our cash flow and our ability to operate our business, remain in compliance with debt covenants, and make payments on our indebtedness.
As of December 31, 2019, our outstanding indebtedness was $754.8 million, which represents approximately 67% of our total book capitalization of approximately $1.1 billion. Our indebtedness could have important consequences. For example, it could:
• | make it difficult for us to satisfy our obligations with respect to our indebtedness, and any failure to comply with the obligations of any of our debt instruments, including financial and other restrictive covenants, could result in an event of default under the indentures governing our senior subordinated notes and the agreements governing our other indebtedness; |
• | require us to dedicate a substantial portion of our cash flow in the future to pay principal and interest on our debt, which will reduce the funds available for working capital, capital expenditures, acquisitions, and other general corporate purposes; |
• | require us to refinance our indebtedness or, in the case of our Convertible Notes, issue shares; |
• | limit our flexibility in planning for and reacting to changes in our business and in the industry in which we operate; |
• | make us more vulnerable to adverse changes in general economic, industry and competitive conditions, and adverse changes in government regulation; and |
• | limit our ability to borrow additional amounts for working capital, capital expenditures, acquisitions, debt service requirements, execution of our growth strategy, research and development costs, or other purposes. |
Any of these factors could materially and adversely affect our business, results of operations, and cash flows. We cannot assure shareholders that our business will generate sufficient cash flow from operations or that future borrowings, including those under our credit facilities, will be available in an amount sufficient to pay our indebtedness. If we do not have sufficient earnings or capital resources to service our debt, we may be required to refinance all or part of our existing debt, sell assets, borrow more money, delay investment and capital expenditures, or sell equity or debt securities, none of which we can guarantee we will be able to do on commercially reasonable terms or at all. For additional information, see Part II. Item 7. Management’s Discussion and Analysis of Financial Condition and Results of Operations - Liquidity and Capital Resources - Financing Facilities.
Our $287.5 million Convertible Notes are due to mature on December 1, 2020. While our current plan is to retire these obligations with additional borrowings under our revolving credit facility and we currently have and expect to have the necessary capacity under our revolving credit facility to repay the Convertible Notes, there can be no assurance that we will be able to borrow the necessary funds at the time they mature. Alternatively, if we are unable to secure the necessary funds through our revolving credit facility or another financing vehicle, we may issue new common stock for the settlement of the Convertible Notes which could dilute our current shareholders’ equity interests.
The terms of our credit agreement and the indentures governing our senior notes may restrict our current and future operations, particularly our ability to respond to changes in our business or to take certain actions.
Our credit agreement and the indentures governing our senior notes include a number of covenants that, among other items, restrict or limit our ability to:
• | sell or transfer property or assets; |
• | pay dividends on or redeem or repurchase shares; |
• | merge into or consolidate with any third-party; |
• | create, incur, assume, or guarantee additional indebtedness; |
• | create certain liens; |
• | make investments; |
• | engage in transactions with affiliates; |
• | issue or sell preferred shares of restricted subsidiaries; and |
• | enter into sale and leaseback transactions. |
In addition, we are required by our credit agreement to adhere to certain covenants and maintain specified financial ratios. As a result of these ratios, we may be limited in the manner in which we conduct our business in the future and may be unable to engage in favorable business activities or finance our future operations or capital needs. Accordingly, these restrictions may limit our ability to successfully operate our business and prevent us from fulfilling our debt obligations. A failure to comply with the covenants or financial ratios could result in an event of default. In the event of a default under our credit agreement, the lenders could exercise a number of remedies, some of which could result in an event of default under the indentures governing the senior notes. An acceleration of indebtedness under our credit agreement would also likely result in an event of default under the terms of any other financing arrangement we have outstanding at the time. If any or all of our debt were to be accelerated, we cannot assure shareholders that our assets would be sufficient to repay our indebtedness in full. If we are unable to repay any amounts
27
outstanding under our bank credit facility when due, the lenders will have the right to proceed against the collateral securing our indebtedness. Such actions could have a material adverse impact on our operations and cash flows. For additional information related to our credit agreement and indentures, see Part II. Item 7. Management’s Discussion and Analysis of Financial Condition and Results of Operations - Liquidity and Capital Resources - Financing Facilities.
The fundamental change and make-whole fundamental change provisions associated with our $287.5 million of 1.00% Convertible Senior Notes due December 2020 (“Convertible Notes”) may delay or prevent an otherwise beneficial takeover attempt of us.
The fundamental change purchase rights, which will allow holders of our Convertible Notes to require us to purchase all or a portion of their notes upon the occurrence of a fundamental change, and the provisions requiring an increase to the conversion rate for conversions in connection with certain other circumstances may delay or prevent a takeover of us or the removal of current management that might otherwise be beneficial to investors. For the potential dilutive effect on the convertible notes, see the risk factor entitled The accounting method for convertible debt securities that may be settled in cash could have a material affect on our reported financial results.
We may not have the ability to raise the funds necessary to pay the amount of cash due upon conversion of the Convertible Notes, if relevant, or upon the occurrence of a fundamental change as described in our convertible indentures, and our debt may contain limitations on our ability to pay cash upon conversion or required purchase of the Convertible Notes.
Upon the occurrence of a fundamental change, holders of our Convertible Notes may require us to purchase, for cash, all or a portion of their Convertible Notes at a fundamental change purchase consideration specified within the convertible note indentures. There can be no assurance that we will have sufficient financial resources, or will be able to arrange financing, to pay the fundamental change purchase consideration if holders submit their Convertible Notes for purchase by us upon the occurrence of a fundamental change or to pay the amount of cash (if any) due if holders surrender their Convertible Notes for conversion. In addition, the occurrence of a fundamental change may cause an event of default under agreements governing us or our subsidiaries’ indebtedness. Agreements governing any future debt may also restrict our ability to make any of the required cash payments even if we have sufficient funds to make them. Furthermore, our ability to purchase the Convertible Notes or to pay cash (if any) due upon the conversion of the Convertible Notes may be limited by law or regulatory authority. In addition, if we fail to purchase the Convertible Notes or to pay the amount of cash (if any) due upon conversion of the Convertible Notes, we will be in default under the indenture. A default under the indenture or the fundamental change itself could also lead to a default under agreements governing our other indebtedness, which in turn may result in the acceleration of other indebtedness we may then have. If the repayment of the other indebtedness were to be accelerated, we may not have sufficient funds to repay that indebtedness and to purchase the Convertible Notes or to pay the amount of cash (if any) due upon conversion. Our convertible notes are due December 2020, see Part I. Item 1A. We have a significant amount of indebtedness, which may adversely affect our cash flow and our ability to operate our business, remain in compliance with debt covenants, and make payments on our indebtedness.
Non-compliance with established EFT network rules and regulations could expose us to fines, penalties or other liabilities and could negatively impact our results of operations. Additionally, new EFT network rules and regulations could require us to expend significant amounts of capital to remain in compliance with such rules and regulations.
Our transactions are routed over various EFT networks to obtain authorization for cash disbursements and to provide account balances. These networks include Star, Pulse, NYCE, Cirrus (MasterCard), and Plus (Visa) in the U.S., and LINK in the U.K., among other networks. We utilize various other EFT networks in our other geographic locations. EFT networks set the interchange fees that they charge to the financial institutions, as well as the amounts paid to us. Additionally, EFT networks, including MasterCard and Visa, establish rules and regulations that ATM providers, including ourselves, must comply with in order for member cardholders to use those ATMs. Failure to comply with such rules and regulations could expose us to penalties and/or fines, which could negatively impact our financial results. Furthermore, compliance may in certain instances require capital expenditure, which could be significant. The payment networks’ rules and regulations are generally subject to change and they may modify their rules and regulations from time to time. Our inability to react to changes in the rules and regulations or the interruption or application thereof, may result in the substantial disruption of our business.
The majority of the electronic debit networks over which our transactions are conducted require sponsorship by a bank, and the loss of any of our sponsors and our inability to find a replacement may cause disruptions to our operations.
In each of the geographic segments in which we operate, bank sponsorship is required in order to process transactions over certain networks. In all of our markets, our ATMs are connected to financial transaction switching networks operated by organizations such as Visa and MasterCard. The rules governing these switching networks require any company sending transactions through these networks to be a bank or a technical service processor that is approved and monitored by a bank. As a result, the
28
operation of our ATM network in all of our markets depends on our ability to secure these “sponsor” arrangements with financial institutions. In the U.S., our largest geographic segment by revenues, bank sponsorship is required on a significant majority of our transactions and we rely on our sponsor banks for participation in the applicable networks. In the U.K., only international transactions require bank sponsorship. In Mexico, all ATM transactions require bank sponsorship, which is currently provided by our banking partners in the country. In Canada, Germany, and Spain, bank sponsorships are also required and are obtained through our relationships with third-party processors. If our current sponsor banks decide to no longer provide this service, or are no longer financially capable of providing this service as may be determined by certain networks, it may be difficult to find an adequate replacement at a cost similar to what we incur today, or potentially, we could incur a temporary service disruption for certain transactions in the event we lose or do not retain bank sponsorship, which may negatively impact our profitability and may prevent us from doing business in that market.
If we lose key personnel or are unable to attract additional qualified personnel as we grow, our business could be adversely affected.
We are dependent upon the ability and experience of a number of key personnel who have substantial experience with our operations, the rapidly changing automated consumer financial services industry, and the geographical segments in which we operate. It is possible that the loss of the services of one or a combination of several of our senior executives or key managers would have an adverse effect on our operations, if we are not able to find suitable replacements for such persons in a timely manner. Unexpected turnover in key leadership positions within the Company may adversely impact our ability to manage the Company efficiently and effectively, could be disruptive and distracting to management and may lead to additional departures of existing personnel, any of which could adversely impact our business. Any adverse change in our reputation, whether as a result of decreases in revenue or a decline in the market price of our common shares, could affect our ability to motivate and retain our existing employees and recruit new employees. Our success also depends on our ability to continue to attract, manage, motivate and retain other qualified management, as well as technical and operational personnel as we grow. We may not be able to continue to attract and retain such personnel in the future, which could adversely impact our business.
We are subject to business cycles, seasonality, and other outside factors such as extreme weather, natural disasters or health emergencies that may negatively affect our business.
Many of our ATMs are located in convenience stores, gas stations, malls, grocery stores, drug stores, airports, train stations, and other large retailers and are utilized by consumers that frequent them. As such transaction volumes at our ATMs located in regions affected by strong winter weather patterns typically experience declines in volume during those months as a result of decreases in the amount of consumer traffic through such locations. With the majority of our ATMs located in the northern hemisphere, we expect to see slightly higher transactions in the warmer summer months from May through August, which are also aided by increased vacation and holiday travel. As a result of these seasonal variations, our quarterly operating results may fluctuate and could lead to volatility in the price of our shares. In addition, if a recessionary economic environment were to reduce traffic at our ATM locations, this could impact the level of transactions taking place on our networks and at our ATMs.
Natural or man-made disasters (including, hurricanes, flooding, tornadoes, fires, or acts of war or terror), uncharacteristic or significant weather conditions or real or potential health emergencies such as the widespread outbreak of contagious diseases could hinder travel, result in travel bans, government restrictions or quarantines. Any of these events could restrict or reduce traffic at our ATM locations, reduce the use or demand for cash or decrease demand for our services. In addition, any catastrophic events or significant business interruptions could reduce or impair our ability, and that of our employees, to provide services and conduct operations and this may occur in a manner that cannot be mitigated by our disaster and business continuity planning or cause losses which are not recoverable under our insurance policies. The impact of such events may have a range of lingering impacts on us, our employees, customers, our suppliers and the overall economy, adversely affecting our operations, financial condition, results of operations and cash flows even after the initial incident resolves.
Changes in tax laws, regulations and interpretations or challenges to our tax positions could adversely affect our business.
We are a large corporation with operations in various jurisdictions around the world. As such, we are subject to tax laws and regulations of federal, state and local governments. We compute our income tax provision based on enacted tax rates in the jurisdictions in which we operate. As the tax rates vary among jurisdictions, a change in earnings attributable to the various jurisdictions in which we operate could result in an unfavorable change in our overall tax provision.
From time to time, changes in tax laws or regulations may be proposed or enacted that could adversely affect our overall tax liability. For example, the recent U.S. tax legislation enacted on December 22, 2017 resulted in significant changes to the U.S. federal tax code. This tax legislation significantly reduced the U.S. statutory corporate tax rate and made other changes that could have a favorable impact on our overall U.S. federal tax liability in a given period. However, the tax legislation also included a
29
number of provisions, including, but not limited to, the limitation or elimination of various deductions or credits (including for interest expense and for performance-based compensation under Section 162(m)), the imposition of taxes on certain cross-border payments or transfers and the changing of the timing of the recognition of certain income and deductions or their character that could significantly and adversely affect our U.S. federal income tax position. There can be no assurance that changes in tax laws or regulations, both within the U.S. and the other jurisdictions in which we operate, will not materially and adversely affect our effective tax rate, tax payments, financial condition and results of operations. Similarly, changes in tax laws and regulations that impact our customers and counterparties or the economy generally may also impact our financial condition and results of operations.
We may also be audited from time to time and while we generally believe we comply with all filing and reporting requirements, a regulator may challenge a particular position or interpretation of law or practice. Certain of our entities are currently under audit.
In addition, tax laws and regulations are complex and subject to varying interpretations, and any significant failure to comply with applicable tax laws and regulations in all relevant jurisdictions could give rise to substantial penalties and liabilities. Any changes in enacted tax laws (such as the recent U.S. tax legislation), rules or regulatory or judicial interpretations; any adverse outcome in connection with tax audits in any jurisdiction; or any change in the pronouncements relating to accounting for income taxes could materially and adversely impact our effective tax rate, tax payments, financial condition and results of operations.
We operate in several jurisdictions and we could be adversely affected by violations of anti-bribery, sanctions and anti-money laundering laws and regulations.
Our business operations are subject to anti-corruption laws and regulations, including restrictions imposed by the U.S. Foreign Corrupt Practices Act (“FCPA”). The FCPA and similar anti-corruption laws in other jurisdictions, such as the U.K. Bribery Act, generally prohibit companies and their intermediaries from paying or promising to pay government officials, political parties, or political party officials and in some cases private individuals or organizations for the purpose of obtaining, retaining, influencing, or directing business. We operate in parts of the world that have experienced governmental or commercial corruption to some degree and, in certain circumstances, compliance with anti-corruption laws may conflict with local customs and practices.
Our employees and agents may interact with government officials on our behalf, including interactions necessary to obtain licenses and other regulatory approvals necessary to operate our business, import or export equipment and resolve tax disputes. These interactions create a risk that actions may occur that could violate the FCPA or other similar laws.
Although we have implemented policies and procedures designed to ensure compliance with local laws and regulations as well as U.S. and U.K. laws and regulations, including the FCPA and the U.K. Bribery Act, there can be no assurance that all of our employees, consultants, contractors and agents will abide by our policies. If we were to be found to be liable for violations of the FCPA, the U.K. Bribery Act or similar anti-corruption laws, either due to our own acts or out of inadvertence, or due to the acts or inadvertence of others, we could suffer from criminal or civil penalties which could have a material and adverse effect on our business, results of operations, financial condition, and cash flows.
We are also subject to economic and trade sanctions programs that are administered globally by the United Nations and in the United States by the Treasury Department’s Office of Foreign Assets Control (OFAC). These programs prohibit or restrict transactions to or from or dealings with specified countries, governments or individuals, including narcotics traffickers and terrorists or terrorist organizations. Additionally other countries in which we operate also have sanctions programs including Canada, Australia, the United Kingdom and the European Union.
Compliance with sanctions regulations may be onerous and expensive, and they may be inconsistent or contradictory between jurisdictions. Any violation of OFAC or other sanctions regulations could result in criminal or civil penalties which could have a material and adverse effect on our business, results of operations, financial condition, and cash flows.
Many jurisdictions apply financial crime regulations, including combating money laundering and terrorist financing. Whilst we are not a financial institution, certain of these regulations may apply to our businesses. To the extent that they do, any violation of such financial crime regulations could have a material and adverse effect on our business, results of operations, financial condition, and cash flows.
30
If we are unable to adequately protect our intellectual property, we may lose a valuable competitive advantage or be forced to incur costly litigation to protect our rights. Additionally, if we face claims of infringement of third-party intellectual property, we may be forced to incur costly litigation.
Our success depends, in part, on developing and protecting our intellectual property. We rely on copyright, patent, trademark and trade secret laws to protect our intellectual property. We also rely on other confidentiality and contractual agreements and arrangements with our employees, affiliates, business partners and customers to establish and protect our intellectual property and similar proprietary rights. While we expect these agreements and arrangements to be honored, we cannot assure shareholders that they will be and, despite our efforts, our trade secrets and proprietary know-how could become known to, or independently developed by competitors. Agreements entered into for that purpose may not be enforceable or provide us with an adequate remedy. Effective patent, trademark, service mark, copyright and trade secret protection may not be available in every country in which our applications and services are made available. Any litigation relating to the defense of our intellectual property, whether successful or unsuccessful, could result in substantial costs to us and potentially cause a diversion of our resources.
In addition, we may face claims of infringement that could interfere with our ability to use technology or other intellectual property rights that are material to our business operations. We may expose ourselves to additional liability if we agree to indemnify our customers against third-party infringement claims. If the owner of intellectual property establishes that we are, or a customer which we are obligated to indemnify is, infringing its intellectual property rights, we may be forced to change our products or services, and such changes may be expensive or impractical, or we may need to seek royalty or license agreements from the owner of such rights. In the event a claim of infringement against us is successful, we may be required to pay royalties to use technology or other intellectual property rights that we had been using, or we may be required to enter into a license agreement and pay license fees, or we may be required to stop using the technology or other intellectual property rights that we had been using. We may be unable to obtain necessary licenses from third-parties at a reasonable cost or within a reasonable amount of time. Any litigation of this type, whether successful or unsuccessful, could result in substantial costs to us and potentially cause a diversion of our resources.
We are subject to business cycles, seasonality, and other outside factors that may negatively affect our business.
Our overall business is subject to seasonal variations. Transaction volumes at our ATMs located in regions affected by strong winter weather patterns typically experience declines in volume during those months as a result of decreases in the amount of consumer traffic through such locations. With the majority of our ATMs located in the northern hemisphere, we expect to see slightly higher transactions in the warmer summer months from May through August, which are also aided by increased vacation and holiday travel. As a result of these seasonal variations, our quarterly operating results may fluctuate and could lead to volatility in the price of our shares. In addition, a recessionary economic environment could impact the level of transactions taking place on our networks, which could have a material impact on our operations and cash flows.
Cardtronics plc may be treated as a U.S. corporation for U.S. federal income tax purposes and could be liable for substantial additional U.S. federal income taxes in the event our redomicile to the U.K. is successfully challenged by the U.S. Internal Revenue Service (“IRS”).
For U.S. federal income tax purposes, a corporation is generally considered a tax resident in the jurisdiction of its incorporation or organization. Because Cardtronics plc is incorporated under English law, it should be considered a U.K. tax resident, and not a U.S. tax resident under these general rules. However, Section 7874 of the Code provides that a corporation organized outside the U.S. that acquires substantially all of the assets of a corporation organized in the U.S. (including through a merger) will be treated as a U.S. corporation (and therefore, a U.S. tax resident) for U.S. federal income tax purposes if (i) the shareholders of the acquired U.S. corporation own at least 80% (of either the voting power or value) of the share of the acquiring foreign corporation after the acquisition and (ii) the acquiring foreign corporation’s “expanded affiliated group” does not have substantial business activities in the country in which the acquiring foreign corporation is organized relative to the expanded affiliated group’s worldwide activities (“substantial business activities” or the “SBA Test”). Pursuant to the Redomicile Transaction, Cardtronics plc indirectly acquired all of Cardtronics Delaware’s assets, and Cardtronics Delaware shareholders held 100% of the value of Cardtronics plc by virtue of their prior share ownership of Cardtronics Delaware immediately after the Redomicile Transaction. As a result, the Cardtronics plc expanded affiliated group (which includes Cardtronics Delaware and its subsidiaries) must have had substantial business activities in the U.K. for Cardtronics plc to avoid being treated as a U.S. corporation for U.S. federal income tax purposes under Section 7874 of the Code. In order for the Cardtronics plc expanded affiliated group to have satisfied the SBA Test, at least 25% of the employees (by headcount and compensation), assets, and gross income of such group must have been based, located, and derived, respectively, in the U.K. as of the dates and for relevant periods under the Code sections.
Cardtronics plc believes it fully satisfied the SBA Test and performed rigorous analysis to support this conclusion. However, the application of Section 7874 of the Code is not entirely clear in all situations, and while we believe the SBA Test was fully
31
satisfied, there is no assurance that the IRS or a court will agree. Furthermore, there have been legislative proposals to expand the scope of U.S. corporate tax residence and there could be changes to the Code (including Section 7874 of the Code) or the U.S. Treasury Regulations that could result in Cardtronics plc being treated as a U.S. corporation or otherwise have adverse consequences. Such statutory or regulatory provisions could have retroactive application.
If it were determined that Cardtronics plc should be taxed as a U.S. corporation for U.S. federal income tax purposes, Cardtronics plc could be liable for substantial additional U.S. federal income taxes. Additionally, the U.K. could continue to tax Cardtronics plc as a U.K. tax resident for U.K. tax purposes, and thus Cardtronics plc and its shareholders could be subject to taxation in both the U.S. and the U.K.
Our U.S. shareholders could suffer tax consequences if we are treated as a “controlled foreign corporation” for U.S. federal income tax purposes.
A foreign corporation will be treated as a “controlled foreign corporation” (“CFC”) for U.S. federal income tax purposes if, on any day during the taxable year of such foreign corporation, more than 50% of the equity interests in such corporation, measured by reference to the combined voting power or value of the equity of the corporation, is owned directly or by application of the attribution and constructive ownership rules of Sections 958(a) and 958(b) of the Internal Revenue Code by United States Shareholders. For this purpose, a “United States Shareholder” is any United States person that possesses directly, or by application of the attribution and constructive ownership rules of Sections 958(a) and 958(b) of the Code, 10% or more of the combined voting power of all classes of equity in such corporation. Each United States Shareholder of our Company who owns, directly or indirectly, our common shares on the last day of the taxable year on which we are a CFC will be required to include in its gross income for United States federal income tax purposes its pro rata share of our “Subpart F income,” even if the Subpart F income is not distributed. Subpart F income generally includes passive income but also includes certain related party sales, manufacturing and services income. Additionally, post U.S. Tax Reform, each United States Shareholder of our Company may be required to include in their gross income for United States federal income tax purposes its pro rata share of our Global Intangible Low-Taxed Income, even if undistributed. If we are a CFC, the Passive Foreign Investment Company ("PFIC") rules set forth above, even if we are otherwise considered to be a PFIC, will not be applicable. United States persons who might, directly, indirectly or constructively, acquire 10% or more of our common shares, and therefore might be a United States Shareholder, should consider the possible application of the CFC rules, and consult a tax advisor with respect to such matter.
Our operating results have fluctuated historically and could continue to fluctuate in the future, which could affect our ability to maintain our current market position or expand.
Our operating results have fluctuated in the past and may continue to fluctuate in the future as a result of a variety of factors, many of which are beyond our control, including the following:
• | changes in consumers’ preferences for cash as a payment vehicle; |
• | changes implemented by networks and how they determine interchange rates; |
• | changes in general economic conditions and specific market conditions in the ATM and financial services industries; |
• | competition from other companies providing the same or similar services that we offer; |
• | changes in the demand for our services by financial institutions; |
• | changes in legislative or regulatory requirements associated with the ATM and financial services industries; |
• | changes in payment trends and offerings in the markets in which we operate; |
• | security or data breaches, cyber-incidents or other business disruptions; |
• | changes in the financial condition and operational execution of our key vendors and service providers; |
• | changes in the mix of our merchant customers; |
• | the timing and magnitude of operating expenses, capital expenditures, and expenses related to the expansion of sales, marketing, and operations, including as a result of acquisitions, if any; |
• | political or social instability; |
• | the timing and magnitude of any impairment charges that may materialize over time relating to our goodwill, intangible assets, or long-lived assets; |
• | changes in the general level of interest rates in the markets in which we operate; |
• | changes in inflation or how key vendors and suppliers price their services to us; |
• | changes in the mix of our current services; |
• | changes in the financial condition and credit risk of our customers; |
• | any adverse results in litigation by us or by others against us; |
• | our inability to make payments on our outstanding indebtedness as they become due; |
• | our failure to successfully enter new markets or the failure of new markets to develop in the time and manner we anticipate; |
• | acquisitions, strategic alliances, or joint ventures involving us, our customers, vendors, or our competitors; |
32
• | terrorist acts, theft, vandalism, fires, floods, or other natural disasters; |
• | decreased use or restrictions on the use of cash, or supply chain interruptions, related to the widespread outbreak of contagious diseases; |
• | additions or departures of key personnel; |
• | changes in tax rates or tax policies in the jurisdictions in which we operate; and |
• | exposure to currency fluctuations, including the risk that our future reported operating results could be negatively impacted by unfavorable movements in the functional currencies of our international operations relative to the U.S. dollar, which represents our consolidated reporting currency. |
Any of the foregoing factors could have a material adverse effect on our business, results of operations, and financial condition. Although we have experienced revenue growth in recent years, this growth rate is not necessarily indicative of future operating results. A relatively large portion of our expenses are fixed in the short-term, particularly with respect to personnel expenses, depreciation and amortization expenses, and interest expense. Therefore, our results of operations are particularly sensitive to fluctuations in revenues. Additionally, beginning in July 2017, the loss of our largest customer at that time, 7-Eleven in the U.S., had a significant negative impact on our income from operations and cash flows. As such, comparisons to prior periods should not be relied upon as indications of our future performance.
Risks associated with our common shares
We may issue additional common shares or instruments convertible into common shares, which may materially and adversely affect the market price of our common shares and the trading price of our Convertible Notes.
We may conduct future offerings of our common shares or other securities convertible into our common shares to fund acquisitions, finance operations or for general corporate purposes. In addition, we may elect to settle the conversion of our outstanding Convertible Notes in common shares and we may also issue common shares under our equity awards programs. The market price of our common shares or the trading price of the Convertible Notes could decrease significantly if we conduct such future offerings, if any of our existing shareholders sells a substantial amount of our common shares or if the market perceives that such offerings or sales may occur. Moreover, any issuance of additional common shares will dilute the ownership interest of our existing common shareholders and may adversely affect the ability of holders of our Convertible Notes to participate in any appreciation of our common shares.
The accounting method for convertible debt securities that may be settled in cash could have a material affect on our reported financial results.
Under U.S. GAAP, an entity must separately account for the debt component and the embedded conversion option of convertible debt instruments that may be settled entirely or partially in cash upon conversion, such as our Convertible Notes, in a manner that reflects the issuer’s economic interest cost. The effect of the accounting treatment for such instruments is that the value of such embedded conversion option is treated as an original issue discount for purposes of accounting for the debt component of the Convertible Notes, and that original issue discount is amortized into interest expense over the term of the Convertible Notes using an effective yield method. As a result, we are required to record non-cash interest expense as a result of the amortization of the effective original issue discount to the Convertible Notes’ face amount over the term of the notes. Accordingly, we report lower net income in our financial results because of the recognition of both the current period’s amortization of the debt discount and the Convertible Notes’ coupon interest.
Under certain circumstances, convertible debt instruments that may be settled entirely or partially in cash are evaluated for their impact on earnings per share utilizing the treasury stock method, the effect of which is that the shares issuable upon conversion of the notes are not included in the calculation of diluted earnings per share except to the extent that the conversion value of the notes exceeds their principal amount. Under the treasury stock method, for diluted earnings per share purposes, the notes are accounted for as if the number of common shares that would be necessary to settle such excess, if we elected to settle such excess in shares, are issued. If we are unable to use the treasury stock method in accounting for the shares issuable upon conversion of the notes, then our diluted earnings per share could be adversely affected.
Our articles of association include mandatory offer provisions that may be viewed as less favorable to shareholders, including with respect to takeover matters.
Although we are not currently subject to the U.K. Takeover Code, certain provisions similar to the mandatory offer provisions and certain other aspects of the U.K. Takeover Code were specifically approved and included in our articles of association that were adopted at the special meeting of shareholders of Cardtronics Delaware held in June 2016 in connection with the Redomicile Transaction. As a result, except as permitted by our articles of association, (including acquisitions with the consent of our Board
33
of Directors or with prior approval by the independent shareholders at a general meeting), a shareholder, together with persons acting in concert, would be at risk of certain Board of Directors sanctions if they acquired 30% or more of our issued shares without making a voluntary offer for all of the issued and outstanding shares, not already held by the acquirer, that is in cash (or accompanied by a full cash alternative) and otherwise in accordance with the provisions of the U.K. Takeover Code, (as if the U.K. Takeover Code applied to us). The ability of shareholders to retain their shares upon completion of an offer for our entire issued share capital may depend on whether the Board of Directors subsequently agrees to propose a court-approved scheme of arrangement that would, if approved by our shareholders, compel minority shareholders to transfer or surrender their shares in favor of the offeror, or if the offeror acquires at least 90% of the shares. In that case, the offeror can require minority shareholders to accept the offer under the ‘squeeze-out’ provisions in our articles of association. The mandatory offer provisions in our articles of association could have the effect of discouraging the acquisition and holding of interests of 30% or more of our issued shares and encouraging those shareholders, who may be acting in concert, with respect to the acquisition of shares, to obtain the recommendation of our Board of Directors before effecting any additional purchases. In addition, these provisions may adversely affect the market price of our shares or inhibit fluctuations in the market price of our shares that could otherwise result from actual or rumored takeover attempts.
English law generally provides for increased shareholder approval requirements with respect to certain aspects of capital management.
English law provides that a board of directors may generally only allot shares with the prior authorization of shareholders and such authorization must specify the maximum nominal value of the shares that can be allotted and can be granted for a maximum period of five years, each as specified in the articles of association or the relevant shareholder resolution. English law also generally provides shareholders with preemptive rights when new shares are issued for cash. It is possible, however, for the articles of association, or shareholders in a general meeting, to exclude preemptive rights, if coupled with a general authorization to allot shares. Such an exclusion of preemptive rights may be for a maximum period of up to five years from the date of adoption of the articles of association, or from the date of the shareholder resolution, as applicable.
English law also prohibits us from repurchasing our own shares by way of “off market purchases” by ordinary resolution (i.e., majority of votes cast of our shareholders). Such authority can be granted for a maximum period of up to five years but may be sought more frequently. English law prohibits us from conducting “on market purchases” as our shares are listed on NASDAQ and will not be traded on a recognized investment exchange in the U.K.
Our shareholders approved the authorization of off market purchases that will expire in 2024 unless renewed by our shareholders prior to the expiration date. We cannot assure shareholders that situations will not arise where such shareholder approval requirements for any of these actions would deprive our shareholders of substantial capital management benefits.
ITEM 1B. UNRESOLVED STAFF COMMENTS
None.
ITEM 2. PROPERTIES
Our principal executive offices are located at 2050 West Sam Houston Parkway South, Suite 1300, Houston, Texas 77042 where we lease 53,544 square feet of office space. We also maintain other offices in North America, Europe, Australia, and South Africa. All of our properties are leased pursuant to operating leases for various terms and we believe they are adequate for our current use. We believe that our leases are at market rates and do not anticipate any difficulty in leasing suitable additional space upon expiration of our current lease terms.
ITEM 3. LEGAL PROCEEDINGS
The Company is subject to various legal proceedings and claims arising in the ordinary course of its business. The Company has provided reserves where necessary for all claims and the Company’s management does not expect the outcome in any legal proceedings or claims, individually or collectively, to have a material adverse financial or operational impact on the Company. Additionally, the Company currently expenses all legal costs as they are incurred.
ITEM 4. MINE SAFETY DISCLOSURES
Not Applicable.
34
PART II
ITEM 5. MARKET FOR REGISTRANT’S COMMON EQUITY, RELATED STOCKHOLDER MATTERS AND ISSUER PURCHASES OF EQUITY SECURITIES
Market information and holders. Our common shares trade on The NASDAQ Global Select Market under the symbol “CATM.” As of February 27, 2020, the majority of our shareholders held their shares in “street name” by a nominee of the Depository Trust Company.
Dividend information. We have historically not paid dividends with respect to our common shares. For additional information related to our restrictions on our ability to pay dividends, see Item 8. Financial Statements and Supplementary Data, Note 11. Debt.
Purchases of Equity Securities. The Company repurchased and canceled an accumulated total of 1,732,392 outstanding Class A ordinary shares between May and September 2019. These shares were repurchased at a weighted average price of $28.86 per share for an aggregate purchase price of approximately $50 million. There were no repurchases of the Company's ordinary shares in the three months ended December 31, 2019.
For information on securities authorized for issuance under our existing equity compensation plans, see “Securities Authorized for Issuance under Equity Compensation Plans” under the heading “Share Ownership Matters” in our proxy statement filed with the SEC.
Share performance graph. The following graph compares the five-year total return to holders of Cardtronics plc’s common shares, the NASDAQ Composite index (the “Index”), and a customized peer group of 12 companies that includes: (i) ACI Worldwide, Inc. (ACIW), (ii) CSG Systems International, Inc. (CSGS), (iii) Euronet Worldwide, Inc. (EEFT), (iv) Everi Holdings Inc. (EVRI), (v) Fair Isaac Corp. (FICO), (vi) Global Payments, Inc. (GPN), (vii) Jack Henry & Associates, Inc. (JKHY), (viii) Liveramp Holdings, Inc. (RAMP), (ix) MoneyGram International, Inc. (MGI), (x) SS&C Technologies Holdings, Inc. (SSNC), (xi) Total Systems Services, Inc. (TSS), and (xii) WEX, Inc. (WEX), (collectively, the “Peer Group”).
We selected the Peer Group companies because they are publicly traded companies that: (i) have the same Global Industry Classification Standard classification, (ii) earn a similar amount of revenues, (iii) have similar market values, and (iv) provide services that are similar to the services we provide.
The performance graph below was prepared based on the following assumptions: (i) $100 was invested in our common shares, in our Peer Group, and the Index on December 31, 2014, (ii) investments in the Peer Group are weighted based on the returns of each individual company within the group according to their market capitalization at the beginning of the period, and (iii) dividends were reinvested on the relevant payment dates. The share price performance included in this graph is historical and not necessarily indicative of future share price performance.
The following graph and related information shall not be deemed “soliciting material” or “filed” with the SEC, nor shall such information be incorporated by reference into any future filing under the Securities Act of 1933 or the Exchange Act, each as amended, except to the extent that we specifically incorporate it by reference into such filing.
35
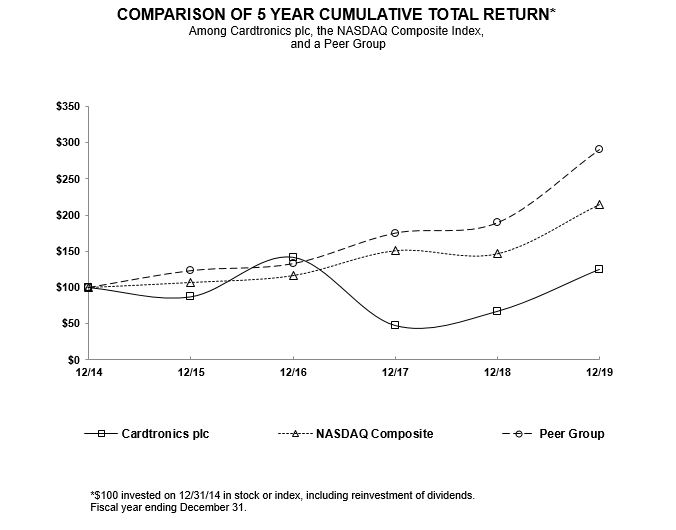
12/14 | 12/15 | 12/16 | 12/17 | 12/18 | 12/19 | ||||||||||||||||||
Cardtronics plc | $ | 100.00 | $ | 87.22 | $ | 141.45 | $ | 48.00 | $ | 67.39 | $ | 115.73 | |||||||||||
NASDAQ Composite | $ | 100.00 | $ | 106.96 | $ | 116.45 | $ | 150.96 | $ | 146.67 | $ | 200.49 | |||||||||||
Peer Group | $ | 100.00 | $ | 123.21 | $ | 132.76 | $ | 174.80 | $ | 189.04 | $ | 289.84 | |||||||||||
36
ITEM 6. SELECTED FINANCIAL DATA
The following table reflects selected financial data derived from our consolidated financial statements. As a result of acquisitions of businesses during the years presented below, our financial results are not comparable in all periods. Additionally, these selected historical results are not necessarily indicative of results to be expected in the future.
Year Ended December 31, | |||||||||||||||||||
2019 | 2018 | 2017 | 2016 | 2015 | |||||||||||||||
(In thousands, excluding share and per share information and number of ATMs) | |||||||||||||||||||
Consolidated Statements of Operations Data: | |||||||||||||||||||
Revenues and Income: | |||||||||||||||||||
Total revenues | $ | 1,349,405 | $ | 1,345,243 | $ | 1,507,599 | $ | 1,265,364 | $ | 1,200,301 | |||||||||
Income (loss) from operations (1) (2) | 86,434 | 70,210 | (103,509 | ) | 146,379 | 139,917 | |||||||||||||
Net income (loss) | 48,265 | 3,656 | (145,351 | ) | 87,910 | 65,981 | |||||||||||||
Net income (loss) attributable to controlling interests and available to common shareholders | 48,274 | 3,676 | (145,350 | ) | 87,991 | 67,080 | |||||||||||||
Per Share Data: | |||||||||||||||||||
Basic net income (loss) per common share | $ | 1.06 | $ | 0.08 | $ | (3.19 | ) | $ | 1.95 | $ | 1.50 | ||||||||
Diluted net income (loss) per common share | $ | 1.05 | $ | 0.08 | $ | (3.19 | ) | $ | 1.92 | $ | 1.48 | ||||||||
Basic weighted average shares outstanding | 45,514,703 | 45,988,775 | 45,619,679 | 45,206,119 | 44,796,701 | ||||||||||||||
Diluted weighted average shares outstanding | 46,015,334 | 46,436,439 | 45,619,679 | 45,821,527 | 45,368,687 | ||||||||||||||
Consolidated Balance Sheets Data: | |||||||||||||||||||
Total cash and cash equivalents | $ | 30,115 | $ | 39,940 | $ | 51,370 | $ | 73,534 | $ | 26,297 | |||||||||
Total assets (3) | 1,763,958 | 1,787,344 | 1,862,716 | 1,364,696 | 1,319,935 | ||||||||||||||
Total long-term debt and lease obligations, including current portions (3) (4) | 862,150 | 818,509 | 918,275 | 503,320 | 568,331 | ||||||||||||||
Total shareholders' equity | 380,326 | 376,772 | 390,393 | 456,935 | 369,793 | ||||||||||||||
Consolidated Statements of Cash Flows Data: | |||||||||||||||||||
Cash flows from operating activities (5) | $ | 204,659 | $ | 334,202 | $ | 230,587 | $ | 272,311 | $ | 268,060 | |||||||||
Cash flows from investing activities | (134,006 | ) | (108,355 | ) | (628,742 | ) | (139,203 | ) | (209,562 | ) | |||||||||
Cash flows from financing activities | (151,097 | ) | (126,392 | ) | 391,424 | (78,942 | ) | (48,520 | ) | ||||||||||
Operating Data (Unaudited): | |||||||||||||||||||
Total number of ATMs (at period end): | |||||||||||||||||||
ATM operations | 88,335 | 88,223 | 96,539 | 78,561 | 77,169 | ||||||||||||||
Managed services and processing, net (6) | 198,438 | 138,362 | 134,156 | 124,572 | 112,622 | ||||||||||||||
Total number of ATMs (at period end) | 286,773 | 226,585 | 230,695 | 203,133 | 189,791 | ||||||||||||||
Total transactions (excluding Managed services and processing, net) | 1,219,085 | 1,328,971 | 1,495,586 | 1,358,409 | 1,251,626 | ||||||||||||||
Total cash withdrawal transactions (excluding Managed services and processing) | 807,188 | 864,923 | 956,919 | 848,394 | 759,408 | ||||||||||||||
(1) | The year ended December 31, 2019 includes $11.7 million of impairment and disposal losses including a goodwill impairment of $7.3 million on our Canada reporting unit. |
The year ended December 31, 2018 includes $17.9 million of impairment and disposal losses and $6.4 million in redemption costs for early extinguishment of debt. The year ended December 31, 2017 includes $227.8 million of impairment and disposal losses. The years ended December 31, 2018, 2017, and 2016 and 2015 include $3.2 million, $18.9 million, $9.5 million, and $27.1 million, respectively, in acquisition and divestiture related costs. No significant acquisition and divestiture costs were recognized in the year ended December 31, 2019. Additionally, the years ended December 31, 2019, 2018 and 2017 include $8.9 million, $6.6 million and $11.1 million, respectively, in restructuring costs.
(2) | The year ended December 31, 2016 includes $13.7 million of expenses associated with the redomicile of our parent company to the U.K., which was completed on July 1, 2016. |
(3) | We adopted Accounting Standards Codification Topic 842, Leases (the “Lease Standard”) on January 1, 2019, using the modified retrospective approach and using the effective date as the date of initial application. Consequently, the financial information for dates and periods ended before January 1, 2019 has not been revised within our financial statements or the above selected financial data. As of December 31, 2019, Total assets include operating lease assets of approximately $76.5 million and Total current liabilities and Long-term liabilities include operating lease liabilities of approximately $20.3 million and approximately $69.5 million, respectively. |
37
(4) | Our long-term debt as of December 31, 2019 consists of outstanding borrowings under our revolving credit facility, our 5.50% Senior Notes due 2025 (the “2025 Notes”) and our 1.00% Convertible Senior Notes due December 2020 (the "Convertible Notes"). The 2025 Notes are reported in the accompanying Consolidated Balance Sheets at a carrying value of $296.5 million as of December 31, 2019, which represents the principal balance of $300.0 million less capitalized debt issuance costs of $3.5 million. The Convertible Notes are reported in the accompanying Consolidated Balance Sheets at a carrying value of $275.7 million as of December 31, 2019, which represents the principal balance of $287.5 million less the unamortized discount and capitalized debt issuance costs of $11.8 million. Although the Convertible Notes are due in December 2020, it is currently Management's intent to utilize the available capacity under the revolving credit facility to fund the December 2020 repayment of the Convertible Notes. Therefore, in accordance with the applicable accounting guidance, the Convertible Notes remain classified in the Long-term debt line in the accompanying Consolidated Balance Sheets at December 31, 2019. |
(5) | In conjunction with our adoption of Accounting Standards Codification ("ASC") 2016-18 in 2018, we retroactively revised our reported Cash flows from operating activities. Consistent with this guidance, Restricted cash is treated as cash in the preparation of the Statements of Cash Flows. Consequently, our reported Cash flows from operating activities can vary significantly due to the timing of settlement activity at a period end. |
(6) | The notable increase in the Managed services and processing, net ATM machine count in 2019, is primarily attributable to the May 2019 acquisition of ATM processing contracts associated with approximately 62,000 ATMs. |
ITEM 7. MANAGEMENT’S DISCUSSION AND ANALYSIS OF FINANCIAL CONDITION AND RESULTS OF OPERATIONS
Management’s Discussion and Analysis of Financial Condition and Results of Operations contains forward-looking statements that are based on management’s current expectations, estimates, and projections about our business and operations. Our actual results may differ materially from those currently anticipated and expressed in such forward-looking statements. Known material factors that could cause actual results to differ materially from those in the forward-looking statements are those described in Part I. Item 1A. Risk Factors of this 2019 Form 10-K. Additionally, you should read the following discussion together with the consolidated financial statements and the related notes included in Item 8. Financial Statements and Supplementary Data.
Strategic Outlook
Over the past several years, we have expanded our operations and the capabilities and service offerings of our ATMs through strategic acquisitions and investments, continued to deploy ATMs in high-traffic locations under contracts with well-known retailers, and expanded through the growth of Allpoint, our surcharge-free ATM network and our bank-branding programs. We have recently seen increased demand from financial institutions of all sizes as they evaluate their physical banking services and branch strategies. We have also expanded our ATM capabilities and service offerings to financial institutions, as we are seeing increasing interest from financial institutions for the outsourcing of ATM-related services due to our cost efficiency advantages and higher service levels.
We will continue to expand our ATM footprint organically and launch new products and services that will allow us to further leverage our existing ATM network. We see opportunities to expand our operations through the following efforts:
•expanding our relationships with leading financial institutions;
• | working with financial technology companies (or “Fintechs”) with a primary focus on the retail consumer finance business and card issuers to further leverage our extensive ATM network; |
• | increasing transaction levels at our existing locations; |
• | increasing the number of deployed ATMs with existing and new merchant relationships; |
• | developing and providing additional services at our existing ATMs; |
• | pursuing additional managed services opportunities; and |
• | pursuing opportunities to expand into new international markets over time. |
For additional information related to each of our strategic points above, see Part I. Item 1. Business - Our Strategy.
Developing Trends and Recent Events
Reduction of physical branches by financial institutions in the U.S., the U.K., and other geographies. With the expansion of services available through digital channels, such as online and mobile, and financial institution customers’ preferences towards these digital channels, many financial institutions have been de-emphasizing traditional physical branches. This trend toward shifting more customer transactions to online and ATMs has helped financial institutions lower their operating costs. As a result, many banks have been reducing the number of physical branches they operate. However, financial institution customers still consider convenient access to ATMs to be an important criteria for maintaining an account with a particular financial institution. The closing of physical branches generally results in the removal of the ATMs that were at the closed branch locations and may create a void in physical presence for that financial institution. This creates an opportunity for us to provide the financial institution’s customers with convenient access to ATMs and to work with the financial institutions to preserve branded or unbranded physical points of presence through our ATM network.
38
Increase in surcharge-free offerings in the U.S. Many U.S. national and regional financial institutions aggressively compete for market share, and part of their competitive strategy is to increase their number of customer touchpoints, including the establishment of an ATM network to provide convenient, surcharge-free access to cash for their cardholders. Bank-branding of ATMs and participation in surcharge-free networks allow financial institutions to rapidly increase surcharge-free ATM access for their customers at a lower cost than owning and operating ATM networks. Additionally, many financial institutions find that providing convenient and free access to ATMs is an important factor in customers establishing or maintaining an account with a particular institution. These factors have led to an increase in bank-branding and participation in surcharge-free ATM networks and we believe that there will be continued growth in such arrangements.
Managed services. While many financial institutions (and some retailers) own and operate significant ATM networks that serve as extensions of their physical branches and increase the level of service offered to their customers, large ATM networks are costly to own and operate and typically do not provide significant revenue for financial institutions or retailers. Owning and operating an ATM network is not a core competency nor a major point of differentiation for the majority of financial institutions and retailers; therefore, we believe there is an opportunity for a large non-bank ATM owner/operator, such as ourselves, with lower costs and an established operating history, to contract with financial institutions and retailers to manage their ATM networks. Such an arrangement could reduce a financial institution or retailer’s operating costs while extending their customer service. Additionally, we believe there are opportunities to provide selected ATM-related services on an outsourced basis, such as transaction processing services, to other independent owners and operators of ATMs.
Growth in other automated consumer financial services. The majority of all ATM transactions in our geographies are cash withdrawals, with the remainder representing other banking functions such as balance inquiries and balance transfers. We believe that there are opportunities for a large non-bank ATM owner/operator, such as ourselves, to provide additional financial services to customers, such as deposit-taking or cash-out services for on-line stored accounts. These additional automated consumer financial services could result in additional revenue streams for us and could ultimately result in increased profitability. However, they generally would require additional capital expenditures on our part to offer these services more broadly and would increase regulatory compliance activities.
Increase in usage of stored-value debit cards. In the U.S., we have seen a proliferation in the issuance and acceptance of stored-value debit cards as a means for consumers to access their cash and make routine retail purchases over the past ten years. Based on published studies, the value loaded on stored-value debit cards such as open loop network-branded money and financial services cards, payroll and benefit cards, and social security cards is expected to continue to increase in the next few years.
We believe that our extensive network of ATMs, located in well-known retail establishments throughout the U.S., provides a convenient and cost-effective way for stored-value cardholders to access their cash and potentially conduct other financial services transactions. Furthermore, through Allpoint, we partner with financial institutions that manage stored-value debit card programs on behalf of corporate entities and governmental agencies and we are able to provide the users of those cards convenient, surcharge-free access to their cash. We believe that the number of stored-value debit cards being issued and in circulation has increased significantly over the last several years and represents a growing portion of our total withdrawal transactions at our ATMs in the U.S.
Growth in other markets. In most regions of the world, ATMs are less common than in the U.S. and the U.K. (our two largest markets). We believe the ATM industry will grow faster in certain markets, as the number of ATMs per capita in those markets increases and begins to approach the levels in the U.S. and the U.K. We believe there is further growth potential for non-branch ATMs in the other geographic markets in which we operate.
• | United Kingdom. The U.K. is the largest ATM market in Europe. According to LINK (which connects the ATM networks of all the U.K. ATM operators), approximately 60,000 ATMs were deployed in the U.K. as of December 2019, of which approximately 60% were operated by non-banks (inclusive of our approximately 18,000 ATMs). Electronic payment alternatives have gained popularity in the U.K. and we have seen both the number of ATM deployments and withdrawals decrease in recent years. We currently operate the largest ATM network in the U.K., with over 18,000 ATMs, which is over 25% of all the ATMs in the country. As a result, our ATMs are a key part of the payment infrastructure in the country, and we expect to leverage our network and capabilities as banks in this market continue to reduce their physical footprints. In light of changes to the LINK interchange rate that included a 5% decrease that came into effect on July 1, 2018 and a second additional 5% decrease in the LINK interchange rate that was enacted January 1, 2019, we have changed certain of our ATMs to pay-to-use, whereby we no longer receive interchange from the customer’s bank, but instead, the customer now pays us a convenience fee. We have also removed certain ATMs from service and have taken other measures to mitigate the impact of this rate reduction. For additional information, see Decrease in interchange rates below. We believe there are opportunities with financial institutions in this market to outsource certain components of their ATM operations and we are actively working to grow our offerings for such services. |
39
• | Germany. There are approximately 58,000 ATMs in Germany that are largely deployed in bank branch locations. The top four independent ATM deployers, including Cardtronics, continue to account for less than 10% of the market as of December 31, 2019. We are presently the largest independent ATM deployer in Germany with over 1,500 ATMs. The German ATM market is highly fragmented and may be under-deployed, based on its population’s high use of cash relative to other markets in which we operate such as the U.S. and the U.K. As a result, this fragmented and potentially under-deployed ATM market is attractive to us and we believe there are a number of opportunities for growth in this market. We have recently expanded our ATM count in this market by adding new ATMs with new retail partners. Additionally, we now also partner with a major retail bank to provide free-to-use access to their customers at our ATMs. |
• | Canada. We currently operate approximately 10,000 ATMs in this market and estimate that there are currently approximately 68,000 ATMs in total in the Canadian market. We plan to grow in this market through a combination of new merchant and financial institution partners. |
• | Mexico. There are approximately 50,000 ATMs operating in Mexico, most of which are owned by national and regional financial institutions. We currently operate approximately 1,000 ATMs in Mexico and plan to selectively pursue growth opportunities with retailers and financial institutions in the region. |
• | Spain. In October 2016, we launched our business in Spain, joining a top Spain ATM network and signing agreements to provide ATMs at multiple retail chains. Spain’s market has approximately 50,000 ATMs of which we currently operate approximately 1%. We plan to continue to grow in this market through additional merchant and financial institution relationships. Recently, most of our growth in this market has been driven by ATM placements in tourist locations. |
• | Australia and New Zealand. In January 2017, in connection with our acquisition of DCPayments, we expanded operations into Australia and New Zealand. Our business in Australia has been adversely impacted by the removal of ATM access fees by the major banks in this market to non-customers. The Australian and New Zealand ATM market is comprised of over 30,000 ATMs and we are the largest independent ATM deployer in this region with approximately 9,000 ATMs. For further information regarding the removal of ATM access fees, see Australia market changes and asset impairment below. We believe there are opportunities for longer-term growth in Australia which would likely include expansion of services to financial institutions in this market. |
• | South Africa. In January 2017, in connection with our acquisition of Spark, we obtained operations in South Africa. Spark is a leading independent ATM operator in South Africa and we have recently grown in this market by expanding the number of ATMs we operate and partnering with financial institutions. We expect to continue to grow in this market with retailers and financial institutions. We operate approximately over 4,000 ATMs in South Africa and estimate that this market has nearly 35,000 ATMs in total. |
Increase in surcharge rates. As financial institutions increase the surcharge rates charged to non-customers for the use of their ATMs, it enables us to increase the surcharge rates charged on our ATMs in selected markets. We also believe that higher surcharge rates in the market make our surcharge-free offerings more attractive to consumers and other financial institutions.
Decrease in interchange rates. The interchange rates paid to independent ATM deployers, such as ourselves, are in some cases set by the various EFT networks and major interbank networks through which the transactions conducted on our ATMs are routed. In past years, certain networks have reduced the net interchange rates paid to ATM deployers for ATM transactions in the U.S. by reducing the transaction rates charged to financial institutions and increasing per-transaction fees charged by the networks to ATM operators. In addition to the impact of the net interchange rate decrease, we saw certain financial institutions migrate their volume away from some networks to take advantage of the lower pricing offered by other networks, resulting in lower net interchange rates per transaction realized by us. If financial institutions move to other networks to take further advantage of lower interchange rates, or if networks reduce the interchange rates they currently pay to ATM deployers or increase their network fees, our future revenues and gross profits could be negatively impacted. We have taken measures to mitigate our exposure to interchange rate reductions by networks, including, but not limited to: (i) where possible, routing transactions through a preferred network such as Allpoint, where we have influence over the per-transaction rate, (ii) negotiating directly with our financial institution partners for contractual interchange rates on transactions involving their customers, (iii) developing contractual protection from such rate changes in our agreements with merchants and financial institution partners, and (iv) negotiating pricing directly with certain networks. During the year ended December 31, 2019, 16.6%, 10.8%, and 0.4% of our total ATM operating revenues were derived from interchange fees in Europe & Africa, North America, and Australia & New Zealand, respectively. A portion of these fees are subject to pricing changes that we may be unable to offset through lower payments to merchants and other measures.
Interchange rates in the U.K. are primarily set by LINK, the U.K.’s major interbank network. In addition to LINK transactions, certain card issuers in the U.K. have issued cards that are not affiliated with the LINK network, and instead carry the Visa or
40
MasterCard network brands. In recent years, transactions conducted on our ATMs from these non-LINK cards have totaled less than 3% of our annual withdrawal transactions in the U.K. For these transactions, we receive interchange revenues based on rates that are set by Visa or MasterCard, respectively. The interchange rates set by Visa and MasterCard have historically been less than the rates that have been established by LINK. In July 2018, the LINK interchange rate was reduced by 5% and an additional 5% rate reduction commenced on January 1, 2019. There are no further scheduled rate reductions at this time, but the impact of the recent rate reductions has recently adversely impacted our revenues and profits in the U.K. As a result of these reductions, we have taken certain actions and may continue to take additional actions to mitigate the impact of the current and potential future price reductions. Mitigating measures have included, but have not been limited to, the removal of lower profitability sites, contract renegotiations with certain merchants and conversion of certain ATMs to a direct charge to the consumer model. Should there be a further change in LINK scheme or its membership, our U.K. interchange revenues and profits could be adversely impacted.
Withdrawal transaction and revenue trends - U.S. Many financial institutions are shifting traditional teller based transactions to online activities and ATMs to reduce their operating costs and remain competitive with lower-cost providers of consumer financial services. Additionally, many financial institutions are reducing the number of branches they own and operate in order to lower their operating costs. As a result of this industry transformation, we believe there has been increasing demand for automated banking solutions such as ATMs. Bank-branding of our ATMs and participation in our surcharge-free ATM network, Allpoint, allows financial institutions and providers of consumer financial services to rapidly increase and/or maintain surcharge-free ATM access for their customers at a substantially lower cost than owning and operating an ATM network themselves. We believe there is continued opportunity for a large non-bank ATM owner/operator, such as ourselves, with lower costs and an established operating history, to contract with financial institutions and retailers to manage their ATM networks. Such an arrangement could reduce a financial institution’s operating costs while extending its customer service. Furthermore, we believe there are opportunities to provide selected services on an outsourced basis, such as transaction processing services, to other independent owners and operators of ATMs. Over the last several years, we have seen increased participation in Allpoint and growth in bank-branding and managed services. We expect continued growth across each of these solutions.
U.S. same-store cash withdrawal transactions during the year ended December 31, 2019 increased approximately 2% from the same period in 2018. These same-store results were impacted by a number of factors and the discrete impact of each factor is difficult to precisely estimate. Growth in our surcharge-free offerings has positively impacted the same-store growth rate, driven by increases in Allpoint transactions as a result of growth in the number of financial institutions and other providers of consumer financial services participating in the Allpoint network along with increased marketing efforts to existing Allpoint participants. Additionally, we expanded our number of branded ATM locations over the past year which drove additional transaction volumes. These positive increases in surcharge-free transactions were partially offset by lower surcharge transactions during the year, consistent with our recent experience.
7-Eleven U.S. relationship. The Company had a long-standing relationship with 7-Eleven in the U.S. that ended during the quarter ended March 31, 2018. In previous periods, this relationship accounted for a material portion of the Company’s consolidated revenues and profits. The Company began a transition to 7-Eleven’s new service provider during the third quarter of 2017 that was completed in February 2018. 7-Eleven in the U.S. accounted for approximately 12.5% of the Company’s total revenues for the twelve months ended December 31, 2017 with an incremental adjusted gross margin of approximately 40%. 7-Eleven in the U.S. accounted for less than 1% of total revenues in 2018 and none in 2019.
Withdrawal transaction and revenue trends - U.K. Historically, the majority of our ATMs in the U.K. have been free-to-use ATMs, meaning the transaction is free to the consumer and we earn an interchange rate paid by the consumer’s bank. We also operate surcharging, or pay-to-use ATMs, which are now increasing in the U.K. The total transaction volume from our ATM operations declined by approximately 8% primarily due to lower transaction volume in the U.K. that was directly impacted by our conversion of a significant number of ATMs from free-to-use to pay-to-use and removal of over 3,000 ATMs in response to the two 5% decreases in the Link interchange rate in the U.K. that came into effect on July 1, 2018 and January 1, 2019. Changes in consumer payments behavior including consumers' use of more contactless debit and credit transactions for small payments at retailers also impacted our transaction volume in the U.K.
Australia market changes and asset impairment. In September 2017, Australia’s four largest banks, Commonwealth Bank of Australia (“CBA”), Australia and New Zealand Banking Group Limited (“ANZ”), Westpac Banking Corporation (“Westpac”), and National Australia Bank (“NAB”), each separately announced decisions to remove all direct charges to all users on domestic ATM transactions on their respective ATM networks, effectively creating a free-to-use network of ATMs that did not exist previously. Collectively, these four banks account for approximately one-third of the total ATMs in Australia. CBA removed the direct charges in September 2017, and Westpac, ANZ, and NAB removed the direct charges soon thereafter in October 2017. During the three months ended September 30, 2017, we performed qualitative and quantitative analysis and recognized an impairment of our Australia and New Zealand reporting unit in response to expected revenue and profit declines in this market following the banks’ removal of the direct charges.
41
The removal of direct charges by Australia’s four largest banks was expected to be and has been particularly impactful as Australia is a direct charge ATM market, where cardholders pay a fee (or “direct charge”) to the operator of an ATM for each transaction, unless the ATM, where the transaction was completed, is part of the cardholder’s issuing bank ATM network. There is no broad interchange arrangement or any other arrangement in Australia between card issuers and ATM operators to compensate the ATM operator for its service to a financial institution’s cardholder in lieu of the direct charge being levied to the cardholders. The impact of these banks’ actions could increase or change over time as consumers’ behavior patterns change as a result of the introduction of an effective free-to-use ATM network in Australia that did not previously exist.
Alternative payment options. We face indirect competition from alternative payment options, including card-based and mobile phone-based contactless payment technology in all of our markets. Australia and the U.K. have reported increasing rates of contactless payment use. Prior to our acquisition of DCPayments and since our ownership of the Australian component of the business, we have observed declines in transactions at Australian ATMs, as cash-based payments have declined as a percentage of total payments in recent years, with growth in contactless payments appearing to be the primary driver of the decline.
Capital investments. Our capital spending in 2019 and 2018 was driven by the following: (i) our strategic initiatives to enhance the consumer experience at our ATMs and drive transaction growth, including the roll-out of deposit-taking ATMs in select markets within the U.S., (ii) certain software and hardware enhancements required to facilitate our strategic initiatives, enhance security, and retain the necessary support, (iii) other compliance related matters including terminal upgrades, (iv) long-term renewals of existing merchant contracts, (v) growth opportunities across our enterprise, and (vi) investments in the infrastructure of our business, including the implementation of an enterprise resource planning (“ERP”) system. Our capital investments in 2017 included significant expenditures to upgrade and replace ATMs at certain locations in response to certain changes in network operating rules largely related to the acceptance of chip-enabled cards at our U.S. ATMs
U.K. exit from the European Union (“Brexit”). On January 31, 2020, the U.K. exited the European Union into a transition period extending through December 2020. The ultimate impact of Brexit on our business is unknown, therefore, we continue to monitor the relationship between the EU and the U.K., see Part 1. Item 1A. Risk Factors The exit of the U.K. from the European Union could adversely affect us and our shareholders.
Dynamic Currency Conversion. The European Commission now requires additional transparency and price comparability requirements on DCC transactions to be implemented between April 2020 and April 2021. Our DCC revenues currently account for approximately 4% of our total revenues, the majority of which relate to our U.K. operations.
Restructuring Expenses. During 2019, the Company continued the corporate reorganization and cost reduction initiatives that began in 2017 to improve the Company's cost structure and operating efficiency (the "Restructuring Plan"). During the years ended December 31, 2019, 2018, and 2017, the Company incurred $8.9 million, $6.6 million and $10.4 million, respectively, of pre-tax expenses related to the Restructuring Plan. Our restructuring activities included workforce reductions, costs incurred in conjunction with facilities closures, professional fees and other related charges.
Next generation banknote upgrade in Australia. Next generation banknotes are in the process of being introduced by the Reserve Bank of Australia. The new $5 note was introduced on September 1, 2016, and the new $50 note, the most widely disseminated note in Australia, was introduced on October 18, 2018. The new $20 note was recently introduced on October 9, 2019 and we expect that the new $100 will be issued in October 2020. The introduction of these next generation banknotes has required upgrades to software and physical ATM components on our ATMs in Australia.
Payments legislation. We monitor active and potential legislative activity across all of our markets. Recently, some well-known retailers attempted to operate ‘cashless’ stores whereby consumers would be unable to buy goods or services with physical cash. In response to these retailer initiatives, several jurisdictions across the U.S. introduced and passed legislation to effectively require cash as a legal tender payment form for most consumer purchases at physical retail locations. Additional legislation at the local, state, and federal levels has been proposed and are currently in various stages. We are actively supporting the legislative efforts to ensure cash remains a widely available choice for consumers’ payment activities. We believe and have heard from many political representatives and key regulators that cash should be supported on behalf of their constituent consumers, who value the choice, privacy, security, convenience, reliability and other key attributes of cash.
Acquisitions. On January 6, 2017, we completed the acquisition of DCPayments, a leading operator of approximately 25,000 ATMs with operations in Australia, Canada, Mexico, New Zealand and the U.K. On January 31, 2017, we completed the acquisition of Spark, an independent ATM operator in South Africa, with a growing network that now exceeds 4,000 ATMs. The agreed purchase consideration for Spark included initial cash consideration paid at closing and potential additional contingent consideration. The additional purchase consideration is contingent upon Spark achieving certain agreed-upon earnings targets in 2019 and 2020 to be paid in 2020 and 2021, respectively.
42
Cybersecurity trends. We electronically process and transmit limited cardholder information as part of our transaction processing services. Companies that process and transmit cardholder information, such as ourselves, have been specifically and increasingly targeted in recent years by sophisticated criminal organizations in an effort to obtain information and utilize it for fraudulent transactions. Additionally, the risk of unauthorized circumvention of system controls has been heightened by advances in computer capabilities and increasing sophistication of hackers. We take a risk-based approach to cybersecurity, and in recognition of the growing threat within our industry and the general marketplace, we proactively make strategic investments in our security infrastructure, technical and procedural controls, and regulatory compliance activities. We also apply the knowledge gained through industry and government organizations to continuously improve our technology, processes and services to detect, mitigate and protect our information. Cybersecurity and the effectiveness of our cybersecurity strategy are regular topics of discussion at Board meetings. We expect to continue to focus attention and resources on our security protection protocols, including repairing any system damage and deploying additional personnel, as well as protecting against any potential reputational harm. The cost to remediate any damages to our information technology systems suffered as a result of a cyber-attack could be significant. For further discussion of the risks we face in connection with growing cybersecurity trends, see Part 1. Item 1A. Risk Factors Security breaches, including the occurrence of a cyber-incident or a deficiency in our cybersecurity, could harm our business by compromising Company, merchant or vendor data, or cardholder information and disrupting our transaction processing services, thus damaging our relationships with our merchant customers, business partners, and generally exposing us to liability. Computer viruses or unauthorized software (malware) could harm our business by disrupting or disabling our systems, including transaction processing services, causing non-compliance with network rules, damaging our relationships with our merchant and financial institution customers, and damaging our reputation causing a decrease in transactions by individual cardholders.
Factors Impacting Comparability Between Periods
• | Foreign currency exchange rates. Our reported financial results are subject to fluctuations in foreign currency exchange rates. We estimate that the year-over-year fluctuations of the currencies in the markets in which we operate relative to the U.S. dollar caused our reported total revenues to be lower by approximately $30.1 million, or 2.2%, for the year ended December 31, 2019 as compared to the prior year. |
• | Acquisitions. The results of operations for any acquired entities during a particular year have been included in our consolidated financial statements for that year since the respective dates of acquisition. Similarly, the results of operations for any divested operations have been excluded from our consolidated financial statements since the dates of divestiture. |
• | 7-Eleven ATM removal. The 7-Eleven ATM placement agreement in the U.S. expired in July 2017 and all ATM operations in the U.S. were transitioned to the new service provider by the end of February 2018. 7-Eleven in the U.S. accounted for approximately 12.5% of total revenues for the year ended 2017 and less than 1% of total revenues in 2018 and none in 2019. |
Components of Revenues, Cost of Revenues, and Expenses
Revenues
We derive our revenues primarily from providing ATM and automated consumer financial services, bank-branding, surcharge-free network offerings, and sales and services of ATM equipment. We currently classify revenues into two primary categories: (i) ATM operating revenues and (ii) ATM product sales and other revenues.
Revenue is recognized when obligations under the terms of a contract with a customer are satisfied. Revenue is recorded in ATM operating revenues and ATM product sales and other revenues line items in the accompanying Consolidated Statements of Operations.
ATM operating revenues are recognized daily as the associated transactions are processed or monthly on a per ATM or per cardholder basis. When customer contracts provide for up-front fees that do not pertain to a distinct performance obligation, the fees are recognized over the term of the underlying agreement on a straight-line basis. ATM product sales and other revenues are recognized when the related performance obligations are fulfilled upon transfer of control of goods or services to the customer.
ATM operating revenues. The Company presents revenues from automated consumer financial services, bank-branding and surcharge-free network offerings, managed services and other services in the ATM operating revenues line in the accompanying Consolidated Statements of Operations. The Company’s ATM operating revenues consist of the following:
43
• | Surcharge revenue. Surcharge revenues are received in the form of a fee paid by a cardholder who has made a cash withdrawal from an ATM. Surcharge fees can vary widely based on the location of the ATM and the nature of the contracts negotiated with merchants. In the U.S. and Canada, the Company does not receive surcharge fees from cardholders whose financial institutions participate in a surcharge-free network or have branded a location; instead, the Company receives interchange and bank-branding or surcharge-free network-branding revenues, which are discussed below. For certain ATMs, primarily those owned and operated by merchants, the Company does not receive any portion of the surcharge but rather the entire surcharge fee is earned by the merchant. In the U.K., ATM deployers operate their ATMs on either a free-to-use (surcharge-free) or a pay-to-use (surcharge) basis. On free-to-use ATMs in the U.K., the Company earns interchange revenue on withdrawal and certain other transactions. These fees are paid by the cardholder’s financial institution. On pay-to-use ATMs in the U.K., the Company only earns a surcharge fee paid by the cardholder on withdrawal transactions and interchange is only paid by the cardholder’s financial institution on other non-withdrawal transaction types. The Company earns both surcharge and interchange in Spain. In Germany, Australia, and Mexico, the Company collects surcharge fees on withdrawal transactions but generally does not receive interchange revenue. In South Africa, the Company generally earns interchange revenues which varies by transaction type and customer arrangement. Surcharge revenues, as described above, are recognized daily as the associated transactions are processed. |
• | Interchange revenue. An interchange fee is a fee paid by the cardholder’s financial institution for its customer’s use of an ATM that is owned by another operator and for the fee the EFT network charges to transmit data between the ATM and the cardholder’s financial institution. The Company typically receives a majority of the interchange fee paid by the cardholder’s financial institution, net of the amount retained by the EFT network, and recognizes the net amount received from the network as revenue. In some markets in which the Company operates, interchange fees are earned not only on cash withdrawal transactions but also on other ATM transactions, including balance inquiries and balance transfers. Interchange revenues are subject to various arrangements and are recognized daily as the associated transactions are processed. |
• | Bank-branding and surcharge-free network revenues. Under a bank-branding arrangement, ATMs that are Company-owned and operated are branded with the logo of the branding financial institution. In exchange for a fee paid by the financial institution, the financial institution’s customers gain access to use these bank-branded ATMs without paying a surcharge fee. Under the Company’s Allpoint surcharge-free network, financial institutions that participate pay a fixed monthly fee per cardholder and/or a fixed fee per transaction so that cardholders gain surcharge-free access to our large network of ATMs. Bank-branding and surcharge-free network revenues are generally recognized monthly on a per ATM or per cardholder basis, except for transaction-based fee arrangements which are recognized daily as they occur. Any up-front fees associated with these arrangements are recognized ratably over the life of the arrangement. |
The Company’s bank-branding, surcharge-free network and managed services arrangements result in the Company providing a series of distinct services that have the same pattern of transfer to the customer. As a result, these arrangements create performance obligations that are satisfied over-time, (generally 3-5 years), for which the Company has a right to consideration that corresponds directly with the value of the entity’s performance completed to date. In conjunction with these arrangements, the Company recognizes revenue in the amount it has a right to receive. Variable consideration may exist in these arrangements and is recognized only to the extent a significant reversal is not probable.
• | Managed services and processing revenues. Under managed service agreements, the Company provides various forms of ATM-related services, including monitoring, maintenance, cash management, cash delivery, customer service, on-screen advertising, processing and other services to merchants, financial institutions, and third-party ATM operators. Under processing arrangements, the Company provides transaction processing services to merchants, financial institutions, and third-party operators. Under managed services and processing arrangements, surcharge and interchange fees are generally earned by the customer and the Company typically receives a fixed fee per transaction and/or a periodic management fee per ATM in return for providing the agreed-upon operating services. The managed services and processing fees are recognized as the related services are provided to the customers. |
The following table presents the components of our total ATM operating revenues:
44
Year Ended December 31, | |||||
2019 | 2018 | ||||
Surcharge revenue | 46.4 | % | 44.1 | % | |
Interchange revenue | 27.8 | 32.4 | |||
Bank-branding and surcharge-free network revenues | 15.8 | 13.9 | |||
Managed services and processing revenues | 10.0 | 9.6 | |||
Total ATM operating revenues | 100.0 | % | 100.0 | % | |
ATM product sales and other revenues. The Company presents revenues from other product sales and services in the ATM product sales and other revenues line in the accompanying Consolidated Statements of Operations. The Company earns revenues from the sale of ATMs and ATM-related equipment as well as the delivery of other non-transaction-based services. Revenues related to these activities are recognized when ownership of the equipment is transferred to the customer and the Company has completed all required installation and set-up procedures. With respect to the sale of ATMs to Value-Added-Resellers (“VARs”), the Company recognizes revenues related to such sales when ownership of the equipment is transferred to the VAR.
Cost of Revenues
Our cost of revenues primarily consist of the costs directly associated with the transactions completed on our network of ATMs. These costs include merchant commissions, vault cash rental expense, other costs of cash, repairs and maintenance expense, communications expense, transaction processing fees, and direct operations expense. To a lesser extent, cost of revenues also includes those costs associated with the sales of ATMs and ATM-related equipment and providing certain services to third-parties. The following is a description of our primary cost of revenues categories:
• | Merchant commissions. We pay our merchants a fee for allowing us an exclusive right to place our ATM at their location. The fee amount depends on a variety of factors, including the type of arrangement under which the ATM is placed, the type of location, and the number of transactions on that ATM. |
• | Vault cash rental expense. We pay monthly fees to our vault cash providers for renting the vault cash that is maintained in our ATMs. The fees we pay under our arrangements with our vault cash providers are based on market rates of interest; therefore, changes in the general level of interest rates affect our cost of cash. In order to limit our exposure to increases in interest rates, we have entered into a number of interest rate derivatives of varying notional amounts through 2024 for our current and anticipated outstanding vault cash rental obligations. This cost category also includes the income/expense realized from interest rate derivatives designated as hedges of our vault cash rental expense. |
• | Other costs of cash. Other costs of cash includes all costs associated with the provision of cash for our ATMs except for vault cash rental expense, including third-party armored courier services, cash insurance, reconciliation of ATM cash balances, associated bank fees, and other costs. This category excludes the cost of our wholly-owned cash delivery operation in the U.K., as those costs are reported in the Other expenses line described below. |
• | Repairs and maintenance. Depending on the type of arrangement with the merchant, we may be responsible for first and/or second-line maintenance for the ATM. In most of our markets, we generally use third-parties with national operations to provide these services. In the U.K., Australia, Canada, and South Africa, we also maintain in-house technicians to service our ATMs and those costs are reported in the Other expenses line described below. |
• | Communications. Under our Company-owned arrangements, we are usually responsible for the expenses associated with providing telecommunications capabilities to the ATMs allowing them to connect with the applicable EFT networks. |
• | Transaction processing. We own and operate EFT transaction processing platforms, through which the majority of our ATMs are driven and monitored. We also utilize third-party processors to gateway certain transactions to the EFT networks for authorization by the cardholders’ financial institutions and to settle transactions. As a result of our past acquisitions, we have inherited transaction processing contracts with certain third-party providers that have varying lengths of remaining contractual terms. Over the next few years, we plan to convert the majority of our ATMs currently operating under these contracts to our own EFT transaction processing platforms. |
• | Other expenses. Other expenses primarily consist of direct operations expenses, which are costs associated with managing our ATM network, including expenses for monitoring the ATMs, program managers, technicians, cash ordering and |
45
forecasting personnel, cash-in-transit and maintenance engineers (principally in the U.K., Canada, and Australia), and customer service representatives.
• | Cost of ATM product sales. In connection with the sale of ATM and ATM-related equipment to merchants and distributors, we incur costs associated with purchasing the ATM equipment from manufacturers, as well as delivery and installation expenses. Additionally, this category includes costs related to providing maintenance services to third-party customers in the U.K. |
The following table presents the components of our total cost of ATM operating revenues:
Year Ended December 31, | |||||
2019 | 2018 | ||||
Merchant commissions | 47.0 | % | 48.6 | % | |
Vault cash rental | 8.5 | 8.3 | |||
Other costs of cash | 11.0 | 10.6 | |||
Repairs and maintenance | 8.9 | 8.1 | |||
Communications | 3.2 | 3.7 | |||
Transaction processing | 2.8 | 2.4 | |||
Employee costs | 9.6 | 10.0 | |||
Other expenses | 9.0 | 8.3 | |||
Total cost of ATM operating revenues | 100.0 | % | 100.0 | % | |
We define variable costs as those that vary based on transaction levels. The majority of Merchant commissions, Vault cash rental expense, and Other costs of cash fall under this category. The other categories of Cost of ATM operating revenues are mostly fixed in nature, meaning that any significant decrease in transaction volumes would lead to a decrease in the profitability of our operations, unless there was an offsetting increase in per-transaction revenues or decrease in our fixed costs. Although the majority of our operating costs are variable in nature, an increase in transaction volumes may lead to an increase in the profitability of our operations due to the economies of scale obtained through increased leveraging of our fixed costs and incremental preferential pricing obtained from our vendors. We exclude depreciation, accretion, and amortization of intangible assets related to ATMs and ATM-related assets from our Cost of ATM operating revenues line item in the accompanying Consolidated Statements of Operations.
The profitability of any particular location and of our entire ATM operation is attributable to a combination of surcharge, interchange, bank-branding and surcharge-free network revenues, and managed services revenues, as well as the level of our related costs.
Other operating expenses
Our Other operating expenses include selling, general, and administrative expenses related to salaries, benefits, advertising and marketing, professional services, and overhead. Acquisition related expenses, redomicile-related expenses, restructuring expenses, depreciation and accretion expense, amortization of our acquired merchant and bank-branding contracts/relationships, and other amortizable intangible assets are also components of our Other operating expenses. We depreciate our ATMs and ATM-related equipment on a straight-line basis over the estimated life of such equipment and amortize the value of acquired intangible assets over the estimated lives of such assets.
46
Results of Operations
The following table reflects line items from the accompanying Consolidated Statements of Operations as a percentage of total revenues for the periods indicated. Percentages may not add due to rounding.
Year Ended December 31, | |||||||||||
2019 | 2018 | ||||||||||
(In thousands, excluding percentages) | |||||||||||
Revenues: | |||||||||||
ATM operating revenues | $ | 1,281,106 | 94.9 | % | $ | 1,292,930 | 96.1 | % | |||
ATM product sales and other revenues | 68,299 | 5.1 | 52,313 | 3.9 | |||||||
Total revenues (1) | 1,349,405 | 100.0 | 1,345,243 | 100.0 | |||||||
Cost of revenues: | |||||||||||
Cost of ATM operating revenues (excludes depreciation, accretion, and amortization of intangible assets reported separately below.) (2) | 830,359 | 61.5 | 855,948 | 63.6 | |||||||
Cost of ATM product sales and other revenues | 54,620 | 4.0 | 41,835 | 3.1 | |||||||
Total cost of revenues | 884,979 | 65.6 | 897,783 | 66.7 | |||||||
Operating expenses: | |||||||||||
Selling, general, and administrative expenses (3) | 177,474 | 13.2 | 170,490 | 12.7 | |||||||
Restructuring expenses | 8,928 | 0.7 | 6,586 | 0.5 | |||||||
Acquisition related expenses | — | — | 3,191 | 0.2 | |||||||
Depreciation and accretion expense | 130,676 | 9.7 | 126,199 | 9.4 | |||||||
Amortization of intangible assets | 49,261 | 3.7 | 52,911 | 3.9 | |||||||
Loss on disposal and impairment of assets (4) | 11,653 | 0.9 | 17,873 | 1.3 | |||||||
Total operating expenses | 377,992 | 28.0 | 377,250 | 28.0 | |||||||
Income from operations | 86,434 | 6.4 | 70,210 | 5.2 | |||||||
Other expenses: | |||||||||||
Interest expense, net | 26,604 | 2.0 | 35,429 | 2.6 | |||||||
Amortization of deferred financing costs and note discount | 13,447 | 1.0 | 14,887 | 1.1 | |||||||
Redemption costs for early extinguishment of debt | — | — | 6,408 | 0.5 | |||||||
Other income (5) | (18,404 | ) | (1.4 | ) | (627 | ) | — | ||||
Total other expenses | 21,647 | 1.6 | 56,097 | 4.2 | |||||||
Income before income taxes | 64,787 | 4.8 | 14,113 | 1.0 | |||||||
Income tax expense | 16,522 | 1.2 | 10,457 | 0.8 | |||||||
Net income | 48,265 | 3.6 | 3,656 | 0.3 | |||||||
Net loss attributable to noncontrolling interests | (9 | ) | — | (20 | ) | — | |||||
Net income attributable to controlling interests and available to common shareholders | $ | 48,274 | 3.6 | % | $ | 3,676 | 0.3 | % | |||
(1) | Effective January 1, 2018, we adopted Accounting Standard Codification (“ASC”) Topic 606, Revenue from Contracts with Customers using the modified retrospective approach. |
(2) | Excludes effects of depreciation, accretion, and amortization of intangible assets of $146.4 million and $145.7 million for the years ended December 31, 2019 and 2018, respectively. See Item 8. Financial Statements and Supplementary Data, Note 1. Basis of Presentation and Summary of Significant Accounting Policies - (d) Cost of ATM Operating Revenues Presentation. The inclusion of this depreciation, accretion, and amortization of intangible assets in Cost of ATM operating revenues would have increased our Cost of ATM operating revenues as a percentage of total revenues by 10.8% and 10.8% for the years ended December 31, 2019 and 2018, respectively. |
(3) | Includes share-based compensation expense of $19.5 million and $14.9 million for the years ended December 31, 2019 and 2018, respectively. |
(4) | The year ended December 31, 2019 includes $11.7 million of impairment and disposal losses including a goodwill impairment of $7.3 million on our Canada reporting unit. See Loss on Disposal and Impairment of Assets for additional information. |
(5) | Other income includes mark-to-market gains associated with the acquisition-related contingent consideration of $21.9 million and losses of $1.9 million in the years ended December 31, 2019 and 2018, respectively. Other income also includes foreign exchange remeasurement gains and losses pertaining to the recognized acquisition-related contingent consideration liability. The Company recognized remeasurement losses of $0.5 million and $6.2 in the years ended December 31, 2019 and 2018, respectively. |
47
Key Operating Metrics
The following tables reflect certain key measures that help gauge our operating performance for the periods indicated:
Year Ended December 31, | ||||||||
2019 | % Change | 2018 | ||||||
Ending number of transacting ATMs: | ||||||||
North America | 43,562 | 0.8 | % | 43,233 | ||||
Europe & Africa | 23,992 | 0.9 | % | 23,768 | ||||
Australia & New Zealand | 6,928 | (8.7 | )% | 7,585 | ||||
Total Company-owned(1) | 74,482 | (0.1 | )% | 74,586 | ||||
North America | 13,621 | 1.6 | % | 13,406 | ||||
Europe & Africa | 232 | 0.4 | % | 231 | ||||
Total Merchant-owned | 13,853 | 1.6 | % | 13,637 | ||||
Managed Services and Processing: | ||||||||
North America (2) | 196,681 | 44.3 | % | 136,288 | ||||
Australia & New Zealand | 1,757 | (15.3 | )% | 2,074 | ||||
Ending number of transacting ATMs – Managed services and processing (1) | 198,438 | 43.4 | % | 138,362 | ||||
Total ending number of transacting ATMs | 286,773 | 26.6 | % | 226,585 | ||||
(1) | Company-owned ATMs that are deployed under managed services agreements are classified under Managed Services and Processing. |
(2) | In May 2019, the Company completed the acquisition of ATM processing contracts to provide transaction processing services for approximately 62,000 ATMs. This transaction added approximately 40,000 ATMs to the average number of transacting ATMs for the year ended December 31, 2019. |
48
Year Ended December 31, | ||||||||||
2019 | % Change | 2018 | ||||||||
Average number of transacting ATMs: | ||||||||||
North America | 43,388 | (2.5 | )% | 44,513 | ||||||
Europe & Africa | 23,875 | (3.0 | )% | 24,609 | ||||||
Australia & New Zealand | 7,373 | (7.7 | )% | 7,988 | ||||||
Total Company-owned (1) | 74,636 | (3.2 | )% | 77,110 | ||||||
North America | 13,998 | (0.2 | )% | 14,030 | ||||||
Europe & Africa | 241 | 57.5 | % | 153 | ||||||
Total Merchant-owned | 14,239 | 0.4 | % | 14,183 | ||||||
Managed Services and Processing: | ||||||||||
North America (2) | 176,828 | 30.2 | % | 135,796 | ||||||
Australia & New Zealand | 1,762 | (16.1 | )% | 2,101 | ||||||
Average number of transacting ATMs – Managed services and processing (1) | 178,590 | 29.5 | % | 137,897 | ||||||
Total average number of transacting ATMs | 267,465 | 16.7 | % | 229,190 | ||||||
Total transactions (in thousands): | ||||||||||
ATM operations (3) | 1,219,085 | (8.3 | )% | 1,328,971 | ||||||
Managed services and processing, net | 1,427,329 | 25.6 | % | 1,136,188 | ||||||
Total transactions | 2,646,414 | 7.4 | % | 2,465,159 | ||||||
Total cash withdrawal transactions (in thousands): | ||||||||||
ATM operations (3) | 807,188 | (6.7 | )% | 864,923 | ||||||
Per ATM per month amounts (excludes managed services and processing): | ||||||||||
Cash withdrawal transactions (3) | 757 | (4.1 | )% | 789 | ||||||
ATM operating revenues | $ | 1,100 | 1.2 | % | $ | 1,087 | ||||
Cost of ATM operating revenues (4) | 731 | (1.3 | )% | 741 | ||||||
ATM adjusted operating gross profit (4) | $ | 369 | 6.6 | % | $ | 346 | ||||
ATM adjusted operating gross profit margin | 33.5 | % | 31.8 | % | ||||||
(1) | Company-owned ATMs that are deployed under managed services agreements are classified under Managed Services and Processing. |
(2) | In May 2019, the Company completed the acquisition of ATM processing contracts to provide transaction processing services for approximately 62,000 ATMs. This transaction added approximately 40,000 ATMs to the average number of transacting ATMs for the year ended December 31, 2019. |
(3) | Total transactions from ATM operations of approximately 1.2 billion include withdrawal transactions of 807.2 million as well as other non-monetary transactions such as balance inquiries and funds transfers. The 8% decline in total transactions from ATM operations is primarily due to our U.K. ATM operations and our conversion of a significant number of ATMs from free-to-use to pay-to-use and removal of over 3,000 ATMs in response to the two 5% decreases in the LINK interchange rate in the U.K. that came into effect on July 1, 2018 and January 1, 2019. The decline in transactions is also due to our Australia & New Zealand ATM operations where in our continued response to market changes we deployed fewer ATMs and realized fewer transactions per ATM. The decline in cash withdrawal transactions per ATM is also attributable to these same factors, partially offset by increases in the number of withdrawal transactions per ATM in our U.S. business. |
(4) | Amounts presented exclude the effect of depreciation, accretion, and amortization of intangible assets, which is reported separately in the accompanying Consolidated Statements of Operations. For additional information, see Item 8. Financial Statements and Supplementary Data, Note 1. Basis of Presentation and Summary of Significant Accounting Policies – (d) Cost of ATM Operating Revenues Presentation. |
49
Revenues
Year Ended December 31, | ||||||||||
2019 | % Change | 2018 | ||||||||
(In thousands, excluding percentages) | ||||||||||
North America | ||||||||||
ATM operating revenues | $ | 803,955 | 2.1 | % | $ | 787,514 | ||||
ATM product sales and other revenues | 59,559 | 39.6 | % | 42,665 | ||||||
North America total revenues | 863,514 | 4.0 | % | 830,179 | ||||||
Europe & Africa | ||||||||||
ATM operating revenues | 388,091 | (3.1 | )% | 400,391 | ||||||
ATM product sales and other revenues | 8,229 | (12.3 | )% | 9,379 | ||||||
Europe & Africa total revenues | 396,320 | (3.3 | )% | 409,770 | ||||||
Australia & New Zealand | ||||||||||
ATM operating revenues | 99,552 | (15.0 | )% | 117,138 | ||||||
ATM product sales and other revenues | 511 | 90.0 | % | 269 | ||||||
Australia & New Zealand total revenues | 100,063 | (14.8 | )% | 117,407 | ||||||
Eliminations | (10,492 | ) | (13.4 | )% | (12,113 | ) | ||||
Total ATM operating revenues | 1,281,106 | (0.9 | )% | 1,292,930 | ||||||
Total ATM product sales and other revenues | 68,299 | 30.6 | % | 52,313 | ||||||
Total revenues | $ | 1,349,405 | 0.3 | % | $ | 1,345,243 | ||||
50
ATM operating revenues. ATM operating revenues during the years ended December 31, 2019 and 2018 decreased by $11.8 million compared to the prior year. The following tables detail, by segment, the changes in the various components of ATM operating revenues for the periods indicated:
Year Ended December 31, | ||||||||||||||
2019 | 2018 | Change | % Change | |||||||||||
(In thousands, excluding percentages) | ||||||||||||||
North America | ||||||||||||||
Surcharge revenues | $ | 349,346 | $ | 359,154 | $ | (9,808 | ) | (2.7 | )% | |||||
Interchange revenues | 138,557 | 143,803 | (5,246 | ) | (3.6 | )% | ||||||||
Bank-branding and surcharge-free network revenues | 201,210 | 179,760 | 21,450 | 11.9 | % | |||||||||
Managed services and processing revenues | 114,842 | 104,797 | 10,045 | 9.6 | % | |||||||||
North America total ATM operating revenues | 803,955 | 787,514 | 16,441 | 2.1 | % | |||||||||
Europe & Africa | ||||||||||||||
Surcharge revenues | 164,606 | 120,906 | 43,700 | 36.1 | % | |||||||||
Interchange revenues | 213,106 | 269,064 | (55,958 | ) | (20.8 | )% | ||||||||
Bank-branding and surcharge-free network revenues | 958 | — | 958 | n/m | ||||||||||
Managed services and processing revenues | 9,421 | 10,421 | (1,000 | ) | (9.6 | )% | ||||||||
Europe & Africa total ATM operating revenues | 388,091 | 400,391 | (12,300 | ) | (3.1 | )% | ||||||||
Australia & New Zealand | ||||||||||||||
Surcharge revenues | 79,880 | 90,110 | (10,230 | ) | (11.4 | )% | ||||||||
Interchange revenues | 4,558 | 5,451 | (893 | ) | (16.4 | )% | ||||||||
Managed services and processing revenues | 15,114 | 21,577 | (6,463 | ) | (30.0 | )% | ||||||||
Australia & New Zealand total ATM operating revenues | 99,552 | 117,138 | (17,586 | ) | (15.0 | )% | ||||||||
Eliminations | (10,492 | ) | (12,113 | ) | 1,621 | (13.4 | )% | |||||||
Total ATM operating revenues | $ | 1,281,106 | $ | 1,292,930 | $ | (11,824 | ) | (0.9 | )% | |||||
North America. During the year ended December 31, 2019, our ATM operating revenues in our North America segment increased by $16.4 million or 2.1% compared to the prior year. This increase was attributable to growth in bank-branding and surcharge-free network revenues, higher managed services and transaction processing revenues, and higher same-store withdrawal transactions. The increase was partially offset by lower surcharge and interchange revenues due to a lower number of transacting ATMs, fewer surcharge transactions, and a slight decrease in non-monetary transactions and increased network fees impacting our interchange revenues.
For additional information related to recent trends that have impacted, and may continue to impact, the revenues from our North America segment, see Developing Trends and Recent Events - Withdrawal transaction and revenue trends - U.S. above.
Europe & Africa. During the year ended December 31, 2019, our ATM operating revenues in our Europe & Africa segment decreased by $12.3 million or 3.1% compared to the prior year. Absent foreign currency exchange rate movements, our ATM operating revenues would have increased by approximately $6.6 million or 1.7% due to an increase in the number of transacting ATMs and the associated transaction activity in Germany, Spain, and South Africa as well as higher dynamic currency conversion revenues. The increase was partially offset by lower ATM operating revenues in the U.K. resulting from lower transaction volume with our conversion of a significant number of ATMs from free-to-use to pay-to-use and removal of over 3,000 ATMs in response to the two 5% decreases in the LINK interchange rate in the U.K. that came into effect on July 1, 2018 and January 1, 2019.
For additional information related to our constant-currency calculations and recent trends that have impacted, and may continue to impact, the revenues from our Europe & Africa segment, see Non-GAAP Financial Measures below and Developing Trends and Recent Events - Withdrawal transaction and revenue trends - U.K. above, respectively.
Australia & New Zealand. During the year ended December 31, 2019, ATM operating revenues in our Australia & New Zealand segment decreased $17.6 million or 15.0% compared to the prior year. Our ATM operating revenues would have been
51
higher by $7.5 million absent the foreign currency exchange rate movements. Adjusted for foreign currency movements, ATM operating revenues decreased 8.6% primarily due to a decline in the number of transacting ATMs and fewer transactions per ATM.
ATM product sales and other revenues. Our ATM product sales and other revenues increased $16.0 million in 2019 when compared to 2018. These fluctuations were primarily due to the timing of equipment sales in our North America segment.
Cost of Revenues (exclusive of depreciation, accretion, and amortization of intangible assets)
Year Ended December 31, | |||||||||
2019 | % Change | 2018 | |||||||
(In thousands, excluding percentages) | |||||||||
North America | |||||||||
Cost of ATM operating revenues | $ | 527,135 | (0.1)% | $ | 527,879 | ||||
Cost of ATM product sales and other revenues | 50,167 | 35.6% | 37,009 | ||||||
North America total cost of revenue | 577,302 | 2.2% | 564,888 | ||||||
Europe & Africa | |||||||||
Cost of ATM operating revenues | 241,822 | (4.3)% | 252,789 | ||||||
Cost of ATM product sales and other revenues | 3,540 | (5.7)% | 3,753 | ||||||
Europe & Africa total cost of revenues | 245,362 | (4.4)% | 256,542 | ||||||
Australia & New Zealand | |||||||||
Cost of ATM operating revenues | 70,368 | (17.9)% | 85,741 | ||||||
Cost of ATM product sales and other revenues | 913 | (14.9)% | 1,073 | ||||||
Australia & New Zealand total cost of revenues | 71,281 | (17.9)% | 86,814 | ||||||
Corporate | 1,528 | 93.9% | 788 | ||||||
Eliminations | (10,494 | ) | (6.7)% | (11,249 | ) | ||||
Cost of ATM operating revenues | 830,359 | (3.0)% | 855,948 | ||||||
Cost of ATM product sales and other revenues | 54,620 | 30.6% | 41,835 | ||||||
Total cost of revenues | $ | 884,979 | (1.4)% | $ | 897,783 | ||||
Cost of ATM operating revenues (exclusive of depreciation, accretion, and amortization of intangible assets). The Total cost of ATM operating revenues (exclusive of depreciation, accretion, and amortization of intangible assets) for the years ended December 31, 2019 and 2018, decreased $25.6 million or 3.0% compared to the prior year. The tables that follow detail, by segment, changes in the various components of the cost of ATM operating revenues (exclusive of depreciation, accretion, and amortization of intangible assets) for the periods indicated:
52
Year Ended December 31, | ||||||||||||||
2019 | 2018 | Change | % Change | |||||||||||
(In thousands, excluding percentages) | ||||||||||||||
Cost of ATM operating revenues | ||||||||||||||
North America | ||||||||||||||
Merchant commissions | $ | 256,992 | $ | 265,110 | $ | (8,118 | ) | (3.1 | )% | |||||
Vault cash rental | 48,740 | 48,056 | 684 | 1.4 | ||||||||||
Other costs of cash | 63,479 | 58,492 | 4,987 | 8.5 | ||||||||||
Repairs and maintenance | 52,450 | 45,368 | 7,082 | 15.6 | ||||||||||
Communications | 13,443 | 15,760 | (2,317 | ) | (14.7 | ) | ||||||||
Transaction processing | 8,559 | 5,911 | 2,648 | 44.8 | ||||||||||
Employee costs | 31,954 | 34,624 | (2,670 | ) | (7.7 | ) | ||||||||
Other expenses | 51,518 | 54,558 | (3,040 | ) | (5.6 | ) | ||||||||
North America total cost of ATM operating revenues | 527,135 | 527,879 | (744 | ) | (0.1 | ) | ||||||||
Europe & Africa | ||||||||||||||
Merchant commissions | 94,249 | 103,203 | (8,954 | ) | (8.7 | ) | ||||||||
Vault cash rental | 14,783 | 14,391 | 392 | 2.7 | ||||||||||
Other costs of cash | 21,512 | 23,820 | (2,308 | ) | (9.7 | ) | ||||||||
Repairs and maintenance | 14,109 | 14,972 | (863 | ) | (5.8 | ) | ||||||||
Communications | 10,740 | 12,592 | (1,852 | ) | (14.7 | ) | ||||||||
Transaction processing | 22,195 | 22,315 | (120 | ) | (0.5 | ) | ||||||||
Employee costs | 42,160 | 44,584 | (2,424 | ) | (5.4 | ) | ||||||||
Other expenses | 22,074 | 16,912 | 5,162 | 30.5 | ||||||||||
Europe & Africa total cost of ATM operating revenues | 241,822 | 252,789 | (10,967 | ) | (4.3 | ) | ||||||||
Australia & New Zealand | ||||||||||||||
Merchant commissions | 38,866 | 47,345 | (8,479 | ) | (17.9 | ) | ||||||||
Vault cash rental | 6,833 | 8,947 | (2,114 | ) | (23.6 | ) | ||||||||
Other costs of cash | 6,532 | 7,898 | (1,366 | ) | (17.3 | ) | ||||||||
Repairs and maintenance | 7,167 | 9,250 | (2,083 | ) | (22.5 | ) | ||||||||
Communications | 2,565 | 3,477 | (912 | ) | (26.2 | ) | ||||||||
Transaction processing | 2,163 | 2,355 | (192 | ) | (8.2 | ) | ||||||||
Employee costs | 4,380 | 5,308 | (928 | ) | (17.5 | ) | ||||||||
Other expenses | 1,862 | 1,161 | 701 | 60.4 | ||||||||||
Australia & New Zealand total cost of ATM operating revenues | 70,368 | 85,741 | (15,373 | ) | (17.9 | ) | ||||||||
Corporate | 1,528 | 788 | 740 | 93.9 | ||||||||||
Eliminations | (10,494 | ) | (11,249 | ) | 755 | (6.7 | ) | |||||||
Total cost of ATM operating revenues | $ | 830,359 | $ | 855,948 | $ | (25,589 | ) | (3.0 | )% | |||||
North America. During the year ended December 31, 2019, our cost of ATM operating revenues (exclusive of depreciation, accretion, and amortization of intangible assets) decreased $0.7 million compared to the prior year. The decrease was primarily due to lower merchant commissions, lower communications costs, and improved operational efficiency as a result of our restructuring activities, partially offset by an increase in repairs and maintenance costs and other costs of cash.
Europe & Africa. During the year ended December 31, 2019, our cost of ATM operating revenues (exclusive of depreciation, accretion, and amortization of intangible assets) in our Europe & Africa segment decreased by $11.0 million or 4.3% compared to the prior year. Excluding foreign currency exchange rate movements, our cost of ATM operating revenues (exclusive of depreciation, accretion, and amortization of intangible assets) increased less than 1% as a result of the additional transacting ATMs
53
and transaction activity from new placement agreements in Germany, Spain, and South Africa and higher U.K. business rates (property taxes) on ATMs compared to the prior year, partly offset by a decrease in merchant commissions in the U.K.
Australia & New Zealand. During the year ended December 31, 2019, our cost of ATM operating revenues (exclusive of depreciation, accretion, and amortization of intangibles assets) in our Australia & New Zealand segment decreased $15.4 million or 17.9% compared to the prior year primarily due to foreign currency exchange rate movements, a decline in the number of transacting ATMs and fewer transactions per ATM.
Cost of ATM product sales and other revenues. During the year ended December 31, 2019, our cost of ATM product sales and other revenues increased $12.8 million or 30.6% compared to the prior year which is directionally consistent with the increase in revenue from ATM product sales primarily in the U.S.
Selling, General, and Administrative Expenses
Year Ended December 31, | ||||||||||
2019 | % Change | 2018 | ||||||||
(In thousands, excluding percentages) | ||||||||||
Selling, general, and administrative expenses | $ | 158,000 | 1.5 | % | $ | 155,618 | ||||
Share-based compensation expense | 19,474 | 30.9 | % | 14,872 | ||||||
Total selling, general, and administrative expenses | $ | 177,474 | 4.1 | % | $ | 170,490 | ||||
Percentage of total revenues: | ||||||||||
Selling, general, and administrative expenses | 11.7 | % | 11.6 | % | ||||||
Share-based compensation expense | 1.4 | 1.1 | ||||||||
Total selling, general, and administrative expenses | 13.2 | % | 12.7 | % | ||||||
Selling, general, and administrative expenses (“SG&A expenses”), excluding share-based compensation. SG&A expenses, excluding share-based compensation, increased $2.4 million, or 1.5% during the year ended December 31, 2019 compared to the prior year. This increase is primarily a result of licensing and other fees related to the new ERP system, investments in information security and technology, and health insurance costs.
Share-based compensation. Share-based compensation increased $4.6 million during the year ended December 31, 2019 compared to the prior year. This increase is a result of the amount, timing and terms of share-based payment awards granted during the periods, net of estimated forfeitures.
For additional information related to equity awards, see Item 8. Financial Statements and Supplementary Data, Note 4. Share-Based Compensation.
Restructuring Expenses
During 2019, we continued the corporate reorganization and cost reduction initiatives that began in 2017 to improve our cost structure and operating efficiency. During the years ended December 31, 2019 and 2018, we incurred $8.9 million and $6.6 million of pre-tax expenses related to the Restructuring Plan. Our restructuring activities included workforce reductions, costs incurred in conjunction with facilities closures, professional fees and other related charges.
For additional information see Item 8. Financial Statements and Supplementary Data, Note 1. Basis of Presentation and Summary of Significant Accounting Policies – (e) Restructuring Expenses.
54
Acquisition related Expenses
Year Ended December 31, | |||||||||
2019 | % Change | 2018 | |||||||
(In thousands, excluding percentages) | |||||||||
Acquisition related expenses | $ | — | nm | $ | 3,191 | ||||
Percentage of total revenues | — | % | 0.2 | % | |||||
Acquisition related expenses. The Company incurred no acquisition related expenses in the year ended December 31, 2019. For the year ended December 31, 2018, acquisition related expenses included acquisition and integration related professional fees, employee severance, and lease termination costs related to certain operations of DCPayments.
Depreciation and Accretion Expense
Year Ended December 31, | ||||||||||
2019 | % Change | 2018 | ||||||||
(In thousands, excluding percentages) | ||||||||||
Depreciation and accretion expense | $ | 130,676 | 3.5 | % | $ | 126,199 | ||||
Percentage of total revenues | 9.7 | % | 9.4 | % | ||||||
Depreciation and accretion expense. In the year ended December 31, 2019, depreciation and accretion expense increased $4.5 million, or 3.5%, in comparison to prior year due to capital additions in the normal course of business and foreign exchange rate movements.
Amortization of Intangible Assets
Year Ended December 31, | ||||||||||
2019 | % Change | 2018 | ||||||||
(In thousands, excluding percentages) | ||||||||||
Amortization of intangible assets | $ | 49,261 | (6.9 | )% | $ | 52,911 | ||||
Percentage of total revenues | 3.7 | % | 3.9 | % | ||||||
Amortization of intangible assets. The decrease in amortization of intangible assets of $3.7 million for the year ended December 31, 2019 compared to the prior year was primarily due to certain intangible assets becoming fully amortized.
Loss on Disposal and Impairment of Assets
Year Ended December 31, | ||||||||||
2019 | % Change | 2018 | ||||||||
(In thousands, excluding percentages) | ||||||||||
Loss on disposal and impairment of assets | $ | 11,653 | (34.8 | )% | $ | 17,873 | ||||
Percentage of total revenues | 0.9 | % | 1.3 | % | ||||||
55
Loss on disposal and impairment of assets.
For the year ended December 31, 2019, we recognized losses of $4.4 million related to the disposal of ATM assets in the normal course of business. In addition, we recognized a goodwill impairment of $7.3 million related to our Canada reporting unit.
For the year ended December 31, 2018, the loss on disposal and impairment of assets was $17.9 million due to our decision to not redeploy certain ATM models. Although many ATMs in our U.S. operations that were impaired were deployable, a combination of many factors including the size, functionality, estimated upgrade costs, and availability of suitable placement locations resulted in a change of plans relative to certain models such that the units not currently in service were deemed not likely to be deployed. These ATM assets, with a net book value of approximately $7 million, were written down to their estimated net realizable value. The remaining loss was a result of other ATM asset disposals in the ordinary course of business and disposals related to the exit from a leased facility in the U.K.
Interest Expense, net
Year Ended December 31, | ||||||||||
2019 | % Change | 2018 | ||||||||
(In thousands, excluding percentages) | ||||||||||
Interest expense, net | $ | 26,604 | (24.9 | )% | $ | 35,429 | ||||
Percentage of total revenues | 2.0 | % | 2.6 | % | ||||||
Interest expense, net. Interest expense, net, decreased $8.8 million or 24.9% during the year ended December 31, 2019, compared to the prior year. This decrease was attributable to a comparatively lower outstanding long-term debt balance and a lower weighted average interest rate following the December 2018 redemption of our $250.0 million 5.125% Senior notes. These borrowings were refinanced under our revolving credit facility with a lower interest rate.
For additional information, see Item 8. Financial Statements and Supplementary Data, Note 11. Long-Term Debt.
Early Extinguishment of Debt
In connection with the early extinguishment of the 2022 Notes in 2018, we recognized a $6.4 million pre-tax charge for the premium paid upon redemption. This amount is included in the Redemption costs for early extinguishment of debt line in the accompanying Consolidated Statements of Operations in the year ended December 31, 2018. We also wrote off approximately $1.4 million in deferred financing costs upon extinguishment. This amount is included in the Amortization of deferred financing costs and note discount in the accompanying Consolidated Statements of Operations in the year ended December 31, 2018. For additional information, see Item 8. Financial Statements and Supplementary Data, Note 11. Long-Term Debt.
Income Tax Expense
Year Ended December 31, | ||||||||||
2019 | % Change | 2018 | ||||||||
(In thousands, excluding percentages) | ||||||||||
Income tax expense | $ | 16,522 | 58.0 | % | $ | 10,457 | ||||
Effective tax rate | 25.5 | % | 74.1 | % | ||||||
Income tax expense. Our income tax expense for the year ended December 31, 2019 totaled $16.5 million resulting in an effective tax rate of 25.5%, compared to an income tax expense of $10.5 million, and an effective tax rate of 74.1%, for the same period of 2018. The decrease in the effective tax rate for the year ended December 31, 2019 was primarily attributable to tax benefits from the utilization of interest deductions disallowed in the prior year and the nontaxable gain recorded in the current year to revise the fair value of the acquisition related contingent consideration liability.
56
Non-GAAP Financial Measures
DISCLOSURE OF NON-GAAP FINANCIAL INFORMATION
In order to assist readers of our consolidated financial statements in understanding the operating results that management uses to evaluate the business and for financial planning purposes, we present the following non-GAAP measures as a complement to financial results prepared in accordance with U.S. GAAP: EBITDA, Adjusted EBITDA, Adjusted EBITDA Margin, Adjusted Net Income, Adjusted Net Income per diluted share, Adjusted Free Cash Flow, and certain other results presented on a constant-currency basis. We believe that the presentation of these measures and the identification of notable, non-cash, non-operating and/or (if applicable in a particular period), certain costs not anticipated to occur in future periods enhance an investor’s understanding of the underlying trends in our business and provide for better comparability between periods in different years. We also believe that these measures are relevant and provide useful information widely used by analysts, investors and other interested parties in our industry to provide a baseline for evaluating and comparing our operating performance and, in the case of free cash flow, our liquidity results. We use these non-GAAP financial measures in managing and measuring the performance of our business, including setting and measuring incentive-based compensation for management.
Furthermore, the non-GAAP financial measures presented herein should not be considered in isolation or as a substitute for operating income, net income, cash flows from operating, investing, or financing activities, or other income or cash flow measures contained within our consolidated financial statements. The non-GAAP measures that we use are not defined in the same manner by all companies and therefore may not be comparable to other similarly titled measures of other companies.
EBITDA, Adjusted EBITDA, and Adjusted EBITDA Margin
EBITDA adds interest, income tax expense (benefit), depreciation and accretion, amortization of deferred financing costs and note discounts, and amortization of intangible assets, and certain costs not anticipated to occur in future periods to net income. Adjusted EBITDA and Adjusted EBITDA Margin exclude the items excluded from EBITDA as well as share-based compensation expense, certain other income and expense amounts, acquisition related expenses, gains or losses on disposal and impairment of assets, certain non-operating expenses, (if applicable in a particular period), our obligation for the payment of income taxes, interest expense and other obligations such as capital expenditures, and includes an adjustment for noncontrolling interests. Depreciation and accretion expense and amortization of intangible assets are excluded from Adjusted EBITDA and Adjusted EBITDA margins as these amounts can vary substantially from company to company within our industry depending upon accounting methods and book values of assets, capital structures, and the methods by which the assets were acquired. Adjusted EBITDA margin is calculated as Adjusted EBITDA divided by total revenues.
57
Adjusted Net Income, Adjusted Net Income per Diluted Share and Adjusted Tax Rate
Adjusted Net Income represents net income computed in accordance with GAAP, before amortization of intangible assets, deferred financing costs and note discount, gains or losses on disposal and impairment of assets, share-based compensation expense, certain other income and expense amounts, acquisition and divestiture-related expenses, certain non-operating expenses, and (if applicable in a particular period) certain costs not anticipated to occur in future periods (together, the “Adjustments”). The non-GAAP tax rate used to calculate Adjusted Net Income was approximately 23.1% and 24.1% for the years ended December 31, 2019 and 2018, respectively. The non-GAAP tax rates represent the GAAP tax rate for the period as adjusted by the estimated tax impact of the items adjusted from the measure. Adjusted Net Income per diluted share is calculated by dividing Adjusted Net Income by weighted average diluted shares outstanding.
Adjusted Free Cash Flow
Adjusted Free Cash Flow is defined as cash provided by operating activities less the impact of changes in restricted cash due to the timing of payments of restricted cash liabilities and less payments for capital expenditures, including those financed through direct debt, but excluding acquisitions. The Adjusted Free Cash Flow measure does not take into consideration certain financing activities and other non-discretionary cash requirements such as mandatory principal payments on portions of the Company's long-term debt.
Constant Currency
Management calculates certain GAAP as well as non-GAAP measures on a constant-currency basis using the average foreign currency exchange rates applicable in the corresponding period of the previous year and applying these rates to the measures in the current reporting period to assess performance and eliminate the effect foreign currency exchange rates have on comparability between periods.
Reconciliation of Non-GAAP Financial Statements
Reconciliations of the non-GAAP financial measures used herein to the most directly comparable U.S. GAAP financial measures are presented as follows:
58
Reconciliation of Net Income Attributable to Controlling Interests and Available to Common Shareholders to EBITDA, Adjusted EBITDA, and Adjusted Net Income (in thousands, excluding share and per share amounts)
Year Ended December 31, | |||||||
2019 | 2018 | ||||||
Net income attributable to controlling interests and available to common shareholders | $ | 48,274 | $ | 3,676 | |||
Adjustments: | |||||||
Interest expense, net | 26,604 | 35,429 | |||||
Amortization of deferred financing costs and note discount | 13,447 | 14,887 | |||||
Redemption costs for early extinguishment of debt | — | 6,408 | |||||
Income tax expense | 16,522 | 10,457 | |||||
Depreciation and accretion expense | 130,676 | 126,199 | |||||
Amortization of intangible assets | 49,261 | 52,911 | |||||
EBITDA | 284,784 | 249,967 | |||||
Add back: | |||||||
Loss on disposal and impairment of assets (1) | 11,653 | 17,873 | |||||
Other income (2) | (18,404 | ) | (627 | ) | |||
Noncontrolling interests (3) | 58 | 38 | |||||
Share-based compensation expense | 20,962 | 15,660 | |||||
Restructuring expenses (4) | 8,928 | 6,586 | |||||
Acquisition related expenses (5) | — | 3,191 | |||||
Adjusted EBITDA | 307,981 | 292,688 | |||||
Less: | |||||||
Depreciation and accretion expense (6) | 130,675 | 126,197 | |||||
Interest expense, net | 26,604 | 35,429 | |||||
Adjusted pre-tax income | 150,702 | 131,062 | |||||
Income tax expense (7) | 34,877 | 31,529 | |||||
Adjusted Net Income | $ | 115,825 | $ | 99,533 | |||
Adjusted Net Income per share – basic | $ | 2.54 | $ | 2.16 | |||
Adjusted Net Income per share – diluted | $ | 2.52 | $ | 2.14 | |||
Weighted average shares outstanding – basic | 45,514,703 | 45,988,775 | |||||
Weighted average shares outstanding – diluted | 46,015,334 | 46,436,439 | |||||
(1) | Includes a goodwill impairment of $7.3 million on the Canada reporting unit during the year ended December 31, 2019. |
(2) | Includes the revaluation of the estimated acquisition related contingent consideration, foreign currency translation gains/losses and other non-operating costs. |
(3) | Noncontrolling interest adjustment made such that Adjusted EBITDA includes only our ownership interest in the Adjusted EBITDA of one of our Mexican subsidiaries. |
(4) | For the years ended December 31, 2019 and 2018, restructuring activities included workforce reductions, costs incurred in conjunction with facilities closures, professional fees and other related charges. |
(5) | Acquisition related expenses include costs incurred for professional and legal fees and certain other transition and integration-related costs. |
(6) | Amounts exclude a portion of the expenses incurred by one of our Mexican subsidiaries to account for the amounts allocable to the noncontrolling interest shareholders. |
(7) | For the years ended December 31, 2019 and 2018, the non-GAAP tax rate used to calculate Adjusted Net Income was 23.1% and 24.1%, respectively, which represents our U.S. GAAP tax rate as adjusted for the net tax effects related to the items excluded from Adjusted Net Income. |
59
Reconciliation of U.S. GAAP Revenue to Constant-Currency Revenue
Consolidated revenue | Year Ended December 31, | ||||||||||||||||||||
2019 | 2018 | % Change | |||||||||||||||||||
U.S. GAAP | Foreign Currency Impact | Constant - Currency | U.S. GAAP | U.S. GAAP | Constant - Currency | ||||||||||||||||
(In thousands) | |||||||||||||||||||||
ATM operating revenues | $ | 1,281,106 | $ | 29,450 | $ | 1,310,556 | $ | 1,292,930 | (0.9 | )% | 1.4 | % | |||||||||
ATM product sales and other revenues | 68,299 | 657 | 68,956 | 52,313 | 30.6 | 31.8 | |||||||||||||||
Total revenues | $ | 1,349,405 | $ | 30,107 | $ | 1,379,512 | $ | 1,345,243 | 0.3 | % | 2.5 | % | |||||||||
North America revenue | Year Ended December 31, | ||||||||||||||||||||
2019 | 2018 | % Change | |||||||||||||||||||
U.S. GAAP | Foreign Currency Impact | Constant - Currency | U.S. GAAP | U.S. GAAP | Constant - Currency | ||||||||||||||||
(In thousands) | |||||||||||||||||||||
ATM operating revenues | $ | 803,955 | $ | 3,069 | $ | 807,024 | $ | 787,514 | 2.1 | % | 2.5 | % | |||||||||
ATM product sales and other revenues | 59,559 | 91 | 59,650 | 42,665 | 39.6 | 39.8 | |||||||||||||||
Total revenues | $ | 863,514 | $ | 3,160 | $ | 866,674 | $ | 830,179 | 4.0 | % | 4.4 | % | |||||||||
Europe & Africa revenue | Year Ended December 31, | ||||||||||||||||||||
2019 | 2018 | % Change | |||||||||||||||||||
U. S. GAAP | Foreign Currency Impact | Constant - Currency | U.S. GAAP | U.S. GAAP | Constant - Currency | ||||||||||||||||
(In thousands) | |||||||||||||||||||||
ATM operating revenues | $ | 388,091 | $ | 18,914 | $ | 407,005 | $ | 400,390 | (3.1 | )% | 1.7 | % | |||||||||
ATM product sales and other revenues | 8,229 | 496 | 8,725 | 9,379 | (12.3 | ) | (7.0 | ) | |||||||||||||
Total revenues | $ | 396,320 | $ | 19,410 | $ | 415,730 | $ | 409,769 | (3.3 | )% | 1.5 | % | |||||||||
Australia & New Zealand revenue | Year Ended December 31, | ||||||||||||||||||||
2019 | 2018 | % Change | |||||||||||||||||||
U.S. GAAP | Foreign Currency Impact | Constant - Currency | U.S. GAAP | U.S. GAAP | Constant - Currency | ||||||||||||||||
(In thousands) | |||||||||||||||||||||
ATM operating revenues | $ | 99,552 | $ | 7,466 | $ | 107,018 | $ | 117,138 | (15.0 | )% | (8.6 | )% | |||||||||
ATM product sales and other revenues | 511 | 41 | 552 | 269 | 90.0 | 105.2 | |||||||||||||||
Total revenues | $ | 100,063 | $ | 7,507 | $ | 107,570 | $ | 117,407 | (14.8 | )% | (8.4 | )% | |||||||||
60
Reconciliation of Adjusted EBITDA, Adjusted Net Income, and Adjusted Net Income per diluted share on a Non-GAAP basis to Constant-Currency
Year Ended December 31, | |||||||||||||||||||||
2019 | 2018 | % Change | |||||||||||||||||||
Non - GAAP (1) | Foreign Currency Impact | Constant - Currency | Non - GAAP (1) | Non - GAAP (1) | Constant - Currency | ||||||||||||||||
(In thousands) | |||||||||||||||||||||
Adjusted EBITDA | $ | 307,981 | $ | 6,819 | $ | 314,800 | $ | 292,688 | 5.2 | % | 7.6 | % | |||||||||
Adjusted Net Income | $ | 115,825 | $ | 2,486 | $ | 118,311 | $ | 99,533 | 16.4 | % | 18.9 | % | |||||||||
Adjusted Net Income per share – diluted (2) | $ | 2.52 | $ | 0.05 | $ | 2.57 | $ | 2.14 | 17.8 | % | 20.1 | % | |||||||||
(1) | As reported on Reconciliation of Net Income Attributable to Controlling Interests and Available to Common Shareholders’ to EBITDA, Adjusted EBITDA, and Adjusted Net Income above. |
(2)Adjusted Net Income per diluted share is calculated by dividing Adjusted Net Income by the weighted average diluted shares outstanding of 46,015,334 and 46,436,439 for the years ended December 31, 2019 and 2018, respectively.
Calculation of Adjusted Free Cash Flow
Year Ended December 31, | |||||||
2019 | 2018 | ||||||
(In thousands) | |||||||
Net cash provided by operating activities | $ | 204,659 | $ | 334,202 | |||
Restricted cash settlement activity (1) | 70,482 | (109,093 | ) | ||||
Adjusted net cash provided by operating activities | 275,141 | 225,109 | |||||
Net cash used in investing activities, excluding acquisitions (2) | (124,906 | ) | (107,205 | ) | |||
Adjusted free cash flow | $ | 150,235 | $ | 117,904 | |||
(1) | Restricted cash settlement activity represents the change in our restricted cash excluding the portion of the change that is attributable to foreign exchange and disclosed as part of the effect of exchange rate changes on cash, cash equivalents, and restricted cash in the accompanying Consolidated Statements of Cash Flows. |
(2) | Capital expenditure amounts include payments made for exclusive license agreements, site acquisition costs, and other assets. Additionally, capital expenditure amounts for one of our Mexican subsidiaries are reflected gross of any noncontrolling interest amounts. |
Liquidity and Capital Resources
Overview
As of December 31, 2019, we had $30.1 million in cash and cash equivalents and $739.5 million in outstanding long-term debt.
We have historically funded our operations primarily through cash flows from operations, borrowings under our revolving credit facility, and the issuance of debt and equity securities. We have generally used a portion of our cash flows to invest in additional ATMs, either through acquisitions or through organic growth. We also have used our cash flows to pay interest and principal amounts outstanding under our borrowings. During 2019, we also used cash flows to repurchase 1.7 million of our outstanding shares at a cost of approximately $50 million and to repay approximately $96 million of our indebtedness.
We typically reflect a working capital deficit position in the Consolidated Balance Sheets. We collect a sizable portion of our cash from sales on a daily basis but generally pay our vendors on 30 day terms and are not required to pay certain of our merchants
61
until 20 days after the end of each calendar month. We are able to utilize the excess available cash flow to reduce borrowings made under our revolving credit facility reported as long term debt and to fund capital expenditures.
We believe that our cash on hand and our current revolving credit facility will be sufficient to meet our working capital requirements and contractual commitments for the next twelve months, including the settlement of our Convertible Notes at maturity on December 1st, 2020. See Financing Facilities below.
Operating Activities
Net cash provided by operating activities totaled $204.7 million and $334.2 million for the years ended December 31, 2019 and 2018, respectively. Excluding changes in restricted cash during the periods due to the timing of settlements, our cash flows from operating activities were up approximately $50.0 million compared to the prior year. This increase is primarily attributable to growth in profits and lower interest payments as well as favorable working capital changes.
Investing Activities
Net cash used in investing activities totaled $134.0 million and $108.4 million for the years ended December 31, 2019 and 2018, respectively. These amounts vary by year, depending on acquisition and divestiture activities in a particular year along with our capital investments. The change in net cash used in investing activities during the year ended 2019 relative to the prior years was related to the following: i) organic growth projects, including the purchase of ATMs for both new and existing ATM management agreements, ii) technology and product development, iii) investments in our infrastructure, iv) ongoing refreshment of our ATMs and operational assets and v) a small acquisition.
Anticipated future capital expenditures. We currently anticipate that the majority of our capital expenditures for the foreseeable future will be attributable to the following: i) organic growth projects, including the purchase of ATMs for both new and existing ATM management agreements, ii) technology and product development, iii) investments in our infrastructure, and iv) ongoing refreshment. We currently anticipate that our capital expenditures for 2020 will total approximately $140 million, the majority of which is expected to be utilized to support new business growth. We expect such capital expenditures to be funded primarily through our cash flows from operations.
Financing Activities and Facilities
Net cash used in financing activities totaled $151.1 million and $126.4 million, for the years ended December 31, 2019 and 2018, respectively. Throughout 2019 and 2018, we used our net cash flow generated from operations to continue to invest in our business and pay down borrowings under our revolving credit facility. In 2019, we also used net cash flows from operations to repurchase 1.7 million shares for approximately $50 million. During 2019, we also entered into an amendment to the second amended and restated credit agreement, increasing the total available commitments under the facility to $750 million. In 2018, we used borrowings under our credit facility to fund our redemption of the 2022 Notes.
For information related to our financing facilities see Item 8. Financial Statements and Supplementary Data, Note 11. Long-Term Debt.
Effects of Inflation
Our monetary assets, consisting primarily of cash and receivables, are not currently significantly affected by inflation. Similarly our non-monetary assets, consisting primarily of tangible and intangible assets, are not affected by inflation. However, inflation may in the future affect our expenses, such as those for employee compensation, operating costs and capital expenditures, which may not be readily recoverable in the price of services offered by us.
62
Contractual Obligations
The following table reflects our significant contractual obligations and other commercial commitments as of December 31, 2019:
Payments Due by Period | |||||||||||||||||||||||||||
2020 | 2021 | 2022 | 2023 | 2024 | Thereafter | Total | |||||||||||||||||||||
(In thousands) | |||||||||||||||||||||||||||
Long-term debt obligations: | |||||||||||||||||||||||||||
Principal (1) | $ | 287,500 | $ | — | $ | — | $ | — | $ | 167,227 | $ | 300,000 | $ | 754,727 | |||||||||||||
Interest (2) | 23,266 | 20,391 | 20,391 | 20,391 | 20,067 | 27,500 | 132,006 | ||||||||||||||||||||
Operating leases (3) | 22,316 | 19,832 | 12,096 | 8,781 | 6,800 | 32,054 | 101,879 | ||||||||||||||||||||
Merchant obligations (4) | 13,999 | 9,809 | 6,417 | 4,424 | 1,514 | 599 | 36,762 | ||||||||||||||||||||
Minimum service contracts | 1,149 | 732 | — | — | — | — | 1,881 | ||||||||||||||||||||
Open purchase orders | 5,383 | — | — | — | — | — | 5,383 | ||||||||||||||||||||
Total contractual obligations | $ | 353,613 | $ | 50,764 | $ | 38,904 | $ | 33,596 | $ | 195,608 | $ | 360,153 | $ | 1,032,638 | |||||||||||||
(1) | Represents the $287.5 million face value of our Convertible Notes, $167.2 million outstanding under our revolving credit facility, and $300.0 million face value of our 2025 Notes. |
(2) | Represents the estimated interest payments associated with our long-term debt outstanding as of December 31, 2019, assuming current interest rates and the amount of debt outstanding in the periods indicated in the table above. |
(3) | Our operating lease obligations increased during 2019 due to our entry into new and amended long-term facilities leases. |
(4) | Includes various fixed periodic payments to merchants required under our ATM placement agreements. |
Critical Accounting Policies and Estimates
Our consolidated financial statements included in this 2019 Form 10-K have been prepared in accordance with U.S. GAAP, which requires management to make numerous estimates and assumptions. Actual results could differ from those estimates and assumptions, thus impacting our results of operations and financial position. The critical accounting policies and estimates described in this section are those that are most important to the depiction of our financial condition and results of operations and the application of which requires management’s most subjective judgments in making estimates about the effect of matters that are inherently uncertain. For additional information related to our significant accounting policies, see Item 8. Financial Statements and Supplementary Data, Note 1. Basis of Presentation and Summary of Significant Accounting Policies.
Goodwill and intangible assets. We have accounted for our acquisitions as business combinations in accordance with U.S. GAAP. Accordingly, the value of the purchase consideration for these acquisitions has been allocated to the assets acquired and liabilities assumed based on their respective fair values as of each acquisition date. Intangible assets that met the criteria established by U.S. GAAP for recognition apart from goodwill include acquired merchant and bank-branding contracts/relationships, trade names, technology, and the non-compete agreements entered into in connection with certain acquisitions. The excess of the purchase consideration paid in excess of the fair values of the identified assets acquired and liabilities assumed is recognized as goodwill in our consolidated financial statements.
Goodwill and other intangible assets that have indefinite useful lives are not amortized, but instead are evaluated annually for impairment, and intangible assets that have finite useful lives are amortized over their estimated useful lives. We follow U.S. GAAP for testing goodwill and other non-amortized intangible assets for impairment. In 2019, we elected to perform the optional qualitative assessment allowed under U.S. GAAP to determine if it was necessary to perform a quantitative assessment. The qualitative assessment considers whether it is more likely than not that the fair value of a reporting unit is less than its carrying amount. In the event that the qualitative assessment indicates it is more likely than not that the fair value of a reporting unit is less than its carrying amount, we perform the quantitative assessment prescribed by the guidance where the carrying amount of the net assets associated with each applicable reporting unit is compared to the estimated fair value of such reporting unit as of the date of the test or the annual testing date, December 31, 2019. For the year ended December 31, 2019, we performed our annual goodwill impairment test for seven separate reporting units: (i) the U.S. operations, (ii) the U.K. operations, (iii) the Australia & New Zealand operations, (iv) the Canada operations, (v) the South Africa operations, (vi) the Germany operations, and (vii) the Mexico operations. There was no goodwill associated with our Spain or Ireland operations as of December 31, 2019.
63
We evaluate our goodwill and other non-amortized intangible assets on an on-going basis considering qualitative factors. If necessary, we evaluate the recoverability of our goodwill and other non-amortized intangible assets by estimating the future discounted cash flows of the reporting units to which the goodwill and other non-amortized intangible assets relate. We use discount rates corresponding to our cost of capital, risk-adjusted as appropriate, to determine the discounted cash flows, and consider current and anticipated business trends, prospects, and other market and economic conditions when performing our evaluations. These evaluations are performed on an annual basis at a minimum, or more frequently based on the occurrence of events that might indicate a potential impairment. Examples of events that might indicate impairment include, but are not limited to, the loss of a significant contract, a material change in the terms or conditions of a significant contract, or significant decreases in revenues associated with a contract or business.
Valuation of long-lived assets. We place significant value on the installed ATMs that we own and manage in merchant locations and the related acquired merchant and bank-branding contracts/relationships. Long-lived assets, such as property and equipment and intangible assets subject to depreciation and amortization, respectively, are reviewed for impairment at least annually, and whenever events or changes in circumstances indicate that the carrying amount of such assets may not be recoverable.
In determining whether a particular merchant and bank-branding contract/relationship is significant enough to warrant a separate identifiable intangible asset, we analyze a number of relevant factors, including: (i) estimates of the historical cash flows from such contract/relationship prior to its acquisition, (ii) estimates regarding our ability to increase the contract/relationship’s cash flows subsequent to the acquisition through a combination of lower operating costs, the deployment of additional ATMs, and the incremental revenues from increased surcharges and/or new merchant or bank-branding contracts/relationships, and (iii) estimates regarding our ability to renew such contracts/relationships beyond their originally scheduled termination date. An individual merchant and bank-branding contract/relationship, and the related ATMs, could be impaired if the contract/relationship is terminated sooner than originally anticipated, or if there is a decline in the number of transactions related to such contract/relationship without a corresponding increase in the amount of revenue collected per transaction. A portfolio of purchased contract/relationship intangibles, including the related ATMs, could be impaired if the contract/relationship attrition rate is materially more than the rate used to estimate the portfolio’s initial value, or if there is a decline in the number of transactions associated with such portfolio without a corresponding increase in the revenue collected per transaction. Whenever events or changes in circumstances indicate that a merchant or bank-branding contract/relationship intangible asset may be impaired, we evaluate the recoverability of the intangible asset, and the related ATMs, by measuring the related carrying amounts against the estimated undiscounted future cash flows associated with the related contract/relationship or portfolio of contracts/relationships. Should the sum of the expected future net cash flows be less than the carrying values of the tangible and intangible assets being evaluated, an impairment loss would be recognized. The impairment loss would be calculated as the amount by which the carrying values of the ATMs and intangible assets exceeded the calculated fair value.
Income taxes. Income tax provisions are based on taxes payable or refundable for the current year and deferred taxes on temporary differences between the amount of taxable income and income before provision of income taxes and between the tax basis of assets and liabilities and their reported amounts in our consolidated financial statements. We include deferred tax assets and liabilities in our consolidated financial statements at currently enacted income tax rates. As changes in tax laws or rates are enacted, we adjust our deferred tax assets and liabilities through the income tax provision.
In assessing the realizability of deferred tax assets, we consider whether it is more likely than not that some portion or all of the deferred tax assets will not be realized. The ultimate realization of deferred tax assets is dependent on the generation of future taxable income during the periods in which those temporary differences become deductible. We consider the scheduled reversal of deferred tax liabilities, projected future taxable income, and tax planning strategies in making this assessment. In the event we do not believe we will be able to utilize the related tax benefits associated with deferred tax assets, we record valuation allowances to reserve for the assets.
Asset retirement obligations (“ARO”). We estimate the fair value of the additions to the ARO associated with our cost to deinstall our ATMs and, in some cases, restore the ATM sites to their original conditions. ARO estimates are based on a number of assumptions, including: (i) the types of ATMs that are installed, (ii) the relative mix where the ATMs are installed (i.e., whether such ATMs are located in single-merchant locations or in locations associated with large, geographically-dispersed retail chains), and (iii) whether we will ultimately be required to refurbish the merchant store locations upon the removal of the related ATMs. Additionally, we are required to make estimates regarding the timing of the estimated ARO payments. We utilize a pooled approach to calculate and maintain our AROs, as opposed to a specific machine-by-machine approach, based on the estimated deinstallation dates. We periodically evaluate the reasonableness of the ARO balance by obtaining the current machine count and updated cost estimates to deinstall ATMs.
The fair value of a liability for an ARO is recognized in the period in which it is incurred and can be reasonably estimated. ARO costs are capitalized as part of the carrying amount of the related long-lived asset and depreciated over the asset’s estimated
64
useful life. Fair value estimates of liabilities for AROs generally involve discounted future cash flows. Periodic accretion of such liabilities due to the passage of time is recorded as depreciation and accretion expense in the consolidated financial statements.
Share-based compensation. We calculate the fair value of share-based awards to our Board and employees on the date of grant and recognize the calculated fair value, net of estimated forfeitures, as share-based compensation expense over the underlying requisite service periods of the related awards. In determining the fair value of our share-based awards, we are required to make certain assumptions and estimates, including: (i) the number of awards that may ultimately be granted to and forfeited by the recipients, (ii) the expected term of the underlying awards, and (iii) the future volatility associated with the price of our common shares. For additional information related to such estimates, and the basis for our conclusions regarding such estimates for the year ended December 31, 2019, see Item 8. Financial Statements and Supplementary Data, Note 4. Share-Based Compensation.
Derivative financial instruments. We recognize all of our derivative instruments as assets or liabilities in the accompanying Consolidated Balance Sheets at fair value. The accounting for changes in the fair value of the derivative instruments depends on whether such instruments have been designated and qualify as part of a hedging relationship and the type of hedging relationship designated. For derivative instruments that are designated and qualify as hedging instruments, we designate the hedging instrument, based upon the exposure being hedged, as a cash flow hedge, a fair value hedge, or a hedge of a net investment in a foreign operation. These derivatives are valued using pricing models based on significant other observable inputs (Level 2 inputs under the fair value hierarchy prescribed by U.S. GAAP), while taking into account the creditworthiness of the party that is in the liability position with respect to each trade. As of December 31, 2019, the majority of our derivative instruments were designated and qualify as cash flow hedges, and accordingly, changes in the fair values of such derivatives have been reported in Accumulated other comprehensive loss, net within the accompanying Consolidated Balance Sheets. We are also party to foreign currency forward contracts that are not designated as hedges for accounting purposes. The changes in the fair values of these derivatives have been reported in Other (income) expense within the accompanying Statements of Operations. Although not designated, these forward contracts are associated with planned borrowings in U.K. pounds sterling and the anticipated conversion of the U.K. pounds sterling to U.S. dollars to partially fund the repayment of our 1.00% Convertible Senior Notes Due 2020.
For additional information related to our derivative financial instruments, see Item 8. Financial Statements and Supplementary Data, Note 16. Derivative Financial Instruments.
Convertible Notes. We are party to various derivative instruments related to the issuance of our Convertible Notes. As of December 31, 2019, all of our derivative instruments related to the Convertible Notes qualified for classification in the Shareholders’ equity line in the accompanying Consolidated Balance Sheets. We are required, however, for the remaining term of the Convertible Notes, to assess whether we continue to meet the shareholders’ equity classification requirements and if in any future period we fail to satisfy those requirements, we would need to reclassify these instruments out of Shareholders’ equity and record them as a derivative asset or liability, at which point we would be required to record any changes in fair value through earnings. For additional information related to our Convertible Notes, see Item 8. Financial Statements and Supplementary Data, Note 11. Long-Term Debt.
New Accounting Pronouncements
For recent accounting pronouncements, including those not yet adopted during 2019, see Item 8. Financial Statements and Supplementary Data, Note 2. New Accounting Pronouncements.
Commitments and Contingencies
We are subject to various legal proceedings and claims arising in the ordinary course of our business. We do not expect that the outcome in any of these legal proceedings, individually or collectively, will have a material adverse financial or operational impact on us. For additional information related to our commitments and contingencies, see Item 8. Financial Statements and Supplementary Data, Note 19 . Commitments and Contingencies.
Off-Balance Sheet Arrangements
As of December 31, 2019, we did not have any material off-balance sheet arrangements, as contemplated in Item 303(a)(4)(ii) of Regulation S-K.
65
ITEM 7A. QUANTITATIVE AND QUALITATIVE DISCLOSURES ABOUT MARKET RISK
Disclosures about Market Risk
We are exposed to certain risks related to our ongoing business operations, including interest rate risk associated with our vault cash rental obligations, borrowings under our revolving credit facility, and foreign currency exchange risk. The following quantitative and qualitative information is provided about financial instruments to which we were a party at December 31, 2019 and from which we may incur future gains or losses from changes in market interest rates or foreign currency exchange rates. We do not enter into derivative or other financial instruments for speculative or trading purposes.
Hypothetical changes in interest rates and foreign currency exchange rates chosen for the following estimated sensitivity analysis are considered to be reasonably possible near-term changes generally based on consideration of past fluctuations for each risk category. However, since it is not possible to accurately predict future changes in interest rates and foreign currency exchange rates, these hypothetical changes may not necessarily be an indicator of probable future fluctuations.
Interest Rate Risk
Vault cash rental expense. As our ATM vault cash rental expense is based on market rates of interest, it is sensitive to changes in the general level of interest rates in the respective countries in which we operate. We pay a monthly fee on the average outstanding vault cash balances in our ATMs under floating rate formulas based on a spread above various interbank offered rates in the U.S., the U.K., Germany, and Spain. In Australia, the formula is based on the Bank Bill Swap Rates (“BBSY”), in South Africa, the rate is based on the South African Prime Lending rate and the Johannesburg Interbank Agreed Rate, in Canada, the rate is based on the Bank of Canada’s Bankers Acceptance Rate and the Canadian Prime Rate, and in Mexico, the rate is based on the Interbank Equilibrium Interest Rate (commonly referred to as the “TIIE”).
As a result of the significant sensitivity surrounding our vault cash rental expense, we have entered into a number of interest rate derivative contracts with varying notional amounts and fixed interest rates in the U.S., Canada, the U.K., and Australia to manage the rate we pay on the amounts of our current and anticipated outstanding vault cash balances.
The notional amounts, weighted average fixed rates, and terms associated with our interest rate swap and cap contracts currently in place in the U.S., Canada, the U.K, and Australia (as of the date of the issuance of this 2019 Form 10-K) are as follows:
Outstanding Interest Rate Derivatives Associated with Vault Cash Rental Obligations
North America – Interest Rate Swap Contracts
Notional Amounts U.S. $ | Weighted Average Fixed Rate | Term | |||||
(In millions) | |||||||
$ | 1,300 | 1.84 | % | January 1, 2020 – December 31, 2020 | |||
$ | 1,000 | 1.61 | % | January 1, 2021 – December 31, 2021 | |||
$ | 800 | 1.28 | % | January 1, 2022 – December 31, 2022 | |||
$ | 400 | 1.11 | % | January 1, 2023 – December 31, 2024 | |||
Notional Amounts CAD $ | Weighted Average Fixed Rate | Term | |||||
(In millions) | |||||||
C$ | 125 | 2.46 | % | January 1, 2020 – December 31, 2021 | |||
North America - Interest Rate Cap Contracts
Notional Amounts U.S. $ | Cap Rate (1) | Term | |||||||
(In millions) | |||||||||
$ | 200 | 3.25 | % | January 1, 2021 – December 31, 2023 | |||||
66
1 Maximum amount of interest to be paid each year as per terms of cap. Cost of cap is amortized through vault cash rental expense over term of cap.
Europe & Africa – Interest Rate Swap Contracts
Notional Amounts U.K. £ | Weighted Average Fixed Rate | Term | |||||
(In millions) | |||||||
£ | 500 | 0.94 | % | January 1, 2020 – December 31, 2022 | |||
Australia & New Zealand – Interest Rate Swap Contracts
Notional Amounts AUS $ | Weighted Average Fixed Rate | Term | |||||
(In millions) | |||||||
$ | 140 | 1.59 | % | January 1, 2020 – December 31, 2020 | |||
$ | 40 | 0.71 | % | January 1, 2021 – December 31, 2021 | |||
Summary of Interest Rate Exposure on Average Outstanding Vault Cash
The following table presents a hypothetical sensitivity analysis of our annual vault cash rental expense in North America based on our average outstanding vault cash balance and interest rate derivatives for the quarter ended December 31, 2019 and assuming a 100 basis point increase in interest rates (in millions of USD):
North America | |||
Average outstanding vault cash balance | $ | 1,898 | |
Interest rate swap and cap contracts fixed notional amount | (1,095 | ) | |
Residual unhedged outstanding vault cash balance | $ | 803 | |
Additional annual interest incurred on 100 basis point increase | $ | 8.03 | |
We also have terms in certain of our North America contracts with merchants and financial institution partners where we can decrease fees paid to merchants or effectively increase the fees paid to us by financial institutions if vault cash rental costs increase. Such protections will serve to reduce but not fully eliminate the exposure calculated above. Furthermore, we have the ability in North America to partially mitigate our interest rate exposure through our operations. We believe we can reduce the average outstanding vault cash balances as interest rates rise by visiting ATMs more frequently with lower cash amounts. This ability to reduce the average outstanding vault cash balances is partially constrained by the incremental cost of more frequent ATM visits.
The following table presents a hypothetical sensitivity analysis of our annual vault cash rental expense in Europe & Africa based on our average outstanding vault cash balance and interest rate derivatives for the quarter ended December 31, 2019 and assuming a 100 basis point increase in interest rates (in millions of USD):
Europe & Africa | |||
Average outstanding vault cash balance | $ | 1,076 | |
Interest rate swap contracts fixed notional amount | (708 | ) | |
Residual unhedged outstanding vault cash balance | $ | 368 | |
Additional annual interest incurred on 100 basis point increase | $ | 3.68 | |
67
The following table presents a hypothetical sensitivity analysis of our annual vault cash rental expense in Australia based on our average outstanding vault cash balance and interest rate derivatives for the quarter ended December 31, 2019 and assuming a 100 basis point increase in interest rates (in millions of USD):
Australia | |||
Average outstanding vault cash balance | $ | 273 | |
Interest rate swap contracts fixed notional amount | (103 | ) | |
Residual unhedged outstanding vault cash balance | $ | 170 | |
Additional annual interest incurred on 100 basis point increase | $ | 1.70 | |
As of December 31, 2019, we had an asset of $10.6 million and a liability of $17.4 million recorded in the accompanying Consolidated Balance Sheets related to our interest rate swap and cap contracts, which represented the fair value asset or liability of the contracts as derivative instruments are required to be carried at fair value. The fair value estimate was calculated as the present value of amounts estimated to be received or paid to a marketplace participant in a selling transaction. These interest rate swap and cap contracts are valued using pricing models based on significant other observable inputs (Level 2 inputs under the fair value hierarchy prescribed by U.S. GAAP). The effective portion of the gain or loss on the derivative instrument is reported as a component of Accumulated other comprehensive loss, net within the accompanying Consolidated Balance Sheets. The effective portion is reclassified into earnings in the Vault cash rental expense line in the accompanying Consolidated Statements of Operations in the same period or periods during which the hedged transaction affects earnings and has been forecasted into earnings.
Outlook. Although we currently hedge a substantial portion of our vault cash interest rate risk in the U.S., Canada, the U.K., and Australia, we may not be able to enter into similar arrangements for similar amounts in the future and any significant increase in interest rates in the future could have an adverse impact on our business, financial condition, and results of operations by increasing our operating expenses. However, we expect that the impact on our consolidated financial statements from a significant increase in interest rates would be partially mitigated by the interest rate swap and cap contracts that we currently have in place associated with our vault cash balances in the U.S., Canada, the U.K., and Australia and other protective measures we have put in place to mitigate such risk.
Interest expense. Our interest expense is also sensitive to changes in interest rates as borrowings under our revolving credit facility accrue interest at floating rates.
As of December 31, 2019, our outstanding borrowings under our revolving credit facility, which carries a floating interest rate, were $167.2 million. To mitigate the interest rate risk associated with these borrowings, we have entered into interest rate swap contracts. These interest rate swaps have an aggregate notional amount of 50 million U.K. pounds sterling starting January 2, 2020 increasing to 100 million U.K. pounds sterling on January 4, 2021, terminating January 1, 2022.
Outstanding Interest Rate Derivatives Associated with Revolving Credit Facility Borrowings
Notional Amounts U.K. £ | Weighted Average Fixed Rate | Term | |||||
(In millions) | |||||||
£ | 50 | 0.95 | % | January 1, 2020 – December 31, 2020 | |||
£ | 100 | 0.64 | % | January 4, 2021 – December 31, 2021 | |||
Foreign Currency Exchange Rate Risk
As a result of our operations in the U.K., Ireland, Germany, Spain, Mexico, Canada, Australia, New Zealand, and South Africa, we are exposed to market risk from changes in foreign currency exchange rates. The functional currencies of our international subsidiaries are at their respective local currencies. The results of operations of our international subsidiaries are translated into U.S. dollars using average foreign currency exchange rates in effect during the periods in which those results are recorded and the assets and liabilities are translated using the foreign currency exchange rate in effect as of each balance sheet reporting date. These resulting translation adjustments to assets and liabilities have been reported in Accumulated other comprehensive loss, net
68
within the accompanying Consolidated Balance Sheets. As of December 31, 2019, this accumulated translation loss totaled $59.0 million compared to $66.3 million as of December 31, 2018.
Certain intercompany balances are designated as short-term in nature. The changes in these balances related to foreign currency exchange rates have been recorded in the accompanying Consolidated Statements of Operations and we are further exposed to foreign currency exchange rate risk as it relates to these intercompany balances.
We do not hold derivative commodity instruments and all of our cash and cash equivalents are held in money market or checking accounts.
Our consolidated financial results were significantly impacted by changes in foreign currency exchange rates during the year ended December 31, 2019 compared to the prior year. Our total revenues during the year ended December 31, 2019 would have been higher by $30.1 million had the foreign currency exchange rates from the year ended December 31, 2018 remained unchanged. A sensitivity analysis indicates that, if the U.S. dollar uniformly strengthened or weakened 10% against the British pound, Euro, Mexican peso, Canadian dollar, Australian dollar, or South African rand, the effect upon our operating income would have been approximately $4.5 million for the year ended December 31, 2019. During 2019, we entered into foreign currency window forward contracts to mitigate our exposure to changes in foreign currency exchange rates related to expected cash flows in currencies other than the U.S. dollar that are expected within the next twelve months. These foreign currency forward contracts were not designated as hedging instruments for accounting purposes.
As of December 31, 2019, we had a liability of $7.9 million recorded in the accompanying Consolidated Balance Sheets related to our foreign currency forward contracts, which represented the fair value liability of the contracts as derivative instruments are required to be carried at fair value. These foreign currency forward contracts are valued using pricing models based on significant other observable inputs (Level 2 inputs under the fair value hierarchy prescribed by U.S. GAAP).
The notional amount, weighted average fixed rate, and terms associated with our foreign currency window forward contracts in place (as of the date of the issuance of this 2019 Form 10-K) are as follows:
Outstanding Undesignated Foreign Currency Derivatives
Notional Amount U.S. $ | Weighted Average Fixed Rate U.S. $/U.K. £ | Settlement Dates | ||||
(In millions) | ||||||
$ | 150 | 1.267 | November 2, 2020 – December 1, 2020 | |||
69
ITEM 8. FINANCIAL STATEMENTS AND SUPPLEMENTARY DATA
INDEX
Page | |
70
Report of Independent Registered Public Accounting Firm
To the Shareholders and Board of Directors
Cardtronics plc:
Opinion on Internal Control Over Financial Reporting
We have audited Cardtronics plc and subsidiaries’ (the Company) internal control over financial reporting as of December 31, 2019, based on criteria established in Internal Control - Integrated Framework (2013) issued by the Committee of Sponsoring Organizations of the Treadway Commission. In our opinion, the Company maintained, in all material respects, effective internal control over financial reporting as of December 31, 2019, based on criteria established in Internal Control - Integrated Framework (2013) issued by the Committee of Sponsoring Organizations of the Treadway Commission.
We also have audited, in accordance with the standards of the Public Company Accounting Oversight Board (United States) (PCAOB), the consolidated balance sheets of the Company as of December 31, 2019 and 2018, the related consolidated statements of operations, comprehensive income (loss), shareholders’ equity, and cash flows for each of the years in the three-year period ended December 31, 2019, and the related notes (collectively, the consolidated financial statements), and our report dated March 2, 2020 expressed an unqualified opinion on those consolidated financial statements.
Basis for Opinion
The Company’s management is responsible for maintaining effective internal control over financial reporting and for its assessment of the effectiveness of internal control over financial reporting, included in the accompanying Management’s Annual Report on Internal Control over Financial Reporting. Our responsibility is to express an opinion on the Company’s internal control over financial reporting based on our audit. We are a public accounting firm registered with the PCAOB and are required to be independent with respect to the Company in accordance with the U.S. federal securities laws and the applicable rules and regulations of the Securities and Exchange Commission and the PCAOB.
We conducted our audit in accordance with the standards of the PCAOB. Those standards require that we plan and perform the audit to obtain reasonable assurance about whether effective internal control over financial reporting was maintained in all material respects. Our audit of internal control over financial reporting included obtaining an understanding of internal control over financial reporting, assessing the risk that a material weakness exists, and testing and evaluating the design and operating effectiveness of internal control based on the assessed risk. Our audit also included performing such other procedures as we considered necessary in the circumstances. We believe that our audit provides a reasonable basis for our opinion.
Definition and Limitations of Internal Control Over Financial Reporting
A company’s internal control over financial reporting is a process designed to provide reasonable assurance regarding the reliability of financial reporting and the preparation of financial statements for external purposes in accordance with generally accepted accounting principles. A company’s internal control over financial reporting includes those policies and procedures that (1) pertain to the maintenance of records that, in reasonable detail, accurately and fairly reflect the transactions and dispositions of the assets of the company; (2) provide reasonable assurance that transactions are recorded as necessary to permit preparation of financial statements in accordance with generally accepted accounting principles, and that receipts and expenditures of the company are being made only in accordance with authorizations of management and directors of the company; and (3) provide reasonable assurance regarding prevention or timely detection of unauthorized acquisition, use, or disposition of the company’s assets that could have a material effect on the financial statements.
Because of its inherent limitations, internal control over financial reporting may not prevent or detect misstatements. Also, projections of any evaluation of effectiveness to future periods are subject to the risk that controls may become inadequate because of changes in conditions, or that the degree of compliance with the policies or procedures may deteriorate.
/s/ KPMG LLP
Houston, Texas
March 2, 2020
71
Report of Independent Registered Public Accounting Firm
To the Shareholders and Board of Directors
Cardtronics plc:
Opinion on the Consolidated Financial Statements
We have audited the accompanying consolidated balance sheets of Cardtronics plc and subsidiaries (the Company) as of December 31, 2019 and 2018, the related consolidated statements of operations, comprehensive income (loss), shareholders’ equity, and cash flows for each of the years in the three‑year period ended December 31, 2019, and the related notes (collectively, the consolidated financial statements). In our opinion, the consolidated financial statements present fairly, in all material respects, the financial position of the Company as of December 31, 2019 and 2018, and the results of its operations and its cash flows for each of the years in the three‑year period ended December 31, 2019, in conformity with U.S. generally accepted accounting principles.
We also have audited, in accordance with the standards of the Public Company Accounting Oversight Board (United States) (PCAOB), the Company’s internal control over financial reporting as of December 31, 2019, based on criteria established in Internal Control - Integrated Framework (2013) issued by the Committee of Sponsoring Organizations of the Treadway Commission, and our report dated March 2, 2020 expressed an unqualified opinion on the effectiveness of the Company’s internal control over financial reporting.
Changes in Accounting Principle
As discussed in Notes 2 and 3 to the consolidated financial statements, the Company changed its method of accounting for leases in 2019 due to the adoption of Accounting Standards Codification Topic 842, Leases, and its method of accounting for revenue recognition in 2018 due to the adoption of Accounting Standards Codification Topic 606, Revenue from Contracts with Customers.
Basis for Opinion
These consolidated financial statements are the responsibility of the Company’s management. Our responsibility is to express an opinion on these consolidated financial statements based on our audits. We are a public accounting firm registered with the PCAOB and are required to be independent with respect to the Company in accordance with the U.S. federal securities laws and the applicable rules and regulations of the Securities and Exchange Commission and the PCAOB.
We conducted our audits in accordance with the standards of the PCAOB. Those standards require that we plan and perform the audit to obtain reasonable assurance about whether the consolidated financial statements are free of material misstatement, whether due to error or fraud. Our audits included performing procedures to assess the risks of material misstatement of the consolidated financial statements, whether due to error or fraud, and performing procedures that respond to those risks. Such procedures included examining, on a test basis, evidence regarding the amounts and disclosures in the consolidated financial statements. Our audits also included evaluating the accounting principles used and significant estimates made by management, as well as evaluating the overall presentation of the consolidated financial statements. We believe that our audits provide a reasonable basis for our opinion.
Critical Audit Matters
The critical audit matters communicated below are matters arising from the current period audit of the consolidated financial statements that were communicated or required to be communicated to the audit committee and that: (1) relate to accounts or disclosures that are material to the consolidated financial statements and (2) involved our especially challenging, subjective, or complex judgments. The communication of critical audit matters does not alter in any way our opinion on the consolidated financial statements, taken as a whole, and we are not, by communicating the critical audit matters below, providing separate opinions on the critical audit matters or on the accounts or disclosures to which they relate.
Evaluation of sufficiency of audit evidence over revenue
As discussed in Notes 1 and 3 to the consolidated financial statements, the Company had $1,349 million in revenues for the year ended December 31, 2019, of which $594 million was related to surcharge revenues, $356 million was related to interchange revenues, $202 million was related to bank-branding and surcharge-free network revenues, and $197 million was related to other revenue streams. The Company earns these revenues across the different countries where the Company has operations, and the Company’s processes for capturing the information for revenue recognition differs between these different revenue types.
72
We identified the evaluation of the sufficiency of audit evidence over revenue as a critical audit matter. Evaluating the sufficiency of audit evidence obtained required especially subjective auditor judgment because of the different revenue streams, the related revenue recognition processes, the number of information technology (IT) applications and the dependence on third-party service providers involved in the revenue recognition processes. This included determining the revenue streams over which the procedures were performed, the nature and extent of audit evidence obtained over each revenue stream, and the need to involve IT professionals to assist with the performance of certain procedures.
The primary procedures we performed to address this critical audit matter included the following. Based on our knowledge of the Company, we applied auditor judgment to determine the nature and extent of procedures to be performed over revenue, including the determination of the revenue streams over which those procedures were performed. For each revenue stream where procedures were performed, we:
•Tested certain internal controls over the Company’s revenue recognition process,
• | involved IT professionals with specialized skills and knowledge, who assisted in testing certain IT applications that are used by the Company in its revenue recognition process, and |
• | assessed the recorded revenue by selecting a sample of transactions and comparing the amounts recognized for consistency with the related contracts, processor statements or cash receipts. |
In addition, we evaluated the overall sufficiency of the audit evidence obtained over revenue.
Assessment of the carrying value of goodwill in one reporting unit
As discussed in Notes 1 and 8 to the consolidated financial statements, the Company performs goodwill impairment testing on an annual basis, or more frequently if there are indicators that suggest the fair value of a reporting unit may be below its carrying value. The goodwill balance as of December 31, 2019 was $752.6 million. During 2019, the Company performed a goodwill impairment test for each reporting unit using a qualitative approach, except for the Canada reporting unit, which was tested using the quantitative approach and subsequently recognized an impairment of $7.3 million for that reporting unit. After the impairment, the Canada reporting unit goodwill balance was $104.0 million at December 31, 2019.
We identified the assessment of the carrying value of goodwill for the Canada reporting unit as a critical audit matter. Significant auditor judgment was required to evaluate the Company’s impairment test, which was performed using a discounted cash flow model and corroborated through the use of a market approach. The discounted cash flow model included key assumptions related to financial forecasts, including operating efficiencies and resulting cash flows over time, and a discount rate. The market approach included a key assumption of market multiples. Minor changes to these key assumptions could have a significant effect on the assessment of the carrying value of the goodwill and the impairment recorded.
The primary procedures we performed to address this critical audit matter included the following. We tested certain internal controls over the Company’s goodwill impairment process, including controls related to the development of the key assumptions. We evaluated the Company’s financial forecasts, including the operating efficiencies and cash flows over time, by comparing these to internal supporting data. We compared the financial forecasts to the Company’s historical results to evaluate the assumptions used in the Company’s financial forecasts. We involved a valuation professional with specialized skills and knowledge, who assisted in:
•assessing the overall valuation methodology used by the Company in estimating the fair value of the reporting unit,
• | evaluating the Company’s discount rate, by comparing it against a discount rate range that was independently developed using publicly available third-party market data for comparable entities, |
• | developing an estimate of the reporting unit’s fair value using the reporting unit’s cash flow forecast and an independently developed discount rate, and compared the results of our estimate of fair value to the Company’s fair value estimate, and |
• | assessing the market multiple utilized in the Company’s market approach calculation by comparing it against the data for the comparable entities. |
/s/ KPMG LLP
We have served as the Company’s auditor since 2001.
Houston, Texas
March 2, 2020
73
CARDTRONICS PLC
CONSOLIDATED BALANCE SHEETS
(In thousands, excluding share and per share amounts)
The accompanying notes are an integral part of these consolidated financial statements.
December 31, 2019 | December 31, 2018 | ||||||
ASSETS | |||||||
Current assets: | |||||||
Cash and cash equivalents | $ | $ | |||||
Accounts and notes receivable, net of allowance for doubtful accounts of $5,251 and $3,005 as of December 31, 2019 and December 31, 2018, respectively | |||||||
Inventory, net | |||||||
Restricted cash | |||||||
Prepaid expenses, deferred costs, and other current assets | |||||||
Total current assets | |||||||
Property and equipment, net of accumulated depreciation of $525,933 and $417,151 as of December 31, 2019 and December 31, 2018, respectively | |||||||
Operating lease assets | — | ||||||
Intangible assets, net | |||||||
Goodwill | |||||||
Deferred tax asset, net | |||||||
Prepaid expenses, deferred costs, and other noncurrent assets | |||||||
Total assets | $ | $ | |||||
LIABILITIES AND SHAREHOLDERS’ EQUITY | |||||||
Current liabilities: | |||||||
Current portion of other long-term liabilities | $ | $ | |||||
Accounts payable | |||||||
Accrued liabilities | |||||||
Total current liabilities | |||||||
Long-term liabilities: | |||||||
Long-term debt | |||||||
Asset retirement obligations | |||||||
Deferred tax liability, net | |||||||
Operating lease liabilities | — | ||||||
Other long-term liabilities | |||||||
Total liabilities | |||||||
Commitments and contingencies (See Note 19) | |||||||
Shareholders' equity: | |||||||
Ordinary shares, $0.01 nominal value; 44,676,132 and 46,134,381 issued and outstanding as of December 31, 2019 and December 31, 2018, respectively | |||||||
Additional paid-in capital | |||||||
Accumulated other comprehensive loss, net | ( | ) | ( | ) | |||
Retained earnings | |||||||
Total parent shareholders' equity | |||||||
Noncontrolling interests | ( | ) | ( | ) | |||
Total shareholders’ equity | |||||||
Total liabilities and shareholders’ equity | $ | $ | |||||
74
CARDTRONICS PLC
CONSOLIDATED STATEMENTS OF OPERATIONS
(In thousands, excluding share and per share amounts)
Year Ended December 31, | |||||||||||
2019 | 2018 | 2017 | |||||||||
Revenues: | |||||||||||
ATM operating revenues | $ | $ | $ | ||||||||
ATM product sales and other revenues | |||||||||||
Total revenues | |||||||||||
Cost of revenues: | |||||||||||
Cost of ATM operating revenues (excludes depreciation, accretion, and amortization of intangible assets reported separately below. See Note 1(d)) | |||||||||||
Cost of ATM product sales and other revenues | |||||||||||
Total cost of revenues | |||||||||||
Operating expenses: | |||||||||||
Selling, general, and administrative expenses | |||||||||||
Redomicile-related expenses | |||||||||||
Restructuring expenses | |||||||||||
Acquisition related expenses | |||||||||||
Depreciation and accretion expense | |||||||||||
Amortization of intangible assets | |||||||||||
Loss on disposal and impairment of assets | |||||||||||
Total operating expenses | |||||||||||
Income (loss) from operations | ( | ) | |||||||||
Other expenses: | |||||||||||
Interest expense, net | |||||||||||
Amortization of deferred financing costs and note discount | |||||||||||
Redemption costs for early extinguishment of debt | |||||||||||
Other (income) expense | ( | ) | ( | ) | |||||||
Total other expenses | |||||||||||
Income (loss) before income taxes | ( | ) | |||||||||
Income tax expense (benefit) | ( | ) | |||||||||
Net income (loss) | ( | ) | |||||||||
Net loss attributable to noncontrolling interests | ( | ) | ( | ) | ( | ) | |||||
Net income (loss) attributable to controlling interests and available to common shareholders | $ | $ | $ | ( | ) | ||||||
Net income (loss) per common share – basic | $ | $ | $ | ( | ) | ||||||
Net income (loss) per common share – diluted | $ | $ | $ | ( | ) | ||||||
Weighted average shares outstanding – basic | |||||||||||
Weighted average shares outstanding – diluted | |||||||||||
The accompanying notes are an integral part of these consolidated financial statements.
75
CARDTRONICS PLC
CONSOLIDATED STATEMENTS OF COMPREHENSIVE INCOME (LOSS)
(In thousands)
Year Ended December 31, | |||||||||||
2019 | 2018 | 2017 | |||||||||
Net income (loss) | $ | $ | $ | ( | ) | ||||||
Unrealized (loss) gain on interest rate swap and cap contracts, net of deferred income tax (benefit) expense of ($4,839), $2,795, and $7,050 for the years ended December 31, 2019, 2018, and 2017, respectively. | ( | ) | |||||||||
Foreign currency translation adjustments, net of deferred income tax (benefit) expense of ($242), $107, and ($1,226) for the years ended December 31, 2019, 2018, and 2017 respectively. | ( | ) | |||||||||
Other comprehensive (loss) income | ( | ) | ( | ) | |||||||
Total comprehensive income (loss) | ( | ) | ( | ) | |||||||
Less: Comprehensive loss attributable to noncontrolling interests | ( | ) | ( | ) | |||||||
Comprehensive income (loss) attributable to controlling interests | $ | $ | ( | ) | $ | ( | ) | ||||
The accompanying notes are an integral part of these consolidated financial statements.
76
CARDTRONICS PLC
CONSOLIDATED STATEMENTS OF SHAREHOLDERS’ EQUITY
(In thousands)
The accompanying notes are an integral part of these consolidated financial statements.
Common Shares | Additional Paid-In Capital | Accumulated Other Comprehensive Loss, Net | Retained Earnings | Noncontrolling Interests | ||||||||||||||||||||||
Shares | Amount | Total | ||||||||||||||||||||||||
Balance as of January 1, 2017 | $ | $ | $ | ( | ) | $ | $ | ( | ) | $ | ||||||||||||||||
Issuance of common shares for share-based compensation, net of forfeitures | — | — | — | |||||||||||||||||||||||
Share-based compensation expense | — | — | — | — | — | |||||||||||||||||||||
Tax payments related to share-based compensation | — | — | ( | ) | — | — | — | ( | ) | |||||||||||||||||
Unrealized gain (loss) on interest rate swap and foreign currency forward contracts, net of deferred income tax expense of $7,050 | — | — | — | ( | ) | — | ||||||||||||||||||||
Net loss attributable to controlling interests | — | — | — | — | ( | ) | — | ( | ) | |||||||||||||||||
Net loss attributable to noncontrolling interests | — | — | — | — | — | ( | ) | ( | ) | |||||||||||||||||
Foreign currency translation adjustments, net of deferred income tax benefit of $1,226 | — | — | — | — | ||||||||||||||||||||||
Balance as of December 31, 2017 | $ | $ | $ | ( | ) | $ | $ | ( | ) | $ | ||||||||||||||||
Cumulative effect of change in accounting principle | — | — | — | — | — | |||||||||||||||||||||
Issuance of common shares for share-based compensation, net of forfeitures | — | — | — | — | ||||||||||||||||||||||
Share-based compensation expense | — | — | — | — | — | |||||||||||||||||||||
Tax payments related to share-based compensation | — | — | ( | ) | — | — | — | ( | ) | |||||||||||||||||
Unrealized gain on interest rate swap and cap contracts, net of deferred income tax expense of $2,795 | — | — | — | — | — | |||||||||||||||||||||
Net income attributable to controlling interests | — | — | — | — | — | |||||||||||||||||||||
Net loss attributable to noncontrolling interests | — | — | — | — | — | ( | ) | ( | ) | |||||||||||||||||
Foreign currency translation adjustments, net of deferred income tax expense of $107 | — | — | — | ( | ) | — | ( | ) | ||||||||||||||||||
Balance as of December 31, 2018 | $ | $ | $ | ( | ) | $ | $ | ( | ) | $ | ||||||||||||||||
Cumulative effect of change in accounting principle | — | — | — | ( | ) | — | ||||||||||||||||||||
Issuance of common shares for share-based compensation, net of forfeitures | — | — | — | — | ||||||||||||||||||||||
Repurchase of common shares | ( | ) | ( | ) | ( | ) | — | ( | ) | — | ( | ) | ||||||||||||||
Share-based compensation expense | — | — | — | — | — | |||||||||||||||||||||
Tax payments related to share-based compensation | — | — | ( | ) | — | — | — | ( | ) | |||||||||||||||||
Unrealized loss on interest rate swap and foreign currency forward contracts, net of deferred income tax benefit of $4,839 | — | — | — | ( | ) | — | ( | ) | ||||||||||||||||||
Net income attributable to controlling interests | — | — | — | — | — | |||||||||||||||||||||
Net loss attributable to noncontrolling interests | — | — | — | — | — | ( | ) | ( | ) | |||||||||||||||||
Foreign currency translation adjustments, net of deferred income tax benefit of $242 | — | — | — | — | ||||||||||||||||||||||
Balance as of December 31, 2019 | $ | $ | $ | ( | ) | $ | $ | ( | ) | $ | ||||||||||||||||
77
CARDTRONICS PLC
CONSOLIDATED STATEMENTS OF CASH FLOWS
(In thousands)
Year Ended December 31, | |||||||||||
2019 | 2018 | 2017 | |||||||||
Cash flows from operating activities: | |||||||||||
Net income (loss) | $ | $ | $ | ( | ) | ||||||
Adjustments to reconcile net income (loss) to net cash provided by operating activities: | |||||||||||
Depreciation, accretion, and amortization of intangible assets | |||||||||||
Amortization of deferred financing costs and note discount | |||||||||||
Share-based compensation expense | |||||||||||
Deferred income tax expense (benefit) | ( | ) | ( | ) | |||||||
Loss on disposal and impairment of assets | |||||||||||
Other reserves and non-cash items | ( | ) | |||||||||
Redemption cost for early extinguishment of debt | |||||||||||
Changes in assets and liabilities: | |||||||||||
(Increase) decrease in accounts and notes receivable, net | ( | ) | |||||||||
(Increase) decrease in prepaid expenses, deferred costs, and other current assets | ( | ) | ( | ) | |||||||
(Increase) in inventory, net | ( | ) | ( | ) | ( | ) | |||||
Decrease (increase) in other assets | ( | ) | |||||||||
Increase (decrease) in accounts payable | ( | ) | ( | ) | |||||||
(Decrease) increase in restricted cash liabilities | ( | ) | |||||||||
Increase (decrease) in accrued liabilities | ( | ) | ( | ) | |||||||
(Decrease) increase in other liabilities | ( | ) | ( | ) | |||||||
Net cash provided by operating activities | |||||||||||
Cash flows from investing activities: | |||||||||||
Additions to property and equipment | ( | ) | ( | ) | ( | ) | |||||
Acquisitions, net of cash acquired | ( | ) | ( | ) | ( | ) | |||||
Net cash used in investing activities | ( | ) | ( | ) | ( | ) | |||||
Cash flows from financing activities: | |||||||||||
Proceeds from borrowings under revolving credit facility | |||||||||||
Repayments of borrowings under revolving credit facility | ( | ) | ( | ) | ( | ) | |||||
Proceeds from borrowings of long-term debt | |||||||||||
Redemption of long-term notes | ( | ) | |||||||||
Debt issuance, modification, and redemption costs | ( | ) | ( | ) | ( | ) | |||||
Tax payments related to share-based compensation | ( | ) | ( | ) | ( | ) | |||||
Proceeds from exercises of stock options | |||||||||||
Repurchase of common shares | ( | ) | |||||||||
Net cash (used in) provided by financing activities | ( | ) | ( | ) | |||||||
Effect of exchange rate changes on cash, cash equivalents, and restricted cash | ( | ) | |||||||||
Net (decrease) increase in cash, cash equivalents, and restricted cash | ( | ) | ( | ) | |||||||
Cash, cash equivalents, and restricted cash as of beginning of period | |||||||||||
Cash, cash equivalents, and restricted cash as of end of period | $ | $ | $ | ||||||||
Supplemental disclosure of cash flow information: | |||||||||||
Cash paid for interest | $ | $ | $ | ||||||||
Cash paid for income taxes | $ | $ | $ | ||||||||
The accompanying notes are an integral part of these consolidated financial statements.
78
CARDTRONICS PLC
NOTES TO CONSOLIDATED FINANCIAL STATEMENTS
(1) Basis of Presentation and Summary of Significant Accounting Policies
(a) Description of Business
Cardtronics plc, together with its wholly and majority-owned subsidiaries (collectively, the “Company”), provides convenient automated financial related services to consumers through its global network of automated teller machines and multi-function financial services kiosks (collectively referred to as “ATMs”). As of December 31, 2019, Cardtronics was the world’s largest ATM owner/operator, providing services to approximately 285,000 ATMs globally, approximately 26 % of which are Company- owned. Company-owned ATMs account for approximately 87 % of our total ATM operating revenues.
During 2019, approximately 64 % of the Company’s revenues were derived from operations in North America (including its ATM operations in the U.S., Canada, and Mexico), approximately 29 % of the Company’s revenues were derived from operations in Europe and Africa (including its ATM operations in the U.K., Ireland, Germany, Spain, and South Africa), and approximately 7 % of the Company’s revenues were derived from the Company’s operations in Australia and New Zealand. As of December 31, 2019, the Company provided processing only services or various forms of managed services solutions to approximately 198,000 ATMs. Under a managed services arrangement, retailers, financial institutions, and ATM distributors rely on Cardtronics to handle some or all of the operational aspects associated with operating and maintaining ATMs, typically in exchange for a monthly service fee, fee per transaction, fee per service provided, or a combination of these fees.
Through its network, the Company delivers financial related services to cardholders and provides ATM management and ATM equipment-related services (typically under multi-year contracts) to large retail merchants, smaller retailers, and operators of facilities such as shopping malls, airports, train stations, and casinos. In doing so, the Company provides its retail partners with a compelling automated solution that helps attract and retain customers, and in turn, increases the likelihood that the ATMs placed at their facilities will be utilized. The Company also partners with financial institutions to enable convenient and fee-free access to its ATMs via surcharge-free and managed service solutions. The Company also owns and operates electronic funds transfer (“EFT”) transaction processing platforms that provide transaction processing services to its network of ATMs, as well as to other ATMs under managed services arrangements. Finally, the Company provides processing services for issuers of debit cards.
In addition to its retail merchant relationships, the Company also partners with leading financial institutions to brand selected ATMs within its network. These financial institutions include BBVA Compass Bancshares, Inc. (“BBVA”), Citibank, N.A. (“Citibank”), Citizens Financial Group, Inc. (“Citizens”), Cullen/Frost Bankers, Inc. (“Cullen/Frost”), Discover Bank (“Discover”), PNC Bank, N.A. (“PNC Bank”), Santander Bank, N.A. (“Santander”), TD Bank, N.A. (“TD Bank”), United Services Automobile Association ("USAA") in the U.S.; BMO Bank of Montreal (“BMO”), the Bank of Nova Scotia (“Scotiabank”), Canadian Imperial Bank Commerce (“CIBC”), and TD Bank in Canada; the Bank of Queensland Limited (“BOQ”) and HSBC Holdings plc (“HSBC”) in Australia; and Capitec Bank ("Capitec"), Mercantile Bank ("Mercantile") and Old Mutual ("Old Mutual") in South Africa. In Mexico, the Company partners with Scotiabank and Banco Multiva by putting their brands on our ATMs in exchange for certain services provided by them. As of December 31, 2019, approximately 21,000 of the Company’s ATMs were under contract with approximately 500 financial institutions to place their logos on the ATMs and to provide convenient surcharge-free access for their banking customers. The Company also provides managed services offerings for financial institutions, which generally include full outsourcing of a portion or all of the financial institution's ATMs.
The Company owns and operates the Allpoint network (“Allpoint”), the largest surcharge-free ATM network (based on the number of participating ATMs). Allpoint, which has approximately 58,000 participating ATMs, provides surcharge-free ATM access to over 1,200 participating banks, credit unions, digital banks, financial technology companies and stored-value debit card issuers. For participants, Allpoint provides scale, density, and convenience of surcharge-free ATMs that surpasses the largest banks in the U.S. Allpoint earns a fixed monthly fee per cardholder and/or a fixed fee per transaction that is paid by the participants. Allpoint includes a majority of the Company’s ATMs in the U.S. and certain ATMs in the U.K., Canada, Mexico, and Australia. Allpoint also provides services to organizations that manage stored-value debit card programs on behalf of corporate entities and governmental agencies, including general purpose, payroll, and electronic benefits transfer cards. Under these programs, the issuing organizations pay Allpoint a fee per issued stored-value debit card or per transaction in return for allowing the users of those cards surcharge-free access to Allpoint’s participating ATM network.
The Company’s revenues are generally recurring in nature, and historically have been derived largely from convenience transaction fees, which are paid by cardholders, as well as other transaction-based fees, including interchange fees, which are paid by the cardholder’s financial institution, or card issuer for the use of the ATMs serving their customers and connectivity to the applicable EFT network that transmits data between the ATM and the cardholder’s financial institution. Other revenue sources
79
include: (i) fees from financial institutions that participate in Allpoint, (ii) fees for bank-branding ATMs and providing financial institution cardholders with surcharge-free access, (iii) revenues earned by providing managed services (including transaction processing services) solutions to retailers and financial institutions, (iv) fees earned from foreign currency exchange transactions at the ATM, known as dynamic currency conversion (“DCC”), and (v) revenues from the sale of ATMs and ATM-related equipment and other ancillary services.
(b) Basis of Presentation and Consolidation
The consolidated financial statements include the accounts of the Company. All material intercompany accounts and transactions have been eliminated in consolidation. The Company owns a majority (95.7 %) interest in, and realizes a majority of the earnings and/or losses of Cardtronics Mexico S.A de C.V., thus this entity is reflected as a consolidated subsidiary in the financial statements, with the remaining ownership interests not held by the Company being reflected as noncontrolling interests.
In management’s opinion, all normal recurring adjustments necessary for a fair presentation of the Company’s current and prior period results have been made.
(c) Use of Estimates in the Preparation of the Consolidated Financial Statements
The preparation of the consolidated financial statements in conformity with accounting principles generally accepted in the United States (“U.S. GAAP”) requires management to make estimates and assumptions that affect the reported amounts of assets and liabilities and disclosure of contingent assets and liabilities at the date of this Annual Report on Form 10-K for the year ended December 31, 2019 (the “2019 Form 10-K”) and the reported amounts of revenues and expenses during the reporting period. Significant items subject to such estimates include the carrying amount of intangibles, goodwill, asset retirement obligations (“ARO”), acquisition-related contingent consideration contingencies, and valuation allowances for receivables, inventories, and deferred income tax assets. Additionally, the Company is required to make estimates and assumptions related to the valuation of its derivative instruments and share-based compensation. Actual results could differ from those estimates and these differences could be material to the consolidated financial statements.
(d) Cost of ATM Operating Revenues Presentation
The Company presents the Cost of ATM operating revenues in the accompanying Consolidated Statements of Operations exclusive of depreciation, accretion, and amortization of intangible assets related to ATMs and ATM-related assets.
The following table reflects the amounts excluded from the Cost of ATM operating revenues line in the accompanying Consolidated Statements of Operations for the periods presented:
Year Ended December 31, | |||||||||||
2019 | 2018 | 2017 | |||||||||
(In thousands) | |||||||||||
Depreciation and accretion expenses related to ATMs and ATM-related assets | $ | $ | $ | ||||||||
Amortization of intangible assets | |||||||||||
Total depreciation, accretion, and amortization of intangible assets excluded from Cost of ATM operating revenues | $ | $ | $ | ||||||||
(e) Restructuring Expenses
80
The following tables reflect the amounts recorded in the Restructuring expenses line in the accompanying Consolidated Statements of Operations for the periods presented:
Year Ended December 31, | |||||||||||
2019 | 2018 | 2017 | |||||||||
(In thousands) | |||||||||||
North America | $ | $ | $ | ||||||||
Europe & Africa | |||||||||||
Corporate | |||||||||||
Total restructuring expenses | $ | $ | $ | ||||||||
Year Ended December 31, | |||||||||||
2019 | 2018 | 2017 | |||||||||
(In thousands) | |||||||||||
Severance and benefits | $ | $ | $ | ||||||||
Facilities closures | |||||||||||
Professional fees and other costs | |||||||||||
Total restructuring expenses | $ | $ | $ | ||||||||
The following tables reflect the unpaid restructuring costs presented within the Accrued liabilities and Other long-term liabilities lines in the accompanying Consolidated Balance Sheets.
As of December 31, 2019 | |||||||||||||||
North America | Europe & Africa | Corporate | Total | ||||||||||||
(In thousands) | |||||||||||||||
Accrued liabilities | $ | $ | $ | $ | |||||||||||
Total restructuring liabilities | $ | $ | $ | $ | |||||||||||
As of December 31, 2018 | |||||||||||||||
North America | Europe & Africa | Corporate | Total | ||||||||||||
(In thousands) | |||||||||||||||
Accrued liabilities | $ | $ | $ | $ | |||||||||||
Other long-term liabilities | |||||||||||||||
Total restructuring liabilities | $ | $ | $ | $ | |||||||||||
81
The changes in the Company’s restructuring liabilities consisted of the following:
Total Restructuring Liabilities | |||
(In thousands) | |||
Restructuring liabilities as of December 31, 2016 | $ | ||
Restructuring expenses | |||
Payments | ( | ) | |
Restructuring liabilities as of December 31, 2017 | |||
Restructuring expenses | |||
Payments | ( | ) | |
Restructuring liabilities as of December 31, 2018 | |||
Restructuring expenses | |||
Payments | ( | ) | |
Other (1) | ( | ) | |
Restructuring liabilities as of December 31, 2019 | $ | ||
(1) Includes $0.9 million of non-cash asset write-offs and $1.1 million of accelerated lease costs classified as a reduction of the associated operating lease assets. The remaining lease liabilities are classified within current and long-term operating lease liabilities.
(f) Cash, Cash Equivalents, and Restricted Cash
For purposes of reporting financial condition, cash and cash equivalents include cash in bank and short-term deposit accounts. Additionally, the Company maintains cash on deposit with banks that is pledged for a particular use or restricted to support a liability. These balances are classified as Restricted cash in the Current assets or Noncurrent assets lines in the accompanying Consolidated Balance Sheets based on when the Company expects this cash to be paid. Current restricted cash largely consists of amounts collected on behalf of, but not yet remitted to, certain of the Company’s merchant customers or third-party service providers. No noncurrent restricted cash was held as of December 31, 2019 and 2018 and the balance of noncurrent restricted cash as of December 31, 2017 was not material.
The following table provides a reconciliation of the ending cash, cash equivalents, and restricted cash balances as of December 31, 2019, 2018, and 2017, corresponding with the balances reflected on our Consolidated Statements of Cash Flows.
December 31, | |||||||||||
2019 | 2018 | 2017 | |||||||||
(In thousands) | |||||||||||
Cash and cash equivalents | $ | $ | $ | ||||||||
Current and long-term restricted cash | |||||||||||
Total cash, cash equivalents, and restricted cash in the Consolidated Statements of Cash Flows | $ | $ | $ | ||||||||
(g) ATM Cash Management Program
The Company relies on arrangements with various banks to provide the cash that it uses to fill its Company-owned, and in some cases merchant-owned and managed services ATMs. The Company refers to such cash as “vault cash”. The Company pays a monthly fee based on the average outstanding vault cash balance, as well as fees related to the bundling and preparation of such cash prior to it being loaded in the ATMs. At all times, beneficial ownership of the cash is retained by the vault cash providers and the Company has no right or access to the cash except for the ATMs that are serviced by the Company’s wholly-owned armored courier operations in the U.K. While the U.K. armored courier operations have physical access to the cash loaded in the ATMs, beneficial ownership of that cash remains with the vault cash provider at all times. The Company’s vault cash arrangements expire at various times through June 2023. Based on the foregoing, the ATM vault cash, and the related obligations, are not reflected in
82
(h) Accounts Receivable, net of Allowance for Doubtful Accounts
Accounts receivable are comprised of amounts due from the Company’s clearing and settlement banks for transaction revenues earned on transactions processed during the month ending on the balance sheet date, as well as receivables from bank-branding and network-branding customers, and for ATMs and ATM-related equipment sales and service. Trade accounts receivable are recorded at the invoiced amount and do not bear interest. The allowance for doubtful accounts represents the Company’s best estimate of the amount of probable credit losses on the Company’s existing accounts receivable. The Company reviews its allowance for doubtful accounts monthly and determines the allowance based on an analysis of its past due accounts. All balances over 90 days past due are reviewed individually for collectability. Account balances are charged off against the allowance after all means of collection have been exhausted and the potential for recovery is considered remote.
(i) Inventory, net
The Company’s inventory is determined using the average cost method. The Company periodically assesses its inventory, and as necessary, adjusts the carrying values to the lower of cost or net realizable value.
The following table reflects the Company’s primary inventory components:
December 31, 2019 | December 31, 2018 | ||||||
(In thousands) | |||||||
ATMs | $ | $ | |||||
ATM spare parts and supplies | |||||||
Total inventory | |||||||
Less: Inventory reserves | ( | ) | ( | ) | |||
Inventory, net | $ | $ | |||||
(j) Property and Equipment, net
Property and equipment are stated at cost and depreciation is calculated using the straight-line method over estimated useful lives ranging from three to ten years . Most new ATMs are depreciated over eight years and most refurbished ATMs and installation-related costs are depreciated over five years , all on a straight-line basis. Leasehold improvements and assets subject to capital leases are depreciated over the useful life of the asset or the lease term, whichever is shorter. As of December 31, 2019, our capital leases were insignificant.
Also reported in property and equipment are ATMs and the associated equipment the Company has acquired for future installation or has temporarily removed from service and plans to re-deploy. Significant refurbishment costs that extend the useful life of an asset, or enhance its functionality, are capitalized and depreciated over the estimated remaining life of the improved asset. Property and equipment are reviewed for impairment at least annually and additionally whenever events or changes in circumstances indicate that the carrying amount of such assets may not be recoverable.
In most of the Company’s markets, maintenance services on ATMs are generally performed by third-party service providers and are generally incurred as a fixed fee per month per ATM. In the U.K., Australia, Canada, and South Africa, maintenance services are, to differing degrees, performed by in-house technicians as well. In all cases, maintenance costs are expensed as incurred.
Included within property and equipment are also costs associated with internally-developed technology assets and implementation costs associated with the Company's new ERP. The Company capitalizes certain internal and external costs associated with developing new or enhanced products and technology that are expected to benefit multiple future periods through enhanced revenues and/or cost savings and efficiencies. Internally developed projects are placed into service and depreciation is commenced once available for use. These projects are generally depreciated on a straight-line basis over estimated useful lives of three to nine years .
83
Depreciation expense for the years ended December 31, 2019, 2018, and 2017 was $129.1 million, $124.3 million, and $120.2 million, respectively.
(k) Intangible Assets Other Than Goodwill
The Company’s intangible assets include merchant and bank-branding contracts/relationships acquired in connection with business acquisitions and asset acquisitions of ATMs and ATM-related assets (i.e., the right to receive future cash flows related to transactions occurring at these ATM locations). They also include exclusive license agreements and site acquisition costs (i.e., the right to be the exclusive ATM provider, at specific ATM locations), trade names, technology, non-compete agreements, and deferred financing costs relating to the Company’s revolving credit facility.
The estimated fair value of the merchant and bank-branding contracts/relationships within each acquired portfolio is determined based on the estimated net cash flows and useful lives of the underlying merchant or bank-branding contracts/relationships, including expected renewals. The contracts/relationships comprising each acquired portfolio are typically fairly similar in nature with respect to the underlying contractual terms and conditions. Accordingly, the Company generally pools such acquired contracts/relationships into a single intangible asset, by acquired portfolio, for purposes of computing the related amortization expense. The Company amortizes such intangible assets on a straight-line basis over the estimated useful lives of the portfolios to which the assets relate. Because the net cash flows associated with the Company’s acquired merchant and bank-branding contracts/relationships have generally increased subsequent to the acquisition date, the use of a straight-line method of amortization effectively results in an accelerated amortization schedule. The estimated useful life of each portfolio is determined based on the weighted average lives of the expected cash flows associated with the underlying contracts/relationships comprising the portfolio and takes into consideration expected renewal rates and the terms and significance of the underlying contracts/relationships themselves. Costs incurred by the Company to renew or extend the term of an existing contract/relationship are expensed as incurred, except for any direct payments made to the merchants, which are set up as new intangible assets (exclusive license agreements). Certain acquired merchant and bank-branding contracts/relationships may have unique attributes, such as significant contractual terms or value, and in such cases, the Company will separately account for these contracts/relationships in order to better assess the value and estimated useful lives of the underlying contracts/relationships.
The Company tests its acquired merchant and bank-branding contract/relationship assets for impairment, on an individual contract/relationship basis for the Company’s significant contracts/relationships, and on a portfolio basis for all other acquired contracts/relationships. If, subsequent to the acquisition date, circumstances indicate that a shorter estimated useful life is warranted for an acquired portfolio or an individual contract/relationship as a result of changes in the expected future cash flows, then the individual contract/relationship or portfolio’s remaining estimated useful life and related amortization expense are adjusted accordingly on a prospective basis.
(l) Goodwill
Included within the Company’s assets are goodwill balances that have been recognized in conjunction with its purchase accounting for completed business combinations. Under U.S. GAAP, goodwill is not amortized but is evaluated periodically for impairment. The Company performs this evaluation annually as of December 31, or more frequently if there are indicators that suggest the fair value of a reporting unit may be below its carrying value. It is the Company's practice to initially assess qualitative factors to determine whether it is necessary to perform a quantitative goodwill impairment. The qualitative and, if necessary, quantitative evaluations are performed at a reporting unit level, which has been determined based on several factors, including (i) whether or not the group has any recorded goodwill, (ii) the availability of discrete financial information, and (iii) how business unit performance is measured and reported. The Company has identified seven separate reporting units for its goodwill assessments: (i) the U.S. operations, (ii) the U.K. operations, (iii) the Australia & New Zealand operations, (iv) the Canada operations, (v) the South African operations, (vi) the Germany operations, and (vii) the Mexico operations. There was no goodwill associated with Spain or Ireland operations as of December 31, 2019.
84
Based on a qualitative assessment, if it is more likely than not that the fair value of a reporting unit is less than its carrying value, the Company performs a quantitative goodwill impairment analysis. The Company may also elect to bypass the qualitative analysis and perform a quantitative evaluation. Using the simplified goodwill impairment test adopted December 31, 2019, the Company compares the fair value of a reporting unit with its carrying amount and, if applicable, records an impairment in the amount by which the carrying amount exceeds the fair value.
When estimating the fair value of a reporting unit in a quantitative goodwill impairment test, the Company uses a combination of income and market approaches that incorporate both management’s views and those of the market. The Company prepares a discounted cash flow model to estimate the fair value and corroborates the resulting values with a market approach that applies a market multiple to normalized EBITDA, and also factors in an estimated control premium. In the event of an impairment, the Company has historically utilized the fair value derived from a pure discounted cash flow model as the basis for a recognized impairment loss.
For the goodwill impairment evaluation as of December 31, 2019, the Company elected to perform the optional qualitative assessment allowed under the applicable guidance to determine if it was necessary to perform a quantitative assessment for any reporting unit. Based on the results of the qualitative assessment, the Company determined that it was not more likely than not that the carrying value of its U.S., U.K., Australia & New Zealand, South Africa, Germany and Mexico reporting units exceeded their fair value. As such, the Company determined that a quantitative assessment was not necessary for these reporting units. The Company did, however, identify impairment indicators associated with the Canada reporting unit, which required the Company to complete a quantitative impairment assessment.
The primary indicator of impairment for the Canada reporting unit was its performance relative to the forecast referenced in the Company's previous quantitative test, performed as of December 31, 2017. For the quantitative assessment prepared as of December 31, 2019, the Company prepared a 5-year cash flow forecast, which incorporated assumptions on operating efficiencies and increased resulting cash flows over time and a discount rate of 10%. Based on this estimation, the carrying value of the reporting unit exceeded its fair value by $7.3 million. Therefore, consistent with our U.S. GAAP treatment following the early adoption of ASU 2017-4, the Company recognized a goodwill impairment of $7.3 million, the amount by which the carrying amount of the Canada reporting unit exceeded its fair value. This impairment is recognized in the Loss on disposal and impairment of assets line in the accompanying Consolidated Statements of Operations together with certain unrelated disposals in the ordinary course of business. After the impairment, the Canada reporting unit's goodwill was approximately $104 million at December 31, 2019. To the extent that the Company is unable to achieve the operating efficiencies and improved cash flows in the future, further impairment charges are possible.
The Company also recognized goodwill and intangible asset impairments in 2017. In 2017, responsive to impairment indicators, the Company completed a goodwill impairment analysis for its Australia & New Zealand reporting unit concluding that the implied fair value of the goodwill associated with this reporting unit was below its carrying value. Accordingly, the Company recorded a goodwill impairment charge of $140.0 million. These impacts are recognized in the Loss on disposal and impairment of assets line in the accompanying Consolidated Statements of Operations.
All of the assumptions utilized in performing qualitative and quantitative assessments of reporting unit fair value are inherently uncertain and require significant judgment on the part of the Company.
(m) Income Taxes
Provisions for income taxes are based on taxes payable or refundable for the current year and deferred taxes, which are based on temporary differences between the amount of taxable income and income before provision for income taxes and between the tax basis of assets and liabilities and their reported amounts in the consolidated financial statements. Deferred tax assets and liabilities are reported in the consolidated financial statements at current income tax rates. As changes in tax laws or rates are enacted, deferred tax assets and liabilities are adjusted through the provision for income taxes. In assessing the realizability of deferred tax assets, the Company considers whether it is more likely than not that some portion or all of the deferred tax assets will not be realized. As the ultimate realization of deferred tax assets is dependent on the generation of future taxable income during the periods in which those temporary differences become deductible, the Company considers the scheduled reversal of deferred tax liabilities, projected future taxable income, and tax planning strategies in making this assessment. In the event the Company does not believe it is more likely than not that it will be able to utilize the related tax benefits associated with deferred tax assets, valuation allowances will be recorded to reserve for the assets, see Note 20. Income Taxes.
85
(n) Asset Retirement Obligations (“ARO”)
The Company estimates the fair value of future ARO costs associated with the costs to deinstall its ATMs, and in some cases, restore the ATM sites to their original condition, and recognizes this amount as a liability on a pooled basis based on the estimated deinstallation dates in the period in which it is incurred and can be reasonably estimated. The Company’s fair value estimates of liabilities for ARO’s generally involve discounted future cash flows. The Company capitalizes the initial estimated fair value amount of the ARO asset and depreciates the ARO over the asset’s estimated useful life. Subsequent to recognizing the initial liability, the Company recognizes an ongoing expense for changes in such liabilities due to the passage of time (i.e., accretion expense), which is recorded in the Depreciation and accretion expense line in the accompanying Consolidated Statements of Operations. As the liability is not revalued on a recurring basis, it is periodically reviewed for reasonableness based on current machine count and updated cost estimates to deinstall ATMs. Upon settlement of the liability, the Company recognizes a gain or loss for any difference between the settlement amount and the liability recorded. For additional information related to the Company’s AROs, see Note 12. Asset Retirement Obligations.
(o) Share-Based Compensation
The Company calculates the fair value of share-based awards to its Board of Directors (the “Board”) and employees on the date of grant and recognizes the calculated fair value, net of estimated forfeitures, as share-based compensation expense over the underlying requisite service periods of the related awards. For additional information related to the Company’s share-based compensation, see Note 4. Share-Based Compensation.
(p) Derivative Financial Instruments
The Company utilizes derivative financial instruments to hedge its exposure to changing interest rates related to the Company’s ATM cash management activities, its exposure to changing interest rates on its revolving credit facility and, on a limited basis, the Company’s exposure to foreign currency transactions. The Company does not enter into derivative transactions for speculative or trading purposes, although circumstances may subsequently change the designation of its derivatives to economic hedges.
The Company records derivative instruments at fair value in the accompanying Consolidated Balance Sheets. These derivatives, which consist of interest rate swap, interest rate caps and foreign currency forward contracts, are valued using pricing models based on significant other observable inputs (Level 2 inputs under the fair value hierarchy prescribed by U.S. GAAP), while taking into account the creditworthiness of the party that is in the liability position with respect to each trade. The majority of the Company’s derivative instruments have been accounted for as cash flow hedges, and accordingly, changes in the fair values of such derivatives have been reported in the Accumulated other comprehensive loss, net line in the accompanying Consolidated Balance Sheets. For additional information related to the Company’s derivative financial instruments, see Note 16. Derivative Financial Instruments.
In connection with the issuance of the $287.5 million of 1.00 % Convertible Senior Notes due December 2020 (the “Convertible Notes”), the Company entered into separate convertible note hedge and warrant transactions with certain of the initial purchasers to reduce the potential dilutive impact upon the conversion of the Convertible Notes. For additional information related to the Company’s convertible note hedges and warrant transactions, see Note 11. Debt.
(q) Fair Value of Financial Instruments
The fair value of a financial instrument is the amount at which the instrument could be exchanged in a current transaction between willing parties, other than in a forced or liquidation sale. U.S. GAAP does not require the disclosure of the fair value of lease financing arrangements and non-financial instruments, including intangible assets such as goodwill and the Company’s merchant and bank-branding contracts/relationships. For additional information related to the Company’s fair value evaluation of its financial instruments, see Note 18. Fair Value Measurements.
(r) Foreign Currency Exchange Rate Translation
The Company is exposed to foreign currency exchange rate risk with respect to its international operations. The functional currencies of these international subsidiaries are their respective local currencies. The results of operations of the Company’s international subsidiaries are translated into U.S. dollars using average foreign currency exchange rates in effect during the periods in which those results are recorded and the assets and liabilities are translated using the foreign currency exchange rate in effect as of each balance sheet reporting date. These resulting translation adjustments have been recorded in the Accumulated other comprehensive loss, net line in the accompanying Consolidated Balance Sheets.
86
The Company currently believes that the unremitted earnings of certain of its subsidiaries will be reinvested in the corresponding country of origin for an indefinite period of time. Accordingly, no deferred taxes have been provided for the differences between the Company’s book basis and underlying tax basis in those subsidiaries or on the foreign currency translation adjustment amounts.
(s) Advertising Costs
Advertising costs are expensed as incurred and totaled $4.2 million, $4.2 million and $5.0 million during the years ended December 31, 2019, 2018, and 2017, respectively, and are reported in the Selling, general, and administrative expenses line in the accompanying Consolidated Statements of Operations.
(t) Working Capital Deficit
The Company’s surcharge and interchange revenues are typically collected in cash on a daily basis or within a short period of time subsequent to the end of each month. However, the Company typically pays its vendors on 30 day terms and is not required to pay certain of its merchants until 20 days after the end of each calendar month. As a result, the Company will typically utilize the excess available cash flow to reduce borrowings made under the Company’s revolving credit facility reported as long term debt in the accompanying Consolidated Balance Sheet. Accordingly, the Company’s balance sheets will often reflect a working capital deficit position. The Company considers such a presentation to be a normal part of its ongoing operations.
(u) Contingencies
The Company evaluates its accounting and disclosures for contingencies on a recurring basis in accordance with U.S. GAAP. As of December 31, 2019, the Company has a material contingent liability for acquisition-related contingent consideration associated with its purchase of Spark ATM Systems Pty Ltd. For additional information, see Note 1(v) Acquisitions and Note. 19 Commitments and Contingencies.
(v) Acquisitions
On January 6, 2017, the Company completed the acquisition of DirectCash Payments Inc. (“DCPayments”) for $658 million Canadian Dollars (approximately $495 million U.S. dollars at the acquisition date foreign exchange rate) financed with cash-on-hand and borrowings under the Company’s revolving credit facility. As a result of the DCPayments acquisition, the Company significantly increased the size of its Canada, Mexico, and U.K. operations and entered into the Australia and New Zealand markets.
The DCPayments acquisition was accounted for as a business combination using the purchase method of accounting under the provisions of ASC Topic 805, Business Combinations. In accordance with this guidance, all assets acquired and liabilities assumed were recorded at their estimated fair values and any excess of the purchase consideration over the fair value of the identifiable assets acquired and liabilities assumed was recognized as goodwill. In conjunction with the transaction, the Company recognized current and other noncurrent assets of $50.4 million, property and equipment of $68.8 million, goodwill of $300.3 million, intangible assets of $182.1 million, current and other long-term liabilities of $74.0 million, ARO of $8.9 million, and a deferred tax liability of $23.2 million.
On January 31, 2017, the Company completed the acquisition of Spark ATM Systems Pty Ltd. (“Spark”), an independent ATM operator in South Africa. The initial purchase consideration of approximately $19.5 million was paid in cash. In addition, the total aggregate purchase price included potential contingent consideration up to $55.5 million at the December 31, 2019 foreign currency exchange rate. The contingent consideration payable is based upon Spark's performance relative to certain agreed-upon earnings targets in 2019 and 2020 and is payable to the previous investors in 2020 and 2021, respectively. The recognized acquisition date fair value of the contingent consideration was $34.8 million, at the January 31, 2017 foreign currency exchange rate, and was determined with the assistance of an independent appraisal firm using forecasted future financial projections and other Level 3 inputs. For additional information related to the Company’s fair value estimates, see Note 18. Fair Value Measurements. In conjunction with the transaction, the Company recognized property and equipment of $5.3 million, goodwill of $48.2 million, intangible assets of $2.8 million, ARO of $0.4 million, and other net liabilities of $1.5 million.
In May 2019, the Company paid $9.1 million to acquire ATM processing contracts associated with approximately 62,000 ATMs.
87
(2) New Accounting Pronouncements
Adoption of New Accounting Pronouncements
Goodwill Impairment. In conjunction with the annual goodwill impairment test for the year ended December 31, 2019, the Company adopted ASU No. 2017-04, Intangibles-Goodwill and Other (Topic 350): Simplifying the Test for Goodwill Impairment (the "Simplification"). This guidance eliminates Step 2 from the goodwill impairment test. Previously, Step 2 was performed after first determining that the fair value of a reporting unit was less than its carrying value and it required an entity to determine the implied fair value of a reporting unit’s goodwill using a procedure similar to a purchase price allocation, prepared in conjunction with a business combination. Under the Simplification, an entity recognizes a goodwill impairment charge by comparing the fair value of a reporting unit with its carrying amount and, if applicable, recording an impairment in the amount by which the carrying amount exceeds the fair value. The adoption of this guidance did not have a material impact on the Company’s consolidated financial statements. However, as discussed in Note 1. Basis of Presentation and Summary of Significant Accounting Policies, (l) Goodwill, the Company recognized a $7.3 million goodwill impairment upon completion of the annual goodwill impairment test for the year ended December 31, 2019.
Lease Accounting. The Company adopted Accounting Standards Codification Topic 842, Leases (the “Lease Standard”) as of January 1, 2019, using the modified retrospective approach and using the effective date as the date of initial application. Consequently, financial information for dates and periods before January 1, 2019 have not been updated or recast. In addition, the Company elected the practical expedients permitted under the transition guidance within the Lease Standard, which allowed the Company to carry forward prior conclusions about lease identification, lease classification, and initial direct costs. In accordance with the Company's accounting policy, the Company elected not to exclude short-term leases for any of its vehicle and equipment leases, as the lease terms associated with the Company's operating leases are routinely longer than 12 months. In addition, the Company elected not to separate lease and non-lease components for its ATM placement agreements that contain fixed payments and are deemed to contain an operating lease under the Lease Standard.
The Company’s adoption of ASC 842 resulted in the recognition of operating lease assets and liabilities of approximately $85 million and $95 million, respectively, as well as the derecognition of certain prepaid and deferred lease balances upon adoption. Upon adoption, this guidance had no impact on the Company's consolidated income from operations, net income, or cash flows.
Hedge Accounting. The Company adopted ASU No. 2017-12, Derivatives and Hedging (Topic 815) Targeted Improvements to Accounting for Hedging Activities (“ASU 2017-12” or the “Hedging Standard”) as of January 1, 2019, using the modified retrospective transition approach, which requires the Company to account for ASU 2017-12 as of the date of adoption with any retrospective adjustments applicable to prior periods included as a cumulative-effect adjustment to Accumulated other comprehensive loss, net and retained earnings. ASU 2017-12 amends and simplifies existing guidance in order to allow companies to more accurately present the economic effects of risk management activities in the financial statements. Upon adoption, this guidance had no impact on the Company's consolidated income from operations, net income, or cash flows.
Revenue from Contracts with Customers. On January 1, 2018, the Company adopted Accounting Standards Codification (“ASC”) 606, Revenue from Contracts with Customers, using the modified retrospective adoption method for contracts that were not completed as of January 1, 2018. The Company recognized the cumulative effect of initially applying the new revenue standard as an adjustment to the opening retained earnings. The comparative information for periods ended prior to the Company's adoption has not been restated and continues to be reported under the accounting standards in effect for those periods.
88
Upon adoption, the Lease Standard and the Hedging Standard had the following impact on the Company’s Consolidated Balance Sheets:
December 31, 2018 As Reported | ASC Topic 842 (Leases) | ASU 2017-12 (Hedging) | December 31, 2018 As Adjusted | ||||||||||||
(In thousands) | |||||||||||||||
ASSETS | |||||||||||||||
Current assets: | |||||||||||||||
Cash and cash equivalents | $ | $ | $ | $ | |||||||||||
Accounts and notes receivable, net | |||||||||||||||
Inventory, net | |||||||||||||||
Restricted cash | |||||||||||||||
Prepaid expenses, deferred costs, and other current assets | |||||||||||||||
Total current assets | |||||||||||||||
Property and equipment, net of accumulated depreciation | |||||||||||||||
Intangible assets, net | |||||||||||||||
Goodwill | |||||||||||||||
Operating lease assets | |||||||||||||||
Deferred tax asset, net | |||||||||||||||
Prepaid expenses, deferred costs, and other noncurrent assets | |||||||||||||||
Total assets | $ | $ | $ | $ | |||||||||||
LIABILITIES AND SHAREHOLDERS’ EQUITY | |||||||||||||||
Current liabilities: | |||||||||||||||
Current portion of other long-term liabilities | $ | $ | $ | $ | |||||||||||
Accounts payable | |||||||||||||||
Accrued liabilities | ( | ) | |||||||||||||
Total current liabilities | |||||||||||||||
Long-term debt | |||||||||||||||
Asset retirement obligations | |||||||||||||||
Noncurrent operating lease liabilities | |||||||||||||||
Deferred tax liability, net | |||||||||||||||
Other long-term liabilities | ( | ) | |||||||||||||
Total liabilities | |||||||||||||||
Commitments and contingencies | |||||||||||||||
Shareholders' equity: | |||||||||||||||
Ordinary shares | |||||||||||||||
Additional paid-in capital | |||||||||||||||
Accumulated other comprehensive loss, net | ( | ) | ( | ) | |||||||||||
Retained earnings | ( | ) | |||||||||||||
Total parent shareholders' equity | |||||||||||||||
Noncontrolling interests | ( | ) | ( | ) | |||||||||||
Total shareholders’ equity | |||||||||||||||
Total liabilities and shareholders’ equity | $ | $ | $ | $ | |||||||||||
89
Accounting Pronouncements Issued But Not Yet Adopted
In June 2016, the FASB issued ASU No. 2016-13, Financial Instruments - Credit Losses (Topic 326), Measurement of Credit Losses on Financial Statements and subsequently issued the following amendments: ASU 2018-19 Codification Improvements to Topic 326, Financial Instruments-Credit Losses, ASU 2019-04 Codification Improvements to Topic 326, Financial Instruments-Credit Losses, Topic 815, Derivatives and Hedging, and Topic 825, Financial Instruments, ASU 2019-05 Financial Instruments-Credit Losses and ASU 2019-11 Codification Improvements to Topic 326, Financial Instruments - Credit Losses” (collectively, the “Credit Loss Guidance”). The Credit Loss Guidance changes the impairment model for most financial assets and will require the use of an “expected loss” model for instruments measured at amortized cost. Under this model, entities will be required to estimate the lifetime expected credit loss on such instruments and record an allowance to offset the amortized cost basis of the financial asset, resulting in a net presentation of the amount expected to be collected on the financial asset. This pronouncement is effective for fiscal years, and for interim periods, beginning after December 15, 2019 and the Company's plans to adopt this guidance effective January 1, 2020. The Company is working to complete its adoption of this guidance in the three month period ended March 31, 2020 and is still evaluating the impact on the Company’s consolidated financial statements.
In August 2018, the FASB issued ASU No. 2018-13, Disclosure Framework (Topic 820): Changes to the Disclosure Requirements for Fair Value Measurement, which modifies the disclosure requirements on fair value measurements. This guidance is effective for fiscal years beginning after December 15, 2019. The Company plans to adopt this guidance effective January 1, 2020. The adoption of this guidance is not expected to have a material impact on the Company’s consolidated financial statements.
In August 2018, the FASB issued ASU No. 2018-15, Intangibles-Goodwill and Other-Internal-Use Software (Subtopic 350-40): Customer’s Accounting for Implementation Costs Incurred in a Cloud Computing Arrangement that is a Service Contract. This guidance aligns the requirements for capitalizing implementation costs incurred in a hosting arrangement that is a service contract with the requirements for capitalizing implementation costs incurred to develop or obtain internal-use software (and hosting arrangements that include an internal use software license). This guidance is effective for fiscal years beginning after December 15, 2019. The Company plans to adopt this guidance effective January 1, 2020. The adoption of this guidance is not expected to have a material impact on the Company’s consolidated financial statements.
In December 2019, the FASB issued ASU 2019-12, Income Taxes (Topic 740): Simplifying the Accounting for Income Taxes. This standard simplifies the accounting for income taxes by eliminating certain exceptions to the guidance in Topic 740 related to the approach for intraperiod tax allocation, the methodology for calculating income taxes in an interim period and the recognition of deferred tax liabilities for outside basis differences. The new guidance also simplifies aspects of the accounting for franchise taxes and enacted changes in tax laws or rates and clarifies the accounting for transactions that result in a step-up in the tax basis of goodwill and allocating consolidated income taxes to separate financial statements of entities not subject to income tax. ASU 2019-12 is effective for fiscal years beginning after December 15, 2020, with early adoption permitted. Upon adoption, the Company must apply certain aspects of this standard retrospectively for all periods presented while other aspects are applied on a modified retrospective basis through a cumulative-effect adjustment to retained earnings as of the beginning of the fiscal year of adoption. The Company is currently evaluating the impact of this new standard on its consolidated financial statements. Although there are several other new accounting pronouncements issued by the FASB, the Company does not believe any of these accounting pronouncements had or will have a material impact on its consolidated financial statements.
(3) Revenue Recognition
Disaggregated Revenues
The following tables detail the revenue of the Company’s reportable segments disaggregated by financial statement line and component:
90
Year Ended December 31, 2019 | |||||||||||||||||||
(In thousands) | |||||||||||||||||||
North America | Europe & Africa | Australia & New Zealand | Eliminations | Consolidated | |||||||||||||||
Surcharge revenues | $ | $ | $ | $ | $ | ||||||||||||||
Interchange revenues | |||||||||||||||||||
Bank-branding and surcharge-free network revenues | |||||||||||||||||||
Managed services and processing revenues | ( | ) | |||||||||||||||||
Total ATM operating revenues | ( | ) | |||||||||||||||||
ATM product sales and other revenues | |||||||||||||||||||
Total revenues | $ | $ | $ | $ | ( | ) | $ | ||||||||||||
Year Ended December 31, 2018 | |||||||||||||||||||
(In thousands) | |||||||||||||||||||
North America | Europe & Africa | Australia & New Zealand | Eliminations | Consolidated | |||||||||||||||
Surcharge revenues | $ | $ | $ | $ | $ | ||||||||||||||
Interchange revenues | |||||||||||||||||||
Bank-branding and surcharge-free network revenues | |||||||||||||||||||
Managed services and processing revenues | ( | ) | |||||||||||||||||
Total ATM operating revenues | ( | ) | |||||||||||||||||
ATM product sales and other revenues | |||||||||||||||||||
Total revenues | $ | $ | $ | $ | ( | ) | $ | ||||||||||||
Revenue is recognized when obligations under the terms of a contract with a customer are satisfied. Revenue is recorded in ATM operating revenues and ATM product sales and other revenues line items in the accompanying Consolidated Statements of Operations.
ATM operating revenues are recognized daily as the associated transactions are processed or monthly on a per ATM or per cardholder basis. When customer contracts provide for up-front fees that do not pertain to a distinct performance obligation, the fees are recognized over the term of the underlying agreement on a straight-line basis. ATM product sales and other revenues are recognized when the related performance obligations are fulfilled upon transfer of control of goods or services to the customer.
ATM operating revenues. The Company presents revenues from automated consumer financial services, bank-branding and surcharge-free network offerings, managed services and other services in the ATM operating revenues line in the accompanying Consolidated Statements of Operations. The Company’s ATM operating revenues consist of the following:
91
• | Surcharge revenue. Surcharge revenues are received in the form of a fee paid by a cardholder who has made a cash withdrawal from an ATM. Surcharge fees can vary widely based on the location of the ATM and the nature of the contracts negotiated with merchants. In the U.S. and Canada, the Company does not receive surcharge fees from cardholders whose financial institutions participate in a surcharge-free network or have branded a location; instead, the Company receives interchange and bank-branding or surcharge-free network-branding revenues, which are discussed below. For certain ATMs, primarily those owned and operated by merchants, the Company does not receive any portion of the surcharge but rather the entire surcharge fee is earned by the merchant. In the U.K., ATM deployers operate their ATMs on either a free-to-use (surcharge-free) or a pay-to-use (surcharge) basis. On free-to-use ATMs in the U.K., the Company earns interchange revenue on withdrawal and certain other transactions. These fees are paid by the cardholder’s financial institution. On pay-to-use ATMs in the U.K., the Company only earns a surcharge fee paid by the cardholder on withdrawal transactions and interchange is only paid by the cardholder’s financial institution on other non-withdrawal transaction types. The Company earns both surcharge and interchange in Spain. In Germany, Australia, and Mexico, the Company collects surcharge fees on withdrawal transactions but generally does not receive interchange revenue. In South Africa, the Company generally earns interchange revenues which varies by transaction type and customer arrangement. Surcharge revenues, as described above, are recognized daily as the associated transactions are processed. |
• | Interchange revenue. An interchange fee is a fee paid by the cardholder’s financial institution for its customer’s use of an ATM that is owned by another operator and for the fee the EFT network charges to transmit data between the ATM and the cardholder’s financial institution. The Company typically receives a majority of the interchange fee paid by the cardholder’s financial institution, net of the amount retained by the EFT network, and recognizes the net amount received from the network as revenue. In some markets in which the Company operates, interchange fees are earned not only on cash withdrawal transactions but also on other ATM transactions, including balance inquiries and balance transfers. Interchange revenues are subject to various arrangements and are recognized daily as the associated transactions are processed. |
• | Bank-branding and surcharge-free network revenues. Under a bank-branding arrangement, ATMs that are Company-owned and operated are branded with the logo of the branding financial institution. In exchange for a fee paid by the financial institution, the financial institution’s customers gain access to use these bank-branded ATMs without paying a surcharge fee. Under the Company’s Allpoint surcharge-free network, financial institutions that participate pay a fixed monthly fee per cardholder and/or a fixed fee per transaction so that cardholders gain surcharge-free access to our large network of ATMs. Bank-branding and surcharge-free network revenues are generally recognized monthly on a per ATM or per cardholder basis, except for transaction-based fee arrangements which are recognized daily as they occur. Any up-front fees associated with these arrangements are recognized ratably over the life of the arrangement. |
The Company’s bank-branding, surcharge-free network and managed services arrangements result in the Company providing a series of distinct services that have the same pattern of transfer to the customer. As a result, these arrangements create performance obligations that are satisfied over-time, (generally 3-5 years), for which the Company has a right to consideration that corresponds directly with the value of the entity’s performance completed to date. In conjunction with these arrangements, the Company recognizes revenue in the amount it has a right to receive. Variable consideration may exist in these arrangements and is recognized only to the extent a significant reversal is not probable.
• | Managed services and processing revenues. Under managed service agreements, the Company provides various forms of ATM-related services, including monitoring, maintenance, cash management, cash delivery, customer service, on-screen advertising, processing and other services to merchants, financial institutions, and third-party ATM operators. Under processing arrangements, the Company provides transaction processing services to merchants, financial institutions, and third-party operators. Under managed services and processing arrangements, surcharge and interchange fees are generally earned by the customer and the Company typically receives a fixed fee per transaction and/or a periodic management fee per ATM in return for providing the agreed-upon operating services. The managed services and processing fees are recognized as the related services are provided to the customers. |
ATM product sales and other revenues. The Company presents revenues from other product sales and services in the ATM product sales and other revenues line in the accompanying Consolidated Statements of Operations. The Company earns revenues from the sale of ATMs and ATM-related equipment as well as the delivery of other non-transaction-based services. Revenues related to these activities are recognized when ownership of the equipment is transferred to the customer and the Company has completed all required installation and set-up procedures. With respect to the sale of ATMs to Value-Added-Resellers (“VARs”), the Company recognizes revenues related to such sales when ownership of the equipment is transferred to the VAR.
Due to the transactional nature of the Company’s revenue, there are no significant judgments that affect the determination of the amount and timing of its revenues.
92
Contract Balances
As of December 31, 2019, the Company has recognized no significant contract assets apart from accounts receivables that relate to completed performance obligations. Contract liabilities totaled $9.0 million and $8.4 million at December 31, 2019 and December 31, 2018, respectively. These amounts represent deferred revenues for advance consideration received largely in relation to bank-branding and surcharge-free network arrangements. The revenue recognized during the year ended December 31, 2019 on previously recognized deferred revenues was not material. The Company expects to recognize the revenue associated with its contract liabilities ratably over various periods extending over the next 36 months. During the year ended December 31, 2019, the Company did not recognize any significant impairment losses related to its accounts receivable or contract assets. For additional information related to the allowance for doubtful accounts, see Note 1. General and Basis of Presentation - (h) Accounts Receivable, net of Allowance for Doubtful Accounts.
Contract Cost
Upon adoption of the new revenue standard on January 1, 2019, the Company recognized deferred sales commissions of $7.9 million, and as of December 31, 2019, the deferred sales commissions totaled $7.5 million. The Company expects that the incremental commissions paid in advance to sales personnel, together with other associated costs, are recoverable, and therefore, the Company capitalizes these amounts as deferred contract acquisition costs. Sales commissions capitalized are generally amortized over a 4 - 5 year period corresponding with the related placement agreements. Similarly, and consistent with past practice, the costs incurred to fulfill a contract, largely consisting of prepaid merchant commissions and other consideration paid or provided to merchant partners, are capitalized and recognized over the duration of the related contract.
Practical Expedients and Other Disclosures
In order to adopt and subsequently apply the new revenue standard, the Company utilized various practical expedients. The Company elected not to re-examine contracts modified prior to its adoption using the modified retrospective adoption method and elected to utilize a portfolio approach to assess and apply the impact of the new revenue standard. Furthermore, the Company has elected not to disclose information about remaining performance obligations that have original expected durations of one year or less. Similarly, the Company does not defer the costs of obtaining a contract if the associated contract is one year or less.
The Company’s bank-branding, surcharge-free network, and managed services arrangements result in the Company providing a series of distinct services that have the same pattern of transfer to the customer. As a result, these arrangements create singular performance obligations that are satisfied over-time (generally 3 - 5 years ) for which the Company has a right to consideration that corresponds directly with the value of the entity’s performance completed to date. In conjunction with these arrangements, the Company recognizes revenue in the amount it has a right to receive. Variable consideration may exist in these arrangements and is recognized only to the extent a significant reversal is not probable.
(4) Share-Based Compensation
The Company accounts for its share-based compensation by recognizing the grant date fair value of share-based awards, net of estimated forfeitures, as share-based compensation expense over the underlying requisite service periods of the related awards. The grant date fair value is based upon the Company’s share price on the date of grant.
The following table reflects the total share-based compensation expense amounts reported in the accompanying Consolidated Statements of Operations:
Year Ended December 31, | |||||||||||
2019 | 2018 | 2017 | |||||||||
(In thousands) | |||||||||||
Cost of ATM operating revenues | $ | $ | $ | ||||||||
Selling, general, and administrative expenses | |||||||||||
Total share-based compensation expense | $ | $ | $ | ||||||||
Total share-based compensation expense increased by $5.3 million during the year ended December 31, 2019 compared to the prior year due to the amount, timing and terms of share-based payment awards granted during the periods and also the recognition of comparatively higher estimated payouts for the performance-based awards granted in 2018. Total share-based compensation
93
expense in 2017 was somewhat lower due to a higher level of forfeitures during that period as a result of the Company’s Restructuring Plan and the associated employee terminations. The employee terminations resulted in the net reversal of $1.5 million in share-based compensation expense during 2017.
Share-based compensation plans. The Company currently has two long-term incentive plans - the Fourth Amended and Restated 2007 Stock Incentive Plan (as amended, the “2007 Plan”) and the 2001 Stock Incentive Plan (“2001 Plan”). The purpose of each of these plans is to provide members of the Board and employees of the Company additional incentive and reward opportunities designed to enhance the profitable growth of the Company. Equity grants awarded under these plans generally vest in various increments up to four years based on continued employment. The Company handles stock option exercises and other share grants through the issuance of new common shares. All grants during the periods above were made under the 2007 Plan.
2007 Plan. The 2007 Plan provides for the granting of incentive stock options intended to qualify under Section 422 of the Internal Revenue Code, options that do not constitute incentive stock options, Restricted Stock Awards (“RSAs”), phantom share awards, Restricted Stock Units (“RSUs”), bonus share awards, performance awards, and annual incentive awards. The number of common shares that may be issued under the 2007 Plan may not exceed 9,679,393 shares. The shares issued under the 2007 Plan are subject to further adjustment to reflect share dividends, share splits, recapitalizations, and similar changes in the Company’s capital structure. As of December 31, 2019, 796,680 options and 7,423,974 shares of RSAs and RSUs, net of cancellations, had been granted under the 2007 Plan and options to purchase 301,875 common shares have been exercised.
2001 Plan. No awards were granted in 2019, 2018, and 2017 under the Company’s 2001 Plan. As of December 31, 2019, options to purchase an aggregate of 6,438,172 common shares, net of cancellations, had been granted pursuant to the 2001 Plan, all of which the Company considered as non-qualified stock options, and 6,306,821 of these options had been exercised.
Restricted Stock Units. The Company grants RSUs under its Long-Term Incentive Plan (“LTIP”), which is an annual equity award program under the 2007 Plan. The ultimate number of RSUs that are available to be earned under the LTIP are approved by the Compensation Committee of the Company’s Board of Directors on an annual basis based on the Company’s achievement of certain performance levels during the associated performance period. The majority of these grants have both a service-based and a performance-based vesting schedule, dependent on Company financial results (“Performance-RSUs”), and for these the Company recognizes the related compensation expense based on the estimated performance levels that management believes will ultimately be met over the related vesting schedule. In addition, a portion of the awards have only a service-based vesting schedule (“Time-RSUs”) and the associated expense is recognized ratably over the related vesting schedule, which can be up to four years . Finally, a portion of the awards have both a service-based and a market-based vesting schedule (“Market-Based-RSUs”). For these grants, the Company recognizes the estimated grant date fair value over the performance period (typically a 36 -month period). Performance-RSUs, Time-RSUs, and Market-Based RSUs are convertible into the Company’s common shares after the passage of the vesting periods. Performance-RSUs and Market-Based RSUs will be earned to the extent the Company achieves the associated performance-based or market-based vesting conditions. Although these RSUs are not considered to be earned and outstanding until the vesting conditions are met, the Company recognizes the related compensation expense over the requisite service period (or to an employee’s qualified retirement date, if earlier) using a graded vesting methodology. RSUs are also granted outside of LTIPs, with or without performance-based or market-based vesting conditions.
The number of the Company’s non-vested RSUs as of December 31 2019, 2018, and 2017 and the changes during these years are presented below:
94
Number of Shares | Weighted Average Grant Date Fair Value | |||||
Non-vested RSUs as of January 1, 2017 | $ | |||||
Granted | ||||||
Vested | ( | ) | ||||
Forfeited | ( | ) | ||||
Non-vested RSUs as of December 31, 2017 | ||||||
Granted | ||||||
Vested | ( | ) | ||||
Forfeited | ( | ) | ||||
Non-vested RSUs as of December 31, 2018 | ||||||
Granted | ||||||
Vested | ( | ) | ||||
Forfeited | ( | ) | ||||
Non-vested RSUs as of December 31, 2019 | $ | |||||
The above table only includes earned RSUs; therefore, the Performance-RSUs and Market-Based RSUs granted in 2018 and 2019 but not yet earned are not included. The number of Performance-RSUs granted at target in 2019, net of actual forfeitures, was 118,367 units with a grant date fair value of $33.75 per unit. The number of Market-Based RSUs granted in 2019, net of actual forfeitures, was 118,285 units with a grant date fair value of $49.21 per unit. The number of Performance-RSUs granted at target in 2018, net of actual forfeitures, was 304,114 units with a grant date fair value of $22.84 per unit. The number of Market-Based RSUs granted in 2018, net of actual forfeitures, was 134,989 units with a grant date fair value of $24.13 per unit. Time-RSUs are included as granted. The weighted average grant date fair value of the RSUs granted was $32.29 , $26.96 , and $37.80 for the years ended December 31, 2019, 2018, and 2017, respectively. The total fair value of RSUs that vested during the years ended December 31, 2019, 2018, and 2017 was $12.7 million, $16.7 million, and $26.0 million, respectively. Compensation expense associated with RSUs totaled $19.5 million, $15.1 million, and $14.5 million for the years ended December 31, 2019, 2018, and 2017, respectively. As of December 31, 2019, the unrecognized compensation expense associated with earned RSUs was $9.3 million, which will be recognized using a graded vesting schedule for Performance-RSUs and a straight-line vesting schedule for Time-RSUs, over a remaining weighted average vesting period of approximately 1.7 years.
Options. The number of the Company’s outstanding stock options as of December 31, 2019, 2018 and 2017 and the changes during these years are presented below:
Number of Shares | Weighted Average Exercise Price | Aggregate Intrinsic Value | Weighted Average Remaining Contractual Term | |||||||||||
(in thousands) | ||||||||||||||
Options outstanding as of January 1, 2018 | $ | |||||||||||||
Granted | ||||||||||||||
Exercised | ( | ) | ||||||||||||
Options outstanding as of December 31, 2018 | $ | $ | years | |||||||||||
Granted | ||||||||||||||
Exercised | ||||||||||||||
Options outstanding as of December 31, 2019 | $ | $ | years | |||||||||||
Options vested and exercisable as of December 31, 2019 | $ | $ | — | years | ||||||||||
During the year ended December 31, 2019, no options were exercised. During the years ended December 31, 2017, the total intrinsic value of options exercised, estimated tax benefits to the Company of the options exercised, and the cash received by the Company as a result of the option exercised were all immaterial.
95
Fair value assumptions. The Company utilizes the Black-Scholes option-pricing model to value options, which requires the input of certain subjective assumptions, including the expected life of the options, expected volatility of the Company's common equity, expected dividend rate, a risk-free interest rate, and an estimated forfeiture rate. These assumptions are based on management’s best estimate at the time of grant. No options were granted in 2017. The value assumptions for the option awards granted in the years ended December 31, 2019 and 2018 are presented below:
Valuation assumptions: | Options Granted in 2019 | Options Granted in 2018 | ||
Expected option term (in years) | ||||
Expected stock price volatility | % | % | ||
Expected dividend yield | % | % | ||
Risk-free interest rate | % | % | ||
(5) Earnings (Loss) per Share
The Company reports its earnings per share under the two-class method. Under this method, potentially dilutive securities are excluded from the calculation of diluted earnings per share (as well as their related impact on the net income available to common shareholders) when their impact on net income available to common shareholders is anti-dilutive.
Potentially dilutive securities for the years ended December 31, 2019, 2018, and 2017 included all outstanding stock options, RSAs, and RSUs, which were included in the calculation of diluted earnings per share for these periods. The potentially dilutive effect of outstanding warrants and the underlying shares exercisable under the Company’s Convertible Notes were excluded from diluted shares outstanding as the exercise price exceeded the average market price of the Company’s common shares. The effect of the note hedge, described in Note. 11. Debt, was also excluded as the effect is anti-dilutive.
Additionally, the restricted shares issued under RSAs have a non-forfeitable right to cash dividends, if and when declared by the Company. Accordingly, restricted shares issued under RSAs are considered to be participating securities. For the years ended December 31, 2019 and 2018, there were no unvested RSAs. For the year ended December 31, 2017, the Company did not allocate the undistributed loss among the vested restricted shares as they did not carry an obligation to share in the loss.
The allocated details are as follows:
Net income (loss) per share (in thousands excluding share and per share amounts)
Year Ended December 31, | ||||||||||||
2019 | 2018 | 2017 | ||||||||||
Net income (loss) available to common shareholders | $ | $ | $ | ( | ) | |||||||
Weighted average common basic shares outstanding (for basic calculation) | ||||||||||||
Dilutive effect of outstanding common stock options and RSUs | ||||||||||||
Weighted average common dilutive shares outstanding (for diluted calculation) | ||||||||||||
Net income (loss) per common share - basic | $ | $ | $ | ( | ) | |||||||
Net income (loss) per common share - diluted | $ | $ | $ | ( | ) | |||||||
96
(6) Related Party Transactions
Board members. Jorge Diaz, a member of the Board, retired from his position as the Division President and Chief Executive Officer of Fiserv Output Solutions, a division of Fiserv during September 2018. During the years ended December 31, 2018 and 2017, Fiserv provided the Company with third-party services during the normal course of business, including transaction processing, network hosting, network sponsorship, and cash management. The amounts paid to Fiserv in each of these years were immaterial to the Company’s financial statements.
G. Patrick Philips, a member of the Board, is a member of the Board of Directors for USAA Federal Savings Bank (“USAA FSB”). During the years ended December 31, 2019, 2018, and 2017, the Company provided bank-branding and Allpoint services to USAA on terms that are generally consistent with its other customers for similar services.
(7) Property and Equipment, net
The Company’s property and equipment consisted of the following:
December 31, 2019 | December 31, 2018 | ||||||
(In thousands) | |||||||
ATM equipment and related costs | $ | $ | |||||
Technology assets | |||||||
Facilities, equipment, and other | |||||||
Total property and equipment | |||||||
Less: Accumulated depreciation | ( | ) | ( | ) | |||
Property and equipment, net | $ | $ | |||||
As discussed in Note 1. Basis of Presentation and Summary of Significant Accounting Policies - (j) Property and Equipment, net, the property and equipment balances include assets available for deployment and deployments in process of $29.3 million and $29.8 million as of December 31, 2019 and 2018, respectively.
(8) Intangible Assets
Goodwill
The following tables present the net carrying amount of the Company’s intangible assets with indefinite lives as of December 31, 2019 and 2018, as well as the changes in the net carrying amounts for the years ended December 31, 2019 and 2018 by segment:
North America | Europe & Africa | Australia & New Zealand | Total | ||||||||||||
(In thousands) | |||||||||||||||
Goodwill, gross as of December 31, 2018 | $ | $ | $ | $ | |||||||||||
Accumulated impairment loss | ( | ) | ( | ) | ( | ) | |||||||||
Goodwill, net as of December 31, 2018 | |||||||||||||||
Foreign currency translation adjustments | ( | ) | |||||||||||||
Goodwill, gross as of December 31, 2019 | |||||||||||||||
Accumulated impairment loss | ( | ) | ( | ) | ( | ) | ( | ) | |||||||
Goodwill, net as of December 31, 2019 | $ | $ | $ | $ | |||||||||||
97
Intangible Assets with Definite Lives
The following table presents the Company’s intangible assets that were subject to amortization:
December 31, 2019 | December 31, 2018 | ||||||||||||||||||||||
Gross Carrying Amount | Accumulated Amortization | Net Carrying Amount | Gross Carrying Amount | Accumulated Amortization | Net Carrying Amount | ||||||||||||||||||
(In thousands) | |||||||||||||||||||||||
Merchant and bank-branding contracts/relationships | $ | $ | ( | ) | $ | $ | $ | ( | ) | $ | |||||||||||||
Trade names | ( | ) | ( | ) | |||||||||||||||||||
Technology | ( | ) | ( | ) | |||||||||||||||||||
Non-compete agreements | ( | ) | ( | ) | |||||||||||||||||||
Revolving credit facility deferred financing costs | ( | ) | ( | ) | |||||||||||||||||||
Total intangible assets with definite lives | $ | $ | ( | ) | $ | $ | $ | ( | ) | $ | |||||||||||||
During the year ended December 31, 2019, the Company paid $9.1 million to acquire ATM processing contracts associated with approximately 62,000 ATMs. These intangible assets were recognized as customer/merchant contracts and are being amortized over a 5 year period.
The majority of the Company’s intangible assets with definite lives are being amortized over the assets’ estimated useful lives utilizing the straight-line method. Estimated useful lives range from four to ten years for merchant and bank-branding contracts/relationships, two to ten years for exclusive license agreements, one to fifteen years for definite-lived trade names, three years for acquired technology, and one to five years for non-compete agreements. Deferred financing costs relating to the revolving credit facility are amortized through interest expense over the contractual term of the revolving credit facility utilizing the effective interest method. The Company periodically reviews the estimated useful lives of its identifiable intangible assets, taking into consideration any events or circumstances that might result in a reduction in fair value or a revision of those estimated useful lives.
Amortization of definite-lived intangible assets is recorded in the Amortization of intangible assets line in the accompanying Consolidated Statements of Operations, except for deferred financing costs related to the revolving credit facility and certain exclusive license agreements. Amortization of the revolving credit facility deferred financing costs is combined with the amortization of note discount related to other debt instruments and is recorded in the Amortization of deferred financing costs and note discount line in the accompanying Consolidated Statements of Operations. Certain exclusive license agreements that were effectively prepayments of merchant fees are amortized through the Cost of ATM operating revenues line in the accompanying Consolidated Statements of Operations during the years ended December 31, 2019, 2018, and 2017 and totaled $10.6 million, $11.7 million, and $10.0 million, respectively.
Estimated amortization for the Company’s intangible assets with definite lives as of December 31, 2019, for each of the next five years and thereafter, is as follows (in thousands):
2020 | $ | ||
2021 | |||
2022 | |||
2023 | |||
2024 | |||
Thereafter | |||
Total | $ | ||
(9) Prepaid Expenses, Deferred Costs, and Other Assets
The Company’s prepaid expenses, deferred costs, and other assets consisted of the following:
98
December 31, 2019 | December 31, 2018 | ||||||
(In thousands) | |||||||
Current portion of prepaid expenses, deferred costs, and other current assets | |||||||
Prepaid expenses | $ | $ | |||||
Interest rate swap and cap contracts | |||||||
Deferred costs and other current assets | |||||||
Total | $ | $ | |||||
Noncurrent portion of prepaid expenses, deferred costs, and other noncurrent assets | |||||||
Prepaid expenses | $ | $ | |||||
Interest rate swap and cap contracts | |||||||
Deferred costs and other noncurrent assets | |||||||
Total | $ | $ | |||||
(10) Accrued Liabilities
The Company’s accrued liabilities consisted of the following:
December 31, 2019 | December 31, 2018 | ||||||
(In thousands) | |||||||
Accrued merchant settlement | $ | $ | |||||
Accrued taxes | |||||||
Accrued merchant fees | |||||||
Accrued compensation | |||||||
Accrued processing costs | |||||||
Accrued cash management fees | |||||||
Accrued armored | |||||||
Accrued maintenance | |||||||
Accrued purchases | |||||||
Accrued interest | |||||||
Accrued telecommunications costs | |||||||
Other accrued expenses | |||||||
Total accrued liabilities | $ | $ | |||||
(11) Long-Term Debt
The Company’s carrying value of long-term debt consisted of the following:
December 31, 2019 | December 31, 2018 | ||||||
(In thousands) | |||||||
Revolving credit facility, including swingline credit facility (weighted average combined interest rate of 2.3% and 2.8% as of December 31, 2019 and December 31, 2018, respectively) | $ | $ | |||||
1.00% Convertible Senior Notes due December 2020, net of unamortized discount and capitalized debt issuance costs | |||||||
5.50% Senior Notes due May 2025, net of capitalized debt issuance costs | |||||||
Total long-term debt | $ | $ | |||||
99
The Convertible Notes with a face value of $287.5 million are presented net of unamortized discount and capitalized debt issuance costs of $11.8 million and $24.0 million as of December 31, 2019 and December 31, 2018, respectively. The 5.50 % Senior Notes due 2025 (the “2025 Notes”) with a face value of $300.0 million are presented net of capitalized debt issuance costs of $3.5 million and $4.1 million as of December 31, 2019 and December 31, 2018, respectively.
Revolving Credit Facility
On September 19, 2019, the Company, entered into a first amendment to its second amended and restated credit agreement (the “First Amendment”, or as amended, the “Credit Agreement”). The First Amendment increased the revolving commitments to an aggregate principal amount equal to $750 million from $600 million, with borrowings to be used for general corporate purposes. The First Amendment also extended the maturity date from November 19, 2023 to September 19, 2024 and amended the accordion feature allowing the Company to (a) increase the available borrowings under the credit facility to $850 million and (b) incur incremental term loans under the facility. Any term loans will rank equal in right of payment with revolving loans under the credit facility and will not mature earlier than the revolving loans.
The total commitments under the credit facility can be borrowed in U.S. dollars, alternative currencies (including Euros, U.K. pounds sterling, Canadian dollars, Australian dollars and South African rand), or a combination thereof. Borrowings (not including swingline loans) accrue interest, at the Company’s option and based on the type of currency borrowed, at the Alternate Base Rate, the Canadian Prime Rate, the Adjusted LIBO Rate, the Canadian Dealer Offered Rate, the Bank Bill Swap Reference Rate or the Johannesburg Interbank Agreed Rate (each, as defined in the Credit Agreement) plus a margin depending on the Company’s most recent Total Net Leverage Ratio (as defined in the Credit Agreement). The margin for Alternative Base Rate loans and Canadian Prime Rate loans varies between 0.0 % and 0.75 %, and the margin for Adjusted LIBO Rate loans, Canadian Dealer Offered Rate loans, Bank Bill Swap Reference Rate loans and Johannesburg Interbank Agreed Rate Loans varies between 1.00 % and 1.75 %. Swingline loans denominated in U.S. dollars bear interest at the Alternate Base Rate plus a margin as described above, swingline loans denominated in Canadian dollars bear interest at the Canadian Prime Rate plus a margin as described above and swingline loans denominated in other alternative currencies bear interest at the Overnight Foreign Currency Rate (as defined in the Credit Agreement) plus the applicable margin for the Adjusted LIBO Rate, the Bank Bill Swap Reference Rate or the Johannesburg Interbank Agreed Rate, as applicable.
Each of the Credit Facility Guarantors (as defined in the Credit Agreement) have guaranteed the full and punctual payment of the obligations under the revolving credit facility and the obligations under the revolving credit facility are secured by substantially all of the assets of the Credit Facility Guarantors. In addition, the obligations of the CFC Borrowers (as defined in the Credit Agreement) are guaranteed by the CFC Guarantors and secured by substantially all of the assets of the CFC Guarantors (as defined in the Credit Agreement).
The Credit Agreement contains representations, warranties and covenants that are customary for similar credit arrangements, including, among other things, covenants relating to: (i) financial reporting and notification, (ii) payment of obligations, (iii) compliance with applicable laws, (iv) notification of certain events, and (v) certain covenants relating to, among other things, the sale or transfer of assets, fundamental changes, incurrence or guarantee of indebtedness, liens, investments, hedging transactions with affiliates and sale and leaseback transactions. Financial covenants in the Credit Agreement require the Company to maintain: (i) as of the last day of any fiscal quarter, a Total Net Leverage Ratio (as defined in the Credit Agreement) of no more than 4.25 to 1.00 and (ii) as of the last day of any fiscal quarter, an Interest Coverage Ratio (as defined in the Credit Agreement) of no less than 3.00 to 1.00. Additionally, the Company is limited on the amount of restricted payments; however, the Company may generally make restricted payments so long as no event of default exists at the time of such payment and the Total Net Leverage Ratio is less than 3.75 to 1.00 at the time such restricted payment is made.
As of December 31, 2019, the Company had $167.2 million of outstanding borrowings under its $750.0 million revolving credit facility and was in compliance with all applicable covenants and ratios under the Credit Agreement. The Company also had $10.7 million outstanding in letters of credit. The weighted average interest rates on the Company’s outstanding borrowings under the revolving credit facility were 2.3 % and 2.8 %, as of December 31, 2019 and December 31, 2018, respectively.
$287.5 million 1.00 % Convertible Senior Notes Due December 2020 and Related Equity Instruments
On November 19, 2013, Cardtronics Inc. ("Cardtronics Delaware") issued the Convertible Notes at par value. Cardtronics Delaware received $254.2 million in net proceeds from the offering after deducting underwriting fees paid to the initial purchasers and a repurchase of 665,994 of its outstanding common shares concurrent with the offering. Cardtronics Delaware used a portion of the net proceeds from the offering to fund the net cost of the convertible note hedge transaction, as described below. The convertible note hedge and warrant transactions were entered into concurrent with the pricing of the Convertible Notes. Interest on the Convertible Notes is payable semi-annually in cash in arrears on June 1st and December 1st of each year. Under U.S. GAAP,
100
certain convertible debt instruments that may be settled in cash (or other assets) upon conversion are required to be separately accounted for as liability (debt) and equity (conversion option) components of the instrument in a manner that reflects the issuer’s non-convertible debt borrowing rate. The Company, with assistance from a valuation professional, determined that the fair value of the debt component was $215.8 million and the fair value of the embedded option was $71.7 million as of the issuance date. The Company recognizes effective interest expense on the debt component and that interest expense effectively accretes the debt component to the total principal amount due at maturity of $287.5 million. The effective rate of interest to accrete the debt balance is approximately 5.26 %, which corresponded to the Company’s estimated conventional debt instrument borrowing rate at the date of issuance.
On July 1, 2016, Cardtronics plc, Cardtronics Delaware, and Wells Fargo Bank, National Association, as trustee, entered into a supplemental indenture (the “Convertible Notes Supplemental Indenture”) with respect to the Convertible Notes. The Convertible Notes Supplemental Indenture provides for the unconditional and irrevocable guarantee by Cardtronics plc of the prompt payment, when due, of any amount owed to the holders of the Convertible Notes. The Convertible Notes Supplemental Indenture also provides that, from and after July 1, 2016, the Convertible Notes will be convertible into shares of Cardtronics plc in lieu of common share of Cardtronics Delaware.
The Convertible Notes have a conversion price of $52.35 per share, which equals a conversion rate of 19.1022 shares per $1,000 principal amount of Convertible Notes, for a total of approximately 5.5 million shares underlying the debt. The conversion rate, however, is subject to adjustment under certain circumstances. Conversion can occur: (i) any time on or after September 1, 2020, (ii) after March 31, 2014, during any calendar quarter that follows a calendar quarter in which the price of the shares exceeds 135 % of the conversion price for at least 20 days during the 30 consecutive trading-day period ending on the last trading day of the quarter, (iii) during the ten consecutive trading-day period following any five consecutive trading-day period in which the trading price of the Convertible Notes is less than 98 % of the closing price of the shares multiplied by the applicable conversion rate on each such trading day, (iv) upon specified distributions to Cardtronics plc’s shareholders upon recapitalizations, reclassifications, or changes in shares, and (v) upon a make-whole fundamental change. A fundamental change is defined as any one of the following: (i) any person or group that acquires 50 % or more of the total voting power of all classes of common equity that is entitled to vote generally in the election of Cardtronics plc’s directors, (ii) Cardtronics plc engages in any recapitalization, reclassification, or changes of common shares as a result of which the shares would be converted into or exchanged for, shares, other securities, other assets, or property, (iii) Cardtronics plc engages in any share exchange, consolidation, or merger where the shares converted into cash, securities, or other property, (iv) the Company engages in certain sales, leases, or other transfers of all or substantially all of the consolidated assets, or (v) Cardtronics plc’s shares are not listed for trading on any U.S. national securities exchange.
Upon conversion, holders of the Convertible Notes are entitled to receive cash, shares, or a combination of cash and shares, at the Company’s election. In the event of a change in control, as defined in the indenture under which the Convertible Notes have been issued, holders can require Cardtronics Delaware to purchase all or a portion of their Convertible Notes for 100 % of the notes’ par value plus any accrued and unpaid interest.
The Company’s interest expense related to the Convertible Notes consisted of the following:
Year Ended December 31, | |||||||||||
2019 | 2018 | 2017 | |||||||||
(In thousands) | |||||||||||
Cash interest per contractual coupon rate | $ | $ | $ | ||||||||
Amortization of note discount | |||||||||||
Amortization of debt issuance costs | |||||||||||
Total interest expense related to Convertible Notes | $ | $ | $ | ||||||||
The Company’s carrying value of the Convertible Notes consisted of the following:
101
December 31, 2019 | December 31, 2018 | ||||||
(In thousands) | |||||||
Principal balance | $ | $ | |||||
Unamortized discount and capitalized debt issuance costs | ( | ) | ( | ) | |||
Net carrying amount of Convertible Notes | $ | $ | |||||
In connection with the issuance of the Convertible Notes, Cardtronics Delaware entered into separate convertible note hedge and warrant transactions to reduce the potential dilutive impact upon the conversion of the Convertible Notes. The net effect of these transactions effectively raised the price at which dilution would occur from the $52.35 initial conversion price of the Convertible Notes to $73.29 . Pursuant to the convertible note hedge, Cardtronics Delaware purchased call options granting Cardtronics Delaware the right to acquire up to approximately 5.5 million common shares with an initial strike price of $52.35 . The call options automatically become exercisable upon conversion of the Convertible Notes, and will terminate on the second scheduled trading day immediately preceding December 1, 2020. Cardtronics Delaware also sold to the initial purchasers warrants to acquire up to approximately 5.5 million common shares with a strike price of $73.29 . The warrants will expire incrementally on a series of expiration dates subsequent to the maturity date of the Convertible Notes through August 30, 2021. If the conversion price of the Convertible Notes remains between the strike prices of the call options and warrants, Cardtronics plc’s shareholders will not experience any economic dilution in connection with the conversion of the Convertible Notes; however, to the extent that the price of the shares exceeds the strike price of the warrants on any or all of the series of related expiration dates of the warrants, Cardtronics plc would be required to issue additional shares or settle the equivalent value in cash to the warrant holders. The amounts allocated to both the note hedge and warrants were recorded in the Shareholders’ equity section in the accompanying Consolidated Balance Sheets.
$300.0 million 5.50 % Senior Notes Due May 2025
On April 4, 2017, in a private placement offering, Cardtronics Delaware and Cardtronics USA, Inc. (the “2025 Notes Issuers”) issued 300.0 million in aggregate principal amount of the 2025 Notes pursuant to an indenture dated April 4, 2017 (the “2025 Notes Indenture”) among the 2025 Notes Issuers, Cardtronics plc, and certain of its subsidiaries, as guarantors (each, a “2025 Notes Guarantor”), and Wells Fargo Bank, National Association, as trustee.
Interest on the 2025 Notes accrues from April 4, 2017, the date of issuance, at the rate of 5.50 % per annum. Interest on the 2025 Notes is payable semi-annually in cash in arrears on May 1st and November 1st of each year, commencing on November 1, 2017.
The 2025 Notes and the related guarantees (the “2025 Guarantees”) are the general unsecured senior obligations of each of the 2025 Notes Issuers and the 2025 Notes Guarantors, respectively, and rank: (i) equally in right of payment with all of the 2025 Notes Issuers’ and the 2025 Notes Guarantors’ existing and future senior indebtedness and (ii) senior in right of payment to all of the 2025 Notes Issuers’ and the 2025 Notes Guarantors’ future subordinated indebtedness. The 2025 Notes and the 2025 Guarantees are effectively subordinated to any of the 2025 Notes Issuers’ and the 2025 Notes Guarantors’ existing and future secured debt to the extent of the collateral securing such debt, including all borrowings under the Company’s revolving credit facility. The 2025 Notes are structurally subordinated to all liabilities of any of Cardtronics plc’s subsidiaries (excluding the 2025 Notes Issuers) that do not guarantee the 2025 Notes.
The 2025 Notes contain covenants that, among other things, limit the 2025 Notes Issuers’ ability and the ability of Cardtronics plc and certain of its restricted subsidiaries to incur or guarantee additional indebtedness, make certain investments, or pay dividends or distributions on Cardtronics plc’s common shares or repurchase common shares or make certain other restricted payments, consolidate or merge with or into other companies, conduct asset sales, restrict dividends or other payments by restricted subsidiaries, engage in transactions with affiliates or related persons, and create liens.
Obligations under the 2025 Notes are fully and unconditionally and jointly and severally guaranteed on a senior unsecured basis by Cardtronics plc and certain of its subsidiaries and certain of its future subsidiaries, with the exception of Cardtronics plc’s immaterial subsidiaries and CFC Guarantors (as defined in the Credit Agreement). There are no significant restrictions on the ability of Cardtronics plc to obtain funds from Cardtronics Delaware, Cardtronics USA, Inc., or the other 2025 Notes Guarantors by dividend or loan. None of the 2025 Notes Guarantors’ assets represent restricted assets pursuant to Rule 4-08(e)(3) of Regulation S-X.
102
The 2025 Notes are subject to certain automatic customary releases with respect to the 2025 Notes Guarantors (other than Cardtronics plc, Cardtronics Holdings Limited, and CATM Holdings LLC), including the sale, disposition, or transfer of the common shares or substantially all of the assets of such 2025 Notes Guarantor, designation of such 2025 Notes Guarantor as unrestricted in accordance with the 2025 Notes Indenture, exercise of the legal defeasance option or the covenant defeasance option, liquidation, or dissolution of such 2025 Notes Guarantor. The 2025 Notes Guarantors, including Cardtronics plc, may not sell or otherwise dispose of all or substantially all of their properties or assets to, or consolidate with or merge into, another company if such a sale would cause a default under the 2025 Notes Indenture and certain other specified requirements under the 2025 Notes Indenture are not satisfied.
2018 Redemption
On December 19, 2018, the Company used borrowings under its revolving credit facility to redeem the aggregate principal of its, then outstanding, $250.0 million 5.125 % Senior Notes Due 2022. In connection with the early extinguishment of the 2022 Notes, the Company recorded a $1.4 million pre-tax charge during the year ended December 31, 2018 to write off the associated unamortized deferred financing costs. This write-off is reflected in the Amortization of deferred financing costs and note discount line in the accompanying Consolidated Statement of Operations. Additionally, the Company recorded a $6.4 million pre-tax charge related to the premium paid at redemption, which is included in the Redemption costs for early extinguishment of debt line in the accompanying Consolidated Statements of Operations.
Debt Maturities
Aggregate maturities of the principal amounts of the Company’s long-term debt as of December 31, 2019, for each of the next five years, and thereafter is as follows (in thousands):
2020 | $ | ||
2021 | |||
2022 | |||
2023 | |||
2024 | |||
Thereafter | |||
Total | $ | ||
(12) Asset Retirement Obligations
Asset retirement obligations (“ARO”) consist primarily of costs to deinstall the Company’s ATMs and, in some cases, restore the ATM sites to their original condition, which are estimated based on current market rates. In most cases, the Company is contractually required to perform this deinstallation of its owned ATMs and in some cases, site restoration work. For each group of similar ATM types, the Company has recognized the estimated fair value of the ARO as a liability in the accompanying Consolidated Balance Sheets and capitalized that cost as part of the cost basis of the related asset. The related assets are depreciated on a straight-line basis over the asset’s estimated useful life, which is the estimated average time period that an ATM is installed in a location before being deinstalled, and the related liabilities are accreted to their full value over the same period of time.
The changes in the Company’s ARO liability consisted of the following:
103
December 31, 2019 | December 31, 2018 | ||||||
(In thousands) | |||||||
Beginning balance asset retirement obligations | $ | $ | |||||
Additional obligations | |||||||
Accretion expense | |||||||
Change in estimates | |||||||
Payments | ( | ) | ( | ) | |||
Foreign currency translation adjustments | ( | ) | |||||
Ending balance asset retirement obligations | |||||||
Less: current portion of asset retirement obligations | |||||||
Ending balance asset retirement obligations, excluding current portion | $ | $ | |||||
For additional information related to the Company’s AROs with respect to its fair value measurements, see Note 18. Fair Value Measurements.
(13) Other Liabilities
The Company’s Other liabilities consisted of the following:
December 31, 2019 | December 31, 2018 | ||||||
(In thousands) | |||||||
Current portion of other long-term liabilities | |||||||
Operating lease liabilities | $ | $ | — | ||||
Interest rate swap and cap contracts | |||||||
Asset retirement obligations | |||||||
Acquisition related contingent consideration | |||||||
Deferred revenue | |||||||
Other | |||||||
Total current portion of other long-term liabilities | $ | $ | |||||
Noncurrent portion of other long-term liabilities | |||||||
Acquisition related contingent consideration | $ | $ | |||||
Interest rate swap and cap contracts | |||||||
Deferred revenue | |||||||
Other | |||||||
Total noncurrent portion of other long-term liabilities | $ | $ | |||||
As of December 31, 2019 and 2018, the Acquisition-related contingent consideration line consisted of the estimated fair value of the contingent consideration associated with the Spark acquisition. For additional information see Note 1(v). Acquisitions.
(14) Shareholders’ Equity
Share Repurchases. On March 26, 2019, the Company announced that its Board had authorized a share repurchase program, enabling the repurchase of up to $50 million of its Class A ordinary shares through August 31, 2020. In addition, on November 21, 2019, the Company announced that its Board had authorized the repurchase of an additional $50 million of its Class A ordinary shares through December 31, 2020. Share repurchases under the authorized plans could be effected on behalf of the Company through open market transactions, privately negotiated transactions, or otherwise, pursuant to SEC trading rules.
104
From May through September 2019, the Company repurchased an accumulated total of 1,732,392 outstanding Class A ordinary shares at a weighted average price of $28.86 per share, for an aggregate purchase price of approximately $50 million, exhausting the March 2019 authorization. The Company did not utilize the second authorization to repurchase shares in the three months ended December 31, 2019. The amounts presented for share repurchases on the Consolidated Statements of Shareholders' Equity include the applicable stamp taxes payable in the U.K. of $0.3 million.
Common shares. The Company had 44,676,132 and 46,134,381 shares outstanding as of December 31, 2019 and 2018, respectively.
Additional paid-in capital. Included in the balance of Additional paid-in capital are amounts related to the Convertible Notes issued in November 2013 and the related equity instruments. These amounts include: (i) the estimated fair value of the embedded option of the Convertible Notes of $71.7 million at the time of issuance, (ii) the amount paid to purchase the associated convertible note hedges of $72.6 million, (iii) the amount received for selling associated warrants of $40.5 million, and (iv) $1.6 million in debt issuance costs allocated to the equity component of the convertible note. For additional information related to the Convertible Notes and the related equity instruments, see Note 11. Long-Term Debt.
Accumulated other comprehensive loss, net. Accumulated other comprehensive loss, net, is a separate component of Shareholders’ equity in the accompanying Consolidated Balance Sheets. The following table presents the changes in the balances of each component of Accumulated other comprehensive loss, net for the years ended December 31, 2019, 2018, and 2017:
Foreign Currency Translation Adjustments | Unrealized (Losses) Gains on Interest Rate Swap and Foreign Currency Forward Contracts | Total | |||||||||
(In thousands) | |||||||||||
Total Accumulated other comprehensive loss, net as of December 31, 2016 | $ | ( | ) | (5) | $ | ( | ) | (1) | $ | ( | ) |
Other comprehensive income (loss) before reclassification | (6) | ( | ) | (2) | |||||||
Amounts reclassified from accumulated other comprehensive loss, net | (2) | ||||||||||
Net current period other comprehensive income | |||||||||||
Total Accumulated other comprehensive loss, net as of December 31, 2017 | $ | ( | ) | (5) | $ | ( | ) | (1) | $ | ( | ) |
Other comprehensive (loss) income before reclassification | ( | ) | (6) | (3) | ( | ) | |||||
Amounts reclassified from accumulated other comprehensive loss, net | (3) | ||||||||||
Net current period other comprehensive (loss) income | ( | ) | ( | ) | |||||||
Total Accumulated other comprehensive loss, net as of December 31, 2018 | $ | ( | ) | (5) | $ | ( | ) | (1) | $ | ( | ) |
Other comprehensive income (loss) before reclassification | (6) | ( | ) | (4) | ( | ) | |||||
Amounts reclassified from Accumulated other comprehensive loss, net | ( | ) | (7) | (4) | |||||||
Net current period other comprehensive income (loss) | ( | ) | ( | ) | |||||||
Total Accumulated other comprehensive loss, net as of December 31, 2019 | $ | ( | ) | (5) | $ | ( | ) | (1) | $ | ( | ) |
(1) | Net of deferred income tax expense of $ |
(2) | Net of deferred income tax (benefit) expense of ($ |
(3) | Net of deferred income tax expense of $ |
(4) | Net of deferred income tax (benefit) expense of ($ |
105
(5) | Net of deferred income tax benefit of ($ |
(6) | Net of deferred income tax (benefit) expense of ($ |
(7) |
The Company records unrealized gains and losses related to its designated interest rate swap, cap and foreign currency forward, net of estimated taxes, in the Accumulated other comprehensive loss, net line in the accompanying Consolidated Balance Sheets since it is more likely than not that the Company will be able to realize the benefits associated with its net deferred tax asset positions in the future. The amounts reclassified from Accumulated other comprehensive loss, net are recognized in the Cost of ATM operating revenues line in the accompanying Consolidated Statements of Operations.
The Company has elected the portfolio approach for the deferred tax asset of the unrealized gains and losses related to the designated interest rate swap, cap and foreign currency forward contracts in Accumulated other comprehensive loss, net within the accompanying Consolidated Balance Sheets. Under the portfolio approach, the disproportionate tax effect created when the valuation allowance was appropriately released as a tax benefit into continuing operations in 2010, will reverse out of the Accumulated other comprehensive loss, net line in the accompanying Consolidated Balance Sheets and into continuing operations as a tax expense when the Company ceases to hold any designated interest rate swap, cap or forward contracts. As of December 31, 2019, the disproportionate tax effect is $14.6 million.
The Company currently believes that the unremitted earnings of certain of its subsidiaries will be reinvested for an indefinite period of time. Accordingly, no deferred taxes have been provided for the differences between the Company’s book basis and underlying tax basis in these subsidiaries or on the foreign currency translation adjustment amounts.
(15) Employee Benefits
The Company sponsors defined contribution retirement plans for its employees, the principal plan being the 401(k) plan which is offered to its employees in the U.S. During 2019, the Company matched 100 % of employee contributions in the 401(k) plan up to 4 % of the employee’s eligible compensation. Employees immediately vest in their contributions while the Company’s matching contributions vest at a rate of 20 % per year. The Company also sponsors a similar retirement plan for its employees in other jurisdictions. The Company contributed $3.7 million to the defined contribution benefit plans for each of the years ended December 31, 2019, 2018, and 2017, respectively.
(16) Derivative Financial Instruments
Risk Management Objectives of Using Derivatives - Interest Rate Risk
The Company is exposed to interest rate risk associated with its vault cash rental obligations and borrowings under its revolving credit facility. The Company uses varying notional amount interest rate swap contracts and interest rate cap agreements (“Interest Rate Derivatives”) to manage the interest rate risk associated with its vault cash rental obligations in the U.S., Canada, the U.K., and Australia. The Company also uses interest rate swap contracts to mitigate its exposure to floating interest rates on its anticipated revolving credit facility borrowings.
The majority of the Company’s Interest Rate Derivatives serve to mitigate interest rate risk exposure by converting a portion of the Company’s monthly floating-rate vault cash rental payments to either monthly fixed-rate vault cash rental payments or to vault cash rental payments with a capped rate. Typically, the Company receives monthly floating-rate payments from its Interest Rate Derivative counterparties that correspond to, in all material respects, the monthly floating-rate payments required by the Company to its vault cash rental providers for the portion of the average outstanding vault cash balances that have been hedged. The floating-rate payments may or may not be capped or limited. In return, the Company pays its counterparties a monthly fixed-rate amount based on the same notional amounts outstanding. By converting the vault cash rental and revolving credit facility obligations from floating-rate to a fixed or a capped rate, the impact of favorable and unfavorable changes in future interest rates on the monthly vault cash rental payments recognized in the Cost of ATM operating revenues line in the accompanying Consolidated Statement of Operations has been reduced.
During the year ended December 31, 2019, the Company entered into new forward-starting interest rate swap contracts to hedge its exposure to floating interest rates on its expected vault cash balances outstanding in the U.S. in future periods. These interest rate swap contracts begin January 1, 2020 with a $300 million aggregate notional amount that increases to $400 million on January 1, 2021 and will terminate on December 31, 2024. In addition, the Company entered into new forward-starting interest rate swap contracts to hedge its exposure to floating interest rates on its expected vault cash balances outstanding in Australia in
106
future periods. These interest rate swap contracts begin January 1, 2020 with a 40 million Australian Dollar aggregate notional amount and will terminate on December 31, 2021. During the year ended December 31, 2019, the Company also entered into new forward-starting interest rate swap contracts to hedge its exposure to floating interest rates on its Credit Agreement. These interest rate swaps have an aggregate notional amount of 100 million U.K. pounds sterling and that began January 4, 2021, terminating December 31, 2021.
Risk Management Objectives of Using Derivatives - Foreign Currency Exchange Rate Risk
The Company is also exposed to foreign currency exchange rate risk with respect to its operations outside the U.S. The Company has at times used foreign currency forward contracts to mitigate its foreign exchange rate risk associated with certain anticipated transactions. The Company regularly designates its foreign currency derivatives as cash flow hedges, however, the Company is not presently party to any foreign currency derivatives designated as cash flow hedges. The Company is party to certain foreign currency forwards that are not designated as hedges at December 31, 2019 as noted below.
None of the Company’s existing derivative contracts contain credit-risk-related contingent features.
Undesignated Foreign Currency Forwards
On October 14, 2019, the Company entered into new foreign currency forward contracts with an aggregate notional amount of $150 million and a fixed rate of 1.267 U.S. dollar to 1 U.K. pounds sterling. These forwards allow for settlement between November 2, 2020 and December 1, 2020. Although not designated as hedging instruments for accounting purposes, these forward contracts are associated with planned borrowings in U.K. pounds sterling and the anticipated conversion of U.K. pounds sterling to U.S. dollars to partially fund the repayment of the Company's 1.00 % Convertible Notes and serve to mitigate currency fluctuation risk.
Derivative Accounting Policy
The Interest Rate Derivatives discussed above are used by the Company to hedge exposure to variability in expected future cash flows attributable to a particular risk; therefore, they are designated and qualify as cash flow hedging instruments. The Company does not currently hold any interest rate derivative instruments not designated as cash flow hedges.
As discussed above, the Company generally utilizes fixed-for-floating Interest Rate Derivatives where the underlying pricing terms of the cash flow hedging instrument agree, in all material respects, with the pricing terms of the anticipated vault cash rental obligations or anticipated Credit Agreement borrowings. Therefore, the amount of ineffectiveness associated with the Interest Rate Derivatives has historically been immaterial. If the Company concludes 1) that the obligations that have been hedged are no longer probable or 2) that the underlying terms of the agreements have changed such that they do not sufficiently agree to the pricing terms of the Interest Rate Derivatives, the Interest Rate Derivative contracts would be deemed ineffective. The Company does not currently anticipate terminating or modifying terms of its existing derivative instruments prior to their expiration dates.
Accordingly, the Company recognizes its Interest Rate Derivative contracts as assets or liabilities in the accompanying Consolidated Balance Sheets at fair value and any changes in the fair values of the related Interest Rate Derivative contracts are reported in Accumulated other comprehensive loss, net within the accompanying Consolidated Balance Sheets. The unrealized gains and losses related to these interest rate swap and cap contracts have been reported net of taxes in Accumulated other comprehensive loss, net within the accompanying Consolidated Balance Sheets. For additional information related to the Company’s interest rate swap and cap contracts and the associated fair value measurements, see Note 18. Fair Value Measurements.
In accordance with U.S. GAAP, the Company reports the gain or loss related to each highly effective cash flow hedging instrument, including any ineffectiveness, as a component of Accumulated other comprehensive loss, net within the accompanying Consolidated Balance Sheets and reclassifies the gain or loss into earnings within the Cost of ATM operating revenues, Interest expense, net, or Other income lines of the accompanying Consolidated Statements of Operations in the same period or periods during which the hedged transaction affects and has been forecasted in earnings. The classification of the gain or loss is determined based on the associated hedge designation.
Summary of Outstanding Interest Rate Derivatives
The notional amounts, weighted average fixed rates, and terms associated with our interest rate swap contracts and cap agreement that are currently in place in the U.S., Canada, the U.K, and Australia (as of the date of the issuance of this 2019 Form 10-K) are as follows:
107
Outstanding Interest Rate Derivatives Associated with Vault Cash Rental Obligations
North America – Interest Rate Swap Contracts
Notional Amounts U.S. $ | Weighted Average Fixed Rate | Term | |||||
(In millions) | |||||||
$ | % | January 1, 2020 – December 31, 2020 | |||||
$ | % | January 1, 2021 – December 31, 2021 | |||||
$ | % | January 1, 2022 – December 31, 2022 | |||||
$ | % | January 1, 2023 – December 31, 2024 | |||||
Notional Amounts CAD $ | Weighted Average Fixed Rate | Term | |||||
(In millions) | |||||||
C$ | % | January 1, 2020 – December 31, 2021 | |||||
North America – Interest Rate Cap Contracts
Notional Amounts U.S. $ | Cap Rate (1) | Term | |||||||
(In millions) | |||||||||
$ | % | January 1, 2021 – December 31, 2023 | |||||||
(1) Maximum amount of interest to be paid each year as per terms of cap contract. Cost of cap is amortized through vault cash rental expense over term of cap.
Europe & Africa – Interest Rate Swap Contracts
Notional Amounts U.K. £ | Weighted Average Fixed Rate | Term | |||||
(In millions) | |||||||
£ | % | January 1, 2020 – December 31, 2022 | |||||
Australia & New Zealand – Interest Rate Swap Contracts
Notional Amounts AUS $ | Weighted Average Fixed Rate | Term | |||||
(In millions) | |||||||
$ | % | January 1, 2020 – December 31, 2020 | |||||
$ | % | January 1, 2021 – December 31, 2021 | |||||
Outstanding Interest Rate Derivatives Associated with Revolving Credit Facility Borrowings
Notional Amounts U.K. £ | Weighted Average Fixed Rate | Term | |||||
(In millions) | |||||||
£ | % | January 1, 2020 – December 31, 2020 | |||||
£ | % | January 4, 2021 – December 31, 2021 | |||||
108
Summary of Outstanding Foreign Currency Derivatives
The notional amount, weighted average fixed rate, and terms associated with our foreign currency window forward contracts in place (as of the date of the issuance of this 2019 Form 10-K) are as follows:
Outstanding Undesignated Foreign Currency Derivatives
Notional Amount U.S. $ | Weighted Average Fixed Rate U.S. $/U.K. £ | Settlement Dates | ||||
(In millions) | ||||||
$ | November 2, 2020 – December 1, 2020 | |||||
The following tables depict the effects of the use of the Company’s derivative contracts in the accompanying Consolidated Balance Sheets and Consolidated Statements of Operations.
Balance Sheet Data
December 31, 2019 | December 31, 2018 | |||||||||||
Asset (Liability) Derivative Instruments | Balance Sheet Location | Fair Value | Balance Sheet Location | Fair Value | ||||||||
(In thousands) | (In thousands) | |||||||||||
Derivatives designated as hedging instruments: | ||||||||||||
Interest rate swap and cap contracts | Prepaid expenses, deferred costs, and other current assets | $ | Prepaid expenses, deferred costs, and other current assets | $ | ||||||||
Interest rate swap and cap contracts | Prepaid expenses, deferred costs, and other noncurrent assets | Prepaid expenses, deferred costs, and other noncurrent assets | ||||||||||
Interest rate swap and cap contracts | Current portion of other long-term liabilities | ( | ) | Current portion of other long-term liabilities | ( | ) | ||||||
Interest rate swap and cap contracts | Other long-term liabilities | ( | ) | Other long-term liabilities | ( | ) | ||||||
Total derivatives designated as hedging instruments, net | $ | ( | ) | $ | ||||||||
Derivatives not designated as hedging instruments: | ||||||||||||
Foreign currency forward contracts | Current portion of other long-term liabilities | ( | ) | |||||||||
Total derivative instruments, net | $ | ( | ) | $ | ||||||||
109
During the year ended December 31, 2019, the Company recognized unrealized foreign exchange losses of $7.9 million on its undesignated foreign currency forward contracts.
Statements of Operations Data
Year Ended December 31, | ||||||||||||||||||
Derivatives in Cash Flow Hedging Relationship | Amount of (Loss) Gain Recognized in Accumulated other comprehensive loss, net on Derivative Instruments | Location of Loss Reclassified from Accumulated other comprehensive loss, net into Income | Amount of Loss Reclassified from Accumulated other comprehensive loss, net into Income | |||||||||||||||
2019 | 2018 (1) | 2019 | 2018 | |||||||||||||||
(In thousands) | (In thousands) | |||||||||||||||||
Interest rate swap and cap contracts | $ | ( | ) | $ | Cost of ATM operating revenues | $ | ( | ) | $ | ( | ) | |||||||
Interest rate swap and cap contracts | ( | ) | Interest expense, net | ( | ) | $ | ||||||||||||
Total | $ | ( | ) | $ | $ | ( | ) | $ | ( | ) | ||||||||
(1) The 2018 period includes a gain of $0.1 million related to foreign currency forward contracts.
As of December 31, 2019, the Company expects to reclassify $5.8 million of net derivative-related losses contained within the Accumulated comprehensive loss, net line in its accompanying Consolidated Balance Sheets into earnings during the next twelve months concurrent with the recording of the related vault cash rental expense amounts.
(17) Leases
The Company leases facilities consisting of office and warehouse space as well as vehicles and office equipment. The Company's facility leases have various remaining terms extending up to approximately 12 years, some of which may include one or more options to extend the associated lease term by up to 5 -10 years, and some may include options for the Company or the lessor to terminate the leases prior to the end of the lease term. The exercise of lease renewal options is at the Company's discretion. From time to time, the Company may sublease office or warehouse space. This sublease activity is currently not significant. The Company's vehicle and office equipment leases currently have remaining lease terms extending up to 3 -5 years and these leases typically have original terms of approximately 4 -6 years. The Company has not historically extended its vehicle and office equipment leases beyond their original term. Similarly, the Company has not historically subleased these assets.
In addition, certain ATM placement agreements are deemed to contain an operating lease of merchant space under the Lease Standard. These ATM placement agreements have remaining terms of less than 1 year to more than 5 years. These arrangements consist of semi-permanent or through-the-wall placements of company-owned ATMs at merchant or financial institution locations. These arrangements are deemed to contain a lease as our counterparty lacks the practical ability to substitute alternative space. The renewal provisions under ATM placement agreements vary.
The Company's ATM placement agreements that are deemed to contain an operating lease generally require fixed and/or variable merchant commissions. The variable payments are based on the type and volume of transactions conducted on the ATMs at each respective location. In addition, the merchant commissions may also change, in accordance with the terms of these agreements, responsive to changes in interchange fees or interest rates. Certain Company facility leases require variable payments based on an index or based on external market rates. The Company's vehicle and office equipment leases do not generally include variable payments.
The Company recognizes the accounting impact of lease extension options when reasonably certain that a right to extend a lease will be exercised. The Company does not provide residual value guarantees within or in conjunction with any of its leases. As of December 31, 2019, all material leases of facilities, vehicles, office equipment, and merchant space had commenced.
The Company is not currently party to any significant finance leases. As a result, the net assets recorded under finance leases and the associated liabilities are not material.
See Note 2. New Accounting Pronouncements for the accounting impact of the Company's adoption of ASC 842-Leases on January 1, 2019.
110
Classification | December 31, 2019 | January 1, 2019 (Upon Adoption) | ||||||||
Assets | (In thousands) | |||||||||
Operating lease assets | Operating lease assets | $ | $ | |||||||
Total operating lease assets | $ | $ | ||||||||
Liabilities | ||||||||||
Current | ||||||||||
Operating lease liabilities | Current portion of other long-term liabilities | $ | $ | |||||||
Noncurrent | ||||||||||
Operating lease liabilities | Noncurrent operating lease liabilities | |||||||||
Total operating lease liabilities | $ | $ | ||||||||
Operating lease costs during the twelve months ended December 31, 2019 were as follows:
Year Ended | ||||||
Classification | December 31, 2019 | |||||
(In thousands) | ||||||
Operating lease costs | Cost of ATM operating revenues (1) | $ | ||||
Operating lease costs | Selling, general, and administrative expenses (2) | |||||
Total operating lease cost | $ | |||||
(1) | Includes the fixed and variable cost of facilities, vehicles, and equipment that are deemed direct operating lease costs. The variable lease cost associated with these leases was not significant. In addition, includes the fixed and variable cost associated with ATM placement agreements that are deemed to contain a lease. The variable cost associated with these placements was approximately $ |
(2) | Includes the fixed and variable cost of facilities, vehicles, and equipment that are deemed general and administrative operating lease costs. The variable lease cost associated with these leases was not significant. |
The following table presents the weighted-average remaining term and weighted-average discount rate associated with the Company's operating leases.
Lease Term and Discount Rate | December 31, 2019 | January 1, 2019 (Upon Adoption) | ||||
Weighted-average remaining lease term (years) | ||||||
Operating leases | ||||||
Weighted-average discount rate | ||||||
Operating leases | % | % | ||||
Year Ended December 31, 2019 | ||||
(In thousands) | ||||
Additional lease information is summarized below: | ||||
Operating cash outflows resulting from payments of operating lease liabilities | $ | |||
New operating lease assets recognized during the period | $ | |||
During the year ended December 31, 2019, the Company paid $19.7 million to satisfy the recognized operating lease obligations. The Company also recognized $14.2 million in new operating lease assets primarily consisting of equipment leases and ATM placement agreements that are deemed to contain an operating lease. Comparative prior period information is not presented above as the Company adopted the Lease Standard on January 1, 2019 using this effective date as the date of initial application.
111
The following table presents the December 31, 2019 undiscounted cash flows associated with the Company's recognized operating lease liabilities in the next five years and thereafter.
Maturity of Recognized Operating Lease Liabilities | Operating Lease Payments(1) | |||
(In thousands) | ||||
2020 | $ | |||
2021 | ||||
2022 | ||||
2023 | ||||
2024 | ||||
After 2024 | ||||
Total lease payments | ||||
Less: Interest (2) | ( | ) | ||
Present value of operating lease liabilities (3) | $ | |||
(1) | Operating lease payments reflect the Company's current fixed obligations under the operating lease agreements. The Company has identified no extensions that are reasonably certain of being exercised and there are no significant lease agreements that have been signed and not yet commenced. |
(2) | Calculated using the estimated incremental borrowing rate for each lease. |
(3) | Includes current operating lease liabilities of approximately $ |
As of December 31, 2018, the future amounts due under our operating leases and ATM placement agreements under the previous lease standard were $152.2 million in the aggregate, which consisted of the following: $36.6 million in 2019; $29.8 million in 2020; $25.0 million in 2021; $13.1 million in 2022; $8.5 million in 2023; and $39.2 million thereafter.
(18) Fair Value Measurements
The following tables provide the financial assets and liabilities carried at fair value measured on a recurring basis as of December 31, 2019 and 2018 using the fair value hierarchy prescribed by U.S. GAAP. The fair value hierarchy has three levels based on the reliability of the inputs used to determine fair value. Level 1 refers to fair values determined based on quoted prices in active markets for identical assets. Level 2 refers to fair values estimated using significant other observable inputs, and Level 3 refers to fair values estimated using significant non-observable inputs. An asset or liability’s classification within the hierarchy is determined based on the lowest level input that is significant to the fair value measurement.
Fair Value Measurements at December 31, 2019 | |||||||||||||||
Total | Level 1 | Level 2 | Level 3 | ||||||||||||
(In thousands) | |||||||||||||||
Assets | |||||||||||||||
Assets associated with interest rate swap and cap contracts | $ | $ | $ | $ | |||||||||||
Liabilities | |||||||||||||||
Liabilities associated with interest rate swap and cap contracts | $ | ( | ) | $ | $ | ( | ) | $ | |||||||
Liabilities associated with foreign currency forward contracts | $ | ( | ) | $ | $ | ( | ) | $ | |||||||
Liabilities associated with acquisition related contingent consideration | $ | ( | ) | $ | $ | $ | ( | ) | |||||||
112
Fair Value Measurements at December 31, 2018 | |||||||||||||||
Total | Level 1 | Level 2 | Level 3 | ||||||||||||
(In thousands) | |||||||||||||||
Assets | |||||||||||||||
Assets associated with interest rate swap and cap contracts | $ | $ | $ | $ | |||||||||||
Liabilities | |||||||||||||||
Liabilities associated with interest rate swap and cap contracts | $ | ( | ) | $ | $ | ( | ) | $ | |||||||
Liabilities associated with acquisition-related contingent consideration | $ | ( | ) | $ | $ | $ | ( | ) | |||||||
As of December 31, 2018, liabilities associated with Level 2 interest rate swap contracts also includes an insignificant amount related to foreign currency forward contracts.
Below are descriptions of the Company’s valuation methodologies for assets and liabilities measured at fair value. The methods described below may produce a fair value calculation that may not be indicative of net realizable value or reflective of future fair values. Furthermore, while the Company believes its valuation methods are appropriate and consistent with other market participants, the use of different methodologies or assumptions to determine the fair value of certain financial instruments could result in a different estimate of fair value at the reporting date.
Cash and cash equivalents, accounts and notes receivable, net of the allowance for doubtful accounts, prepaid expenses, deferred costs and other current assets, accounts payable, accrued liabilities, and other current liabilities. These financial instruments are not carried at fair value, but are carried at amounts that approximate fair value due to their short-term nature and generally negligible credit risk.
Acquisition-related intangible assets. The estimated fair values of acquisition-related intangible assets are valued based on a discounted cash flow analysis using significant non-observable inputs (Level 3). Intangible assets subject to amortization are reviewed for impairment whenever events or changes in circumstances indicate that the carrying amount of such assets may not be recoverable. An assessment of non-amortized intangible assets is performed on an annual basis or more frequently based on the occurrence of events that might indicate a potential impairment.
Acquisition-related contingent consideration. Liabilities from acquisition-related contingent consideration are estimated using market observable inputs and other significant non-observable inputs, as well as projections based on the Company’s best estimate of future operational results upon which the payment of these obligations are contingent. The contingent consideration payment amounts are based upon a formula and performance relative to certain agreed-upon earnings targets for 2019 and 2020 to be paid in 2020 and 2021, respectively.
Subsequent to the Spark acquisition, the Company has utilized a Monte Carlo simulation to estimate the fair value and account for the interdependency between the 2019 and 2020 performance periods. However, effective December 31, 2019, at the end first measurement period, the Company revised its methodology and used a Black-Scholes based model to estimate the fair value of the payments. Future changes to the estimated contingent liability either higher or lower may occur as the estimated internal projections and other significant non-observable inputs for the calculation become available and are updated as deemed necessary. These future changes could result in a material change in the estimated contingent liability. The estimates and significant non-observable inputs may differ from actual results.
As of December 31, 2019 and 2018, the estimated fair value of the Company’s acquisition-related contingent consideration liability was approximately $16.9 million and $38.3 million, respectively. We currently estimate that approximately $5.0 million will be paid in the first quarter of 2020 with the remaining amount being paid in the first quarter of 2021. During the year ended December 31, 2019, the Company recognized mark-to-market gains of approximately $21.9 million to revise the estimated fair value of the contingent consideration liability. Separately, foreign exchange losses of approximately $0.5 million were recognized during the year ended December 31, 2019, to remeasure the South African Rand denominated liability reported in U.S. Dollars. Both the revision to the estimated fair value and the net foreign exchange losses are included in the Other (income) expense line in the Consolidated Statements of Operations. For additional information related to the Spark acquisition contingent consideration, see Note 1(v). Acquisitions.
Long-term debt. The carrying amount of the long-term debt balance related to borrowings under the Company’s revolving credit facility approximates fair value due to the fact that any outstanding borrowings are subject to short-term floating interest
113
rates. As of December 31, 2019, the fair value of our Convertible Notes and 2025 Notes totaled $305.7 million and $311.9 million, respectively, based on the quoted prices in markets that are not active inputs (Level 2) for these notes as of that date. For additional information related to long-term debt, see Note 11. Debt.
Additions to asset retirement obligations liability. The Company estimates the fair value of additions to its ARO liability using expected discounted future cash flows at the Company’s credit-adjusted risk-free interest rate. Liabilities added to ARO are measured at fair value at the time of the asset installations using significant non-observable (Level 3) inputs. These liabilities are evaluated periodically based on estimated current fair value. Amounts added to the ARO liability during the years ended December 31, 2019 and 2018 totaled $3.7 million and $9.9 million, respectively.
Interest rate derivatives and foreign currency forward contracts. As of December 31, 2019, the recognized fair value of the Company’s Interest Rate Derivatives resulted in an asset of approximately $10.6 million and a liability of approximately $17.4 million. The recognized fair value of the Company’s foreign currency forward contracts resulted in an liability of approximately $7.9 million. These financial instruments are carried at fair value and are valued using pricing models based on significant other observable inputs (Level 2), while taking into account the creditworthiness of the party that is in the liability position with respect to each trade. For additional information related to the valuation process of this asset or liability, see Note 16. Derivative Financial Instruments.
(19) Commitments and Contingencies
Legal Matters
The Company is subject to various legal proceedings and claims arising in the ordinary course of its business. The Company has provided reserves where necessary for contingent liabilities, based on ASC 450, contingencies, when it has determined that a liability is probable and reasonably estimable. The Company’s management does not expect the outcome in any legal proceedings or claims, individually or collectively, to have a material adverse financial or operational impact on the Company. Additionally, the Company currently expenses all legal costs as they are incurred.
Operating Leases
As of December 31, 2019, the Company was a party to numerous operating leases including leases of facilities, vehicles, and office equipment as well as ATM placement agreements that are deemed to contain an operating lease of merchant space under the applicable lease accounting guidance. The payment obligations and rental expense under the Company’s operating leases are presented in Note 17. Leases.
Other Commitments
Asset retirement obligations. The Company’s ARO consist primarily of costs to deinstall the Company’s ATMs and to restore the ATM sites to their original condition. In most cases, the Company is contractually required to perform this deinstallation of its owned ATMs, and in some cases, the site restoration work. The Company had $61.2 million accrued for these liabilities as of December 31, 2019. For additional information, see Note 12. Asset Retirement Obligations.
Acquisition-related contingent consideration. As a result of the Spark acquisition, the Company accrued $16.9 million for the acquisition – related contingent consideration as of December 31, 2019. For additional information related to the Spark acquisition contingent consideration, see Note 1(v). Acquisitions.
Purchase commitments. During the normal course of business, the Company issues purchase orders for various products. As of December 31, 2019, the Company had open purchase commitments of $5.4 million for products to be delivered in 2020. Other material purchase commitments as of December 31, 2019 included $1.9 million in minimum service requirements for certain gateway and processing fees over the next seven years .
(20) Income Taxes
On December 22, 2017, House of Representatives 1 (“H.R. 1”), originally known as the Tax Cuts and Jobs Act (“U.S. Tax Reform”), was enacted and signed into legislation. Under U.S. GAAP, the effects of changes in tax rates and laws are recognized in the period in which the new legislation is enacted. As a result of this legislation, in the three months ended December 31, 2017, the Company provisionally recognized a one-time net tax benefit totaling $11.6 million. This amount included an estimated one-time tax benefit of $19.4 million due to the re-measurement of the Company’s net deferred tax liabilities, primarily related to the
114
change in the U.S. federal corporate income tax rate from 35% to 21%. Partially offsetting this non-cash book tax benefit, the Company recognized an estimated one-time tax expense of $7.8 million on its accumulated undistributed foreign earnings pertaining to foreign operations under the U.S. business, which the Company will elect to pay over an eight-year period. In accordance with SEC Staff Accounting Bulletin No. 118 (SAB 118), the Company adjusted the provisional estimates during the three months ended September 30, 2018. The Company decreased its estimate of the one-time tax benefit by $1.2 million upon its completion of the earnings and profits calculations of its foreign subsidiaries. Offsetting this benefit, the Company recognized a charge of $1.0 million for deferred tax assets that will not be realized, determined after the release of IRS Notice 2018-68, clarifying deduction limitations for remunerations of covered persons. During the three months ended December 31, 2018, the Company additionally reduced its one-time tax benefit by $0.2 million and completed its accounting for the tax effects of the U.S. Tax Reform.
As a result of the Redomicile Transaction completed on July 1, 2016, the location of incorporation of the parent company of the Cardtronics group was changed from Delaware to the U.K. As a Delaware company, the statutory corporate tax rate was 35%, and after the redomicile to the U.K., the Cardtronics parent company statutory tax rate was 19 % for the Company’s calendar reporting year 2019, 19 % for 2018, and 19.25 % for 2017. For additional information related to the Redomicile Transaction, see Note 1. Basis of Presentation and Summary of Significant Accounting Policies - (a) Description of Business.
The Company’s income (loss) before income taxes consisted of the following:
Year Ended December 31, | |||||||||||
2019 | 2018 | 2017 | |||||||||
(In thousands) | |||||||||||
U.S. | $ | $ | ( | ) | $ | ||||||
Non-U.S. | ( | ) | |||||||||
Total pre-tax book income (loss) | $ | $ | $ | ( | ) | ||||||
The Company’s income tax expense (benefit) based on income (loss) before income taxes consisted of the following:
Year Ended December 31, | |||||||||||
2019 | 2018 | 2017 | |||||||||
(In thousands) | |||||||||||
Current | |||||||||||
U.S. federal | $ | $ | ( | ) | $ | ( | ) | ||||
U.S. state and local | |||||||||||
Non-U.S. | |||||||||||
Total current | $ | $ | $ | ||||||||
Deferred | |||||||||||
U.S. federal | $ | $ | $ | ||||||||
U.S. state and local | |||||||||||
Non-U.S. | ( | ) | ( | ) | ( | ) | |||||
Total deferred | ( | ) | ( | ) | |||||||
Total income tax expense (benefit) | $ | $ | $ | ( | ) | ||||||
115
Income tax expense (benefit) differs from amounts computed by applying the statutory tax rate to income before income taxes as follows:
Year Ended December 31, | |||||||||||
2019 | 2018 | 2017 | |||||||||
(In thousands) | |||||||||||
Income tax expense (benefit), at the U.K. statutory tax rate of 19%, 19%, and 19.25% for the years ended December 31, 2019, 2018, and 2017, respectively. | $ | $ | $ | ( | ) | ||||||
Provision to return and deferred tax adjustments | ( | ) | |||||||||
U.S. state tax, net of federal benefit | |||||||||||
Permanent adjustments | |||||||||||
Tax rates in excess of (less than) statutory tax rates | ( | ) | |||||||||
Impact of Finance Structure | ( | ) | ( | ) | |||||||
Nondeductible/(nontaxable) transaction costs | ( | ) | ( | ) | |||||||
Goodwill impairment (non-deductible) | |||||||||||
US Tax Reform (net impact) | ( | ) | ( | ) | |||||||
Share-based Compensation | ( | ) | |||||||||
Capital Gains | |||||||||||
Other | ( | ) | |||||||||
Subtotal | ( | ) | |||||||||
Change in valuation allowance | |||||||||||
Total income tax expense (benefit) | $ | $ | $ | ( | ) | ||||||
The net income tax expense (benefit) is attributable to a combination of 1) tax benefits from the utilization of interest deductions disallowed in the prior year, 2) the additional tax expense related to share-based compensation, 3) the nontaxable gain recorded to revise the fair value of the acquisition related contingent consideration liability, 4) the goodwill impairment recognized and 5) the mix of earnings across jurisdictions.
The Company’s net deferred tax assets and liabilities, by segment, consisted of the following:
Year Ended December 31, 2019 | |||||||||||||||||||
North America | Europe & Africa | Australia & New Zealand | Corporate | Total | |||||||||||||||
(In thousands) | |||||||||||||||||||
Noncurrent deferred tax asset | $ | $ | $ | $ | $ | ||||||||||||||
Valuation allowance | ( | ) | ( | ) | ( | ) | ( | ) | |||||||||||
Noncurrent deferred tax liability | ( | ) | ( | ) | ( | ) | ( | ) | |||||||||||
Net noncurrent deferred tax (liability) asset | $ | ( | ) | $ | $ | $ | $ | ( | ) | ||||||||||
Year Ended December 31, 2018 | |||||||||||||||||||
North America | Europe & Africa | Australia & New Zealand | Corporate | Total | |||||||||||||||
(In thousands) | |||||||||||||||||||
Noncurrent deferred tax asset | $ | $ | $ | $ | $ | ||||||||||||||
Valuation allowance | ( | ) | ( | ) | ( | ) | ( | ) | |||||||||||
Noncurrent deferred tax liability | ( | ) | ( | ) | ( | ) | ( | ) | |||||||||||
Net noncurrent deferred tax (liability) asset | $ | ( | ) | $ | $ | $ | $ | ( | ) | ||||||||||
116
The Company’s tax effects of temporary differences that give rise to significant portions of the deferred tax assets and deferred tax liabilities consisted of the following:
December 31, 2019 | December 31, 2018 | ||||||
(In thousands) | |||||||
Noncurrent deferred tax assets | |||||||
Reserve for receivables | $ | $ | |||||
Accrued liabilities and inventory reserves | |||||||
Net operating loss carryforward | |||||||
Unrealized losses on interest rate swap contracts | |||||||
Share-based compensation expense | |||||||
Asset retirement obligations | |||||||
Tangible and intangible assets | |||||||
Deferred revenue | |||||||
Other | |||||||
Subtotal | |||||||
Valuation allowance | ( | ) | ( | ) | |||
Noncurrent deferred tax assets | $ | $ | |||||
Noncurrent deferred tax liabilities | |||||||
Tangible and intangible assets | $ | ( | ) | $ | ( | ) | |
Asset retirement obligations | ( | ) | ( | ) | |||
Unrealized gain on interest rate swap contracts | ( | ) | |||||
Other | ( | ) | ( | ) | |||
Noncurrent deferred tax liabilities | $ | ( | ) | $ | ( | ) | |
Net deferred tax liability | $ | ( | ) | $ | ( | ) | |
The Company assesses the need for any deferred tax asset valuation allowances at the end of each reporting period. The determination of whether a valuation allowance for deferred tax assets is needed is subject to considerable judgment and requires an evaluation of all available positive and negative evidence. Based on the assessment at December 31, 2019, and the weight of all evidence, the Company concluded that maintaining valuation allowances on deferred tax assets in Australia, Mexico, Canada, and other new markets is appropriate, as the Company currently believes that it is more likely than not that the related deferred tax assets will not be realized.
The deferred tax expenses and benefits associated with the Company’s net unrealized gains and losses on derivative instruments and foreign currency translation adjustments have been reflected within the Accumulated other comprehensive loss, net balance in the accompanying Consolidated Balance Sheets.
As of December 31, 2019, the Company had approximately $54.5 million in U.S. federal net operating loss carryforwards, of which $6.1 million will begin expiring in 2021, approximately $42.3 million in Canadian net operating loss carryforwards that will begin expiring in 2031, and approximately $9.3 million in net operating loss carryforwards in Mexico that are subject to expiration based on a 10 year loss carryforward limitation. The deferred tax benefits associated with such carryforwards in Canada and Mexico, to the extent they are not offset by deferred tax liabilities, have been fully reserved for through a valuation allowance.
The Company currently believes that the unremitted earnings of certain of its subsidiaries will be indefinitely reinvested in the corresponding country of origin. Accordingly, no deferred taxes have been provided for on the differences between the Company’s book basis and underlying tax basis in those subsidiaries.
The Company files U.S., state, and foreign income tax returns in jurisdictions with varying statutes of limitations. With few exceptions, the Company is not subject to income tax examination by tax authorities for years before 2014. The Company has
117
recorded an uncertain tax benefit of $2.4 million, of which $1.5 million was for net operating losses generated in prior years with an associated valuation allowance, and $0.4 million was for a deferred tax asset for the related US federal tax benefit. A net amount of $0.5 million of this uncertain tax benefit was recorded to tax expense in 2019.
(21) Concentration Risk
Significant supplier. For the years ended December 31, 2019 and 2018, the Company purchased ATM and ATM-related equipment from one supplier that accounted for 77 % and 64 %, respectively, of the Company’s total ATM purchases for those years.
(22) Segment Information
As of December 31, 2019, the Company’s operations consisted of its North America, Europe & Africa, and Australia & New Zealand segments. The Company’s ATM operations in the U.S., Canada, Mexico, and Puerto Rico are included in its North America segment. The North America segment also includes the Company’s transaction processing operations, which service its internal ATM operations, along with external customers. The Company’s operations in the U.K., Ireland, Germany, Spain, and South Africa are included in its Europe & Africa segment, along with i-design (the Company’s ATM advertising business based in the U.K.). The Company exited its operations in Poland at the end of 2018, that had previously been included in the Europe & Africa segment in 2018 and 2017. The Company’s Australia & New Zealand segment consists exclusively of its operations in Australia and New Zealand. The Corporate segment solely includes the Company’s corporate general and administrative expenses. While each of the reporting segments provides similar kiosk-based and/or ATM-related services, each segment is managed separately and requires different marketing and business strategies. Segment information presented for prior periods have been revised to reflect the changes in the Company’s segments.
Management uses Adjusted EBITDA, together with U.S. GAAP measures, to manage and measure the performance of its segments. Management believes Adjusted EBITDA is a useful measure to more effectively evaluate the performance of the business and compare its results of operations from period to period without regard to financing methods, capital structure, or non-recurring costs as defined by the Company. Adjusted EBITDA excludes depreciation and accretion, amortization of deferred financing costs and note discounts, amortization of intangible assets, share-based compensation expense, certain other income and expense amounts, acquisition related expenses, gains or losses on disposal and impairment of assets, certain non-operating expenses, (if applicable in a particular period), our obligation for the payment of income taxes, interest expense and other obligations such as capital expenditures, and includes an adjustment for noncontrolling interests. Depreciation and accretion expense and amortization of intangible assets are excluded from Adjusted EBITDA as these amounts can vary substantially from company to company within our industry depending upon accounting methods and book values of assets, capital structures, and the methods by which the assets were acquired.
Adjusted EBITDA as defined by the Company is a non-GAAP financial measure provided as a complement to the financial results prepared in accordance with U.S. GAAP. It may not be defined in the same manner by all companies and therefore may not be comparable to other similarly titled measures of other companies. In evaluating the Company’s performance as measured by Adjusted EBITDA, management recognizes and considers the limitations of this measurement. Therefore, Adjusted EBITDA should not be considered in isolation or as a substitute for operating income, net income, cash flows from operating, investing, or financing activities, or other income or cash flow measures contained within our consolidated financial statements.
118
The following table is a reconciliation of Net income (loss) attributable to controlling interests and available to common shareholders to EBITDA and Adjusted EBITDA:
Year Ended December 31, | |||||||||||
2019 | 2018 | 2017 | |||||||||
(In thousands) | |||||||||||
Net income (loss) attributable to controlling interests and available to common shareholders | $ | $ | $ | ( | ) | ||||||
Adjustments: | |||||||||||
Interest expense, net | |||||||||||
Amortization of deferred financing costs and note discount | |||||||||||
Redemption costs for early extinguishment of debt | |||||||||||
Income tax expense (benefit) | ( | ) | |||||||||
Depreciation and accretion expense | |||||||||||
Amortization of intangible assets | |||||||||||
EBITDA | $ | $ | $ | ||||||||
Add back: | |||||||||||
Loss on disposal and impairment of assets (1) | |||||||||||
Other (income) expense (2) | ( | ) | ( | ) | |||||||
Noncontrolling interests (3) | ( | ) | |||||||||
Share-based compensation expense | |||||||||||
Restructuring expenses (4) | |||||||||||
Acquisition related expenses (5) | |||||||||||
Adjusted EBITDA | $ | $ | $ | ||||||||
(1) | Loss of disposal and impairment of assets includes a goodwill impairment of $ |
(2) | Includes the revaluation of the estimated acquisition related contingent consideration, foreign currency translation gains/losses and other non-operating costs. |
(3) | Noncontrolling interest adjustment made such that Adjusted EBITDA includes only the Company’s ownership interest in the Adjusted EBITDA of one of its Mexican subsidiaries. |
(4) | For the years ended December 31, 2019, 2018, and 2017, restructuring expenses include employee severance and other costs incurred in conjunction with the Company's corporate reorganization and cost reduction initiatives. For the year ended December 31, 2017, restructuring expenses also include amounts associated with the Company’s redomicile of its parent company to the U.K. that occurred on July 1, 2016. |
(5) | Acquisition related expenses include costs incurred for professional and legal fees and certain other transition and integration-related costs. For the twelve months ended December 31, 2017, expenses also include employee severance and lease termination costs related to DCPayments acquisition integration. |
119
The following tables reflect certain financial information for each of the Company’s reporting segments for the periods presented:
Year ended December 31, 2019 (1) | |||||||||||||||||||||||
North America | Europe & Africa | Australia & New Zealand | Corporate | Eliminations | Total | ||||||||||||||||||
(In thousands) | |||||||||||||||||||||||
Revenue from external customers | $ | $ | $ | $ | $ | ||||||||||||||||||
Intersegment revenues | — | ( | ) | — | |||||||||||||||||||
Cost of revenues | ( | ) | |||||||||||||||||||||
Selling, general, and administrative expenses | |||||||||||||||||||||||
Restructuring expenses | |||||||||||||||||||||||
Loss (gain) on disposal and impairment of assets | ( | ) | |||||||||||||||||||||
Adjusted EBITDA | ( | ) | |||||||||||||||||||||
Capital expenditures (2) | $ | $ | $ | $ | $ | $ | |||||||||||||||||
Year ended December 31, 2018 (1) | |||||||||||||||||||||||
North America | Europe & Africa | Australia & New Zealand | Corporate | Eliminations | Total | ||||||||||||||||||
(In thousands) | |||||||||||||||||||||||
Revenue from external customers | $ | $ | $ | $ | $ | — | $ | ||||||||||||||||
Intersegment revenues | — | ( | ) | — | |||||||||||||||||||
Cost of revenues | ( | ) | |||||||||||||||||||||
Selling, general, and administrative expenses | ( | ) | |||||||||||||||||||||
Redomicile-related expenses | |||||||||||||||||||||||
Restructuring expenses | |||||||||||||||||||||||
Acquisition related expenses | ( | ) | |||||||||||||||||||||
Loss on disposal and impairment of assets | |||||||||||||||||||||||
Adjusted EBITDA | ( | ) | ( | ) | |||||||||||||||||||
Capital expenditures (2) | $ | $ | $ | $ | $ | $ | |||||||||||||||||
120
Year ended December 31, 2017 (1) | |||||||||||||||||||||||
North America | Europe & Africa | Australia & New Zealand | Corporate | Eliminations | Total | ||||||||||||||||||
(In thousands) | |||||||||||||||||||||||
Revenue from external customers | $ | $ | $ | $ | $ | — | $ | ||||||||||||||||
Intersegment revenues | — | ( | ) | — | |||||||||||||||||||
Cost of revenues | ( | ) | |||||||||||||||||||||
Selling, general, and administrative expenses | |||||||||||||||||||||||
Redomicile-related expenses | |||||||||||||||||||||||
Restructuring expenses | |||||||||||||||||||||||
Acquisition related expenses | |||||||||||||||||||||||
Loss on disposal and impairment of assets | |||||||||||||||||||||||
Adjusted EBITDA | ( | ) | ( | ) | |||||||||||||||||||
Capital expenditures (2) | $ | $ | $ | $ | $ | $ | |||||||||||||||||
(1) | The segment information presented for the years ended December 31, 2018 and 2017 have been revised to ensure consistency with the current allocation of certain intercompany revenues and expenses for the year ended December 31, 2019. |
(2) | Capital expenditures include payments made for plant, property, and equipment, exclusive license agreements, and site acquisition costs. Additionally, capital expenditures for one of the Company’s Mexican subsidiaries, included in the North America segment, are reflected gross of any noncontrolling interest amounts. |
Identifiable Assets
December 31, 2019 | December 31, 2018 | ||||||
(In thousands) | |||||||
North America | $ | $ | |||||
Europe & Africa | |||||||
Australia & New Zealand | |||||||
Corporate | |||||||
Total | $ | $ | |||||
(23) Supplemental Guarantor Financial Information
The 2025 Notes are fully and unconditionally and jointly and severally guaranteed on a senior unsecured basis by Cardtronics plc and certain of its subsidiaries and certain of its future subsidiaries, with the exception of Cardtronics plc’s immaterial subsidiaries and CFC Guarantors (as defined in the Credit Agreement). The guarantees of the 2025 Notes by any Guarantor are subject to automatic and customary releases upon: (i) the sale or disposition of all or substantially all of the assets of the Guarantor, (ii) the disposition of sufficient capital stock of the Guarantor so that it no longer qualifies under the Indenture as a restricted subsidiary of the Company, (iii) the designation of the Guarantor as an unrestricted subsidiary in accordance with the Indenture, (iv) the legal or covenant defeasance of the notes or the satisfaction and discharge of the Indenture, (v) the liquidation or dissolution of the Guarantor, or (vi) provided the Guarantor is not wholly-owned by the Company, its ceasing to guarantee other debt of the Company or another Guarantor. A Guarantor may not sell or otherwise dispose of all or substantially all of its properties or assets to, or consolidate with or merge into another company (other than the Company or another Guarantor), unless no default under the Indenture exists and either the successor to the Guarantor assumes its guarantee of the 2025 Notes or the disposition, consolidation, or merger complies with the “Asset Sales” covenant in the Indenture.
121
The following information reflects the Condensed Consolidating Statements of Comprehensive (Loss) Income and Condensed Consolidated Statements of Cash Flows for the years ended December 31, 2019, 2018, and 2017 and the Condensed Consolidating Balance Sheets as of December 31, 2019 and 2018 for: (i) Cardtronics plc, the parent Guarantor of the 2025 Notes (“Parent”), (ii) Cardtronics Delaware and Cardtronics U.S.A. (“Issuers”), (iii) the 2025 Notes Guarantors (the “Guarantors”), and (iv) the 2025 Notes Non-Guarantors.
Condensed Consolidating Statements of Comprehensive Income (Loss)
Year Ended December 31, 2019 | |||||||||||||||||||||||
Parent | Issuers | Guarantors | Non-Guarantors | Eliminations | Total | ||||||||||||||||||
(In thousands) | |||||||||||||||||||||||
Revenues | $ | $ | $ | $ | $ | ( | ) | $ | |||||||||||||||
Operating costs and expenses | ( | ) | |||||||||||||||||||||
Loss on disposal and impairment of assets | |||||||||||||||||||||||
(Loss) income from operations | ( | ) | |||||||||||||||||||||
Interest expense (income), net, including amortization of deferred financing costs and note discount | ( | ) | |||||||||||||||||||||
Equity in earnings of subsidiaries | ( | ) | ( | ) | ( | ) | ( | ) | |||||||||||||||
Other (income) expense | ( | ) | ( | ) | ( | ) | ( | ) | |||||||||||||||
Income before income taxes | ( | ) | |||||||||||||||||||||
Income tax (benefit) expense | ( | ) | |||||||||||||||||||||
Net income | ( | ) | |||||||||||||||||||||
Net loss attributable to noncontrolling interests | ( | ) | ( | ) | |||||||||||||||||||
Net income attributable to controlling interests and available to common shareholders | ( | ) | |||||||||||||||||||||
Other comprehensive loss attributable to controlling interest | ( | ) | ( | ) | ( | ) | ( | ) | ( | ) | |||||||||||||
Comprehensive income attributable to controlling interests | $ | $ | $ | $ | $ | ( | ) | $ | |||||||||||||||
122
Year Ended December 31, 2018 | |||||||||||||||||||||||
Parent | Issuers | Guarantors | Non-Guarantors | Eliminations | Total | ||||||||||||||||||
(In thousands) | |||||||||||||||||||||||
Revenues | $ | $ | $ | $ | $ | ( | ) | $ | |||||||||||||||
Operating costs and expenses | ( | ) | |||||||||||||||||||||
Loss (gain) on disposal and impairment of assets | ( | ) | |||||||||||||||||||||
(Loss) income from operations | ( | ) | ( | ) | |||||||||||||||||||
Interest expense (income), net, including amortization of deferred financing costs and note discount | ( | ) | |||||||||||||||||||||
Redemption costs for early extinguishment of debt | |||||||||||||||||||||||
Equity in (earnings) loss of subsidiaries | ( | ) | ( | ) | ( | ) | |||||||||||||||||
Other (income) expense | ( | ) | ( | ) | ( | ) | ( | ) | |||||||||||||||
(Loss) income before income taxes | ( | ) | ( | ) | |||||||||||||||||||
Income tax (benefit) expense | ( | ) | |||||||||||||||||||||
Net income | ( | ) | |||||||||||||||||||||
Net loss attributable to noncontrolling interests | ( | ) | ( | ) | |||||||||||||||||||
Net income attributable to controlling interests and available to common shareholders | ( | ) | |||||||||||||||||||||
Other comprehensive (loss) income attributable to controlling interest | ( | ) | ( | ) | ( | ) | ( | ) | |||||||||||||||
Comprehensive (loss) income attributable to controlling interests | $ | ( | ) | $ | $ | $ | $ | ( | ) | $ | ( | ) | |||||||||||
123
Year Ended December 31, 2017 | |||||||||||||||||||||||
Parent | Issuers | Guarantors | Non-Guarantors | Eliminations | Total | ||||||||||||||||||
(In thousands) | |||||||||||||||||||||||
Revenues | $ | $ | $ | $ | $ | ( | ) | $ | |||||||||||||||
Operating costs and expenses | ( | ) | |||||||||||||||||||||
Loss on disposal and impairment of assets | |||||||||||||||||||||||
(Loss) income from operations | ( | ) | ( | ) | ( | ) | |||||||||||||||||
Interest expense (income), net, including amortization of deferred financing costs and note discount | ( | ) | ( | ) | |||||||||||||||||||
Equity in loss (earnings) of subsidiaries | ( | ) | ( | ) | ( | ) | ( | ) | |||||||||||||||
Other (income) expense | ( | ) | ( | ) | ( | ) | |||||||||||||||||
(Loss) income before income tax | ( | ) | ( | ) | ( | ) | |||||||||||||||||
Income tax (benefit) expense | ( | ) | ( | ) | ( | ) | |||||||||||||||||
Net (loss) income | ( | ) | ( | ) | ( | ) | |||||||||||||||||
Net loss attributable to noncontrolling interests | ( | ) | ( | ) | |||||||||||||||||||
Net (loss) income attributable to controlling interests and available to common shareholders | ( | ) | ( | ) | ( | ) | |||||||||||||||||
Other comprehensive (loss) income attributable to controlling interests | ( | ) | |||||||||||||||||||||
Comprehensive (loss) income attributable to controlling interests | $ | ( | ) | $ | $ | ( | ) | $ | $ | $ | ( | ) | |||||||||||
124
Condensed Consolidating Balance Sheets
As of December 31, 2019 | |||||||||||||||||||||||
Parent | Issuers | Guarantors | Non-Guarantors | Eliminations | Total | ||||||||||||||||||
(In thousands) | |||||||||||||||||||||||
Assets | |||||||||||||||||||||||
Cash and cash equivalents | $ | $ | $ | $ | $ | $ | |||||||||||||||||
Restricted cash | |||||||||||||||||||||||
Accounts and notes receivable, net | |||||||||||||||||||||||
Other current assets | |||||||||||||||||||||||
Total current assets | |||||||||||||||||||||||
Property and equipment, net | |||||||||||||||||||||||
Intangible assets, net | |||||||||||||||||||||||
Goodwill | |||||||||||||||||||||||
Operating lease assets | |||||||||||||||||||||||
Investments in and advances to subsidiaries | ( | ) | |||||||||||||||||||||
Intercompany receivable | ( | ) | ( | ) | |||||||||||||||||||
Deferred tax asset, net | ( | ) | |||||||||||||||||||||
Prepaid expenses, deferred costs, and other noncurrent assets | |||||||||||||||||||||||
Total assets | $ | $ | $ | $ | $ | ( | ) | $ | |||||||||||||||
Liabilities and Shareholders' Equity | |||||||||||||||||||||||
Current portion of other long-term liabilities | |||||||||||||||||||||||
Accounts payable and accrued liabilities | |||||||||||||||||||||||
Total current liabilities | |||||||||||||||||||||||
Long-term debt | |||||||||||||||||||||||
Intercompany payable | ( | ) | ( | ) | |||||||||||||||||||
Asset retirement obligations | |||||||||||||||||||||||
Noncurrent operating lease liabilities | |||||||||||||||||||||||
Deferred tax liability, net | |||||||||||||||||||||||
Other long-term liabilities | |||||||||||||||||||||||
Total liabilities | ( | ) | |||||||||||||||||||||
Shareholders' equity | ( | ) | |||||||||||||||||||||
Total liabilities and shareholders' equity | $ | $ | $ | $ | $ | ( | ) | $ | |||||||||||||||
125
As of December 31, 2018 | |||||||||||||||||||||||
Parent | Issuers | Guarantors | Non-Guarantors | Eliminations | Total | ||||||||||||||||||
(In thousands) | |||||||||||||||||||||||
Assets | |||||||||||||||||||||||
Cash and cash equivalents | $ | $ | $ | $ | $ | $ | |||||||||||||||||
Restricted Cash | |||||||||||||||||||||||
Accounts and notes receivable, net | |||||||||||||||||||||||
Other current assets | |||||||||||||||||||||||
Total current assets | |||||||||||||||||||||||
Property and equipment, net | |||||||||||||||||||||||
Intangible assets, net | |||||||||||||||||||||||
Goodwill | |||||||||||||||||||||||
Investments in and advances to subsidiaries | ( | ) | |||||||||||||||||||||
Intercompany receivable | ( | ) | |||||||||||||||||||||
Deferred tax asset, net | ( | ) | |||||||||||||||||||||
Prepaid expenses, deferred costs, and other noncurrent assets | |||||||||||||||||||||||
Total assets | $ | $ | $ | $ | $ | ( | ) | $ | |||||||||||||||
Liabilities and Shareholders' Equity | |||||||||||||||||||||||
Current portion of other long-term liabilities | |||||||||||||||||||||||
Accounts payable and accrued liabilities | |||||||||||||||||||||||
Total current liabilities | |||||||||||||||||||||||
Long-term debt | ( | ) | |||||||||||||||||||||
Intercompany payable | ( | ) | |||||||||||||||||||||
Asset retirement obligations | |||||||||||||||||||||||
Deferred tax liability, net | |||||||||||||||||||||||
Other long-term liabilities | |||||||||||||||||||||||
Total liabilities | ( | ) | |||||||||||||||||||||
Shareholders' equity | ( | ) | |||||||||||||||||||||
Total liabilities and shareholders' equity | $ | $ | $ | $ | $ | ( | ) | $ | |||||||||||||||
126
Condensed Consolidated Statement of Cash Flows
Year Ended December 31, 2019 | |||||||||||||||||||||||
Parent | Issuers | Guarantors | Non-Guarantors | Eliminations | Total | ||||||||||||||||||
(In thousands) | |||||||||||||||||||||||
Net cash provided by operating activities | $ | $ | $ | $ | $ | $ | |||||||||||||||||
Additions to property and equipment | ( | ) | ( | ) | ( | ) | ( | ) | |||||||||||||||
Acquisitions, net of cash acquired | ( | ) | ( | ) | |||||||||||||||||||
Net cash used in investing activities | ( | ) | ( | ) | ( | ) | ( | ) | |||||||||||||||
Proceeds from borrowings under revolving credit facility | |||||||||||||||||||||||
Repayments of borrowings under revolving credit facility | ( | ) | ( | ) | ( | ) | ( | ) | |||||||||||||||
Intercompany financing | ( | ) | |||||||||||||||||||||
Tax payments related to share-based compensation | ( | ) | ( | ) | |||||||||||||||||||
Proceeds from exercises of stock options | |||||||||||||||||||||||
Debt issuance, modification, and redemption costs | ( | ) | ( | ) | |||||||||||||||||||
Repurchase of common shares | ( | ) | ( | ) | |||||||||||||||||||
Net cash used in financing activities | ( | ) | ( | ) | ( | ) | ( | ) | ( | ) | |||||||||||||
Effect of exchange rate changes on cash, cash equivalents, and restricted cash | |||||||||||||||||||||||
Net (decrease) increase in cash, cash equivalents, and restricted cash | ( | ) | ( | ) | ( | ) | ( | ) | |||||||||||||||
Cash, cash equivalents, and restricted cash as of beginning of period | |||||||||||||||||||||||
Cash, cash equivalents, and restricted cash as of end of period | $ | $ | $ | $ | $ | $ | |||||||||||||||||
127
Year Ended December 31, 2018 | |||||||||||||||||||||||
Parent | Issuers | Guarantors | Non-Guarantors | Eliminations | Total | ||||||||||||||||||
(In thousands) | |||||||||||||||||||||||
Net cash provided by operating activities | $ | ||||||||||||||||||||||
Additions to property and equipment | ( | ) | ( | ) | ( | ) | ( | ) | |||||||||||||||
Acquisitions, net of cash acquired | ( | ) | ( | ) | |||||||||||||||||||
Net cash used in investing activities | ( | ) | ( | ) | ( | ) | ( | ) | |||||||||||||||
Proceeds from borrowings under revolving credit facility | |||||||||||||||||||||||
Repayments of borrowings under revolving credit facility | ( | ) | ( | ) | ( | ) | ( | ) | |||||||||||||||
Redemption of long-term notes | ( | ) | ( | ) | |||||||||||||||||||
Intercompany financing | ( | ) | ( | ) | |||||||||||||||||||
Tax payments related to share-based compensation | ( | ) | ( | ) | |||||||||||||||||||
Proceeds from exercise of stock options | |||||||||||||||||||||||
Debt issuance, modification, and redemption costs | ( | ) | ( | ) | |||||||||||||||||||
Net cash (used in) provided by financing activities | ( | ) | ( | ) | ( | ) | ( | ) | |||||||||||||||
Effect of exchange rate changes on cash, cash equivalents, and restricted cash | ( | ) | ( | ) | ( | ) | |||||||||||||||||
Net increase (decrease) in cash, cash equivalents, and restricted cash | ( | ) | |||||||||||||||||||||
Cash, cash equivalents, and restricted cash as of beginning of period | |||||||||||||||||||||||
Cash, cash equivalents, and restricted cash as of end of period | $ | $ | $ | $ | $ | $ | |||||||||||||||||
128
Year Ended December 31, 2017 | |||||||||||||||||||||||
Parent | Issuers | Guarantors | Non-Guarantors | Eliminations | Total | ||||||||||||||||||
(In thousands) | |||||||||||||||||||||||
Net cash provided by (used in) operating activities | $ | $ | $ | ( | ) | $ | $ | $ | |||||||||||||||
Additions to property and equipment | ( | ) | ( | ) | ( | ) | ( | ) | |||||||||||||||
Acquisitions, net of cash acquired | ( | ) | ( | ) | ( | ) | ( | ) | |||||||||||||||
Net cash used in investing activities | ( | ) | ( | ) | ( | ) | ( | ) | |||||||||||||||
Proceeds from borrowings under revolving credit facility | |||||||||||||||||||||||
Repayments of borrowings under revolving credit facility | ( | ) | ( | ) | ( | ) | ( | ) | |||||||||||||||
Proceeds from borrowings of long-term debt | |||||||||||||||||||||||
Debt issuance costs | ( | ) | ( | ) | |||||||||||||||||||
Intercompany financing | ( | ) | |||||||||||||||||||||
Tax payments related to share-based compensation | ( | ) | ( | ) | |||||||||||||||||||
Proceeds from exercise of stock options | |||||||||||||||||||||||
Net cash (used in) provided by financing activities | ( | ) | ( | ) | |||||||||||||||||||
Effect of exchange rate changes on cash | ( | ) | |||||||||||||||||||||
Net (decrease) increase in cash and cash equivalents | ( | ) | ( | ) | ( | ) | |||||||||||||||||
Cash and cash equivalents as of beginning of period | |||||||||||||||||||||||
Cash and cash equivalents as of end of period | $ | $ | $ | $ | $ | $ | |||||||||||||||||
129
(24) Supplemental Selected Quarterly Financial Information (Unaudited)
The Company’s financial information by quarter is summarized below for the periods indicated:
Quarter Ended | |||||||||||||||||||
March 31 | June 30 | September 30 | December 31 | Total | |||||||||||||||
(In thousands, excluding per share amounts) | |||||||||||||||||||
2019 | |||||||||||||||||||
Total revenues | $ | $ | $ | $ | $ | ||||||||||||||
Net income | |||||||||||||||||||
Net income attributable to controlling interests and available to common shareholders | |||||||||||||||||||
Basic net income per common share | $ | $ | $ | $ | $ | ||||||||||||||
Diluted net income per common share | $ | $ | $ | $ | $ | ||||||||||||||
2018 | |||||||||||||||||||
Total revenues | $ | $ | $ | $ | $ | ||||||||||||||
Net (loss) income | ( | ) | ( | ) | |||||||||||||||
Net (loss) income attributable to controlling interests and available to common shareholders | ( | ) | ( | ) | |||||||||||||||
Basic net (loss) income per common share | $ | ( | ) | $ | $ | $ | ( | ) | $ | ||||||||||
Diluted net (loss) income per common share | $ | ( | ) | $ | $ | $ | ( | ) | $ | ||||||||||
ITEM 9. CHANGES IN AND DISAGREEMENTS WITH ACCOUNTANTS ON ACCOUNTING AND FINANCIAL DISCLOSURE
There have been no changes in or disagreements on any matters of accounting principles or financial statement disclosure between the Company and its independent registered public accountants.
ITEM 9A. CONTROLS AND PROCEDURES
Evaluation of Disclosure Controls and Procedures
As required by Rule 13a-15(b) under the Securities Exchange Act of 1934, as amended (the “Exchange Act”), the Company have evaluated, under the supervision and with the participation of its management, including its principal executive officer and principal financial officer, the effectiveness of the design and operation of its disclosure controls and procedures (as defined in Rules 13a-15(e) and 15d-15(e) under the Exchange Act) as of the end of the period covered by this Annual Report on Form 10-K (this “2019 Form 10-K”). The Company’s disclosure controls and procedures are designed to provide reasonable assurance that information required to be disclosed by the Company in reports that it files under the Exchange Act is accumulated and communicated to its management, including its principal executive officer and principal financial officer, as appropriate, to allow timely decisions regarding required disclosure and is recorded, processed, summarized, and reported within the time periods specified in the rules and forms of the SEC. Based upon that evaluation, the Company’s principal executive officer and principal financial officer concluded that its disclosure controls and procedures were effective as of December 31, 2019 at the reasonable assurance level.
Changes in Internal Controls over Financial Reporting
As previously disclosed, during the third quarter of 2019, the Company implemented a cloud based Enterprise Resource Planning (“ERP”) system and other associated financial consolidation and reporting systems. In connection with this implementation, the Company has updated the processes that comprise the Company's internal control over financial reporting, as necessary, to accommodate related changes in the Company's systems and business processes. To date, this implementation has
130
not had, and the Company does not believe this implementation will have in the future, an adverse effect on the Company's internal control over financial reporting. Except as disclosed above, there were no other material changes in the Company's internal control over financial reporting (as such term is defined in Exchange Act Rules 13a-15(f) and 15d-15(f)) that occurred during the three months ended December 31, 2019, that have materially affected, or are reasonably likely to materially affect, the Company's internal control over financial reporting.
Management’s Annual Report on Internal Control over Financial Reporting
The Company’s management is responsible for establishing and maintaining adequate internal control over financial reporting (as defined in Rules 13a-15(f) under the Exchange Act). The Company’s internal control over financial reporting is a process designed by management, under the supervision and with the participation of its principal executive officer and principal financial officer, to provide reasonable assurance regarding the reliability of financial reporting and the preparation of consolidated financial statements in accordance with U.S. GAAP. The Company’s internal control over financial reporting includes those policies and procedures that: (i) relate to the maintenance of records that, in reasonable detail, accurately and fairly reflect the transactions and dispositions of its assets, (ii) provide reasonable assurance that transactions are recorded as necessary to permit preparation of consolidated financial statements in accordance with U.S. GAAP, and that its receipts and expenditures are being made only in accordance with authorizations of its management and directors, and (iii) provide reasonable assurance regarding prevention or timely detection of unauthorized acquisition, use, or disposition of its assets that could have a material effect on its consolidated financial statements.
Because of its inherent limitations, internal control over financial reporting may not prevent or detect misstatements. Also, projections of any evaluation of effectiveness to future periods are subject to the risk that controls may become inadequate because of changes in conditions, or that the degree of compliance with the policies or procedures may deteriorate.
The scope of management’s assessment of the effectiveness of the Company’s internal control over financial reporting as of December 31, 2019 includes its consolidated subsidiaries.
The Company’s management, under the supervision and with the participation of its principal executive officer and principal financial officer, assessed the effectiveness of its internal control over financial reporting as of December 31, 2019 based on the framework in Internal Control - Integrated Framework (2013) issued by the Committee of Sponsoring Organizations of the Treadway Commission (COSO). Based on the Company’s evaluation under the framework in Internal Control - Integrated Framework (2013), its management concluded that its internal control over financial reporting was effective as of December 31, 2019.
131
Attestation Report of the Independent Registered Public Accounting Firm
The Company’s internal control over financial reporting as of December 31, 2019 has been audited by KPMG LLP, an independent registered public accounting firm that audited the Company’s consolidated financial statements included in this 2019 Form 10-K, as stated in the attestation report which is included in Item 8. Financial Statements and Supplementary Data, Reports of Independent Registered Public Accounting Firm.
ITEM 9B. OTHER INFORMATION
None.
132
PART III
ITEM 10. DIRECTORS, EXECUTIVE OFFICERS AND CORPORATE GOVERNANCE
Code of Ethics
The Company has adopted a Code of Ethics applicable to its principal executive officer, principal financial officer, principal accounting officer, and persons performing similar functions. A copy of the Code of Ethics is available on the Company’s website at http://www.cardtronics.com, and you may also request a copy of the Code of Ethics at no cost, by writing or telephoning at the following: Cardtronics plc, Attention: General Counsel, 2050 West Sam Houston Parkway South, Suite 1300, Houston, Texas 77042, (832) 308-4000. The Company intends to disclose any amendments to or waivers of the Code of Ethics on behalf of its Chief Executive Officer, Chief Financial Officer, Chief Accounting Officer, and persons performing similar functions on its website at http://www.cardtronics.com promptly following the date of any such amendment or waiver.
Pursuant to General Instruction G of Form 10-K, the Company incorporates by reference into this Item 10 the remaining information required by this Item 10 from the information to be disclosed in its definitive proxy statement for its 2020 Annual Meeting of Shareholders.
ITEM 11. EXECUTIVE COMPENSATION
Pursuant to General Instruction G of Form 10-K, the Company incorporates by reference into this Item 11 the information to be disclosed in its definitive proxy statement for its 2020 Annual Meeting of Shareholders.
ITEM 12. SECURITY OWNERSHIP OF CERTAIN BENEFICIAL OWNERS AND MANAGEMENT AND RELATED STOCKHOLDER MATTERS
Pursuant to General Instruction G of Form 10-K, the Company incorporates by reference into this Item 12 the information to be disclosed in its definitive proxy statement for its 2020 Annual Meeting of Shareholders.
ITEM 13. CERTAIN RELATIONSHIPS AND RELATED TRANSACTIONS, AND DIRECTOR INDEPENDENCE
Pursuant to General Instruction G of Form 10-K, the Company incorporates by reference into this Item 13 the information to be disclosed in its definitive proxy statement for its 2020 Annual Meeting of Shareholders.
ITEM 14. PRINCIPAL ACCOUNTING FEES AND SERVICES
Pursuant to General Instruction G of Form 10-K, the Company incorporates by reference into this Item 14 the information to be disclosed in its definitive proxy statement for its 2020 Annual Meeting of Shareholders.
133
PART IV
ITEM 15. EXHIBITS AND FINANCIAL STATEMENT SCHEDULES
1. Consolidated Financial Statements
Page | |
2. Financial Statement Schedules
All schedules are omitted because they are either not applicable or required information is reported in the consolidated financial statements or notes thereto.
3. Index to Exhibits
The exhibits required to be filed pursuant to the requirements of Item 601 of Regulation S-K are reflected in the Index to Exhibits accompanying this 2019 Form 10-K.
ITEM 16. FORM 10-K SUMMARY
None.
Index to Exhibits
Exhibit Number | Description | |
2.1 | Agreement and Plan of Merger, dated April 27, 2016, by and among Cardtronics, Inc., Cardtronics Group Limited, CATM Merger Sub LLC and CATM Holdings LLC (incorporated herein by reference to Annex A of the Registration Statement on Form S-4, filed by Cardtronics plc on April 27, 2016, File No. 333-210955). | |
3.1 | Articles of Association of Cardtronics plc (incorporated herein by reference to Exhibit 3.1 of the Current Report on Form 8-K, filed by Cardtronics plc on July 1, 2016, File No. 001-37820). | |
4.1 | Indenture, dated as of April 4, 2017, by and among Cardtronics, Inc., Cardtronics USA, Inc., the subsidiary guarantors named therein and Wells Fargo Bank, National Association, as trustee, relating to Cardtronics, Inc.’s and Cardtronics USA, Inc.’s 5.5% Senior Notes due 2025 (incorporated herein by reference to Exhibit 4.1 of the Current Report on Form 8-K, filed by Cardtronics, PLC on April 5, 2017, File No. 001-37820). | |
4.2 | First Supplemental Indenture, dated as of April 28, 2017, by and among Cardtronics, Inc. Cardtronics USA Inc., Cardtronics plc, the subsidiary guarantors names therein and Wells Fargo Bank, National Association, as trustee, relating to Cardtronics, Inc.’s and Cardtronics USA, Inc.’s 5.5% Senior Notes due 2025 (incorporated herein by reference to Exhibit 4.2 of the Annual Report on Form 10-K, filed by Cardtronics, Inc. on February 28, 2018). | |
4.3 | Form of 5.5% Senior Note due 2025 (incorporated herein by reference to Exhibit 4.2 (included in Exhibit 4.1) of the Current Report on Form 8-K, filed by Cardtronics, PLC on April 5, 2017, File No. 001-37820). | |
4.4 | Indenture, dated as of November 25, 2013, by and among Cardtronics, Inc. and Wells Fargo Bank, National Association, as trustee, relating to Cardtronics, Inc.’s 1.00% Convertible Senior Notes due 2020 (incorporated herein by reference to Exhibit 4.1 of the Current Report on Form 8-K, filed by Cardtronics, Inc. on November 26, 2013, File No. 001-33864). | |
4.5 | First Supplemental Indenture, dated as of July 1, 2016, by and among Cardtronics, Inc., Cardtronics plc and Wells Fargo Bank, National Association, as trustee, relating to Cardtronics, Inc.’s 1.00% Convertible Senior Notes due 2020 (incorporated herein by reference to Exhibit 4.1 of the Current Report on Form 8-K, filed by Cardtronics plc on July 1, 2016, File No. 001-37820). | |
134
Exhibit Number | Description | |
4.6 | Form of 1.00% Convertible Senior Notes due 2020 (incorporated herein by reference to Exhibit A of Exhibit 4.1 of the Current Report on Form 8-K, filed by Cardtronics, Inc. on November 26, 2013, File No. 001-33864). | |
4.7 | Form of Class A ordinary share certificate for Cardtronics plc (incorporated herein by reference to Exhibit 4.3 of the Current Report on Form 8-K, filed by Cardtronics plc. on July 1, 2016, File No. 001-37820). | |
10.1 | Second Amended and Restated Credit Agreement, dated as of November 19, 2018, by and among Cardtronics plc, the other Obligors party thereto, JPMorgan Chase Bank, N.A., as Administrative Agent, J.P. Morgan Europe Limited, as Alternative Currency Agent, Bank of America, N.A., Barclays Bank plc and Wells Fargo Bank, N.A. as co-Syndication Agents and Capital One, N.A. and Compass Bank, as co-Documentation Agents, and the lenders party thereto.(incorporated herein by reference to Exhibit 10.1 of the Current Report on Form 8-K, filed by Cardtronics plc on November 19, 2018, File No. 001-37820). | |
10.2 | First Amendment to Second Amended and Restated Credit Agreement, dated September 19, 2019, by and among Cardtronics plc, the other Obligors party thereto, JPMorgan Chase Bank, N.A., as administrative agent (incorporated herein by reference to Exhibit 10.1 of the Current Report on Form 8-K, filed by Cardtronics plc on September 20, 2019, File No. 001-37820). | |
10.3 | Amended and Restated Base Bond Hedge Confirmation, dated as of October 26, 2016, by and among Cardtronics plc, Cardtronics, Inc. and Bank of America, N.A. (incorporated herein by reference to Exhibit 10.1 of the Current Report on Form 8-K, filed by Cardtronics plc on November 1, 2016, File No. 001-37820). | |
10.4 | Amended and Restated Base Bond Hedge Confirmation, dated as of October 26, 2016, by and among Cardtronics plc, Cardtronics, Inc. and JPMorgan Chase Bank, National Association, London Branch (incorporated herein by reference to Exhibit 10.2 of the Current Report on Form 8-K, filed by Cardtronics plc on November 1, 2016, File No. 001-37820). | |
10.5 | Amended and Restated Base Bond Hedge Confirmation, dated as of October 26, 2016, by and among Cardtronics plc, Cardtronics, Inc. and Wells Fargo Bank, National Association (incorporated herein by reference to Exhibit 10.3 of the Current Report on Form 8-K, filed by Cardtronics plc on November 1, 2016, File No. 001-37820). | |
10.6 | Amended and Restated Base Warrant Confirmation, dated as of October 26, 2016, by and among Cardtronics plc, Cardtronics, Inc. and Bank of America, N.A. (incorporated herein by reference to Exhibit 10.4 of the Current Report on Form 8-K, filed by Cardtronics plc on November 1, 2016, File No. 001-37820). | |
10.7 | Amended and Restated Base Warrant Confirmation, dated as of October 26, 2016, by and among Cardtronics plc, Cardtronics, Inc. and JPMorgan Chase Bank, National Association, London Branch (incorporated herein by reference to Exhibit 10.5 of the Current Report on Form 8-K, filed by Cardtronics plc on November 1, 2016, File No. 001-37820). | |
10.8 | Amended and Restated Base Warrant Confirmation, dated as of October 26, 2016, by and among Cardtronics plc, Cardtronics, Inc. and Wells Fargo Bank, National Association (incorporated herein by reference to Exhibit 10.6 of the Current Report on Form 8-K, filed by Cardtronics plc on November 1, 2016, File No. 001-37820). | |
10.9 | Amended and Restated Additional Bond Hedge Confirmation, dated as of October 26, 2016, by and among Cardtronics plc, Cardtronics, Inc. and Bank of America, N.A. (incorporated herein by reference to Exhibit 10.7 of the Current Report on Form 8-K, filed by Cardtronics plc. on November 1, 2016, File No. 001-37820). | |
10.10 | Amended and Restated Additional Bond Hedge Confirmation, dated as of October 26, 2016, by and among Cardtronics plc, Cardtronics, Inc. and JPMorgan Chase Bank, National Association, London Branch (incorporated herein by reference to Exhibit 10.8 of the Current Report on Form 8-K, filed by Cardtronics plc on October 26, 2016, File No. 001-37820). | |
10.11 | Amended and Restated Additional Bond Hedge Confirmation, dated as of October 26, 2016, by and among Cardtronics plc, Cardtronics, Inc. and Wells Fargo Bank, National Association (incorporated herein by reference to Exhibit 10.9 of the Current Report on Form 8-K, filed by Cardtronics plc on November 1, 2016, File No. 001-37820). | |
10.12 | Amended and Restated Additional Warrant Confirmation, dated as of October 26, 2016, by and among Cardtronics plc, Cardtronics, Inc. and Bank of America, N.A. (incorporated herein by reference to Exhibit 10.10 of the Current Report on Form 8-K, filed by Cardtronics plc on November 1, 2016, File No. 001-37820). | |
10.13 | Amended and Restated Additional Warrant Confirmation, dated as of October 26, 2016, by and among Cardtronics plc, Cardtronics, Inc. and JPMorgan Chase Bank, National Association, London Branch (incorporated herein by reference to Exhibit 10.11 of the Current Report on Form 8-K, filed by Cardtronics plc on November 1, 2016, File No. 001-37820). | |
10.14 | Amended and Restated Additional Warrant Confirmation, dated as of October 26, 2016, by and among Cardtronics plc, Cardtronics, Inc. and Wells Fargo Bank, National Association (incorporated herein by reference to Exhibit 10.12 of the Current Report on Form 8-K, filed by Cardtronics plc on November 1, 2016, File No. 001-37820). | |
135
Exhibit Number | Description | |
10.15† | Form of Deed of Indemnity of Cardtronics plc, entered into by each director of Cardtronics plc and each of the following officers: Steven A. Rathgaber, Edward H. West, E. Brad Conrad, Jerry Garcia, Dilshad Kasmani, Todd Ruden, Jonathan Simpson-Dent and Roger Craig (incorporated herein by reference to Exhibit 10.21 of the Annual Report on Form 10-K, filed by Cardtronics, Inc. on February 28, 2017, File No. 001-33864). | |
10.16† | Form of Indemnification Agreement of Cardtronics, Inc., entered into by each director of Cardtronics plc and each of the following officers: Steven A. Rathgaber, Edward H. West, E. Brad Conrad, Jerry Garcia and David Dove (incorporated herein by reference to Exhibit 10.7 of the Current Report on Form 8-K, filed by Cardtronics plc on July 1, 2016, File No. 001-37820). | |
10.17† | 2001 Stock Incentive Plan of Cardtronics Group, Inc., dated effective as of June 4, 2001 (incorporated herein by reference to Exhibit 10.21 of the Registration Statement on Form S-4, filed by Cardtronics, Inc. on January 20, 2006, File No. 333-131199). | |
10.18† | Amendment No. 1 to the 2001 Stock Incentive Plan of Cardtronics Group, Inc., dated effective as of January 30, 2004 (incorporated herein by reference to Exhibit 10.22 of the Registration Statement on Form S-4, filed by Cardtronics, Inc. on January 20, 2006, File No. 333-131199). | |
10.19† | Amendment No. 2 to the 2001 Stock Incentive Plan of Cardtronics Group, Inc., dated effective as of June 23, 2004 (incorporated herein by reference to Exhibit 10.23 of the Registration Statement on Form S-4, filed by Cardtronics, Inc. on January 20, 2006, File No. 333-131199). | |
10.20† | Amendment No. 3 to the 2001 Stock Incentive Plan of Cardtronics Group, Inc. dated effective as of May 9, 2006 (incorporated herein by reference to Exhibit 10.38 of Post-effective Amendment No. 1 to the Registration Statement on Form S-1, filed by Cardtronics, Inc. on December 10, 2007, File No. 333-145929). | |
10.21† | Amendment No. 4 to the 2001 Stock Incentive Plan of Cardtronics Group, Inc. dated effective as of August 22, 2007 (incorporated herein by reference to Exhibit 10.39 of Post-effective Amendment No. 1 to the Registration Statement on Form S-1, filed by Cardtronics, Inc. on December 10, 2007, File No. 333-145929). | |
10.22† | Amendment No. 5 to the 2001 Stock Incentive Plan of Cardtronics Group, Inc. dated effective as of November 26, 2007 (incorporated herein by reference to Exhibit 10.40 of Post-effective Amendment No. 1 to the Registration Statement on Form S-1, filed by Cardtronics, Inc. on December 10, 2007, File No. 333-145929). | |
10.23† | Third Amended and Restated 2007 Stock Incentive Plan (as assumed and adopted by Cardtronics plc, effective July 1, 2016) (incorporated herein by reference to Exhibit 10.3 of the Current Report on Form 8-K, filed by Cardtronics plc on July 1, 2016, File No. 001-37820). | |
10.24† | Form of Restricted Stock Unit Agreement (Time-Based) pursuant to the Third Amended and Restated 2007 Stock Incentive Plan (incorporated herein by reference to Exhibit 10.4 of the Current Report on Form 8-K, filed by Cardtronics plc on July 1, 2016, File No. 001-37820). | |
10.25† | Form of Restricted Stock Unit Agreement (Performance-Based) pursuant to the Third Amended and Restated 2007 Stock Incentive Plan (incorporated herein by reference to Exhibit 10.5 of the Current Report on Form 8-K, filed by Cardtronics plc on July 1, 2016, File No. 001-37820). | |
10.26† | Form of Non-Employee Director Restricted Stock Unit Agreement pursuant to the Third Amended and Restated 2007 Stock Incentive Plan (incorporated herein by reference to Exhibit 10.6 of Current Report on Form 8-K, filed by Cardtronics plc on July 1, 2016, File No. 001-37820). | |
10.27† | Form of Equity Restricted Stock Unit Agreement (Performance Based) pursuant to the Third Amended and Restated 2007 Stock Incentive Plan (incorporated herein by reference to Exhibit 10.5 of the Current Report on Form 8-K, filed by Cardtronics plc on July 1, 2016, File No. 001-37820). | |
10.28†* | Fourth Amended and Restated 2007 Stock Incentive Plan (adopted by Cardtronics plc on January 18, 2019 and incorporated herein by reference to Exhibit 10.35 of the Annual Report on Form 10-K, filed by Cardtronics plc on February 28, 2019). | |
10.29† | Form of Stock Option Award Agreement pursuant to the Fourth Amended and Restated 2007 Stock Incentive Plan (incorporated herein by reference to Exhibit 10.2 of the Quarterly Report on Form 10-Q, filed by Cardtronics plc on May 2, 2019, File No. 001-37820). | |
10.30† | Form of Restricted Stock Unit Agreement (Time-Based) pursuant to the Fourth Amended and Restated 2007 Stock Incentive Plan (incorporated herein by reference to Exhibit 10.3 of the Quarterly Report on Form 10-Q, filed by Cardtronics plc on May 2, 2019, File No. 001-37820 | |
10.31† | Form of Restricted Stock Unit Agreement (Performance-Based) pursuant to the Fourth Amended and Restated 2007 Stock Incentive Plan (incorporated herein by reference to Exhibit 10.4 of the Quarterly Report on Form 10-Q, filed by Cardtronics plc on May 2, 2019, File No. 001-37820). | |
10.32† | Form of Restricted Stock Unit Agreement (Market-Based) pursuant to the Fourth Amended and Restated 2007 Stock Incentive Plan (incorporated herein by reference to Exhibit 10.5 of the Quarterly Report on Form 10-Q, filed by Cardtronics plc on May 2, 2019, File No. 001-37820). | |
136
Exhibit Number | Description | |
10.33† | Form of Restricted Stock Unit Agreement (Special) pursuant to the Third Amended and Restated 2007 Stock Incentive Plan (incorporated herein by reference to Exhibit 10.6 of the Quarterly Report on Form 10-Q, filed by Cardtronics plc on May 2, 2019, File No. 001-37820). | |
10.34† | Form of Non-Employee Director Restricted Stock Unit Agreement pursuant to the Fourth Amended and Restated 2007 Stock Incentive Plan (incorporated herein by reference to Exhibit 10.7 of Quarterly Report on Form 10-Q, filed by Cardtronics plc on May 2, 2019, File No. 001-37820). | |
10.35 | Form of Restricted Stock Unit Agreement (Performance-Based) pursuant to the Fourth Amended and Restated 2007 Stock Incentive Plan (incorporated herein by reference to Exhibit 10.1 of the Quarterly Report on Form 10-Q, filed by Cardtronics plc on August 1, 2019, File No. 001-37820). | |
10.36 | Deed of Assumption, dated July 1, 2016, executed by Cardtronics plc (incorporated herein by reference to Exhibit 10.2 of the Current Report on Form 8-K, filed by Cardtronics plc on July 1, 2016, File No. 001-37820). | |
10.37†* | Form Annual Executive Cash Incentive Plan (incorporated herein by reference to Exhibit) 10.60 of the Annual Report on Form 10-K, filed by Cardtronics plc on February 28, 2019). | |
10.38† | Cardtronics, Inc. 2013 Long Term Incentive Plan, dated March 29, 2013 (incorporated herein by reference to Exhibit 10.1 of the Current Report on Form 8-K, filed by Cardtronics, Inc. on April 4, 2013, File No. 001-33864). | |
10.39† | Cardtronics, Inc. 2014 Long Term Incentive Plan, dated March 27, 2014 (incorporated herein by reference to Exhibit 99.3 of the Current Report on Form 8-K, filed by Cardtronics, Inc. on April 2, 2014, File No. 001-33864). | |
10.40† | Cardtronics, Inc. 2015 Long Term Incentive Plan, dated March 24, 2015 (incorporated herein by reference to Exhibit 10.3 of the Quarterly Report on Form 10-Q, filed by Cardtronics, Inc. on April 30, 2015, File No. 001-33864). | |
10.41† | Cardtronics, Inc. 2016 Long Term Incentive Plan (incorporated herein by reference to Exhibit 10.3 of the Quarterly Report on Form 10-Q, filed by Cardtronics, Inc. on April 28, 2016 File No. 001-33864). | |
10.42† | Cardtronics, Inc. 2016 Annual Bonus Pool Allocation Plan (incorporated by reference to Exhibit 10.1 of the Quarterly Report on Form 10-Q, filed by Cardtronics, Inc. on April 28, 2016, File No. 001-33864). | |
10.43† | Amended and Restated Employment Agreement by and between Cardtronics plc and Edward H. West, dated as of December 6, 2017 (incorporated herein by reference to Exhibit 10.01 of the Current Report on Form 8-K, filed by Cardtronics, Inc. on December 11, 2017, File No. 001-33864). | |
10.44† | Employment Agreement by and between Cardtronics plc and Gary W. Ferrera, dated effective as of November 28, 2017 (incorporated herein by reference to Exhibit 10.51 of the Annual Report on Form 10-K, filed by Cardtronics plc on February 28, 2018). | |
10.45† | Amendment to Employment agreement, dated July 31, 2019, by and between Cardtronics plc and Gary W. Ferrera (incorporated herein by reference to Exhibit 10.1 to Current Report on Form 8-K filed by Cardtronics plc on August 1, 2019, File No. 001-37820). | |
10.46† | Employment Agreement by and between Cardtronics USA, Inc. and Paul Gullo, dated effective as of May 14, 2018 (incorporated herein by reference to Exhibit 10.1 of the Quarterly Report on Form 10-Q, filed by Cardtronics plc on August 2, 2018). | |
10.48† | Employment agreement by and between Cardtronics USA, Inc. and Dan Antilley, dated effective as of October 9, 2018 (incorporated herein by reference to Exhibit 10.1 of the Quarterly Report on Form 10-Q, filed by Cardtronics plc on November 1, 2018). | |
10.50† | Employment agreement by and between Cardtronics USA, Inc. and Brian Bailey, dated effective as of October 10, 2018 (incorporated herein by reference to Exhibit 10.2 of the Quarterly Report on Form 10-Q, filed by Cardtronics plc on November 1, 2018). | |
10.51† | Employment agreement by and between Cardtronics USA, Inc. and Stuart Mackinnon, dated effective as of October 9, 2018 (incorporated herein by reference to Exhibit 10.3 of the Quarterly Report on Form 10-Q, filed by Cardtronics plc on November 1, 2018). | |
10.53†* | Employment agreement by and between Cardtronics USA, Inc. and J. Brad Nolan, dated October 9, 2018.(incorporated herein by reference to Exhibit 10.58 of the Annual Report on Form 10-K, filed by Cardtronics plc on February 28, 2019). | |
137
Exhibit Number | Description | |
10.54†* | Employment agreement by and between Cardtronics USA, Inc. and Geri R. House, dated October 9, 2018.(incorporated herein by reference to Exhibit 10.59 of the Annual Report on Form 10-K, filed by Cardtronics plc on February 28, 2019). | |
10.55†* | Employment agreement by and between Cardtronics USA, Inc. and Aimie Killeen dated February 24, 2019.(incorporated herein by reference to Exhibit 10.60 of the Annual Report on Form 10-K, filed by Cardtronics plc on February 28, 2019). | |
10.57 | Employment agreement by and between Cardtronics USA, Inc. and Paul Wilmore dated March 22, 2019 (incorporated herein by reference to Exhibit 10.1 to Quarterly Report on Form 10-Q filed by Cardtronics plc on May 2, 2019, File No. 001-37820). | |
101.INS* | XBRL Instance Document | |
101.SCH* | XBRL Taxonomy Extension Schema Document | |
101.CAL* | XBRL Taxonomy Extension Calculation Linkbase Document | |
101.LAB* | XBRL Taxonomy Extension Label Linkbase Document | |
101.PRE* | XBRL Taxonomy Extension Presentation Linkbase Document | |
101.DEF* | XBRL Taxonomy Extension Definition Linkbase Document | |
* Filed herewith.
† Management contract or compensatory plan or arrangement.
138
SIGNATURES
Pursuant to the requirements of Section 13 or 15(d) of the Securities Exchange Act of 1934, the registrant has duly caused this report to be signed on its behalf by the undersigned, thereunto duly authorized, in the City of Houston, State of Texas, on March 2, 2020.
Cardtronics plc
/s/ Edward H. West | |
Edward H. West | |
Chief Executive Officer and Director | |
(Principal Executive Officer) | |
Pursuant to the requirements of the Securities Exchange Act of 1934, this report has been signed below by the following persons on behalf of the registrant in the capacities indicated on March 2, 2020.
Signature | Title | |
/s/ Edward H. West | Chief Executive Officer and Director | |
Edward H. West | (Principal Executive Officer) | |
/s/ Gary W. Ferrera | Chief Financial Officer | |
Gary W. Ferrera | (Principal Financial Officer) | |
/s/ Paul A. Gullo | Chief Accounting Officer | |
Paul A. Gullo | (Principal Accounting Officer) | |
/s/ Mark Rossi | ||
Mark Rossi | Chairman of the Board of Directors | |
/s/ Juli Spottiswood | ||
Juli Spottiswood | Director | |
/s/ Jorge M. Diaz | ||
Jorge M. Diaz | Director | |
/s/ G. Patrick Phillips | ||
G. Patrick Phillips | Director | |
/s/ Julie Gardner | ||
Julie Gardner | Director | |
/s/ Warren Jenson | ||
Warren Jenson | Director | |
/s/Douglas Braunstein | ||
Douglas Braunstein | Director | |
139