Exhibit 99.1
Appendix
Page 1
Adient plc
Condensed Consolidated Statements of Income
(Unaudited)
| Three Months Ended June 30, | ||||||||||||||
| (in millions, except per share data) | 2023 | 2022 | ||||||||||||
| Net sales | $ | 4,055 | $ | 3,485 | ||||||||||
| Cost of sales | 3,753 | 3,312 | ||||||||||||
| Gross profit | 302 | 173 | ||||||||||||
| Selling, general and administrative expenses | 148 | 142 | ||||||||||||
| Restructuring and impairment costs | 6 | 12 | ||||||||||||
| Equity income (loss) | 25 | 16 | ||||||||||||
| Earnings (loss) before interest and income taxes | 173 | 35 | ||||||||||||
| Net financing charges | 49 | 39 | ||||||||||||
| Other pension expense (income) | 1 | (4) | ||||||||||||
| Income (loss) before income taxes | 123 | — | ||||||||||||
| Income tax provision (benefit) | 28 | 20 | ||||||||||||
| Net income (loss) | 95 | (20) | ||||||||||||
| Income attributable to noncontrolling interests | 22 | 10 | ||||||||||||
| Net income (loss) attributable to Adient | $ | 73 | $ | (30) | ||||||||||
| Diluted earnings (loss) per share | $ | 0.77 | $ | (0.32) | ||||||||||
| Shares outstanding at period end | 93.7 | 94.8 | ||||||||||||
| Diluted weighted average shares | 94.9 | 94.8 | ||||||||||||
Appendix
Page 2
Adient plc
Condensed Consolidated Statements of Financial Position
(Unaudited)
| June 30, | September 30, | |||||||||||||
| (in millions) | 2023 | 2022 | ||||||||||||
| Assets | ||||||||||||||
| Cash and cash equivalents | $ | 908 | $ | 947 | ||||||||||
Accounts receivable - net | 2,074 | 1,852 | ||||||||||||
| Inventories | 877 | 953 | ||||||||||||
| Other current assets | 547 | 411 | ||||||||||||
| Current assets | 4,406 | 4,163 | ||||||||||||
| Property, plant and equipment - net | 1,397 | 1,377 | ||||||||||||
| Goodwill | 2,115 | 2,057 | ||||||||||||
| Other intangible assets - net | 421 | 467 | ||||||||||||
| Investments in partially-owned affiliates | 296 | 286 | ||||||||||||
| Assets held for sale | 7 | 11 | ||||||||||||
| Other noncurrent assets | 840 | 797 | ||||||||||||
| Total assets | $ | 9,482 | $ | 9,158 | ||||||||||
| Liabilities and Shareholders' Equity | ||||||||||||||
| Short-term debt | $ | 2 | $ | 14 | ||||||||||
| Accounts payable and accrued expenses | 3,029 | 2,818 | ||||||||||||
| Other current liabilities | 689 | 669 | ||||||||||||
| Current liabilities | 3,720 | 3,501 | ||||||||||||
| Long-term debt | 2,532 | 2,564 | ||||||||||||
| Other noncurrent liabilities | 688 | 673 | ||||||||||||
| Redeemable noncontrolling interests | 57 | 45 | ||||||||||||
| Shareholders' equity attributable to Adient | 2,174 | 2,073 | ||||||||||||
| Noncontrolling interests | 311 | 302 | ||||||||||||
| Total liabilities and shareholders' equity | $ | 9,482 | $ | 9,158 | ||||||||||
Appendix
Page 3
Adient plc
Condensed Consolidated Statements of Cash Flows
(Unaudited)
| Three Months Ended June 30, | ||||||||||||||
| (in millions) | 2023 | 2022 | ||||||||||||
| Operating Activities | ||||||||||||||
| Net income (loss) attributable to Adient | $ | 73 | $ | (30) | ||||||||||
| Income attributable to noncontrolling interests | 22 | 10 | ||||||||||||
| Net income (loss) | 95 | (20) | ||||||||||||
| Adjustments to reconcile net income (loss) to cash provided (used) by operating activities: | ||||||||||||||
| Depreciation | 74 | 72 | ||||||||||||
| Amortization of intangibles | 13 | 14 | ||||||||||||
| Pension and postretirement benefit expense (benefit) | 3 | (3) | ||||||||||||
| Pension and postretirement contributions, net | (2) | (7) | ||||||||||||
| Equity in earnings of partially-owned affiliates, net of dividends received | (2) | 10 | ||||||||||||
| Deferred income taxes | 2 | 13 | ||||||||||||
| Non-cash restructuring and impairment charges | — | 1 | ||||||||||||
| Equity-based compensation | 7 | 7 | ||||||||||||
| Other | 1 | — | ||||||||||||
| Changes in assets and liabilities: | ||||||||||||||
| Receivables | (72) | (83) | ||||||||||||
| Inventories | 39 | 8 | ||||||||||||
| Other assets | (13) | 7 | ||||||||||||
| Restructuring reserves | (8) | (11) | ||||||||||||
| Accounts payable and accrued liabilities | 65 | 37 | ||||||||||||
| Accrued income taxes | 1 | (22) | ||||||||||||
| Cash provided (used) by operating activities | 203 | 23 | ||||||||||||
| Investing Activities | ||||||||||||||
| Capital expenditures | (60) | (53) | ||||||||||||
| Sale of property, plant and equipment | 1 | 6 | ||||||||||||
| Business acquisitions | 5 | (13) | ||||||||||||
| Proceeds from business divestitures | 2 | — | ||||||||||||
| Other | (1) | — | ||||||||||||
| Cash provided (used) by investing activities | (53) | (60) | ||||||||||||
| Financing Activities | ||||||||||||||
| Repayment of long-term debt | — | (144) | ||||||||||||
| Share repurchases | (37) | — | ||||||||||||
| Cash paid to acquire a noncontrolling interest | — | (3) | ||||||||||||
| Dividends paid to noncontrolling interests | (5) | — | ||||||||||||
| Share based compensation and other | (1) | — | ||||||||||||
| Cash provided (used) by financing activities | (43) | (147) | ||||||||||||
| Effect of exchange rate changes on cash and cash equivalents | (25) | (42) | ||||||||||||
| Increase (decrease) in cash and cash equivalents | $ | 82 | $ | (226) | ||||||||||
Appendix
Page 4
Footnotes
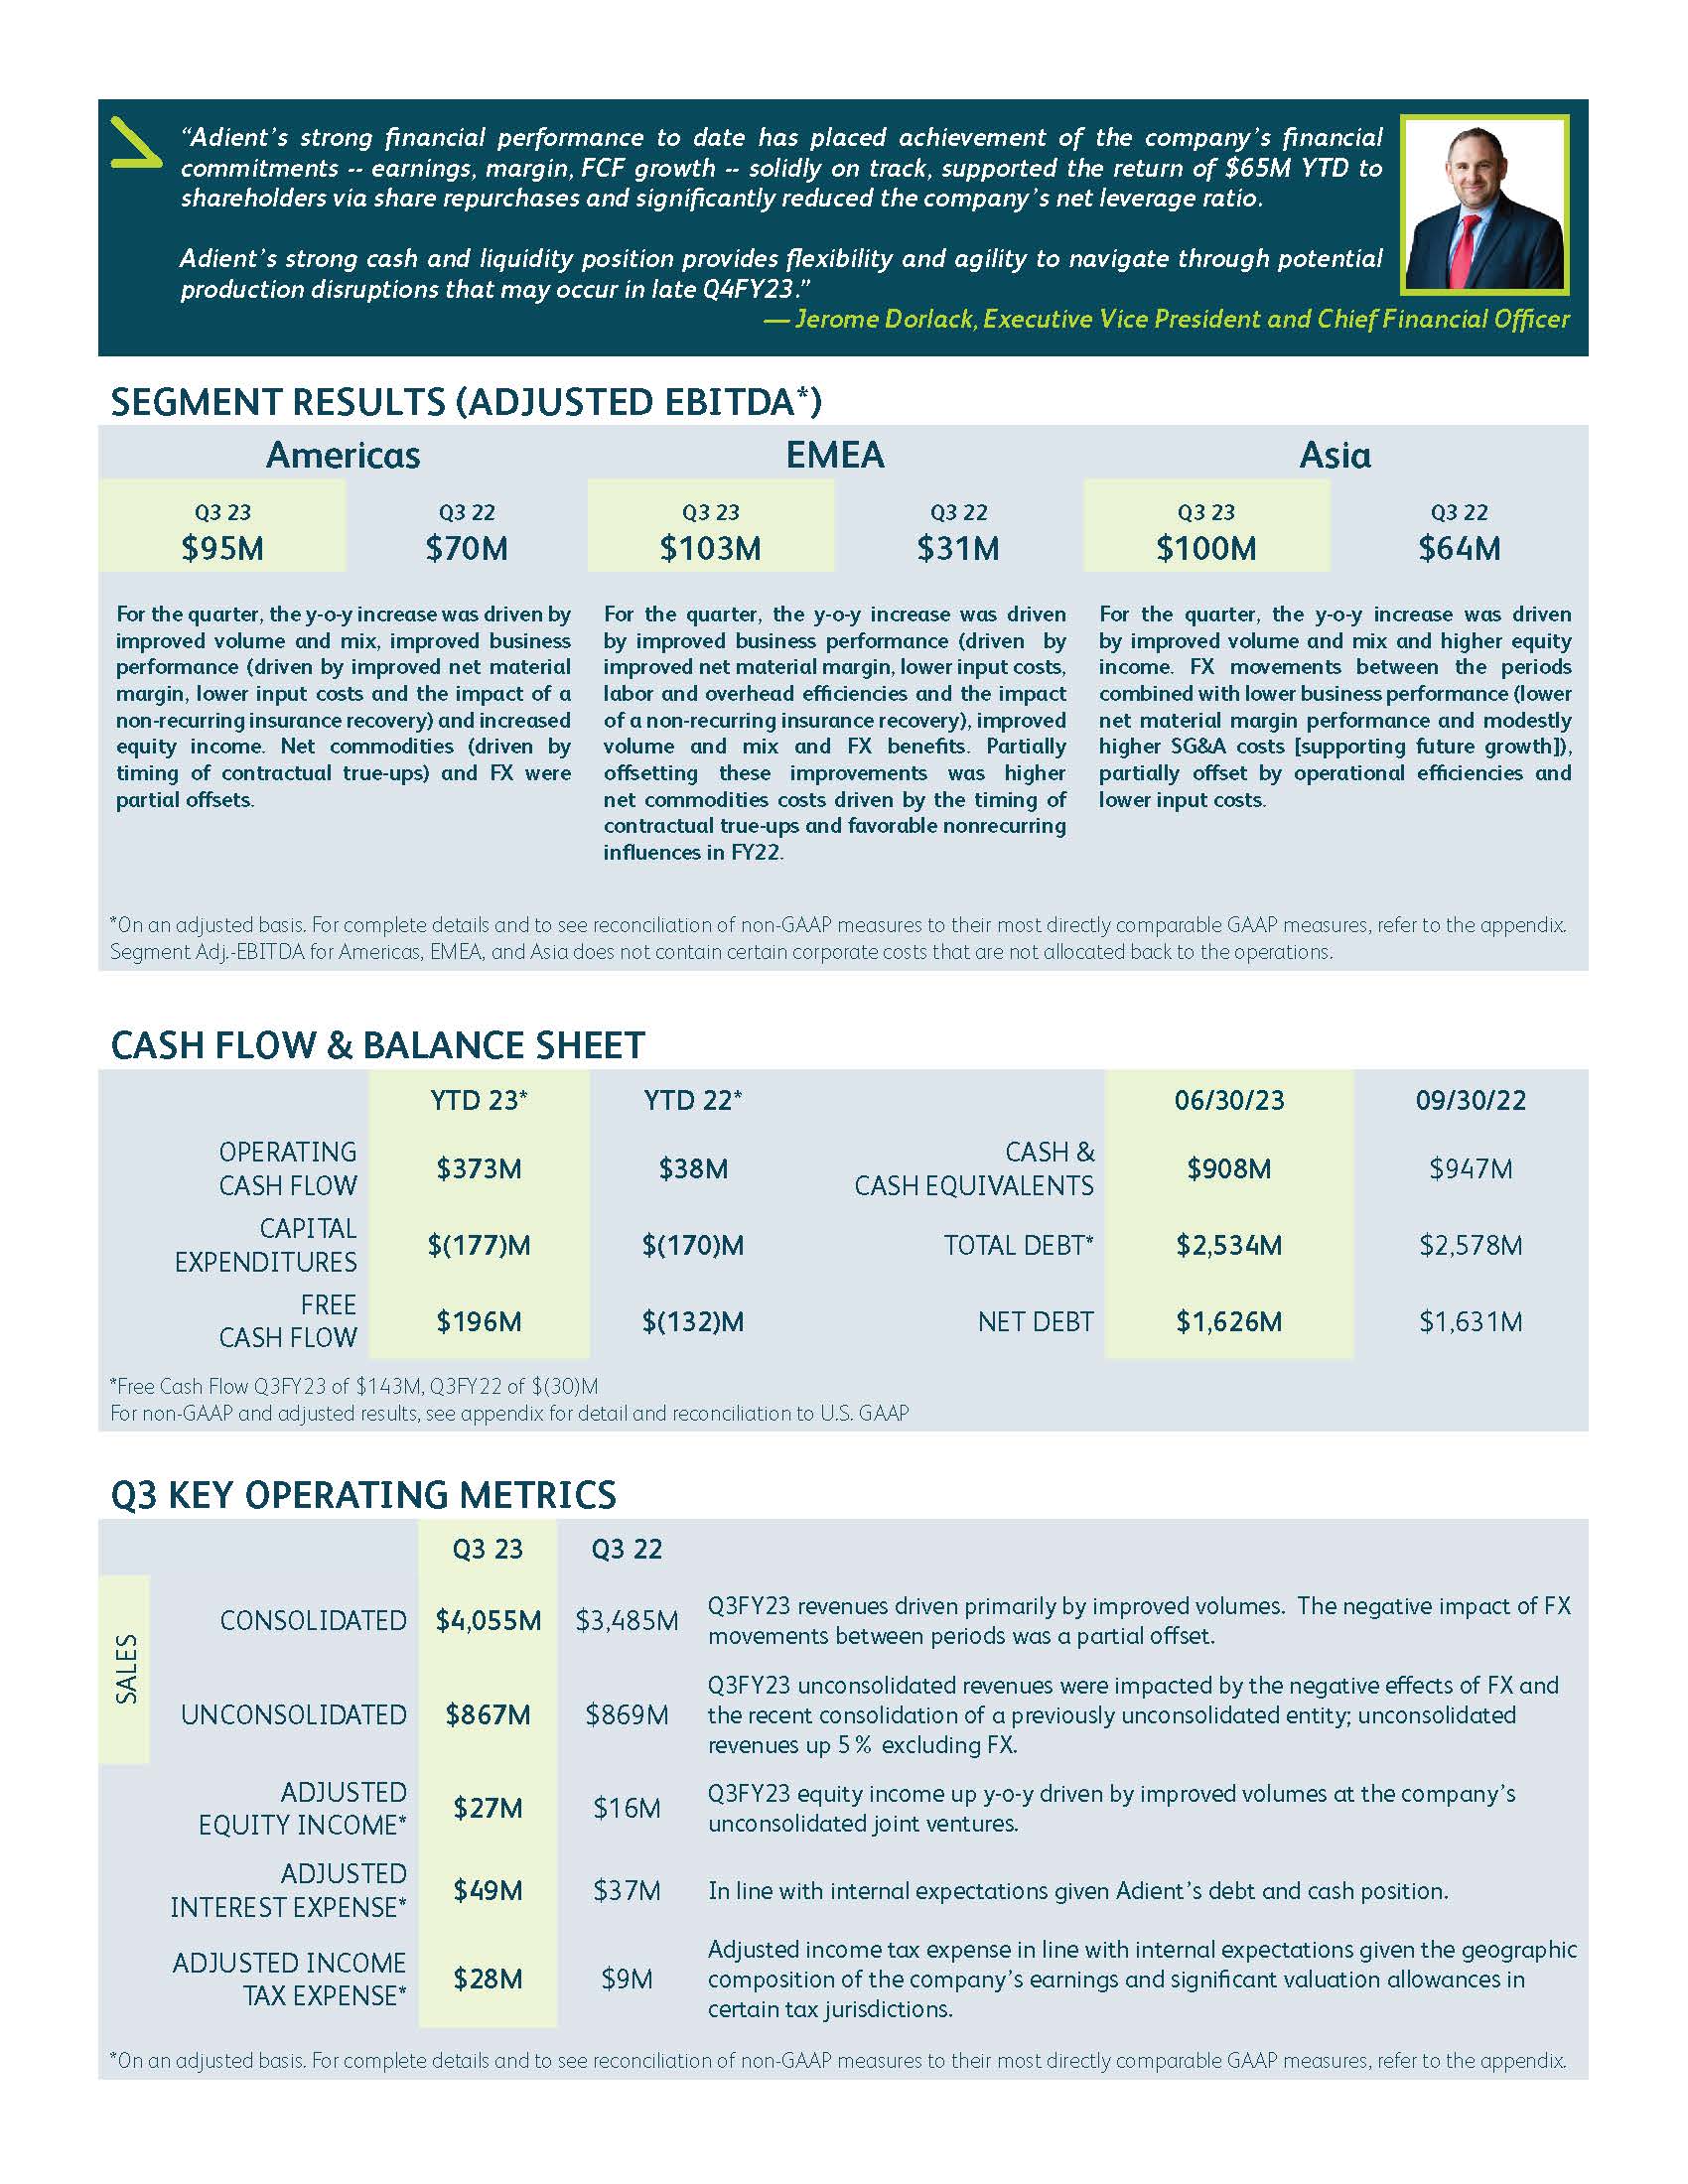
1. Segment Results
Adient manages its business on a geographic basis and operates in the following three reportable segments for financial reporting purposes: 1) Americas, which is inclusive of North America and South America; 2) Europe, Middle East, and Africa ("EMEA") and 3) Asia Pacific/China ("Asia").
Adient evaluates the performance of its reportable segments using an adjusted EBITDA metric defined as income before income taxes and noncontrolling interests, excluding net financing charges, qualified restructuring and impairment costs, restructuring related-costs, net mark-to-market adjustments on pension and postretirement plans, transaction gains/losses, purchase accounting amortization, depreciation, stock-based compensation and other non-recurring items ("Adjusted EBITDA"). Also, certain corporate-related costs are not allocated to the segments. The reportable segments are consistent with how management views the markets served by Adient and reflect the financial information that is reviewed by its chief operating decision maker.
Financial information relating to Adient's reportable segments is as follows:
| Three Months Ended June 30, | ||||||||||||||
| (in millions) | 2023 | 2022 | ||||||||||||
| Net Sales | ||||||||||||||
| Americas | $ | 1,900 | $ | 1,673 | ||||||||||
| EMEA | 1,438 | 1,215 | ||||||||||||
| Asia | 742 | 627 | ||||||||||||
| Eliminations | (25) | (30) | ||||||||||||
| Total net sales | $ | 4,055 | $ | 3,485 | ||||||||||
| Three Months Ended June 30, | ||||||||||||||
| (in millions) | 2023 | 2022 | ||||||||||||
| Adjusted EBITDA | ||||||||||||||
| Americas | $ | 95 | $ | 70 | ||||||||||
| EMEA | 103 | 31 | ||||||||||||
| Asia | 100 | 64 | ||||||||||||
Corporate-related costs (1) | (22) | (22) | ||||||||||||
Restructuring and impairment costs (2) | (6) | (12) | ||||||||||||
Purchase accounting amortization (3) | (13) | (14) | ||||||||||||
Restructuring related charges (4) | (3) | (1) | ||||||||||||
| Stock based compensation | (7) | (7) | ||||||||||||
| Depreciation | (74) | (72) | ||||||||||||
Other items (5) | — | (2) | ||||||||||||
| Earnings (loss) before interest and income taxes | $ | 173 | $ | 35 | ||||||||||
| Net financing charges | (49) | (39) | ||||||||||||
| Other pension income (expense) | (1) | 4 | ||||||||||||
| Income (loss) before income taxes | $ | 123 | $ | — | ||||||||||
Refer to the Footnote Addendum for footnote explanations.
Appendix
Page 5
2. Earnings Per Share
The following table reconciles the numerators and denominators used to calculate basic and diluted earnings (loss) per share:
| Three Months Ended June 30, | ||||||||||||||
| (in millions, except per share data) | 2023 | 2022 | ||||||||||||
| Income available to shareholders | ||||||||||||||
| Net income (loss) attributable to Adient | $ | 73 | $ | (30) | ||||||||||
| Weighted average shares outstanding | ||||||||||||||
| Basic weighted average shares outstanding | 94.1 | 94.8 | ||||||||||||
| Effect of dilutive securities: | ||||||||||||||
| Stock options, unvested restricted stock and unvested performance share awards | 0.8 | — | ||||||||||||
| Diluted weighted average shares outstanding | 94.9 | 94.8 | ||||||||||||
Potentially dilutive securities whose effect would have been antidilutive are excluded from the computation of diluted earnings per share, which for the three months ended June 30, 2022 is a result of being in a loss position.
Appendix
Page 6
3. Non-GAAP Measures
Adjusted EBIT, Adjusted EBIT margin, Adjusted EBITDA, Adjusted EBITDA margin, Adjusted net income attributable to Adient, Adjusted effective tax rate, Adjusted earnings per share, Adjusted equity income, Adjusted interest expense, Free cash flow and Net debt as well as other measures presented on an adjusted basis are not recognized terms under U.S. GAAP and do not purport to be alternatives to the most comparable U.S. GAAP amounts. Since all companies do not use identical calculations, our definition and presentation of these measures may not be comparable to similarly titled measures reported by other companies. Management uses the identified non-GAAP measures to evaluate the operating performance of the Company and its business segments and to forecast future periods. Management believes these non-GAAP measures assist investors and other interested parties in evaluating Adient's on-going operations and provide important supplemental information to management and investors regarding financial and business trends relating to Adient's financial condition and results of operations. Investors should not consider these non-GAAP measures as alternatives to the related GAAP measures. Reconciliations of non-GAAP measures to their closest U.S. GAAP equivalent are presented below. Reconciliations of non-GAAP measures related to guidance for any future period have not been provided due to the unreasonable efforts it would take to provide such reconciliations.
| • | Adjusted EBIT is defined as income before income taxes and noncontrolling interests excluding net financing charges, restructuring, impairment and related costs, purchase accounting amortization, transaction gains/losses, other significant non-recurring items, and net mark-to-market adjustments on pension and postretirement plans. Adjusted EBIT margin is adjusted EBIT as a percentage of net sales. | ||||
| • | Adjusted EBITDA is defined as adjusted EBIT excluding depreciation and stock based compensation. Certain corporate-related costs are not allocated to the business segments in determining Adjusted EBITDA. Adjusted EBITDA margin is adjusted EBITDA as a percentage of net sales. Adjusted EBITDA excluding adjusted equity income, each as defined herein, is also presented. | ||||
| • | Adjusted net income attributable to Adient is defined as net income attributable to Adient excluding restructuring, impairment and related costs, purchase accounting amortization, transaction gains/losses, expenses associated with becoming an independent company, other significant non-recurring items, net mark-to-market adjustments on pension and postretirement plans, the tax impact of these items and other discrete tax charges/benefits. | ||||
| • | Adjusted effective tax rate is defined as adjusted income tax provision as a percentage of adjusted income before income taxes. | ||||
| • | Adjusted earnings per share is defined as Adjusted net income attributable to Adient divided by diluted weighted average shares. | ||||
| • | Adjusted equity income is defined as equity income excluding amortization of Adient's intangible assets related to its non-consolidated joint ventures and other unusual or one-time items impacting equity income. | ||||
| • | Adjusted interest expense is defined as net financing charges excluding unusual or one-time items impacting interest expense. | ||||
| • | Free cash flow is defined as cash provided by operating activities less capital expenditures. | ||||
| • | Net debt is calculated as gross debt (short-term and long-term) less cash and cash equivalents. | ||||
Appendix
Page 7
Summarized Income Statement Information
(Refer to the Footnote Addendum for footnote explanations and details
of reconciling items between GAAP results and Adjusted results)
| Three Months Ended June 30, | ||||||||||||||||||||||||||||||||||||||
| 2023 | 2022 | |||||||||||||||||||||||||||||||||||||
| (in millions, except per share data) | GAAP Results | Adj. | Adjusted Results | GAAP Results | Adj. | Adjusted Results | ||||||||||||||||||||||||||||||||
| Net sales | $ | 4,055 | $ | — | $ | 4,055 | $ | 3,485 | $ | — | $ | 3,485 | ||||||||||||||||||||||||||
Cost of sales (6) | 3,753 | (1) | 3,752 | 3,312 | (2) | 3,310 | ||||||||||||||||||||||||||||||||
| Gross profit | 302 | 1 | 303 | 173 | 2 | 175 | ||||||||||||||||||||||||||||||||
Selling, general and administrative expenses (7) | 148 | (13) | 135 | 142 | (15) | 127 | ||||||||||||||||||||||||||||||||
Restructuring and impairment costs (2) | 6 | (6) | — | 12 | (12) | — | ||||||||||||||||||||||||||||||||
Equity income (loss) (8) | 25 | 2 | 27 | 16 | — | 16 | ||||||||||||||||||||||||||||||||
| Earnings (loss) before interest and income taxes (EBIT) | 173 | 22 | 195 | 35 | 29 | 64 | ||||||||||||||||||||||||||||||||
| Memo accounts: | ||||||||||||||||||||||||||||||||||||||
| Depreciation | 74 | 72 | ||||||||||||||||||||||||||||||||||||
| Equity based compensation | 7 | 7 | ||||||||||||||||||||||||||||||||||||
| Adjusted EBITDA | $ | 276 | $ | 143 | ||||||||||||||||||||||||||||||||||
Net financing charges (9) | 49 | — | 49 | 39 | (2) | 37 | ||||||||||||||||||||||||||||||||
| Other pension expense (income) | 1 | — | 1 | (4) | 3 | (1) | ||||||||||||||||||||||||||||||||
| Income (loss) before income taxes | 123 | 22 | 145 | — | 28 | 28 | ||||||||||||||||||||||||||||||||
Income tax provision (benefit) (10) | 28 | — | 28 | 20 | (11) | 9 | ||||||||||||||||||||||||||||||||
| Net income (loss) attributable to Adient | 73 | 20 | 93 | (30) | 38 | 8 | ||||||||||||||||||||||||||||||||
| Diluted earnings (loss) per share | 0.77 | 0.21 | 0.98 | (0.32) | 0.40 | 0.08 | ||||||||||||||||||||||||||||||||
| Diluted weighted average shares | 94.9 | — | 94.9 | 94.8 | 0.9 | 95.7 | ||||||||||||||||||||||||||||||||
Appendix
Page 8
Segment Performance:
| Three months ended June 30, 2023 | ||||||||||||||||||||||||||||||||
| Americas | EMEA | Asia | Corporate/Eliminations | Consolidated | ||||||||||||||||||||||||||||
| Net sales | $ | 1,900 | $ | 1,438 | $ | 742 | $ | (25) | $ | 4,055 | ||||||||||||||||||||||
| Adjusted EBITDA | $ | 95 | $ | 103 | $ | 100 | $ | (22) | $ | 276 | ||||||||||||||||||||||
| Adjusted EBITDA margin | 5.0 | % | 7.2 | % | 13.5 | % | N/A | 6.8 | % | |||||||||||||||||||||||
| Three months ended June 30, 2022 | ||||||||||||||||||||||||||||||||
| Americas | EMEA | Asia | Corporate/Eliminations | Consolidated | ||||||||||||||||||||||||||||
| Net sales | $ | 1,673 | $ | 1,215 | $ | 627 | $ | (30) | $ | 3,485 | ||||||||||||||||||||||
| Adjusted EBITDA | $ | 70 | $ | 31 | $ | 64 | $ | (22) | $ | 143 | ||||||||||||||||||||||
| Adjusted EBITDA margin | 4.2 | % | 2.6 | % | 10.2 | % | N/A | 4.1 | % | |||||||||||||||||||||||
The following table presents adjusted EBITDA excluding adjusted equity income:
| Three Months Ended June 30, | ||||||||||||||
| (in millions) | 2023 | 2022 | ||||||||||||
| Adjusted EBITDA | $ | 276 | $ | 143 | ||||||||||
| Less: Adjusted Equity Income | 27 | 16 | ||||||||||||
| Adjusted EBITDA Excluding Adjusted Equity Income | $ | 249 | $ | 127 | ||||||||||
| % of Sales | 6.1 | % | 3.6 | % | ||||||||||
The following table reconciles income (loss) before income taxes to adjusted income before income taxes and presents the related effective tax rate and adjusted effective tax rate:
| Three months ended June 30, | ||||||||||||||||||||||||||||||||||||||
| 2023 | 2022 | |||||||||||||||||||||||||||||||||||||
| (in millions, except effective tax rate) | Income (loss) before income taxes | Tax impact | Effective tax rate | Income (loss) before income taxes | Tax impact | Effective tax rate | ||||||||||||||||||||||||||||||||
| As reported | $ | 123 | $ | 28 | 22.8% | $ | — | $ | 20 | nm | ||||||||||||||||||||||||||||
Adjustments (10) | 22 | — | —% | 28 | (11) | (39.3)% | ||||||||||||||||||||||||||||||||
| As adjusted | $ | 145 | $ | 28 | 19.3% | $ | 28 | $ | 9 | 32.1% | ||||||||||||||||||||||||||||
Appendix
Page 9
The following table reconciles net income (loss) attributable to Adient to adjusted net income (loss) attributable to Adient:
| Three Months Ended June 30, | ||||||||||||||
| (in millions) | 2023 | 2022 | ||||||||||||
| Net income (loss) attributable to Adient | $ | 73 | $ | (30) | ||||||||||
Restructuring and impairment costs (2) | 6 | 12 | ||||||||||||
Purchase accounting amortization (3) | 13 | 14 | ||||||||||||
Restructuring related charges | 3 | 1 | ||||||||||||
Pension mark-to-market and curtailment/settlement (gain)/loss (12) | — | (3) | ||||||||||||
Foreign exchange loss on intercompany loan in Russia (9) | — | 2 | ||||||||||||
Other items (5) | — | 2 | ||||||||||||
Impact of adjustments on noncontrolling interests (11) | (2) | (1) | ||||||||||||
Tax impact of above adjustments and other tax items (10) | — | 11 | ||||||||||||
| Adjusted net income (loss) attributable to Adient | $ | 93 | $ | 8 | ||||||||||
Refer to the Footnote Addendum for footnote explanations
The following table reconciles diluted earnings (loss) per share as reported to adjusted diluted earnings (loss) per share.
| Three Months Ended June 30, | ||||||||||||||
| 2023 | 2022 | |||||||||||||
| Diluted earnings (loss) per share as reported | $ | 0.77 | $ | (0.32) | ||||||||||
Restructuring and impairment costs (2) | 0.06 | 0.13 | ||||||||||||
Purchase accounting amortization (3) | 0.14 | 0.15 | ||||||||||||
| Restructuring related charges | 0.03 | 0.01 | ||||||||||||
Pension mark-to-market and curtailment/settlement (gain)/loss (12) | — | (0.03) | ||||||||||||
Foreign exchange loss on intercompany loan in Russia (9) | — | 0.02 | ||||||||||||
Other items (5) | — | 0.02 | ||||||||||||
Impact of adjustments on noncontrolling interests (11) | (0.02) | (0.01) | ||||||||||||
Tax impact of above adjustments and other tax items (10) | — | 0.11 | ||||||||||||
| Adjusted diluted earnings (loss) per share | $ | 0.98 | $ | 0.08 | ||||||||||
Appendix
Page 10
The following table presents calculations of net debt:
| June 30, | September 30, | |||||||||||||
| (in millions) | 2023 | 2022 | ||||||||||||
| Cash and cash equivalents | $ | 908 | $ | 947 | ||||||||||
| Total short-term and long-term debt | 2,534 | 2,578 | ||||||||||||
| Net debt | $ | 1,626 | $ | 1,631 | ||||||||||
The following table reconciles cash from operating activities to free cash flow:
| Three Months Ended June 30, | Nine Months Ended June 30, | |||||||||||||||||||||||||
| (in millions) | 2023 | 2022 | 2023 | 2022 | ||||||||||||||||||||||
| Cash provided (used) by operating activities | $ | 203 | $ | 23 | $ | 373 | $ | 38 | ||||||||||||||||||
| Capital expenditures | (60) | (53) | (177) | (170) | ||||||||||||||||||||||
| Free cash flow | $ | 143 | $ | (30) | $ | 196 | $ | (132) | ||||||||||||||||||
The following table reconciles adjusted EBITDA excluding adjusted equity income to free cash flow:
| FY2023 | FY2022 | |||||||||||||||||||||||||
| (in millions) | Q3 | YTD | Q3 | YTD | ||||||||||||||||||||||
| Adjusted EBITDA excluding adjusted equity income | $ | 249 | $ | 637 | $ | 127 | $ | 381 | ||||||||||||||||||
| Dividend | 23 | 36 | 26 | 27 | ||||||||||||||||||||||
| Restructuring (cash) | (9) | (49) | (11) | (49) | ||||||||||||||||||||||
| Net customer tooling | (3) | (40) | (15) | (36) | ||||||||||||||||||||||
| Trade working capital (Net AR/AP + Inventory) | (53) | (21) | (57) | (6) | ||||||||||||||||||||||
| Accrued compensation | 31 | 41 | 2 | (45) | ||||||||||||||||||||||
| Interest paid | (19) | (107) | (23) | (134) | ||||||||||||||||||||||
| Tax refund/taxes paid | (25) | (74) | (25) | (63) | ||||||||||||||||||||||
| Non-income related taxes (VAT) | (13) | (5) | (20) | 33 | ||||||||||||||||||||||
| Commercial settlements | 8 | 36 | (22) | (66) | ||||||||||||||||||||||
| Capitalized engineering | 9 | (25) | 31 | 33 | ||||||||||||||||||||||
| Prepaids | (16) | (41) | 15 | (8) | ||||||||||||||||||||||
| Other | 21 | (15) | (5) | (29) | ||||||||||||||||||||||
| Operating cash flow | 203 | 373 | 23 | 38 | ||||||||||||||||||||||
| Capital expenditures | (60) | (177) | (53) | (170) | ||||||||||||||||||||||
| Free cash flow | $ | 143 | $ | 196 | $ | (30) | $ | (132) | ||||||||||||||||||
Appendix
Page 11
Footnote Addendum
(1) Corporate-related costs not allocated to the segments include executive office, communications, corporate development, legal and corporate finance.
(2) Reflects qualified restructuring charges for costs that are directly attributable to restructuring activities and meet the definition of restructuring under ASC 420 along with one-time asset impairment charges, as follows:
| Three Months Ended June 30, | ||||||||||||||
| (in millions) | 2023 | 2022 | ||||||||||||
| Restructuring charges | $ | (6) | $ | (13) | ||||||||||
| Held for sale asset adjustments | — | 1 | ||||||||||||
| $ | (6) | $ | (12) | |||||||||||
(3) Reflects amortization of intangible assets including those related to partially owned affiliates recorded within equity income.
(4) Reflects non-qualified restructuring charges for costs that are directly attributable to restructuring activities, but do not meet the definition of restructuring under ASC 420 including restructuring costs at partially owned affiliates recorded within equity income.
(5) Other items include:
| Three Months Ended June 30, | ||||||||||||||
| (in millions) | 2023 | 2022 | ||||||||||||
| Transaction costs | $ | (1) | $ | (2) | ||||||||||
| Brazil indirect tax recoveries | 1 | 1 | ||||||||||||
| Disposal of non-core assets | — | (1) | ||||||||||||
| $ | — | $ | (2) | |||||||||||
(6) The adjustments to cost of sales include:
| Three Months Ended June 30, | ||||||||||||||
| (in millions) | 2023 | 2022 | ||||||||||||
| Restructuring related charges | $ | (1) | $ | (1) | ||||||||||
| Brazil indirect tax recoveries | 1 | 1 | ||||||||||||
| Purchase accounting amortization | (1) | (1) | ||||||||||||
| Disposal of non-core assets | — | (1) | ||||||||||||
| $ | (1) | $ | (2) | |||||||||||
Appendix
Page 12
(7) The adjustments to selling, general and administrative costs include:
| Three Months Ended June 30, | ||||||||||||||
| (in millions) | 2023 | 2022 | ||||||||||||
| Purchase accounting amortization | $ | (12) | $ | (13) | ||||||||||
| Transaction costs | (1) | (2) | ||||||||||||
| $ | (13) | $ | (15) | |||||||||||
(8) The adjustments to equity income include:
| Three Months Ended June 30, | ||||||||||||||
| (in millions) | 2023 | 2022 | ||||||||||||
| Restructuring related charges | $ | 2 | $ | — | ||||||||||
(9) The adjustments to net financing charges to calculate adjusted interest expense include:
| Three Months Ended June 30, | ||||||||||||||
| (in millions) | 2023 | 2022 | ||||||||||||
| Foreign exchange loss on intercompany loan in Russia | $ | — | (2) | |||||||||||
(10) The adjustments to income tax provision (benefit) include:
| Three Months Ended June 30, | ||||||||||||||
| (in millions) | 2023 | 2022 | ||||||||||||
| Valuation allowances | $ | 1 | $ | 12 | ||||||||||
| Other reconciling items | (1) | (1) | ||||||||||||
| $ | — | $ | 11 | |||||||||||
(11) Reflects the impact of adjustments, primarily purchase accounting amortization on noncontrolling interests.
(12) During the three months ended June 30, 2022, Adient remeasured pension plans in the Americas and recorded a mark-to-market gain of $4 million and a curtailment loss of $1 million.