UNITED STATES
SECURITIES AND EXCHANGE COMMISSION
Washington, D.C. 20549
FORM 1-U
CURRENT REPORT
Pursuant to Regulation A of the Securities Act of 1933
March 6, 2019
(Date of Report (Date of earliest event reported))
MogulREIT I, LLC
(Exact name of registrant as specified in its charter)
|
Delaware |
|
32-0487554 |
|
(State or other jurisdiction |
|
(I.R.S. Employer |
|
of incorporation or organization) |
Identification No.) |
|
|
|
|
|
|
|
10780 Santa Monica Blvd, Suite 140 |
|
|
|
Los Angeles, CA, 90025 |
|
|
|
(Full mailing address of |
|
|
|
principal executive offices) |
|
(877) 781‑7153
(Issuer’s telephone number, including area code)
Common Shares
(Title of each class of securities issued pursuant to Regulation A)
1
Item 9. Other Events.
On March 5, 2019, we issued an offering overview discussing our financial results for the quarter ended December 31, 2018. The text of the offering overview is set forth below.

Q4 2018*
MOGULREIT I
|
OFFERING OVERVIEW |
|
TOTAL INVESTMENT VALUE1 |
$46,424,055 |
|
|
|
TOTAL ASSET VALUE2 |
$293,635,000 |
|
|
|
NUMBER OF INVESTMENTS |
18 |
|
MogulREIT I is a public, non-traded REIT, focused on providing |
|
WEIGHTED AVERAGE INVESTMENT TERM |
45 Months |
|
monthly income to investors through debt and equity investments in a diversified pool of commercial real estate |
|
DISTRIBUTION FREQUENCY |
Monthly |
|
property types including multifamily, retail, office, and industrial. |
TAX REPORTING FORM |
1099-DIV |
|
|
|
|
CONSECUTIVE DISTRIBUTIONS3 |
27 Months |
|
KEY OBJECTIVES |
|
|
|
|
|
|
|
|
|
To pay attractive and consistent cash distributions; and |
|
|
|
|
|
|
|
|
|
To preserve, protect, increase and return your capital contribution. |
|
|
|
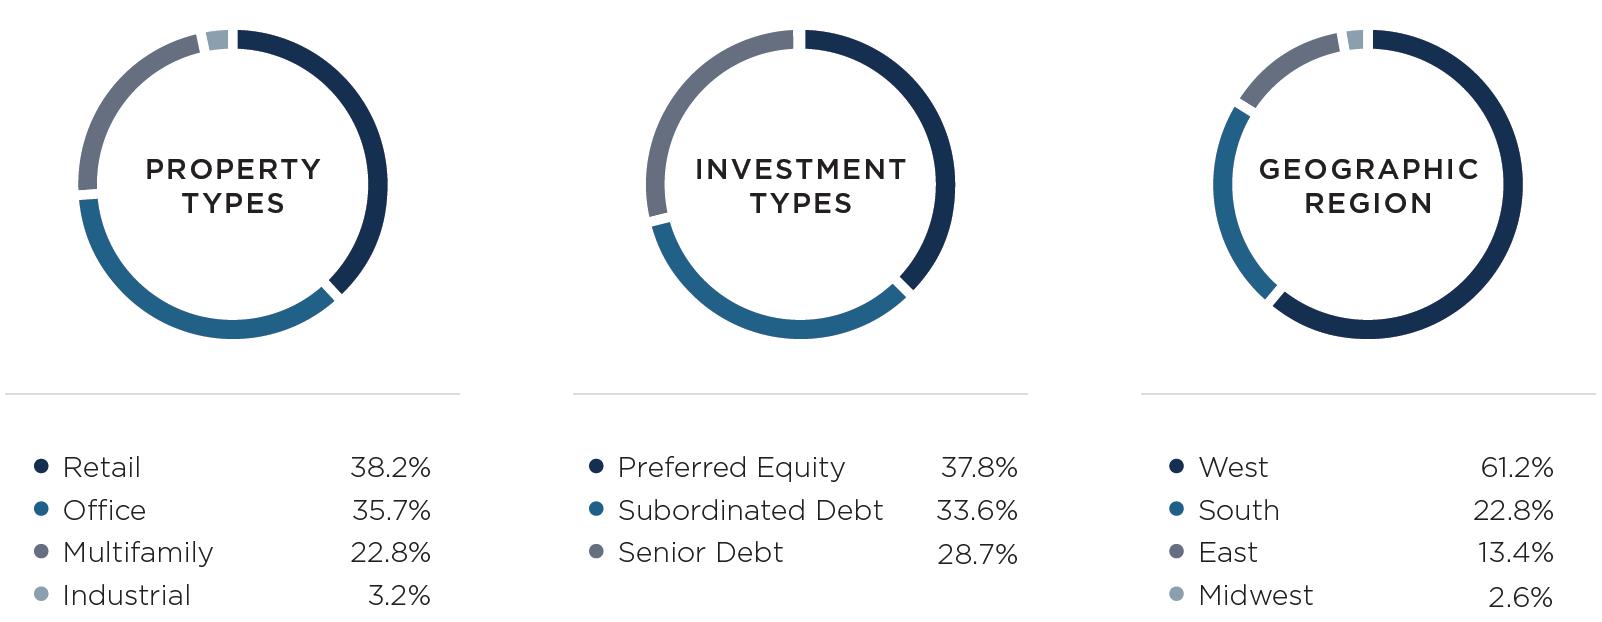
PORTFOLIO STATISTICS4
*All data as of December 31, 2018.
|
1 |
Aggregate value of all underlying investments in MogulREIT I, LLC based on the current outstanding investment amount, including outstanding cash. |
|
2 |
Aggregate value of all underlying properties in MogulREIT I, LLC based on appraisals dated within 6 months of the original acquisition by Realty Mogul, Co. or Realty Mogul Commercial Capital, Co., as applicable. |
|
3 |
This is not a guarantee or projection of future returns, and the Manager may in the future declare lower distributions or no distributions at all for any given period. |
|
4 |
Based on the current outstanding investment amount. |
2
DISTRIBUTION HISTORY
|
RECORD DATE |
DISTRIBUTION PERIOD |
PURCHASE PRICE |
MONTHLY CASH DISTRIBUTION PER SHARE* |
NET ASSET VALUE (NAV) |
ANNUALIZED DISTRIBUTION PER PURCHASE PRICE |
ANNUALIZED DISTRIBUTION PER NAV |
|
|
2016 |
9/30 |
8/15 – 9/30 |
$10.00 |
$0.1000 |
$10.00 |
8.00% |
8.00% |
|
11/30 |
10/1 – 11/30 |
$10.00 |
$0.1333 |
$10.00 |
8.00% |
8.00% |
|
|
12/31 |
12/1 – 12/31 |
$10.00 |
$0.0667 |
$10.00 |
8.00% |
8.00% |
|
|
2017 |
1/31 |
1/1 – 1/31 |
$10.00 |
$0.0667 |
$10.00 |
8.00% |
8.00% |
|
2/28 |
2/1 – 2/28 |
$10.00 |
$0.0667 |
$10.00 |
8.00% |
8.00% |
|
|
3/31 |
3/1 – 3/31 |
$10.00 |
$0.0667 |
$10.00 |
8.00% |
8.00% |
|
|
4/30 |
4/1 – 4/30 |
$10.00 |
$0.0667 |
$10.00 |
8.00% |
8.00% |
|
|
5/31 |
5/1 – 5/31 |
$10.00 |
$0.0667 |
$10.00 |
8.00% |
8.00% |
|
|
6/30 |
6/1 – 6/30 |
$10.00 |
$0.0667 |
$10.00 |
8.00% |
8.00% |
|
|
7/31 |
7/1 – 7/31 |
$10.00 |
$0.0667 |
$10.00 |
8.00% |
8.00% |
|
|
8/31 |
8/1 – 8/31 |
$10.00 |
$0.0667 |
$10.00 |
8.00% |
8.00% |
|
|
9/30 |
9/1 – 9/30 |
$10.00 |
$0.0667 |
$10.00 |
8.00% |
8.00% |
|
|
10/31 |
10/1 – 10/31 |
$10.00 |
$0.0653 |
$9.80 |
7.84% |
8.00% |
|
|
11/30 |
11/1 – 11/30 |
$10.00 |
$0.0653 |
$9.80 |
7.84% |
8.00% |
|
|
12/31 |
12/1 – 12/31 |
$10.00 |
$0.0653 |
$9.80 |
7.84% |
8.00% |
|
|
2018 |
1/31 |
1/1 – 1/31 |
$10.00 |
$0.0655 |
$9.82 |
7.86% |
8.00% |
|
2/28 |
2/1 – 2/28 |
$10.00 |
$0.0655 |
$9.82 |
7.86% |
8.00% |
|
|
3/31 |
3/1 – 3/31 |
$10.00 |
$0.0655 |
$9.82 |
7.86% |
8.00% |
|
|
4/30 |
4/1 – 4/30 |
$10.00 |
$0.0655 |
$9.82 |
7.84% |
8.00% |
|
|
5/31 |
5/1 – 5/31 |
$10.00 |
$0.0653 |
$9.80 |
7.84% |
8.00% |
|
|
6/30 |
6/1 – 6/30 |
$10.00 |
$0.0653 |
$9.80 |
7.84% |
8.00% |
|
|
7/31 |
7/1 – 7/31 |
$10.00 |
$0.0647 |
$9.70 |
7.76% |
8.00% |
|
|
8/31 |
8/1 – 8/31 |
$10.00 |
$0.0647 |
$9.70 |
7.76% |
8.00% |
|
|
9/30 |
9/1 – 9/30 |
$10.00 |
$0.0647 |
$9.70 |
7.76% |
8.00% |
|
|
10/31 |
10/1 – 10/31 |
$10.00 |
$0.0647 |
$9.70 |
7.76% |
8.00% |
|
|
11/30 |
11/1 – 11/30 |
$10.00 |
$0.0647 |
$9.70 |
7.76% |
8.00% |
|
|
12/31 |
12/1 – 12/31 |
$10.00 |
$0.0647 |
$9.70 |
7.76% |
8.25% |
3
INVESTMENT ACTIVITY
DISTRIBUTIONS
All monthly distributions declared during the fourth quarter of 2018, in addition to all distributions declared and paid since the REIT began its operation, equate to approximately 7.76% on an annualized basis based upon Purchase Price as of 12/1/2018.
The annualized distribution rate is not a guarantee or projection of future distributions, and the board of directors may in the future declare lower distributions or no distributions at all for any given period. While the board of directors is under no obligation to do so, the annualized distribution rate assumes that the board of directors will declare quarterly distributions in the future similar to the distribution disclosed herein.
PORTFOLIO OVERVIEW
|
ASSET |
LOCATION |
MOGULREIT I ACQUISITION DATE |
PROPERTY TYPE |
INVESTMENT TYPE |
PRINCIPAL REQUIRED |
REMAINING BALANCE AS OF 12/31/18 |
INTEREST YIELD AS OF 12/31/18 |
|
Synchrony Financial |
Canton, OH |
8/19/16 |
Office |
Preferred Equity |
$2,000000 |
$1,224,755 |
10.00% |
|
Parkway Plaza |
San Antonio, TX |
2/17/17 |
Office |
Mezzanine Debt |
$3,400,000 |
$3,400,000 |
10.00% |
|
Highland Place |
Centennial, CO |
3/23/17 |
Retail |
Mezzanine Debt |
$2,300,000 |
$2,300,000 |
10.00% |
|
Pensacola Marketplace |
Pensacola, FL |
6/12/17 |
Retail |
Mezzanine Debt |
$1,125,000 |
$1,125,000 |
9.75% |
|
Northside at John’s Creek |
Suwanee, GA |
6/20/17 |
Office |
Subordinated Senior Debt |
$1,500,000 |
$1,500,000 |
14.00% |
|
Jadak HQ |
Syracuse, NY |
6/28/17 |
Office/ Industrial |
Preferred Equity |
$1,500,000 |
$1,500.000 |
11.00% |
|
Texas Retail Portfolio |
Multiple Locations, TX |
7/18/17 |
Retail |
Preferred Equity |
$3,325,000 |
$3,325,000 |
14.00% |
|
Crossroads South |
Jonesboro, GA |
8/3/17 |
Retail |
Preferred Equity |
$1,250,000 |
$1,250,000 |
12.00% |
|
Corona Marketplace |
Corona, CA |
8/17/17 |
Retail |
Mezzanine Debt |
$3,549,300 |
3,549,300 |
14.00% |
|
378 Moss St |
Chula Vista, CA |
11/15/17 |
Multifamily |
Senior Debt |
$3,575,000 |
$3,575,000 |
8.50% |
|
2395 29th Ave |
San Francisco, CA |
2/16/18 |
Multifamily |
Senior Debt |
$4,750,000 |
$4,750,000 |
8.00% |
|
Harbor Hills |
La Habra, CA |
3/16/18 |
Retail |
Preferred Equity |
$1,900,000 |
$1,900,000 |
11.00% |
|
Orange Tree Village |
Tucson, AZ |
4/23/18 |
Multifamily |
Preferred Equity |
$2,275,000 |
$2,275,000 |
12.00% |
|
Amerigroup Corp HQ |
Virginia Beach, CA |
6/15/18 |
Office |
Preferred Equity |
$1,700,000 |
$1,700,000 |
12.00% |
|
Riverside Office Portfolio |
Riverside, CA |
10/19/18 |
Office |
Mezzanine Debt |
$2,500,000 |
$2,500,000 |
13.00% |
|
Naugatuck Valley Shopping Center |
Waterbury, CT |
10/23/18 |
Retail |
Preferred Equity |
$3,000,000 |
$3,000,000 |
12.00% |
|
Ashlan Park |
Fresno, CA |
11/19/18 |
Retail |
Second Mortgage |
$3,600,000 |
$3,600,000 |
13.51% |
|
Portland Office |
Portland, OR |
11/27/18 |
Office |
Senior Debt |
$3,950,000 |
$3,950,000 |
9.01% |
|
|
|
|
|
|
$47,199,300 |
$26,424,055 |
11.17%* |
4
INVESTMENT ACTIVITY (CONT.)
INVESTMENT SPOTLIGHT
|
|
|
2395 29TH AVENUE On February 16, 2018, we acquired a $4,750,000 first mortgage loan in 2395 29th Avenue, 11-unit multifamily property with two ground-floor retail spaces and five enclosed garage units. INVESTMENT SPOTLIGHT (CONT.) The San Francisco market has experienced a widely publicized housing shortage since the 1990’s. Furthermore, as Silicon Valley, the region in the southern San Francisco Bay Area, has continued to grow, with companies such as Apple, Facebook and Google building massive campuses in the 2010’s, the United States Census Bureau estimates the average annual gain since 2010 was 11,173 persons, which equates to just under a 10% increase to overall population. As a result, San Francisco has not only the highest median home prices in the country, but also the highest average rents. The real estate company’s business plan for the Property was to implement a value-add strategy by converting the five garage units into two one-bedroom/one-bathroom units through San Francisco’s recently introduced Accessory Dwelling Units (“ADU”) program and converting four one-bedroom/one-bathroom units into two-bedroom/one-bathroom units. The real estate company intends to complete its business plan, stabilize the Property and exit within two years. As of December 31, 2018, the four vacant one-bedrooms that were converted to two bedrooms were all leased by year-end. Each of the units was leased above original underwriting, with an average positive variance of 16.2%. Moreover, due to San Francisco’s strict rent control guidelines, our underwriting conservatively assumed that no tenant would vacate during the hold period as any vacated unit would be underwritten at considerably higher market rents once leased. One tenant vacated the Property prior to year-end, and the real estate company will be renovating this unit and marketing it for rent at over 1.5 times the previous price. Lastly, at year-end, the real estate company was in the final stages of the permitting process for the ADU program and anticipated that the permits would be issued by the end of February. |

5
INVESTMENT ACTIVITY (CONT.)
FOURTH QUARTER HIGHLIGHTS
ACQUISITIONS
|
|
Riverside Office Portfolio On October 22, 2018, we acquired a $2,500,000 mezzanine loan for the acquisition of Riverside Office Portfolio, five Class A office buildings (four 3-story buildings and one single-story building) totaling 223,711 square feet located in downtown Riverside, California.
|
|
|
Naugatuck Valley Shopping Center On October 23, 2018, we acquired a $3,000,000 preferred equity investment to facilitate the acquisition and stabilization of a 382,844 square-foot Class B shopping center located in Waterbury, Connecticut.
|
|
|
Ashlan Park Shopping Center On November 19, 2018, we acquired a $3,600,000 second mortgage loan in connection with the acquisition of a 153,870 square-foot Class B shopping center located in Fresno, California.
|


6
MARKET UPDATES
|
RISK ADJUSTED RETURN OPPORTUNITIES
We believe that the near and intermediate term market for investment in commercial real estate loans, commercial real estate, commercial real estate equity securities, and other real estate related assets presents investors with attractive risk adjusted return opportunities. We think this is particularly true in the non-core areas of the lending market, specifically small balance bridge loans, mezzanine debt and preferred equity.
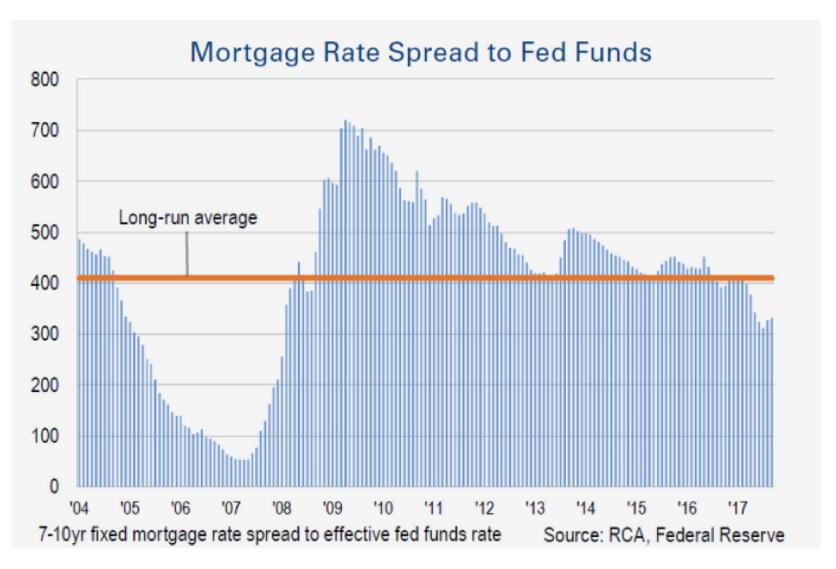
While significant liquidity has entered the debt and sub-debt market in the past few years, pushing spreads down, we have continued to see opportunity in the non-core, small balance market where there are fewer participants. To the right is a chart illustrating the yield compression that has occurred since the start of the economic recovery.
We believe that our investment strategy combined with the experience and expertise of our Manager’s management team will provide opportunities to acquire investments with attractive risk return characteristics and strong structural features. |
|
|
|
|
|
|
|
CONTINUED GROWTH POTENTIAL
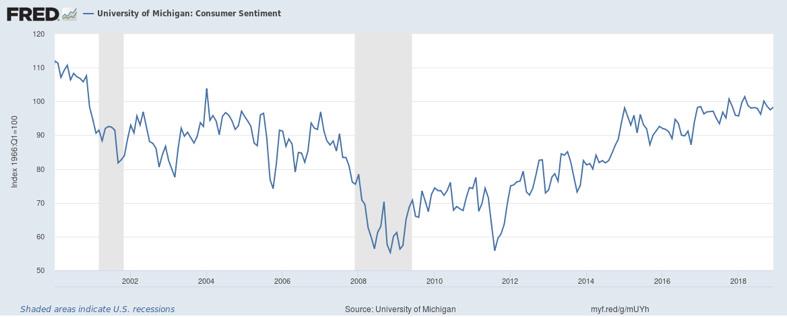
We still see strong economic indicators for real estate as we enter the new year. Though we believe the U.S. economy is in the late stages of its recovery, we believe that there is still further growth in the near to intermediate-term. In November 2017, consumer confidence reached its highest level in 17 years and has remained at historically high levels through November 2018. The index has remained over 90 for almost two years. According to the University of Michigan, who created the survey, the last time the index has remained at these levels for this period of time was the 1997-2000 timeframe. While we believe consumer confidence trails the market rather than precedes it, we believe that positive consumer confidence bodes well for near-term investing. |
|
|
|
|
|
|
|
|
|
|
7
MARKET UPDATES (CONT.)
|
Q4 VOLATILITY
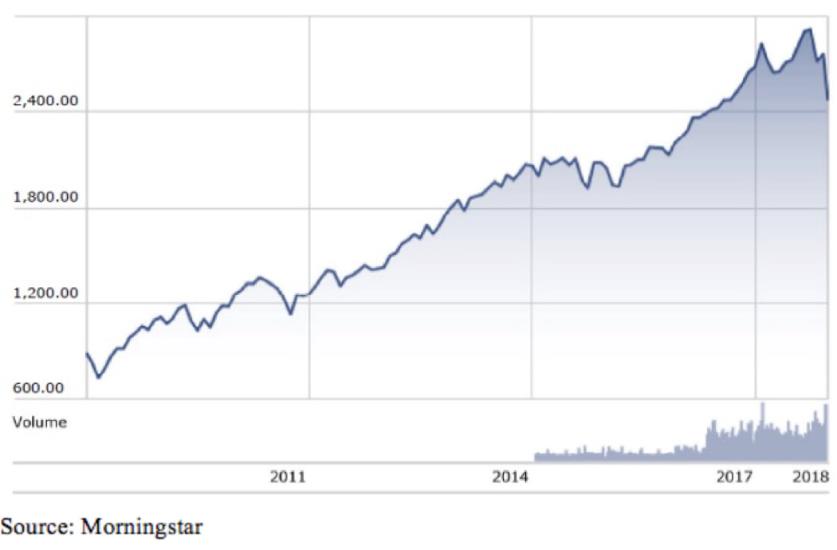
Despite the extreme volatility in Q4 2018, equities are still at high historic levels, evidenced by the S&P 500 Index and the Dow Jones Industrial Average. The fourth quarter 2018 was challenging for the S&P 500, and the index experienced dramatic losses to date. As of December 31, 2018, the S&P 500 index was down almost 7% for the year. The volatility in the equities market may be largely the result of investor fear that we are nearing the peak of a market cycle. |
|
|
|
|
|
|
|
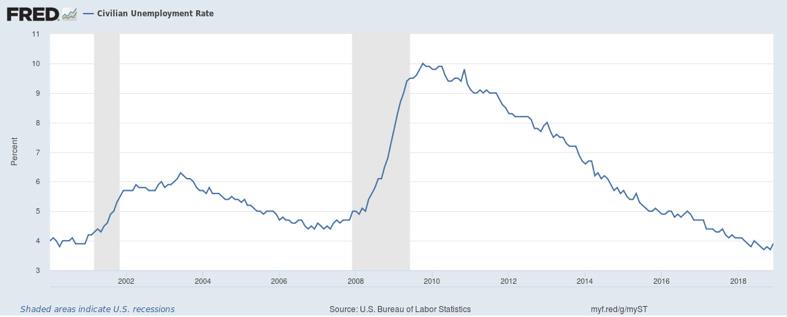
JOB GROWTH POTENTIAL
Job growth has remained strong, and unemployment rates are at historically low levels at 3.9% as of December 2018. We believe that this is one of the most important macroeconomic indicators for real estate and is one of the foundations of our positive near-term outlook. |
|
|
|
|
|
|
|
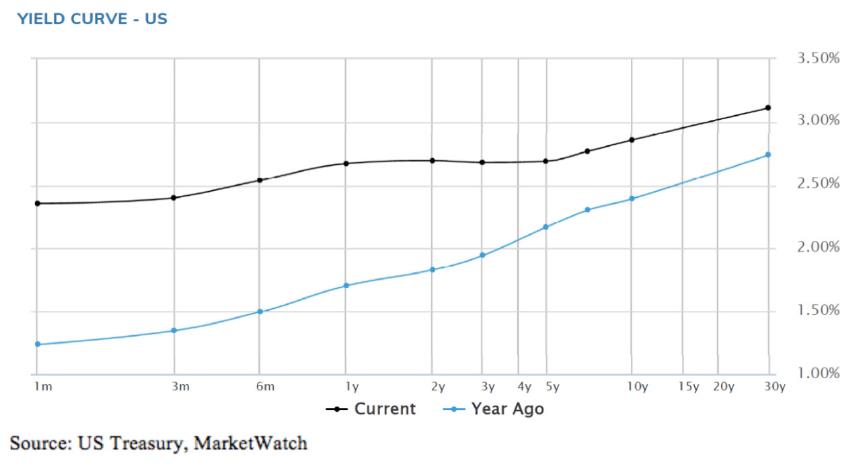
RISING INTEREST RATES
After years of predictions of substantial movement in interest rates, the Federal Reserve finally viewed the economy stable enough to begin to raise interest rates in the past 18 months. The corresponding chart shows movement in the yield curve over the past 12 months. |
|
|
|
|
|
|
|
|
|
|
|
|
|
|
8
MARKET UPDATES (CONT.)
|
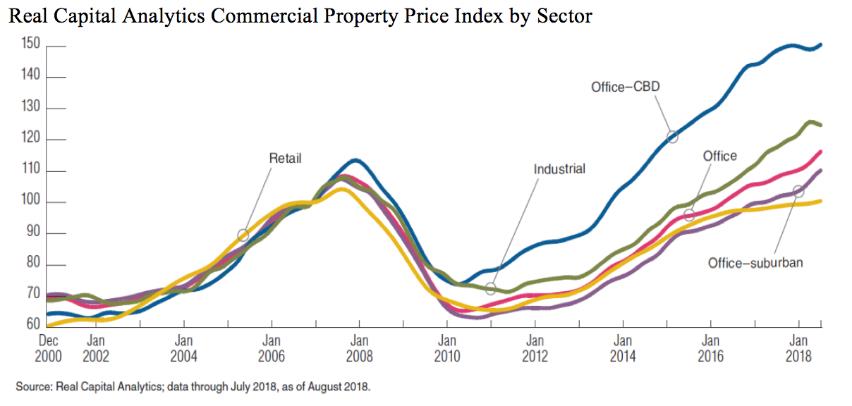
MARKET PRICING
Pricing in the real estate market is reflective of the economic growth we have seen in this recovery. After devastating losses in value in the 2008-2010 timeframe, we have seen a strong recovery of value, especially in CBD Office according to Real Capital Analytics. Other asset classes, such as industrial and suburban office, have regained their peak values. However, retail has not yet returned to peak values.
|
|
|
|
|
|
|
|
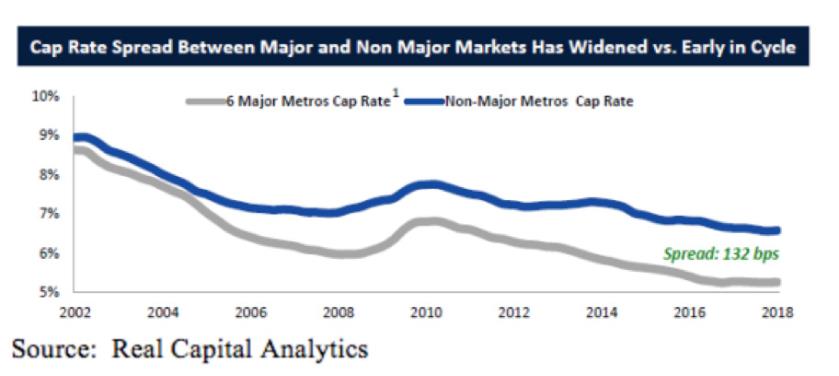
EFFECTS ON CAP RATES
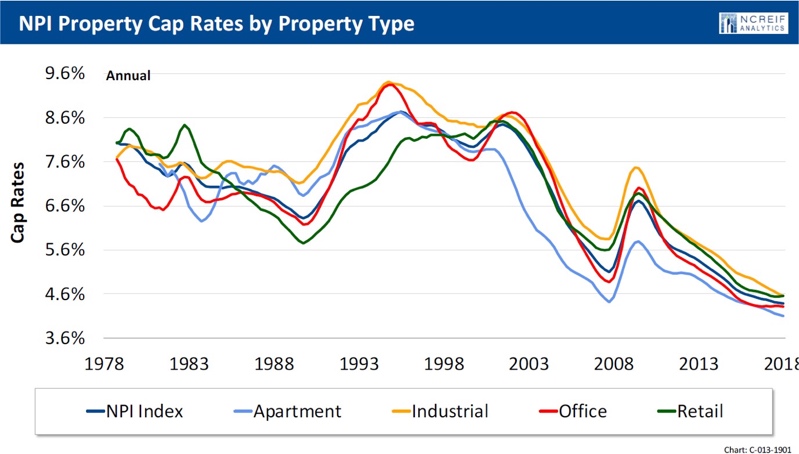
While heavily correlated, the real estate cycles in Core US Metro markets and Non-Core Metro markets tend to move in slightly different cycles. The chart to the right illustrates how cap rates have experienced greater compression in Core US Metro markets versus Non-Core US Metro markets.
Despite significant movement in interest rates over the past 18 months, capitalization rates have remained relatively stable throughout all asset classes, as illustrated in the final chart on the right. |
|
|
|
|
|
|
|
EFFECTS ON THE INVESTMENT ENVIRONMENT
Though current pricing indicates that we are in a seller’s market overall, we believe that our prudent underwriting and flexibility to make investments in any asset class, any geography and any tier in the capital stack leaves us poised to take advantage of the near and intermediate term opportunities.
We believe that the following market conditions, which are by-products of the economy, credit market and regulatory environment should create a favorable investment environment. |
|
|
9
MARKET UPDATES (CONT.)
|
EFFECTS FROM TREND CHANGES
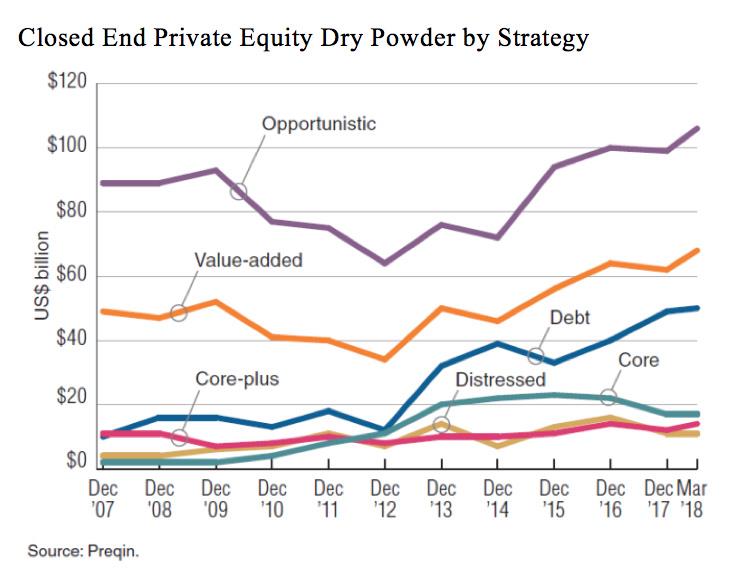
Concentration of fundraising among the largest private equity funds has increased the difficulty for real estate companies to raise equity or mezzanine investments of less than $10,000,000. One of the responses to the 2008 recession, according to Prequin Global Private Equity Report, has been growth in the average size of investment funds, whereby large investors have been investing more of their capital with managers that have extensive track records, and are therefore, by nature, raising much larger funds. In 2014, funds of a size equivalent to $1.5 billion or more accounted for 58% of all private equity capital raised while first-time managers only accounted for 7% of capital raised. The average fund size hit a record of greater than $600,000,000. Larger funds consequently focus on larger deals in order to deploy their capital fully and effectively.
Further, the changing economic landscape may provide dislocation in market and create opportunities in non-core segments of the capital markets and non-core sections of the real estate markets. After years of anticipation of future rises in interest rates, the Federal Reserve has finally felt comfortable with the economy to begin raising rates. For the most part, these rises were already priced into commercial real estate valuations. However, the rising interest rate environment creates uncertainty which can lead to opportunity, especially in the segments of the market which are not flush with increasing levels of institutional capital.
|
|
|
|
|
|
|
|
THE MULTIFAMILY ASSET CLASS
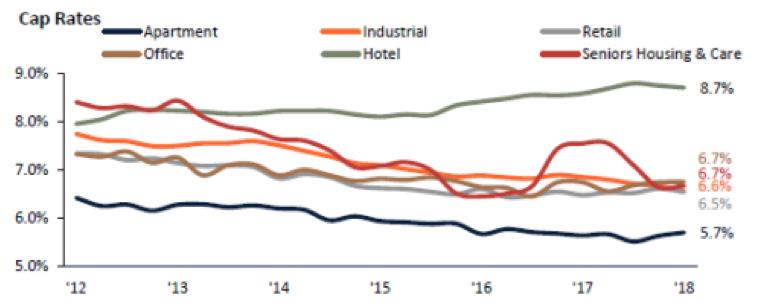
Lastly, we are particularly interested in the valuation trends for the multifamily asset class. As depicted in the chart to the right, cap rates for multifamily assets have decreased steadily since 2012 and maintained a large spread compared to the other asset classes. While the portfolio is currently composed of fixed and floating rate debt or debt-like investments, we are beginning to explore opportunities for common equity investments in suburban multifamily to take advantage of this trend and provide additional diversity for the portfolio. |
|
|
10
MARKET UPDATES (CONT.)
THE MULTIFAMILY ASSET CLASS (CONT.)
Our current MogulREIT I multifamily allocation is as follows:
|
|
|
|
|
|
|
|
|
|
|
|
PROPERTY |
DATE |
ASSET TYPE |
PRODUCT |
CITY |
STATE |
TERM |
INTEREST |
BALANCE AT |
% OF |
|
378 Moss Street |
11/15/17 |
Multifamily |
Debt |
Chula Vista |
CA |
24 mo. |
8.5% |
$3,575,000 |
10.7% |
|
2395 29th Ave |
2/16/18 |
Multifamily |
Debt |
San |
CA |
36 mo. |
8% |
$4,750,000 |
14.2% |
|
Orange Village Tree |
4/23/18 |
Multifamily |
Equity |
Tucson |
AZ |
36 mo. |
12% |
$2,275,000 |
4.9% |
|
|
|
|
|
|
|
|
10.5% |
$10,600,000 |
41.2% |
|
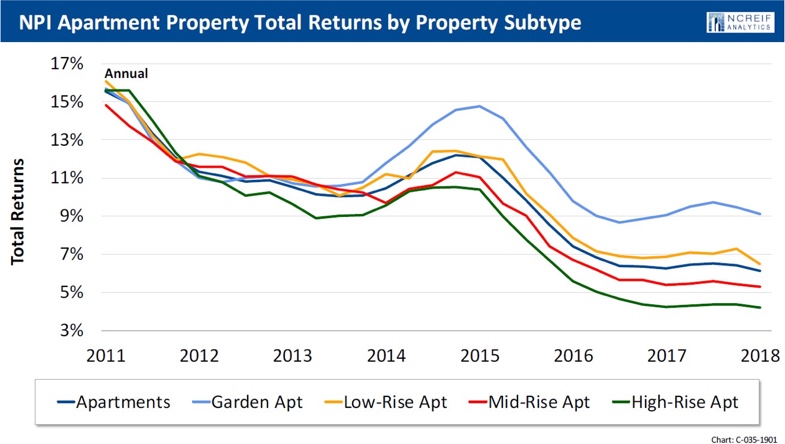
MULTIFAMILY MARKET COMPARISON METRICS Per NCREIF’s Year-End Indices Review, in 2018, apartment buildings had the lowest cap rates of all asset classes. We believe that this trend can be attributed in part to the market viewing multifamily as a defensive asset class, especially in the context of what is now the longest economic expansion in the history of the United States. Tenant risk for multifamily buildings, as opposed to retail and office buildings, is typically spread amongst a larger tenant base; thus, if one tenant vacates, a multifamily property generally can more easily absorb such loss. According to NCREIF’s 2018 report, garden- style apartments had the highest total returns across the multifamily asset class while high-rise buildings performed the worst. |
||
|
|
|
|
|
|
|
|
11
MARKET UPDATES (CONT.)
|
SUPPLY AND DEMAND
Lastly, we are particularly interested in the valuation trends for the multifamily asset class. As depicted in the chart to the right, cap rates for multifamily assets have decreased steadily since 2012 and maintained a large spread compared to the other asset classes. While the portfolio is currently composed of fixed and floating rate debt or debt-like investments, we are beginning to explore opportunities for common equity investments in suburban multifamily to take advantage of this trend and provide additional diversity for the portfolio. |
|
|
|
|
|
|
|
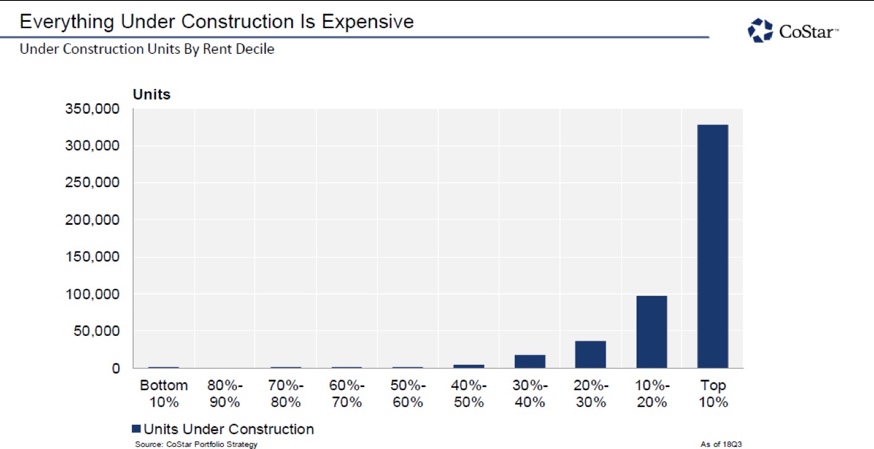
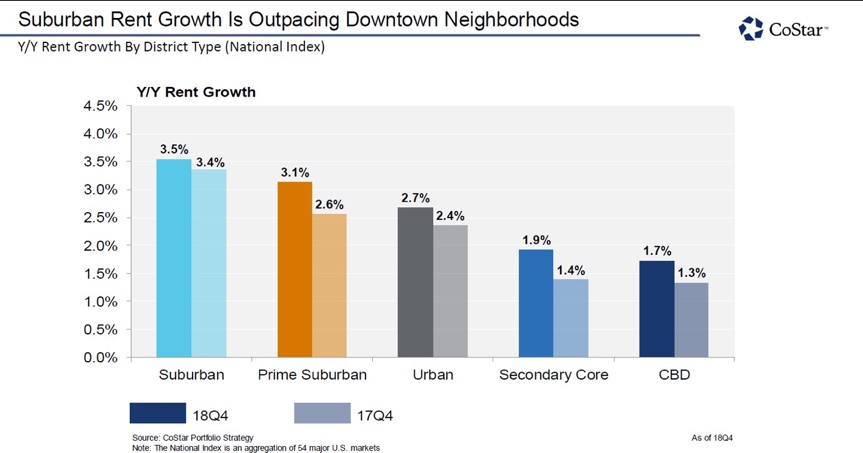
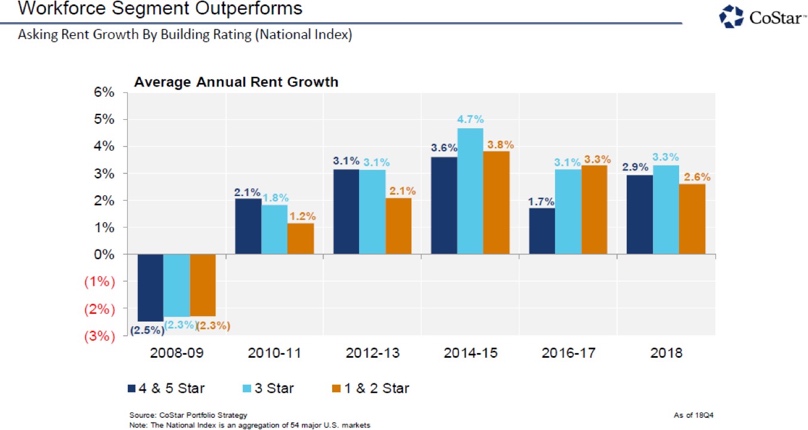
SUPPLY AND DEMAND EFFECTS ON RENT GROWTH
As one might expect from the above insights, according to CoStar, in Q4 2018, suburban multifamily assets had over double the rent growth as CBD multifamily assets, with the strongest rent growth in Class B product, which is typically affordable, workforce housing. |
|
|
12
MARKET UPDATES (CONT.)
CLOSING REMARKS
We believe that the non-core areas of the lending market, specifically small balance bridge loans, mezzanine debt and preferred equity presents investors with attractive risk adjusted return opportunities. While significant liquidity has entered the debt and sub-debt market in the past few years, pushing spreads down, we have continued to see opportunity in the non-core, small balance market where there are fewer participants. Our current portfolio allocation is weighted heavily to retail and office assets as we have seen the most opportunity for debt investments for these asset classes. As public perception of retail and office has tempered, we have found opportunities to lend to these asset classes in a first mortgage, mezzanine, or, when appropriate, preferred equity position.
At the same time, we are also encouraged by the continued success of the suburban multifamily market over the past decade. While the portfolio is currently composed of fixed and floating rate debt or debt-like investments, we are beginning to explore opportunities for common equity investments in workforce housing to take advantage of this trend and provide additional diversity for the portfolio.
13
NET ASSET VALUE (NAV)
|
PRICE PER SHARE $10.00 |
|
NAV PER SHARE (ON 12/31/18) $9.71 |
NAV is calculated on a quarterly basis by taking the total value of our assets less the total value of our liabilities, divided by the number of shares outstanding.
Offering costs can be up to 3.0% of the purchase price. Based on a successful raise, the REIT would ultimately incur the full 3.0%, resulting in a full $0.30 reduction to the $10.00 purchase price and a NAV per share of $9.70.
Investors should reasonably expect the future NAV per share to fully reflect the 3.0% offering costs.
Copyright © 2019 RM Adviser, LLC, all rights reserved.
14
Previous Updates
Please follow the below links to access updates for descriptions of other investments in prior quarters.
We remain excited about all that 2019 has in store for MogulREIT I and our investors. We continue to expand our real estate, technology and investor relations teams and look forward to bringing even more exclusive, highly vetted deals to our clients. We hope you will join us in your pursuit of building wealth as we continue to source institutional quality real estate investments on behalf of discerning investors.
As always, please feel free to contact us at info@realtymogul.com or call directly with any questions you may have.
Sincerely,
/s/ Jilliene Helman
Jilliene Helman
CEO, RM Adviser, LLC
CEO, Realty Mogul, Co.
Forward-Looking Statements
This Current Report on Form 1-U contains forward-looking statements within the meaning of the federal securities laws. The words “believe,” “estimate,” “expect,” “anticipate,” “intend,” “plan,” “seek,” “may,” “continue,” “could,” “might,” “potential,” “predict,” “should,” “will,” “would,” and similar expressions or statements regarding future periods or the negative of these terms are intended to identify forward-looking statements. These forward-looking statements involve known and unknown risks, uncertainties and other important factors that could cause our actual results, performance or achievements, or industry results, to differ materially from any predictions of future results, performance or achievements that we express or imply in this Current Report on Form 1-U.
15
SIGNATURES
Pursuant to the requirements of Regulation A, the issuer has duly caused this report to be signed on its behalf by the undersigned, thereunto duly authorized.
|
|
MOGULREIT I, LLC |
|
|
|
|
|
|
|
By: |
RM Adviser, LLC |
|
|
Its: |
Manager |
|
|
|
|
|
|
By: |
/s/ Jilliene Helman |
|
|
Name: |
Jilliene Helman |
|
|
Title: |
Chief Executive Officer and Secretary |
|
|
|
|
|
|
Date: |
March 6, 2019 |
|
|
|
|
16