000166670010-Kfalse12/31/20December 312020FY538,089,0143900016667002020-01-012020-12-31iso4217:USD00016667002020-06-30xbrli:shares00016667002021-02-100001666700us-gaap:AllowanceForNotesReceivableMember2019-12-310001666700us-gaap:AllowanceForNotesReceivableMember2018-12-310001666700us-gaap:AllowanceForNotesReceivableMember2017-12-310001666700us-gaap:AllowanceForNotesReceivableMember2020-01-012020-12-310001666700us-gaap:AllowanceForNotesReceivableMember2019-01-012019-12-310001666700us-gaap:AllowanceForNotesReceivableMember2018-01-012018-12-310001666700us-gaap:AllowanceForNotesReceivableMember2020-12-310001666700us-gaap:InventoryValuationReserveMember2019-12-310001666700us-gaap:InventoryValuationReserveMember2018-12-310001666700us-gaap:InventoryValuationReserveMember2017-12-310001666700us-gaap:InventoryValuationReserveMember2020-01-012020-12-310001666700us-gaap:InventoryValuationReserveMember2019-01-012019-12-310001666700us-gaap:InventoryValuationReserveMember2018-01-012018-12-310001666700us-gaap:InventoryValuationReserveMember2020-12-310001666700us-gaap:ValuationAllowanceOfDeferredTaxAssetsMember2019-12-310001666700us-gaap:ValuationAllowanceOfDeferredTaxAssetsMember2018-12-310001666700us-gaap:ValuationAllowanceOfDeferredTaxAssetsMember2017-12-310001666700us-gaap:ValuationAllowanceOfDeferredTaxAssetsMember2020-01-012020-12-310001666700us-gaap:ValuationAllowanceOfDeferredTaxAssetsMember2019-01-012019-12-310001666700us-gaap:ValuationAllowanceOfDeferredTaxAssetsMember2018-01-012018-12-310001666700us-gaap:ValuationAllowanceOfDeferredTaxAssetsMember2020-12-3100016667002019-01-012019-12-3100016667002018-01-012018-12-310001666700dd:TotalCompanyDomain2020-01-012020-12-31iso4217:USDxbrli:shares00016667002020-12-3100016667002019-12-310001666700dd:TotalCompanyDomain2019-01-012019-12-310001666700dd:TotalCompanyDomain2018-01-012018-12-310001666700us-gaap:SegmentContinuingOperationsMember2019-12-310001666700us-gaap:SegmentContinuingOperationsMember2018-12-310001666700us-gaap:SegmentContinuingOperationsMember2017-12-310001666700us-gaap:DiscontinuedOperationsDisposedOfByMeansOtherThanSaleSpinoffMember2019-12-310001666700us-gaap:DiscontinuedOperationsDisposedOfByMeansOtherThanSaleSpinoffMember2018-12-310001666700us-gaap:DiscontinuedOperationsDisposedOfByMeansOtherThanSaleSpinoffMember2017-12-3100016667002018-12-3100016667002017-12-310001666700us-gaap:SegmentContinuingOperationsMember2020-12-310001666700us-gaap:DiscontinuedOperationsDisposedOfByMeansOtherThanSaleSpinoffMember2020-12-310001666700us-gaap:CommonStockMember2017-12-310001666700us-gaap:AdditionalPaidInCapitalMember2017-12-310001666700us-gaap:RetainedEarningsMember2017-12-310001666700us-gaap:AccumulatedOtherComprehensiveIncomeMember2017-12-310001666700dd:UnearnedEmployeeStockOwnershipPlanESOPMember2017-12-310001666700us-gaap:TreasuryStockMember2017-12-310001666700us-gaap:NoncontrollingInterestMember2017-12-310001666700us-gaap:RetainedEarningsMember2018-01-012018-12-310001666700us-gaap:AccumulatedOtherComprehensiveIncomeMember2018-01-012018-12-310001666700us-gaap:NoncontrollingInterestMember2018-01-012018-12-310001666700dd:TotalCompanyDomain2018-01-012018-12-310001666700us-gaap:AdditionalPaidInCapitalMember2018-01-012018-12-310001666700dd:UnearnedEmployeeStockOwnershipPlanESOPMember2018-01-012018-12-310001666700us-gaap:TreasuryStockMember2018-01-012018-12-310001666700us-gaap:CommonStockMember2018-12-310001666700us-gaap:AdditionalPaidInCapitalMember2018-12-310001666700us-gaap:RetainedEarningsMember2018-12-310001666700us-gaap:AccumulatedOtherComprehensiveIncomeMember2018-12-310001666700dd:UnearnedEmployeeStockOwnershipPlanESOPMember2018-12-310001666700us-gaap:TreasuryStockMember2018-12-310001666700us-gaap:NoncontrollingInterestMember2018-12-310001666700us-gaap:RetainedEarningsMember2019-01-012019-12-310001666700us-gaap:NoncontrollingInterestMember2019-01-012019-12-310001666700us-gaap:AccumulatedOtherComprehensiveIncomeMember2019-01-012019-12-310001666700dd:TotalCompanyDomain2019-01-012019-12-310001666700us-gaap:AdditionalPaidInCapitalMember2019-01-012019-12-310001666700dd:UnearnedEmployeeStockOwnershipPlanESOPMember2019-01-012019-12-310001666700us-gaap:TreasuryStockMember2019-01-012019-12-310001666700us-gaap:CommonStockMember2019-01-012019-12-310001666700us-gaap:CommonStockMember2019-12-310001666700us-gaap:AdditionalPaidInCapitalMember2019-12-310001666700us-gaap:RetainedEarningsMember2019-12-310001666700us-gaap:AccumulatedOtherComprehensiveIncomeMember2019-12-310001666700dd:UnearnedEmployeeStockOwnershipPlanESOPMember2019-12-310001666700us-gaap:TreasuryStockMember2019-12-310001666700us-gaap:NoncontrollingInterestMember2019-12-310001666700us-gaap:RetainedEarningsMember2020-01-012020-12-310001666700us-gaap:NoncontrollingInterestMember2020-01-012020-12-310001666700us-gaap:AccumulatedOtherComprehensiveIncomeMember2020-01-012020-12-310001666700dd:TotalCompanyDomain2020-01-012020-12-310001666700us-gaap:AdditionalPaidInCapitalMember2020-01-012020-12-310001666700us-gaap:TreasuryStockMember2020-01-012020-12-310001666700us-gaap:CommonStockMember2020-12-310001666700us-gaap:AdditionalPaidInCapitalMember2020-12-310001666700us-gaap:RetainedEarningsMember2020-12-310001666700us-gaap:AccumulatedOtherComprehensiveIncomeMember2020-12-310001666700dd:UnearnedEmployeeStockOwnershipPlanESOPMember2020-12-310001666700us-gaap:TreasuryStockMember2020-12-310001666700us-gaap:NoncontrollingInterestMember2020-12-310001666700srt:MinimumMember2020-01-012020-12-310001666700srt:MaximumMember2020-01-012020-12-3100016667002019-04-012019-04-010001666700dd:MaterialsScienceDivisionMember2020-01-012020-12-310001666700dd:MaterialsScienceDivisionMember2019-01-012019-12-310001666700dd:MaterialsScienceDivisionMember2018-01-012018-12-3100016667002019-06-012019-06-010001666700dd:AgricultureDivisionMember2020-01-012020-12-310001666700dd:AgricultureDivisionMember2019-01-012019-12-310001666700dd:AgricultureDivisionMember2018-01-012018-12-310001666700dd:HistoricalEIDOtherMember2019-01-012019-12-310001666700dd:HistoricalEIDCropProtectionandRDMember2019-01-012019-12-310001666700dd:BiomaterialsBusinessUnitMember2020-12-310001666700us-gaap:SubsequentEventMemberdd:CleanTechnologiesBusinessUnitMember2021-01-310001666700dd:NonCoreHeldForSaleDisposalGroupMember2020-12-310001666700us-gaap:NonCoreMember2020-12-310001666700us-gaap:NonCoreMemberdd:NonCoreHeldForSaleDisposalGroupMember2020-01-012020-12-310001666700us-gaap:NonCoreMember2020-01-012020-12-310001666700dd:ElectronicsAndImagingSegmentMember2020-01-012020-12-310001666700us-gaap:NonCoreMember2019-01-012019-12-310001666700dd:ImageSolutionsMember2020-01-012020-12-310001666700dd:ImageSolutionsMember2019-01-012019-12-310001666700dd:ImageSolutionsMember2018-01-012018-12-310001666700dd:InterconnectSolutionsMember2020-01-012020-12-310001666700dd:InterconnectSolutionsMember2019-01-012019-12-310001666700dd:InterconnectSolutionsMember2018-01-012018-12-310001666700dd:SemiconductorTechnologiesMember2020-01-012020-12-310001666700dd:SemiconductorTechnologiesMember2019-01-012019-12-310001666700dd:SemiconductorTechnologiesMember2018-01-012018-12-310001666700dd:ElectronicsAndImagingSegmentMember2019-01-012019-12-310001666700dd:ElectronicsAndImagingSegmentMember2018-01-012018-12-310001666700us-gaap:FoodAndBeverageMember2020-01-012020-12-310001666700us-gaap:FoodAndBeverageMember2019-01-012019-12-310001666700us-gaap:FoodAndBeverageMember2018-01-012018-12-310001666700dd:HealthBiosciencesMember2020-01-012020-12-310001666700dd:HealthBiosciencesMember2019-01-012019-12-310001666700dd:HealthBiosciencesMember2018-01-012018-12-310001666700dd:PharmaSolutionsMember2020-01-012020-12-310001666700dd:PharmaSolutionsMember2019-01-012019-12-310001666700dd:PharmaSolutionsMember2018-01-012018-12-310001666700dd:NutritionAndBiosciencesSegmentMember2020-01-012020-12-310001666700dd:NutritionAndBiosciencesSegmentMember2019-01-012019-12-310001666700dd:NutritionAndBiosciencesSegmentMember2018-01-012018-12-310001666700dd:HealthcareSpecialtyMember2020-01-012020-12-310001666700dd:HealthcareSpecialtyMember2019-01-012019-12-310001666700dd:HealthcareSpecialtyMember2018-01-012018-12-310001666700dd:IndustrialConsumerMember2020-01-012020-12-310001666700dd:IndustrialConsumerMember2019-01-012019-12-310001666700dd:IndustrialConsumerMember2018-01-012018-12-310001666700dd:MobilitySolutionsMember2020-01-012020-12-310001666700dd:MobilitySolutionsMember2019-01-012019-12-310001666700dd:MobilitySolutionsMember2018-01-012018-12-310001666700dd:TransportationIndustrialMember2020-01-012020-12-310001666700dd:TransportationIndustrialMember2019-01-012019-12-310001666700dd:TransportationIndustrialMember2018-01-012018-12-310001666700dd:SafetySolutionsMember2020-01-012020-12-310001666700dd:SafetySolutionsMember2019-01-012019-12-310001666700dd:SafetySolutionsMember2018-01-012018-12-310001666700dd:ShelterSolutionsMember2020-01-012020-12-310001666700dd:ShelterSolutionsMember2019-01-012019-12-310001666700dd:ShelterSolutionsMember2018-01-012018-12-310001666700dd:WaterSolutionsMember2020-01-012020-12-310001666700dd:WaterSolutionsMember2019-01-012019-12-310001666700dd:WaterSolutionsMember2018-01-012018-12-310001666700dd:SafetyAndConstructionSegmentMember2020-01-012020-12-310001666700dd:SafetyAndConstructionSegmentMember2019-01-012019-12-310001666700dd:SafetyAndConstructionSegmentMember2018-01-012018-12-310001666700dd:BiomaterialsMember2020-01-012020-12-310001666700dd:BiomaterialsMember2019-01-012019-12-310001666700dd:BiomaterialsMember2018-01-012018-12-310001666700dd:CleanTechnologiesMember2020-01-012020-12-310001666700dd:CleanTechnologiesMember2019-01-012019-12-310001666700dd:CleanTechnologiesMember2018-01-012018-12-310001666700dd:DuPontTeijinFilmsMember2020-01-012020-12-310001666700dd:DuPontTeijinFilmsMember2019-01-012019-12-310001666700dd:DuPontTeijinFilmsMember2018-01-012018-12-310001666700dd:PhotovoltaicAdvancedMaterialsMember2020-01-012020-12-310001666700dd:PhotovoltaicAdvancedMaterialsMember2019-01-012019-12-310001666700dd:PhotovoltaicAdvancedMaterialsMember2018-01-012018-12-310001666700dd:SustainableSolutionsMember2020-01-012020-12-310001666700dd:SustainableSolutionsMember2019-01-012019-12-310001666700dd:SustainableSolutionsMember2018-01-012018-12-310001666700us-gaap:NonCoreMember2018-01-012018-12-310001666700dd:A2020RestructuringProgramMember2020-01-012020-12-310001666700dd:A2020RestructuringProgramMemberus-gaap:EmployeeSeveranceMember2020-01-012020-12-310001666700dd:A2020RestructuringProgramMemberdd:AssetRelatedChargesAndOtherMember2020-01-012020-12-310001666700dd:A2020RestructuringProgramMemberdd:ElectronicsAndImagingSegmentMember2020-01-012020-12-310001666700dd:NutritionAndBiosciencesSegmentMemberdd:A2020RestructuringProgramMember2020-01-012020-12-310001666700dd:A2020RestructuringProgramMemberdd:TransportationIndustrialMember2020-01-012020-12-310001666700dd:SafetyAndConstructionSegmentMemberdd:A2020RestructuringProgramMember2020-01-012020-12-310001666700us-gaap:CorporateMemberdd:A2020RestructuringProgramMember2020-01-012020-12-310001666700dd:A2020RestructuringProgramMemberus-gaap:EmployeeSeveranceMember2019-12-310001666700dd:A2020RestructuringProgramMemberdd:AssetRelatedChargesAndOtherMember2019-12-310001666700dd:AccruedAndOtherCurrentLiabilitiesMemberdd:A2020RestructuringProgramMember2019-12-310001666700dd:A2020RestructuringProgramMemberus-gaap:EmployeeSeveranceMember2020-12-310001666700dd:AccruedAndOtherCurrentLiabilitiesMemberdd:A2020RestructuringProgramMember2020-12-310001666700dd:A2019RestructuringProgramDomain2019-04-012020-12-310001666700dd:A2019RestructuringProgramDomainus-gaap:EmployeeSeveranceMember2019-04-012020-12-310001666700dd:A2019RestructuringProgramDomaindd:AssetRelatedChargesAndOtherMember2019-04-012020-12-310001666700dd:A2019RestructuringProgramDomain2020-01-012020-12-310001666700dd:A2019RestructuringProgramDomainus-gaap:EmployeeSeveranceMember2020-01-012020-12-310001666700dd:A2019RestructuringProgramDomainus-gaap:EmployeeSeveranceMember2019-01-012019-12-310001666700dd:A2019RestructuringProgramDomaindd:AssetRelatedChargesAndOtherMember2019-01-012019-12-310001666700dd:A2019RestructuringProgramDomain2019-01-012019-12-310001666700dd:A2019RestructuringProgramDomaindd:ElectronicsAndImagingSegmentMember2020-01-012020-12-310001666700dd:A2019RestructuringProgramDomaindd:ElectronicsAndImagingSegmentMember2019-01-012019-12-310001666700dd:A2019RestructuringProgramDomaindd:NutritionAndBiosciencesSegmentMember2020-01-012020-12-310001666700dd:A2019RestructuringProgramDomaindd:NutritionAndBiosciencesSegmentMember2019-01-012019-12-310001666700dd:A2019RestructuringProgramDomaindd:TransportationIndustrialMember2020-01-012020-12-310001666700dd:A2019RestructuringProgramDomaindd:TransportationIndustrialMember2019-01-012019-12-310001666700dd:A2019RestructuringProgramDomaindd:SafetyAndConstructionSegmentMember2020-01-012020-12-310001666700dd:A2019RestructuringProgramDomaindd:SafetyAndConstructionSegmentMember2019-01-012019-12-310001666700dd:A2019RestructuringProgramDomainus-gaap:NonCoreMember2019-01-012019-12-310001666700dd:A2019RestructuringProgramDomainus-gaap:CorporateMember2020-01-012020-12-310001666700dd:A2019RestructuringProgramDomainus-gaap:CorporateMember2019-01-012019-12-310001666700dd:A2019RestructuringProgramDomainus-gaap:EmployeeSeveranceMember2019-12-310001666700dd:A2019RestructuringProgramDomainus-gaap:EmployeeSeveranceMember2020-12-310001666700dd:A2019RestructuringProgramDomaindd:AccruedAndOtherCurrentLiabilitiesMember2020-12-310001666700dd:A2019RestructuringProgramDomaindd:AccruedAndOtherCurrentLiabilitiesMember2019-12-310001666700dd:DowDuPontCostSynergyProgramMember2017-09-012020-12-310001666700us-gaap:EmployeeSeveranceMemberdd:DowDuPontCostSynergyProgramMember2017-09-012020-12-310001666700dd:AssetRelatedChargesAndOtherMemberdd:DowDuPontCostSynergyProgramMember2017-09-012020-12-310001666700us-gaap:ContractTerminationMemberdd:DowDuPontCostSynergyProgramMember2017-09-012020-12-310001666700dd:DowDuPontCostSynergyProgramMember2020-01-012020-12-310001666700us-gaap:EmployeeSeveranceMemberdd:DowDuPontCostSynergyProgramMember2020-01-012020-12-310001666700us-gaap:EmployeeSeveranceMemberdd:DowDuPontCostSynergyProgramMember2019-01-012019-12-310001666700us-gaap:EmployeeSeveranceMemberdd:DowDuPontCostSynergyProgramMember2018-01-012018-12-310001666700us-gaap:ContractTerminationMemberdd:DowDuPontCostSynergyProgramMember2020-01-012020-12-310001666700us-gaap:ContractTerminationMemberdd:DowDuPontCostSynergyProgramMember2019-01-012019-12-310001666700us-gaap:ContractTerminationMemberdd:DowDuPontCostSynergyProgramMember2018-01-012018-12-310001666700dd:AssetRelatedChargesAndOtherMemberdd:DowDuPontCostSynergyProgramMember2020-01-012020-12-310001666700dd:AssetRelatedChargesAndOtherMemberdd:DowDuPontCostSynergyProgramMember2019-01-012019-12-310001666700dd:AssetRelatedChargesAndOtherMemberdd:DowDuPontCostSynergyProgramMember2018-01-012018-12-310001666700dd:DowDuPontCostSynergyProgramMember2019-01-012019-12-310001666700dd:DowDuPontCostSynergyProgramMember2018-01-012018-12-310001666700dd:RestructuringSettlementAndImpairmentProvisionsDomaindd:DowDuPontCostSynergyProgramMember2019-01-012019-12-310001666700dd:RestructuringSettlementAndImpairmentProvisionsDomaindd:DowDuPontCostSynergyProgramMember2018-01-012018-12-310001666700dd:IncomeLossFromEquityMethodInvestmentsDomaindd:DowDuPontCostSynergyProgramMember2019-01-012019-12-310001666700dd:IncomeLossFromEquityMethodInvestmentsDomaindd:DowDuPontCostSynergyProgramMember2018-01-012018-12-310001666700dd:ElectronicsAndImagingSegmentMemberdd:DowDuPontCostSynergyProgramMember2018-01-012018-12-310001666700dd:NutritionAndBiosciencesSegmentMemberdd:DowDuPontCostSynergyProgramMember2019-01-012019-12-310001666700dd:NutritionAndBiosciencesSegmentMemberdd:DowDuPontCostSynergyProgramMember2018-01-012018-12-310001666700dd:TransportationIndustrialMemberdd:DowDuPontCostSynergyProgramMember2020-01-012020-12-310001666700dd:TransportationIndustrialMemberdd:DowDuPontCostSynergyProgramMember2018-01-012018-12-310001666700dd:SafetyAndConstructionSegmentMemberdd:DowDuPontCostSynergyProgramMember2020-01-012020-12-310001666700dd:SafetyAndConstructionSegmentMemberdd:DowDuPontCostSynergyProgramMember2019-01-012019-12-310001666700dd:SafetyAndConstructionSegmentMemberdd:DowDuPontCostSynergyProgramMember2018-01-012018-12-310001666700us-gaap:NonCoreMemberdd:DowDuPontCostSynergyProgramMember2020-01-012020-12-310001666700us-gaap:NonCoreMemberdd:DowDuPontCostSynergyProgramMember2018-01-012018-12-310001666700us-gaap:CorporateMemberdd:DowDuPontCostSynergyProgramMember2020-01-012020-12-310001666700us-gaap:CorporateMemberdd:DowDuPontCostSynergyProgramMember2019-01-012019-12-310001666700us-gaap:CorporateMemberdd:DowDuPontCostSynergyProgramMember2018-01-012018-12-310001666700us-gaap:EmployeeSeveranceMemberdd:DowDuPontCostSynergyProgramMember2019-12-310001666700us-gaap:ContractTerminationMemberdd:DowDuPontCostSynergyProgramMember2019-12-310001666700dd:AccruedAndOtherCurrentLiabilitiesMemberdd:DowDuPontCostSynergyProgramMember2019-12-310001666700us-gaap:EmployeeSeveranceMemberdd:DowDuPontCostSynergyProgramMember2020-12-310001666700us-gaap:ContractTerminationMemberdd:DowDuPontCostSynergyProgramMember2020-12-310001666700dd:DowDuPontCostSynergyProgramMember2020-12-310001666700dd:AccruedAndOtherCurrentLiabilitiesMemberdd:DowDuPontCostSynergyProgramMember2020-12-310001666700dd:FiniteLivedIntangibleAssetsAndPropertyPlantAndEquipmentMemberus-gaap:NonCoreMember2020-01-012020-12-310001666700us-gaap:NonCoreMemberus-gaap:IndefinitelivedIntangibleAssetsMember2020-01-012020-12-310001666700dd:FiniteLivedIntangibleAssetsAndPropertyPlantAndEquipmentMemberus-gaap:NonCoreMemberdd:BiomaterialsMember2020-01-012020-12-310001666700us-gaap:EquityMethodInvestmentsMemberdd:NutritionAndBiosciencesSegmentMember2019-01-012019-12-310001666700dd:NonCoreSegmentMember2020-01-012020-12-310001666700dd:EIDMemberus-gaap:ForeignExchangeContractMember2018-01-012018-12-310001666700us-gaap:IndemnificationGuaranteeMember2020-01-012020-12-310001666700us-gaap:IndemnificationGuaranteeMemberdd:DowMember2019-01-012019-12-310001666700dd:NBBridgeLoanMember2020-12-31xbrli:pure00016667002017-01-012017-12-310001666700us-gaap:GeographicDistributionForeignMember2019-01-012019-12-310001666700us-gaap:NonCoreMember2020-01-012020-12-310001666700us-gaap:GeographicDistributionDomesticMember2020-01-012020-12-310001666700us-gaap:GeographicDistributionForeignMember2020-01-012020-12-310001666700us-gaap:GeographicDistributionDomesticMember2019-01-012019-12-310001666700us-gaap:GeographicDistributionForeignMember2019-01-012019-12-310001666700us-gaap:GeographicDistributionDomesticMember2018-01-012018-12-310001666700us-gaap:GeographicDistributionForeignMember2018-01-012018-12-310001666700us-gaap:PartnershipMember2020-12-310001666700us-gaap:PartnershipMember2019-12-310001666700dd:ExpiringwithinFiveYearsMember2020-12-310001666700dd:ExpiringwithinFiveYearsMember2019-12-310001666700dd:ExpiringafterFiveYearsorIndefiniteExpirationMember2020-12-310001666700dd:ExpiringafterFiveYearsorIndefiniteExpirationMember2019-12-310001666700us-gaap:GeographicDistributionForeignMember2018-12-310001666700us-gaap:GeographicDistributionForeignMember2019-12-310001666700srt:MinimumMemberus-gaap:LandAndLandImprovementsMember2020-01-012020-12-310001666700srt:MaximumMemberus-gaap:LandAndLandImprovementsMember2020-01-012020-12-310001666700srt:MinimumMemberus-gaap:BuildingMember2020-01-012020-12-310001666700srt:MaximumMemberus-gaap:BuildingMember2020-01-012020-12-310001666700us-gaap:MachineryAndEquipmentMembersrt:MinimumMember2020-01-012020-12-310001666700srt:MaximumMemberus-gaap:MachineryAndEquipmentMember2020-01-012020-12-31dd:entity0001666700srt:MinimumMember2020-12-310001666700srt:MaximumMember2020-12-310001666700us-gaap:EquityMethodInvesteeMemberus-gaap:CustomerConcentrationRiskMemberus-gaap:SalesRevenueNetMember2020-01-012020-12-310001666700us-gaap:EquityMethodInvesteeMemberus-gaap:CustomerConcentrationRiskMemberus-gaap:SalesRevenueNetMember2019-01-012019-12-310001666700us-gaap:EquityMethodInvesteeMemberus-gaap:CustomerConcentrationRiskMemberus-gaap:SalesRevenueNetMember2018-01-012018-12-310001666700us-gaap:CostOfGoodsTotalMemberus-gaap:EquityMethodInvesteeMemberus-gaap:SupplierConcentrationRiskMember2020-01-012020-12-310001666700us-gaap:CostOfGoodsTotalMemberus-gaap:EquityMethodInvesteeMemberus-gaap:SupplierConcentrationRiskMember2019-01-012019-12-310001666700us-gaap:CostOfGoodsTotalMemberus-gaap:EquityMethodInvesteeMemberus-gaap:SupplierConcentrationRiskMember2018-01-012018-12-310001666700dd:HemlockSemiconductorL.L.C.Member2019-12-310001666700dd:DCHSCHoldingsLLCMember2019-12-310001666700dd:HSCgroupMember2020-01-012020-12-310001666700dd:HSCgroupMember2019-01-012019-12-310001666700dd:HSCgroupMember2018-01-012018-12-310001666700dd:ElectronicsAndImagingSegmentMember2018-12-310001666700dd:NutritionAndBiosciencesSegmentMember2018-12-310001666700dd:TransportationIndustrialMember2018-12-310001666700dd:SafetyAndConstructionSegmentMember2018-12-310001666700us-gaap:NonCoreMember2018-12-310001666700dd:SCWaterAcquisitionDomaindd:SafetyAndConstructionSegmentMember2019-01-012019-12-310001666700dd:ElectronicsAndImagingSegmentMember2019-12-310001666700dd:NutritionAndBiosciencesSegmentMember2019-12-310001666700dd:TransportationIndustrialMember2019-12-310001666700dd:SafetyAndConstructionSegmentMember2019-12-310001666700us-gaap:NonCoreMember2019-12-310001666700dd:ElectronicsAndImagingSegmentMember2020-12-310001666700dd:NutritionAndBiosciencesSegmentMember2020-12-310001666700dd:TransportationIndustrialMember2020-12-310001666700dd:SafetyAndConstructionSegmentMember2020-12-310001666700us-gaap:NonCoreMember2020-12-310001666700us-gaap:NonCoreMemberdd:PhotovoltaicAdvancedMaterialsMember2020-01-012020-12-310001666700dd:PhotovoltaicAdvancedMaterialsMemberus-gaap:NonCoreMember2020-01-012020-12-310001666700us-gaap:DevelopedTechnologyRightsMember2020-12-310001666700us-gaap:DevelopedTechnologyRightsMember2019-12-310001666700us-gaap:TrademarksAndTradeNamesMember2020-12-310001666700us-gaap:TrademarksAndTradeNamesMember2019-12-310001666700us-gaap:CustomerRelatedIntangibleAssetsMember2020-12-310001666700us-gaap:CustomerRelatedIntangibleAssetsMember2019-12-310001666700us-gaap:OtherIntangibleAssetsMember2020-12-310001666700us-gaap:OtherIntangibleAssetsMember2019-12-310001666700us-gaap:TrademarksAndTradeNamesMember2020-12-310001666700us-gaap:TrademarksAndTradeNamesMember2019-12-310001666700dd:TransportationIndustrialMemberus-gaap:TrademarksAndTradeNamesMember2020-12-310001666700us-gaap:CommercialPaperMember2020-12-310001666700us-gaap:CommercialPaperMember2019-12-310001666700dd:LongtermdebtduewithinoneyearMember2020-12-310001666700dd:LongtermdebtduewithinoneyearMember2019-12-310001666700us-gaap:LoansPayableMemberdd:PromissoryNotesAndDebenturesFinalMaturity2020Member2020-12-310001666700us-gaap:LoansPayableMemberdd:PromissoryNotesAndDebenturesFinalMaturity2020Member2019-12-310001666700dd:PromissoryNotesAndDebenturesFinalMaturity2022Memberus-gaap:LoansPayableMember2020-12-310001666700dd:PromissoryNotesAndDebenturesFinalMaturity2022Memberus-gaap:LoansPayableMember2019-12-310001666700dd:PromissoryNotesAndDebenturesFinalMaturity2023Memberus-gaap:LoansPayableMember2020-12-310001666700dd:PromissoryNotesAndDebenturesFinalMaturity2023Memberus-gaap:LoansPayableMember2019-12-310001666700dd:PromissoryNotesAndDebenturesFinalMaturity2025Memberus-gaap:LoansPayableMember2020-12-310001666700dd:PromissoryNotesAndDebenturesFinalMaturity2025Memberus-gaap:LoansPayableMember2019-12-310001666700dd:PromissoryNotesAndDebenturesFinalMaturity2026AndThereafterMemberus-gaap:LoansPayableMember2020-12-310001666700dd:PromissoryNotesAndDebenturesFinalMaturity2026AndThereafterMemberus-gaap:LoansPayableMember2019-12-310001666700dd:TermLoanFacilityMember2020-12-310001666700dd:TermLoanFacilityMember2020-12-310001666700dd:TermLoanFacilityMember2019-12-310001666700dd:TermLoanFacilityMember2019-12-310001666700us-gaap:LoansPayableMember2020-12-310001666700us-gaap:LoansPayableMember2019-12-310001666700dd:NBSeniorUnsecuredNotesMember2020-12-310001666700dd:NBSeniorUnsecuredNotesDue2022Memberus-gaap:SeniorNotesMember2020-12-310001666700us-gaap:SeniorNotesMemberdd:NBSeniorUnsecuredNotesDue2025Member2020-12-310001666700us-gaap:FairValueInputsLevel2Memberus-gaap:FairValueMeasurementsRecurringMember2020-12-310001666700us-gaap:FairValueInputsLevel2Memberus-gaap:FairValueMeasurementsRecurringMember2019-12-310001666700us-gaap:RevolvingCreditFacilityMember2020-12-310001666700dd:A1BRevolvingCreditFacilityMember2020-12-310001666700dd:NBseniorunsecuredtermloanfacilityMember2020-12-310001666700dd:NBSeniorUnsecuredNotesMemberus-gaap:SeniorNotesMember2020-12-310001666700dd:NBSeniorUnsecuredNotesDue2022Member2020-12-310001666700dd:NBSeniorUnsecuredNotesDue2025Member2020-12-310001666700us-gaap:SeniorNotesMemberdd:NBSeniorUnsecuredNotesDue2027Member2020-12-310001666700dd:NBSeniorUnsecuredNotesDue2027Member2020-12-310001666700us-gaap:SeniorNotesMemberdd:NBSeniorUnsecuredNotesDue2030Member2020-12-310001666700dd:NBSeniorUnsecuredNotesDue2030Member2020-12-310001666700us-gaap:SeniorNotesMemberdd:NBSeniorUnsecuredNotesDue2040Member2020-12-310001666700dd:NBSeniorUnsecuredNotesDue2040Member2020-12-310001666700dd:NBSeniorUnsecuredNotesDue2050Memberus-gaap:SeniorNotesMember2020-12-310001666700dd:NBSeniorUnsecuredNotesDue2050Member2020-12-310001666700us-gaap:SeniorNotesMemberdd:SeniorUnsecuredNotesDue2023Member2020-12-310001666700dd:SeniorFloatingRateNoteDue2020Member2020-01-012020-12-310001666700dd:SeniorFixedRateNotesDue2020Member2020-01-012020-12-310001666700dd:SeniorFixedRateNotesDue2020Member2020-12-310001666700dd:A364dayRevolvingCreditFacilityMember2019-12-310001666700dd:A2018SeniorNotesMember2020-12-310001666700dd:PFOAMultiDistrictLitigationMDLMemberdd:PFOAMattersMemberdd:EIDMember2020-01-012020-12-310001666700dd:PFOAMultiDistrictLitigationMDLMemberdd:PFOAMattersMemberdd:DuPontMember2020-01-012020-12-310001666700dd:EligiblePFASCostsMember2020-12-310001666700dd:DuPontMember2020-12-310001666700dd:CortevaDomain2020-12-310001666700dd:DuPontandCortevaMember2020-12-310001666700dd:ChemoursMember2020-12-310001666700dd:DuPontandCortevaMember2020-12-310001666700dd:PaymentsDueSeptember2021September2022Memberdd:ChemoursMember2020-12-310001666700dd:PaymentsDueSeptember2021September2022Memberdd:DuPontandCortevaMember2020-12-310001666700dd:PaymentsDueAnnuallyBeginningSeptember2023Memberdd:ChemoursMember2020-12-310001666700dd:PaymentsDueAnnuallyBeginningSeptember2023Memberdd:DuPontandCortevaMember2020-12-310001666700dd:PFOAMattersMemberdd:Leachv.DuPontMemberdd:EIDMember2004-12-310001666700dd:PFOAMultiDistrictLitigationMDLMemberdd:PFOAMattersMemberdd:HistoricalEIDAndChemoursMember2017-01-012017-03-310001666700dd:PFOAMultiDistrictLitigationMDLMemberdd:PFOAMattersMemberdd:EIDMember2017-03-310001666700dd:PFOAMultiDistrictLitigationMDLMember2020-12-310001666700dd:PFOAMultiDistrictLitigationMDLMemberdd:PFOAMattersMember2020-01-012020-12-310001666700dd:PFOAMultiDistrictLitigationMDLMemberdd:PFOAMattersMemberdd:ChemoursMember2020-01-012020-12-310001666700dd:AbbottVsEIDMember2020-01-012020-12-310001666700dd:FayettevilleWorksFacilityMatterMember2020-01-012020-12-310001666700dd:NorthCarolinaGenXMember2020-01-012020-12-310001666700dd:FirefighterFoamCasesDomain2020-12-310001666700dd:RetainedandAssumedatDivestitureDomain2020-12-310001666700us-gaap:IndemnificationGuaranteeMemberdd:DuPontMember2020-12-310001666700us-gaap:IndemnificationGuaranteeMemberdd:DuPontMemberdd:DowMember2020-12-310001666700us-gaap:IndemnificationGuaranteeMemberdd:DuPontMemberdd:CortevaDomain2020-12-310001666700dd:AccountsAndNotesReceivableOtherMember2020-12-310001666700dd:DeferredChargesAndOtherAssetsMember2020-12-310001666700dd:AccruedAndOtherCurrentLiabilitiesMember2020-12-310001666700dd:OtherNoncurrentObligationsMember2020-12-310001666700dd:AccountsAndNotesReceivableOtherMember2019-12-310001666700dd:DeferredChargesAndOtherAssetsMember2019-12-310001666700dd:AccruedAndOtherCurrentLiabilitiesMember2019-12-310001666700dd:OtherNoncurrentObligationsMember2019-12-310001666700dd:CustomerandSupplierGuaranteeBankBorrowingsMember2020-12-310001666700dd:EquityAffiliatesGuaranteeBankBorrowingsMember2020-12-310001666700dd:ResidualValueGuaranteesMember2020-12-3100016667002019-06-010001666700dd:June12019ShareRepurchaseProgramMember2020-01-012020-12-3100016667002019-06-012020-12-3100016667002019-06-252019-06-250001666700us-gaap:AccumulatedNetUnrealizedInvestmentGainLossMember2018-01-010001666700us-gaap:AccumulatedTranslationAdjustmentMember2018-01-010001666700us-gaap:AccumulatedDefinedBenefitPlansAdjustmentMember2018-01-010001666700us-gaap:AccumulatedNetGainLossFromDesignatedOrQualifyingCashFlowHedgesMember2018-01-010001666700us-gaap:AccumulatedOtherComprehensiveIncomeMember2018-01-010001666700us-gaap:AccumulatedNetUnrealizedInvestmentGainLossMember2018-01-012018-12-310001666700us-gaap:AccumulatedTranslationAdjustmentMember2018-01-012018-12-310001666700us-gaap:AccumulatedDefinedBenefitPlansAdjustmentMember2018-01-012018-12-310001666700us-gaap:AccumulatedNetGainLossFromDesignatedOrQualifyingCashFlowHedgesMember2018-01-012018-12-310001666700us-gaap:AccumulatedNetUnrealizedInvestmentGainLossMember2018-12-310001666700us-gaap:AccumulatedTranslationAdjustmentMember2018-12-310001666700us-gaap:AccumulatedDefinedBenefitPlansAdjustmentMember2018-12-310001666700us-gaap:AccumulatedNetGainLossFromDesignatedOrQualifyingCashFlowHedgesMember2018-12-310001666700us-gaap:AccumulatedNetUnrealizedInvestmentGainLossMember2019-01-012019-12-310001666700us-gaap:AccumulatedTranslationAdjustmentMember2019-01-012019-12-310001666700us-gaap:AccumulatedDefinedBenefitPlansAdjustmentMember2019-01-012019-12-310001666700us-gaap:AccumulatedNetGainLossFromDesignatedOrQualifyingCashFlowHedgesMember2019-01-012019-12-310001666700us-gaap:AccumulatedGainLossNetCashFlowHedgeParentMember2019-01-012019-12-310001666700us-gaap:AccumulatedNetUnrealizedInvestmentGainLossMember2019-12-310001666700us-gaap:AccumulatedTranslationAdjustmentMember2019-12-310001666700us-gaap:AccumulatedDefinedBenefitPlansAdjustmentMember2019-12-310001666700us-gaap:AccumulatedNetGainLossFromDesignatedOrQualifyingCashFlowHedgesMember2019-12-310001666700us-gaap:AccumulatedNetUnrealizedInvestmentGainLossMember2020-01-012020-12-310001666700us-gaap:AccumulatedTranslationAdjustmentMember2020-01-012020-12-310001666700us-gaap:AccumulatedDefinedBenefitPlansAdjustmentMember2020-01-012020-12-310001666700us-gaap:AccumulatedNetGainLossFromDesignatedOrQualifyingCashFlowHedgesMember2020-01-012020-12-310001666700us-gaap:AccumulatedNetUnrealizedInvestmentGainLossMember2020-12-310001666700us-gaap:AccumulatedTranslationAdjustmentMember2020-12-310001666700us-gaap:AccumulatedDefinedBenefitPlansAdjustmentMember2020-12-310001666700us-gaap:AccumulatedNetGainLossFromDesignatedOrQualifyingCashFlowHedgesMember2020-12-310001666700us-gaap:AccumulatedNetUnrealizedInvestmentGainLossMemberus-gaap:AccountingStandardsUpdate201601Member2018-01-010001666700us-gaap:AccumulatedNetUnrealizedInvestmentGainLossMemberus-gaap:ReclassificationOutOfAccumulatedOtherComprehensiveIncomeMember2020-01-012020-12-310001666700us-gaap:AccumulatedNetUnrealizedInvestmentGainLossMemberus-gaap:ReclassificationOutOfAccumulatedOtherComprehensiveIncomeMember2019-01-012019-12-310001666700us-gaap:AccumulatedNetUnrealizedInvestmentGainLossMemberus-gaap:ReclassificationOutOfAccumulatedOtherComprehensiveIncomeMember2018-01-012018-12-310001666700us-gaap:AccumulatedTranslationAdjustmentMemberus-gaap:ReclassificationOutOfAccumulatedOtherComprehensiveIncomeMember2020-01-012020-12-310001666700us-gaap:AccumulatedTranslationAdjustmentMemberus-gaap:ReclassificationOutOfAccumulatedOtherComprehensiveIncomeMember2019-01-012019-12-310001666700us-gaap:AccumulatedTranslationAdjustmentMemberus-gaap:ReclassificationOutOfAccumulatedOtherComprehensiveIncomeMember2018-01-012018-12-310001666700us-gaap:AccumulatedDefinedBenefitPlansAdjustmentMemberus-gaap:ReclassificationOutOfAccumulatedOtherComprehensiveIncomeMember2020-01-012020-12-310001666700us-gaap:AccumulatedDefinedBenefitPlansAdjustmentMemberus-gaap:ReclassificationOutOfAccumulatedOtherComprehensiveIncomeMember2019-01-012019-12-310001666700us-gaap:AccumulatedDefinedBenefitPlansAdjustmentMemberus-gaap:ReclassificationOutOfAccumulatedOtherComprehensiveIncomeMember2018-01-012018-12-310001666700us-gaap:AccumulatedNetGainLossFromDesignatedOrQualifyingCashFlowHedgesMemberus-gaap:ReclassificationOutOfAccumulatedOtherComprehensiveIncomeMember2020-01-012020-12-310001666700us-gaap:AccumulatedNetGainLossFromDesignatedOrQualifyingCashFlowHedgesMemberus-gaap:ReclassificationOutOfAccumulatedOtherComprehensiveIncomeMember2019-01-012019-12-310001666700us-gaap:AccumulatedNetGainLossFromDesignatedOrQualifyingCashFlowHedgesMemberus-gaap:ReclassificationOutOfAccumulatedOtherComprehensiveIncomeMember2018-01-012018-12-310001666700us-gaap:ReclassificationOutOfAccumulatedOtherComprehensiveIncomeMember2020-01-012020-12-310001666700us-gaap:ReclassificationOutOfAccumulatedOtherComprehensiveIncomeMember2019-01-012019-12-310001666700us-gaap:ReclassificationOutOfAccumulatedOtherComprehensiveIncomeMember2018-01-012018-12-310001666700dd:DowAndDuPontMergerMember2020-01-012020-12-310001666700dd:DowAndDuPontMergerMember2019-01-012019-12-310001666700dd:DowAndDuPontMergerMember2018-01-012018-12-310001666700us-gaap:PensionPlansDefinedBenefitMember2020-12-310001666700us-gaap:PensionPlansDefinedBenefitMember2019-12-310001666700us-gaap:PensionPlansDefinedBenefitMember2020-01-012020-12-310001666700us-gaap:PensionPlansDefinedBenefitMember2019-01-012019-12-310001666700us-gaap:PensionPlansDefinedBenefitMember2018-01-012018-12-310001666700us-gaap:OtherPostretirementBenefitPlansDefinedBenefitMember2020-12-310001666700us-gaap:OtherPostretirementBenefitPlansDefinedBenefitMember2019-12-310001666700us-gaap:OtherPostretirementBenefitPlansDefinedBenefitMember2020-01-012020-12-310001666700us-gaap:OtherPostretirementBenefitPlansDefinedBenefitMember2019-01-012019-12-310001666700us-gaap:OtherPostretirementBenefitPlansDefinedBenefitMember2018-01-012018-12-310001666700us-gaap:OtherPostretirementBenefitPlansDefinedBenefitMemberdd:DowPensionPlansDomain2019-01-012019-12-310001666700us-gaap:OtherPostretirementBenefitPlansDefinedBenefitMemberdd:DowPensionPlansDomain2018-01-012018-12-310001666700us-gaap:OtherPostretirementBenefitPlansDefinedBenefitMemberdd:DuPontOtherPostretirementBenefitPlansDomain2019-01-012019-12-310001666700us-gaap:OtherPostretirementBenefitPlansDefinedBenefitMemberdd:DuPontOtherPostretirementBenefitPlansDomain2018-01-012018-12-310001666700us-gaap:PensionPlansDefinedBenefitMember2018-12-310001666700us-gaap:OtherPostretirementBenefitPlansDefinedBenefitMember2018-12-310001666700dd:MaterialsScienceDivisionMemberus-gaap:PensionPlansDefinedBenefitMember2020-12-310001666700dd:MaterialsScienceDivisionMemberus-gaap:PensionPlansDefinedBenefitMember2019-12-310001666700dd:MaterialsScienceDivisionMemberus-gaap:OtherPostretirementBenefitPlansDefinedBenefitMember2020-12-310001666700dd:MaterialsScienceDivisionMemberus-gaap:OtherPostretirementBenefitPlansDefinedBenefitMember2019-12-310001666700us-gaap:PensionPlansDefinedBenefitMemberdd:AgricultureDivisionMember2020-12-310001666700us-gaap:PensionPlansDefinedBenefitMemberdd:AgricultureDivisionMember2019-12-310001666700dd:AgricultureDivisionMemberus-gaap:OtherPostretirementBenefitPlansDefinedBenefitMember2020-12-310001666700dd:AgricultureDivisionMemberus-gaap:OtherPostretirementBenefitPlansDefinedBenefitMember2019-12-310001666700country:USdd:PensionPlanwithPlanAssetsDomain2020-12-310001666700country:USdd:PensionPlanwithPlanAssetsDomain2019-12-310001666700country:USdd:OtherPostretirementBenefitPlanswithPlanAssetsDomain2020-12-310001666700country:USdd:OtherPostretirementBenefitPlanswithPlanAssetsDomain2019-12-310001666700us-gaap:ForeignPlanMemberdd:PensionPlanwithPlanAssetsDomain2020-12-310001666700us-gaap:ForeignPlanMemberdd:PensionPlanwithPlanAssetsDomain2019-12-310001666700dd:OtherPostretirementBenefitPlanswithPlanAssetsDomainus-gaap:ForeignPlanMember2020-12-310001666700dd:OtherPostretirementBenefitPlanswithPlanAssetsDomainus-gaap:ForeignPlanMember2019-12-310001666700dd:PensionPlanExcludingPlansWithPlanAssetsDomainus-gaap:ForeignPlanMember2020-12-310001666700dd:PensionPlanExcludingPlansWithPlanAssetsDomainus-gaap:ForeignPlanMember2019-12-310001666700us-gaap:ForeignPlanMemberdd:OtherPostretirementBenefitPlansExcludingPlansWithPlanAssetsDomain2020-12-310001666700us-gaap:ForeignPlanMemberdd:OtherPostretirementBenefitPlansExcludingPlansWithPlanAssetsDomain2019-12-310001666700us-gaap:PensionPlansDefinedBenefitMemberus-gaap:DiscontinuedOperationsDisposedOfByMeansOtherThanSaleSpinoffMember2020-01-012020-12-310001666700us-gaap:PensionPlansDefinedBenefitMemberus-gaap:DiscontinuedOperationsDisposedOfByMeansOtherThanSaleSpinoffMember2019-01-012019-12-310001666700us-gaap:PensionPlansDefinedBenefitMemberus-gaap:DiscontinuedOperationsDisposedOfByMeansOtherThanSaleSpinoffMember2018-01-012018-12-310001666700us-gaap:OtherPostretirementBenefitPlansDefinedBenefitMemberus-gaap:DiscontinuedOperationsDisposedOfByMeansOtherThanSaleSpinoffMember2020-01-012020-12-310001666700us-gaap:OtherPostretirementBenefitPlansDefinedBenefitMemberus-gaap:DiscontinuedOperationsDisposedOfByMeansOtherThanSaleSpinoffMember2019-01-012019-12-310001666700us-gaap:OtherPostretirementBenefitPlansDefinedBenefitMemberus-gaap:DiscontinuedOperationsDisposedOfByMeansOtherThanSaleSpinoffMember2018-01-012018-12-310001666700us-gaap:SegmentContinuingOperationsMemberus-gaap:PensionPlansDefinedBenefitMember2020-01-012020-12-310001666700us-gaap:SegmentContinuingOperationsMemberus-gaap:PensionPlansDefinedBenefitMember2019-01-012019-12-310001666700us-gaap:SegmentContinuingOperationsMemberus-gaap:PensionPlansDefinedBenefitMember2018-01-012018-12-310001666700us-gaap:SegmentContinuingOperationsMemberus-gaap:OtherPostretirementBenefitPlansDefinedBenefitMember2020-01-012020-12-310001666700us-gaap:SegmentContinuingOperationsMemberus-gaap:OtherPostretirementBenefitPlansDefinedBenefitMember2019-01-012019-12-310001666700us-gaap:SegmentContinuingOperationsMemberus-gaap:OtherPostretirementBenefitPlansDefinedBenefitMember2018-01-012018-12-310001666700us-gaap:EquitySecuritiesMemberus-gaap:PensionPlansDefinedBenefitMemberus-gaap:CommonStockMemberdd:DuPontPensionPlansDomaincountry:US2020-12-310001666700us-gaap:EquitySecuritiesMemberus-gaap:PensionPlansDefinedBenefitMember2020-12-310001666700us-gaap:FixedIncomeSecuritiesMemberus-gaap:PensionPlansDefinedBenefitMember2020-12-310001666700us-gaap:PensionPlansDefinedBenefitMemberdd:AlternativeInvestmentsMember2020-12-310001666700us-gaap:PensionPlansDefinedBenefitMemberus-gaap:OtherInvestmentsMember2020-12-310001666700us-gaap:PensionPlansDefinedBenefitMemberus-gaap:CashAndCashEquivalentsMember2020-12-310001666700us-gaap:CashAndCashEquivalentsMemberus-gaap:PensionPlansDefinedBenefitMemberus-gaap:FairValueInputsLevel1Member2020-12-310001666700us-gaap:FairValueInputsLevel2Memberus-gaap:CashAndCashEquivalentsMemberus-gaap:PensionPlansDefinedBenefitMember2020-12-310001666700us-gaap:CashAndCashEquivalentsMemberus-gaap:PensionPlansDefinedBenefitMemberus-gaap:FairValueInputsLevel3Member2020-12-310001666700us-gaap:PensionPlansDefinedBenefitMemberus-gaap:CashAndCashEquivalentsMember2019-12-310001666700us-gaap:CashAndCashEquivalentsMemberus-gaap:PensionPlansDefinedBenefitMemberus-gaap:FairValueInputsLevel1Member2019-12-310001666700us-gaap:FairValueInputsLevel2Memberus-gaap:CashAndCashEquivalentsMemberus-gaap:PensionPlansDefinedBenefitMember2019-12-310001666700us-gaap:CashAndCashEquivalentsMemberus-gaap:PensionPlansDefinedBenefitMemberus-gaap:FairValueInputsLevel3Member2019-12-310001666700us-gaap:EquitySecuritiesMemberus-gaap:PensionPlansDefinedBenefitMembercountry:US2020-12-310001666700us-gaap:EquitySecuritiesMemberus-gaap:PensionPlansDefinedBenefitMemberus-gaap:FairValueInputsLevel1Membercountry:US2020-12-310001666700us-gaap:FairValueInputsLevel2Memberus-gaap:EquitySecuritiesMemberus-gaap:PensionPlansDefinedBenefitMembercountry:US2020-12-310001666700us-gaap:EquitySecuritiesMemberus-gaap:PensionPlansDefinedBenefitMemberus-gaap:FairValueInputsLevel3Membercountry:US2020-12-310001666700us-gaap:EquitySecuritiesMemberus-gaap:PensionPlansDefinedBenefitMembercountry:US2019-12-310001666700us-gaap:EquitySecuritiesMemberus-gaap:PensionPlansDefinedBenefitMemberus-gaap:FairValueInputsLevel1Membercountry:US2019-12-310001666700us-gaap:FairValueInputsLevel2Memberus-gaap:EquitySecuritiesMemberus-gaap:PensionPlansDefinedBenefitMembercountry:US2019-12-310001666700us-gaap:EquitySecuritiesMemberus-gaap:PensionPlansDefinedBenefitMemberus-gaap:FairValueInputsLevel3Membercountry:US2019-12-310001666700us-gaap:EquitySecuritiesMemberus-gaap:PensionPlansDefinedBenefitMemberus-gaap:NonUsMember2020-12-310001666700us-gaap:EquitySecuritiesMemberus-gaap:PensionPlansDefinedBenefitMemberus-gaap:NonUsMemberus-gaap:FairValueInputsLevel1Member2020-12-310001666700us-gaap:FairValueInputsLevel2Memberus-gaap:EquitySecuritiesMemberus-gaap:PensionPlansDefinedBenefitMemberus-gaap:NonUsMember2020-12-310001666700us-gaap:EquitySecuritiesMemberus-gaap:PensionPlansDefinedBenefitMemberus-gaap:FairValueInputsLevel3Memberus-gaap:NonUsMember2020-12-310001666700us-gaap:EquitySecuritiesMemberus-gaap:PensionPlansDefinedBenefitMemberus-gaap:NonUsMember2019-12-310001666700us-gaap:EquitySecuritiesMemberus-gaap:PensionPlansDefinedBenefitMemberus-gaap:NonUsMemberus-gaap:FairValueInputsLevel1Member2019-12-310001666700us-gaap:FairValueInputsLevel2Memberus-gaap:EquitySecuritiesMemberus-gaap:PensionPlansDefinedBenefitMemberus-gaap:NonUsMember2019-12-310001666700us-gaap:EquitySecuritiesMemberus-gaap:PensionPlansDefinedBenefitMemberus-gaap:FairValueInputsLevel3Memberus-gaap:NonUsMember2019-12-310001666700us-gaap:EquitySecuritiesMemberus-gaap:PensionPlansDefinedBenefitMemberus-gaap:FairValueInputsLevel1Member2020-12-310001666700us-gaap:FairValueInputsLevel2Memberus-gaap:EquitySecuritiesMemberus-gaap:PensionPlansDefinedBenefitMember2020-12-310001666700us-gaap:EquitySecuritiesMemberus-gaap:PensionPlansDefinedBenefitMemberus-gaap:FairValueInputsLevel3Member2020-12-310001666700us-gaap:EquitySecuritiesMemberus-gaap:PensionPlansDefinedBenefitMember2019-12-310001666700us-gaap:EquitySecuritiesMemberus-gaap:PensionPlansDefinedBenefitMemberus-gaap:FairValueInputsLevel1Member2019-12-310001666700us-gaap:FairValueInputsLevel2Memberus-gaap:EquitySecuritiesMemberus-gaap:PensionPlansDefinedBenefitMember2019-12-310001666700us-gaap:EquitySecuritiesMemberus-gaap:PensionPlansDefinedBenefitMemberus-gaap:FairValueInputsLevel3Member2019-12-310001666700us-gaap:PensionPlansDefinedBenefitMemberus-gaap:USTreasuryAndGovernmentMember2020-12-310001666700us-gaap:PensionPlansDefinedBenefitMemberus-gaap:FairValueInputsLevel1Memberus-gaap:USTreasuryAndGovernmentMember2020-12-310001666700us-gaap:FairValueInputsLevel2Memberus-gaap:PensionPlansDefinedBenefitMemberus-gaap:USTreasuryAndGovernmentMember2020-12-310001666700us-gaap:PensionPlansDefinedBenefitMemberus-gaap:FairValueInputsLevel3Memberus-gaap:USTreasuryAndGovernmentMember2020-12-310001666700us-gaap:PensionPlansDefinedBenefitMemberus-gaap:USTreasuryAndGovernmentMember2019-12-310001666700us-gaap:PensionPlansDefinedBenefitMemberus-gaap:FairValueInputsLevel1Memberus-gaap:USTreasuryAndGovernmentMember2019-12-310001666700us-gaap:FairValueInputsLevel2Memberus-gaap:PensionPlansDefinedBenefitMemberus-gaap:USTreasuryAndGovernmentMember2019-12-310001666700us-gaap:PensionPlansDefinedBenefitMemberus-gaap:FairValueInputsLevel3Memberus-gaap:USTreasuryAndGovernmentMember2019-12-310001666700us-gaap:PensionPlansDefinedBenefitMemberus-gaap:CorporateDebtSecuritiesMember2020-12-310001666700us-gaap:PensionPlansDefinedBenefitMemberus-gaap:CorporateDebtSecuritiesMemberus-gaap:FairValueInputsLevel1Member2020-12-310001666700us-gaap:FairValueInputsLevel2Memberus-gaap:PensionPlansDefinedBenefitMemberus-gaap:CorporateDebtSecuritiesMember2020-12-310001666700us-gaap:PensionPlansDefinedBenefitMemberus-gaap:FairValueInputsLevel3Memberus-gaap:CorporateDebtSecuritiesMember2020-12-310001666700us-gaap:PensionPlansDefinedBenefitMemberus-gaap:CorporateDebtSecuritiesMember2019-12-310001666700us-gaap:PensionPlansDefinedBenefitMemberus-gaap:CorporateDebtSecuritiesMemberus-gaap:FairValueInputsLevel1Member2019-12-310001666700us-gaap:FairValueInputsLevel2Memberus-gaap:PensionPlansDefinedBenefitMemberus-gaap:CorporateDebtSecuritiesMember2019-12-310001666700us-gaap:PensionPlansDefinedBenefitMemberus-gaap:FairValueInputsLevel3Memberus-gaap:CorporateDebtSecuritiesMember2019-12-310001666700us-gaap:PensionPlansDefinedBenefitMemberus-gaap:AssetBackedSecuritiesMember2020-12-310001666700us-gaap:PensionPlansDefinedBenefitMemberus-gaap:FairValueInputsLevel1Memberus-gaap:AssetBackedSecuritiesMember2020-12-310001666700us-gaap:FairValueInputsLevel2Memberus-gaap:PensionPlansDefinedBenefitMemberus-gaap:AssetBackedSecuritiesMember2020-12-310001666700us-gaap:PensionPlansDefinedBenefitMemberus-gaap:FairValueInputsLevel3Memberus-gaap:AssetBackedSecuritiesMember2020-12-310001666700us-gaap:PensionPlansDefinedBenefitMemberus-gaap:AssetBackedSecuritiesMember2019-12-310001666700us-gaap:PensionPlansDefinedBenefitMemberus-gaap:FairValueInputsLevel1Memberus-gaap:AssetBackedSecuritiesMember2019-12-310001666700us-gaap:FairValueInputsLevel2Memberus-gaap:PensionPlansDefinedBenefitMemberus-gaap:AssetBackedSecuritiesMember2019-12-310001666700us-gaap:PensionPlansDefinedBenefitMemberus-gaap:FairValueInputsLevel3Memberus-gaap:AssetBackedSecuritiesMember2019-12-310001666700us-gaap:FixedIncomeSecuritiesMemberus-gaap:PensionPlansDefinedBenefitMemberus-gaap:FairValueInputsLevel1Member2020-12-310001666700us-gaap:FixedIncomeSecuritiesMemberus-gaap:FairValueInputsLevel2Memberus-gaap:PensionPlansDefinedBenefitMember2020-12-310001666700us-gaap:FixedIncomeSecuritiesMemberus-gaap:PensionPlansDefinedBenefitMemberus-gaap:FairValueInputsLevel3Member2020-12-310001666700us-gaap:FixedIncomeSecuritiesMemberus-gaap:PensionPlansDefinedBenefitMember2019-12-310001666700us-gaap:FixedIncomeSecuritiesMemberus-gaap:PensionPlansDefinedBenefitMemberus-gaap:FairValueInputsLevel1Member2019-12-310001666700us-gaap:FixedIncomeSecuritiesMemberus-gaap:FairValueInputsLevel2Memberus-gaap:PensionPlansDefinedBenefitMember2019-12-310001666700us-gaap:FixedIncomeSecuritiesMemberus-gaap:PensionPlansDefinedBenefitMemberus-gaap:FairValueInputsLevel3Member2019-12-310001666700us-gaap:PensionPlansDefinedBenefitMemberus-gaap:RealEstateFundsMember2020-12-310001666700us-gaap:PensionPlansDefinedBenefitMemberus-gaap:RealEstateFundsMemberus-gaap:FairValueInputsLevel1Member2020-12-310001666700us-gaap:FairValueInputsLevel2Memberus-gaap:PensionPlansDefinedBenefitMemberus-gaap:RealEstateFundsMember2020-12-310001666700us-gaap:PensionPlansDefinedBenefitMemberus-gaap:RealEstateFundsMemberus-gaap:FairValueInputsLevel3Member2020-12-310001666700us-gaap:PensionPlansDefinedBenefitMemberus-gaap:RealEstateFundsMember2019-12-310001666700us-gaap:PensionPlansDefinedBenefitMemberus-gaap:RealEstateFundsMemberus-gaap:FairValueInputsLevel1Member2019-12-310001666700us-gaap:FairValueInputsLevel2Memberus-gaap:PensionPlansDefinedBenefitMemberus-gaap:RealEstateFundsMember2019-12-310001666700us-gaap:PensionPlansDefinedBenefitMemberus-gaap:RealEstateFundsMemberus-gaap:FairValueInputsLevel3Member2019-12-310001666700us-gaap:PensionPlansDefinedBenefitMemberus-gaap:GuaranteedInsuranceContractTypeOfGuaranteeDomain2020-12-310001666700us-gaap:PensionPlansDefinedBenefitMemberus-gaap:FairValueInputsLevel1Memberus-gaap:GuaranteedInsuranceContractTypeOfGuaranteeDomain2020-12-310001666700us-gaap:FairValueInputsLevel2Memberus-gaap:PensionPlansDefinedBenefitMemberus-gaap:GuaranteedInsuranceContractTypeOfGuaranteeDomain2020-12-310001666700us-gaap:PensionPlansDefinedBenefitMemberus-gaap:FairValueInputsLevel3Memberus-gaap:GuaranteedInsuranceContractTypeOfGuaranteeDomain2020-12-310001666700us-gaap:PensionPlansDefinedBenefitMemberus-gaap:GuaranteedInsuranceContractTypeOfGuaranteeDomain2019-12-310001666700us-gaap:PensionPlansDefinedBenefitMemberus-gaap:FairValueInputsLevel1Memberus-gaap:GuaranteedInsuranceContractTypeOfGuaranteeDomain2019-12-310001666700us-gaap:FairValueInputsLevel2Memberus-gaap:PensionPlansDefinedBenefitMemberus-gaap:GuaranteedInsuranceContractTypeOfGuaranteeDomain2019-12-310001666700us-gaap:PensionPlansDefinedBenefitMemberus-gaap:FairValueInputsLevel3Memberus-gaap:GuaranteedInsuranceContractTypeOfGuaranteeDomain2019-12-310001666700us-gaap:PensionPlansDefinedBenefitMemberus-gaap:DerivativeFinancialInstrumentsAssetsMember2020-12-310001666700us-gaap:PensionPlansDefinedBenefitMemberus-gaap:DerivativeFinancialInstrumentsAssetsMemberus-gaap:FairValueInputsLevel1Member2020-12-310001666700us-gaap:FairValueInputsLevel2Memberus-gaap:PensionPlansDefinedBenefitMemberus-gaap:DerivativeFinancialInstrumentsAssetsMember2020-12-310001666700us-gaap:PensionPlansDefinedBenefitMemberus-gaap:FairValueInputsLevel3Memberus-gaap:DerivativeFinancialInstrumentsAssetsMember2020-12-310001666700us-gaap:PensionPlansDefinedBenefitMemberus-gaap:DerivativeFinancialInstrumentsAssetsMember2019-12-310001666700us-gaap:PensionPlansDefinedBenefitMemberus-gaap:DerivativeFinancialInstrumentsAssetsMemberus-gaap:FairValueInputsLevel1Member2019-12-310001666700us-gaap:FairValueInputsLevel2Memberus-gaap:PensionPlansDefinedBenefitMemberus-gaap:DerivativeFinancialInstrumentsAssetsMember2019-12-310001666700us-gaap:PensionPlansDefinedBenefitMemberus-gaap:FairValueInputsLevel3Memberus-gaap:DerivativeFinancialInstrumentsAssetsMember2019-12-310001666700us-gaap:DerivativeFinancialInstrumentsLiabilitiesMemberus-gaap:PensionPlansDefinedBenefitMember2020-12-310001666700us-gaap:DerivativeFinancialInstrumentsLiabilitiesMemberus-gaap:PensionPlansDefinedBenefitMemberus-gaap:FairValueInputsLevel1Member2020-12-310001666700us-gaap:DerivativeFinancialInstrumentsLiabilitiesMemberus-gaap:FairValueInputsLevel2Memberus-gaap:PensionPlansDefinedBenefitMember2020-12-310001666700us-gaap:DerivativeFinancialInstrumentsLiabilitiesMemberus-gaap:PensionPlansDefinedBenefitMemberus-gaap:FairValueInputsLevel3Member2020-12-310001666700us-gaap:DerivativeFinancialInstrumentsLiabilitiesMemberus-gaap:PensionPlansDefinedBenefitMember2019-12-310001666700us-gaap:DerivativeFinancialInstrumentsLiabilitiesMemberus-gaap:PensionPlansDefinedBenefitMemberus-gaap:FairValueInputsLevel1Member2019-12-310001666700us-gaap:DerivativeFinancialInstrumentsLiabilitiesMemberus-gaap:FairValueInputsLevel2Memberus-gaap:PensionPlansDefinedBenefitMember2019-12-310001666700us-gaap:DerivativeFinancialInstrumentsLiabilitiesMemberus-gaap:PensionPlansDefinedBenefitMemberus-gaap:FairValueInputsLevel3Member2019-12-310001666700us-gaap:PensionPlansDefinedBenefitMemberdd:AlternativeInvestmentsMemberus-gaap:FairValueInputsLevel1Member2020-12-310001666700us-gaap:FairValueInputsLevel2Memberus-gaap:PensionPlansDefinedBenefitMemberdd:AlternativeInvestmentsMember2020-12-310001666700us-gaap:PensionPlansDefinedBenefitMemberus-gaap:FairValueInputsLevel3Memberdd:AlternativeInvestmentsMember2020-12-310001666700us-gaap:PensionPlansDefinedBenefitMemberdd:AlternativeInvestmentsMember2019-12-310001666700us-gaap:PensionPlansDefinedBenefitMemberdd:AlternativeInvestmentsMemberus-gaap:FairValueInputsLevel1Member2019-12-310001666700us-gaap:FairValueInputsLevel2Memberus-gaap:PensionPlansDefinedBenefitMemberdd:AlternativeInvestmentsMember2019-12-310001666700us-gaap:PensionPlansDefinedBenefitMemberus-gaap:FairValueInputsLevel3Memberdd:AlternativeInvestmentsMember2019-12-310001666700us-gaap:HedgeFundsMemberus-gaap:PensionPlansDefinedBenefitMember2020-12-310001666700us-gaap:HedgeFundsMemberus-gaap:PensionPlansDefinedBenefitMemberus-gaap:FairValueInputsLevel1Member2020-12-310001666700us-gaap:HedgeFundsMemberus-gaap:FairValueInputsLevel2Memberus-gaap:PensionPlansDefinedBenefitMember2020-12-310001666700us-gaap:HedgeFundsMemberus-gaap:PensionPlansDefinedBenefitMemberus-gaap:FairValueInputsLevel3Member2020-12-310001666700us-gaap:HedgeFundsMemberus-gaap:PensionPlansDefinedBenefitMember2019-12-310001666700us-gaap:HedgeFundsMemberus-gaap:PensionPlansDefinedBenefitMemberus-gaap:FairValueInputsLevel1Member2019-12-310001666700us-gaap:HedgeFundsMemberus-gaap:FairValueInputsLevel2Memberus-gaap:PensionPlansDefinedBenefitMember2019-12-310001666700us-gaap:HedgeFundsMemberus-gaap:PensionPlansDefinedBenefitMemberus-gaap:FairValueInputsLevel3Member2019-12-310001666700us-gaap:PensionPlansDefinedBenefitMemberus-gaap:PrivateEquityFundsMember2020-12-310001666700us-gaap:PensionPlansDefinedBenefitMemberus-gaap:PrivateEquityFundsMemberus-gaap:FairValueInputsLevel1Member2020-12-310001666700us-gaap:FairValueInputsLevel2Memberus-gaap:PensionPlansDefinedBenefitMemberus-gaap:PrivateEquityFundsMember2020-12-310001666700us-gaap:PensionPlansDefinedBenefitMemberus-gaap:FairValueInputsLevel3Memberus-gaap:PrivateEquityFundsMember2020-12-310001666700us-gaap:PensionPlansDefinedBenefitMemberus-gaap:PrivateEquityFundsMember2019-12-310001666700us-gaap:PensionPlansDefinedBenefitMemberus-gaap:PrivateEquityFundsMemberus-gaap:FairValueInputsLevel1Member2019-12-310001666700us-gaap:FairValueInputsLevel2Memberus-gaap:PensionPlansDefinedBenefitMemberus-gaap:PrivateEquityFundsMember2019-12-310001666700us-gaap:PensionPlansDefinedBenefitMemberus-gaap:FairValueInputsLevel3Memberus-gaap:PrivateEquityFundsMember2019-12-310001666700us-gaap:PensionPlansDefinedBenefitMemberus-gaap:OtherAggregatedInvestmentsMember2020-12-310001666700us-gaap:PensionPlansDefinedBenefitMemberus-gaap:FairValueInputsLevel1Memberus-gaap:OtherAggregatedInvestmentsMember2020-12-310001666700us-gaap:FairValueInputsLevel2Memberus-gaap:PensionPlansDefinedBenefitMemberus-gaap:OtherAggregatedInvestmentsMember2020-12-310001666700us-gaap:PensionPlansDefinedBenefitMemberus-gaap:FairValueInputsLevel3Memberus-gaap:OtherAggregatedInvestmentsMember2020-12-310001666700us-gaap:PensionPlansDefinedBenefitMemberus-gaap:OtherAggregatedInvestmentsMember2019-12-310001666700us-gaap:PensionPlansDefinedBenefitMemberus-gaap:FairValueInputsLevel1Memberus-gaap:OtherAggregatedInvestmentsMember2019-12-310001666700us-gaap:FairValueInputsLevel2Memberus-gaap:PensionPlansDefinedBenefitMemberus-gaap:OtherAggregatedInvestmentsMember2019-12-310001666700us-gaap:PensionPlansDefinedBenefitMemberus-gaap:FairValueInputsLevel3Memberus-gaap:OtherAggregatedInvestmentsMember2019-12-310001666700us-gaap:PensionPlansDefinedBenefitMemberus-gaap:OtherInvestmentsMemberus-gaap:FairValueInputsLevel1Member2020-12-310001666700us-gaap:FairValueInputsLevel2Memberus-gaap:PensionPlansDefinedBenefitMemberus-gaap:OtherInvestmentsMember2020-12-310001666700us-gaap:PensionPlansDefinedBenefitMemberus-gaap:OtherInvestmentsMemberus-gaap:FairValueInputsLevel3Member2020-12-310001666700us-gaap:PensionPlansDefinedBenefitMemberus-gaap:OtherInvestmentsMember2019-12-310001666700us-gaap:PensionPlansDefinedBenefitMemberus-gaap:OtherInvestmentsMemberus-gaap:FairValueInputsLevel1Member2019-12-310001666700us-gaap:FairValueInputsLevel2Memberus-gaap:PensionPlansDefinedBenefitMemberus-gaap:OtherInvestmentsMember2019-12-310001666700us-gaap:PensionPlansDefinedBenefitMemberus-gaap:OtherInvestmentsMemberus-gaap:FairValueInputsLevel3Member2019-12-310001666700us-gaap:PensionPlansDefinedBenefitMemberus-gaap:FairValueInputsLevel1Member2020-12-310001666700us-gaap:FairValueInputsLevel2Memberus-gaap:PensionPlansDefinedBenefitMember2020-12-310001666700us-gaap:PensionPlansDefinedBenefitMemberus-gaap:FairValueInputsLevel3Member2020-12-310001666700us-gaap:PensionPlansDefinedBenefitMemberus-gaap:FairValueInputsLevel1Member2019-12-310001666700us-gaap:FairValueInputsLevel2Memberus-gaap:PensionPlansDefinedBenefitMember2019-12-310001666700us-gaap:PensionPlansDefinedBenefitMemberus-gaap:FairValueInputsLevel3Member2019-12-310001666700us-gaap:PensionPlansDefinedBenefitMemberus-gaap:USTreasuryAndGovernmentMemberus-gaap:FairValueMeasuredAtNetAssetValuePerShareMember2020-12-310001666700us-gaap:PensionPlansDefinedBenefitMemberus-gaap:USTreasuryAndGovernmentMemberus-gaap:FairValueMeasuredAtNetAssetValuePerShareMember2019-12-310001666700us-gaap:HedgeFundsMemberus-gaap:PensionPlansDefinedBenefitMemberus-gaap:FairValueMeasuredAtNetAssetValuePerShareMember2020-12-310001666700us-gaap:HedgeFundsMemberus-gaap:PensionPlansDefinedBenefitMemberus-gaap:FairValueMeasuredAtNetAssetValuePerShareMember2019-12-310001666700us-gaap:PensionPlansDefinedBenefitMemberus-gaap:PrivateEquityFundsMemberus-gaap:FairValueMeasuredAtNetAssetValuePerShareMember2020-12-310001666700us-gaap:PensionPlansDefinedBenefitMemberus-gaap:PrivateEquityFundsMemberus-gaap:FairValueMeasuredAtNetAssetValuePerShareMember2019-12-310001666700us-gaap:PensionPlansDefinedBenefitMemberus-gaap:RealEstateFundsMemberus-gaap:FairValueMeasuredAtNetAssetValuePerShareMember2020-12-310001666700us-gaap:PensionPlansDefinedBenefitMemberus-gaap:RealEstateFundsMemberus-gaap:FairValueMeasuredAtNetAssetValuePerShareMember2019-12-310001666700us-gaap:PensionPlansDefinedBenefitMemberus-gaap:FairValueMeasuredAtNetAssetValuePerShareMember2020-12-310001666700us-gaap:PensionPlansDefinedBenefitMemberus-gaap:FairValueMeasuredAtNetAssetValuePerShareMember2019-12-310001666700us-gaap:EquitySecuritiesMemberus-gaap:PensionPlansDefinedBenefitMemberus-gaap:CommonStockMemberdd:DuPontPensionPlansDomaincountry:US2019-12-310001666700us-gaap:EquitySecuritiesMemberus-gaap:PensionPlansDefinedBenefitMemberus-gaap:FairValueInputsLevel3Member2018-12-310001666700us-gaap:FixedIncomeSecuritiesMemberus-gaap:PensionPlansDefinedBenefitMemberus-gaap:FairValueInputsLevel3Member2018-12-310001666700us-gaap:PensionPlansDefinedBenefitMemberus-gaap:RealEstateFundsMemberus-gaap:FairValueInputsLevel3Member2018-12-310001666700us-gaap:PensionPlansDefinedBenefitMemberus-gaap:FairValueInputsLevel3Memberus-gaap:GuaranteedInsuranceContractTypeOfGuaranteeDomain2018-12-310001666700us-gaap:PensionPlansDefinedBenefitMemberus-gaap:FairValueInputsLevel3Member2018-12-310001666700us-gaap:EquitySecuritiesMemberus-gaap:PensionPlansDefinedBenefitMemberus-gaap:FairValueInputsLevel3Member2019-01-012019-12-310001666700us-gaap:FixedIncomeSecuritiesMemberus-gaap:PensionPlansDefinedBenefitMemberus-gaap:FairValueInputsLevel3Member2019-01-012019-12-310001666700us-gaap:PensionPlansDefinedBenefitMemberus-gaap:RealEstateFundsMemberus-gaap:FairValueInputsLevel3Member2019-01-012019-12-310001666700us-gaap:PensionPlansDefinedBenefitMemberus-gaap:FairValueInputsLevel3Memberus-gaap:GuaranteedInsuranceContractTypeOfGuaranteeDomain2019-01-012019-12-310001666700us-gaap:PensionPlansDefinedBenefitMemberus-gaap:FairValueInputsLevel3Member2019-01-012019-12-310001666700us-gaap:EquitySecuritiesMemberus-gaap:PensionPlansDefinedBenefitMemberus-gaap:FairValueInputsLevel3Memberus-gaap:DiscontinuedOperationsDisposedOfByMeansOtherThanSaleSpinoffMember2019-01-012019-12-310001666700us-gaap:FixedIncomeSecuritiesMemberus-gaap:PensionPlansDefinedBenefitMemberus-gaap:FairValueInputsLevel3Memberus-gaap:DiscontinuedOperationsDisposedOfByMeansOtherThanSaleSpinoffMember2019-01-012019-12-310001666700us-gaap:PensionPlansDefinedBenefitMemberus-gaap:RealEstateFundsMemberus-gaap:FairValueInputsLevel3Memberus-gaap:DiscontinuedOperationsDisposedOfByMeansOtherThanSaleSpinoffMember2019-01-012019-12-310001666700us-gaap:PensionPlansDefinedBenefitMemberus-gaap:FairValueInputsLevel3Memberus-gaap:DiscontinuedOperationsDisposedOfByMeansOtherThanSaleSpinoffMemberus-gaap:GuaranteedInsuranceContractTypeOfGuaranteeDomain2019-01-012019-12-310001666700us-gaap:PensionPlansDefinedBenefitMemberus-gaap:FairValueInputsLevel3Memberus-gaap:DiscontinuedOperationsDisposedOfByMeansOtherThanSaleSpinoffMember2019-01-012019-12-310001666700us-gaap:EquitySecuritiesMemberus-gaap:PensionPlansDefinedBenefitMemberus-gaap:FairValueInputsLevel3Member2020-01-012020-12-310001666700us-gaap:FixedIncomeSecuritiesMemberus-gaap:PensionPlansDefinedBenefitMemberus-gaap:FairValueInputsLevel3Member2020-01-012020-12-310001666700us-gaap:PensionPlansDefinedBenefitMemberus-gaap:RealEstateFundsMemberus-gaap:FairValueInputsLevel3Member2020-01-012020-12-310001666700us-gaap:PensionPlansDefinedBenefitMemberus-gaap:FairValueInputsLevel3Memberus-gaap:GuaranteedInsuranceContractTypeOfGuaranteeDomain2020-01-012020-12-310001666700us-gaap:PensionPlansDefinedBenefitMemberus-gaap:FairValueInputsLevel3Member2020-01-012020-12-310001666700dd:DowEmployeeSavingsPlanor401kPlansMember2018-01-012018-12-310001666700dd:DuPontU.S.RetirementSavingsPlanMember2017-09-012017-12-310001666700dd:DuPontU.S.RetirementSavingsPlanMember2019-01-012019-12-310001666700dd:DuPontOtherContributionPlansMember2017-09-012017-12-310001666700dd:DuPontU.S.RetirementSavingsPlanMember2020-01-012020-12-310001666700dd:DuPontOtherContributionPlansMember2020-01-012020-12-310001666700dd:DuPontOtherContributionPlansMember2019-01-012019-12-310001666700dd:DuPont2020EquityAndIncentivePlanDomain2020-12-310001666700us-gaap:EmployeeStockOptionMember2020-01-012020-12-310001666700us-gaap:RestrictedStockUnitsRSUMember2020-01-012020-12-310001666700dd:DuPontOmnibusIncentivePlanDomainus-gaap:RestrictedStockUnitsRSUMember2020-01-012020-12-310001666700dd:DuPontOmnibusIncentivePlanDomainus-gaap:DeferredCompensationShareBasedPaymentsMember2020-01-012020-12-310001666700dd:DuPontOmnibusIncentivePlanDomain2020-12-310001666700dd:DuPontOmnibusIncentivePlanDomain2020-01-012020-12-310001666700dd:DuPontOmnibusIncentivePlanDomain2019-01-012019-12-310001666700dd:DuPontOmnibusIncentivePlanDomain2019-12-310001666700us-gaap:EmployeeStockOptionMemberdd:DuPontOmnibusIncentivePlanDomain2020-01-012020-12-310001666700us-gaap:EmployeeStockOptionMemberdd:DuPontOmnibusIncentivePlanDomain2019-01-012019-12-310001666700dd:DuPontOmnibusIncentivePlanDomainus-gaap:RestrictedStockUnitsRSUMember2019-12-310001666700dd:DuPontOmnibusIncentivePlanDomainus-gaap:RestrictedStockUnitsRSUMember2020-12-310001666700us-gaap:EmployeeStockOptionMemberdd:TheDowChemicalCompany2012StockIncentivePlanMember2018-01-012018-12-310001666700us-gaap:EmployeeStockOptionMembersrt:MinimumMemberdd:TheDowChemicalCompany2012StockIncentivePlanMember2020-01-012020-12-310001666700us-gaap:EmployeeStockOptionMemberdd:DuPontEquityAndIncentivePlanMember2020-01-012020-12-310001666700srt:MaximumMemberus-gaap:EmployeeStockOptionMemberdd:TheDowChemicalCompany2012StockIncentivePlanMember2020-01-012020-12-310001666700us-gaap:EmployeeStockOptionMemberdd:TheDowChemicalCompany2012StockIncentivePlanMember2020-01-012020-12-310001666700dd:TheDowChemicalCompany2012StockIncentivePlanMember2019-12-310001666700dd:TheDowChemicalCompany2012StockIncentivePlanMember2020-01-012020-12-310001666700dd:TheDowChemicalCompany2012StockIncentivePlanMember2020-12-310001666700us-gaap:EmployeeStockOptionMemberdd:TheDowChemicalCompany2012StockIncentivePlanMember2019-01-012019-12-310001666700us-gaap:DeferredCompensationShareBasedPaymentsMemberdd:TheDowChemicalCompany2012StockIncentivePlanMember2019-12-310001666700us-gaap:DeferredCompensationShareBasedPaymentsMemberdd:TheDowChemicalCompany2012StockIncentivePlanMember2020-01-012020-12-310001666700us-gaap:DeferredCompensationShareBasedPaymentsMemberdd:TheDowChemicalCompany2012StockIncentivePlanMember2020-12-310001666700us-gaap:DeferredCompensationShareBasedPaymentsMemberdd:TheDowChemicalCompany2012StockIncentivePlanMember2019-01-012019-12-310001666700us-gaap:DeferredCompensationShareBasedPaymentsMemberdd:TheDowChemicalCompany2012StockIncentivePlanMember2018-01-012018-12-310001666700srt:ExecutiveOfficerMemberus-gaap:DeferredCompensationShareBasedPaymentsMember2018-12-310001666700us-gaap:RestrictedStockUnitsRSUMembersrt:ExecutiveOfficerMember2018-01-012018-12-310001666700srt:MinimumMemberdd:PerformanceDeferredCompensationMemberdd:TheDowChemicalCompany2012StockIncentivePlanMember2020-01-012020-12-310001666700us-gaap:RestrictedStockUnitsRSUMemberdd:DuPontEquityAndIncentivePlanMember2020-01-012020-12-310001666700srt:MaximumMemberdd:PerformanceDeferredCompensationMemberdd:TheDowChemicalCompany2012StockIncentivePlanMember2020-01-012020-12-310001666700dd:PerformanceDeferredCompensationMemberdd:TheDowChemicalCompany2012StockIncentivePlanMember2018-01-012018-12-310001666700dd:ShareBasedCompensationAwardPerformancePeriodTwoMemberdd:PerformanceDeferredCompensationMemberdd:TheDowChemicalCompany2012StockIncentivePlanMember2018-01-012018-12-310001666700dd:ShareBasedCompensationAwardPerformancePeriodOneMemberdd:PerformanceDeferredCompensationMemberdd:TheDowChemicalCompany2012StockIncentivePlanMember2018-01-012018-12-310001666700srt:MinimumMemberdd:PerformanceDeferredCompensationMemberdd:TheDowChemicalCompany2012StockIncentivePlanMember2018-01-012018-12-310001666700srt:MaximumMemberdd:PerformanceDeferredCompensationMemberdd:TheDowChemicalCompany2012StockIncentivePlanMember2018-01-012018-12-310001666700us-gaap:RestrictedStockMemberdd:TheDowChemicalCompany2012StockIncentivePlanMember2020-01-012020-12-310001666700us-gaap:RestrictedStockMemberdd:NonEmployeeDirectorMemberdd:TheDowChemicalCompany2012StockIncentivePlanMember2018-01-012018-12-310001666700dd:DuPontEquityAndIncentivePlanMember2020-12-310001666700dd:DuPontEquityAndIncentivePlanMember2020-01-012020-12-310001666700dd:DowAndDuPontMergerMemberus-gaap:CommonStockMember2017-08-310001666700dd:GrantsBetween2010and2015Memberus-gaap:EmployeeStockOptionMemberdd:DuPontEquityAndIncentivePlanMember2017-09-012017-12-310001666700us-gaap:EmployeeStockOptionMemberdd:GrantsBetween2016and2017MemberMemberdd:DuPontEquityAndIncentivePlanMember2017-09-012017-12-310001666700us-gaap:EmployeeStockOptionMemberdd:DuPontEquityAndIncentivePlanMember2019-01-012019-12-310001666700us-gaap:EmployeeStockOptionMemberdd:DuPontEquityAndIncentivePlanMember2018-01-012018-12-310001666700dd:DuPontEquityAndIncentivePlanMember2019-01-012019-12-310001666700dd:DuPontEquityAndIncentivePlanMember2018-01-012018-12-310001666700dd:DuPontEquityAndIncentivePlanMember2019-12-310001666700dd:DuPontEquityAndIncentivePlanMember2017-09-012017-12-310001666700dd:DuPontEquityAndIncentivePlanMemberdd:RestrictedStockUnitsandPreferredStockUnitsMember2020-01-012020-12-310001666700srt:MinimumMemberdd:DuPontEquityAndIncentivePlanMemberdd:RestrictedStockUnitsandPreferredStockUnitsMember2020-01-012020-12-310001666700srt:MaximumMemberdd:DuPontEquityAndIncentivePlanMemberdd:RestrictedStockUnitsandPreferredStockUnitsMember2020-01-012020-12-310001666700us-gaap:RestrictedStockUnitsRSUMemberdd:DuPontEquityAndIncentivePlanMember2017-11-012017-11-300001666700us-gaap:RestrictedStockUnitsRSUMemberdd:DuPontEquityAndIncentivePlanMember2019-12-310001666700us-gaap:RestrictedStockUnitsRSUMemberdd:DuPontEquityAndIncentivePlanMember2020-12-310001666700us-gaap:RestrictedStockUnitsRSUMemberdd:DuPontEquityAndIncentivePlanMember2019-01-012019-12-310001666700us-gaap:RestrictedStockUnitsRSUMemberdd:DuPontEquityAndIncentivePlanMember2018-01-012018-12-310001666700us-gaap:ForeignExchangeContractMember2020-12-310001666700us-gaap:ForeignExchangeContractMember2019-12-310001666700us-gaap:ForeignExchangeContractMemberus-gaap:NondesignatedMember2020-12-310001666700us-gaap:ForeignExchangeContractMemberus-gaap:NondesignatedMember2019-12-310001666700us-gaap:NondesignatedMemberus-gaap:CommodityContractMember2020-12-310001666700us-gaap:NondesignatedMemberus-gaap:CommodityContractMember2019-12-310001666700us-gaap:ForeignExchangeContractMemberus-gaap:OtherCurrentAssetsMemberus-gaap:NondesignatedMember2020-12-310001666700us-gaap:NondesignatedMember2020-12-310001666700us-gaap:ForeignExchangeContractMemberdd:AccruedAndOtherCurrentLiabilitiesMemberus-gaap:NondesignatedMember2020-12-310001666700us-gaap:ForeignExchangeContractMemberus-gaap:OtherCurrentAssetsMemberus-gaap:NondesignatedMember2019-12-310001666700us-gaap:NondesignatedMember2019-12-310001666700us-gaap:ForeignExchangeContractMemberdd:AccruedAndOtherCurrentLiabilitiesMemberus-gaap:NondesignatedMember2019-12-310001666700us-gaap:ForeignExchangeContractMemberus-gaap:OtherNonoperatingIncomeExpenseMemberus-gaap:NondesignatedMember2020-01-012020-12-310001666700us-gaap:ForeignExchangeContractMemberus-gaap:OtherNonoperatingIncomeExpenseMemberus-gaap:NondesignatedMember2019-01-012019-12-310001666700us-gaap:ForeignExchangeContractMemberus-gaap:OtherNonoperatingIncomeExpenseMemberus-gaap:NondesignatedMember2018-01-012018-12-310001666700us-gaap:ForeignExchangeContractMemberus-gaap:FairValueInputsLevel2Memberus-gaap:FairValueMeasurementsRecurringMember2020-12-310001666700us-gaap:ForeignExchangeContractMemberus-gaap:FairValueInputsLevel2Memberus-gaap:FairValueMeasurementsRecurringMember2019-12-310001666700us-gaap:FairValueMeasurementsNonrecurringMemberus-gaap:FairValueInputsLevel3Member2020-12-310001666700us-gaap:FairValueMeasurementsNonrecurringMemberus-gaap:ChangeDuringPeriodFairValueDisclosureMember2020-12-310001666700us-gaap:FairValueMeasurementsNonrecurringMemberus-gaap:FairValueInputsLevel3Member2019-12-310001666700us-gaap:FairValueMeasurementsNonrecurringMemberus-gaap:ChangeDuringPeriodFairValueDisclosureMember2019-12-310001666700us-gaap:FairValueMeasurementsNonrecurringMemberus-gaap:FairValueInputsLevel3Member2018-12-310001666700us-gaap:FairValueMeasurementsNonrecurringMemberus-gaap:ChangeDuringPeriodFairValueDisclosureMember2018-12-310001666700us-gaap:FairValueMeasurementsNonrecurringMember2018-01-012018-12-310001666700dd:U.S.MemberDomain2020-01-012020-12-310001666700dd:U.S.MemberDomain2019-01-012019-12-310001666700dd:U.S.MemberDomain2018-01-012018-12-310001666700dd:CanadaDomain2020-01-012020-12-310001666700dd:CanadaDomain2019-01-012019-12-310001666700dd:CanadaDomain2018-01-012018-12-310001666700dd:EuropeMiddleEastandAfricaMember2020-01-012020-12-310001666700dd:EuropeMiddleEastandAfricaMember2019-01-012019-12-310001666700dd:EuropeMiddleEastandAfricaMember2018-01-012018-12-310001666700srt:AsiaPacificMember2020-01-012020-12-310001666700srt:AsiaPacificMember2019-01-012019-12-310001666700srt:AsiaPacificMember2018-01-012018-12-310001666700srt:LatinAmericaMember2020-01-012020-12-310001666700srt:LatinAmericaMember2019-01-012019-12-310001666700srt:LatinAmericaMember2018-01-012018-12-310001666700country:CN2020-01-012020-12-310001666700country:CN2019-01-012019-12-310001666700country:CN2018-01-012018-12-310001666700dd:U.S.MemberDomain2020-12-310001666700dd:U.S.MemberDomain2019-12-310001666700dd:U.S.MemberDomain2018-12-310001666700dd:CanadaDomain2020-12-310001666700dd:CanadaDomain2019-12-310001666700dd:CanadaDomain2018-12-310001666700srt:ProFormaMemberdd:EuropeMiddleEastandAfricaMember2020-12-310001666700srt:ProFormaMemberdd:EuropeMiddleEastandAfricaMember2019-12-310001666700srt:ProFormaMemberdd:EuropeMiddleEastandAfricaMember2018-12-310001666700srt:ProFormaMembersrt:AsiaPacificMember2020-12-310001666700srt:ProFormaMembersrt:AsiaPacificMember2019-12-310001666700srt:ProFormaMembersrt:AsiaPacificMember2018-12-310001666700srt:LatinAmericaMembersrt:ProFormaMember2020-12-310001666700srt:LatinAmericaMembersrt:ProFormaMember2019-12-310001666700srt:LatinAmericaMembersrt:ProFormaMember2018-12-310001666700us-gaap:CorporateMember2020-01-012020-12-310001666700us-gaap:CorporateMember2020-12-310001666700us-gaap:CorporateMember2019-01-012019-12-310001666700srt:ProFormaMemberdd:ElectronicsAndImagingSegmentMember2019-01-012019-12-310001666700dd:NutritionAndBiosciencesSegmentMembersrt:ProFormaMember2019-01-012019-12-310001666700srt:ProFormaMemberdd:TransportationIndustrialMember2019-01-012019-12-310001666700dd:SafetyAndConstructionSegmentMembersrt:ProFormaMember2019-01-012019-12-310001666700us-gaap:NonCoreMembersrt:ProFormaMember2019-01-012019-12-310001666700us-gaap:CorporateMembersrt:ProFormaMember2019-01-012019-12-310001666700srt:ProFormaMember2019-01-012019-12-310001666700us-gaap:CorporateMember2019-12-310001666700us-gaap:CorporateMember2018-01-012018-12-310001666700srt:ProFormaMemberdd:ElectronicsAndImagingSegmentMember2018-01-012018-12-310001666700dd:NutritionAndBiosciencesSegmentMembersrt:ProFormaMember2018-01-012018-12-310001666700srt:ProFormaMemberdd:TransportationIndustrialMember2018-01-012018-12-310001666700dd:SafetyAndConstructionSegmentMembersrt:ProFormaMember2018-01-012018-12-310001666700us-gaap:NonCoreMembersrt:ProFormaMember2018-01-012018-12-310001666700us-gaap:CorporateMembersrt:ProFormaMember2018-01-012018-12-310001666700srt:ProFormaMember2018-01-012018-12-310001666700us-gaap:CorporateMember2018-12-310001666700dd:IncomeLossFromEquityMethodInvestmentsDomain2019-01-012019-12-310001666700dd:AdjustedForSignificantItemsMember2020-01-012020-12-310001666700us-gaap:CorporateMemberdd:NBFinancingMember2020-01-012020-12-310001666700dd:NBFinancingMember2020-01-012020-12-3100016667002020-10-012020-12-3100016667002019-10-012019-12-310001666700us-gaap:SubsequentEventMemberdd:NutritionBiosciencesBusinessMember2021-02-010001666700us-gaap:SubsequentEventMemberdd:NutritionBiosciencesBusinessMember2021-02-012021-02-010001666700dd:NutritionBiosciencesBusinessMember2020-12-310001666700us-gaap:SubsequentEventMemberdd:NutritionBiosciencesBusinessMemberdd:NBTermLoanFacilityMember2021-02-010001666700dd:NBSeniorUnsecuredNotesMemberus-gaap:SubsequentEventMemberdd:NutritionBiosciencesBusinessMember2021-02-010001666700us-gaap:SubsequentEventMemberdd:TermLoanFacilityMember2021-02-010001666700us-gaap:SubsequentEventMemberdd:TermLoanFacilityMember2021-02-012021-02-01
UNITED STATES
SECURITIES AND EXCHANGE COMMISSION
Washington, D.C. 20549
FORM 10-K
☑ ANNUAL REPORT PURSUANT TO SECTION 13 OR 15(d) OF THE SECURITIES EXCHANGE ACT OF 1934
For the fiscal year ended December 31, 2020
or
☐ TRANSITION REPORT PURSUANT TO SECTION 13 OR 15(d) OF THE SECURITIES EXCHANGE ACT OF 1934
Commission file number: 001-38196
DUPONT DE NEMOURS, INC.
(Exact name of registrant as specified in its charter)
| | | | | | | | | | | | | | |
| Delaware | | 81-1224539 | |
| State or other jurisdiction of incorporation or organization | | (I.R.S. Employer Identification No.) | |
| | | | | | | | | | | | | | | | | | | | |
974 Centre Road | Building 730 | Wilmington | Delaware | | 19805 | |
(Address of Principal Executive Offices) | | (Zip Code) | |
(302) 774-3034
(Registrant’s Telephone Number, Including Area Code)
Securities registered pursuant to Section 12(b) of the Act:
| | | | | | | | |
| Title of each class | Trading Symbol(s) | Name of each exchange on which registered |
| Common Stock, par value $0.01 per share | DD | New York Stock Exchange |
No securities are registered pursuant to Section 12(g) of the Act.
_____________________________________________________
Indicate by check mark if the registrant is a well-known seasoned issuer, as defined in Rule 405 of the Securities Act. þ Yes ¨ No
Indicate by check mark if the registrant is not required to file reports pursuant to Section 13 or Section 15(d) of the Act. ¨ Yes þ No
Indicate by check mark whether the registrant (1) has filed all reports required to be filed by Section 13 or 15(d) of the Securities Exchange Act of 1934 during the preceding 12 months (or for such shorter period that the registrant was required to file such reports), and (2) has been subject to such filing requirements for the past 90 days.
þ Yes ¨ No
Indicate by check mark whether the registrant has submitted electronically every Interactive Data File required to be submitted pursuant to Rule 405 of Regulation S-T (§232.405 of this chapter) during the preceding 12 months (or for such shorter period that the registrant was required to submit and post such files).
☑ Yes ¨ No
Indicate by check mark whether the registrant is a large accelerated filer, an accelerated filer, a non-accelerated filer, a smaller reporting company, or an emerging growth company. See the definitions of “large accelerated filer,” “accelerated filer,” “smaller reporting company,” and "emerging growth company" in Rule 12b-2 of the Exchange Act.
| | | | | | | | | | | | | | | | | | | | | | | |
| Large Accelerated Filer | | ☑ | | Accelerated filer | | ¨ |
| Non-accelerated filer | | ¨ | | Smaller reporting company | | ☐ |
| | | | | Emerging growth company | | ☐ |
If an emerging growth company, indicate by check mark if the registrant has elected not to use the extended transition period for complying with any new or revised financial accounting standards provided pursuant to Section 13(a) of the Exchange Act. ¨
Indicate by check mark whether the registrant has filed a report on and attestation to its management’s assessment of the effectiveness of its internal control over financial reporting under Section 404(b) of the Sarbanes-Oxley Act (15 U.S.C. 7262(b)) by the registered public accounting firm that prepared or issued its audit report. ☑
Indicate by check mark whether the registrant is a shell company (as defined in Rule 12b-2 of the Act). ☐ Yes ☑ No
The aggregate market value of the common equity held by non-affiliates of the registrant as of June 30, 2020, (the last day of the registrant's most recently completed second fiscal quarter), was approximately $39 billion based on the New York Stock Exchange closing price on such date. For purposes of this computation, the registrant has assumed that its Directors and Executive Officers are affiliates.
The registrant had 538,089,014 shares of common stock, $0.01 par value, outstanding at February 10, 2021.
DOCUMENTS INCORPORATED BY REFERENCE
Part III: Proxy Statement for the 2021 Annual Meeting of Stockholders to be filed not later than 120 days after the end of the fiscal year covered by this Form 10-K.
DuPont de Nemours, Inc.
ANNUAL REPORT ON FORM 10-K
For the year ended December 31, 2020
TABLE OF CONTENTS
Throughout this Annual Report on Form 10-K, except as otherwise noted by the context, the terms "DuPont" or "Company" used herein mean DuPont de Nemours, Inc. and its consolidated subsidiaries. On June 1, 2019, DowDuPont Inc. changed its registered name to DuPont de Nemours, Inc. (“DuPont”) (for certain events prior to June 1, 2019, the Company may be referred to as DowDuPont). Beginning on June 3, 2019, the Company's common stock is traded on the New York Stock Exchange under the ticker symbol "DD."
Effective August 31, 2017, E. I. du Pont de Nemours and Company ("EID") and The Dow Chemical Company ("TDCC") each merged with subsidiaries of DowDuPont Inc. (n/k/a "DuPont”) and, as a result, EID and TDCC became subsidiaries of the Company. On April 1, 2019, the Company completed the separation of the materials science business through the spin-off of Dow Inc., (“Dow”) including Dow’s subsidiary TDCC (the “Dow Distribution”). On June 1, 2019, the Company completed the separation of the agriculture business through the spin-off of Corteva, Inc. (“Corteva”) including Corteva’s subsidiary EID, (the “Corteva Distribution and together with the Dow Distribution, the “DWDP Distributions”).
Following the Corteva Distribution, DuPont holds the specialty products business as continuing operations. The results of operations of DuPont for the 2019 and 2018 periods presented reflect the historical financial results of Dow and Corteva as discontinued operations, as applicable. The cash flows and comprehensive income related to Dow and Corteva have not been segregated and are included in the Consolidated Statements of Cash Flows and Consolidated Statements of Comprehensive Income, respectively, for the applicable period. Unless otherwise indicated, the information in the notes to the Consolidated Financial Statements refer only to DuPont's continuing operations and do not include discussion of balances or activity of Dow or Corteva.
On February 1, 2021, DuPont completed the separation and distribution of the Nutrition & Biosciences business (the “N&B Business”), and merger of Nutrition & Biosciences, Inc. (“N&B”), a DuPont subsidiary formed to hold the N&B Business, with a subsidiary of International Flavors & Fragrances Inc. (“IFF”). The distribution was effected through an exchange offer (the “Exchange Offer”) where, on the terms and subject to the conditions of the Exchange Offer, eligible participating DuPont stockholders had the option to tender all, some or none of their shares of common stock, par value $0.01 per share, of DuPont (the “DuPont Common Stock”) for a number of shares of common stock, par value $0.01 per share, of N&B (the “N&B Common Stock”) and which resulted in all shares of N&B Common Stock being distributed to DuPont stockholders that participated in the Exchange Offer. The consummation of the Exchange Offer was followed by the merger of N&B with a wholly owned subsidiary of IFF, with N&B surviving the merger as a wholly owned subsidiary of IFF (the “N&B Merger” and, together with the Exchange Offer, the “N&B Transaction”). The results of the N&B business are included in the continuing operations of DuPont for all periods presented herein.
DuPontTM and all products, unless otherwise noted, denoted with TM, SM or ® are trademarks, service marks or registered trademarks of affiliates of DuPont de Nemours, Inc.
FORWARD-LOOKING STATEMENTS
This communication contains "forward-looking statements" within the meaning of the federal securities laws, including Section 27A of the Securities Act of 1933, as amended, and Section 21E of the Securities Exchange Act of 1934, as amended. In this context, forward-looking statements often address expected future business and financial performance and financial condition, and often contain words such as "expect," "anticipate," "intend," "plan," "believe," "seek," "see," "will," "would," "target," and similar expressions and variations or negatives of these words.
Forward-looking statements address matters that are, to varying degrees, uncertain and subject to risks, uncertainties and assumptions, many of which that are beyond DuPont's control, that could cause actual results to differ materially from those expressed in any forward-looking statements. Forward-looking statements are not guarantees of future results. Some of the important factors that could cause DuPont's actual results to differ materially from those projected in any such forward-looking statements include, but are not limited to: (i) ability to achieve anticipated tax treatments in connection with the N&B Transaction or the DWDP Distributions; (ii) changes in relevant tax and other laws; (iii) indemnification of certain legacy liabilities of EID in connection with the Corteva Distribution; (iv) risks and costs related to the DWDP Distributions and the N&B Transaction and potential liability arising from fraudulent conveyance and similar laws; (v) risks and costs related to the performance under and impact of the cost sharing arrangement by and between DuPont, Corteva, Inc. and The Chemours Company related to future eligible PFAS costs; (vi) failure to effectively manage acquisitions, divestitures, alliances, joint ventures and other portfolio changes, including meeting conditions under the Letter Agreement entered in connection with the Corteva Distribution, related to the transfer of certain levels of assets and businesses; (vii) uncertainty as to the long-term value of DuPont common stock; (viii) potential inability or reduced access to the capital markets or increased cost of borrowings, including as a result of a credit rating downgrade; (ix) risks and uncertainties related to the novel coronavirus (COVID-19) and
the responses thereto (such as voluntary and in some cases, mandatory quarantines as well as shut downs and other restrictions on travel and commercial, social and other activities) on DuPont’s business, results of operations, access to sources of liquidity and financial condition which depend on highly uncertain and unpredictable future developments, including, but not limited to, the duration and spread of the COVID-19 outbreak, its severity, the actions to contain the virus or treat its impact, and how quickly and to what extent normal economic and operating conditions resume; and x) other risks to DuPont's business, operations; each as further discussed in detail in and results of operations as discussed in in the section titled “Risk Factors” (Part I, Item 1A of this Form 10-K). While the list of factors presented here is considered representative, no such list should be considered a complete statement of all potential risks and uncertainties. Unlisted factors may present significant additional obstacles to the realization of forward-looking statements. Consequences of material differences in results as compared with those anticipated in the forward-looking statements could include, among other things, business disruption, operational problems, financial loss, legal liability to third parties and similar risks, any of which could have a material adverse effect on DuPont’s consolidated financial condition, results of operations, credit rating or liquidity. You should not place undue reliance on forward-looking statements, which speak only as of the date they are made. DuPont assumes no obligation to publicly provide revisions or updates to any forward-looking statements whether as a result of new information, future developments or otherwise, should circumstances change, except as otherwise required by securities and other applicable laws.
| | | | | | | | |
| DuPont de Nemours, Inc. | |
| PART I | |
ITEM 1. BUSINESS
DuPont is a Delaware corporation formed in 2015 (formerly, DowDuPont Inc.), for the purpose of effecting an all-stock merger of equals transactions between The Dow Chemical Company ("TDCC") and E. I. du Pont de Nemours and Company ("EID"). Effective August 31, 2017, pursuant to the merger of equals transaction contemplated by the Agreement and Plan of Merger, dated as of December 11, 2015, as amended on March 31, 2017 ("DWDP Merger Agreement"), TDCC and EID each merged with subsidiaries of DowDuPont Inc. ("DowDuPont") and, as a result, TDCC and EID became subsidiaries of DowDuPont (the "DWDP Merger"). Prior to the DWDP Merger, DowDuPont did not conduct any business activities other than those required for its formation and matters contemplated by the DWDP Merger Agreement. For purposes of DowDuPont's financial statement presentation, TDCC was determined to be the accounting acquirer in the DWDP Merger and EID's assets and liabilities are reflected at fair value as of the DWDP Merger Effectiveness Time.
On April 1, 2019, the Company completed the separation of the materials science business through the spin-off of Dow Inc., (“Dow”) including Dow’s subsidiary TDCC (the “Dow Distribution”). On June 1, 2019, the Company completed the separation of the agriculture business through the spin-off of Corteva, Inc. (“Corteva”) including Corteva’s subsidiary EID, (the “Corteva Distribution and together with the Dow Distribution, the “DWDP Distributions”).
Following the Corteva Distribution, the Company holds the specialty products business. On June 1, 2019, DowDuPont changed its registered name from "DowDuPont Inc." to "DuPont de Nemours, Inc." doing business as "DuPont" (the "Company") Beginning on June 3, 2019, the Company's common stock is traded on the NYSE under the ticker symbol "DD."
DuPont is a global innovation leader with technology-based materials and solutions that help transform industries and everyday life by applying diverse science and expertise to help customers advance their best ideas and deliver essential innovations in key markets including electronics, transportation, building and construction, healthcare and worker safety. At December 31, 2020, the Company has subsidiaries in about 60 countries worldwide and manufacturing operations in about 40 countries. See Note 23 to the Consolidated Financial Statements for details on the location of the Company's sales and property.
On December 15, 2019, the Company entered into definitive agreements to separate and combine the Nutrition & Biosciences business segment (the "N&B Business") with International Flavors & Fragrances Inc. ("IFF") in a tax-efficient Reverse Morris Trust transaction.
On February 1, 2021, DuPont completed the separation and distribution of the N&B Business, and merger of Nutrition & Biosciences, Inc. (“N&B”), a DuPont subsidiary formed to hold the N&B Business, with a subsidiary of IFF. The distribution was effected through an exchange offer (the “Exchange Offer”) where, on the terms and subject to the conditions of the Exchange Offer, eligible participating DuPont stockholders had the option to tender all, some or none of their shares of common stock, par value $0.01 per share, of DuPont (the “DuPont Common Stock”) for a number of shares of common stock, par value $0.01 per share, of N&B (the “N&B Common Stock”) and which resulted in all shares of N&B Common Stock being distributed to DuPont stockholders that participated in the Exchange Offer. The consummation of the Exchange Offer was followed by the merger of N&B with a wholly owned subsidiary of IFF, with N&B surviving the merger as a wholly owned subsidiary of IFF (the “N&B Merger” and, together with the Exchange Offer, the “N&B Transaction”).
On December 31, 2020, DuPont commenced the Exchange Offer which expired at one minute past 11:59 PM ET on January 29, 2021. Pursuant to the Exchange Offer, on February 1, 2021, DuPont accepted approximately 197.4 million shares of DuPont Common Stock in exchange for about 141.7 million shares of N&B Common Stock. The closing of the N&B Merger followed on February 1, 2021 after satisfaction of certain other conditions, including the receipt of a one-time cash payment of approximately $7.3 billion (the “Special Cash Payment”).
In the N&B Merger, each share of N&B common stock was automatically converted into the right to receive one share of IFF common stock, par value $0.125 per share (“IFF Common Stock”). See Note 25 to the Consolidated Financial Statements for more information.
BASIS OF PRESENTATION
The Consolidated Financial Statements included in this annual report present the financial position of DuPont as of December 31, 2020 and 2019 and the results of operations of DuPont for the years ended December 31, 2020, 2019, and 2018 giving effect to the DWDP Distributions, with the historical financial results of Dow and Corteva reflected as discontinued operations, as applicable. The cash flows and comprehensive income related to Dow and Corteva have not been segregated and are included in the Consolidated Statements of Cash Flows and Consolidated Statements of Comprehensive Income, respectively, for the year ended December 31, 2019 and 2018. Unless otherwise indicated, the information in the Notes to the Consolidated Financial Statements refer only to DuPont's continuing operations and do not include discussion of balances or activity of Dow or Corteva.
At December 31, 2020, the financial results of the N&B Business are included in continuing operations for all periods presented.
SEGMENT INFORMATION
DuPont’s worldwide operations are managed through global businesses, which are currently reported in five reportable segments: Electronics & Imaging; Nutrition & Biosciences; Transportation & Industrial; Safety & Construction; and Non-Core.
In conjunction with the closing of the N&B Transaction on February 1, 2020, the Company announced changes to its management and reporting structure (the “2021 Segment Realignment”). These changes result in the following:
•Realignment of certain businesses from Transportation & Industrial to Electronics & Imaging
•Dissolution of the Non-Core segment with the businesses to be divested and previously divested reflected in Corporate
•Realignment of the remaining Non-Core businesses to Transportation & Industrial
In addition, the following name changes will occur:
•Electronic & Imaging will be renamed Electronics & Industrial
•Transportation & Industrial will be renamed Mobility & Materials
•Safety & Construction will be renamed Water & Protection
The changes became effective February 1, 2021 and the Company will report financial results under this new structure beginning in the first quarter of 2021.
See Part II, Item 7, Management’s Discussion and Analysis of Financial Condition and Results of Operations and Note 23 to the Consolidated Financial Statements for additional information concerning the Company’s operating segments.
ELECTRONICS & IMAGING
Electronics & Imaging is a leading global supplier of differentiated materials and systems for a broad range of consumer electronics including mobile devices, television monitors, personal computers and electronics used in a variety of industries. The segment is a leading supplier of key materials for the manufacturing of materials and printing systems to the advanced printing industry, and of materials and solutions for the fabrication of semiconductors and integrated circuits addressing both front-end and back-end of the manufacturing process. The segment offers the broadest portfolio of semiconductor and advanced packaging materials in the market, providing chemical mechanical planarization ("CMP") pads and slurries, photoresists and advanced coatings for lithography, removers and cleaners; dielectric and metallization solutions for back-end-of-line advanced chip packaging; along with silicones for light emitting diode ("LED") packaging and semiconductor applications. Electronics & Imaging also provides permanent and process chemistries for the fabrication of printed circuit boards to include laminates and substrates, electroless and electrolytic metallization solutions, as well as patterning solutions and materials and innovative metallization processes for metal finishing, decorative, and industrial applications. Electronics & Imaging is a leading global supplier in the packaging graphics industry providing photopolymer plates and platemaking systems used in flexographic printing and digital inks for textile, commercial and home-office printing applications. In addition, the segment provides cutting-edge materials for the manufacturing of rigid and flexible displays for organic light emitting diode ("OLED"), and other display applications. Electronics & Imaging addresses these markets by leveraging a strong science and technology base to provide the critical materials and solutions for creating a more connected and digital world.
Divestitures
In the first quarter of 2020, the Company completed the sale of its Compound Semiconductor Solutions business unit to SK Siltron. The proceeds received in the first quarter of 2020 related to the sale of the business were approximately $420 million.
Details on Electronics & Imaging's 2020 net sales, by major product line and geographic region, are as follows:
Products
Major applications/market segments and technologies are listed below by major product line:
| | | | | | | | | |
| Major Product Line | Applications/Market Segments | Technologies | |
| Image Solutions | Flexographic printing and inkjet printing,
display materials for mobile devices | Flexographic printing plates and materials, digital inks, OLED and other display process materials
| |
| Interconnect Solutions | Printed circuit board, electronic and industrial finishing | Circuit packaging film and laminate materials, interconnect metallization and imaging process chemistries, dry film laminates, polyimide films, and flexible circuit materials | |
| Semiconductor Technologies | Integrated circuit fabrication for memory and logic semiconductors | CMP consumables, photolithography materials, semiconductor fabrication materials, fabrication cleaners and removers, advanced chip packaging materials and thermal management materials and LED encapsuants | |
Key Raw Materials
The major commodities, raw materials and supplies for the Electronics & Imaging segment include: p-acetoxystyrene, monomers, pigments and dyes, styrenic block copolymers, copper foil, diglycolamine, dimethylacetamide, hydroxylamine, oxydianiline, palladium metal, photoactive compounds, polyester and other polymer films, polyurethane resins and pyromellitic dianhydride.
Competitors
Electronics & Imaging's competitors include many large multinational firms as well as a number of regional and local competitors. Key competitors include 3M, CMC Materials, Element Solutions, Entegris, Flint Group, JSR Micro, Merck KGaA, Shin-Etsu and Sun Chemical.
Current and Future Investments
In March 2019, the Company announced plans to invest more than $200 million in its Electronics & Imaging segment to build new production assets at its Circleville, Ohio, plant. The new assets will expand production of KAPTON® polyimide film and PYRALUX® flexible circuit materials to meet growing market demand. At December 31, 2020, the Company had spent approximately $160 million since project start date. The Company anticipates that the new assets will be operational by the end of 2021.
2021 Segment Realignment
In conjunction with the 2021 Segment Realignment, KALREZ®/VESPEL®, and Healthcare and Specialty Lubricants (Medical Silicones and MOLYKOTE® lubricants) will move to Electronics & Imaging from Transportation & Industrial. On February 1, 2021, the segment will be renamed Electronics & Industrial and the Image Solutions product line, which will include the additional technologies, will be renamed Industrial Solutions. The Company will report under this structure beginning in the first quarter of 2021.
NUTRITION & BIOSCIENCES
Nutrition & Biosciences is an innovation-driven and customer-focused segment that provides solutions for the global food and beverage, dietary supplements, pharma, home and personal care, energy and animal nutrition markets. The segment is one of the world’s largest producers of specialty ingredients, developing and manufacturing solutions for the global food and beverage, dietary supplements and pharmaceutical markets. Its innovative and broad portfolio of natural-based ingredients marketed under the DANISCO® brand serves to improve health and nutrition as well as taste and texture in a wide range of dairy, beverage, bakery and dietary supplement applications. Its probiotics portfolio, including the HOWARU® brand, is world famous for its extensively documented strains that deliver consumers benefits in digestive and immune health. In addition to serving the global food and beverage market, the segment is one of the world's largest producers of cellulosics and alginates based pharma excipients, which are used to improve the functionality and delivery of pharmaceuticals, and enabling the development of more effective pharma solutions. Additionally, the segment is an industry pioneer and innovator that works with customers to improve the performance, productivity and sustainability of their products and processes, through differentiated technology in ingredients applications, fermentation, biotechnology, chemistry and manufacturing process excellence. The segment offers better, cleaner and safer solutions to a wide range of industries including food & beverages, dietary supplements, animal nutrition, biofuels, cleaning, personal care, pharmaceutical, and oil and gas.
Divestitures
In June 2019, the Company sold the natural colors business, a H&N Business.
Details on Nutrition & Biosciences' 2020 net sales, by product line and geographic region, are as follows:
Products
Major applications and products are listed below by product line:
| | | | | | | | | |
| Product Line | Applications / Market Segments | Major Products | |
| Food & Beverage | Food and beverage, dietary supplements, infant nutrition, sports nutrition | Soy protein, emulsifiers, sweeteners, texturants and ingredient systems | |
| Health & Biosciences | Dietary supplements, animal nutrition, home & personal care, biofuels production, food and beverage, microbial control solutions for oil and gas production and other industrial preservation markets | Probiotics, fibers, cultures, enzymes, yeast, betaine, direct-fed microbials, antimicrobials, glutaraldehyde | |
| Pharma Solutions | Oral dosage pharmaceuticals excipients | Cellulosic and alginates excipients (immediate and controlled release) and active pharmaceutical ingredients | |
Key Raw Materials
The major commodities, raw materials and supplies for the Nutrition & Biosciences segment include: soybeans, gelatin, glycols, cellulose processed grains (including dextrose and glucose), guar, locust bean gum, organic vegetable oils, peels, saccharides, seaweed, sugars and yeasts.
Competitors
Nutrition & Biosciences' competitors include many large multinational nutrition and biosciences companies as well as a number of regional and local competitors. Key competitors include Chr. Hansen, Novozymes, Royal DSM, Kerry, Corbion, Ingredion, CP Kelco, Croda and Tate & Lyle.
Current and Future Investments
In November 2016, EID announced an investment to expand probiotics production capacity in the United States. The announced investment is the second phase of a broader probiotics expansion project. Phase one was complete as of the end of 2017 and increased capacity by about 30 percent. The second phase represented an investment of approximately $100 million and increased DuPont's probiotics production capacity by an additional 70 percent. The construction was completed in the first quarter of 2019, including the installation of new, high-volume fermenters and other processing equipment. Additional and periodic investments were made in the past years to debottleneck some of our assets running at full capacity.
Nutrition & Biosciences Distribution
On February 1, 2021, DuPont completed the previously announced separation and distribution of its N&B Business. The Company will reflect the results of the N&B Business as discontinued operations beginning in the first quarter of 2021.
TRANSPORTATION & INDUSTRIAL
Transportation & Industrial provides high-performance engineering resins, adhesives, silicones, lubricants and parts to engineers and designers in the transportation, electronics, healthcare, industrial and consumer end-markets to enable systems solutions for demanding applications and environments.
The segment delivers a broad range of polymer-based high-performance materials in its product portfolio, including elastomers and thermoplastic and thermoset engineering polymers which are used by customers to fabricate components for mechanical, chemical and electrical systems. In addition, the segment produces innovative engineering polymer solutions, high performance parts, specialty silicones and differentiated adhesive technologies to meet customer specifications in automotive, aerospace, electronics, industrial, healthcare and consumer markets. Transportation & Industrial is a global leader of advanced materials that provide technologies that differentiate customers’ products with improved performance characteristics enabling the transition to hybrid-electric-connected vehicles, high speed high frequency connectivity and smart healthcare.
Details on Transportation & Industrial's 2020 net sales, by major product line and geographic region, are as follows:
Products
Major applications and products are listed below by major product line, all which serve the transportation industry and electronics, medical, industrial and consumer end-markets.
| | | | | |
| Major Product Line | Major Products |
| Healthcare & Specialty | KALREZ® perfluoroelastomer, VESPEL® parts and shapes, MOLYKOTE® lubricants, LIVEO™ silicone solutions for healthcare, BETASEAL™, BETAMATE™ and BETAFORCE™ structural and elastic adhesives |
| Industrial & Consumer | HYTREL® polyester thermoplastic elastomer resins, DELRIN® acetal resins, VAMAC® ethylene acrylic elastomer, and MULTIBASE™ TPSiV™ silicones for thermoplastics |
| Mobility Solutions | DUPONT™ ZYTEL® nylon resins, CRASTIN® PBT thermoplastic polyester resin, RYNITE® PET polyester resin and TYNEX® filaments |
Key Raw Materials
The major commodities, raw materials and supplies for the Transportation & Industrial segment include: adipic acid, butanediol, carbon black, dimethyl terephthalate, epoxy resins, fiberglass, flame retardants, hexamethylene diamine, methanol, polyethylene terephthalate, purified terephthalic acid and silicones.
Competitors
Transportation & Industrial's competitors include many large multinational chemical firms as well as a number of regional and local competitors. Key competitors include BASF, Celanese, EMS, Henkel, Kluber, Mitsubishi, Royal DSM, Sika, Victrex and Wacker Chemie.
2021 Segment Realignment
In conjunction with the 2021 Segment Realignment, Kalrez®/Vespel®, and Healthcare and Specialty Lubricants (Medical Silicones and Molykote® lubricants) will move from Transportation & Industrial to Electronic & Imaging. Non-Core businesses including TEDLAR® and Microcircuit Materials (previously part of Photovoltaic & Advanced Materials ("PVAM")), and DuPont Teijin Films will shift from the Non-Core Segment to Transportation & Industrial. Major product lines will be reorganized into Engineering Polymers, Performance Resins, and Advanced Solutions and the segment will be renamed Mobility & Materials effective February 1, 2021. The Company will report under this structure beginning in the first quarter of 2021.
SAFETY & CONSTRUCTION
Safety & Construction is the global leader in providing innovative engineered products and integrated systems for a number of industries including, worker safety, water purification and separation, transportation, energy, medical packaging and building materials. Safety & Construction addresses the growing global needs of businesses, governments and consumers for solutions that make life safer, healthier and better.
Innovation is the business imperative. By uniting market-driven science and engineering with the strength of highly regarded brands including KEVLAR® high-strength material, NOMEX® thermal-resistant material, CORIAN® solid surfaces, TYVEK® selective barriers, FILMTEC™ reverse osmosis elements, STYROFOAM™ insulation and GREAT STUFF™ insulating foam sealants, the segment strives to bring new products and solutions to solve customers' needs faster, better and more cost effectively. Safety & Construction is investing in future growth initiatives such as water management solutions, construction productivity solutions, high strength and light weighting composite solutions, and circular ecosystem / zero waste solutions.
Acquisitions
During the fourth quarter of 2019, the Company completed three acquisitions: (1) BASF's Ultrafiltration Membrane business, including inge GmbH, the business’ international workforce, its headquarters and production site in Greifenberg, Germany, and associated intellectual property currently owned by BASF SE; (2) Evoqua Water Technologies Corp.’s MEMCOR® business including ultrafiltration and membrane biofiltration technologies, which together with the acquisition from BASF, add to Safety & Construction’s leading portfolio of water purification and separation technologies including ultrafiltration, reverse osmosis and ion exchange resins; and (3) OxyMem Limited, a company that develops and produces Membrane Aerated Biofilm Reactor technology for the treatment and purification of municipal and industrial wastewater. In the first quarter of 2020, the Company acquired Desalitech Ltd., a closed circuit reverse osmosis (CCRO) company.
Details on Safety & Construction's 2020 net sales, by major product line and geographic region, are as follows:
Products
Major applications and products are listed below by major product line:
| | | | | | | | |
| Major Product Line | Applications / Market Segments | Major Products / Technologies |
| Safety Solutions | Industrial personnel protection, military and emergency response, medical devices and packaging, automotive, aerospace and oil and gas | KEVLAR® fiber; NOMEX® fiber and paper; TYVEK® protective materials; TYCHEM® protective suits |
| Shelter Solutions | Rigid and spray foam insulation, weatherization, waterproofing and air sealing, caulks and sealants, roof coatings, and decorative surface materials | STYROFOAM™ brand insulation products, THERMAX™ exterior insulation, WALOCEL™ cellulose ethers, XENERGY™ high performance insulation, LIQUIDARMOR™ flashing and sealant, GREAT STUFF™ insulating foam sealants and adhesives, CORIAN® design solid and quartz surfaces, TYVEK® weather resistant barriers |
| Water Solutions | Water filtration and purification technology for residential, municipal and industrial use. Key industries include municipal drinking water and wastewater, power generation, microelectronics, pharmaceuticals, food and beverage, industrial wastewater reuse, metals and mining, and oil and gas segments | AMBERLITE™ ion exchange resins, FILMTEC™ reverse osmosis and nanofiltration elements, INTEGRAFLUX™ ultrafiltration modules, FORTILIFE™ challenging water reverse osmosis membranes, and TAPTEC™ water filtration and purification for drinking water in homes and commercial buildings |
Key Raw Materials
The major commodities, raw materials and supplies for the Safety & Construction segment include: alumina trihydrate, aniline, benzene, calcium chloride, carbon monoxide, chlorine, divinyl benzene monomers, high-density polyethylene, isophthalic acid, metaphenylenediamine, methyl methacrylate, methylpentanediol, polyester resin, polypropylene, polystyrene, sulfuric acid and terephthalic acid.
Competitors
Safety & Construction's competitors include many large multinational chemical firms as well as a number of regional and local competitors. Key competitors include 3M, Honeywell, Hydranautics, Kingspan, Lanxess, LG Corp, Owens-Corning, Purolite, Royal DSM, Toray and Teijin.
Current and Future Investments
The Company previously announced plans to invest more than $400 million in Safety & Construction to increase capacity for the manufacture of TYVEK® nonwoven materials at its Luxembourg site due to growing global demand. While the Company experienced delays in construction due to COVID-19 in 2020, the expansion for the new operating line of TYVEK® nonwoven materials is expected to be completed in 2023.
NON-CORE
The Non-Core segment is a leading global supplier of key materials for the manufacturing of photovoltaic cells and panels, including innovative SOLAMET® metallization pastes, TEDLAR® backsheet materials, and FORTASUN® silicone encapsulants and adhesives. The segment also provides materials used in components and films for consumer electronics, automotive, and aerospace markets. The segment also provides sustainable materials and services for sulfuric acid production and regeneration technologies, alkylation technology for production of clean, high-octane gasoline, and a comprehensive suite of aftermarket service and solutions offerings, including safety consulting and services, to improve the safety, productivity, and sustainability of organizations across a range of industries. The Non-Core segment is also a leading producer of SORONA® specialty biotechnology materials for carpet and apparel markets as well as polyester films for the healthcare, photovoltaics, electronics, packaging and labels, and electrical insulation industries.
Divestitures
The segment historically included the Company's joint venture interests in the Hemlock Semiconductor Corporation Group ("HSC Group"), a U.S.-based group of companies that manufacture and sell polycrystalline silicon products for the photovoltaic and semiconductor industries, as well as its trichlorosilane business (“TCS Business”). In the third quarter of 2020, the Company completed the sale of its ownership interests in both the HSC Group and the TCS Business to The Hemlock Group.
In October 2020, the Company entered into a definitive agreement to sell its Biomaterials business unit, which includes the Company's equity method investment in DuPont Tate & Lyle Bio Products. In January 2021, the Company entered into separate definitive agreements to sell its Clean Technologies and Solamet® businesses. These divestitures, subject to regulatory approval and customary closing conditions, are expected to close in the first half of 2021 and generate in aggregate pre-tax cash proceeds of about $920 million.
In the third quarter of 2019, the Company completed the sale and separation of its Sustainable Solutions business unit, a part of the Non-Core segment, to Gyrus Capital.
2021 Segment Realignment
As part of the 2021 Segment Realignment, the Non-Core segment will be dissolved. TEDLAR® and Microcircuit Materials (both previously part of PVAM), and DuPont Teijin Films will move to Transportation & Industrial. The remaining businesses and historical results of divested businesses will be reported in Corporate. The Company will report under this structure beginning in the first quarter of 2021.
Details on Non-Core's 2020 net sales, by business or major product line and geographic region, are as follows:
Products
Major applications and products/services/technologies are listed below by major product line:
| | | | | | | | |
| Major Product Line | Applications / Market Segments | Major Products / Services / Technologies |
| Biomaterials | Carpet, apparel | SORONA® polymer |
| Clean Technologies | Sulfuric acid, fertilizer, chemicals, refining, scrubbing | STRATCO® alkylation technology, MECS® sulfuric acid & environmental technologies, ISOTHERMING® hydroprocessing technology, BELCO® wet scrubbing technology |
| DuPont Teijin Films | Healthcare, photovoltaics, electronics, packaging and labels, electrical insulation, dry film resists | MYLAR®, MELINEX® polyester films |
| Photovoltaic & Advanced Materials | Photovoltaics, aerospace/aircraft, automotive, military, consumer electronics | Metallization pastes (including SOLAMET®), TEDLAR® polyvinyl fluoromaterials, FORTASUN® silicone encapsulants and adhesives |
Key Raw Materials
The major commodities, raw materials and supplies for the Non-Core segment include propanediol, terephthalic acid, precious metals, silicon metal and hydrochloric acid.
Competitors
Non-Core's competitors include many large multinational chemical firms as well as a number of regional and local competitors. Key competitors include Arkema, Giga Solar Materials, Heraeus, Outotec, Samsung SDI, Yihua Toray Polyester Film, and Zhangjiagang Glory.
INDUSTRY SEGMENTS AND GEOGRAPHIC REGION RESULTS
See Note 4 to the Consolidated Financial Statements for net sales by business or major product line.
Sales by geographic region are included within Part II, Item 7 "Management's Discussion and Analysis of Financial Condition and Results of Operations", "Results of Operations." See Note 23 to the Consolidated Financial Statements for information regarding total net sales, pro forma net sales, pro forma Operating EBITDA and total assets by segment, as well as net sales and long-lived assets by geographic region.
SIGNIFICANT CUSTOMERS AND COMPETITION
In 2020, no significant portion of the Company's sales was dependent upon a single customer. The markets in which the Company participates compete primarily through technology, range of products and services, performance, quality, reliability, brand, reputation, service and support. The Company provides extensive support, technical services and testing services for its customers, in addition to new product development. The Company believes that its proprietary product and process technologies, robust product and application development pipelines, customer intimacy, global manufacturing capability and local service capability enable it to compete successfully.
Against this competitive backdrop, value-in-use is the primary driver of price for the Company’s products, although price is impacted by many factors including, among others, fluctuations in supply and demand, and availability and cost of key manufacturing inputs including raw materials and energy.
DISTRIBUTION
Most products are marketed primarily through the Company's sales organization, although in some regions, more emphasis is placed on sales through distributors. The Company has a diverse worldwide network which markets and distributes the Company's brands to customers globally. This network consists of the Company's sales and marketing organization partnering with distributors, independent retailers, cooperatives and agents throughout the world.
INTELLECTUAL PROPERTY
The Company’s businesses differentially manage their respective intellectual property estates to support Company strategic priorities, which can include leveraging intellectual property within and across product lines.
Trade Secrets: Trade secrets are an important part of the Company's intellectual property. Many of the processes used to make products are kept as trade secrets which, from time to time, may be licensed to third parties. DuPont vigilantly protects all of its intellectual property including its trade secrets. When the Company discovers that its trade secrets have been unlawfully taken, it reports the matter to governmental authorities for investigation and potential criminal action, as appropriate. In addition, the Company takes measures to mitigate any potential impact, which may include civil actions seeking redress, restitution and/or damages based on loss to the Company and/or unjust enrichment.
Patents: The Company applies for and obtains patents in many countries, including the U.S., and has access to a large patent portfolio, both owned and licensed. DuPont’s rights under these patents and licenses, as well as the products made and sold under them, are important to the Company in the aggregate. The protection afforded by these patents varies based on country, scope of individual patent coverage, as well as the availability of legal remedies in each country. The term of these patents is approximately twenty years from the filing date in general, but varies depending on country. This significant patent estate may be leveraged to align with the Company’s strategic priorities within and across product lines. At December 31, 2020, the Company owned about 24,000 patents and patent applications globally, about 9,000 of which are part of the N&B Business. Approximately 80% of the Company’s patent estate has a remaining term of more than 5 years.
Trademarks: The Company owns or licenses many trademarks that have significant recognition at the consumer retail level and/or the product line to product line level. Ownership rights in trademarks do not expire if the trademarks are continued in use and properly protected.
ENVIRONMENTAL MATTERS
Information related to environmental matters is included in several areas of this report: (1) Environmental Proceedings beginning on page 29, (2) Management's Discussion and Analysis of Financial Condition and Results of Operations beginning on page 32, and (3) Notes 1 and 15 to the Consolidated Financial Statements.
HUMAN CAPITAL
Foundational to the Company’s current and future success is its employees, who drive the Company’s strategic vision, manage operations and develop products. The Company focuses significant attention on attracting, motivating, and retaining talent at all levels. Through training and professional development initiatives, promoting a culture of diversity and inclusion, and emphasizing the importance of health, safety, and well-being, the Company’s aim is to create an environment that fully supports the needs of its employees. Annually, an enterprise-wide engagement survey is conducted, which provides insight into employee morale and aspects of workplace culture like core values, communication and employee development.
The Company is committed to creating innovative talent-management opportunities that are aligned to the strategic needs of its workforce. Learning is a continual process, and the Company offers a diverse set of training, education, and development opportunities, both formally and informally, throughout the year. Each segment within the Company has ongoing training programs that are designed specifically to maximize the performance of its employees in meeting business objectives, including better health and safety outcomes. All employees take part in a mix of on-the-job training and appropriate learning and training opportunities focusing on topics that are the most critical and relevant to each employees’ job function.
The Company believes that diversity and inclusion is central to high employee engagement and seeks to foster an environment where employees can bring their authentic selves to work each day. The more perspectives there are, the more ideas that can be generated, which makes diversity, equity, and inclusion (“DE&I”) a driver of innovation, and therefore, integral to the Company’s success. The Company’s employee-led Employee Resource Groups (“ERGs”) help cultivate a culture of acceptance where employees feel not only accepted, but celebrated, at every level. As of December 31, 2020, the Company had eight ERGs - DuPont Corporate Black Employees Network, DuPont Asian Group, DuPont Pride Network, DuPont Latin Network, DuPont Women’s Network, DuPont Veterans Network, DuPont Early Career Network, and DuPont Persons with Disabilities and Allies. Each group is actively sponsored by senior leadership, helping model and promote inclusive values and behaviors. The Company also offers DE&I tools and resources to educate managers and employees in how to utilize diversity as a resource and establish more inclusive work environments. These resources include unconscious bias workshops, networking and mentoring practices, and opportunities for participation in external conferences and events, among others.
The Company’s success also depends on the well-being of employees, including physical, mental and intellectual health. All employees have the support of the Company’s Integrated Health Services (“IHS”) teams, which provides onsite and intranet-based services to support and monitor the health and welfare of employees. The Company’s larger manufacturing and research sites have onsite clinics where employees can get occupational care, first aid treatment, travel vaccinations, and referrals for off-site medical care. The Company continuously strives for zero workplace injuries, occupational illnesses and incidents. The Company’s safety metrics are measured against this goal at least quarterly, and the Company’s Environmental, Health, Safety & Sustainability Committee is charged with driving improvements in the Company's health and safety practices. IHS also
assesses health risks across DuPont to find out which health concerns are most important to our employees, and conducts medical surveillance exams based on occupational risks and regulatory compliance priorities flagged by the Company’s Environment, Health and Safety team.
In response to the COVID-19 pandemic, the Company has corporate, regional and local crisis management teams in place actively monitoring, preparing and managing the Company’s response. The Company has implemented safety plans and protocols based on World Health Organization and Centers for Disease Control guidelines. This includes issuing health and safety guidance for sites that have remained open during the pandemic, and encouraging employees to work remotely, when possible.
As of December 31, 2020, the Company had employed approximately 34,000 people worldwide. Approximately 25 percent of employees were in Asia Pacific, 28 percent were in the EMEA, 5 percent were in Latin America, and 42 percent were in the U.S and Canada. Within the United States, about 7,500 employees were in non-exempt or hourly-rate positions.
On February 1, 2021, the Company completed the N&B Transaction. As of December 31, 2020, the N&B Business employed approximately 11,000 people around the world. About 20 percent of N&B Business employees were located in Asia Pacific, 40 percent in EMEA, 10 percent in Latin America, and 30 percent in the United States. Within the United States, about 1,500 employees were in non-exempt or hourly-rate positions.
AVAILABLE INFORMATION
The Company is subject to the reporting requirements under the Securities Exchange Act of 1934. Consequently, the Company is required to file reports and information with the Securities and Exchange Commission ("SEC"), including reports on the following forms: annual report on Form 10-K, quarterly reports on Form 10-Q, current reports on Form 8-K, and amendments to those reports filed or furnished pursuant to Section 13(a) or 15(d) of the Securities Exchange Act of 1934.
The SEC maintains an Internet site at http://www.sec.gov that contains reports, proxy and information statements, and other information regarding issuers that file electronically with the SEC, from which the public may obtain any materials the Company files with the SEC.
The Company's annual report on Form 10-K, quarterly reports on Form 10-Q, current reports on Form 8-K and amendments to those reports are also accessible on DuPont's website at http://www.investors.dupont.com by clicking on the section labeled "Investors," then on "Filings & Reports." These reports are made available, without charge, as soon as is reasonably practicable after the Company files or furnishes them electronically with the SEC.
ITEM 1A. RISK FACTORS
The Company's operations could be affected by various risks, many of which are beyond its control. Based on current information, the Company believes that the following identifies the most material risk factors that could affect its operations. Past financial performance may not be a reliable indicator of future performance and historical trends should not be used to anticipate results or trends in future periods.
Risks Relating to the N&B Transaction and the Dow and Corteva Distributions
The separation and combination of DuPont’s Nutrition & Biosciences business with IFF could result in significant tax liability to DuPont.
Following the N&B Merger, N&B is expected to merge with and into Neptune Merger Sub II LLC (a wholly owned subsidiary of IFF) (“Merger Sub II”), with Merger Sub II surviving as a wholly owned subsidiary of IFF (the “Second Merger,” and together with the N&B Merger, the “Mergers”).
The distribution by DuPont to its stockholders of all the issued and outstanding shares of N&B through the Exchange Offer ("N&B Distribution") and Mergers are expected to be tax-free to DuPont stockholders for U.S. federal income tax purposes (except to the extent that cash is paid to DuPont stockholders in lieu of fractional shares pursuant to the Merger Agreement), and the N&B Contribution, N&B Distribution, and Special Cash Payment are expected to result in no recognition of gain or loss by DuPont for U.S. federal income tax purposes.
DuPont has received an opinion from Skadden, Arps, Slate, Meagher & Flom LLP regarding (i) the qualification of the separation and transfer by DuPont of its N&B Business (the "N&B Contribution"), N&B Distribution, and Special Cash Payment as a “reorganization” within the meaning of Sections 368(a), 361 and 355 of the Internal Revenue Code of 1986 (the “Code”), (ii) the nonrecognition of gain or loss by DuPont on receipt of the Special Cash Payment (subject to certain conditions), (iii) the qualification of the N&B Distribution as a distribution described in Section 355 and to which Section 355(e) does not apply and (iv) the qualification of the Mergers as a “reorganization” within the meaning of Section 368(a) of the Code. This opinion is based upon and rely on, among other things, certain facts and assumptions, as well as certain representations, statements and undertakings of DuPont, N&B, IFF and Merger Sub 1 and Merger Sub II. If any of these representations, statements or undertakings are, or become, inaccurate or incomplete, or if any party breaches any of its covenants in the relevant transaction documents, the opinion may be invalid and the conclusions reached therein could be jeopardized. Notwithstanding the receipt of such opinion, the Internal Revenue Service (the “IRS”) could determine that the separation of DuPont’s Nutrition & Biosciences business should be treated as a taxable transaction if it determines that any of the facts, assumptions, representations, statements or undertakings upon which the opinion of counsel was based are false or have been violated, or if it disagrees with the conclusions in the opinion. An opinion of counsel is not binding on the IRS and there can be no assurance that the IRS will not assert a contrary position.
DuPont has also obtained a private letter ruling from the IRS regarding certain matters impacting the U.S. federal income tax treatment of the N&B Contribution, N&B Distribution, Special Cash Payment and certain related transactions. The conclusions of the IRS private letter ruling were based, among other things, on various factual assumptions DuPont authorized and representations DuPont made to the IRS. If any of assumptions or representations are, or become, inaccurate or incomplete, reliance on the IRS private letter ruling may be affected.
If the N&B Contribution and N&B Distribution failed to qualify for the treatment described above, DuPont would be required to generally recognize taxable gain on the transactions and stockholders of DuPont who receive N&B Common Stock (and subsequently, IFF Common Stock) would be subject to tax on their receipt of the N&B Common Stock. Additionally, if the Special Cash Payment or certain internal transactions related to the separation of the Nutrition & Biosciences business fail to qualify for their intended tax-free treatment under U.S. federal, state, local tax and/or foreign tax law, DuPont could incur additional tax liabilities.
Under the Tax Matters Agreement by and between DuPont with N&B and IFF, N&B or IFF is generally be required to indemnify DuPont for any taxes resulting from the separation of the Nutrition & Biosciences business (and any related costs and other damages) to the extent such amounts resulted from (i) certain actions taken by N&B or IFF involving the capital stock of N&B or IFF or any assets of the N&B group (excluding actions required by the documents governing the proposed transactions), or (ii) any breach of certain representations and covenants made by N&B or IFF.
DuPont is subject to continuing contingent tax-related liabilities of Dow and Corteva following the separations and DWDP Distributions.
After the separations and DWDP Distributions, there are several significant areas where the liabilities of Dow and Corteva may become the Company’s obligations, either in whole or in part. For example, to the extent that any subsidiary of the Company
was included in the consolidated tax reporting group of either TDCC or EID for any taxable period or portion of any taxable period ending on or before the effective date of the DWDP Merger, such subsidiary is jointly and severally liable for the U.S. federal income tax liability of the entire consolidated tax reporting group of TDCC or EID, as applicable, for such taxable period. In connection with the separations and DWDP Distributions, DuPont, Dow and Corteva have entered into a Tax Matters Agreement, as amended, that allocates the responsibility for prior period consolidated taxes among Dow, Corteva and DuPont. If Dow or Corteva are unable to pay any prior period taxes for which it is responsible, however, DuPont could be required to pay the entire amount of such taxes, and such amounts could be significant. Other provisions of federal, state, local, or foreign law may establish similar liability for other matters, including laws governing tax-qualified pension plans, as well as other contingent liabilities.
In connection with the separations and DWDP Distributions, certain liabilities are allocated to or retained by DuPont through assumption or indemnification of Dow and/or Corteva, as applicable. If DuPont is required to make payments pursuant to these indemnities to Dow and/or Corteva, DuPont may need to divert cash to meet those obligations, and the Company’s financial results could be negatively impacted. In addition, certain liabilities are allocated to or retained by Dow and/or Corteva through assumption or indemnification, or subject to indemnification by other third parties. These indemnities may not be sufficient to insure the Company against the full amount of liabilities, including PFAS Stray Liabilities, allocated to or retained by it, and Dow, Corteva and/or third parties may not be able to satisfy their respective indemnification obligations in the future.
Pursuant to the DWDP Separation and Distribution Agreement, the DWDP Employee Matters Agreement, and the DWDP Tax Matters Agreement, as amended, (collectively, the “Core Agreements”) with Dow and Corteva, as well as the Letter Agreement between DuPont and Corteva, DuPont has agreed to assume, and indemnify Dow and Corteva for, certain liabilities. (See discussion of the Core Agreements in Note 3 to the Consolidated Financial Statements and Litigation and Environmental Matters in Note 15 to the Consolidated Financial Statements.) Payments pursuant to these indemnities may be significant and could negatively impact the Company’s business, particularly indemnities relating to the Company’s actions that could impact the tax-free nature of the distributions. Third parties could also seek to hold it responsible for any of the liabilities allocated to Dow and Corteva, including those related to EID’s materials science and/or agriculture businesses, or for the conduct of such businesses prior to the distributions, and such third parties could seek damages, other monetary penalties (whether civil or criminal) and/or other remedies. Additionally, DuPont generally assumes and is responsible for the payment of the Company’s share of (i) certain liabilities of DowDuPont relating to, arising out of or resulting from certain general corporate matters of DuPont and (ii) certain separation expenses not otherwise allocated to Corteva or Dow (or allocated specifically to it) pursuant to the Core Agreements, and third parties could seek to hold it responsible for Dow’s or Corteva’s share of any such liabilities. Dow and/or Corteva, as applicable, have agreed to indemnify it for such liabilities; however, such indemnities may not be sufficient to protect it against the full amount of such liabilities or from other remedies, and Dow and/or Corteva, as applicable, may not be able to fully satisfy their indemnification obligations. Even if DuPont ultimately succeeds in recovering from Dow and/or Corteva, as applicable, any amounts for which DuPont are held liable, DuPont may be temporarily required to bear these losses. Each of these risks could negatively affect the Company’s business, financial condition, results of operations and cash flows.
Generally, as described in Litigation and Environmental Matters, losses related from liabilities related to discontinued and/or divested operations and businesses of EID that are not primarily related to its agriculture business or specialty products business, (“Stray Liabilities”), are allocated to or shared by each of Corteva and DuPont. Stray Liabilities include liabilities arising out of actions to the extent related to or resulting from EID’s development, testing, manufacture or sale of per- or polyfluoroalkyl substances, (“PFAS Stray Liabilities”).
Although the Company believes it is remote, there can be no assurance that any such third party would have adequate resources to satisfy its indemnification obligation when due, or, would not ultimately be successful in claiming defenses against payment. Even if recovery from the third party is ultimately successful, DuPont may be temporarily required to bear these losses. Each of these risks could negatively affect the Company’s business, financial condition, results of operations and cash flows. See Note 15 to the Consolidated Financial Statements and the risk factor below regarding the DuPont, Corteva and Chemours cost sharing arrangement related to future eligible PFAS liabilities.
If the completed distribution of Corteva or Dow, in each case, together with certain related transactions, were to fail to qualify for non-recognition treatment for U.S. federal income tax purposes, then the Company could be subject to significant tax and indemnification liability.
The completed distributions of Corteva and Dow were each conditioned upon the receipt of an opinion from Skadden, Arps, Slate, Meagher & Flom LLP, the Company’s tax counsel, regarding the qualification of the applicable distribution along with certain related transactions as a tax-free transaction under Section 355 and Section 368(a)(1)(D) of the Internal Revenue Code of 1986, as amended (the “Code,” and such opinions, collectively, the “Tax Opinions”). The Tax Opinions relied on certain facts, assumptions, and undertakings, and certain representations from the Company, Dow and Corteva, as applicable, as well
as the IRS Ruling (as defined below). Notwithstanding the Tax Opinions and the IRS Ruling, the Internal Revenue Service (the “IRS”) could determine on audit that either, or both, of the distributions and certain related transactions should be treated as taxable transactions if it determines that any of these facts, assumptions, representations or undertakings are not correct or have been violated, or that the distributions should be taxable for other reasons, including if the IRS were to disagree with the conclusions of the Tax Opinions.
Even if a distribution otherwise constituted a tax-free transaction to stockholders under Section 355 of the Code, the Company could be required to recognize corporate level tax on such distribution and certain related transactions under Section 355(e) of the Code if the IRS determines that, as a result of the DWDP Merger or other transactions considered part of a plan with such distribution, there was a 50 percent or greater change in ownership in the Company, Dow or Corteva, as relevant. In connection with the DWDP Merger, the Company sought and received a private letter ruling from the IRS regarding the proper time, manner and methodology for measuring common ownership in the stock of the Company, EID and TDCC for purposes of determining whether there was a 50 percent or greater change of ownership under Section 355(e) of the Code as a result of the DWDP Merger (the “IRS Ruling”). The Tax Opinions relied on the continued validity of the IRS Ruling and representations made by the Company as to the common ownership of the stock of TDCC and EID immediately prior to the DWDP Merger, and concluded that there was not a 50 percent or greater change of ownership for purposes of Section 355(e) as a result of the DWDP Merger. Notwithstanding the Tax Opinions and the IRS Ruling, the IRS could determine that a distribution or a related transaction should nevertheless be treated as a taxable transaction to the Company if it determines that any of the Company’s facts, assumptions, representations or undertakings was not correct or that a distribution should be taxable for other reasons, including if the IRS were to disagree with the conclusions in the Tax Opinions that are not covered by the IRS Ruling.
Generally, corporate taxes resulting from the failure of a distribution to qualify for non-recognition treatment for U.S. federal income tax purposes would be imposed on the Company. Under the DWDP Tax Matters Agreement, as amended, that the Company entered into with Dow and Corteva, Dow and Corteva are generally obligated to indemnify the Company against any such taxes imposed on it. However, if a distribution fails to qualify for non-recognition treatment for U.S. federal income tax purposes for certain reasons relating to the overall structure of the DWDP Merger and the distributions, then under the DWDP Tax Matters Agreement, as amended, the Company and Corteva, on the one hand, and Dow, on the other hand, would share the tax liability resulting from such failure in accordance with the relative equity values of the Company and Dow on the first full trading day following the distribution of Dow, and the Company and Corteva would in turn share any such resulting tax liability in accordance with the relative equity values of the Company and Corteva on the first full trading day following the distribution of Corteva. Furthermore, under the terms of the DWDP Tax Matters Agreement, as amended, a party also generally will be responsible for any taxes imposed on the other parties that arise from the failure of either distribution to qualify as tax-free for U.S. federal income tax purposes within the meaning of Section 355 of the Code or the failure of certain related transactions to qualify for tax-free treatment, to the extent such failure to qualify is attributable to actions, events or transactions relating to such party, or such party's affiliates’, stock, assets or business, or any breach of such party's representations made in connection with the IRS Ruling or in any representation letter provided to a tax advisor in connection with certain tax opinions, including the Tax Opinions, regarding the tax-free status of the distributions and certain related transactions. To the extent that the Company is responsible for any liability under the DWDP Tax Matters Agreement, as amended, there could be a material adverse impact on the Company's business, financial condition, results of operations and cash flows in future reporting periods.
The DWDP separations and DWDP Distributions and the N&B Transaction may expose the Company to potential liabilities arising out of state and federal fraudulent conveyance laws and legal distribution requirements.
Although in connection with the DWDP Distributions and in connection with the N&B Transaction DuPont received separate solvency opinions from investment banks confirming that DuPont, Dow, Corteva and N&B would each be adequately capitalized following the separations and DWDP Distributions, and the N&B Transactions as relevant, (the “Transactions”), the Transactions could be challenged under various state and federal fraudulent conveyance laws. Fraudulent conveyances or transfers are generally defined to include transfers made or obligations incurred with the actual intent to hinder, delay or defraud current or future creditors or transfers made or obligations incurred for less than reasonably equivalent value when the debtor was insolvent, or that rendered the debtor insolvent, inadequately capitalized or unable to pay its debts as they become due. Any unpaid creditor could claim that DuPont did not receive fair consideration or reasonably equivalent value in any of the Transactions and that any one or the aggregate of the Transactions left DuPont insolvent or with unreasonably small capital or that DuPont intended or believed DuPont would incur debts beyond the Company’s ability to pay such debts as they mature. If a court were to agree with such a plaintiff, then such court could void the separations and distributions as a fraudulent transfer or impose substantial liabilities on it, which could adversely affect the Company’s financial condition and the Company’s results of operations.
The Transactions are also subject to review under state corporate distribution statutes. Under the Delaware General Corporation Law, a corporation may only pay dividends to its stockholders either (i) out of its surplus (net assets minus capital) or (ii) if there is no such surplus, out of its net profits for the fiscal year in which the dividend is declared and/or the preceding fiscal
year. Although DuPont’s Board of Directors made the distributions out of DuPont’s surplus and received an opinion that DuPont had adequate surplus under Delaware law to declare the dividends of Corteva and Dow common stock in connection with the DWDP Distributions there can be no assurance that a court will not later determine that some or all of the distributions were unlawful.
On January 22, 2021, DuPont, Corteva and Chemours entered into a cost sharing arrangement related to future eligible PFAS costs. The Company’s results of operations could be adversely affected by litigation and other commitments and contingencies, including expected performance under and impact of the cost sharing arrangement.
Although by reducing uncertainty, the Company expects to benefit from the cost sharing arrangement related to future PFAS eligible costs, achievement of any such benefits may not be realized and depend on a number of factors and uncertainties that include, but are not limited to: the achievement, terms and conditions of final agreements related to the cost sharing arrangement; the outcome of any pending or future litigation related to PFAS or PFOA, including personal injury claims and natural resource damages claims; the extent and cost of ongoing remediation obligations and potential future remediation obligations; changes in laws and regulations applicable to PFAS chemicals; the performance by each of the parties of their respective obligations under the cost sharing arrangement.
DuPont faces risks arising from various unasserted and asserted litigation matters, including product liability, patent infringement and other intellectual property disputes, contract and commercial litigation, claims for damage or personal injury, antitrust claims, governmental regulations and other actions. An adverse outcome in any one or more of these matters could be material to the Company’s business, results of operations, financial condition and cash flows.
In the ordinary course of business, DuPont may make certain commitments, including representations, warranties and indemnities relating to current and past operations, including those related to divested businesses, and DuPont may issue guarantees of third-party obligations. If DuPont is required to make payments as a result, they could exceed the amounts accrued therefor, thereby adversely affecting the Company’s results of operations.
Risks Relating to DuPont’s Business and Results of Operations
The extent to which the novel coronavirus (COVID-19) and measures taken in response to it, impact DuPont’s business, results of operations, access to sources of liquidity and financial condition depends on future developments, which are highly uncertain and cannot be predicted.
DuPont is actively monitoring the global impacts of COVID-19, including the impacts from responsive measures, and remains focused on its top priorities - the safety and health of its employees and the needs of its customers. The Company’s business and financial condition, and the business and financial condition of the company’s customers and suppliers, have been impacted by the significantly increased economic and demand uncertainties created by the COVID-19 outbreak. In addition, public and private sector responsive measures, such as the imposition of travel restrictions, quarantines, adoption of remote working, and suspension of non-essential business and government services, have impacted the Company’s business and financial condition. Many of DuPont’s facilities and employees are based in areas impacted by the virus. While most DuPont manufacturing sites remain in operation, DuPont has reduced or furloughed certain operations in response to government measures, employee welfare concerns and the impact of COVID-19 on the global demand and supply chain. DuPont’s manufacturing operations may be further adversely affected by impacts from COVID-19 including, among other things, additional government actions and other responsive measures, more and /or deeper supply chain disruptions, quarantines and health and availability of essential onsite personnel. In response, the Company developed site-by-site protocols in 2020 under which the Company continues to operate. These protocols include pre-entrance screening, restricting visitor access, social distancing and masking requirements, additional sanitization and disinfecting requirements, restrictions on all nonessential travel and implementation of work-from-home protocols. The suspension of travel and doing business in-person has increased the Company’s exposure to cybersecurity risks and could negatively impact the Company's innovation and marketing efforts, challenge the ability to deliver against the Company’s strategic priorities and to otherwise transact business in a timely manner, or create operational or other challenges, any of which could harm DuPont’s business. Furthermore, COVID-19 continues to adversely impact the broader global economy, including negatively impacting economic growth and creating disruption and volatility in the global financial and capital markets, which could result in increases in the cost of capital and/or adversely impact the availability of and access to capital, which could negatively affect DuPont’s liquidity. DuPont is unable to predict the extent of COVID-19 related impacts on its business, results of operations, access to sources of liquidity and financial condition which depends on highly uncertain and unpredictable future developments, including, but not limited to, the duration and spread of the COVID-19 outbreak, its severity, the actions to contain the virus or treat its impact, and how quickly and to what extent normal economic and operating conditions resume. DuPont’s financial results may be materially and adversely impacted by a variety of factors that have not yet been determined, including potential impairments of goodwill and other assets. DuPont is taking actions, including reducing costs, restructuring actions, and delaying certain capital expenditures and non-essential spend. In addition, the Company may consider further reductions in or furloughing additional operations in response to further and/or deeper declines in demand and/or or supply chain disruptions. There can be no guaranty that such actions will significantly mitigate the
impact of COVID-19 on the company’s business, results of operations, access to sources of liquidity or financial condition. After the COVID-19 outbreak has subsided, DuPont may experience materially adverse impacts to its business, results of operations and financial condition as a result of related global economic impacts, including any recession that has occurred or may occur in the future.
Supply chain disruptions and volatility in energy and raw material costs could have a significant impact on the Company’s sales and earnings.
The Company’s manufacturing processes depend on the continued availability of energy and raw materials, the costs of which are subject to worldwide supply and demand as well as other factors beyond the Company’s control, including potential legislation to address climate change by reducing greenhouse gas emissions, creating a carbon tax or implementing a cap and trade program which could create increases in energy costs and price volatility. Supply chain disruptions, plant and/or power outages, labor disputes and/or strikes, geo-political activity, weather events and natural disasters, including hurricanes or flooding that impact coastal regions, and global health risks or pandemics could seriously harm the Company’s operations as well as the operations of the Company’s customers and suppliers. In addition, the Company’ suppliers may experience capacity limitations in their own operations or may elect to reduce or eliminate certain product lines. To address this risk, generally, the Company seeks to have many sources of supply for key raw materials in order to avoid significant dependence on any one or a few suppliers. In addition, and where the supply market for key raw materials is concentrated, DuPont takes additional steps to manage its exposure to supply chain risk and price fluctuations through, among other things, negotiated long-term contracts some which include minimum purchase obligations. Although there can be no assurance that such mitigation efforts will prevent future difficulty in obtaining sufficient and timely delivery of certain raw materials, DuPont believes it has adequate programs to ensure a reliable supply of key raw materials
DuPont also takes actions to offset the effects of higher energy and raw material costs through selling price increases, productivity improvements and cost reduction programs. Success in offsetting higher raw material costs with price increases is largely influenced by competitive and economic conditions and could vary significantly depending on the market served. As a result, volatility in these costs may negatively impact the Company’s business, results of operations, financial condition and cash flows.
The Company’s business, results of operations, financial condition and cash flows could be adversely affected by interruption of the Company’s information technology or network systems and other business disruptions.
DuPont relies on centralized and local information technology networks and systems, some of which are managed or accessible by third parties, to process, transmit and store electronic information, and to otherwise manage or support its business. Additionally, the Company collects and stores certain data, including proprietary business information, and has access to confidential or personal information in certain of our businesses that is subject to privacy and security laws, regulations and customer-imposed controls.
Information technology system and/or network disruptions, whether caused by acts of sabotage, employee error, malfeasance or other actions, could have an adverse impact on the Company’s operations as well as the operations of the Company’s customers and suppliers. Other business disruptions may also be caused by security breaches, which could include, for example, attacks on information technology and infrastructure by hackers, viruses, breaches due to employee error, malfeasance or other actions or other disruptions. DuPont and/or the Company’s suppliers may fail to effectively prevent, detect and recover from these or other security breaches and, therefore, such breaches could result in misuse of the Company’s assets, loss of property including trade secrets and confidential or personal information, some of which is subject to privacy and security laws, and other business disruptions. As a result, DuPont may be subject to legal claims or proceedings, reporting errors, processing inefficiencies, negative media attention, loss of sales, interference with regulatory compliance which could result in sanctions or penalties, liability or penalties under privacy laws, disruption in the Company’s operations, and damage to the Company’s reputation, which could adversely affect the Company’s business, results of operations, financial condition and cash flows.
Like most major corporations, DuPont is the target of industrial espionage, including cyber-attacks, from time to time. DuPont is experiencing an increase in attempts to breach its information technology systems, including in conjunction with implementation of work-from-home protocols adopted in response to COVID-19. These cyber-security threats include phishing, spam emails, hacking, social engineering, and malicious software. DuPont has determined that these attacks have resulted, and could result in the future, in unauthorized parties gaining access to certain confidential business information. Although management does not believe that DuPont has experienced any material losses to date related to these security breaches, including cybersecurity incidents, there can be no assurance that DuPont will not suffer such losses in the future.
DuPont seeks to actively manage the risks within the Company’s control that could lead to business disruptions and security breaches. As these threats continue to evolve, particularly around cybersecurity, DuPont may be required to expend significant
resources to enhance the Company’s control environment, processes, practices and other protective measures. Despite these efforts, such events could have a material adverse effect on the Company’s business, results of operations, financial condition and cash flows.
Enforcing the Company’s intellectual property rights, or defending against intellectual property claims asserted by others, could adversely affect the Company’s business, results of operations, financial condition and cash flows.
Intellectual property rights, including patents, trade secrets, know-how and other confidential information, trademarks, tradenames and other forms of trade dress, are important to the Company’s business. DuPont endeavors to protect the Company’s intellectual property rights in jurisdictions in which the Company’s products are produced or used and in jurisdictions into which the Company’s products are imported. However, DuPont may be unable to obtain protection for the Company’s intellectual property in key jurisdictions. Further, changes in government policies and regulations, including changes made in reaction to pressure from non-governmental organizations, or the public generally, could impact the extent of intellectual property protection afforded by such jurisdictions.
DuPont has designed and implemented internal controls intended to restrict access to and distribution of the Company’s intellectual property. Despite these precautions, the Company’s intellectual property is vulnerable to unauthorized access through employee error or actions, theft and cybersecurity incidents, and other security breaches. When unauthorized access and use or counterfeit products are discovered, DuPont considers the matter for report to governmental authorities for investigation, as appropriate, and takes measures to mitigate any potential impact. Protecting intellectual property related to biotechnology is particularly challenging because theft is difficult to detect and biotechnology can be self-replicating. Accordingly, the impact of such theft can be significant.
Competitors are increasingly challenging the Company’s intellectual property positions, and the potential outcomes can be highly uncertain. Third parties may also claim the Company’s products violate their intellectual property rights. Defending such claims, even those without merit, is time-consuming and expensive. In addition, as a result of such claims, DuPont has and could be required in the future to enter into license agreements, develop non-infringing products or engage in litigation that could be costly. If challenges are resolved adversely, it could negatively impact the Company’s ability to obtain licenses on competitive terms, commercialize new products and generate sales from existing products.
In addition, because of the rapid pace of technological change, the confidentiality of patent applications in some jurisdictions and/or the uncertainty in predicting the outcome of complex proceedings relating to ownership or the scope of protection of patents relating to certain emerging technologies, competitors may be unexpectedly issued patents that DuPont does not anticipate. These patents could reduce the value of the Company’s commercial or pipeline products or, to the extent they cover key technologies on which DuPont has unknowingly relied, require it to seek to obtain licenses or cease using the technology, no matter how valuable to the Company’s business. If DuPont decided to obtain licenses to continue using the technology, it cannot ensure DuPont would be able to obtain such a license on acceptable terms.
Legislation and jurisprudence on patent protection is evolving, and changes in laws could affect the Company’s ability to obtain or maintain patent protection for the Company’s products.
Any one or more of the above factors could significantly affect the Company’s business, results of operations, financial condition and cash flows.
An impairment of goodwill or intangible assets could negatively impact the Company’s financial results.
At least annually, DuPont must assess both goodwill and indefinite-lived intangible assets for impairment. Intangible assets with finite lives are tested for impairment when events or changes in circumstances indicate their carrying value may not be recoverable. If testing indicates that goodwill or intangible assets are impaired, their carrying values will be written down based on fair values with a charge against earnings. Where DuPont utilizes discounted cash flow methodologies in determining fair values, continued weak demand for a specific product line or business could result in an impairment. Accordingly, any determination requiring the write-off of a significant portion of goodwill or intangible assets could negatively impact the Company’s results of operations.
As a result of the DWDP Merger and related acquisition method of accounting, EID’s assets and liabilities were measured at fair value, and any declines in projected cash flows could have a material, negative impact on the fair value of the Company’s reporting units and assets. Future impairments of the Company’s goodwill or intangible assets also could be recorded due to changes in assumptions, estimates or circumstances and the magnitude of such impairments may be material to it.
Failure to effectively manage acquisitions, divestitures, alliances and other portfolio actions could adversely impact the Company’s business, results of operations, financial condition and cash flows.
DuPont continuously evaluates acquisition candidates, including significant transactions, that may strategically fit the Company’s business and/or growth objectives. If DuPont is unable to successfully integrate and develop acquired businesses, DuPont could fail to achieve anticipated synergies and cost savings, including any expected increases in revenues and operating results, which could have a material adverse effect on the Company’s financial results. DuPont expects to continually review the Company’s portfolio of assets for contributions to the Company’s objectives and alignment with the Company’s growth strategy. The Letter Agreement between the Company and Corteva limits DuPont’s ability to separate certain businesses and assets to third parties without assigning certain of its indemnification obligations under the DWDP Separation and Distribution Agreement to the transferee of such businesses and assets or meeting certain other alternative conditions. DuPont may be unable to meet the conditions under the Letter Agreement, if applicable. Even if the conditions under the Letter Agreement are met or are not applicable, DuPont may not be successful in separating underperforming or non-strategic assets, and gains or losses on the divestiture of, or lost operating income from, such assets may affect the Company’s earnings. Moreover, DuPont might incur asset impairment charges related to acquisitions or divestitures that reduce the Company’s earnings. In addition, if the execution or implementation of acquisitions, divestitures, alliances, joint ventures and other portfolio actions is not successful and/or the Company fails to effectively manage its cost as its portfolio evolves, it could adversely impact the Company’s business, results of operations, financial condition and cash flows.
Failure to maintain a streamlined operating model and sustain operational improvements may reduce the Company’s profitability or adversely impact the Company’s business, results of operations, financial condition and cash flows.
The Company’s profitability and margin growth will depend in part on the Company’s ability to maintain a streamlined operating model and drive sustainable improvements, through actions and projects, such as consolidation of manufacturing facilities, transitions to cost-competitive regions and product line rationalizations. A variety of factors may adversely affect the Company’s ability to realize the targeted cost synergies, including failure to successfully optimize the Company’s facilities footprint, the failure to take advantage of the Company’s global supply chain, the failure to identify and eliminate duplicative programs. There can be no assurance that DuPont is be able to achieve or sustain any or all of the cost savings generated from restructuring actions.
Failure to attract and retain talented people with the necessary knowledge and experience could adversely affect Company’s ability to compete and achieve its strategic goals.
Attracting, developing, and retaining talented employees is essential to the Company’s successful delivery of products and services, ability to innovate, including developing new products and technologies, and ability to identify trends and develop new markets.
Competition for employees can be intense. If the Company is unable to successfully integrate, motivate and reward its employees, it may not be able to retain them or attract new employee in the future which could adversely impact the Company’s ability to effectively compete.
Risks Relating to Capital Resources and Liquidity
Changes in the Company’s credit ratings could increase the Company’s cost of borrowing or restrict the Company’s ability to access debt capital markets. The Company’s credit ratings are important to the Company’s cost of capital.
DuPont relies on access to the debt capital markets and other short-term borrowings to finance the Company’s long-term and day-to-day operations. A decrease in the ratings assigned to it by the ratings agencies may negatively impact the Company’s access to the debt capital markets and increase the Company’s cost of borrowing. The major rating agencies will routinely evaluate the Company’s credit profile and assign debt ratings to it. This evaluation is based on a number of factors, which include weighing the Company’s financial strength versus business, industry and financial risk. The addition of further leverage to the Company’s capital structure could impact the Company’s credit ratings. Failure to maintain an investment grade rating at the Company’s current level would adversely affect the Company’s cost of funding and the Company’s results of operations and could adversely affect the Company’s liquidity and access to the capital markets. Any limitation on the Company’s ability to continue to raise money in the debt capital markets could have a substantial negative effect on the Company’s liquidity. If DuPont is unable to generate sufficient cash flow or maintain access to adequate external financing, including from significant disruptions in the global credit markets, it could restrict the Company’s current operations, activities under its current and future stock buyback programs, and the Company’s growth opportunities, which could adversely affect the Company’s operating results.
A significant percentage of the Company’s net sales are generated from the Company’s international operations and are subject to economic, foreign exchange and other risks.
DuPont does business globally in about 60 countries. The percentage of net sales generated by the international operations of DuPont, including U.S. exports, was approximately 70 percent of net sales on a continuing operations basis for the year ended
December 31, 2020. With Asia Pacific as the Company’s largest region, DuPont expects the percentage of the Company’s net sales derived from international operations to continue to be significant. Risks related to international operations include:
•exchange control regulations
•fluctuations in foreign exchange rates
•foreign investment laws
The Company’s international operations expose it to fluctuations in foreign currencies relative to the U.S. dollar, which could adversely affect the Company’s results of operations. For its continuing operations as of the year ended December 31, 2020, the Company’s largest currency exposures are the European euro, Chinese renminbi, and Japanese yen. U.S. dollar fluctuations against foreign currency have an impact to commercial prices and raw material costs in some cases and could result in local price increases if the price or raw material costs is denominated in U.S. dollar.
Sales and expenses of the Company’s non-U.S. businesses are also translated into U.S. dollars for reporting purposes and fluctuations of foreign currency against the U.S. dollar could impact U.S. dollar-denominated earnings. In addition, the Company’s assets and liabilities denominated in foreign currencies can also be impacted by foreign currency exchange rates against the U.S. dollar, which could result in exchange gain or loss from revaluation.
DuPont also faces exchange rate risk from the Company’s investments in subsidiaries owned and operated in foreign countries.
DuPont has a balance sheet hedging program and actively looks for opportunities in managing currency exposures related to earnings. However, foreign exchange hedging activities bear a financial cost and may not always be available to it or be successful in completely mitigating such exposures.
DuPont generates significant amounts of cash outside of the United States that is invested with financial and non-financial counterparties. While DuPont employs comprehensive controls regarding global cash management to guard against cash or investment loss and to ensure the Company’s ability to fund the Company’s operations and commitments, a material disruption to the counterparties with whom DuPont transacts business could expose it to financial loss.
Any one or more of the above factors could adversely affect the Company’s international operations and could significantly affect the Company’s business, results of operations, financial condition and cash flows.
Risks Related to Regulatory Changes and Compliance
The costs of complying with evolving regulatory requirements could negatively impact the Company’s business, results of operations, financial condition and cash flows. Actual or alleged violations of environmental laws or permit requirements could result in restrictions or prohibitions on plant operations and substantial civil or criminal sanctions, as well as the assessment of strict liability and/or joint and several liability.
DuPont continues to be subject to extensive federal, state, local and foreign laws, regulations, rules and ordinances relating to pollution, protection of the environment, greenhouse gas emissions, and the generation, storage, handling, transportation, treatment, disposal and remediation of hazardous substances and waste materials. Costs and capital expenditures relating to environmental, health or safety matters are subject to evolving regulatory requirements and depend on the timing of the promulgation and enforcement of specific standards which impose the requirements. Moreover, changes in environmental regulations could inhibit or interrupt the Company’s operations, or require modifications to the Company’s facilities. Changes to regulations or the implementation of additional regulations, may result in significant costs or capital expenditures or require changes in business practice that could result in reduced margins or profitability.
Accordingly, environmental, health or safety regulatory matters could result in significant unanticipated costs or liabilities causing a negative impact on the Company’s business, cash flows and results of operations.
The Company’s business, results of operations and reputation could be adversely affected by industry-specific risks including process safety and product stewardship/regulatory compliance issues.
DuPont is subject to risks which include, but are not limited to, product safety or quality; shifting consumer preferences; federal, state, and local regulations on manufacturing or labeling; environmental, health and safety regulations; and customer product liability claims. While DuPont maintains general liability insurance, the amount of liability that may result from certain of these risks may not always be covered by, or could exceed, the applicable insurance coverage. In addition, negative publicity related to product liability, food safety, safety, health and environmental matters may damage the Company’s reputation. The occurrence of any of the matters described above could adversely affect the Company’s business, results of operations, financial condition and cash flows.
In most jurisdictions, DuPont must test the safety, efficacy and environmental impact of the Company’s products to satisfy regulatory requirements and obtain the needed approvals. In certain jurisdictions, DuPont must periodically renew the Company’s approvals, which may require it to demonstrate compliance with then-current standards. The regulatory approvals process is lengthy, complex and in some markets unpredictable, with requirements that can vary by product, technology, industry and country. Additionally, the regulatory environment may be impacted by the activities of non-governmental organizations and special interest groups and stakeholder reactions to the actual or perceived impacts of new technology, products or processes on safety, health and the environment. Obtaining and maintaining regulatory approvals will require submitting a significant amount of information and data, which may require participation from technology providers. Regulatory standards and trial procedures are continuously changing. The pace of change together with the lack of regulatory harmony could result in unintended noncompliance. To maintain the Company’s right to produce or sell existing products or to commercialize new products, DuPont must be able to demonstrate the Company’s ability to satisfy the requirements of regulatory agencies.
The failure to meet existing and new requirements or receive necessary permits or approvals could have near- and long-term effects on the Company’s ability to produce and sell certain current and future products, which could significantly increase operating costs and adversely affect the Company’s business, results of operations, financial condition and cash flows.
Increased concerns regarding chemicals in commerce and their potential impact on the environment have resulted in more restrictive regulations, may lead to new regulations and compliance may be costly.
Concerns about chemicals and biotechnology, as well as their potential impact on health and the environment, reflect a growing trend in societal demands for increasing levels of product safety and environmental protection. These concerns could manifest themselves in stockholder proposals, preferred purchasing, delays or failures in obtaining or retaining regulatory approvals, delayed product launches, lack of market acceptance, product discontinuation, continued pressure for and adoption of more stringent regulatory intervention and litigation. These concerns could also influence public perceptions, the viability or continued sales of certain of the Company’s products, the Company’s reputation and the cost to comply with regulations and, as a result, could have a negative impact on the Company’s business, results of operations and financial condition.
The Company’s U.S. and non-U.S. tax liabilities will be dependent, in part, upon the distribution of income among various jurisdictions in which DuPont operates.
The Company’s future results of operations could be adversely affected by changes in the effective tax rate as a result of a change in the mix of earnings in countries with differing statutory tax rates, changes in tax laws, regulations and judicial rulings (or changes in the interpretation thereof), changes in generally accepted accounting principles, changes in the valuation of deferred tax assets and liabilities, changes in the amount of earnings permanently reinvested offshore, the results of audits and examinations of previously filed tax returns and continuing assessments of the Company’s tax exposures and various other governmental enforcement initiatives. The Company’s tax expense includes estimates of tax reserves and reflects other estimates and assumptions, including assessments of future earnings of the Company which could impact the valuation of the Company’s deferred tax assets. Changes in tax laws or regulations, including further regulatory developments arising from U.S. tax reform legislation as well as multi-jurisdictional changes enacted in response to the action items provided by the Organization for Economic Co-operation and Development (OECD), will increase tax uncertainty and impact the Company’s provision for income taxes.
General Risks that may impact the Company’s business
The Company’s results will be affected by competitive conditions and customer preferences.
Demand for the Company’s products, which impacts revenue and profit margins, will be affected by (i) the development and timing of the introduction of competitive products; (ii) the Company’s response to downward pricing trends to stay competitive; (iii) changes in customer order patterns, such as changes in the levels of inventory maintained by customers and the timing of customer purchases which may be affected by announced price changes, changes in the Company’s incentive programs, or the customer’s ability to achieve incentive goals; (iv) the impact of tariffs or trade disputes on availability of raw materials; and (v) changes in customers’ preferences for the Company’s products, including the success of products offered by the Company’s competitors, and changes in customer’s designs for their products that can affect the demand for some of the Company’s products.
Additionally, success in achieving the Company’s growth objectives is significantly dependent on the timing and market acceptance of the Company’s new product offerings, including the Company’s ability to renew the Company’s pipeline of new product offerings and to bring those offerings to market. This ability may be adversely affected by difficulties or delays in product development, such as the inability to identify viable new products, obtain adequate intellectual property protection, or gain market acceptance of new products. There are no guarantees that new products will prove to be commercially successful. The Company’s success will depend on several factors, including the Company’s ability to:
•correctly identify customer needs and preferences and predict future needs and preferences
•allocate the Company’s research & development funding to products and services with higher growth prospects;
•anticipate and respond to the Company’s competitors’ development of new products and services and technological innovations;
•differentiate the Company’s offerings from the Company’s competitors’ offerings and avoid commoditization;
•innovate and develop new technologies and applications, and acquire or obtain rights to third-party technologies that may have valuable applications in the Company’s served markets;
•obtain adequate intellectual property rights with respect to key technologies before the Company’s competitors do;
•successfully commercialize new technologies in a timely manner, price them competitively and cost-effectively manufacture and deliver sufficient volumes of new products of appropriate quality on time;
•obtain necessary regulatory approvals of appropriate scope; and
•stimulate customer demand for, and convince customers, to adopt new technologies
There are no guarantees that new product offerings will prove to be commercially successful. Additionally, the Company’s expansion into new markets may result in greater-than-expected risks, liabilities and expenses.
DuPont is subject to numerous laws, regulations and mandates globally which could adversely affect the Company’s operating results and forward strategy.
DuPont is required to comply with the numerous and far-reaching laws and regulations administered by United States federal, state, local and foreign governmental authorities. DuPont is required to comply with other general business regulations covering areas such as income taxes, anti-corruption, anti-bribery, global trade, trade sanctions, environmental protections, product safety, and handling and production of regulated substances. DuPont expects to frequently face challenges from U.S. and foreign tax authorities regarding the amount of taxes due. These challenges may include questions regarding the timing and amount of deductions and the allocation of income among various tax jurisdictions.
In evaluating the exposure associated with various tax filing positions, DuPont expects to record reserves for estimates of potential additional tax DuPont may owe. Any failure to comply with applicable laws and regulations or appropriately resolve these challenges could subject it to administrative, civil and criminal remedies including fines, penalties, disgorgement, injunctions and recalls of the Company’s products, and damage to the Company’s reputation.
Governmental policies, including antitrust and competition law, trade restrictions, regulations related to medical applications and devices, food safety regulations, sustainability requirements, traceability and other government regulations and mandates, can impact the Company’s ability to execute this strategy successfully. See also “A significant percentage of the Company’s net sales are generated from the Company’s international operations and are subject to the economic, political, regulatory, foreign exchange and other risks.”
ITEM 1B. UNRESOLVED STAFF COMMENTS.
None.
ITEM 2. PROPERTIES
The Company's corporate headquarters is located in Wilmington, Delaware. The Company's manufacturing, processing, marketing and research and development facilities, as well as regional purchasing offices and distribution centers are located throughout the world. Additional information with respect to the Company's property, plant and equipment and leases is contained in Notes 11, 16 and 23 to the Consolidated Financial Statements.
The Company has investments in property, plant and equipment related to global manufacturing operations. Collectively there are approximately 200 principal sites in total. The number of manufacturing and other significant sites by reportable segment and geographic area around the world at December 31, 2020 is as follows:
| | | | | | | | | | | | | | | | | | | | |
| Geographic Region | Electronics & Imaging | Nutrition & Biosciences | Transportation & Industrial | Safety & Construction | Non-Core | Total 2 |
| Asia Pacific | 17 | | 17 | | 11 | | 12 | | 7 | | 64 | |
EMEA 1 | 3 | | 38 | | 8 | | 6 | | 1 | | 56 | |
| Latin America | — | | 13 | | 2 | | — | | — | | 15 | |
| U.S. & Canada | 12 | | 24 | | 19 | | 13 | | 10 | | 78 | |
| Total | 32 | | 92 | | 40 | | 31 | | 18 | | 213 | |
1.. Europe, Middle East, and Africa.
2. Sites that are used by multiple segments are included more than once in the figures above.
The Company's principal sites include facilities which, in the opinion of management, are suitable and adequate for their use and have sufficient capacity for the Company's current needs and expected near-term growth. Properties are primarily owned by the Company; however, certain properties are leased. No title examination of the properties has been made for the purpose of this report and certain properties are shared with other tenants under long-term leases.
ITEM 3. LEGAL PROCEEDINGS
The Company and its subsidiaries are subject to various litigation matters, including, but not limited to, product liability, patent infringement, antitrust claims, and claims for third party property damage or personal injury stemming from alleged environmental torts. Information regarding certain of these matters is set forth below and in Note 15 to the Consolidated Financial Statements, which also includes discussion of the allocation of liabilities in connection with the DWDP Distributions.
Litigation
See Note 15 to the Consolidated Financial Statements.
Environmental Proceedings
The Company believes it is remote that the following matters will have a material impact on its financial position, liquidity or results of operations. The description is included per Regulation S-K, Item 103(5)(c) of the Securities Exchange Act of 1934.
Divested Neoprene Facility, La Place, Louisiana - EPA Compliance Inspection
In 2016, the EPA conducted a focused compliance investigation at the Denka Performance Elastomer LLC (“Denka”) neoprene manufacturing facility in La Place, Louisiana. EID sold the neoprene business, including this manufacturing facility, to Denka in the fourth quarter of 2015. Subsequent to this inspection, the U.S. Environmental Protection Agency (“EPA)”, the U.S. Department of Justice (“DOJ”), the Louisiana Department of Environmental Quality (“DEQ”), the Company (originally through EID), and Denka began discussions in the spring of 2017 relating to the inspection conclusions and allegations of noncompliance arising under the Clean Air Act, including leak detection and repair. DuPont, Denka, EPA, DOJ and DEQ are continuing these discussions, which include potential settlement options.
New Jersey Directive PFAS
On March 25, 2019, the New Jersey Department of Environmental Protection (“NJDEP”) issued a Directive and Notice to Insurers to a number of companies, including Chemours, DowDuPont, EID, and certain DuPont subsidiaries. NJDEP’s allegations relate to former operations of EID involving poly- and perfluoroalkyl substances, (“PFAS”), including PFOA and PFOA- replacement products. The NJDEP seeks past and future costs of investigating, monitoring, testing, treating, and remediating New Jersey’s drinking water and waste systems, private drinking water wells and natural resources including groundwater, surface water, soil, sediments and biota. The Directive seeks certain information as to future costs and information related to the historic uses of PFAS and replacement chemicals including “information ranging from use and discharge of the chemicals through wastewater treatment plants, air emissions, and sales of products containing the chemicals to current development, manufacture, use and release of newer chemicals in the state.”
ITEM 4. MINE SAFETY DISCLOSURES
Not applicable
| | | | | | | | |
| DuPont de Nemours, Inc. | |
| PART II | |
ITEM 5. MARKET FOR REGISTRANT'S COMMON EQUITY, RELATED STOCKHOLDER MATTERS AND ISSUER PURCHASES OF EQUITY SECURITIES
The Company's common stock is traded on the NYSE under the ticker symbol "DD." Fourth quarter dividend information can be found in Note 24 to the Consolidated Financial Statements.
At February 3, 2021, there were 75,797 stockholders of record.
See Part III, Item 11. Executive Compensation for information relating to the Company’s equity compensation plans.
Issuer Purchases of Equity Securities
On June 1, 2019, the Company announced a $2 billion share buyback program, which expires on June 1, 2021. For the three months ended December 31, 2020, there were no purchases of the Company’s common stock under this share repurchase program. At December 31, 2020, $1 billion is the approximate dollar value of shares that may yet be purchased by the Company under this program.
Stockholder Return
The form of the chart presented below is in accordance with the requirements of the U.S. Securities and Exchange Commission. Stockholders are cautioned against drawing any conclusions from the data contained therein, as past results are not necessarily indicative of future performance. The chart illustrates the cumulative total return of the Company's stock following completion of the DWDP Merger based on a presumed investment of $100 on September 1, 2017 and a presumption that all dividends were reinvested. The historical stock prices of DuPont presented in the chart have been adjusted to reflect the impact of the DWDP Distributions and the Reverse Stock Split. The Company elected to display the closing price on May 31, 2019, the day preceding the Corteva Distribution, in order to provide the reader a more useful baseline for the Company's performance as a specialty products company after consummation of the DWDP Distributions. The chart does not reflect the Company's forecast of future financial performance.
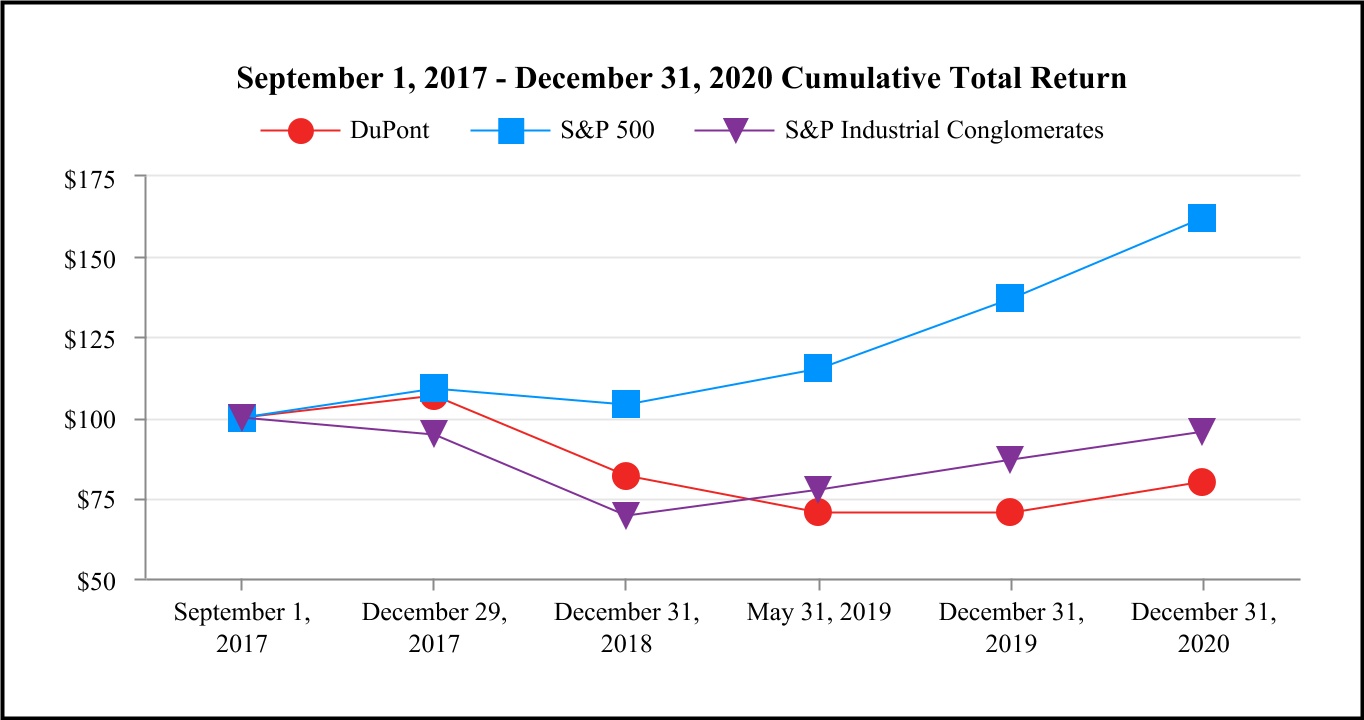
| | | | | | | | | | | | | | | | | | | | |
| Cumulative Total Return | September 1, 2017 | December 29, 2017 | December 31, 2018 | May 31, 2019 2 | December 31, 2019 | December 31, 2020 |
DuPont 1 | $ | 100.00 | | $ | 106.60 | | $ | 81.92 | | $ | 70.30 | | $ | 70.48 | | $ | 79.86 | |
| S&P 500 | $ | 100.00 | | $ | 108.84 | | $ | 104.07 | | $ | 115.24 | | $ | 136.84 | | $ | 162.02 | |
| S&P Industrial Conglomerates | $ | 100.00 | | $ | 94.76 | | $ | 69.29 | | $ | 77.63 | | $ | 86.70 | | $ | 95.60 | |
1. The historical stock prices of DuPont prior to the DWDP Distributions have been adjusted to reflect the impact of the DWDP Distributions and the Reverse Stock Split.
2. Represents the day preceding the Corteva Distribution.
ITEM 7. MANAGEMENT'S DISCUSSION AND ANALYSIS OF FINANCIAL CONDITION AND RESULTS OF OPERATIONS
Management’s discussion and analysis of financial condition and results of operations is provided as a supplement to, and should be read in conjunction with, the consolidated financial statements and related notes to enhance the understanding of the Company’s operations and present business environment. Components of management’s discussion and analysis of financial condition and results of operations include:
•Overview
•Analysis of Operations
•Result of Operations
•Supplemental Unaudited Pro Forma Combined Financial Information
•Segment Results
•Liquidity and Capital Resources
•Outlook
•Recent Accounting Pronouncements
•Critical Accounting Estimates
•Long-Term Employee Benefits
•Environmental Matters
OVERVIEW
As of December 31, 2020, the Company has $6 billion of working capital and over $2.5 billion in cash and cash equivalents. The Company expects its cash and cash equivalents, cash generated from operations, and ability to access the debt capital markets to provide sufficient liquidity and financial flexibility to meet the liquidity requirements associated with its continued operations. In response to the uncertainty surrounding the extent and duration of the COVID-19 pandemic, the Company has also taken additional measures throughout the year to further ensure its liquidity and capital resources. The Company continually assesses its liquidity position, including possible sources of incremental liquidity, in light of the current economic environment, capital market conditions and Company performance.
On February 1, 2021, DuPont completed the separation and distribution of the Nutrition & Biosciences business (the “N&B Business”), and merger of Nutrition & Biosciences, Inc. (“N&B”), a DuPont subsidiary formed to hold the N&B Business, with a subsidiary of IFF. The distribution was effected through an exchange offer (the “Exchange Offer”) where, on the terms and subject to the conditions of the Exchange Offer, eligible participating DuPont stockholders had the option to tender all, some or none of their shares of common stock, par value $0.01 per share, of DuPont (the “DuPont Common Stock”) for a number of shares of common stock, par value $0.01 per share, of N&B (the “N&B Common Stock”) and which resulted in all shares of N&B Common Stock being distributed to DuPont stockholders that participated in the Exchange Offer. The consummation of the Exchange Offer was followed by the merger of N&B with a wholly owned subsidiary of IFF, with N&B surviving the merger as a wholly owned subsidiary of IFF (the “N&B Merger” and, together with the Exchange Offer, the “N&B Transaction”). In connection with the N&B Transaction, N&B made a one-time cash payment of approximately $7.3 billion (the “Special Cash Payment”) to DuPont. The company used a portion of the proceeds to retire its $3 billion term loan facilities on February 1, 2021 and will use the proceeds to fund the redemption, in accordance with their terms, of the $2 billion May 2020 Notes issuance. See discussion below and within “Liquidity and Capital Resources” for more information.
DWDP Merger
Effective August 31, 2017, pursuant to the merger of equals transactions contemplated by the Agreement and Plan of Merger, dated as of December 11, 2015, as amended on March 31, 2017 ("DWDP Merger Agreement"), The Dow Chemical Company ("TDCC") and E. I. du Pont de Nemours and Company ("EID") each merged with subsidiaries of DowDuPont Inc. ("DowDuPont") and, as a result, TDCC and EID became subsidiaries of DowDuPont (the "DWDP Merger"). Prior to the DWDP Merger, DowDuPont did not conduct any business activities other than those required for its formation and matters contemplated by the DWDP Merger Agreement. TDCC was determined to be the accounting acquirer in the DWDP Merger.
DowDuPont completed a series of internal reorganizations and realignment steps in order to separate into three, independent, publicly traded companies - one for each of its agriculture, materials science and specialty products businesses. DowDuPont formed two wholly owned subsidiaries: Dow Inc. ("Dow," formerly known as Dow Holdings Inc.), to serve as a holding company for its materials science business, and Corteva, Inc. ("Corteva"), to serve as a holding company for its agriculture business.
DWDP Distributions
On April 1, 2019, the Company completed the separation of the materials science business through the spin-off of Dow Inc., including Dow’s subsidiary TDCC (the “Dow Distribution”). On June 1, 2019, the Company completed the separation of the agriculture business through the spin-off of Corteva including Corteva’s subsidiary EID, (the “Corteva Distribution and together with the Dow Distribution, the “DWDP Distributions”).
Following the Corteva Distribution, the Company holds the specialty products business. On June 1, 2019, DowDuPont changed its registered name from "DowDuPont Inc." to "DuPont de Nemours, Inc." doing business as "DuPont" (the "Company"). Beginning on June 3, 2019, the Company's common stock is traded on the NYSE under the ticker symbol "DD."
The results of operations of DuPont for the 2019 and 2018 periods presented reflect the historical financial results of Dow and Corteva as discontinued operations, as applicable. The cash flows and comprehensive income related to Dow and Corteva have not been segregated and are included in the Consolidated Statements of Cash Flows and Consolidated Statements of Comprehensive Income, respectively, for the applicable period. Unless otherwise indicated, the information in the notes to the Consolidated Financial Statements refer only to DuPont's continuing operations and do not include discussion of balances or activity of Dow or Corteva.
The statements of operations and pro forma statements of operations included in this report and as discussed below include costs previously allocated to the materials science and agriculture businesses that did not meet the definition of expenses related to discontinued operations in accordance with Financial Accounting Standards Codification 205, "Presentation of Financial Statements" ("ASC 205") and thus are reflected in the Company's results of continuing operations. A significant portion of these costs relate to TDCC and consist of leveraged services provided through service centers, as well as other corporate overhead costs related to information technology, finance, manufacturing, research & development, sales & marketing, supply chain, human resources, sourcing & logistics, legal and communications, public affairs & government affairs functions. These costs are no longer incurred by the Company following the DWDP Distributions.
N&B Transaction
On December 31, 2020, DuPont commenced the Exchange Offer which expired at one minute past 11:59 PM ET on January 29, 2021. Pursuant to the Exchange Offer, on February 1, 2021, DuPont accepted approximately 197.4 million shares of DuPont Common Stock in exchange for about 141.7 million shares of N&B Common Stock. The closing of the N&B Merger followed on February 1, 2021 after satisfaction of certain other conditions, including the receipt of the Special Cash Payment.
In the N&B Merger, each share of N&B common stock was automatically converted into the right to receive one share of IFF common stock, par value $0.125 per share (“IFF Common Stock”). See Note 25 to the Consolidated Financial Statements for more information.
At December 31, 2020, the financial results of the N&B Business are included in continuing operations for all periods presented.
2021 Segment Realignment
DuPont’s worldwide operations are managed through global businesses, which are currently reported in five reportable segments: Electronics & Imaging; Nutrition & Biosciences; Transportation & Industrial; Safety & Construction; and Non-Core. In conjunction with the closing of the N&B Transaction on February 1, 2020, the Company announced changes to its reportable segments (the “2021 Segment Realignment”). These changes result in the following:
•Realignment of certain businesses from Transportation & Industrial to Electronics & Imaging
•Dissolution of the Non-Core segment with the businesses to be divested and previously divested reflected in Corporate
•Realignment of the remaining Non-Core businesses to Transportation & Industrial
In addition, the following name changes will occur:
•Electronic & Imaging will be renamed Electronics & Industrial
•Transportation & Industrial will be renamed Mobility & Materials
•Safety & Construction will be renamed Water & Protection
The changes became effective February 1, 2021 and the Company will report financial results under this new structure beginning in the first quarter of 2021. The results included in Management’s Discussion and Analysis of Financial Condition and Results of Operations are not reflective of the 2021 Segment Realignment.
ANALYSIS OF OPERATIONS
COVID-19
The novel coronavirus (“COVID-19”) pandemic has resulted in significant economic disruption and continues to adversely impact the broader global economy, including certain of the Company’s customers and suppliers. The ultimate extent of the effects of the COVID-19 pandemic on the Company is highly uncertain and will depend on future developments and the effects could exist for an extended period of time even after the pandemic subsides.
During 2020, the Company benefited from strong demand in certain key end-markets, principally electronics, water filtration, health & wellness and personal protection. Although results reflect notable improvement in automotive markets, along with residential construction, in the second half of 2020 compared to the first half of 2020, the COVID-19 pandemic adversely impacted demand in aerospace, commercial construction, oil & gas, and select industrial end-markets. In response to this uncertainty, the Company delayed certain capital investments in select sectors throughout the year.
Nutrition & Biosciences Financing
In the third quarter of 2020, N&B completed an offering of $6.25 billion of senior unsecured notes (the “N&B Notes Offering”). The net proceeds of approximately $6.2 billion from the N&B Notes Offering were deposited into an escrow account and at December 31, 2020 are reflected as restricted cash in the Company’s consolidated financial statements.
In the first quarter of 2020, N&B entered into a senior unsecured term loan agreement in the amount of $1.25 billion split evenly between three- and five-year facilities.
See Note 14 of the Consolidated Financial Statements for additional information.
Divestitures
In the fourth quarter of 2020, the Company entered into a definitive agreement to sell its Biomaterials business unit, which includes the Company's equity method investment in DuPont Tate & Lyle Bio Products. In January 2021, the Company entered into separate definitive agreements to sell its Clean Technologies and Solamet® businesses. These divestitures, subject to regulatory approval and customary closing conditions, are expected to close in the first half of 2021.
In the third quarter of 2020, the Company completed the sale of its trichlorosilane business (“TCS Business”) along with its equity ownership interest in DC HSC Holdings LLC and Hemlock Semiconductor L.L.C. (the "HSC Group,” and together with the TCS Business, the “TCS/HSC Disposal Group” and the sale of the TCS/HSC Disposal Group, the “TCS/HSC Disposal”) to the HSC Group, both of which were part of the Non-Core segment. The TCS/HSC Disposal resulted in a net pre-tax benefit of $396 million ($236 million net of tax) which was recorded in “Sundry income (expense) – net” in the Company’s Consolidated Statements of Operations.
In the first quarter of 2020, the Company completed the sale of its Compound Semiconductor Solutions business unit, a part of the Electronics & Imaging segment, to SK Siltron, for approximately $420 million. The sale resulted in a pre-tax gain of $197 million ($102 million net of tax) recorded in "Sundry income (expense) - net" in the Company's Consolidated Statements of Operations.
In the third quarter of 2019, the Company completed the sale and separation of its Sustainable Solutions business unit, a part of the Non-Core segment, to Gyrus Capital. The sale resulted in a pre-tax gain of $28 million ($22 million net of tax) which was recorded in "Sundry income (expense) - net" in the Company's Consolidated Statements of Operations.
See Note 3 of the Consolidated Financial Statements for additional information.
Joint Settlement Agreement
On January 22, 2021, the Company, Corteva, EID and Chemours entered into a binding Memorandum of Understanding (the “MOU”), pursuant to which the parties have agreed to share certain costs associated with potential future liabilities related to alleged historical releases of certain PFAS arising out of pre-July 1, 2015 conduct (“eligible PFAS costs”) until the earlier to occur of (i) December 31, 2040, (ii) the day on which the aggregate amount of qualified spend (as defined in the MOU) is equal to $4 billion or (iii) a termination in accordance with the terms of the MOU. The parties have agreed that, during the term of this sharing arrangement, Chemours will bear 50% of any qualified spend and the Company and Corteva shall together bear 50% of any qualified spend. As of December 31, 2020, the Company has recorded a liability of $59 million in connection with the cost sharing arrangement related to future eligible PFAS costs.
On January 21, 2021, EID and Chemours entered into settlement agreements with plaintiffs’ counsel representing the Ohio MDL plaintiffs providing for a settlement of cases and claims in the Ohio MDL totaling $83 million in cash with each of the Company and EID contributing approximately $27 million and Chemours contributing approximately $29 million. As of December 31, 2020, the Company has recorded an indemnification liability of $27 million related to the settlement.
Total pre-tax charges of $86 million ($66 million after-tax) related to both of the above matters are reflected as a loss from discontinued operations for the year ended December 31, 2020 in the Company's Consolidated Statements of Operations.
Goodwill, Long-Lived Asset and Indefinite-Lived Asset Impairments
During the third quarter of 2020, multiple triggering events occurred requiring the Company to perform impairment analyses associated with its Non-Core segment. As a result of the analyses performed, the Company recorded aggregate pre-tax, non-cash goodwill impairment charges of $183 million recognized in "Goodwill impairment charges" and aggregate pre-tax, non-cash asset impairment charges of $370 million recognized in “Restructuring and asset related charges - net” in the Consolidated Statements of Operations.
During the second quarter of 2020, continued near-term demand weakness in global automotive production resulting from the COVID-19 pandemic, along with revised views of recovery based on third party market information, served as a triggering event requiring the Company to perform an impairment analysis of the goodwill associated with its Transportation & Industrial reporting unit. As a result of the analysis performed, the Company recorded pre-tax, non-cash goodwill impairment charges of $2,498 million recognized in "Goodwill impairment charges" in the Consolidated Statements of Operations. In connection with the Transportation & Industrial impairment analysis, the Company also recorded pre-tax, non-cash impairment charges of $21 million related to indefinite-lived intangible assets recognized in “Restructuring and asset related charges - net” in the Consolidated Statements of Operations.
During the first quarter of 2020, the Company was required to perform interim impairment tests of its goodwill and long-lived assets as expectations of proceeds related to certain potential divestitures within the Non-Core segment gave rise to fair value indicators and, thus, served as triggering events. As a result of the analysis performed, the Company recorded pre-tax, non-cash impairment charges related to goodwill of $533 million. The charges were recognized in "Goodwill impairment charge" in the Consolidated Statements of Operations. The Company also recorded pre-tax, non-cash impairment charges of $270 million related to long-lived assets. The charges were recognized in “Restructuring and asset related charges - net” in the Consolidated Statements of Operations.
During the second quarter of 2019, the Company was required to perform interim impairment tests of its goodwill due to the internal distribution of the specialty products legal entities from EID to DowDuPont (the "Internal SP Distribution") and the Second Quarter Segment Realignment. As a result of the analyses performed, the Company recorded pre-tax, non-cash impairment charges during the year ended December 31, 2019, totaling $1,175 million, of which $933 million related to the Nutrition & Biosciences segment and $242 million related to the Non-Core segment. The charges were recognized in "Goodwill impairment charges" in the Consolidated Statements of Operations.
See Notes 5 and 13 of the Consolidated Financial Statements.
Equity Method Investment Impairment
During the second quarter of 2019, in connection with the Internal SP Distribution and the impairment of the Industrial Biosciences reporting unit, the Company performed an impairment analysis on the reporting unit's equity method investments. As a result of the analysis performed, the Company recorded pre-tax, non-cash impairment charges of $63 million to write-down the value of an equity method investment. The charge was recognized in "Restructuring and asset related charges - net" in the Consolidated Statements of Operations. See Note 5 of the Consolidated Financial Statements.
Dividends
On February 12, 2020, the Board of Directors declared a first quarter dividend of $0.30 per share, paid on March 16, 2020, to shareholders of record on February 28, 2020. On April 29, 2020, the Company announced that its Board of Directors declared a second quarter dividend of $0.30 per share, paid on June 15, 2020, to shareholders of record on May 29, 2020. On June 25, 2020, the Company announced that its Board of Directors declared a third quarter dividend of $0.30 per share, paid on September 15, 2020, to shareholders of record on July 31, 2020. On October 14, 2020, the Company announced that its Board of Directors declared a fourth quarter dividend of $0.30 per share, paid on December 15, 2020, to shareholders of record on November 30, 2020.
Share Buyback Program
On June 1, 2019, the Company's Board of Directors approved a $2 billion share buyback program, which expires on June 1, 2021. During the year ended December 31, 2020, the Company repurchased and retired 6.1 million shares for $232 million. As of the year ended December 31, 2020, the Company had repurchased and retired 16.9 million shares under this program at a total cost of $982 million.
Restructuring Programs
2020 Restructuring Program
During the first quarter of 2020, the Company approved restructuring actions designed to capture near-term cost reductions and to further simplify certain organizational structures in anticipation of the N&B Transaction (the "2020 Restructuring Program"). For the year ended December 31, 2020, the Company recorded a pre-tax charge related to the 2020 Restructuring Program of $179 million, recognized in "Restructuring and asset related charges - net" in the Company's Consolidated Statements of Operations. At December 31, 2020, total liabilities related to the program were $68 million, which represents expected future cash payments related to this program for the payment of severance and related benefits. The 2020 Restructuring Program was considered substantially complete at December 31, 2020.
2019 Restructuring Program
During the second quarter of 2019 and in connection with the ongoing integration activities, DuPont approved restructuring actions to simplify and optimize certain organizational structures following the completion of the DWDP Distributions (the "2019 Restructuring Program"). The Company recorded pre-tax restructuring charges of $140 million inception-to-date, consisting of severance and related benefit costs of $106 million and asset related charges of $34 million, recognized in "Restructuring and asset related charges - net" in the Company's Consolidated Statements of Operations. At December 31, 2020, total liabilities related to the program were $18 million, which represents expected future cash payments related to this program for the payment of severance and related benefits. The 2019 Restructuring Program was considered substantially complete at June 30, 2020.
DowDuPont Cost Synergy Program
In September and November 2017, the Company approved post-merger restructuring actions under the DowDuPont Cost Synergy Program (the “Synergy Program”), adopted by the DowDuPont Board of Directors. The Synergy Program was designed to integrate and optimize the organization following the DWDP Merger and in preparation for the DWDP Distributions. The Company recorded pre-tax restructuring charges of $492 million inception-to-date, consisting of severance and related benefit costs of $213 million, asset related charges of $212 million and contract termination charges of $67 million. The DowDuPont Cost Synergy program the program was considered substantially complete at June 30, 2020.
RESULTS OF OPERATIONS
| | | | | | | | | | | |
| Summary of Sales Results | For the Years Ended December 31, |
| In millions | 2020 | 2019 | 2018 |
| Net sales | $ | 20,397 | | $ | 21,512 | | $ | 22,594 | |
| | | |
| | | | | | | | | | | | | | | | | | | | | | | | | | | | | | | | |
| Sales Variances by Segment and Geographic Region - As Reported |
| For the Year Ended December 31, 2020 | For the Year Ended December 31, 2019 |
| Percentage change from prior year | Local Price & Product Mix | Currency | Volume | Portfolio & Other | Total | Local Price & Product Mix | Currency | Volume | Portfolio & Other | Total |
| Electronics & Imaging | (1) | % | — | % | 8 | % | — | % | 7 | % | — | % | (1) | % | (1) | % | — | % | (2) | % |
| Nutrition & Biosciences | 1 | | (1) | | — | | — | | — | | 1 | | (2) | | — | | (1) | | (2) | |
Transportation & Industrial | (4) | | — | | (11) | | — | | (15) | | 3 | | (2) | | (10) | | — | | (9) | |
| Safety & Construction | 2 | | — | | (8) | | 2 | | (4) | | 3 | | (1) | | — | | (4) | | (2) | |
| Non-Core | 3 | | — | | (14) | | (11) | | (22) | | 1 | | (2) | | (11) | | (3) | | (15) | |
| Total | — | % | — | % | (4) | % | (1) | % | (5) | % | 2 | % | (2) | % | (4) | % | (1) | % | (5) | % |
| U.S. & Canada | (1) | % | — | % | (7) | % | (1) | % | (9) | % | 2 | % | — | % | (3) | % | — | % | (1) | % |
EMEA 1 | — | | — | | (9) | | — | | (9) | | 3 | | (5) | | (4) | | (4) | | (10) | |
| Asia Pacific | (1) | | — | | 2 | | — | | 1 | | 1 | | (1) | | (4) | | — | | (4) | |
| Latin America | 4 | | (5) | | (9) | | (1) | | (11) | | 3 | | (3) | | (3) | | (1) | | (4) | |
| Total | — | % | — | % | (4) | % | (1) | % | (5) | % | 2 | % | (2) | % | (4) | % | (1) | % | (5) | % |
1. Europe, Middle East and Africa.
2020 versus 2019
The Company reported net sales for the year ended December 31, 2020 of $20.4 billion, down 5 percent from $21.5 billion for the year ended December 31, 2019, due to a 4 percent decrease in volume and a 1 percent decline due to portfolio actions. Local price and product mix and currency remained flat. Volume declined across all geographic regions with the exception of Asia Pacific where it increased 2 percent. Volume gains in Electronics & Imaging (up 8 percent) were more than offset by declines in Non-Core (down 14 percent), Transportation & Industrial (down 11 percent) and Safety & Construction (down 8 percent). Portfolio and other changes contributed 1 percent of the sales decrease which impacted Non-Core (down 11 percent) offset by Safety & Construction (up 2 percent). Currency was flat compared with the same period last year in all segments with the exception of Nutrition & Bioscience (down 1 percent). Local price increased in Latin America (up 4 percent) and in Non-Core (up 3 percent) and Safety & Construction (up 2 percent).
2019 versus 2018
The Company reported net sales for the year ended December 31, 2019 of $21.5 billion, down 5 percent from $22.6 billion for the year ended December 31, 2018, due to a 4 percent decrease in volume, a 2 percent unfavorable currency impact and a 1 percent decline in portfolio actions slightly offset by a 2 percent increase in local price. Volume declined across all geographic regions and all segments with the exception of Nutrition & Biosciences and Safety & Construction which were both flat. The most notable volume decreases were in Non-Core (down 11 percent) and Transportation & Industrial (down 10 percent). Currency was down 2 percent compared with last year, driven primarily by EMEA currencies (down 5 percent). Local price was up 2 percent compared with last year. Local price increased in all geographic regions and in all segments except Electronics & Imaging (flat). Portfolio and other changes contributed 1 percent of the sales decrease which impacted Safety & Construction (down 4 percent; within EMEA), Non-Core (down 3 percent) and Nutrition & Biosciences (down 1 percent).
Cost of Sales
Cost of sales was $13.5 billion for the year ended December 31, 2020, down from $14.1 billion for the year ended December 31, 2019. Cost of sales decreased for the year ended December 31, 2020 primarily due to lower sales volume, cost synergies, and the absence in 2020 of costs previously allocated to the materials science and agriculture businesses that did not meet the definition of expenses related to discontinued operations in accordance with ASC 205 and therefore remained as costs of continuing operations for periods prior to the DWDP Distributions, offset by approximately $245 million of charges associated with temporarily idling several manufacturing plants to align supply with demand due to COVID-19, driven primarily by the Transportation & Industrial segment.
Cost of sales as a percentage of net sales for the year ended December 31, 2020 was 66 percent compared with 65 percent for the year ended December 31, 2019.
For the year ended December 31, 2019, cost of sales was $14.1 billion, down from $15.3 billion for the year ended December 31, 2018. Cost of sales decreased for the year ended December 31, 2019 primarily due to lower sales volume, cost synergies, portfolio actions related to current year divestitures, currency impacts, and lower costs previously allocated to the materials science and agriculture businesses that did not meet the definition of expenses related to discontinued operations in accordance with ASC 205 and therefore remained as costs of continuing operations for periods prior to the DWDP Distributions.
Cost of sales as a percentage of net sales for the year ended December 31, 2019 was 65 percent compared with 68 percent for the year ended December 31, 2018.
Research and Development Expense ("R&D")
R&D expense was $860 million for the year ended December 31, 2020, $955 million for the year ended December 31, 2019, and $1,070 million for the year ended December 31, 2018. R&D as a percentage of net sales was 4 percent for both the years ended December 31, 2020 and 2019, and 5 percent for the year December 31, 2018.
The decrease in R&D costs in 2020 compared to 2019 was due to productivity actions as well as the absence of R&D costs previously allocated to the materials science and agriculture businesses that did not meet the definition of expenses related to discontinued operations in accordance with ASC 205 and therefore remained as a cost of continuing operations for periods prior to the DWDP Distributions. The decrease in R&D costs in 2019 compared to 2018 was primarily due to lower R&D costs previously allocated to the materials science and agriculture businesses that did not meet the definition of expenses related to discontinued operations in accordance with ASC 205 and therefore remained as costs of continuing operations for periods prior to the DWDP Distributions.
Selling, General and Administrative Expenses ("SG&A")
For the year ended December 31, 2020, SG&A expenses totaled $2,235 million, down from $2,663 million in the year ended December 31, 2019 and $3,028 million for the year ended December 31, 2018. SG&A as a percentage of net sales was 11 percent, 12 percent, and 13 percent for the years ended December 31, 2020, 2019, and 2018, respectively.
The decrease in SG&A costs in 2020 compared to 2019 was due to productivity actions, temporarily reducing costs due to COVID-19 restrictions, overall reducing spending, and the absence of SG&A costs previously allocated to the materials science and agriculture businesses that did not meet the definition of expenses related to discontinued operations in accordance with ASC 205 and therefore remained as costs of continuing operations for periods prior to the DWDP Distributions. The decrease in SG&A costs in 2019 compared to 2018 was due to cost synergies and lower SG&A costs previously allocated to the materials science and agriculture businesses that did not meet the definition of expenses related to discontinued operations in accordance with ASC 205 and therefore remained as costs of continuing operations for periods prior to the DWDP Distributions.
Amortization of Intangibles
Amortization of intangibles was $2,119 million, $1,050 million, and $1,044 million for the years ended December 31, 2020, 2019, and 2018, respectively. The increase in amortization in 2020 compared with 2019 was primarily due to the amortization of the Nutrition and Biosciences tradename that was reclassified to definite-lived intangibles in the fourth quarter of 2019 in connection with the N&B Transaction. Amortization in 2019 compared with 2018 was relatively flat. See Note 13 to the Consolidated Financial Statements for additional information on intangible assets.
Restructuring and Asset Related Charges - Net
Restructuring and asset related charges - net were $849 million, $314 million, and $147 million for the years ended December 31, 2020, 2019 and 2018, respectively.
The activity for the year ended December 31, 2020 included a $588 million impairment charge related to long-lived assets and a $52 million impairment charge related to indefinite-lived intangible assets in the Non-Core segment, a $21 million impairment charge related to indefinite-lived intangible assets in the Transportation & Industrial segment, a $179 million charge related to the 2020 Restructuring Program, a $2 million charge related to the 2019 Restructuring Program and a $7 million charge related to the DowDuPont Cost Synergy Program. The charges for the year ended December 31, 2019 included a charge of $138 million related to the 2019 Restructuring Program, a $113 million charge related to the DowDuPont Cost Synergy Program, and a $63 million impairment charge related to an equity method investment. The charges for the year ended December 31, 2018 related to the Synergy Program.
See Note 5 to the Consolidated Financial Statements for additional information.
Goodwill Impairment Charges
Goodwill impairment charges were $3,214 million and $1,175 million for the years ended December 31, 2020 and 2019, respectively. For the year ended December 31, 2020, goodwill impairment charges relate to the Transportation & Industrial and Non-Core segments. For the year ended December 31, 2019, goodwill impairment charges relate to the Nutrition & Biosciences and Non-Core segments. There were no goodwill related impairments in the year ended December 31, 2018. See Note 13 to the Consolidated Financial Statements for additional information.
Integration and Separation Costs
Integration and separation costs were $594 million in 2020, $1,342 million in 2019 and $1,887 million in 2018. Integration and separation costs primarily reflect costs related to the N&B Transaction, which began in the fourth quarter of 2019, the post-DWDP Merger integration, and activities related to the DWDP Distributions. The decline was primarily related to the timing of the DWDP Distributions.
Equity in Earnings of Nonconsolidated Affiliates
The Company's share of the earnings of nonconsolidated affiliates was $191 million, $84 million, and $447 million for the years ended December 31, 2020, 2019 and 2018, respectively. The increase in earnings of nonconsolidated affiliates for the year ended December 31, 2020 compared to the prior year is due to higher HSC Group equity earnings in the first half of 2020, driven mainly by customer settlements in the second quarter of 2020. The decrease in earnings of nonconsolidated affiliates for the year ended December 31, 2019 compared to the year ended December 31, 2018 was primarily due to lower equity earnings from the HSC Group for the year ended December 31, 2019. For the year ended December 31, 2019 lower equity earnings from the HSC Group was mainly attributable to asset impairment charges, partially offset by benefits associated with customer contract settlements.
Sundry Income (Expense) - Net
Sundry income (expense) - net includes a variety of income and expense items such as foreign currency exchange gains or losses, interest income, dividends from investments, gains and losses on sales of investments and assets, non-operating pension and other post-employment benefit plan credits or costs, and certain litigation matters. Sundry income (expense) - net for the year ended December 31, 2020 was $675 million compared with $153 million and $92 million in the years ended December 31, 2019 and 2018, respectively.
The year ended December 31, 2020 included a net pre-tax benefit of $396 million associated with the TCS/HSC Disposal as discussed above, a pre-tax gain of $197 million related to the sale of the Compound Semiconductor Solutions business unit in the Electronics & Imaging segment, miscellaneous income of $47 million, and income related to non-operating pension and other post-employment benefit plans of $32 million, partially offset by foreign currency exchange losses of $56 million.
The year ended December 31, 2019 included a net gain on sale of assets and investments of $157 million, income related to non-operating pension and other post-employment benefit plans of $74 million, and interest income of $55 million partially offset by foreign currency exchange losses of $110 million and miscellaneous expenses of $23 million which includes a $48 million charge reflecting a reduction in gross proceeds from lower withholding taxes related to a prior year legal settlement. The net gain on sale of assets includes income of $92 million related to a sale of assets within the Electronics & Imaging segment and as well as a gain of $28 million related to the sale of the Sustainable Solutions business unit within the Non-Core segment.
The year ended December 31, 2018 included income related to non-operating pension and other post-employment benefit plans of $96 million, miscellaneous income of $83 million and interest income of $39 million, partially offset by foreign currency exchange losses of $93 million and loss on divestiture and change in joint venture ownership of $41 million. The foreign currency exchange losses included a $50 million foreign currency exchange loss related to adjustments to foreign currency exchange contracts as a result of U.S. tax reform. The loss on divestitures and change in joint venture ownership include a $14 million loss on the divestiture of the European XPS STYROFOAMTM business (related to Safety & Construction) and a $27 million negative impact for adjustments related to the Dow Silicones ownership restructure (related to Non-Core).
See Notes 6 to the Consolidated Financial Statements for additional information.
Interest Expense
Interest expense was $767 million, $668 million, and $55 million for the years ended December 31, 2020, 2019, and 2018, respectively. The increase in interest expense in 2020 compared to 2019 primarily relates to financing costs associated with the N&B Transaction and the May Debt Offering, partially offset by reduced borrowing rates on floating rate debt. For the year ended December 31, 2018, there was less than one quarter of interest expense as the Company did not have outstanding
borrowings until the 2018 Senior Notes issuance in the fourth quarter of 2018. Refer to Note 14 to the Consolidated Financial Statements for additional information.
(Benefit from) Provision for Income Taxes on Continuing Operations
The Company's effective tax rate fluctuates based on, among other factors, where income is earned and the level of income relative to tax attributes. For the year ended December 31, 2020, the Company's effective tax rate was 0.8 percent on a pre-tax loss from continuing operations of $2,897 million. The effective tax rate for the year ended December 31, 2020, was principally the result of a non-tax-deductible goodwill impairment charge impacting the Non-Core segment in the first and third quarter and a non-tax-deductible goodwill impairment charge impacting the Transportation and Industrial segment in the second quarter, coupled with an allocation of non-tax-deductible goodwill related to the TCS/HSC Disposal. See Note 13 for more information regarding the goodwill impairment charges. The underlying factors affecting the Company’s overall tax rate are summarized in Note 7 to the Consolidated Financial Statements.
For the year ended December 31, 2019, the Company's effective tax rate was (29.5) percent on a pre-tax loss from continuing operations of $474 million. The effective tax rate was principally the result of the non-tax-deductible goodwill impairment charges impacting the Nutrition & Biosciences and Non-Core segments.
For the year ended December 31, 2018, the Company's effective tax rate was 32.6 percent on pre-tax income from continuing operations of $600 million. The effective tax was favorably impacted by the geographic mix of earnings but was more than offset by a $67 million charge associated with a valuation allowance recorded against the net deferred tax asset position of the Company’s legal entity in Brazil related to the separated agriculture business.
(Loss) Income from Discontinued Operations, Net of Tax
Loss from discontinued operations, net of tax was $49 million for the year ended December 31, 2020, compared to income from discontinued operations, net of tax of $1,214 million and $3,595 million for the years ended December 31, 2019 and 2018, respectively. For the year ended December 31, 2020, loss from discontinued operations, net of tax primarily related to litigation matters, partially offset by a gain related to the DWDP Tax Matters Agreement. For the year ended December 31, 2019 and 2018, income from discontinued operations, net of tax primarily related to the DWDP Distributions. The decrease each year is attributable to the timing of the DWDP Distributions. Refer to Notes 3 and 15 to the Consolidated Financial Statements for additional information.
Net Income Attributable to Noncontrolling Interests
Net income attributable to noncontrolling interests, including the portion attributable to discontinued operations, was $28 million, $102 million, and $155 million, for the years ended December 31, 2020, 2019, and 2018 respectively.
Net income attributable to noncontrolling interests of continuing operations was $28 million, $30 million, and $39 million, for the years ended December 31, 2020, 2019, and 2018 respectively.
SUPPLEMENTAL UNAUDITED PRO FORMA COMBINED FINANCIAL INFORMATION
The following supplemental unaudited pro forma financial information (the “unaudited pro forma financial statements”) was derived from DuPont’s Consolidated Financial Statements, adjusted to give effect to certain events directly attributable to the DWDP Distributions. In contemplation of the DWDP Distributions and to achieve the respective credit profiles of each of the current companies, in the fourth quarter of 2018, DowDuPont borrowed $12.7 billion under the 2018 Senior Notes and entered the Term Loan Facilities with an aggregate principal amount of $3.0 billion. Additionally, DuPont issued approximately $1.4 billion in commercial paper in May 2019 in anticipation of the Corteva Distribution (the “Funding CP Issuance” together with the 2018 Senior Notes and the Term Loan Facilities, the "DWDP Financings"). The unaudited pro forma financial statements below were prepared in accordance with Article 11 of Regulation S-X. The historical consolidated financial information has been adjusted to give effect to pro forma events that are (1) directly attributable to the DWDP Distributions and the DWDP Financings (collectively the "DWDP Transactions"), (2) factually supportable and (3) with respect to the statements of operations, expected to have a continuing impact on the results. The unaudited pro forma statements of operations for the years ended December 31, 2019 and 2018 give effect to the pro forma events as if the DWDP Transactions had occurred on January 1, 2018. There were no pro forma adjustments for the year ended December 31, 2020.
Restructuring or integration activities or other costs following the DWDP Distributions that may be incurred to achieve cost or growth synergies of DuPont are not reflected. The unaudited pro forma statements of operations provides shareholders with summary financial information and historical data that is on a basis consistent with how DuPont reports current financial information.
The unaudited pro forma financial statements are presented for informational purposes only, and do not purport to represent what DuPont's results of operations or financial position would have been had the DWDP Transactions occurred on the dates indicated, nor do they purport to project the results of operations or financial position for any future period or as of any future date.
| | | | | | | | | | | | | | | | | | | | |
Unaudited Pro Forma Combined
Statement of Operations | 2019 | 2018 |
|
| In millions, except per share amounts | DuPont 1 | Pro Forma Adjustments2 | Pro Forma | DuPont 1 | Pro Forma Adjustments2 | Pro Forma |
| Net sales | $ | 21,512 | | $ | — | | $ | 21,512 | | $ | 22,594 | | $ | — | | $ | 22,594 | |
| Cost of sales | 14,056 | | 22 | | 14,078 | | 15,302 | | 74 | | 15,376 | |
| Research and development expenses | 955 | | — | | 955 | | 1,070 | | — | | 1,070 | |
| Selling, general and administrative expenses | 2,663 | | — | | 2,663 | | 3,028 | | — | | 3,028 | |
| Amortization of intangibles | 1,050 | | — | | 1,050 | | 1,044 | | — | | 1,044 | |
| Restructuring and asset related charges - net | 314 | | — | | 314 | | 147 | | — | | 147 | |
| Goodwill impairment charges | 1,175 | | — | | 1,175 | | — | | — | | — | |
| Integration and separation costs | 1,342 | | (173) | | 1,169 | | 1,887 | | (493) | | 1,394 | |
| Equity in earnings of nonconsolidated affiliates | 84 | | — | | 84 | | 447 | | — | | 447 | |
| Sundry income (expense) - net | 153 | | — | | 153 | | 92 | | — | | 92 | |
Interest expense | 668 | | 29 | | 697 | | 55 | | 629 | | 684 | |
(Loss) Income from continuing operations before income taxes | (474) | | 122 | | (352) | | 600 | | (210) | | 390 | |
Provision for income taxes on continuing operations | 140 | | 30 | | 170 | | 195 | | (42) | | 153 | |
(Loss) Income from continuing operations, net of tax | (614) | | 92 | | (522) | | 405 | | (168) | | 237 | |
Net income attributable to noncontrolling interests of continuing operations | 30 | | — | | 30 | | 39 | | — | | 39 | |
Net (loss) income from continuing operations attributable to DuPont | $ | (644) | | $ | 92 | | $ | (552) | | $ | 366 | | $ | (168) | | $ | 198 | |
| | | | | | |
| Per common share data: | | | | | | |
(Loss) Income per common share from continuing operations - basic | $ | (0.86) | | | $ | (0.74) | | $ | 0.46 | | | $ | 0.24 | |
(Loss) Income per common share from continuing operations - diluted | $ | (0.86) | | | $ | (0.74) | | $ | 0.45 | | | $ | 0.23 | |
| | | | | | |
Weighted-average common shares outstanding - basic | 746.3 | | | 746.3 | | 767.0 | | | 767.0 | |
Weighted-average common shares outstanding - diluted | 746.3 | | | 746.3 | | 771.8 | | | 771.8 | |
| | | | | | |
| | | | | | |
| | | | | | |
1. See the Company's historical U.S. GAAP Consolidated Statements of Operations.
2. Certain pro forma adjustments were made to illustrate the estimated effects of the DWDP Transactions, assuming that the DWDP Transactions had occurred on January 1, 2018. The adjustments include the impact to "Cost of sales" of different pricing than historical intercompany and intracompany practices related to various supply agreements entered into with the Dow Distribution, adjustments to "Integration and separation costs" to eliminate one time transaction costs directly attributable to the DWDP Distributions, and adjustments to "Interest expense" to reflect the impact of the Financings.
SEGMENT RESULTS
Prior to April 1, 2019, the Company's measure of profit / loss for segment reporting purposes is pro forma Operating EBITDA as this is the manner in which the Company's chief operating decision maker ("CODM") assessed performance and allocates resources. The Company defines pro forma Operating EBITDA as pro forma earnings (i.e. pro forma "Income (loss) from continuing operations before income taxes") before interest, depreciation, amortization, non-operating pension / other post-employment benefits (“OPEB”) / charges, and foreign exchange gains/losses, excluding the impact of costs historically allocated to the materials science and agriculture businesses that did not meet the criteria to be recorded as discontinued operations and adjusted for significant items. Effective April 1, 2019, the Company's measure of profit/loss for segment reporting purposes is Operating EBITDA as this is the manner in which the Company's chief operating decision maker ("CODM") assesses performance and allocates resources. The Company defines Operating EBITDA as earnings (i.e., “Income from continuing operations before income taxes") before interest, depreciation, amortization, non-operating pension / OPEB benefits / charges, and foreign exchange gains / losses, adjusted for significant items.
Pro forma adjustments were determined in accordance with Article 11 of Regulation S-X. Pro forma financial information is based on the Consolidated Financial Statements of DuPont, adjusted to give effect to the impact of certain items directly attributable to the DWDP Distributions, and the Term Loan Facilities, the 2018 Senior Notes and the Funding CP Issuance (together, the "DWDP Financings"), including the use of proceeds from such Financings (collectively the "DWDP Transactions"). The historical consolidated financial information has been adjusted to give effect to pro forma events that are (1) directly attributable to the DWDP Transactions, (2) factually supportable and (3) with respect to the statements of operations, expected to have a continuing impact on the results. Events that are not expected to have a continuing impact on the combined results are excluded from the pro forma adjustments. Those pro forma adjustments include the impact of various supply agreements entered into in connection with the Dow Distribution ("supply agreements") and are adjustments to "Cost of sales." The impact of these supply agreements are reflected in pro forma Operating EBITDA for the periods noted above as they are included in the measure of profit/loss reviewed by the CODM in order to show meaningful comparability among periods while assessing performance and making resource allocation decisions. Refer to the Supplemental Unaudited Pro Forma Combined Financial Information section for further information.
ELECTRONICS & IMAGING
The Electronics & Imaging segment is a leading global supplier of differentiated materials and systems for a broad range of consumer electronics including mobile devices, television monitors, personal computers and electronics used in a variety of industries. The segment is a leading provider of materials and solutions for the fabrication of semiconductors and integrated circuits, and provides innovative metallization processes for metal finishing, decorative, and industrial applications as well as films and laminate materials for a broad range of uses in printed circuit board and other electronic industry applications. Electronics & Imaging is a leading provider of photopolymer plates and platemaking systems used in flexographic printing and digital inks for textile, commercial and home-office printing applications. In addition, the segment provides cutting-edge materials for the manufacturing of rigid and flexible displays for organic light emitting diode ("OLED"), and other display applications.
| | | | | | | | | | | |
| Electronics & Imaging | For the Years Ended December 31, |
| In millions | 2020 | 2019 | 2018 |
| Net sales | $ | 3,814 | | $ | 3,554 | | $ | 3,635 | |
Operating EBITDA 1 | $ | 1,210 | | $ | 1,147 | | $ | 1,210 | |
| Equity earnings | $ | 35 | | $ | 24 | | $ | 23 | |
1.For the year ended December 31, 2019 and 2018 operating EBITDA is on a pro forma basis.
| | | | | | | | |
| Electronics & Imaging | For the Years Ended December 31, |
| Percentage change from prior year | 2020 | 2019 |
| Change in Net Sales from Prior Period due to: | | |
Local price & product mix | (1) | % | — | % |
Currency | — | | (1) | |
Volume | 8 | | (1) | |
Portfolio & other | — | | — | |
Total | 7 | % | (2) | % |
2020 Versus 2019
Electronics & Imaging net sales were $3,814 million for the year ended December 31, 2020, up from $3,554 million for the year ended December 31, 2019. Net sales increased due to a 8 percent volume increase partially offset by a 1 percent decrease in local price. Volume growth was driven by Semiconductor Technologies with continued strength and new technology in logic and foundry and increased demand in the memory segment. Volume growth within Interconnect Solutions was driven by increased material content in next-generation smartphones. Within Image Solutions, volume growth in OLED materials for displays and digital printing inks for the consumer segment offset weakness in flexographic plates and commercial printing and textile inks. Volume grew significantly in Asia Pacific.
Operating EBITDA was $1,210 million for the year ended December 31, 2020, up 5 percent compared with pro forma Operating EBITDA of $1,147 million for the year ended December 31, 2019 as volume growth, productivity and higher equity income more than offset higher raw material logistic costs and lower gains related to asset sales.
2019 Versus 2018
Electronics & Imaging net sales were $3,554 million for the year ended December 31, 2019, down from $3,635 million for the year ended December 31, 2018 due to a 1 percent volume decline and a 1 percent unfavorable currency impact, primarily in Asia Pacific and EMEA. Volume decreased overall as Semiconductor Technologies and Interconnect Solutions declines more than offset volume gains in Image Solutions. Within Semiconductor Technologies, weakened demand in the memory sector was partially offset by increased volumes related to semiconductor packaging materials. Demand for advanced materials for smartphones remained strong but overall volumes in Interconnect Solutions were down due to soft circuit board demand. Volume growth in Image Solutions reflects increased demand for OLED materials partially offset by volume declines in flexographic printing.
Pro forma Operating EBITDA was $1,147 million for the year ended December 31, 2019, down 5 percent compared with $1,210 million for the year ended December 31, 2018, as higher raw material costs, volume declines and an unfavorable currency impact more than offset cost synergies and income associated with an asset sale.
NUTRITION & BIOSCIENCES
The Nutrition & Biosciences segment is an innovation-driven and customer-focused segment that provides solutions for the global food and beverage, dietary supplements, pharma, home and personal care, energy, and animal nutrition markets. The segment is one of the world's largest producers of specialty ingredients, developing and manufacturing solutions for the global food and beverage, dietary supplements and pharmaceutical markets. Additionally, the segment is an industry pioneer and innovator that works with customers to improve the performance, productivity and sustainability of their products and processes, through differentiated technology in ingredients applications, fermentation, biotechnology, chemistry and manufacturing process excellence.
| | | | | | | | | | | |
| Nutrition & Biosciences | For the Years Ended December 31, |
| In millions | 2020 | 2019 | 2018 |
| Net sales | $ | 6,059 | | $ | 6,076 | | $ | 6,216 | |
Operating EBITDA 1 | $ | 1,523 | | $ | 1,406 | | $ | 1,420 | |
| Equity earnings | $ | 4 | | $ | (1) | | $ | (1) | |
1.For the year ended December 31, 2019 and 2018 operating EBITDA is on a pro forma basis.
| | | | | | | | |
| Nutrition & Biosciences | For the Years Ended December 31, |
| Percentage change from prior year | 2020 | 2019 |
| Change in Net Sales from Prior Period due to: | | |
Local price & product mix | 1 | % | 1 | % |
Currency | (1) | | (2) | |
Volume | — | | — | |
Portfolio & other | — | | (1) | |
Total | — | % | (2) | % |
2020 Versus 2019
Nutrition & Biosciences net sales were $6,059 million for the year ended December 31, 2020, or essentially flat compared with $6,076 million for the year ended December 31, 2019. A 1 percent increase in local price was offset by a 1 percent unfavorable currency impact. Volume remained flat. Food & Beverage volume declined due to decreased demand in food service and sweeteners, partially offset by higher demand for plant-based meat. Health & Biosciences volume gains were driven by probiotics along with strong demand in home & personal care and animal nutrition, offset by declined demand in biorefinery and microbial control. Pharma Solutions volume gains were driven by increased demand in key products.
Operating EBITDA was $1,523 million for the year ended December 31, 2020, up 8 percent compared with pro forma Operating EBITDA of $1,406 million for the year ended December 31, 2019 due to a cost productivity actions, favorable product mix led by Health & Biosciences, and pricing gains.
2019 Versus 2018
Nutrition & Biosciences net sales were $6,076 million for the year ended December 31, 2019, down from $6,216 million for the year ended December 31, 2018, due to a 2 percent unfavorable currency impact, primarily in EMEA and Latin America, and a 1 percent decrease from portfolio actions partially offset by a 1 percent increase in local price. Volume was flat year over year as volume gains in Food & Beverage, primarily in cellulosics from growing demand in the meat alternatives and high protein nutritional beverages, was offset by declines in Health & Biosciences due to continued market-driven softness in biorefineries and decreased volume related to home and personal care applications which were partially offset by strength in food enzymes.
Pro forma Operating EBITDA was $1,406 million for the year ended December 31, 2019, down 1 percent compared with $1,420 million for the year ended December 31, 2018 as unfavorable impacts related to product mix and currency were partially offset by cost synergies, productivity actions and pricing gains.
TRANSPORTATION & INDUSTRIAL
The Transportation & Industrial segment provides high-performance engineering resins, adhesives, silicones, lubricants and parts to engineers and designers in the transportation, electronics, healthcare, industrial and consumer end-markets to enable systems solutions for demanding applications and environments. The segment delivers a broad range of polymer-based high-performance materials in its product portfolio, including elastomers and thermoplastic and thermoset engineering polymers which are used by customers to fabricate components for mechanical, chemical and electrical systems. In addition, the segment produces innovative engineering polymer solutions, high performance parts, specialty silicones and differentiated adhesive technologies to meet customer specifications in automotive, aerospace, electronics, industrial, healthcare and consumer markets. Transportation & Industrial is a global leader of advanced materials that provide technologies that differentiate customers’ products with improved performance characteristics enabling the transition to hybrid-electric-connected vehicles, high speed high frequency connectivity and smart healthcare.
| | | | | | | | | | | |
Transportation & Industrial | For the Years Ended December 31, |
| In millions | 2020 | 2019 | 2018 |
| Net sales | $ | 4,189 | | $ | 4,950 | | $ | 5,422 | |
Operating EBITDA 1 | $ | 916 | | $ | 1,313 | | $ | 1,518 | |
| Equity earnings | $ | 4 | | $ | 4 | | $ | 1 | |
1.For the year ended December 31, 2019 and 2018 operating EBITDA is on a pro forma basis.
| | | | | | | | |
Transportation & Industrial | For the Years Ended December 31, |
| Percentage change from prior year | 2020 | 2019 |
| Change in Net Sales from Prior Period due to: | | |
Local price & product mix | (4) | % | 3 | % |
Currency | — | | (2) | |
Volume | (11) | | (10) | |
Portfolio & other | — | | — | |
Total | (15) | % | (9) | % |
2020 Versus 2019
Transportation & Industrial net sales were $4,189 million for the year ended December 31, 2020, down from $4,950 million for the year ended December 31, 2019 due to a 11 percent decrease in volume and a 4 percent decrease in local price. Volume declines were due to the impact of the COVID-19 pandemic on the automotive industry and the other key industrial markets.
Operating EBITDA was $916 million for the year ended December 31, 2020, down 30 percent compared with pro forma Operating EBITDA of $1,313 million for the year ended December 31, 2019 driven primarily by price and volume declines due to the COVID-19 pandemic and approximately $170 million in charges associated with temporarily idling several manufacturing plants to align supply with demand.
2019 Versus 2018
Transportation & Industrial net sales were $4,950 million for the year ended December 31, 2019, down from $5,422 million for the year ended December 31, 2018. The change in net sales was due to a 10 percent decrease in volume and a 2 percent unfavorable currency impact, primarily in EMEA and Asia Pacific, which more than offset a 3 percent increase in local price. Volume declines were primarily due to destocking in the automotive channel and decreased demand in automotive and electronics markets in Asia Pacific and EMEA. Local price increased across all regions and primarily in Mobility Solutions.
Pro forma Operating EBITDA was $1,313 million for the year ended December 31, 2019, down 14 percent compared with $1,518 million for the year ended December 31, 2018 as volume declines, higher raw material costs and an unfavorable currency impact were partially offset by pricing gains and cost synergies.
SAFETY & CONSTRUCTION
Safety & Construction is the global leader in providing innovative engineered products and integrated systems for a number of industries including, worker safety, water purification and separation, transportation, energy, medical packaging and building materials. Safety & Construction addresses the growing global needs of businesses, governments and consumers for solutions that make life safer, healthier and better. By uniting market-driven science and engineering with the strength of highly regarded brands, the segment strives to bring new products and solutions to solve customers' needs faster, better and more cost effectively.
| | | | | | | | | | | |
| Safety & Construction | For the Years Ended December 31, |
| In millions | 2020 | 2019 | 2018 |
| Net sales | $ | 4,993 | | $ | 5,201 | | $ | 5,294 | |
Operating EBITDA 1 | $ | 1,351 | | $ | 1,419 | | $ | 1,283 | |
| Equity earnings | $ | 26 | | $ | 27 | | $ | 24 | |
1.For the year ended December 31, 2019 and 2018 operating EBITDA is on a pro forma basis.
| | | | | | | | |
| Safety & Construction | For the Years Ended December 31, |
| Percentage change from prior year | 2020 | 2019 |
| Change in Net Sales from Prior Period due to: | | |
Local price & product mix | 2 | % | 3 | % |
Currency | — | | (1) | |
Volume | (8) | | — | |
Portfolio & other | 2 | | (4) | |
Total | (4) | % | (2) | % |
2020 Versus 2019
Safety & Construction net sales were $4,993 million for the for the year ended December 31, 2020, down from $5,201 million for the year ended December 31, 2019 as a 2 percent increase in local price and 2 percent increase in portfolio were more than offset by a 8 percent volume decline. The portfolio impact reflects the recent acquisitions in the Water Solutions business. Volume growth in the segment was led by gains in Water Solutions and TYVEK® protective garment sales within Safety Solutions which were more than offset by weakened demand in end markets for NOMEX® and KEVLAR®. Shelter Solutions volume declined due to the COVID-19 pandemic and the resulting impact on commercial construction activity.
Operating EBITDA was $1,351 million for the year ended December 31, 2020, down 5 percent compared with pro forma Operating EBITDA of $1,419 million for the year ended December 31, 2019 due to lower volumes, the absence of licensing income, and costs associated with idling facilities more than offsetting pricing gains, improved product mix, and productivity actions.
2019 Versus 2018
Safety & Construction net sales were $5,201 million for the year ended December 31, 2019, down from $5,294 million for the year ended December 31, 2018 as portfolio declines of 4 percent and a 1 percent unfavorable impact from currency in all regions more than offset a 3 percent increase in local price. The portfolio impact reflects the prior year divestiture of the European XPS STYROFOAM™ business on December 1, 2018. Local price increased across all businesses and in all regions.
Volume was flat compared with the prior year as volume growth in Water Solutions was offset by declines in Safety Solutions and Shelter Solutions. Water Solutions volume gains were driven by strong demand for ion exchange and reverse osmosis membranes mainly in the industrial market. Safety Solutions volume declined as a result of supply constraints and planned maintenance downtime which more than offset TYVEK® volume gains from increased demand in the personal protection market. Volume declines in Shelter Solutions were primarily due to weakness in the construction market.
Pro forma Operating EBITDA was $1,419 million for the year ended December 31, 2019, up 11 percent compared with $1,283 million for the year ended December 31, 2018 due to local price gains, cost synergies, productivity improvements and volume gains partially offset by an unfavorable impact from currency.
NON-CORE
The Non-Core segment is a leading global supplier of key materials for the manufacturing of photovoltaic cells and panels, including innovative metallization pastes, backsheet materials and silicone encapsulants and adhesives. The segment provides materials used in components and films for consumer electronics, automotive, and aerospace markets. Additionally, the segment provides sustainable materials and services for sulfuric acid production and regeneration technologies, alkylation technology for production of clean, high-octane gasoline, and a comprehensive suite of aftermarket service and solutions offerings, including safety consulting and services, to improve the safety, productivity, and sustainability of organizations across a range of industries. The Non-Core segment is also a leading producer of specialty biotechnology materials for carpet and apparel markets as well as polyester films for the healthcare, photovoltaics, electronics, packaging and labels, and electrical insulation industries. Until its sale in the third quarter of 2020, the segment also includes the Company's share of the results of the HSC Group, a U.S.-based group of companies that manufacture and sell polycrystalline silicon products for the photovoltaic and semiconductor industries.
| | | | | | | | | | | |
| Non-Core | For the Years Ended December 31, |
| In millions | 2020 | 2019 | 2018 |
| Net sales | $ | 1,342 | | $ | 1,731 | | $ | 2,027 | |
Operating EBITDA 1 | $ | 168 | | $ | 512 | | $ | 702 | |
Equity earnings 2 | $ | 122 | | $ | 258 | | $ | 400 | |
1. For the year ended December 31, 2019 and 2018 operating EBITDA is on a pro forma basis.
2. Excludes a net charge primarily related to a joint venture in the Non-Core segment.
| | | | | | | | |
| Non-Core | For the Years Ended December 31, |
| Percentage change from prior year | 2020 | 2019 |
| Change in Net Sales from Prior Period due to: | | |
Local price & product mix | 3 | % | 1 | % |
Currency | — | | (2) | |
Volume | (14) | | (11) | |
Portfolio & other | (11) | | (3) | |
Total | (22) | % | (15) | % |
2020 Versus 2019
Non-Core net sales were $1,342 million for the year ended December 31, 2020, down from $1,731 million for the year ended December 31, 2019 due to a 14 percent decrease in volume and an 11 percent portfolio decline which more than offset a 3 percent increase in local price. The portfolio decline was driven by the third quarter 2020 sale of the trichlorosilane ("TCS") business within Photovoltaic & Advanced Materials and the third quarter 2019 sale of the Sustainable Solutions business. Volume declines were driven by declines in demand for trichlorosilanes, TEDLAR® aircraft films, biomaterials due to weakened demand in carpet and apparel markets, and lower volumes in Clean Technologies.
Operating EBITDA was $168 million for the year ended December 31, 2020, down 67 percent compared with pro forma Operating EBITDA of $512 million for the year ended December 31, 2019 due to declines in customer settlements, volume declines, the absence of the gain on the sale of the Sustainable Solutions business, and the absence of earnings from the Sustainable Solutions, TCS, and HSC businesses.
2019 Versus 2018
Non-Core net sales were $1,731 million for the year ended December 31, 2019, down from $2,027 million for the year ended December 31, 2018 due to a 11 percent decrease in volume, a 3 percent portfolio decline and a 2 percent unfavorable impact from currency, primarily in Asia Pacific, which more than offset a 1 percent increase in local price. Portfolio declines were due to the sale of the Sustainable Solutions business in the third quarter of 2019. Volume declines in Photovoltaic & Advanced Materials were driven by weak demand for trichlorosilanes due to low polysilicon production and lower paste sales in electronic component end markets. Biomaterials volume declines were primarily a result of a slow-down in demand in the carpet and apparel markets.
Pro forma Operating EBITDA was $512 million for the year ended December 31, 2019, down 27 percent compared with $702 million for the year ended December 31, 2018 as a result of volume declines, lower HSC Group equity earnings due to lower customer settlements, and unfavorable impacts from currency and portfolio actions, which were partially offset by cost synergies and a gain on the sale of the Sustainable Solutions business.
LIQUIDITY & CAPITAL RESOURCES
The Company continually reviews its sources of liquidity and debt portfolio and may make adjustments to one or both to ensure adequate liquidity and increase the Company’s optionality and financing efficiency as it relates to financing cost and balancing terms/maturities. The Company’s primary source of incremental liquidity is cash flows from operating activities. COVID-19 continues to impact the broader global economy, including negatively impacting economic growth and creating disruption and volatility in the global financial and capital markets, which could result in increases in the cost of capital and/or adversely impact the availability of and access to capital, which could negatively affect DuPont’s liquidity. Management expects the generation of cash from operations and the ability to access the debt capital markets and other sources of liquidity will continue to provide sufficient liquidity and financial flexibility to meet the Company’s and its subsidiaries obligations as they come due; however, DuPont is unable to predict the extent of COVID-19 related impacts which depends on highly uncertain and unpredictable future developments, including the duration and spread of the COVID-19 outbreak, and the speed and extent of the resumption of normal economic and operating conditions. In light of this uncertainty, the Company has taken steps to further ensure liquidity and capital resources, as discussed below.
| | | | | | | | |
| In millions | December 31, 2020 | December 31, 2019 |
Cash and cash equivalents 1 | $ | 2,544 | | $ | 1,540 | |
Total debt 2 | $ | 21,811 | | $ | 17,447 | |
1.The net proceeds of approximately $6.2 billion from the N&B Notes Offering were recorded within non-current “Restricted cash” in the Consolidated Balance Sheets at December 31, 2020 and thus are not included in "Cash and cash equivalents" as presented in the table above.
2.This includes $6.25 billion of debt obligations associated with the N&B Notes Offering.
The Company's cash and cash equivalents at December 31, 2020 and December 31, 2019 were $2.5 billion and $1.5 billion, respectively, of which $1.8 billion at December 31, 2020 and $1.4 billion at December 31, 2019 were held by subsidiaries in foreign countries, including United States territories. For each of its foreign subsidiaries, the Company makes an assertion regarding the amount of earnings intended for permanent reinvestment, with the balance available to be repatriated to the United States.
Total debt at December 31, 2020 and December 31, 2019 was $21.8 billion and $17.4 billion, respectively. The increase was primarily due to the N&B Notes Offering and the May Debt Offering. This increase was partially offset by the repayment of the notes due in November 2020 and a decline in commercial paper.
As of December 31, 2020, the Company is contractually obligated to make future cash payments of $21,958 million and $9,235 million associated with principal and interest, respectively, on debt obligations. Related to the principal balance, $5 million will be due in the next twelve months and the remainder will be due subsequent to 2021. Related to interest, $754 million will be due in the next twelve months and the remainder will be due subsequent to 2021. The majority of interest obligations will be due in 2026 or later. The obligations associated with the N&B Notes Offering were separated from the Company on February 1, 2021, upon consummation of the N&B Transaction. This resulted in $6,250 million of principal, mostly due subsequent to 2025, and related $2,637 million of future interest obligations being separated from the Company.
Term Loan and Revolving Credit Facilities
In November 2018, the Company entered into a term loan agreement that establishes two term loan facilities in the aggregate principal amount of $3 billion, (the “Term Loan Facilities”) as well as a five-year $3 billion revolving credit facility (the “Five-Year Revolving Credit Facility”). Effective May 2, 2019, the Company fully drew the two Term Loan Facilities in the aggregate principal amount of $3 billion and the Five-Year Revolving Credit Facility became effective and available. The Five-Year Revolving Credit Facility is generally expected to remain undrawn, and serve as a backstop to the Company’s commercial paper and letter of credit issuance. In June 2019, the Company entered into a 364-day $750 million revolving credit facility (the “Old 364-Day Revolving Credit Facility”).
In April 2020, the Company entered into a $1 billion 364-day revolving credit facility (the “$1B Revolving Credit Facility"). The $1B Revolving Credit Facility replaced the Old 364-Day Revolving Credit Facility, improving the Company’s liquidity position in response to near term uncertainties. As of the effectiveness of the $1B Revolving Credit Facility, the Old 364-Day Revolving Credit Facility was terminated. The $1B Revolving Credit facility may be used for general corporate purposes.
On February 1, 2021, the Company terminated its fully drawn $3 billion Term Loan Facilities. The termination triggered the repayment of the aggregate outstanding principal amount of $3 billion, plus accrued and unpaid interest through and including January 31, 2021. The Company funded the repayment with proceeds from the Special Cash Payment.
May Debt Offering
On May 1, 2020, the Company completed an underwritten public offering of senior unsecured notes (the “May 2020 Notes”) in the aggregate principal amount of $2 billion of 2.169 percent fixed rate Notes due May 1, 2023 (the “May Debt Offering”). The proceeds from the May Debt Offering were used by the Company to repay the Company’s $0.5 billion in floating rate notes due November 2020 and $1.5 billion of 3.77 percent fixed-rate notes due November 2020. Upon consummation of the N&B Transaction, the special mandatory redemption feature of the May Debt Offering was triggered, requiring the Company to redeem all of the May 2020 Notes at a redemption price equal to 100% of the aggregate principal amount of the May 2020 Notes plus accrued and unpaid interest. The Company intends to redeem the May 2020 Notes in May 2021 and will fund the redemption with proceeds from the Special Cash Payment.
Commercial Paper
In April 2019, DuPont authorized a $3 billion commercial paper program (the “DuPont Commercial Paper Program”). At December 31, 2020, the Company had no issuances outstanding of commercial paper ($1.8 billion at December 31, 2019). The Company’s issuance under the Commercial Paper Program in 2019 included the issuance of $1.4 billion (the “Funding CP Issuance”) in May 2019 in anticipation of the Corteva Distribution, as well as borrowings for general corporate purposes.
Nutrition & Biosciences Financing
In January 2020, N&B entered into a senior unsecured term loan agreement in the amount of $1.25 billion split evenly between three- and five-year facilities ("N&B Term Loan Facilities").
On September 16, 2020 (the “Offering Date”), N&B completed an offering in the aggregate principal amount of $6.25 billion of senior unsecured notes in six series, comprised of the following (collectively, the “N&B Notes Offering" and together with the N&B Term Loan Facilities, the “Permanent Financing”): $300 million aggregate principal amount of 0.697% Senior Notes due 2022; $1.0 billion aggregate principal amount of 1.230% Senior Notes due 2025; $1.2 billion aggregate principal amount of 1.832% Senior Notes due 2027; $1.5 billion aggregate principal amount of 2.300% Senior Notes due 2030; $750 million aggregate principal amount of 3.268% Senior Notes due 2040; and $1.5 billion aggregate principal amount of 3.468% Senior Notes due 2050. The net proceeds of approximately $6.2 billion from the N&B Notes Offering were deposited into an escrow account.
On February 1, 2021, upon consummation of the N&B Transaction, the proceeds from the Permanent Financing were used to make the Special Cash Payment and to pay the related financing fees and expenses. At this time, the net proceeds from the N&B Notes Offering were released from escrow. The obligations and liabilities associated with the Permanent Financing were also separated from the Company upon consummation of the N&B Transaction.
Credit Ratings
The Company's credit ratings impact its access to the debt capital markets and cost of capital. The Company remains committed to maintaining a strong financial position with a balanced financial policy focused on maintaining a strong investment-grade rating and driving shareholder value and remuneration. At January 31, 2021, DuPont's credit ratings were as follows:
| | | | | | | | | | | |
| Credit Ratings | Long-Term Rating | Short-Term Rating | Outlook |
| Standard & Poor’s | BBB+ | A-2 | Stable |
| Moody’s Investors Service | Baa1 | P-2 | Stable |
| Fitch Ratings | BBB+ | F-2 | Stable |
The Company's indenture covenants include customary limitations on liens, sale and leaseback transactions, and mergers and consolidations, subject to certain limitations. The 2018 Senior Notes also contain customary default provisions. The Term Loan Facilities, the Five-Year Revolving Credit Facility and the $1B Revolving Credit Facility contain a financial covenant, typical for companies with similar credit ratings, requiring that the ratio of Total Indebtedness to Total Capitalization for the Company and its consolidated subsidiaries not exceed 0.60. At December 31, 2020, the Company was in compliance with this financial covenant.
Summary of Cash Flows
The Company’s cash flows from operating, investing and financing activities, as reflected in the Consolidated Statements of Cash Flows, are summarized in the following table. The cash flows related to the materials science and agriculture businesses have not been segregated and are included in the Consolidated Statements of Cash Flows for the years ended December 31, 2019 and 2018.
| | | | | | | | | | | |
Cash Flow Summary | 2020 | 2019 | 2018 |
In millions |
| Cash provided by (used for): | | | |
Operating activities | $ | 4,095 | | $ | 1,409 | | $ | 4,731 | |
Investing activities | $ | (202) | | $ | (2,313) | | $ | (2,462) | |
Financing activities | $ | 3,238 | | $ | (11,550) | | $ | (1,918) | |
Effect of exchange rate changes on cash, cash equivalents and restricted cash | $ | 67 | | $ | 9 | | $ | (344) | |
Cash, cash equivalents and restricted cash in discontinued operations | $ | — | | $ | — | | $ | 5,431 | |
| | | |
| | | |
| | | |
| | | |
| | | |
| | | |
Cash Flows from Operating Activities
Cash provided by operating activities was $4,095 million and $1,409 million for the years ended December 31, 2020 and 2019, respectively. Cash provided by operating activities increased in 2020 compared with 2019, primarily due to a release of cash from net working capital in 2020 versus a use of cash for net working capital in the prior period, partially offset by lower earnings versus the prior period. Cash provided by operating activities for the year ended December 31, 2018 was $4,731 million. Cash provided by operating activities decreased in 2019 compared to 2018, primarily driven by the impact of the DWDP Distributions of the materials science and agriculture businesses to period earnings, partially offset by a decrease in the use of cash for net working capital versus the prior period.
| | | | | | | | |
Net Working Capital | December 31, 2020 | December 31, 2019 |
In millions (except ratio) |
Current assets | $ | 10,877 | | $ | 9,999 | |
Current liabilities | 4,699 | | 8,346 | |
| Net working capital | $ | 6,178 | | $ | 1,653 | |
| Current ratio | 2.31:1 | 1.20:1 |
Cash Flows from Investing Activities
Cash used for investing activities in 2020 was $202 million compared to cash used for investing of $2,313 million in 2019. The decrease in cash used was primarily attributable to lower capital expenditures and an increase in proceeds from sales of property and businesses, partially offset by a decrease in proceeds from sales and maturities of investments. Cash used for investing activities in 2018 was $2,462 million primarily driven by capital expenditures and purchases of investments, which were partially offset by proceeds from sales and maturities of investments and proceeds from interests in trade accounts receivable conduits.
Capital expenditures totaled $1,194 million for the year ended December 31, 2020, $2,472 million for the year ended December 31, 2019, and $3,837 million for the year ended December 31, 2018. The Company expects 2021 capital expenditures to be approximately $825 million. The Company may adjust its spending throughout the year as economic conditions develop.
Cash Flows from Financing Activities
Cash provided by financing activities in 2020 was $3,238 million compared to cash used by financing activities of $11,550 million in 2019. The difference in cash flows from financing activities in 2020 versus the prior year is primarily driven by the increase in proceeds from the issuance of long-term debt, largely related to the N&B Transaction, as well as the impact of the DWDP Distributions of the materials science and agriculture businesses to cash balances in 2019, partially offset by the increased use of cash in decreasing short-term notes payable. Cash used for financing activities in 2018 was $1,918 million. The primary driver of the difference in cash used for financing activities between 2019 and 2018 is the increased proceeds in issuance of long-term debt in 2018 and the impact of the DWDP Distributions of the materials science and agriculture businesses to cash balances in 2019.
Dividends
The following table provides dividends paid to common shareholders for the years ended December 31, 2020, 2019, and 2018:
| | | | | | | | | | | |
Dividends Paid | December 31, 2020 | December 31, 2019 | December 31, 2018 |
| In millions |
| Dividends paid, per common share | $ | 1.20 | | $ | 2.16 | | $ | 4.56 | |
Dividends paid to common stockholders 1 | $ | 882 | | $ | 1,611 | | $ | 3,491 | |
1.The 2019 and 2018 dividends include dividends paid to DowDuPont common stockholders prior to the DWDP Distributions.
Share Buyback Programs
On June 1, 2019, the Company's Board of Directors authorized a $2 billion share buyback program, which expires on June 1, 2021. As of December 31, 2020, the Company had repurchased 16.9 million shares under this program since inception at a total cost of $982 million, including 6.1 million shares repurchased and retired for $232 million during the year ended December 31, 2020.
Under this program, the Company has remaining authorization to repurchase and retire about $1 billion of its common stock in the open market or privately negotiated deals. The timing and amount of any share repurchases will be determined by the Company based on its evaluation of market conditions and other factors.
See Part II, Item 5. Market for Registrant's Common Equity, Related Stockholder Matters and Issuer Purchases of Equity Securities and Note 17 to the Consolidated Financial Statements, for additional information.
Pension and Other Post-Employment Plans
TDCC and EID did not merge their pension plans and other post-employment benefit plans as a result of the DWDP Merger. TDCC and EID had defined benefit pension plans in the United States and a number of other countries. Subsequent to the DWDP Distributions, the Company retained defined benefit pension plans in a number of other countries but does not have any qualified defined benefit pension plan in the United States.
The Company's funding policy is to contribute to defined benefit pension plans based on pension funding laws and local country requirements. Contributions exceeding funding requirements may be made at the Company's discretion. The Company expects to contribute approximately $100 million to its pension plans in 2021. The amount and timing of the Company’s actual future contributions will depend on applicable funding requirements, discount rates, investment performance, plan design, and various other factors, separations and distributions. See Note 19 to the Consolidated Financial Statements for additional information concerning the Company’s pension plans.
TDCC's funding policy was to contribute to plans when pension laws and/or economics either require or encourage funding. Prior to the Dow Distribution, TDCC made discretionary contributions exceeding funding requirements. In 2018 TDCC contributed $1,656 million to its pension plans, including contributions to fund benefit payments for its non-qualified pension plans. In the third quarter of 2018, TDCC made $1,100 million discretionary contributions to their principal U.S. pension plans, which are included in the 2018 contribution amounts above. The discretionary contributions were based on TDCC's funding policies, which permit discretionary contributions to defined benefit pension plans when economics encourage funding, and reflected considerations relating to tax deductibility and capital structure. During the three months of 2019, TDCC made contributions of $103 million to TDCC plans that were separated with Dow after the DWDP Distributions.
As of December 31, 2020, the Company is contractually obligated to make future cash payments of $1,416 million related to pension and other post-employment benefit plans. $106 million will be due in the next twelve months and the remainder will be due subsequent to 2021 with the majority due subsequent to 2025.
EID's funding policy was to contribute to defined benefit pension plans based on pension funding laws and local country requirements. Prior to the Corteva Distribution, EID made discretionary contributions exceeding funding requirements. EID contributed $1,308 million, including discretionary contributions of $1,100 million to its principal U.S. pension plans in 2018. These contributions included contributions to fund benefit payments for non-qualified pension plans. The discretionary contributions were based on EID's funding policies, which permit discretionary contributions to defined benefit pension plans when economics encourage funding, and reflected considerations relating to tax deductibility and capital structure. During the five months of 2019, EID made $36 million contributions to plans that were separated from the Company in conjunction with the Corteva Distribution.
Restructuring
In March 2020, the Company approved restructuring actions designed to capture near-term cost reductions and to further simplify certain organizational structures in anticipation of the N&B Transaction. As a result of these actions, the Company recorded pre-tax restructuring charges of $179 million inception-to-date, consisting of severance and related benefit costs of $129 million and asset related charges of $50 million. Actions associated with the 2020 Restructuring Program are considered substantially complete. Future cash payments related to the 2020 Restructuring Program are anticipated to be $68 million primarily related to the payment of severance and related benefits.
In June 2019, DuPont approved restructuring actions to simplify and optimize certain organizational structures following the completion of the DWDP Distributions. As a result of these actions, the Company has recorded pre-tax restructuring charges of $140 million inception-to-date, consisting of severance and related benefit costs of $106 million, and asset related charges of $34 million. Actions associated with this program are considered substantially complete. Future cash payments related to the 2019 Restructuring Program are anticipated to be $18 million and relate to the payment of severance and related benefits.
In September and November 2017, the Company approved post-merger restructuring actions under the DowDuPont Cost Synergy Program, adopted by the DowDuPont Board of Directors. The Synergy Program was designed to integrate and optimize the organization following the DWDP Merger and in preparation for the DWDP Distributions whereby the Company has recorded pre-tax restructuring charges attributable to the continuing operations of DuPont of $492 million inception-to-date, consisting of severance and related benefit costs of $213 million, asset related charges of $212 million and contract termination and other charges of $67 million. The activities related to the Synergy Program are expected to result in additional cash expenditures of $20 million and relate primarily to the payment of severance and related benefit costs. Actions associated with the Synergy Program, including employee separations, are considered substantially complete.
See Note 5 to the Consolidated Financial Statements for more information on the Company's restructuring programs.
Other Off-balance Sheet Arrangements
Certain Guarantee Contracts
Guarantees arise in the ordinary course of business from relationships with customers and nonconsolidated affiliates when the Company undertakes an obligation to guarantee the performance of others if specific triggering events occur. At December 31, 2020 and December 31, 2019, the Company had directly guaranteed $189 million and $187 million, respectively, of such obligations. Additional information related to the guarantees of the Subsidiaries can be found in the “Guarantees” section of Note 15 to the Consolidated Financial Statements.
The MOU Cost Sharing Agreement
In connection with the cost sharing arrangement entered into as part of the MOU, the companies agreed to establish an escrow account to address potential future PFAS costs. Subject to the terms of the arrangement, contributions to the escrow account will be made by Chemours, DuPont and Corteva, annually over an eight-year period. Over such period, Chemours will deposit a total of $500 million into the account and DuPont and Corteva, together, will deposit an additional $500 million pursuant to the terms of their existing Letter Agreement.
The Company is contractually obligated to make deposits to the escrow account of $50 million no later than September 30, 2021. Additional information regarding the MOU and funding of the escrow account can be found in Note 15 to the Consolidated Financial Statements.
Other Contractual Obligations
As of December 31, 2020, the Company is contractually obligated to make future cash payments of $1,191 million and $809 million related to purchase and lease obligations, respectively. Related to purchases, $372 million will be due in the next twelve months and the remainder will be due subsequent to 2021. Related to leases, $186 million will be due in the next twelve months and remainder will be due subsequent to 2021.
As of December 31, 2020, the Company is contractually obligated to make future cash payments of $188 million related to other miscellaneous obligations, the majority of which is due subsequent to 2021.
OUTLOOK
In 2021, the Company expects demand to remain strong for semiconductors, smartphones, protective garments, water and residential construction, along with continued improvements in automotive markets. This anticipated strong demand, along with benefits from our continued cost actions, are expected to drive earnings improvement. In addition, the Company is expected to benefit from a lower share count resulting from the Exchange Offer and lower interest expense resulting from the pay down of Commercial Paper and the pay down of the Term Loan Facilities and May 2020 Notes, both funded by proceeds from the Special Cash Payment.
RECENT ACCOUNTING PRONOUNCEMENTS
See Note 2 to the Consolidated Financial Statements for a description of recent accounting pronouncements.
CRITICAL ACCOUNTING ESTIMATES
The Company's significant accounting policies are more fully described in Note 1 to the Consolidated Financial Statements. Management believes that the application of these policies on a consistent basis enables the Company to provide the users of the financial statements with useful and reliable information about the Company's operating results and financial condition.
The preparation of the Consolidated Financial Statements in conformity with generally accepted accounting principles ("GAAP") in the United States of America requires management to make estimates and assumptions that affect the reported amounts, including, but not limited to, receivable and inventory valuations, impairment of tangible and intangible assets, long-term employee benefit obligations, income taxes, restructuring liabilities, environmental matters and litigation. Management's estimates are based on historical experience, facts and circumstances available at the time and various other assumptions that are believed to be reasonable. The Company reviews these matters and reflects changes in estimates as appropriate. Management believes that the following represent some of the more critical judgment areas in the application of the Company's accounting policies which could have a material effect on the Company's financial position, liquidity or results of operations.
Pension Plans
Accounting for employee benefit plans involves numerous assumptions and estimates. Discount rate and expected return on plan assets are two critical assumptions in measuring the cost and benefit obligation of the Company's pension plans. Management reviews these two key assumptions when plans are re-measured. These and other assumptions are updated periodically to reflect the actual experience and expectations on a plan specific basis as appropriate. As permitted by GAAP, actual results that differ from the assumptions are accumulated on a plan by plan basis and to the extent that such differences exceed 10 percent of the greater of the plan's benefit obligation or the applicable plan assets, the excess is amortized over the average remaining service period of active employees or the average remaining life expectancy of the inactive participants if all or almost all of a plan’s participants are inactive.
For the majority of the benefit plans, the Company utilizes the Aon AA corporate bond yield curves to determine the discount rate, applicable to each country, at the measurement date.
The Company establishes strategic asset allocation percentage targets and appropriate benchmarks for significant asset classes in accordance with the laws and practices of those countries. Where appropriate, asset-liability studies are also taken into consideration. For plans, the long-term expected return on plan assets pension expense is determined using the fair value of assets.
The following table highlights the potential impact on the Company's pre-tax earnings due to changes in certain key assumptions with respect to the Company's pension plans based on assets and liabilities at December 31, 2020:
| | | | | | | | |
Pre-tax Earnings Benefit (Charge)
(Dollars in millions) | 1/4 Percentage
Point
Increase | 1/4 Percentage
Point
Decrease |
| Discount rate | $ | (1) | | $ | (2) | |
| Expected rate of return on plan assets | 10 | | (10) | |
Additional information with respect to pension plans, liabilities and assumptions is discussed under "Long-term Employee Benefits" beginning on page 57 and in Note 19 to the Consolidated Financial Statements.
Legal Contingencies
The Company's results of operations could be affected by significant litigation adverse to the Company, including product liability claims, patent infringement and antitrust claims, and claims for third party property damage or personal injury stemming from alleged environmental torts. The Company records accruals for legal matters when the information available indicates that it is probable that a liability has been incurred and the amount of the loss can be reasonably estimated. Management makes adjustments to these accruals to reflect the impact and status of negotiations, settlements, rulings, advice of counsel and other information and events that may pertain to a particular matter. Predicting the outcome of claims and lawsuits and estimating related costs and exposure involves substantial uncertainties that could cause actual costs to vary materially from estimates. In making determinations of likely outcomes of litigation matters, management considers many factors. These factors include, but are not limited to, the nature of specific claims including unasserted claims, the Company's experience with similar types of claims, the jurisdiction in which the matter is filed, input from outside legal counsel, the likelihood of resolving the matter through alternative dispute resolution mechanisms, and the matter's current status. Considerable judgment is required in determining whether to establish a litigation accrual when an adverse judgment is rendered against the Company in a court proceeding. In such situations, the Company will not recognize a loss if, based upon a thorough review of all relevant facts and information, management believes that it is probable that the pending judgment will be successfully overturned on appeal. A detailed discussion of significant litigation matters is contained in Note 15 to the Consolidated Financial Statements.
Income Taxes
The breadth of the Company's operations and the global complexity of tax regulations require assessments of uncertainties and judgments in estimating taxes the Company will ultimately pay. The final taxes paid are dependent upon many factors, including negotiations with taxing authorities in various jurisdictions, outcomes of tax litigation and resolution of disputes arising from federal, state and international tax audits in the normal course of business. The resolution of these uncertainties may result in adjustments to the Company's tax assets and tax liabilities. It is reasonably possible that changes to the Company’s global unrecognized tax benefits could be significant; however, due to the uncertainty regarding the timing of completion of audits and possible outcomes, a current estimate of the range of increases or decreases that may occur within the next twelve months cannot be made.
Deferred income taxes result from differences between the financial and tax basis of the Company's assets and liabilities and are adjusted for changes in tax rates and tax laws when changes are enacted. Valuation allowances are recorded to reduce deferred tax assets when it is more likely than not that a tax benefit will not be realized. Significant judgment is required in evaluating the need for and magnitude of appropriate valuation allowances against deferred tax assets. The realization of these assets is dependent on generating future taxable income, as well as successful implementation of various tax planning strategies. For example, changes in facts and circumstances that alter the probability that the Company will realize deferred tax assets could result in recording a valuation allowance, thereby reducing the deferred tax asset and generating a deferred tax expense in the relevant period. In some situations, these changes could be material.
At December 31, 2020, the Company had a net deferred tax liability balance of $2.7 billion, net of a valuation allowance of $0.7 billion. Realization of deferred tax assets is expected to occur over an extended period of time. As a result, changes in tax laws, assumptions with respect to future taxable income, and tax planning strategies could result in adjustments to deferred tax assets. See Note 7 to the Consolidated Financial Statements for additional details related to the deferred tax liability balance.
Goodwill
The assets and liabilities of acquired businesses are measured at their estimated fair values at the dates of acquisition. The excess of the purchase price over the estimated fair value of the net assets acquired, including identified intangibles, is recorded as goodwill. The determination and allocation of fair value to the assets acquired and liabilities assumed is based on various assumptions and valuation methodologies requiring considerable management judgment, including estimates based on historical information, current market data and future expectations. The Company’s significant assumptions in these analyses include, but are not limited to, future cash flow projections (with probability weighting applied when applicable), the weighted average cost of capital, the terminal growth rate, and the tax rate for the income approach, and metrics of publicly traded companies or historically completed transactions of comparable businesses for the market approach. The Company will also apply a weighting to the market approach and income approach to determine the fair value. When applicable, third party purchase offers may be utilized to measure fair value under the market approach. Although the estimates are deemed reasonable by management based on information available at the dates of acquisition, those estimates are inherently uncertain.
Assessment of the potential impairment of goodwill, other intangible assets, property, plant and equipment, investments in nonconsolidated affiliates, and other assets is an integral part of the Company's normal ongoing review of operations. Testing for potential impairment of these assets is significantly dependent on numerous assumptions and reflects management's best estimates at a particular point in time. The dynamic economic environments in which the Company's diversified product lines operate, and key economic and product line assumptions with respect to projected selling prices, market growth and inflation
rates, can significantly affect the outcome of impairment tests. Estimates based on these assumptions may differ significantly from actual results. Changes in factors and assumptions used in assessing potential impairments can have a significant impact on the existence and magnitude of impairments, as well as the time in which such impairments are recognized. In addition, the Company continually reviews its diverse portfolio of assets to ensure they are achieving their greatest potential and are aligned with the Company's growth strategy. Strategic decisions involving a particular group of assets may trigger an assessment of the recoverability of the related assets. Such an assessment could result in impairment losses.
The Company performs goodwill impairment testing at the reporting unit level which is defined as the operating segment or one level below the operating segment. One level below the operating segment, or component, is a business in which discrete financial information is available and regularly reviewed by segment management. The Company aggregates certain components into reporting units based on economic similarities. The Company tests goodwill for impairment annually (during the fourth quarter), or more frequently when events or circumstances indicate it is more likely than not that the fair value of the reporting unit has declined below its carrying value. As of the date of the annual impairment test, the Company identified twelve reporting units, of which seven have goodwill assigned. Two of those reporting units were reclassified as held for sale disposal groups as of the date of the annual impairment test. Of those two reporting units, one has goodwill assigned and is presented in “Assets held for sale” in the Consolidated Balance Sheet. The held for sale disposal groups are recorded at the lower of carrying amount or fair value less cost to sell each reporting period the disposal group is reclassified as held for sale.
For purposes of goodwill impairment testing, the Company has the option to first perform qualitative testing to determine whether it is more likely than not that the fair value of a reporting unit is less than its carrying value. The qualitative evaluation is an assessment of factors, including reporting unit or asset specific operating results and cost factors, as well as industry, market and macroeconomic conditions, to determine whether it is more likely than not (more than 50%) that the fair value of a reporting unit or asset is less than the respective carrying amount, including goodwill. If the Company chooses not to complete a qualitative assessment for a given reporting unit or if the initial assessment indicates that it is more likely than not that the carrying value of a reporting unit exceeds its estimated fair value, additional quantitative testing is required.
If additional quantitative testing is performed, an impairment loss is recognized in the amount by which the carrying value of the reporting unit exceeds its fair value, limited to the amount of goodwill at the reporting unit. The Company determined fair values for each of the reporting units using a combination of the income approach and market approach.
Under the income approach, fair value is determined based on the present value of estimated future cash flows, discounted at an appropriate risk-adjusted rate. The Company uses its internal forecasts to estimate future cash flows and includes an estimate of long-term future growth rates based on its most recent views of the long-term outlook for each reporting unit. The discounted cash flow valuations are completed using the following key assumptions: projected revenue growth rates; discount rates; tax rates; and terminal values. The Company applies probability-weighted scenarios to the income approach to determine the concluded fair value of the reporting unit given the uncertainty in the current economic environment to determine the concluded fair value, where applicable. These key assumptions are determined through evaluation of the Company as a whole and underlying business fundamentals and industry risk. Actual results may differ from those assumed in the Company’s forecasts. The Company derives its discount rates using a capital asset pricing model and analyzing published rates for industries relevant to its reporting units to estimate the cost of equity financing. The Company uses discount rates that are commensurate with the risks and uncertainty inherent in the respective reporting units and in its internally developed forecasts. Discount rates used in the Company’s reporting unit valuations ranged from 8% to 9.5%.
Under the market approach, the Company used the Guideline Public Company Method ("GPCM"). The selected peer sets were based on close competitors and reviews of analysts' reports, public filings, and industry research related to firms operating in the respective reporting units industries. In selecting the EBIT/EBITDA multiples and determining the fair value, the Company considered the size, growth, and profitability of each reporting unit versus the relevant guideline public companies.
Estimating the fair value of reporting units requires the use of estimates and significant judgments that are based on a number of factors including actual operating results. It is reasonably possible that the judgments and estimates described above could change in future periods.
2020 Interim Goodwill Impairment Testing
During the third quarter of 2020, multiple triggering events occurred requiring the Company to perform impairment analyses associated with its Non-Core segment. As a result of the analyses performed, the Company recorded aggregate pre-tax, non-cash goodwill impairment charges of $183 million recognized in "Goodwill impairment charges" in the Consolidated Statements of Operations.
During the second quarter of 2020, continued near-term demand weakness in global automotive production resulting from the COVID-19 pandemic, along with revised views of recovery based on third party market information, served as a triggering event requiring the Company to perform an impairment analysis of the goodwill associated with its Transportation & Industrial reporting unit. As a result of the analysis performed, the Company recorded pre-tax, non-cash goodwill impairment charges of $2,498 million recognized in "Goodwill impairment charges" in the Consolidated Statements of Operations.
During the first quarter of 2020, the Company was required to perform interim impairment tests of its goodwill and long-lived assets as expectations of proceeds related to certain potential divestitures within the Non-Core segment gave rise to fair value indicators and, thus, served as triggering events. As a result of the analysis performed, the Company recorded pre-tax, non-cash impairment charges related to goodwill of $533 million. The charges were recognized in "Goodwill impairment charge" in the Consolidated Statements of Operations.
The Company’s analyses above use a combination of the discounted cash flow models (a form of the income approach) utilizing Level 3 unobservable inputs and the market approach. The Company’s significant assumptions in these analyses include, but are not limited to, future cash flow projections, the weighted average cost of capital, the terminal growth rate, and the tax rate. The Company’s estimates of future cash flows are based on current regulatory and economic climates, recent operating results, and planned business strategies. These estimates could be negatively affected by changes in federal, state, or local regulations or economic downturns. Future cash flow estimates are, by their nature, subjective and actual results may differ materially from the Company’s estimates. If the Company’s ongoing estimates of future cash flows are not met, the Company may have to record additional impairment charges in future periods. The Company also uses the Guideline Public Company Method, a form of the market approach (utilizing Level 3 unobservable inputs), which is derived from metrics of publicly traded companies or historically completed transactions of comparable businesses. The selection of comparable businesses is based on the markets in which the reporting units operate giving consideration to risk profiles, size, geography, and diversity of products and services. When applicable, third party purchase offers may be utilized to measure fair value.
For further information see Note 13 to the Consolidated Financial Statements.
2020 Annual Goodwill Impairment Testing
In the fourth quarter of 2020, the Company performed its annual goodwill impairment testing by applying the qualitative assessment to four of its reporting units and the quantitative assessment to two of its reporting units. For the reporting units tested under the qualitative assessment, the Company considered various qualitative factors that would have affected the estimated fair value of the reporting units, and the results of the qualitative assessments indicated that it is not more likely than not that the fair values of the reporting units were less than their carrying values. For the reporting units tested under the quantitative assessment, the results indicated that, the estimated fair values of the reporting units exceeded their carrying values.
The dynamic economic environments in which the Company's diversified product lines operate, and key economic and product line assumptions with respect to projected selling prices, market growth and inflation rates, can significantly affect the outcome of impairment tests. Estimates based on these assumptions may differ significantly from actual results.
Impairment and Disposals of Long-Lived Assets
The Company evaluates the carrying value of long-lived assets (collectively the “asset group”) to be held and used when events or changes in circumstances indicate the carrying value may not be recoverable. Such reviews are performed in accordance with ASC 360. The carrying value of a long-lived asset group is considered impaired when the anticipated future undiscounted cash flows to be derived from the asset group over the remaining economic life of the asset group’s primary asset are separately identifiable and are less than its carrying value. In that event, a loss is recognized based on the amount by which the carrying value exceeds the fair value of the long-lived asset group. Fair value of the asset group is determined using a combination of a discounted cash flow model and/or market approach. Long-lived assets to be disposed of by sale, if material, are classified as held for sale and reported at the lower of carrying amount or fair value less cost to sell, and depreciation is ceased. Long-lived assets to be disposed of other than by sale are classified as held and used until they are disposed of and reported at the lower of carrying amount or fair value. Depreciation is recognized over the remaining useful life of the assets.
LONG-TERM EMPLOYEE BENEFITS
The Company has various obligations to its employees and retirees. The Company maintains retirement-related programs in many countries that have a long-term impact on the Company's earnings and cash flows. These plans are typically defined benefit pension plans. The Company has a few medical, dental and life insurance benefits for employees, pensioners and survivors and for employees (other post-employment benefits or "OPEB" plans).
Pension coverage for employees of the Company's non-U.S. consolidated subsidiaries is provided, to the extent deemed appropriate, through separate plans. The Company regularly explores alternative solutions to meet its global pension obligations in the most cost effective manner possible as demographics, life expectancy and country-specific pension funding rules change. Where permitted by applicable law, the Company reserves the right to change, modify or discontinue its plans that provide pension, medical, dental and life insurance. Benefits under defined benefit pension plans are based primarily on years of service and employees' pay near retirement.
Pension benefits are paid primarily from trust funds established to comply with applicable laws and regulations of the sovereign country in which the pension plan operates. Unless required by law, the Company does not make contributions that are in excess of tax deductible limits. The actuarial assumptions and procedures utilized are reviewed periodically by the plans' actuaries to provide reasonable assurance that there will be adequate funds for the payment of benefits. Thus, there is not necessarily a direct correlation between pension funding and pension expense. In general, however, improvements in plans' funded status tends to moderate subsequent funding needs.
The Company contributed $28 million, $497 million, and $93 million to its funded pension plans for the years ended December 31, 2020, December 31, 2019, and December 31, 2018, respectively.
The Company does maintain one U.S. pension benefit plan. This plan is a separate unfunded plan and these benefits are paid to employees from operating cash flows. The Company's remaining pension plans with no plan assets are paid from operating cash flows. The Company made benefit payments of $70 million, $71 million, and $61 million to its unfunded plans for the years ended December 31, 2020, December 31, 2019, and December 31, 2018, respectively.
The Company's OPEB plans are unfunded and the cost is paid from operating cash flows. Pre-tax cash requirements to cover payments for the Company's OPEB plans was $3 million for the year ended December 31, 2020 and $1 million for the years ended December 31, 2019 and December 31, 2018, respectively.
In 2021, the Company expects to contribute approximately $100 million to its funded pension plans and its remaining plans with no plan assets, and about $6 million for its OPEB plans. The amount and timing of actual future contributions will depend on applicable funding requirements, discount rates, investment performance, plan design, and various other factors.
The Company's income can be significantly affected by pension and defined contribution charges/(benefits) as well as OPEB costs. The following table summarizes the extent to which the Company's income for the years ended December 31, 2020, December 31, 2019, and December 31, 2018 was affected by pre-tax charges related to long-term employee benefits:
| | | | | | | | | | | |
| For the Years Ended |
| In millions | December 31, 2020 | December 31, 2019 | December 31, 2018 |
| Long-term employee benefit plan charges | $ | 155 | | $ | 98 | | $ | 75 | |
The above charges (benefit) for pension and OPEB are determined as of the beginning of each period. See "Pension Plans and Other Post-Employment Benefits" under the Critical Accounting Estimates section beginning on page 53 of this report for additional information on determining annual expense.
For 2021, long term employee benefit expense from continuing operations is expected to decrease by about $20 million. The decrease is mainly due to lower interest cost and higher expected return on plan assets.
ENVIRONMENTAL MATTERS
The Company operates global manufacturing, product handling and distribution facilities that are subject to a broad array of environmental laws and regulations. Such rules are subject to change by the implementing governmental agency, and the Company monitors these changes closely. Company policy requires that all operations fully meet or exceed legal and regulatory requirements. In addition, the Company implements voluntary programs to reduce air emissions, minimize the generation of hazardous waste, decrease the volume of water use and discharges, increase the efficiency of energy use and reduce the generation of persistent, bioaccumulative and toxic materials. Management has noted a global upward trend in the amount and complexity of proposed chemicals regulation. The costs to comply with complex environmental laws and regulations, as well as internal voluntary programs and goals, are significant and will continue to be significant for the foreseeable future. The Company has incurred environmental remediation costs of $6 million, $28 million, and $15 million for the years ended December 31, 2020, 2019 and 2018, respectively.
Based on existing facts and circumstances, management does not believe that year-over-year changes, if any, in environmental expenses charged to current operations will have a material impact on the Company's financial position, liquidity or results of operations. Annual expenditures in the near term are not expected to vary significantly from the range of such expenditures experienced in the past few years. Longer term, expenditures are subject to considerable uncertainty and may fluctuate significantly.
Environmental Operating Costs
As a result of its operations, the Company incurs costs for pollution abatement activities including waste collection and disposal, installation and maintenance of air pollution controls and wastewater treatment, emissions testing and monitoring, and obtaining permits. The Company also incurs costs related to environmental related research and development activities including environmental field and treatment studies as well as toxicity and degradation testing to evaluate the environmental impact of products and raw materials.
Remediation Accrual
Changes in the remediation accrual balance are summarized below:
| | | | | |
| (Dollars in millions) | |
| |
| Balance at December 31, 2018 | $ | 51 | |
| Remediation payments | (12) | |
| Net increase in remediation accrual | 28 | |
Net change, indemnification 1 | 10 | |
| Balance at December 31, 2019 | $ | 77 | |
| Remediation payments | (5) | |
| Net increase in remediation accrual | 6 | |
Net change, indemnification 1 | 2 | |
| Balance at December 31, 2020 | $ | 80 | |
1.Represents the net change in indemnified remediation obligations based on activity pursuant to the DWDP Separation and Distribution Agreement and Letter Agreement as discussed below and in Notes 3 and 15 to the Consolidated Financial Statements. This is not inclusive of the accrual of $59 million related to eligible PFAS costs associated with the MOU.
Considerable uncertainty exists with respect to environmental remediation costs, and, under adverse changes in circumstances, the potential liability may range up to $170 million above the amount accrued as of December 31, 2020. However, based on existing facts and circumstances, management does not believe that any loss, in excess of amounts accrued, related to remediation activities at any individual site will have a material impact on the financial position, liquidity or results of operations of the Company.
Pursuant to the DWDP Separation and Distribution Agreement and the Letter Agreement discussed in Notes 3 and 15 to the Consolidated Financial Statements, the Company indemnifies Dow and Corteva for certain environmental matters. The Company has recorded an indemnification liability of $44 million corresponding to the Company's accrual balance related to these matters at December 31, 2020. The indemnification liability is included in the total remediation accrual liability of $80 million.
Environmental Capital Expenditures
Capital expenditures for environmental projects, either required by law or necessary to meet the Company’s internal environmental goals, were $43 million for the year ended December 31, 2020. The Company currently estimates expenditures for environmental-related capital projects to be approximately $48 million in 2021.
Climate Change
The Company believes that climate change is an important global issue that presents risks and opportunities. For instance, the Company continuously evaluates opportunities for existing and new product and service offerings to meet the anticipated demands of a low-carbon economy. In 2019, the Company announced nine new sustainability goals, including an Acting on Climate goal to achieve a 30 percent reduction in absolute greenhouse gas (GHG) emissions by 2030 and carbon neutral operations by 2050. DuPont reports on its progress against these goals in its annual sustainability report.
The Company is actively engaged in efforts to develop constructive public policies to reduce GHG emissions and encourage lower-carbon forms of energy. Such policies may bring higher operating costs as well as greater revenue and margin opportunities. Legislative efforts to control or limit GHG emissions could affect the Company's energy source and supply choices as well as increase the cost of energy and raw materials derived from fossil fuels. Such efforts are also anticipated to provide the business community with greater certainty for the regulatory future, help guide investment decisions, and drive growth in demand for low-carbon and energy-efficient products, technologies, and services. Similarly, demand is expected to grow for products that facilitate adaptation to a changing climate. However, the current unsettled policy environment in the U.S., where many company facilities are located, adds an element of uncertainty to business decisions, particularly those relating to long-term capital investments.
In addition, significant differences in regional or national approaches could present challenges in a global marketplace. An effective global climate policy framework will help drive the market changes that are needed to stimulate and efficiently deploy new innovations in science and technology, while maintaining open and competitive global markets.
Sustainability
In October 2019, DuPont announced its fifth-generation sustainability strategy — nine ambitious priorities that reflect the Company's best opportunity to make a positive impact in the world while advancing our business objectives. The ten-year strategy prioritizes global challenges such as climate change, water stewardship, advancing circular economy and processes, improving health and safety, and more. With these goals, DuPont committed to using the Company's strength in innovation to advance progress on several of the United Nations’ Sustainable Development Goals (SDGs), increasing resiliency and reducing environmental and social impacts across value chains, and ensuring people are put at the center of all our work.
ITEM 7A. QUANTITATIVE AND QUALITATIVE DISCLOSURES ABOUT MARKET RISK
The Company’s global operations are exposed to financial market risks relating to fluctuations in foreign currency exchange rates, commodity prices, and interest rates. The Company has established a variety of programs including the use of derivative instruments and other financial instruments to manage the exposure to financial market risks as to minimize volatility of financial results. In the ordinary course of business, the Company enters into derivative instruments to hedge its exposure to foreign currency, interest rate and commodity price risks under established procedures and controls. For additional information on these derivatives and related exposures, see Note 21 to the Consolidated Financial Statements. Decisions regarding whether or not to hedge a given commitment are made on a case-by-case basis, taking into consideration the amount and duration of the exposure, market volatility and economic trends. Foreign currency exchange contracts are also used, from time to time, to manage near-term foreign currency cash requirements.
Foreign Currency Exchange Rate Risks
The Company has significant international operations resulting in a large number of currency transactions that result from international sales, purchases, investments and borrowings. The primary currencies for which the Company has an exchange rate exposure are the European euro ("EUR"), Chinese renminbi, and Japanese yen. The Company uses forward exchange contracts to offset its net exposures, by currency, related to the foreign currency denominated monetary assets and liabilities of its operations. In addition to the contracts disclosed in Note 21 to the Consolidated Financial Statements, from time to time, the Company will enter into foreign currency exchange contracts to establish with certainty the U.S. dollar ("USD") amount of future firm commitments denominated in a foreign currency.
The following table illustrates the fair values of outstanding foreign currency contracts at December 31, 2020, and the effect on fair values of a hypothetical adverse change in the foreign exchange rates that existed at December 31, 2020. The sensitivities for foreign currency contracts are based on a 10 percent adverse change in foreign exchange rates.
| | | | | | | | |
| | Fair Value
Asset/(Liability) | Fair Value
Sensitivity |
| In millions | December 31, 2020 | December 31, 2020 |
| Foreign currency contracts | $ | (9) | | $ | (219) | |
Since the Company's risk management programs are highly effective, the potential loss in value for each risk management portfolio described above would be largely offset by changes in the value of the underlying exposure.
Concentration of Credit Risk
The Company maintains cash and cash equivalents, marketable securities, derivatives and certain other financial instruments with various financial institutions. These financial institutions are generally highly rated and geographically dispersed and the Company has a policy to limit the dollar amount of credit exposure with any one institution.
As part of the Company's financial risk management processes, it continuously evaluates the relative credit standing of all of the financial institutions that service DuPont and monitors actual exposures versus established limits. The Company has not sustained credit losses from instruments held at financial institutions.
The Company's sales are not materially dependent on any single customer. As of December 31, 2020, no one individual customer balance represented more than five percent of the Company's total outstanding receivables balance. Credit risk associated with its receivables balance is representative of the geographic, industry and customer diversity associated with the Company's global product lines.
The Company also maintains strong credit controls in evaluating and granting customer credit. As a result, it may require that customers provide some type of financial guarantee in certain circumstances. Length of terms for customer credit varies by industry and region.
ITEM 8. FINANCIAL STATEMENTS AND SUPPLEMENTARY DATA
The financial statements and supplementary data required by this Item are included herein, commencing on page F-1 of this report.
ITEM 9. CHANGES IN AND DISAGREEMENTS WITH ACCOUNTANTS ON ACCOUNTING AND FINANCIAL DISCLOSURE
None.
ITEM 9A. CONTROLS AND PROCEDURES
Evaluation of Disclosure Controls and Procedures
The Company maintains a system of disclosure controls and procedures to give reasonable assurance that information required to be disclosed in the Company's reports filed or submitted under the Securities Exchange Act of 1934 (Exchange Act) is recorded, processed, summarized and reported within the time periods specified in the rules and forms of the SEC. These controls and procedures also give reasonable assurance that information required to be disclosed in such reports is accumulated and communicated to management to allow timely decisions regarding required disclosures.
As of December 31, 2020, the Company's Chief Executive Officer (CEO) and Chief Financial Officer (CFO), together with management, conducted an evaluation of the effectiveness of the Company's disclosure controls and procedures pursuant to Rules 13a-15(e) and 15d-15(e) of the Exchange Act. Based on that evaluation, the CEO and CFO concluded that these disclosure controls and procedures are effective.
Changes in Internal Control Over Financial Reporting
There were no changes in the Company's internal control over financial reporting identified in connection with the evaluation required by paragraph (d) of Exchange Act Rules 13a-15 and 15d-15 that was conducted during the quarter ended December 31, 2020 that have materially affected, or are reasonably likely to materially affect, the Company's internal control over financial reporting.
In connection with the N&B Transaction, there were several processes, policies, operations, technologies and information systems that were transferred or separated. Through the quarter ended December 31, 2020, the Company continued to take steps to ensure that adequate controls were designed and maintained throughout this transition period.
The Company has completed its evaluation of its internal controls and has concluded that the Company's system of internal controls over financial reporting was effective as of December 31, 2020 (see page F-2).
ITEM 9B. OTHER INFORMATION
None.
| | | | | | | | |
| DuPont de Nemours, Inc. | |
| PART III | |
ITEM 10. DIRECTORS, EXECUTIVE OFFICERS AND CORPORATE GOVERNANCE
Information related to Directors, certain executive officers and certain corporate governance matters (including identification of Audit Committee members and financial expert(s)) is contained in the definitive Proxy Statement for the 2021 Annual Meeting of Stockholders of DuPont De Nemours Inc. and is incorporated herein by reference.
ITEM 11. EXECUTIVE COMPENSATION
Information related to executive compensation and the Company's equity compensation plans is contained in the definitive Proxy Statement for the 2021 Annual Meeting of Stockholders of DuPont de Nemours, Inc. and is incorporated herein by reference.
ITEM 12. SECURITY OWNERSHIP OF CERTAIN BENEFICIAL OWNERS AND MANAGEMENT AND RELATED STOCKHOLDER MATTERS
Information with respect to beneficial ownership of DuPont de Nemours, Inc. common stock by each Director and all Directors and executive officers of the Company as a group is contained in the definitive Proxy Statement for the 2021 Annual Meeting of Stockholders of DuPont de Nemours, Inc. and is incorporated herein by reference.
Information relating to any person who beneficially owns in excess of 5 percent of the total outstanding shares of DuPont de Nemours, Inc. common stock is contained in the definitive Proxy Statement for the 2021 Annual Meeting of Stockholders of DuPont de Nemours, Inc. and is incorporated herein by reference.
Information with respect to compensation plans under which equity securities are authorized for issuance is contained in the definitive Proxy Statement for the 2021 Annual Meeting of Stockholders of DuPont de Nemours, Inc. and is incorporated herein by reference.
ITEM 13. CERTAIN RELATIONSHIPS AND RELATED TRANSACTIONS, AND DIRECTOR INDEPENDENCE
Reportable relationships and related transactions, if any, as well as information relating to director independence are contained in the definitive Proxy Statement for the 2021 Annual Meeting of Stockholders of DuPont de Nemours, Inc. and are incorporated herein by reference.
ITEM 14. PRINCIPAL ACCOUNTING FEES AND SERVICES
Information with respect to fees and services related to the Company’s independent auditors, PricewaterhouseCoopers LLP, and the disclosure of the Audit Committee’s pre-approval policies and procedures are contained in the definitive Proxy Statement for the 2021 Annual Meeting of Stockholders of DuPont and are incorporated herein by reference.
| | | | | | | | |
| DuPont de Nemours, Inc. | |
| PART IV | |
ITEM 15. EXHIBITS AND FINANCIAL STATEMENT SCHEDULES
(a)Financial Statements and Financial Statement Schedules:
1.Financial Statements (See the Index to the Consolidated Financial Statements on page F-1 of this report).
2.Financial Statement Schedules
Schedule II—Valuation and Qualifying Accounts
| | | | | | | | | | | |
| (In millions) for the years ended December 31, | 2020 | 2019 | 2018 |
| Accounts Receivable—Allowance for Doubtful Receivables | | | |
| Balance at beginning of period | $ | 9 | | $ | 10 | | $ | 1 | |
| Additions charged to expenses | 34 | | — | | 10 | |
Deductions from reserves1 | (2) | | (1) | | (1) | |
| Balance at end of period | $ | 41 | | $ | 9 | | $ | 10 | |
| Inventory—Obsolescence Reserve | | | |
| Balance at beginning of period | $ | 41 | | $ | 43 | | $ | 40 | |
| Additions charged to expenses | 29 | | 45 | | 44 | |
Deductions from reserves2 | (45) | | (47) | | (41) | |
| Balance at end of period | $ | 25 | | $ | 41 | | $ | 43 | |
| Deferred Tax Assets—Valuation Allowance | | | |
| Balance at beginning of period | $ | 634 | | $ | 593 | | $ | 741 | |
Additions charged to expenses 3 | 109 | | 91 | | 13 | |
Deductions from reserves 3 | (45) | | (50) | | (161) | |
| Balance at end of period | $ | 698 | | $ | 634 | | $ | 593 | |
1.Deductions include write-offs, recoveries and currency translation adjustments.
2.Deductions include disposals and currency translation adjustments.
3.Additions and Deductions include currency translation adjustments.
Financial Statement Schedules listed under the Securities and Exchange Commission ("SEC") rules but not included in this report are omitted because they are not applicable or the required information is shown in the Consolidated Financial Statements or notes thereto incorporated by reference.
(b) Exhibits required to be filed by Item 601 of Regulation S-K (all of which are under Commission File No. 0001666700):
| | | | | | | | | | | |
| EXHIBIT NO. | | DESCRIPTION |
| | | Second Amended and Restated Certificate of Incorporation of DowDuPont Inc. effective as of June 1, 2019, incorporated by reference to Exhibit 3.2 to the DuPont de Nemours, Inc. Current Report on Form 8-K filed June 3, 2019. |
| | | The Amended and Restated Bylaws of DuPont de Nemours, Inc., effective as of June 1, 2019, incorporated by reference to Exhibit 3.3 to the DuPont de Nemours, Inc. Current Report on Form 8-K filed June 3, 2019. |
| | | Description of Capital Stock incorporated by reference to Exhibit 4.1 to DuPont de Nemours, Inc. Quarterly Report on Form 10-Q for the quarter ended June 30, 2020. |
| | | Indenture, dated as of November 28, 2018, by and between DowDuPont Inc. and U.S. Bank National Association, as trustee, incorporated by reference to Exhibit 4.1 to the DuPont de Nemours. Inc. Current Report on Form 8-K filed on November 28, 2018. |
| | | First Supplemental Indenture, dated November 28, 2018, by and between DowDuPont Inc. and U.S. Bank National Association, as trustee incorporated by reference to Exhibit 4.2 to the DuPont de Nemours. Inc. Current Report on Form 8-K filed on November 28, 2018. |
| | | Second Supplemental Indenture, dated May 1, 2020, by and between DuPont de Nemours, Inc. and U.S. Bank National Association, as trustee incorporated by reference to Exhibit 4.2 to the DuPont de Nemours. Inc. Current Report on Form 8-K filed on May 1, 2020. |
| | | DuPont de Nemours, Inc. 2020 Equity and Incentive Plan, incorporated by reference to Exhibit 10.1 to the DuPont de Nemours, Inc. Current Report on Form 8- K filed May 29, 2020. |
| | | Employment Contract by and between DuPont de Nemours, Inc. and Matthias Heinzel, effective August 1, 2011, as amended by the Terms of Treatment dated October 28, 2014 as fully executed on November 21, 2014, and dated November 11, 2019 as fully executed on November 30, 2019 incorporated by reference to Exhibit 10.1 to DuPont de Nemours, Inc. Quarterly Report on Form 10-Q for the quarter ended March 31, 2020. |
| | | Letter Agreement by and between DuPont de Nemours, Inc. and Matthias Heinzel dated May 28, 2019 incorporated by reference to Exhibit 10.2 to DuPont de Nemours, Inc. Quarterly Report on Form 10-Q for the quarter ended March 31, 2020. |
| | | Letter Agreement by and between DuPont de Nemours, Inc. and Matthias Heinzel dated August 30, 2019 as fully executed on September 26, 2019 incorporated by reference to Exhibit 10.3 to DuPont de Nemours, Inc. Quarterly Report on Form 10-Q for the quarter ended March 31, 2020. |
| | | Letter Agreement by and between DuPont de Nemours, Inc. and Matthias Heinzel dated October 25, 2019 as fully executed on October 28, 2019 incorporated by reference to Exhibit 10.4 to DuPont de Nemours, Inc. Quarterly Report on Form 10-Q for the quarter ended March 31, 2020. |
| | | Memorandum of Understanding, dated January 22, 2021, by and among DuPont de Nemours, Inc., Corteva, Inc., E. I. du Pont de Nemours and Company and The Chemours Company, incorporated by reference to Exhibit 10.1 to the DuPont de Nemours, Inc. Current Report on Form 8-K filed January 22, 2021. |
| | | Agreement and Plan of Merger, dated December 15, 2019, by and among DuPont de Nemours Inc., Nutrition & Biosciences, Inc., International Flavors & Fragrances Inc. and Neptune Merger Sub I Inc. incorporated by reference to Exhibit 2.1 to the DuPont de Nemours, Inc. Current Report on Form 8-K filed December 18, 2019. |
| | | Separation and Distribution Agreement, dated as of December 15, 2019, by and among DuPont de Nemours Inc., Nutrition & Biosciences, Inc. and International Flavors & Fragrances Inc. incorporated by reference to Exhibit 2.2 to the DuPont de Nemours, Inc. Current Report on Form 8-K filed December 18, 2019. |
| | | Amendment No. 1 dated January 22, 2021 to that certain Separation and Distribution Agreement dated as of December 15, 2019, by and among DuPont de Nemours Inc., Nutrition & Biosciences, Inc. and International Flavors & Fragrances Inc.and Neptune Merger Sub II LLC, incorporated by reference to Exhibit 2.1 to the DuPont de Nemours, Inc. Current Report on Form 8-K filed January 25, 2021. |
| | | Amendment No. 2 dated February 1, 2021 to that certain Separation and Distribution Agreement dated December 15, 2019, by and among DuPont de Nemours Inc., Nutrition & Biosciences, Inc., International Flavors & Fragrances Inc. and Neptune Merger Sub II LLC, incorporated by reference to Exhibit 2.4 to the DuPont de Nemours, Inc. Current Report on Form 8-K filed February 4, 2021. |
| | | | | | | | | | | |
| | | Employee Matters Agreement, dated December 15, 2019, by and among DuPont de Nemours Inc., Nutrition & Biosciences, Inc. and International Flavors & Fragrances Inc. incorporated by reference to Exhibit 10.1 to the DuPont de Nemours, Inc. Current Report on Form 8-K filed December 18, 2019. |
| | | Amendment No. 1 dated January 22, 2021 to that certain Employee Matters Agreement, dated December 15, 2019, by and among DuPont de Nemours Inc., Nutrition & Biosciences, Inc. and International Flavors & Fragrances Inc. incorporated by reference to Exhibit 10.1 to the DuPont de Nemours, Inc. Current Report on Form 8-K filed January 25, 2021. |
| | | Tax Matters Agreement dated February 1, 2021, by and among DuPont de Nemours Inc., Nutrition & Biosciences, Inc. and International Flavors & Fragrances Inc. incorporated by reference to Exhibit 10.1 to the DuPont de Nemours, Inc. Current Report on Form 8-K filed February 4, 2021. |
| | | Intellectual Property Cross-License Agreement, dated February 1, 2021, by and among DuPont de Nemours Inc., Nutrition & Biosciences, Inc. and the other parties identified therein incorporated by reference to Exhibit 10.2 to the DuPont de Nemours, Inc. Current Report on Form 8-K filed February 4, 2021. |
| | | Separation and Distribution Agreement, effective as of April 1, 2019, by and among DowDuPont Inc., Dow Inc. and Corteva, Inc. incorporated by reference to Exhibit 2.1 to the DowDuPont Inc. Current Report on Form 8-K filed April 2, 2019. |
| | | Tax Matters Agreement, effective as of April 1, 2019, by and among DowDuPont Inc., Dow Inc. and Corteva, Inc. incorporated by reference to Exhibit 10.1 to the DowDuPont Inc. Current Report on Form 8-K filed April 2, 2019. |
| | | Employee Matters Agreement, effective as of April 1, 2019, by and among DowDuPont Inc., Dow Inc. and Corteva, Inc. incorporated by reference to Exhibit 10.2 to the DowDuPont Inc. Current Report on Form 8-K filed April 2, 2019. |
| | | Intellectual Property Cross-License Agreement, effective as of April 1, 2019, by and among DowDuPont Inc. and Dow Inc., incorporated by reference to Exhibit 10.3 to the DowDuPont Inc. Current Report on Form 8-K filed April 2, 2019. |
| | | Intellectual Property Cross-License Agreement, effective as of April 1, 2019, by and among Dow Inc. and Corteva, Inc., incorporated by reference to Exhibit 10.4 to the DowDuPont Inc. Current Report on Form 8-K filed April 2, 2019. |
| | | Intellectual Property Cross-License Agreement, effective as of June 1, 2019, by and among DuPont de Nemours, Inc. and Corteva, Inc., incorporated by reference to Exhibit 10.1 to the DuPont de Nemours, Inc. Current Report on Form 8-K filed June 3, 2019. |
| | | Letter Agreement, effective as of June 1, 2019 by and between DuPont de Nemours, Inc. and Corteva, Inc., incorporated by reference to Exhibit 10.2 to the DuPont de Nemours, Inc. Current Report on Form 8-K filed June 3, 2019. |
| | | Amended and Restated Tax Matters Agreement, effective as of June 1, 2019, by and among DowDuPont Inc., Corteva, Inc. and Dow Inc., incorporated by reference to Exhibit 10.3 to the DuPont de Nemours, Inc. Current Report on Form 8-K filed June 3, 2019. |
| | | DuPont Senior Executive Severance Plan, effective as of June 1, 2019, incorporated by reference to Exhibit 10.4 to the DuPont de Nemours, Inc. Current Report on Form 8-K filed June 3, 2019. |
| | | DuPont Management Deferred Compensation Plan, effective June 1, 2019, incorporated by reference to Exhibit 10.5 to DuPont de Nemours, Inc. Quarterly Report on Form 10-Q for the quarter ended June 30, 2019. |
| | | DuPont Stock Accumulation and Deferred Compensation Plan for Directors, effective June 1, 2019, incorporated by reference to Exhibit 10.6 to DuPont de Nemours, Inc. Quarterly Report on Form 10-Q for the quarter ended June 30, 2019. |
| | | DuPont Deferred Variable Compensation Plan, effective June 1, 2019, incorporated by reference to Exhibit 10.7 to DuPont de Nemours, Inc. Quarterly Report on Form 10-Q for the quarter ended June 30, 2019. |
| | | DuPont Retirement Savings Restoration Plan, effective June 1, 2019, incorporated by reference to Exhibit 10.8 to DuPont de Nemours, Inc. Quarterly Report on Form 10-Q for the quarter ended June 30, 2019. |
| | | DuPont Pension Restoration Plan, effective June 1, 2019, incorporated by reference to Exhibit 10.9 to DuPont de Nemours, Inc. Quarterly Report on Form 10-Q for the quarter ended June 30, 2019. |
| | | | | | | | | | | |
| | | DuPont Omnibus Incentive Plan effective June 1, 2019, incorporated by reference to Exhibit 10.10 to DuPont de Nemours, Inc. Quarterly Report on Form 10-Q for the quarter ended June 30, 2019. |
| | | Amended and Restated Employment Agreement by and between DuPont de Nemours, Inc. and Edward D. Breen, dated as of December 28, 2019, incorporated by reference to Exhibit 10.1 to DuPont de Nemours, Inc. Current Report on Form 8-K filed December 29, 2020. |
| | | Subsidiaries of the Registrant. |
| | | Consent of Independent Registered Public Accounting Firm, PricewaterhouseCoopers LLP. |
| | | Consent of Independent Registered Public Accounting Firm, Deloitte & Touche LLP. |
| | | Consent of Independent Registered Public Accounting Firm, Deloitte & Touche LLP. |
| | | Consent of Independent Registered Public Accounting Firm, PricewaterhouseCoopers LLP. |
| | | Power of Attorney (included as part of signature page). |
| | | Certification Pursuant to Section 302 of the Sarbanes-Oxley Act of 2002. |
| | | Certification Pursuant to Section 302 of the Sarbanes-Oxley Act of 2002. |
| | | Certification Pursuant to Section 906 of the Sarbanes-Oxley Act of 2002. |
| | | Certification Pursuant to Section 906 of the Sarbanes-Oxley Act of 2002. |
| 101.INS | | XBRL Instance Document – the instance document does not appear in the Interactive Data File because its XBRL tags are embedded within the Inline XBRL document. |
| 101.SCH | | XBRL Taxonomy Extension Schema Document. |
| 101.CAL | | XBRL Taxonomy Extension Calculation Linkbase Document. |
| 101.DEF | | XBRL Taxonomy Extension Definition Linkbase Document. |
| 101.LAB | | XBRL Taxonomy Extension Label Linkbase Document. |
| 101.PRE | | XBRL Taxonomy Extension Presentation Linkbase Document. |
| 104 | | Cover Page Interactive Data File (formatted as Inline XBRL and contained in Exhibit 101). |
ITEM 16. FORM 10-K SUMMARY
None.
| | |
DuPont de Nemours, Inc. Signatures |
Pursuant to the requirements of Section 13 or 15(d) of the Securities Exchange Act of 1934, the registrant has duly caused this report to be signed on its behalf by the undersigned, thereunto duly authorized.
DUPONT DE NEMOURS, INC.
Registrant
Date: February 12, 2021
| | | | | | | | | | | | | | |
| By: | /s/ MICHAEL G. GOSS | | | |
| Name: | Michael G. Goss | | | |
| Title: | Vice President and Controller | | | |
| | | | |
| City: | Wilmington | | | |
| State: | Delaware | | | |
Pursuant to the requirements of the Securities Exchange Act of 1934, this report has been signed below by the following persons on behalf of the registrant and in the capacities and on the dates indicated.
| | | | | | | | | | | | | | | | | |
| Signature | | Title(s) | | Date |
| | | | | |
| /s/ LORI KOCH | | Executive Vice President and
Chief Financial Officer
(Principal Financial Officer) | | February 12, 2021 |
| Lori Koch | | | |
| | | | | |
| /s/ MICHAEL G. GOSS | | Vice President and Controller | | February 12, 2021 |
| Michael G. Goss | | (Principal Accounting Officer) | | |
| | | | | |
We, the undersigned directors and officers of DuPont de Nemours, Inc, hereby severally constitute Erik T. Hoover, Senior Vice President & General Counsel and Peter W. Hennessey, Vice President, Associate General Counsel & Corporate Secretary, and each of them singly, as our true and lawful attorneys with full power to them and each of them to sign for us, in our names in the capacities indicated below, any and all amendments or supplements to this Annual Report on Form 10-K and to cause same to be filed with the U.S. Securities and Exchange Commission pursuant to the Securities and Exchange Act of 1934.
| | | | | | | | | | | | | | | | | |
| Signature | | Title(s) | | Date |
| | | | | |
| /s/ EDWARD D. BREEN | | Chief Executive Officer and Director | | February 12, 2021 |
| Edward D. Breen | | (Principal Executive Officer) | | |
| | | | | |
| /s/ AMY G. BRADY | | Director | | February 12, 2021 |
| Amy G. Brady | | | | |
| | | | | |
| /s/ RUBY R. CHANDY | | Director | | February 12, 2021 |
| Ruby R. Chandy | | | | |
| | | | | |
| /s/ FRANKLIN K. CLYBURN JR. | | Director | | February 12, 2021 |
| Franklin K. Clyburn, Jr. | | | | |
| | | | | |
| /s/ TERRENCE R. CURTIN | | Director | | February 12, 2021 |
| Terrence R. Curtin | | | | |
| | | | | |
| /s/ ALEXANDER M. CUTLER | | Director | | February 12, 2021 |
| Alexander M. Cutler | | | | |
| | | | | |
| /s/ ELEUTHERE I. DU PONT | | Director | | February 12, 2021 |
| Eleuthère I. du Pont | | | | |
| | | | | |
| /s/ RAJIV L. GUPTA | | Director | | February 12, 2021 |
| Rajiv L. Gupta | | | | |
| | | | | |
| /s/ LUTHER C. KISSAM | | Director | | February 12, 2021 |
| Luther C. Kissam | | | | |
| | | | | |
| /s/ FREDERICK M. LOWERY | | Director | | February 12, 2021 |
| Frederick M. Lowery | | | | |
| | | | | |
| /s/ RAYMOND J. MILCHOVICH | | Director | | February 12, 2021 |
| Raymond J. Milchovich | | | | |
| | | | | |
| /s/ STEVEN M. STERIN | | Director | | February 12, 2021 |
| Steven M. Sterin | | | | |
DuPont de Nemours, Inc.
Index to the Consolidated Financial Statements
| | | | | |
| | Page(s) |
| Consolidated Financial Statements: | |
| |
| |
| |
| |
| |
| |
| |
| |
Management's Reports on Responsibility for Financial Statements and
Internal Control over Financial Reporting
Management's Report on Responsibility for Financial Statements
Management is responsible for the Consolidated Financial Statements and the other financial information contained in this Annual Report on Form 10-K. The financial statements have been prepared in accordance with generally accepted accounting principles in the United States of America ("GAAP") and are considered by management to present fairly the Company's financial position, results of operations and cash flows. The financial statements include some amounts that are based on management's best estimates and judgments. The financial statements have been audited by the Company's independent registered public accounting firms, PricewaterhouseCoopers LLP and Deloitte & Touche LLP. The purpose of their audits is to express an opinion as to whether the Consolidated Financial Statements included in this Annual Report on Form 10-K present fairly, in all material respects, the Company's financial position, results of operations and cash flows in conformity with GAAP. Their reports are presented on the following pages.
Management's Report on Internal Control over Financial Reporting
Management is responsible for establishing and maintaining an adequate system of internal control over financial reporting as defined in Rules 13a-15(f) and 15d-15(f) under the Securities Exchange Act of 1934. The Company's internal control over financial reporting is a process designed to provide reasonable assurance regarding the reliability of financial reporting and the preparation of financial statements for external purposes in accordance with GAAP. The Company's internal control over financial reporting includes those policies and procedures that:
i.pertain to the maintenance of records that, in reasonable detail, accurately and fairly reflect the transactions and dispositions of the assets of the Company;
ii.provide reasonable assurance that transactions are recorded as necessary to permit preparation of financial statements in accordance with generally accepted accounting principles and that receipts and expenditures of the Company are being made only in accordance with authorization of management and directors of the Company; and
iii.provide reasonable assurance regarding prevention or timely detection of unauthorized acquisitions, use or disposition of the Company's assets that could have a material effect on the financial statements.
Internal control over financial reporting has certain inherent limitations which may not prevent or detect misstatements. In addition, changes in conditions and business practices may cause variation in the effectiveness of internal controls.
Management assessed the effectiveness of the Company's internal control over financial reporting as of December 31, 2020, based on criteria set forth by the Committee of Sponsoring Organizations of the Treadway Commission ("COSO") in Internal Control-Integrated Framework (2013). Based on its assessment and those criteria, management concluded that the Company maintained effective internal control over financial reporting as of December 31, 2020.
PricewaterhouseCoopers LLP, an independent registered public accounting firm, has audited the effectiveness of the Company's internal control over financial reporting as of December 31, 2020, as stated in its report, which is presented on the following pages.
| | | | | | | | |
| /s/ EDWARD D. BREEN | | /s/ LORI KOCH |
Edward D. Breen
Chief Executive Officer | | Lori Koch
Chief Financial Officer |
February 12, 2021
Report of Independent Registered Public Accounting Firm
To the Board of Directors and Stockholders of DuPont de Nemours, Inc.
Opinions on the Financial Statements and Internal Control over Financial Reporting
We have audited the accompanying consolidated balance sheets of DuPont de Nemours, Inc. and its subsidiaries (the “Company”) as of December 31, 2020 and 2019, and the related consolidated statements of operations, comprehensive income, equity and cash flows for each of the two years in the period ended December 31, 2020, including the related notes and schedule of valuation and qualifying accounts for each of the two years in the period ended December 31, 2020 appearing under Item 15(a)(2) (collectively referred to as the “consolidated financial statements”). We also have audited the Company's internal control over financial reporting as of December 31, 2020, based on criteria established in Internal Control - Integrated Framework (2013) issued by the Committee of Sponsoring Organizations of the Treadway Commission (COSO).
In our opinion, based on our audits and the report of other auditors, the consolidated financial statements referred to above present fairly, in all material respects, the financial position of the Company as of December 31, 2020 and 2019, and the results of its operations and its cash flows for each of the two years in the period ended December 31, 2020 in conformity with accounting principles generally accepted in the United States of America. Also in our opinion, the Company maintained, in all material respects, effective internal control over financial reporting as of December 31, 2020, based on criteria established in Internal Control - Integrated Framework (2013) issued by the COSO.
We did not audit the financial statements of The Dow Chemical Company, which was a wholly owned subsidiary prior to the April 1, 2019 distribution discussed in Note 3, which statements reflect, for the period from January 1, 2019 to March 31, 2019, total net sales of $13,582 million (of which $1,604 million is included in continuing operations and $11,978 million is included in discontinued operations in the Company’s consolidated statement of operations) for the period then ended. Those statements were audited by other auditors whose report thereon has been furnished to us, and our opinion expressed herein, insofar as it relates to the amounts included for The Dow Chemical Company for period from January 1, 2019 to March 31, 2019 is based solely on the report of the other auditors.
Change in Accounting Principle
As discussed in Note 1 to the consolidated financial statements, the Company changed the manner in which it accounts for leases in 2019.
Basis for Opinions
The Company's management is responsible for these consolidated financial statements, for maintaining effective internal control over financial reporting, and for its assessment of the effectiveness of internal control over financial reporting, included in the accompanying Management’s Report on Internal Control over Financial Reporting. Our responsibility is to express opinions on the Company’s consolidated financial statements and on the Company's internal control over financial reporting based on our audits. We are a public accounting firm registered with the Public Company Accounting Oversight Board (United States) (PCAOB) and are required to be independent with respect to the Company in accordance with the U.S. federal securities laws and the applicable rules and regulations of the Securities and Exchange Commission and the PCAOB.
We conducted our audits in accordance with the standards of the PCAOB. Those standards require that we plan and perform the audits to obtain reasonable assurance about whether the consolidated financial statements are free of material misstatement, whether due to error or fraud, and whether effective internal control over financial reporting was maintained in all material respects.
Our audits of the consolidated financial statements included performing procedures to assess the risks of material misstatement of the consolidated financial statements, whether due to error or fraud, and performing procedures that respond to those risks. Such procedures included examining, on a test basis, evidence regarding the amounts and disclosures in the consolidated financial statements. Our audits also included evaluating the accounting principles used and significant estimates made by management, as well as evaluating the overall presentation of the consolidated financial statements. Our audit of internal control over financial reporting included obtaining an understanding of internal control over financial reporting, assessing the risk that a material weakness exists, and testing and evaluating the design and operating effectiveness of internal control based on the assessed risk. Our audits also included performing such other procedures as we considered necessary in the circumstances. We believe that our audits and the report of other auditors provide a reasonable basis for our opinions.
Definition and Limitations of Internal Control over Financial Reporting
A company’s internal control over financial reporting is a process designed to provide reasonable assurance regarding the reliability of financial reporting and the preparation of financial statements for external purposes in accordance with generally accepted accounting principles. A company’s internal control over financial reporting includes those policies and procedures that (i) pertain to the maintenance of records that, in reasonable detail, accurately and fairly reflect the transactions and dispositions of the assets of the company; (ii) provide reasonable assurance that transactions are recorded as necessary to permit preparation of financial statements in accordance with generally accepted accounting principles, and that receipts and expenditures of the company are being made only in accordance with authorizations of management and directors of the company; and (iii) provide reasonable assurance regarding prevention or timely detection of unauthorized acquisition, use, or disposition of the company’s assets that could have a material effect on the financial statements.
Because of its inherent limitations, internal control over financial reporting may not prevent or detect misstatements. Also, projections of any evaluation of effectiveness to future periods are subject to the risk that controls may become inadequate because of changes in conditions, or that the degree of compliance with the policies or procedures may deteriorate.
Critical Audit Matters
The critical audit matters communicated below are matters arising from the current period audit of the consolidated financial statements that were communicated or required to be communicated to the audit committee and that (i) relate to accounts or disclosures that are material to the consolidated financial statements and (ii) involved our especially challenging, subjective, or complex judgments. The communication of critical audit matters does not alter in any way our opinion on the consolidated financial statements, taken as a whole, and we are not, by communicating the critical audit matters below, providing separate opinions on the critical audit matters or on the accounts or disclosures to which they relate.
Goodwill impairment assessments for certain reporting units and long-lived assets impairment assessment for a certain asset group
As described in Notes 1, 5, 11 and 13 to the consolidated financial statements, the Company’s consolidated goodwill balance was $30.2 billion, property, plant, and equipment - net balance was $10.0 billion, and other intangible assets with finite lives net balance was $9.5 billion, respectively, as of December 31, 2020. Management conducts impairment tests for goodwill annually during the fourth quarter, or more frequently, if events or circumstances indicate the carrying value of goodwill may be impaired. In the first and third quarters, management recorded goodwill impairment charges of $533 million and $158 million, respectively, related to certain reporting units within the Non-Core segment. In the second quarter, management recorded goodwill impairment charges of $2,498 million related to the Transportation and Industrial reporting unit. Fair value of each reporting unit is estimated using a combination of a discounted cash flow model and/or market approach and involves the use of significant assumptions. Management also evaluates the carrying value of all tangible and intangible assets (collectively, “asset groups”) held for use for possible impairment when an event or change in circumstance has occurred that indicates their carrying value may not be recoverable. In the third quarter, management recorded long-lived asset impairment charges of $318 million, within the PVAM business unit. The evaluation of the asset group includes estimating anticipated future undiscounted cash flows to be derived from the asset group. If such undiscounted cash flows are less than the asset group’s carrying value, an additional evaluation is performed whereby the carrying value of the asset group is compared to the estimated fair value of the asset group. Fair value of the asset group is determined using a combination of a discounted cash flow model and/or market approach and involves the use of significant assumptions.
The principal considerations for our determination that performing procedures relating to the goodwill impairment assessments for certain reporting units and the asset group impairment assessment for a certain asset group is a critical audit matter are (i) the significant judgment by management when developing the fair value measurements of an asset group within the PVAM business unit and reporting units within the Non-Core segment, which in turn led to a high degree of auditor judgment, effort, and subjectivity in performing procedures and in evaluating audit evidence relating to the Company’s discounted cash flow models and significant assumptions, including the projected revenue, gross margins, and the weighted average costs of capital; (ii) the significant judgment by management when developing the fair value measurement of the Transportation and Industrial reporting unit, which in turn led to a high degree of auditor judgment, effort, and subjectivity in performing procedures and in evaluating audit evidence relating to the Company’s discounted cash flow and market approach models and significant assumptions, including the projected revenue, gross margins, the weighted average costs of capital, the terminal growth rates, and the probability-weighting applied to the projected financial information and weighting applied to the market approach and income approach, (iii) management recorded an impairment charge for an asset group within the PVAM business unit and goodwill for certain reporting units within the Non-core segment and Transportation and Industrial reporting unit during the year, and (iv) the audit effort involved the use of professionals with specialized skill and knowledge.
Addressing the matter involved performing procedures and evaluating audit evidence in connection with forming our overall opinion on the consolidated financial statements. These procedures included testing the effectiveness of controls relating to management’s goodwill and long-lived asset impairment assessments, including controls over management’s identification of events or changes in circumstances that indicate an impairment of an asset group and/or a reporting unit has occurred and controls over the determination of the fair value of the Company’s reporting units and asset group. These procedures also included, among others, evaluating the appropriateness of the models and reasonableness of the significant assumptions used by management in developing the fair value measurements, including (i) the projected revenue, gross margins, the weighted average costs of capital for the asset group within the PVAM business unit and reporting units in the Non-Core segment and (ii) the projected revenue, gross margins, the weighted average costs of capital, the terminal growth rates, and probability-weighting applied to the projected financial information and weighting applied to the market approach and income approach for the Transportation and Industrial reporting unit. Evaluating the reasonableness of assumptions related to projected revenue, gross margins, and probability-weighting applied to the projected financial information involved considering the current economic conditions and recent operating results and whether the assumptions used by management were consistent with evidence obtained in other areas of the audit. For certain impairment assessments, professionals with specialized skill and knowledge were used to assist in evaluating the appropriateness of the Company’s discounted cash flow and market approach models and evaluating the reasonableness of the weighted average costs of capital, terminal growth rates and the weighting applied to the market approach and income approach, as applicable.
Tax-free determination of certain internal distributions and reorganizations in preparation for the intended 2021 Nutrition and Bioscience business external distribution
As described in Notes 1 and 3 to the consolidated financial statements, management has determined that certain internal distributions and reorganizations in preparation for the intended 2021 Nutrition and Bioscience business external distribution, qualified as tax-free transactions under the applicable sections of the Internal Revenue Code. As such, the Company is not required to pay corporate taxes on the transactions. The determination of the tax-free nature relating to certain internal distributions and reorganizations requires management to make judgments about the application of tax laws and regulations. As disclosed by management, the Internal Revenue Service could determine on audit that certain internal reorganizations should be treated as taxable transactions, which would have a material adverse impact on the Company.
The principal considerations for our determination that performing procedures relating to the tax-free determination of certain internal distributions and reorganizations in preparation for the intended 2021 Nutrition and Bioscience business external distribution is a critical audit matter are (i) there was significant judgment made by management regarding the transactions and the application of tax laws and regulations in determining that certain internal distributions and reorganizations qualify for tax-free status, and (ii) the significant impact to the financial statements if the tax-free determinations were determined to be inappropriate by the Internal Revenue Service. This in turn led to a significant degree of auditor judgment and effort in performing procedures and in evaluating audit evidence relating to the tax-free determination of certain internal distributions and reorganizations. In addition, the audit effort involved the use of professionals with specialized skill and knowledge to assist in evaluating the audit evidence obtained from these procedures.
Addressing the matter involved performing procedures and evaluating audit evidence in connection with forming our overall opinion on the consolidated financial statements. These procedures included testing the effectiveness of controls relating to the key judgments, including inputs and assumptions, relating to management’s determination of the tax-free nature of the transactions. These procedures also included, among others, (i) evaluating the information, including third party opinions, tax law, and other relevant evidence used by management to support management’s position that the transactions qualified for tax-free status, and (ii) evaluating certain internal distributions and reorganization transactions and related tax consequences. Professionals with specialized skill and knowledge were used to assist in the evaluation of the transactions, related assumptions, and certain representations from management, as well as the application of relevant tax laws.
/s/PricewaterhouseCoopers LLP
Philadelphia, Pennsylvania
February 12, 2021
We have served as the Company’s auditor since 2019.
REPORT OF INDEPENDENT REGISTERED PUBLIC ACCOUNTING FIRM
To the Stockholders and the Board of Directors of DuPont de Nemours, Inc.
Opinion on the Financial Statements
We have audited the accompanying consolidated statements of income, comprehensive income, equity, and cash flows of DuPont de Nemours, Inc. and subsidiaries (the “Company”) for the year ended December 31, 2018, and the related notes and the schedule listed in the Index at Item 15a(2) (collectively referred to as the "financial statements). In our opinion, based on our audit and the report of the other auditors, the financial statements present fairly, in all material respects, the results of the Company’s operations and its cash flows for the year ended December 31, 2018, in conformity with accounting principles generally accepted in the United States of America.
We did not audit the consolidated financial statements of E. I. du Pont de Nemours and Company (“EID”), a wholly-owned subsidiary of the Company, which consolidated financial statements reflected total revenues of $26,279 million for the year ended December 31, 2018. Those statements were audited by other auditors whose report has been furnished to us, and our opinion, insofar as it relates to the amounts included for EID for the year ended December 31, 2018, is based solely on the report of the other auditors.
Basis for Opinion
These financial statements are the responsibility of the Company's management. Our responsibility is to express an opinion on the Company's financial statements based on our audit. We are a public accounting firm registered with the PCAOB and are required to be independent with respect to the Company in accordance with the U.S. federal securities laws and the applicable rules and regulations of the Securities and Exchange Commission and the PCAOB.
We conducted our audit in accordance with the standards of the PCAOB. Those standards require that we plan and perform the audit to obtain reasonable assurance about whether the financial statements are free of material misstatement, whether due to error or fraud. Our audit included performing procedures to assess the risks of material misstatement of the financial statements, whether due to error or fraud, and performing procedures that respond to those risks. Such procedures included examining, on a test basis, evidence regarding the amounts and disclosures in the financial statements. Our audit also included evaluating the accounting principles used and significant estimates made by management, as well as evaluating the overall presentation of the financial statements. We believe that our audit and the report of the other auditors provide a reasonable basis for our opinion.
| | |
| /s/ DELOITTE & TOUCHE LLP |
| Midland, Michigan |
|
February 11, 2019 (February 14, 2020 as to changes to the 2018 financial statements as a result of a change in method of accounting for inventory, a change in reportable segments, and the effects of discontinued operations, common control transactions, and a reverse stock split.)
We began serving as the Company's auditor in 1905. In 2019 we became the predecessor auditor.
REPORT OF INDEPENDENT REGISTERED PUBLIC ACCOUNTING FIRM
To the Board of Directors and Stockholder of The Dow Chemical Company
Opinion on the Financial Statements
We have audited the consolidated balance sheet of The Dow Chemical Company and subsidiaries (the "Company") as of March 31, 2019, the related consolidated statements of income, comprehensive income, equity, and cash flows, for the three-month period ended March 31, 2019, and the related notes (collectively referred to as the "financial statements") (not presented herein). In our opinion, the financial statements present fairly, in all material respects, the financial position of the Company as of March 31, 2019, and the results of its operations and its cash flows for the three-month period ended March 31, 2019, in conformity with accounting principles generally accepted in the United States of America.
Basis for Opinion
These financial statements are the responsibility of the Company's management. Our responsibility is to express an opinion on the Company's financial statements based on our audit. We are a public accounting firm registered with the Public Company Accounting Oversight Board (United States) (PCAOB) and are required to be independent with respect to the Company in accordance with the U.S. federal securities laws and the applicable rules and regulations of the Securities and Exchange Commission and the PCAOB.
We conducted our audit in accordance with the standards of the PCAOB. Those standards require that we plan and perform the audit to obtain reasonable assurance about whether the financial statements are free of material misstatement, whether due to error or fraud. The Company is not required to have, nor were we engaged to perform, an audit of its internal control over financial reporting for the three-month period ended March 31, 2019. As part of our audit, we are required to obtain an understanding of internal control over financial reporting but not for the purpose of expressing an opinion on the effectiveness of the Company’s internal control over financial reporting. Accordingly, we express no such opinion.
Our audit included performing procedures to assess the risks of material misstatement of the financial statements, whether due to error or fraud, and performing procedures that respond to those risks. Such procedures included examining, on a test basis, evidence regarding the amounts and disclosures in the financial statements. Our audit also included evaluating the accounting principles used and significant estimates made by management, as well as evaluating the overall presentation of the financial statements. We believe that our audit provides a reasonable basis for our opinion.
| | |
| /s/ DELOITTE & TOUCHE LLP |
| Midland, Michigan |
| February 14, 2020 |
We have served as the Company's auditor since 1905.
Report of Independent Registered Public Accounting Firm
To the Stockholders and Board of Directors of E.I. du Pont de Nemours and Company
Opinion on the Financial Statements
We have audited the consolidated statements of operations, comprehensive income (loss), equity and cash flows of E.I. du Pont de Nemours and Company and its subsidiaries (the “Company”) for the year ended December 31, 2018, including the related notes and schedule of valuation and qualifying accounts for the year ended December 31, 2018 appearing under Item 15(a) (collectively referred to as the “consolidated financial statements”) (not presented herein).
In our opinion, based on our audit and the report of other auditors, the consolidated financial statements present fairly, in all material respects, the results of operations and cash flows of the Company for the year ended December 31, 2018 in conformity with accounting principles generally accepted in the United States of America.
We did not audit the combined financial statements of the Dow Agricultural Sciences Business, a business under common control of the Company, which statements reflect total assets of $7,773 million as of December 31, 2018, and total net sales of $5,646 million for the year ended December 31, 2018. Those statements were audited by other auditors whose report thereon has been furnished to us, and our opinion expressed herein, insofar as it relates to the amounts included for the Dow Agricultural Sciences Business as of and for the year ended December 31, 2018, is based solely on the report of the other auditors.
Basis for Opinion
These consolidated financial statements are the responsibility of the Company’s management. Our responsibility is to express an opinion on the Company’s consolidated financial statements based on our audit. We are a public accounting firm registered with the Public Company Accounting Oversight Board (United States) (PCAOB) and are required to be independent with respect to the Company in accordance with the U.S. federal securities laws and the applicable rules and regulations of the Securities and Exchange Commission and the PCAOB.
We conducted our audit of these consolidated financial statements in accordance with the standards of the PCAOB. Those standards require that we plan and perform the audit to obtain reasonable assurance about whether the consolidated financial statements are free of material misstatement, whether due to error or fraud.
Our audit included performing procedures to assess the risks of material misstatement of the consolidated financial statements, whether due to error or fraud, and performing procedures that respond to those risks. Such procedures included examining, on a test basis, evidence regarding the amounts and disclosures in the consolidated financial statements. Our audit also included evaluating the accounting principles used and significant estimates made by management, as well as evaluating the overall presentation of the consolidated financial statements. We believe that our audit and the report of other auditors provide a reasonable basis for our opinion.
/s/PricewaterhouseCoopers LLP
Philadelphia, Pennsylvania
February 11, 2021
We have served as the Company’s auditor since 1946.
DuPont de Nemours, Inc.
Consolidated Statements of Operations
| | | | | | | | | | | |
| (In millions, except for per share amounts) For the years ended December 31, | 2020 | 2019 | 2018 |
| Net sales | $ | 20,397 | | $ | 21,512 | | $ | 22,594 | |
| Cost of sales | 13,522 | | 14,056 | | 15,302 | |
| Research and development expenses | 860 | | 955 | | 1,070 | |
| Selling, general and administrative expenses | 2,235 | | 2,663 | | 3,028 | |
| Amortization of intangibles | 2,119 | | 1,050 | | 1,044 | |
| Restructuring and asset related charges - net | 849 | | 314 | | 147 | |
| Goodwill impairment charges | 3,214 | | 1,175 | | — | |
| Integration and separation costs | 594 | | 1,342 | | 1,887 | |
| Equity in earnings of nonconsolidated affiliates | 191 | | 84 | | 447 | |
| Sundry income (expense) - net | 675 | | 153 | | 92 | |
| Interest expense | 767 | | 668 | | 55 | |
| (Loss) Income from continuing operations before income taxes | (2,897) | | (474) | | 600 | |
| (Benefit from) Provision for income taxes on continuing operations | (23) | | 140 | | 195 | |
| (Loss) Income from continuing operations, net of tax | (2,874) | | (614) | | 405 | |
| (Loss) Income from discontinued operations, net of tax | (49) | | 1,214 | | 3,595 | |
| Net (loss) income | (2,923) | | 600 | | 4,000 | |
| Net income attributable to noncontrolling interests | 28 | | 102 | | 155 | |
| Net (loss) income available for DuPont common stockholders | $ | (2,951) | | $ | 498 | | $ | 3,845 | |
| | | |
| Per common share data: | | | |
| (Loss) Earnings per common share from continuing operations - basic | $ | (3.95) | | $ | (0.86) | | $ | 0.46 | |
| (Loss) Earnings per common share from discontinued operations - basic | (0.07) | | 1.53 | | 4.54 | |
| (Loss) Earnings per common share - basic | $ | (4.01) | | $ | 0.67 | | $ | 4.99 | |
| (Loss) Earnings per common share from continuing operations - diluted | $ | (3.95) | | $ | (0.86) | | $ | 0.45 | |
| (Loss) Earnings per common share from discontinued operations - diluted | (0.07) | | 1.53 | | 4.51 | |
| (Loss) Earnings per common share - diluted | $ | (4.01) | | $ | 0.67 | | $ | 4.96 | |
| | | |
| Weighted-average common shares outstanding - basic | 735.5 | | 746.3 | | 767.0 | |
| Weighted-average common shares outstanding - diluted | 735.5 | | 746.3 | | 771.8 | |
See Notes to the Consolidated Financial Statements.
DuPont de Nemours, Inc.
Consolidated Statements of Comprehensive Income
| | | | | | | | | | | |
| (In millions) For the years ended December 31, | 2020 | 2019 | 2018 |
| Net (loss) income | $ | (2,923) | | $ | 600 | | $ | 4,000 | |
| Other comprehensive income (loss), net of tax | | | |
| Unrealized gains (losses) on investments | — | | 67 | | (67) | |
| Cumulative translation adjustments | 1,540 | | (464) | | (1,743) | |
| Pension and other post-employment benefit plans | (80) | | (65) | | (626) | |
| Derivative instruments | — | | (58) | | 51 | |
| Total other comprehensive income (loss) | 1,460 | | (520) | | (2,385) | |
| Comprehensive (loss) income | (1,463) | | 80 | | 1,615 | |
| Comprehensive income attributable to noncontrolling interests, net of tax | 28 | | 112 | | 118 | |
| Comprehensive (loss) income attributable to DuPont | $ | (1,491) | | $ | (32) | | $ | 1,497 | |
See Notes to the Consolidated Financial Statements.
DuPont de Nemours, Inc.
Consolidated Balance Sheets
| | | | | | | | |
| (In millions, except share and per share amounts) | December 31, 2020 | December 31, 2019 |
| Assets | | |
| Current Assets | | |
Cash and cash equivalents | $ | 2,544 | | $ | 1,540 | |
| | |
Accounts and notes receivable - net | 3,551 | | 3,802 | |
Inventories | 3,726 | | 4,319 | |
Other current assets | 246 | | 338 | |
| Assets held for sale | 810 | | — | |
Total current assets | 10,877 | | 9,999 | |
| Property | | |
| Property, plant and equipment | 15,982 | | 15,112 | |
| Less: Accumulated depreciation | 5,997 | | 4,969 | |
| Property, plant and equipment - net | 9,985 | | 10,143 | |
| Other Assets | | |
Goodwill | 30,244 | | 33,151 | |
Other intangible assets | 11,144 | | 13,593 | |
| Restricted cash | 6,206 | | — | |
| Investments and noncurrent receivables | 1,083 | | 1,260 | |
Deferred income tax assets | 234 | | 189 | |
Deferred charges and other assets | 1,131 | | 1,014 | |
Total other assets | 50,042 | | 49,207 | |
| Total Assets | $ | 70,904 | | $ | 69,349 | |
| Liabilities and Equity | | |
| Current Liabilities | | |
Short-term borrowings and finance lease obligations | $ | 5 | | $ | 3,830 | |
Accounts payable | 2,964 | | 2,934 | |
Income taxes payable | 205 | | 240 | |
Accrued and other current liabilities | 1,385 | | 1,342 | |
| Liabilities related to assets held for sale | 140 | | — | |
Total current liabilities | 4,699 | | 8,346 | |
| Long-Term Debt | 21,806 | | 13,617 | |
| Other Noncurrent Liabilities | | |
Deferred income tax liabilities | 2,905 | | 3,467 | |
| Pension and other post-employment benefits - noncurrent | 1,348 | | 1,172 | |
Other noncurrent obligations | 1,076 | | 1,191 | |
Total other noncurrent liabilities | 5,329 | | 5,830 | |
| Total Liabilities | 31,834 | | 27,793 | |
| Commitments and contingent liabilities | | |
| Stockholders' Equity | | |
Common stock (authorized 1,666,666,667 shares of $0.01 par value each; issued 2020: 734,204,054 shares; 2019: 738,564,728 shares) | 7 | | 7 | |
Additional paid-in capital | 50,039 | | 50,796 | |
| Accumulated deficit | (11,586) | | (8,400) | |
| Accumulated other comprehensive income (loss) | 44 | | (1,416) | |
| | |
| | |
Total DuPont stockholders' equity | 38,504 | | 40,987 | |
Noncontrolling interests | 566 | | 569 | |
Total equity | 39,070 | | 41,556 | |
| Total Liabilities and Equity | $ | 70,904 | | $ | 69,349 | |
See Notes to the Consolidated Financial Statements.
DuPont de Nemours, Inc.
Consolidated Statements of Cash Flows
| | | | | | | | | | | |
| (In millions) For the years ended December 31, | 2020 | 2019 | 2018 |
| Operating Activities | | | |
| Net (loss) income | $ | (2,923) | | $ | 600 | | $ | 4,000 | |
| Adjustments to reconcile net income to net cash provided by operating activities: | | | |
| Depreciation and amortization | 3,094 | | 3,195 | | 5,918 | |
| Credit for deferred income tax and other tax related items | (692) | | (768) | | (366) | |
| Earnings of nonconsolidated affiliates (in excess of) less than dividends received | (87) | | 909 | | 83 | |
| Net periodic pension benefit cost (credit) | 37 | | (55) | | 58 | |
| Pension contributions | (98) | | (697) | | (2,964) | |
Net gain on sales of assets, businesses and investments | (642) | | (149) | | (93) | |
| Restructuring and asset related charges - net | 849 | | 588 | | 1,105 | |
| Goodwill impairment charges | 3,214 | | 1,175 | | — | |
| Amortization of merger-related inventory step-up | — | | 253 | | 1,628 | |
| Other net loss | 175 | | 338 | | 720 | |
| Changes in assets and liabilities, net of effects of acquired and divested companies: | | | |
| Accounts and notes receivable | 308 | | (2,227) | | (1,611) | |
| Inventories | 570 | | 387 | | (1,496) | |
| Accounts payable | 177 | | (1,049) | | 201 | |
| Other assets and liabilities, net | 113 | | (1,091) | | (2,452) | |
| Cash provided by operating activities | 4,095 | | 1,409 | | 4,731 | |
| Investing Activities | | | |
| Capital expenditures | (1,194) | | (2,472) | | (3,837) | |
| Investment in gas field developments | — | | (25) | | (114) | |
| Purchases of previously leased assets | — | | — | | (26) | |
| Proceeds from sales of property, businesses, and ownership interests in nonconsolidated affiliates, net of cash divested | 1,033 | | 299 | | 206 | |
| Acquisitions of property and businesses, net of cash acquired | (70) | | (180) | | (20) | |
| | | |
| | | |
| | | |
| | | |
| Purchases of investments | (1) | | (197) | | (2,787) | |
| Proceeds from sales and maturities of investments | 1 | | 242 | | 3,402 | |
| Proceeds from interests in trade accounts receivable conduits | — | | — | | 657 | |
| Other investing activities, net | 29 | | 20 | | 57 | |
| Cash used for investing activities | (202) | | (2,313) | | (2,462) | |
| Financing Activities | | | |
| Changes in short-term borrowings | (1,829) | | 2,735 | | 223 | |
| Proceeds from issuance of long-term debt | 8,275 | | 4,005 | | 15,455 | |
| Payments on long-term debt | (2,031) | | (6,900) | | (9,009) | |
| Purchases of common stock | (232) | | (2,329) | | (4,421) | |
| Proceeds from issuance of Company stock | 57 | | 85 | | 197 | |
| Employee taxes paid for share-based payment arrangements | (15) | | (84) | | (128) | |
| Distributions to noncontrolling interests | (50) | | (27) | | (195) | |
| Dividends paid to stockholders | (882) | | (1,611) | | (3,491) | |
| Cash held by Dow and Corteva at the respective DWDP Distributions | — | | (7,315) | | — | |
| Debt extinguishment costs | — | | (104) | | (555) | |
| Other financing activities, net | (55) | | (5) | | 6 | |
| Cash provided by (used for) financing activities | 3,238 | | (11,550) | | (1,918) | |
| Effect of exchange rate changes on cash, cash equivalents and restricted cash | 67 | | 9 | | (344) | |
| Increase (Decrease) in cash, cash equivalents and restricted cash | 7,198 | | (12,445) | | 7 | |
| Cash, cash equivalents and restricted cash from continuing operations, beginning of period | 1,577 | | 8,591 | | 4,441 | |
| Cash, cash equivalents and restricted cash from discontinued operations, beginning of period | — | | 5,431 | | 9,574 | |
| Cash, cash equivalents and restricted cash at beginning of period | 1,577 | | 14,022 | | 14,015 | |
| Cash, cash equivalents and restricted cash from continuing operations, end of period | 8,775 | | 1,577 | | 8,591 | |
| Cash, cash equivalents and restricted cash from discontinued operations, end of period | — | | — | | 5,431 | |
| Cash, cash equivalents and restricted cash at end of period | $ | 8,775 | | $ | 1,577 | | $ | 14,022 | |
| Supplemental cash flow information | | | |
| Cash paid during the year for: | | | |
| Interest, net of amounts capitalized | $ | 647 | | $ | 969 | | $ | 2,116 | |
| Income taxes | $ | 495 | | $ | 722 | | $ | 2,199 | |
See Notes to the Consolidated Financial Statements.
DuPont de Nemours, Inc.
Consolidated Statements of Equity
| | | | | | | | | | | | | | | | | | | | | | | | | | |
| In millions | Common Stock | Additional Paid-in Capital | Retained Earnings (Accumulated Deficit) | Accumulated Other Comp (Loss) Income | Unearned ESOP | Treasury Stock | Non-controlling Interests | Total Equity |
| 2018 | | | | | | | | |
Balance at January 1, 2018 | $ | 8 | | $ | 81,272 | | $ | 28,931 | | $ | (8,972) | | $ | (189) | | $ | (1,000) | | $ | 1,597 | | $ | 101,647 | |
Adoption of accounting standards | — | | — | | 996 | | (1,037) | | — | | — | | — | | (41) | |
Net income | — | | — | | 3,845 | | — | | — | | — | | 155 | | 4,000 | |
Other comprehensive loss | — | | — | | — | | (2,385) | | — | | — | | (37) | | (2,422) | |
Dividends ($4.56 per common share) | — | | — | | (3,491) | | — | | — | | — | | — | | (3,491) | |
Common stock issued/sold | — | | 198 | | — | | — | | — | | — | | — | | 198 | |
Stock-based compensation and allocation of ESOP shares | — | | 506 | | — | | — | | 55 | | — | | — | | 561 | |
Distributions to non-controlling interests | — | | — | | — | | — | | — | | — | | (168) | | (168) | |
| Purchases of treasury stock | — | | — | | — | | — | | — | | (4,421) | | — | | (4,421) | |
Other | — | | — | | (24) | | — | | — | | — | | 61 | | 37 | |
Balance at December 31, 2018 | $ | 8 | | $ | 81,976 | | $ | 30,257 | | $ | (12,394) | | $ | (134) | | $ | (5,421) | | $ | 1,608 | | $ | 95,900 | |
| 2019 | | | | | | | | |
Adoption of accounting standards | — | | — | | (111) | | — | | — | | — | | — | | (111) | |
Net income | — | | — | | 498 | | — | | — | | — | | 102 | | 600 | |
Other comprehensive (loss) income | — | | — | | — | | (520) | | — | | — | | 10 | | (510) | |
Dividends ($2.16 per common share) | — | | (446) | | (1,165) | | — | | — | | — | | — | | (1,611) | |
Common stock issued/sold | — | | 85 | | — | | — | | — | | — | | — | | 85 | |
Stock-based compensation and allocation of ESOP shares | — | | 194 | | (1) | | — | | 29 | | — | | — | | 222 | |
Distributions to non-controlling interests | — | | — | | — | | — | | — | | — | | (27) | | (27) | |
| Purchases of treasury stock | — | | — | | — | | — | | — | | (2,329) | | — | | (2,329) | |
Retirement of treasury stock | — | | — | | (7,750) | | — | | — | | 7,750 | | — | | — | |
Spin-off of Dow and Corteva | — | | (31,010) | | (30,123) | | 11,498 | | 105 | | — | | (1,124) | | (50,654) | |
Other | (1) | | (3) | | (5) | | — | | — | | — | | — | | (9) | |
Balance at December 31, 2019 | $ | 7 | | $ | 50,796 | | $ | (8,400) | | $ | (1,416) | | $ | — | | $ | — | | $ | 569 | | $ | 41,556 | |
| 2020 | | | | | | | | |
Adoption of accounting standards | — | | — | | (3) | | — | | — | | — | | — | | (3) | |
| Net (loss) income | — | | — | | (2,951) | | — | | — | | — | | 28 | | (2,923) | |
| Other comprehensive income | — | | — | | — | | 1,460 | | — | | — | | — | | 1,460 | |
Dividends ($1.20 per common share) | — | | (882) | | — | | — | | — | | — | | — | | (882) | |
Common stock issued/sold | — | | 57 | | — | | — | | — | | — | | — | | 57 | |
| Stock-based compensation | — | | 98 | | — | | — | | — | | — | | — | | 98 | |
Distributions to non-controlling interests | — | | — | | — | | — | | — | | — | | (50) | | (50) | |
| Purchases of treasury stock | — | | — | | — | | — | | — | | (232) | | — | | (232) | |
Retirement of treasury stock | — | | — | | (232) | | — | | — | | 232 | | — | | — | |
Other | — | | (30) | | — | | — | | — | | — | | 19 | | (11) | |
Balance at December 31, 2020 | $ | 7 | | $ | 50,039 | | $ | (11,586) | | $ | 44 | | $ | — | | $ | — | | $ | 566 | | $ | 39,070 | |
See Notes to the Consolidated Financial Statements.
DuPont De Nemours, Inc.
NOTES TO THE CONSOLIDATED FINANCIAL STATEMENTS
Table of Contents
| | | | | | | | |
| Note | | Page |
| 1 | | |
| 2 | | |
| 3 | | |
| 4 | | |
| 5 | | |
| 6 | | |
| 7 | | |
| 8 | | |
| 9 | | |
| 10 | | |
| 11 | | |
| 12 | | |
| 13 | | |
| 14 | | |
| 15 | | |
| 16 | | |
| 17 | | |
| 18 | | |
| 19 | | |
| 20 | | |
| 21 | | |
| 22 | | |
| 23 | | |
| 24 | | |
| 25 | | |
NOTE 1 - SUMMARY OF SIGNIFICANT ACCOUNTING POLICIES
Principles of Consolidation and Basis of Presentation
The accompanying Consolidated Financial Statements of DuPont de Nemours, Inc. ("DuPont” or the "Company”) were prepared in accordance with accounting principles generally accepted in the United States of America (“U.S. GAAP”). The significant accounting policies described below, together with the other notes that follow, are an integral part of the Consolidated Financial Statements.
Effective August 31, 2017, pursuant to the merger of equals transaction contemplated by the Agreement and Plan of Merger, dated as of December 11, 2015, as amended on March 31, 2017 ("DWDP Merger Agreement"), The Dow Chemical Company ("TDCC") and E. I. du Pont de Nemours and Company ("EID") each merged with subsidiaries of DowDuPont Inc. ("DowDuPont") and, as a result, TDCC and EID became subsidiaries of DowDuPont (the "DWDP Merger"). Prior to the DWDP Merger, DowDuPont did not conduct any business activities other than those required for its formation and matters contemplated by the DWDP Merger Agreement. For purposes of DowDuPont's financial statement presentation, TDCC was determined to be the accounting acquirer in the DWDP Merger and EID's assets and liabilities are reflected at fair value as of the DWDP Merger Effectiveness Time.
Except as otherwise indicated by the context, the term "TDCC" includes TDCC and its consolidated subsidiaries, "EID" includes EID and its consolidated subsidiaries, and "Dow Silicones" means Dow Silicones Corporation, a wholly owned subsidiary of TDCC.
The Consolidated Financial Statements include the accounts of the Company and subsidiaries in which a controlling interest is maintained. For those consolidated subsidiaries in which the Company's ownership is less than 100 percent, the outside stockholders' interests are shown as noncontrolling interests. Investments in affiliates over which the Company has the ability to exercise significant influence but does not have a controlling interest are accounted for under the equity method.
The Company is also involved with certain joint ventures accounted for under the equity method of accounting that are variable interest entities ("VIEs"). The Company is not the primary beneficiary, as the nature of the Company's involvement with the VIEs does not provide it the power to direct the VIEs significant activities. Future events may require these VIEs to be consolidated if the Company becomes the primary beneficiary. At December 31, 2020 and 2019, the maximum exposure to loss related to the nonconsolidated VIEs is not considered material to the Consolidated Financial Statements.
DWDP Distributions
On April 1, 2019, the Company completed the separation of the materials science business through the spin-off of Dow Inc., (“Dow”) including Dow’s subsidiary TDCC (the “Dow Distribution”). On June 1, 2019, the Company completed the separation of the agriculture business through the spin-off of Corteva, Inc. (“Corteva”) including Corteva’s subsidiary EID, (the “Corteva Distribution" and together with the Dow Distribution, the “DWDP Distributions”).
Following the Corteva Distribution, DuPont holds the specialty products business as continuing operations. On June 1, 2019, DowDuPont changed its registered name from "DowDuPont Inc." to "DuPont de Nemours, Inc." doing business as "DuPont." Beginning on June 3, 2019, the Company's common stock is traded on the NYSE under the ticker symbol "DD."
The results of operations of DuPont for the years ended December 31, 2019 and 2018 reflect the historical financial results of Dow and Corteva as discontinued operations, as applicable. The cash flows and comprehensive income related to Dow and Corteva have not been segregated and are included in the Consolidated Statements of Cash Flows and Consolidated Statements of Comprehensive Income, respectively, for the applicable periods. Unless otherwise indicated, the information in the notes to the Consolidated Financial Statements refer only to DuPont's continuing operations and do not include discussion of balances or activity of Dow or Corteva.
N&B Transaction
On December 15, 2019, the Company entered into definitive agreements to separate and combine the Nutrition & Biosciences business segment (the "N&B Business") with International Flavors & Fragrances Inc. ("IFF") in a tax-efficient Reverse Morris Trust transaction.
On February 1, 2021, DuPont completed the separation and distribution of the N&B Business, and merger of Nutrition & Biosciences, Inc. (“N&B”), a DuPont subsidiary formed to hold the N&B Business, with a subsidiary of IFF. The distribution was effected through an exchange offer (the “Exchange Offer”) and the consummation of the Exchange Offer was followed by the merger of N&B with a wholly owned subsidiary of IFF, with N&B surviving the merger as a wholly owned subsidiary of IFF (the “N&B Merger” and, together with the Exchange Offer, the “N&B Transaction”). See Note 25 for more information.
At December 31, 2020, the N&B Business remains classified as held and used and accordingly, its financial results are included in continuing operations for all periods presented.
Use of Estimates in Financial Statement Preparation
The preparation of financial statements in accordance with U.S. GAAP requires the use of estimates and assumptions that affect the reported amounts of assets and liabilities, the disclosure of contingent assets and liabilities at the date of the financial statements, and the reported amounts of revenues and expenses during the reporting period. The Company’s Consolidated Financial Statements include amounts that are based on management’s best estimates and judgments. Actual results could differ from those estimates.
Cash and Cash Equivalents
Cash equivalents represent investments with maturities of three months or less from time of purchase. They are carried at cost plus accrued interest, which approximates fair value.
Restricted Cash
Restricted cash represents trust assets and cash held in escrow. These funds are restricted as to withdrawal or use under the terms of certain contractual agreements. Restricted cash is classified as a current or non-current asset based on the timing and nature of when or how the cash is expected to be used. See Note 6 for further information.
Fair Value Measurements
Under the accounting guidance for fair value measurements and disclosures, a fair value hierarchy was established that prioritizes the inputs to valuation techniques used to measure fair value. The hierarchy gives the highest priority to unadjusted quoted prices in active markets for identical assets or liabilities (Level 1 measurements) and the lowest priority to unobservable inputs (Level 3 measurements). A financial instrument's level within the fair value hierarchy is based on the lowest level of any input that is significant to the fair value measurement.
The Company uses the following valuation techniques to measure fair value for its assets and liabilities:
| | | | | | | | |
| Level 1 | – | Quoted market prices in active markets for identical assets or liabilities; |
| | |
| Level 2 | – | Significant other observable inputs (e.g. quoted prices for similar items in active markets, quoted prices for identical or similar items in markets that are not active, inputs other than quoted prices that are observable such as interest rate and yield curves, and market-corroborated inputs); |
| | |
| Level 3 | – | Unobservable inputs for the asset or liability, which are valued based on management's estimates of assumptions that market participants would use in pricing the asset or liability. |
Foreign Currency Translation
The Company's worldwide operations utilize the U.S. dollar ("USD") or local currency as the functional currency, where applicable. The Company identifies its separate and distinct foreign entities and groups the foreign entities into two categories: 1) extension of the parent or foreign subsidiaries operating in a hyper-inflationary environment (USD functional currency) and 2) self-contained (local functional currency). If a foreign entity does not align with either category, factors are evaluated and a judgment is made to determine the functional currency.
For foreign entities where the USD is the functional currency, all foreign currency-denominated asset and liability amounts are re-measured into USD at end-of-period exchange rates, except for inventories, prepaid expenses, property, plant and equipment, goodwill and other intangible assets, which are re-measured at historical rates. Foreign currency income and expenses are re-measured at average exchange rates in effect during the year, except for expenses related to balance sheet amounts re-measured at historical exchange rates. Exchange gains and losses arising from re-measurement of foreign currency-denominated monetary assets and liabilities are included in income in the period in which they occur.
For foreign entities where the local currency is the functional currency, assets and liabilities denominated in local currencies are translated into USD at end-of-period exchange rates and the resultant translation adjustments are reported, net of their related tax effects, as a component of accumulated other comprehensive loss in equity. Assets and liabilities denominated in other than the local currency are re-measured into the local currency prior to translation into USD and the resultant exchange gains or losses are included in income in the period in which they occur. Income and expenses are translated into USD at average exchange rates in effect during the period.
The Company changes the functional currency of its separate and distinct foreign entities only when significant changes in economic facts and circumstances indicate clearly that the functional currency has changed.
Inventories
The Company's inventories are valued at the lower of cost or net realizable value. Elements of cost in inventories include raw materials, direct labor and manufacturing overhead. Stores and supplies are valued at cost or net realizable value, whichever is lower; cost is generally determined by the average cost method. The Company's inventories are generally accounted for under the average cost method. The Company establishes allowances for obsolescence of inventory based upon quality considerations and assumptions about future demand and market conditions.
In periods of low production, certain fixed costs normally absorbed into inventory are recorded directly to cost of sales in the period incurred.
Property, Plant and Equipment
Property, plant and equipment are carried at cost less accumulated depreciation. In connection with the DWDP Merger, the fair value of EID's property, plant and equipment was determined using a market approach and a replacement cost approach. Depreciation is based on the estimated service lives of depreciable assets and is calculated using the straight-line method. Fully depreciated assets are retained in property and accumulated depreciation accounts until they are removed from service. When assets are surrendered, retired, sold, or otherwise disposed of, their gross carrying values and related accumulated depreciation are removed from the Consolidated Balance Sheets and included in determining gain or loss on such disposals.
Goodwill and Other Intangible Assets
The Company records goodwill when the purchase price of a business acquisition exceeds the estimated fair value of net identified tangible and intangible assets acquired. Goodwill is tested for impairment at the reporting unit level annually during the fourth quarter, or more frequently when events or changes in circumstances indicate that the fair value of a reporting unit has more likely than not declined below its carrying value.
When testing goodwill for impairment, the Company has the option to first perform qualitative testing to determine whether it is more likely than not that the fair value of a reporting unit is less than its carrying value. If the Company chooses not to complete a qualitative assessment for a given reporting unit or if the initial assessment indicates that it is more likely than not that the carrying value of a reporting unit exceeds its estimated fair value, additional quantitative testing is required. If the carrying value of a reporting unit exceeds its fair value, an impairment loss is recognized in the amount by which the carrying value of the reporting unit exceeds its fair value, limited to the amount of goodwill at the reporting unit. The Company determines fair values for each of the reporting units using a combination of the income approach and/or market approach. Under the income approach, fair value is determined based on the present value of estimated future cash flows, discounted at an appropriate risk-adjusted rate. Under the market approach, the Company selects peer sets based on close competitors and reviews the EBIT/EBITDA multiples to determine the fair value. When applicable, third party purchase offers may be utilized to measure fair value. The Company applies a weighting to the market approach and income approach to determine the fair value. See Note 13 for further information on goodwill.
Indefinite-lived intangible assets are tested for impairment at least annually; however, these tests are performed more frequently when events or changes in circumstances indicate that the asset may be impaired. Impairment exists when carrying value exceeds fair value. The Company's fair value methodology is primarily based on discounted cash flow techniques.
Definite-lived intangible assets are amortized over their estimated useful lives, generally on a straight-line basis for periods ranging primarily from 1 to 23 years. The Company continually evaluates the reasonableness of the useful lives of these assets. Once these assets are fully amortized, they are removed from the Consolidated Balance Sheets.
Impairment and Disposals of Long-Lived Assets
The Company evaluates the carrying value of long-lived assets to be held and used when events or changes in circumstances indicate the carrying value may not be recoverable. The carrying value of a long-lived asset group is considered impaired when the total projected undiscounted cash flows from the assets are separately identifiable and are less than its carrying value. In that event, a loss is recognized based on the amount by which the carrying value exceeds the fair value of the long-lived asset group. The Company's fair value methodology is an estimate of fair market value which is made based on prices of similar assets or other valuation methodologies including present value techniques. Long-lived assets to be disposed of by sale, if material, are classified as held for sale and reported at the lower of carrying amount or fair value less cost to sell, and depreciation is ceased. Long-lived assets to be disposed of other than by sale are classified as held and used until they are disposed of and reported at the lower of carrying amount or fair value. Depreciation is recognized over the remaining useful life of the assets.
Leases
The Company determines whether an arrangement is a lease at the inception of the arrangement based on the terms and conditions in the contract. A contract contains a lease if there is an identified asset and the Company has the right to control the asset. Operating lease right-of-use ("ROU") assets are included in "Deferred charges and other assets" on the Consolidated Balance Sheets. Operating lease liabilities are included in "Accrued and other current liabilities" and "Other noncurrent obligations" on the Consolidated Balance Sheets. Finance lease ROU assets are included in "Property, plant and equipment - net" and the corresponding lease liabilities are included in "Short-term borrowings and finance lease obligations" and "Long-term debt" on the Consolidated Balance Sheets.
ROU assets represent the Company’s right to use an underlying asset for the lease term and lease liabilities represent the Company’s obligation to make lease payments arising from the lease. Operating lease ROU assets and liabilities are recognized at the commencement date based on the present value of lease payments over the lease term. As most of the Company’s leases do not provide the lessor's implicit rate, the Company uses its incremental borrowing rate at the commencement date in determining the present value of lease payments. Lease terms include options to extend the lease when it is reasonably certain those options will be exercised. Leases with an initial term of 12 months or less are not recorded on the balance sheet, and lease expense is recognized on a straight-line basis over the lease term.
The Company has lease agreements with lease and non-lease components, which are accounted for as a single lease component for all asset classes. Additionally, for certain equipment leases, the portfolio approach is applied to account for the operating lease ROU assets and lease liabilities. In the Consolidated Statements of Operations, lease expense for operating lease payments is recognized on a straight-line basis over the lease term. For finance leases, interest expense is recognized on the lease liability and the ROU asset is amortized over the lease term. See Note 16 for additional information regarding the Company's leases.
Derivative Instruments
Derivative instruments are reported in the Consolidated Balance Sheets at their fair values. The Company utilizes derivatives to manage exposures to foreign currency exchange rates and commodity prices. Changes in the fair values of derivative instruments that are not designated as hedges are recorded in current period earnings. For derivative instruments designated as cash flow hedges, the gain or loss is reported in "Accumulated other comprehensive loss" ("AOCL") until it is cleared to earnings during the same period in which the hedged item affects earnings.
In the event that a derivative designated as a hedge of a firm commitment or an anticipated transaction is terminated prior to the maturation of the hedged transaction, the net gain or loss in AOCL generally remains in AOCL until the item that was hedged affects earnings. If a hedged transaction matures, or is sold, extinguished, or terminated prior to the maturity of a derivative designated as a hedge of such transaction, gains or losses associated with the derivative through the date the transaction matured are included in the measurement of the hedged transaction and the derivative is reclassified as for trading purposes. Derivatives designated as hedges of anticipated transactions are reclassified as for trading purposes if the anticipated transaction is no longer probable.
Environmental Matters
Accruals for environmental matters are recorded when it is probable that a liability has been incurred and the amount of the liability can be reasonably estimated. These accruals are adjusted periodically as assessment and remediation efforts progress or as additional technical or legal information becomes available. Accruals for environmental liabilities are included in the Consolidated Balance Sheets in "Accrued and other current liabilities" and "Other noncurrent obligations" at undiscounted amounts. Accruals for related insurance or other third-party recoveries for environmental liabilities are recorded when it is probable that a recovery will be realized and are included in the Consolidated Balance Sheets as "Accounts and notes receivable - net."
Environmental costs are capitalized if the costs extend the life of the property, increase its capacity, and/or mitigate or prevent contamination from future operations. Environmental costs are also capitalized in recognition of legal asset retirement obligations resulting from the acquisition, construction and/or normal operation of a long-lived asset. Costs related to environmental contamination treatment and cleanup are charged to expense. Estimated future incremental operations, maintenance and management costs directly related to remediation are accrued when such costs are probable and reasonably estimable.
Revenue Recognition
The Company recognizes revenue when its customer obtains control of promised goods or services, in an amount that reflects the consideration which the Company expects to receive in exchange for those goods or services. To determine revenue recognition for the arrangements that the Company determines are within the scope of FASB ASU No. 2014-09, Revenue from Contracts with Customers (Topic 606), the Company performs the following five steps: (1) identify the contract(s) with a
customer, (2) identify the performance obligations in the contract, (3) determine the transaction price, (4) allocate the transaction price to the performance obligations in the contract, and (5) recognize revenue when (or as) the entity satisfies a performance obligation. See Note 4 for additional information on revenue recognition.
Cost of Sales
Cost of sales primarily includes the cost of manufacture and delivery, ingredients or raw materials, direct salaries, wages and benefits and overhead, non-capitalizable costs associated with capital projects and other operational expenses. No amortization of intangibles is included within costs of sales.
Research and Development
Research and development costs are expensed as incurred. Research and development expense includes costs (primarily consisting of employee costs, materials, contract services, research agreements, and other external spend) relating to the discovery and development of new products, enhancement of existing products and regulatory approval of new and existing products.
Selling, General and Administrative Expenses
Selling, general and administrative expenses primarily include selling and marketing expenses, commissions, functional costs, and business management expenses.
Integration and Separation Costs
Integration and separation costs primarily consist of financial advisory, information technology, legal, accounting, consulting, and other professional advisory fees associated with the preparation and execution of activities related to the separation of the Nutrition & Biosciences business, the DWDP Merger, post-DWDP Merger integration, and the DWDP Distributions.
Litigation
Accruals for legal matters are recorded when it is probable that a liability has been incurred and the amount of the liability can be reasonably estimated. Legal costs, such as outside counsel fees and expenses, are charged to expense in the period incurred.
Severance Costs
Severance benefits are provided to employees under the Company's ongoing benefit arrangements. Severance costs are accrued when management commits to a plan of termination and it becomes probable that employees will be entitled to benefits at amounts that can be reasonably estimated.
Income Taxes
The Company accounts for income taxes using the asset and liability method. Under this method, deferred tax assets and liabilities are recognized for the future tax consequences of temporary differences between the carrying amounts and tax bases of assets and liabilities using enacted tax rates. The effect of a change in tax rates on deferred tax assets or liabilities is recognized in income in the period that includes the enactment date.
The Company recognizes the financial statement effects of an uncertain income tax position when it is more likely than not, based on the technical merits, that the position will be sustained upon examination. The Company accrues for other tax contingencies when it is probable that a liability to a taxing authority has been incurred and the amount of the contingency can be reasonably estimated. The current portion of uncertain income tax positions is included in "Income taxes payable" and the long-term portion is included in "Other noncurrent obligations" in the Consolidated Balance Sheets.
NOTE 2 - RECENT ACCOUNTING GUIDANCE
Recently Adopted Accounting Guidance
In June 2016, the FASB issued ASU No. 2016-13, Financial Instruments - Credit Losses (Topic 326): Measurement of Credit Losses on Financial Instruments, and associated ASUs related to Topic 326. The new guidance introduces the current expected credit loss (“CECL”) model, which requires organizations to record an allowance for credit losses for certain financial instruments and financial assets, including trade receivables, based on expected losses rather than incurred losses. Under this update, on initial recognition and at each reporting period, an entity will be required to recognize an allowance that reflects the entity’s current estimate of credit losses expected to be incurred over the life of the financial instrument. This update became effective for fiscal years, and interim periods within those fiscal years, beginning after December 15, 2019.
The Company adopted the new standard in the first quarter of 2020, which required a modified retrospective transition approach, recording the cumulative-effect adjustment at the date of initial adoption. This cumulative-effect has been reflected as of January 1, 2020 and prior periods have not been restated. The impact of initial adoption was not material to the Company’s Consolidated Balance Sheet, Consolidated Statements of Operations, and Consolidated Statement of Cash Flows.
NOTE 3 - DIVESTITURES
Separation Agreements
In connection with the Dow Distribution and the Corteva Distribution, the Company entered into certain agreements that, among other things, effected the separations, provides for the allocation of assets, employees, liabilities and obligations (including its investments, property and employee benefits and tax-related assets and liabilities) among DuPont, Dow, and Corteva (together, the “Parties” and each a “Party”), and provides a framework for DuPont’s relationship with Dow and Corteva following the DWDP Distributions. Effective April 1, 2019, the Parties entered into the following agreements referred to herein as: the DWDP Separation and Distribution Agreement; the DWDP Tax Matters Agreement; the DWDP Employee Matters Agreement; and the Intellectual Property Cross-License Agreement (the “DuPont-Dow IP Cross-License Agreement”). In addition to the agreements above, DuPont has entered into certain various supply agreements with Dow. These agreements provide for different pricing than the historical intercompany and intracompany practices prior to the DWDP Distributions.
Effective June 1, 2019, in connection with the Corteva Distribution, DuPont and Corteva entered into the following agreements: the Intellectual Property Cross-License Agreement (the “DuPont-Corteva IP Cross-License Agreement”); the Letter Agreement; and the Amended and Restated DWDP Tax Matters Agreement.
Certain internal distributions and reorganizations, and the distributions of Dow on April 1, 2019, and of Corteva on June 1, 2019, qualified as tax-free transactions under the applicable sections of the Internal Revenue Code. If the completed distribution of Corteva or Dow, in each case, together with certain related transactions, were to fail to qualify for non-recognition treatment for U.S. federal income tax purposes, then the Company could be subject, under the DWDP Tax Matters Agreement, to significant tax and indemnification liability. To the extent that the Company is responsible for any liability under the Amended and Restated DWDP Tax Matters Agreement there could be a material adverse impact on the Company's business, financial condition, results of operations and cash flows in future reporting periods.
In connection with the DWDP Distributions, Dow and Corteva indemnify the Company against, and DuPont indemnifies Dow and Corteva against certain litigation, environmental, income taxes, and other liabilities that arose prior to the DWDP Distributions, as applicable. The term of this indemnification is generally indefinite and includes defense costs and expenses, as well as monetary and non-monetary settlements and judgments. Refer to Note 15 for additional information regarding treatment of litigation and environmental related matters under the DWDP Separation and Distribution Agreement and the Letter Agreement.
Materials Science Division
On April 1, 2019, DowDuPont completed the separation of its Materials Science businesses, including the businesses and operations that comprised the Company's former Performance Materials & Coating, Industrial Intermediates & Infrastructure and the Packaging & Specialty Plastics segments, (the "Materials Science Division") through the consummation of the Dow Distribution.
On April 1, 2019, prior to the Dow Distribution, the Company contributed $2,024 million in cash to Dow.
The results of operations of the Materials Science Division are presented as discontinued operations as summarized below:
| | | | | | | | |
| In millions | 2019 | 2018 |
| Net sales | $ | 10,867 | | $ | 49,224 | |
| Cost of sales | 8,917 | | 40,187 | |
| Research and development expenses | 163 | | 670 | |
| Selling, general and administrative expenses | 329 | | 1,304 | |
| Amortization of intangibles | 116 | | 469 | |
| Restructuring and asset related charges - net | 157 | | 219 | |
| Integration and separation costs | 44 | | 135 | |
| Equity in earnings of nonconsolidated affiliates | (13) | | 554 | |
| Sundry income (expense) - net | 48 | | 242 | |
| Interest expense | 240 | | 1,062 | |
| Income from discontinued operations before income taxes | 936 | | 5,974 | |
| Provision for income taxes on discontinued operations | 207 | | 1,490 | |
| Income from discontinued operations, net of tax | 729 | | 4,484 | |
| Income from discontinued operations attributable to noncontrolling interests, net of tax | 37 | | 102 | |
| Income from discontinued operations attributable to DuPont stockholders, net of tax | $ | 692 | | $ | 4,382 | |
The following table presents depreciation, amortization, and capital expenditures of the discontinued operations related to the Materials Science Division:
| | | | | | | | |
| In millions | 2019 | 2018 |
| Depreciation and amortization | $ | 744 | | $ | 2,835 | |
| Capital expenditures | $ | 597 | | $ | 2,062 | |
| | |
Agriculture Division
On June 1, 2019, the Company completed the separation of its Agriculture business, including the businesses and operations that comprised the Company's former Agriculture segment (the "Agriculture Division"), through the consummation of the Corteva Distribution.
In 2019, prior to the distribution of Corteva, the Company contributed $7,139 million in cash to Corteva, a portion of which was used to retire indebtedness of EID.
The results of operations of the Agriculture Division are presented as discontinued operations as summarized below:
| | | | | | | | |
| In millions | 2019 | 2018 |
| Net sales | $ | 7,144 | | $ | 14,159 | |
| Cost of sales | 4,218 | | 9,838 | |
| Research and development expenses | 470 | | 1,320 | |
| Selling, general and administrative expenses | 1,294 | | 2,377 | |
| Amortization of intangibles | 176 | | 390 | |
| Restructuring and asset related charges - net | 117 | | 739 | |
| Integration and separation costs | 430 | | 441 | |
| Equity in earnings of nonconsolidated affiliates | (4) | | — | |
| Sundry income (expense) - net | 40 | | 258 | |
| Interest expense | 91 | | 387 | |
| Income (Loss) from discontinued operations before income taxes | 384 | | (1,075) | |
| Provision for (Benefit from) income taxes on discontinued operations | 62 | | (191) | |
| Income (Loss) from discontinued operations, net of tax | $ | 322 | | $ | (884) | |
| Income from discontinued operations attributable to noncontrolling interests, net of tax | 35 | | 14 | |
| Income (Loss) from discontinued operations attributable to DuPont stockholders, net of tax | $ | 287 | | $ | (898) | |
The following table presents depreciation, amortization, and capital expenditures of the discontinued operations related to the Agriculture Division:
| | | | | | | | |
| In millions | 2019 | 2018 |
| Depreciation and amortization | $ | 385 | | $ | 913 | |
| Capital expenditures | $ | 383 | | $ | 531 | |
| | |
Other Discontinued Operations Activity
For the year ended December 31, 2020, the Company recorded a "Loss from discontinued operations, net of tax" in the Company's Consolidated Statements of Operations of $49 million. The loss primarily relates to litigation matters (refer to Note 15) partially offset by a gain related to the DWDP Tax Matters Agreement. For the year ended December 31, 2019, the Company recorded "Income from discontinued operations, net of tax" in the Company's Consolidated Statements of Operations of $86 million related to the adjustment of certain unrecognized tax benefits for positions taken on items from prior years from previously divested businesses and $80 million related to changes in accruals for certain prior year tax positions related to the divested crop protection business and research and development assets of EID.
Assets Held for Sale
In October 2020, the Company entered into a definitive agreement to sell its Biomaterials business unit, which includes the Company's equity method investment in DuPont Tate & Lyle Bio Products, for $240 million. In January 2021, the Company entered into a definitive agreement to sell its Clean Technologies business unit for $510 million. Both transactions are subject to customary closing conditions and are expected to close in the first half of 2021. The assets and liabilities associated with these businesses, which are reported in Non-Core, met the held for sale criteria at December 31, 2020.
The following table summarizes the carrying value of the major assets and liabilities of the Biomaterials and Clean Technologies business units as of December 31, 2020 (collectively, the “Non-Core Held for Sale Disposal Groups”):
| | | | | |
| In millions | December 31, 2020 |
| Assets | |
| Accounts and notes receivable - net | $ | 63 | |
| Inventories | 75 | |
| Other current assets | 35 | |
| Investments and noncurrent receivables | 164 | |
| Property, plant and equipment - net | 34 | |
| Goodwill | 267 | |
| Other intangible assets | 168 | |
| Deferred charges and other assets | 4 | |
| Assets held for sale | $ | 810 | |
| Liabilities | |
| Accounts payable | $ | 40 | |
| Income taxes payable | 1 | |
| Accrued and other current liabilities | 50 | |
| Deferred income tax liabilities | 30 | |
| Pension and other post-employment benefits - noncurrent | 1 | |
| Other noncurrent obligations | 18 | |
| Liabilities related to assets held for sale | $ | 140 | |
In connection with the held for sale classification, the Non-Core Held for Sale Disposal Groups were measured at fair value less estimated cost to sell. As a result, the Company recorded a $25 million pre-tax goodwill impairment charge during the third quarter of 2020 which is reflected in “Goodwill impairment charges” in the Company’s Consolidated Statements of Operations for the year ended December 31, 2020. See Note 5 for further information on the asset impairments recorded related to the Non-Core Held for Sale Disposal Groups.
Sale of TCS/HSC Disposal Group
In the third quarter of 2020, the Company completed the sale of its trichlorosilane business (“TCS Business”) along with its equity ownership interest in DC HSC Holdings LLC and Hemlock Semiconductor L.L.C. (the "HSC Group,” and together with the TCS Business, the “TCS/HSC Disposal Group” and the sale of the TCS/HSC Disposal Group, the “TCS/HSC Disposal”) to the HSC Group, both of which were part of the Non-Core segment. In connection with the TCS/HSC Disposal, the Company received $550 million in cash at closing, subject to certain claw-back provisions, and will receive an additional $175 million in
equal installments over the course of the next three years associated with the settlement of an existing supply agreement dispute with the HSC Group. The TCS/HSC Disposal resulted in a net pre-tax benefit of $396 million ($236 million net of tax), including the settlement of the supply agreement dispute and after allocation of goodwill to the TCS Business. The net pre-tax benefit is recorded in “Sundry income (expense) – net” in the Company’s Consolidated Statements of Operations for the year ended December 31, 2020.
Sale of Compound Semiconductor Solutions
In the first quarter of 2020, the Company completed the sale of its Compound Semiconductor Solutions business unit, a part of the Electronics & Imaging segment, to SK Siltron. The proceeds received in the first quarter of 2020 related to the sale of the business were approximately $420 million. The sale resulted in a pre-tax gain of $197 million ($102 million net of tax) recorded in "Sundry income (expense) - net" in the Company's Consolidated Statements of Operations for the year ended December 31, 2020.
Sale of DuPont Sustainable Solutions
In the third quarter of 2019, the Company completed the sale of its Sustainable Solutions business unit, a part of the Non-Core segment, to Gyrus Capital. The sale resulted in a pre-tax gain of $28 million ($22 million net of tax). The gain was recorded in "Sundry income (expense) - net" in the Company's Consolidated Statements of Operations for the year ended December 31, 2019.
Integration and Separation Costs
Integration and separation costs for continuing operations through December 31, 2020 primarily have consisted of financial advisory, information technology, legal, accounting, consulting, and other professional advisory fees associated with the preparation and execution of activities related to the separation of the Nutrition & Biosciences business beginning in the fourth quarter of 2019, the DWDP Merger, post-DWDP Merger integration, and the DWDP Distributions.
These costs are recorded within "Integration and separation costs" within the Consolidated Statements of Operations.
| | | | | | | | | | | |
| In millions | 2020 | 2019 | 2018 |
| Integration and separation costs | $ | 594 | | $ | 1,342 | | $ | 1,887 | |
NOTE 4 - REVENUE
Revenue Recognition
Products
Substantially all of DuPont's revenue is derived from product sales. Product sales consist of sales of DuPont's products to supply manufacturers and distributors. DuPont considers purchase orders, which in some cases are governed by master supply agreements, to be a contract with a customer. Contracts with customers are considered to be short-term when the time between order confirmation and satisfaction of the performance obligations is equal to or less than one year.
Revenue from product sales is recognized when the customer obtains control of the Company’s product, which occurs at a point in time, usually upon shipment, with payment terms typically in the range of 30 to 60 days after invoicing depending on business and geographic region. The Company elected the practical expedient to not adjust the amount of consideration for the effects of a significant financing component for all instances in which the period between payment and transfer of the goods will be one year or less. When the Company performs shipping and handling activities after the transfer of control to the customer (e.g., when control transfers prior to shipment), these are considered fulfillment activities, and accordingly, the costs are accrued when the related revenue is recognized. Taxes collected from customers relating to product sales and remitted to governmental authorities are excluded from revenues. The Company elected to use the practical expedient to expense cash and non-cash sales incentives as the amortization period for the costs to obtain the contract would have been one year or less.
The transaction price includes estimates for reductions in revenue from customer rebates and rights of return on product sales. These amounts are estimated based upon the most likely amount of consideration to which the customer will be entitled. All estimates are based on historical experience, anticipated performance, and the Company’s best judgment at the time to the extent it is probable, that a significant reversal of revenue recognized will not occur. All estimates for variable consideration are reassessed periodically.
For contracts with multiple performance obligations, the Company allocates the transaction price to each performance obligation based on the relative standalone selling price. The standalone selling price is the observable price which depicts the price as if sold to a similar customer in similar circumstances.
Disaggregation of Revenue
The Company disaggregates its revenue from contracts with customers by segment and business or major product line and geographic region, as the Company believes it best depicts the nature, amount, timing and uncertainty of its revenue and cash flows. Refer to Note 23 for the breakout of net sales by geographic region.
During the second quarter of 2020, Electronics & Imaging realigned a component within the Semiconductor Technologies product line to the Image Solutions product line. The reporting changes have been retrospectively reflected for all periods presented. The table below does not reflect the impact of the 2021 Segment Realignment (refer to Note 23).
| | | | | | | | | | | |
| Net Trade Revenue by Segment and Business or Major Product Line | 2020 | 2019 | 2018 |
| In millions |
| Image Solutions | $ | 686 | | $ | 687 | | $ | 687 | |
| Interconnect Solutions | 1,280 | | 1,187 | | 1,174 | |
| Semiconductor Technologies | 1,848 | | 1,680 | | 1,774 | |
| Electronics & Imaging | $ | 3,814 | | $ | 3,554 | | $ | 3,635 | |
| Food & Beverage | $ | 2,917 | | $ | 2,945 | | $ | 2,987 | |
| Health & Biosciences | 2,317 | | 2,317 | | 2,405 | |
| Pharma Solutions | 825 | | 814 | | 824 | |
| Nutrition & Biosciences | $ | 6,059 | | $ | 6,076 | | $ | 6,216 | |
| Healthcare & Specialty | $ | 1,368 | | $ | 1,492 | | $ | 1,581 | |
| Industrial & Consumer | 968 | | 1,138 | | 1,309 | |
| Mobility Solutions | 1,853 | | 2,320 | | 2,532 | |
| Transportation & Industrial | $ | 4,189 | | $ | 4,950 | | $ | 5,422 | |
| Safety Solutions | $ | 2,291 | | $ | 2,549 | | $ | 2,483 | |
| Shelter Solutions | 1,426 | | 1,535 | | 1,796 | |
| Water Solutions | 1,276 | | 1,117 | | 1,015 | |
| Safety & Construction | $ | 4,993 | | $ | 5,201 | | $ | 5,294 | |
| Biomaterials | $ | 141 | | $ | 211 | | $ | 284 | |
| Clean Technologies | 237 | | 278 | | 301 | |
| DuPont Teijin Films | 173 | | 172 | | 198 | |
Photovoltaic & Advanced Materials 1 | 791 | | 962 | | 1,085 | |
Sustainable Solutions 2 | — | | 108 | | 159 | |
| Non-Core | $ | 1,342 | | $ | 1,731 | | $ | 2,027 | |
| Total | $ | 20,397 | | $ | 21,512 | | $ | 22,594 | |
1.The TCS Business within Photovoltaic & Advanced Materials was divested in the third quarter of 2020.
2.The Sustainable Solutions business was divested in third quarter of 2019.
Contract Balances
From time to time, the Company enters into arrangements in which it receives payments from customers based upon contractual billing schedules. The Company records accounts receivables when the right to consideration becomes unconditional. Contract assets include amounts related to the Company’s conditional right to consideration for completed performance obligations not yet invoiced. Contract liabilities primarily reflect deferred revenue from advance payment for product that the Company has received from customers. The Company classifies deferred revenue as current or noncurrent based on the timing of when the Company expects to recognize revenue.
Revenue recognized for the years ended December 31, 2020 and 2019 from amounts included in contract liabilities at the beginning of the period was $31 million and $30 million, respectively. The amount of contract assets reclassified to receivables as a result of the right to the transaction consideration becoming unconditional was insignificant. The Company did not recognize any asset impairment charges related to contract assets during the period.
| | | | | | | | |
| Contract Balances | December 31, 2020 | December 31, 2019 |
| In millions |
Accounts and notes receivable - trade 1 | $ | 2,872 | | $ | 3,007 | |
Contract assets - current 2 | $ | — | | $ | 35 | |
Deferred revenue - current 3 | $ | 16 | | $ | 20 | |
Deferred revenue - noncurrent 4 | $ | 21 | | $ | 24 | |
1.Included in "Accounts and notes receivable - net" in the Consolidated Balance Sheets.
2.Included in "Other current assets" in the Consolidated Balance Sheets.
3.Included in "Accrued and other current liabilities" in the Consolidated Balance Sheets.
4.Included in "Other noncurrent obligations" in the Consolidated Balance Sheets.
NOTE 5 - RESTRUCTURING AND ASSET RELATED CHARGES - NET
Charges for restructuring programs and asset related charges, which includes asset impairments, were $849 million, $314 million and $147 million for the years ended December 31, 2020, 2019, and 2018, respectively. These charges were recorded in "Restructuring and asset related charges - net" in the Consolidated Statements of Operations. The total liability related to restructuring programs was $106 million at December 31, 2020 and $162 million at December 31, 2019, recorded in "Accrued and other current liabilities" in the Consolidated Balance Sheets. Restructuring activity consists of the following programs:
2020 Restructuring Program
In the first quarter of 2020, the Company approved restructuring actions designed to capture near-term cost reductions and to further simplify certain organizational structures in anticipation of the N&B Transaction (the "2020 Restructuring Program").
The following tables summarize the charges related to the 2020 Restructuring Program:
| | | | | |
| 2020 |
| In millions |
| Severance and related benefit costs | $ | 129 | |
| Asset related charges | 50 | |
| Total restructuring and asset related charges - net | $ | 179 | |
| | | | | | |
| 2020 Restructuring Program Charges by Segment | 2020 | |
| In millions | |
| Electronics & Imaging | $ | 10 | | |
| Nutrition & Biosciences | 10 | | |
| Transportation & Industrial | 18 | | |
| Safety & Construction | 57 | | |
| Non-Core | — | | |
Corporate | 84 | | |
| Total | $ | 179 | | |
The following table summarizes the activities related to the 2020 Restructuring Program:
| | | | | | | | | | | | | |
| 2020 Restructuring Program | Severance and Related Benefit Costs | Asset Related Charges | Total | | |
| In millions |
| Year-to-date restructuring charges | $ | 129 | | $ | 50 | | $ | 179 | | | |
| Charges against the reserve | — | | (50) | | (50) | | | |
| Cash payments | (61) | | — | | (61) | | | |
| Reserve balance at December 31, 2020 | $ | 68 | | $ | — | | $ | 68 | | | |
At December 31, 2020, total liabilities related to the 2020 Restructuring Program were $68 million, recorded in "Accrued and other current liabilities" in the Consolidated Balance Sheets. The 2020 Restructuring Program is considered substantially complete at December 31, 2020.
2019 Restructuring Program
During the second quarter of 2019 and in connection with the ongoing integration activities, DuPont approved restructuring actions to simplify and optimize certain organizational structures following the completion of the DWDP Distributions (the "2019 Restructuring Program"). The Company recorded pre-tax restructuring charges of $140 million inception-to-date, consisting of severance and related benefit costs of $106 million and asset related charges of $34 million.
The following tables summarize the charges incurred related to the 2019 Restructuring Program:
| | | | | | | | |
| In millions | 2020 | 2019 |
| Severance and related benefit costs | $ | 2 | | $ | 104 | |
| Asset related charges | — | | 34 | |
| Total restructuring and asset related charges - net | $ | 2 | | $ | 138 | |
| | | | | | | | |
| 2019 Restructuring Program Charges (Credits) by Segment | 2020 | 2019 |
| In millions |
| Electronics & Imaging | $ | (3) | | $ | 47 | |
| Nutrition & Biosciences | (3) | | 20 | |
| Transportation & Industrial | (7) | | 19 | |
| Safety & Construction | (14) | | 25 | |
| Non-Core | — | | 4 | |
Corporate | 29 | | 23 | |
| Total | $ | 2 | | $ | 138 | |
The following table summarizes the activities related to the 2019 Restructuring Program.
| | | | | |
| 2019 Restructuring Program | Severance and Related Benefit Costs |
| In millions |
| Reserve balance at December 31, 2019 | $ | 86 | |
| Year-to-date restructuring charges | 2 | |
| Non-cash compensation | (6) | |
| Cash payments | (64) | |
| Reserve balance at December 31, 2020 | $ | 18 | |
Total liabilities related to the 2019 Restructuring Program were $18 million at December 31, 2020 and $86 million at December 31, 2019, respectively, and recorded in "Accrued and other current liabilities" in the Consolidated Balance Sheets. The 2019 Restructuring Program was considered substantially complete at June 30, 2020.
DowDuPont Cost Synergy Program
In September and November 2017, the Company approved post-merger restructuring actions under the DowDuPont Cost Synergy Program, which was designed to integrate and optimize the organization following the DWDP Merger and in preparation for the DWDP Distributions. The portions of the charges, costs and expenses attributable to integration and optimization within the Agriculture and Materials Sciences Divisions are reflected in discontinued operations. The Company has recorded pretax restructuring charges attributable to the continuing operations of DuPont of $492 million inception-to-date, consisting of severance and related benefit costs of $213 million, asset related charges of $212 million and contract termination charges and other charges of $67 million.
The following tables summarize the charges incurred related to the DowDuPont Cost Synergy Program:
| | | | | | | | | | | |
| In millions | 2020 | 2019 | 2018 |
| Severance and related benefit (credits) costs | $ | (2) | | $ | 46 | | $ | 97 | |
| Contract termination charges | 6 | | 17 | | 12 | |
| Asset related charges | 3 | | 54 | | 42 | |
Total restructuring and asset related charges - net 1 | $ | 7 | | $ | 117 | | $ | 151 | |
1.The charge for the years ended December 31, 2019 and 2018 includes $113 million and $147 million, respectively, which was recognized in "Restructuring and asset related charges - net" and $4 million which was recognized in "Equity in earnings of nonconsolidated affiliates" in the Consolidated Statements of Operations.
| | | | | | | | | | | |
| DowDuPont Cost Synergy Program Charges (Credits) by Segment | 2020 | 2019 | 2018 |
| In millions |
| Electronics & Imaging | $ | — | | $ | — | | $ | 2 | |
| Nutrition & Biosciences | — | | 39 | | 29 | |
| Transportation & Industrial | 1 | | — | | 2 | |
| Safety & Construction | 5 | | 7 | | 24 | |
| Non-Core | 3 | | — | | (8) | |
Corporate 1 | (2) | | 71 | | 102 | |
| Total | $ | 7 | | $ | 117 | | $ | 151 | |
1.Severance and related benefit costs were recorded at Corporate.
The following table summarized the activities related to the DowDuPont Cost Synergy Program:
| | | | | | | | | | | | | | |
| DowDuPont Cost Synergy Program | Severance and Related Benefit Costs | Contract Termination Charges | Asset Related Charges | Total |
| In millions |
| Reserve balance at December 31, 2019 | $ | 74 | | $ | 2 | | $ | — | | $ | 76 | |
| Year-to-date restructuring (credits) charges | (2) | | 6 | | 3 | | 7 | |
| Charges against the reserve | — | | (1) | | (3) | | (4) | |
| Cash payments | (57) | | (2) | | — | | (59) | |
| Reserve balance at December 31, 2020 | $ | 15 | | $ | 5 | | $ | — | | $ | 20 | |
Total liabilities related to the DowDuPont Cost Synergy Program were $20 million at December 31, 2020 and $76 million in December 31, 2019, respectively, and recorded in "Accrued and other current liabilities," in the Consolidated Balance Sheets. The DowDuPont Cost Synergy Program is considered substantially complete at June 30, 2020.
Asset Impairments
In the third quarter of 2020, the TCS/HSC Disposal within the Non-Core segment, as well as further softening conditions in the aerospace markets, gave rise to fair value indicators and, thus, served as triggering events requiring the Company to perform a recoverability assessment related to asset groups within its Photovoltaic and Advanced Materials (“PVAM”) business unit. The Company first performed a long-lived asset impairment test and determined that, based on undiscounted cash flows, the carrying amount of certain long-lived assets was not recoverable. Accordingly, the Company estimated the fair value of these assets using both an income approach and a market approach utilizing Level 3 unobservable inputs. As a result, the Company recognized a pre-tax impairment charge of $318 million ($242 million net of tax) recorded within “Restructuring and asset related charges - net” in the Consolidated Statements of Operations for the year ended December 31, 2020 with the charge impacting definite-lived intangible assets and property, plant, and equipment. See Note 13 for further discussion of goodwill impairment charges recorded during the third quarter of 2020 resulting from the above triggering events.
Additionally, the Company recorded a pre-tax asset impairment charge of $52 million ($39 million net of tax) in the third quarter of 2020 related to indefinite-lived intangible assets within the Non-Core segment which were deemed no longer recoverable as a result of the Non-Core Held for Sale Disposal Groups classification (refer to Note 3 for additional information). The charge was recorded within “Restructuring and asset related charges – net” in the Consolidated Statements of Operations for the year ended December 31, 2020.
In the second quarter of 2020, the Company recorded a pre-tax asset impairment charge of $21 million ($16 million net of tax) related to indefinite-lived intangible assets within the Transportation & Industrial segment. This charge was recorded within
“Restructuring and asset related charges - net” in the Consolidated Statements of Operations for the year ended December 31, 2020. See Note 13 for further discussion.
In the first quarter of 2020, expectations of proceeds related to certain potential divestitures within the Non-Core segment gave rise to fair value indicators and, thus, triggering events requiring the Company to perform a recoverability assessment related to its Biomaterials business unit. The Company performed a long-lived asset impairment test and determined that, based on undiscounted cash flows, the carrying amount of certain long-lived assets was not recoverable. Accordingly, the Company estimated the fair value of these assets using a market approach utilizing Level 3 unobservable inputs. As a result, the Company recognized a pre-tax impairment charge of $270 million ($206 million net of tax) recorded within “Restructuring and asset related charges - net” in the Consolidated Statements of Operations for the year ended December 31, 2020 with the charge impacting definite-lived intangible assets and property, plant, and equipment.
Equity Method Investment Impairment Related Charges
In preparation for the Corteva Distribution, EID completed the separation of the assets and liabilities related to its specialty products businesses into separate legal entities (the “SP Legal Entities”) and on May 1, 2019, EID distributed the SP Legal Entities to DowDuPont (the “Internal SP Distribution”). The Internal SP Distribution served as a triggering event requiring the Company to perform an impairment analysis related to equity method investments held by the Company as of May 1, 2019. The Company applied the net asset value method under the cost approach to determine the fair value of the equity method investments in the Nutrition & Biosciences segment. Based on updated projections, the Company determined the fair value of the equity method investment was below the carrying value and had no expectation the fair value would recover in the short-term due to the current economic environment. As a result, management concluded the impairment was other-than-temporary and recorded a pre-tax impairment charge of $63 million ($47 million net of tax) in “Restructuring and asset related charges - net” in the Consolidated Statements of Operations related to the Nutrition & Biosciences segment for the year ended December 31, 2019.
NOTE 6 - SUPPLEMENTARY INFORMATION
| | | | | | | | | | | | | |
| Sundry Income (Expense) - Net | | |
| In millions | 2020 | 2019 | 2018 | | |
| Non-operating pension and other post-employment benefit costs | $ | 32 | | $ | 74 | | $ | 96 | | | |
| Interest income | 10 | | 55 | | 39 | | | |
Net gain on divestiture and sales of other assets and investments 1, 2, 3 | 642 | | 157 | | 8 | | | |
Foreign exchange (losses) gains, net 4 | (56) | | (110) | | (93) | | | |
| Net loss on divestiture and changes in joint venture ownership | — | | — | | (41) | | | |
Miscellaneous income (expenses) - net 5 | 47 | | (23) | | 83 | | | |
| Sundry income (expense) - net | $ | 675 | | $ | 153 | | $ | 92 | | | |
1.The year ended December 31, 2020 includes a net benefit of $396 million related to the TCS/HSC Disposal, including the settlement of a supply agreement dispute, within the Non-Core segment. Refer to Note 3 for further information.
2. The year ended December 31, 2020 includes income of $197 million related to the gain on sale of the Compound Semiconductor Solutions business unit within the Electronics & Imaging segment. Refer to Note 3 for further information.
3. The year ended December 31, 2020 includes income of $30 million related to milestone achievement of a prior year sale of assets within the Electronics & Imaging segment. The year ended December 31, 2019 includes income of $92 million, related to a sale of assets within the Electronics & Imaging segment and as well as a gain of $28 million related to the sale of the Sustainable Solutions business unit within the Non-Core segment.
4. Includes a $50 million foreign exchange loss for the year ended December 31, 2018 related to adjustments to EID's foreign currency exchange contracts as a result of U.S. tax reform.
5. Miscellaneous income and expenses - net, for the year ended December 31, 2020 includes $17 million related to income from a tax indemnification. The year ended December 31, 2019 includes a $48 million charge reflecting a reduction in gross proceeds from lower withholding taxes related to a prior year legal settlement and a $74 million charge related to tax indemnifications, primarily associated with an adjustment to a one-time transition tax liability required by the Tax Cuts and Jobs Act of 2017, which were recorded in accordance with the Amended and Restated DWDP Tax Matters Agreement. These charges were offset by various indemnification and lease income amounts. The year ended December 31, 2019 also includes $26 million related to licensing income within the Safety & Construction segment. The miscellaneous income for the year ended 2018 primarily relates to legal settlements.
Cash, Cash Equivalents and Restricted Cash
On September 16, 2020, N&B completed an offering of $6.25 billion of senior unsecured notes (the “N&B Notes Offering”). The net proceeds of approximately $6.2 billion from the N&B Notes Offering were deposited into an escrow account. At December 31, 2020, the Company had approximately $6.2 billion in net proceeds from the N&B Notes Offering recorded within non-current “Restricted cash” in the Consolidated Balance Sheets. See Note 14 for further discussion of the N&B Notes Offering.
From time to time, the Company is required to set aside funds for various activities that arise in the normal course of business. These funds typically have legal restrictions associated with them and are deposited in an escrow account or held in a separately identifiable account by the Company. EID entered into a trust agreement in 2013 (as amended and restated in 2017), establishing and requiring EID to fund a trust (the "Trust") for cash obligations under certain non-qualified benefit and deferred compensation plans upon a change in control event as defined in the Trust agreement. Under the Trust agreement, the consummation of the DWDP Merger was a change in control event. After the distribution of Corteva, the Trust assets related to Corteva employees were transferred to a new trust for Corteva (the "Corteva Trust"). As a result, the Trust currently held by DuPont relates to funding obligations to DuPont employees. At December 31, 2020, the Company had restricted cash of $25 million ($37 million at December 31, 2019) included in "Other current assets" in the Consolidated Balance Sheets which was completely attributed to the Trust.
Accrued and Other Current Liabilities
"Accrued and other current liabilities" in the Consolidated Balance Sheets were $1,385 million at December 31, 2020 and $1,342 million at December 31, 2019. Accrued payroll, which is a component of "Accrued and other current liabilities," was $469 million at December 31, 2020 and $479 million at December 31, 2019. No other components of "Accrued and other current liabilities" were more than five percent of total current liabilities.
NOTE 7 - INCOME TAXES
For periods between the DWDP Merger and the DWDP Distributions, DuPont's consolidated federal income tax group and consolidated tax return included the Dow and Corteva entities. Generally, the consolidated tax liability of the DuPont U.S. tax group for each year was apportioned among the members of the consolidated group in accordance with the terms of the Amended and Restated DWDP Tax Matters Agreement. DuPont, Corteva and Dow intend that to the extent Federal and/or State corporate income tax liabilities are reduced through the utilization of tax attributes of the other, settlement of any receivable and payable generated from the use of the other party’s sub-group attributes will be in accordance with the Amended and Restated DWDP Tax Matters Agreement.
On December 22, 2017, the Tax Cuts and Jobs Act (“The Act”) was enacted. The Act reduced the U.S. federal corporate income tax rate from 35 percent to 21 percent, required companies to pay a one-time transition tax on earnings of foreign subsidiaries that were previously tax deferred, created new provisions related to foreign sourced earnings, eliminated the domestic manufacturing deduction and moves towards a territorial system. At December 31, 2018, the Company had substantially completed its accounting for the tax effects of The Act.
•As a result of The Act, the Company remeasured its U.S. federal deferred tax assets and liabilities based on the rates at which they are expected to reverse in the future, which is generally 21 percent. In 2018, the Company recorded a $118 million benefit to “(Benefit from) Provision for income taxes on continuing operations” in the Consolidated Statements of Operations with respect to the remeasurement of the Company's deferred tax balances.
•The Act required a mandatory deemed repatriation of post-1986 undistributed foreign earnings and profits (“E&P”), which results in a one-time transition tax. The Company recorded a $65 million benefit in 2019 and a $59 million charge in 2018 to "(Benefit from) Provision for income taxes on continuing operations" with respect to the one-time transition tax.
•In the year ended December 31, 2018, the Company recorded an indirect impact of The Act related to prepaid tax on the intercompany sale of inventory. The amount recorded related to the inventory was a $54 million charge to "(Benefit from) Provision for income taxes on continuing operations."
| | | | | | | | | | | |
| Geographic Allocation of (Loss) Income and Provision for (Benefit from) Income Taxes | 2020 | 2019 | 2018 |
| (In millions) |
| (Loss) Income from continuing operations before income taxes | | | |
| Domestic | $ | (3,179) | | $ | (2,007) | | $ | (985) | |
| Foreign | 282 | | 1,533 | | 1,585 | |
| (Loss) Income from continuing operations before income taxes | $ | (2,897) | | $ | (474) | | $ | 600 | |
| Current tax expense | | | |
| Federal | $ | 123 | | $ | 22 | | $ | 401 | |
| State and local | 16 | | 5 | | 9 | |
Foreign 1 | 469 | | 554 | | 452 | |
| Total current tax expense | $ | 608 | | $ | 581 | | $ | 862 | |
| Deferred tax (benefit) expense | | | |
Federal 1 | $ | (363) | | $ | (457) | | $ | (560) | |
| State and local | (87) | | 172 | | (53) | |
Foreign 1 | (181) | | (156) | | (54) | |
| Total deferred tax benefit | $ | (631) | | $ | (441) | | $ | (667) | |
| (Benefit from) Provision for income taxes on continuing operations | (23) | | 140 | | 195 | |
| Net (loss) income from continuing operations | $ | (2,874) | | $ | (614) | | $ | 405 | |
1.The Company has corrected the allocation of tax expense for the year ended December 31, 2019, resulting in a decrease of Foreign current tax expense of $37 million, an increase in Federal deferred tax expense of $141 million, and a decrease in Foreign deferred tax expense of $104 million. The total provision for income taxes on continuing operations for the year ended December 31, 2019 was not impacted.
Pre-tax loss from continuing operations for the year ended December 31, 2020 includes non-deductible, non-cash goodwill impairment charges of $3,214 million impacting the Non-Core and Transportation and Industrial segments and a non-deductible goodwill allocation of $247 million in connection with the TCS/HSC Disposal. Of these amounts, $2,381 million related to the U.S and the remaining $1,080 million related to foreign operations. See Note 13 for additional information.
Pre-tax loss from continuing operations for the year ended December 31, 2019 includes a non-deductible $1,175 million non-cash goodwill impairment charge associated with the Nutrition & Biosciences and Non-Core segments, of which $657 million related to the U.S. and the remaining $518 million related to foreign operations.
In 2018, the domestic and foreign components of "Income (loss) from continuing operations before income taxes" included a $76 million and $1 million charge, respectively, recognized in "Cost of sales" related to the fair value step-up of inventories assumed in the DWDP Merger and the acquisition of the H&N Business.
| | | | | | | | | | | |
| Reconciliation to U.S. Statutory Rate | 2020 | 2019 | 2018 |
| Statutory U.S. federal income tax rate | 21.0 | % | 21.0 | % | 21.0 | % |
| Equity earning effect | 0.2 | | 1.3 | | (1.0) | |
| Foreign income taxed at rates other than the statutory U.S. federal income tax rate | 2.8 | | 3.4 | | (5.2) | |
| U.S. tax effect of foreign earnings and dividends | (3.3) | | (4.3) | | (3.4) | |
| Unrecognized tax benefits | (1.1) | | (10.0) | | (0.8) | |
Acquisitions, divestitures and ownership restructuring activities 1, 2 | 1.4 | | 30.3 | | 6.2 | |
Exchange gains/losses 3 | (0.1) | | (4.4) | | 0.9 | |
Impact of Enactment of U.S. Tax Reform 4 | — | | 10.8 | | (0.5) | |
| State and local income taxes | 2.0 | | (33.2) | | 4.1 | |
| Change in valuation allowance | (0.1) | | (6.8) | | 5.2 | |
| Goodwill impairments | (22.7) | | (51.2) | | — | |
| Stock-based compensation | (0.3) | | 0.1 | | (1.4) | |
Other - net 5 | 1.0 | | 13.5 | | 7.5 | |
| Effective tax rate | 0.8 | % | (29.5) | % | 32.6 | % |
1.See Note 3 for additional information.
2. Includes a net tax benefit of $148 million, a net tax benefit of $102 million and a net tax charge of $25 million related to internal entity restructuring for the years ended December 31, 2020, 2019 and 2018, respectively.
3. Principally reflects the impact of foreign exchange gains and losses on net monetary assets for which no corresponding tax impact is realized.
4. Includes a net tax benefit of $65 million relating to the Company's change in estimate with respect to the portion of the one time transition tax for the taxable year ended December 31, 2018 for TDCC.
5. Includes a net tax benefit of $41 million in the year ended December 31, 2019 related to certain unrecognized tax benefits for positions taken on items from prior years.
| | | | | | | | |
| Deferred Tax Balances at December 31, | 2020 | 2019 |
| (In millions) |
| Deferred tax assets: | | |
Tax loss and credit carryforwards 1 | $ | 856 | | $ | 776 | |
| Pension and postretirement benefit obligations | 269 | | 245 | |
| Other accruals and reserves | 137 | | 65 | |
| Other – net | 165 | | 169 | |
| Gross deferred tax assets | $ | 1,427 | | $ | 1,255 | |
Valuation allowances 1 | (698) | | (634) | |
| Total deferred tax assets | $ | 729 | | $ | 621 | |
| | |
| Deferred tax liabilities: | | |
| Unrealized exchange gains (losses), net | $ | 3 | | $ | (1) | |
| Inventory | (10) | | (9) | |
| Investments | (388) | | (341) | |
| Property | (612) | | (796) | |
| Intangibles | (2,393) | | (2,752) | |
| Total deferred tax liabilities | $ | (3,400) | | $ | (3,899) | |
| Total net deferred tax liability | $ | (2,671) | | $ | (3,278) | |
1.Primarily related to recorded tax benefits and the non-realizability of tax loss and carryforwards from operations in the United States, Luxembourg and Asia Pacific.
Included in the 2020 and 2019 deferred tax asset and liability amounts above is $778 million and $1,142 million, respectively, of a net deferred tax liability related to the Company’s investment in DuPont Specialty Products USA, LLC, which is a partnership for U.S. federal income tax purposes. The Company and its subsidiaries own in aggregate 100% of DuPont Specialty Products USA, LLC and the assets and liabilities of DuPont Specialty Products USA, LLC are included in the Consolidated Financial Statements of the Company.
| | | | | | | | |
| Operating Loss and Tax Credit Carryforwards | Deferred Tax Asset |
| (In millions) | 2020 | 2019 |
| Operating loss carryforwards | | |
| Expire within 5 years | $ | 21 | | $ | 43 | |
| Expire after 5 years or indefinite expiration | 673 | | 602 | |
| Total operating loss carryforwards | $ | 694 | | $ | 645 | |
| Tax credit carryforwards | | |
| Expire within 5 years | $ | 3 | | $ | 8 | |
| Expire after 5 years or indefinite expiration | 159 | | 123 | |
| Total tax credit carryforwards | $ | 162 | | $ | 131 | |
| Total Operating Loss and Tax Credit Carryforwards | $ | 856 | | $ | 776 | |
| | | | | | | | | | | |
| Total Gross Unrecognized Tax Benefits | 2020 | 2019 | 2018 |
| (In millions) |
| Total unrecognized tax benefits at January 1, | $ | 368 | | $ | 1,062 | | $ | 994 | |
| Decreases related to positions taken on items from prior years | (1) | | (149) | | (51) | |
| Increases related to positions taken on items from prior years | 5 | | 53 | | 142 | |
| Increases related to positions taken in the current year | 39 | | 57 | | 11 | |
| Settlement of uncertain tax positions with tax authorities | (3) | | — | | (13) | |
| Decreases due to expiration of statutes of limitations | — | | — | | (6) | |
| Exchange loss (gain) | 24 | | (3) | | (15) | |
| Spin-offs of Dow and Corteva | — | | (652) | | — | |
Total unrecognized tax benefits at December 31, 1 | $ | 432 | | $ | 368 | | $ | 1,062 | |
Total unrecognized tax benefits that, if recognized, would impact the effective tax rate of continuing operations 2 | $ | 365 | | $ | 296 | | $ | 248 | |
| Total amount of interest and penalties (benefit) recognized in "Provision for (benefit from) income taxes on continuing operations" | $ | 5 | | $ | 9 | | $ | 1 | |
| Total accrual for interest and penalties associated with unrecognized tax benefits | $ | 17 | | $ | 12 | | $ | 154 | |
1.Total unrecognized tax benefits at December 31, 2018 includes $758 million of benefits related to discontinued operations.
2. For the years ended December 31, 2019 and 2018, the Company corrected the Total unrecognized tax benefits that would impact the effective tax rate of continuing operations to exclude $100 million of tax benefits for certain positions affecting tax years for which there were no uncertain tax positions.
Each year the Company files hundreds of tax returns in the various national, state and local income taxing jurisdictions in which it operates. These tax returns are subject to examination and possible challenge by the tax authorities. Positions challenged by the tax authorities may be settled or appealed by the Company. As a result, there is an uncertainty in income taxes recognized in the Company’s financial statements in accordance with accounting for income taxes and accounting for uncertainty in income taxes. The ultimate resolution of such uncertainties is not expected to have a material impact on the Company's results of operations.
Tax years that remain subject to examination for the Company’s major tax jurisdictions are shown below:
| | | | | |
| Tax Years Subject to Examination by Major Tax Jurisdiction at December 31, 2020 | Earliest Open Year |
| Jurisdiction |
| Brazil | 2016 |
| Canada | 2015 |
| China | 2010 |
| Denmark | 2015 |
| Germany | 2010 |
| Japan | 2013 |
| The Netherlands | 2014 |
| Switzerland | 2015 |
| United States: | |
Federal income tax 1 | 2012 |
| State and local income tax | 2011 |
1. The U.S. Federal income tax jurisdiction is open back to 2012 with respect to EID pursuant to the DWDP Tax Matters Agreement.
Undistributed earnings of foreign subsidiaries and related companies that are deemed to be permanently invested amounted to $10,101 million at December 31, 2020. In addition to the U.S. federal tax imposed by The Act on all accumulated unrepatriated earnings through December 31, 2017, the Act introduced additional U.S. federal tax on foreign earnings, effective as of January 1, 2018. The undistributed foreign earnings at December 31, 2020 may still be subject to certain taxes upon repatriation, primarily where foreign withholding taxes apply. It is not practicable to calculate the unrecognized deferred tax liability on undistributed foreign earnings due to the complexity of the hypothetical calculation.
N&B Transaction
Certain internal distributions and reorganizations that occurred during 2020 in preparation for the N&B Transaction qualified as tax-free transactions under the applicable sections of the Internal Revenue Code. If the aforementioned transactions were to fail to qualify for non-recognition treatment for U.S. federal income tax purposes, then the Company could be subject to significant tax liability. Under the N&B Tax Matters Agreement, the Company would generally be allocated such liability and not be indemnified, unless certain non qualifying actions are undertaken by N&B or IFF. To the extent that the Company is responsible for any such liability, there could be a material adverse impact on the Company's business, financial condition, results of operations and cash flows in future reporting periods.
NOTE 8 - EARNINGS PER SHARE CALCULATIONS
The following tables provide earnings per share calculations for the years ended December 31, 2020, 2019 and 2018:
| | | | | | | | | | | |
Net Income for Earnings Per Share Calculations - Basic & Diluted
In millions | 2020 | 2019 | 2018 |
| (Loss) Income from continuing operations, net of tax | $ | (2,874) | | $ | (614) | | $ | 405 | |
| Net income from continuing operations attributable to noncontrolling interests | 28 | | 30 | | 39 | |
Net income from continuing operations attributable to participating securities 1 | — | | 1 | | 17 | |
| (Loss) Income from continuing operations attributable to common stockholders | $ | (2,902) | | $ | (645) | | $ | 349 | |
| (Loss) Income from discontinued operations, net of tax | (49) | | 1,214 | | 3,595 | |
| Net income from discontinued operations attributable to noncontrolling interests | — | | 72 | | 116 | |
| (Loss) Income from discontinued operations attributable to common stockholders | (49) | | 1,142 | | 3,479 | |
| Net (loss) income available to common stockholders | $ | (2,951) | | $ | 497 | | $ | 3,828 | |
| | | | | | | | | | | |
Earnings Per Share Calculations - Basic
Dollars per share | 2020 | 2019 | 2018 |
| (Loss) Income from continuing operations attributable to common stockholders | $ | (3.95) | | $ | (0.86) | | $ | 0.46 | |
| (Loss) Income from discontinued operations attributable to common stockholders | (0.07) | | 1.53 | | 4.54 | |
Net (loss) income available to common stockholders 2 | $ | (4.01) | | $ | 0.67 | | $ | 4.99 | |
| | | | | | | | | | | |
Earnings Per Share Calculations - Diluted
Dollars per share | 2020 | 2019 | 2018 |
| (Loss) Income from continuing operations attributable to common stockholders | $ | (3.95) | | $ | (0.86) | | $ | 0.45 | |
| (Loss) Income from discontinued operations attributable to common stockholders | (0.07) | | 1.53 | | 4.51 | |
Net (loss) income available to common stockholders 2 | $ | (4.01) | | $ | 0.67 | | $ | 4.96 | |
| | | | | | | | | | | |
Share Count Information
Shares in Millions | 2020 | 2019 | 2018 |
| Weighted-average common shares - basic | 735.5 | | 746.3 | | 767.0 | |
| Plus dilutive effect of equity compensation plans | — | | — | | 4.8 | |
| Weighted-average common shares - diluted | 735.5 | | 746.3 | | 771.8 | |
Stock options and restricted stock units excluded from EPS calculations 3 | 5.7 | | 3.3 | | 3.2 | |
1. TDCC restricted stock units are considered participating securities due to TDCC's practice of paying dividend equivalents on unvested shares.
2. Earnings per share amounts are computed independently for income from continuing operations, income from discontinued operations and net income attributable to common stockholders. As a result, the per share amounts from continuing operations and discontinued operations may not equal the total per share amounts for net income attributable to common stockholders.
3. These outstanding options to purchase shares of common stock and restricted stock units were excluded from the calculation of diluted earnings per share because the effect of including them would have been antidilutive.
NOTE 9 - ACCOUNTS AND NOTES RECEIVABLE - NET
| | | | | | | | |
| In millions | December 31, 2020 | December 31, 2019 |
Accounts receivable – trade 1 | $ | 2,810 | | $ | 2,954 | |
| Notes receivable – trade | 62 | | 53 | |
Other 2 | 679 | | 795 | |
| Total accounts and notes receivable - net | $ | 3,551 | | $ | 3,802 | |
1.Accounts receivable – trade is net of allowances of $41 million at December 31, 2020 and $9 million at December 31, 2019. Allowances are equal to the estimated uncollectible amounts and current expected credit loss. That estimate is based on historical collection experience, current economic and market conditions, and review of the current status of customers' accounts.
2.Other includes receivables in relation to value added tax, fair value of derivative instruments, indemnification assets, and general sales tax and other taxes. No individual group represents more than ten percent of total receivables.
Accounts and notes receivable are carried at amounts that approximate fair value.
NOTE 10 - INVENTORIES
| | | | | | | | |
| In millions | December 31, 2020 | December 31, 2019 |
| Finished goods | $ | 2,301 | | $ | 2,621 | |
| Work in process | 772 | | 855 | |
| Raw materials | 429 | | 599 | |
| Supplies | 224 | | 244 | |
| Total inventories | $ | 3,726 | | $ | 4,319 | |
NOTE 11 - PROPERTY, PLANT, AND EQUIPMENT
| | | | | | | | | | | | | | | | | |
| Estimated Useful Lives (Years) | December 31, 2020 | December 31, 2019 |
| In millions |
| Land and land improvements | 1 | - | 25 | $ | 816 | | $ | 791 | |
| Buildings | 1 | - | 40 | 3,028 | | 2,806 | |
| Machinery, equipment, and other | 1 | - | 25 | 10,592 | | 9,863 | |
| Construction in progress | | | | 1,546 | | 1,652 | |
| Total property, plant and equipment | | | | $ | 15,982 | | $ | 15,112 | |
| Total accumulated depreciation | | | | $ | 5,997 | | $ | 4,969 | |
| Total property, plant and equipment - net | | | | $ | 9,985 | | $ | 10,143 | |
| | | | | | | | | | | |
| In millions | 2020 | 2019 | 2018 |
| Depreciation expense | $ | 975 | | $ | 1,016 | | $ | 1,126 | |
| | | |
NOTE 12 - NONCONSOLIDATED AFFILIATES
The Company's investments in companies accounted for using the equity method ("nonconsolidated affiliates") are recorded in "Investments and other noncurrent receivables" in the Consolidated Balance Sheets.
The Company's net investment in and dividends received from nonconsolidated affiliates are shown in the following tables:
| | | | | | | | |
| Investments in Nonconsolidated Affiliates at December 31, | 2020 | 2019 |
| In millions |
| Investments and other noncurrent receivables | $ | 918 | | $ | 1,204 | |
| Accrued and other current liabilities | (71) | | (85) | |
| Other noncurrent obligations | — | | (358) | |
| Net investment in nonconsolidated affiliates | $ | 847 | | $ | 761 | |
| | | | | | | | | | | | | | |
| Dividends Received from Nonconsolidated Affiliates | 2020 | 2019 | 2018 |
| In millions |
| Dividends from nonconsolidated affiliates | $ | 104 | | $ | 191 | | $ | 318 | |
The Company had an ownership interest in 17 nonconsolidated affiliates, with ownership interest (direct and indirect) ranging from 49 percent to 50 percent at December 31, 2020.
Sales to nonconsolidated affiliates represented less than 2 percent of total net sales for the year ended December 31, 2020 and less than 3 percent of total net sales for the year ended December 31, 2019 and 2018. Sales to nonconsolidated affiliates are primarily related to the sale of trichlorosilane, a raw material used in the production of polycrystalline silicon, to the HSC Group, prior to the TCS/Hemlock Disposal in the third quarter of 2020. Sales of this raw material to the HSC Group are reflected in Non-Core. Purchases from nonconsolidated affiliates represented less than 2 percent of “Cost of sales” in 2020, 2019, and 2018.
HSC Group
In the third quarter of 2020, the Company sold its equity interest in the HSC group. See Note 3 for further discussion. The Company's investment in and equity earnings from the HSC Group are shown in the tables below:
| | | | | | | | |
| Investment in the HSC Group at December 31, | | Investment |
| In millions | Balance Sheet Classification | 2019 |
| Hemlock Semiconductor L.L.C. | Other noncurrent obligations | $ | (358) | |
| DC HSC Holdings LLC | Investments and other noncurrent receivables | $ | 87 | |
| | | | | | | | | | | | | | |
| Equity Earnings in the HSC Group | 2020 | 2019 | 2018 |
| In millions |
| Equity in earnings | $ | 108 | | $ | 29 | | $ | 389 | |
NOTE 13 - GOODWILL AND OTHER INTANGIBLE ASSETS
The following table summarizes changes in the carrying amount of goodwill for the years ended December 31, 2020 and 2019.
| | | | | | | | | | | | | | | | | | | | |
| Elect. & Imaging | Nutrition & Biosciences | Transp. & Industrial | Safety & Const. | Non-Core | Total |
| In millions |
| Balance at December 31, 2018 | $ | 7,113 | | $ | 12,109 | | $ | 6,967 | | $ | 6,698 | | $ | 1,609 | | $ | 34,496 | |
| Acquisitions | — | | — | | — | | 54 | | — | | 54 | |
| Impairments | — | | (933) | | — | | — | | (242) | | (1,175) | |
Currency Translation Adjustment | (21) | | (127) | | (36) | | (41) | | — | | (225) | |
Other | — | | (37) | | — | | — | | 38 | | 1 | |
| Balance at December 31, 2019 | $ | 7,092 | | $ | 11,012 | | $ | 6,931 | | $ | 6,711 | | $ | 1,405 | | $ | 33,151 | |
| Acquisitions | — | | — | | — | | 53 | | — | | 53 | |
Divestitures 1 | (199) | | — | | — | | — | | (514) | | (713) | |
| Impairments | — | | — | | (2,498) | | — | | (716) | | (3,214) | |
| Currency Translation Adjustment | 92 | | 530 | | 140 | | 195 | | — | | 957 | |
| Measurement Period Adjustment | — | | — | | — | | 10 | | — | | 10 | |
| Balance at December 31, 2020 | $ | 6,985 | | $ | 11,542 | | $ | 4,573 | | $ | 6,969 | | $ | 175 | | $ | 30,244 | |
1.Includes $267 million of goodwill related to the Non-Core segment reclassified as held for sale in connection with the Non-Core Held for Sale Disposal Groups. Refer to Note 3 for further information.
The Company tests goodwill for impairment annually during the fourth quarter, or more frequently when events or changes in circumstances indicate that the fair value is below its carrying value. As a result of the related acquisition method of accounting in connection with the DWDP Merger, EID’s assets and liabilities were measured at fair value resulting in increases to the Company’s goodwill and other intangible assets. The fair value valuation increased the risk that any declines in financial projections, including changes to key assumptions, could have a material, negative impact on the fair value of the Company’s reporting units and assets, and therefore could result in an impairment.
In the fourth quarter of 2020, the Company performed qualitative testing on four of its reporting units and performed quantitative testing on two of its reporting units and determined that no further impairments existed. The qualitative evaluation is an assessment of factors, including reporting unit or asset specific operating results and cost factors, as well as industry, market and macroeconomic conditions, to determine whether it is more likely than not (more than 50%) that the fair value of a reporting unit or asset is less than the respective carrying amount, including goodwill. The results of the qualitative assessments indicated that it is not more likely than not that the fair values of the reporting units were less than their carrying values. For reporting units tested by applying the quantitative assessment, the Company used a combination of discounted cash flow models (a form of the income approach) utilizing Level 3 unobservable inputs and the Guideline Public Company Method (a form of the market approach). The Company’s significant assumptions in these analyses include, but are not limited to, projected revenue, EBITDA margins, the weighted average cost of capital, the terminal growth rate, derived multiples from comparable market transactions and other market data.
In the third quarter of 2020, the TCS/HSC Disposal within the Non-Core segment, as well as further softening conditions in aerospace markets, served as triggering events requiring the Company to perform recoverability assessments related to asset groups within its PVAM business unit. These assessments resulted in the Company recording asset impairment charges related to certain long-lived assets whose carrying values were deemed not recoverable (refer to Note 5 for additional information). The Company then performed a series of impairment analyses related to goodwill associated with the PVAM business unit. The goodwill impairment analyses included an assessment of the preceding PVAM reporting unit as well as assessments of re-defined reporting units within the PVAM business unit resulting from the TCS/HSC Disposal along with recent progress in the sales processes for other Non-Core business units, including reallocation of goodwill on a relative fair value basis. As a result of these analyses, the Company determined that the fair value of certain reporting units was below carrying value resulting in impairment charges of goodwill. In connection with the foregoing and as a result of the Non-Core Held For Sale Disposal Groups classification (see Note 3 for additional information), the Company recorded aggregate, pre-tax, non-cash impairment charges of $183 million in the third quarter of 2020 impacting the Non-Core segment and reflected in "Goodwill impairment charges" in the Consolidated Statements of Operations. As a result of the above impairment charges and previous impairment charges recorded impacting Non-Core as discussed below, the carrying value of the reporting units within Non-Core are indicative of fair value. As a result, future changes in fair value could impact the carrying value of these business units which have been and continue to be at risk for impairment charges in future periods.
The Company’s analyses above use a combination of the discounted cash flow models (a form of the income approach) utilizing Level 3 unobservable inputs and the market approach. The Company’s significant assumptions in these analyses include, but are not limited to, future cash flow projections, the weighted average cost of capital, the terminal growth rate, and the tax rate. The Company’s estimates of future cash flows are based on current regulatory and economic climates, recent operating results, and planned business strategies. These estimates could be negatively affected by changes in federal, state, or local regulations or economic downturns. Future cash flow estimates are, by their nature, subjective and actual results may differ materially from the Company’s estimates. If the Company’s ongoing estimates of future cash flows are not met, the Company may have to record additional impairment charges in future periods. The Company also uses the Guideline Public Company Method, a form of the market approach (utilizing Level 3 unobservable inputs), which is derived from metrics of publicly traded companies or historically completed transactions of comparable businesses. The selection of comparable businesses is based on the markets in which the reporting units operate giving consideration to risk profiles, size, geography, and diversity of products and services. When applicable, third party purchase offers may be utilized to measure fair value. The Company applies a weighting to the market approach and income approach to determine the fair value. As such, the Company believes the current assumptions and estimates utilized are both reasonable and appropriate.
In the second quarter of 2020, continued near-term demand weakness in global automotive production resulting from the COVID-19 pandemic, along with revised views of recovery based on third party market information, served as a triggering event requiring the Company to perform an impairment analysis of the goodwill associated with its Transportation & Industrial reporting unit as of June 30, 2020. The carrying value of the Transportation & Industrial reporting unit is comprised substantially of EID’s assets and liabilities which were measured at fair value in connection with the DWDP Merger, and thus inherently considered at risk for impairment. The Company performed quantitative testing on its Transportation & Industrial reporting unit as of June 30, 2020, using a combination of the discounted cash flow model (a form of the income approach) utilizing Level 3 unobservable inputs and the Guideline Public Company Method (a form of the market approach). Based on the analysis performed, during the second quarter of 2020, the Company concluded that the carrying amount of the reporting unit exceeded its fair value resulting in a pre-tax, non-cash goodwill impairment charge of $2,498 million, reflected in "Goodwill impairment charges" in the Consolidated Statements of Operations for the year ended December 31, 2020.
The Company's goodwill analysis referenced above used the discounted cash flow model (a form of the income approach) utilizing Level 3 unobservable inputs. The Company’s significant assumptions in this analysis included, but were not limited to, future cash flow projections, the weighted average cost of capital, the terminal growth rate, and the tax rate. The Company’s estimates of future cash flows are based on current regulatory and economic climates, recent operating results, and planned business strategies. These estimates could be negatively affected by changes in federal, state, or local regulations or economic downturns. Future cash flow estimates are, by their nature, subjective and actual results may differ materially from the Company’s estimates. If the Company’s ongoing estimates of future cash flows are not met, the Company may have to record additional impairment charges in future periods.
The Company also used the Guideline Public Company Method (a form of the market approach). The significant assumptions used in this analysis include, but are not limited to, the derived multiples from comparable market transactions and other market data. The selection of comparable businesses is based on the markets in which the reporting unit operates giving consideration to risk profiles, size, geography, and diversity of products and services.
The Company probability-weighted scenarios for both the income and market approaches and also applied an overall probability-weighting to the income and market approaches to determine the concluded fair value of the reporting unit given the uncertainty in the current economic environment to determine the concluded fair value of the reporting unit. The Company believes the current assumptions and estimates utilized in the income and market approaches are both reasonable and appropriate.
In the first quarter of 2020, expectations of proceeds related to certain potential divestitures within the Non-Core segment gave rise to fair value indicators and, thus, served as triggering events requiring the Company to perform impairment analyses related to goodwill as of March 31, 2020. As part of the analysis, the Company determined that the fair value of its PVAM reporting unit was below its carrying value resulting in an impairment charge to goodwill. Valuations of the PVAM reporting unit under a combination of the market approach and income approach reflected softening conditions in photovoltaics markets as compared to prior estimates. In connection with this analysis, the Company recorded a pre-tax, non-cash goodwill impairment charge of $533 million in the first quarter of 2020 impacting the Non-Core segment. This charge is reflected in "Goodwill impairment charges" in the Consolidated Statements of Operations for the year ended December 31, 2020.
The Company's analysis uses the discounted cash flow model (a form of the income approach) utilizing Level 3 unobservable inputs. The Company’s significant assumptions in this analysis include, but are not limited to, future cash flow projections, the weighted average cost of capital, the terminal growth rate, and the tax rate. The Company’s estimates of future cash flows are
based on current regulatory and economic climates, recent operating results, and planned business strategies. These estimates could be negatively affected by changes in federal, state, or local regulations or economic downturns. Future cash flow estimates are, by their nature, subjective and actual results may differ materially from the Company’s estimates. If the Company’s ongoing estimates of future cash flows are not met, the Company may have to record additional impairment charges in future periods. As referenced, the Company also uses a form of the market approach. As such, the Company believes the current assumptions and estimates utilized are both reasonable and appropriate.
In preparation for the Corteva Distribution, EID completed the separation of the assets and liabilities related to its specialty products businesses into separate legal entities (the “SP Legal Entities”) and on May 1, 2019, EID completed the Internal SP Distribution. The Internal SP Distribution served as a triggering event requiring the Company to perform an impairment analysis related to goodwill carried by its EID existing reporting units as of May 1, 2019. Subsequent to the Corteva Distribution, on June 1, 2019, the Company realigned certain businesses resulting in changes to its management and reporting structure, including the creation of a new Non-Core segment. As part of the Second Quarter Segment Realignment, the Company assessed and re-defined certain reporting units effective June 1, 2019, including reallocation of goodwill on a relative fair value basis as applicable to new reporting units identified. Goodwill impairment analyses were then performed for reporting units impacted by the Second Quarter Segment Realignment.
In the second quarter of 2019, in connection with the analysis described above, the Company recorded pre-tax, non-cash goodwill impairment charges of $1,175 million impacting the Nutrition & Biosciences and Non-Core segments which are reflected in "Goodwill impairment charges" in the Consolidated Statements of Operations for the year ended December 31, 2019.
COVID-19 continues to impact the broader global economy and has caused volatility in financial markets. If there is a of lack of recovery, the time period to recovery is longer than expected or further global softening is experienced in certain markets, or a sustained decline in the value of the Company's common stock, the Company may be required to perform additional impairment assessments for its goodwill, other intangibles, and long-lived assets, the results of which could result in material impairment charges.
Other Intangible Assets
The gross carrying amounts and accumulated amortization of other intangible assets by major class are as follows:
| | | | | | | | | | | | | | | | | | | | |
| December 31, 2020 | December 31, 2019 |
| In millions | Gross
Carrying
Amount | Accum Amort | Net | Gross Carrying Amount | Accum Amort | Net |
| Intangible assets with finite lives: | | | | | | |
| Developed technology | $ | 4,273 | | $ | (1,814) | | $ | 2,459 | | $ | 4,343 | | $ | (1,361) | | $ | 2,982 | |
Trademarks/tradenames | 2,424 | | (1,702) | | 722 | | 2,433 | | (455) | | 1,978 | |
| Customer-related | 9,096 | | (2,833) | | 6,263 | | 8,986 | | (2,229) | | 6,757 | |
| Other | 178 | | (87) | | 91 | | 303 | | (98) | | 205 | |
| Total other intangible assets with finite lives | $ | 15,971 | | $ | (6,436) | | $ | 9,535 | | $ | 16,065 | | $ | (4,143) | | $ | 11,922 | |
| Intangible assets with indefinite lives: | | | | | | |
Trademarks/tradenames | 1,609 | | — | | 1,609 | | 1,671 | | — | | 1,671 | |
| Total other intangible assets with indefinite lives | $ | 1,609 | | $ | — | | $ | 1,609 | | $ | 1,671 | | $ | — | | $ | 1,671 | |
| Total | $ | 17,580 | | $ | (6,436) | | $ | 11,144 | | $ | 17,736 | | $ | (4,143) | | $ | 13,593 | |
In the third quarter of 2020, the Company recorded a pre-tax asset impairment charge of $52 million ($39 million net of tax) related to indefinite-lived intangible assets within the Non-Core segment which were deemed no longer recoverable as a result of an impairment test performed related to the Non-Core Held For Sale Disposal Groups classification (see Note 3 for additional information). The charge was recorded within “Restructuring and asset related charges – net” in the Consolidated Statements of Operations for the year ended December 31, 2020.
In the first quarter and third quarter of 2020, the Company recorded non-cash impairment charges related to definite-lived intangible assets impacting the Non-Core segment reflected within “Restructuring and asset related charges - net” in the Consolidated Statements of Operations for the year ended December 31, 2020. See Note 5 for further discussion.
In the second quarter of 2020, the Company performed quantitative testing on indefinite-lived intangible assets attributable to the Transportation & Industrial segment, for which the Company determined that the fair value of certain tradenames had
declined related to the factors described above. The Company performed an analysis of the fair value using the relief from royalty method (a form of the income approach) using Level 3 inputs within the fair value hierarchy. The key assumptions used in the calculation included projected revenue, royalty rates and discount rates. These key assumptions involve management judgment and estimates relating to future operating performance and economic conditions that may differ from actual cash flows. As a result of the testing, the Company recorded a pre-tax, non-cash indefinite-lived intangible asset impairment charge of $21 million ($16 million net of tax), which is reflected in "Restructuring and asset related charges - net," in the Consolidated Statements of Operations for the year ended December 31, 2020. The remaining net book value of the tradenames attributable to the Transportation & Industrial segment at December 31, 2020 was approximately $289 million, which represents fair value.
The following table provides the net carrying value of other intangible assets by segment:
| | | | | | | | |
| Net Intangibles by Segment | December 31, 2020 | December 31, 2019 |
| In millions |
| Electronics & Imaging | $ | 1,651 | | $ | 1,833 | |
| Nutrition & Biosciences | 3,071 | | 4,377 | |
| Transportation & Industrial | 3,408 | | 3,590 | |
| Safety & Construction | 2,920 | | 3,082 | |
| Non-Core | 94 | | 711 | |
| Total | $ | 11,144 | | $ | 13,593 | |
Total estimated amortization expense for the next five fiscal years is as follows:
| | | | | |
| Estimated Amortization Expense | |
| In millions | |
| 2021 | $ | 988 | |
| 2022 | $ | 966 | |
| 2023 | $ | 914 | |
| 2024 | $ | 819 | |
| 2025 | $ | 726 | |
NOTE 14 - SHORT-TERM BORROWINGS, LONG-TERM DEBT AND AVAILABLE CREDIT FACILITIES
The following tables summarize the Company's short-term borrowings and finance lease obligations and long-term debt:
| | | | | | | | |
| Short-term borrowings and finance lease obligations | December 31, 2020 | December 31, 2019 |
| In millions |
Commercial paper 1 | $ | — | | $ | 1,829 | |
Long-term debt due within one year 2,3 | 5 | | 2,001 | |
| Total short-term borrowings and finance lease obligations | $ | 5 | | $ | 3,830 | |
1.The weighted-average interest rate on commercial paper at December 31, 2019 was 2.79 percent.
2. Presented net of current portion of unamortized debt issuance costs.
3. The year ended December 31, 2019 includes finance lease obligations of $1 million due within one year.
| | | | | | | | | | | | | | |
| Long-Term Debt | December 31, 2020 | December 31, 2019 |
| In millions | Amount | Weighted Average Rate | Amount | Weighted Average Rate |
| Promissory notes and debentures: | | | | |
| Final maturity 2020 | $ | — | | — | % | $ | 2,000 | | 3.48 | % |
| Final maturity 2022 | 300 | | 0.70 | % | — | | — | % |
| Final maturity 2023 | 4,800 | | 3.18 | % | 2,800 | | 4.08 | % |
| Final maturity 2025 | 2,850 | | 3.56 | % | 1,850 | | 4.49 | % |
| Final maturity 2026 and thereafter | 11,000 | | 3.83 | % | 6,050 | | 5.13 | % |
| Other facilities: | | | | |
| Term loan due 2022 | 3,000 | | 1.25 | % | 3,000 | | 2.86 | % |
| Other loans | 6 | | 4.21 | % | 10 | | 4.20 | % |
| Finance lease obligations | 2 | | | 3 | | |
| Less: Unamortized debt discount and issuance costs | 147 | | | 95 | | |
Less: Long-term debt due within one year 1, 2 | 5 | | | 2,001 | | |
Total 3 | $ | 21,806 | | | $ | 13,617 | | |
1.Presented net of current portion of unamortized debt issuance costs.
2. The year ended December 31, 2019 includes finance lease obligations of $1 million due within one year. See Note 16 for more information on finance leases.
3. The year ended December 31, 2020 includes $6.2 billion related to the N&B Notes Offering.
Principal payments of long-term debt for the five succeeding fiscal years is as follows:
| | | | | |
| Maturities of Long-Term Debt for Next Five Years at December 31, 2020 | Total |
| In millions |
| 2021 | $ | 5 | |
2022 1 | $ | 3,303 | |
| 2023 | $ | 4,800 | |
| 2024 | $ | — | |
2025 1 | $ | 2,850 | |
1. The Company’s long-term borrowings due in 2022 and 2025 include $300 million and $1 billion, respectively, related to the N&B Notes Offering.
The estimated fair value of the Company's long-term borrowings was determined using Level 2 inputs within the fair value hierarchy, as described in Note 22. Based on quoted market prices for the same or similar issues, or on current rates offered to the Company for debt of the same remaining maturities, the fair value of the Company's long-term borrowings, not including long-term debt due within one year, was $24,853 million and $15,220 million at December 31, 2020 and December 31, 2019, respectively.
Available Committed Credit Facilities
The following table summarizes the Company's credit facilities:
| | | | | | | | | | | | | | | | | |
| Committed and Available Credit Facilities at December 31, 2020 | | |
| In millions | Effective Date | Committed Credit | Credit Available | Maturity Date | Interest |
| Term Loan Facility | May 2019 | $ | 3,000 | | $ | — | | May 2022 | Floating Rate |
| Revolving Credit Facility, Five-year | May 2019 | 3,000 | | 2,978 | | May 2024 | Floating Rate |
| 364-day Revolving Credit Facility | April 2020 | 1,000 | | 1,000 | | April 2021 | Floating Rate |
| Total Committed and Available Credit Facilities | | $ | 7,000 | | $ | 3,978 | | | |
Nutrition & Biosciences Financing
In January 2020, N&B entered into a senior unsecured term loan agreement in the amount of $1.25 billion split evenly between three- and five-year facilities.
On September 16, 2020 (the "Offering Date"), N&B completed an offering in the aggregate principal amount of $6.25 billion of senior unsecured notes in six series, comprised of the following (collectively, the “N&B Notes Offering” and together with the N&B Term Loan Facilities, the “Permanent Financing”): $300 million aggregate principal amount of 0.697 percent Senior Notes due 2022; $1 billion aggregate principal amount of 1.230 percent Senior Notes due 2025; $1.2 billion aggregate principal amount of 1.832 percent Senior Notes due 2027; $1.5 billion aggregate principal amount of 2.300 percent Senior Notes due 2030; $750 million aggregate principal amount of 3.268 percent Senior Notes due 2040; and $1.5 billion aggregate principal
amount of 3.468 percent Senior Notes due 2050. The net proceeds of approximately $6.2 billion from the N&B Notes Offering were deposited into an escrow account. See Note 25 for more information on the N&B Notes Offering.
May Debt Offering
On May 1, 2020, the Company completed an underwritten public offering of senior unsecured notes (the “May 2020 Notes”) in the aggregate principal amount of $2 billion of 2.169 percent fixed rate Notes due May 1, 2023 (the “May Debt Offering”). The proceeds from the May Debt Offering were used by the Company to repay the Company’s $0.5 billion in floating rate notes due November 2020 and $1.5 billion of 3.77 percent fixed-rate notes due November 2020. See Note 25 for more information on the May Debt Offering.
Term Loan and Revolving Credit Facilities
In May 2019, the Company fully drew the two term loan facilities it entered into in the fourth quarter of 2018 (the “Term Loan Facilities”) in the aggregate principal amount of $3,000 million. In May 2019, the Company amended its $3,000 million five-year revolving credit facility (the “Five-Year Revolver”) entered into in the fourth quarter of 2018 to become effective and available as of the amendment. In addition, in June 2019, the Company entered into a $750 million, 364-day revolving credit facility (the "Old 364-day Revolving Credit Facility"). On and effective as of April 16, 2020, the Company entered into a new $1.0 billion 364-day revolving credit facility (the “$1B Revolving Credit Facility"). As of the effectiveness of the $1B Revolving Credit Facility, the Old 364-Day Revolving Credit Facility was terminated.
Senior Notes
In contemplation of the DWDP Distributions and in preparation to achieve the intended credit profiles of Corteva, Dow and DuPont, in the fourth quarter of 2018, the Company consummated a public underwritten offer of eight series of senior unsecured notes (the "2018 Senior Notes") in an aggregate principal amount of $12.7 billion. The 2018 Senior Notes are a senior unsecured obligation of the Company and will rank equally with the Company's future senior unsecured debt outstanding from time to time. In the fourth quarter of 2020, the Company repaid the notes due in November 2020 using the proceeds from the May Debt Offering.
Uncommitted Credit Facilities and Outstanding Letters of Credit
Unused bank credit lines on uncommitted credit facilities were $696 million at December 31, 2020. These lines are available to support short-term liquidity needs and general corporate purposes including letters of credit. Outstanding letters of credit were $165 million at December 31, 2020. These letters of credit support commitments made in the ordinary course of business.
Debt Covenants and Default Provisions
The Company's indenture covenants include customary limitations on liens, sale and leaseback transactions, and mergers and consolidations, subject to certain limitations. The 2018 Senior Notes also contain customary default provisions. The Term Loan
Facilities, the Five-Year Revolving Credit Facility and the $1B Revolving Credit Facility contain a financial covenant requiring that the ratio of Total Indebtedness to Total Capitalization for the Company and its consolidated subsidiaries not exceed 0.60. At December 31, 2020, the Company was in compliance with this financial covenant. There were no material changes to the debt covenants and default provisions at December 31, 2020.
NOTE 15 - COMMITMENTS AND CONTINGENT LIABILITIES
Litigation Matters
As of December 31, 2020, the Company had recorded liabilities of $19 million associated with litigation matters including non-PFAS liabilities retained, assumed or indemnified under the DWDP Separation and Distribution Agreement discussed below.
In addition, DuPont recorded liabilities of $27 million related to the settlement of the Ohio MDL, discussed below, and of $59 million in connection with the cost sharing arrangement related to future eligible PFAS costs, discussed below, between The Chemours Company (“Chemours”), Corteva, EID and the Company. Management believes that it is reasonably possible the Company could incur eligible PFAS costs in excess of the amounts accrued, but any such losses are not estimable at this time due to various reasons, including, among others, that the underlying matters are in their early stages and have significant factual issues to be resolved. Eligible PFAS costs are included in PFAS Stray Liabilities discussed below.
Discontinued and/or Divested Operations and Businesses ("DDOB") Liabilities
Under the DWDP Separation and Distribution Agreement, liabilities, including cost and expenses, associated with litigation and environmental matters that primarily related to the materials science business, the agriculture business or the specialty products business were generally allocated to or retained by Dow, Corteva or the Company, respectively, through retention, assumption or indemnification. Further, under the Letter Agreement between Corteva and DuPont, DDOB liabilities of EID primarily related to EID’s agriculture business were allocated to or retained by Corteva and those primarily related to EID’s specialty products business were allocated to or retained by the Company. EID DDOB liabilities not primarily related to EID’s agriculture business or specialty products business (“Stray Liabilities”), are allocated as follows:
•Generally, indemnifiable losses as defined in the DWDP Separation and Distribution Agreement (“Indemnifiable Losses”) for Stray Liabilities, to the extent they do not arise out of actions related to or resulting from the development, testing, manufacture or sale of PFAS, defined below, (“Non-PFAS Stray Liabilities”) that are known as of April 1, 2019 are borne by Corteva up to a specified amount set forth in the schedules to the DWDP Separation and Distribution Agreement and/or Letter Agreement. Non-PFAS Stray Liabilities in excess of such specified amounts and any Non-PFAS Stray Liabilities not listed in the schedules to the Separation and Distribution Agreement or Letter Agreement are borne by Corteva and/or DuPont up to separate, aggregate thresholds of $200 million each to the extent Corteva or DuPont, as applicable, incurs an Indemnifiable Loss. Once Corteva’s or DuPont’s $200 million threshold is met, the other would generally bear all Non-PFAS Stray Liabilities until meeting its $200 million threshold. After the respective $200 million thresholds are met, DuPont will bear 71 percent of such losses and Corteva will bear 29 percent of such losses. While DuPont believes it is probable that it will incur a liability related to Non-PFAS Stray Liabilities discussed below, such liability is not reasonably estimable at December 31, 2020. Therefore, at December 31, 2020, DuPont has not recorded an accrual related to Non-PFAS Liabilities.
•Generally, Corteva and the Company will each bear 50 percent of the first $300 million (up to $150 million each) for Indemnifiable Losses arising out of actions to the extent related to or resulting from the development, testing, manufacture or sale of per- or polyfluoroalkyl substances, which include perfluorooctanoic acids and its ammonium salts (“PFOA”) (all such substances, “PFAS” and such Stray Liabilities referred to as “PFAS Stray Liabilities”), unless either Corteva or DuPont has met its $200 million threshold described above. In that event, the other company would bear all PFAS Stray Liabilities until that company meets its $200 million threshold, at which point DuPont will bear 71 percent of such losses and Corteva will bear 29 percent of such losses. Indemnifiable Losses to the extent related to PFAS Stray Liabilities in excess of $300 million generally will be borne 71 percent by the Company and 29 percent by Corteva.
•Indemnifiable Losses incurred by the companies in relation to PFAS Stray Liabilities up to $300 million (e.g., up to $150 million each) will be applied to each company’s respective $200 million threshold.
Indemnifiable Losses, as defined in the DWDP Separation and Distribution Agreement, include, among other things, attorneys’, accountants’, consultants’ and other professionals’ fees and expenses incurred in the investigation or defense of Stray Liabilities.
DuPont expects to continue to incur directly and as Indemnifiable Losses and/or qualified spend (as defined below), costs and expenses related to litigation defense, such as attorneys’ fees and expenses and court costs, in connection with the Stray Liabilities described below. In accordance with its accounting policy for litigation matters, the Company will expense such litigation defense costs as incurred which could be significant to the Company’s financial condition and/or cash flows in the period.
Even when the Company believes the probability of loss or of an adverse unappealable final judgment is remote, the Company may consider settlement of these matters, and may enter into settlement agreements, if it believes settlement is in the best interest of the Company, including avoidance of future distraction and litigation defense cost, and its shareholders.
PFAS Stray Liabilities: Future Eligible PFAS Costs
On July 1, 2015, EID completed the separation of EID’s Performance Chemicals segment through the spin-off of Chemours to holders of EID common stock (the “Chemours Separation”). In connection with the spin-off, EID and Chemours entered into a Separation Agreement. In 2017, EID and Chemours amended the Chemours Separation Agreement (as amended, the “Chemours Separation Agreement”) to provide for a limited sharing of potential future liabilities related to alleged historical releases of PFOA for a five-year period that began on July 6, 2017.
On May 13, 2019, Chemours filed suit in the Delaware Court of Chancery against EID, Corteva and the Company seeking, among other things, to limit its responsibility for the litigation and environmental liabilities allocated to and assumed by Chemours under the Chemours Separation Agreement (the “Delaware Litigation”). On March 30, 2020, the Court of Chancery granted a motion to dismiss. On December 15, 2020, the Delaware Supreme Court affirmed the judgment of the Court of Chancery. Meanwhile, a confidential arbitration process regarding the same and other claims has proceeded (the “Pending Arbitration”).
On January 22, 2021, the Company, Corteva, EID and Chemours entered into a binding Memorandum of Understanding (the “MOU”), pursuant to which the parties have agreed to release certain claims regarding the Delaware Litigation and the Pending Arbitration, including that Chemours has released any claim set forth in the complaint filed in the Delaware Litigation, any other similar claims arising out of or resulting from the facts recited by Chemours in the complaint or the process and manner in which EID structured or conducted the Chemours Separation, and any other claims that challenge the Chemours Separation or the assumption of Chemours Liabilities (as defined in the Chemours Separation Agreement) by Chemours and the allocation thereof, subject in each case to certain exceptions set forth in the MOU. The parties have further agreed not to bring any future, additional claims regarding the Chemours Separation Agreement or the MOU outside of arbitration. In connection with entering into the MOU, the parties have jointly moved to terminate the Pending Arbitration.
Pursuant to the MOU, the parties have agreed to share certain costs associated with potential future liabilities related to alleged historical releases of certain PFAS, including PFOA, out of pre-July 1, 2015 conduct (“eligible PFAS costs”) until the earlier to occur of (i) December 31, 2040, (ii) the day on which the aggregate amount of qualified spend (as defined in the MOU) is equal to $4 billion or (iii) a termination in accordance with the terms of the MOU. This sharing arrangement replaces the cost sharing arrangement between EID and Chemours established pursuant to the Chemours Separation Agreement.
The parties have agreed that, during the term of this sharing arrangement, Chemours will bear 50 percent of any qualified spend and the Company and Corteva shall bear 50 percent of any qualified spend. The Company’s and Corteva’s share of qualified spend shall not exceed $2 billion in the aggregate. After the term of this arrangement, Chemours’ indemnification obligations under the Chemours Separation Agreement would continue unchanged, subject in each case to certain exceptions set forth in the MOU.
In order to support and manage any potential future eligible PFAS costs, the parties have also agreed to establish an escrow account. The MOU provides that (1) no later than each of September 30, 2021 and September 30, 2022, Chemours shall deposit $100 million into an escrow account and DuPont and Corteva shall together deposit $100 million in the aggregate into an escrow account and (2) no later than September 30 of each subsequent year through and including 2028, Chemours shall deposit $50 million into an escrow account and DuPont and Corteva shall together deposit $50 million in the aggregate into an escrow account. Subject to the terms and conditions set forth in the MOU, each party may be permitted to defer funding in any year (excluding 2021). Additionally, if on December 31, 2028, the balance of the escrow account (including interest) is less than $700 million, Chemours will make 50 percent of the deposits and DuPont and Corteva together will make 50 percent of the deposits necessary to restore the balance of the escrow account to $700 million. Such payments will be made in a series of consecutive annual equal installments commencing on September 30, 2029 pursuant to the escrow account replenishment terms as set forth in the MOU.
All funding obligations of the Company and Corteva under this sharing arrangement, whether in respect of escrow funding or in respect of qualified spend, will be allocated between the Company and Corteva in accordance with the terms of the DWDP Separation and Distribution Agreement and the terms of the Letter Agreement.
Future charges, if any, associated with the MOU would be recognized over the term of the agreement as a component of income from discontinued operations to the extent liabilities become probable and estimable.
The parties have agreed to cooperate in good faith to enter into additional agreements reflecting the terms set forth in the MOU on or prior to February 28, 2021.
Ohio MDL Personal Injury Cases
DuPont, which was formed after the spin-off of Chemours, is not named in the personal injury and other PFAS actions discussed below.
In 2004, EID settled a West Virginia state court class action, Leach v. DuPont, which alleged that PFOA from EID’s former Washington Works facility had contaminated area drinking water supplies and affected the health of area residents. EID has residual liabilities under the Leach settlement related to providing PFOA water treatment to six area water districts and private well users and to fund, through an escrow account, up to $235 million for a medical monitoring program for eligible class members.
Members of the Leach class have standing to pursue personal injury claims for just six health conditions that an expert panel appointed under the Leach settlement reported in 2012 had a “probable link” (as defined in the settlement) with PFOA: pregnancy-induced hypertension, including preeclampsia; kidney cancer; testicular cancer; thyroid disease; ulcerative colitis; and diagnosed high cholesterol. In 2017, Chemours and EID each paid $335 million to settle the multi-district litigation in the U.S. District Court for the Southern District of Ohio (“Ohio MDL”), thereby resolving claims of about 3,550 plaintiffs alleging injury from exposure to PFOA in drinking water. The 2017 settlement did not resolve claims of Leach class members who did not have claims in the Ohio MDL or whose claims are based on diseases first diagnosed after February 11, 2017. As of December 31, 2020, since the 2017 settlement about 100 additional cases alleging personal injury, including kidney and testicular cancer claims, have been filed and are pending in the Ohio MDL. About a dozen additional claims have been noticed but not yet accepted in the Ohio MDL.
On January 21, 2021, EID and Chemours entered into settlement agreements with plaintiffs’ counsel representing the Ohio MDL plaintiffs providing for a settlement of cases and claims in the Ohio MDL, except as noted below (the “Settlement”). The total settlement amount is $83 million in cash with each of the Company and EID contributing $27 million and Chemours contributing $29 million. The Settlement was entered into solely by way of compromise and settlement and is not in any way an admission of liability or fault by the Company, Corteva, EID or Chemours. The case captioned “Abbott v E. I. du Pont de Nemours and Company” is not included in the Settlement and is presently pending motions for new trial.
In the Abbott case, the jury returned a verdict in March 2020 against EID, awarding $50 million in compensatory damages to the plaintiff and his wife, who claimed that exposure to PFOA in drinking water caused him to develop testicular cancer. EID will appeal the verdict. The plaintiffs also sought but were not awarded punitive damages.
In addition to the actions described above, there are several cases alleging damages to natural resources, the environment, water, and/or property as well as various other allegations. DuPont and Corteva are named in most of the actions discussed below. Such actions include additional claims based on allegations that the transfer by EID of certain PFAS liabilities to Chemours prior to the Chemours Separation resulted in a fraudulent conveyance or voidable transaction.
Natural Resource Damage Matters
Since May 2017, a number of state attorneys general have filed lawsuits against DuPont, Corteva, EID, Chemours, and others, claiming environmental contamination by certain PFAS compounds. Such actions are currently pending in Michigan, New Hampshire, New Jersey, New York, North Carolina, Ohio and Vermont. Generally, the states raise common law tort claims and seek economic impact damages for alleged harm to natural resources, punitive damages, present and future costs to cleanup contamination from certain PFAS compounds, and to abate the alleged nuisance. Most of these actions include fraudulent transfer claims related to the Chemours Separation, the DowDuPont separations, and questions potential loss of assets caused by future divestitures.
Other PFAS Environmental Matters
Several lawsuits have been filed by residents, local water districts, and private water companies against EID and Chemours in New York. Additionally, a water district in West Virginia, filed suit in state court against EID, Chemours, Corteva, DuPont, and others alleging contamination as a result of PFAS releases and seeking compensatory, consequential and punitive damages, and attorneys’ fees. The complaint includes a fraudulent transfer allegation associated with the Chemours separation. In September 2020, a complaint was filed in the Central District of California on behalf of Golden State Water Company against DuPont, Corteva, EID, Chemours, and others, alleging contamination of water systems from PFAS. The complaint includes fraudulent transfer claims related to the Chemours Separation, the DowDuPont separations, and questions potential loss of assets caused by future divestitures.
North Carolina PFAS Actions
There are several actions pending in federal court against EID and Chemours, relating to discharges of PFCs, including GenX, into the Cape Fear River. GenX is a polymerization processing aid and a replacement for PFOA introduced by EID which Chemours continues to manufacture at its Fayetteville Works facility in Bladen County, North Carolina. One of these actions is a consolidated putative class action that asserts claims for damages and other relief on behalf of putative classes of property owners and residents in areas near or who draw drinking water from the Cape Fear River. Another action is a consolidated action brought by various North Carolina water authorities, including the Cape Fear Public Utility Authority and Brunswick County, that seek actual and punitive damages as well as injunctive relief. In addition, an action is pending in North Carolina state court on behalf of about 100 plaintiffs who own wells and property near the Fayetteville Works facility. The plaintiffs seek damages for nuisance allegedly caused by releases of certain PFCs from the site.
In the third quarter 2020, three lawsuits were filed in North Carolina state court against Chemours, EID, Corteva and DuPont. The lawsuits seek damages for alleged personal injuries to more than 100 individuals due to alleged exposure to PFOA and GenX originating from the Fayetteville Works plant. These lawsuits also include fraudulent transfer allegations related to the Chemours Separation.
Aqueous Film Forming Foam
Beginning in April 2019, several dozen lawsuits involving water contamination arising from the use of PFAS-containing aqueous firefighting foams (“AFFF”) were filed against EID, Chemours, 3M and other AFFF manufacturers and in different parts of the country. Most were consolidated in multi-district litigation docket in federal district court in South Carolina (the “SC MDL”). Many of those cases also name DuPont as a defendant. Those actions largely seek remediation of the alleged PFAS contamination in and around military bases and airports as well as medical monitoring of affected residents. In September 2020, a complaint was filed in Missouri state court on behalf of a deceased firefighter against 3M, DuPont, Corteva, EID, Chemours and others. The suit seeks damages for injuries and wrongful death of the plaintiff allegedly from his exposure to PFAS contained in AFFF. This case has not been removed to the SC MDL.
As of December 31, 2020, approximately 820 personal injury cases have been filed directly in the SC MDL and assert claims on behalf of individual firefighters and others who allege that exposure to PFAS in firefighting foam caused them to develop cancer, including kidney and testicular cancer. DuPont has been named as a defendant in most of these personal injury AFFF cases. DuPont is seeking the dismissal of DowDuPont and DuPont from these actions. EID and the Company have never made or sold AFFF, perfluorooctanesulfonic acid ("PFOS") or PFOS containing products.
Additionally, a case filed by a former firefighter is pending in the Southern District of Ohio seeking certification of a nationwide class of individuals who have detectable levels of PFAS in their blood serum. The suit was filed against 3M and several other defendants in addition to Chemours and EID. The complaint specifically seeks, among other things, the creation of a “PFAS Science Panel” to study the effects of PFAS, but expressly states that the class does not seek compensatory damages for personal injuries. In February 2020, the court denied the defendants' motion to transfer this case to the SC MDL. The decision of whether to certify the class is currently pending before the court.
Other Actions
A number of additional PFAS lawsuits have been filed in various state and federal courts against DuPont, Corteva, EID, Chemours, 3M and others, alleging contamination of water systems.
On December 18, 2020, Suez Water filed suits in both New York and New Jersey against EID, DuPont, DuPont Specialty Products USA, LLC, Corteva, and Chemours alleging contamination of its water systems due to the release of PFAS. These lawsuits generally seek damages for the installation and implementation of drinking water treatment systems in addition to attorneys’ fees and costs, and include allegations of fraudulent transfer related to the Chemours Separation.
There are several actions that have been filed in New Jersey on behalf of residents who allege personal injuries due to exposure to PFAS. These lawsuits generally seek compensatory and punitive damages stemming from those injuries and medical monitoring.
In December, 2020, several water districts in California filed suit to recover costs associated with alleged PFAS contamination of groundwater and for abatement of the alleged contamination based on strict products liability, trespass, public and private nuisance, negligence and the Orange County Water District Act.
A putative class action was filed in the Northern District of New York on behalf of all individuals who, as of December 1, 2015, are or were owners of real property located in the Village of Hoosick Falls, New York and who obtain their drinking water from a privately owned well which has allegedly been contaminated by PFAS. The plaintiffs seek compensatory and punitive damages as well as medical monitoring. The certification of the class is currently pending before the court.
Other Litigation Matters
In addition to the specific matters described above, the Company is party to other claims and lawsuits arising out of the normal course of business with respect to product liability, patent infringement, governmental regulation, contract and commercial litigation, and other actions. Certain of these actions may purport to be class actions and seek damages in very large amounts. It is the opinion of the Company’s management that the possibility is remote that the aggregate of all such other claims and lawsuits will have a material adverse impact on the results of operations, financial condition and cash flows of the Company.
Environmental Matters
Accruals for environmental matters are recorded when it is probable that a liability has been incurred and the amount of the liability can be reasonably estimated based on current law and existing technologies. At December 31, 2020, the Company had accrued obligations of $80 million for probable environmental remediation and restoration costs, inclusive of $36 million retained and assumed following the DWDP Distributions and $44 million of indemnified liabilities. These obligations are included in "Accrued and other current liabilities" and "Other noncurrent obligations" in the Consolidated Balance Sheets. This is management’s best estimate of the costs for remediation and restoration with respect to environmental matters for which the Company has accrued liabilities, although it is reasonably possible that the ultimate cost with respect to these particular matters could range up to $170 million above the amount accrued at December 31, 2020. Consequently, it is reasonably possible that environmental remediation and restoration costs in excess of amounts accrued could have a material impact on the Company’s results of operations, financial condition and cash flows. Inherent uncertainties exist in these estimates primarily due to unknown conditions, changing governmental regulations and legal standards regarding liability, and emerging remediation technologies for handling site remediation and restoration. At December 31, 2019, the Company had accrued obligations of $77 million for probable environmental remediation and restoration costs.
Pursuant to the DWDP Separation and Distribution Agreement, the Company is required to indemnify certain clean-up responsibilities and associated remediation costs. The accrued environmental obligations of $80 million as of December 31, 2020 includes amount for which the Company indemnifies Dow and Corteva. At December 31, 2020, the Company has indemnified Dow and Corteva $8 million and $36 million, respectively.
Indemnifications
In connection with the ongoing divestitures and transactions, the Company has indemnified and has been indemnified by respective parties against certain liabilities that may arise in connection with these transactions and business activities prior to the completion of the respective transactions. The term of these indemnifications, which typically pertain to environmental, tax and product liabilities, is generally indefinite. At December 31, 2020, the indemnified assets were $90 million within "Accounts and notes receivable - net" and $124 million within "Deferred charges and other assets" and the indemnified liabilities were $157 million within "Accrued and other current liabilities" and $132 million within "Other noncurrent obligations" within the Consolidated Balance Sheets. At December 31, 2019, the indemnified assets were $133 million within "Accounts and notes receivable - net" and $146 million within "Deferred charges and other assets" and the indemnified liabilities were $77 million within "Accrued and other current liabilities" and $97 million within "Other noncurrent obligations" within the Consolidated Balance Sheets.
Guarantees
Obligations for Equity Affiliates & Others
The Company has directly guaranteed various debt obligations under agreements with third parties related to equity affiliates and customers. At December 31, 2020 and December 31, 2019, the Company had directly guaranteed $189 million and $187 million, respectively, of such obligations. These amounts represent the maximum potential amount of future (undiscounted) payments that the Company could be required to make under the guarantees. The Company would be required to perform on these guarantees in the event of default by the guaranteed party.
The Company assesses the payment/performance risk by assigning default rates based on the duration of the guarantees. These default rates are assigned based on the external credit rating of the counterparty or through internal credit analysis and historical default history for counterparties that do not have published credit ratings. For counterparties without an external rating or available credit history, a cumulative average default rate is used.
In certain cases, the Company has recourse to assets held as collateral, as well as personal guarantees from customers. At December 31, 2020, no collateral was held by the Company. The following table provides a summary of the final expiration year and maximum future payments for each type of guarantee:
| | | | | | | | |
| Guarantees at December 31, 2020 | Final Expiration Year | Maximum Future Payments |
| In millions |
Obligations for customers 1: | | |
| Bank borrowings | 2021 | $ | 22 | |
Obligations for non-consolidated affiliates 2: | | |
| Bank borrowings | 2021 | 167 | |
| Total guarantees | | $ | 189 | |
1. Existing guarantees for select customers, as part of contractual agreements. The terms of the guarantees are equivalent to the terms of the customer loans that are primarily made to finance customer invoices. At December 31, 2020, all maximum future payments had terms less than a year.
2. Existing guarantees for non-consolidated affiliates' liquidity needs in normal operations.
NOTE 16 - LEASES
The Company has operating and finance leases for real estate, an airplane, railcars, fleet, certain machinery and equipment, and information technology assets. The Company’s leases have remaining lease terms of approximately 1 year to 40 years. For purposes of calculating operating lease liabilities, lease terms may be deemed to include options to extend the lease when it is reasonably certain that the Company will exercise that option. Some leasing arrangements require variable payments that are dependent on usage, output, or may vary for other reasons, such as insurance and tax payments. The variable lease payments are not presented as part of the initial ROU asset or lease liability.
Certain of the Company's leases include residual value guarantees. These residual value guarantees are based on a percentage of the lessor's asset acquisition price and the amount of such guarantee declines over the course of the lease term. The portion of residual value guarantees that are probable of payment is included in the related lease liability in the Consolidated Balance Sheet other than certain finance leases that include the maximum residual value guarantee amount in the measurement of the related liability given the election to use the package of practical expedients at the date of adoption of Leases (Topic 842). At December 31, 2020, the Company has future maximum payments for residual value guarantees in operating leases of $21 million with final expirations through 2024. The Company's lease agreements do not contain any material restrictive covenants.
The components of lease cost for operating and finance leases for the years ended December 31, 2020 and 2019 were as follows:
| | | | | | | | |
| In millions | 2020 | 2019 |
| Operating lease cost | $ | 197 | | $ | 182 | |
| Finance lease cost | | |
| Amortization of right-of-use assets | 3 | | 4 | |
| Interest on lease liabilities | — | | — | |
| Total finance lease cost | $ | 3 | | $ | 4 | |
| Short-term lease cost | 4 | | 5 | |
| Variable lease cost | 47 | | 22 | |
| Less: Sublease income | 23 | | 23 | |
| Total lease cost | $ | 228 | | $ | 190 | |
Prior to the adoption of Topic 842, rental expense under operating leases, net of sublease rental income, for the year ended December 31, 2018 was $142 million.
Supplemental cash flow information related to leases was as follows:
| | | | | | | | |
| In millions | December 31, 2020 | December 31, 2019 |
| Cash paid for amounts included in the measurement of lease liabilities: | | |
| Operating cash flows from operating leases | $ | 193 | | $ | 184 | |
| Financing cash flows from finance leases | $ | 1 | | $ | 3 | |
| Gain on sale-leaseback transactions, net | $ | — | | $ | 17 | |
New operating lease assets and liabilities entered into during the year ended December 31, 2020 and 2019 were $196 million and $117 million, respectively. Supplemental balance sheet information related to leases was as follows:
| | | | | | | | |
| In millions | December 31, 2020 | December 31, 2019 |
Operating Leases | | |
Operating lease right-of-use assets 1 | $ | 637 | | $ | 556 | |
Current operating lease liabilities 2 | 170 | | 138 | |
Noncurrent operating lease liabilities 3 | 472 | | 416 | |
Total operating lease liabilities | $ | 642 | | $ | 554 | |
| | |
Finance Leases | | |
Property, plant, and equipment, gross | $ | 11 | | $ | 13 | |
Accumulated depreciation | 7 | | 6 | |
Property, plant, and equipment, net | $ | 4 | | $ | 7 | |
| Short-term borrowings and finance lease obligations | $ | — | | $ | 1 | |
| Long-Term Debt | 2 | | 2 | |
| Total finance lease liabilities | $ | 2 | | $ | 3 | |
1.Included in "Deferred charges and other assets" in the Consolidated Balance Sheet.
2.Included in "Accrued and other current liabilities" in the Consolidated Balance Sheet.
3.Included in "Other noncurrent obligations" in the Consolidated Balance Sheet.
Operating lease ROU assets and lease liabilities are recognized at the commencement date based on the present value of lease payments over the lease term. As most of the Company’s leases do not provide the lessor’s implicit rate, the Company uses its incremental borrowing rate at the commencement date in determining the present value of lease payments.
| | | | | | | | |
| Lease Term and Discount Rate | December 31, 2020 | December 31, 2019 |
| Weighted-average remaining lease term (years) | | |
| Operating leases | 7.33 | 7.18 |
| Finance leases | 4.25 | 4.52 |
| Weighted average discount rate | | |
| Operating leases | 2.77 | % | 3.28 | % |
| Finance leases | 3.42 | % | 3.35 | % |
Maturities of lease liabilities were as follows:
| | | | | | | | |
| Maturity of Lease Liabilities at December 31, 2020 | Operating Leases | Finance Leases |
| In millions |
| 2021 | $ | 186 | | $ | 1 | |
| 2022 | 161 | | 1 | |
| 2023 | 104 | | — | |
| 2024 | 123 | | — | |
| 2025 | 45 | | — | |
| 2026 and thereafter | 190 | | 1 | |
| Total lease payments | $ | 809 | | $ | 3 | |
| Less: Interest | 167 | | 1 | |
| Present value of lease liabilities | $ | 642 | | $ | 2 | |
NOTE 17 - STOCKHOLDERS' EQUITY
Share Repurchase Program
On June 1, 2019, the Company's Board of Directors approved a $2 billion share buyback program, which expires on June 1, 2021. During the year ended December 31, 2020, the Company repurchased and retired 6.1 million shares for $232 million. As of the year ended December 31, 2020, the Company had repurchased and retired 16.9 million shares under this program at a total cost of $982 million.
Common Stock
The following table provides a reconciliation of DuPont Common Stock activity for the years ended December 31, 2020, 2019 and 2018:
| | | | | | | | |
| Shares of DuPont Common Stock | Issued | Held in Treasury |
| In thousands |
| Balance at January 1, 2018 | 780,485 | | 4,708 | |
| Issued | 3,658 | | — | |
| Repurchased | — | | 23,110 | |
| Balance at December 31, 2018 | 784,143 | | 27,818 | |
| Issued | 2,656 | | — | |
| Repurchased | — | | 20,416 | |
Retired 1 | (48,234) | | (48,234) | |
| Balance at December 31, 2019 | 738,565 | | — | |
| Issued | 1,719 | | — | |
| Repurchased | — | | 6,080 | |
Retired | (6,080) | | (6,080) | |
| Balance at December 31, 2020 | 734,204 | | — | |
1.Includes 37 million shares of common stock held in treasury that were retired in June 2019, which were returned to the status of authorized but unissued shares.
Retained Earnings
There are no significant restrictions limiting the Company's ability to pay dividends. Dividends declared and paid to common stockholders during the years ended December 31, 2020, 2019, and 2018 are summarized in the following table:
| | | | | | | | | | | | | | |
| Dividends Declared and Paid | 2020 | 2019 | 2018 |
| In millions |
Dividends declared to common stockholders 1 | $ | 882 | | $ | 1,611 | | $ | 3,491 | |
Dividends paid to common stockholders 1 | $ | 882 | | $ | 1,611 | | $ | 3,491 | |
1.The 2019 and 2018 dividends declared and paid include dividends declared and paid to DowDuPont common stockholders prior to the DWDP Distributions.
Undistributed earnings of nonconsolidated affiliates included in retained earnings were $934 million at December 31, 2020 and $790 million at December 31, 2019.
Accumulated Other Comprehensive Loss
The following table summarizes the activity related to each component of accumulated other comprehensive loss ("AOCL") for the years ended December 31, 2020, 2019, and 2018:
| | | | | | | | | | | | | | | | | |
| Accumulated Other Comprehensive Loss | Unrealized Gains (Losses) on Investments | Cumulative Translation Adj | Pension and OPEB | Derivative Instruments | Total |
| In millions |
| 2018 | | | | | |
Balance at January 1, 2018 1 | $ | 17 | | $ | (1,935) | | $ | (6,923) | | $ | (111) | | $ | (8,952) | |
Other comprehensive income (loss) before reclassifications | (74) | | (1,739) | | (1,086) | | (15) | | (2,914) | |
Amounts reclassified from accumulated other comprehensive income (loss) | 7 | | (4) | | 460 | | 66 | | 529 | |
| Net other comprehensive income (loss) | $ | (67) | | (1,743) | | (626) | | 51 | | $ | (2,385) | |
Reclassification of stranded tax effects 2 | $ | (1) | | (107) | | (927) | | (22) | | $ | (1,057) | |
| Balance at December 31, 2018 | $ | (51) | | $ | (3,785) | | $ | (8,476) | | $ | (82) | | $ | (12,394) | |
| 2019 | | | | | |
Other comprehensive income (loss) before reclassifications | 68 | | (446) | | (206) | | (43) | | (627) | |
Amounts reclassified from accumulated other comprehensive income (loss) | (1) | | (18) | | 141 | | (15) | | 107 | |
| Net other comprehensive income (loss) | $ | 67 | | $ | (464) | | $ | (65) | | $ | (58) | | $ | (520) | |
| Spin-offs of Dow and Corteva | $ | (16) | | $ | 3,179 | | $ | 8,196 | | $ | 139 | | $ | 11,498 | |
| Balance at December 31, 2019 | $ | — | | $ | (1,070) | | $ | (345) | | $ | (1) | | $ | (1,416) | |
| 2020 | | | | | |
Other comprehensive income (loss) before reclassifications | — | | 1,540 | | (102) | | — | | 1,438 | |
| Amounts reclassified from accumulated other comprehensive income | — | | — | | 22 | | — | | 22 | |
| Net other comprehensive income (loss) | $ | — | | $ | 1,540 | | $ | (80) | | $ | — | | $ | 1,460 | |
| Balance at December 31, 2020 | $ | — | | $ | 470 | | $ | (425) | | $ | (1) | | $ | 44 | |
1.At January 1, 2018 the balance of "Unrealized gains (losses) on investments" was increased by $20 million to reflect the impact of adoption of ASU 2016-01, Financial Instruments - Overall (Subtopic 825-10): Recognition and Measurement of Financial Assets and Financial Liabilities, which was adopted in the first quarter of 2018.
2. Amounts reclassified to retained earnings as a result of the adoption of ASU 2018-02, Income Statement—Reporting Comprehensive Income (Topic 220), Reclassification of Certain Tax Effects from Accumulated Other Comprehensive Income, which was adopted April 1, 2018. The ASU allowed a reclassification from AOCL to retained earnings for stranded tax effects resulting from The Act.
The tax effects on the net activity related to each component of other comprehensive income (loss) for the years ended December 31, 2020, 2019, and 2018 were as follows:
| | | | | | | | | | | |
| Tax Benefit (Expense) | 2020 | 2019 | 2018 |
| In millions |
| Unrealized gains (losses) on investments | $ | — | | $ | (18) | | $ | 17 | |
| Cumulative translation adjustments | — | | (1) | | (6) | |
| Pension and other post-employment benefit plans | 37 | | 31 | | 152 | |
| Derivative instruments | — | | 16 | | (14) | |
Tax expense from income taxes related to other comprehensive income (loss) items | $ | 37 | | $ | 28 | | $ | 149 | |
A summary of the reclassifications out of AOCL for the years ended December 31, 2020, 2019, and 2018 is provided as follows:
| | | | | | | | | | | | | | |
| Reclassifications Out of Accumulated Other Comprehensive Loss | 2020 | 2019 | 2018 | Income Classification |
| In millions |
| Unrealized (gains) losses on investments | $ | — | | $ | (1) | | $ | 9 | | See (1) below |
Tax expense (benefit) | — | | — | | (2) | | See (2) below |
| Unrealized (gains) losses on investments, after tax | $ | — | | $ | (1) | | $ | 7 | | |
| Cumulative translation adjustments | $ | — | | $ | (18) | | $ | (4) | | See (3) below |
| Pension and other post-employment benefit plans | $ | 19 | | $ | 174 | | $ | 599 | | See (4) below |
Tax benefit | 3 | | (33) | | (139) | | See (2) below |
Pension and other post-employment benefit plans, after tax | $ | 22 | | $ | 141 | | $ | 460 | | |
| Derivative Instruments | $ | — | | $ | (18) | | $ | 83 | | See (5) below |
Tax expense (benefit) | — | | 3 | | (17) | | See (2) below |
| Derivative Instruments, after tax | $ | — | | $ | (15) | | $ | 66 | | |
| Total reclassifications for the period, after tax | $ | 22 | | $ | 107 | | $ | 529 | | |
1. "Net sales" and "Sundry income (expense) - net."
2. "Provision for income taxes on continuing operations."
3. "Sundry income (expense) - net."
4. These AOCL components are included in the computation of net periodic benefit cost of the Company's defined benefit pension and other post-employment benefit plans. See Note 19 for additional information.
5. "Cost of sales," "Sundry income (expense) - net" and "Interest expense."
NOTE 18 - NONCONTROLLING INTERESTS
Ownership interests in the Company's subsidiaries held by parties other than the Company are presented separately from the Company's equity in the Consolidated Balance Sheets as "Noncontrolling interests." The amount of consolidated net income attributable to the Company and the noncontrolling interests are both presented on the face of the Consolidated Statements of Operations.
The following table summarizes the activity for equity attributable to noncontrolling interests in the years ended December 31, 2020, 2019, and 2018:
| | | | | | | | | | | |
Noncontrolling Interests In millions | 2020 | 2019 | 2018 |
| Balance at beginning of period | $ | 569 | | $ | 1,608 | | $ | 1,597 | |
| Net income attributable to noncontrolling interests | 28 | | 102 | | 155 | |
Distributions to noncontrolling interests 1 | (50) | | (27) | | (168) | |
| Noncontrolling interests from DWDP Merger | — | | — | | 61 | |
| | | |
| Cumulative translation adjustments | — | | 12 | | (39) | |
| Spin-off of Dow and Corteva | — | | (1,124) | | — | |
| Other | 19 | | (2) | | 2 | |
| Balance at end of period | $ | 566 | | $ | 569 | | $ | 1,608 | |
1. Net of dividends paid to a joint venture, which were reclassified to "Equity in earnings of nonconsolidated affiliates" in the Consolidated Statements of Operations, totaled $27 million for the year ended December 31, 2018.
NOTE 19 - PENSION PLANS AND OTHER POST-EMPLOYMENT BENEFITS
TDCC and EID did not merge their defined benefit pension and other post-employment benefit ("OPEB") plans as a result of the DWDP Merger. In connection with the DWDP Distributions, the TDCC U.S. qualified defined benefit plan and the EID U.S. principal qualified defined benefit plan were separated from the Company to Dow and Corteva, respectively. The defined benefit pension plans that were related to TDCC that were not separated with Dow or Corteva were not merged with any EID plans. The Company retained a portion of pension liabilities relating to foreign benefit plans for both EID and TDCC. The Company retained select OPEB liabilities relating to foreign EID benefit plans but did not retain any TDCC OPEB plans. The Company also retained an immaterial portion of the non-qualified US pension liabilities and other post-employment benefit plans relating to EID US benefit plans. The significant defined benefit pension and OPEB plans of EID and EID are summarized below.
Defined Benefit Pension Plans
TDCC
TDCC had both funded and unfunded defined benefit pension plans that covered employees in the United States and a number of other countries. The U.S. qualified plan covering the parent company was the largest plan. Benefits for employees hired before January 1, 2008, were based on length of service and the employee’s three highest consecutive years of compensation. Employees hired after January 1, 2008, earned benefits based on a set percentage of annual pay, plus interest.
The Employee Matters Agreement with Dow provides that employees of Dow no longer participate in benefit plans sponsored or maintained by the Company, and that employees of the Company no longer participate in benefit plans sponsored or maintained by Dow, as of the effective time of the Dow Distribution. The U.S. qualified plan is no longer an obligation of the Company, the fundings, maintenance and ultimate payout of the plan is the sole responsibility of Dow. TDCC's funding policy was to contribute to the plans when pension laws and/or economics either require or encourage funding.
The Company has both funded and unfunded defined benefit pension plans that cover employees in a number of non-US countries.
EID
EID had both funded and unfunded noncontributory defined benefit pension plans covering a majority of the U.S. employees. The U.S. qualified plan was the largest pension plan held by EID. Most employees hired on or after January 1, 2007, were not eligible to participate in the U.S. defined benefit pension plans. The benefits under these plans were based primarily on years of service and employees' pay near retirement. EID froze the pay and service amounts used to calculate pension benefits for employees who participated in the U.S. pension plans as of November 30, 2018. Therefore, as of November 30, 2018, employees that participated in the U.S. pension plans no longer accrued additional benefits for future service and eligible compensation received.
The Employee Matters Agreement with Corteva provides that employees of Corteva no longer participate in benefit plans sponsored or maintained by the Company, and that employees of the Company no longer participate in benefit plans sponsored or maintained by Corteva, as of the effective time of the Corteva Distribution. The U.S. qualified plan is no longer an obligation of the Company; the fundings, maintenance and ultimate payout of the plan is the sole responsibility of Corteva Inc. The Company has both funded and unfunded defined benefit pension plans that cover executives in the United States and employees in a number of non-US countries.
EID's funding policy was consistent with the funding requirements of federal laws and regulations. Pension coverage for employees of EID's non-U.S. consolidated subsidiaries was provided, to the extent deemed appropriate, through separate plans. Obligations under such plans are funded by depositing funds with trustees, covered by insurance contracts, or remain unfunded. Total 2019 contributions also includes contributions to fund benefit payments for EID's pension plans where funding is not customary.
DuPont
DuPont has both funded and unfunded defined benefit pension plans covering employees in a number of non-US countries that formerly relate to both TDCC and EID. The United Kingdom qualified plan is the largest pension plan held by DuPont.
DuPont's funding policy is consistent with the funding requirements of each country's laws and regulations. Pension coverage for employees of DuPont's non-U.S. consolidated subsidiaries is provided, to the extent deemed appropriate, through separate plans. Obligations under such plans are funded by depositing funds with trustees, covered by insurance contracts, or remain unfunded. During 2020, the Company contributed $98 million to its pension plans. DuPont expects to contribute approximately $100 million to its pension plans in 2021.
The weighted-average assumptions used to determine pension plan obligations and net periodic benefit costs for all plans are summarized in the table below:
| | | | | | | | | | | | | | | | | |
| Weighted-Average Assumptions for Pension Plans | Benefit Obligations
at December 31, | Net Periodic Costs
for the Years Ended |
| | 2020 | 2019 | 2020 | 2019 1 | 2018 |
| Discount rate | 0.84 | % | 1.21 | % | 1.21 | % | 3.80 | % | 3.26 | % |
| Interest crediting rate for applicable benefits | 1.25 | % | 1.25 | % | 1.25 | % | 3.72 | % | 3.61 | % |
Rate of compensation increase 2 | 3.09 | % | 3.14 | % | 3.11 | % | 3.42 | % | 3.95 | % |
Expected return on plan assets 3 | N/A | N/A | 2.98 | % | 6.46 | % | 6.68 | % |
1.Includes three months of Dow activity (January - March), five months of Corteva activity (January - May) and twelve months of DuPont activity, all based on dates of the DWDP Distributions.
2. The December 31, 2018 rate did not include EID's U.S. pension plans as employees of these plans no longer accrued additional benefits for future service and eligible compensation.
3. The decrease in expected return on assets between 2020 and 2019 is due to de-risking of DuPont's two largest country plans within the United Kingdom and Switzerland. For the United Kingdom this process involved purchasing two buy-in insurance contracts for some current beneficiaries. For Switzerland this process involved changing the pension plan to a defined contribution plan (cash balance plan under US GAAP) at an insurance company for the current employees and adopting a low-risk fixed income strategy for the current beneficiaries of the plan.
Other Post-employment Benefit Plans
TDCC
TDCC provided certain health care and life insurance benefits to retired employees and survivors. TDCC’s plans outside of the United States were not significant; therefore, this discussion relates to the U.S. plans only. The plans provide health care benefits, including hospital, physicians’ services, drug and major medical expense coverage, and life insurance benefits. In general, for employees hired before January 1, 1993, the plans provide benefits supplemental to Medicare when retirees are eligible for these benefits. TDCC and the retiree share the cost of these benefits, with the TDCC portion increasing as the retiree has increased years of credited service, although there was a cap on the TDCC portion. TDCC had the ability to change these benefits at any time. Employees hired after January 1, 2008, are not covered under the plans.
The Employee Matters Agreement with Dow provides that employees of Dow no longer participate in benefit plans sponsored or maintained by the Company, and that employees of the Company no longer participate in benefit plans sponsored or maintained by Dow, as of the effective time of the Dow Distribution.
No TDCC other post-employment benefit plans were retained by the Company in connection with the Dow Distribution. All other post-employment benefit plans both those inside the US and those outside, are the sole responsibility of Dow.
EID
EID provided medical, dental and life insurance benefits to pensioners and survivors. The associated plans for retiree benefits were unfunded and the cost of the approved claims was paid from EID company funds. Essentially all of the cost and liabilities for these retiree benefit plans are attributable to the U.S. benefit plans. The non-Medicare eligible retiree medical plan is contributory with pensioners and survivors' contributions adjusted annually to achieve a 50/50 target for sharing of cost increases between EID and pensioners and survivors. In addition, limits were applied to EID's portion of the retiree medical cost coverage. For Medicare eligible pensioners and survivors, EID provided a funded Health Reimbursement Arrangement ("HRA"). In November 2016, EID announced that OPEB eligible employees who will be under the age of 50 as of November 30, 2018, as defined above, will not receive post-employment medical, dental and life insurance benefits. Beginning January 1, 2015, eligible employees who retire on and after that date will receive the same life insurance benefit payment, regardless of the employee's age or pay. The majority of U.S. employees hired on or after January 1, 2007, are not eligible to participate in the post-employment medical, dental and life insurance plans.
The Employee Matters Agreement with Corteva provides that employees of Corteva no longer participate in benefit plans sponsored or maintained by the Company, and that employees of the Company no longer participate in benefit plans sponsored or maintained by Corteva, as of the effective time of the Corteva Distribution. The vast majority of U.S. other post-employment benefit obligations are no longer the obligations of the Company; the fundings, maintenance and ultimate payout of the plans are the sole responsibility of Corteva Inc.
DuPont
The Company retained U.S. and foreign other post-employment benefit obligations with the Canadian plan being the largest plan and accounting for the majority of the Company's total other post-employment benefit obligations. In comparison to the Company's defined benefit pension plans, the Company's other post-employment benefit plans are not significant.
The weighted-average assumptions used to determine other post-employment benefit obligations and net periodic benefit costs are provided below:
| | | | | | | | | | | | | | | | | |
| Weighted-Average Assumptions for Other Postretirement Benefits Plans | Benefit Obligations
at December 31, | Net Periodic Costs
for the Year Ended |
| 2020 | 2019 | 2020 | 2019 1 | 2018 |
| Discount rate | 2.21 | % | 3.10 | % | 3.20 | % | 4.23 | % | 3.54 | % |
| Health care cost trend rate assumed for next year | N/A | N/A | N/A | 7.15 | % | 6.52 | % |
Rate to which the cost trend rate is assumed to decline (the ultimate health cost care trend rate) | N/A | N/A | N/A | 5.00 | % | 5.00 | % |
Year that the rate reaches the ultimate health care cost trend rate: | | | | | |
| TDCC plans | N/A | N/A | N/A | 2025 | 2025 |
| EID plans | N/A | N/A | N/A | 2028 | 2023 |
1.Includes three months of Dow activity (January - March), five months of Corteva activity (January - May) and twelve months of DuPont activity, all based on dates of the DWDP Distributions.
Assumptions
The Company determines the expected long-term rate of return on plan assets by performing a detailed analysis of key economic and market factors driving historical returns for each asset class and formulating a projected return based on factors in the current environment. Factors considered include, but are not limited to, inflation, real economic growth, interest rate yield, interest rate spreads, and other valuation measures and market metrics.
Service cost and interest cost for all other plans are determined on the basis of the discount rates derived in determining those plan obligations.The discount rates utilized to measure the majority of pension and other postretirement obligations are based on the Aon AA corporate bond yield curves applicable to each country at the measurement date. DuPont utilizes the mortality tables and generational mortality improvement scales, where available, developed in each of the respective countries in which the Company holds plans.
Summarized information on the Company's pension and other postretirement benefit plans is as follows:
| | | | | | | | | | | | | | |
| Change in Projected Benefit Obligations of All Plans | Defined Benefit Pension Plans | Other Post-Employment Benefits |
| In millions | 2020 | 2019 | 2020 | 2019 |
| Change in projected benefit obligations: | | | | |
| Benefit obligations at beginning of year | $ | 4,784 | | $ | 53,014 | | $ | 22 | | $ | 3,992 | |
| Service cost | 70 | | 184 | | 2 | | 5 | |
| Interest cost | 57 | | 630 | | 1 | | 53 | |
| Plan participants' contributions | 11 | | 11 | | — | | 15 | |
Actuarial changes in assumptions and experience | 298 | | 515 | | 18 | | 116 | |
| Benefits paid | (268) | | (1,247) | | (3) | | (150) | |
| Plan amendments | — | | (76) | | — | | — | |
| Acquisitions/divestitures/other | — | | 20 | | — | | — | |
| Effect of foreign exchange rates | 347 | | 31 | | — | | 1 | |
| Termination benefits/curtailment cost/settlements | (4) | | (4) | | — | | — | |
| Spin-off of Dow | — | | (29,285) | | — | | (1,462) | |
| Spin-off of Corteva | — | | (19,009) | | — | | (2,548) | |
| Benefit obligations at end of year | $ | 5,295 | | $ | 4,784 | | $ | 40 | | $ | 22 | |
| | | | | | | | | | | | | | |
| Change in Plan Assets and Funded Status of All Plans | Defined Benefit Pension Plans | Other Post-Employment Benefits |
| In millions | 2020 | 2019 | 2020 | 2019 |
| Change in plan assets: | | | | |
| Fair value of plan assets at beginning of year | $ | 3,757 | | $ | 41,462 | | $ | — | | $ | — | |
| Actual return on plan assets | 309 | | 1,191 | | — | | — | |
| Employer contributions | 98 | | 697 | | 3 | | 135 | |
| Plan participants' contributions | 11 | | 11 | | — | | 15 | |
| Benefits paid | (268) | | (1,247) | | (3) | | (150) | |
| Acquisitions/divestitures/other | — | | 10 | | — | | — | |
| Effect of foreign exchange rates | 251 | | 60 | | — | | — | |
| Settlements | — | | — | | — | | — | |
| Spin-off of Dow | — | | (22,626) | | — | | — | |
| Spin-off of Corteva | — | | (15,801) | | — | | — | |
| Fair value of plan assets at end of year | $ | 4,158 | | $ | 3,757 | | $ | — | | $ | — | |
| | | | |
| Funded status: | | | | |
| U.S. plans with plan assets | $ | — | | $ | — | | $ | — | | $ | — | |
| Non-U.S. plans with plan assets | (341) | | (315) | | — | | — | |
All other plans 1 | (796) | | (712) | | (40) | | (22) | |
| Funded status at end of year | $ | (1,137) | | $ | (1,027) | | $ | (40) | | $ | (22) | |
1.Certain benefit obligations are supported by funding, $6 million as of December 31, 2020 and $16 million as of December 31, 2019, under the Trust agreement, defined in the "Trust Assets" section.
The following tables summarize the amounts recognized in the consolidated balance sheets for all significant plans:
| | | | | | | | | | | | | | |
| Amounts Recognized in the Consolidated Balance Sheets for All Significant Plans | Defined Benefit Pension Plans | Other Post-Employment Benefits |
| In millions | December 31, 2020 | December 31, 2019 | December 31, 2020 | December 31, 2019 |
Amounts recognized in the consolidated balance sheets: | | | | |
| Deferred charges and other assets | $ | 230 | | $ | 171 | | $ | — | | $ | — | |
| Assets of discontinued operations | — | | — | | — | | — | |
| Accrued and other current liabilities | (53) | | (47) | | (6) | | (1) | |
| Pension and other postretirement benefits - noncurrent | $ | (1,314) | | $ | (1,151) | | $ | (34) | | $ | (21) | |
| Liabilities of discontinued operations | $ | — | | $ | — | | $ | — | | $ | — | |
| Net amount recognized | $ | (1,137) | | $ | (1,027) | | $ | (40) | | $ | (22) | |
| | | | |
Pretax amounts recognized in accumulated other comprehensive loss: | | | | |
| Net loss (gain) | $ | 583 | | $ | 485 | | $ | 20 | | $ | 2 | |
| Prior service credit | (47) | | (47) | | — | | — | |
Pretax balance in accumulated other comprehensive loss at end of year | $ | 536 | | $ | 438 | | $ | 20 | | $ | 2 | |
The increase in the Company's actuarial losses for the year ended December 31, 2020 was primarily due to the changes in weighted-average discount rates, which decreased from 1.21 percent at December 31, 2019 to 0.84 percent at December 31, 2020, partially offset by gains on assets in excess of what was expected.
The accumulated benefit obligation for all pension plans was $5.0 billion and $4.5 billion at December 31, 2020 and 2019, respectively.
| | | | | | | | |
| Pension Plans with Accumulated Benefit Obligations in Excess of Plan Assets | December 31, 2020 | December 31, 2019 |
| In millions |
| Accumulated benefit obligations | $ | 1,896 | | $ | 1,731 | |
| Fair value of plan assets | $ | 735 | | $ | 690 | |
| | | | | | | | |
| Pension Plans with Projected Benefit Obligations in Excess of Plan Assets | December 31, 2020 | December 31, 2019 |
| In millions |
| Projected benefit obligations | $ | 2,605 | | $ | 2,320 | |
| Fair value of plan assets | $ | 1,238 | | $ | 1,122 | |
| | | | | | | | | | | | | | | | | | | | |
| Net Periodic Benefit Costs for All Significant Plans for the Year Ended December 31, | Defined Benefit Pension Plans | Other Post-Employment Benefits |
| In millions | 2020 | 2019 | 2018 | 2020 | 2019 | 2018 |
| Net Periodic Benefit Costs: | | | | | | |
Service cost 1 | $ | 70 | | $ | 184 | | $ | 651 | | $ | 2 | | $ | 5 | | $ | 21 | |
Interest cost 2 | 57 | | 630 | | 1,638 | | 1 | | 53 | | 130 | |
Expected return on plan assets 3 | (110) | | (988) | | (2,846) | | — | | — | | — | |
Amortization of prior service credit 4 | (5) | | (9) | | (24) | | — | | — | | — | |
Amortization of unrecognized loss (gain) 5 | 16 | | 128 | | 649 | | — | | (6) | | (24) | |
Curtailment/settlement/other 6 | 9 | | — | | (10) | | — | | — | | — | |
| Net periodic benefit costs (credits) - Total | $ | 37 | | $ | (55) | | $ | 58 | | $ | 3 | | $ | 52 | | $ | 127 | |
| Less: Net periodic benefit (credits) costs - discontinued operations | — | | (45) | | 90 | | — | | 50 | | 126 | |
| Net periodic benefit costs (credits) - Continuing operations | $ | 37 | | $ | (10) | | $ | (32) | | $ | 3 | | $ | 2 | | $ | 1 | |
| Changes in plan assets and benefit obligations recognized in other comprehensive loss (income): | | | | | | |
| Net loss (gain) | $ | 99 | | $ | 350 | | $ | 1,490 | | $ | 18 | | $ | 2 | | $ | (185) | |
| Prior service (credit) cost | — | | (65) | | 34 | | — | | — | | — | |
| Amortization of prior service credit | 5 | | 3 | | 24 | | — | | — | | — | |
| Amortization of unrecognized (loss) gain | (16) | | (7) | | (649) | | — | | — | | 24 | |
| Curtailment loss | (4) | | (2) | | — | | — | | — | | — | |
| Settlement loss | (9) | | (2) | | 2 | | — | | — | | — | |
| Effect of foreign exchange rates | 21 | | (2) | | 1 | | — | | — | | — | |
| Total recognized in other comprehensive loss (income) | $ | 96 | | $ | 275 | | $ | 902 | | $ | 18 | | $ | 2 | | $ | (161) | |
Noncontrolling interest | $ | 2 | | $ | — | | $ | — | | $ | — | | $ | — | | $ | — | |
| Total recognized in net periodic benefit costs (credits) and other comprehensive loss (income) | $ | 131 | | $ | 265 | | $ | 870 | | $ | 21 | | $ | 4 | | $ | (160) | |
1.The service cost from continuing operations was $64 million for both the years ended December 31, 2019 and December 31, 2018, respectively, for pension plans. The activity from OPEBs was immaterial for all years presented.
2. The interest cost from continuing operations was $79 million and $76 million for the years ended December 31, 2019, and December 31, 2018, respectively, for pension plans. The activity from OPEBs was immaterial for all years presented.
3. The expected return on plan assets from continuing operations was $148 million and $178 million for the years ended December 31, 2019 and December 31, 2018, respectively, for pension plans.
4. The amortization of prior year service credit from continuing operations was $3 million for the year ended December 31, 2019 and immaterial for the year ended December 31, 2018 for pension plans. The activity from OPEBs was immaterial for all years presented.
5. The amortization of unrecognized gain/loss from continuing operations was gains of $2 million for the year ended December 2019 and losses of $7 million for the year ended December 31, 2018 for pension plans. The activity from OPEBs was immaterial for all years presented.
6. The curtailment and settlement costs from continuing operations was immaterial for the year ended December 31, 2019 for pension plans. The curtailment and settlement gain from continuing operations was $1 million for the year ended December 31, 2018 for pension plans. The activity from OPEBs was immaterial for all years presented.
Estimated Future Benefit Payments
The estimated future benefit payments, reflecting expected future service, as appropriate, are presented in the following table:
| | | | | | | | |
| Estimated Future Benefit Payments at December 31, 2020 | Defined Benefit Pension Plans | Other Postretirement Benefits |
| In millions |
| 2021 | $ | 201 | | $ | 6 | |
| 2022 | 196 | | 4 | |
| 2023 | 203 | | 3 | |
| 2024 | 204 | | 2 | |
| 2025 | 214 | | 2 | |
| Years 2026-2030 | 1,118 | | 11 | |
| Total | $ | 2,136 | | $ | 28 | |
Plan Assets
TDCC
Plan assets consist primarily of equity and fixed income securities of U.S. and foreign issuers, and include alternative investments such as real estate, private market securities and absolute return strategies. TDCC's investment strategy for the plan assets was to manage the assets in relation to the liability in order to pay retirement benefits to plan participants over the life of the plans. This was accomplished by identifying and managing the exposure to various market risks, diversifying investments across various asset classes and earning an acceptable long-term rate of return consistent with an acceptable amount of risk, while considering the liquidity needs of the plans.
The plans were permitted to use derivative instruments for investment purposes, as well as for hedging the underlying asset and liability exposure and rebalancing the asset allocation. The plans used value-at-risk, stress testing, scenario analysis and Monte Carlo simulations to monitor and manage both the risk within the portfolios and the surplus risk of the plans.
Equity securities primarily included investments in large- and small-cap companies located in both developed and emerging markets around the world. Fixed income securities included investment and non-investment grade corporate bonds of companies diversified across industries, U.S. treasuries, non-U.S. developed market securities, U.S. agency mortgage-backed securities, emerging market securities and fixed income related funds. Alternative investments primarily included investments in real estate, private equity limited partnerships and absolute return strategies. Other significant investment types included various insurance contracts and interest rate, equity, commodity and foreign exchange derivative investments and hedges.
TDCC mitigated the credit risk of investments by establishing guidelines with investment managers that limit investment in any single issue or issuer to an amount that was not material to the portfolio being managed. These guidelines were monitored for compliance both by TDCC and external managers. Credit risk related to derivative activity was mitigated by utilizing multiple counterparties, collateral support agreements and centralized clearing, where appropriate.
EID
Plan assets consisted primarily of equity and fixed income securities of U.S. and foreign issuers, and included alternative investments such as real estate and private market securities. EID established strategic asset allocation percentage targets and appropriate benchmarks for significant asset classes with the aim of achieving a prudent balance between return and risk. Strategic asset allocations in other countries were selected in accordance with the laws and practices of those countries. Where appropriate, asset liability studies were utilized in this process. U.S. plan assets and a portion of non-U.S. plan assets are managed by investment professionals employed by EID. The remaining assets are managed by professional investment firms unrelated to EID. EID's pension investment professionals had discretion to manage the assets within established asset allocation ranges approved by management. Additionally, pension trust funds were permitted to enter into certain contractual arrangements generally described as derivative instruments. Derivatives were primarily used to reduce specific market risks, hedge currency and adjust portfolio duration and asset allocation in a cost-effective manner.
Global equity securities include varying market capitalization levels. U.S. equity investments are primarily large-cap companies. Global fixed income investments include corporate-issued, government-issued and asset-backed securities. Corporate debt investments include a range of credit risk and industry diversification. U.S. fixed income investments are weighted heavier than non-U.S fixed income securities. Other investments include cash and cash equivalents, hedge funds, real estate and private market securities such as interests in private equity and venture capital partnerships.
DuPont
Plan assets consist primarily of equity and fixed income securities of U.S. and foreign issuers, and alternative investments such as insurance contracts, pooled investment vehicles and private market securities. At December 31, 2020, plan assets totaled $4,158 billion and included directly held common stock of DuPont of less than $1 million.
The Company establishes strategic asset allocation percentage targets and appropriate benchmarks for significant asset classes with the aim of achieving a prudent balance between return and risk. Strategic asset allocations in other countries are selected in accordance with the laws and practices of those countries. Where appropriate, asset liability studies are utilized in this process. The assets are managed by professional investment firms unrelated to the Company. Pension trust funds are permitted to enter into certain contractual arrangements generally described as derivative instruments. Derivatives are primarily used to reduce specific market risks, hedge currency and adjust portfolio duration and asset allocation in a cost-effective manner.
Equity securities primarily included investments in large- and small-cap companies located in both developed and emerging markets around the world. Global equity securities include varying market capitalization levels. U.S. equity investments are primarily large-cap companies. Fixed income securities included investment and non-investment grade corporate bonds of companies diversified across industries, U.S. treasuries, non-U.S. developed market securities, U.S. agency mortgage-backed securities, emerging market securities and fixed income related funds. Global fixed income investments include corporate-issued, government-issued and asset-backed securities. Corporate debt investments include a range of credit risk and industry diversification. U.S. fixed income investments are weighted heavier than non-U.S fixed income securities. Alternative investments primarily included investments in real estate, various insurance contracts and interest rate, equity, commodity and foreign exchange derivative investments and hedges. Other investments include cash and cash equivalents, pooled investment vehicles, hedge funds and private market securities such as interests in private equity and venture capital partnerships.
The weighted-average target allocation for plan assets of DuPont's pension plans is summarized as follows:
| | | | | |
| Target Allocation for Plan Assets at December 31, 2020 | DuPont |
| Asset Category |
| Equity securities | 20 | % |
| Fixed income securities | 17 | |
| Alternative investments | 21 | |
| Other investments | 42 | |
| Total | 100 | % |
Fair value calculations may not be indicative of net realizable value or reflective of future fair values. Furthermore, although the Company believes its valuation methods are appropriate and consistent with other market participants, the use of different methodologies or assumptions to determine the fair value of certain financial instruments could result in a different fair value measurement at the reporting date.
For pension plan assets classified as Level 1 measurements (measured using quoted prices in active markets), total fair value is either the price of the most recent trade at the time of the market close or the official close price, as defined by the exchange on which the asset is most actively traded on the last trading day of the period, multiplied by the number of units held without consideration of transaction costs.
For pension plan assets classified as Level 2 measurements, where the security is frequently traded in less active markets, fair value is based on the closing price at the end of the period; where the security is less frequently traded, fair value is based on the price a dealer would pay for the security or similar securities, adjusted for any terms specific to that asset or liability. Market inputs are obtained from well-established and recognized vendors of market data and subjected to tolerance and quality checks. For derivative assets and liabilities, standard industry models are used to calculate the fair value of the various financial instruments based on significant observable market inputs, such as foreign exchange rates, commodity prices, swap rates, interest rates and implied volatilities obtained from various market sources. For other pension plan assets for which observable inputs are used, fair value is derived through the use of fair value models, such as a discounted cash flow model or other standard pricing models.
For pension plan assets classified as Level 3 measurements, total fair value is based on significant unobservable inputs including assumptions where there is little, if any, market activity for the investment. Valuations of the investments are provided by investment managers or fund managers. These valuations are reviewed for reasonableness based on applicable sector, benchmark and company performance. Valuations of insurance contracts are contractually determined and are based on exit price valuations or contract value. Adjustments to valuations are made where appropriate.
Certain pension plan assets are held in funds where fair value is based on an estimated net asset value per share (or its equivalent) as of the most recently available fund financial statements which are received on a monthly or quarterly basis. These valuations are reviewed for reasonableness based on applicable sector, benchmark and company performance. Adjustments to valuations are made where appropriate to arrive at an estimated net asset value per share at the measurement date. Where available, audited annual financial statements are obtained and reviewed for the investments as support for the manager’s investment valuation. These funds are not classified within the fair value hierarchy.
The following table summarizes the bases used to measure the Company’s pension plan assets at fair value for the years ended December 31, 2020 and 2019:
| | | | | | | | | | | | | | | | | | | | | | | | | | |
| Basis of Fair Value Measurements | December 31, 2020 | December 31, 2019 |
| In millions | Total | Level 1 | Level 2 | Level 3 | Total | Level 1 | Level 2 | Level 3 |
| Cash and cash equivalents | $ | 97 | | $ | 97 | | $ | — | | $ | — | | $ | 101 | | $ | 101 | | $ | — | | $ | — | |
| Equity securities: | | | | | | | | |
U.S. equity securities 1 | $ | 336 | | $ | 336 | | $ | — | | $ | — | | $ | 297 | | $ | 297 | | $ | — | | $ | — | |
| Non - U.S. equity securities | 480 | | 473 | | 7 | | — | | 622 | | 609 | | 13 | | — | |
| Total equity securities | $ | 816 | | $ | 809 | | $ | 7 | | $ | — | | $ | 919 | | $ | 906 | | $ | 13 | | $ | — | |
| Fixed income securities: | | | | | | | | |
| Debt - government-issued | $ | 308 | | $ | 20 | | $ | 288 | | $ | — | | $ | 468 | | $ | 198 | | $ | 270 | | $ | — | |
| Debt - corporate-issued | 106 | | 16 | | 90 | | — | | 99 | | 12 | | 87 | | — | |
| Debt - asset-backed | — | | — | | — | | — | | 1 | | — | | 1 | | — | |
| Total fixed income securities | $ | 414 | | $ | 36 | | $ | 378 | | $ | — | | $ | 568 | | $ | 210 | | $ | 358 | | $ | — | |
Alternative investments: 2 | | | | | | | | |
| Real estate | 84 | | 7 | | — | | 77 | | 72 | | 6 | | — | | 66 | |
| Insurance contracts | $ | 788 | | $ | — | | $ | 30 | | $ | 758 | | $ | 334 | | $ | — | | $ | 30 | | $ | 304 | |
| Derivatives - asset position | 4 | | — | | 4 | | — | | 6 | | — | | 6 | | — | |
| Derivatives - liability position | (1) | | — | | (1) | | — | | (2) | | — | | (2) | | — | |
| Total alternative investments | $ | 875 | | $ | 7 | | $ | 33 | | $ | 835 | | $ | 410 | | $ | 6 | | $ | 34 | | $ | 370 | |
Other Investments: 2 | | | | | | | | |
| Pooled Investment Vehicles | $ | 627 | | $ | 627 | | $ | — | | $ | — | | $ | 790 | | $ | 790 | | $ | — | | $ | — | |
| Private market securities | — | | — | | — | | — | | — | | — | | — | | — | |
| Other investments | — | | — | | $ | — | | $ | — | | 6 | | 6 | | — | | — | |
| Total other investments | $ | 627 | | $ | 627 | | $ | — | | $ | — | | $ | 796 | | $ | 796 | | $ | — | | $ | — | |
| Subtotal | $ | 2,829 | | $ | 1,576 | | $ | 418 | | $ | 835 | | $ | 2,794 | | $ | 2,019 | | $ | 405 | | $ | 370 | |
Investments measured at net asset value: 2 | | | | | | | | |
| Debt - government-issued | $ | 273 | | | | | $ | 152 | | | | |
| Hedge funds | 933 | | | | | 745 | | | | |
| Private market securities | 122 | | | | | 107 | | | | |
| Real estate | — | | | | | — | | | | |
Total investments measured at net asset value | $ | 1,328 | | | | | $ | 1,004 | | | | |
Items to reconcile to fair value of plan assets: | | | | | | | | |
Pension trust receivables 3 | $ | 3 | | | | | $ | 15 | | | | |
Pension trust payables 4 | (2) | | | | | (56) | | | | |
| Total | $ | 4,158 | | | | | $ | 3,757 | | | | |
1.The Company's pension plans directly held less than $1 million (0 percent of total plan assets) of DuPont common stock at December 31, 2020 and less than held $1 million (0 percent of total plan assets) at December 31, 2019.
2.In 2018, the Company reviewed its fair value technique and elected to present assets valued at net asset value per share as a practical expedient outside of the fair value hierarchy. The assets are presented as "Investments measured at net asset value."
3.Primarily receivables for investment securities sold.
4.Primarily payables for investment securities purchased.
The following table summarizes the changes in the fair value of Level 3 pension plan assets for the years ended December 31, 2020 and 2019:
| | | | | | | | | | | | | | | | | |
| Fair Value Measurement of Level 3 Pension Plan Assets | Equity Securities | Fixed Income Securities | Real Estate | Investment Contracts | Total |
| In millions |
| Balance at Jan 1, 2019 | $ | 55 | | $ | 15 | | $ | 95 | | $ | 206 | | $ | 371 | |
| Actual return on assets: | | | | | |
| Relating to assets sold during 2019 | — | | — | | 2 | | — | | 2 | |
| Relating to assets held at Dec 31, 2019 | — | | — | | 10 | | 11 | | 21 | |
| Purchases, sales and settlements, net | — | | — | | — | | — | | — | |
| Transfers into Level 3, net | — | | — | | 1 | | 87 | | 88 | |
| Transfers out of Level 3, spin related | (55) | | (15) | | (42) | | — | | (112) | |
| Balance at Dec 31, 2019 | $ | — | | $ | — | | $ | 66 | | $ | 304 | | $ | 370 | |
| Actual return on assets: | | | | | |
| Relating to assets sold during 2020 | — | | — | | — | | — | | — | |
| Relating to assets held at Dec 31, 2020 | — | | — | | 9 | | 64 | | 73 | |
| Purchases, sales and settlements, net | — | | — | | 2 | | 390 | | 392 | |
| Transfers into Level 3, net | — | | — | | — | | — | | — | |
| Transfers out of Level 3, net | — | | — | | — | | — | | — | |
| Balance at Dec 31, 2020 | $ | — | | $ | — | | $ | 77 | | $ | 758 | | $ | 835 | |
Trust Assets
EID entered into a trust agreement in 2013 (as amended and restated in 2017) that established and required EID to fund a trust (the "Trust") for cash obligations under certain non-qualified benefit and deferred compensation plans upon a change in control event as defined in the Trust agreement. Under the Trust agreement, the consummation of the DWDP Merger was a change in control event. After the distribution of Corteva, the Trust assets related to Corteva employees were transferred to a new trust for Corteva. As a result, the Trust currently held by DuPont relates solely to funding obligations to DuPont employees. At December 31, 2020, the balance in the Trust was $25 million compared to $37 million at December 31, 2019.
Defined Contribution Plans
TDCC
U.S. employees participated in defined contribution plans (Employee Savings Plans or 401(k) plans) by contributing a portion of their compensation, which was partially matched by TDCC. Defined contribution plans also covered employees in some subsidiaries in other countries, including Australia, Brazil, Canada, Italy, Spain and the United Kingdom. Expense recognized for all defined contribution plans was $242 million in 2018.
EID
EID provided defined contribution benefits to its employees. The most significant was the U.S. Retirement Savings Plan ("the Plan"), which covered all U.S. full-service employees. This Plan included a non-leveraged Employee Stock Ownership Plan ("ESOP"). Employees were not required to participate in the ESOP and those who did were free to diversify out of the ESOP. The purpose of the Plan was to provide retirement savings benefits for employees and to provide employees an opportunity to become stockholders of the Company. The Plan was a tax qualified contributory profit sharing plan, with cash or deferred arrangement and any eligible employee of EID could participate. EID's post-Merger contributions were $183 million in 2018. EID's matching contributions vested immediately upon contribution. The 3 percent nonmatching employer contribution vested after employees completed three years of service.
In addition, EID made post-DWDP Merger contributions to other defined contribution plans of $51 million in 2018.
DuPont
The Company provides defined contribution benefits to its employees. The most significant is the U.S. Retirement Savings Plan ("the Plan"), which covers all U.S. full-service employees. This Plan includes a non-leveraged Employee Stock Ownership Plan ("ESOP"). Employees are not required to participate in the ESOP and those who do are free to diversify out of the ESOP. The purpose of the Plan is to provide retirement savings benefits for employees and to provide employees an opportunity to become stockholders of the Company. The Plan is a tax qualified contributory profit sharing plan, with cash or deferred arrangement and any eligible employee of the Company may participate. Currently, the Company contributes 100 percent of the first 6 percent of the employee's contribution election and also contributes 3 percent of each eligible employee's eligible compensation regardless of the employee's contribution. The Company's matching contributions vest immediately upon contribution. The 3
percent nonmatching employer contribution vests after employees complete three years of service. The Company's contributions to the Plan were $78 million in 2020 and $82 million in 2019 related to continuing operations.
In addition, the Company made contributions to other defined contribution plans in 2020 in the amount of $38 million and $24 million in 2019 related to continuing operations.
NOTE 20 - STOCK-BASED COMPENSATION
Effective with the DWDP Merger, on August 31, 2017, DowDuPont assumed all TDCC and EID equity incentive compensation awards outstanding immediately prior to the DWDP Merger. The fair values of the converted awards were based on valuation assumptions developed by management and other information including, but not limited to, historical volatility and exercise trends of TDCC and EID. All outstanding TDCC stock options and restricted stock unit ("RSU") (formerly termed deferred stock) awards were converted into stock options and RSU awards with respect to DowDuPont Common Stock. All outstanding and nonvested TDCC performance stock unit ("PSU") (formerly termed performance deferred stock) awards were converted into RSU awards with respect to DowDuPont Common Stock at the greater of the applicable performance target or the actual performance as of the effective time of the DWDP Merger.
In addition, the Company also assumed sponsorship of each equity incentive compensation plan of TDCC and EID. TDCC and EID did not merge their equity incentive plans as a result of the DWDP Merger. The TDCC and EID stock-based compensation plans were assumed by DowDuPont and remained in place with the ability to grant and issue DowDuPont common stock until the Distributions. Immediately following the Corteva Distribution, DuPont adopted the DuPont Omnibus Incentive Plan ("DuPont OIP") which provides for equity-based and cash incentive awards to certain employees, directors, independent contractors and consultants. Upon adoption of the DuPont OIP, the TDCC and EID plans were maintained and rolled into the DuPont OIP as separate subplans. The equity awards under these subplans have the same terms and conditions that were applicable to the awards under the TDCC and EID plans immediately prior to the Distributions.
During the second quarter of 2020, the stockholders of DuPont approved the DuPont 2020 Equity and Incentive Plan (the "2020 Plan"). The 2020 Plan limits the number of shares that may be subject to awards payable in shares of DuPont common stock to 19 million. The 2020 Plan authorizes the Company to grant options, share appreciation rights, restricted shares, RSUs, share bonuses, other share-based awards, cash awards, each as defined in the 2020 Plan, or any combination of the foregoing. The approval of the 2020 Plan had no effect on the Company’s ability to make future grants under the DuPont OIP in accordance with its terms, and awards that are outstanding under the DuPont OIP remain outstanding in accordance with their terms. There has been no activity under the 2020 Plan to date.
A description of the Company's stock-based compensation is discussed below followed by a description of TDCC and EID stock-based compensation.
Accounting for Stock-Based Compensation
The Company grants stock-based compensation awards that vest over a specified period or upon employees meeting certain performance and/or retirement eligibility criteria. The fair value of equity instruments issued to employees is measured on the grant date. The fair value of liability instruments issued to employees is measured at the end of each quarter. The fair value of equity and liability instruments is expensed over the vesting period or, in the case of retirement, from the grant date to the date on which retirement eligibility provisions have been met and additional service is no longer required. The Company estimates expected forfeitures.
DuPont recognized share-based compensation expense in continuing operations of $112 million, $106 million, and $92 million during the years ended December 31, 2020, 2019 and 2018, respectively. The income tax benefits related to stock-based compensation arrangements were $22 million, $22 million, and $19 million for the years ended December 31, 2020, 2019 and 2018, respectively.
Total unrecognized pretax compensation cost related to nonvested stock option awards of $10 million at December 31, 2020, is expected to be recognized over a weighted-average period of 1.3 years. Total unrecognized pretax compensation cost related to RSUs and PSUs of $62 million at December 31, 2020, is expected to be recognized over a weighted average period of 1.6 years. The total fair value of RSUs and PSUs vested in the year ended December 31, 2020 was $78 million. The weighted average grant-date fair value of RSUs and PSUs granted during 2020 was $52.83.
DuPont Omnibus Incentive Plan
The Company grants stock-based compensation awards to certain employees, directors, independent contractors and consultants in the form of stock incentive plans, which include stock options, RSUs and PSUs. The DuPont OIP has two subplans that have the same terms and conditions of the TDCC and EID plans immediately prior to the Distributions. Awards previously granted under those plans that were nonvested will now vest in each subplan. All new awards will be granted by the OIP. Under the DuPont OIP, a maximum of 10 million shares of common stock are available for award as of December 31, 2020.
OIP Stock Options
The exercise price of shares subject to option is equal to the market price of the Company's stock on the date of grant. Stock option awards expire 10 years after the grant date. The plan allows retirement-eligible employees of the Company to retain any granted awards upon retirement provided the employee has rendered at least six months of service following the grant date.
The Company uses the Black-Scholes option pricing model to determine the fair value of stock option awards and the assumptions set forth in the table below. The weighted-average assumptions used to calculate total stock-based compensation are included in the following table:
| | | | | | | | |
| OIP Weighted-Average Assumptions | 2020 | 2019 |
| Dividend yield | 2.3 | % | 1.8 | % |
| Expected volatility | 23.0 | % | 21.1 | % |
| Risk-free interest rate | 1.2 | % | 1.6 | % |
| Expected life of stock options granted during period (years) | 6.0 | 6.1 |
The Company determines the dividend yield by dividing the annualized dividend on DuPont's common stock by the option exercise price. A historical daily measurement of volatility (using DowDuPont stock information after the DWDP Merger date and a weighted average of TDCC and EID prior to DWDP Merger date) is determined based on the expected life of the option granted. The risk-free interest rate is determined by reference to the yield on an outstanding U.S. Treasury note with a term equal to the expected life of the option granted. Expected life is determined by reference to DuPont's historical experience, adjusted for expected exercise patterns of in-the-money options.
The following table summarizes stock option activity for 2020 under the OIP:
| | | | | | | | | | | | | | |
| OIP Stock Options | 2020 |
| Number of Shares
(in thousands) | Weighted Average Exercise Price (per share) | Weighted Average Remaining Contractual Term (in years) | Aggregate Intrinsic Value (in thousands) |
| Outstanding at January 1, 2020 | 1,367 | | $ | 66.06 | | | |
| Granted | 1,052 | | $ | 53.50 | | | |
| Exercised | — | | $ | — | | | |
| Forfeited/Expired | (147) | | $ | 63.59 | | | |
| Outstanding at December 31, 2020 | 2,272 | | $ | 60.40 | | 8.58 | $ | 24,322 | |
| Exercisable at December 31, 2020 | — | | $ | — | | — | | $ | — | |
| | | | | | | | |
Additional Information about OIP Stock Options 1 | | |
| In millions, except per share amounts | 2020 | 2019 |
| Weighted-average fair value per share of options granted | $ | 9.18 | | $ | 11.85 | |
| Total compensation expense for stock options plans | $ | 16 | | $ | 5 | |
| Related tax benefit | $ | 3 | | $ | 1 | |
1.No awards have vested under the OIP as of December 31, 2020.
The aggregate intrinsic values in the table above represent the total pretax intrinsic value (the difference between the closing stock price on the last trading day of 2020 and the exercise price, multiplied by the number of in-the-money options) that would have been received by the option holders had all option holders exercised their in-the-money options at year end.
OIP Restricted Stock Units and Performance Deferred Stock
The Company grants RSUs to certain employees that serially vested over a three-year period and, upon vesting, convert one-for-one to DuPont common stock. A retirement eligible employee retains any granted awards upon retirement provided the employee has rendered at least six months of service following the grant date. The fair value of all stock-settled RSUs is based upon the market price of the underlying common stock as of the grant date.
The Company grants PSUs to senior leadership under a subplan of the DuPont OIP. Vesting for PSUs granted is based upon achieving certain return on invested capital ("ROIC") targets and certain adjusted corporate net income annual growth targets, weighted evenly between the metrics and modified by a relative total shareholder return ("TSR") percentile ranking goal as compared to the S&P 500. Performance and payouts are determined independently for each metric. The actual award, delivered as DuPont common stock, can range from zero percent to two-hundred percent of the original grant. The weighted-average grant-date fair value of the PSUs, subject to the TSR metric, is based upon the market price of the underlying common stock as of the grant date and estimated using a Monte Carlo simulation.
Nonvested awards of RSUs and PSUs are shown below.
| | | | | | | | |
| OIP RSUs and PSUs | 2020 |
| Number of Shares
(in thousands) | Weighted Average Grant Date Fair Value
(per share) |
| Nonvested at January 1, 2020 | 561 | | $ | 66.56 | |
| Granted | 1,482 | | $ | 52.83 | |
| Vested | (38) | | $ | 63.14 | |
| Forfeited | (106) | | $ | 61.03 | |
| Nonvested at December 31, 2020 | 1,899 | | $ | 56.31 | |
TDCC Plans
TDCC granted stock-based compensation to employees and non-employee directors in the form of stock incentive plans, which include stock options, RSUs and restricted stock. TDCC also provided stock-based compensation in the form of PSUs.
TDCC Valuation Methods and Assumptions
Effective with the first quarter of 2018 grant, TDCC began using the Black-Scholes option valuation model to estimate the fair value of stock options. TDCC used the Black-Scholes option valuation model for subscriptions to purchase shares under the ESPP. The weighted-average assumptions used to calculate total stock-based compensation are included in the following table:
| | | | | |
TDCC Weighted-Average Assumptions 1 | 2018 |
| Dividend yield | 2.13 | % |
| Expected volatility | 23.34 | % |
| Risk-free interest rate | 2.83 | % |
| Expected life of stock options granted during period (years) | 6.2 |
| |
1.No awards were granted by the Company out of the TDCC plan during 2019 and 2020.
The dividend yield assumption was equal to the dividend yield on the grant date, which reflected the most recent DowDuPont quarterly dividend payment of $0.38 per share in 2018. The expected volatility assumptions for the 2018 stock options were based on an equal weighting of the historical daily volatility for the expected term of the awards and current implied volatility from exchange-traded options. The risk-free interest rate was based on the U.S. Treasury strip rates over the expected life of the 2018 options. The expected life of stock options granted was based on an analysis of historical exercise patterns.
TDCC Stock Incentive Plan
TDCC previously granted equity awards under various plans (the "Prior Plans"). On February 9, 2012, TDCC's Board of Directors authorized The Dow Chemical Company 2012 Stock Incentive Plan (the "2012 Plan"), which was approved by stockholders at TDCC's annual meeting on May 10, 2012 ("Original Effective Date") and became effective on that date. On February 13, 2014, TDCC's Board of Directors adopted The Dow Chemical Company Amended and Restated 2012 Stock Incentive Plan (the "2012 Restated Plan"). The 2012 Restated Plan was approved by stockholders at TDCC's annual meeting on May 15, 2014, and became effective on that date. The Prior Plans were superseded by the 2012 Plan and the 2012 Restated Plan (collectively, the "2012 Plan"). Under the 2012 Plan, TDCC may grant options, RSUs, PSUs, restricted stock, stock appreciation rights and stock units to employees and non-employee directors until the tenth anniversary of the Original
Effective Date, subject to an aggregate limit and annual individual limits. The terms of the grants are fixed at the grant date. TDCC's stock-based compensation programs were assumed by DowDuPont.
In connection with the DWDP Merger, on August 31, 2017 ("Conversion Date") all outstanding TDCC stock options and RSU awards were converted into stock options and RSU awards with respect to DowDuPont Common Stock. The stock options and RSU awards have the same terms and conditions under the applicable plans and award agreements prior to the DWDP Merger. All outstanding and nonvested PSU awards were converted into RSU awards with respect to DowDuPont Common Stock at the greater of the applicable performance target or the actual performance as of the effective time of the DWDP Merger. Changes in the fair value of liability instruments are recognized as compensation expense each quarter. Upon the adoption of the OIP, the 2012 Plan became an inactive sub plan of the OIP and no longer grants new awards. All previously granted awards still vest under the 2012 Plan with the same terms and conditions that were applicable to the awards immediately prior to the Distributions.
TDCC Stock Options
TDCC granted stock options to certain employees, subject to certain annual and individual limits, with terms of the grants fixed at the grant date. The exercise price of each stock option equals the market price of TDCC’s stock on the grant date. Options vest from one year to three years, and had a maximum term of 10 years.
The following table summarizes stock option activity for 2020:
| | | | | | | | | | | | | | |
| TDCC Stock Options | 2020 |
| Number of Shares
(in thousands) | Weighted Average Exercise Price
(per share) | Weighted Average Remaining Contractual Term (in years) | Aggregate Intrinsic Value
(in thousands) |
| Outstanding at January 1, 2020 | 689 | | $ | 58.21 | | | |
Granted 1 | — | | $ | — | | | |
| Exercised | (84) | | $ | 49.14 | | | |
| Forfeited/Expired | (10) | | $ | 60.75 | | | |
| Outstanding at December 31, 2020 | 595 | | $ | 59.45 | | 3.73 | $ | 7,596 | |
| Exercisable at December 31, 2020 | 534 | | $ | 57.96 | | 3.36 | $ | 7,564 | |
1.No awards were granted by the Company out of the TDCC plan during 2020.
| | | | | | | | | | | |
Additional Information about TDCC Stock Options 1 | | | |
| In millions, except per share amounts | 2020 | 2019 | 2018 |
| Weighted-average fair value per share of options granted | $ | — | | $ | — | | $ | 15.38 | |
| Total compensation expense for stock options plans | $ | — | | $ | 1 | | $ | 68 | |
| Related tax benefit | $ | — | | $ | — | | $ | 15 | |
| Total amount of cash received from the exercise of options | $ | 4 | | $ | 2 | | $ | 112 | |
Total intrinsic value of options exercised 2 | $ | 1 | | $ | 1 | | $ | 160 | |
| Related tax benefit | $ | — | | $ | — | | $ | 36 | |
1.No awards were granted by the Company out of the TDCC plan during 2019 and 2020.
2. Difference between the market price at exercise and the price paid by the employee to exercise the options.
TDCC Restricted Stock Units
TDCC granted restricted stock units to certain employees. The grants vest after a designated period of time, generally one to five years. The following table shows changes in nonvested RSUs:
| | | | | | | | |
| TDCC RSU Awards | 2020 |
| Shares in thousands | Shares | Grant Date Fair Value 1 |
| Nonvested at January 1, 2020 | 336 | | $ | 81.12 | |
Granted 2 | — | | $ | — | |
| Vested | (178) | | $ | 85.49 | |
| Forfeited | (6) | | $ | 75.97 | |
| Nonvested at December 31, 2020 | 152 | | $ | 74.24 | |
1. Weighted-average per share.
2. No awards were granted by the Company out of the TDCC plan during 2020.
| | | | | | | | | | | |
Additional Information about TDCC RSUs 1 | | | |
| In millions, except per share amounts | 2020 | 2019 | 2018 |
| Weighted-average fair value per share of RSUs granted | $ | — | | $ | — | | $ | 71.46 | |
| Total fair value of RSUs vested | $ | 15 | | $ | 1 | | $ | 382 | |
| Related tax benefit | $ | 3 | | $ | — | | $ | 86 | |
| Total compensation expense for RSU awards | $ | 3 | | $ | 4 | | $ | 144 | |
| Related tax benefit | $ | 1 | | $ | 1 | | $ | 32 | |
1.No awards were granted out of the TDCC plan during 2019 and 2020.
In 2018, TDCC paid $45 million in cash, equal to the value of the stock award on the date of delivery, to certain executive employees to settle approximately 625,000 RSUs.
TDCC Performance Stock Units
TDCC granted performance stock units to certain employees. The grants vest when specified performance targets are attained, such as return on capital and relative total shareholder return, over a predetermined period, generally one year to three years. In November 2017, DowDuPont granted PSUs to senior leadership measured on the realization of cost savings in connection with cost synergy commitments, as well as the Company’s ability to complete the DWDP Distributions. Performance and payouts are determined independently for each metric. Compensation expense related to PSU awards is recognized over the lesser of the service or performance period. Changes in the fair value of liability instruments are recognized as compensation expense each quarter. In the year ended December 31, 2018, the Company recognized $12 million and $3 million of compensation expense and related income tax benefit, respectively, for the TDCC PSUs.
The following table shows the PSU awards granted:
| | | | | | | | | | | |
| TDCC PSU Awards | Target Shares Granted 1 | Grant Date Fair Value 2 |
| Shares in thousands |
| Year | Performance Period |
| | | |
| 2017 | Sep 1, 2017 - Aug 31, 2019 | 232 | | $ | 71.16 | |
2017 3 | Jan 1, 2017 - Dec 31, 2019 | 1,728 | | $ | 81.99 | |
1. At the end of the performance period, the actual number of shares issued can range from zero to 200 percent of the target shares granted.
2. Weighted-average per share.
3. Converted to RSU awards at Conversion Date.
TDCC Restricted Stock
Under the 2012 Plan, TDCC had the option to grant shares (including options, stock appreciation rights, stock units and restricted stock) to non-employee directors over the 10-year duration of the program, subject to the plan's aggregate limit as well as annual individual limits. The restricted stock issued under this plan cannot be sold, assigned, pledged or otherwise transferred by the non-employee director, until retirement or termination of service to TDCC. In the year ended December 31, 2018, the Company issued 36 thousand shares with a weighted average fair value of $62.82. No awards were granted out of the TDCC plan during 2019 or 2020.
EID Plans
Prior to the DWDP Merger, EID provided share-based compensation to its employees through grants of stock options, RSUs and PSUs. Most of these awards have been granted annually in the first quarter of each calendar year. Subsequent to the DWDP Merger, DowDuPont assumed sponsorship of the equity incentive compensation plan of EID.
EID Equity Incentive Plan
EID's Equity Incentive Plan ("EID EIP"), as amended and restated effective August 31, 2017, provides for equity-based and cash incentive awards to certain employees, directors and consultants. Under the EID EIP, the maximum number of shares reserved for the grant or settlement of awards was 110 million shares, provided that each share in excess of 30 million that was issued with respect to any award that was not an option or stock appreciation right be counted against the 110 million share limit as four and one-half shares. EID satisfied stock option exercises and vesting of RSUs and PSUs with shares of DowDuPont Common Stock. Upon the adoption of the OIP, EID EIP became an inactive sub plan of the OIP and no longer grants new awards. All previously granted awards still vest under the EID EIP with the same terms and conditions that were applicable to the awards immediately prior to the Distributions.
EID Stock Options
The exercise price of shares subject to option is equal to the market price of EID's stock on the date of grant. When converted into the right to receive 1.282 shares of DowDuPont Common Stock, the exercise price was also adjusted by the 1.282 conversion factor. All options vest serially over a three-year period. Stock option awards granted between 2010 and 2015 expire seven years after the grant date and options granted between 2016 and 2018 expire ten years after the grant date. The plan allowed retirement-eligible employees of EID to retain any granted awards upon retirement provided the employee has rendered at least six months of service following the grant date. The awards have the same terms and conditions as were applicable to such equity awards immediately prior to the DWDP Merger closing date.
EID used the Black-Scholes option pricing model to determine the fair value of stock option awards and the assumptions set forth in the table below. The weighted-average grant-date fair value of options granted for the years ended December 31, 2019 and 2018 was $15.69 and $15.46, respectively. There were no options granted out of the EID EIP in 2020. The weighted-average assumptions used to calculate total stock-based compensation are included in the following table:
| | | | | | | | |
| EID Weighted-Average Assumptions | 2019 | 2018 |
| Dividend yield | 1.6 | % | 2.1 | % |
| Expected volatility | 19.8 | % | 23.3 | % |
| Risk-free interest rate | 2.4 | % | 2.8 | % |
| Expected life of stock options granted during period (years) | 6.1 | 6.2 |
EID determined the dividend yield by dividing the annualized dividend on DowDuPont's Common Stock by the option exercise price. A historical daily measurement of volatility (using DowDuPont stock information after the DWDP Merger date and a weighted average of TDCC and EID prior to DWDP Merger date) is determined based on the expected life of the option granted. The risk-free interest rate is determined by reference to the yield on an outstanding U.S. Treasury note with a term equal to the expected life of the option granted. Expected life is determined by reference to EID's historical experience, adjusted for expected exercise patterns of in-the-money options.
The following table summarizes stock option activity for 2020 under EID's EIP:
| | | | | | | | | | | | | | |
| EID Stock Options | 2020 |
| Number of Shares (in thousands) | Weighted Average Exercise Price (per share) | Weighted Average Remaining Contractual Term (in years) | Aggregate Intrinsic Value (in thousands) |
| Outstanding at January 1, 2020 | 5,661 | | $ | 67.60 | | | |
| Granted | — | | $ | — | | | |
| Exercised | (526) | | $ | 47.93 | | | |
| Forfeited/Expired | (111) | | $ | 65.51 | | | |
| Canceled and assigned | — | | $ | — | | | |
| Outstanding at December 31, 2020 | 5,024 | | $ | 69.71 | | 4.29 | $ | 7,101 | |
| Exercisable at December 31, 2020 | 4,323 | | $ | 69.05 | | 3.94 | $ | 7,052 | |
EID RSUs and PSUs
EID issued RSUs that serially vested over a three-year period and, upon vesting, convert one-for-one to DowDuPont Common Stock. A retirement eligible employee retains any granted awards upon retirement provided the employee has rendered at least six months of service following the grant date. Additional RSUs were also granted periodically to key senior management employees. These RSUs generally vested over periods ranging from three years to five years. The fair value of all stock-settled RSUs is based upon the market price of the underlying common stock as of the grant date. The awards have the same terms and conditions as were applicable to such equity awards immediately prior to the DWDP Merger closing date.
EID granted PSUs to senior leadership. Upon a change in control, EID's EIP provisions required PSUs to be converted into RSUs based on the number of PSUs that would vest by assuming that target levels of performance are achieved. Service requirements for vesting in the RSUs replicate those inherent in the exchanged PSUs. In accordance with the DWDP Merger Agreement, PSUs converted to RSU awards based on an assessment of the underlying market conditions in the PSUs at the greater of target or actual performance levels as of the closing date. As the actual performance levels were not in excess of target as of the closing date, all PSUs converted to RSUs based on target and there was no incremental benefit from the DWDP Merger Agreement when compared with EID’s EIP.
In November 2017, DowDuPont granted PSUs to senior leadership that vest partially based on the realization of cost savings in connection with cost synergy commitments, as well as DowDuPont’s ability to complete the DWDP Distributions. Performance and payouts are determined independently for each metric. The actual award, delivered in DowDuPont Common Stock, can range from zero percent to 200 percent of the original grant. The weighted-average grant date fair value of the PSUs granted in November 2017 of $71.16 was based upon the market price of the underlying common stock as of the grant date. There were no PSUs granted in the years ended December 31, 2020, 2019 and 2018.
Nonvested awards of RSUs are shown below.
| | | | | | | | |
| EID RSUs | 2020 |
| Shares in thousands | Shares | Grant Date Fair Value 1 |
| Nonvested at January 1, 2020 | 1,700 | | $ | 74.14 | |
| Granted | — | | $ | — | |
| Vested | (783) | | $ | 77.27 | |
| Forfeited | (17) | | $ | 75.64 | |
| Nonvested at December 31, 2020 | 900 | | $ | 71.44 | |
1. Weighted-average per share.
The weighted average grant-date fair value of stock units granted during 2019 and 2018 was $70.69 and $70.37, respectively. There were no RSUs granted out of the EID EIP in 2020.
NOTE 21 - FINANCIAL INSTRUMENTS
The following table summarizes the fair value of financial instruments at December 31, 2020 and December 31, 2019:
| | | | | | | | | | | | | | | | | | | | | | | | | | |
| Fair Value of Financial Instruments | December 31, 2020 | December 31, 2019 |
| In millions | Cost | Gain | Loss | Fair Value | Cost | Gain | Loss | Fair Value |
Cash equivalents 1 | $ | 1,105 | | $ | — | | $ | — | | $ | 1,105 | | $ | 417 | | $ | — | | $ | — | | $ | 417 | |
Restricted cash equivalents 2 | $ | 6,231 | | $ | — | | $ | — | | $ | 6,231 | | $ | 37 | | $ | — | | $ | — | | $ | 37 | |
| | | | | | | | |
| | | | | | | | |
| Total cash and restricted cash equivalents | $ | 7,336 | | $ | — | | $ | — | | $ | 7,336 | | $ | 454 | | $ | — | | $ | — | | $ | 454 | |
Long-term debt including debt due within one year | $ | (21,811) | | $ | — | | $ | (3,042) | | $ | (24,853) | | $ | (15,618) | | $ | — | | $ | (1,633) | | $ | (17,251) | |
| Derivatives relating to: | | | | | | | | |
Foreign currency 3 | — | | 4 | | (13) | | (9) | | — | | 6 | | (7) | | (1) | |
| Total derivatives | $ | — | | $ | 4 | | $ | (13) | | $ | (9) | | $ | — | | $ | 6 | | $ | (7) | | $ | (1) | |
1.Represents held-to-maturity securities (primarily time deposits and money market funds) classified as cash equivalents, as these securities had maturities of three months or less at the time of purchase.
2.Includes $25 million of restricted cash classified as "Other current assets" and $6.2 billion classified as "Restricted cash" in the Consolidated Balance Sheets at December 31, 2020. See Note 6 for more information on Restricted Cash.
3. Presented net of cash collateral where master netting arrangements allow.
Derivative Instruments
Objectives and Strategies for Holding Derivative Instruments
In the ordinary course of business, the Company enters into contractual arrangements (derivatives) to reduce its exposure to foreign currency, interest rate and commodity price risks. The Company has established a variety of derivative programs to be utilized for financial risk management. These programs reflect varying levels of exposure coverage and time horizons based on an assessment of risk.
Derivative programs have procedures and controls and are approved by the Corporate Financial Risk Management Committee, consistent with the Company's financial risk management policies and guidelines. Derivative instruments used are forwards, options, futures and swaps. The Company has not designated any derivatives or non-derivatives as hedging instruments.
The Company's financial risk management procedures also address counterparty credit approval, limits and routine exposure monitoring and reporting. The counterparties to these contractual arrangements are major financial institutions and major commodity exchanges. The Company is exposed to credit loss in the event of nonperformance by these counterparties. The Company utilizes collateral support annex agreements with certain counterparties to limit its exposure to credit losses. The Company anticipates performance by counterparties to these contracts and therefore no material loss is expected. Market and counterparty credit risks associated with these instruments are regularly reported to management.
The notional amounts of the Company's derivative instruments were as follows:
| | | | | | | | |
| Notional Amounts | December 31, 2020 | December 31, 2019 |
| In millions |
| Derivatives not designated as hedging instruments: | | |
Foreign currency contracts 1 | $ | (304) | | $ | 26 | |
Commodity contracts | $ | 7 | | $ | 11 | |
1.Presented net of contracts bought and sold.
Derivatives not Designated in Hedging Relationships
Foreign Currency Contracts
The Company routinely uses forward exchange contracts to reduce its net exposure, by currency, related to foreign currency-denominated monetary assets and liabilities of its operations so that exchange gains and losses resulting from exchange rate changes are minimized. The netting of such exposures precludes the use of hedge accounting; however, the required revaluation of the forward contracts and the associated foreign currency-denominated monetary assets and liabilities intends to achieve a minimal earnings impact, after taxes. The Company also uses foreign currency exchange contracts to offset a portion of the Company's exposure to certain foreign currency-denominated revenues so that gains and losses on the contracts offset changes in the USD value of the related foreign currency-denominated revenues.
Commodity Contracts
The Company utilizes options, futures and swaps that are not designated as hedging instruments to reduce exposure to commodity price fluctuations on purchases of inventory such as soybeans, soybean oil and soybean meal.
Fair Value of Derivative Instruments
Asset and liability derivatives subject to an enforceable master netting arrangement with the same counterparty are presented on a net basis in the Consolidated Balance Sheets. The presentation of the Company's derivative assets and liabilities is as follows:
| | | | | | | | | | | | | | |
| Fair Value of Derivative Instruments at December 31, 2020 |
| In millions | Balance Sheet Classification | Gross | Counterparty and Cash Collateral Netting 1 | Net Amounts Included in the Consolidated Balance Sheet |
| Asset derivatives: | | | | |
Derivatives not designated as hedging instruments: | | | | |
| Foreign currency contracts | Other current assets | 13 | | (9) | | 4 | |
| Total asset derivatives | | $ | 13 | | $ | (9) | | $ | 4 | |
| | | | |
| Liability derivatives: | | | | |
Derivatives not designated as hedging instruments: | | | | |
| Foreign currency contracts | Accrued and other current liabilities | $ | 22 | | $ | (9) | | $ | 13 | |
| Total liability derivatives | | $ | 22 | | $ | (9) | | $ | 13 | |
| | | | | | | | | | | | | | |
| Fair Value of Derivative Instruments at December 31, 2019 |
| In millions | Balance Sheet Classification | Gross | Counterparty and Cash Collateral Netting 1 | Net Amounts Included in the Consolidated Balance Sheet |
| Asset derivatives: | | | | |
Derivatives not designated as hedging instruments: | | | | |
| Foreign currency contracts | Other current assets | $ | 16 | | $ | (10) | | $ | 6 | |
| Total asset derivatives | | $ | 16 | | $ | (10) | | $ | 6 | |
| | | | |
| Liability derivatives: | | | | |
Derivatives not designated as hedging instruments: | | | | |
| Foreign currency contracts | Accrued and other current liabilities | $ | 17 | | $ | (10) | | $ | 7 | |
| Total liability derivatives | | $ | 17 | | $ | (10) | | $ | 7 | |
1.Counterparty and cash collateral amounts represent the estimated net settlement amount when applying netting and set-off rights included in master netting arrangements between the Company and its counterparties and the payable or receivable for cash collateral held or placed with the same counterparty.
Effect of Derivative Instruments
Foreign currency derivatives not designated as hedges are used to offset foreign exchange gains or losses resulting from the underlying exposures of foreign currency-denominated assets and liabilities. The amount charged on a pretax basis related to foreign currency derivatives not designated as a hedge, which was included in “Sundry income (expense) - net” in the Consolidated Statements of Operations, was a loss of $1 million for the year ended December 31, 2020 ($62 million loss for the year ended December 31, 2019 and $94 million gain for the year ended December 31, 2018). The income statement effects of other derivatives were immaterial.
Reclassification from AOCL
The Company does not expect to reclassify gains losses related to foreign currency contracts from AOCL to income within the next 12 months and there are currently no such amounts included within AOCL.
NOTE 22 - FAIR VALUE MEASUREMENTS
Fair Value Measurements on a Recurring Basis
The following tables summarize the basis used to measure certain assets and liabilities at fair value on a recurring basis:
| | | | | | | |
Basis of Fair Value Measurements on a Recurring Basis at December 31, 2020 | Significant Other Observable Inputs
(Level 2) | | |
| In millions |
| Assets at fair value: | | | |
Cash equivalents and restricted cash equivalents 1 | $ | 7,336 | | | |
Derivatives relating to: 2 | | | |
Foreign currency contracts | 13 | | | |
| Total assets at fair value | $ | 7,349 | | | |
| Liabilities at fair value: | | | |
Long-term debt including debt due within one year 3 | $ | 24,853 | | | |
Derivatives relating to: 2 | | | |
Foreign currency contracts | 22 | | | |
| Total liabilities at fair value | $ | 24,875 | | | |
1.Treasury bills, time deposits, and money market funds included in "Cash and cash equivalents" and money market funds included in "Other current assets" in the Consolidated Balance Sheets and held at amortized cost, which approximates fair value.
2. See Note 21 for the classification of derivatives in the Consolidated Balance Sheets.
3. Fair value is based on quoted market prices for the same or similar issues, or on current rates offered to the company for debt of the same remaining maturities and terms.
| | | | | | | |
Basis of Fair Value Measurements on a Recurring Basis at December 31, 2019 | Significant Other Observable Inputs
(Level 2) | | |
| In millions |
| Assets at fair value: | | | |
Cash equivalents and restricted cash equivalents 1 | $ | 454 | | | |
| | | |
Derivatives relating to: 2 | | | |
Foreign currency contracts | 16 | | | |
| Total assets at fair value | $ | 470 | | | |
| Liabilities at fair value: | | | |
Long-term debt including debt due within one year 3 | $ | 17,251 | | | |
Derivatives relating to: 2 | | | |
Foreign currency contracts | 17 | | | |
| Total liabilities at fair value | $ | 17,268 | | | |
1.Treasury bills, time deposits, and money market funds included in "Cash and cash equivalents" and money market funds included in "Other current assets" in the Consolidated Balance Sheets and held at amortized cost, which approximates fair value.
2. See Note 21 for the classification of derivatives in the Consolidated Balance Sheets.
3. Fair value is based on quoted market prices for the same or similar issues, or on current rates offered to the company for debt of the same remaining maturities and terms.
For assets and liabilities classified as Level 2 measurements, where the security is frequently traded in less active markets, fair value is based on the closing price at the end of the period; where the security is less frequently traded, fair value is based on the price a dealer would pay for the security or similar securities, adjusted for any terms specific to that asset or liability, or by using observable market data points of similar, more liquid securities to imply the price. For time deposits classified as held-to-maturity investments and reported at amortized cost, fair value is based on an observable interest rate for similar securities. Market inputs are obtained from well-established and recognized vendors of market data and subjected to tolerance and quality checks.
For derivative assets and liabilities, standard industry models are used to calculate the fair value of the various financial instruments based on significant observable market inputs, such as foreign exchange rates, commodity prices, swap rates, interest rates and implied volatilities obtained from various market sources. Market inputs are obtained from well-established and recognized vendors of market data and subjected to tolerance/quality checks.
For all other assets and liabilities for which observable inputs are used, fair value is derived through the use of fair value models, such as a discounted cash flow model or other standard pricing models.
There were no transfers between Levels 1 and 2 during the year ended December 31, 2020 and December 31, 2019.
Fair Value Measurements on a Nonrecurring Basis
The following table summarizes the basis used to measure certain assets at fair value on a nonrecurring basis:
| | | | | | | | | | | | | | |
| Basis of Fair Value Measurements on a Nonrecurring Basis | Significant Other Unobservable Inputs (Level 3) | Total Losses |
| In millions |
| 2020 | | |
| Assets at fair value: | | |
| Long-lived assets, intangible assets, and other assets | $ | 447 | | $ | (661) | |
| 2019 | | |
| Assets at fair value: | | |
| Long-lived assets and other assets, and equity method investments | $ | 3 | | $ | (63) | |
| 2018 | | |
| Assets at fair value: | | |
| Long-lived assets and other assets | $ | — | | $ | (32) | |
2020 Fair Value Measurements on a Nonrecurring Basis
During the third quarter of 2020, the Company recorded impairment charges related to indefinite-lived intangible assets and long-lived assets within the Non-Core segment. These impairment analyses were performed using Level 3 inputs within the fair value hierarchy. See Notes 3, 5, and 13 for further discussion.
During the second quarter of 2020, the Company recorded impairment charges related to indefinite-lived intangible assets within the Transportation & Industrial segment. See Notes 5 and 13 for further discussion of these fair value measurements.
During the first quarter of 2020, the Company recorded impairment charges related to long-lived assets within the Non-Core segment. See Notes 5 for further discussion of these fair value measurements.
2019 Fair Value Measurements on a Nonrecurring Basis
The Internal SP Distribution served as a triggering event to assess equity method investments for impairment. The Company recorded an other-than-temporary impairment, classified as Level 3 measurements, on an equity method investment during the second quarter of 2019. The impairment charge of $63 million was recorded in "Restructuring and asset related charges - net" in the Consolidated Statements of Operations. See Note 5 for further discussion of these fair value measurements.
2018 Fair Value Measurements on a Nonrecurring Basis
The Company has or will shut down a number of manufacturing, R&D, other non-manufacturing facilities and corporate facilities around the world as part of its restructuring programs. Certain inventory, corporate facilities and manufacturing facilities and related assets, were written down to zero. The related charge totaled $32 million for the year ended December 31, 2018, and was included in "Restructuring and asset related charges - net" in the Consolidated Statements of Operations. See Note 5 for additional information on the Company's restructuring activities.
NOTE 23 - SEGMENTS AND GEOGRAPHIC REGIONS
The Company's segments are aligned with the market verticals they serve, while maintaining integration and innovation strengths within strategic value chains. DuPont is comprised of five operating segments: Electronics & Imaging; Nutrition & Biosciences; Safety & Construction; Transportation & Industrial; and Non-Core. Corporate contains the reconciliation between the totals for the reportable segments and the Company’s totals.
In the first quarter of 2020, in preparation for the N&B Transaction, DuPont changed its management and reporting structure to realign costs associated with its polysaccharides pre-commercial activities from the Non-Core segment to the N&B segment. The reporting changes have been retrospectively reflected in the segment results for all periods presented.
Major products by segment include: Electronics & Imaging (printing and packaging materials, photopolymers and electronic materials); Nutrition & Biosciences (probiotics, cultures, emulsifiers, texturants, natural sweeteners and soy-based food ingredients, enzymes, bio-based materials, cellulosics and process technologies); Transportation & Industrial (engineering resins, adhesives, silicones, lubricants and parts); Safety and Construction (nonwovens, aramids, construction materials, water filtration and purification resins, elements and membranes) and Non-Core (specialty biotechnology materials, alkylation technology, sulfuric acid technology, hydroprocessing technology, polyester films, metallization pastes, polyvinyl fluoromaterials, silicone encapsulants and adhesives, and polycrystalline silicon). The Company operates globally in substantially all of its product lines. Transfers of products between operating segments are generally valued at cost.
Prior to April 1, 2019, the Company's measure of profit / loss for segment reporting purposes is pro forma Operating EBITDA as this is the manner in which the Company's chief operating decision maker ("CODM") assessed performance and allocates resources. The Company defines pro forma Operating EBITDA as pro forma earnings (i.e. pro forma "Income (loss) from continuing operations before income taxes") before interest, depreciation, amortization, non-operating pension / OPEB / charges, and foreign exchange gains/losses, excluding the impact of costs historically allocated to the materials science and agriculture businesses that did not meet the criteria to be recorded as discontinued operations and adjusted for significant items. Effective April 1, 2019, the Company's measure of profit/loss for segment reporting purposes is Operating EBITDA as this is the manner in which the Company's chief operating decision maker ("CODM") assesses performance and allocates resources. The Company defines Operating EBITDA as earnings (i.e., “Income from continuing operations before income taxes") before interest, depreciation, amortization, non-operating pension / OPEB benefits / charges, and foreign exchange gains / losses, adjusted for significant items. Reconciliations of these measures are provided on the following pages.
Pro forma adjustments were determined in accordance with Article 11 of Regulation S-X. Pro forma financial information is based on the Consolidated Financial Statements of DuPont, adjusted to give effect to the impact of certain items directly attributable to the DWDP Distributions, and the Term Loan Facilities, the 2018 Senior Notes and the Funding CP Issuance (together, the "DWDP Financings"), including the use of proceeds from such DWDP Financings (collectively the "DWDP Transactions"). The historical consolidated financial information has been adjusted to give effect to pro forma events that are (1) directly attributable to the DWDP Transactions, (2) factually supportable and (3) with respect to the statements of operations, expected to have a continuing impact on the results. Events that are not expected to have a continuing impact on the combined results are excluded from the pro forma adjustments. Those pro forma adjustments include the impact of various supply agreements entered into in connection with the Dow Distribution ("supply agreements") and are adjustments to "Cost of sales." The impact of these supply agreements are reflected in pro forma Operating EBITDA for the periods noted above as they are included in the measure of profit/loss reviewed by the CODM in order to show meaningful comparability among periods while assessing performance and making resource allocation decisions.
In conjunction with the closing of the N&B Transaction on February 1, 2020, the Company announced changes to its management and reporting structure (the “2021 Segment Realignment”). These changes result in the following:
•Realignment of certain businesses from Transportation & Industrial to Electronics & Imaging
•Dissolution of the Non-Core segment with the businesses to be divested and previously divested reflected in Corporate
•Realignment of the remaining Non-Core businesses to Transportation & Industrial
In addition, the following name changes will occur:
•Electronic & Imaging will be renamed Electronics & Industrial
•Transportation & Industrial will be renamed Mobility & Materials
•Safety & Construction will be renamed Water & Protection
The changes became effective February 1, 2021 and the Company will report financial results under this new structure beginning in the first quarter of 2021.
Sales are attributed to geographic regions based on customer location; long-lived assets are attributed to geographic regions based on asset location.
| | | | | | | | | | | |
| Net Trade Revenue by Geographic Region | 2020 | 2019 | 2018 |
| In millions |
| United States | $ | 6,073 | | $ | 6,688 | | $ | 6,764 | |
| Canada | 403 | | 434 | | 465 | |
EMEA 1 | 4,572 | | 5,027 | | 5,610 | |
Asia Pacific 2 | 8,234 | | 8,113 | | 8,458 | |
| Latin America | 1,115 | | 1,250 | | 1,297 | |
| Total | $ | 20,397 | | $ | 21,512 | | $ | 22,594 | |
1.Europe, Middle East and Africa.
2. Net sales attributed to China/Hong Kong, for the years ended December 31, 2020, 2019, and 2018 were $3,670 million, $3,515 million, and $3,604 million, respectively.
| | | | | | | | | | | |
| Long-lived Assets by Geographic Region | December 31, |
| In millions | 2020 | 2019 | 2018 |
| United States | $ | 5,185 | | $ | 5,583 | | $ | 5,506 | |
| Canada | 72 | | 69 | | 56 | |
EMEA 1 | 3,086 | | 2,809 | | 2,715 | |
| Asia Pacific | 1,486 | | 1,525 | | 1,494 | |
| Latin America | 156 | | 157 | | 146 | |
| Total | $ | 9,985 | | $ | 10,143 | | $ | 9,917 | |
1.Europe, Middle East and Africa.
| | | | | | | | | | | | | | | | | | | | | | | |
| Segment Information | Elect. & Imaging | Nutrition & Biosciences | Transp. & Industrial | Safety & Const. | Non-Core | Corporate | Total |
| In millions |
| For the Year Ended December 31, 2020 | | | | | | | |
| Net sales | $ | 3,814 | | $ | 6,059 | | $ | 4,189 | | $ | 4,993 | | $ | 1,342 | | $ | — | | $ | 20,397 | |
Operating EBITDA 1 | 1,210 | | 1,523 | | 916 | | 1,351 | | 168 | | (126) | | 5,042 | |
| Equity in earnings of nonconsolidated affiliates | 35 | | 4 | | 4 | | 26 | | 122 | | — | | 191 | |
Restructuring and asset related charges - net 2 | 7 | | 7 | | 33 | | 48 | | 643 | | 111 | | 849 | |
| Depreciation and amortization | 338 | | 1,732 | | 417 | | 497 | | 107 | | 3 | | 3,094 | |
| Assets of continuing operations | 11,877 | | 20,643 | | 11,515 | | 15,054 | | 1,027 | | 9,978 | | 70,094 | |
| Investment in nonconsolidated affiliates | 505 | | 29 | | 66 | | 315 | | 3 | | — | | 918 | |
| Capital expenditures | 264 | | 250 | | 185 | | 312 | | 35 | | — | | 1,046 | |
| For the Year Ended December 31, 2019 | | | | | | | |
| Net sales | $ | 3,554 | | $ | 6,076 | | $ | 4,950 | | $ | 5,201 | | $ | 1,731 | | $ | — | | $ | 21,512 | |
Pro forma operating EBITDA 1 | 1,147 | | 1,406 | | 1,313 | | 1,419 | | 512 | | (157) | | 5,640 | |
Equity in earnings (losses) of nonconsolidated affiliates 3 | 24 | | (1) | | 4 | | 27 | | 258 | | — | | 312 | |
Restructuring and asset related charges - net 2 | 47 | | 122 | | 19 | | 32 | | — | | 94 | | 314 | |
| Depreciation and amortization | 339 | | 675 | | 423 | | 503 | | 127 | | (1) | | 2,066 | |
| Assets of continuing operations | 12,042 | | 21,555 | | 14,336 | | 15,060 | | 3,736 | | 2,620 | | 69,349 | |
| Investment in nonconsolidated affiliates | 510 | | 34 | | 75 | | 326 | | 259 | | — | | 1,204 | |
| Capital expenditures | 273 | | 393 | | 275 | | 415 | | 64 | | — | | 1,420 | |
| For the Year Ended December 31, 2018 | | | | | | | |
| Net sales | $ | 3,635 | | $ | 6,216 | | $ | 5,422 | | $ | 5,294 | | $ | 2,027 | | $ | — | | $ | 22,594 | |
Pro forma operating EBITDA 1 | 1,210 | | 1,420 | | 1,518 | | 1,283 | | 702 | | (228) | | 5,905 | |
Equity in earnings (losses) of nonconsolidated affiliates | 23 | | (1) | | 1 | | 24 | | 400 | | — | | 447 | |
Restructuring asset related charges - net 2 | 2 | | 29 | | 2 | | 24 | | (12) | | 102 | | 147 | |
| Depreciation and amortization | 390 | | 643 | | 456 | | 549 | | 124 | | 8 | | 2,170 | |
| Assets of continuing operations | 12,212 | | 22,717 | | 14,363 | | 14,749 | | 4,365 | | 9,174 | | 77,580 | |
| Investment in nonconsolidated affiliates | 519 | | 103 | | 75 | | 328 | | 720 | | — | | 1,745 | |
| Capital expenditures | 258 | | 475 | | 226 | | 362 | | 75 | | — | | 1,396 | |
| | | | | | | |
1.A reconciliation of "Income (loss) from continuing operations, net of tax" to Operating EBITDA and pro forma Operating EBITDA, as applicable, is provided in the table on the following page.
2.See Note 5 for information regarding the Company's restructuring programs and asset related charges.
3.Represents equity in earnings (losses) of nonconsolidated affiliates included in pro forma Operating EBITDA, the Company's measure of profit/loss for segment reporting purposes, which excludes significant items. Accordingly, the Non-Core segment presented above excludes a net charge of $224 million related to a joint venture and a restructuring charge of $4 million which are presented in "Equity in earnings of nonconsolidated affiliates" in the Company's Consolidated Statement of Operations.
| | | | | | | | | | | | | | | | | |
| Segment Information Reconciliation to Consolidated Financial Statements | Segment Totals | Corteva Distribution | Dow Distribution | Other 1 | Total |
| In millions |
| For the Year Ended December 31, 2020 | | | | | |
| Capital expenditures | $ | 1,046 | | $ | — | | $ | — | | $ | 148 | | $ | 1,194 | |
| Depreciation and amortization | $ | 3,094 | | $ | — | | $ | — | | $ | — | | $ | 3,094 | |
| For the Year Ended December 31, 2019 | | | | | |
| Capital expenditures | $ | 1,420 | | $ | 252 | | $ | 426 | | $ | 374 | | $ | 2,472 | |
| Depreciation and amortization | $ | 2,066 | | $ | 385 | | $ | 744 | | $ | — | | $ | 3,195 | |
| For the Year Ended December 31, 2018 | | | | | |
| Capital expenditures | $ | 1,396 | | $ | 614 | | $ | 2,055 | | $ | (228) | | $ | 3,837 | |
| Depreciation and amortization | $ | 2,170 | | $ | 913 | | $ | 2,835 | | $ | — | | $ | 5,918 | |
1.Reflects the incremental cash spent or unpaid on capital expenditures; total capital expenditures are presented on a cash basis.
| | | | | | | | | | | |
| Total Asset Reconciliation at December 31, | 2020 | 2019 | 2018 |
| In millions |
| Assets of continuing operations | $ | 70,094 | | $ | 69,349 | | $ | 77,580 | |
| Assets held for sale / Assets of discontinued operations | 810 | | — | | 110,275 | |
| Total assets | $ | 70,904 | | $ | 69,349 | | $ | 187,855 | |
| | | | | | | | | | | | | | |
| Reconciliation of "(Loss) Income from continuing operations, net of tax" to Pro Forma Operating EBITDA | 2020 | 2019 | 2018 |
| In millions |
| (Loss) Income from continuing operations, net of tax | $ | (2,874) | | $ | (614) | | $ | 405 | |
| + | Provision for income taxes on continuing operations | (23) | | 140 | | 195 | |
| (Loss) Income from continuing operations before income taxes | $ | (2,897) | | $ | (474) | | $ | 600 | |
| + | Pro forma adjustments 1 | — | | 122 | | (210) | |
| + | Depreciation and amortization | 3,094 | | 2,066 | | 2,170 | |
| - | Interest income 2 | 10 | | 55 | | 39 | |
| + | Interest expense 3, 4 | 674 | | 697 | | 684 | |
| - | Non-operating pension/OPEB benefit 2 | 32 | | 74 | | 96 | |
| - | Foreign exchange losses, net 2, 5 | (56) | | (110) | | (43) | |
| + | Costs historically allocated to the materials science and agriculture businesses 6 | — | | 256 | | 1,044 | |
| - | Significant items 7 | (4,157) | | (2,992) | | (1,709) | |
| Operating EBITDA | $ | 5,042 | | $ | 5,640 | | $ | 5,905 | |
1.For the years ended December 31, 2019 and 2018, operating EBITDA is on a pro forma basis. The pro forma adjustment reflects the net pro forma impact of items directly attributable to the DWDP Transactions, as applicable.
2. Included in "Sundry income (expense) - net."
3. The year ended December 31, 2020 excludes N&B financing activity. Refer to details of significant items below.
4. The years ended December 31, 2019 and 2018 are presented on a pro forma basis giving effect to the DWDP Financings.
5. Excludes a $50 million pretax foreign exchange loss significant item related to adjustments to EID's foreign currency exchange contracts as a result of U.S. tax reform for the year ended December 31, 2018.
6. Costs previously allocated to the materials science and agriculture businesses that did not meet the definition of expenses related to discontinued operations in accordance with ASC 205.
7. The significant items for the year ended December 31, 2020 are presented on an as reported basis. The significant items for the years ended December 31, 2019 and 2018 are presented on a pro forma basis.
The significant items for the year ended December 31, 2020 are presented on an as reported basis. The significant items for the years ended December 31, 2019 and 2018 are presented on a pro forma basis. The following tables summarize the pre-tax impact of significant items by segment that are excluded from Operating EBITDA and pro forma Operating EBITDA above:
| | | | | | | | | | | | | | | | | | | | | | | |
| Significant Items by Segment for the Year Ended December 31, 2020 | Elect. & Imaging | Nutrition & Biosciences | Transp. & Industrial | Safety & Construction | Non-Core | Corporate | Total |
| In millions |
Integration and separation costs 1 | $ | — | | $ | — | | $ | — | | $ | — | | $ | — | | $ | (594) | | $ | (594) | |
Restructuring and asset related charges - net 2 | (7) | | (7) | | (12) | | (48) | | (3) | | (111) | | (188) | |
Goodwill impairment charges 3 | — | | — | | (2,498) | | — | | (716) | | — | | (3,214) | |
Asset impairment charges 3, 4 | — | | — | | (21) | | — | | (640) | | — | | (661) | |
Gain on divestiture 5 | 197 | | — | | — | | — | | 396 | | — | | 593 | |
N&B financing fee amortization 6 | — | | — | | — | | — | | — | | (93) | | (93) | |
| Total | $ | 190 | | $ | (7) | | $ | (2,531) | | $ | (48) | | $ | (963) | | $ | (798) | | $ | (4,157) | |
1. Integration and separation costs related to the post-DWDP Merger integration and the separation of the N&B Business.
2. Includes Board approved restructuring plans and asset related charges. See Note 5 for additional information.
3. See Note 13 for additional information.
4. See Note 5 for additional information.
5. Refer to Note 3 for additional information.
6. Represents interest expense, net related to the N&B Notes Offering as well as the financing fee amortization related to the separation of the N&B Business.
| | | | | | | | | | | | | | | | | | | | | | | |
| Significant Items by Segment for the Year Ended December 31, 2019 (Pro Forma) | Elect. & Imaging | Nutrition & Biosciences | Transp. & Industrial | Safety & Construction | Non-Core | Corporate | Total |
| In millions |
Integration and separation costs 1 | $ | — | | $ | — | | $ | — | | $ | — | | $ | — | | $ | (1,169) | | $ | (1,169) | |
Restructuring and asset related charges - net 2 | (47) | | (59) | | (19) | | (32) | | (4) | | (94) | | (255) | |
Goodwill impairment charges 3 | — | | (933) | | — | | — | | (242) | | — | | (1,175) | |
| Asset impairment charges | — | | (63) | | — | | — | | — | | — | | (63) | |
Net charge related to a joint venture 4 | — | | — | | — | | — | | (208) | | — | | (208) | |
Income tax related items 5 | — | | — | | — | | (48) | | — | | (74) | | (122) | |
| Total | $ | (47) | | $ | (1,055) | | $ | (19) | | $ | (80) | | $ | (454) | | $ | (1,337) | | $ | (2,992) | |
1.Integration and separation costs related to the DWDP Merger, post-DWDP Merger integration, the DWDP Distributions and business separation activities.
2. Includes Board approved restructuring plans and asset related charges, which include other asset impairments. See Note 5 for additional information.
3. See Note 13 for additional information.
4. Reflects the Company’s share of net charges related to its investment in the HSC Group, consisting of $456 million in asset impairment charges, primarily fixed assets, partially offset by benefits associated with certain customer contract settlements of $248 million deemed non-recurring in nature.
5. Includes a $48 million charge which reflects a reduction in gross proceeds from lower withholding taxes related to a prior year legal settlement and a $74 million charge related to tax indemnifications, primarily associated with an adjustment to a one-time transition tax liability required by the Tax Cuts and Jobs Act of 2017, which were recorded in accordance with the Amended and Restated Tax Matters Agreement. Both charges were recorded in "Sundry income (expense) - net" in the Consolidated Statements of Operations.
| | | | | | | | | | | | | | | | | | | | | | | |
| Significant Items by Segment for the Year Ended December 31, 2018 (Pro Forma) | Elect. & Imaging | Nutrition & Biosciences | Transp. & Industrial | Safety & Construction | Non-Core | Corporate | Total |
| In millions |
Merger-related inventory step-up amortization 1 | $ | — | | $ | (68) | | $ | — | | $ | (9) | | $ | — | | $ | — | | $ | (77) | |
Net (gain) loss on divestitures and changes in joint venture ownership 2 | — | | — | | — | | (14) | | (27) | | — | | (41) | |
Integration and separation costs 3 | — | | — | | — | | — | | — | | (1,394) | | (1,394) | |
Restructuring and asset related charges - net 4 | (2) | | (29) | | (2) | | (24) | | 12 | | (102) | | (147) | |
Income tax related item 5 | — | | — | | — | | — | | — | | (50) | | (50) | |
| Total | $ | (2) | | $ | (97) | | $ | (2) | | $ | (47) | | $ | (15) | | $ | (1,546) | | $ | (1,709) | |
1.Includes the fair value step-up in EID's inventories as a result of the DWDP Merger and the acquisition of FMC Corporation's Health and Nutrition business in November 2017.
2. Reflected in "Sundry income (expense) - net."
3. Integration and separation costs related to the DWDP Merger, post-DWDP Merger integration and the DWDP Distributions.
4. Includes Board approved restructuring plans and asset related charges, which includes other asset impairments. See Note 5 for additional information.
5. Includes a foreign exchange loss related to adjustments to EID's foreign currency exchange contracts as a result of U.S. tax reform.
NOTE 24 - SELECTED QUARTERLY FINANCIAL DATA (UNAUDITED)
| | | | | | | | |
| Selected Quarterly Financial Data | Three Months Ended December 31, |
| In millions, except per share amounts (Unaudited) | 2020 | 2019 |
| Net sales | $ | 5,252 | | $ | 5,204 | |
| Cost of sales | $ | 3,521 | | $ | 3,408 | |
| Amortization of intangibles | $ | 528 | | $ | 295 | |
Restructuring and asset related charges - net 1 | $ | 42 | | $ | 24 | |
| Integration and separation costs | $ | 125 | | $ | 193 | |
Income from continuing operations, net of tax 2 | $ | 279 | | $ | 191 | |
| Loss from discontinued operations, net of tax | $ | (49) | | $ | (3) | |
| Net income | $ | 230 | | $ | 188 | |
| Net income available for DuPont common shareholders | $ | 222 | | $ | 176 | |
| Earnings per common share from continuing operations - basic | $ | 0.37 | | $ | 0.24 | |
| (Loss) Earnings per common share from discontinued operations - basic | $ | (0.07) | | $ | — | |
| Earnings per common share from continuing operations - diluted | $ | 0.37 | | $ | 0.24 | |
| (Loss) Earnings per common share from discontinued operations - diluted | $ | (0.07) | | $ | — | |
| Dividends declared per share of common stock | $ | 0.30 | | $ | 0.30 | |
1.See Note 5 for additional information.
2. See Notes 3, 5, and 23 for information on additional items impacting "Income (loss) from continuing operations, net of tax." The fourth quarter of 2020 included integration and separation costs, restructuring charges, and an income tax item. The fourth quarter of 2019 included integration and separation costs, restructuring charges, an income tax item, and a net charge related to a joint venture.
NOTE 25 - SUBSEQUENT EVENTS
Closing of the Exchange Offer and N&B Merger
On February 1, 2021, DuPont completed the separation and distribution of the N&B Business, and merger of N&B, a DuPont subsidiary formed to hold the N&B Business, with a subsidiary of IFF. The distribution was effected through an exchange offer (the "Exchange Offer") where, on the terms and subject to the conditions of the Exchange Offer, eligible participating DuPont stockholders had the option to tender all, some or none of their shares of common stock, par value $0.01 per share, of DuPont (the “DuPont Common Stock”) for a number of shares of common stock, par value $0.01 per share, of N&B (the “N&B Common Stock”) and which resulted in all shares of N&B Common Stock being distributed to DuPont stockholders that participated in the Exchange Offer. The consummation of the Exchange Offer was followed by the merger of N&B with a wholly owned subsidiary of IFF, with N&B surviving the merger as a wholly owned subsidiary of IFF (the “N&B Merger” and, together with the Exchange Offer, the “N&B Transaction”). The N&B Transaction was subject to IFF shareholder approval, customary regulatory approvals, tax authority rulings including a favorable private letter ruling from the U.S. Internal Revenue Service which confirms the N&B Transaction to be free of U.S. federal income tax, and expiration of the public exchange offer. DuPont does not have an ownership interest in IFF as a result of the N&B Transaction.
In the Exchange Offer, DuPont accepted approximately 197.4 million shares of its common stock in exchange for about 141.7 million shares of N&B Common Stock. As a result, DuPont reduced its common stock outstanding by 197.4 million shares of DuPont Common Stock. In the N&B Merger, each share of N&B Common Stock was automatically converted into the right to receive one share of IFF common stock, par value $0.125 per share, based on the terms of the N&B Merger Agreement. In connection with and in accordance with the terms of the N&B Transaction, prior to consummation of the Exchange Offer and the N&B Merger, DuPont received a one-time cash payment of approximately $7.3 billion, (the "Special Cash Payment"). The Special Cash Payment is subject to post-closing adjustment pursuant to the terms of the Separation Agreement.
At December 31, 2020, the N&B Business represented approximately 30 percent of the Company's assets and net sales. Beginning with the Company's first quarterly report on Form 10-Q for the period ended March 31, 2021, the N&B Business will be reflected in the Company's historical financial statements as discontinued operations, including for periods prior to the consummation of the N&B Transaction.
N&B Transaction Agreements
In connection with the N&B Transaction, effective December 15, 2019, the Company, as previously discussed, entered into the following agreements:
•A Separation and Distribution Agreement, subsequently amended and joined by Neptune Merger Sub II LLC, a subsidiary of IFF on January 22, 2021, and as amended further on February 1, 2021 (as amended, the “N&B Separation and Distribution Agreement”) with N&B and IFF, which, among other things, governs the separation of the N&B Business from DuPont and certain other post-closing obligations between DuPont and N&B related thereto;
◦An Agreement and Plan of Merger, (the “N&B Merger Agreement”) with N&B, IFF and Neptune Merger Sub I Inc., governing the N&B Merger and related matters; and
◦An Employee Matters Agreement, subsequently amended on January 22, 2021, (as amended, the “N&B Employee Matters Agreement Agreement”), with N&B and IFF, which, among other things, allocates among the parties the pre- and post-closing liabilities in respect of the current and former employees of the N&B Business (including liabilities in respect of employee compensation and benefit plans).
In connection with the closing of the N&B Transaction, and effective February 1, 2021, the Company entered into the following agreements:
•DuPont, N&B and IFF entered into a Tax Matters Agreement (the “N&B Tax Matters Agreement”), which governs the parties’ rights, responsibilities and obligations with respect to tax liabilities and benefits, tax attributes, the preparation and filing of tax returns, the control of audits and other tax proceedings, the preservation of the expected tax-free status of the transactions contemplated by the Separation Agreement, and other matters regarding taxes; and
•DuPont, N&B and certain of their subsidiaries entered into an Intellectual Property Cross-License Agreement (the “N&B IP Cross-License Agreement”). The IP Cross-License Agreement sets forth the terms and conditions under which the applicable parties may use in their respective businesses certain know-how (including trade secrets), copyrights, design rights, software, and patents, allocated to another party pursuant to the Separation Agreement, and pursuant to which N&B may use certain standards retained by DuPont. All licenses under the IP Cross-License Agreement are non-exclusive, worldwide, and royalty-free.
Financing Transactions
As discussed in Note 14, the net proceeds of approximately $6.2 billion from the N&B Notes Offering were deposited into an escrow account and at December 31, 2020 were reflected as restricted cash in the Company’s consolidated financial statements. On February 1, 2021, N&B borrowed $1.25 billion under the N&B Term Loan. The proceeds from the N&B Notes Offering and the N&B Term Loan were used to fund the Special Cash Payment of approximately $7.3 billion and to pay the related financing fees and expenses. The obligations and liabilities of $6.2 billion associated with the N&B Notes Offering were separated from the Company on February 1, 2021 upon consummation of the N&B Transaction.
On February 1, 2021, the Company terminated its fully drawn $3 billion Term Loan Facilities. The termination triggered the repayment of the aggregate outstanding principal amount of $3 billion, plus accrued and unpaid interest through and including January 31, 2021. The Company funded the repayment with proceeds from the Special Cash Payment.
The special mandatory redemption feature of the May Debt Offering was triggered upon consummation of the N&B Transaction. The Company intends to use proceeds from the Special Cash Payment to redeem the May 2020 Notes in full together with unpaid interest in May 2021.