UNITED STATES
SECURITIES AND EXCHANGE COMMISSION
Washington, D.C. 20549
SECURITIES AND EXCHANGE COMMISSION
Washington, D.C. 20549
FORM N-CSR
CERTIFIED SHAREHOLDER REPORT OF REGISTERED
MANAGEMENT INVESTMENT COMPANIES
Investment Company Act file number (811-23127)
GoodHaven Funds Trust
(Exact name of registrant as specified in charter)
(Exact name of registrant as specified in charter)
374 Millburn Avenue, Suite 306
Millburn, New Jersey 07041
(Address of principal executive offices) (Zip code)
(Address of principal executive offices) (Zip code)
Larry Pitkowsky
374 Millburn Avenue, Suite 306
Millburn, New Jersey 07041
Millburn, New Jersey 07041
(Name and address of agent for service)
305-677-7650
Registrant's telephone number, including area code
Date of fiscal year end: November 30
Date of reporting period: November 30, 2023
Item 1. Report to Stockholders.
|
(a)
|
|
Annual Report
November 30, 2023
GoodHaven Fund
Ticker: GOODX
GoodHaven Capital Management, LLC
GoodHaven Fund
Table of Contents
|
Shareholder Letter
|
1
|
||
|
Portfolio Management Discussion and Analysis
|
10
|
||
|
Asset/Sector Allocation
|
14
|
||
|
Historical Performance
|
15
|
||
|
Schedule of Investments
|
16
|
||
|
Statement of Assets and Liabilities
|
19
|
||
|
Statement of Operations
|
20
|
||
|
Statements of Changes in Net Assets
|
21
|
||
|
Financial Highlights
|
22
|
||
|
Notes to Financial Statements
|
23
|
||
|
Report of Independent Registered Public Accounting Firm
|
32
|
||
|
Expense Example
|
33
|
||
|
Approval of Investment Advisory Agreement
|
35
|
||
|
Statement Regarding Liquidity Risk Management Program
|
38
|
||
|
Trustees and Executive Officers
|
39
|
||
|
Additional Information
|
42
|
||
|
Privacy Notice
|
44
|
GoodHaven Fund
|
PERFORMANCE as of November 30, 2023
|
|
Since
|
||||||
|
2 Years
|
3 Years
|
5 Years
|
10 Years
|
Incept. 1
|
||
|
1 Year
|
Annualized
|
Annualized
|
Annualized
|
Annualized
|
Annualized
|
|
|
ended
|
as of
|
as of
|
as of
|
as of
|
as of
|
|
|
11/30/23
|
11/30/23
|
11/30/23
|
11/30/23
|
11/30/23
|
11/30/23
|
|
|
GOODX
|
20.25%
|
7.99%
|
16.16%
|
12.35%
|
4.91%
|
6.89%
|
|
S&P 500 Index 2
|
13.84%
|
1.66%
|
9.76%
|
12.51%
|
11.82%
|
12.43%
|
|
FT Wilshire 5000
|
||||||
|
Full Cap Index
|
10.85%
|
-2.13%
|
5.91%
|
9.58%
|
8.87%
|
9.58%
|
|
CS Hedge Fund Index 3
|
5.20%
|
3.06%
|
6.06%
|
5.72%
|
3.92%
|
3.96%
|
|
1
|
The Fund commenced operations on April 8, 2011.
|
|
2
|
With dividends reinvested
|
|
3
|
Hedge Fund Index performance figures are supplied on a month end basis and are provided for illustrative purposes as a broad equity alternative asset class only. Accordingly, “since inception” hedge fund index
performance figures reflect a start date of 3/31/11 and an end date of 11/30/23. Source: Bloomberg Terminal
|
Performance data quoted represents past performance; past performance does not guarantee future results. The investment return and principal value of an investment will fluctuate so that an
investor’s shares, when redeemed, may be worth more or less than their original cost. Current performance of the Fund may be lower or higher than the performance quoted. Performance data current to the most recent month-end may be obtained by calling
(855) OK-GOODX or (855) 654-6639. The annualized gross expense ratio of the GoodHaven Fund is 1.10%.
“I think a life properly lived is just learn, learn, learn, learn all the time.”
— Charlie Munger
January 5, 2024
We had strong relative and absolute results for the fiscal year 2023 (ending November 30, 2023) as the GoodHaven Fund was up 20.25% versus the S&P 500’s rise of 13.84%. This was accomplished with
a portfolio that had the drag of above average levels of cash/cash equivalents for part of this period as we welcomed a material number of new fellow shareholders. Importantly, we continue to feel that our portfolio is undervalued and possessing
strong long-term growth potential.
Our performance was strong for the calendar year (12/31/22 – 12/31/23) as well. For this period, the Fund gained 34.06% versus the S&P 500 being up 26.29%.
Our results since the start of GoodHaven 2.0 (12/31/19) through 11/30/2023 are a total return of 61.43% versus the S&P 500’s total return of 50.74%. While we wonder if there is a perfect
“category” for our unique portfolio we note that, according to Morningstar, we ranked (at 11/30/23) in the top 1%, 4% and 2% of our category for the trailing one, three, and five-year periods respectively.
Our refocused efforts at GoodHaven 2.0 to concentrate our exposure on better business with good growth prospects and high returns on capital – purchased with a
1
GoodHaven Fund
margin of safety – has been an important contributor to our results. As of 12/31/2023, our portfolio continues to be undervalued compared to the index despite the
outperformance in the long-term earnings per share growth.
|
As of 12/31/2023
|
GoodHaven
|
S&P 500
|
|
|
Concentration
|
# of Positions
|
23
|
503
|
|
Growth Rate (2018 – 2023E)
|
5 YR EPS Growth Rate
|
16.9%
|
12.5%
|
|
Attractive Valuation
|
2023 P/E Ratio
|
16.4x
|
21.6x
|
|
Attractive Valuation
|
2024 P/E Ratio
|
14.5x
|
19.5x
|
Plenty has been written in the financial press about the dominance of a small number of companies (now called the Magnificent Seven) on the results of the S&P 500, and how their price performance
obscures the recent less robust performance of most of the index, much less other equity indexes that are not dominated by these companies.1 We have long felt this is a
topic worth paying some attention to, just not nearly as much attention as many think it warrants. We continue to show our results in the above table versus some additional indexes which we think are relevant.2 Our active share continues to be a pretty high ~95%.3
While this period continues a string of strong results, we take this moment to remind you that our portfolio is managed striving for long-term outperformance, not short-term outperformance. We will
underperform the market averages from time to time. We hope you will view such periods when they come as opportunities, as we expect we will. Also, despite our best efforts and alignment as material fellow shareholders, we will make an occasional
unsuccessful investment. Having said that, we like our current portfolio, which we feel has material long-term upside. We are pleased (but never satisfied) with our recent results.
There is never a shortage of macro and geo-political things to worry about. Today is no different, maybe it is worse. Just because we don’t think we (or most investors) can consistently predict these
things and just because we don’t construct portfolios around such themes, doesn’t mean we don’t consider how extreme outcomes in these areas might impact us. Here are just a few quotes/headlines of recent conundrums:
“The outlook for the federal budget right now is essentially unprecedented – crisis-size deficits as far as the eye can see, even though the economy appears to be in good health.” – Bloomberg
BusinessWeek 8/24/2023
“A build-up of leveraged bets has the potential to “dislocate” trading in the $25 trillion US Treasures market.” – Financial Times 9/19/2023
__________
|
1
|
“It’s the Magnificent Seven's Market. The Other Stocks are Just Living in It” – Hardika Singh, Wall Street Journal 12/17/23.
|
|
2
|
Please note some of the HRFI indexes we used to include in the table are no longer available without a material cost so they are no longer included.
|
|
3
|
Active share is measure of the percentage of stock holdings in a manager's portfolio (GOODX) that differs from the benchmark index (S&P 500).
|
2
GoodHaven Fund
Here is a telling chart as well:
Declining Interest Coverage Ratios for High Yield Companies
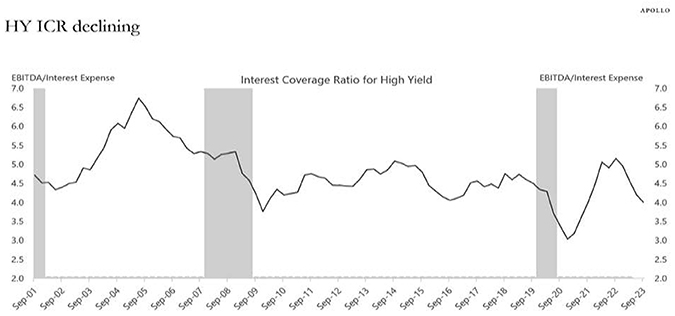
Source: Apollo4
To the surprise of many, inflation has recently declined materially while unemployment has not increased materially. Paul Krugman’s recent column “Beware Economists Who Won’t Admit They Were Wrong”
is a fun read.5 We try to stick to the “important and knowable” in our portfolio construction – with an awareness of the economic backdrop.
“US bank stocks sink to all-time low against the S&P 500. The relative performance of the S&P 500 banks index compared with the broader benchmark is at its weakest since
the bank-specific measure began in 1989.” – Jennifer Hughes Financial Times, November 11, 2023
Our biggest purchase in the period (by far) was a material increase in our existing holding in Bank of America. This was followed by increasing our positions in Devon, Berkshire, Occidental Petroleum
Warrants, Goldman Sachs and also the initiation of a new position in the apartment real estate investment trust (REIT) Camden Property Trust. It should come as no surprise that we found opportunities to add capital to some industries which had
materially lagged the broader stock market recently.
Bank of America (BAC) needs no explanation, but some comments on the opportunity we see for this holding is warranted. BAC’s shares recently traded at a P/E of 8x (an earnings yield of 12%) and 80%
of stated book value and pays a 3.5% dividend. BAC’s return on equity is a depressed 11%+. BAC has a mix of “main street” traditional deposit gathering and lending, large corporate banking functions
__________
|
4
|
https://apolloacademy.com/coverage-ratios-continue-to-decline-for-ig-and-hy/
|
|
5
|
New York Times, 12/18/2023
|
3
GoodHaven Fund
and a top tier investment banking franchise and wealth management business via the original Merrill Lynch businesses. The investment banking and wealth management segments contribute to approximately 40%⅓ of BAC
earnings, and at the recent depressed valuations, we were getting these franchises at a discount. We historically found management’s slow and steady approach to growth and returns sensible and still do. Management’s decision to invest a material
amount of the COVID era deposit influx into longer dated treasury and mortgage bonds a few years ago was a bad decision – but it is manageable and well known by all – to say the least. If the economy weakens, loan losses will increase. However, with
a stable deposit base, strong lending controls, recurring earnings from the non-banking businesses, healthy capital and liquidity, the potential benefit from higher interest rates and a cheap stock price (down recently about 50% from recent highs and
back to 2017 price levels), we like our risk reward here.
Devon, a long-time successful holding, was our top dollar decliner in the period and we took that as an opportunity to add to our holdings. Devon continues with the thoughtful game plan of using free
cash flow to primarily pay dividends and repurchase shares supported by profitable oil/gas production growth. Besides our legacy capital gains here, we have received $8.11/share in cash dividends since this program began (in November 2021) and now
own a greater percentage of the company due to repurchases. We expect Devon to continue on this path and perhaps lean more to buybacks in the near-term. We would not be surprised to see them make a periodic acquisition in their core basin(s). We
think much upside remains with Devon generating approximately $4/share in free cash flow with oil at $75.
Camden is a well-run owner/operator of multi-family apartment communities with approximately 172 properties and 60,000 apartment homes across the US with significant exposure in the southeast US and
the Sunbelt states where demographic trends remain favorable. We have followed the company for a long time. In a broad sense, rents in their markets should flatten out after a very robust period. Underlying values for their assets are going through
an adjustment to the much higher risk-free rates of today. More new supply is on the short-term horizon in some of their markets, but we believe that will be followed by very little new supply due to tight bank lending and higher interest rates. With
the stock recently down about 50% from almost two years ago, and an implied public valuation on its properties at a significant discount to private markets, we like our risk reward from those levels.
Berkshire Hathaway remains our largest position. Charlie Munger, Berkshire’s Vice-Chairman and Warren Buffett’s partner for many decades, passed away recently at the age 99. In addition to his
economic contributions to Berkshire and his thoughtful and generous philanthropic endeavors, Mr. Munger was a generous and brilliant teacher to generations of investors and business people.
4
GoodHaven Fund
As a reminder – we made Berkshire a top holding during the spring of 2020 – when we said “Berkshire Hathaway is now our largest holding after we materially increased its size during the recent market
downturn.”6 This was not a consensus idea at the time – as the folks at Pension and Investments Magazine opined in July 2020 “It’s been an off year for Warren Buffett’s
Berkshire Hathaway Inc. The company’s B shares are down 15% year-to-date and missed most of the second quarter rebound.” 7 Since June 2020, BRK/B has outperformed the
S&P 500 by 30 percentage points, with an annualized return of ~20% since then. We are pleased with Berkshire’s progress since then and as we’ve said several times – unfortunately both Buffett and Munger will no longer be running the company one
of these days, but we remain currently comfortable with the possible ways management succession may evolve.
TABLE OF TOP 5 CONTRIBUTORS & DETRACTORS ($) FOR THE FISCAL YEAR
|
Contributors (11/30/2022 – 11/30/2023)
|
Detractors (11/30/2022 – 11/30/2023)
|
|
Builders FirstSource Inc.
|
Devon Energy
|
|
Alphabet Inc. – Class C
|
Jefferies Financial Group Inc.
|
|
Lennar Corp. – Class B
|
Ligado Networks LLC Debt
|
|
Berkshire Hathaway Inc. – Class B
|
RH
|
|
Meta Platforms Inc. – Class A
|
Occidental Petroleum Corp Warrants
|
Our biggest dollar gainer in the period by far was our long-time holding in Builders FirstSource. Exceptional business performance here has led to excellent stock market performance. In addition,
Builders has become a better business over the years and better able to navigate the cyclicality of their industry. We now own a greater percentage of the company due to a material, and well executed, share repurchase program.8 The impressive organic growth has also been aided by a material number of attractive acquisitions. There have been 14 acquisitions since their landmark BMC merger, which
have added meaningfully to existing revenues and earnings. In the past five years, earnings per share have increased from ~$2 to an estimated ~$13 this fiscal year, a 48% CAGR during that time period, and during the recent annual investor day,
management guided to a double digit % annualized EPS growth the next 2 years. The business continues to generate significant free cash flow even during slower periods with low debt leverage and no near-term maturities.
__________
|
6
|
GoodHaven Fund 2020 Semi-Annual Report Shareholder letter, July 1, 2020
|
|
7
|
Pension and Investments Magazine, 7/27/2020
|
|
8
|
Since the inception of its buyback program in August 2021, the company has repurchased approximately 41% of its shares outstanding via
https://s202.q4cdn.com/867695273/files/doc_events/2023/Dec/05/bldr-2023-investor-day-presentation-final_edgar.pdf As of September 30, 2023, shares outstanding were 123.4 million.
https://s202.q4cdn.com/867695273/files/doc_financials/2023/q3/BLDR-Q3-2023-Earnings-Presentation.pdf
|
5
GoodHaven Fund
The rate of competitive change in business out there in general, is harsher and faster than ever. One of the important things that attracted us initially to Builders was our view that not only was
their competitive position strong but it was stable, predictable and getting stronger. Amazon’s Jeff Bezos well-articulated how we too think about analyzing businesses when considering the risk of change when he said:
“I very frequently get the question; What’s going to change in the next 10 years? And that is a very interesting question; it’s a very common one. I almost never get the question: What’s not going to
change in the next 10 years? And I submit to you that the second question is actually the more important of the two – because you can build a business strategy around the things that are stable in time…”9
By the way, our continued strong recent results from our two companies operating in/around the housing sector – Builders and Lennar – have occurred amidst a backdrop of crummy housing affordability
statistics and uneven results amidst many other parts of this broader industry.10 Even during this uncertain period, both businesses continued to win market share in
their respective markets, and executed on operational efficiencies that unlocked working capital which ultimately increased earnings per share and returns on capital.
We remind you that the housing market is still cyclical – and while both Builders and Lennar are much better businesses than they used to be with solid balance sheets and low leverage, periodic
business volatility comes with the territory here.
KKR was a gainer during this period. In November, KKR announced it was going to acquire the remaining 37% stake of Global Atlantic for $2.7bn in cash (at a valuation of 1.0x book value). Global
Atlantic is an annuities and life insurance provider that they acquired a majority stake back in 2021. The original investment in Global has been a significant contributor to earnings and AUM growth, and the acquisition of the remaining stake will
accelerate the future growth of the overall business. Other recently announced positive KKR changes are expected to increase recurring earnings to ~70% of pre-tax earnings in the future.
TerraVest was also a gainer this period – and deserves some mention. TerraVest is a small company based in Canada. The below quote captures TerraVest’s wonderful historic results well:
“The secret to success is to do common things uncommonly well.”
– John D. Rockefeller
TerraVest’s “complex” business plan of modest organic growth, opportunistic and bargain priced acquisitions in sectors they understand, astute stock buybacks and modest dividends, continues. Business
schools and bankers would convey that approach in a semester-long class or a fifty-page presentation – but Charles and Dustin (Chairman and CEO respectively) at TerraVest just “show us the money!”
__________
|
9
|
https://www.youtube.com/watch?v=O4MtQGRIIuA&t=267s
|
|
10
|
“How the Housing Market Slowdown is Rippling Through the Economy...” Harriet Torry, Wall Street Journal 12/19/2023
|
6
GoodHaven Fund
Near the end of the fiscal period TerraVest announced two new acquisitions (Highland Tank and LV Energy Services) which we feel are materially accretive to intrinsic value.
TerraVest’s track record has led to an approximately 29% compound return for shareholders over the past 10 years - well supported by growth in intrinsic value. At a current price of about 10X forward
free cash flow/share, with a healthy 30% adjusted return on equity we think much long-term upside remains.
Over on the negative side of the ledger Devon was the largest dollar detractor. We saw this as an opportunity and as discussed earlier behaved accordingly. Next on the list was Jefferies, where our
long-term positive outlook has actually increased. Alibaba, which we sold for a loss in the period, was also a detractor. There we concluded that our thesis was flawed and we also lacked confidence in the long-term outlook and so we exited the
position fully.
Our biggest errors in recent years have been errors of omission, not commission. This is not a throw away self-depreciating comment. We review and think a lot about our process and why we may have
missed, or not sized properly something that worked out well, was within our circle of competence and was “sitting on our desk.” As many potential ways to have an advantage in our industry such as; dissemination of information, financial modeling
field research and more – have become more commoditized – process matters more than ever.
Value investing (both what it is and what it is not) remains our philosophy. We have covered our views on this in some of our more recent letters. Just because we don’t feel it’s necessary to add
pages to each letter about it does not mean it’s not important. We hope that our comments about our portfolio’s valuation, and how we think about allocating capital with a margin of safety and a long-term orientation tells you plenty. To reiterate
some process thoughts that we believe have been important to the recent results at GoodHaven 2.0 we reprint some comments we made in January 2020 in our first letter to you after our reorganization:
“Further and even with extensive experience, a review of our past process leaves me reminded that: 1) growing high return companies are special; 2) without a
catalyst, intrinsic value better be rising as you sleep; 3) there is no shame in jumping over lower hurdles; and 4) it’s not an IQ test – decision making, insights and position sizing are critical aspects of performance. Of course, material realized
losses are just unacceptable. Despite my insistence that our process always improve it’s also usually a bad idea when allocating capital to immediately do what you wish you had done three or four years ago.”11
Please note that as of November 1, 2023 the Fund redemption fee has been removed and shareholders are no longer subject to this fee.
__________
|
11
|
GoodHaven Fund 2020 Annual Report
|
7
GoodHaven Fund
We thank all fellow shareholders for their continued confidence as GoodHaven 2.0 continues to unfold. We feel we have the capacity to manage a much larger portfolio should more new fellow
shareholders join us. We welcome Allison Nagelberg as a new member of our Board of Trustees. We expect to all benefit from her experience and counsel. We also recognize Steven Tishman who recently left the Board. Steven diligently and insightfully
performed his role on the Board. We all thank him and expect to still see him around sometimes! We thank all our Fund Board of Trustees and our long-time partner and investor Markel for their support and wise advice.
Stay healthy and safe and forward we go.

Larry Pitkowsky
Mutual fund investing involves risk. Principal loss is possible. The Fund is non-diversified, meaning it may concentrate its assets in fewer individual holdings than a diversified fund. Therefore,
the Fund is more exposed to individual stock volatility than a diversified fund. The Fund invests in midcap and smaller capitalization companies, which involve additional risks such as limited liquidity and greater volatility. The Fund may invest in
foreign securities which involve political, economic and currency risks, greater volatility and differences in accounting methods. These risks are enhanced in emerging markets. The Fund may invest in REITs, which are subject to additional risks
associated with direct ownership of real property including decline in value, economic conditions, operating expenses, and property taxes. Investments in debt securities typically decrease in value when interest rates rise. This risk is usually
greater for longer-term debt securities. Investments in lower-rated, non-rated and distressed securities present a greater risk of loss to principal and interest than higher-rated securities.
The opinions expressed are those of Larry Pitkowsky through the end of the period for this report, are subject to change, and are not intended to be a forecast of future events, a guarantee of future results, nor
investment advice. This material may include statements that constitute “forward-looking statements” under the U.S. securities laws. Forward-looking statements include, among other things, projections, estimates, and information about possible or
future results related to the Fund, market or regulatory developments. The views expressed herein are not guarantees of future performance or economic results and involve certain risks, uncertainties and assumptions that could cause actual outcomes
and results to differ materially from the views expressed herein. The views expressed herein are subject to change at any time based upon economic, market, or other conditions and GoodHaven undertakes no obligation to update the views expressed
herein. While we have gathered this information from sources believed to be reliable, GoodHaven cannot guarantee the accuracy of the information provided. Any discussions of specific securities or sectors should not be considered a recommendation to
buy or sell those securities. The views expressed herein (including any forward-looking statement) may not be relied upon as investment advice or as an indication of the Fund’s trading intent. Information included herein is not an indication of the
Fund’s future portfolio composition.
Fund holdings and sector allocations are subject to change and are not a recommendation to buy or sell any security. Please see the Schedule of Investments for a complete list of Fund holdings.
8
GoodHaven Fund
It is not possible to invest directly in an index. Must be preceded or accompanied by a prospectus.
The S&P 500 Index is a capitalization weighted index of 500 large capitalization stocks which is designed to measure broad domestic securities markets.
The FT Wilshire 5000 Full Cap Index is designed to measure the full market capitalization of equities in the US Market. This index replaced the Wilshire 5000 Total Market Index (full-cap) as of May 31, 2023.
CS Hedge Fund Index is an asset-weighted hedge fund index derived from the TASS database of more than 5000 funds. The index consists of funds with a minimum of US $10 million under management and a current audited
financial statement. Funds are separated into primary subcategories based on investment style. The index in all cases represents at least 85% of the assets under management in the universe. The index is rebalanced monthly, and funds are reselected on
a quarterly basis. Index NAVs are updated on the 15th of each month.
Per Morningstar (as of 11/30/2023 in the Midcap value category), the GoodHaven Fund was ranked in the top 1% for 1YR (vs. 394 funds), top 4% for 3YR (vs. 379 funds), top 2% for 5 YR (vs. 362 funds), and top 95% for
10YR (vs. 269 funds). Morningstar Rankings represent a fund’s total return percentile rank relative to all funds in the same Morningstar Category for the same time period. The highest (or most favorable) percentile rank is 1%, and the lowest (or
least favorable) percentile rank is 100%. It is based on Morningstar total return, which includes both income and capital gains or losses and is not adjusted for sales charges or redemption fees. Past performance does not guarantee future results.
References to other mutual funds should not be interpreted as an offer of these securities. Please see the Schedule of Investments for a full list of fund holdings.
The GoodHaven Fund is distributed by Quasar Distributors, LLC
9
GoodHaven Fund
|
PORTFOLIO MANAGEMENT DISCUSSION AND ANALYSIS
|
The Net Asset Value (“NAV”) of the GoodHaven Fund was $40.48 at November 30, 2023, based on 5,015,721 shares outstanding. This compares to the Fund’s NAV of $35.78 at May 31, 2023 and NAV of $33.79
at November 30, 2022 and an NAV of $20.00 at inception on April 8, 2011. In December 2023, the Fund distributed a small long term capital gains distribution of $0.2416 per share and an income distribution of $0.3670 per share which reduced per share
NAV on the ex-dividend date (December 08, 2023). Shareholders should be aware that the Fund has paid capital gains and income distributions in prior years that reduced NAV by the amount of a distribution on the ex-dividend date. Please note that
except where otherwise indicated, discussions in this MD&A relate to the period ended November 30, 2023.
In late November 2019, the Fund’s shareholders approved a new investment advisory agreement for the Fund in conjunction with a reorganization of the advisor which was subsequently completed. Details
of this reorganization have been previously disclosed in a proxy filing dated October 25, 2019. As a result of the reorganization Larry Pitkowsky became the Fund’s sole portfolio manager, Chairman of the Board of Trustees, and the controlling owner
of the advisor. Keith Trauner is now a minority partner of the advisor and no longer a portfolio manager of the Fund.
The performance data quoted above represents past performance. Past performance does not guarantee future results. The investment return and principal value of an investment will
fluctuate so that an investor’s shares, when redeemed, maybe worth more or less than their original cost. Current performance of the Fund may be lower or higher than the performance quoted. Performance data current to the most recent month-end may be
obtained by calling (855) OK-GOODX or (855) 654-6639.
During the recent annual period, the Fund had strong results and materially outperformed the S&P 500. The Fund has benefited in recent periods from an improved investment and security selection
process, as well as strong business results from its investments.
While the Fund’s record since inception is still colored by a material divergence between mid-2014 and the end of 2015, we continue to believe that the investment manager’s strategy is sound and risk
averse and note that the recent reorganization appears to have improved the investment process, decision making, and is reflective in recent performance. Since shortly after our reorganization at the end of 2019, the Fund has materially outperformed
the S&P 500 and the Wilshire 5000. The portfolio manager continues to be among the largest individual owners of Fund shares and continues to have significant personal assets at risk, aligning with the interests of shareholders.
The portfolio manager believes that short-term performance figures are less meaningful than comparison of longer periods and that a long-term investment strategy should be properly judged over a
period of years rather than weeks or months. Moreover, as we have noted, value investing has been out of favor for an
10
GoodHaven Fund
|
PORTFOLIO MANAGEMENT DISCUSSION AND ANALYSIS (Continued)
|
extended period of years. Please note that the S&P 500 Index is an unmanaged index incurring no fees, expenses, or taxes and is shown solely for the purpose of comparing
the Fund’s portfolio to an unmanaged and diversified index of large companies. There are other indexes whose performance may diverge materially from that of the S&P 500. Below is a table of the Fund’s top ten holdings and categories as of
November 30, 2023:
|
Top 10 Holdings 1
|
%
|
Top Categories 2
|
%
|
||||||
|
Berkshire Hathaway
|
Cash & Equivalents
|
29.0
|
|||||||
|
Inc. – Class B
|
11.2
|
Diversified Holding Companies
|
11.2
|
||||||
|
Alphabet Inc. – Class C
|
7.0
|
Oil & Gas Exploration
|
|||||||
|
Builders FirstSource, Inc.
|
6.6
|
& Production
|
8.0
|
||||||
|
Bank of America Corp.
|
5.4
|
Interactive Media & Services
|
7.0
|
||||||
|
Devon Energy Corp.
|
4.4
|
Banks – Diversified
|
6.8
|
||||||
|
Jefferies Financial Group, Inc.
|
4.2
|
General Building Materials
|
6.6
|
||||||
|
EXOR NV
|
4.2
|
Capital Markets
|
6.5
|
||||||
|
Lennar Corp. – Class B
|
3.5
|
Investment Management
|
5.7
|
||||||
|
The Progressive Corp.
|
2.8
|
Industrial Conglomerate
|
4.2
|
||||||
|
KKR & Co., Inc.
|
2.8
|
Home Builder
|
3.5
|
||||||
|
Total
|
52.1
|
Total
|
88.5
|
||||||
|
1
|
Top ten holdings excludes cash, money market funds and Government and Agency Obligations.
|
|
2
|
Where applicable, includes money market funds and short-term Government and Agency Obligations.
|
Fund holdings and/or sector allocations are subject to change at any time and are not recommendations to buy or sell any security.
The Fund experienced material inflows in the 2023 annual period. Since the inception of the Fund, there have been periods where there were large new shareholder subscriptions and periods with
significant net withdrawals. Material swings in shareholder subscriptions and redemptions can make management of the portfolio more difficult. The Fund’s investments are stated as of November 30, 2023 and the amounts and rankings of the Fund’s
holdings today may vary significantly from the data disclosed above and the managers may have taken actions that would result in material changes to the portfolio.
The Fund’s investments having the most positive impact on portfolio performance for the twelve month period ending November 30, 2023 were: Builders FirstSource, which rose amidst strong earnings and
free cash flow generation and an aggressive share buyback program even amidst a challenging macro backdrop; Alphabet which rose amidst steady operating results and more attention on managing its expense base and a clearer picture of progress on new
AI (artificial intelligence) initiatives; and Lennar which rose as it generated solid operating results despite a difficult macro backdrop. Major detractors were Devon Energy which declined
11
GoodHaven Fund
|
PORTFOLIO MANAGEMENT DISCUSSION AND ANALYSIS (Continued)
|
amidst weaker oil prices despite continued solid results and some general sector underperformance; and Jefferies which declined amidst a cyclical downturn in certain capital
markets activities and a volatile climate for financial companies amidst the banking crisis surrounding Silicon Valley Bank and Signature Bank.
The Fund’s turnover rate of 14%, a measure of how frequently assets within a fund are bought and sold by the manager, remains at reasonably low levels and is consistent with the strategies, generally
long-term in nature, of GoodHaven Capital Management LLC, the Fund’s investment advisor. There may be times when turnover rates rise, however, we do not anticipate rapid turnover of the portfolio under normal circumstances.
The portfolio manager believes that a liquidity position is an important part of portfolio management. Since inception, the Fund has continued to have liquidity available both in cash holdings as
well as short-term fixed income investments to potentially make opportunistic purchases and meet redemptions. In addition, in order to ensure that we have sufficient resources to behave opportunistically, the Fund has sold or reduced certain
investments and has held some modest hedges from time to time. Over time, and as previously communicated, we expect the Fund’s level of cash to vary significantly and has lately sometimes been materially lower than in recent years. In addition, and
as previously communicated, the portfolio was recently more concentrated in its holdings than in the past—consistent with its prospectus—which could increase volatility materially. The manager of the Fund does not believe that a decline in a security
price necessarily means that the security is a less attractive investment. The opposite may be the case in that price declines may represent significant investment opportunities. Finally, the Fund periodically invests in special-situations which may
entail a greater level of risk and potential for loss. The portfolio manager’s letter to shareholders contains additional discussion about performance.
Generally, we do not expect significant realized capital gain or loss from any particular short-term, non-U.S. investments when viewed over an extended period. Certain large multi-national businesses
in the portfolio may be exposed to non-U.S. rules and regulations as well as volatility in currency values.
In addition, the recent elevated level of inflation has prompted the Federal Reserve to tighten monetary policies materially which could lead to declines in financial markets and may lead to a
recession domestically.
The Fund is subject to certain risks as disclosed in the Prospectus and Statement of Additional Information, both of which may be obtained from the Fund’s website at www.goodhavenfunds.com or by
calling 1-855-654-6639. Some of these risks include, but are not limited to, adverse market conditions that negatively affect the price of securities owned by the Fund, a high level of cash, which may result in underperformance during periods of
robust price appreciation, adverse movements in foreign currency relationships as a number of the Fund’s holdings have earnings
12
GoodHaven Fund
|
PORTFOLIO MANAGEMENT DISCUSSION AND ANALYSIS (Continued)
|
resulting from operations outside the United States, and the fact that the Fund is non-diversified, meaning that its holdings are more concentrated than a diversified Fund
and that adverse price movements in a particular security may affect the Fund’s Net Asset Value more negatively than would occur in a more diversified fund.
Please note that as of November 1, 2023 the Fund redemption fee has been removed and shareholders are no longer subject to this fee.
As of November 30, 2023, the members, officers, and employees of GoodHaven Capital Management, LLC, the investment advisor to the GoodHaven Fund, owned approximately 124,152 shares of the Fund. It is
management’s intention to disclose such holdings (in the aggregate) in this section of the Fund’s Annual and Semi-Annual reports on an ongoing basis.
13
GoodHaven Fund
|
ASSET/SECTOR ALLOCATION at November 30, 2023 (Unaudited)
|
|
Asset/Sector
|
% of Net Assets
|
|||
|
Short-Term Investments
|
27.4
|
%
|
||
|
Diversified Holding Companies
|
11.2
|
%
|
||
|
Oil & Gas Exploration & Production
|
8.0
|
%
|
||
|
Interactive Media & Services
|
7.0
|
%
|
||
|
Banks-Diversified
|
6.8
|
%
|
||
|
General Building Materials
|
6.6
|
%
|
||
|
Capital Markets
|
6.5
|
%
|
||
|
Investment Management
|
5.7
|
%
|
||
|
Industrial Conglomerate
|
4.2
|
%
|
||
|
Home Builder
|
3.5
|
%
|
||
|
Property/Casualty Insurance
|
2.8
|
%
|
||
|
Oil & Gas Equipment & Services
|
2.1
|
%
|
||
|
Specialty Retail
|
2.0
|
%
|
||
|
Cash and Equivalents 1
|
1.6
|
%
|
||
|
Real Estate
|
1.3
|
%
|
||
|
Oil & Gas Infrastructure
|
1.2
|
%
|
||
|
Machinery, Equipment, and Supplies Merchant Wholesalers
|
0.8
|
%
|
||
|
Mortgage Banking
|
0.5
|
%
|
||
|
Government Agency
|
0.5
|
%
|
||
|
Corporate Bonds
|
0.3
|
%
|
||
|
Insurance 2
|
0.0
|
%
|
||
|
Total
|
100.0
|
%
|
||
Equities are classified by sector. Debt is classified by asset type.
|
1
|
Represents cash and other assets in excess of liabilities.
|
|
2
|
Represents less than 0.05% of net assets.
|
14
GoodHaven Fund
|
HISTORICAL PERFORMANCE (Unaudited)
|
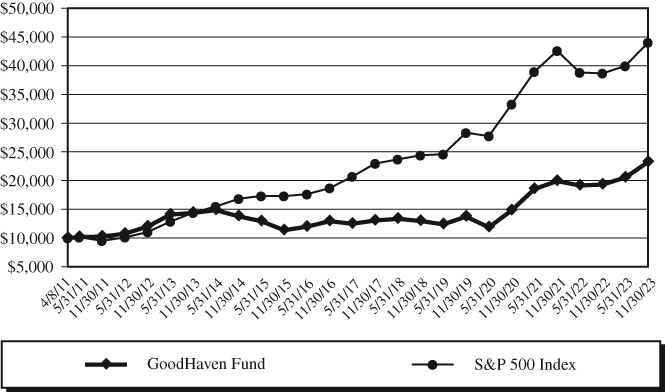
Value of $10,000 vs. S&P 500 Index
Average Annual Total Returns
Periods Ended November 30, 2023
|
Annualized
|
Value of
|
|||||
|
One
|
Three
|
Five
|
Ten
|
Since Inception
|
$10,000
|
|
|
Year
|
Year
|
Year
|
Year
|
(4/8/2011)
|
(11/30/2023)
|
|
|
GoodHaven Fund
|
20.25%
|
16.16%
|
12.35%
|
4.91%
|
6.89%
|
$23,225
|
|
S&P 500 Index
|
13.84%
|
9.76%
|
12.51%
|
11.82%
|
12.43%
|
$44,010
|
This chart illustrates the performance of a hypothetical $10,000 investment made on April 8, 2011 (the Fund’s inception) and is not intended to imply any future performance. The returns shown do not reflect the
deduction of taxes that a shareholder would pay on Fund distributions or the redemption of Fund shares. The chart assumes reinvestment of capital gains, dividends, and return of capital, if applicable, for the Fund and dividends for an index.
15
GoodHaven Fund
|
SCHEDULE OF INVESTMENTS at November 30, 2023
|
|
COMMON STOCKS – 68.8%
|
Shares
|
Value
|
||||||
|
Banks-Diversified – 6.8%
|
||||||||
|
Bank of America Corp.
|
359,500
|
$
|
10,961,155
|
|||||
|
JPMorgan Chase & Co.
|
8,000
|
1,248,640
|
||||||
|
Peapack-Gladstone Financial Corp.
|
66,211
|
1,644,681
|
||||||
|
13,854,476
|
||||||||
|
Capital Markets – 6.5%
|
||||||||
|
Jefferies Financial Group, Inc.
|
242,512
|
8,594,625
|
||||||
|
The Goldman Sachs Group, Inc.
|
13,600
|
4,644,944
|
||||||
|
13,239,569
|
||||||||
|
Diversified Holding Companies – 11.2%
|
||||||||
|
Berkshire Hathaway, Inc. – Class B (a)
|
62,900
|
22,644,000
|
||||||
|
General Building Materials – 6.6%
|
||||||||
|
Builders FirstSource, Inc. (a)
|
99,400
|
13,330,534
|
||||||
|
Government Agency – 0.1%
|
||||||||
|
Federal National Mortgage Association (a)
|
200,000
|
148,400
|
||||||
|
Home Builder – 3.5%
|
||||||||
|
Lennar Corp. – Class B
|
62,036
|
7,118,011
|
||||||
|
Industrial Conglomerate – 4.2%
|
||||||||
|
EXOR NV
|
88,062
|
8,559,853
|
||||||
|
Insurance – 0.0% (b)
|
||||||||
|
Brookfield Reinsurance Ltd.
|
252
|
8,868
|
||||||
|
Interactive Media & Services – 7.0%
|
||||||||
|
Alphabet, Inc. – Class C (a)
|
106,200
|
14,222,304
|
||||||
|
Investment Management – 5.7%
|
||||||||
|
Brookfield Asset Management Ltd. – Class A
|
9,201
|
322,311
|
||||||
|
Brookfield Corp.
|
154,548
|
5,450,908
|
||||||
|
KKR & Co., Inc.
|
75,000
|
5,688,000
|
||||||
|
11,461,219
|
||||||||
|
Machinery, Equipment, and Supplies
|
||||||||
|
Merchant Wholesalers – 0.8%
|
||||||||
|
Global Industrial Co.
|
47,805
|
1,702,336
|
||||||
|
Mortgage Banking – 0.5%
|
||||||||
|
Guild Holdings Co. – Class A
|
85,011
|
1,015,882
|
||||||
The accompanying notes are an integral part of these financial statements.
16
GoodHaven Fund
|
SCHEDULE OF INVESTMENTS at November 30, 2023 (Continued)
|
|
COMMON STOCKS – 68.8% (Continued)
|
Shares
|
Value
|
||||||
|
Oil & Gas Equipment & Services – 2.1%
|
||||||||
|
TerraVest Industries, Inc.
|
158,300
|
$
|
4,317,538
|
|||||
|
Oil & Gas Exploration & Production – 6.5%
|
||||||||
|
Devon Energy Corp.
|
199,161
|
8,956,270
|
||||||
|
Vitesse Energy, Inc.
|
180,892
|
4,274,478
|
||||||
|
13,230,748
|
||||||||
|
Oil & Gas Infrastructure – 1.2%
|
||||||||
|
Hess Midstream LP – Class A
|
75,667
|
2,462,204
|
||||||
|
Property/Casualty Insurance – 2.8%
|
||||||||
|
The Progressive Corp.
|
35,000
|
5,741,050
|
||||||
|
Real Estate – 1.3%
|
||||||||
|
Camden Property Trust
|
29,500
|
2,662,670
|
||||||
|
Specialty Retail – 2.0%
|
||||||||
|
Academy Sports & Outdoors, Inc.
|
52,000
|
2,645,240
|
||||||
|
Arhaus, Inc. (a)
|
143,000
|
1,332,760
|
||||||
|
3,978,000
|
||||||||
|
TOTAL COMMON STOCKS
|
||||||||
|
(Cost $75,487,551)
|
139,697,662
|
|||||||
|
WARRANTS – 1.5%
|
Contracts
|
|||||||
|
Oil & Gas Exploration & Production – 1.5%
|
||||||||
|
Occidental Petroleum Corp.,
|
||||||||
|
Expires August 03, 2027, Exercise Price $22.00 (a)
|
79,522
|
2,962,195
|
||||||
|
TOTAL WARRANTS
|
||||||||
|
(Cost $3,159,989)
|
2,962,195
|
|||||||
|
PREFERRED STOCKS – 0.4%
|
||||||||
|
Government Agency – 0.4%
|
||||||||
|
Federal National Mortgage Association
|
||||||||
|
Series E, 5.10%, Perpetual
|
7,750
|
27,667
|
||||||
|
Series N, 5.50%, Perpetual
|
31,037
|
106,333
|
||||||
|
Series R, 7.63%, Perpetual
|
69,980
|
139,960
|
||||||
|
Series T, 8.25%, Perpetual
|
216,881
|
481,476
|
||||||
|
755,436
|
||||||||
|
TOTAL PREFERRED STOCKS
|
||||||||
|
(Cost $929,908)
|
755,436
|
|||||||
The accompanying notes are an integral part of these financial statements.
17
GoodHaven Fund
|
SCHEDULE OF INVESTMENTS at November 30, 2023 (Continued)
|
|
CORPORATE BONDS – 0.3%
|
Par
|
Value
|
||||||
|
Telecommunications – 0.3%
|
||||||||
|
Ligado Networks LLC, 15.50%, 11/01/2023 (c)(d)
|
3,000,000
|
$
|
607,500
|
|||||
|
TOTAL CORPORATE BONDS
|
||||||||
|
(Cost $1,005,000)
|
607,500
|
|||||||
|
SHORT-TERM INVESTMENTS – 27.4%
|
||||||||
|
U.S. Treasury Bills – 27.4%
|
||||||||
|
5.32%, 12/7/2023 (e)
|
19,000,000
|
18,983,315
|
||||||
|
5.34%, 1/11/2024 (e)
|
12,000,000
|
11,927,960
|
||||||
|
5.38%, 2/8/2024 (e)
|
10,000,000
|
9,899,758
|
||||||
|
5.42%, 3/7/2024 (e)
|
11,000,000
|
10,845,655
|
||||||
|
5.33%, 3/14/2024 (e)
|
4,000,000
|
3,939,796
|
||||||
|
55,596,484
|
||||||||
|
TOTAL SHORT-TERM INVESTMENTS
|
||||||||
|
(Cost $55,593,912)
|
55,596,484
|
|||||||
|
TOTAL INVESTMENTS – 98.4%
|
||||||||
|
(Cost $136,176,360)
|
199,619,277
|
|||||||
|
Money Market Deposit Account – 1.7% (f)
|
3,557,913
|
|||||||
|
Liabilities in Excess of Other Assets – (0.1)%
|
(155,596
|
)
|
||||||
|
TOTAL NET ASSETS – 100.0%
|
$
|
203,021,594
|
||||||
Percentages are stated as a percent of net assets.
|
(a)
|
Non-income producing security.
|
|
(b)
|
Represents less than 0.05% of net assets.
|
|
(c)
|
Issuer is currently in forbearance.
|
|
(d)
|
Security is exempt from registration pursuant to Rule 144A under the Securities Act of 1933, as amended. These securities may only be resold in transactions exempt from registration to qualified institutional
investors. As of November 30, 2023, the value of these securities total $607,500 or 0.3% of the Fund’s net assets.
|
|
(e)
|
The rate shown is the effective yield.
|
|
(f)
|
The U.S. Bank Money Market Deposit Account (the “MMDA”) is a short-term investment vehicle in which the Fund holds cash balances. The MMDA will bear interest at a variable rate that is determined based on
conditions and is subject to change daily. The rate shown as of November 30, 2023 was 5.20%.
|
The accompanying notes are an integral part of these financial statements.
18
GoodHaven Fund
|
STATEMENT OF ASSETS AND LIABILITIES at November 30, 2023
|
|
ASSETS
|
||||
|
Investments in securities, at value
|
||||
|
(Cost $136,176,360) (Note 2)
|
$
|
199,619,277
|
||
|
Cash equivalents
|
3,557,913
|
|||
|
Receivables:
|
||||
|
Dividends and interest
|
158,131
|
|||
|
Fund shares sold
|
113,081
|
|||
|
Total assets
|
203,448,402
|
|||
|
LIABILITIES
|
||||
|
Payables:
|
||||
|
Investment securities purchased
|
228,958
|
|||
|
Fund shares redeemed
|
18,692
|
|||
|
Management fees
|
146,584
|
|||
|
Support services fees
|
32,574
|
|||
|
Total liabilities
|
426,808
|
|||
|
NET ASSETS
|
$
|
203,021,594
|
||
|
COMPONENTS OF NET ASSETS
|
||||
|
Paid-in capital
|
$
|
136,684,328
|
||
|
Total distributable (accumulated) earnings (losses)
|
66,337,266
|
|||
|
Net assets
|
$
|
203,021,594
|
||
|
Net Asset Value (unlimited shares authorized):
|
||||
|
Net assets
|
$
|
203,021,594
|
||
|
Shares of beneficial interest issued and outstanding
|
5,015,721
|
|||
|
Net asset value, offering and redemption price per share
|
$
|
40.48
|
||
The accompanying notes are an integral part of these financial statements.
19
GoodHaven Fund
|
STATEMENT OF OPERATIONS For the Year Ended November 30, 2023
|
|
INVESTMENT INCOME
|
||||
|
Dividend income
|
||||
|
(net of $19,411 in foreign withholding taxes)
|
$
|
1,729,657
|
||
|
Interest
|
1,508,347
|
|||
|
Total investment income
|
3,238,004
|
|||
|
EXPENSES
|
||||
|
Management fees
|
1,239,490
|
|||
|
Support services fees
|
275,442
|
|||
|
Total expenses
|
1,514,932
|
|||
|
Net investment income (loss)
|
1,723,072
|
|||
|
REALIZED AND UNREALIZED GAIN (LOSS)
|
||||
|
ON INVESTMENTS & FOREIGN CURRENCY
|
||||
|
Net realized gain (loss) on transactions
|
||||
|
from investments & foreign currency
|
2,669,453
|
|||
|
Net change in unrealized appreciation/depreciation
|
||||
|
on investments & foreign currency
|
19,318,718
|
|||
|
Net realized and unrealized gain (loss)
|
21,988,171
|
|||
|
Net increase (decrease) in net assets
|
||||
|
resulting from operations
|
$
|
23,711,243
|
||
The accompanying notes are an integral part of these financial statements.
20
GoodHaven Fund
|
STATEMENTS OF CHANGES IN NET ASSETS
|
|
Year Ended
|
Year Ended
|
|||||||
|
November 30, 2023
|
November 30, 2022
|
|||||||
|
INCREASE (DECREASE) IN NET ASSETS FROM:
|
||||||||
|
OPERATIONS
|
||||||||
|
Net investment income (loss)
|
$
|
1,723,072
|
$
|
388,066
|
||||
|
Net realized gain (loss) on
|
||||||||
|
investments & foreign currency
|
2,669,453
|
2,785,389
|
||||||
|
Change in unrealized appreciation/
|
||||||||
|
depreciation on investments
|
||||||||
|
& foreign currency
|
19,318,718
|
(6,304,764
|
)
|
|||||
|
Net increase (decrease) in net
|
||||||||
|
assets resulting from operations
|
23,711,243
|
(3,131,309
|
)
|
|||||
|
DISTRIBUTIONS TO SHAREHOLDERS
|
||||||||
|
Net distributions to shareholders
|
(387,947
|
)
|
(148,223
|
)
|
||||
|
CAPITAL SHARE TRANSACTIONS
|
||||||||
|
Net increase (decrease) in net assets derived
|
||||||||
|
from net change in outstanding shares 1
|
72,681,696
|
3,311,282
|
||||||
|
Total increase (decrease) in net assets
|
96,004,992
|
31,750
|
||||||
|
NET ASSETS
|
||||||||
|
Beginning of year
|
107,016,602
|
106,984,852
|
||||||
|
End of year
|
$
|
203,021,594
|
$
|
107,016,602
|
||||
|
1
|
Summary of capital share transactions is as follows:
|
|
Year Ended
|
Year Ended
|
||||||||||||||||
|
November 30, 2023
|
November 30, 2022
|
||||||||||||||||
|
Shares
|
Value
|
Shares
|
Value
|
||||||||||||||
|
Shares sold
|
2,012,260
|
$
|
78,894,571
|
225,007
|
$
|
7,404,547
|
|||||||||||
|
Shares issued on
|
|||||||||||||||||
|
reinvestment
|
|||||||||||||||||
|
of distributions
|
10,125
|
328,138
|
3,463
|
124,655
|
|||||||||||||
|
Shares redeemed 2
|
(173,484
|
)
|
(6,541,013
|
)
|
(128,402
|
)
|
(4,217,920
|
)
|
|||||||||
|
Net increase
|
|||||||||||||||||
|
(decrease)
|
1,848,901
|
$
|
72,681,696
|
100,068
|
$
|
3,311,282
|
|||||||||||
|
2
|
Net of redemption fees of $6,956 and $847, respectively.
|
The accompanying notes are an integral part of these financial statements.
21
GoodHaven Fund
|
FINANCIAL HIGHLIGHTS For a capital share outstanding throughout each year
|
|
Year Ended November 30,
|
||||||||||||||||||||
|
2023
|
2022
|
2021
|
2020
|
2019
|
||||||||||||||||
|
Net asset value at
|
||||||||||||||||||||
|
beginning of year
|
$
|
33.79
|
$
|
34.89
|
$
|
26.08
|
$
|
24.48
|
$
|
23.43
|
||||||||||
|
INCOME (LOSS) FROM INVESTMENT OPERATIONS:
|
||||||||||||||||||||
|
Net investment
|
||||||||||||||||||||
|
income (loss) 1
|
0.46
|
0.12
|
0.05
|
0.10
|
0.42
|
|||||||||||||||
|
Net realized and unrealized
|
||||||||||||||||||||
|
gain (loss) on investments
|
6.35
|
(1.17
|
)
|
8.88
|
1.82
|
0.90
|
||||||||||||||
|
Total from
|
||||||||||||||||||||
|
investment operations
|
6.81
|
(1.05
|
)
|
8.93
|
1.92
|
1.32
|
||||||||||||||
|
LESS DISTRIBUTION:
|
||||||||||||||||||||
|
From net investment income
|
(0.12
|
)
|
(0.05
|
)
|
(0.12
|
)
|
(0.32
|
)
|
(0.27
|
)
|
||||||||||
|
Total distributions
|
(0.12
|
)
|
(0.05
|
)
|
(0.12
|
)
|
(0.32
|
)
|
(0.27
|
)
|
||||||||||
|
Paid-in capital from
|
||||||||||||||||||||
|
redemption fees
|
0.00
|
2
|
0.00
|
2
|
0.00
|
2
|
0.00
|
2
|
0.00
|
2
|
||||||||||
|
Net asset value
|
||||||||||||||||||||
|
at end of year
|
$
|
40.48
|
$
|
33.79
|
$
|
34.89
|
$
|
26.08
|
$
|
24.48
|
||||||||||
|
Total return
|
20.25
|
%
|
-3.02
|
%
|
34.39
|
%
|
7.93
|
%
|
5.83
|
%
|
||||||||||
|
SUPPLEMENTAL DATA/RATIOS:
|
||||||||||||||||||||
|
Net assets at end
|
||||||||||||||||||||
|
of year (millions)
|
$
|
203.0
|
$
|
107.0
|
$
|
107.0
|
$
|
84.0
|
$
|
94.3
|
||||||||||
|
Portfolio turnover rate
|
14
|
%
|
17
|
%
|
13
|
%
|
32
|
%
|
8
|
%
|
||||||||||
|
Ratio of expenses to
|
||||||||||||||||||||
|
average net assets
|
1.10
|
%
|
1.10
|
%
|
1.10
|
%
|
1.11
|
%
|
1.11
|
%
|
||||||||||
|
Ratio of net investment
|
||||||||||||||||||||
|
income (loss) to
|
||||||||||||||||||||
|
average net assets
|
1.25
|
%
|
0.37
|
%
|
0.15
|
%
|
0.44
|
%
|
1.81
|
%
|
||||||||||
|
1
|
Calculated using the average shares method.
|
|
2
|
Does not round to $0.01 or $(0.01), as applicable.
|
The accompanying notes are an integral part of these financial statements.
22
GoodHaven Fund
|
NOTES TO FINANCIAL STATEMENTS November 30, 2023
|
|
NOTE 1 – ORGANIZATION
|
The GoodHaven Funds Trust (the “Trust”) is registered under the Investment Company Act of 1940, as amended (the “1940 Act”) as a non-diversified, open-end
investment management company. The Fund is an investment company and accordingly follows the investment company accounting and reporting guidance of the Financial Accounting Standards Board (“FASB”) Accounting Standard Codification Topic 946
“Financial Services – Investment Companies.” The Fund commenced operations on April 8, 2011.
The Fund’s investment objective is to seek long-term growth of capital.
|
NOTE 2 – SIGNIFICANT ACCOUNTING POLICIES
|
The following is a summary of significant accounting policies consistently followed by the Fund. These policies are in conformity with accounting
principles generally accepted in the United States of America (“U.S. GAAP”).
|
A.
|
Security Valuation. All equity securities, which may include Real Estate Investment Trusts (“REITs”), Business Development Companies (“BDCs”) and Master Limited
Partnerships (“MLPs”), that are traded on U.S. national or foreign securities exchanges are valued at the last reported sale price on the exchange on which the security is principally traded or the exchange’s official closing price, if
applicable. If, on a particular day, an exchange-traded security does not trade, then the mean between the most recent quoted bid and asked prices will be used. All equity securities, which may include REITs, BDCs and MLPs, that are not
traded on a listed exchange are valued at the last sale price in the over-the-counter market. If a non-exchange traded security does not trade on a particular day, then the mean between the last quoted closing bid and asked price will be
used.
|
|
|
Debt securities are valued by using the evaluated mean price supplied by an approved independent pricing service. The independent pricing service may use various valuation methodologies, including matrix
pricing and other analytical pricing models as well as market transactions and dealer quotations. These models generally consider such factors as yields or prices of bonds of comparable quality, type of issue, coupon, maturity, ratings and
general market conditions.
|
||
|
Exchange traded options are valued at the composite price, using the National Best Bid and Offer quotes (“NBBO”). NBBO consists of the highest bid price and lowest ask price across any of the exchanges on which
an option is quoted, thus providing a view across the entire U.S. options marketplace. Composite option pricing calculates the mean of the highest bid price and lowest ask price across the exchanges where the option is traded. If a composite
price is not available, then the closing price will be used.
|
23
GoodHaven Fund
|
NOTES TO FINANCIAL STATEMENTS November 30, 2023 (Continued)
|
|
Any securities or other assets for which market quotations are not readily available are valued at their fair value as determined in good faith by the Adviser as “valuation designee” of the Board of Trustees
(the “Board”) pursuant to policies and procedures adopted pursuant to Rule 2a-5 under the 1940 Act. When a security is “fair valued,” consideration is given to the facts and circumstances relevant to the particular situation, including a
review of various factors set forth in the pricing procedures adopted by the Board. Fair value pricing is an inherently subjective process, and no single standard exists for determining fair value. Different funds could reasonably arrive at
different values for the same security. The use of fair value pricing by a fund may cause the net asset value of its shares to differ significantly from the net asset value that would be calculated without regard to such considerations.
|
||
|
As described above, the Fund utilizes various methods to measure the fair value of its investments on a recurring basis. U.S. GAAP establishes a hierarchy that prioritizes inputs to valuation methods. The three
levels of inputs are:
|
|
Level 1 –
|
Unadjusted quoted prices in active markets for identical assets or liabilities that the Fund has the ability to access.
|
||
|
Level 2 –
|
Observable inputs other than quoted prices included in Level 1 that are observable for the asset or liability, either directly or indirectly. These inputs may include quoted prices for the identical instrument
on an inactive market, prices for similar instruments, interest rates, prepayment speeds, credit risk, yield curves, default rates and similar data.
|
||
|
Level 3 –
|
Unobservable inputs for the asset or liability, to the extent relevant observable inputs are not available, representing the Fund’s own assumptions about the assumptions a market participant would use in
valuing the asset or liability, and would be based on the best information available.
|
|
The availability of observable inputs can vary from security to security and is affected by a wide variety of factors, including, for example, the type of security, whether the security is new and not yet
established in the marketplace, the liquidity of markets, and other characteristics particular to the security. To the extent that valuation is based on models or inputs that are less observable or unobservable in the market, the
determination of fair value requires more judgment. Accordingly, the degree of judgment exercised in determining fair value is greatest for instruments categorized in Level 3.
|
||
|
The inputs used to measure fair value may fall into different levels of the fair value hierarchy. In such cases, for disclosure purposes, the level in the
|
24
GoodHaven Fund
|
NOTES TO FINANCIAL STATEMENTS November 30, 2023 (Continued)
|
|
fair value hierarchy within which the fair value measurement falls in its entirety, is determined based on the lowest level input that is significant to the fair value measurement in its entirety.
|
||
|
The following is a summary of the inputs used to value the Fund’s investments as of November 30, 2023. See the Schedule of Investments for the industry and security type breakouts.
|
|
Level 1
|
Level 2
|
Level 3
|
Total
|
|||||||||||||||
|
Common Stocks
|
$
|
139,697,662
|
$
|
—
|
$
|
—
|
$
|
139,697,662
|
||||||||||
|
Warrants
|
2,962,195
|
—
|
—
|
2,962,195
|
||||||||||||||
|
Preferred Stocks
|
727,769
|
27,667
|
—
|
755,436
|
||||||||||||||
|
Corporate Bonds
|
—
|
607,500
|
—
|
607,500
|
||||||||||||||
|
Short-Term
|
||||||||||||||||||
|
Investments
|
—
|
55,596,484
|
—
|
55,596,484
|
||||||||||||||
|
Total Investments
|
$
|
143,387,626
|
$
|
56,231,651
|
$
|
—
|
$
|
199,619,277
|
||||||||||
|
The Fund has adopted financial reporting rules and regulations that require enhanced disclosure regarding derivatives and hedging activity intending to improve financial reporting of derivative instruments by
enabling investors to understand how and why an entity uses derivatives, how derivatives are accounted for, and how derivative instruments affect an entity’s results of operations and financial position.
|
||
|
The Fund may invest, at the time of purchase, up to 10% of the Fund’s net assets in options, which are a type of derivative and employ specialized trading techniques such as options trading to increase the
Fund’s exposure to certain selected securities. The Fund may employ these techniques as hedging tools as well as speculatively to enhance returns. Other than when used for hedging, these techniques may be riskier than many investment
strategies and may result in greater volatility for the Fund, particularly in periods of market declines. As a hedging tool, options may help cushion the impact of market declines, but may reduce the Fund’s participation in a market advance.
|
||
|
The Fund did not hold options contracts as of November 30, 2023.
|
25
GoodHaven Fund
|
NOTES TO FINANCIAL STATEMENTS November 30, 2023 (Continued)
|
|
Statement of Operations
|
||
|
The effect of derivative instruments on the Statement of Operations for the year ended November 30, 2023:
|
|
Change in
|
|||||||||||
|
Unrealized
|
|||||||||||
|
Location of
|
Realized
|
Appreciation/
|
|||||||||
|
Gain (Loss)
|
Gain (Loss)
|
Depreciation
|
|||||||||
|
on Derivatives
|
on Derivatives
|
on Derivatives
|
|||||||||
|
Derivative
|
Recognized
|
Recognized
|
Recognized
|
||||||||
|
Instruments
|
in Income
|
in Income
|
in Income
|
||||||||
|
Equity Contracts:
|
Realized and Unrealized
|
||||||||||
|
Put Options
|
Gain (Loss) on Investments
|
||||||||||
|
Purchased
|
& Foreign Currency
|
$
|
(4,573
|
)
|
$
|
—
|
|||||
|
Equity Contracts:
|
Realized and Unrealized
|
||||||||||
|
Call Options
|
Gain (Loss) on Investments
|
||||||||||
|
Purchased
|
& Foreign Currency
|
$
|
(18,086
|
)
|
$
|
30,645
|
|||||
|
B.
|
Foreign Currency. Foreign currency amounts, other than the cost of investments, are translated into U.S. dollar values based upon the spot exchange rate prior to the
close of regular trading. The cost of investments is translated at the rates of exchange prevailing on the dates the portfolio securities were acquired. The Fund includes foreign exchange gains and losses from dividends receivable and other
foreign currency denominated payables and receivables in realized and unrealized gain (loss) on investments and foreign currency. The Fund does not isolate that portion of realized gain (loss) or unrealized gain (loss) on investments
resulting from changes in foreign exchange rates on investments from fluctuations arising from changes in the market price of securities for financial reporting purposes. Fluctuations in foreign exchange rates on investments are thus included
with net realized gain (loss) on investments and foreign currency and with net unrealized gain (loss) on investments and foreign currency.
|
|
|
C.
|
Federal Income Taxes. The Fund has elected to be taxed as a “regulated investment company” and intends to distribute substantially all taxable income to its
shareholders and otherwise comply with the provisions of the Internal Revenue Code applicable to regulated investment companies. Therefore, no provision for federal income taxes or excise taxes has been made.
|
|
|
In order to avoid imposition of the excise tax applicable to regulated investment companies, the Fund intends to declare each year as dividends in each calendar year at least 98.0% of its net investment income
(earned during the calendar year) and at least 98.2% of its net realized capital gains (earned during the twelve months ended November 30) plus undistributed amounts, if any, from prior years.
|
26
GoodHaven Fund
|
NOTES TO FINANCIAL STATEMENTS November 30, 2023 (Continued)
|
|
Net investment losses incurred after December 31, and within the taxable year may be deferred and are deemed to arise on the first business day of the Fund’s next taxable year. As of November 30, 2023, the Fund
did not have any capital loss carryovers. As of November 30, 2023, the capital loss carryover utilized in the current year was $1,468,182.
|
||
|
As of November 30, 2023, the Fund did not have any tax positions that did not meet the “more likely-than-not” threshold of being sustained by the applicable tax authority. Generally, tax authorities can examine
all the tax returns filed for the last three years. The Fund identifies their major tax jurisdictions as U.S. Federal and the State of Delaware. As of November 30, 2023, the Fund was not aware of any tax positions for which it is reasonably
possible that the total amounts of unrecognized tax benefits will change materially.
|
||
|
D.
|
Reclassification of Capital Accounts. Accounting principles generally accepted in the United States of America require that certain components of net assets relating to
permanent differences be reclassified between financial and tax reporting. These reclassifications have no effect on net assets or net asset value per share. For the year ended November 30, 2023 the following adjustments were made:
|
|
Distributable (accumulated)
|
|
|
earnings (losses)
|
Paid-in Capital
|
|
$(4)
|
$4
|
|
E.
|
Security Transactions and Investment Income. Investment securities transactions are accounted for on the trade date. Gains and losses realized on sales of securities are
determined on a specific identification basis. Discounts/premiums on debt securities purchased are accreted/amortized over the life of the respective securities using the effective interest method. Dividend income is recorded on the
ex-dividend date. Dividends from REITs and MLPs generally are comprised of ordinary income, capital gains and may include return of capital. Interest income is recorded on an accrual basis. Other non-cash dividends are recognized as
investment income at the fair value of the property received. Withholding taxes on foreign dividends have been provided for in accordance with the Trust’s understanding of the applicable country’s tax rules and rates.
|
|
|
F.
|
Distributions to Shareholders. Distributions to shareholders from net investment income and net realized gains for the Fund normally are declared and paid on an annual
basis. Distributions are recorded on the ex-dividend date.
|
|
|
G.
|
Use of Estimates. The preparation of financial statements in conformity with U.S. GAAP requires management to make estimates and assumptions that affect the reported
amounts of assets and liabilities at the date of the
|
27
GoodHaven Fund
|
NOTES TO FINANCIAL STATEMENTS November 30, 2023 (Continued)
|
|
financial statements, as well as the reported amounts of revenues and expenses during the period. Actual results could differ from those estimates.
|
||
|
H.
|
Share Valuation. The net asset value (“NAV”) per share of the Fund is calculated by dividing the sum of the value of the securities held by the Fund, plus cash and
other assets, minus all liabilities by the total number of shares outstanding for the Fund, rounded to the nearest cent. The Fund’s shares will not be priced on the days on which the New York Stock Exchange is closed for trading. The offering
and redemption price per share for the Fund is equal to the Fund’s net asset value per share. Prior to November 1, 2023, the Fund charged a 2.00% redemption fee on shares held less than 60 days.
|
|
|
I.
|
Guarantees and Indemnifications. In the normal course of business, the Fund enters into contracts with service providers that contain general indemnification clauses.
The Fund’s maximum exposure under these arrangements is unknown as this would involve future claims that may be made against the Fund that have not yet occurred. However, based on experience, the Fund expects the risk of loss to be remote.
|
|
|
J.
|
Illiquid Securities. Pursuant to Rule 22e-4 under the 1940 Act, the Fund has adopted a Board approved Liquidity Risk management Program (“LRMP”) that requires, among
other things, that the Fund limits its illiquid investments that are assets to no more than 15% of net assets. An illiquid investment is any security which may not reasonably be expected to be sold or disposed of in current market conditions
in seven calendar days or less without the sale or disposition significantly changing the market value of the investment.
|
|
|
K.
|
Options Contracts. When the Fund purchases an option, an amount equal to the premium paid by the Fund is recorded as an investment and is subsequently adjusted to the
current value of the option purchased. If an option expires on the stipulated expiration date or if the Fund enters into a closing sale transaction, a gain or loss is realized. If a call option is exercised, the cost of the security acquired
is increased by the premium paid for the call. If a put option is exercised, a gain or loss is realized from the sale of the underlying security, and the proceeds from such sale are decreased by the premium originally paid. Written and
purchased options are non-income producing securities.
|
|
|
When the Fund writes an option, an amount equal to the premium received by the Fund is recorded as a liability and is subsequently adjusted to the current fair value of the option written. Premiums received
from writing options that expire unexercised are treated by the Fund on the expiration date as realized gains from investments. The difference between the premium and the amount paid on effecting a closing purchase transaction,
|
28
GoodHaven Fund
|
NOTES TO FINANCIAL STATEMENTS November 30, 2023 (Continued)
|
|
including brokerage commissions, is also treated as a realized gain, or, if the premium is less that the amount paid for the closing purchase transaction, as a realized loss. If a call option is exercised, the
premium is added to the proceeds from the sale of the underlying security or currency in determining whether the Fund has realized a gain or loss. If a put option is exercised, the premium reduces the cost basis of the securities purchased by
the Fund. The Fund as writer of an option bears the market risk of an unfavorable change in the price of the security underlying the written option.
|
||
|
The following table indicates the average volume when in use for the year ended November 30, 2023:
|
Average notional value of:
|
Options purchased
|
$151,858
|
|
L.
|
Recently Issued Accounting Pronouncements. In June 2022, the FASB issued Accounting Standards Update 2022-03, which amends Fair Value Measurement (Topic 820): Fair Value
Measurement of Equity Securities Subject to Contractual Sale Restrictions (“ASU 2022-03”). ASU 2022-03 clarifies guidance for fair value measurement of an equity security subject to a contractual sale restriction and establishes new
disclosure requirements for such equity securities. ASU 2022-03 is effective for fiscal years beginning after December 15, 2023 and for interim periods within those fiscal years, with early adoption permitted. Management is currently
evaluating the impact of these amendments on the financial statements.
|
|
NOTE 3 – COMMITMENTS AND OTHER RELATED PARTY TRANSACTIONS
|
The Advisor provides the Fund with investment management services under an Investment Advisory Agreement (the “Advisory Agreement”). Under the Agreement,
the Advisor provides all investment advice, office space and certain administrative services, and most of the personnel needed by the Fund. Under the Advisory Agreement, the Advisor is entitled to receive a monthly management fee calculated daily and
payable monthly equal to 0.90% of the Fund’s average daily net assets. The amount of Management fees incurred by the Fund for the year ended November 30, 2023, is disclosed in the Statement of Operations.
The Fund has also entered into a Support Services Agreement (the “Support Agreement”) with the Advisor. Under this agreement, the Advisor is responsible
for paying all of the Fund’s other normal day-to-day operational expenses, such as administrative, custody, transfer agency, fund accounting, legal and audit. The support services fee does not cover the following other expenses: (a) any charges
associated with the execution of portfolio transactions, such as brokerage commissions, transaction charges or other transaction-related expenses (such as stamp taxes), (b) taxes, acquired fund fees and expenses, if any, imposed on the Fund, (c)
interest, if any, on any Fund borrowings, or (d) extraordinary Fund legal expenses incurred outside of the normal operation of the Fund, such as legal fees, arbitration fees, or
29
GoodHaven Fund
|
NOTES TO FINANCIAL STATEMENTS November 30, 2023 (Continued)
|
related expenses in connection with any actual or threatened arbitration, mediation, or litigation. Under the Support Agreement, the Advisor is entitled to
receive a monthly fee calculated daily and payable monthly equal to 0.20% of the Fund’s average daily net assets. The amount of support services fees incurred by the Fund for the six months ended November 30, 2023, is disclosed in the Statement of
Operations.
U.S. Bancorp Fund Services, LLC, doing business as U.S. Bank Global Fund Services (“Fund Services”), acts as the Fund’s administrator, fund accountant and
transfer agent. In those capacities Fund Services maintains the Fund’s books and records, calculates the Fund’s NAV, prepares various federal and state regulatory filings, coordinates the payment of fund expenses, reviews expense accruals and
prepares materials supplied to the Board.
Quasar Distributors, LLC acts as the Fund’s principal underwriter in a continuous public offering of the Fund’s shares. U.S. Bank N.A. serves as custodian
to the Fund. U.S. Bank N.A. is an affiliate of Fund Services.
|
NOTE 4 – PURCHASES AND SALES OF SECURITIES
|
Investment transactions (excluding short-term investments) for the year ended November 30, 2023, were as follows:
|
Purchases
|
Sales or Maturity
|
|
at Cost
|
Proceeds
|
|
$38,104,777
|
$15,661,660
|
There were no purchases or sales/maturities of long-term U.S. Government securities for the year ended November 30, 2023.
|
NOTE 5 – DISTRIBUTIONS TO SHAREHOLDERS
|
The tax character of distributions paid during the years ended November 30, 2023 and November 30, 2022, was as follows:
|
November 30, 2023
|
November 30, 2022
|
|
|
Ordinary income
|
$387,947
|
$148,223
|
As of November 30, 2023, the components of distributable earnings on a tax basis were as follows:
|
Cost of investments
|
$
|
136,085,326
|
||
|
Gross tax unrealized appreciation
|
65,697,487
|
|||
|
Gross tax unrealized depreciation
|
(2,163,536
|
)
|
||
|
Net unrealized appreciation (depreciation)
|
63,533,951
|
|||
|
Undistributed ordinary income
|
1,722,901
|
|||
|
Undistributed long-term capital gain
|
1,213,205
|
|||
|
Total distributable earnings
|
2,936,106
|
|||
|
Other accumulated gain/(loss)
|
(132,791
|
)
|
||
|
Total accumulated gain/(loss)
|
$
|
66,337,266
|
30
GoodHaven Fund
|
NOTES TO FINANCIAL STATEMENTS November 30, 2023 (Continued)
|
|
NOTE 6 – OTHER MATTERS
|
Significant market disruptions, such as those caused by the COVID-19 (commonly referred to as “coronavirus”) pandemic, war (e.g., Russia’s invasion of
Ukraine, Israeli-Palestinian conflict), or other events, can adversely affect local and global markets and normal market operations. The COVID-19 pandemic caused significant economic disruption in recent years as countries worked to limit the
negative health impacts of the virus. While the virus appears to be entering an endemic stage, significant outbreaks or new variants present a continued risk to the global economy. The ultimate economic fallout from these disruptions and the
long-term impact on economies, markets, industries, and individual issuers, are not known. Continuing market volatility as a result of these or other events may have adverse effects on the Fund’s investments and lead to losses.
|
NOTE 7 – SUBSEQUENT EVENTS
|
In preparing these financial statements, the Fund has evaluated events and transactions for potential recognition or disclosure through the date the
financial statement were issued. The Fund declared a distribution from net investment income and net realized gain on securities payable on December 8, 2023. The distribution amount for the Fund was as follows:
|
Net Investment Income
|
Net Realized Gain
|
|
$1,843,138 ($0.36700719 per share)
|
$1,213,233 ($0.24158 per share)
|
31
GoodHaven Fund
|
REPORT OF INDEPENDENT REGISTERED PUBLIC ACCOUNTING FIRM
|
To the Shareholders and Board of Directors of GoodHaven Funds Trust
Opinion on the Financial Statements
We have audited the accompanying statement of assets and liabilities of GoodHaven Fund (the “Fund”), a series of GoodHaven Funds Trust, including the
schedule of investments, as of November 30, 2023, the related statement of operations for the year then ended, the statements of changes in net assets for each of the two years in the period then ended, financial highlights for each of the five years
in the period then ended, and the related notes (collectively referred to as the “financial statements”). In our opinion, the financial statements present fairly, in all material respects, the financial position of the Fund as of November 30, 2023,
the results of its operations for the year then ended, the changes in its net assets for each of the two years in the period then ended, and the financial highlights for each of the five years in the period then ended, in conformity with accounting
principles generally accepted in the United States of America.
Basis for Opinion
These financial statements are the responsibility of the Fund’s management. Our responsibility is to express an opinion on the Fund’s financial statements
based on our audits. We are a public accounting firm registered with the Public Company Accounting Oversight Board (United States) (“PCAOB”) and are required to be independent with respect to the Fund in accordance with the U.S. federal securities
laws and the applicable rules and regulations of the Securities and Exchange Commission and the PCAOB. We have served as the Fund’s auditor since 2011.
We conducted our audits in accordance with the standards of the PCAOB. Those standards require that we plan and perform the audits to obtain reasonable
assurance about whether the financial statements are free of material misstatement, whether due to error or fraud. The Fund is not required to have, nor were we engaged to perform, an audit of its internal control over financial reporting. As part
of our audits we are required to obtain an understanding of internal control over financial reporting, but not for the purpose of expressing an opinion on the effectiveness of the Fund’s internal control over financial reporting. Accordingly, we
express no such opinion.
Our audits included performing procedures to assess the risks of material misstatement of the financial statements, whether due to error or fraud, and
performing procedures that respond to those risks. Such procedures included examining, on a test basis, evidence regarding the amounts and disclosures in the financial statements. Our audits also included evaluating the accounting principles used
and significant estimates made by management, as well as evaluating the overall presentation of the financial statements. Our procedures included confirmation of securities owned as of November 30, 2023 by correspondence with the custodian and
brokers; when replies were not received from brokers, we performed other auditing procedures. We believe that our audits provide a reasonable basis for our opinion.
 |
|
|
TAIT, WELLER & BAKER LLP
|
Philadelphia, Pennsylvania
January 25, 2024
32
GoodHaven Fund
|
EXPENSE EXAMPLE For the Six Months Ended November 30, 2023 (Unaudited)
|
As a shareholder of the Fund you incur two types of costs: (1) transaction costs and (2) ongoing costs, including management fees and support services
fees. This example is intended to help you understand your ongoing costs (in dollars) of investing in the Fund and to compare these costs with the ongoing costs of investing in other mutual funds. The example is based on an investment of $1,000
invested at the beginning of the period and held for the entire period (June 1, 2023 – November 30, 2023).
Actual Expenses
The “Actual” line of the following table provides information about actual account values based on actual returns and actual expenses. Although the Fund
charges no sales load, you will be assessed fees for outgoing wire transfers, returned checks, and stop payment orders at prevailing rates charged by Fund Services, the Fund’s transfer agent. If you request that a redemption be made by wire transfer,
currently the Fund’s transfer agent charges a $15.00 fee. Individual Retirement Accounts will be charged a $15.00 annual maintenance fee. To the extent the Fund invests in shares of other investment companies as part of its investment strategy, you
will indirectly bear your proportionate share of any fees and expenses charged by the underlying funds in which the Fund invests, in addition to the expenses of the Fund. Actual expenses of the underlying funds may vary. These expenses are not
included in the example. The example includes management fees and support services. However, the example does not include portfolio trading commissions and related expenses. You may use the information in this line, together with the amount you
invested, to estimate the expenses that you paid over the period. Simply divide your account value by $1,000 (for example, an $8,600 account value divided by $1,000 = 8.6). Then, multiply the result by the number in the first line under the heading
entitled “Expenses Paid During the Period” to estimate the expenses you paid on your account during this period.
Hypothetical Example for Comparison Purposes
The “Hypothetical” line of the following table provides information about hypothetical account values based on a hypothetical return and hypothetical
expenses based on the Fund’s actual expense ratio and an assumed rate of return of 5% per year before expenses, which is not the Fund’s actual return. The hypothetical account values and expenses may not be used to estimate the actual ending account
balance or expenses you paid for the period. You may use this information to compare the ongoing costs of investing in the Fund with those of other funds. To do so, compare this 5% hypothetical example with the 5% hypothetical examples that appear in
the shareholder reports of the other funds. Please note that the expenses shown in the table are meant to highlight your ongoing costs only and do not reflect any transaction costs. Therefore, the second line of the table is useful in comparing
ongoing costs only and will not help you
33
GoodHaven Fund
|
EXPENSE EXAMPLE For the Six Months Ended November 30, 2023 (Unaudited) (Continued)
|
determine the relative total costs of owning different funds. If these transaction costs were included, your costs would have been higher.
|
Expenses Paid
|
|||
|
Beginning
|
Ending
|
During the Period
|
|
|
Account Value
|
Account Value
|
June 1, 2023 –
|
|
|
June 1, 2023
|
November 30, 2023
|
November 30, 2023 1,2
|
|
|
Actual
|
$1,000.00
|
$1,131.40
|
$5.88
|
|
Hypothetical
|
|||
|
(5% annual return
|
|||
|
before expenses)
|
$1,000.00
|
$1,019.55
|
$5.57
|
|
1
|
The calculations are based on expenses incurred during the most recent six-month period. The annualized six month expense ratio for the Fund during that period was 1.10%. The dollar amounts shown as expenses
paid during the period are equal to the annualized six-month expense ratio multiplied by the average account value during the period, multiplied by 183/365 (to reflect the half-year period).
|
|
2
|
The calculations do not reflect any transaction costs. Prior to November 1, 2023, the Fund charged a 2.00% redemption fee on shares held less than 60 days.
|
34
GoodHaven Fund
|
APPROVAL OF INVESTMENT ADVISORY AGREEMENT (Unaudited)
|
At a meeting held on October 18, 2023 the Board of Trustees of the Trust (the “Board”) (which is comprised of five persons, one of whom is an Interested
Trustee, as defined under the Investment Company Act of 1940) considered and approved an Investment Advisory Agreement (the “Advisory Agreement”) for the GoodHaven Fund (the “Fund”) between the GoodHaven Funds Trust (the “Trust”) and GoodHaven
Capital Management, LLC (the “Adviser”). At the meeting, the Board received and reviewed substantial information regarding the Fund, the Adviser and the services to be provided by the Adviser to the Fund under the Advisory Agreement. This
information formed the primary (but not exclusive) basis for the Board’s determinations. Below is a summary of the factors considered by the Board and the conclusions that formed the basis for the Board’s approval of the continuance of the Advisory
Agreement:
Nature, Extent and Quality of Service. The Board, including the Independent Trustees, noted
that the Adviser will continue to provide all investment research and analysis, portfolio management and execution decisions for the Fund. The Board reviewed the background information of the key investment personnel who will be responsible for
servicing the Fund. The Board recognized that the managing member of the portfolio has over 25 years of experience in executive management positions with various advisory firms as well as a decades-long successful career as an analyst and portfolio
manager. Securities research involves a variety of activities, including, but not limited to, review of financial statements, analyst reports, interviews with executives, customers, and suppliers, review of analyst reports, retention of third-party
research personnel where the Adviser believes additional value can be added, and other activities and their services are conducted in a professional and high-quality manner, consistent with industry practices. The Board discussed the Adviser’s risk
management policies and procedures to manage and control the risks associated with providing investment advisory services to the Fund. The Board noted that the Adviser maintains controls in place to minimize risks associated with trading,
allocations, trade reviews, conflicts of interest and other risks. The Adviser also has specific statutory guidelines with respect to portfolio concentration as well as internal guidelines designed to limit risks attributable to a single security.
The Board considered the financial condition and operations of the Adviser during the COVID-19 pandemic and noted that there had been no material disruption of the Adviser’s service to the Fund and that the Adviser had continued to provide the same
level, quality and extent of services to the Fund. The Board concluded that the Adviser continues to provide a high quality of service to the Fund for the benefit of the Fund and its shareholders and that the nature, overall quality and extent of the
advisory services provided by the Adviser to the Fund were satisfactory and reliable.
35
GoodHaven Fund
|
APPROVAL OF INVESTMENT ADVISORY AGREEMENT (Unaudited) (Continued)
|
Performance of the Fund. The Board reviewed the performance of the Fund and discussed the
performance relative to its peer group, Morningstar category and index. The Adviser noted as previously described to the Board that from inception in April 2011 through May 31, 2014 the Fund either matched or exceeded most broad equity indexes
despite large cash inflows and a substantial cash balance during a period of mostly rising markets. The Board recognized that the Fund materially underperformed the large-cap equity indexes for the period from mid-2014 through the end of 2015 due to
a record percentage decline in certain equities with commodity exposure in which the Fund held investments. The Board noted that during the initial period, the Fund matched or exceeded most equity indexes despite very large cash inflows during a
period of rising markets, far exceeding returns on most hedge funds and low-risk alternatives, and generated an absolute return of 13.43% annualized during a period of zero interest rates. The Board also noted that during the second period, the Fund
suffered weak absolute and relative performance (-23.55% vs the S&P 500 Index +11.56%), which the Adviser believes may be attributable to a few specific securities and non-recurring factors, notably, the worst-ever two-year decline in oil prices,
a rapid strengthening of the U.S. dollar, and an increase in regulatory activity in the mortgage servicing business. It was recognized that following that period, the Fund showed positive returns (+22.58% vs the S&P 500 Index +54.57%) through
June 20, 2019 that lagged below some equity indexes (largely due to a sizeable cash holding) but which exceeded short-term low-risk fixed income and most hedge funds. Moreover, the Board noted that this period encompassed large overall outflows from
the Fund, making portfolio management much more difficult, which is believed to have also affected performance as can be seen by comparison to similarly managed accounts. The Board noted that from December 31, 2019 through May 31, 2023, the Fund was
up 10.96% versus the S&P 500 Index which was up 9.59%.
The Board stated that it remains confident in the Adviser and its strategies for the Fund and expects positive long-term performance. After further
discussion, the Board concluded that current performance of the Fund, taken as a whole and given external conditions, was satisfactory.
Investment Advisory Fee and Expenses. The Board discussed the current advisory fee paid by the
Fund. The Board considered a comparison of the Fund’s contractual advisory fee structure to many funds within its peer group and noted that the Fund’s fee structure was fair and competitive. Additionally, the Independent Trustees recognized that the
fee levels are appropriate, given the Fund’s size, history, performance and operations. After further discussion, the Board concluded that the proposed advisory fee with respect to the Fund was not unreasonable.
36
GoodHaven Fund
|
APPROVAL OF INVESTMENT ADVISORY AGREEMENT (Unaudited) (Continued)
|
Economies of Scale. The Board considered the economies of scale and noted that the Fund has yet
to achieve a sufficient amount of assets to warrant a discussion on economies of scale. Further, the Board noted that the Fund had set fees at inception anticipating scale benefits that have not yet occurred, causing the Adviser to bear early losses
which it did not seek to recover from the Fund and benefitting shareholders despite the lack of scale. The Adviser agreed with the Board that they should consider breakpoints when asset levels for the Fund reach appropriate levels. After discussion,
the Board agreed that based on the current size of the Fund, it does not appear that economies of scale have not been reached at this time; however, the matter would be revisited in the future should the size of the Fund increase materially.
Profitability. The Board reviewed the Adviser’s financial statements and allocation of
expenses. The Board noted that the Adviser receives an advisory fee of 0.90% and a support servicing fee of 0.20% for a total fee of 1.10% from the Fund, which is a comparable fee to the Fund’s peer group. After discussion, the Trustees concluded
that the Adviser’s current profitability was not excessive and, that the Adviser’s profitability with respect to the Fund is reasonable in light of the services provided to the Fund.
Conclusion. Having requested and received information from the Adviser as the Board believed to
be reasonably necessary to evaluate the terms of the Investment Advisory Agreement, and after considering the Gartenberg factors with the assistance and advice of counsel, the Board concluded that the fee structure is fair and reasonable and that
approval of the Investment Advisory Agreement is in the best interests of the Fund and its shareholders.
37
GoodHaven Fund
|
STATEMENT REGARDING LIQUIDITY RISK MANAGEMENT PROGRAM (Unaudited)
|
The Fund has adopted a liquidity risk management program (the “program”). The Board has designated the Advisor’s Chief Executive Officer to serve as the
administrator of the program. The Program Administrator conducts the day-to-day operation of the program pursuant to the Advisor’s policies and procedures. Under the program, the Program Administrator manages the Fund’s liquidity risk, which is the
risk that the Fund could not meet shareholder redemption requests without significant dilution of remaining shareholders’ interests in the Fund. This risk is managed by monitoring the degree of liquidity of the Fund’s investments, limiting the amount
of the Fund’s illiquid investments, and utilizing various risk management tools and facilities available to the Fund for meeting shareholder redemptions, among other means. The Program Administrator process of determining the degree of liquidity of
the Fund’s investments is supported by one or more third-party liquidity assessment vendors. The Board reviewed a report prepared by the Advisor regarding the operation and effectiveness of the program for the period January 1, 2023 through December
31, 2023. No significant liquidity events impacting the Fund were noted in the report. In addition, the Program Administrator provided its assessment that the program had been effective in managing the Fund’s liquidity risk.
38
GoodHaven Fund
|
TRUSTEES AND EXECUTIVE OFFICERS
|
The Board is responsible for the overall management of the Trust, including general supervision and review of the investment activities of the Fund. The
Board, in turn, elects the officers of the Trust, who are responsible for the day-to-day operations of the Trust and its separate series. The current Trustees and executive officers of the Trust, their birth dates, positions with the Trust, terms of
office with the Trust and length of time served, their principal occupations during the past five years and other directorships are set forth in the table below.
|
Term of
|
Number of
|
||||
|
Office
|
Portfolios
|
Other
|
|||
|
Position
|
and
|
in New Fund
|
Directorships
|
||
|
with
|
Length
|
Complex
|
Held During
|
||
|
Name, Address
|
the New
|
of Time
|
Principal Occupation
|
Overseen by
|
the Past
|
|
and Age
|
Trust
|
Served
|
During Past Five Years
|
Trustees
|
5 Years
|
|
Independent Trustees of the Trust
|
|||||
|
Richard A. Conn, Jr.
|
Trustee
|
Indefinite
|
Managing Partner,
|
1
|
None
|
|
c/o GoodHaven Capital
|
Term;
|
Innovate Partners LLC
|
|||
|
Management LLC
|
Since
|
(private investment
|
|||
|
374 Millburn Avenue,
|
January
|
company) (2009 to present)
|
|||
|
Suite 306
|
2016
|
||||
|
Millburn, NJ 07041
|
|||||
|
Born: 1957
|
|||||
|
Bruce A. Eatroff
|
Trustee
|
Indefinite
|
Founding Partner, Halyard
|
1
|
None
|
|
c/o GoodHaven Capital
|
Term;
|
Capital (private equity firm)
|
|||
|
Management LLC
|
Since
|
(2006 to present);
|
|||
|
374 Millburn Avenue,
|
January
|
Managing Director,
|
|||
|
Suite 306
|
2016
|
Investment Committee
|
|||
|
Millburn, NJ 07041
|
member, Star Mountain
|
||||
|
Born: 1963
|
Capital (2020 to present)
|
||||
|
Steven H. Tishman*
|
Trustee
|
Indefinite
|
Managing Director and
|
1
|
Director,
|
|
c/o GoodHaven Capital
|
Term;
|
Global Head of Mergers
|
Acushnet
|
||
|
Management LLC
|
Since
|
and Acquisitions Group,
|
Holdings
|
||
|
374 Millburn Avenue,
|
January
|
Houlihan Lokey (global
|
Corp.
|
||
|
Suite 306
|
2016
|
investment bank)
|
|||
|
Millburn, NJ 07041
|
(2012 to present)
|
||||
|
Born: 1957
|
|||||
39
GoodHaven Fund
|
TRUSTEES AND EXECUTIVE OFFICERS (Continued)
|
|
Term of
|
Number of
|
||||
|
Office
|
Portfolios
|
Other
|
|||
|
Position
|
and
|
in New Fund
|
Directorships
|
||
|
with
|
Length
|
Complex
|
Held During
|
||
|
Name, Address
|
the New
|
of Time
|
Principal Occupation
|
Overseen by
|
the Past
|
|
and Age
|
Trust
|
Served
|
During Past Five Years
|
Trustees
|
5 Years
|
|
Allison Nagelberg
|
Trustee
|
Indefinite
|
Northeast Director of
|
1
|
None
|
|
c/o GoodHaven Capital
|
Term;
|
Planned Giving, Jewish
|
|||
|
Management LLC
|
Since
|
National Fund USA
|
|||
|
374 Millburn Avenue,
|
July 2023
|
(charitable organization)
|
|||
|
Suite 306
|
(July 2022 to present);
|
||||
|
Millburn, NJ 07041
|
Director, Global
|
||||
|
Born: 1964
|
Connections, Jewish
|
||||
|
Federation of Greater
|
|||||
|
MetroWest NJ (charitable
|
|||||
|
organization) (May 2021 to
|
|||||
|
June 2022); General Counsel,
|
|||||
|
Monmouth Real Estate
|
|||||
|
Investment Corp. (public
|
|||||
|
REIT) (2000 to 2019);
|
|||||
|
General Counsel, UMH
|
|||||
|
Properties Inc. (public
|
|||||
|
REIT) (2000 to 2013),
|
|||||
|
General Counsel, Monmouth
|
|||||
|
Capital Corporation
|
|||||
|
(public REIT) (2000 to 2007)
|
|||||
|
Interested Trustees and Officers of the Trust
|
|||||
|
Larry Pitkowsky
|
Trustee,
|
Indefinite
|
Managing Partner and
|
1
|
None
|
|
c/o GoodHaven Capital
|
President
|
Term;
|
Portfolio Manager,
|
||
|
Management LLC
|
and
|
Since
|
GoodHaven Fund and
|
||
|
374 Millburn Avenue,
|
Chairman
|
January
|
GoodHaven Capital
|
||
|
Suite 306
|
2016
|
Management, LLC
|
|||
|
Millburn, NJ 07041
|
(Advisor) (Since
|
||||
|
Born: 1964
|
December 2, 2019);
|
||||
|
Co-Portfolio Manager of
|
|||||
|
GoodHaven Fund and
|
|||||
|
Co-Managing Partner of
|
|||||
|
GoodHaven Capital
|
|||||
|
Management (2010 to
|
|||||
|
December 1, 2019)
|
|||||
|
Lynn Iacona
|
Secretary
|
Indefinite
|
Director of Operations,
|
N/A
|
None
|
|
c/o GoodHaven Capital
|
and
|
Term;
|
GoodHaven Capital
|
||
|
Management LLC
|
Treasurer
|
Since
|
Management LLC
|
||
|
374 Millburn Avenue,
|
December
|
(Advisor)
|
|||
|
Suite 306
|
2019
|
||||
|
Millburn, NJ 07041
|
|||||
|
Born: 1972
|
|||||
40
GoodHaven Fund
|
TRUSTEES AND EXECUTIVE OFFICERS (Continued)
|
|
Term of
|
Number of
|
||||
|
Office
|
Portfolios
|
Other
|
|||
|
Position
|
and
|
in New Fund
|
Directorships
|
||
|
with
|
Length
|
Complex
|
Held During
|
||
|
Name, Address
|
the New
|
of Time
|
Principal Occupation
|
Overseen by
|
the Past
|
|
and Age
|
Trust
|
Served
|
During Past Five Years
|
Trustees
|
5 Years
|
|
Bernadette Murphy
|
Chief
|
Indefinite
|
Director, Vigilant
|
N/A
|
None
|
|
Vigilant
|
Compli-
|
Term;
|
Compliance, LLC from
|
||
|
Compliance, LLC
|
ance
|
Since
|
July 2018 to present;
|
||
|
374 Millburn Avenue,
|
Officer
|
December
|
Director of Compliance
|
||
|
Suite 306
|
2019
|
and Operations, B. Riley
|
|||
|
Millburn, NJ 07041
|
Dialectic Capital
|
||||
|
Born: 1964
|
Management, LLC from
|
||||
|
April 2017 to July 2018;
|
|||||
|
Chief Compliance Officer,
|
|||||
|
Dialectic Capital
|
|||||
|
Management, LP from
|
|||||
|
October 2015 to April 2017;
|
|||||
|
Vice President
|
|||||
|
Administration/
|
|||||
|
Compliance Manager from
|
|||||
|
2013 to 2015, Dialectic
|
|||||
|
Capital Management, LLC
|
|
*
|
Steven Tishman resigned as a Trustee effective October 18, 2023.
|
41
GoodHaven Fund
|
ADDITIONAL INFORMATION (Unaudited)
|
|
INFORMATION ABOUT PROXY VOTING
|
A description of the policies and procedures that the Fund uses to determine how to vote proxies relating to portfolio securities is available without
charge, upon request, by calling toll-free at (855) 654-6639 and on the Fund’s website at www.goodhavenfunds.com. Furthermore, you can obtain the description on the SEC’s website at www.sec.gov.
Information regarding how the Fund voted proxies relating to portfolio securities during the most recent 12-month period ended June 30 is available without
charge, upon request, by calling (855) 654-6639 or through the SEC’s website at www.sec.gov.
|
INFORMATION ABOUT THE PORTFOLIO HOLDINGS
|
The Fund files its complete schedule of portfolio holdings for the first and third quarters with the SEC on Form N-PORT. The Fund’s Form N-PORT may be
reviewed and copied at the SEC’s Public Reference Room in Washington D.C. Information on the operation of the Public Reference Room may be obtained by calling (800) SEC-0330. The Fund’s Form N-PORT is available without charge, upon request, by
calling (855) 654-6639. Furthermore, you can obtain the Form N-Q on the SEC’s website at www.sec.gov.
|
HOUSEHOLDING
|
In an effort to decrease costs, the Fund will reduce the number of duplicate Prospectuses and annual and semi-annual reports that you receive by sending
only one copy of each to those addresses shown by two or more accounts. Please call the transfer agent toll free at (855) 654-6639 to request individual copies of these documents. The Fund will begin sending individual copies thirty days after
receiving your request. This policy does not apply to account statements.
42
GoodHaven Fund
|
ADDITIONAL INFORMATION (Unaudited) (Continued)
|
|
INFORMATION ABOUT THE FUND’S TRUSTEES
|
The Statement of Additional Information (“SAI”) includes additional information about the Fund’s Trustees and is available without charge, upon request, by
calling (855) 654-6639. Furthermore, you can obtain the SAI on the SEC’s website at www.sec.gov or the Fund’s website at www.goodhavenfunds.com.
|
FEDERAL TAX INFORMATION
|
For the year ended November 30, 2023, certain dividends paid by the Fund may be subject to a maximum tax rate of 23.8%, as provided for by the Jobs and
Growth Tax Relief Reconciliation Act of 2003 and the Tax Cuts and Jobs Act of 2017. The percentage of dividends declared from ordinary income designated as qualified dividend income was 100.00%. For corporate shareholders, the percent of ordinary
income distributions qualifying for the corporate dividends received deduction for the year ended November 30, 2023 was 100.00%.
43
GoodHaven Fund
|
PRIVACY NOTICE (Unaudited)
|
|
FACTS
|
WHAT DOES GOODHAVEN CAPITAL MANAGEMENT, LLC &
|
|
GOODHAVEN FUND DO WITH YOUR PERSONAL INFORMATION?
|
|
|
Why?
|
Financial companies choose how they share your personal information. Federal law gives consumers the right to limit some but not all sharing.
Federal law also requires us to tell you how we collect, share, and protect your personal information. Please read this notice carefully to understand what we do.
|
|
What?
|
The types of personal information we collect and share depend on the product or service you have with us. This information can include:
|
|
|
• Social Security number and Income
|
|
|
• Account Balances and Employment Information
|
|
|
• Assets and Investment Experience
|
|
|
When you are no longer our customer, we continue to share
your information as described in this notice.
|
|
How?
|
All financial companies need to share customer’s personal information to run their everyday business. In the section below, we list the reasons
financial companies can share their customer’s personal information; the reasons GoodHaven chooses to share; and whether you can limit this sharing.
|
|
Reasons we can share your
|
Does GoodHaven
|
Can you limit
|
|
personal information
|
share?
|
this sharing?
|
|
For our everyday business purposes—
|
||
|
such as to process your transactions, maintain
|
||
|
your account(s), respond to court orders and
|
Yes
|
No
|
|
legal investigations, or report to credit bureaus
|
||
|
For our marketing purposes—
|
||
|
to offer our products and services to you
|
Yes
|
No
|
|
For joint marketing with
|
||
|
other financial companies
|
No
|
We don’t share
|
|
For our affiliates’ everyday
|
||
|
business purposes—
|
||
|
information about your
|
Yes
|
Yes
|
|
transactions and experiences
|
||
|
For our affiliates’ everyday
|
||
|
business purposes—
|
||
|
information about your creditworthiness
|
Yes
|
Yes
|
|
For nonaffiliates to market to you
|
No
|
We don’t share
|
|
Questions?
|
Call (305) 677-7650 or email info@goodhavenllc.com
|
44
GoodHaven Fund
|
PRIVACY NOTICE (Unaudited) (Continued)
|
|
Who we are
|
|
|
Who is providing
|
GoodHaven Capital Management, LLC
|
|
this notice?
|
GoodHaven Fund (collectively “GoodHaven”)
|
|
What we do
|
|
|
How does
|
To protect your personal information from unauthorized
|
|
GoodHaven
|
access and use, we use security measures that comply
|
|
protect
|
with federal law. These measures include computer safeguards
|
|
my personal
|
and secured files and buildings.
|
|
information?
|
Our service providers must represent to us that they will protect any personal information through similar safeguards and security.
|
|
How does
|
We collect your personal information, for example, when you
|
|
GoodHaven
|
• open an account or give us your income
|
|
collect my
|
• give us contact information or seek advice about your
|
|
personal
|
investments
|
|
information?
|
• tell us about your investments or retirement portfolio
|
|
Why can’t I
|
Federal law gives you the right to limit only
|
|
limit all sharing?
|
• sharing for affiliates’ everyday business purposes—information about your creditworthiness
|
|
|
• affiliates from using your information to market to you
|
|
|
• sharing for nonaffiliates to market you
|
|
|
State laws and individual companies may give you additional rights to limit sharing.
|
|
Definitions
|
|
|
Affiliates
|
Companies related by common ownership or control. They can be financial and nonfinancial companies.
|
|
|
• Our affiliates include: a series of a registered investment company called the GoodHaven Fund (a no-load mutual fund).
|
|
Nonaffiliates
|
Companies not related by common ownership or control. They can be financial and nonfinancial companies.
|
|
|
• We do not share with nonaffiliates so they can market to you.
|
|
Joint marketing
|
A formal agreement between nonaffiliated financial companies that together market financial products or services to you.
|
|
|
• We do not jointly market with nonaffiliated financial companies.
|
|
Other important information
|
|
45
GoodHaven Fund
Advisor
GOODHAVEN CAPITAL MANAGEMENT, LLC
374 Millburn Avenue, Suite 306
Millburn, New Jersey 07041
Distributor
QUASAR DISTRIBUTORS, LLC
111 East Kilbourn Avenue, Suite 2200
Milwaukee, Wisconsin 53202
Custodian
U.S. BANK N.A.
Custody Operations
1555 North RiverCenter Drive, Suite 302
Milwaukee, Wisconsin 53212
Transfer Agent, Fund Accountant & Fund Administrator
U.S. BANCORP FUND SERVICES, LLC
615 East Michigan Street
Milwaukee, Wisconsin 53202
1-855-OK-GOODX
(1-855-654-6639)
Independent Registered Public Accounting Firm
TAIT WELLER
Two Liberty Place
50 South 16th Street, Suite 2900
Philadelphia, Pennsylvania 19102
Legal Counsel
BLANK ROME LLP
1271 Avenue of the Americas
New York, New York 10020
GoodHaven Fund
855-OK-GOODX (855-654-6639)
www.goodhavenfunds.com
Symbol – GOODX
CUSIP – 38217G103
|
(b)
|
Not applicable.
|
Item 2. Code of Ethics.
The registrant has adopted a code of ethics that applies to the registrant’s principal executive officer and principal financial officer. The registrant has not made any amendments to its code of ethics during the period covered by this
report. The registrant has not granted any waivers from any provisions of the code of ethics during the period covered by this report.
A copy of the registrant’s Code of Ethics is filed herewith.
Item 3. Audit Committee Financial Expert.
The registrant’s Board of Trustees of the Trust has determined that there is at least one audit committee financial expert serving on its audit committee. Mr. Bruce Eatroff is an “audit committee financial expert” and is
considered to be “independent” as each term is defined in Item 3 of Form N-CSR.
Item 4. Principal Accountant Fees and Services.
The registrant has engaged its principal accountant to perform audit services, audit-related services, tax services and other services during the past two fiscal years. “Audit services” refer to performing an audit of the registrant's annual
financial statements or services that are normally provided by the accountant in connection with statutory and regulatory filings or engagements for those fiscal years. “Audit-related services” refer to the assurance and related services by the
principal accountant that are reasonably related to the performance of the audit. “Tax services” refer to professional services rendered by the principal accountant for tax compliance, tax advice, and tax planning. There were no “Other services”
provided by the principal accountant. The following table details the aggregate fees billed or expected to be billed for each of the last two fiscal years for audit fees, audit-related fees, tax fees and other fees by the principal accountant.
|
|
GoodHaven Fund
|
|
FYE 11/30/2023
|
FYE 11/30/2022
|
|
|
(a) Audit Fees
|
$19,000
|
$19,000
|
|
(b) Audit-Related Fees
|
N/A
|
N/A
|
|
(c) Tax Fees
|
$2,600
|
$2,600
|
|
(d) All Other Fees
|
N/A
|
N/A
|
(e)(1) The audit committee has adopted pre-approval policies and procedures that require the audit committee to pre‑approve all audit and non‑audit services of the registrant, including services provided to any entity affiliated with the
registrant.
(e)(2) The percentage of fees billed by Tait, Weller & Baker LLP applicable to non-audit services pursuant to waiver of pre-approval requirement were as follows:
|
FYE 11/30/2023
|
FYE 11/30/2022
|
|
|
Audit-Related Fees
|
0%
|
0%
|
|
Tax Fees
|
0%
|
0%
|
|
All Other Fees
|
0%
|
0%
|
(f) Not applicable
(g) The following table indicates the non-audit fees billed or expected to be billed by the registrant’s accountant for services to the registrant and to the registrant’s investment advisor (and any other
controlling entity, etc.—not sub-advisor) for the last two years.
GoodHaven Fund
|
Non-Audit Related Fees
|
FYE 11/30/2023
|
FYE 11/30/2022
|
|
Registrant
|
N/A
|
N/A
|
|
Registrant’s Investment Advisor
|
N/A
|
N/A
|
(h) The audit committee of the board of trustees/directors has considered whether the provision of non-audit services that were rendered to the registrant's investment advisor is compatible with maintaining the principal accountant's
independence and has concluded that the provision of such non-audit services by the accountant has not compromised the accountant’s independence.
(i) The registrant has not been identified by the U.S. Securities and Exchange Commission as having filed an annual report issued by a registered public accounting firm branch or office that is located in a foreign jurisdiction where the Public
Company Accounting Oversight Board is unable to inspect or completely investigate because of a position taken by an authority in that jurisdiction.
(j) The registrant is not a foreign issuer.
Item 5. Audit Committee of Listed Registrants.
Not applicable to registrants who are not listed issuers (as defined in Rule 10A-3 under the Securities Exchange Act of 1934).
Item 6. Schedule of Investments.
(a) Schedule of Investments is included as part of the report to shareholders filed under Item 1 of this Form.
(b) Not applicable.
Item 7. Disclosure of Proxy Voting Policies and Procedures for Closed-End Management Investment Companies.
Not applicable to open-end investment companies.
Item 8. Portfolio Managers of Closed-End Management Investment Companies
Not applicable to open-end investment companies.
Item 9. Purchases of Equity Securities by Closed‑End Management Investment Company and Affiliated Purchasers.
Not applicable to open-end investment companies.
Item 10. Submission of Matters to a Vote of Security Holders.
There have been no material changes to the procedures by which shareholders may recommend nominees to the registrant’s board of trustees.
Item 11. Controls and Procedures.
|
(a)
|
The Registrant’s Principal Executive Officer and Principal Financial and Accounting Officer have reviewed the Registrant's disclosure controls and procedures (as defined in Rule 30a-3(c) under the Investment Company Act of 1940 (the
“Act”)) as of a date within 90 days of the filing of this report, as required by Rule 30a-3(b) under the Act and Rules 13a-15(b) or 15d‑15(b) under the Securities Exchange Act of 1934. Based on their review, such officers have concluded
that the disclosure controls and procedures are effective in ensuring that information required to be disclosed in this report is appropriately recorded, processed, summarized and reported and made known to them by others within the
Registrant and by the Registrant’s service provider.
|
|
(b)
|
There were no significant changes in the Registrant's internal control over financial reporting (as defined in Rule 30a-3(d) under the Act) that occurred during the period covered by this report that has materially affected, or is
reasonably likely to materially affect, the Registrant's internal control over financial reporting.
|
Item 12. Disclosure of Securities Lending Activities for Closed-End Management Investment Companies
Not applicable to open-end investment companies.
Item 13. Exhibits.
(3) Any written solicitation to purchase securities under Rule 23c‑1 under the Act sent or given during the period covered by the report by or on behalf of the registrant to 10 or
more persons. Not applicable to open-end investment companies.
(4) Change in the registrant’s independent public accountant. There was no change in the registrant’s independent public accountant for the period covered by this report.
SIGNATURES
Pursuant to the requirements of the Securities Exchange Act of 1934 and the Investment Company Act of 1940, the registrant has duly caused this report to be signed on its behalf by the undersigned, thereunto duly
authorized.
(Registrant) GoodHaven Funds Trust
By (Signature and Title) /s/Larry Pitkowsky
Larry Pitkowsky, President and Principal Executive Officer
Date January 30, 2024
Pursuant to the requirements of the Securities Exchange Act of 1934 and the Investment Company Act of 1940, this report has been signed below by the following persons on behalf of the registrant and in the capacities
and on the dates indicated.
By (Signature and Title) /s/Larry Pitkowsky
Larry Pitkowsky, President and Principal Executive Officer
Date January 30, 2024
By (Signature and Title) /s/Lynn Iacona
Lynn Iacona, Treasurer and Principal Financial Officer
Date January 30, 2024