UNITED STATES
SECURITIES AND EXCHANGE COMMISSION
Washington, D.C. 20549
FORM N-CSR
CERTIFIED SHAREHOLDER REPORT OF REGISTERED
MANAGEMENT INVESTMENT COMPANIES
Investment Company Act file number: 811-23117
JPMorgan Trust IV
(Exact name of registrant as specified in charter)
277 Park Avenue
New York, NY 10172
(Address of principal executive offices) (Zip code)
Gregory S. Samuels
277 Park Avenue
New York, NY 10172
(Name and Address of Agent for Service)
Registrant’s telephone number, including area code: (800) 480-4111
Date of fiscal year end: October 31
Date of reporting period: November 1, 2021 through October 31, 2022
Form N-CSR is to be used by management investment companies to file reports with the Commission not later than 10 days after the transmission to stockholders of any report that is required to be transmitted to stockholders under Rule 30e-1 under the Investment Company Act of 1940 (17 CFR 270.30e-1). The Commission may use the information provided on Form N-CSR in its regulatory, disclosure review, inspection, and policymaking roles.
A registrant is required to disclose the information specified by Form N-CSR, and the Commission will make this information public. A registrant is not required to respond to the collection of information contained in Form N-CSR unless the Form displays a currently valid Office of Management and Budget (“OMB”) control number. Please direct comments concerning the accuracy of the information collection burden estimate and any suggestions for reducing the burden to Secretary, Securities and Exchange Commission, 450 Fifth Street, NW, Washington, DC 20549-0609. The OMB has reviewed this collection of information under the clearance requirements of 44 U.S.C. Section 3507.
ITEM 1. REPORTS TO STOCKHOLDERS.
a.) The following is a copy of the report transmitted to shareholders pursuant to Rule 30e-1 under the Investment Company Act of 1940 (17 CFR 270.30e-1).
b.) A copy of the notice transmitted to shareholders in reliance on Rule 30e-3 under the 1940 Act that contains disclosures specified by paragraph (c)(3) of that rule is included in the Annual Report. Not Applicable. Notices do not incorporate disclosures from the
shareholder reports.
| JPMorgan Emerging Markets Equity Fund |
| JPMorgan Emerging Markets Research Enhanced Equity Fund |
| JPMorgan Europe Dynamic Fund |
| JPMorgan International Equity Fund |
| JPMorgan International Focus Fund |
| JPMorgan International Hedged Equity Fund |
| JPMorgan International Value Fund |

| |
|
| 1 | |
| 2 | |
| | |
| 3 | |
| 7 | |
| 10 | |
| 13 | |
| 16 | |
| 19 | |
| 23 | |
| 26 | |
| 53 | |
| 78 | |
| 96 | |
| 118 | |
| 119 | |
| 123 | |
| 125 | |
| 129 | |
| 134 | |
| |
Past performance is no guarantee of future performance. The general market views expressed in this report are opinions based on market and other conditions through the end of the reporting period and are subject to change without notice. These views are not intended to predict the future performance of a Fund or the securities markets.
Prospective investors should refer to the Funds’ prospectuses for a discussion of the Funds’ investment objectives, strategies and risks. Call J.P. Morgan Funds Service Center at 1-800-480-4111 for a prospectus containing more complete information about a Fund, including management fees and other expenses. Please read it carefully before investing.
December 15, 2022 (Unaudited)
 |
“While investors seek to adapt to the current market environment, we believe a well-diversified portfolio and a patient outlook remain crucial components of a successful invest- ment approach.” — Brian S. Shlissel |

President, J.P. Morgan Funds
J.P. Morgan Asset Management
1-800-480-4111 or www.jpmorganfunds.com for more information
| October 31, 2022 |
J.P. Morgan International Equity Funds |
1 |
TWELVE MONTHS ENDED October 31, 2022 (Unaudited)
| 2 |
J.P. Morgan International Equity Funds |
October 31, 2022 |
TWELVE MONTHS ENDED October 31, 2022 (Unaudited)
| REPORTING PERIOD RETURN: |
|
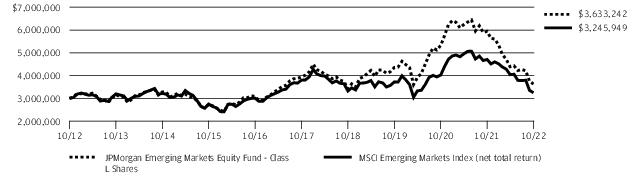
| Fund (Class L Shares) * |
(38.84)% |
| MSCI
Emerging Markets Index (net total return) |
(31.03)% |
| Net Assets as of 10/31/2022 (In Thousands) |
$7,154,996 |
| October 31, 2022 |
J.P. Morgan International Equity Funds |
3 |
TWELVE MONTHS ENDED October 31, 2022 (Unaudited) (continued)
| TOP TEN POSITIONS OF THE PORTFOLIO AS OF October 31,
2022 |
PERCENT OF TOTAL
INVESTMENTS | |
| 1. |
Taiwan Semiconductor Manufacturing Co. Ltd., ADR (Taiwan) |
6.9% |
| 2. |
Samsung Electronics Co. Ltd. (South Korea) |
6.2 |
| 3. |
Housing Development Finance Corp. Ltd. (India) |
3.4 |
| 4. |
MercadoLibre, Inc. (Brazil) |
3.3
|
| 5. |
HDFC Bank Ltd. (India) |
3.3 |
| 6. |
Tata Consultancy Services Ltd. (India) |
2.7
|
| 7. |
EPAM Systems, Inc. |
2.6 |
| 8. |
Bank Rakyat Indonesia Persero Tbk. PT (Indonesia) |
2.6
|
| 9. |
Kotak Mahindra Bank Ltd. (India) |
2.6 |
| 10. |
Tencent Holdings Ltd. (China) |
2.5
|
| PORTFOLIO COMPOSITION BY COUNTRY AS OF October 31,
2022 |
PERCENT OF TOTAL
INVESTMENTS |
| India |
24.9 % |
| China |
21.6
|
| Taiwan |
10.7 |
| South
Korea |
8.6
|
| Brazil |
8.0 |
| Hong
Kong |
5.7
|
| Indonesia |
5.1 |
| Mexico |
4.4
|
| United States |
3.7 |
| South
Africa |
2.5
|
| Portugal |
1.4 |
| Others
(each less than 1.0%) |
1.7
|
| Short-Term Investments |
1.7 |
| 4 |
J.P. Morgan International Equity Funds |
October 31, 2022 |
| |
INCEPTION
DATE OF CLASS |
1 YEAR |
5 YEAR |
10 YEAR |
| CLASS A SHARES |
September 28, 2001 |
|
|
|
| With Sales Charge * |
|
(42.26)% |
(3.00)% |
1.01% |
| Without Sales Charge |
|
(39.06) |
(1.94) |
1.55 |
| CLASS C SHARES |
February 28, 2006 |
|
|
|
| With CDSC ** |
|
(40.36) |
(2.44) |
1.15 |
| Without CDSC |
|
(39.36) |
(2.44) |
1.15 |
| Class I SHARES |
September 10, 2001 |
(38.91) |
(1.70) |
1.80 |
| Class L SHARES |
November 15, 1993 |
(38.84) |
(1.60) |
1.93 |
| Class R2 SHARES |
July 31, 2017 |
(39.24) |
(2.24) |
1.36 |
| Class R3 SHARES |
July 31, 2017 |
(39.08) |
(1.99) |
1.53 |
| Class R4 SHARES |
July 31, 2017 |
(38.93) |
(1.75) |
1.78 |
| Class R5 SHARES |
September 9, 2016 |
(38.86) |
(1.61) |
1.93 |
| Class R6 SHARES |
December 23, 2013 |
(38.78) |
(1.50) |
2.02 |
| | |
| * |
Sales Charge for Class A Shares is 5.25%. |
| ** |
Assumes a 1% CDSC (contingent deferred sales charge) for the one year period and 0% CDSC thereafter. |
| October 31, 2022 |
J.P. Morgan International Equity Funds |
5 |
TWELVE MONTHS ENDED October 31, 2022 (Unaudited) (continued)
| 6 |
J.P. Morgan International Equity Funds |
October 31, 2022 |
TWELVE MONTHS ENDED October 31, 2022 (Unaudited)
| REPORTING PERIOD RETURN: |
|
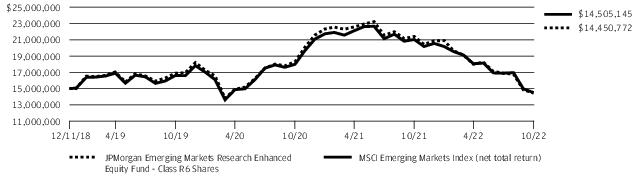
| Fund (Class R6 Shares) * |
(32.48)% |
| MSCI
Emerging Markets Index (net total return) |
(31.03)% |
| Net Assets as of 10/31/2022 (In Thousands) |
$2,650,568 |
Alinma Bank. Shares of Yandex, a Dutch e-commerce and taxi service provider not held in the Fund, fell amid investor concerns about its large exposure to Russia and the potential impact of multilateral sanctions on its business. Shares of Petrobras, Brazil’s state-controlled oil and gas producer, rose amid higher global energy prices. Shares of Alinma, a Saudi Arabian bank, rose amid investor expectations that rising global energy prices would benefit the broader Saudi Arabian economy.
| October 31, 2022 |
J.P. Morgan International Equity Funds |
7 |
TWELVE MONTHS ENDED October 31, 2022 (Unaudited) (continued)
| TOP TEN POSITIONS OF THE PORTFOLIO AS OF October 31,
2022 |
PERCENT OF TOTAL
INVESTMENTS | |
| 1. |
Taiwan Semiconductor Manufacturing Co. Ltd. (Taiwan) |
4.9% |
| 2. |
Samsung Electronics Co. Ltd. (South Korea) |
4.4 |
| 3. |
Tencent Holdings Ltd. (China) |
3.1 |
| 4. |
Alibaba Group Holding Ltd. (China) |
2.3
|
| 5. |
Reliance Industries Ltd. (India) |
1.9 |
| 6. |
Meituan (China) |
1.4
|
| 7. |
Infosys Ltd., ADR (India) |
1.4 |
| 8. |
ICICI Bank Ltd. (India) |
1.3
|
| 9. |
Housing Development Finance Corp. Ltd. (India) |
1.2 |
| 10. |
Petroleo Brasileiro SA (Preference) (Brazil) |
1.2
|
| PORTFOLIO COMPOSITION BY COUNTRY AS OF October 31,
2022 |
PERCENT OF TOTAL
INVESTMENTS |
| China |
26.9 % |
| India |
15.5
|
| South Korea |
12.6 |
| Taiwan |
12.4
|
| Brazil |
7.5 |
| Saudi
Arabia |
4.0
|
| South Africa |
4.0 |
| Mexico |
3.7
|
| Thailand |
2.6 |
| Indonesia |
2.3
|
| Malaysia |
1.3 |
| Qatar |
1.0
|
| United Arab Emirates |
1.0 |
| Others
(each less than 1.0%) |
3.1
|
| Short-Term Investments |
2.1 |
| 8 |
J.P. Morgan International Equity Funds |
October 31, 2022 |
| |
INCEPTION
DATE OF CLASS |
1
YEAR |
SINCE INCEPTION |
| Class I SHARES |
January 30, 2019 |
(32.53)% |
(1.05)% |
| Class R6 SHARES |
December 11, 2018 |
(32.48) |
(0.95) |
| October 31, 2022 |
J.P. Morgan International Equity Funds |
9 |
TWELVE MONTHS ENDED October 31, 2022 (Unaudited)
| REPORTING PERIOD RETURN: |
|
| Fund (Class A Shares, without a sales charge) *
|
(21.67)% |
| MSCI
Europe Index (net total return) |
(22.88)% |
| Net Assets as of 10/31/2022 (In Thousands) |
$539,581 |
| TOP TEN HOLDINGS OF THE PORTFOLIO AS OF October 31,
2022 |
PERCENT OF TOTAL
INVESTMENTS | |
| 1. |
Nestle SA (Registered) |
5.0% |
| 2. |
TotalEnergies SE (France) |
4.1
|
| 3. |
BP plc (United Kingdom) |
3.7 |
| 4. |
Novo Nordisk A/S, Class B (Denmark) |
3.6
|
| 5. |
Roche Holding AG |
3.4 |
| 6. |
Novartis AG (Registered) (Switzerland) |
3.2
|
| 7. |
LVMH Moet Hennessy Louis Vuitton SE (France) |
2.9 |
| 8. |
Koninklijke Ahold Delhaize NV (Netherlands) |
2.7
|
| 9. |
Glencore plc (Australia) |
2.3 |
| 10. |
Zurich Insurance Group AG (Switzerland) |
2.3
|
| PORTFOLIO COMPOSITION BY COUNTRY AS OF October 31,
2022 |
PERCENT OF TOTAL
INVESTMENTS |
| France |
18.8 % |
| Germany |
18.0
|
| United Kingdom |
17.2 |
| United
States |
10.9 |
| Denmark |
7.8 |
| Switzerland |
5.5
|
| Netherlands |
5.4 |
| Finland |
3.2
|
| Ireland |
3.1 |
| Sweden |
2.5
|
| Australia |
2.3 |
| Italy |
1.7
|
| Spain |
1.0 |
| Others
(each less than 1.0%) |
1.4
|
| Short-Term Investments |
1.2 |
| 10 |
J.P. Morgan International Equity Funds |
October 31, 2022 |
| October 31, 2022 |
J.P. Morgan International Equity Funds |
11 |
TWELVE MONTHS ENDED October 31, 2022 (Unaudited) (continued)
| |
INCEPTION
DATE OF CLASS |
1 YEAR |
5 YEAR |
10 YEAR |
| CLASS A SHARES |
November 2, 1995 |
|
|
|
| With Sales Charge * |
|
(25.78)% |
(1.72)% |
4.13% |
| Without Sales Charge |
|
(21.67) |
(0.66) |
4.69 |
| CLASS C SHARES |
November 1, 1998 |
|
|
|
| With CDSC ** |
|
(23.09) |
(1.16) |
4.28 |
| Without CDSC |
|
(22.09) |
(1.16) |
4.28 |
| Class I SHARES |
September 10, 2001 |
(21.48) |
(0.41) |
4.98 |
| Class L SHARES |
September 10, 2001 |
(21.39) |
(0.29) |
5.14 |
| Class R6 SHARES |
October 1, 2018 |
(21.31) |
(0.20) |
5.18 |
| | |
| * |
Sales Charge for Class A Shares is 5.25%. |
| ** |
Assumes a 1% CDSC (contingent deferred sales charge) for the one year period and 0% CDSC thereafter. |

| 12 |
J.P. Morgan International Equity Funds |
October 31, 2022 |
TWELVE MONTHS ENDED October 31, 2022 (Unaudited)
| REPORTING PERIOD RETURN: |
|
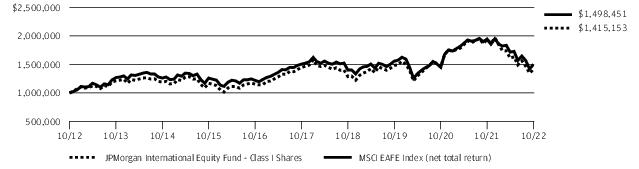
| Fund (Class I Shares) * |
(26.95)% |
| MSCI
EAFE Index (net total return) |
(23.00)% |
| Net Assets as of 10/31/2022 (In Thousands) |
$3,811,190 |
Shares of TotalEnergies, a French integrated petroleum and natural gas company, rose amid higher global energy prices during the period. Shares of DBS Group Holdings, a Singapore financial services provider, rose after the company reported earnings and revenue growth during the period. Shares of Novo Nordisk, a Danish pharmaceuticals and health care products company, rose after legislative efforts to cap insulin prices failed in the U.S. Congress.
| October 31, 2022 |
J.P. Morgan International Equity Funds |
13 |
TWELVE MONTHS ENDED October 31, 2022 (Unaudited) (continued)
| TOP TEN HOLDINGS OF THE PORTFOLIO AS OF October 31,
2022 |
PERCENT OF TOTAL
INVESTMENTS | |
| 1. |
TotalEnergies SE (France) |
4.0% |
| 2. |
Nestle SA (Registered) |
3.9
|
| 3. |
Roche Holding AG |
3.5 |
| 4. |
LVMH Moet Hennessy Louis Vuitton SE (France) |
2.5
|
| 5. |
Novo Nordisk A/S, Class B (Denmark) |
2.5 |
| 6. |
AstraZeneca plc (United Kingdom) |
2.5
|
| 7. |
Shell plc (Netherlands) |
2.4 |
| 8. |
DBS Group Holdings Ltd. (Singapore) |
2.4
|
| 9. |
Diageo plc (United Kingdom) |
2.3 |
| 10. |
ASML Holding NV (Netherlands) |
2.2
|
| PORTFOLIO COMPOSITION BY COUNTRY AS OF October 31,
2022 |
PERCENT OF TOTAL
INVESTMENTS |
| France |
16.9 % |
| Japan |
16.6
|
| United States |
10.3 |
| United
Kingdom |
9.4
|
| Germany |
8.6 |
| Netherlands |
5.6
|
| Denmark |
5.5 |
| Sweden |
3.8
|
| Hong Kong |
3.6 |
| Australia |
2.6
|
| Singapore |
2.4 |
| Switzerland |
2.1
|
| Spain |
1.7 |
| South
Korea |
1.6
|
| PORTFOLIO COMPOSITION BY COUNTRY AS OF October 31,
2022 |
PERCENT OF TOTAL
INVESTMENTS |
| India |
1.2% |
| Belgium |
1.1
|
| South Africa |
1.0 |
| Others
(each less than 1.0%) |
1.9
|
| Short-Term Investments |
4.1 |
| 14 |
J.P. Morgan International Equity Funds |
October 31, 2022 |
| |
INCEPTION
DATE OF CLASS |
1 YEAR |
5 YEAR |
10 YEAR |
| CLASS A SHARES |
February 28, 2002 |
|
|
|
| With Sales Charge * |
|
(30.98)% |
(1.79)% |
2.71% |
| Without Sales Charge |
|
(27.15) |
(0.72) |
3.27 |
| CLASS C SHARES |
January 31, 2003 |
|
|
|
| With CDSC ** |
|
(28.51) |
(1.21) |
2.86 |
| Without CDSC |
|
(27.51) |
(1.21) |
2.86 |
| Class I SHARES |
January 1, 1997 |
(26.95) |
(0.46) |
3.53 |
| Class R2 SHARES |
November 3, 2008 |
(27.36) |
(1.02) |
2.98 |
| Class R5 SHARES |
May 15, 2006 |
(26.88) |
(0.36) |
3.68 |
| Class R6 SHARES |
November 30, 2010 |
(26.81) |
(0.26) |
3.76 |
| | |
| * |
Sales Charge for Class A Shares is 5.25%. |
| ** |
Assumes a 1% CDSC (contingent deferred sales charge) for the one year period and 0% CDSC thereafter. |
| October 31, 2022 |
J.P. Morgan International Equity Funds |
15 |
TWELVE MONTHS ENDED October 31, 2022 (Unaudited)
| REPORTING PERIOD RETURN: |
|
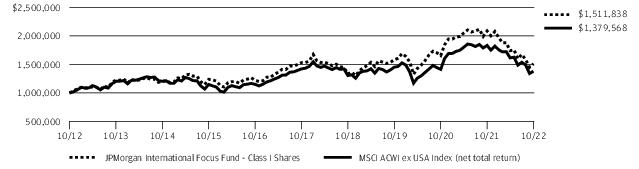
| Fund (Class I Shares) * |
(27.56)% |
| MSCI
ACWI ex USA Index (net total return) |
(24.73)% |
| Net Assets as of 10/31/2022 (In Thousands) |
$1,094,781 |
| 16 |
J.P. Morgan International Equity Funds |
October 31, 2022 |
| TOP TEN HOLDINGS OF THE PORTFOLIO AS OF October 31,
2022 |
PERCENT OF TOTAL
INVESTMENTS | |
| 1. |
Shell plc (Netherlands) |
4.5% |
| 2. |
Nestle SA (Registered) |
4.4 |
| 3. |
Samsung Electronics Co. Ltd. (South Korea) |
3.5 |
| 4. |
Toronto-Dominion Bank (The) (Canada) |
3.0
|
| 5. |
Canadian National Railway Co. (Canada) |
3.0 |
| 6. |
Novo Nordisk A/S, Class B (Denmark) |
2.9
|
| 7. |
Diageo plc (United Kingdom) |
2.9 |
| 8. |
HDFC Bank Ltd., ADR (India) |
2.9
|
| 9. |
Roche Holding AG |
2.9 |
| 10. |
DBS Group Holdings Ltd. (Singapore) |
2.9
|
| PORTFOLIO COMPOSITION BY COUNTRY AS OF October 31,
2022 |
PERCENT OF TOTAL
INVESTMENTS |
| France |
11.2 % |
| United
States |
10.4 |
| United Kingdom |
9.6 |
| Canada |
7.7
|
| Japan |
6.7 |
| Netherlands |
6.7
|
| Germany |
5.4 |
| Denmark |
4.2
|
| South Korea |
4.1 |
| Australia |
3.5
|
| India |
2.9 |
| Singapore |
2.9
|
| Hong Kong |
2.8 |
| Taiwan |
2.6
|
| PORTFOLIO COMPOSITION BY COUNTRY AS OF October 31,
2022 |
PERCENT OF TOTAL
INVESTMENTS |
| Spain |
2.1% |
| Indonesia |
1.9
|
| Belgium |
1.6 |
| China |
1.6
|
| Sweden |
1.4 |
| Switzerland |
1.4
|
| Mexico |
1.3 |
| South
Africa |
1.3
|
| Short-Term Investments |
6.7 |
| October 31, 2022 |
J.P. Morgan International Equity Funds |
17 |
TWELVE MONTHS ENDED October 31, 2022 (Unaudited) (continued)
| |
INCEPTION
DATE OF CLASS |
1 YEAR |
5 YEAR |
10 YEAR |
| CLASS A SHARES |
November 30, 2011 |
|
|
|
| With Sales Charge * |
|
(31.55)% |
(1.58)% |
3.37% |
| Without Sales Charge |
|
(27.75) |
(0.51) |
3.93 |
| CLASS C SHARES |
November 30, 2011 |
|
|
|
| With CDSC ** |
|
(29.13) |
(1.01) |
3.51 |
| Without CDSC |
|
(28.13) |
(1.01) |
3.51 |
| Class I SHARES |
November 30, 2011 |
(27.56) |
(0.26) |
4.22 |
| Class R2 SHARES |
November 30, 2011 |
(27.97) |
(0.82) |
3.64 |
| Class R5 SHARES |
November 30, 2011 |
(27.51) |
(0.16) |
4.35 |
| Class R6 SHARES |
November 30, 2011 |
(27.44) |
(0.06) |
4.42 |
| | |
| * |
Sales Charge for Class A Shares is 5.25%. |
| ** |
Assumes a 1% CDSC (contingent deferred sales charge) for the one year period and 0% CDSC thereafter. |
| 18 |
J.P. Morgan International Equity Funds |
October 31, 2022 |
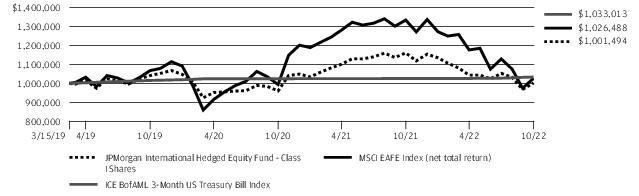
TWELVE MONTHS ENDED October 31, 2022 (Unaudited)
| REPORTING PERIOD RETURN: |
|
| Fund (Class I Shares) * |
(13.68)% |
| MSCI
EAFE Index (net total return) |
(23.00)% |
| ICE BofAML 3-Month US Treasury Bill Index |
0.79% |
| Net Assets as of 10/31/2022 (In Thousands) |
$161,207 |
Shares of Sea, a Singapore-based internet and mobile platform provider, fell after Tencent Holdings Ltd. reduced its stake in the company.
| TOP TEN HOLDINGS OF THE PORTFOLIO AS OF October 31,
2022 |
PERCENT OF TOTAL
INVESTMENTS | |
| 1. |
Nestle SA (Registered) |
2.8% |
| 2. |
Roche Holding AG |
2.5
|
| 3. |
LVMH Moet Hennessy Louis Vuitton SE (France) |
2.0 |
| 4. |
ASML Holding NV (Netherlands) |
2.0 |
| 5. |
Novo Nordisk A/S, Class B (Denmark) |
2.0 |
| 6. |
Shell plc (Netherlands) |
1.7
|
| 7. |
Novartis AG (Registered) (Switzerland) |
1.7 |
| 8. |
AstraZeneca plc (United Kingdom) |
1.7
|
| 9. |
BP plc (United Kingdom) |
1.6 |
| 10. |
TotalEnergies SE (France) |
1.4
|
| October 31, 2022 |
J.P. Morgan International Equity Funds |
19 |
TWELVE MONTHS ENDED October 31, 2022 (Unaudited) (continued)
| PORTFOLIO COMPOSITION BY COUNTRY AS OF October 31,
2022 |
PERCENT OF TOTAL
INVESTMENTS |
| Japan |
21.9 % |
| United
Kingdom |
13.2 |
| France |
11.2 |
| United
States |
9.3
|
| Germany |
8.4 |
| Netherlands |
6.6
|
| Australia |
6.0 |
| Switzerland |
5.4
|
| Denmark |
3.3 |
| Spain |
2.5
|
| Hong Kong |
2.2 |
| Sweden |
1.9
|
| Singapore |
1.1 |
| Others
(each less than 1.0%) |
3.2
|
| Short-Term Investments |
3.8 |
| 20 |
J.P. Morgan International Equity Funds |
October 31, 2022 |
| |
INCEPTION
DATE OF CLASS |
1
YEAR |
SINCE INCEPTION |
| CLASS A SHARES |
March 15, 2019 |
|
|
| With Sales Charge * |
|
(18.42)% |
(1.68)% |
| Without Sales Charge |
|
(13.89) |
(0.22) |
| CLASS C SHARES |
March 15, 2019 |
|
|
| With CDSC ** |
|
(15.36) |
(0.73) |
| Without CDSC |
|
(14.36) |
(0.73) |
| Class I SHARES |
March 15, 2019 |
(13.68) |
0.04 |
| Class R5 SHARES |
March 15, 2019 |
(13.56) |
0.17 |
| Class R6 SHARES |
March 15, 2019 |
(13.52) |
0.27 |
| | |
| * |
Sales Charge for Class A Shares is 5.25%. |
| ** |
Assumes a 1% CDSC (contingent deferred sales charge) for the one year period and 0% CDSC thereafter. |
| October 31, 2022 |
J.P. Morgan International Equity Funds |
21 |
TWELVE MONTHS ENDED October 31, 2022 (Unaudited) (continued)
| 22 |
J.P. Morgan International Equity Funds |
October 31, 2022 |
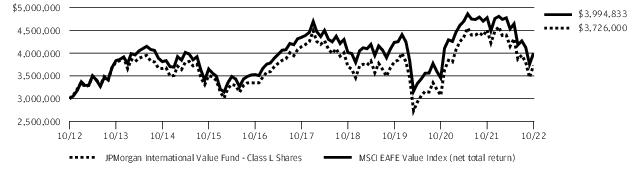
TWELVE MONTHS ENDED October 31, 2022 (Unaudited)
| REPORTING PERIOD RETURN: |
|
| Fund (Class L Shares) * |
(17.31)% |
| MSCI
EAFE Value Index (net total return) |
(16.35)% |
| Net Assets as of 10/31/2022 (In Thousands) |
$357,877 |
| TOP TEN HOLDINGS OF THE PORTFOLIO AS OF October 31,
2022 |
PERCENT OF TOTAL
INVESTMENTS | |
| 1. |
Shell plc (Netherlands) |
3.2% |
| 2. |
Novartis AG (Registered) (Switzerland) |
2.8 |
| 3. |
Toyota Motor Corp. (Japan) |
2.2 |
| 4. |
TotalEnergies SE (France) |
2.1
|
| 5. |
BP plc (United Kingdom) |
1.8 |
| 6. |
BHP Group Ltd. (Australia) |
1.8
|
| 7. |
HSBC Holdings plc (United Kingdom) |
1.7 |
| 8. |
Sanofi (France) |
1.7
|
| 9. |
Siemens AG (Registered) (Germany) |
1.2 |
| 10. |
GSK plc |
1.1
|
| PORTFOLIO COMPOSITION BY COUNTRY AS OF October 31,
2022 |
PERCENT OF TOTAL
INVESTMENTS |
| Japan |
21.2 % |
| United
Kingdom |
12.6
|
| France |
10.1 |
| Germany |
8.6
|
| Australia |
8.3 |
| Netherlands |
6.0
|
| Switzerland |
5.7 |
| Italy |
3.2
|
| Norway |
3.0 |
| United
States |
2.5
|
| Spain |
2.4 |
| Sweden |
2.2
|
| Denmark |
1.6 |
| Finland |
1.5
|
| Singapore |
1.4 |
| Austria |
1.1
|
| Others (each less than 1.0%) |
3.2 |
| Short-Term Investments |
5.4 |
| October 31, 2022 |
J.P. Morgan International Equity Funds |
23 |
TWELVE MONTHS ENDED October 31, 2022 (Unaudited) (continued)
| 24 |
J.P. Morgan International Equity Funds |
October 31, 2022 |
| |
INCEPTION
DATE OF CLASS |
1 YEAR |
5 YEAR |
10 YEAR |
| CLASS A SHARES |
September 28, 2001 |
|
|
|
| With Sales Charge * |
|
(21.91)% |
(3.47)% |
1.26% |
| Without Sales Charge |
|
(17.56) |
(2.42) |
1.80 |
| CLASS C SHARES |
July 11, 2006 |
|
|
|
| With CDSC ** |
|
(19.04) |
(2.93) |
1.39 |
| Without CDSC |
|
(18.04) |
(2.93) |
1.39 |
| Class I SHARES |
September 10, 2001 |
(17.38) |
(2.19) |
2.07 |
| Class L SHARES |
November 4, 1993 |
(17.31) |
(2.09) |
2.19 |
| Class R2 SHARES |
November 3, 2008 |
(17.88) |
(2.73) |
1.52 |
| Class R5 SHARES |
September 9, 2016 |
(17.31) |
(2.10) |
2.18 |
| Class R6 SHARES |
November 30, 2010 |
(17.23) |
(1.98) |
2.31 |
| | |
| * |
Sales Charge for Class A Shares is 5.25%. |
| ** |
Assumes a 1% CDSC (contingent deferred sales charge) for the one year period and 0% CDSC thereafter. |
| October 31, 2022 |
J.P. Morgan International Equity Funds |
25 |
AS OF October 31, 2022
| INVESTMENTS |
SHARES
(000) |
VALUE ($000) |
| Common Stocks — 98.4% | ||
| Brazil — 8.0% | ||
| B3 SA - Brasil Bolsa Balcao |
6,199 |
18,001 |
| MercadoLibre, Inc. * |
264 |
238,204 |
| NU Holdings Ltd., Class A * |
18,843 |
94,218 |
| Petroleo Brasileiro SA (Preference) |
10,174 |
58,693 |
| Raia Drogasil SA |
16,708 |
85,649 |
| XP, Inc., Class A * |
4,385 |
80,366 |
| |
|
575,131 |
| China — 21.6% | ||
| Beijing Oriental Yuhong Waterproof Technology Co. Ltd., Class A |
14,366 |
48,097 |
| Budweiser Brewing Co. APAC Ltd. (a) |
36,126 |
76,035 |
| Dada Nexus Ltd., ADR * |
3,422 |
10,573 |
| Foshan Haitian Flavouring & Food Co. Ltd., Class A |
10,583 |
86,283 |
| JD.com, Inc., ADR |
850 |
31,704 |
| JD.com, Inc., Class A |
7,783 |
141,734 |
| Jiangsu Hengli Hydraulic Co. Ltd., Class A |
13,118 |
98,665 |
| Kingdee International Software Group Co. Ltd. * |
32,769 |
53,696 |
| Meituan * (a) |
4,969 |
79,554 |
| Midea Group Co. Ltd., Class A |
3,199 |
17,532 |
| NetEase, Inc. |
6,038 |
66,993 |
| Pharmaron Beijing Co. Ltd., Class A |
4,743 |
33,526 |
| Shenzhen Mindray Bio-Medical Electronics Co. Ltd., Class A |
1,884 |
83,778 |
| Shenzhou International Group Holdings Ltd. |
10,123 |
70,283 |
| Silergy Corp. |
7,629 |
87,975 |
| Tencent Holdings Ltd. |
6,938 |
182,308 |
| Wanhua Chemical Group Co. Ltd., Class A |
8,599 |
94,400 |
| Wuliangye Yibin Co. Ltd., Class A |
2,765 |
50,421 |
| WuXi AppTec Co. Ltd., Class A |
5,697 |
59,387 |
| Wuxi Biologics Cayman, Inc. * (a) |
14,305 |
64,367 |
| Yum China Holdings, Inc. |
2,560 |
105,838 |
| |
|
1,543,149 |
| Hong Kong — 5.8% | ||
| AIA Group Ltd. |
795 |
6,024 |
| AIA Group Ltd. |
22,106 |
167,450 |
| Hong Kong Exchanges & Clearing Ltd. |
1,571 |
41,688 |
| Prudential plc |
8,655 |
80,407 |
| Techtronic Industries Co. Ltd. |
1,219 |
11,532 |
| Techtronic Industries Co. Ltd. |
10,990 |
104,062 |
| |
|
411,163 |
| India — 24.9% | ||
| Apollo Hospitals Enterprise Ltd. |
1,535 |
83,825 |
| INVESTMENTS |
SHARES
(000) |
VALUE ($000) |
| | ||
| India — continued | ||
| Asian Paints Ltd. |
1,268 |
47,735 |
| Britannia Industries Ltd. |
1,234 |
56,180 |
| HDFC Bank Ltd. |
12,838 |
232,995 |
| HDFC Bank Ltd., ADR |
2,750 |
171,361 |
| HDFC Life Insurance Co. Ltd. (a) |
16,389 |
107,106 |
| Hindustan Unilever Ltd. |
3,179 |
98,078 |
| Housing Development Finance Corp. Ltd. |
8,216 |
245,657 |
| Infosys Ltd. |
3,020 |
56,278 |
| Infosys Ltd., ADR |
6,738 |
126,190 |
| Kotak Mahindra Bank Ltd. |
7,967 |
183,433 |
| Reliance Industries Ltd. |
5,749 |
177,405 |
| Tata Consultancy Services Ltd. |
5,058 |
195,211 |
| |
|
1,781,454 |
| Indonesia — 5.1% | ||
| Bank Central Asia Tbk. PT |
319,744 |
180,744 |
| Bank Rakyat Indonesia Persero Tbk. PT |
617,755 |
184,297 |
| |
|
365,041 |
| Macau — 0.5% | ||
| Sands China Ltd. * |
21,809 |
38,127 |
| Mexico — 4.4% | ||
| Grupo Financiero Banorte SAB de CV, Class O |
17,505 |
142,503 |
| Wal-Mart de Mexico SAB de CV |
45,381 |
175,312 |
| |
|
317,815 |
| Panama — 0.9% | ||
| Copa Holdings SA, Class A * |
864 |
64,991 |
| Poland — 0.3% | ||
| Allegro.eu SA * (a) |
4,933 |
23,925 |
| Portugal — 1.4% | ||
| Jeronimo Martins SGPS SA |
4,685 |
96,946 |
| South Africa — 2.5% | ||
| Bid Corp. Ltd. |
3,392 |
54,571 |
| Capitec Bank Holdings Ltd. |
571 |
59,133 |
| FirstRand Ltd. |
19,474 |
68,082 |
| |
|
181,786 |
| South Korea — 8.6% | ||
| Delivery Hero SE * (a) (b) |
1,044 |
34,362 |
| LG Chem Ltd. |
221 |
97,135 |
| NCSoft Corp. |
129 |
35,075 |
| Samsung Electronics Co. Ltd. |
10,715 |
445,969 |
| |
|
612,541 |
| 26 |
J.P. Morgan International Equity Funds |
October 31, 2022 |
| INVESTMENTS |
SHARES
(000) |
VALUE ($000) |
| Common Stocks — continued | ||
| Taiwan — 10.7% | ||
| Chailease Holding Co. Ltd. |
16,745 |
77,240 |
| Delta Electronics, Inc. |
10,888 |
86,634 |
| Realtek Semiconductor Corp. |
4,736 |
37,335 |
| Taiwan Semiconductor Manufacturing Co. Ltd., ADR |
7,981 |
491,198 |
| Taiwan Semiconductor Manufacturing Co. Ltd. |
6,120 |
73,576 |
| |
|
765,983 |
| United States — 3.7% | ||
| EPAM Systems, Inc. * |
534 |
186,930 |
| Globant SA * |
245 |
46,251 |
| JS Global Lifestyle Co. Ltd. (a) |
40,451 |
32,584 |
| |
|
265,765 |
| Total Common Stocks (Cost $7,368,331) |
|
7,043,817 |
| Short-Term Investments — 1.7% | ||
| Investment Companies — 1.6% | ||
| JPMorgan Prime Money Market Fund Class Institutional Shares, 3.12% (c) (d)(Cost
$113,774) |
113,762 |
113,774 |
| Investment of Cash Collateral from Securities Loaned — 0.1% | ||
| JPMorgan Securities Lending Money Market Fund Agency SL Class Shares, 3.23% (c) (d) |
4,022 |
4,022 |
| JPMorgan U.S. Government Money Market Fund Class IM Shares, 2.85% (c) (d) |
771 |
771 |
| Total Investment of Cash Collateral from Securities Loaned (Cost
$4,791) |
|
4,793 |
| Total Short-Term Investments (Cost $118,565) |
|
118,567 |
| Total Investments — 100.1% (Cost $7,486,896) |
|
7,162,384 |
| Liabilities in Excess of Other Assets — (0.1)% |
|
(7,388) |
| NET ASSETS — 100.0% |
|
7,154,996 |
| Percentages indicated are based on net assets. |
| Abbreviations |
|
| ADR |
American Depositary Receipt |
| APAC |
Asia Pacific |
| Preference |
A special type of equity investment that shares in the earnings of the company, has limited voting rights, and may have a dividend preference. Preference shares may also have liquidation preference. |
| PT |
Limited liability company |
| SGPS |
Holding company |
| * |
Non-income producing security. |
| (a) |
Security exempt from registration pursuant to Regulation S under the Securities Act of 1933, as amended. Regulation S applies to securities offerings that are made outside of the United States and do not involve direct selling efforts in the United States and as such may have restrictions on resale. |
| (b) |
The security or a portion of this security is on loan at October 31, 2022. The total value of securities on loan at October 31, 2022 is $4,595. |
| (c) |
Investment in an affiliated fund, which is registered under the Investment Company Act of 1940, as amended, and is advised by J.P. Morgan Investment Management Inc. |
| (d) |
The rate shown is the current yield as of October 31, 2022. |
| PORTFOLIO COMPOSITION BY ASSET CLASS AS OF October 31,
2022 |
PERCENT OF
TOTAL
INVESTMENTS |
| Banks |
17.4% |
| Semiconductors & Semiconductor Equipment |
9.6 |
| IT Services |
8.5 |
| Internet & Direct Marketing Retail |
7.8 |
| Technology Hardware, Storage & Peripherals |
6.2 |
| Food & Staples Retailing |
5.8 |
| Diversified Financial Services |
5.5 |
| Insurance |
5.0 |
| Chemicals |
3.3 |
| Oil, Gas & Consumable Fuels |
3.3 |
| Machinery |
3.0 |
| Interactive Media & Services |
2.5 |
| Life Sciences Tools & Services |
2.2 |
| Hotels, Restaurants & Leisure |
2.0 |
| Food Products |
2.0 |
| Capital Markets |
2.0 |
| Beverages |
1.8 |
| Entertainment |
1.4 |
| Personal Products |
1.4 |
| Electronic Equipment, Instruments & Components |
1.2 |
| Health Care Providers & Services |
1.2 |
| Health Care Equipment & Supplies |
1.2 |
| Textiles, Apparel & Luxury Goods |
1.0 |
| Others (each less than 1.0%) |
3.0 |
| Short-Term Investments |
1.7 |
| October 31, 2022 |
J.P. Morgan International Equity Funds |
27 |
AS OF October 31, 2022
| INVESTMENTS |
SHARES
(000) |
VALUE ($000) |
| Common Stocks — 93.5% | ||
| Brazil — 7.1% | ||
| B3 SA - Brasil Bolsa Balcao |
1,127 |
3,271 |
| Centrais Eletricas Brasileiras SA |
623 |
6,025 |
| Cia Energetica de Minas Gerais (Preference) |
1,331 |
2,927 |
| EDP - Energias do Brasil SA |
1,000 |
4,464 |
| Gerdau SA (Preference) |
1,934 |
9,649 |
| Itau Unibanco Holding SA (Preference) * |
3,193 |
18,754 |
| Itausa SA (Preference) |
5,834 |
12,118 |
| Localiza Rent a Car SA |
889 |
12,123 |
| Lojas Renner SA * |
1,827 |
10,932 |
| Magazine Luiza SA * |
2,862 |
2,477 |
| MercadoLibre, Inc. * |
3 |
2,957 |
| NU Holdings Ltd., Class A * |
520 |
2,600 |
| Petroleo Brasileiro SA (Preference) |
5,128 |
29,582 |
| Porto Seguro SA |
502 |
2,261 |
| Raia Drogasil SA |
2,030 |
10,408 |
| Suzano SA |
1,002 |
10,325 |
| TIM SA, ADR * |
498 |
6,350 |
| Vale SA, ADR |
2,079 |
26,899 |
| WEG SA |
1,785 |
13,933 |
| XP, Inc., BDR * |
82 |
1,497 |
| |
|
189,552 |
| Chile — 0.3% | ||
| Banco Santander Chile, ADR |
410 |
5,908 |
| Cencosud SA |
1,431 |
1,926 |
| |
|
7,834 |
| China — 25.7% | ||
| Alibaba Group Holding Ltd. * |
7,406 |
57,579 |
| Amoy Diagnostics Co. Ltd., Class A |
362 |
1,159 |
| Angel Yeast Co. Ltd., Class A |
410 |
2,027 |
| Anhui Conch Cement Co. Ltd., Class H |
739 |
1,903 |
| ANTA Sports Products Ltd. |
882 |
7,752 |
| Baidu, Inc., ADR * |
78 |
5,984 |
| Baoshan Iron & Steel Co. Ltd., Class A |
7,134 |
4,686 |
| BeiGene Ltd., ADR * |
7 |
1,231 |
| Beijing Oriental Yuhong Waterproof Technology Co. Ltd., Class A |
582 |
1,950 |
| BOE Technology Group Co. Ltd., Class A |
10,812 |
4,934 |
| BYD Co. Ltd., Class H |
171 |
3,820 |
| CGN Power Co. Ltd., Class H (a) |
11,906 |
2,412 |
| Chacha Food Co. Ltd., Class A |
759 |
4,587 |
| China Conch Environment Protection Holdings Ltd. * |
1,411 |
416 |
| China Construction Bank Corp., Class H |
54,888 |
29,128 |
| China International Capital Corp. Ltd., Class H (a) |
3,628 |
5,042 |
| INVESTMENTS |
SHARES
(000) |
VALUE ($000) |
| | ||
| China — continued | ||
| China Lesso Group Holdings Ltd. |
3,027 |
2,457 |
| China Life Insurance Co. Ltd., Class H |
6,883 |
7,506 |
| China Longyuan Power Group Corp. Ltd., Class H |
3,474 |
3,970 |
| China Merchants Bank Co. Ltd., Class H |
3,604 |
11,799 |
| China Oilfield Services Ltd., Class H |
4,732 |
5,327 |
| China Overseas Land & Investment Ltd. |
3,784 |
7,231 |
| China Pacific Insurance Group Co. Ltd., Class H |
2,568 |
4,140 |
| China Petroleum & Chemical Corp., Class H |
13,760 |
5,453 |
| China Resources Land Ltd. |
2,770 |
8,667 |
| China Resources Mixc Lifestyle Services Ltd. (a) |
688 |
2,016 |
| China Vanke Co. Ltd., Class H |
4,188 |
5,375 |
| China Yangtze Power Co. Ltd., Class A |
2,613 |
7,233 |
| Chongqing Brewery Co. Ltd., Class A |
205 |
2,438 |
| Chongqing Fuling Zhacai Group Co. Ltd., Class A |
1,539 |
4,729 |
| CMOC Group Ltd., Class H |
2,550 |
821 |
| COSCO SHIPPING Holdings Co. Ltd., Class H |
2,019 |
2,176 |
| Country Garden Services Holdings Co. Ltd. |
1,164 |
1,017 |
| CSPC Pharmaceutical Group Ltd. |
6,200 |
6,368 |
| Dongguan Yiheda Automation Co. Ltd., Class A |
187 |
1,908 |
| Dongguan Yiheda Automation Co. Ltd., Class A |
69 |
702 |
| ENN Energy Holdings Ltd. |
727 |
7,229 |
| Foshan Haitian Flavouring & Food Co. Ltd., Class A |
747 |
6,088 |
| Fuyao Glass Industry Group Co. Ltd., Class H (a) |
1,750 |
6,271 |
| Ganfeng Lithium Group Co. Ltd., Class H (a) |
331 |
2,237 |
| Guangzhou Automobile Group Co. Ltd., Class H |
11,776 |
7,176 |
| Guangzhou Kingmed Diagnostics Group Co. Ltd., Class A |
594 |
6,106 |
| H World Group Ltd. |
1,759 |
4,799 |
| Haier Smart Home Co. Ltd., Class H |
3,805 |
9,525 |
| Han's Laser Technology Industry Group Co. Ltd., Class A |
1,113 |
3,854 |
| Hefei Meiya Optoelectronic Technology, Inc., Class A |
743 |
2,407 |
| Huatai Securities Co. Ltd., Class H (a) |
2,648 |
2,593 |
| Huayu Automotive Systems Co. Ltd., Class A |
1,508 |
3,447 |
| Hundsun Technologies, Inc., Class A |
571 |
3,255 |
| HUTCHMED China Ltd., ADR * (b) |
64 |
563 |
| Industrial & Commercial Bank of China Ltd., Class H |
29,229 |
12,690 |
| Inner Mongolia Yili Industrial Group Co. Ltd., Class A |
1,697 |
5,850 |
| Jade Bird Fire Co. Ltd., Class A |
866 |
2,944 |
| JD Logistics, Inc. * (a) |
1,421 |
1,986 |
| JD.com, Inc., Class A |
1,301 |
23,688 |
| Jiangsu Hengli Hydraulic Co. Ltd., Class A |
555 |
4,178 |
| Joinn Laboratories China Co. Ltd., Class H (a) |
433 |
1,404 |
| Kingdee International Software Group Co. Ltd. * |
2,441 |
4,000 |
| 28 |
J.P. Morgan International Equity Funds |
October 31, 2022 |
| INVESTMENTS |
SHARES
(000) |
VALUE ($000) |
| Common Stocks — continued | ||
| China — continued | ||
| Kuaishou Technology * (a) |
528 |
2,181 |
| Kunlun Energy Co. Ltd. |
9,678 |
5,784 |
| Kweichow Moutai Co. Ltd., Class A |
58 |
10,659 |
| Laobaixing Pharmacy Chain JSC, Class A |
931 |
4,463 |
| Longfor Group Holdings Ltd. (c) |
1,575 |
2,007 |
| Meituan * (a) |
2,280 |
36,504 |
| Midea Group Co. Ltd., Class A |
344 |
1,885 |
| Minth Group Ltd. |
1,490 |
2,938 |
| Montage Technology Co. Ltd., Class A |
346 |
2,667 |
| NARI Technology Co. Ltd., Class A |
777 |
2,597 |
| NetEase, Inc. |
1,356 |
15,043 |
| NIO, Inc., ADR * |
447 |
4,319 |
| NIO, Inc., Class A * (b) |
175 |
1,650 |
| Oppein Home Group, Inc., Class A |
244 |
2,708 |
| Pharmaron Beijing Co. Ltd., Class H (a) |
766 |
2,583 |
| PICC Property & Casualty Co. Ltd., Class H |
8,384 |
7,733 |
| Pinduoduo, Inc., ADR * |
237 |
13,010 |
| Ping An Bank Co. Ltd., Class A |
3,157 |
4,457 |
| Ping An Insurance Group Co. of China Ltd., Class H |
4,082 |
16,342 |
| Postal Savings Bank of China Co. Ltd., Class H (a) |
9,180 |
4,257 |
| Qingdao Haier Biomedical Co. Ltd., Class A |
413 |
4,342 |
| Sany Heavy Industry Co. Ltd., Class A |
1,527 |
2,818 |
| Shanghai Baosight Software Co. Ltd., Class A |
712 |
4,122 |
| Shanghai Liangxin Electrical Co. Ltd., Class A |
1,445 |
2,218 |
| Shanghai Putailai New Energy Technology Co. Ltd., Class A |
336 |
2,286 |
| Shenzhen Mindray Bio-Medical Electronics Co. Ltd., Class A |
161 |
7,159 |
| Silergy Corp. |
427 |
4,924 |
| Skshu Paint Co. Ltd., Class A * |
345 |
4,100 |
| Sunny Optical Technology Group Co. Ltd. |
192 |
1,660 |
| Tencent Holdings Ltd. |
3,022 |
79,414 |
| Tingyi Cayman Islands Holding Corp. |
1,768 |
2,764 |
| Tongwei Co. Ltd., Class A |
898 |
5,340 |
| Trip.com Group Ltd., ADR * |
163 |
3,686 |
| Wanhua Chemical Group Co. Ltd., Class A |
600 |
6,587 |
| Wuliangye Yibin Co. Ltd., Class A |
348 |
6,338 |
| WuXi AppTec Co. Ltd., Class H (a) |
570 |
4,575 |
| Wuxi Biologics Cayman, Inc. * (a) |
2,124 |
9,557 |
| Xinyi Solar Holdings Ltd. |
6,588 |
6,541 |
| XPeng, Inc., Class A * |
518 |
1,658 |
| Yum China Holdings, Inc. |
89 |
3,603 |
| Yum China Holdings, Inc. |
165 |
6,810 |
| Yunnan Energy New Material Co. Ltd. |
100 |
2,024 |
| INVESTMENTS |
SHARES
(000) |
VALUE ($000) |
| | ||
| China — continued | ||
| Zhejiang Dingli Machinery Co. Ltd., Class A |
715 |
4,387 |
| Zhejiang Weixing New Building Materials Co. Ltd., Class A |
1,763 |
4,188 |
| Zijin Mining Group Co. Ltd., Class H |
9,000 |
8,585
|
| |
|
681,706 |
| Colombia — 0.1% | ||
| Ecopetrol SA, ADR (b) |
352 |
3,473
|
| Greece — 0.5% | ||
| Hellenic Telecommunications Organization SA |
410 |
6,441 |
| OPAP SA |
496 |
6,081
|
| |
|
12,522 |
| Hong Kong — 0.2% | ||
| Orient Overseas International Ltd. |
89 |
1,293 |
| Techtronic Industries Co. Ltd. |
446 |
4,228 |
| |
|
5,521 |
| Hungary — 0.4% | ||
| OTP Bank Nyrt. |
269 |
5,870 |
| Richter Gedeon Nyrt. |
197 |
3,901 |
| |
|
9,771 |
| India — 14.8% | ||
| ACC Ltd. |
163 |
4,723 |
| Apollo Hospitals Enterprise Ltd. |
177 |
9,694 |
| Ashok Leyland Ltd. |
1,378 |
2,554 |
| Axis Bank Ltd. |
1,706 |
18,705 |
| Bajaj Finance Ltd. |
15 |
1,285 |
| Bharat Petroleum Corp. Ltd. |
1,880 |
6,903 |
| Biocon Ltd. |
976 |
3,183 |
| Britannia Industries Ltd. |
200 |
9,108 |
| Dabur India Ltd. |
686 |
4,601 |
| Dr Reddy's Laboratories Ltd. |
154 |
8,313 |
| Eicher Motors Ltd. |
132 |
6,157 |
| GAIL India Ltd. |
3,260 |
3,594 |
| Godrej Properties Ltd. * |
175 |
2,675 |
| HCL Technologies Ltd. |
459 |
5,774 |
| HDFC Bank Ltd., ADR |
137 |
8,530 |
| HDFC Life Insurance Co. Ltd. (a) |
1,504 |
9,829 |
| Hindustan Unilever Ltd. |
604 |
18,629 |
| Housing Development Finance Corp. Ltd. |
1,052 |
31,468 |
| ICICI Bank Ltd. |
2,922 |
32,124 |
| ICICI Prudential Life Insurance Co. Ltd. (a) |
618 |
3,797 |
| Infosys Ltd., ADR |
1,894 |
35,468 |
| October 31, 2022 |
J.P. Morgan International Equity Funds |
29 |
AS OF October 31, 2022 (continued)
| INVESTMENTS |
SHARES
(000) |
VALUE ($000) |
| Common Stocks — continued | ||
| India — continued | ||
| Kotak Mahindra Bank Ltd. |
586 |
13,493 |
| Larsen & Toubro Ltd. |
466 |
11,402 |
| Maruti Suzuki India Ltd. |
126 |
14,512 |
| NTPC Ltd. |
4,469 |
9,354 |
| Oil & Natural Gas Corp. Ltd. |
1,911 |
3,087 |
| Petronet LNG Ltd. |
2,378 |
5,909 |
| Power Grid Corp. of India Ltd. |
3,067 |
8,461 |
| Reliance Industries Ltd. |
1,587 |
48,972 |
| Shriram Transport Finance Co. Ltd. |
476 |
7,083 |
| Tata Consultancy Services Ltd. |
534 |
20,629 |
| Tata Consumer Products Ltd. |
711 |
6,619 |
| UltraTech Cement Ltd. |
96 |
7,767 |
| UPL Ltd. |
1,047 |
9,240 |
| |
|
393,642 |
| Indonesia — 2.2% | ||
| Bank Central Asia Tbk. PT |
38,453 |
21,737 |
| Bank Mandiri Persero Tbk. PT |
5,201 |
3,513 |
| Bank Rakyat Indonesia Persero Tbk. PT |
57,644 |
17,197 |
| Telkom Indonesia Persero Tbk. PT |
52,114 |
14,636 |
| |
|
57,083 |
| Malaysia — 1.2% | ||
| CIMB Group Holdings Bhd. |
4,083 |
4,770 |
| Malayan Banking Bhd. |
1,942 |
3,527 |
| Petronas Chemicals Group Bhd. |
4,272 |
7,875 |
| Public Bank Bhd. |
12,208 |
11,546 |
| Tenaga Nasional Bhd. |
2,358 |
4,199 |
| |
|
31,917 |
| Mexico — 3.5% | ||
| America Movil SAB de CV |
19,331 |
18,246 |
| Cemex SAB de CV * |
21,483 |
8,371 |
| Grupo Aeroportuario del Pacifico SAB de CV, Class B |
582 |
9,035 |
| Grupo Aeroportuario del Sureste SAB de CV, Class B |
455 |
10,672 |
| Grupo Financiero Banorte SAB de CV, Class O |
2,166 |
17,631 |
| Grupo Mexico SAB de CV |
2,352 |
8,471 |
| Kimberly-Clark de Mexico SAB de CV, Class A |
2,639 |
4,158 |
| Sitios Latinoamerica SAB de CV * |
978 |
290 |
| Wal-Mart de Mexico SAB de CV |
4,035 |
15,587 |
| |
|
92,461 |
| Peru — 0.5% | ||
| Credicorp Ltd. |
85 |
12,487 |
| INVESTMENTS |
SHARES
(000) |
VALUE ($000) |
| | ||
| Philippines — 0.2% | ||
| ACEN Corp. |
809 |
88 |
| Ayala Corp. |
154 |
1,789 |
| Ayala Land, Inc. |
6,328 |
2,808
|
| |
|
4,685 |
| Poland — 0.5% | ||
| Dino Polska SA * (a) |
127 |
8,262 |
| Powszechny Zaklad Ubezpieczen SA (b) |
864 |
4,843
|
| |
|
13,105 |
| Qatar — 0.9% | ||
| Industries Qatar QSC |
1,740 |
7,532 |
| Qatar National Bank QPSC |
3,098 |
16,963 |
| |
|
24,495 |
| Russia — 0.0% ^ | ||
| Gazprom PJSC ‡ |
4,581 |
352 |
| Magnitogorsk Iron & Steel Works PJSC ‡ |
3,146 |
36 |
| MMC Norilsk Nickel PJSC, ADR ‡ |
— |
— |
| MMC Norilsk Nickel PJSC ‡ |
41 |
264 |
| Novatek PJSC ‡ |
165 |
50 |
| Rosneft Oil Co. PJSC ‡ |
833 |
83 |
| Sberbank of Russia PJSC ‡ * |
3,172 |
133 |
| Severstal PAO, GDR ‡ (a) |
329 |
105 |
| TCS Group Holding plc, GDR ‡ * (a) |
69 |
50 |
| X5 Retail Group NV, GDR ‡ (a) |
207 |
50 |
| |
|
1,123 |
| Saudi Arabia — 3.9% | ||
| Al Rajhi Bank * |
1,242 |
28,167 |
| Alinma Bank |
1,281 |
12,783 |
| Almarai Co. JSC |
406 |
6,074 |
| Etihad Etisalat Co. |
528 |
5,138 |
| SABIC Agri-Nutrients Co. |
158 |
6,662 |
| Saudi Arabian Oil Co. (a) |
819 |
7,604 |
| Saudi Basic Industries Corp. |
570 |
13,395 |
| Saudi National Bank (The) |
941 |
14,870 |
| Saudi Telecom Co. |
723 |
7,768 |
| |
|
102,461 |
| Singapore — 0.1% | ||
| BOC Aviation Ltd. (a) |
370 |
2,477 |
| South Africa — 3.8% | ||
| Bid Corp. Ltd. |
574 |
9,234 |
| Bidvest Group Ltd. (The) |
631 |
7,305 |
| Capitec Bank Holdings Ltd. |
100 |
10,382 |
| 30 |
J.P. Morgan International Equity Funds |
October 31, 2022 |
| INVESTMENTS |
SHARES
(000) |
VALUE ($000) |
| Common Stocks — continued | ||
| South Africa — continued | ||
| Clicks Group Ltd. |
517 |
8,756 |
| Discovery Ltd. * |
400 |
2,614 |
| FirstRand Ltd. |
3,709 |
12,966 |
| Foschini Group Ltd. (The) |
391 |
2,443 |
| MTN Group Ltd. |
1,117 |
7,898 |
| Naspers Ltd., Class N |
104 |
10,724 |
| Nedbank Group Ltd. |
363 |
4,302 |
| Sanlam Ltd. |
2,858 |
8,331 |
| SPAR Group Ltd. (The) (b) |
317 |
2,685 |
| Standard Bank Group Ltd. |
845 |
7,885 |
| Vodacom Group Ltd. |
863 |
5,880
|
| |
|
101,405 |
| South Korea — 12.1% | ||
| BGF retail Co. Ltd. |
17 |
2,266 |
| Hana Financial Group, Inc. |
323 |
9,352 |
| Hankook Tire & Technology Co. Ltd. |
125 |
3,208 |
| HL Mando Co. Ltd. |
79 |
2,719 |
| Hyundai Glovis Co. Ltd. |
60 |
7,338 |
| Hyundai Mobis Co. Ltd. |
60 |
9,188 |
| Hyundai Motor Co. |
29 |
3,308 |
| JYP Entertainment Corp. |
108 |
4,202 |
| Kakao Corp. |
63 |
2,219 |
| KB Financial Group, Inc. |
351 |
11,806 |
| Kia Corp. |
225 |
10,478 |
| KIWOOM Securities Co. Ltd. |
44 |
2,475 |
| LG Chem Ltd. |
41 |
17,975 |
| LG H&H Co. Ltd. |
11 |
3,760 |
| NAVER Corp. |
97 |
11,499 |
| NCSoft Corp. |
24 |
6,483 |
| POSCO Holdings, Inc. |
75 |
13,094 |
| Samsung Biologics Co. Ltd. * (a) |
17 |
10,298 |
| Samsung Electro-Mechanics Co. Ltd. |
25 |
2,159 |
| Samsung Electronics Co. Ltd. |
2,683 |
111,670 |
| Samsung Fire & Marine Insurance Co. Ltd. |
62 |
8,683 |
| Samsung SDI Co. Ltd. |
13 |
6,725 |
| Shinhan Financial Group Co. Ltd. |
503 |
12,797 |
| SK Hynix, Inc. |
348 |
20,167 |
| SK Innovation Co. Ltd. * |
62 |
7,550 |
| SK Telecom Co. Ltd. |
142 |
4,974 |
| SK, Inc. |
24 |
3,595 |
| SKC Co. Ltd. |
51 |
3,682 |
| S-Oil Corp. |
110 |
6,670 |
| |
|
320,340 |
| INVESTMENTS |
SHARES
(000) |
VALUE ($000) |
| | ||
| Taiwan — 11.8% | ||
| Accton Technology Corp. |
1,087 |
8,174 |
| Advantech Co. Ltd. |
920 |
8,331 |
| ASE Technology Holding Co. Ltd. |
2,153 |
5,316 |
| Chailease Holding Co. Ltd. |
1,723 |
7,946 |
| CTBC Financial Holding Co. Ltd. |
17,380 |
10,980 |
| Delta Electronics, Inc. |
1,899 |
15,110 |
| E.Sun Financial Holding Co. Ltd. |
12,126 |
8,714 |
| Eclat Textile Co. Ltd. |
431 |
5,656 |
| eMemory Technology, Inc. |
73 |
2,421 |
| Evergreen Marine Corp. Taiwan Ltd. |
469 |
1,997 |
| Fubon Financial Holding Co. Ltd. |
3,895 |
6,153 |
| Giant Manufacturing Co. Ltd. |
488 |
3,105 |
| Hon Hai Precision Industry Co. Ltd. |
4,016 |
12,755 |
| Largan Precision Co. Ltd. |
63 |
3,604 |
| MediaTek, Inc. |
376 |
6,854 |
| Nan Ya Plastics Corp. |
4,037 |
8,554 |
| Nan Ya Printed Circuit Board Corp. |
506 |
3,301 |
| Nien Made Enterprise Co. Ltd. |
394 |
3,038 |
| Novatek Microelectronics Corp. |
658 |
4,903 |
| Powertech Technology, Inc. |
976 |
2,254 |
| President Chain Store Corp. |
746 |
6,203 |
| Realtek Semiconductor Corp. |
243 |
1,916 |
| Taiwan Mobile Co. Ltd. |
1,228 |
3,621 |
| Taiwan Semiconductor Manufacturing Co. Ltd., ADR |
297 |
18,300 |
| Taiwan Semiconductor Manufacturing Co. Ltd. |
10,227 |
122,950 |
| Uni-President Enterprises Corp. |
4,862 |
9,873 |
| United Microelectronics Corp. * |
2,882 |
3,465 |
| Vanguard International Semiconductor Corp. |
793 |
1,628 |
| Wiwynn Corp. |
245 |
5,488 |
| Yang Ming Marine Transport Corp. |
780 |
1,452 |
| Yuanta Financial Holding Co. Ltd. |
15,306 |
9,346 |
| |
|
313,408 |
| Thailand — 2.5% | ||
| Airports of Thailand PCL * |
4,300 |
8,303 |
| Indorama Ventures PCL |
3,287 |
3,643 |
| Kasikornbank PCL |
693 |
2,674 |
| Minor International PCL * |
5,991 |
4,450 |
| PTT Exploration & Production PCL, NVDR |
85 |
405 |
| PTT Exploration & Production PCL |
2,147 |
10,183 |
| PTT Global Chemical PCL |
5,123 |
5,870 |
| PTT Global Chemical PCL, NVDR |
127 |
146 |
| PTT PCL |
5,533 |
5,233 |
| PTT PCL, NVDR |
138 |
130 |
| October 31, 2022 |
J.P. Morgan International Equity Funds |
31 |
AS OF October 31, 2022 (continued)
| INVESTMENTS |
SHARES
(000) |
VALUE ($000) |
| Common Stocks — continued | ||
| Thailand — continued | ||
| SCB X PCL |
2,524 |
7,053 |
| SCG Packaging PCL |
2,534 |
3,465 |
| Siam Cement PCL (The), NVDR |
18 |
153 |
| Siam Cement PCL (The) (Registered) |
721 |
6,141 |
| Thai Oil PCL, NVDR |
76 |
109 |
| Thai Oil PCL |
3,331 |
4,790 |
| Thai Union Group PCL, Class F |
6,153 |
2,912
|
| |
|
65,660 |
| United Arab Emirates — 0.9% | ||
| Dubai Islamic Bank PJSC |
3,647 |
5,778 |
| Emaar Properties PJSC |
4,604 |
7,601 |
| Emirates Telecommunications Group Co. PJSC |
774 |
5,440 |
| First Abu Dhabi Bank PJSC |
1,111 |
5,415 |
| |
|
24,234 |
| United States — 0.3% | ||
| Genpact Ltd. |
67 |
3,262 |
| Globant SA * |
12 |
2,327 |
| JS Global Lifestyle Co. Ltd. (a) |
1,214 |
977 |
| Parade Technologies Ltd. |
60 |
1,130 |
| |
|
7,696 |
| Total Common Stocks (Cost $3,011,874) |
|
2,479,058 |
| |
NO. OF
RIGHTS
(000) |
|
| Rights — 0.0% | ||
| Thailand — 0.0% ^ | ||
| Thai Union Group PCL, expiring 12/31/2022(Cost $—) (d) |
174 |
—(d) |
| |
SHARES
(000) |
|
| Short-Term Investments — 2.1% | ||
| Investment Companies — 1.8% | ||
| JPMorgan Prime Money Market Fund Class Institutional Shares, 3.12% (e) (f)(Cost
$47,042) |
47,035 |
47,040 |
| Investment of Cash Collateral from Securities Loaned — 0.3% | ||
| JPMorgan Securities Lending Money Market Fund Agency SL Class Shares, 3.23% (e) (f) |
3,487 |
3,487 |
| INVESTMENTS |
SHARES
(000) |
VALUE ($000) |
| | ||
| Investment of Cash Collateral from Securities Loaned — continued | ||
| JPMorgan U.S. Government Money Market Fund Class IM Shares, 2.85% (e) (f) |
3,438 |
3,438
|
| Total Investment of Cash Collateral from Securities Loaned (Cost
$6,925) |
|
6,925 |
| Total Short-Term Investments (Cost $53,967) |
|
53,965 |
| Total Investments — 95.6% (Cost $3,065,841) |
|
2,533,023 |
| Other Assets Less Liabilities — 4.4% |
|
117,545 |
| NET ASSETS — 100.0% |
|
2,650,568 |
| Percentages indicated are based on net assets. | ||
| Amounts presented as a dash ("-") represent amounts that round to less than a thousand. |
| Abbreviations |
|
| ADR |
American Depositary Receipt |
| BDR |
Brazilian Depositary Receipt |
| GDR |
Global Depositary Receipt |
| JSC |
Joint Stock Company |
| NVDR |
Non-Voting Depositary Receipt |
| PJSC |
Public Joint Stock Company |
| Preference |
A special type of equity investment that shares in the earnings of the company, has limited voting rights, and may have a dividend preference. Preference shares may also have liquidation preference. |
| PT |
Limited liability company |
| ^ |
Amount rounds to less than 0.1% of net assets. | |
| ‡ |
Value determined using significant unobservable inputs. |
|
| * |
Non-income producing security. |
|
| (a) |
Security exempt from registration pursuant to Regulation S under the Securities Act of 1933, as amended. Regulation S applies to securities offerings that are made outside of the United States and do not involve direct selling efforts in the United States and as such may have restrictions on resale. |
|
| (b) |
The security or a portion of this security is on loan at October 31, 2022. The total value of securities on loan at October 31, 2022 is $6,699. |
|
| (c) |
Securities exempt from registration under Rule 144A or section 4(a)(2), of the Securities Act of 1933, as amended. |
|
| (d) |
Value is zero. |
|
| 32 |
J.P. Morgan International Equity Funds |
October 31, 2022 |
| (e) |
Investment in an affiliated fund, which is registered under the Investment Company Act of 1940, as amended, and is advised by J.P. Morgan Investment Management Inc. |
|
| (f) |
The rate shown is the current yield as of October 31, 2022. |
|
| PORTFOLIO COMPOSITION BY ASSET CLASS AS OF October 31,
2022 |
PERCENT OF
TOTAL
INVESTMENTS |
| Banks |
17.5% |
| Semiconductors & Semiconductor Equipment |
8.1 |
| Oil, Gas & Consumable Fuels |
5.8 |
| Internet & Direct Marketing Retail |
5.7 |
| Technology Hardware, Storage & Peripherals |
5.0 |
| Interactive Media & Services |
4.0 |
| Chemicals |
3.6 |
| Insurance |
3.2 |
| Metals & Mining |
3.0 |
| Food & Staples Retailing |
2.8 |
| IT Services |
2.7 |
| Food Products |
2.6 |
| Diversified Financial Services |
2.4 |
| Electronic Equipment, Instruments & Components |
2.1 |
| Automobiles |
2.1 |
| Wireless Telecommunication Services |
2.1 |
| Real Estate Management & Development |
1.6 |
| Diversified Telecommunication Services |
1.4 |
| Construction Materials |
1.2 |
| Hotels, Restaurants & Leisure |
1.2 |
| Life Sciences Tools & Services |
1.1 |
| Transportation Infrastructure |
1.1 |
| Auto Components |
1.1 |
| Machinery |
1.1 |
| Personal Products |
1.1 |
| Electric Utilities |
1.0 |
| Entertainment |
1.0 |
| Others (each less than 1.0%) |
12.3 |
| Short-Term Investments |
2.1 |
| October 31, 2022 |
J.P. Morgan International Equity Funds |
33 |
AS OF October 31, 2022 (continued)
| DESCRIPTION |
NUMBER OF
CONTRACTS |
EXPIRATION DATE |
TRADING CURRENCY |
NOTIONAL
AMOUNT ($) |
VALUE AND
UNREALIZED APPRECIATION
(DEPRECIATION) ($) |
| Long Contracts |
|
|
|
|
|
| MSCI Emerging Markets E-Mini Index |
294 |
12/16/2022 |
USD |
12,555 |
(434) |
| Abbreviations |
|
| MSCI |
Morgan Stanley Capital International |
| USD |
United States Dollar |
| 34 |
J.P. Morgan International Equity Funds |
October 31, 2022 |
AS OF October 31, 2022
| INVESTMENTS |
SHARES
(000) |
VALUE ($000) |
| Common Stocks — 96.9% | ||
| Australia — 2.3% | ||
| Glencore plc |
2,131 |
12,215 |
| Austria — 0.6% | ||
| Erste Group Bank AG |
128 |
3,143 |
| Denmark — 7.6% | ||
| Carlsberg A/S, Class B |
36 |
4,266 |
| Genmab A/S * |
28 |
10,868 |
| Jyske Bank A/S (Registered) * |
129 |
6,978 |
| Novo Nordisk A/S, Class B |
174 |
18,864 |
| |
|
40,976 |
| Finland — 3.1% | ||
| Neste OYJ |
108 |
4,735 |
| Nokia OYJ |
1,065 |
4,734 |
| Nordea Bank Abp |
760 |
7,253 |
| |
|
16,722 |
| France — 18.5% | ||
| Arkema SA |
58 |
4,554 |
| BNP Paribas SA |
139 |
6,543 |
| Capgemini SE |
51 |
8,337 |
| Engie SA |
577 |
7,502 |
| LVMH Moet Hennessy Louis Vuitton SE |
24 |
15,420 |
| Pernod Ricard SA |
44 |
7,678 |
| Sanofi |
131 |
11,282 |
| Thales SA |
32 |
4,035 |
| TotalEnergies SE |
395 |
21,559 |
| Verallia SA (a) |
194 |
5,500 |
| Vinci SA |
80 |
7,340 |
| |
|
99,750 |
| Germany — 17.6% | ||
| AIXTRON SE |
145 |
3,574 |
| Allianz SE (Registered) |
64 |
11,419 |
| Bayer AG (Registered) |
157 |
8,261 |
| Brenntag SE |
114 |
6,906 |
| Deutsche Boerse AG |
57 |
9,315 |
| Deutsche Lufthansa AG (Registered) * |
792 |
5,418 |
| Deutsche Telekom AG (Registered) |
581 |
10,959 |
| Dr Ing hc F Porsche AG (Preference) * |
42 |
4,322 |
| HUGO BOSS AG |
124 |
5,717 |
| Mercedes-Benz Group AG |
137 |
7,904 |
| Muenchener Rueckversicherungs-Gesellschaft AG (Registered) |
32 |
8,390 |
| INVESTMENTS |
SHARES
(000) |
VALUE ($000) |
| | ||
| Germany — continued | ||
| RWE AG |
273 |
10,511 |
| VERBIO Vereinigte BioEnergie AG |
32 |
2,507 |
| |
|
95,203 |
| Ireland — 3.0% | ||
| AIB Group plc |
1,737 |
5,024 |
| Bank of Ireland Group plc |
883 |
6,384 |
| Bank of Ireland Group plc |
36 |
258 |
| Smurfit Kappa Group plc |
146 |
4,846 |
| |
|
16,512 |
| Italy — 1.7% | ||
| UniCredit SpA |
736 |
9,132 |
| Netherlands — 5.3% | ||
| Alfen Beheer BV * (a) |
52 |
5,520 |
| Koninklijke Ahold Delhaize NV |
508 |
14,152 |
| NN Group NV |
207 |
8,772 |
| |
|
28,444 |
| Norway — 0.8% | ||
| Aker Solutions ASA (a) |
1,090 |
4,163 |
| Spain — 1.0% | ||
| Corp. ACCIONA Energias Renovables SA |
136 |
5,355 |
| Sweden — 2.4% | ||
| Billerud AB |
384 |
4,956 |
| Hexatronic Group AB |
432 |
5,848 |
| New Wave Group AB, Class B |
177 |
2,465 |
| |
|
13,269 |
| Switzerland — 5.4% | ||
| Novartis AG (Registered) |
211 |
17,064 |
| Zurich Insurance Group AG |
29 |
12,201 |
| |
|
29,265 |
| United Kingdom — 16.9% | ||
| 3i Group plc |
311 |
4,144 |
| Ashtead Group plc |
113 |
5,918 |
| Barclays plc |
4,827 |
8,203 |
| BP plc |
3,559 |
19,692 |
| Diageo plc |
266 |
10,938 |
| Inchcape plc |
405 |
3,452 |
| JD Sports Fashion plc |
2,152 |
2,404 |
| Linde plc |
40 |
12,093 |
| Lloyds Banking Group plc |
14,429 |
6,930 |
| Reckitt Benckiser Group plc |
99 |
6,565 |
| October 31, 2022 |
J.P. Morgan International Equity Funds |
35 |
AS OF October 31, 2022 (continued)
| INVESTMENTS |
SHARES
(000) |
VALUE ($000) |
| Common Stocks — continued | ||
| United Kingdom — continued | ||
| RELX plc |
305 |
8,184 |
| Taylor Wimpey plc |
2,468 |
2,653 |
| |
|
91,176 |
| United States — 10.7% | ||
| Nestle SA (Registered) |
241 |
26,261 |
| Roche Holding AG |
54 |
17,973 |
| Schneider Electric SE |
63 |
7,968 |
| Stellantis NV |
423 |
5,694 |
| |
|
57,896 |
| Total Common Stocks (Cost $527,921) |
|
523,221 |
| Short-Term Investments — 1.2% | ||
| Investment Companies — 1.2% | ||
| JPMorgan Prime Money Market Fund Class Institutional Shares, 3.12% (b) (c)(Cost $6,343) |
6,342 |
6,343 |
| Total Investments — 98.1% (Cost $534,264) |
|
529,564 |
| Other Assets Less Liabilities — 1.9% |
|
10,017 |
| NET ASSETS — 100.0% |
|
539,581 |
| Percentages indicated are based on net assets. |
| Abbreviations |
|
| OYJ |
Public Limited Company |
| Preference |
A special type of equity investment that shares in the earnings of the company, has limited voting rights, and may have a dividend preference. Preference shares may also have liquidation preference. |
| * |
Non-income producing security. |
| (a) |
Security exempt from registration pursuant to Regulation S under the Securities Act of 1933, as amended. Regulation S applies to securities offerings that are made outside of the United States and do not involve direct selling efforts in the United States and as such may have restrictions on resale. |
| (b) |
Investment in an affiliated fund, which is registered under the Investment Company Act of 1940, as amended, and is advised by J.P. Morgan Investment Management Inc. |
| (c) |
The rate shown is the current yield as of October 31, 2022. |
| PORTFOLIO COMPOSITION BY ASSET CLASS AS OF October 31,
2022 |
PERCENT OF
TOTAL
INVESTMENTS |
| Pharmaceuticals |
13.9% |
| Banks |
11.3 |
| Oil, Gas & Consumable Fuels |
9.2 |
| Insurance |
7.7 |
| Food Products |
5.0 |
| Textiles, Apparel & Luxury Goods |
4.5 |
| Beverages |
4.3 |
| Electrical Equipment |
3.6 |
| Automobiles |
3.4 |
| Chemicals |
3.1 |
| Independent Power and Renewable Electricity Producers |
3.0 |
| Containers & Packaging |
2.9 |
| Food & Staples Retailing |
2.7 |
| Capital Markets |
2.5 |
| Trading Companies & Distributors |
2.4 |
| Metals & Mining |
2.3 |
| Diversified Telecommunication Services |
2.1 |
| Biotechnology |
2.0 |
| IT Services |
1.6 |
| Professional Services |
1.5 |
| Multi-Utilities |
1.4 |
| Construction & Engineering |
1.4 |
| Household Products |
1.2 |
| Airlines |
1.0 |
| Others (each less than 1.0%) |
4.8 |
| Short-Term Investments |
1.2 |
| 36 |
J.P. Morgan International Equity Funds |
October 31, 2022 |
| DESCRIPTION |
NUMBER OF
CONTRACTS |
EXPIRATION DATE |
TRADING CURRENCY |
NOTIONAL
AMOUNT ($) |
VALUE AND
UNREALIZED APPRECIATION
(DEPRECIATION) ($) |
| Long Contracts |
|
|
|
|
|
| EURO STOXX 50 Index |
57 |
12/16/2022 |
EUR |
2,038 |
5 |
| FTSE 100 Index |
14 |
12/16/2022 |
GBP |
1,142 |
9 |
| |
|
|
|
|
14 |
| Abbreviations |
|
| EUR |
Euro |
| FTSE |
Financial Times and the London Stock Exchange |
| GBP |
British Pound |
| October 31, 2022 |
J.P. Morgan International Equity Funds |
37 |
AS OF October 31, 2022
| INVESTMENTS |
SHARES
(000) |
VALUE ($000) |
| Common Stocks — 98.3% | ||
| Australia — 2.7% | ||
| BHP Group Ltd. |
591 |
14,101 |
| BHP Group Ltd. |
2,322 |
55,768 |
| Woodside Energy Group Ltd. |
1,261 |
29,156 |
| Woodside Energy Group Ltd. |
190 |
4,432
|
| |
|
103,457 |
| Austria — 0.6% | ||
| Erste Group Bank AG |
912 |
22,486 |
| Belgium — 1.2% | ||
| KBC Group NV |
872 |
43,695 |
| Denmark — 5.6% | ||
| Carlsberg A/S, Class B |
345 |
40,580 |
| Coloplast A/S, Class B |
245 |
27,369 |
| Genmab A/S * |
69 |
26,551 |
| Novo Nordisk A/S, Class B |
900 |
97,897 |
| Orsted A/S (a) |
254 |
20,946 |
| |
|
213,343 |
| Finland — 0.7% | ||
| Kone OYJ, Class B |
605 |
24,782 |
| France — 17.3% | ||
| AXA SA |
2,254 |
55,668 |
| BNP Paribas SA |
1,009 |
47,297 |
| Capgemini SE |
286 |
46,916 |
| Kering SA |
103 |
47,029 |
| L'Oreal SA |
201 |
63,055 |
| LVMH Moet Hennessy Louis Vuitton SE |
157 |
98,793 |
| Pernod Ricard SA |
243 |
42,708 |
| Safran SA |
395 |
44,015 |
| TotalEnergies SE |
2,879 |
157,055 |
| Vinci SA |
633 |
58,282 |
| |
|
660,818 |
| Germany — 8.8% | ||
| adidas AG |
172 |
16,755 |
| Allianz SE (Registered) |
361 |
64,940 |
| Deutsche Boerse AG |
361 |
58,732 |
| Deutsche Telekom AG (Registered) |
1,039 |
19,616 |
| Muenchener Rueckversicherungs-Gesellschaft AG (Registered) (b) |
238 |
62,893 |
| RWE AG |
1,357 |
52,222 |
| Symrise AG |
300 |
30,592 |
| Volkswagen AG (Preference) |
234 |
29,964 |
| |
|
335,714 |
| INVESTMENTS |
SHARES
(000) |
VALUE ($000) |
| | ||
| Hong Kong — 3.7% | ||
| AIA Group Ltd. |
8,250 |
62,492 |
| Hong Kong Exchanges & Clearing Ltd. |
920 |
24,428 |
| Prudential plc |
3,213 |
29,851 |
| Techtronic Industries Co. Ltd. |
2,415 |
22,862 |
| |
|
139,633 |
| India — 1.2% | ||
| HDFC Bank Ltd., ADR |
740 |
46,123 |
| Japan — 17.0% | ||
| Bridgestone Corp. |
1,352 |
48,901 |
| Daikin Industries Ltd. |
353 |
52,905 |
| Hoya Corp. |
507 |
47,094 |
| Keyence Corp. |
180 |
67,985 |
| Kubota Corp. |
1,172 |
16,345 |
| Kyowa Kirin Co. Ltd. |
1,538 |
36,218 |
| Makita Corp. |
695 |
12,707 |
| Nidec Corp. |
532 |
29,262 |
| Nippon Telegraph & Telephone Corp. |
2,106 |
58,085 |
| Recruit Holdings Co. Ltd. |
1,134 |
34,910 |
| Shin-Etsu Chemical Co. Ltd. |
516 |
53,576 |
| SMC Corp. |
82 |
32,835 |
| Sony Group Corp. |
969 |
65,324 |
| Tokio Marine Holdings, Inc. |
3,003 |
54,370 |
| Tokyo Electron Ltd. |
143 |
37,570 |
| |
|
648,087 |
| Netherlands — 5.7% | ||
| ASML Holding NV (b) |
184 |
86,050 |
| ING Groep NV |
3,708 |
36,485 |
| Shell plc |
3,418 |
94,688 |
| |
|
217,223 |
| Singapore — 2.4% | ||
| DBS Group Holdings Ltd. |
3,828 |
92,557 |
| South Africa — 1.0% | ||
| Anglo American plc |
1,281 |
38,357 |
| South Korea — 1.6% | ||
| Delivery Hero SE * (a) (b) |
381 |
12,530 |
| Samsung Electronics Co. Ltd., GDR (a) |
24 |
25,486 |
| Samsung Electronics Co. Ltd., GDR (a) |
23 |
23,458 |
| |
|
61,474 |
| Spain — 1.7% | ||
| Iberdrola SA |
6,404 |
65,120 |
| 38 |
J.P. Morgan International Equity Funds |
October 31, 2022 |
| INVESTMENTS |
SHARES
(000) |
VALUE ($000) |
| Common Stocks — continued | ||
| Sweden — 3.9% | ||
| Assa Abloy AB, Class B |
1,581 |
31,927 |
| Atlas Copco AB, Class A |
3,695 |
39,441 |
| Svenska Handelsbanken AB, Class A |
5,040 |
46,829 |
| Volvo AB, Class B |
1,843 |
30,160 |
| |
|
148,357 |
| Switzerland — 2.2% | ||
| Lonza Group AG (Registered) |
95 |
48,681 |
| SGS SA (Registered) |
11 |
23,879 |
| Straumann Holding AG (Registered) |
123 |
11,755 |
| |
|
84,315 |
| Taiwan — 0.7% | ||
| Taiwan Semiconductor Manufacturing Co. Ltd., ADR |
427 |
26,302 |
| United Kingdom — 9.7% | ||
| AstraZeneca plc |
821 |
96,286 |
| Diageo plc |
2,222 |
91,457 |
| Haleon plc * |
662 |
2,031 |
| Linde plc (b) |
164 |
48,942 |
| London Stock Exchange Group plc |
542 |
46,965 |
| Persimmon plc |
1,269 |
18,994 |
| RELX plc |
2,386 |
64,136 |
| |
|
368,811 |
| United States — 10.6% | ||
| Ferguson plc |
360 |
39,257 |
| GSK plc |
1,200 |
19,657 |
| Nestle SA (Registered) |
1,411 |
153,618 |
| Roche Holding AG |
410 |
135,879 |
| Schneider Electric SE |
437 |
55,229 |
| |
|
403,640 |
| Total Common Stocks (Cost $3,666,547) |
|
3,744,294 |
| Short-Term Investments — 4.2% | ||
| Investment Companies — 1.5% | ||
| JPMorgan Prime Money Market Fund Class Institutional Shares, 3.12% (c) (d)(Cost
$57,919) |
57,914 |
57,920 |
| Investment of Cash Collateral from Securities Loaned — 2.7% | ||
| JPMorgan Securities Lending Money Market Fund Agency SL Class Shares, 3.23% (c) (d) |
93,075 |
93,074 |
| INVESTMENTS |
SHARES
(000) |
VALUE ($000) |
| | ||
| Investment of Cash Collateral from Securities Loaned — continued | ||
| JPMorgan U.S. Government Money Market Fund Class IM Shares, 2.85% (c) (d) |
10,497 |
10,497 |
| Total Investment of Cash Collateral from Securities Loaned (Cost
$103,567) |
|
103,571 |
| Total Short-Term Investments (Cost $161,486) |
|
161,491 |
| Total Investments — 102.5% (Cost $3,828,033) |
|
3,905,785 |
| Liabilities in Excess of Other Assets — (2.5)% |
|
(94,595) |
| NET ASSETS — 100.0% |
|
3,811,190 |
| Percentages indicated are based on net assets. |
| Abbreviations |
|
| ADR |
American Depositary Receipt |
| GDR |
Global Depositary Receipt |
| OYJ |
Public Limited Company |
| Preference |
A special type of equity investment that shares in the earnings of the company, has limited voting rights, and may have a dividend preference. Preference shares may also have liquidation preference. |
| * |
Non-income producing security. |
| (a) |
Security exempt from registration pursuant to Regulation S under the Securities Act of 1933, as amended. Regulation S applies to securities offerings that are made outside of the United States and do not involve direct selling efforts in the United States and as such may have restrictions on resale. |
| (b) |
The security or a portion of this security is on loan at October 31, 2022. The total value of securities on loan at October 31, 2022 is $97,049. |
| (c) |
Investment in an affiliated fund, which is registered under the Investment Company Act of 1940, as amended, and is advised by J.P. Morgan Investment Management Inc. |
| (d) |
The rate shown is the current yield as of October 31, 2022. |
| October 31, 2022 |
J.P. Morgan International Equity Funds |
39 |
AS OF October 31, 2022 (continued)
| PORTFOLIO COMPOSITION BY ASSET CLASS AS OF October 31,
2022 |
PERCENT OF
TOTAL
INVESTMENTS |
| Pharmaceuticals |
9.9% |
| Banks |
8.6 |
| Insurance |
8.5 |
| Oil, Gas & Consumable Fuels |
7.3 |
| Machinery |
4.6 |
| Beverages |
4.5 |
| Textiles, Apparel & Luxury Goods |
4.2 |
| Food Products |
3.9 |
| Semiconductors & Semiconductor Equipment |
3.8 |
| Chemicals |
3.4 |
| Capital Markets |
3.3 |
| Professional Services |
3.1 |
| Metals & Mining |
2.8 |
| Health Care Equipment & Supplies |
2.2 |
| Electric Utilities |
2.2 |
| Building Products |
2.2 |
| Electrical Equipment |
2.2 |
| Household Durables |
2.2 |
| Diversified Telecommunication Services |
2.0 |
| Electronic Equipment, Instruments & Components |
1.7 |
| Personal Products |
1.7 |
| Construction & Engineering |
1.5 |
| Independent Power and Renewable Electricity Producers |
1.3 |
| Technology Hardware, Storage & Peripherals |
1.3 |
| Auto Components |
1.2 |
| Life Sciences Tools & Services |
1.2 |
| IT Services |
1.2 |
| Aerospace & Defense |
1.1 |
| Trading Companies & Distributors |
1.0 |
| Others (each less than 1.0%) |
1.8 |
| Short-Term Investments |
4.1 |
| 40 |
J.P. Morgan International Equity Funds |
October 31, 2022 |
AS OF October 31, 2022
| INVESTMENTS |
SHARES
(000) |
VALUE ($000) |
| Common Stocks — 97.1% | ||
| Australia — 3.6% | ||
| BHP Group Ltd. |
1,134 |
27,075 |
| Woodside Energy Group Ltd. |
296 |
6,835 |
| Woodside Energy Group Ltd. |
254 |
5,910
|
| |
|
39,820 |
| Belgium — 1.7% | ||
| KBC Group NV |
374 |
18,763 |
| Canada — 8.1% | ||
| Alimentation Couche-Tard, Inc. |
447 |
20,033 |
| Canadian National Railway Co. |
288 |
34,073 |
| Toronto-Dominion Bank (The) |
534 |
34,160 |
| |
|
88,266 |
| China — 1.6% | ||
| Tencent Holdings Ltd. |
675 |
17,742 |
| Denmark — 4.4% | ||
| Coloplast A/S, Class B |
129 |
14,391 |
| Novo Nordisk A/S, Class B |
307 |
33,414 |
| |
|
47,805 |
| France — 11.6% | ||
| Capgemini SE |
101 |
16,452 |
| L'Oreal SA |
70 |
22,078 |
| LVMH Moet Hennessy Louis Vuitton SE |
48 |
30,430 |
| TotalEnergies SE |
538 |
29,355 |
| Vinci SA |
316 |
29,093 |
| |
|
127,408 |
| Germany — 5.6% | ||
| adidas AG |
95 |
9,224 |
| Allianz SE (Registered) |
150 |
27,072 |
| Deutsche Boerse AG |
73 |
11,866 |
| RWE AG |
344 |
13,240 |
| |
|
61,402 |
| Hong Kong — 3.0% | ||
| AIA Group Ltd. |
3,136 |
23,753 |
| Hong Kong Exchanges & Clearing Ltd. |
328 |
8,714 |
| |
|
32,467 |
| India — 3.0% | ||
| HDFC Bank Ltd., ADR |
531 |
33,108 |
| Indonesia — 2.0% | ||
| Bank Central Asia Tbk. PT |
38,091 |
21,532 |
| INVESTMENTS |
SHARES
(000) |
VALUE ($000) |
| | ||
| Japan — 7.0% | ||
| Hoya Corp. |
135 |
12,587 |
| Keyence Corp. |
47 |
17,798 |
| Shin-Etsu Chemical Co. Ltd. |
115 |
11,962 |
| Sony Group Corp. |
296 |
19,954 |
| Tokio Marine Holdings, Inc. |
807 |
14,600 |
| |
|
76,901 |
| Mexico — 1.3% | ||
| Wal-Mart de Mexico SAB de CV |
3,777 |
14,589 |
| Netherlands — 7.0% | ||
| ASML Holding NV (a) |
53 |
24,850 |
| Shell plc |
1,845 |
51,115 |
| |
|
75,965 |
| Singapore — 3.0% | ||
| DBS Group Holdings Ltd. |
1,352 |
32,679 |
| South Africa — 1.3% | ||
| Anglo American plc |
485 |
14,528 |
| South Korea — 4.3% | ||
| Delivery Hero SE * (a) (b) |
201 |
6,605 |
| Samsung Electronics Co. Ltd. |
962 |
40,051 |
| |
|
46,656 |
| Spain — 2.2% | ||
| Iberdrola SA |
2,383 |
24,229 |
| Sweden — 1.5% | ||
| Atlas Copco AB, Class A |
1,541 |
16,452 |
| Switzerland — 1.4% | ||
| Lonza Group AG (Registered) |
30 |
15,617 |
| Taiwan — 2.7% | ||
| Taiwan Semiconductor Manufacturing Co. Ltd., ADR |
481 |
29,570 |
| United Kingdom — 10.0% | ||
| AstraZeneca plc |
126 |
14,812 |
| Diageo plc |
807 |
33,190 |
| Linde plc (a) |
90 |
26,857 |
| Persimmon plc |
563 |
8,425 |
| RELX plc |
965 |
25,947 |
| |
|
109,231 |
| United States — 10.8% | ||
| Ferguson plc |
166 |
18,106 |
| Nestle SA (Registered) |
456 |
49,654 |
| October 31, 2022 |
J.P. Morgan International Equity Funds |
41 |
AS OF October 31, 2022 (continued)
| INVESTMENTS |
SHARES
(000) |
VALUE ($000) |
| Common Stocks — continued | ||
| United States — continued | ||
| Roche Holding AG |
99 |
32,723 |
| Schneider Electric SE |
140 |
17,711 |
| |
|
118,194 |
| Total Common Stocks (Cost $1,046,890) |
|
1,062,924 |
| Short-Term Investments — 7.0% | ||
| Investment Companies — 1.8% | ||
| JPMorgan Prime Money Market Fund Class Institutional Shares, 3.12% (c) (d)(Cost
$19,898) |
19,894 |
19,897 |
| Investment of Cash Collateral from Securities Loaned — 5.2% | ||
| JPMorgan Securities Lending Money Market Fund Agency SL Class Shares, 3.23% (c) (d) |
40,011 |
40,011 |
| JPMorgan U.S. Government Money Market Fund Class IM Shares, 2.85% (c) (d) |
16,404 |
16,404 |
| Total Investment of Cash Collateral from Securities Loaned (Cost
$56,412) |
|
56,415 |
| Total Short-Term Investments (Cost $76,310) |
|
76,312 |
| Total Investments — 104.1% (Cost $1,123,200) |
|
1,139,236 |
| Liabilities in Excess of Other Assets — (4.1)% |
|
(44,455) |
| NET ASSETS — 100.0% |
|
1,094,781 |
| Percentages indicated are based on net assets. |
| Abbreviations |
|
| ADR |
American Depositary Receipt |
| PT |
Limited liability company |
| * |
Non-income producing security. |
| (a) |
The security or a portion of this security is on loan at October 31, 2022. The total value of securities on loan at October 31, 2022 is $26,619. |
| (b) |
Security exempt from registration pursuant to Regulation S under the Securities Act of 1933, as amended. Regulation S applies to securities offerings that are made outside of the United States and do not involve direct selling efforts in the United States and as such may have restrictions on resale. |
| (c) |
Investment in an affiliated fund, which is registered under the Investment Company Act of 1940, as amended, and is advised by J.P. Morgan Investment Management Inc. |
| (d) |
The rate shown is the current yield as of October 31, 2022. |
| INDUSTRY October 31,
2022 |
PERCENT OF
TOTAL
INVESTMENTS |
| Banks |
12.3% |
| Oil, Gas & Consumable Fuels |
8.2 |
| Pharmaceuticals |
7.1 |
| Insurance |
5.7 |
| Semiconductors & Semiconductor Equipment |
4.8 |
| Food Products |
4.4 |
| Metals & Mining |
3.6 |
| Technology Hardware, Storage & Peripherals |
3.5 |
| Textiles, Apparel & Luxury Goods |
3.5 |
| Chemicals |
3.4 |
| Food & Staples Retailing |
3.0 |
| Road & Rail |
3.0 |
| Beverages |
2.9 |
| Construction & Engineering |
2.5 |
| Household Durables |
2.5 |
| Health Care Equipment & Supplies |
2.4 |
| Professional Services |
2.3 |
| Electric Utilities |
2.1 |
| Personal Products |
1.9 |
| Capital Markets |
1.8 |
| Trading Companies & Distributors |
1.6 |
| Electronic Equipment, Instruments & Components |
1.6 |
| Interactive Media & Services |
1.6 |
| Electrical Equipment |
1.6 |
| IT Services |
1.4 |
| Machinery |
1.4 |
| Life Sciences Tools & Services |
1.4 |
| Independent Power and Renewable Electricity Producers |
1.2 |
| Internet & Direct Marketing Retail |
0.6 |
| Short-Term Investments |
6.7 |
| 42 |
J.P. Morgan International Equity Funds |
October 31, 2022 |
AS OF October 31, 2022
| INVESTMENTS |
SHARES
(000) |
VALUE ($000) |
| Common Stocks — 94.1% | ||
| Australia — 6.0% | ||
| Aurizon Holdings Ltd. |
35 |
81 |
| BHP Group Ltd. |
48 |
1,155 |
| Commonwealth Bank of Australia |
14 |
909 |
| Dexus, REIT |
70 |
347 |
| Endeavour Group Ltd. |
32 |
147 |
| Goodman Group, REIT |
53 |
582 |
| GPT Group (The), REIT |
46 |
127 |
| Insurance Australia Group Ltd. |
52 |
164 |
| Macquarie Group Ltd. |
6 |
694 |
| Medibank Pvt Ltd. |
138 |
248 |
| Mirvac Group, REIT |
161 |
213 |
| National Australia Bank Ltd. |
21 |
439 |
| Newcrest Mining Ltd. |
9 |
102 |
| QBE Insurance Group Ltd. |
41 |
318 |
| Rio Tinto Ltd. |
21 |
1,220 |
| Rio Tinto plc |
10 |
519 |
| Santos Ltd. |
92 |
451 |
| Wesfarmers Ltd. |
12 |
336 |
| Westpac Banking Corp. |
61 |
938 |
| Woodside Energy Group Ltd. |
9 |
201 |
| Woolworths Group Ltd. |
21 |
437 |
| |
|
9,628 |
| Belgium — 0.5% | ||
| KBC Group NV |
15 |
732 |
| China — 0.6% | ||
| BOC Hong Kong Holdings Ltd. |
131 |
405 |
| Prosus NV * |
9 |
404 |
| Xinyi Glass Holdings Ltd. |
160 |
206 |
| |
|
1,015 |
| Denmark — 3.3% | ||
| Carlsberg A/S, Class B |
7 |
883 |
| Genmab A/S * |
1 |
229 |
| Novo Nordisk A/S, Class B |
29 |
3,106 |
| Orsted A/S (a) |
11 |
898 |
| Vestas Wind Systems A/S |
7 |
149 |
| |
|
5,265 |
| Finland — 0.9% | ||
| Kone OYJ, Class B |
9 |
356 |
| Nokia OYJ |
66 |
294 |
| Nordea Bank Abp |
85 |
812 |
| |
|
1,462 |
| INVESTMENTS |
SHARES
(000) |
VALUE ($000) |
| | ||
| France — 11.0% | ||
| Air Liquide SA |
13 |
1,745 |
| Airbus SE |
5 |
475 |
| Alstom SA |
16 |
328 |
| BNP Paribas SA |
28 |
1,327 |
| Capgemini SE |
8 |
1,318 |
| Kering SA |
1 |
604 |
| L'Oreal SA |
6 |
1,878 |
| LVMH Moet Hennessy Louis Vuitton SE |
5 |
3,163 |
| Pernod Ricard SA |
2 |
386 |
| Safran SA |
7 |
815 |
| Sanofi |
6 |
525 |
| Societe Generale SA |
20 |
446 |
| TotalEnergies SE |
42 |
2,265 |
| Veolia Environnement SA |
42 |
930 |
| Vinci SA |
17 |
1,567 |
| |
|
17,772 |
| Germany — 8.3% | ||
| adidas AG |
5 |
467 |
| Allianz SE (Registered) |
10 |
1,897 |
| BASF SE |
2 |
81 |
| Bayer AG (Registered) |
8 |
424 |
| Brenntag SE |
2 |
133 |
| Deutsche Post AG (Registered) |
25 |
886 |
| Deutsche Telekom AG (Registered) |
97 |
1,836 |
| Infineon Technologies AG |
40 |
976 |
| Mercedes-Benz Group AG |
3 |
150 |
| Merck KGaA |
3 |
505 |
| Muenchener Rueckversicherungs-Gesellschaft AG (Registered) |
5 |
1,248 |
| RWE AG |
36 |
1,373 |
| SAP SE |
12 |
1,185 |
| Siemens AG (Registered) |
9 |
971 |
| Symrise AG |
5 |
473 |
| Volkswagen AG (Preference) |
5 |
654 |
| Zalando SE * (a) |
8 |
184 |
| |
|
13,443 |
| Hong Kong — 2.2% | ||
| AIA Group Ltd. |
150 |
1,136 |
| CK Asset Holdings Ltd. |
57 |
315 |
| CLP Holdings Ltd. |
13 |
87 |
| Hong Kong Exchanges & Clearing Ltd. |
20 |
518 |
| Link, REIT |
53 |
313 |
| Prudential plc |
45 |
422 |
| October 31, 2022 |
J.P. Morgan International Equity Funds |
43 |
AS OF October 31, 2022 (continued)
| INVESTMENTS |
SHARES
(000) |
VALUE ($000) |
| Common Stocks — continued | ||
| Hong Kong — continued | ||
| Sun Hung Kai Properties Ltd. |
24 |
258 |
| Techtronic Industries Co. Ltd. |
48 |
455 |
| |
|
3,504 |
| Ireland — 0.3% | ||
| Kingspan Group plc |
3 |
161 |
| Kingspan Group plc |
7 |
371 |
| |
|
532 |
| Italy — 0.7% | ||
| Enel SpA |
12 |
54 |
| FinecoBank Banca Fineco SpA |
54 |
722 |
| UniCredit SpA |
29 |
362 |
| |
|
1,138 |
| Japan — 21.7% | ||
| AGC, Inc. |
7 |
223 |
| Asahi Group Holdings Ltd. |
26 |
725 |
| Asahi Kasei Corp. |
77 |
491 |
| Bridgestone Corp. |
25 |
893 |
| Capcom Co. Ltd. |
14 |
389 |
| Central Japan Railway Co. |
7 |
845 |
| Daiichi Sankyo Co. Ltd. |
39 |
1,258 |
| Daikin Industries Ltd. |
6 |
959 |
| Daito Trust Construction Co. Ltd. |
1 |
99 |
| Daiwa House Industry Co. Ltd. |
31 |
617 |
| Denso Corp. |
10 |
481 |
| Dentsu Group, Inc. |
29 |
914 |
| Fast Retailing Co. Ltd. |
— |
111 |
| Hitachi Ltd. |
27 |
1,216 |
| Honda Motor Co. Ltd. |
42 |
962 |
| Hoya Corp. |
12 |
1,078 |
| ITOCHU Corp. |
32 |
837 |
| Japan Airlines Co. Ltd. * |
18 |
333 |
| Kao Corp. |
12 |
437 |
| Keyence Corp. |
4 |
1,433 |
| Konami Group Corp. |
8 |
355 |
| Kubota Corp. |
18 |
254 |
| Kyowa Kirin Co. Ltd. |
20 |
483 |
| Mitsubishi Corp. |
29 |
783 |
| Mitsubishi UFJ Financial Group, Inc. |
131 |
618 |
| Mitsui Fudosan Co. Ltd. |
39 |
745 |
| Murata Manufacturing Co. Ltd. |
13 |
630 |
| Nidec Corp. |
5 |
286 |
| Nintendo Co. Ltd. |
8 |
325 |
| INVESTMENTS |
SHARES
(000) |
VALUE ($000) |
| | ||
| Japan — continued | ||
| NIPPON EXPRESS HOLDINGS, Inc. |
7 |
332 |
| Nippon Paint Holdings Co. Ltd. |
63 |
404 |
| Nippon Steel Corp. |
12 |
167 |
| Nippon Telegraph & Telephone Corp. |
37 |
1,015 |
| Nomura Research Institute Ltd. |
19 |
429 |
| Ono Pharmaceutical Co. Ltd. |
17 |
393 |
| ORIX Corp. |
41 |
602 |
| Otsuka Corp. |
14 |
444 |
| Recruit Holdings Co. Ltd. |
18 |
539 |
| Rohm Co. Ltd. |
5 |
358 |
| Seven & i Holdings Co. Ltd. |
13 |
482 |
| Shimadzu Corp. |
7 |
192 |
| Shin-Etsu Chemical Co. Ltd. |
9 |
946 |
| Shionogi & Co. Ltd. |
9 |
413 |
| SoftBank Group Corp. |
11 |
459 |
| Sony Group Corp. |
23 |
1,524 |
| Sumitomo Electric Industries Ltd. |
45 |
474 |
| Sumitomo Metal Mining Co. Ltd. |
13 |
376 |
| Sumitomo Mitsui Financial Group, Inc. |
38 |
1,062 |
| Suzuki Motor Corp. |
20 |
669 |
| T&D Holdings, Inc. |
40 |
397 |
| Takeda Pharmaceutical Co. Ltd. |
5 |
127 |
| Terumo Corp. |
24 |
734 |
| Tokio Marine Holdings, Inc. |
64 |
1,168 |
| Tokyo Electron Ltd. |
4 |
947 |
| Toyota Motor Corp. |
112 |
1,557 |
| |
|
34,990 |
| Luxembourg — 0.1% | ||
| ArcelorMittal SA |
8 |
184 |
| Netherlands — 6.5% | ||
| Adyen NV * (a) |
— |
407 |
| Akzo Nobel NV |
14 |
828 |
| ASML Holding NV |
7 |
3,109 |
| Koninklijke Ahold Delhaize NV |
19 |
541 |
| Koninklijke DSM NV |
6 |
752 |
| Koninklijke KPN NV |
260 |
727 |
| NN Group NV |
17 |
722 |
| Shell plc |
99 |
2,742 |
| Wolters Kluwer NV |
6 |
639 |
| |
|
10,467 |
| Singapore — 1.1% | ||
| DBS Group Holdings Ltd. |
43 |
1,054 |
| 44 |
J.P. Morgan International Equity Funds |
October 31, 2022 |
| INVESTMENTS |
SHARES
(000) |
VALUE ($000) |
| Common Stocks — continued | ||
| Singapore — continued | ||
| Oversea-Chinese Banking Corp. Ltd. |
20 |
171 |
| Sea Ltd., ADR * |
2 |
79 |
| United Overseas Bank Ltd. |
22 |
424 |
| |
|
1,728 |
| South Korea — 0.1% | ||
| Delivery Hero SE * (a) |
4 |
128 |
| Spain — 2.4% | ||
| Banco Bilbao Vizcaya Argentaria SA |
229 |
1,183 |
| Banco Santander SA |
80 |
208 |
| Iberdrola SA |
190 |
1,930 |
| Industria de Diseno Textil SA |
27 |
609 |
| |
|
3,930 |
| Sweden — 1.9% | ||
| Atlas Copco AB, Class A |
85 |
909 |
| Boliden AB |
12 |
357 |
| SKF AB, Class B |
39 |
557 |
| Volvo AB, Class B |
77 |
1,264 |
| |
|
3,087 |
| Switzerland — 5.3% | ||
| Cie Financiere Richemont SA (Registered) |
3 |
321 |
| Givaudan SA (Registered) |
— |
191 |
| Julius Baer Group Ltd. |
3 |
144 |
| Lonza Group AG (Registered) |
3 |
1,513 |
| Novartis AG (Registered) |
34 |
2,727 |
| SGS SA (Registered) |
— |
712 |
| Sika AG (Registered) |
5 |
992 |
| UBS Group AG (Registered) |
36 |
575 |
| Zurich Insurance Group AG |
3 |
1,364 |
| |
|
8,539 |
| United Kingdom — 13.1% | ||
| 3i Group plc |
104 |
1,389 |
| AstraZeneca plc |
23 |
2,697 |
| Barclays plc |
687 |
1,167 |
| Berkeley Group Holdings plc |
17 |
661 |
| BP plc |
469 |
2,594 |
| British American Tobacco plc |
17 |
690 |
| CK Hutchison Holdings Ltd. |
19 |
94 |
| DCC plc |
5 |
276 |
| Diageo plc |
52 |
2,143 |
| HSBC Holdings plc |
145 |
746 |
| InterContinental Hotels Group plc |
17 |
892 |
| INVESTMENTS |
SHARES
(000) |
VALUE ($000) |
| | ||
| United Kingdom — continued | ||
| Intertek Group plc |
2 |
94 |
| Lloyds Banking Group plc |
2,250 |
1,080 |
| London Stock Exchange Group plc |
1 |
128 |
| Reckitt Benckiser Group plc |
19 |
1,254 |
| RELX plc |
59 |
1,574 |
| SSE plc |
58 |
1,044 |
| Standard Chartered plc |
134 |
803 |
| Taylor Wimpey plc |
147 |
158 |
| Tesco plc |
265 |
655 |
| Unilever plc |
21 |
953 |
| |
|
21,092 |
| United States — 8.1% | ||
| CSL Ltd. |
5 |
1,001 |
| Ferguson plc |
1 |
114 |
| GSK plc |
25 |
406 |
| Nestle SA (Registered) |
41 |
4,453 |
| Roche Holding AG |
12 |
3,975 |
| Schneider Electric SE |
14 |
1,722 |
| Stellantis NV |
98 |
1,320 |
| |
|
12,991 |
| Total Common Stocks (Cost $160,682) |
|
151,627 |
| |
NO. OF
CONTRACTS |
|
| Options Purchased — 1.1% | ||
| Put Options Purchased — 1.1% | ||
| United States — 1.1% | ||
| MSCI EAFE Index |
|
|
| 12/30/2022 at USD 1,575.00, European Style |
|
|
| Notional Amount: USD 159,600 |
|
|
| Counterparty: Exchange-Traded * (Cost $4,516) |
912 |
1,806 |
| |
SHARES
(000) |
|
| Short-Term Investments — 3.8% | ||
| Investment Companies — 3.8% | ||
| JPMorgan U.S. Government Money Market Fund Class Institutional Shares, 2.79% (b) (c)(Cost
$6,096) |
6,096 |
6,096 |
| Total Investments — 99.0% (Cost $171,294) |
|
159,529 |
| Other Assets Less Liabilities — 1.0% |
|
1,678 |
| NET ASSETS — 100.0% |
|
161,207 |
| October 31, 2022 |
J.P. Morgan International Equity Funds |
45 |
AS OF October 31, 2022 (continued)
| Percentages indicated are based on net assets. | ||
| Amounts presented as a dash ("-") represent amounts that round to less than a thousand. |
| Abbreviations |
|
| ADR |
American Depositary Receipt |
| EAFE |
Europe, Australasia and Far East |
| MSCI |
Morgan Stanley Capital International |
| OYJ |
Public Limited Company |
| Preference |
A special type of equity investment that shares in the earnings of the company, has limited voting rights, and may have a dividend preference. Preference shares may also have liquidation preference. |
| REIT |
Real Estate Investment Trust |
| USD |
United States Dollar |
| * |
Non-income producing security. |
| (a) |
Security exempt from registration pursuant to Regulation S under the Securities Act of 1933, as amended. Regulation S applies to securities offerings that are made outside of the United States and do not involve direct selling efforts in the United States and as such may have restrictions on resale. |
| (b) |
Investment in an affiliated fund, which is registered under the Investment Company Act of 1940, as amended, and is advised by J.P. Morgan Investment Management Inc. |
| (c) |
The rate shown is the current yield as of October 31, 2022. |
| INDUSTRY October 31,
2022 |
PERCENT OF
TOTAL
INVESTMENTS |
| Pharmaceuticals |
10.7% |
| Banks |
9.8 |
| Insurance |
5.7 |
| Oil, Gas & Consumable Fuels |
5.2 |
| Chemicals |
4.3 |
| Semiconductors & Semiconductor Equipment |
3.4 |
| Automobiles |
3.3 |
| Textiles, Apparel & Luxury Goods |
2.9 |
| Food Products |
2.8 |
| Beverages |
2.6 |
| Machinery |
2.6 |
| Metals & Mining |
2.6 |
| Electric Utilities |
2.5 |
| Diversified Telecommunication Services |
2.2 |
| Professional Services |
2.2 |
| Capital Markets |
2.2 |
| Personal Products |
2.0 |
| IT Services |
1.6 |
| Industrial Conglomerates |
1.6 |
| Household Durables |
1.5 |
| Food & Staples Retailing |
1.4 |
| Electronic Equipment, Instruments & Components |
1.4 |
| Electrical Equipment |
1.3 |
| Real Estate Management & Development |
1.3 |
| Building Products |
1.2 |
| Trading Companies & Distributors |
1.2 |
| Auto Components |
1.2 |
| Health Care Equipment & Supplies |
1.1 |
| Index Funds |
1.1 |
| Equity Real Estate Investment Trusts (REITs) |
1.0 |
| Construction & Engineering |
1.0 |
| Others (each less than 1.0%) |
11.3 |
| Short-Term Investments |
3.8 |
| 46 |
J.P. Morgan International Equity Funds |
October 31, 2022 |
| DESCRIPTION |
NUMBER OF
CONTRACTS |
EXPIRATION DATE |
TRADING CURRENCY |
NOTIONAL
AMOUNT ($) |
VALUE AND
UNREALIZED APPRECIATION
(DEPRECIATION) ($) |
| Long Contracts |
|
|
|
|
|
| SPI 200 Index |
31 |
12/15/2022 |
AUD |
3,404 |
(77) |
| MSCI EAFE E-Mini Index |
47 |
12/16/2022 |
USD |
4,127 |
207 |
| |
|
|
|
|
130 |
| Abbreviations |
|
| AUD |
Australian Dollar |
| EAFE |
Europe, Australasia and Far East |
| MSCI |
Morgan Stanley Capital International |
| SPI |
Australian Securities Exchange |
| USD |
United States Dollar |
| Written Call Options Contracts as of October 31, 2022 (amounts in thousands, except number of contracts):
| ||||||
| DESCRIPTION |
COUNTERPARTY |
NUMBER OF
CONTRACTS |
NOTIONAL
AMOUNT |
EXERCISE
PRICE |
EXPIRATION
DATE |
VALUE ($) |
| MSCI EAFE Index |
Exchange-Traded |
912 |
USD 159,600 |
USD 1,780.00 |
12/30/2022 |
(4,998) |
| Written Put Options Contracts as of October 31, 2022 | ||||||
| DESCRIPTION |
COUNTERPARTY |
NUMBER OF
CONTRACTS |
NOTIONAL
AMOUNT |
EXERCISE
PRICE |
EXPIRATION
DATE |
VALUE ($) |
| MSCI EAFE Index |
Exchange-Traded |
912 |
USD 159,600
|
USD 1,325.00
|
12/30/2022 |
(342) |
| Total Written Options Contracts (Premiums Received $4,555) |
(5,340) | |||||
| Abbreviations |
|
| EAFE |
Europe, Australasia and Far East |
| MSCI |
Morgan Stanley Capital International |
| USD |
United States Dollar |
| October 31, 2022 |
J.P. Morgan International Equity Funds |
47 |
AS OF October 31, 2022
| INVESTMENTS |
SHARES
(000) |
VALUE ($000) |
| Common Stocks — 95.3% | ||
| Australia — 8.4% | ||
| Australia & New Zealand Banking Group Ltd. |
177 |
2,903 |
| BHP Group Ltd. |
266 |
6,381 |
| BlueScope Steel Ltd. |
117 |
1,176 |
| Coronado Global Resources, Inc., CDI (a) |
989 |
1,180 |
| Glencore plc |
695 |
3,985 |
| JB Hi-Fi Ltd. |
11 |
310 |
| Metcash Ltd. |
136 |
356 |
| National Australia Bank Ltd. |
53 |
1,109 |
| Qantas Airways Ltd. * |
268 |
1,001 |
| Rio Tinto Ltd. |
24 |
1,380 |
| Rio Tinto plc |
54 |
2,808 |
| South32 Ltd. |
291 |
668 |
| Westpac Banking Corp. |
250 |
3,869 |
| Woodside Energy Group Ltd. |
119 |
2,743 |
| |
|
29,869 |
| Austria — 1.1% | ||
| ANDRITZ AG |
12 |
569 |
| BAWAG Group AG * (a) |
14 |
692 |
| Erste Group Bank AG |
25 |
607 |
| OMV AG |
34 |
1,566 |
| Telekom Austria AG * |
59 |
342 |
| |
|
3,776 |
| Belgium — 0.2% | ||
| Ageas SA |
18 |
640 |
| Telenet Group Holding NV |
9 |
136 |
| |
|
776 |
| China — 0.7% | ||
| BOC Hong Kong Holdings Ltd. |
316 |
980 |
| Yangzijiang Shipbuilding Holdings Ltd. |
1,786 |
1,515 |
| |
|
2,495 |
| Denmark — 1.6% | ||
| D/S Norden A/S |
22 |
1,147 |
| Drilling Co. of 1972 A/S (The) * |
18 |
905 |
| ISS A/S * |
47 |
859 |
| Jyske Bank A/S (Registered) * |
11 |
594 |
| Solar A/S, Class B |
9 |
663 |
| Spar Nord Bank A/S |
83 |
1,006 |
| Sydbank A/S |
23 |
695 |
| |
|
5,869 |
| Egypt — 0.3% | ||
| Energean plc |
74 |
1,213 |
| INVESTMENTS |
SHARES
(000) |
VALUE ($000) |
| | ||
| Finland — 1.5% | ||
| Nokia OYJ |
371 |
1,646 |
| Nordea Bank Abp |
277 |
2,645 |
| Outokumpu OYJ |
215 |
863 |
| TietoEVRY OYJ |
10 |
244 |
| |
|
5,398 |
| France — 10.2% | ||
| AXA SA |
117 |
2,890 |
| BNP Paribas SA |
75 |
3,491 |
| Carrefour SA |
81 |
1,308 |
| Cie de Saint-Gobain |
25 |
1,006 |
| Coface SA |
41 |
460 |
| Eiffage SA |
12 |
1,035 |
| Engie SA |
154 |
2,006 |
| IPSOS |
18 |
874 |
| Orange SA |
177 |
1,682 |
| Publicis Groupe SA |
20 |
1,124 |
| Renault SA * |
46 |
1,422 |
| Rothschild & Co. |
28 |
998 |
| Sanofi |
71 |
6,142 |
| Societe Generale SA |
70 |
1,600 |
| Sopra Steria Group SACA |
3 |
371 |
| SPIE SA |
25 |
592 |
| Technip Energies NV |
79 |
1,015 |
| TotalEnergies SE |
138 |
7,551 |
| Verallia SA (a) |
33 |
933 |
| |
|
36,500 |
| Germany — 8.7% | ||
| Allianz SE (Registered) |
21 |
3,771 |
| Aurubis AG |
7 |
455 |
| Bayer AG (Registered) |
64 |
3,364 |
| Bayerische Motoren Werke AG |
23 |
1,811 |
| Daimler Truck Holding AG * |
26 |
679 |
| Deutsche Bank AG (Registered) |
148 |
1,415 |
| Deutsche Pfandbriefbank AG (a) |
77 |
577 |
| Deutsche Post AG (Registered) |
60 |
2,119 |
| Deutsche Telekom AG (Registered) |
152 |
2,874 |
| E.ON SE |
127 |
1,066 |
| Freenet AG |
21 |
412 |
| HeidelbergCement AG |
12 |
557 |
| HOCHTIEF AG |
5 |
234 |
| Kloeckner & Co. SE |
71 |
556 |
| Mercedes-Benz Group AG |
51 |
2,946 |
| 48 |
J.P. Morgan International Equity Funds |
October 31, 2022 |
| INVESTMENTS |
SHARES
(000) |
VALUE ($000) |
| Common Stocks — continued | ||
| Germany — continued | ||
| Muenchener Rueckversicherungs-Gesellschaft AG (Registered) |
7 |
1,773 |
| Siemens AG (Registered) |
40 |
4,389 |
| Talanx AG |
10 |
365 |
| Volkswagen AG (Preference) |
14 |
1,733 |
| |
|
31,096 |
| Hong Kong — 0.7% | ||
| Hongkong Land Holdings Ltd. |
288 |
1,107 |
| Kerry Properties Ltd. |
498 |
788 |
| Pacific Basin Shipping Ltd. |
3,041 |
736 |
| |
|
2,631 |
| Ireland — 0.3% | ||
| Bank of Ireland Group plc |
119 |
859 |
| Italy — 3.2% | ||
| Anima Holding SpA (a) |
50 |
154 |
| Assicurazioni Generali SpA |
84 |
1,263 |
| Azimut Holding SpA |
22 |
349 |
| Credito Emiliano SpA |
68 |
405 |
| Eni SpA |
209 |
2,746 |
| Maire Tecnimont SpA (b) |
252 |
780 |
| Mediobanca Banca di Credito Finanziario SpA |
73 |
664 |
| OVS SpA (a) |
493 |
921 |
| Pirelli & C SpA (a) |
196 |
739 |
| Poste Italiane SpA (a) |
50 |
434 |
| UniCredit SpA |
176 |
2,177 |
| Unipol Gruppo SpA |
214 |
923 |
| |
|
11,555 |
| Japan — 21.3% | ||
| AGC, Inc. |
26 |
818 |
| Aiful Corp. |
138 |
376 |
| Aozora Bank Ltd. |
23 |
387 |
| Brother Industries Ltd. |
40 |
676 |
| Chiba Bank Ltd. (The) |
98 |
539 |
| Concordia Financial Group Ltd. |
148 |
450 |
| Cosmo Energy Holdings Co. Ltd. |
53 |
1,357 |
| Credit Saison Co. Ltd. |
92 |
981 |
| Dai-ichi Life Holdings, Inc. |
102 |
1,625 |
| Dentsu Group, Inc. |
38 |
1,173 |
| Fuyo General Lease Co. Ltd. |
16 |
889 |
| Hachijuni Bank Ltd. (The) |
96 |
305 |
| Hitachi Ltd. |
50 |
2,251 |
| Honda Motor Co. Ltd. |
105 |
2,399 |
| INVESTMENTS |
SHARES
(000) |
VALUE ($000) |
| | ||
| Japan — continued | ||
| Inpex Corp. |
147 |
1,484 |
| Isuzu Motors Ltd. |
115 |
1,351 |
| ITOCHU Corp. |
49 |
1,269 |
| Japan Post Holdings Co. Ltd. |
193 |
1,299 |
| Japan Post Insurance Co. Ltd. |
74 |
1,094 |
| Kamigumi Co. Ltd. |
23 |
435 |
| Kandenko Co. Ltd. |
41 |
232 |
| KDDI Corp. |
105 |
3,100 |
| Marubeni Corp. |
185 |
1,624 |
| Mitsubishi Corp. |
98 |
2,663 |
| Mitsubishi UFJ Financial Group, Inc. |
731 |
3,454 |
| Mitsui & Co. Ltd. |
95 |
2,091 |
| Mitsui Fudosan Co. Ltd. |
74 |
1,423 |
| Mizuho Financial Group, Inc. |
178 |
1,923 |
| MS&AD Insurance Group Holdings, Inc. |
44 |
1,173 |
| Nippon Steel Corp. |
104 |
1,425 |
| Nippon Telegraph & Telephone Corp. |
98 |
2,714 |
| Nomura Real Estate Holdings, Inc. |
54 |
1,223 |
| ORIX Corp. |
119 |
1,751 |
| Resona Holdings, Inc. |
190 |
717 |
| Sekisui House Ltd. |
64 |
1,056 |
| Shizuoka Financial Group, Inc. |
91 |
573 |
| SoftBank Corp. |
211 |
2,078 |
| Sojitz Corp. |
71 |
1,040 |
| Sompo Holdings, Inc. |
23 |
971 |
| Subaru Corp. |
95 |
1,480 |
| Sumitomo Corp. |
94 |
1,194 |
| Sumitomo Forestry Co. Ltd. |
78 |
1,223 |
| Sumitomo Mitsui Financial Group, Inc. |
93 |
2,609 |
| Sumitomo Mitsui Trust Holdings, Inc. |
50 |
1,444 |
| Sumitomo Warehouse Co. Ltd. (The) |
70 |
946 |
| Takeda Pharmaceutical Co. Ltd. |
115 |
3,048 |
| Tokyo Steel Manufacturing Co. Ltd. |
53 |
457 |
| Tokyo Tatemono Co. Ltd. |
35 |
483 |
| Tokyu Fudosan Holdings Corp. |
219 |
1,113 |
| Toyota Boshoku Corp. |
74 |
944 |
| Toyota Motor Corp. |
565 |
7,838 |
| Yamaha Motor Co. Ltd. |
55 |
1,144 |
| |
|
76,312 |
| Luxembourg — 0.5% | ||
| ArcelorMittal SA |
77 |
1,724 |
| Netherlands — 6.0% | ||
| ABN AMRO Bank NV, CVA (a) |
91 |
896 |
| October 31, 2022 |
J.P. Morgan International Equity Funds |
49 |
AS OF October 31, 2022 (continued)
| INVESTMENTS |
SHARES
(000) |
VALUE ($000) |
| Common Stocks — continued | ||
| Netherlands — continued | ||
| Aegon NV |
337 |
1,560 |
| ASR Nederland NV |
30 |
1,298 |
| Heijmans NV, CVA |
100 |
1,012 |
| Koninklijke Ahold Delhaize NV |
91 |
2,529 |
| Koninklijke BAM Groep NV * |
372 |
812 |
| NN Group NV |
26 |
1,114 |
| Randstad NV |
13 |
629 |
| Shell plc |
419 |
11,620 |
| |
|
21,470 |
| Norway — 3.0% | ||
| Aker BP ASA, SDR * |
26 |
821 |
| DNB Bank ASA |
100 |
1,766 |
| Elkem ASA (a) |
230 |
763 |
| Equinor ASA |
80 |
2,918 |
| Europris ASA (a) |
133 |
792 |
| Hoegh Autoliners ASA |
31 |
175 |
| Norsk Hydro ASA |
170 |
1,078 |
| Olav Thon Eiendomsselskap ASA |
24 |
408 |
| SpareBank 1 Nord Norge |
80 |
666 |
| SpareBank 1 SMN |
42 |
459 |
| SpareBank 1 SR-Bank ASA |
46 |
470 |
| Storebrand ASA |
60 |
464 |
| |
|
10,780 |
| Singapore — 1.4% | ||
| DBS Group Holdings Ltd. |
64 |
1,555 |
| Oversea-Chinese Banking Corp. Ltd. |
207 |
1,775 |
| StarHub Ltd. |
378 |
286 |
| United Overseas Bank Ltd. |
68 |
1,328 |
| |
|
4,944 |
| South Africa — 0.6% | ||
| Anglo American plc |
76 |
2,281 |
| Spain — 2.4% | ||
| Banco Bilbao Vizcaya Argentaria SA |
518 |
2,672 |
| Banco Santander SA (b) |
944 |
2,448 |
| CaixaBank SA |
293 |
971 |
| Repsol SA |
148 |
2,015 |
| Unicaja Banco SA |
540 |
479 |
| |
|
8,585 |
| Sweden — 2.2% | ||
| Bilia AB, Class A |
24 |
252 |
| Boliden AB |
25 |
732 |
| INVESTMENTS |
SHARES
(000) |
VALUE ($000) |
| | ||
| Sweden — continued | ||
| Loomis AB |
31 |
873 |
| MEKO AB |
34 |
321 |
| Securitas AB, Class B (b) |
174 |
1,425 |
| Skandinaviska Enskilda Banken AB, Class A |
169 |
1,782 |
| SSAB AB, Class B |
189 |
877 |
| Svenska Handelsbanken AB, Class A |
173 |
1,602 |
| |
|
7,864 |
| Switzerland — 5.8% | ||
| Julius Baer Group Ltd. |
15 |
737 |
| Mobilezone Holding AG (Registered) |
51 |
807 |
| Novartis AG (Registered) |
126 |
10,202 |
| Swiss Life Holding AG (Registered) |
3 |
1,224 |
| UBS Group AG (Registered) |
245 |
3,892 |
| Zurich Insurance Group AG |
9 |
3,804 |
| |
|
20,666 |
| United Kingdom — 12.7% | ||
| Aviva plc |
210 |
1,007 |
| Balfour Beatty plc |
249 |
851 |
| Barclays plc |
969 |
1,647 |
| Barratt Developments plc |
139 |
601 |
| Bellway plc |
9 |
187 |
| Berkeley Group Holdings plc |
10 |
402 |
| BP plc |
1,192 |
6,595 |
| BT Group plc |
575 |
857 |
| Centrica plc |
1,490 |
1,309 |
| CK Hutchison Holdings Ltd. |
276 |
1,374 |
| Crest Nicholson Holdings plc |
84 |
195 |
| Drax Group plc |
122 |
731 |
| DS Smith plc |
319 |
1,062 |
| HSBC Holdings plc |
1,225 |
6,286 |
| IG Group Holdings plc |
56 |
508 |
| Inchcape plc |
157 |
1,341 |
| Investec plc |
278 |
1,395 |
| JD Sports Fashion plc |
818 |
914 |
| JET2 plc * |
54 |
531 |
| Land Securities Group plc, REIT |
157 |
1,026 |
| Legal & General Group plc |
752 |
2,011 |
| Lloyds Banking Group plc |
5,734 |
2,754 |
| Man Group plc |
271 |
673 |
| Marks & Spencer Group plc * |
530 |
642 |
| Mitie Group plc |
948 |
778 |
| Morgan Sindall Group plc |
20 |
348 |
| NatWest Group plc |
371 |
998 |
| 50 |
J.P. Morgan International Equity Funds |
October 31, 2022 |
| INVESTMENTS |
SHARES
(000) |
VALUE ($000) |
| Common Stocks — continued | ||
| United Kingdom — continued | ||
| OSB Group plc |
172 |
821 |
| Paragon Banking Group plc |
75 |
365 |
| Premier Foods plc |
451 |
536 |
| Redrow plc |
48 |
231 |
| Standard Chartered plc |
163 |
974 |
| Taylor Wimpey plc |
325 |
350 |
| Tesco plc |
599 |
1,478 |
| Vistry Group plc |
77 |
531 |
| Vodafone Group plc |
1,914 |
2,235 |
| WPP plc |
106 |
933 |
| |
|
45,477 |
| United States — 2.5% | ||
| GSK plc |
253 |
4,142 |
| Roche Holding AG |
3 |
1,024 |
| Stellantis NV |
131 |
1,763 |
| Stellantis NV |
62 |
837 |
| Tenaris SA |
73 |
1,151 |
| |
|
8,917 |
| Total Common Stocks (Cost $360,347) |
|
341,057 |
| Short-Term Investments — 5.4% | ||
| Investment Companies — 4.3% | ||
| JPMorgan Prime Money Market Fund Class Institutional Shares, 3.12% (c) (d)(Cost $15,394) |
15,392 |
15,394 |
| Investment of Cash Collateral from Securities Loaned — 1.1% | ||
| JPMorgan Securities Lending Money Market Fund Agency SL Class Shares, 3.23% (c) (d) |
705 |
705 |
| JPMorgan U.S. Government Money Market Fund Class IM Shares, 2.85% (c) (d) |
3,290 |
3,290 |
| Total Investment of Cash Collateral from Securities Loaned (Cost
$3,995) |
|
3,995 |
| Total Short-Term Investments (Cost $19,389) |
|
19,389 |
| Total Investments — 100.7% (Cost $379,736) |
|
360,446 |
| Liabilities in Excess of Other Assets — (0.7)% |
|
(2,569) |
| NET ASSETS — 100.0% |
|
357,877 |
| Percentages indicated are based on net assets. |
| Abbreviations |
|
| CDI |
Certificate of interbank deposits |
| CVA |
Dutch Certification |
| OYJ |
Public Limited Company |
| Preference |
A special type of equity investment that shares in the earnings of the company, has limited voting rights, and may have a dividend preference. Preference shares may also have liquidation preference. |
| REIT |
Real Estate Investment Trust |
| SDR |
Swedish Depositary Receipt |
| * |
Non-income producing security. |
| (a) |
Security exempt from registration pursuant to Regulation S under the Securities Act of 1933, as amended. Regulation S applies to securities offerings that are made outside of the United States and do not involve direct selling efforts in the United States and as such may have restrictions on resale. |
| (b) |
The security or a portion of this security is on loan at October 31, 2022. The total value of securities on loan at October 31, 2022 is $3,806. |
| (c) |
Investment in an affiliated fund, which is registered under the Investment Company Act of 1940, as amended, and is advised by J.P. Morgan Investment Management Inc. |
| (d) |
The rate shown is the current yield as of October 31, 2022. |
| October 31, 2022 |
J.P. Morgan International Equity Funds |
51 |
AS OF October 31, 2022 (continued)
| PORTFOLIO COMPOSITION BY ASSET CLASS AS OF October 31,
2022 |
PERCENT OF
TOTAL
INVESTMENTS |
| Banks |
18.9% |
| Oil, Gas & Consumable Fuels |
11.8 |
| Insurance |
8.6 |
| Pharmaceuticals |
7.7 |
| Metals & Mining |
7.6 |
| Automobiles |
6.9 |
| Trading Companies & Distributors |
3.1 |
| Capital Markets |
2.8 |
| Diversified Telecommunication Services |
2.3 |
| Wireless Telecommunication Services |
2.2 |
| Industrial Conglomerates |
2.2 |
| Real Estate Management & Development |
1.8 |
| Food & Staples Retailing |
1.7 |
| Construction & Engineering |
1.5 |
| Household Durables |
1.3 |
| Commercial Services & Supplies |
1.3 |
| Multi-Utilities |
1.2 |
| Media |
1.2 |
| Others (each less than 1.0%) |
10.5 |
| Short-Term Investments |
5.4 |
| 52 |
J.P. Morgan International Equity Funds |
October 31, 2022 |
AS OF October 31, 2022
(Amounts in thousands, except per share amounts)
| |
JPMorgan
Emerging
Markets
Equity Fund |
JPMorgan
Emerging
Markets
Research
Enhanced
Equity Fund |
JPMorgan
Europe Dynamic Fund |
| ASSETS: |
|
|
|
| Investments in non-affiliates, at value |
$7,043,817 |
$2,479,058 |
$523,221 |
| Investments in affiliates, at value |
113,774 |
47,040 |
6,343 |
| Investments of cash collateral received from securities loaned, at
value (See Note 2.C.) |
4,793 |
6,925 |
— |
| Cash |
363 |
3,115 |
124 |
| Foreign currency, at value |
1,771 |
1,368 |
64 |
| Deposits at broker for futures contracts |
— |
724 |
322 |
| Receivables: |
|
|
|
| Investment securities sold |
1,189 |
481 |
979 |
| Fund shares sold |
40,745 |
124,257 |
9,767 |
| Dividends from non-affiliates |
4,984 |
2,198 |
221 |
| Dividends from affiliates |
63 |
73 |
15 |
| Tax reclaims |
— |
40 |
3,038 |
| Securities lending income (See Note 2.C.) |
—(a) |
3 |
1 |
| Variation margin on futures contracts |
— |
— |
13 |
| Total Assets |
7,211,499 |
2,665,282 |
544,108 |
| LIABILITIES: |
|
|
|
| Payables: |
|
|
|
| Investment securities purchased |
— |
— |
2,970 |
| Collateral received on securities loaned (See Note 2.C.) |
4,793 |
6,925 |
— |
| Fund shares redeemed |
13,131 |
115 |
1,045 |
| Variation margin on futures contracts |
— |
31 |
— |
| Accrued liabilities: |
|
|
|
| Investment advisory fees |
4,090 |
515 |
265 |
| Administration fees |
369 |
145 |
33 |
| Distribution fees |
105 |
— |
16 |
| Service fees |
514 |
11 |
21 |
| Custodian and accounting fees |
610 |
346 |
29 |
| Deferred foreign capital gains tax |
32,221 |
6,549 |
— |
| Other |
670 |
77 |
148 |
| Total Liabilities |
56,503 |
14,714 |
4,527 |
| Net Assets |
$7,154,996 |
$2,650,568 |
$539,581 |
| October 31, 2022 |
J.P. Morgan International Equity Funds |
53 |
AS OF October 31, 2022 (continued)
(Amounts in thousands, except per share amounts)
| |
JPMorgan
Emerging
Markets
Equity Fund |
JPMorgan
Emerging
Markets
Research
Enhanced
Equity Fund |
JPMorgan
Europe Dynamic Fund |
| NET ASSETS: |
|
|
|
| Paid-in-Capital |
$7,860,400 |
$3,396,555 |
$700,213 |
| Total distributable earnings (loss) |
(705,404)
|
(745,987)
|
(160,632) |
| Total Net Assets |
$7,154,996 |
$2,650,568 |
$539,581 |
| Net Assets: |
|
|
|
| Class A |
$358,077 |
$— |
$64,573 |
| Class C |
35,997 |
— |
5,096 |
| Class I |
1,871,401 |
171,538 |
83,608 |
| Class L |
1,282,832 |
— |
15,568 |
| Class R2 |
407 |
— |
— |
| Class R3 |
11,182 |
— |
— |
| Class R4 |
2,485 |
— |
— |
| Class R5 |
12,712 |
— |
— |
| Class R6 |
3,579,903 |
2,479,030 |
370,736 |
| Total |
$7,154,996 |
$2,650,568 |
$539,581
|
| Outstanding units of beneficial interest (shares) ($0.0001 par value; unlimited number of shares authorized): |
|
|
|
| Class A |
15,016 |
— |
2,724 |
| Class C |
1,577 |
— |
244 |
| Class I |
76,438 |
12,857 |
3,455 |
| Class L |
51,942 |
— |
634 |
| Class R2 |
17 |
— |
— |
| Class R3 |
473 |
— |
— |
| Class R4 |
102 |
— |
— |
| Class R5 |
514 |
— |
— |
| Class R6 |
145,017 |
186,780 |
15,169 |
| Net Asset Value (a): |
|
|
|
| Class A — Redemption price per share |
$23.85
|
$—
|
$23.70 |
| Class C — Offering price per share (b) |
22.82 |
— |
20.85 |
| Class I — Offering and redemption price per share |
24.48 |
13.34 |
24.20 |
| Class L — Offering and redemption price per share |
24.70 |
— |
24.54 |
| Class R2 — Offering and redemption price per share |
23.49 |
— |
— |
| Class R3 — Offering and redemption price per share |
23.67 |
— |
— |
| Class R4 — Offering and redemption price per share |
24.39 |
— |
— |
| Class R5 — Offering and redemption price per share |
24.69 |
— |
— |
| Class R6 — Offering and redemption price per share |
24.69 |
13.27 |
24.44 |
| Class A maximum sales charge |
5.25% |
—% |
5.25% |
| Class A maximum public offering price per share [net asset value per share/(100% – maximum sales charge)] |
$25.17 |
$— |
$25.01
|
| Cost of investments in non-affiliates |
$7,368,331 |
$3,011,874 |
$527,921 |
| Cost of investments in affiliates |
113,774 |
47,042 |
6,343 |
| Cost of foreign currency |
— |
1,369 |
64 |
| Investment securities on loan, at value (See Note 2.C.) |
4,595 |
6,699 |
— |
| Cost of investment of cash collateral (See Note 2.C.) |
4,791 |
6,925 |
— |
| 54 |
J.P. Morgan International Equity Funds |
October 31, 2022 |
| |
JPMorgan
International
Equity Fund |
JPMorgan
International
Focus Fund |
JPMorgan
International Hedged Equity Fund |
| ASSETS: |
|
|
|
| Investments in non-affiliates, at value |
$3,744,294 |
$1,062,924 |
$151,627 |
| Investments in affiliates, at value |
57,920 |
19,897 |
6,096 |
| Investments of cash collateral received from securities loaned, at
value (See Note 2.C.) |
103,571 |
56,415 |
— |
| Options purchased, at value |
— |
— |
1,806 |
| Cash |
87 |
55 |
811 |
| Foreign currency, at value |
103 |
398 |
233 |
| Deposits at broker for futures contracts |
— |
— |
616 |
| Receivables: |
|
|
|
| Investment securities sold |
56,993 |
— |
— |
| Fund shares sold |
1,468 |
9,841 |
5,416 |
| Dividends from non-affiliates |
4,238 |
1,049 |
340 |
| Dividends from affiliates |
218 |
30 |
15 |
| Tax reclaims |
8,223 |
4,104 |
390 |
| Securities lending income (See Note 2.C.) |
8 |
2 |
— |
| Total Assets |
3,977,123 |
1,154,715 |
167,350 |
| LIABILITIES: |
|
|
|
| Payables: |
|
|
|
| Investment securities purchased |
19,733 |
— |
— |
| Collateral received on securities loaned (See Note 2.C.) |
103,571 |
56,415 |
— |
| Fund shares redeemed |
40,698 |
2,538 |
579 |
| Variation margin on futures contracts |
— |
— |
24 |
| Outstanding options written, at fair value |
— |
— |
5,340 |
| Accrued liabilities: |
|
|
|
| Investment advisory fees |
1,378 |
460 |
8 |
| Administration fees |
100 |
— |
— |
| Distribution fees |
74 |
59 |
1 |
| Service fees |
137 |
111 |
33 |
| Custodian and accounting fees |
100 |
146 |
25 |
| Other |
142 |
205 |
133 |
| Total Liabilities |
165,933 |
59,934 |
6,143 |
| Net Assets |
$3,811,190 |
$1,094,781 |
$161,207 |
| October 31, 2022 |
J.P. Morgan International Equity Funds |
55 |
AS OF October 31, 2022 (continued)
(Amounts in thousands, except per share amounts)
| |
JPMorgan
International
Equity Fund |
JPMorgan
International
Focus Fund |
JPMorgan
International Hedged Equity Fund |
| NET ASSETS: |
|
|
|
| Paid-in-Capital |
$3,910,637 |
$1,245,611 |
$176,837 |
| Total distributable earnings (loss) |
(99,447)
|
(150,830)
|
(15,630) |
| Total Net Assets |
$3,811,190 |
$1,094,781 |
$161,207 |
| Net Assets: |
|
|
|
| Class A |
$304,284 |
$237,262 |
$4,032 |
| Class C |
6,191 |
14,034 |
235 |
| Class I |
513,812 |
433,591 |
156,582 |
| Class R2 |
16,764 |
1,477 |
— |
| Class R5 |
8,328 |
1,961 |
20 |
| Class R6 |
2,961,811 |
406,456 |
338 |
| Total |
$3,811,190 |
$1,094,781 |
$161,207 |
| Outstanding units of beneficial interest (shares) ($0.0001 par value; unlimited number of shares authorized): |
|
|
|
| Class A |
20,627 |
12,117 |
287 |
| Class C |
446 |
729 |
17 |
| Class I |
34,174 |
21,814 |
11,060 |
| Class R2 |
1,153 |
76 |
— |
| Class R5 |
551 |
99 |
1 |
| Class R6 |
196,186 |
20,420 |
24 |
| Net Asset Value (a): |
|
|
|
| Class A — Redemption price per share |
$14.75
|
$19.58
|
$14.07 |
| Class C — Offering price per share (b) |
13.87 |
19.23 |
14.00 |
| Class I — Offering and redemption price per share |
15.04 |
19.88 |
14.16 |
| Class R2 — Offering and redemption price per share |
14.53 |
19.40 |
— |
| Class R5 — Offering and redemption price per share |
15.13 |
19.89 |
14.19 |
| Class R6 — Offering and redemption price per share |
15.10 |
19.90 |
14.20 |
| Class A maximum sales charge |
5.25% |
5.25% |
5.25% |
| Class A maximum public offering price per share [net asset value per share/(100% – maximum sales charge)] |
$15.57 |
$20.66 |
$14.85 |
| Cost of investments in non-affiliates |
$3,666,547 |
$1,046,890 |
$160,682 |
| Cost of investments in affiliates |
57,919 |
19,898 |
6,096 |
| Cost of options purchased |
— |
— |
4,516 |
| Cost of foreign currency |
108 |
400 |
231 |
| Investment securities on loan, at value (See Note 2.C.) |
97,049 |
26,619 |
— |
| Cost of investment of cash collateral (See Note 2.C.) |
103,567 |
56,412 |
— |
| Premiums received from options written |
— |
— |
4,555 |
| 56 |
J.P. Morgan International Equity Funds |
October 31, 2022 |
| |
JPMorgan
International Value Fund |
| ASSETS: |
|
| Investments in non-affiliates, at value |
$341,057 |
| Investments in affiliates, at value |
15,394 |
| Investments of cash collateral received from securities loaned, at
value (See Note 2.C.) |
3,995 |
| Cash |
98 |
| Foreign currency, at value |
20 |
| Receivables: |
|
| Investment securities sold |
56 |
| Fund shares sold |
494 |
| Dividends from non-affiliates |
1,319 |
| Dividends from affiliates |
40 |
| Tax reclaims |
1,565 |
| Securities lending income (See Note 2.C.) |
3 |
| Total Assets |
364,041 |
| LIABILITIES: |
|
| Payables: |
|
| Investment securities purchased |
603 |
| Collateral received on securities loaned (See Note 2.C.) |
3,995 |
| Fund shares redeemed |
423 |
| Accrued liabilities: |
|
| Investment advisory fees |
67 |
| Distribution fees |
34 |
| Service fees |
30 |
| Custodian and accounting fees |
20 |
| Other |
992 |
| Total Liabilities |
6,164 |
| Net Assets |
$357,877
|
| October 31, 2022 |
J.P. Morgan International Equity Funds |
57 |
AS OF October 31, 2022 (continued)
(Amounts in thousands, except per share amounts)
| |
JPMorgan
International Value Fund |
| NET ASSETS: |
|
| Paid-in-Capital |
$461,581 |
| Total distributable earnings (loss) |
(103,704) |
| Total Net Assets |
$357,877
|
| Net Assets: |
|
| Class A |
$160,039 |
| Class C |
1,791 |
| Class I |
29,816 |
| Class L |
5,451 |
| Class R2 |
454 |
| Class R5 |
29 |
| Class R6 |
160,297 |
| Total |
$357,877 |
| Outstanding units of beneficial interest (shares) ($0.0001 par value; unlimited number of shares authorized): |
|
| Class A |
15,146 |
| Class C |
175 |
| Class I |
2,740 |
| Class L |
504 |
| Class R2 |
44 |
| Class R5 |
3 |
| Class R6 |
14,887 |
| Net Asset Value (a): |
|
| Class A — Redemption price per share |
$10.57 |
| Class C — Offering price per share (b) |
10.23 |
| Class I — Offering and redemption price per share |
10.88 |
| Class L — Offering and redemption price per share |
10.83 |
| Class R2 — Offering and redemption price per share |
10.37 |
| Class R5 — Offering and redemption price per share |
10.75 |
| Class R6 — Offering and redemption price per share |
10.77 |
| Class A maximum sales charge |
5.25% |
| Class A maximum public offering price per share [net asset value per share/(100% – maximum sales charge)] |
$11.16 |
| Cost of investments in non-affiliates |
$360,347 |
| Cost of investments in affiliates |
15,394 |
| Cost of foreign currency |
20 |
| Investment securities on loan, at value (See Note 2.C.) |
3,806 |
| Cost of investment of cash collateral (See Note 2.C.) |
3,995 |
| 58 |
J.P. Morgan International Equity Funds |
October 31, 2022 |
FOR THE YEAR ENDED October 31, 2022
(Amounts in thousands)
| |
JPMorgan
Emerging
Markets
Equity Fund |
JPMorgan
Emerging
Markets
Research
Enhanced
Equity Fund |
JPMorgan
Europe Dynamic Fund |
| INVESTMENT INCOME: |
|
|
|
| Interest income from non-affiliates |
$2 |
$— |
$4 |
| Interest income from affiliates |
1 |
3 |
—(a) |
| Dividend income from non-affiliates |
160,318 |
106,440 |
20,030 |
| Dividend income from affiliates |
462 |
320 |
129 |
| Income from securities lending (net) (See Note 2.C.) |
93 |
55 |
175 |
| Foreign taxes withheld (net) |
(14,899)
|
(10,543)
|
(2,465) |
| Total investment income |
145,977 |
96,275 |
17,873 |
| EXPENSES: |
|
|
|
| Investment advisory fees |
69,534 |
8,038 |
4,500 |
| Administration fees |
7,353 |
2,411 |
562 |
| Distribution fees: |
|
|
|
| Class A |
1,274 |
— |
188 |
| Class C |
418 |
— |
58 |
| Class R2 |
2 |
— |
— |
| Class R3 |
32 |
— |
— |
| Service fees: |
|
|
|
| Class A |
1,274 |
— |
188 |
| Class C |
140 |
— |
20 |
| Class I |
7,876 |
415 |
488 |
| Class L |
1,906 |
— |
74 |
| Class R2 |
1 |
— |
— |
| Class R3 |
32 |
— |
— |
| Class R4 |
8 |
— |
— |
| Class R5 |
16 |
— |
— |
| Custodian and accounting fees |
4,496 |
2,166 |
156 |
| Interest expense to affiliates |
54 |
12 |
15 |
| Professional fees |
323 |
112 |
131 |
| Trustees’ and Chief Compliance Officer’s fees |
59 |
36 |
27 |
| Printing and mailing costs |
730 |
46 |
102 |
| Registration and filing fees |
222 |
105 |
62 |
| Transfer agency fees (See Note 2.I.) |
251 |
37 |
41 |
| Other |
775 |
61 |
82 |
| Total expenses |
96,776 |
13,439 |
6,694 |
| Less fees waived |
(4,150) |
(2,070) |
(82) |
| Less expense reimbursements |
(114)
|
— |
— |
| Net expenses |
92,512 |
11,369 |
6,612 |
| Net investment income (loss) |
53,465 |
84,906 |
11,261 |
| October 31, 2022 |
J.P. Morgan International Equity Funds |
59 |
FOR THE YEAR ENDED October 31, 2022 (continued)
(Amounts in thousands)
| |
JPMorgan
Emerging
Markets
Equity Fund |
JPMorgan
Emerging
Markets
Research
Enhanced
Equity Fund |
JPMorgan
Europe Dynamic Fund |
| REALIZED/UNREALIZED GAINS (LOSSES): |
|
|
|
| Net realized gain (loss) on transactions from: |
|
|
|
| Investments in non-affiliates |
$(320,022)(a)
|
$(209,716)(b)
|
$(85,967) |
| Investments in affiliates |
27 |
6 |
2 |
| Futures contracts |
— |
(531) |
1,173 |
| Foreign currency transactions |
(15,165)
|
(2,412)
|
(2,187) |
| Net realized gain (loss) |
(335,160)
|
(212,653)
|
(86,979) |
| Distribution of capital gains received from investment company affiliates |
—(c) |
— |
— |
| Change in net unrealized appreciation/depreciation on: |
|
|
|
| Investments in non-affiliates |
(4,824,365)(d) |
(1,083,790)(e) |
(134,780) |
| Investments in affiliates |
2 |
(2) |
— |
| Futures contracts |
— |
(434) |
(1,337) |
| Foreign currency translations |
10,953 |
30 |
(435) |
| Change in net unrealized appreciation/depreciation |
(4,813,410)
|
(1,084,196)
|
(136,552) |
| Net realized/unrealized gains (losses) |
(5,148,570)
|
(1,296,849)
|
(223,531) |
| Change in net assets resulting from operations |
$(5,095,105) |
$(1,211,943) |
$(212,270) |
| 60 |
J.P. Morgan International Equity Funds |
October 31, 2022 |
| |
JPMorgan
International
Equity Fund |
JPMorgan
International
Focus Fund |
JPMorgan
International Hedged Equity Fund |
| INVESTMENT INCOME: |
|
|
|
| Interest income from non-affiliates |
$2 |
$1 |
$3 |
| Interest income from affiliates |
— |
—(a) |
1 |
| Dividend income from non-affiliates |
132,705 |
58,979 |
5,164 |
| Dividend income from affiliates |
883 |
227 |
35 |
| Income from securities lending (net) (See Note 2.C.) |
730 |
117 |
— |
| Foreign taxes withheld (net) |
(12,861)
|
(5,269)
|
(493) |
| Total investment income |
121,459 |
54,055 |
4,710 |
| EXPENSES: |
|
|
|
| Investment advisory fees |
22,239 |
13,678 |
418 |
| Administration fees |
3,336 |
1,710 |
126 |
| Distribution fees: |
|
|
|
| Class A |
933 |
710 |
11 |
| Class C |
64 |
143 |
2 |
| Class R2 |
104 |
9 |
— |
| Service fees: |
|
|
|
| Class A |
933 |
710 |
11 |
| Class C |
22 |
48 |
1 |
| Class I |
1,499 |
1,628 |
406 |
| Class R2 |
52 |
4 |
— |
| Class R5 |
9 |
2 |
—(a) |
| Custodian and accounting fees |
607 |
496 |
100 |
| Interest expense to affiliates |
12 |
12 |
1 |
| Professional fees |
147 |
99 |
94 |
| Trustees’ and Chief Compliance Officer’s fees |
40 |
33 |
25 |
| Printing and mailing costs |
196 |
164 |
33 |
| Registration and filing fees |
109 |
194 |
123 |
| Transfer agency fees (See Note 2.I.) |
113 |
64 |
1 |
| Other |
149 |
132 |
23 |
| Total expenses |
30,564 |
19,836 |
1,375 |
| Less fees waived |
(5,256) |
(4,476) |
(357) |
| Less expense reimbursements |
— |
—(a) |
—(a) |
| Net expenses |
25,308 |
15,360 |
1,018 |
| Net investment income (loss) |
96,151 |
38,695 |
3,692 |
| October 31, 2022 |
J.P. Morgan International Equity Funds |
61 |
FOR THE YEAR ENDED October 31, 2022 (continued)
(Amounts in thousands)
| |
JPMorgan
International
Equity Fund |
JPMorgan
International
Focus Fund |
JPMorgan
International Hedged Equity Fund |
| REALIZED/UNREALIZED GAINS (LOSSES): |
|
|
|
| Net realized gain (loss) on transactions from: |
|
|
|
| Investments in non-affiliates |
$(241,534) |
$195,962 |
$(2,273) |
| Investments in affiliates |
(54) |
(3) |
— |
| Options purchased |
— |
— |
5,401 |
| Futures contracts |
— |
71 |
(913) |
| Foreign currency transactions |
(1,913) |
(766) |
(192) |
| Options written |
— |
— |
14,601 |
| Net realized gain (loss) |
(243,501)
|
195,264 |
16,624 |
| Change in net unrealized appreciation/depreciation on: |
|
|
|
| Investments in non-affiliates |
(1,273,842) |
(957,734) |
(41,950) |
| Investments in affiliates |
5 |
2 |
— |
| Options purchased |
— |
— |
(1,067) |
| Futures contracts |
— |
— |
120 |
| Foreign currency translations |
(950) |
(473) |
(26) |
| Options written |
— |
— |
(2,504) |
| Change in net unrealized appreciation/depreciation |
(1,274,787)
|
(958,205)
|
(45,427) |
| Net realized/unrealized gains (losses) |
(1,518,288)
|
(762,941)
|
(28,803) |
| Change in net assets resulting from operations |
$(1,422,137) |
$(724,246) |
$(25,111)
|
| 62 |
J.P. Morgan International Equity Funds |
October 31, 2022 |
| |
JPMorgan
International Value Fund |
| INVESTMENT INCOME: |
|
| Interest income from non-affiliates |
$—(a)
|
| Interest income from affiliates |
—(a) |
| Dividend income from non-affiliates |
19,474 |
| Dividend income from affiliates |
155 |
| Income from securities lending (net) (See Note 2.C.) |
136 |
| Foreign taxes withheld (net) |
(1,740) |
| Total investment income |
18,025 |
| EXPENSES: |
|
| Investment advisory fees |
2,109 |
| Administration fees |
288 |
| Distribution fees: |
|
| Class A |
441 |
| Class C |
20 |
| Class R2 |
2 |
| Service fees: |
|
| Class A |
441 |
| Class C |
7 |
| Class I |
90 |
| Class L |
6 |
| Class R2 |
1 |
| Class R5 |
—(a) |
| Custodian and accounting fees |
109 |
| Interest expense to affiliates |
2 |
| Professional fees |
26 |
| Trustees’ and Chief Compliance Officer’s fees |
26 |
| Printing and mailing costs |
15 |
| Registration and filing fees |
140 |
| Transfer agency fees (See Note 2.I.) |
19 |
| Other |
47 |
| Total expenses |
3,789 |
| Less fees waived |
(868) |
| Less expense reimbursements |
(2) |
| Net expenses |
2,919 |
| Net investment income (loss) |
15,106 |
| October 31, 2022 |
J.P. Morgan International Equity Funds |
63 |
FOR THE YEAR ENDED October 31, 2022 (continued)
(Amounts in thousands)
| |
JPMorgan
International Value Fund |
| REALIZED/UNREALIZED GAINS (LOSSES): |
|
| Net realized gain (loss) on transactions from: |
|
| Investments in non-affiliates |
$(9,226) |
| Investments in affiliates |
(2) |
| Futures contracts |
(355) |
| Foreign currency transactions |
(278) |
| Net realized gain (loss) |
(9,861) |
| Change in net unrealized appreciation/depreciation on: |
|
| Investments in non-affiliates |
(78,719) |
| Investments in affiliates |
—(a) |
| Futures contracts |
(50) |
| Foreign currency translations |
(225) |
| Change in net unrealized appreciation/depreciation |
(78,994) |
| Net realized/unrealized gains (losses) |
(88,855) |
| Change in net assets resulting from operations |
$(73,749) |
| 64 |
J.P. Morgan International Equity Funds |
October 31, 2022 |
FOR THE PERIODS INDICATED
(Amounts in thousands)
| |
JPMorgan Emerging
Markets Equity Fund |
JPMorgan Emerging
Markets Research Enhanced Equity Fund | ||
| |
Year Ended
October 31, 2022 |
Year Ended
October 31, 2021 |
Year Ended
October 31, 2022 |
Year Ended
October 31, 2021 |
| CHANGE IN NET ASSETS RESULTING FROM OPERATIONS: |
|
|
|
|
| Net investment income (loss) |
$53,465 |
$(660) |
$84,906 |
$70,642 |
| Net realized gain (loss) |
(335,160) |
570,100 |
(212,653) |
184,068 |
| Change in net unrealized appreciation/depreciation |
(4,813,410)
|
749,583 |
(1,084,196)
|
221,738 |
| Change in net assets resulting from operations |
(5,095,105)
|
1,319,023 |
(1,211,943)
|
476,448 |
| DISTRIBUTIONS TO SHAREHOLDERS: |
|
|
|
|
| Class A |
(22,535) |
— |
— |
— |
| Class C |
(2,610) |
— |
— |
— |
| Class I |
(162,208) |
(4,875) |
(231) |
(1) |
| Class L |
(91,277) |
(3,336) |
— |
— |
| Class R2 |
(19) |
— |
— |
— |
| Class R3 |
(504) |
— |
— |
— |
| Class R4 |
(135) |
(1) |
— |
— |
| Class R5 |
(704) |
(80) |
— |
— |
| Class R6 |
(206,914)
|
(10,851)
|
(199,236)
|
(50,836) |
| Total distributions to shareholders |
(486,906)
|
(19,143)
|
(199,467)
|
(50,837) |
| CAPITAL TRANSACTIONS: |
|
|
|
|
| Change in net assets resulting from capital transactions |
(1,098,777)
|
1,315,679 |
268,590 |
527,435 |
| NET ASSETS: |
|
|
|
|
| Change in net assets |
(6,680,788) |
2,615,559 |
(1,142,820) |
953,046 |
| Beginning of period |
13,835,784 |
11,220,225 |
3,793,388 |
2,840,342 |
| End of period |
$7,154,996 |
$13,835,784 |
$2,650,568 |
$3,793,388 |
| October 31, 2022 |
J.P. Morgan International Equity Funds |
65 |
FOR THE PERIODS INDICATED (continued)
(Amounts in thousands)
| |
JPMorgan Europe
Dynamic Fund |
JPMorgan
International Equity Fund | ||
| |
Year Ended
October 31, 2022 |
Year Ended
October 31, 2021 |
Year Ended
October 31, 2022 |
Year Ended
October 31, 2021 |
| CHANGE IN NET ASSETS RESULTING FROM OPERATIONS: |
|
|
|
|
| Net investment income (loss) |
$11,261 |
$12,685 |
$96,151 |
$80,677 |
| Net realized gain (loss) |
(86,979) |
65,264 |
(243,501) |
332,125 |
| Change in net unrealized appreciation/depreciation |
(136,552)
|
119,032 |
(1,274,787)
|
630,933 |
| Change in net assets resulting from operations |
(212,270)
|
196,981 |
(1,422,137)
|
1,043,735 |
| DISTRIBUTIONS TO SHAREHOLDERS: |
|
|
|
|
| Class A |
(1,773) |
(839) |
(27,845) |
(3,040) |
| Class C |
(188) |
(80) |
(669) |
(42) |
| Class I |
(9,923) |
(772) |
(38,399) |
(4,786) |
| Class L |
(2,043) |
(920) |
— |
— |
| Class R2 |
— |
— |
(1,477) |
(292) |
| Class R5 |
— |
— |
(678) |
(99) |
| Class R6 |
(11,157)
|
(4,405)
|
(256,785)
|
(33,732) |
| Total distributions to shareholders |
(25,084)
|
(7,016)
|
(325,853)
|
(41,991) |
| CAPITAL TRANSACTIONS: |
|
|
|
|
| Change in net assets resulting from capital transactions |
(297,583)
|
445,725 |
713,463 |
913,051 |
| NET ASSETS: |
|
|
|
|
| Change in net assets |
(534,937) |
635,690 |
(1,034,527) |
1,914,795 |
| Beginning of period |
1,074,518 |
438,828 |
4,845,717 |
2,930,922 |
| End of period |
$539,581 |
$1,074,518 |
$3,811,190 |
$4,845,717 |
| 66 |
J.P. Morgan International Equity Funds |
October 31, 2022 |
| |
JPMorgan
International Focus Fund |
JPMorgan
International Hedged Equity Fund | ||
| |
Year Ended
October 31, 2022 |
Year Ended
October 31, 2021 |
Year Ended
October 31, 2022 |
Year Ended
October 31, 2021 |
| CHANGE IN NET ASSETS RESULTING FROM OPERATIONS: |
|
|
|
|
| Net investment income (loss) |
$38,695 |
$58,536 |
$3,692 |
$2,600 |
| Net realized gain (loss) |
195,264 |
75,956 |
16,624 |
(5,465) |
| Change in net unrealized appreciation/depreciation |
(958,205)
|
610,179 |
(45,427)
|
26,744 |
| Change in net assets resulting from operations |
(724,246)
|
744,671 |
(25,111)
|
23,879 |
| DISTRIBUTIONS TO SHAREHOLDERS: |
|
|
|
|
| Class A |
(5,362) |
(1,160) |
(77) |
(29) |
| Class C |
(261) |
(42) |
(6) |
(1) |
| Class I |
(14,693) |
(4,486) |
(4,049) |
(2,175) |
| Class R2 |
(21) |
(9) |
— |
— |
| Class R5 |
(56) |
(32) |
(1) |
(1) |
| Class R6 |
(50,762)
|
(28,297)
|
(4)
|
(1) |
| Total distributions to shareholders |
(71,155)
|
(34,026)
|
(4,137)
|
(2,207) |
| CAPITAL TRANSACTIONS: |
|
|
|
|
| Change in net assets resulting from capital transactions |
(2,030,106)
|
407,973 |
37,679 |
(6,164) |
| NET ASSETS: |
|
|
|
|
| Change in net assets |
(2,825,507) |
1,118,618 |
8,431 |
15,508 |
| Beginning of period |
3,920,288 |
2,801,670 |
152,776 |
137,268 |
| End of period |
$1,094,781 |
$3,920,288 |
$161,207 |
$152,776
|
| October 31, 2022 |
J.P. Morgan International Equity Funds |
67 |
FOR THE PERIODS INDICATED (continued)
(Amounts in thousands)
| |
JPMorgan
International Value Fund | |
| |
Year Ended
October 31, 2022 |
Year Ended
October 31, 2021 |
| CHANGE IN NET ASSETS RESULTING FROM OPERATIONS: |
|
|
| Net investment income (loss) |
$15,106 |
$13,022 |
| Net realized gain (loss) |
(9,861) |
4,345 |
| Change in net unrealized appreciation/depreciation |
(78,994)
|
104,838 |
| Change in net assets resulting from operations |
(73,749)
|
122,205 |
| DISTRIBUTIONS TO SHAREHOLDERS: |
|
|
| Class A |
(8,496) |
(4,156) |
| Class C |
(136) |
(106) |
| Class I |
(1,804) |
(914) |
| Class L |
(331) |
(192) |
| Class R2 |
(22) |
(11) |
| Class R5 |
(2) |
(3) |
| Class R6 |
(7,825)
|
(3,877) |
| Total distributions to shareholders |
(18,616)
|
(9,259) |
| CAPITAL TRANSACTIONS: |
|
|
| Change in net assets resulting from capital transactions |
53,543 |
15,889 |
| NET ASSETS: |
|
|
| Change in net assets |
(38,822) |
128,835 |
| Beginning of period |
396,699 |
267,864 |
| End of period |
$357,877 |
$396,699 |
| 68 |
J.P. Morgan International Equity Funds |
October 31, 2022 |
| |
JPMorgan Emerging
Markets Equity Fund |
JPMorgan Emerging
Markets Research Enhanced Equity Fund | ||
| |
Year Ended
October 31, 2022 |
Year Ended
October 31, 2021 |
Year Ended
October 31, 2022 |
Year Ended October 31, 2021 |
| CAPITAL TRANSACTIONS: |
|
|
|
|
| Class A |
|
|
|
|
| Proceeds from shares issued |
$106,700
|
$254,285
|
$—
|
$— |
| Distributions reinvested |
21,957 |
— |
— |
— |
| Cost of shares redeemed |
(198,433)
|
(192,488)
|
— |
— |
| Change in net assets resulting from Class A capital transactions |
(69,776)
|
61,797 |
— |
— |
| Class C |
|
|
|
|
| Proceeds from shares issued |
1,744 |
21,002 |
— |
— |
| Distributions reinvested |
2,464 |
— |
— |
— |
| Cost of shares redeemed |
(19,963)
|
(18,983)
|
— |
— |
| Change in net assets resulting from Class C capital transactions |
(15,755)
|
2,019 |
— |
— |
| Class I |
|
|
|
|
| Proceeds from shares issued |
1,051,591 |
2,529,253 |
338,191 |
6,294 |
| Distributions reinvested |
152,054 |
4,534 |
232 |
1 |
| Cost of shares redeemed |
(2,325,538)
|
(2,287,926)
|
(94,988)
|
(466) |
| Change in net assets resulting from Class I capital transactions |
(1,121,893)
|
245,861 |
243,435 |
5,829 |
| Class L |
|
|
|
|
| Proceeds from shares issued |
564,411 |
1,202,345 |
— |
— |
| Distributions reinvested |
90,633 |
3,299 |
— |
— |
| Cost of shares redeemed |
(934,130)
|
(693,103)
|
— |
— |
| Change in net assets resulting from Class L capital transactions |
(279,086)
|
512,541 |
— |
— |
| Class R2 |
|
|
|
|
| Proceeds from shares issued |
143 |
415 |
— |
— |
| Distributions reinvested |
19 |
— |
— |
— |
| Cost of shares redeemed |
(69)
|
(288)
|
— |
— |
| Change in net assets resulting from Class R2 capital transactions |
93 |
127 |
— |
— |
| Class R3 |
|
|
|
|
| Proceeds from shares issued |
5,710 |
13,765 |
— |
— |
| Distributions reinvested |
227 |
— |
— |
— |
| Cost of shares redeemed |
(2,826)
|
(5,183)
|
— |
— |
| Change in net assets resulting from Class R3 capital transactions |
3,111 |
8,582 |
— |
— |
| Class R4 |
|
|
|
|
| Proceeds from shares issued |
891 |
2,383 |
— |
— |
| Distributions reinvested |
135 |
1 |
— |
— |
| Cost of shares redeemed |
(693)
|
(1,833)
|
— |
— |
| Change in net assets resulting from Class R4 capital transactions |
333 |
551 |
— |
— |
| October 31, 2022 |
J.P. Morgan International Equity Funds |
69 |
FOR THE PERIODS INDICATED (continued)
(Amounts in thousands)
| |
JPMorgan Emerging
Markets Equity Fund |
JPMorgan Emerging
Markets Research Enhanced Equity Fund | ||
| |
Year Ended
October 31, 2022 |
Year Ended
October 31, 2021 |
Year Ended
October 31, 2022 |
Year Ended October 31, 2021 |
| CAPITAL TRANSACTIONS: (continued) |
|
|
|
|
| Class R5 |
|
|
|
|
| Proceeds from shares issued |
$4,443 |
$18,329 |
$— |
$— |
| Distributions reinvested |
651 |
79 |
— |
— |
| Cost of shares redeemed |
(4,459)
|
(63,474)
|
— |
— |
| Change in net assets resulting from Class R5 capital transactions |
635 |
(45,066)
|
— |
— |
| Class R6 |
|
|
|
|
| Proceeds from shares issued |
1,626,066 |
2,782,507 |
1,143,019 |
1,383,412 |
| Distributions reinvested |
189,280 |
9,925 |
199,235 |
50,835 |
| Cost of shares redeemed |
(1,431,785)
|
(2,263,165)
|
(1,317,099)
|
(912,641) |
| Change in net assets resulting from Class R6 capital transactions |
383,561 |
529,267 |
25,155 |
521,606 |
| Total change in net assets resulting from capital transactions |
$(1,098,777) |
$1,315,679 |
$268,590 |
$527,435
|
| SHARE TRANSACTIONS: |
|
|
|
|
| Class A |
|
|
|
|
| Issued |
3,408 |
6,043 |
— |
— |
| Reinvested |
591 |
— |
— |
— |
| Redeemed |
(6,307)
|
(4,582)
|
— |
— |
| Change in Class A Shares |
(2,308)
|
1,461 |
— |
— |
| Class C |
|
|
|
|
| Issued |
56 |
523 |
— |
— |
| Reinvested |
69 |
— |
— |
— |
| Redeemed |
(663)
|
(464)
|
— |
— |
| Change in Class C Shares |
(538)
|
59 |
— |
— |
| Class I |
|
|
|
|
| Issued |
32,274 |
58,966 |
18,701 |
281 |
| Reinvested |
3,999 |
106 |
12 |
—(a) |
| Redeemed |
(74,112)
|
(52,366)
|
(6,117)
|
(22) |
| Change in Class I Shares |
(37,839)
|
6,706 |
12,596 |
259 |
| Class L |
|
|
|
|
| Issued |
17,254 |
27,731 |
— |
— |
| Reinvested |
2,366 |
77 |
— |
— |
| Redeemed |
(29,603)
|
(15,762)
|
— |
— |
| Change in Class L Shares |
(9,983)
|
12,046 |
— |
— |
| Class R2 |
|
|
|
|
| Issued |
4 |
10 |
— |
— |
| Reinvested |
1 |
— |
— |
— |
| Redeemed |
(2)
|
(7)
|
— |
— |
| Change in Class R2 Shares |
3 |
3 |
— |
— |
| 70 |
J.P. Morgan International Equity Funds |
October 31, 2022 |
| |
JPMorgan Emerging
Markets Equity Fund |
JPMorgan Emerging
Markets Research Enhanced Equity Fund | ||
| |
Year Ended
October 31, 2022 |
Year Ended
October 31, 2021 |
Year Ended
October 31, 2022 |
Year Ended October 31, 2021 |
| SHARE TRANSACTIONS: (continued) |
|
|
|
|
| Class R3 |
|
|
|
|
| Issued |
191 |
334 |
— |
— |
| Reinvested |
6 |
— |
— |
— |
| Redeemed |
(94)
|
(124)
|
— |
— |
| Change in Class R3 Shares |
103 |
210 |
— |
— |
| Class R4 |
|
|
|
|
| Issued |
27 |
54 |
— |
— |
| Reinvested |
4 |
—(a) |
— |
— |
| Redeemed |
(21)
|
(42)
|
— |
— |
| Change in Class R4 Shares |
10 |
12 |
— |
— |
| Class R5 |
|
|
|
|
| Issued |
140 |
416 |
— |
— |
| Reinvested |
17 |
2 |
— |
— |
| Redeemed |
(137)
|
(1,466)
|
— |
— |
| Change in Class R5 Shares |
20 |
(1,048)
|
— |
— |
| Class R6 |
|
|
|
|
| Issued |
50,537 |
63,838 |
70,374 |
64,804 |
| Reinvested |
4,950 |
232 |
10,435 |
2,474 |
| Redeemed |
(45,388)
|
(51,699)
|
(76,413)
|
(42,567) |
| Change in Class R6 Shares |
10,099 |
12,371 |
4,396 |
24,711 |
| October 31, 2022 |
J.P. Morgan International Equity Funds |
71 |
FOR THE PERIODS INDICATED (continued)
(Amounts in thousands)
| |
JPMorgan Europe
Dynamic Fund |
JPMorgan
International Equity Fund | ||
| |
Year Ended
October 31, 2022 |
Year Ended
October 31, 2021 |
Year Ended
October 31, 2022 |
Year Ended October
31, 2021 |
| CAPITAL TRANSACTIONS: |
|
|
|
|
| Class A |
|
|
|
|
| Proceeds from shares issued |
$5,210
|
$6,061
|
$64,303
|
$128,373 |
| Distributions reinvested |
1,698 |
805 |
27,642 |
3,017 |
| Cost of shares redeemed |
(10,121)
|
(15,952)
|
(73,469)
|
(50,637) |
| Change in net assets resulting from Class A capital transactions |
(3,213)
|
(9,086)
|
18,476 |
80,753 |
| Class C |
|
|
|
|
| Proceeds from shares issued |
158 |
543 |
1,073 |
2,112 |
| Distributions reinvested |
184 |
79 |
669 |
42 |
| Cost of shares redeemed |
(4,364)
|
(4,769)
|
(3,015)
|
(3,467) |
| Change in net assets resulting from Class C capital transactions |
(4,022)
|
(4,147)
|
(1,273)
|
(1,313) |
| Class I |
|
|
|
|
| Proceeds from shares issued |
83,067 |
412,233 |
439,834 |
217,953 |
| Distributions reinvested |
9,021 |
721 |
38,299 |
4,774 |
| Cost of shares redeemed |
(370,731)
|
(48,189)
|
(314,861)
|
(91,184) |
| Change in net assets resulting from Class I capital transactions |
(278,643)
|
364,765 |
163,272 |
131,543 |
| Class L |
|
|
|
|
| Proceeds from shares issued |
12,743 |
11,606 |
— |
— |
| Distributions reinvested |
2,037 |
917 |
— |
— |
| Cost of shares redeemed |
(61,116)
|
(6,155)
|
— |
— |
| Change in net assets resulting from Class L capital transactions |
(46,336)
|
6,368 |
— |
— |
| Class R2 |
|
|
|
|
| Proceeds from shares issued |
— |
— |
4,712 |
5,946 |
| Distributions reinvested |
— |
— |
1,474 |
289 |
| Cost of shares redeemed |
— |
— |
(5,886)
|
(9,508) |
| Change in net assets resulting from Class R2 capital transactions |
— |
— |
300 |
(3,273) |
| Class R5 |
|
|
|
|
| Proceeds from shares issued |
— |
— |
2,974 |
4,537 |
| Distributions reinvested |
— |
— |
650 |
95 |
| Cost of shares redeemed |
— |
— |
(2,313)
|
(3,471) |
| Change in net assets resulting from Class R5 capital transactions |
— |
— |
1,311 |
1,161 |
| Class R6 |
|
|
|
|
| Proceeds from shares issued |
72,496 |
135,760 |
1,168,411 |
1,637,397 |
| Distributions reinvested |
10,393 |
4,405 |
256,061 |
33,605 |
| Cost of shares redeemed |
(48,258)
|
(52,340)
|
(893,095)
|
(966,822) |
| Change in net assets resulting from Class R6 capital transactions |
34,631 |
87,825 |
531,377 |
704,180 |
| Total change in net assets resulting from capital transactions |
$(297,583) |
$445,725 |
$713,463 |
$913,051
|
| 72 |
J.P. Morgan International Equity Funds |
October 31, 2022 |
| |
JPMorgan Europe
Dynamic Fund |
JPMorgan
International Equity Fund | ||
| |
Year Ended
October 31, 2022 |
Year Ended
October 31, 2021 |
Year Ended
October 31, 2022 |
Year Ended October
31, 2021 |
| SHARE TRANSACTIONS: |
|
|
|
|
| Class A |
|
|
|
|
| Issued |
189 |
204 |
3,518 |
6,338 |
| Reinvested |
58 |
31 |
1,370 |
155 |
| Redeemed |
(380)
|
(561)
|
(4,281)
|
(2,491) |
| Change in Class A Shares |
(133)
|
(326)
|
607 |
4,002 |
| Class C |
|
|
|
|
| Issued |
7 |
21 |
62 |
108 |
| Reinvested |
7 |
3 |
35 |
2 |
| Redeemed |
(185)
|
(189)
|
(185)
|
(179) |
| Change in Class C Shares |
(171)
|
(165)
|
(88)
|
(69) |
| Class I |
|
|
|
|
| Issued |
2,991 |
13,177 |
24,681 |
10,466 |
| Reinvested |
301 |
27 |
1,865 |
242 |
| Redeemed |
(13,869)
|
(1,563)
|
(18,906)
|
(4,423) |
| Change in Class I Shares |
(10,577)
|
11,641 |
7,640 |
6,285 |
| Class L |
|
|
|
|
| Issued |
453 |
384 |
— |
— |
| Reinvested |
67 |
34 |
— |
— |
| Redeemed |
(2,576)
|
(212)
|
— |
— |
| Change in Class L Shares |
(2,056)
|
206 |
— |
— |
| Class R2 |
|
|
|
|
| Issued |
— |
— |
272 |
296 |
| Reinvested |
— |
— |
74 |
15 |
| Redeemed |
— |
— |
(347)
|
(468) |
| Change in Class R2 Shares |
— |
— |
(1)
|
(157) |
| Class R5 |
|
|
|
|
| Issued |
— |
— |
169 |
219 |
| Reinvested |
— |
— |
32 |
5 |
| Redeemed |
— |
— |
(123)
|
(165) |
| Change in Class R5 Shares |
— |
— |
78 |
59 |
| Class R6 |
|
|
|
|
| Issued |
2,666 |
4,263 |
63,877 |
79,648 |
| Reinvested |
345 |
163 |
12,433 |
1,702 |
| Redeemed |
(1,835)
|
(1,668)
|
(51,308)
|
(46,388) |
| Change in Class R6 Shares |
1,176 |
2,758 |
25,002 |
34,962 |
| October 31, 2022 |
J.P. Morgan International Equity Funds |
73 |
FOR THE PERIODS INDICATED (continued)
(Amounts in thousands)
| |
JPMorgan
International Focus Fund |
JPMorgan
International Hedged Equity Fund | ||
| |
Year Ended
October 31, 2022 |
Year Ended
October 31, 2021 |
Year Ended
October 31, 2022 |
Year Ended October 31, 2021 |
| CAPITAL TRANSACTIONS: |
|
|
|
|
| Class A |
|
|
|
|
| Proceeds from shares issued |
$89,525
|
$195,801
|
$4,000
|
$3,079 |
| Distributions reinvested |
5,307 |
1,132 |
77 |
29 |
| Cost of shares redeemed |
(95,703)
|
(32,379)
|
(2,799)
|
(1,473) |
| Change in net assets resulting from Class A capital transactions |
(871)
|
164,554 |
1,278 |
1,635 |
| Class C |
|
|
|
|
| Proceeds from shares issued |
1,726 |
8,415 |
135 |
184 |
| Distributions reinvested |
259 |
42 |
6 |
1 |
| Cost of shares redeemed |
(5,622)
|
(3,542)
|
(172)
|
(7) |
| Change in net assets resulting from Class C capital transactions |
(3,637)
|
4,915 |
(31)
|
178 |
| Class I |
|
|
|
|
| Proceeds from shares issued |
302,480 |
534,780 |
125,491 |
57,032 |
| Distributions reinvested |
14,119 |
4,249 |
3,842 |
2,032 |
| Cost of shares redeemed |
(483,530)
|
(182,797)
|
(93,112)
|
(67,180) |
| Change in net assets resulting from Class I capital transactions |
(166,931)
|
356,232 |
36,221 |
(8,116) |
| Class R2 |
|
|
|
|
| Proceeds from shares issued |
691 |
947 |
— |
— |
| Distributions reinvested |
21 |
9 |
— |
— |
| Cost of shares redeemed |
(731)
|
(716)
|
— |
— |
| Change in net assets resulting from Class R2 capital transactions |
(19)
|
240 |
— |
— |
| Class R5 |
|
|
|
|
| Proceeds from shares issued |
421 |
424 |
— |
— |
| Distributions reinvested |
56 |
32 |
1 |
—(a) |
| Cost of shares redeemed |
(853)
|
(749)
|
— |
— |
| Change in net assets resulting from Class R5 capital transactions |
(376)
|
(293)
|
1 |
—(a) |
| Class R6 |
|
|
|
|
| Proceeds from shares issued |
142,067 |
452,976 |
251 |
151 |
| Distributions reinvested |
50,271 |
28,297 |
4 |
1 |
| Cost of shares redeemed |
(814,180) |
(598,948) |
(45) |
(13) |
| Redemptions in-kind |
(1,236,430)
|
— |
— |
— |
| Change in net assets resulting from Class R6 capital transactions |
(1,858,272)
|
(117,675)
|
210 |
139 |
| Total change in net assets resulting from capital transactions |
$(2,030,106) |
$407,973 |
$37,679 |
$(6,164) |
| 74 |
J.P. Morgan International Equity Funds |
October 31, 2022 |
| |
JPMorgan
International Focus Fund |
JPMorgan
International Hedged Equity Fund | ||
| |
Year Ended
October 31, 2022 |
Year Ended
October 31, 2021 |
Year Ended
October 31, 2022 |
Year Ended October 31, 2021 |
| SHARE TRANSACTIONS: |
|
|
|
|
| Class A |
|
|
|
|
| Issued |
3,793 |
7,283 |
254 |
192 |
| Reinvested |
205 |
45 |
5 |
2 |
| Redeemed |
(4,132)
|
(1,217)
|
(185)
|
(92) |
| Change in Class A Shares |
(134)
|
6,111 |
74 |
102 |
| Class C |
|
|
|
|
| Issued |
69 |
316 |
9 |
11 |
| Reinvested |
10 |
2 |
—(a) |
—(a) |
| Redeemed |
(247)
|
(134)
|
(11)
|
—(a) |
| Change in Class C Shares |
(168)
|
184 |
(2)
|
11 |
| Class I |
|
|
|
|
| Issued |
12,761 |
19,663 |
8,117 |
3,560 |
| Reinvested |
538 |
165 |
241 |
135 |
| Redeemed |
(21,255)
|
(6,676)
|
(6,134)
|
(4,418) |
| Change in Class I Shares |
(7,956)
|
13,152 |
2,224 |
(723) |
| Class R2 |
|
|
|
|
| Issued |
30 |
36 |
— |
— |
| Reinvested |
1 |
—(a) |
— |
— |
| Redeemed |
(31)
|
(26)
|
— |
— |
| Change in Class R2 Shares |
— |
10 |
— |
— |
| Class R5 |
|
|
|
|
| Issued |
19 |
15 |
— |
— |
| Reinvested |
2 |
1 |
—(a) |
—(a) |
| Redeemed |
(35)
|
(27)
|
— |
— |
| Change in Class R5 Shares |
(14)
|
(11)
|
—(a) |
—(a) |
| Class R6 |
|
|
|
|
| Issued |
6,013 |
16,687 |
17 |
9 |
| Reinvested |
1,917 |
1,099 |
—(a) |
—(a) |
| Redeemed |
(32,570) |
(22,086) |
(3) |
(1) |
| Redemptions in-kind |
(52,192)
|
— |
— |
— |
| Change in Class R6 Shares |
(76,832)
|
(4,300)
|
14 |
8 |
| October 31, 2022 |
J.P. Morgan International Equity Funds |
75 |
FOR THE PERIODS INDICATED (continued)
(Amounts in thousands)
| |
JPMorgan
International Value Fund | |
| |
Year Ended
October 31, 2022 |
Year Ended October 31, 2021 |
| CAPITAL TRANSACTIONS: |
|
|
| Class A |
|
|
| Proceeds from shares issued |
$37,527
|
$39,262 |
| Distributions reinvested |
8,400 |
4,095 |
| Cost of shares redeemed |
(31,122)
|
(34,717) |
| Change in net assets resulting from Class A capital transactions |
14,805 |
8,640 |
| Class C |
|
|
| Proceeds from shares issued |
234 |
165 |
| Distributions reinvested |
135 |
104 |
| Cost of shares redeemed |
(1,871)
|
(2,175) |
| Change in net assets resulting from Class C capital transactions |
(1,502)
|
(1,906) |
| Class I |
|
|
| Proceeds from shares issued |
10,688 |
12,348 |
| Distributions reinvested |
1,784 |
829 |
| Cost of shares redeemed |
(13,058)
|
(11,848) |
| Change in net assets resulting from Class I capital transactions |
(586)
|
1,329 |
| Class L |
|
|
| Proceeds from shares issued |
397 |
2,881 |
| Distributions reinvested |
310 |
179 |
| Cost of shares redeemed |
(803)
|
(3,956) |
| Change in net assets resulting from Class L capital transactions |
(96)
|
(896) |
| Class R2 |
|
|
| Proceeds from shares issued |
69 |
175 |
| Distributions reinvested |
22 |
11 |
| Cost of shares redeemed |
(31)
|
(252) |
| Change in net assets resulting from Class R2 capital transactions |
60 |
(66) |
| Class R5 |
|
|
| Proceeds from shares issued |
25 |
21 |
| Distributions reinvested |
2 |
3 |
| Cost of shares redeemed |
(54)
|
(64) |
| Change in net assets resulting from Class R5 capital transactions |
(27)
|
(40) |
| Class R6 |
|
|
| Proceeds from shares issued |
69,981 |
52,793 |
| Distributions reinvested |
7,790 |
3,621 |
| Cost of shares redeemed |
(36,882)
|
(47,586) |
| Change in net assets resulting from Class R6 capital transactions |
40,889 |
8,828 |
| Total change in net assets resulting from capital transactions |
$53,543 |
$15,889
|
| 76 |
J.P. Morgan International Equity Funds |
October 31, 2022 |
| |
JPMorgan
International Value Fund | |
| |
Year Ended
October 31, 2022 |
Year Ended October 31, 2021 |
| SHARE TRANSACTIONS: |
|
|
| Class A |
|
|
| Issued |
3,140 |
3,054 |
| Reinvested |
685 |
356 |
| Redeemed |
(2,627)
|
(2,757) |
| Change in Class A Shares |
1,198 |
653 |
| Class C |
|
|
| Issued |
21 |
12 |
| Reinvested |
11 |
10 |
| Redeemed |
(158)
|
(181) |
| Change in Class C Shares |
(126)
|
(159) |
| Class I |
|
|
| Issued |
850 |
923 |
| Reinvested |
141 |
70 |
| Redeemed |
(1,082)
|
(921) |
| Change in Class I Shares |
(91)
|
72 |
| Class L |
|
|
| Issued |
33 |
219 |
| Reinvested |
25 |
15 |
| Redeemed |
(65)
|
(301) |
| Change in Class L Shares |
(7) |
(67) |
| Class R2 |
|
|
| Issued |
6 |
14 |
| Reinvested |
2 |
1 |
| Redeemed |
(3)
|
(20) |
| Change in Class R2 Shares |
5 |
(5) |
| Class R5 |
|
|
| Issued |
2 |
2 |
| Reinvested |
—(a) |
—(a) |
| Redeemed |
(4)
|
(5) |
| Change in Class R5 Shares |
(2) |
(3) |
| Class R6 |
|
|
| Issued |
5,786 |
4,060 |
| Reinvested |
626 |
310 |
| Redeemed |
(3,067)
|
(3,744) |
| Change in Class R6 Shares |
3,345 |
626 |
| October 31, 2022 |
J.P. Morgan International Equity Funds |
77 |
FOR THE PERIODS INDICATED
| |
Per share
operating performance | ||||||
| |
|
Investment
operations |
Distributions
| ||||
| |
Net asset
value,
beginning
of period |
Net
investment
income
(loss)(a) |
Net realized
and unrealized
gains
(losses) on
investments |
Total from
investment
operations |
Net
investment
income |
Net
realized
gain |
Total
distributions |
| JPMorgan Emerging Markets Equity Fund |
|
|
|
|
|
|
|
| Class A |
|
|
|
|
|
|
|
| Year Ended October 31, 2022 |
$40.54 |
$0.06
|
$(15.42)
|
$(15.36)
|
$(0.07)
|
$(1.26)
|
$(1.33) |
| Year Ended October 31, 2021 |
36.44 |
(0.14) |
4.24 |
4.10 |
— |
— |
— |
| Year Ended October 31, 2020 |
30.07 |
(0.02) |
6.56 |
6.54 |
(0.17) |
— |
(0.17) |
| Year Ended October 31, 2019 |
23.84 |
0.19 |
6.16 |
6.35 |
(0.12) |
— |
(0.12) |
| Year Ended October 31, 2018 |
27.58 |
0.14 |
(3.84) |
(3.70) |
(0.04) |
— |
(0.04) |
| Class C |
|
|
|
|
|
|
|
| Year Ended October 31, 2022 |
38.96 |
(0.10) |
(14.78) |
(14.88) |
— |
(1.26) |
(1.26) |
| Year Ended October 31, 2021 |
35.20 |
(0.34) |
4.10 |
3.76 |
— |
— |
— |
| Year Ended October 31, 2020 |
29.07 |
(0.18) |
6.35 |
6.17 |
(0.04) |
— |
(0.04) |
| Year Ended October 31, 2019 |
23.08 |
0.04 |
5.98 |
6.02 |
(0.03) |
— |
(0.03) |
| Year Ended October 31, 2018 |
26.80 |
0.02 |
(3.74) |
(3.72) |
—(d) |
— |
—(d) |
| Class I |
|
|
|
|
|
|
|
| Year Ended October 31, 2022 |
41.60 |
0.12 |
(15.81) |
(15.69) |
(0.17) |
(1.26) |
(1.43) |
| Year Ended October 31, 2021 |
37.34 |
(0.04) |
4.34 |
4.30 |
(0.04) |
— |
(0.04) |
| Year Ended October 31, 2020 |
30.79 |
0.05 |
6.75 |
6.80 |
(0.25) |
— |
(0.25) |
| Year Ended October 31, 2019 |
24.45 |
0.27 |
6.29 |
6.56 |
(0.22) |
— |
(0.22) |
| Year Ended October 31, 2018 |
28.29 |
0.24 |
(3.96) |
(3.72) |
(0.12) |
— |
(0.12) |
| Class L |
|
|
|
|
|
|
|
| Year Ended October 31, 2022 |
41.96 |
0.17 |
(15.95) |
(15.78) |
(0.22) |
(1.26) |
(1.48) |
| Year Ended October 31, 2021 |
37.64 |
0.01 |
4.37 |
4.38 |
(0.06) |
— |
(0.06) |
| Year Ended October 31, 2020 |
31.03 |
0.08 |
6.80 |
6.88 |
(0.27) |
— |
(0.27) |
| Year Ended October 31, 2019 |
24.63 |
0.29 |
6.35 |
6.64 |
(0.24) |
— |
(0.24) |
| Year Ended October 31, 2018 |
28.49 |
0.26 |
(3.99) |
(3.73) |
(0.13) |
— |
(0.13) |
| Class R2 |
|
|
|
|
|
|
|
| Year Ended October 31, 2022 |
39.99 |
(0.02) |
(15.22) |
(15.24) |
— |
(1.26) |
(1.26) |
| Year Ended October 31, 2021 |
36.06 |
(0.26) |
4.19 |
3.93 |
— |
— |
— |
| Year Ended October 31, 2020 |
29.78 |
(0.13) |
6.52 |
6.39 |
(0.11) |
— |
(0.11) |
| Year Ended October 31, 2019 |
23.73 |
0.08 |
6.13 |
6.21 |
(0.16) |
— |
(0.16) |
| Year Ended October 31, 2018 |
27.57 |
0.07 |
(3.83) |
(3.76) |
(0.08) |
— |
(0.08) |
| Class R3 |
|
|
|
|
|
|
|
| Year Ended October 31, 2022 |
40.30 |
0.06 |
(15.32) |
(15.26) |
(0.11) |
(1.26) |
(1.37) |
| Year Ended October 31, 2021 |
36.25 |
(0.15) |
4.20 |
4.05 |
— |
— |
— |
| Year Ended October 31, 2020 |
29.96 |
(0.05) |
6.55 |
6.50 |
(0.21) |
— |
(0.21) |
| Year Ended October 31, 2019 |
23.78 |
0.25 |
6.06 |
6.31 |
(0.13) |
— |
(0.13) |
| Year Ended October 31, 2018 |
27.59 |
0.22 |
(3.92) |
(3.70) |
(0.11) |
— |
(0.11) |
| Class R4 |
|
|
|
|
|
|
|
| Year Ended October 31, 2022 |
41.45 |
0.13 |
(15.77) |
(15.64) |
(0.16) |
(1.26) |
(1.42) |
| Year Ended October 31, 2021 |
37.20 |
(0.05) |
4.32 |
4.27 |
(0.02) |
— |
(0.02) |
| Year Ended October 31, 2020 |
30.68 |
0.04 |
6.70 |
6.74 |
(0.22) |
— |
(0.22) |
| Year Ended October 31, 2019 |
24.42 |
0.27 |
6.25 |
6.52 |
(0.26) |
— |
(0.26) |
| Year Ended October 31, 2018 |
28.28 |
0.18 |
(3.91) |
(3.73) |
(0.13) |
— |
(0.13) |
| 78 |
J.P. Morgan International Equity Funds |
October 31, 2022 |
| |
Ratios/Supplemental data | |||||
| |
|
|
Ratios to
average net assets | |||
| Net asset
value,
end of
period |
Total return
(excludes
sales
charge)(b) |
Net assets,
end of
period
(000's) |
Net
expenses(c)
|
Net
investment
income
(loss) |
Expenses without
waivers and reimbursements |
Portfolio turnover
rate |
| |
|
|
|
|
|
|
| |
|
|
|
|
|
|
| $23.85 |
(39.06)% |
$358,077
|
1.25% |
0.19% |
1.33% |
18% |
| 40.54 |
11.25 |
702,288 |
1.24 |
(0.33) |
1.30 |
25 |
| 36.44 |
21.84 |
578,112 |
1.24 |
(0.06) |
1.33 |
15 |
| 30.07 |
26.77 |
524,357 |
1.24 |
0.69 |
1.47 |
34 |
| 23.84 |
(13.44) |
369,490 |
1.24 |
0.51 |
1.52 |
13 |
| |
|
|
|
|
|
|
| 22.82 |
(39.36) |
35,997 |
1.75 |
(0.35) |
1.83 |
18 |
| 38.96 |
10.68 |
82,409 |
1.74 |
(0.83) |
1.80 |
25 |
| 35.20 |
21.24 |
72,364 |
1.74 |
(0.58) |
1.83 |
15 |
| 29.07 |
26.12 |
56,830 |
1.74 |
0.15 |
1.98 |
34 |
| 23.08 |
(13.87) |
43,612 |
1.74 |
0.06 |
2.02 |
13 |
| |
|
|
|
|
|
|
| 24.48 |
(38.92) |
1,871,401 |
1.00 |
0.37 |
1.07 |
18 |
| 41.60 |
11.51 |
4,753,438 |
0.99 |
(0.09) |
1.05 |
25 |
| 37.34 |
22.19 |
4,016,180 |
0.99 |
0.15 |
1.07 |
15 |
| 30.79 |
27.04 |
1,725,882 |
0.99 |
0.94 |
1.21 |
34 |
| 24.45 |
(13.23) |
773,142 |
0.99 |
0.84 |
1.26 |
13 |
| |
|
|
|
|
|
|
| 24.70 |
(38.84) |
1,282,832 |
0.90 |
0.53 |
0.92 |
18 |
| 41.96 |
11.63 |
2,598,326 |
0.89 |
0.02 |
0.90 |
25 |
| 37.64 |
22.29 |
1,877,489 |
0.89 |
0.25 |
0.92 |
15 |
| 31.03 |
27.20 |
926,781 |
0.89 |
1.00 |
1.06 |
34 |
| 24.63 |
(13.16) |
475,997 |
0.89 |
0.91 |
1.11 |
13 |
| |
|
|
|
|
|
|
| 23.49 |
(39.24) |
407 |
1.55 |
(0.07) |
1.83 |
18 |
| 39.99 |
10.90 |
585 |
1.54 |
(0.63) |
1.78 |
25 |
| 36.06 |
21.51 |
414 |
1.54 |
(0.41) |
2.00 |
15 |
| 29.78 |
26.35 |
145 |
1.54 |
0.31 |
2.26 |
34 |
| 23.73 |
(13.69) |
95 |
1.54 |
0.26 |
2.04 |
13 |
| |
|
|
|
|
|
|
| 23.67 |
(39.08) |
11,182 |
1.30 |
0.19 |
1.32 |
18 |
| 40.30 |
11.17 |
14,918 |
1.29 |
(0.36) |
1.30 |
25 |
| 36.25 |
21.80 |
5,797 |
1.29 |
(0.15) |
1.33 |
15 |
| 29.96 |
26.67 |
2,151 |
1.29 |
0.90 |
1.49 |
34 |
| 23.78 |
(13.49) |
341 |
1.29 |
0.81 |
1.59 |
13 |
| |
|
|
|
|
|
|
| 24.39 |
(38.93) |
2,485 |
1.05 |
0.43 |
1.08 |
18 |
| 41.45 |
11.48 |
3,810 |
1.04 |
(0.12) |
1.06 |
25 |
| 37.20 |
22.09 |
2,962 |
1.04 |
0.12 |
1.08 |
15 |
| 30.68 |
26.98 |
1,300 |
1.04 |
0.94 |
1.23 |
34 |
| 24.42 |
(13.25) |
26 |
1.04 |
0.63 |
1.62 |
13 |
| October 31, 2022 |
J.P. Morgan International Equity Funds |
79 |
FOR THE PERIODS INDICATED (continued)
| |
Per share
operating performance | ||||||
| |
|
Investment
operations |
Distributions
| ||||
| |
Net asset
value,
beginning
of period |
Net
investment
income
(loss)(a) |
Net realized
and unrealized
gains
(losses) on
investments |
Total from
investment
operations |
Net
investment
income |
Net
realized
gain |
Total
distributions |
| JPMorgan Emerging Markets Equity Fund (continued) |
|
|
|
|
|
|
|
| Class R5 |
|
|
|
|
|
|
|
| Year Ended October 31, 2022 |
$41.88 |
$0.18 |
$(15.96)
|
$(15.78)
|
$(0.15)
|
$(1.26)
|
$(1.41) |
| Year Ended October 31, 2021 |
37.56 |
0.01 |
4.36 |
4.37 |
(0.05) |
— |
(0.05) |
| Year Ended October 31, 2020 |
30.96 |
0.08 |
6.78 |
6.86 |
(0.26) |
— |
(0.26) |
| Year Ended October 31, 2019 |
24.60 |
0.31 |
6.31 |
6.62 |
(0.26) |
— |
(0.26) |
| Year Ended October 31, 2018 |
28.47 |
0.39 |
(4.11) |
(3.72) |
(0.15) |
— |
(0.15) |
| Class R6 |
|
|
|
|
|
|
|
| Year Ended October 31, 2022 |
41.95 |
0.21 |
(15.95) |
(15.74) |
(0.26) |
(1.26) |
(1.52) |
| Year Ended October 31, 2021 |
37.61 |
0.05 |
4.37 |
4.42 |
(0.08) |
— |
(0.08) |
| Year Ended October 31, 2020 |
31.00 |
0.12 |
6.78 |
6.90 |
(0.29) |
— |
(0.29) |
| Year Ended October 31, 2019 |
24.60 |
0.31 |
6.35 |
6.66 |
(0.26) |
— |
(0.26) |
| Year Ended October 31, 2018 |
28.46 |
0.29 |
(3.99) |
(3.70) |
(0.16) |
— |
(0.16) |
| | |
| (a) |
Calculated based upon average shares outstanding. |
| (b) |
Includes adjustments in accordance with accounting principles generally accepted in the United States of America and as such, the net asset values for financial
reporting purposes and the returns based upon those net asset values may differ from the net asset values
and returns for shareholder transactions. |
| (c) |
Includes interest expense, if applicable, which is less than 0.005% unless otherwise noted. |
| (d) |
Amount rounds to less than $0.005. |
| 80 |
J.P. Morgan International Equity Funds |
October 31, 2022 |
| |
Ratios/Supplemental data | |||||
| |
|
|
Ratios to
average net assets | |||
| Net asset
value,
end of
period |
Total return
(excludes
sales
charge)(b) |
Net assets,
end of
period
(000's) |
Net
expenses(c)
|
Net
investment
income
(loss) |
Expenses without
waivers and reimbursements |
Portfolio turnover
rate |
| | ||||||
| |
|
|
|
|
|
|
| $24.69 |
(38.86)% |
$12,712
|
0.90% |
0.55% |
0.93% |
18% |
| 41.88 |
11.64 |
20,676 |
0.89 |
0.02 |
0.91 |
25 |
| 37.56 |
22.29 |
57,909 |
0.89 |
0.26 |
0.93 |
15 |
| 30.96 |
27.19 |
41,872 |
0.89 |
1.08 |
1.08 |
34 |
| 24.60 |
(13.14) |
1,672 |
0.89 |
1.37 |
1.11 |
13 |
| |
|
|
|
|
|
|
| 24.69 |
(38.78) |
3,579,903 |
0.80 |
0.67 |
0.82 |
18 |
| 41.95 |
11.75 |
5,659,334 |
0.79 |
0.11 |
0.80 |
25 |
| 37.61 |
22.39 |
4,608,998 |
0.79 |
0.37 |
0.82 |
15 |
| 31.00 |
27.36 |
3,034,359 |
0.79 |
1.09 |
0.96 |
34 |
| 24.60 |
(13.08) |
2,936,830 |
0.79 |
1.00 |
1.01 |
13 |
| October 31, 2022 |
J.P. Morgan International Equity Funds |
81 |
FOR THE PERIODS INDICATED
| |
Per share
operating performance | ||||||
| |
|
Investment
operations |
Distributions
| ||||
| |
Net asset
value,
beginning
of period |
Net
investment
income
(loss)(b) |
Net realized
and unrealized
gains
(losses) on
investments |
Total from
investment
operations |
Net
investment
income |
Net
realized
gain |
Total
distributions |
| JPMorgan Emerging Markets Research Enhanced Equity Fund |
|
|
|
|
|
|
|
| Class I |
|
|
|
|
|
|
|
| Year Ended October 31, 2022 |
$20.87 |
$0.48 |
$(6.96)
|
$(6.48)
|
$(0.52)
|
$(0.53)
|
$(1.05) |
| Year Ended October 31, 2021 |
18.11 |
0.51 |
2.56 |
3.07 |
(0.31) |
— |
(0.31) |
| Year Ended October 31, 2020 |
16.78 |
0.33 |
1.04 |
1.37 |
— |
(0.04) |
(0.04) |
| January 30, 2019 (f) through October 31, 2019 |
16.22 |
0.31 |
0.25 |
0.56 |
— |
— |
— |
| Class R6 |
|
|
|
|
|
|
|
| Year Ended October 31, 2022 |
20.77 |
0.45 |
(6.88) |
(6.43) |
(0.54) |
(0.53) |
(1.07) |
| Year Ended October 31, 2021 |
18.01 |
0.42 |
2.65 |
3.07 |
(0.31) |
— |
(0.31) |
| Year Ended October 31, 2020 |
16.80 |
0.31 |
1.07 |
1.38 |
(0.13) |
(0.04) |
(0.17) |
| December 11, 2018 (h) through October 31, 2019 |
15.00 |
0.42 |
1.46 |
1.88 |
(0.08) |
— |
(0.08) |
| | |
| (a) |
Annualized for periods less than one year, unless otherwise noted. |
| (b) |
Calculated based upon average shares outstanding. |
| (c) |
Not annualized for periods less than one year. |
| (d) |
Includes adjustments in accordance with accounting principles generally accepted in the United States of America and as such, the net asset values for financial
reporting purposes and the returns based upon those net asset values may differ from the net asset values
and returns for shareholder transactions. |
| (e) |
Includes interest expense, if applicable, which is less than 0.005% unless otherwise noted. |
| (f) |
Commencement of offering of class of shares. |
| (g) |
Certain non-recurring expenses incurred by the Fund were not annualized for the period indicated. |
| (h) |
Commencement of operations. |
| 82 |
J.P. Morgan International Equity Funds |
October 31, 2022 |
| |
Ratios/Supplemental data | |||||
| |
|
|
Ratios to
average net assets(a) | |||
| Net asset
value,
end of
period |
Total
return(c)(d) |
Net assets,
end of
period
(000's) |
Net
expenses(e)
|
Net
investment
income
(loss) |
Expenses without
waivers and reimbursements |
Portfolio turnover
rate(c) |
| |
|
|
|
|
|
|
| |
|
|
|
|
|
|
| $13.34 |
(32.53)% |
$171,538
|
0.45% |
3.00% |
0.68% |
34% |
| 20.87 |
16.95 |
5,435 |
0.45 |
2.36 |
0.69 |
53 |
| 18.11 |
8.15 |
33 |
0.45 |
1.98 |
1.39 |
47 |
| 16.78 |
3.45 |
5 |
0.44(g) |
2.52(g) |
0.70(g) |
28 |
| |
|
|
|
|
|
|
| 13.27 |
(32.48) |
2,479,030 |
0.35 |
2.62 |
0.40 |
34 |
| 20.77 |
17.09 |
3,787,953 |
0.35 |
1.97 |
0.40 |
53 |
| 18.01 |
8.22 |
2,840,309 |
0.35 |
1.87 |
0.41 |
47 |
| 16.80 |
12.60 |
2,090,569 |
0.34(g) |
2.90(g) |
0.46(g) |
28 |
| October 31, 2022 |
J.P. Morgan International Equity Funds |
83 |
FOR THE PERIODS INDICATED
| |
Per share
operating performance | ||||
| |
|
Investment
operations |
Distributions
| ||
| |
Net asset
value,
beginning
of period |
Net
investment
income
(loss)(b) |
Net realized
and unrealized
gains
(losses) on
investments |
Total from
investment
operations |
Net
investment
income |
| JPMorgan Europe Dynamic Fund |
|
|
|
|
|
| Class A |
|
|
|
|
|
| Year Ended October 31, 2022 |
$30.91 |
$0.36 |
$(6.95)
|
$(6.59)
|
$(0.62) |
| Year Ended October 31, 2021 |
21.64 |
0.40(f) |
9.14 |
9.54 |
(0.27) |
| Year Ended October 31, 2020 |
24.25 |
0.25 |
(2.16) |
(1.91) |
(0.70) |
| Year Ended October 31, 2019 |
23.01 |
0.61 |
1.18 |
1.79 |
(0.55) |
| Year Ended October 31, 2018 |
27.04 |
0.42 |
(4.08) |
(3.66) |
(0.37) |
| Class C |
|
|
|
|
|
| Year Ended October 31, 2022 |
27.25 |
0.20 |
(6.13) |
(5.93) |
(0.47) |
| Year Ended October 31, 2021 |
19.10 |
0.22(f) |
8.08 |
8.30 |
(0.15) |
| Year Ended October 31, 2020 |
21.47 |
0.12 |
(1.91) |
(1.79) |
(0.58) |
| Year Ended October 31, 2019 |
20.39 |
0.44 |
1.06 |
1.50 |
(0.42) |
| Year Ended October 31, 2018 |
24.00 |
0.25 |
(3.62) |
(3.37) |
(0.24) |
| Class I |
|
|
|
|
|
| Year Ended October 31, 2022 |
31.57 |
0.24 |
(6.88) |
(6.64) |
(0.73) |
| Year Ended October 31, 2021 |
22.10 |
0.47(f) |
9.33 |
9.80 |
(0.33) |
| Year Ended October 31, 2020 |
24.75 |
0.31 |
(2.19) |
(1.88) |
(0.77) |
| Year Ended October 31, 2019 |
23.48 |
0.67 |
1.21 |
1.88 |
(0.61) |
| Year Ended October 31, 2018 |
27.60 |
0.49 |
(4.17) |
(3.68) |
(0.44) |
| Class L |
|
|
|
|
|
| Year Ended October 31, 2022 |
31.99 |
0.52 |
(7.22) |
(6.70) |
(0.75) |
| Year Ended October 31, 2021 |
22.38 |
0.54(f) |
9.44 |
9.98 |
(0.37) |
| Year Ended October 31, 2020 |
25.05 |
0.35 |
(2.23) |
(1.88) |
(0.79) |
| Year Ended October 31, 2019 |
23.70 |
0.65 |
1.27 |
1.92 |
(0.57) |
| Year Ended October 31, 2018 |
27.85 |
0.51 |
(4.18) |
(3.67) |
(0.48) |
| Class R6 |
|
|
|
|
|
| Year Ended October 31, 2022 |
31.86 |
0.49 |
(7.13) |
(6.64) |
(0.78) |
| Year Ended October 31, 2021 |
22.29 |
0.55(f) |
9.41 |
9.96 |
(0.39) |
| Year Ended October 31, 2020 |
24.96 |
0.37 |
(2.22) |
(1.85) |
(0.82) |
| Year Ended October 31, 2019 |
23.70 |
0.75 |
1.19 |
1.94 |
(0.68) |
| October 1, 2018 (g) through October 31, 2018 |
26.32 |
0.01 |
(2.63) |
(2.62) |
— |
| | |
| (a) |
Annualized for periods less than one year, unless otherwise noted. |
| (b) |
Calculated based upon average shares outstanding. |
| (c) |
Not annualized for periods less than one year. |
| (d) |
Includes adjustments in accordance with accounting principles generally accepted in the United States of America and as such, the net asset values for financial
reporting purposes and the returns based upon those net asset values may differ from the net asset values
and returns for shareholder transactions. |
| (e) |
Includes interest expense, if applicable, which is less than 0.005% unless otherwise noted. |
| (f) |
Reflects income from foreign withholding tax claims, including related interest income. Had the Fund not received these proceeds, the net investment income
(loss) per share would have been $0.38, $0.20, $0.45, $0.52 and $0.53 for Class A, Class C, Class I,
Class L and Class R6, respectively, and the net investment income (loss) ratios would have
been 1.29%, 0.78%, 1.44%, 1.70% and 1.75% for Class A, Class C, Class I, Class L and Class R6, respectively. |
| (g) |
Commencement of offering of class of shares. |
| 84 |
J.P. Morgan International Equity Funds |
October 31, 2022 |
| |
Ratios/Supplemental data | |||||
| |
|
|
Ratios to average net assets(a) | |||
| Net asset
value,
end of
period |
Total return
(excludes
sales charge)(c)(d) |
Net assets,
end of
period
(000's) |
Net
expenses(e) |
Net
investment
income
(loss) |
Expenses without
waivers and reimbursements |
Portfolio
turnover
rate(c) |
| |
|
|
|
|
|
|
| |
|
|
|
|
|
|
| $23.70
|
(21.70)% |
$64,573
|
1.25% |
1.37% |
1.28% |
75% |
| 30.91 |
44.30 |
88,315 |
1.24 |
1.37(f) |
1.26 |
92 |
| 21.64 |
(8.21) |
68,882 |
1.24 |
1.09 |
1.28 |
159 |
| 24.25 |
8.14 |
98,294 |
1.24 |
2.67 |
1.31 |
83 |
| 23.01 |
(13.72) |
124,681 |
1.24 |
1.58 |
1.29 |
149 |
| |
|
|
|
|
|
|
| 20.85 |
(22.09) |
5,096 |
1.75 |
0.82 |
1.78 |
75 |
| 27.25 |
43.56 |
11,313 |
1.74 |
0.86(f) |
1.77 |
92 |
| 19.10 |
(8.68) |
11,082 |
1.74 |
0.59 |
1.77 |
159 |
| 21.47 |
7.64 |
19,798 |
1.74 |
2.15 |
1.80 |
83 |
| 20.39 |
(14.18) |
31,125 |
1.74 |
1.08 |
1.79 |
149 |
| |
|
|
|
|
|
|
| 24.20 |
(21.48) |
83,608 |
0.98 |
0.81 |
1.00 |
75 |
| 31.57 |
44.61 |
443,053 |
0.98 |
1.52(f) |
0.99 |
92 |
| 22.10 |
(7.98) |
52,841 |
0.99 |
1.33 |
1.01 |
159 |
| 24.75 |
8.44 |
86,582 |
0.99 |
2.86 |
1.05 |
83 |
| 23.48 |
(13.53) |
139,858 |
0.99 |
1.84 |
1.04 |
149 |
| |
|
|
|
|
|
|
| 24.54 |
(21.39) |
15,568 |
0.85 |
1.87 |
0.86 |
75 |
| 31.99 |
44.88 |
86,054 |
0.84 |
1.78(f) |
0.85 |
92 |
| 22.38 |
(7.86) |
55,597 |
0.85 |
1.49 |
0.86 |
159 |
| 25.05 |
8.49 |
65,686 |
0.89 |
2.77 |
0.90 |
83 |
| 23.70 |
(13.41) |
389,665 |
0.88 |
1.88 |
0.89 |
149 |
| |
|
|
|
|
|
|
| 24.44 |
(21.31) |
370,736 |
0.75 |
1.81 |
0.76 |
75 |
| 31.86 |
45.01 |
445,783 |
0.74 |
1.83(f) |
0.75 |
92 |
| 22.29 |
(7.79) |
250,426 |
0.75 |
1.61 |
0.76 |
159 |
| 24.96 |
8.65 |
271,885 |
0.79 |
3.17 |
0.79 |
83 |
| 23.70 |
(9.95) |
18 |
0.82 |
0.67 |
0.83 |
149 |
| October 31, 2022 |
J.P. Morgan International Equity Funds |
85 |
FOR THE PERIODS INDICATED
| |
Per share
operating performance | ||||||
| |
|
Investment
operations |
Distributions
| ||||
| |
Net asset
value,
beginning
of period |
Net
investment
income
(loss)(a) |
Net realized
and unrealized
gains
(losses) on
investments |
Total from
investment
operations |
Net
investment
income |
Net
realized
gain |
Total
distributions |
| JPMorgan International Equity Fund |
|
|
|
|
|
|
|
| Class A |
|
|
|
|
|
|
|
| Year Ended October 31, 2022 |
$21.63 |
$0.31 |
$(5.83)
|
$(5.52)
|
$(0.37)
|
$(0.99)
|
$(1.36) |
| Year Ended October 31, 2021 |
16.47 |
0.30(d) |
5.04 |
5.34 |
(0.18) |
— |
(0.18) |
| Year Ended October 31, 2020 |
17.27 |
0.19 |
(0.49) |
(0.30) |
(0.50) |
— |
(0.50) |
| Year Ended October 31, 2019 |
15.56 |
0.33 |
1.89 |
2.22 |
(0.33) |
(0.18) |
(0.51) |
| Year Ended October 31, 2018 |
17.81 |
0.33 |
(2.33) |
(2.00) |
(0.25) |
— |
(0.25) |
| Class C |
|
|
|
|
|
|
|
| Year Ended October 31, 2022 |
20.41 |
0.20 |
(5.48) |
(5.28) |
(0.27) |
(0.99) |
(1.26) |
| Year Ended October 31, 2021 |
15.53 |
0.18(d) |
4.77 |
4.95 |
(0.07) |
— |
(0.07) |
| Year Ended October 31, 2020 |
16.29 |
0.09 |
(0.45) |
(0.36) |
(0.40) |
— |
(0.40) |
| Year Ended October 31, 2019 |
14.68 |
0.23 |
1.80 |
2.03 |
(0.24) |
(0.18) |
(0.42) |
| Year Ended October 31, 2018 |
16.83 |
0.25 |
(2.23) |
(1.98) |
(0.17) |
— |
(0.17) |
| Class I |
|
|
|
|
|
|
|
| Year Ended October 31, 2022 |
22.02 |
0.38 |
(5.95) |
(5.57) |
(0.42) |
(0.99) |
(1.41) |
| Year Ended October 31, 2021 |
16.76 |
0.36(d) |
5.13 |
5.49 |
(0.23) |
— |
(0.23) |
| Year Ended October 31, 2020 |
17.56 |
0.21 |
(0.47) |
(0.26) |
(0.54) |
— |
(0.54) |
| Year Ended October 31, 2019 |
15.82 |
0.36 |
1.93 |
2.29 |
(0.37) |
(0.18) |
(0.55) |
| Year Ended October 31, 2018 |
18.09 |
0.41 |
(2.40) |
(1.99) |
(0.28) |
— |
(0.28) |
| Class R2 |
|
|
|
|
|
|
|
| Year Ended October 31, 2022 |
21.31 |
0.25 |
(5.74) |
(5.49) |
(0.30) |
(0.99) |
(1.29) |
| Year Ended October 31, 2021 |
16.31 |
0.23(d) |
4.99 |
5.22 |
(0.22) |
— |
(0.22) |
| Year Ended October 31, 2020 |
17.14 |
0.13 |
(0.48) |
(0.35) |
(0.48) |
— |
(0.48) |
| Year Ended October 31, 2019 |
15.44 |
0.28 |
1.88 |
2.16 |
(0.28) |
(0.18) |
(0.46) |
| Year Ended October 31, 2018 |
17.70 |
0.29 |
(2.33) |
(2.04) |
(0.22) |
— |
(0.22) |
| Class R5 |
|
|
|
|
|
|
|
| Year Ended October 31, 2022 |
22.14 |
0.38 |
(5.96) |
(5.58) |
(0.44) |
(0.99) |
(1.43) |
| Year Ended October 31, 2021 |
16.85 |
0.39(d) |
5.15 |
5.54 |
(0.25) |
— |
(0.25) |
| Year Ended October 31, 2020 |
17.60 |
0.24 |
(0.48) |
(0.24) |
(0.51) |
— |
(0.51) |
| Year Ended October 31, 2019 |
15.85 |
0.38 |
1.94 |
2.32 |
(0.39) |
(0.18) |
(0.57) |
| Year Ended October 31, 2018 |
18.13 |
0.41 |
(2.40) |
(1.99) |
(0.29) |
— |
(0.29) |
| Class R6 |
|
|
|
|
|
|
|
| Year Ended October 31, 2022 |
22.10 |
0.39 |
(5.94) |
(5.55) |
(0.46) |
(0.99) |
(1.45) |
| Year Ended October 31, 2021 |
16.81 |
0.42(d) |
5.13 |
5.55 |
(0.26) |
— |
(0.26) |
| Year Ended October 31, 2020 |
17.61 |
0.26 |
(0.49) |
(0.23) |
(0.57) |
— |
(0.57) |
| Year Ended October 31, 2019 |
15.86 |
0.40 |
1.93 |
2.33 |
(0.40) |
(0.18) |
(0.58) |
| Year Ended October 31, 2018 |
18.13 |
0.43 |
(2.39) |
(1.96) |
(0.31) |
— |
(0.31) |
| | |
| (a) |
Calculated based upon average shares outstanding. |
| (b) |
Includes adjustments in accordance with accounting principles generally accepted in the United States of America and as such, the net asset values for financial
reporting purposes and the returns based upon those net asset values may differ from the net asset values
and returns for shareholder transactions. |
| (c) |
Includes interest expense, if applicable, which is less than 0.005% unless otherwise noted. |
| (d) |
Reflects income from foreign withholding tax claims. Had the Fund not received these proceeds, the net investment income (loss) per share and the net
investment income (loss) ratios for each share class would have remained the same. |
| 86 |
J.P. Morgan International Equity Funds |
October 31, 2022 |
| |
Ratios/Supplemental data | |||||
| |
|
|
Ratios to
average net assets | |||
| Net asset
value,
end of
period |
Total return
(excludes
sales
charge)(b) |
Net assets,
end of
period
(000's) |
Net
expenses(c)
|
Net
investment
income
(loss) |
Expenses without
waivers and reimbursements |
Portfolio turnover
rate |
| |
|
|
|
|
|
|
| |
|
|
|
|
|
|
| $14.75 |
(27.15)% |
$304,284
|
0.95% |
1.76% |
1.11% |
31% |
| 21.63 |
32.56 |
433,033 |
0.95 |
1.47(d) |
1.11 |
35 |
| 16.47 |
(1.88) |
263,791 |
0.95 |
1.17 |
1.12 |
28 |
| 17.27 |
14.93 |
328,312 |
0.95 |
2.03 |
1.22 |
25 |
| 15.56 |
(11.42) |
240,394 |
0.95 |
1.88 |
1.32 |
33 |
| |
|
|
|
|
|
|
| 13.87 |
(27.51) |
6,191 |
1.45 |
1.23 |
1.64 |
31 |
| 20.41 |
31.94 |
10,899 |
1.45 |
0.91(d) |
1.62 |
35 |
| 15.53 |
(2.38) |
9,358 |
1.45 |
0.61 |
1.62 |
28 |
| 16.29 |
14.39 |
14,549 |
1.45 |
1.51 |
1.74 |
25 |
| 14.68 |
(11.89) |
18,899 |
1.45 |
1.48 |
1.83 |
33 |
| |
|
|
|
|
|
|
| 15.04 |
(26.95) |
513,812 |
0.70 |
2.16 |
0.86 |
31 |
| 22.02 |
32.94 |
584,191 |
0.70 |
1.71(d) |
0.86 |
35 |
| 16.76 |
(1.64) |
339,416 |
0.70 |
1.26 |
0.86 |
28 |
| 17.56 |
15.20 |
190,885 |
0.70 |
2.22 |
0.96 |
25 |
| 15.82 |
(11.20) |
179,831 |
0.70 |
2.30 |
1.06 |
33 |
| |
|
|
|
|
|
|
| 14.53 |
(27.36) |
16,764 |
1.25 |
1.46 |
1.46 |
31 |
| 21.31 |
32.18 |
24,598 |
1.25 |
1.13(d) |
1.47 |
35 |
| 16.31 |
(2.21) |
21,379 |
1.25 |
0.79 |
1.37 |
28 |
| 17.14 |
14.58 |
2,099 |
1.25 |
1.75 |
1.57 |
25 |
| 15.44 |
(11.68) |
1,833 |
1.25 |
1.64 |
1.60 |
33 |
| |
|
|
|
|
|
|
| 15.13 |
(26.88) |
8,328 |
0.60 |
2.13 |
0.71 |
31 |
| 22.14 |
33.04 |
10,463 |
0.60 |
1.85(d) |
0.71 |
35 |
| 16.85 |
(1.52) |
6,970 |
0.60 |
1.41 |
0.72 |
28 |
| 17.60 |
15.38 |
3,778 |
0.60 |
2.31 |
0.83 |
25 |
| 15.85 |
(11.16) |
19,516 |
0.60 |
2.31 |
0.91 |
33 |
| |
|
|
|
|
|
|
| 15.10 |
(26.81) |
2,961,811 |
0.50 |
2.22 |
0.61 |
31 |
| 22.10 |
33.20 |
3,782,533 |
0.50 |
1.98(d) |
0.60 |
35 |
| 16.81 |
(1.46) |
2,290,008 |
0.50 |
1.56 |
0.61 |
28 |
| 17.61 |
15.50 |
2,457,383 |
0.50 |
2.46 |
0.72 |
25 |
| 15.86 |
(11.04) |
3,808,621 |
0.50 |
2.42 |
0.81 |
33 |
| October 31, 2022 |
J.P. Morgan International Equity Funds |
87 |
FOR THE PERIODS INDICATED
| |
Per share
operating performance | ||||
| |
|
Investment
operations |
Distributions
| ||
| |
Net asset
value,
beginning
of period |
Net
investment
income
(loss)(a) |
Net realized
and unrealized
gains
(losses) on
investments |
Total from
investment
operations |
Net
investment
income |
| JPMorgan International Focus Fund |
|
|
|
|
|
| Class A |
|
|
|
|
|
| Year Ended October 31, 2022 |
$27.55 |
$0.41 |
$(7.95)
|
$(7.54)
|
$(0.43) |
| Year Ended October 31, 2021 |
22.07 |
0.35(d) |
5.32 |
5.67 |
(0.19) |
| Year Ended October 31, 2020 |
21.15 |
0.18 |
0.75 |
0.93 |
(0.01) |
| Year Ended October 31, 2019 |
18.24 |
0.26 |
3.02 |
3.28 |
(0.37) |
| Year Ended October 31, 2018 |
21.14 |
0.36 |
(3.13) |
(2.77) |
(0.13) |
| Class C |
|
|
|
|
|
| Year Ended October 31, 2022 |
27.06 |
0.29 |
(7.83) |
(7.54) |
(0.29) |
| Year Ended October 31, 2021 |
21.68 |
0.20(d) |
5.24 |
5.44 |
(0.06) |
| Year Ended October 31, 2020 |
20.86 |
0.07 |
0.75 |
0.82 |
— |
| Year Ended October 31, 2019 |
17.98 |
0.16 |
2.97 |
3.13 |
(0.25) |
| Year Ended October 31, 2018 |
20.90 |
0.26 |
(3.09) |
(2.83) |
(0.09) |
| Class I |
|
|
|
|
|
| Year Ended October 31, 2022 |
27.95 |
0.47 |
(8.06) |
(7.59) |
(0.48) |
| Year Ended October 31, 2021 |
22.39 |
0.42(d) |
5.39 |
5.81 |
(0.25) |
| Year Ended October 31, 2020 |
21.43 |
0.23 |
0.78 |
1.01 |
(0.05) |
| Year Ended October 31, 2019 |
18.49 |
0.31 |
3.04 |
3.35 |
(0.41) |
| Year Ended October 31, 2018 |
21.41 |
0.44 |
(3.19) |
(2.75) |
(0.17) |
| Class R2 |
|
|
|
|
|
| Year Ended October 31, 2022 |
27.25 |
0.34 |
(7.89) |
(7.55) |
(0.30) |
| Year Ended October 31, 2021 |
21.85 |
0.27(d) |
5.26 |
5.53 |
(0.13) |
| Year Ended October 31, 2020 |
20.99 |
0.13 |
0.73 |
0.86 |
— |
| Year Ended October 31, 2019 |
18.14 |
0.21 |
2.98 |
3.19 |
(0.34) |
| Year Ended October 31, 2018 |
21.11 |
0.35 |
(3.17) |
(2.82) |
(0.15) |
| Class R5 |
|
|
|
|
|
| Year Ended October 31, 2022 |
27.96 |
0.49 |
(8.06) |
(7.57) |
(0.50) |
| Year Ended October 31, 2021 |
22.38 |
0.44(d) |
5.40 |
5.84 |
(0.26) |
| Year Ended October 31, 2020 |
21.42 |
0.25 |
0.78 |
1.03 |
(0.07) |
| Year Ended October 31, 2019 |
18.49 |
0.34 |
3.03 |
3.37 |
(0.44) |
| Year Ended October 31, 2018 |
21.39 |
0.53 |
(3.25) |
(2.72) |
(0.18) |
| Class R6 |
|
|
|
|
|
| Year Ended October 31, 2022 |
27.98 |
0.39 |
(7.94) |
(7.55) |
(0.53) |
| Year Ended October 31, 2021 |
22.40 |
0.46(d) |
5.40 |
5.86 |
(0.28) |
| Year Ended October 31, 2020 |
21.44 |
0.28 |
0.77 |
1.05 |
(0.09) |
| Year Ended October 31, 2019 |
18.50 |
0.27 |
3.13 |
3.40 |
(0.46) |
| Year Ended October 31, 2018 |
21.40 |
0.44 |
(3.16) |
(2.72) |
(0.18) |
| | |
| (a) |
Calculated based upon average shares outstanding. |
| (b) |
Includes adjustments in accordance with accounting principles generally accepted in the United States of America and as such, the net asset values for financial
reporting purposes and the returns based upon those net asset values may differ from the net asset values
and returns for shareholder transactions. |
| (c) |
Includes interest expense, if applicable, which is less than 0.005% unless otherwise noted. |
| (d) |
Reflects income from foreign withholding tax claims. Had the Fund not received these proceeds, the net investment income (loss) per share and the net
investment income (loss) ratios for each share class would have remained the same. |
| 88 |
J.P. Morgan International Equity Funds |
October 31, 2022 |
| |
Ratios/Supplemental data | |||||
| |
|
|
Ratios to
average net assets | |||
| Net asset
value,
end of
period |
Total return
(excludes
sales
charge)(b) |
Net assets,
end of
period
(000's) |
Net
expenses(c)
|
Net
investment
income
(loss) |
Expenses without
waivers and reimbursements |
Portfolio turnover
rate |
| |
|
|
|
|
|
|
| |
|
|
|
|
|
|
| $19.58 |
(27.75)% |
$237,262
|
1.00% |
1.75% |
1.24% |
30% |
| 27.55 |
25.74 |
337,503 |
1.00 |
1.31(d) |
1.21 |
32 |
| 22.07 |
4.39 |
135,527 |
1.00 |
0.86 |
1.22 |
38 |
| 21.15 |
18.41 |
114,629 |
1.00 |
1.33 |
1.32 |
34 |
| 18.24 |
(13.20) |
84,325 |
1.00 |
1.75 |
1.38 |
63 |
| |
|
|
|
|
|
|
| 19.23 |
(28.13) |
14,034 |
1.50 |
1.26 |
1.76 |
30 |
| 27.06 |
25.11 |
24,272 |
1.50 |
0.77(d) |
1.72 |
32 |
| 21.68 |
3.93 |
15,463 |
1.50 |
0.32 |
1.73 |
38 |
| 20.86 |
17.73 |
18,447 |
1.50 |
0.83 |
1.84 |
34 |
| 17.98 |
(13.60) |
22,532 |
1.50 |
1.29 |
1.89 |
63 |
| |
|
|
|
|
|
|
| 19.88 |
(27.56) |
433,591 |
0.75 |
1.99 |
0.99 |
30 |
| 27.95 |
26.04 |
832,039 |
0.75 |
1.54(d) |
0.96 |
32 |
| 22.39 |
4.71 |
372,068 |
0.75 |
1.05 |
0.96 |
38 |
| 21.43 |
18.62 |
177,764 |
0.75 |
1.57 |
1.08 |
34 |
| 18.49 |
(12.96) |
189,061 |
0.75 |
2.09 |
1.13 |
63 |
| |
|
|
|
|
|
|
| 19.40 |
(27.97) |
1,477 |
1.30 |
1.46 |
1.53 |
30 |
| 27.25 |
25.35 |
2,078 |
1.30 |
1.00(d) |
1.48 |
32 |
| 21.85 |
4.10 |
1,441 |
1.30 |
0.61 |
1.51 |
38 |
| 20.99 |
18.01 |
1,049 |
1.30 |
1.05 |
1.74 |
34 |
| 18.14 |
(13.46) |
773 |
1.30 |
1.70 |
1.72 |
63 |
| |
|
|
|
|
|
|
| 19.89 |
(27.51) |
1,961 |
0.65 |
2.06 |
0.91 |
30 |
| 27.96 |
26.19 |
3,172 |
0.65 |
1.61(d) |
0.87 |
32 |
| 22.38 |
4.79 |
2,772 |
0.65 |
1.16 |
0.88 |
38 |
| 21.42 |
18.76 |
3,082 |
0.65 |
1.71 |
1.04 |
34 |
| 18.49 |
(12.84) |
3,341 |
0.65 |
2.56 |
1.07 |
63 |
| |
|
|
|
|
|
|
| 19.90 |
(27.44) |
406,456 |
0.55 |
1.55 |
0.72 |
30 |
| 27.98 |
26.28 |
2,721,224 |
0.55 |
1.68(d) |
0.71 |
32 |
| 22.40 |
4.89 |
2,274,399 |
0.55 |
1.31 |
0.71 |
38 |
| 21.44 |
18.95 |
2,284,670 |
0.55 |
1.32 |
0.77 |
34 |
| 18.50 |
(12.81) |
175,198 |
0.55 |
2.12 |
0.87 |
63 |
| October 31, 2022 |
J.P. Morgan International Equity Funds |
89 |
FOR THE PERIODS INDICATED
| |
Per share
operating performance | ||||
| |
|
Investment
operations |
Distributions
| ||
| |
Net asset
value,
beginning
of period |
Net
investment
income
(loss)(b) |
Net realized
and unrealized
gains
(losses) on
investments |
Total from
investment
operations |
Net
investment
income |
| JPMorgan International Hedged Equity Fund |
|
|
|
|
|
| Class A |
|
|
|
|
|
| Year Ended October 31, 2022 |
$16.73 |
$0.32 |
$(2.60)
|
$(2.28)
|
$(0.38) |
| Year Ended October 31, 2021 |
14.12 |
0.30 |
2.58 |
2.88 |
(0.27) |
| Year Ended October 31, 2020 |
15.58 |
0.27 |
(1.49) |
(1.22) |
(0.24) |
| March 15, 2019 (f) through October 31, 2019 |
15.00 |
0.19 |
0.39 |
0.58 |
— |
| Class C |
|
|
|
|
|
| Year Ended October 31, 2022 |
16.68 |
0.20 |
(2.56) |
(2.36) |
(0.32) |
| Year Ended October 31, 2021 |
14.06 |
0.22 |
2.57 |
2.79 |
(0.17) |
| Year Ended October 31, 2020 |
15.53 |
0.20 |
(1.50) |
(1.30) |
(0.17) |
| March 15, 2019 (f) through October 31, 2019 |
15.00 |
0.16 |
0.37 |
0.53 |
— |
| Class I |
|
|
|
|
|
| Year Ended October 31, 2022 |
16.83 |
0.33 |
(2.59) |
(2.26) |
(0.41) |
| Year Ended October 31, 2021 |
14.18 |
0.32 |
2.61 |
2.93 |
(0.28) |
| Year Ended October 31, 2020 |
15.61 |
0.31 |
(1.50) |
(1.19) |
(0.24) |
| March 15, 2019 (f) through October 31, 2019 |
15.00 |
0.32 |
0.29 |
0.61 |
— |
| Class R5 |
|
|
|
|
|
| Year Ended October 31, 2022 |
16.86 |
0.35 |
(2.59) |
(2.24) |
(0.43) |
| Year Ended October 31, 2021 |
14.20 |
0.35 |
2.61 |
2.96 |
(0.30) |
| Year Ended October 31, 2020 |
15.62 |
0.31 |
(1.48) |
(1.17) |
(0.25) |
| March 15, 2019 (f) through October 31, 2019 |
15.00 |
0.34 |
0.28 |
0.62 |
— |
| Class R6 |
|
|
|
|
|
| Year Ended October 31, 2022 |
16.88 |
0.37 |
(2.60) |
(2.23) |
(0.45) |
| Year Ended October 31, 2021 |
14.22 |
0.39 |
2.59 |
2.98 |
(0.32) |
| Year Ended October 31, 2020 |
15.63 |
0.34 |
(1.49) |
(1.15) |
(0.26) |
| March 15, 2019 (f) through October 31, 2019 |
15.00 |
0.35 |
0.28 |
0.63 |
— |
| | |
| (a) |
Annualized for periods less than one year, unless otherwise noted. |
| (b) |
Calculated based upon average shares outstanding. |
| (c) |
Not annualized for periods less than one year. |
| (d) |
Includes adjustments in accordance with accounting principles generally accepted in the United States of America and as such, the net asset values for financial
reporting purposes and the returns based upon those net asset values may differ from the net asset values
and returns for shareholder transactions. |
| (e) |
Includes interest expense, if applicable, which is less than 0.005% unless otherwise noted. |
| (f) |
Commencement of operations. |
| (g) |
Certain non-recurring expenses incurred by the Fund were not annualized for the period indicated. |
| 90 |
J.P. Morgan International Equity Funds |
October 31, 2022 |
| |
Ratios/Supplemental data | |||||
| |
|
|
Ratios to average net assets(a) | |||
| Net asset
value,
end of
period |
Total return
(excludes
sales charge)(c)(d) |
Net assets,
end of
period
(000's) |
Net
expenses(e) |
Net
investment
income
(loss) |
Expenses without
waivers and reimbursements |
Portfolio
turnover
rate(c) |
| |
|
|
|
|
|
|
| |
|
|
|
|
|
|
| $14.07
|
(13.89)% |
$4,032
|
0.85% |
2.13% |
1.07% |
17% |
| 16.73 |
20.60 |
3,561 |
0.85 |
1.85 |
1.05 |
50 |
| 14.12 |
(8.02) |
1,573 |
0.85 |
1.84 |
1.30 |
85 |
| 15.58 |
3.87 |
330 |
0.85(g) |
1.95(g) |
1.31(g) |
9 |
| |
|
|
|
|
|
|
| 14.00 |
(14.36) |
235 |
1.35 |
1.35 |
1.58 |
17 |
| 16.68 |
19.97 |
320 |
1.35 |
1.35 |
1.55 |
50 |
| 14.06 |
(8.47) |
115 |
1.35 |
1.34 |
1.81 |
85 |
| 15.53 |
3.53 |
119 |
1.35(g) |
1.73(g) |
1.92(g) |
9 |
| |
|
|
|
|
|
|
| 14.16 |
(13.68) |
156,582 |
0.60 |
2.21 |
0.81 |
17 |
| 16.83 |
20.90 |
148,703 |
0.60 |
2.02 |
0.79 |
50 |
| 14.18 |
(7.78) |
135,542 |
0.60 |
2.12 |
1.03 |
85 |
| 15.61 |
4.07 |
59,751 |
0.60(g) |
3.38(g) |
1.19(g) |
9 |
| |
|
|
|
|
|
|
| 14.19 |
(13.56) |
20 |
0.45 |
2.30 |
0.73 |
17 |
| 16.86 |
21.10 |
23 |
0.45 |
2.19 |
0.71 |
50 |
| 14.20 |
(7.68) |
19 |
0.45 |
2.08 |
1.04 |
85 |
| 15.62 |
4.13 |
21 |
0.45(g) |
3.59(g) |
1.03(g) |
9 |
| |
|
|
|
|
|
|
| 14.20 |
(13.52) |
338 |
0.35 |
2.43 |
0.60 |
17 |
| 16.88 |
21.19 |
169 |
0.35 |
2.42 |
0.58 |
50 |
| 14.22 |
(7.53) |
19 |
0.35 |
2.33 |
0.94 |
85 |
| 15.63 |
4.20 |
21 |
0.35(g) |
3.69(g) |
0.93(g) |
9 |
| October 31, 2022 |
J.P. Morgan International Equity Funds |
91 |
FOR THE PERIODS INDICATED
| |
Per share
operating performance | ||||
| |
|
Investment
operations |
Distributions
| ||
| |
Net asset
value,
beginning
of period |
Net
investment
income
(loss)(a) |
Net realized
and unrealized
gains
(losses) on
investments |
Total from
investment
operations |
Net
investment
income |
| JPMorgan International Value Fund |
|
|
|
|
|
| Class A |
|
|
|
|
|
| Year Ended October 31, 2022 |
$13.46 |
$0.44 |
$(2.72)
|
$(2.28)
|
$(0.61) |
| Year Ended October 31, 2021 |
9.46 |
0.43(d) |
3.89 |
4.32 |
(0.32) |
| Year Ended October 31, 2020 |
12.22 |
0.28 |
(2.55) |
(2.27) |
(0.49) |
| Year Ended October 31, 2019 |
12.44 |
0.44 |
(0.20) |
0.24 |
(0.46) |
| Year Ended October 31, 2018 |
14.26 |
0.36 |
(1.87) |
(1.51) |
(0.31) |
| Class C |
|
|
|
|
|
| Year Ended October 31, 2022 |
13.02 |
0.35 |
(2.62) |
(2.27) |
(0.52) |
| Year Ended October 31, 2021 |
9.14 |
0.33(d) |
3.79 |
4.12 |
(0.24) |
| Year Ended October 31, 2020 |
11.81 |
0.21 |
(2.47) |
(2.26) |
(0.41) |
| Year Ended October 31, 2019 |
12.02 |
0.36 |
(0.18) |
0.18 |
(0.39) |
| Year Ended October 31, 2018 |
13.78 |
0.28 |
(1.82) |
(1.54) |
(0.22) |
| Class I |
|
|
|
|
|
| Year Ended October 31, 2022 |
13.84 |
0.49 |
(2.81) |
(2.32) |
(0.64) |
| Year Ended October 31, 2021 |
9.72 |
0.47(d) |
3.99 |
4.46 |
(0.34) |
| Year Ended October 31, 2020 |
12.54 |
0.31 |
(2.61) |
(2.30) |
(0.52) |
| Year Ended October 31, 2019 |
12.76 |
0.48 |
(0.20) |
0.28 |
(0.50) |
| Year Ended October 31, 2018 |
14.62 |
0.41 |
(1.92) |
(1.51) |
(0.35) |
| Class L |
|
|
|
|
|
| Year Ended October 31, 2022 |
13.78 |
0.49 |
(2.79) |
(2.30) |
(0.65) |
| Year Ended October 31, 2021 |
9.66 |
0.47(d) |
3.99 |
4.46 |
(0.34) |
| Year Ended October 31, 2020 |
12.47 |
0.30 |
(2.58) |
(2.28) |
(0.53) |
| Year Ended October 31, 2019 |
12.70 |
0.46 |
(0.17) |
0.29 |
(0.52) |
| Year Ended October 31, 2018 |
14.55 |
0.41 |
(1.90) |
(1.49) |
(0.36) |
| Class R2 |
|
|
|
|
|
| Year Ended October 31, 2022 |
13.22 |
0.40 |
(2.68) |
(2.28) |
(0.57) |
| Year Ended October 31, 2021 |
9.29 |
0.39(d) |
3.82 |
4.21 |
(0.28) |
| Year Ended October 31, 2020 |
11.96 |
0.24 |
(2.51) |
(2.27) |
(0.40) |
| Year Ended October 31, 2019 |
12.20 |
0.40 |
(0.20) |
0.20 |
(0.44) |
| Year Ended October 31, 2018 |
14.01 |
0.31 |
(1.84) |
(1.53) |
(0.28) |
| Class R5 |
|
|
|
|
|
| Year Ended October 31, 2022 |
13.67 |
0.52 |
(2.80) |
(2.28) |
(0.64) |
| Year Ended October 31, 2021 |
9.60 |
0.41(d) |
4.02 |
4.43 |
(0.36) |
| Year Ended October 31, 2020 |
12.40 |
0.33 |
(2.59) |
(2.26) |
(0.54) |
| Year Ended October 31, 2019 |
12.65 |
0.49 |
(0.21) |
0.28 |
(0.53) |
| Year Ended October 31, 2018 |
14.51 |
0.42 |
(1.91) |
(1.49) |
(0.37) |
| 92 |
J.P. Morgan International Equity Funds |
October 31, 2022 |
| |
Ratios/Supplemental data | |||||
| |
|
|
Ratios to
average net assets | |||
| Net asset
value,
end of
period |
Total return
(excludes
sales
charge)(b) |
Net assets,
end of
period
(000's) |
Net
expenses(c)
|
Net
investment
income
(loss) |
Expenses without
waivers and reimbursements |
Portfolio turnover
rate |
| |
|
|
|
|
|
|
| |
|
|
|
|
|
|
| $10.57 |
(17.56)% |
$160,039
|
0.98% |
3.71% |
1.23% |
26% |
| 13.46 |
46.20 |
187,774 |
1.00 |
3.39(d) |
1.24 |
33 |
| 9.46 |
(19.51) |
125,744 |
1.00 |
2.66 |
1.26 |
59 |
| 12.22 |
2.30 |
181,458 |
1.00 |
3.69 |
1.28 |
61 |
| 12.44 |
(10.88) |
242,231 |
1.00 |
2.59 |
1.27 |
90 |
| |
|
|
|
|
|
|
| 10.23 |
(18.04) |
1,791 |
1.49 |
3.01 |
1.76 |
26 |
| 13.02 |
45.54 |
3,923 |
1.50 |
2.70(d) |
1.77 |
33 |
| 9.14 |
(19.94) |
4,202 |
1.50 |
2.07 |
1.78 |
59 |
| 11.81 |
1.82 |
9,358 |
1.50 |
3.15 |
1.80 |
61 |
| 12.02 |
(11.37) |
14,055 |
1.50 |
2.06 |
1.78 |
90 |
| |
|
|
|
|
|
|
| 10.88 |
(17.38) |
29,816 |
0.73 |
4.00 |
0.98 |
26 |
| 13.84 |
46.51 |
39,188 |
0.75 |
3.58(d) |
0.99 |
33 |
| 9.72 |
(19.31) |
26,805 |
0.75 |
2.88 |
1.02 |
59 |
| 12.54 |
2.56 |
45,503 |
0.75 |
3.91 |
1.03 |
61 |
| 12.76 |
(10.62) |
66,291 |
0.75 |
2.84 |
1.02 |
90 |
| |
|
|
|
|
|
|
| 10.83 |
(17.31) |
5,451 |
0.63 |
4.04 |
0.83 |
26 |
| 13.78 |
46.77 |
7,042 |
0.66 |
3.66(d) |
0.84 |
33 |
| 9.66 |
(19.25) |
5,585 |
0.65 |
2.72 |
0.85 |
59 |
| 12.47 |
2.69 |
30,256 |
0.65 |
3.81 |
0.87 |
61 |
| 12.70 |
(10.57) |
73,651 |
0.65 |
2.84 |
0.87 |
90 |
| |
|
|
|
|
|
|
| 10.37 |
(17.88) |
454 |
1.28 |
3.41 |
1.58 |
26 |
| 13.22 |
45.84 |
514 |
1.30 |
3.14(d) |
1.59 |
33 |
| 9.29 |
(19.74) |
412 |
1.30 |
2.27 |
1.61 |
59 |
| 11.96 |
2.00 |
722 |
1.30 |
3.47 |
1.69 |
61 |
| 12.20 |
(11.19) |
1,025 |
1.30 |
2.27 |
1.59 |
90 |
| |
|
|
|
|
|
|
| 10.75 |
(17.31) |
29 |
0.63 |
4.23 |
0.83 |
26 |
| 13.67 |
46.74 |
67 |
0.65 |
3.24(d) |
0.85 |
33 |
| 9.60 |
(19.26) |
77 |
0.65 |
3.13 |
0.86 |
59 |
| 12.40 |
2.64 |
88 |
0.65 |
4.08 |
0.87 |
61 |
| 12.65 |
(10.58) |
70 |
0.65 |
2.97 |
0.91 |
90 |
| October 31, 2022 |
J.P. Morgan International Equity Funds |
93 |
FOR THE PERIODS INDICATED (continued)
| |
Per share
operating performance | ||||
| |
|
Investment
operations |
Distributions
| ||
| |
Net asset
value,
beginning
of period |
Net
investment
income
(loss)(a) |
Net realized
and unrealized
gains
(losses) on
investments |
Total from
investment
operations |
Net
investment
income |
| JPMorgan International Value Fund (continued) |
|
|
|
|
|
| Class R6 |
|
|
|
|
|
| Year Ended October 31, 2022 |
$13.71 |
$0.50 |
$(2.77)
|
$(2.27)
|
$(0.67) |
| Year Ended October 31, 2021 |
9.62 |
0.49(d) |
3.97 |
4.46 |
(0.37) |
| Year Ended October 31, 2020 |
12.43 |
0.34 |
(2.60) |
(2.26) |
(0.55) |
| Year Ended October 31, 2019 |
12.67 |
0.51 |
(0.21) |
0.30 |
(0.54) |
| Year Ended October 31, 2018 |
14.53 |
0.43 |
(1.91) |
(1.48) |
(0.38) |
| | |
| (a) |
Calculated based upon average shares outstanding. |
| (b) |
Includes adjustments in accordance with accounting principles generally accepted in the United States of America and as such, the net asset values for financial
reporting purposes and the returns based upon those net asset values may differ from the net asset values
and returns for shareholder transactions. |
| (c) |
Includes interest expense, if applicable, which is less than 0.005% unless otherwise noted. |
| (d) |
Reflects income from foreign withholding tax claims, including related interest income, less IRS compliance fees. Without these proceeds, the net investment
income (loss) per share would have been $0.38, $0.28, $0.42, $0.41, $0.34, $0.35 and $0.44 for Class A,
Class C, Class I, Class L, Class R2, Class R5, and Class R6,respectively, and the net
investment income (loss) ratios would have been 3.00%, 2.26%, 3.19%, 3.23%, 2.72%, 2.80% and 3.44% for Class A, Class C, Class I, Class L, Class R2, Class R5, and Class R6, respectively. |
| 94 |
J.P. Morgan International Equity Funds |
October 31, 2022 |
| |
Ratios/Supplemental data | |||||
| |
|
|
Ratios to
average net assets | |||
| Net asset
value,
end of
period |
Total return
(excludes
sales
charge)(b) |
Net assets,
end of
period
(000's) |
Net
expenses(c)
|
Net
investment
income
(loss) |
Expenses without
waivers and reimbursements |
Portfolio turnover
rate |
| | ||||||
| |
|
|
|
|
|
|
| $10.77 |
(17.23)% |
$160,297
|
0.52% |
4.19% |
0.72% |
26% |
| 13.71 |
46.99 |
158,191 |
0.55 |
3.83(d) |
0.73 |
33 |
| 9.62 |
(19.22) |
105,039 |
0.55 |
3.18 |
0.76 |
59 |
| 12.43 |
2.83 |
125,887 |
0.55 |
4.22 |
0.77 |
61 |
| 12.67 |
(10.49) |
124,246 |
0.55 |
3.06 |
0.77 |
90 |
| October 31, 2022 |
J.P. Morgan International Equity Funds |
95 |
AS OF October 31, 2022
(Dollar values in thousands)
| |
Classes Offered |
Trust |
Diversification Classification |
| JPMorgan Emerging Markets Equity Fund |
Class A, Class C, Class I, Class L, Class R2,
Class R3, Class R4, Class R5 and Class R6 |
JPM I |
Diversified |
| JPMorgan Emerging Markets Research Enhanced Equity Fund |
Class I and Class R6 |
JPM IV |
Diversified |
| JPMorgan Europe Dynamic Fund |
Class A, Class C, Class I, Class L and Class R6 |
JPM I |
Diversified |
| JPMorgan International Equity Fund |
Class A, Class C, Class I, Class R2, Class R5
and Class R6 |
JPM I |
Diversified |
| JPMorgan International Focus Fund |
Class A, Class C, Class I, Class R2, Class R5
and Class R6 |
JPM I |
Diversified |
| JPMorgan International Hedged Equity Fund |
Class A, Class C, Class I, Class R5 and Class R6 |
JPM IV |
Diversified |
| JPMorgan International Value Fund |
Class A, Class C, Class I, Class L, Class R2,
Class R5 and Class R6 |
JPM I |
Diversified |
| 96 |
J.P. Morgan International Equity Funds |
October 31, 2022 |
| October 31, 2022 |
J.P. Morgan International Equity Funds |
97 |
AS OF October 31, 2022 (continued)
(Dollar values in thousands)
| Emerging Markets Equity Fund |
|
| ||
| |
Level 1
Quoted prices |
Level 2
Other significant
observable inputs |
Level 3
Significant
unobservable inputs |
Total |
| Investments in Securities |
|
|
|
|
| Common Stocks |
|
|
|
|
| Brazil |
$575,131
|
$—
|
$—
|
$575,131 |
| China |
148,115 |
1,395,034 |
— |
1,543,149 |
| Hong Kong |
— |
411,163 |
— |
411,163 |
| India |
297,551 |
1,483,903 |
— |
1,781,454 |
| Indonesia |
— |
365,041 |
— |
365,041 |
| Macau |
— |
38,127 |
— |
38,127 |
| Mexico |
317,815 |
— |
— |
317,815 |
| Panama |
64,991 |
— |
— |
64,991 |
| Poland |
— |
23,925 |
— |
23,925 |
| Portugal |
— |
96,946 |
— |
96,946 |
| South Africa |
54,571 |
127,215 |
— |
181,786 |
| South Korea |
— |
612,541 |
— |
612,541 |
| Taiwan |
491,198 |
274,785 |
— |
765,983 |
| United States |
233,181 |
32,584 |
— |
265,765 |
| Total Common Stocks |
2,182,553 |
4,861,264 |
— |
7,043,817 |
| Short-Term Investments |
|
|
|
|
| Investment Companies |
113,774 |
— |
— |
113,774 |
| Investment of Cash Collateral from Securities Loaned |
4,793 |
— |
— |
4,793 |
| Total Short-Term Investments |
118,567 |
— |
— |
118,567 |
| Total Investments in Securities |
$2,301,120 |
$4,861,264 |
$— |
$7,162,384 |
| Emerging Markets Research Enhanced Equity
Fund |
|
| ||
| |
Level 1
Quoted prices |
Level 2
Other significant
observable inputs |
Level 3
Significant
unobservable inputs |
Total |
| Investments in Securities |
|
|
|
|
| Common Stocks |
|
|
|
|
| Brazil |
$189,552
|
$—
|
$—
|
$189,552 |
| Chile |
7,834 |
— |
— |
7,834 |
| China |
35,603 |
646,103 |
— |
681,706 |
| Colombia |
3,473 |
— |
— |
3,473 |
| Greece |
— |
12,522 |
— |
12,522 |
| Hong Kong |
— |
5,521 |
— |
5,521 |
| Hungary |
— |
9,771 |
— |
9,771 |
| India |
43,998 |
349,644 |
— |
393,642 |
| Indonesia |
— |
57,083 |
— |
57,083 |
| Malaysia |
— |
31,917 |
— |
31,917 |
| Mexico |
92,461 |
— |
— |
92,461 |
| Peru |
12,487 |
— |
— |
12,487 |
| Philippines |
— |
4,685 |
— |
4,685 |
| Poland |
— |
13,105 |
— |
13,105 |
| Qatar |
— |
24,495 |
— |
24,495 |
| Russia |
— |
— |
1,123 |
1,123 |
| Saudi Arabia |
— |
102,461 |
— |
102,461 |
| 98 |
J.P. Morgan International Equity Funds |
October 31, 2022 |
| Emerging Markets Research Enhanced Equity
Fund (continued) |
|
| ||
| |
Level 1
Quoted prices |
Level 2
Other significant
observable inputs |
Level 3
Significant
unobservable inputs |
Total |
| Singapore |
$— |
$2,477 |
$— |
$2,477 |
| South Africa |
32,282 |
69,123 |
— |
101,405 |
| South Korea |
— |
320,340 |
— |
320,340 |
| Taiwan |
18,300 |
295,108 |
— |
313,408 |
| Thailand |
49,757 |
15,903 |
— |
65,660 |
| United Arab Emirates |
— |
24,234 |
— |
24,234 |
| United States |
5,589 |
2,107 |
— |
7,696 |
| Total Common Stocks |
491,336 |
1,986,599 |
1,123 |
2,479,058 |
| Rights |
|
|
|
|
| Thailand |
— |
— |
— |
— |
| Short-Term Investments |
|
|
|
|
| Investment Companies |
47,040 |
— |
— |
47,040 |
| Investment of Cash Collateral from Securities Loaned |
6,925 |
— |
— |
6,925 |
| Total Short-Term Investments |
53,965 |
— |
— |
53,965 |
| Total Investments in Securities |
$545,301 |
$1,986,599 |
$1,123 |
$2,533,023 |
| Depreciation in Other Financial Instruments |
|
|
|
|
| Futures Contracts |
$(434) |
$— |
$— |
$(434) |
| Europe Dynamic Fund |
|
| ||
| |
Level 1
Quoted prices |
Level 2
Other significant
observable inputs |
Level 3
Significant
unobservable inputs |
Total |
| Investments in Securities |
|
|
|
|
| Common Stocks |
|
|
|
|
| Australia |
$—
|
$12,215
|
$—
|
$12,215 |
| Austria |
— |
3,143 |
— |
3,143 |
| Denmark |
— |
40,976 |
— |
40,976 |
| Finland |
— |
16,722 |
— |
16,722 |
| France |
— |
99,750 |
— |
99,750 |
| Germany |
4,322 |
90,881 |
— |
95,203 |
| Ireland |
6,384 |
10,128 |
— |
16,512 |
| Italy |
— |
9,132 |
— |
9,132 |
| Netherlands |
— |
28,444 |
— |
28,444 |
| Norway |
— |
4,163 |
— |
4,163 |
| Spain |
— |
5,355 |
— |
5,355 |
| Sweden |
— |
13,269 |
— |
13,269 |
| Switzerland |
— |
29,265 |
— |
29,265 |
| United Kingdom |
— |
91,176 |
— |
91,176 |
| United States |
— |
57,896 |
— |
57,896 |
| Total Common Stocks |
10,706 |
512,515 |
— |
523,221 |
| Short-Term Investments |
|
|
|
|
| Investment Companies |
6,343 |
— |
— |
6,343 |
| Total Investments in Securities |
$17,049 |
$512,515 |
$— |
$529,564
|
| October 31, 2022 |
J.P. Morgan International Equity Funds |
99 |
AS OF October 31, 2022 (continued)
(Dollar values in thousands)
| Europe Dynamic Fund (continued) |
|
| ||
| |
Level 1
Quoted prices |
Level 2
Other significant
observable inputs |
Level 3
Significant
unobservable inputs |
Total |
| Appreciation in Other Financial Instruments |
|
|
|
|
| Futures Contracts |
$14 |
$— |
$— |
$14
|
| International Equity Fund |
|
| ||
| |
Level 1
Quoted prices |
Level 2
Other significant
observable inputs |
Level 3
Significant
unobservable inputs |
Total |
| Investments in Securities |
|
|
|
|
| Common Stocks |
|
|
|
|
| Australia |
$—
|
$103,457
|
$—
|
$103,457 |
| Austria |
— |
22,486 |
— |
22,486 |
| Belgium |
— |
43,695 |
— |
43,695 |
| Denmark |
— |
213,343 |
— |
213,343 |
| Finland |
— |
24,782 |
— |
24,782 |
| France |
— |
660,818 |
— |
660,818 |
| Germany |
— |
335,714 |
— |
335,714 |
| Hong Kong |
— |
139,633 |
— |
139,633 |
| India |
46,123 |
— |
— |
46,123 |
| Japan |
— |
648,087 |
— |
648,087 |
| Netherlands |
— |
217,223 |
— |
217,223 |
| Singapore |
— |
92,557 |
— |
92,557 |
| South Africa |
— |
38,357 |
— |
38,357 |
| South Korea |
— |
61,474 |
— |
61,474 |
| Spain |
— |
65,120 |
— |
65,120 |
| Sweden |
— |
148,357 |
— |
148,357 |
| Switzerland |
— |
84,315 |
— |
84,315 |
| Taiwan |
26,302 |
— |
— |
26,302 |
| United Kingdom |
— |
368,811 |
— |
368,811 |
| United States |
— |
403,640 |
— |
403,640 |
| Total Common Stocks |
72,425 |
3,671,869 |
— |
3,744,294 |
| Short-Term Investments |
|
|
|
|
| Investment Companies |
57,920 |
— |
— |
57,920 |
| Investment of Cash Collateral from Securities Loaned |
103,571 |
— |
— |
103,571 |
| Total Short-Term Investments |
161,491 |
— |
— |
161,491 |
| Total Investments in Securities |
$233,916 |
$3,671,869 |
$— |
$3,905,785 |
| International Focus Fund |
|
| ||
| |
Level 1
Quoted prices |
Level 2
Other significant
observable inputs |
Level 3
Significant
unobservable inputs |
Total |
| Investments in Securities |
|
|
|
|
| Common Stocks |
|
|
|
|
| Australia |
$—
|
$39,820
|
$—
|
$39,820 |
| Belgium |
— |
18,763 |
— |
18,763 |
| Canada |
88,266 |
— |
— |
88,266 |
| China |
— |
17,742 |
— |
17,742 |
| Denmark |
— |
47,805 |
— |
47,805 |
| France |
— |
127,408 |
— |
127,408 |
| 100 |
J.P. Morgan International Equity Funds |
October 31, 2022 |
| International Focus Fund (continued) |
|
| ||
| |
Level 1
Quoted prices |
Level 2
Other significant
observable inputs |
Level 3
Significant
unobservable inputs |
Total |
| Germany |
$—
|
$61,402
|
$—
|
$61,402 |
| Hong Kong |
— |
32,467 |
— |
32,467 |
| India |
33,108 |
— |
— |
33,108 |
| Indonesia |
— |
21,532 |
— |
21,532 |
| Japan |
— |
76,901 |
— |
76,901 |
| Mexico |
14,589 |
— |
— |
14,589 |
| Netherlands |
— |
75,965 |
— |
75,965 |
| Singapore |
— |
32,679 |
— |
32,679 |
| South Africa |
— |
14,528 |
— |
14,528 |
| South Korea |
— |
46,656 |
— |
46,656 |
| Spain |
— |
24,229 |
— |
24,229 |
| Sweden |
— |
16,452 |
— |
16,452 |
| Switzerland |
— |
15,617 |
— |
15,617 |
| Taiwan |
29,570 |
— |
— |
29,570 |
| United Kingdom |
— |
109,231 |
— |
109,231 |
| United States |
— |
118,194 |
— |
118,194 |
| Total Common Stocks |
165,533 |
897,391 |
— |
1,062,924 |
| Short-Term Investments |
|
|
|
|
| Investment Companies |
19,897 |
— |
— |
19,897 |
| Investment of Cash Collateral from Securities Loaned |
56,415 |
— |
— |
56,415 |
| Total Short-Term Investments |
76,312 |
— |
— |
76,312 |
| Total Investments in Securities |
$241,845 |
$897,391 |
$— |
$1,139,236 |
| International Hedged Equity Fund
|
|
| ||
| |
Level 1
Quoted prices |
Level 2
Other significant
observable inputs |
Level 3
Significant
unobservable inputs |
Total |
| Investments in Securities |
|
|
|
|
| Common Stocks |
|
|
|
|
| Australia |
$—
|
$9,628
|
$—
|
$9,628 |
| Belgium |
— |
732 |
— |
732 |
| China |
— |
1,015 |
— |
1,015 |
| Denmark |
— |
5,265 |
— |
5,265 |
| Finland |
— |
1,462 |
— |
1,462 |
| France |
— |
17,772 |
— |
17,772 |
| Germany |
— |
13,443 |
— |
13,443 |
| Hong Kong |
— |
3,504 |
— |
3,504 |
| Ireland |
— |
532 |
— |
532 |
| Italy |
— |
1,138 |
— |
1,138 |
| Japan |
— |
34,990 |
— |
34,990 |
| Luxembourg |
— |
184 |
— |
184 |
| Netherlands |
— |
10,467 |
— |
10,467 |
| Singapore |
79 |
1,649 |
— |
1,728 |
| South Korea |
— |
128 |
— |
128 |
| Spain |
— |
3,930 |
— |
3,930 |
| Sweden |
— |
3,087 |
— |
3,087 |
| Switzerland |
— |
8,539 |
— |
8,539 |
| United Kingdom |
— |
21,092 |
— |
21,092 |
| October 31, 2022 |
J.P. Morgan International Equity Funds |
101 |
AS OF October 31, 2022 (continued)
(Dollar values in thousands)
| International Hedged Equity Fund (continued) |
|
| ||
| |
Level 1
Quoted prices |
Level 2
Other significant
observable inputs |
Level 3
Significant
unobservable inputs |
Total |
| United States |
$— |
$12,991 |
$— |
$12,991 |
| Total Common Stocks |
79 |
151,548 |
— |
151,627 |
| Options Purchased |
1,806 |
— |
— |
1,806 |
| Short-Term Investments |
|
|
|
|
| Investment Companies |
6,096 |
— |
— |
6,096 |
| Total Investments in Securities |
$7,981 |
$151,548 |
$— |
$159,529
|
| Appreciation in Other Financial Instruments |
|
|
|
|
| Futures Contracts |
$207
|
$—
|
$—
|
$207 |
| Depreciation in Other Financial Instruments |
|
|
|
|
| Futures Contracts |
(77) |
— |
— |
(77) |
| Options Written |
|
|
|
|
| Call Options Written |
(4,998) |
— |
— |
(4,998) |
| Put Options Written |
(342)
|
— |
— |
(342) |
| Total Net Appreciation/ Depreciation in Other Financial Instruments |
$(5,210) |
$— |
$— |
$(5,210) |
| International Value Fund |
|
| ||
| |
Level 1
Quoted prices |
Level 2
Other significant
observable inputs |
Level 3
Significant
unobservable inputs |
Total |
| Investments in Securities |
|
|
|
|
| Common Stocks |
|
|
|
|
| Australia |
$—
|
$29,869
|
$—
|
$29,869 |
| Austria |
— |
3,776 |
— |
3,776 |
| Belgium |
— |
776 |
— |
776 |
| China |
— |
2,495 |
— |
2,495 |
| Denmark |
— |
5,869 |
— |
5,869 |
| Egypt |
1,213 |
— |
— |
1,213 |
| Finland |
— |
5,398 |
— |
5,398 |
| France |
— |
36,500 |
— |
36,500 |
| Germany |
— |
31,096 |
— |
31,096 |
| Hong Kong |
— |
2,631 |
— |
2,631 |
| Ireland |
— |
859 |
— |
859 |
| Italy |
— |
11,555 |
— |
11,555 |
| Japan |
— |
76,312 |
— |
76,312 |
| Luxembourg |
— |
1,724 |
— |
1,724 |
| Netherlands |
— |
21,470 |
— |
21,470 |
| Norway |
583 |
10,197 |
— |
10,780 |
| Singapore |
— |
4,944 |
— |
4,944 |
| South Africa |
— |
2,281 |
— |
2,281 |
| Spain |
— |
8,585 |
— |
8,585 |
| Sweden |
— |
7,864 |
— |
7,864 |
| Switzerland |
— |
20,666 |
— |
20,666 |
| United Kingdom |
1,918 |
43,559 |
— |
45,477 |
| United States |
— |
8,917 |
— |
8,917 |
| Total Common Stocks |
3,714 |
337,343 |
— |
341,057 |
| 102 |
J.P. Morgan International Equity Funds |
October 31, 2022 |
| International Value Fund (continued) |
|
| ||
| |
Level 1
Quoted prices |
Level 2
Other significant
observable inputs |
Level 3
Significant
unobservable inputs |
Total |
| Short-Term Investments |
|
|
|
|
| Investment Companies |
$15,394 |
$— |
$— |
$15,394 |
| Investment of Cash Collateral from Securities Loaned |
3,995 |
— |
— |
3,995 |
| Total Short-Term Investments |
19,389 |
— |
— |
19,389 |
| Total Investments in Securities |
$23,103 |
$337,343 |
$— |
$360,446
|
| |
Investment Securities
on Loan, at value,
Presented on the
Statements of Assets
and Liabilities |
Cash Collateral
Posted by Borrower* |
Net Amount Due
to Counterparty (not less than zero) |
| Emerging Markets Equity Fund |
$4,595 |
$(4,595) |
$— |
| Emerging Markets Research Enhanced Equity Fund |
6,699 |
(6,699) |
— |
| International Equity Fund |
97,049 |
(97,049) |
— |
| International Focus Fund |
26,619 |
(26,619) |
— |
| October 31, 2022 |
J.P. Morgan International Equity Funds |
103 |
AS OF October 31, 2022 (continued)
(Dollar values in thousands)
| |
Investment Securities
on Loan, at value,
Presented on the
Statements of Assets
and Liabilities |
Cash Collateral
Posted by Borrower* |
Net Amount Due to
Counterparty (not less than zero) |
| International Value Fund |
$3,806 |
$(3,806) |
$— |
| | |
| * |
Collateral posted reflects the value of securities on loan and does not include any additional amounts received from the borrower. |
| Emerging Markets Equity Fund |
$9 |
| Emerging Markets Research Enhanced Equity Fund |
3 |
| Europe Dynamic Fund |
5 |
| International Equity Fund |
18 |
| International Focus Fund |
6 |
| International Value Fund |
2 |
| Emerging Markets Equity
Fund | |||||||||
| For the year ended October 31, 2022 | |||||||||
| Security Description |
Value at
October 31,
2021 |
Purchases at
Cost |
Proceeds from
Sales |
Net Realized
Gain (Loss) |
Change in
Unrealized
Appreciation/
(Depreciation) |
Value at
October 31,
2022 |
Shares at
October 31,
2022 |
Dividend
Income |
Capital Gain Distributions |
| JPMorgan Prime Money Market Fund Class Institutional Shares, 3.12% (a) (b) |
$24,800
|
$2,286,615 |
$2,197,668 |
$27
|
$—(c) |
$113,774 |
113,762 |
$462 |
$—(c)
|
| JPMorgan Securities Lending Money Market Fund Agency SL Class Shares, 3.23% (a) (b) |
222,040 |
193,500 |
411,499 |
(21)* |
2 |
4,022 |
4,022 |
147* |
— |
| JPMorgan U.S. Government Money Market Fund Class IM Shares, 2.85% (a) (b) |
25,886 |
424,397 |
449,512 |
— |
— |
771 |
771 |
56*
|
— |
| Total |
$272,726 |
$2,904,512 |
$3,058,679 |
$6 |
$2 |
$118,567 |
|
$665 |
$—(c)
|
| | |
| (a) |
Investment in an affiliated fund, which is registered under the Investment Company Act of 1940, as amended, and is advised by J.P. Morgan
Investment Management Inc. |
| (b) |
The rate shown is the current yield as of October 31, 2022. |
| (c) |
Amount rounds to less than one thousand. |
| * |
Amount is included on the Statements of Operations as Income from securities lending (net) (after payments of rebates and Citibank’s fee). |
| 104 |
J.P. Morgan International Equity Funds |
October 31, 2022 |
| Emerging Markets Research Enhanced Equity Fund | |||||||||
| For the year ended October 31, 2022 | |||||||||
| Security Description |
Value at
October 31,
2021 |
Purchases at
Cost |
Proceeds from
Sales |
Net Realized
Gain (Loss) |
Change in
Unrealized
Appreciation/
(Depreciation) |
Value at
October 31,
2022 |
Shares at
October 31,
2022 |
Dividend
Income |
Capital Gain Distributions |
| JPMorgan Prime Money Market Fund Class Institutional Shares, 3.12% (a) (b) |
$3,718
|
$1,275,230 |
$1,231,912 |
$6
|
$(2)
|
$47,040 |
47,035 |
$320 |
$— |
| JPMorgan Securities Lending Money Market Fund Agency SL Class Shares, 3.23% (a) (b) |
22,493 |
54,000 |
73,000 |
(6)* |
—(c) |
3,487 |
3,487 |
23* |
— |
| JPMorgan U.S. Government Money Market Fund Class IM Shares, 2.85% (a) (b) |
2,859 |
148,705 |
148,126 |
— |
— |
3,438 |
3,438 |
33*
|
— |
| Total |
$29,070 |
$1,477,935 |
$1,453,038 |
$— |
$(2) |
$53,965 |
|
$376 |
$— |
| | |
| (a) |
Investment in an affiliated fund, which is registered under the Investment Company Act of 1940, as amended, and is advised by J.P. Morgan
Investment Management Inc. |
| (b) |
The rate shown is the current yield as of October 31, 2022. |
| (c) |
Amount rounds to less than one thousand. |
| * |
Amount is included on the Statements of Operations as Income from securities lending (net) (after payments of rebates and Citibank’s fee). |
| Europe Dynamic
Fund | |||||||||
| For the year ended October 31, 2022 | |||||||||
| Security Description |
Value at
October 31,
2021 |
Purchases at
Cost |
Proceeds from
Sales |
Net Realized
Gain (Loss) |
Change in
Unrealized
Appreciation/
(Depreciation) |
Value at
October 31,
2022 |
Shares at
October 31,
2022 |
Dividend
Income |
Capital Gain Distributions |
| JPMorgan Prime Money Market Fund Class Institutional Shares, 3.12% (a) (b) |
$46,060 |
$377,334 |
$417,053 |
$2
|
$—
|
$6,343 |
6,342 |
$129 |
$— |
| JPMorgan Securities Lending Money Market Fund Agency SL Class Shares, 3.23% (a) (b) |
— |
118,000 |
118,021 |
21* |
— |
— |
— |
192* |
— |
| JPMorgan U.S. Government Money Market Fund Class IM Shares, 2.85% (a) (b) |
7,173 |
218,772 |
225,945 |
— |
— |
— |
— |
51*
|
— |
| Total |
$53,233 |
$714,106 |
$761,019 |
$23 |
$— |
$6,343 |
|
$372 |
$— |
| | |
| (a) |
Investment in an affiliated fund, which is registered under the Investment Company Act of 1940, as amended, and is advised by J.P. Morgan
Investment Management Inc. |
| (b) |
The rate shown is the current yield as of October 31, 2022. |
| * |
Amount is included on the Statements of Operations as Income from securities lending (net) (after payments of rebates and Citibank’s fee). |
| International Equity
Fund | |||||||||
| For the year ended October 31, 2022 | |||||||||
| Security Description |
Value at
October 31,
2021 |
Purchases at
Cost |
Proceeds from
Sales |
Net Realized
Gain (Loss) |
Change in
Unrealized
Appreciation/
(Depreciation) |
Value at
October 31,
2022 |
Shares at
October 31,
2022 |
Dividend
Income |
Capital Gain Distributions |
| JPMorgan Prime Money Market Fund Class Institutional Shares, 3.12% (a) (b) |
$123,785 |
$1,489,471 |
$1,555,283 |
$(54)
|
$1
|
$57,920
|
57,914 |
$883
|
$— |
| JPMorgan Securities Lending Money Market Fund Agency SL Class Shares, 3.23% (a) (b) |
111,000 |
1,001,000 |
1,018,975 |
45* |
4 |
93,074 |
93,075 |
788* |
— |
| JPMorgan U.S. Government Money Market Fund Class IM Shares, 2.85% (a) (b) |
13,466 |
1,265,827 |
1,268,796 |
— |
— |
10,497 |
10,497 |
255*
|
— |
| Total |
$248,251 |
$3,756,298 |
$3,843,054 |
$(9) |
$5 |
$161,491 |
|
$1,926 |
$— |
| | |
| (a) |
Investment in an affiliated fund, which is registered under the Investment Company Act of 1940, as amended, and is advised by J.P. Morgan
Investment Management Inc. |
| October 31, 2022 |
J.P. Morgan International Equity Funds |
105 |
AS OF October 31, 2022 (continued)
(Dollar values in thousands)
| (b) |
The rate shown is the current yield as of October 31, 2022. |
| * |
Amount is included on the Statements of Operations as Income from securities lending (net) (after payments of rebates and Citibank’s fee). |
| International Focus
Fund | |||||||||
| For the year ended October 31, 2022 | |||||||||
| Security Description |
Value at
October 31,
2021 |
Purchases at
Cost |
Proceeds from
Sales |
Net Realized
Gain (Loss) |
Change in
Unrealized
Appreciation/
(Depreciation) |
Value at
October 31,
2022 |
Shares at
October 31,
2022 |
Dividend
Income |
Capital Gain Distributions |
| JPMorgan Prime Money Market Fund Class Institutional Shares, 3.12% (a) (b) |
$47,837 |
$750,870
|
$778,806
|
$(3) |
$(1)
|
$19,897 |
19,894 |
$227 |
$— |
| JPMorgan Securities Lending Money Market Fund Agency SL Class Shares, 3.23% (a) (b) |
33,000 |
335,000 |
327,985 |
(7)* |
3 |
40,011 |
40,011 |
215* |
— |
| JPMorgan U.S. Government Money Market Fund Class IM Shares, 2.85% (a) (b) |
3,469 |
322,935 |
310,000 |
— |
— |
16,404 |
16,404 |
90*
|
— |
| Total |
$84,306 |
$1,408,805 |
$1,416,791 |
$(10) |
$2 |
$76,312 |
|
$532 |
$— |
| | |
| (a) |
Investment in an affiliated fund, which is registered under the Investment Company Act of 1940, as amended, and is advised by J.P. Morgan
Investment Management Inc. |
| (b) |
The rate shown is the current yield as of October 31, 2022. |
| * |
Amount is included on the Statements of Operations as Income from securities lending (net) (after payments of rebates and Citibank’s fee). |
| International Hedged Equity
Fund | |||||||||
| For the year ended October 31, 2022 | |||||||||
| Security Description |
Value at
October 31,
2021 |
Purchases at
Cost |
Proceeds from
Sales |
Net Realized
Gain (Loss) |
Change in
Unrealized
Appreciation/
(Depreciation) |
Value at
October 31,
2022 |
Shares at
October 31,
2022 |
Dividend
Income |
Capital Gain Distributions |
| JPMorgan U.S. Government Money Market Fund Class Institutional Shares, 2.79% (a) (b) |
$3,536 |
$80,682 |
$78,122 |
$— |
$— |
$6,096 |
6,096 |
$35 |
$—
|
| | |
| (a) |
Investment in an affiliated fund, which is registered under the Investment Company Act of 1940, as amended, and is advised by J.P. Morgan
Investment Management Inc. |
| (b) |
The rate shown is the current yield as of October 31, 2022. |
| International Value
Fund | |||||||||
| For the year ended October 31, 2022 | |||||||||
| Security Description |
Value at
October 31,
2021 |
Purchases at
Cost |
Proceeds from
Sales |
Net Realized
Gain (Loss) |
Change in
Unrealized
Appreciation/
(Depreciation) |
Value at
October 31,
2022 |
Shares at
October 31,
2022 |
Dividend
Income |
Capital Gain Distributions |
| JPMorgan Prime Money Market Fund Class Institutional Shares, 3.12% (a) (b) |
$2,400 |
$75,384
|
$62,388
|
$(2)
|
$—(c) |
$15,394 |
15,392 |
$155 |
$— |
| JPMorgan Securities Lending Money Market Fund Agency SL Class Shares, 3.23% (a) (b) |
3,199 |
56,500 |
59,000 |
6* |
— |
705 |
705 |
71* |
— |
| JPMorgan U.S. Government Money Market Fund Class IM Shares, 2.85% (a) (b) |
945 |
100,448 |
98,103 |
— |
— |
3,290 |
3,290 |
26*
|
— |
| Total |
$6,544 |
$232,332 |
$219,491 |
$4 |
$—(c) |
$19,389 |
|
$252 |
$— |
| | |
| (a) |
Investment in an affiliated fund, which is registered under the Investment Company Act of 1940, as amended, and is advised by J.P. Morgan
Investment Management Inc. |
| (b) |
The rate shown is the current yield as of October 31, 2022. |
| (c) |
Amount rounds to less than one thousand. |
| * |
Amount is included on the Statements of Operations as Income from securities lending (net) (after payments of rebates and Citibank’s fee). |
| 106 |
J.P. Morgan International Equity Funds |
October 31, 2022 |
| October 31, 2022 |
J.P. Morgan International Equity Funds |
107 |
AS OF October 31, 2022 (continued)
(Dollar values in thousands)
| |
Emerging
Markets
Research
Enhanced
Equity Fund |
Europe
Dynamic
Fund |
International
Focus Fund |
International
Hedged
Equity Fund |
International
Value Fund |
| Futures Contracts: |
|
|
|
|
|
| Average Notional Balance Long |
$45,395 |
$15,748 |
$7,890 |
$6,396 |
$2,091 |
| Ending Notional Balance Long |
12,555 |
3,180 |
— |
7,531 |
— |
| Exchange-Traded Options: |
|
|
|
|
|
| Average Number of Contracts Purchased |
— |
— |
— |
813 |
— |
| Average Number of Contracts Written |
— |
— |
— |
(1,626) |
— |
| Ending Number of Contracts Purchased |
— |
— |
— |
912 |
— |
| Ending Number of Contracts Written |
— |
— |
— |
(1,824) |
— |
| |
Class A |
Class C |
Class I |
Class L |
Class R2 |
Class R3 |
Class R4 |
Class R5 |
Class R6 |
Total |
| Emerging Markets Equity Fund |
|
|
|
|
|
|
|
|
|
|
| Transfer agency fees |
$33 |
$4 |
$75 |
$21 |
$1 |
$1 |
$1 |
$1 |
$114 |
$251 |
| Emerging Markets Research Enhanced Equity Fund |
|
|
|
|
|
|
|
|
|
|
| Transfer agency fees |
n/a |
n/a |
17 |
n/a |
n/a |
n/a |
n/a |
n/a |
20 |
37 |
| Europe Dynamic Fund |
|
|
|
|
|
|
|
|
|
|
| Transfer agency fees |
13 |
2 |
22 |
1 |
n/a |
n/a |
n/a |
n/a |
3 |
41 |
| International Equity Fund |
|
|
|
|
|
|
|
|
|
|
| Transfer agency fees |
23 |
3 |
27 |
n/a |
21 |
n/a |
n/a |
—(a) |
39 |
113 |
| 108 |
J.P. Morgan International Equity Funds |
October 31, 2022 |
| |
Class A |
Class C |
Class I |
Class L |
Class R2 |
Class R3 |
Class R4 |
Class R5 |
Class R6 |
Total |
| International Focus Fund |
|
|
|
|
|
|
|
|
|
|
| Transfer agency fees |
$9 |
$3 |
$32 |
n/a |
$1 |
n/a |
n/a |
$2 |
$17 |
$64 |
| International Hedged Equity Fund |
|
|
|
|
|
|
|
|
|
|
| Transfer agency fees |
—(a) |
—(a) |
1 |
n/a |
n/a |
n/a |
n/a |
—(a) |
—(a) |
1 |
| International Value Fund |
|
|
|
|
|
|
|
|
|
|
| Transfer agency fees |
13 |
1 |
2 |
$—(a) |
1 |
n/a |
n/a |
—(a) |
2 |
19 |
| | |
| (a) |
Amount rounds to less than one thousand. |
| |
Paid-in-Capital |
Accumulated
undistributed
(distributions in
excess of)
net investment
income |
Accumulated
net realized gains (losses) |
| Emerging Markets Equity Fund |
$—
|
$1,394
|
$(1,394) |
| Emerging Markets Research Enhanced Equity Fund |
6,032 |
1,705 |
(7,737) |
| Europe Dynamic Fund |
— |
3,759 |
(3,759) |
| International Equity Fund |
— |
12,347 |
(12,347) |
| International Focus Fund |
267,587 |
14,908 |
(282,495) |
| International Hedged Equity Fund |
— |
14 |
(14) |
| International Value Fund |
— |
2,337 |
(2,337) |
| |
|
| Emerging Markets Equity Fund |
0.68% |
| Emerging Markets Research Enhanced Equity Fund |
0.25 |
| October 31, 2022 |
J.P. Morgan International Equity Funds |
109 |
AS OF October 31, 2022 (continued)
(Dollar values in thousands)
| |
|
| Europe Dynamic Fund |
0.60% |
| International Equity Fund |
0.50 |
| International Focus Fund |
0.60 |
| International Hedged Equity Fund |
0.25 |
| International Value Fund |
0.55 |
| |
Class A |
Class C |
Class R2 |
Class R3 |
| Emerging Markets Equity Fund |
0.25% |
0.75% |
0.50% |
0.25% |
| Europe Dynamic Fund |
0.25 |
0.75 |
n/a |
n/a |
| International Equity Fund |
0.25 |
0.75 |
0.50 |
n/a |
| International Focus Fund |
0.25 |
0.75 |
0.50 |
n/a |
| International Hedged Equity Fund |
0.25 |
0.75 |
n/a |
n/a |
| International Value Fund |
0.25 |
0.75 |
0.50 |
n/a |
| |
Front-End Sales Charge |
CDSC |
| Emerging Markets Equity Fund |
$10 |
$—(a)
|
| Europe Dynamic Fund |
1 |
— |
| International Equity Fund |
36 |
1 |
| International Focus Fund |
62 |
1 |
| International Hedged Equity Fund |
2 |
— |
| International Value Fund |
31 |
— |
| | |
| (a) |
Amount rounds to less than one thousand. |
| 110 |
J.P. Morgan International Equity Funds |
October 31, 2022 |
| |
Class A |
Class C |
Class I |
Class L |
Class R2 |
Class R3 |
Class R4 |
Class R5 |
| Emerging Markets Equity Fund |
0.25% |
0.25% |
0.25% |
0.10% |
0.25% |
0.25% |
0.25% |
0.10% |
| Emerging Markets Research Enhanced Equity Fund |
n/a |
n/a |
0.25 |
n/a |
n/a |
n/a |
n/a |
n/a |
| Europe Dynamic Fund |
0.25 |
0.25 |
0.25 |
0.10 |
n/a |
n/a |
n/a |
n/a |
| International Equity Fund |
0.25 |
0.25 |
0.25 |
n/a |
0.25 |
n/a |
n/a |
0.10 |
| International Focus Fund |
0.25 |
0.25 |
0.25 |
n/a |
0.25 |
n/a |
n/a |
0.10 |
| International Hedged Equity Fund |
0.25 |
0.25 |
0.25 |
n/a |
n/a |
n/a |
n/a |
0.10 |
| International Value Fund |
0.25 |
0.25 |
0.25 |
0.10 |
0.25 |
n/a |
n/a |
0.10 |
| |
Class A |
Class C |
Class I |
Class L |
Class R2 |
Class R3 |
Class R4 |
Class R5 |
Class R6 |
| Emerging Markets Equity Fund |
1.24% |
1.74% |
0.99% |
n/a |
1.54% |
1.29% |
1.04% |
0.89% |
0.79% |
| Emerging Markets Research Enhanced Equity Fund |
n/a |
n/a |
0.45 |
n/a |
n/a |
n/a |
n/a |
n/a |
0.35 |
| Europe Dynamic Fund |
1.24 |
1.74 |
0.99 |
n/a |
n/a |
n/a |
n/a |
n/a |
n/a |
| International Equity Fund |
0.95 |
1.45 |
0.70 |
n/a |
1.25 |
n/a |
n/a |
0.60 |
0.50 |
| International Focus Fund |
1.00 |
1.50 |
0.75 |
n/a |
1.30 |
n/a |
n/a |
0.65 |
0.55 |
| International Hedged Equity Fund |
0.85 |
1.35 |
0.60 |
n/a |
n/a |
n/a |
n/a |
0.45 |
0.35 |
| International Value Fund |
1.00 |
1.50 |
0.75 |
n/a |
1.30 |
n/a |
n/a |
0.65 |
0.55 |
| October 31, 2022 |
J.P. Morgan International Equity Funds |
111 |
AS OF October 31, 2022 (continued)
(Dollar values in thousands)
| |
Contractual
Waivers |
| |||
| |
Investment
Advisory Fees |
Administration
Fees |
Service
Fees |
Total |
Contractual
Reimbursements |
| Emerging Markets Equity Fund |
$1,220 |
$817
|
$1,974 |
$4,011 |
$114 |
| Emerging Markets Research Enhanced Equity Fund |
1,039 |
692 |
264 |
1,995 |
— |
| Europe Dynamic Fund |
— |
— |
47 |
47 |
— |
| International Equity Fund |
2,724 |
1,813 |
554 |
5,091 |
— |
| International Focus Fund |
2,402 |
1,505 |
505 |
4,412 |
—(a) |
| International Hedged Equity Fund |
227 |
122 |
—(a) |
349 |
—(a) |
| International Value Fund |
459 |
267 |
124 |
850 |
2 |
| | |
| (a) |
Amount rounds to less than one thousand. |
| |
|
| Emerging Markets Equity Fund |
$137 |
| Emerging Markets Research Enhanced Equity Fund |
73 |
| Europe Dynamic Fund |
34 |
| International Equity Fund |
163 |
| International Focus Fund |
62 |
| International Hedged Equity Fund |
7 |
| International Value Fund |
17 |
| |
|
| Emerging Markets Equity Fund |
$2 |
| Emerging Markets Research Enhanced Equity Fund |
2 |
| Europe Dynamic Fund |
1 |
| International Equity Fund |
2 |
| International Focus Fund |
2 |
| International Hedged Equity Fund |
1 |
| International Value Fund |
1 |
| 112 |
J.P. Morgan International Equity Funds |
October 31, 2022 |
| |
Purchases
(excluding
U.S. Government) |
Sales
(excluding U.S. Government) |
| Emerging Markets Equity Fund |
$1,820,297
|
$3,447,431 |
| Emerging Markets Research Enhanced Equity Fund |
1,122,070 |
1,061,069 |
| Europe Dynamic Fund |
554,449 |
822,653 |
| International Equity Fund |
1,857,747 |
1,329,780 |
| International Focus Fund |
671,371 |
1,569,645 |
| International Hedged Equity Fund |
75,285 |
26,134 |
| International Value Fund |
129,748 |
94,535 |
| |
Aggregate
Cost |
Gross
Unrealized
Appreciation |
Gross
Unrealized
Depreciation |
Net Unrealized
Appreciation (Depreciation) |
| Emerging Markets Equity Fund |
$7,551,845
|
$1,332,227
|
$1,721,688
|
$(389,461) |
| Emerging Markets Research Enhanced Equity Fund |
3,131,143 |
169,635 |
768,189 |
(598,554) |
| Europe Dynamic Fund |
541,865 |
32,206 |
44,493 |
(12,287) |
| International Equity Fund |
3,896,606 |
421,048 |
411,869 |
9,179 |
| International Focus Fund |
1,141,965 |
117,960 |
120,689 |
(2,729) |
| International Hedged Equity Fund |
168,470 |
9,710 |
23,861 |
(14,151) |
| International Value Fund |
385,707 |
19,338 |
44,599 |
(25,261) |
| |
Ordinary
Income* |
Net
Long-Term
Capital Gains |
Total
Distributions Paid |
| Emerging Markets Equity Fund |
$72,043
|
$414,863 |
$486,906 |
| Emerging Markets Research Enhanced Equity Fund |
104,428 |
95,039 |
199,467 |
| Europe Dynamic Fund |
25,084 |
— |
25,084 |
| International Equity Fund |
104,877 |
220,976 |
325,853 |
| International Focus Fund |
71,155 |
— |
71,155 |
| International Hedged Equity Fund |
4,137 |
— |
4,137 |
| International Value Fund |
18,616 |
— |
18,616 |
| | |
| * |
Short-term gain distributions are treated as ordinary income for income tax purposes. |
| October 31, 2022 |
J.P. Morgan International Equity Funds |
113 |
AS OF October 31, 2022 (continued)
(Dollar values in thousands)
| |
Ordinary
Income* |
Total
Distributions Paid |
| Emerging Markets Equity Fund |
$19,143
|
$19,143 |
| Emerging Markets Research Enhanced Equity Fund |
50,837 |
50,837 |
| Europe Dynamic Fund |
7,016 |
7,016 |
| International Equity Fund |
41,991 |
41,991 |
| International Focus Fund |
34,026 |
34,026 |
| International Hedged Equity Fund |
2,207 |
2,207 |
| International Value Fund |
9,259 |
9,259 |
| | |
| * |
Short-term gain distributions are treated as ordinary income for income tax purposes. |
| |
Current
Distributable
Ordinary
Income |
Current
Distributable
Long-Term
Capital Gain
(Tax Basis Capital
Loss Carryover) |
Unrealized
Appreciation (Depreciation) |
| Emerging Markets Equity Fund |
$34,114
|
$(328,713)
|
$(410,724) |
| Emerging Markets Research Enhanced Equity Fund |
53,880 |
(194,816) |
(605,024) |
| Europe Dynamic Fund |
5,961 |
(153,878) |
(12,671) |
| International Equity Fund |
104,346 |
(212,015) |
8,313 |
| International Focus Fund |
42,783 |
(190,446) |
(3,132) |
| International Hedged Equity Fund |
3,097 |
(4,530) |
(14,177) |
| International Value Fund |
13,099 |
(91,310) |
(25,432) |
| |
Capital Loss
Carryforward Character | |
| |
Short-Term |
Long-Term |
| Emerging Markets Equity Fund |
$328,713
|
$— |
| Emerging Markets Research Enhanced Equity Fund |
128,445 |
66,371 |
| Europe Dynamic Fund |
153,878 |
— |
| International Equity Fund |
72,180 |
139,835 |
| International Focus Fund |
190,446 |
— |
| International Hedged Equity Fund |
435* |
4,095* |
| International Value Fund |
54,421 |
36,889 |
| | |
| * |
Amount includes capital loss carryforwards which are limited in future years under Internal Revenue Code sections 381-384. |
| |
Capital Loss
Utilized | |
| |
Short-Term |
Long-Term |
| International Hedged Equity Fund |
$4,146 |
$9,123 |
| 114 |
J.P. Morgan International Equity Funds |
October 31, 2022 |
| |
Average
Borrowings |
Average
Interest
Rate paid |
Number of
Days
Outstanding |
Interest
Paid |
| Emerging Markets Equity Fund |
$27,442
|
1.99% |
47 |
$54 |
| Emerging Markets Research Enhanced Equity Fund |
13,848 |
1.62 |
6 |
7 |
| Europe Dynamic Fund |
39,339 |
1.31 |
9 |
8 |
| International Equity Fund |
52,801 |
1.55 |
4 |
6 |
| International Focus Fund |
16,226 |
2.40 |
11 |
8 |
| International Value Fund |
1,651 |
0.82 |
2 |
—(a) |
| | |
| (a) |
Amount rounds to less than one thousand. |
| October 31, 2022 |
J.P. Morgan International Equity Funds |
115 |
AS OF October 31, 2022 (continued)
(Dollar values in thousands)
| |
Number of
Individual Shareholder
and/or Affiliated
Omnibus Accounts |
% of the Fund |
Number of
Individual Shareholder
and/or Non-Affiliated
Omnibus Accounts |
% of the Fund |
| Emerging Markets Equity Fund |
— |
—% |
3 |
43.7% |
| Emerging Markets Research Enhanced Equity Fund |
— |
— |
1 |
11.9 |
| Europe Dynamic Fund |
3 |
46.3 |
1 |
10.2 |
| International Focus Fund |
— |
— |
1 |
27.8 |
| International Hedged Equity Fund |
1 |
11.4 |
4 |
62.5 |
| International Value Fund |
— |
— |
1 |
82.6 |
| |
J.P. Morgan
Investor
Funds |
JPMorgan
SmartRetirement
Funds |
JPMorgan
SmartRetirement Blend Funds |
| Emerging Markets Research Enhanced Equity Fund |
—% |
29.3% |
39.1% |
| Europe Dynamic Fund |
51.6 |
— |
— |
| International Equity Fund |
— |
49.5 |
— |
| International Focus Fund |
13.8 |
— |
— |
| |
Emerging
Markets
Equity Fund |
Emerging
Markets
Research
Enhanced
Equity Fund |
Europe
Dynamic
Fund |
International
Equity Fund |
International
Focus Fund |
International
Hedged
Equity Fund |
International
Value Fund |
| China |
21.6% |
27.0% |
—% |
—% |
—% |
—% |
—% |
| France |
— |
— |
18.8 |
17.4 |
11.8 |
11.1 |
10.2 |
| Germany |
— |
— |
18.0 |
— |
— |
— |
— |
| India |
24.9 |
15.6 |
— |
— |
— |
— |
— |
| Japan |
— |
— |
— |
17.0 |
— |
21.9 |
21.4 |
| South Korea |
— |
12.7 |
— |
— |
— |
— |
— |
| Taiwan |
10.7 |
12.4 |
— |
— |
— |
— |
— |
| United Kingdom |
— |
— |
17.2 |
— |
10.1 |
13.2 |
12.8 |
| 116 |
J.P. Morgan International Equity Funds |
October 31, 2022 |
| Fund |
Value |
Gain/(Loss) |
Type |
| International Focus Fund |
$1,236,430(a)
|
$280,048 |
Redemption in-kind |
| | |
| (a) |
This amount includes cash of $99,867 associated with the redemption in-kind. |
| October 31, 2022 |
J.P. Morgan International Equity Funds |
117 |
| 118 |
J.P. Morgan International Equity Funds |
October 31, 2022 |
(Unaudited)
| Name (Year of Birth); Positions With the Funds (1) |
Principal Occupation
During Past 5 Years |
Number of
Funds in Fund
Complex Overseen
by Trustee (2) |
Other Directorships Held During the Past 5 Years |
| Independent Trustees |
|
|
|
| John F. Finn (1947); Chair since 2020; Trustee since 1998. |
Chairman, Gardner, Inc. (supply chain management company serving industrial and consumer markets) (serving in various roles 1974-present). |
166 |
Director, Greif, Inc. (GEF) (industrial package products and services) (2007-present); Trustee, Columbus Association for the Performing Arts (1988-present). |
| Stephen P. Fisher (1959); Trustee since 2018. |
Retired; Chairman and Chief Executive Officer, NYLIFE Distributors LLC (registered broker-dealer) (serving in various roles 2008-2013); Chairman, NYLIM Service Company LLC (transfer agent) (2008-2017); New York Life Investment Management LLC (registered investment adviser) (serving in various roles 2005-2017); Chairman, IndexIQ Advisors LLC (registered investment adviser for ETFs) (2014-2017); President, MainStay VP Funds Trust (2007-2017), MainStay DefinedTerm Municipal Opportunities Fund (2011-2017) and MainStay Funds Trust (2007-2017) (registered investment companies). |
166 |
Honors Program Advisory Board Member, The Zicklin School of Business, Baruch College, The City University of New York (2017-present). |
| Gary L. French (1951); Trustee since 2014. |
Real Estate Investor (2011-2020); Investment management industry Consultant and Expert Witness (2011-present); Senior Consultant for The Regulatory Fundamentals Group LLC (2011-2017). |
166 |
Independent Trustee, The China Fund, Inc. (2013-2019); Exchange Traded Concepts Trust II (2012-2014); Exchange Traded Concepts Trust I (2011-2014). |
| Kathleen M. Gallagher (1958); Trustee since 2018. |
Retired; Chief Investment Officer — Benefit Plans, Ford Motor Company (serving in various roles 1985-2016). |
166 |
Non- Executive Director, Legal & General Investment Management (Holdings) (2018-present); Non-Executive Director, Legal & General Investment Management America (U.S. Holdings) (financial services and insurance) (2017-present); Advisory Board Member, State Street Global Advisors Total Portfolio Solutions (2017-present); Member, Client Advisory Council, Financial Engines, LLC (registered investment adviser) (2011-2016); Director, Ford Pension Funds Investment Management Ltd. (2007-2016). |
| Robert J. Grassi (1957); Trustee since 2014. |
Sole Proprietor, Academy Hills Advisors LLC (2012-present); Pension Director, Corning Incorporated (2002-2012). |
166 |
None |
| October 31, 2022 |
J.P. Morgan International Equity Funds |
119 |
(Unaudited) (continued)
| Name (Year of Birth); Positions With the Funds (1) |
Principal Occupation
During Past 5 Years |
Number of
Funds in Fund
Complex Overseen
by Trustee (2) |
Other Directorships Held During the Past 5 Years |
| Frankie D. Hughes (1952); Trustee since 2008. |
President, Ashland Hughes Properties (property management) (2014-present); President and Chief Investment Officer, Hughes Capital Management, Inc. (fixed income asset management) (1993-2014). |
166 |
None |
| Raymond Kanner (1953); Trustee since 2017. |
Retired; Managing Director and Chief Investment Officer, IBM Retirement Funds (2007-2016). |
166 |
Advisory Board Member, Penso Advisors, LLC (2020-present); Advisory Board Member, Los Angeles Capital (2018-present); Advisory Board Member, State Street Global Advisors Total Portfolio Solutions (2017- present); Acting Executive Director, Committee on Investment of Employee Benefit Assets (CIEBA) (2016-2017); Advisory Board Member, Betterment for Business (robo advisor) (2016- 2017); Advisory Board Member, BlueStar Indexes (index creator) (2013-2017); Director, Emerging Markets Growth Fund (registered investment company) (1997-2016); Member, Russell Index Client Advisory Board (2001-2015). |
| Thomas P. Lemke (1954); Trustee since 2014. |
Retired since 2013. |
166 |
(1) Independent Trustee of Advisors’ Inner Circle III fund platform, consisting of the following: (i) the Advisors’ Inner Circle Fund III, (ii) the Gallery Trust, (iii) the Schroder Series Trust, (iv) the Delaware Wilshire Private Markets Fund (since 2020), (v) Chiron Capital Allocation Fund Ltd., and (vi) formerly the Winton Diversified Opportunities Fund (2014-2018); and (2) Independent Trustee of the Symmetry Panoramic Trust (since 2018). |
| Lawrence R. Maffia (1950); Trustee since 2014 |
Retired; Director and President, ICI Mutual Insurance Company (2006-2013). |
166 |
Director, ICI Mutual Insurance Company (1999-2013). |
| Mary E. Martinez (1960); Vice Chair since 2021; Trustee since 2013. |
Associate, Special Properties, a Christie’s International Real Estate Affiliate (2010-present); Managing Director, Bank of America (asset management) (2007-2008); Chief Operating Officer, U.S. Trust Asset Management, U.S. Trust Company (asset management) (2003-2007); President, Excelsior Funds (registered investment companies) (2004-2005). |
166 |
None |
| Marilyn McCoy (1948); Trustee since 2005. |
Vice President of Administration and Planning, Northwestern University (1985-present). |
166 |
None |
| 120 |
J.P. Morgan International Equity Funds |
October 31, 2022 |
| Name (Year of Birth); Positions With the Funds (1) |
Principal Occupation
During Past 5 Years |
Number of
Funds in Fund
Complex Overseen
by Trustee (2) |
Other Directorships Held During the Past 5 Years |
| Dr. Robert A. Oden, Jr. (1946); Trustee
since 2005. |
Retired; President, Carleton College (2002-2010); President, Kenyon College (1995-2002). |
166 |
Trustee, The Coldwater Conservation Fund (2017-present); Trustee, American Museum of Fly Fishing (2013-present); Trustee and Vice Chair, Trout Unlimited (2017-2021);Trustee, Dartmouth- Hitchcock MedicalCenter (2011-2020). |
| Marian U. Pardo* (1946); Trustee since 2013. |
Managing Director and Founder, Virtual Capital Management LLC (investment consulting) (2007-present); Managing Director, Credit Suisse Asset Management (portfolio manager) (2003-2006). |
166 |
Board Chair and Member, Board of Governors, Columbus Citizens Foundation (not-for-profit supporting philanthropic and cultural programs) (2006-present). |
| Emily A. Youssouf (1951); Trustee since 2022. |
Adjunct Professor (2011-present) and Clinical Professor (2009-2011), NYU Schack Institute of Real Estate; Board Member and Member of the Audit Committee (2013–present), Chair of Finance Committee (2019-present), Member of Related Parties Committee (2013-2018) and Member of the Enterprise Risk Committee (2015-2018), PennyMac Financial Services, Inc.; Board Member (2005-2018), Chair of Capital Committee (2006-2016), Chair of Audit Committee (2005-2018), Member of Finance Committee (2005-2018) and Chair of IT Committee (2016-2018), NYC Health and Hospitals Corporation. |
166 |
Trustee, NYC School Construction Authority (2009-present); Board Member, NYS Job Development Authority (2008-present); Trustee and Chair of the Audit Committee of the Transit Center Foundation (2015-2019). |
| Interested Trustees |
|
|
|
| Robert F. Deutsch** (1957); Trustee since 2014. |
Retired; Head of ETF Business for JPMorgan Asset Management (2013-2017); Head of Global Liquidity Business for JPMorgan Asset Management (2003-2013). |
166 |
Treasurer and Director of the JUST Capital Foundation (2017-present). |
| Nina O. Shenker** (1957); Trustee since 2022. |
Vice Chair (2017-2021), General Counsel and Managing Director (2008-2016), Associate General Counsel and Managing Director (2004-2008), J.P. Morgan Asset & Wealth Management. |
166 |
Director and Member of Legal and Human Resources Subcommittees, American Jewish Joint Distribution Committee (2018-present). |
| | |||
| (1) |
The year shown is the first year in which a Trustee became a member of any of the following: the Mutual Fund Board, the ETF Board, the
heritage J.P. Morgan Funds or the heritage One Group Mutual Funds. Trustees serve an indefinite term,
until resignation, retirement, removal or death. The Board’s current retirement
policy sets retirement at the end of the calendar year in which the Trustee attains the age of 75, provided that any Board member who was a member of the Mutual Fund Board prior to January 1, 2022 and was born prior to January 1, 1950 shall retire
from the Board at the end of the calendar year in which the Trustee attains the age of 78.
| ||
| (2) |
A Fund Complex means two or more registered investment companies that hold themselves out to investors as related companies for purposes
of investment and investor services or have a common investment adviser or have an investment adviser
that is an affiliated person of the investment adviser of any of the other registered
investment companies. The J.P. Morgan Funds Complex for which the Board of Trustees serves
currently includes nine registered investment companies (166 J.P. Morgan Funds). | ||
| * |
In connection with prior employment with JPMorgan Chase, Ms. Pardo was the recipient of non-qualified pension plan payments from JPMorgan
Chase in the amount of approximately $2,055 per month, which she irrevocably waived effective January 1,
2013, and deferred compensation payments from JPMorgan Chase in the amount of approximately
$7,294 per year, which ended in January 2013. In addition, Ms. Pardo receives payments from
a fully-funded qualified plan, which is not an obligation of JPMorgan Chase. | ||
| ** |
Designation as an “Interested Trustee” is based on prior employment by the Adviser or an affiliate of the Adviser or interests in a control person
of the Adviser. | ||
| October 31, 2022 |
J.P. Morgan International Equity Funds |
121 |
(Unaudited) (continued)
| |
The contact address for each of the Trustees is 277 Park Avenue, New York, NY 10172. | ||
| 122 |
J.P. Morgan International Equity Funds |
October 31, 2022 |
(Unaudited)
| Name (Year of Birth), Positions Held with the Trust (Since) |
Principal Occupations During Past 5 Years |
| Brian S. Shlissel (1964), President and Principal Executive Officer (2016)* |
Managing Director and Chief Administrative Officer for J.P. Morgan pooled vehicles, J.P. Morgan Investment
Management Inc. since 2014. |
| Timothy J. Clemens (1975), Treasurer and Principal Financial Officer (2018) |
Executive Director, J.P. Morgan Investment Management Inc. since February 2016. Mr. Clemens has been with
J.P. Morgan Investment Management Inc. since 2013. |
| Gregory S. Samuels (1980), Secretary (2019) (formerly Assistant
Secretary 2010-2019)** |
Managing Director and Assistant General Counsel, JPMorgan Chase & Co. Mr. Samuels has been with
JPMorgan Chase & Co. since 2010. |
| Stephen M. Ungerman (1953), Chief Compliance Officer (2005) |
Managing Director, JPMorgan Chase & Co. Mr. Ungerman has been with JPMorgan Chase & Co. since 2000. |
| Kiesha Astwood-Smith (1973), Assistant Secretary (2021)** |
Vice President and Assistant General Counsel, JPMorgan Chase & Co. since June 2021; Senior Director and
Counsel, Equitable Financial Life Insurance Company (formerly, AXA Equitable Life Insurance Company) from
September 2015 through June 2021. |
| Matthew Beck (1988), Assistant Secretary (2021)*** |
Vice President and Assistant General Counsel, JPMorgan Chase & Co. since May 2021; Senior Legal Counsel,
Ultimus Fund Solutions from May 2018 through May 2021; General Counsel, The Nottingham Company from
April 2014 through May 2018. |
| Elizabeth A. Davin (1964), Assistant Secretary (2005)*** |
Executive Director and Assistant General Counsel, JPMorgan Chase & Co. Ms. Davin has been with JPMorgan
Chase & Co. (formerly Bank One Corporation) since 2004. |
| Jessica K. Ditullio (1962) Assistant Secretary (2005)*** |
Executive Director and Assistant General Counsel, JPMorgan Chase & Co. Ms. Ditullio has been with JPMorgan
Chase & Co. (formerly Bank One Corporation) since 1990. |
| Anthony Geron (1971), Assistant Secretary (2018)** |
Vice President and Assistant General Counsel, JPMorgan Chase & Co. since September 2018; Lead Director
and Counsel, AXA Equitable Life Insurance Company from 2015 to 2018 and Senior Director and Counsel, AXA
Equitable Life Insurance Company from 2014 to 2015. |
| Carmine Lekstutis (1980), Assistant Secretary (2011)** |
Executive Director and Assistant General Counsel, JPMorgan Chase & Co. Mr. Lekstutis has been with
JPMorgan Chase & Co. since 2011. |
| Max Vogel (1990), Assistant Secretary (2021)** |
Vice President and Assistant General Counsel, JPMorgan Chase & Co. since June 2021; Associate, Proskauer
Rose LLP (law firm) from March 2017 to June 2021. |
| Zachary E. Vonnegut-Gabovitch (1986),
Assistant Secretary (2017)** |
Vice President and Assistant General Counsel, JPMorgan Chase & Co. since September 2016. |
| Michael M. D’Ambrosio (1969), Assistant Treasurer (2012) |
Managing Director, J.P. Morgan Investment Management Inc. Mr. D’Ambrosio has been with J.P. Morgan
Investment Management Inc. since 2012. |
| Aleksandr Fleytekh (1972), Assistant Treasurer (2019) |
Vice President, J.P. Morgan Investment Management Inc. since February 2012. |
| Shannon Gaines (1977), Assistant Treasurer (2018)*** |
Vice President, J.P. Morgan Investment Management Inc. since January 2014. |
| Jeffrey D. House (1972), Assistant Treasurer (2017)*** |
Vice President, J.P. Morgan Investment Management Inc. since July 2006. |
| Michael Mannarino (1985), Assistant Treasurer (2020) |
Vice President, J.P. Morgan Investment Management Inc. since 2014. |
| Joseph Parascondola (1963), Assistant Treasurer (2011)* |
Executive Director, J.P. Morgan Investment Management, Inc. Mr. Parascondola has been with J.P. Morgan
Investment Management Inc. since 2006. |
| Gillian I. Sands (1969), Assistant Treasurer (2012) |
Executive Director, J.P. Morgan Investment Management Inc. Ms. Sands has been with J.P. Morgan Investment
Management Inc. since 2012. |
| | |
| The contact address for each of the officers, unless otherwise noted, is 277 Park Avenue, New York, NY 10172. |
| October 31, 2022 |
J.P. Morgan International Equity Funds |
123 |
(Unaudited) (continued)
| * |
The contact address for the officer is 575 Washington Boulevard, Jersey City, NJ 07310. |
| ** |
The contact address for the officer is 4 New York Plaza, New York, NY 10004. |
| *** |
The contact address for the officer is 1111 Polaris Parkway, Columbus, OH 43240. |
| 124 |
J.P. Morgan International Equity Funds |
October 31, 2022 |
(Unaudited)
Hypothetical $1,000 Investment
| |
Beginning
Account Value
May 1, 2022 |
Ending
Account Value
October 31, 2022 |
Expenses
Paid During
the Period* |
Annualized
Expense Ratio |
| JPMorgan Emerging Markets Equity Fund |
|
|
|
|
| Class A |
|
|
|
|
| Actual |
$1,000.00
|
$826.70
|
$5.80 |
1.26% |
| Hypothetical |
1,000.00 |
1,018.85 |
6.41 |
1.26 |
| Class C |
|
|
|
|
| Actual |
1,000.00 |
824.70 |
8.09 |
1.76 |
| Hypothetical |
1,000.00 |
1,016.33 |
8.94 |
1.76 |
| Class I |
|
|
|
|
| Actual |
1,000.00 |
827.60 |
4.65 |
1.01 |
| Hypothetical |
1,000.00 |
1,020.11 |
5.14 |
1.01 |
| Class L |
|
|
|
|
| Actual |
1,000.00 |
828.30 |
4.19 |
0.91 |
| Hypothetical |
1,000.00 |
1,020.62 |
4.63 |
0.91 |
| Class R2 |
|
|
|
|
| Actual |
1,000.00 |
825.70 |
7.18 |
1.56 |
| Hypothetical |
1,000.00 |
1,017.34 |
7.93 |
1.56 |
| Class R3 |
|
|
|
|
| Actual |
1,000.00 |
826.50 |
5.98 |
1.30 |
| Hypothetical |
1,000.00 |
1,018.65 |
6.61 |
1.30 |
| Class R4 |
|
|
|
|
| Actual |
1,000.00 |
827.60 |
4.84 |
1.05 |
| Hypothetical |
1,000.00 |
1,019.91 |
5.35 |
1.05 |
| Class R5 |
|
|
|
|
| Actual |
1,000.00 |
828.00 |
4.19 |
0.91 |
| Hypothetical |
1,000.00 |
1,020.62 |
4.63 |
0.91 |
| October 31, 2022 |
J.P. Morgan International Equity Funds |
125 |
(Unaudited) (continued)
Hypothetical $1,000 Investment
| |
Beginning
Account Value
May 1, 2022 |
Ending
Account Value
October 31, 2022 |
Expenses
Paid During
the Period* |
Annualized
Expense Ratio |
| JPMorgan Emerging Markets Equity Fund (continued) |
|
|
|
|
| Class R6 |
|
|
|
|
| Actual |
$1,000.00
|
$828.80
|
$3.69 |
0.80% |
| Hypothetical |
1,000.00 |
1,021.17 |
4.08 |
0.80 |
| JPMorgan Emerging Markets Research Enhanced Equity Fund |
|
|
|
|
| Class I |
|
|
|
|
| Actual |
1,000.00 |
802.20 |
2.04 |
0.45 |
| Hypothetical |
1,000.00 |
1,022.94 |
2.29 |
0.45 |
| Class R6 |
|
|
|
|
| Actual |
1,000.00 |
802.30 |
1.59 |
0.35 |
| Hypothetical |
1,000.00 |
1,023.44 |
1.79 |
0.35 |
| JPMorgan Europe Dynamic Fund |
|
|
|
|
| Class A |
|
|
|
|
| Actual |
1,000.00 |
914.40 |
6.08 |
1.26 |
| Hypothetical |
1,000.00 |
1,018.85 |
6.41 |
1.26 |
| Class C |
|
|
|
|
| Actual |
1,000.00 |
912.10 |
8.48 |
1.76 |
| Hypothetical |
1,000.00 |
1,016.33 |
8.94 |
1.76 |
| Class I |
|
|
|
|
| Actual |
1,000.00 |
915.60 |
4.88 |
1.01 |
| Hypothetical |
1,000.00 |
1,020.11 |
5.14 |
1.01 |
| Class L |
|
|
|
|
| Actual |
1,000.00 |
916.00 |
4.30 |
0.89 |
| Hypothetical |
1,000.00 |
1,020.72 |
4.53 |
0.89 |
| Class R6 |
|
|
|
|
| Actual |
1,000.00 |
916.40 |
3.82 |
0.79 |
| Hypothetical |
1,000.00 |
1,021.22 |
4.02 |
0.79 |
| JPMorgan International Equity Fund |
|
|
|
|
| Class A |
|
|
|
|
| Actual |
1,000.00 |
877.50 |
4.50 |
0.95 |
| Hypothetical |
1,000.00 |
1,020.42 |
4.84 |
0.95 |
| Class C |
|
|
|
|
| Actual |
1,000.00 |
875.10 |
6.85 |
1.45 |
| Hypothetical |
1,000.00 |
1,017.90 |
7.38 |
1.45 |
| Class I |
|
|
|
|
| Actual |
1,000.00 |
878.50 |
3.31 |
0.70 |
| Hypothetical |
1,000.00 |
1,021.68 |
3.57 |
0.70 |
| Class R2 |
|
|
|
|
| Actual |
1,000.00 |
875.80 |
5.91 |
1.25 |
| Hypothetical |
1,000.00 |
1,018.90 |
6.36 |
1.25 |
| Class R5 |
|
|
|
|
| Actual |
1,000.00 |
879.10 |
2.84 |
0.60 |
| Hypothetical |
1,000.00 |
1,022.18 |
3.06 |
0.60 |
| Class R6 |
|
|
|
|
| Actual |
1,000.00 |
879.40 |
2.37 |
0.50 |
| Hypothetical |
1,000.00 |
1,022.68 |
2.55 |
0.50 |
| JPMorgan International Focus Fund |
|
|
|
|
| Class A |
|
|
|
|
| Actual |
1,000.00 |
867.50 |
4.75 |
1.01 |
| Hypothetical |
1,000.00 |
1,020.11 |
5.14 |
1.01 |
| 126 |
J.P. Morgan International Equity Funds |
October 31, 2022 |
| |
Beginning
Account Value
May 1, 2022 |
Ending
Account Value
October 31, 2022 |
Expenses
Paid During
the Period* |
Annualized
Expense Ratio |
| JPMorgan International Focus Fund (continued) |
|
|
|
|
| Class C |
|
|
|
|
| Actual |
$1,000.00 |
$865.00 |
$7.10 |
1.51% |
| Hypothetical |
1,000.00 |
1,017.59 |
7.68 |
1.51 |
| Class I |
|
|
|
|
| Actual |
1,000.00 |
868.50 |
3.58 |
0.76 |
| Hypothetical |
1,000.00 |
1,021.37 |
3.87 |
0.76 |
| Class R2 |
|
|
|
|
| Actual |
1,000.00 |
866.10 |
6.16 |
1.31 |
| Hypothetical |
1,000.00 |
1,018.60 |
6.67 |
1.31 |
| Class R5 |
|
|
|
|
| Actual |
1,000.00 |
868.90 |
3.11 |
0.66 |
| Hypothetical |
1,000.00 |
1,021.88 |
3.36 |
0.66 |
| Class R6 |
|
|
|
|
| Actual |
1,000.00 |
869.00 |
2.69 |
0.57 |
| Hypothetical |
1,000.00 |
1,022.33 |
2.91 |
0.57 |
| JPMorgan International Hedged Equity Fund |
|
|
|
|
| Class A |
|
|
|
|
| Actual |
1,000.00 |
958.40 |
4.20 |
0.85 |
| Hypothetical |
1,000.00 |
1,020.92 |
4.33 |
0.85 |
| Class C |
|
|
|
|
| Actual |
1,000.00 |
955.60 |
6.65 |
1.35 |
| Hypothetical |
1,000.00 |
1,018.40 |
6.87 |
1.35 |
| Class I |
|
|
|
|
| Actual |
1,000.00 |
959.30 |
2.96 |
0.60 |
| Hypothetical |
1,000.00 |
1,022.18 |
3.06 |
0.60 |
| Class R5 |
|
|
|
|
| Actual |
1,000.00 |
960.10 |
2.22 |
0.45 |
| Hypothetical |
1,000.00 |
1,022.94 |
2.29 |
0.45 |
| Class R6 |
|
|
|
|
| Actual |
1,000.00 |
960.10 |
1.73 |
0.35 |
| Hypothetical |
1,000.00 |
1,023.44 |
1.79 |
0.35 |
| JPMorgan International Value Fund |
|
|
|
|
| Class A |
|
|
|
|
| Actual |
1,000.00 |
896.50 |
4.54 |
0.95 |
| Hypothetical |
1,000.00 |
1,020.42 |
4.84 |
0.95 |
| Class C |
|
|
|
|
| Actual |
1,000.00 |
894.20 |
6.97 |
1.46 |
| Hypothetical |
1,000.00 |
1,017.85 |
7.43 |
1.46 |
| Class I |
|
|
|
|
| Actual |
1,000.00 |
897.70 |
3.40 |
0.71 |
| Hypothetical |
1,000.00 |
1,021.63 |
3.62 |
0.71 |
| Class L |
|
|
|
|
| Actual |
1,000.00 |
898.80 |
2.87 |
0.60 |
| Hypothetical |
1,000.00 |
1,022.18 |
3.06 |
0.60 |
| Class R2 |
|
|
|
|
| Actual |
1,000.00 |
894.70 |
5.97 |
1.25 |
| Hypothetical |
1,000.00 |
1,018.90 |
6.36 |
1.25 |
| Class R5 |
|
|
|
|
| Actual |
1,000.00 |
898.10 |
2.92 |
0.61 |
| Hypothetical |
1,000.00 |
1,022.13 |
3.11 |
0.61 |
| October 31, 2022 |
J.P. Morgan International Equity Funds |
127 |
(Unaudited) (continued)
Hypothetical $1,000 Investment
| |
Beginning
Account Value
May 1, 2022 |
Ending
Account Value
October 31, 2022 |
Expenses
Paid During
the Period* |
Annualized
Expense Ratio |
| JPMorgan International Value Fund (continued) |
|
|
|
|
| Class R6 |
|
|
|
|
| Actual |
$1,000.00 |
$899.00 |
$2.39 |
0.50% |
| Hypothetical |
1,000.00 |
1,022.68 |
2.55 |
0.50 |
| | |
| * |
Expenses are equal to each Class’ respective annualized expense ratio, multiplied by the average account value over the period, multiplied by
184/365 (to reflect the one-half year period). |
| 128 |
J.P. Morgan International Equity Funds |
October 31, 2022 |
(Unaudited)
| |
|
129 |
(Unaudited)
| 130 |
|
|
| |
|
131 |
(Unaudited)
| 132 |
|
|
| |
|
133 |
(Unaudited)
(Dollar values in thousands)
| |
Long-Term
Capital Gain Distribution |
| JPMorgan Emerging Markets Equity Fund |
$414,863 |
| JPMorgan Emerging Markets Research Enhanced Equity Fund |
95,039 |
| JPMorgan International Equity Fund |
220,976 |
| |
Qualified
Dividend Income |
| JPMorgan Emerging Markets Equity Fund |
$90,647 |
| JPMorgan Emerging Markets Research Enhanced Equity Fund |
52,427 |
| JPMorgan Europe Dynamic Fund |
17,517 |
| JPMorgan International Equity Fund |
112,014 |
| JPMorgan International Focus Fund |
55,969 |
| JPMorgan International Hedged Equity Fund |
4,630 |
| JPMorgan International Value Fund |
16,716 |
| |
Total Foreign
Source Income |
Foreign Tax
Credit |
| JPMorgan Emerging Markets Equity Fund |
$176,392 |
$18,604 |
| JPMorgan Emerging Markets Research Enhanced Equity Fund |
118,387 |
11,387 |
| JPMorgan Europe Dynamic Fund |
22,377 |
2,090 |
| JPMorgan International Equity Fund |
147,232 |
9,713 |
| JPMorgan International Focus Fund |
67,288 |
5,167 |
| JPMorgan International Hedged Equity Fund |
5,365 |
493 |
| JPMorgan International Value Fund |
21,305 |
1,346 |
| 134 |
J.P. Morgan International Equity Funds |
October 31, 2022 |
| FACT |
WHAT DOES J.P. MORGAN FUNDS DO WITH YOUR PERSONAL INFORMATION? |
| Why? |
Financial companies choose how they share your personal information. Federal law gives consumers
the right to limit some but not all sharing. Federal law also requires us to tell you
how we collect, share, and protect your personal information. Please read
this notice carefully to understand what we do. |
| What? |
The types of personal information we collect and share depend on the product or service you have
with us. This information can include: |
| |
○Social Security number and account balances |
| |
○transaction history and account transactions |
| |
○checking account information and wire transfer instructions |
| |
When you are no longer our customer, we continue to share your information as described in this notice. |
| How? |
All financial companies need to share customers’ personal information to run
their everyday business. In the section below, we list the reasons
financial companies can share their customers’ personal
information; the reasons J.P. Morgan Funds chooses to share; and whether you can limit this sharing. |
| Reasons we can share your personal information |
Does J.P. Morgan Funds share? |
Can you limit this sharing? |
| For our everyday business purposes — such as to process your transactions, maintain your account(s), respond to court orders and legal investigations, or report to credit bureaus |
Yes |
No |
| For marketing purposes — to offer our products and services to you |
Yes |
No |
| For joint marketing with other financial companies |
No |
We don't share |
| For our affiliates’ everyday business purposes — information about your transactions and experiences |
No |
We don't share |
| For our affiliates’ everyday business purposes — information about your creditworthiness |
No |
We don't share |
| For nonaffiliates to market to you |
No |
We don't share |
| Questions? Call 1-800-480-4111 or go to
www.jpmorganfunds.com |
|

| Who we are | |
| Who is providing this notice? |
J.P. Morgan Funds |
| What we do | |
| How does J.P. Morgan Funds protect my personal information? |
To protect your personal information from unauthorized access and use, we use security measures
that comply with federal law. These measures include computer safeguards and secured
files and buildings. We authorize our employees to access your
information only when they need it to do their work and we require
companies that work for us to protect your information. |
| | |
| How does J.P. Morgan Funds
protect my personal
information? |
We collect your personal information, for example, when you: |
| ○open an account or provide contact information | |
| ○give us your account information or pay us by check |
|
| ○make a wire transfer | |
| We also collect your personal information from others, such as credit bureaus, affiliates and other
companies. | |
| | |
| Why can’t I limit all sharing? |
Federal law gives you the right to limit only: |
| ○sharing for affiliates’ everyday business purposes – information
about your creditworthiness | |
| ○affiliates from using your information to market to you | |
| ○sharing for nonaffiliates to market to you | |
| State laws and individual companies may give you additional rights to limit sharing. | |
| Definitions | |
| Affiliates |
Companies related by common ownership or control. They can be financial and nonfinancial
companies. |
| |
○J.P. Morgan Funds does not share with our
affiliates. |
| | |
| Nonaffiliates |
Companies not related by common ownership or control. They can be financial and nonfinancial
companies. |
| |
○J.P. Morgan Funds does not share with nonaffiliates so they
can market to you. |
| | |
| Joint Marketing |
A formal agreement between nonaffiliated financial companies that together market financial
products or services to you. |
| |
○J.P. Morgan Funds doesn’t jointly market.
|

| JPMorgan Opportunistic Equity Long/Short Fund |
| JPMorgan Research Market Neutral Fund |

| |
|
| 1 | |
| 2 | |
| | |
| 3 | |
| 6 | |
| 9 | |
| 18 | |
| 26 | |
| 30 | |
| 43 | |
| 44 | |
| 48 | |
| 50 | |
| 51 | |
| 55 | |
| |
Past performance is no guarantee of future performance. The general market views expressed in this report are opinions based on market and other conditions through the end of the reporting period and are subject to change without notice. These views are not intended to predict the future performance of a Fund or the securities markets.
Prospective investors should refer to the Funds’ prospectuses for a discussion of the Funds’ investment objectives, strategies and risks. Call J.P. Morgan Funds Service Center at 1-800-480-4111 for a prospectus containing more complete information about a Fund, including management fees and other expenses. Please read it carefully before investing.
December 15, 2022 (Unaudited)
 |
“While investors seek to adapt to the current market environment, we believe a well-diversified portfolio and a patient outlook remain crucial components of a successful invest- ment approach.” — Brian S. Shlissel |

President, J.P. Morgan Funds
J.P. Morgan Asset Management
1-800-480-4111 or www.jpmorganfunds.com for more information
| October 31, 2022 |
J.P. Morgan Specialty Funds |
1 |
TWELVE MONTHS ENDED October 31, 2022 (Unaudited)
| 2 |
J.P. Morgan Specialty Funds |
October 31, 2022 |
TWELVE MONTHS ENDED October 31, 2022 (Unaudited)
| REPORTING PERIOD RETURN: |
|
| Fund (Class I Shares) * |
(18.35)% |
| S&P 500 Index |
(14.61)% |
| ICE BofAML 3-Month US Treasury Bill Index |
0.79% |
| Net Assets as of 10/31/2022 (In Thousands) |
$481,006 |
| October 31, 2022 |
J.P. Morgan Specialty Funds |
3 |
TWELVE MONTHS ENDED October 31, 2022 (Unaudited) (continued)
| TOP TEN LONG POSITIONS OF THE PORTFOLIO AS OF October 31,
2022 |
PERCENT OF TOTAL
INVESTMENTS | |
| 1. |
NextEra Energy, Inc. |
6.8% |
| 2. |
UnitedHealth Group, Inc. |
5.1 |
| 3. |
NXP Semiconductors NV (China) |
5.0 |
| 4. |
SPDR S&P 500 ETF Trust |
4.9 |
| 5. |
Amazon.com, Inc. |
4.3 |
| 6. |
Fiserv, Inc. |
4.3 |
| 7. |
Constellation Energy Corp. |
4.2 |
| 8. |
Canadian Pacific Railway Ltd. |
4.0
|
| 9. |
Microsoft Corp. |
4.0 |
| 10. |
Zscaler, Inc. |
3.1 |
| TOP TEN SHORT POSITIONS OF THE PORTFOLIO AS OF October 31,
2022 |
PERCENT OF TOTAL
INVESTMENTS | |
| 1. |
Apple, Inc. |
20.4% |
| 2. |
Old Dominion Freight Line, Inc. |
11.8 |
| 3. |
iShares Semiconductor ETF |
10.4 |
| 4. |
Signet Jewelers Ltd. |
4.7 |
| 5. |
Intel Corp. |
3.4 |
| 6. |
Cisco Systems, Inc. |
3.4 |
| 7. |
Saia, Inc. |
3.2 |
| 8. |
XPO Logistics, Inc. |
3.1 |
| 9. |
Ally Financial, Inc. |
3.0 |
| 10. |
FedEx Corp. |
2.7 |
| LONG POSITION PORTFOLIO COMPOSITION BY SECTOR AS OF October 31,
2022 |
PERCENT OF TOTAL
INVESTMENTS |
| Information Technology |
16.9% |
| Utilities |
11.0 |
| Consumer Discretionary |
10.3 |
| Industrials |
9.5 |
| Health Care |
8.0 |
| Exchange-Traded Fund |
4.9 |
| Energy |
1.8 |
| Short-Term Investments |
37.6 |
| SHORT POSITION PORTFOLIO COMPOSITION BY SECTOR AS OF October 31,
2022 |
PERCENT OF TOTAL
INVESTMENTS |
| Information Technology |
30.1% |
| Industrials |
26.7 |
| Consumer Discretionary |
12.4 |
| Exchange-Traded Fund |
10.4 |
| Consumer Staples |
6.5 |
| Financials |
5.7 |
| Materials |
3.9 |
| Communication Services |
2.2 |
| Health Care |
2.1 |
| 4 |
J.P. Morgan Specialty Funds |
October 31, 2022 |
| |
INCEPTION
DATE OF CLASS |
1 YEAR |
5 YEAR |
SINCE INCEPTION |
| CLASS A SHARES |
August 29, 2014 |
|
|
|
| With Sales Charge * |
|
(22.81)% |
1.57% |
4.40% |
| Without Sales Charge |
|
(18.53) |
2.68 |
5.09 |
| CLASS C SHARES |
August 29, 2014 |
|
|
|
| With CDSC ** |
|
(19.95) |
2.16 |
4.58 |
| Without CDSC |
|
(18.95) |
2.16 |
4.58 |
| Class I SHARES |
August 29, 2014 |
(18.35) |
2.93 |
5.35 |
| Class R6 SHARES |
August 29, 2014 |
(18.11) |
3.19 |
5.61 |
| | |
| * |
Sales Charge for Class A Shares is 5.25%. |
| ** |
Assumes a 1% CDSC (contingent deferred sales charge) for the one year period and 0% CDSC thereafter. |
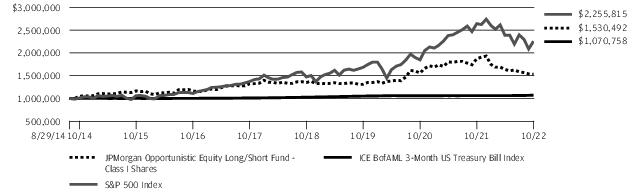
| October 31, 2022 |
J.P. Morgan Specialty Funds |
5 |
TWELVE MONTHS ENDED October 31, 2022 (Unaudited)
| REPORTING PERIOD RETURN: |
|
| Fund (Class I Shares) * |
(2.41)% |
| ICE
BofAML 3-Month US Treasury Bill Index |
0.79% |
| Net Assets as of 10/31/2022 (In Thousands) |
$158,346 |
| 6 |
J.P. Morgan Specialty Funds |
October 31, 2022 |
| TOP TEN LONG POSITIONS OF THE PORTFOLIO AS OF October 31,
2022 |
PERCENT OF TOTAL
INVESTMENTS | |
| 1. |
Mastercard, Inc., Class A |
1.9% |
| 2. |
NXP Semiconductors NV (China) |
1.7 |
| 3. |
Amazon.com, Inc. |
1.4 |
| 4. |
Intuit, Inc. |
1.3 |
| 5. |
Progressive Corp. (The) |
1.3 |
| 6. |
Lam Research Corp. |
1.3 |
| 7. |
AbbVie, Inc. |
1.2 |
| 8. |
Honeywell International, Inc. |
1.2 |
| 9. |
Deere & Co. |
1.2 |
| 10. |
Wells Fargo & Co. |
1.1 |
| TOP TEN SHORT POSITIONS OF THE PORTFOLIO AS OF October 31,
2022 |
PERCENT OF TOTAL
INVESTMENTS | |
| 1. |
Apple, Inc. |
3.9% |
| 2. |
Kroger Co. (The) |
2.7 |
| 3. |
Omnicom Group, Inc. |
2.1 |
| 4. |
General Electric Co. |
2.0
|
| 5. |
Walmart, Inc. |
1.8 |
| 6. |
Moderna, Inc. |
1.7 |
| 7. |
Boeing Co. (The) |
1.6 |
| 8. |
3M Co. |
1.5 |
| 9. |
Gilead Sciences, Inc. |
1.5 |
| 10. |
Johnson Controls International plc |
1.5 |
| LONG POSITION PORTFOLIO COMPOSITION BY SECTOR AS OF October 31,
2022 |
PERCENT OF TOTAL
INVESTMENTS |
| Information Technology |
14.6% |
| Industrials |
12.4 |
| Health Care |
10.0 |
| Financials |
8.3 |
| Consumer Discretionary |
6.5 |
| Communication Services |
4.9 |
| Utilities |
3.5 |
| Energy |
3.2 |
| Consumer Staples |
2.4 |
| Materials |
1.8 |
| Real Estate |
1.8 |
| Short-Term Investments |
30.6 |
| SHORT POSITION PORTFOLIO COMPOSITION BY SECTOR AS OF October 31,
2022 |
PERCENT OF TOTAL
INVESTMENTS |
| Industrials |
20.3% |
| Information Technology |
17.6 |
| Financials |
13.3 |
| Health
Care |
12.0 |
| Consumer Staples |
10.1 |
| Communication Services |
8.5 |
| Utilities |
6.1 |
| Real
Estate |
3.5 |
| Consumer Discretionary |
3.3 |
| Energy |
3.0 |
| Materials |
2.3 |
| October 31, 2022 |
J.P. Morgan Specialty Funds |
7 |
TWELVE MONTHS ENDED October 31, 2022 (Unaudited) (continued)
| |
INCEPTION
DATE OF CLASS |
1 YEAR |
5 YEAR |
10 YEAR |
| CLASS A SHARES |
February 28, 2002 |
|
|
|
| With Sales Charge * |
|
(7.79)% |
1.59% |
1.23% |
| Without Sales Charge |
|
(2.66) |
2.69 |
1.77 |
| CLASS C SHARES |
November 2, 2009 |
|
|
|
| With CDSC ** |
|
(4.16) |
2.18 |
1.36 |
| Without CDSC |
|
(3.16) |
2.18 |
1.36 |
| Class I SHARES |
November 2, 2009 |
(2.41) |
2.95 |
2.04 |
| | |
| * |
Sales Charge for Class A Shares is 5.25%. |
| ** |
Assumes a 1% CDSC (contingent deferred sales charge) for the one year period and 0% CDSC thereafter. |

| 8 |
J.P. Morgan Specialty Funds |
October 31, 2022 |
AS OF October 31, 2022
| INVESTMENTS |
SHARES
(000) |
VALUE ($000) |
| Long Positions — 97.3% | ||
| Common Stocks — 56.0% | ||
| Automobiles — 2.1% | ||
| Ferrari NV (Italy) |
51 |
10,024 |
| Tesla, Inc. * |
1 |
249 |
| |
|
10,273 |
| Communications Equipment — 0.5% | ||
| Motorola Solutions, Inc. |
10 |
2,574 |
| Electric Utilities — 10.7% | ||
| Constellation Energy Corp. (a) |
208 |
19,664 |
| NextEra Energy, Inc. (a) |
411 |
31,878 |
| |
|
51,542 |
| Health Care Providers & Services — 6.0% | ||
| Humana, Inc. |
9 |
5,300 |
| UnitedHealth Group, Inc. (a) |
43 |
23,674 |
| |
|
28,974 |
| Hotels, Restaurants & Leisure — 2.0% | ||
| Royal Caribbean Cruises Ltd. * |
177 |
9,443 |
| Industrial Conglomerates — 2.0% | ||
| Honeywell International, Inc. |
46 |
9,449 |
| Internet & Direct Marketing Retail — 4.2% | ||
| Amazon.com, Inc. * (a) |
197 |
20,131 |
| IT Services — 4.2% | ||
| Fiserv, Inc. * |
196 |
20,121 |
| Life Sciences Tools & Services — 1.7% | ||
| Thermo Fisher Scientific, Inc. |
16 |
8,312 |
| Machinery — 1.6% | ||
| PACCAR, Inc. |
79 |
7,650 |
| Oil, Gas & Consumable Fuels — 1.7% | ||
| Exxon Mobil Corp. |
75 |
8,360 |
| Road & Rail — 5.7% | ||
| Canadian Pacific Railway Ltd. (Canada) |
254 |
18,918 |
| Union Pacific Corp. (a) |
43 |
8,499 |
| |
|
27,417 |
| Semiconductors & Semiconductor Equipment — 4.9% | ||
| NXP Semiconductors NV (China) |
161 |
23,489 |
| Software — 6.9% | ||
| Microsoft Corp. (a) |
80 |
18,515 |
| Zscaler, Inc. * |
94 |
14,545 |
| |
|
33,060 |
| INVESTMENTS |
SHARES
(000) |
VALUE ($000) |
| | ||
| | ||
| Specialty Retail — 1.8% | ||
| AutoZone, Inc. * |
2 |
5,382 |
| O'Reilly Automotive, Inc. * |
4 |
3,039 |
| |
|
8,421 |
| Total Common Stocks (Cost $252,284) |
|
269,216 |
| Exchange-Traded Funds — 4.7% | ||
| U.S. Equity — 4.7% | ||
| SPDR S&P 500 ETF Trust(Cost $22,132) |
59 |
22,826 |
| Short-Term Investments — 36.6% | ||
| Investment Companies — 36.6% | ||
| JPMorgan Prime Money Market Fund Class Institutional Shares, 3.12% (b) (c)(Cost $176,262) |
176,245 |
176,262 |
| Total Long Positions (Cost $450,678) |
|
468,304 |
| Short Positions — (31.1)% | ||
| Common Stocks — (27.9)% | ||
| Air Freight & Logistics — (0.8)% | ||
| FedEx Corp. |
(25) |
(3,966) |
| Automobiles — (1.9)% | ||
| Ford Motor Co. |
(227) |
(3,031) |
| General Motors Co. |
(82) |
(3,197) |
| Harley-Davidson, Inc. |
(69) |
(2,986) |
| |
|
(9,214) |
| Building Products — (0.7)% | ||
| A O Smith Corp. |
(59) |
(3,264) |
| Chemicals — (1.2)% | ||
| Celanese Corp. |
(14) |
(1,303) |
| Dow, Inc. |
(62) |
(2,896) |
| Westlake Corp. |
(17) |
(1,684) |
| |
|
(5,883) |
| Communications Equipment — (1.0)% | ||
| Cisco Systems, Inc. |
(111) |
(5,027) |
| Consumer Finance — (1.8)% | ||
| Ally Financial, Inc. |
(163) |
(4,484) |
| Capital One Financial Corp. |
(9) |
(1,001) |
| Synchrony Financial |
(84) |
(2,984) |
| |
|
(8,469) |
| Entertainment — (0.7)% | ||
| Roku, Inc. * |
(59) |
(3,269) |
| October 31, 2022 |
J.P. Morgan Specialty Funds |
9 |
AS OF October 31, 2022 (continued)
| INVESTMENTS |
SHARES
(000) |
VALUE ($000) |
| Short Positions — continued | ||
| Common Stocks — continued | ||
| Food Products — (0.8)% | ||
| Mondelez International, Inc., Class A |
(63) |
(3,865)
|
| Health Care Providers & Services — (0.7)% | ||
| CVS Health Corp. |
(13) |
(1,210) |
| Henry Schein, Inc. * |
(29) |
(2,015)
|
| |
|
(3,225) |
| Household Products — (1.2)% | ||
| Kimberly-Clark Corp. |
(21) |
(2,537) |
| Procter & Gamble Co. (The) |
(24) |
(3,267)
|
| |
|
(5,804) |
| IT Services — (0.7)% | ||
| Okta, Inc. * |
(59) |
(3,337) |
| Professional Services — (0.3)% | ||
| ManpowerGroup, Inc. |
(20) |
(1,568) |
| Road & Rail — (6.5)% | ||
| JB Hunt Transport Services, Inc. |
(7) |
(1,217) |
| Knight-Swift Transportation Holdings, Inc. |
(61) |
(2,905) |
| Old Dominion Freight Line, Inc. |
(64) |
(17,668) |
| Saia, Inc. * |
(24) |
(4,825) |
| XPO Logistics, Inc. * |
(89) |
(4,590) |
| |
|
(31,205) |
| Semiconductors & Semiconductor Equipment — (1.0)% | ||
| Intel Corp. |
(177) |
(5,033) |
| Specialty Retail — (1.5)% | ||
| Signet Jewelers Ltd. |
(107) |
(6,968) |
| Technology Hardware, Storage & Peripherals — (6.6)% | ||
| Apple, Inc. |
(199) |
(30,570) |
| Western Digital Corp. * |
(30) |
(1,040) |
| |
|
(31,610) |
| INVESTMENTS |
SHARES
(000) |
VALUE ($000) |
| | ||
| | ||
| Textiles, Apparel & Luxury Goods — (0.5)% | ||
| Tapestry, Inc. |
(77) |
(2,454)
|
| Total Common Stocks (Proceeds $(129,779)) |
|
(134,161) |
| Exchange-Traded Funds — (3.2)% | ||
| U.S. Equity — (3.2)% | ||
| iShares Semiconductor ETF (Proceeds $(15,586)) |
(48) |
(15,572) |
| Total Short Positions (Proceeds $(145,365)) |
|
(149,733) |
| Total Investments — 66.2% (Cost $305,313) |
|
318,571 |
| Other Assets Less Liabilities — 33.8% |
|
162,435 |
| Net Assets — 100.0% |
|
481,006 |
| Percentages indicated are based on net assets. |
| Abbreviations |
|
| ETF |
Exchange Traded Fund |
| SPDR |
Standard & Poor's Depositary Receipt |
| * |
Non-income producing security. |
| (a) |
All or a portion of this security is segregated as collateral for short sales. The total value of securities and cash segregated as collateral is $64,171 and $146,489, respectively. |
| (b) |
Investment in an affiliated fund, which is registered under the Investment Company Act of 1940, as amended, and is advised by J.P. Morgan Investment Management Inc. |
| (c) |
The rate shown is the current yield as of October 31, 2022. |
| 10 |
J.P. Morgan Specialty Funds |
October 31, 2022 |
AS OF October 31, 2022
| INVESTMENTS |
SHARES
(000) |
VALUE ($000) |
| Long Positions — 98.9% | ||
| Common Stocks — 68.6% | ||
| Aerospace & Defense — 3.1% | ||
| Howmet Aerospace, Inc. |
44 |
1,576 |
| Northrop Grumman Corp. |
2 |
1,217 |
| Raytheon Technologies Corp. |
15 |
1,417 |
| Textron, Inc. |
4 |
240 |
| TransDigm Group, Inc. |
1 |
478 |
| |
|
4,928 |
| Air Freight & Logistics — 0.3% | ||
| FedEx Corp. |
— |
56 |
| United Parcel Service, Inc., Class B |
3 |
491 |
| |
|
547 |
| Auto Components — 0.3% | ||
| Aptiv plc * |
2 |
138 |
| Lear Corp. |
1 |
163 |
| Magna International, Inc. (Canada) |
3 |
181 |
| |
|
482 |
| Automobiles — 0.2% | ||
| Rivian Automotive, Inc., Class A * |
7 |
246 |
| Banks — 2.1% | ||
| Bank of America Corp. |
2 |
76 |
| Fifth Third Bancorp |
27 |
962 |
| Truist Financial Corp. |
14 |
625 |
| Wells Fargo & Co. (a) |
38 |
1,730 |
| |
|
3,393 |
| Beverages — 1.5% | ||
| Coca-Cola Co. (The) |
7 |
401 |
| Constellation Brands, Inc., Class A |
1 |
245 |
| Keurig Dr Pepper, Inc. |
3 |
127 |
| Monster Beverage Corp. * |
11 |
1,040 |
| PepsiCo, Inc. |
4 |
627 |
| |
|
2,440 |
| Biotechnology — 5.2% | ||
| AbbVie, Inc. (a) |
13 |
1,959 |
| Biogen, Inc. * |
6 |
1,637 |
| BioMarin Pharmaceutical, Inc. * |
11 |
989 |
| Neurocrine Biosciences, Inc. * |
3 |
383 |
| Regeneron Pharmaceuticals, Inc. * |
2 |
1,309 |
| Sarepta Therapeutics, Inc. * |
6 |
633 |
| Vertex Pharmaceuticals, Inc. * (a) |
4 |
1,308 |
| |
|
8,218 |
| INVESTMENTS |
SHARES
(000) |
VALUE ($000) |
| | ||
| | ||
| Building Products — 0.8% | ||
| Trane Technologies plc |
8 |
1,299 |
| Capital Markets — 3.3% | ||
| Ameriprise Financial, Inc. |
— |
128 |
| Charles Schwab Corp. (The) |
16 |
1,305 |
| CME Group, Inc. |
6 |
971 |
| Morgan Stanley |
1 |
86 |
| Raymond James Financial, Inc. |
10 |
1,204 |
| S&P Global, Inc. |
4 |
1,240 |
| State Street Corp. |
4 |
263 |
| |
|
5,197 |
| Chemicals — 1.2% | ||
| Air Products and Chemicals, Inc. (a) |
1 |
267 |
| DuPont de Nemours, Inc. (a) |
6 |
350 |
| Eastman Chemical Co. (a) |
2 |
144 |
| Linde plc (United Kingdom) |
1 |
342 |
| PPG Industries, Inc. |
1 |
92 |
| Sherwin-Williams Co. (The) |
3 |
638 |
| |
|
1,833 |
| Commercial Services & Supplies — 1.0% | ||
| Republic Services, Inc. |
2 |
314 |
| Waste Connections, Inc. |
9 |
1,199 |
| |
|
1,513 |
| Construction Materials — 0.4% | ||
| Martin Marietta Materials, Inc. |
1 |
501 |
| Vulcan Materials Co. |
1 |
160 |
| |
|
661 |
| Consumer Finance — 0.5% | ||
| American Express Co. (a) |
6 |
847 |
| Electric Utilities — 1.7% | ||
| Exelon Corp. (a) |
24 |
909 |
| PG&E Corp. * |
72 |
1,073 |
| Xcel Energy, Inc. |
11 |
752 |
| |
|
2,734 |
| Electrical Equipment — 0.5% | ||
| Eaton Corp. plc |
6 |
822 |
| Electronic Equipment, Instruments & Components — 1.1% | ||
| Corning, Inc. |
10 |
315 |
| October 31, 2022 |
J.P. Morgan Specialty Funds |
11 |
AS OF October 31, 2022 (continued)
| INVESTMENTS |
SHARES
(000) |
VALUE ($000) |
| Long Positions — continued | ||
| Common Stocks — continued | ||
| Electronic Equipment, Instruments & Components — continued | ||
| Keysight Technologies, Inc. * |
6 |
1,067 |
| Mobileye Global, Inc., Class A (Israel) * |
11 |
298 |
| |
|
1,680 |
| Energy Equipment & Services — 0.5% | ||
| Baker Hughes Co. |
27 |
749 |
| Entertainment — 2.2% | ||
| Endeavor Group Holdings, Inc., Class A * (a) |
65 |
1,410 |
| Netflix, Inc. * (a) |
4 |
1,136 |
| Take-Two Interactive Software, Inc. * |
3 |
409 |
| Warner Music Group Corp., Class A |
20 |
512 |
| |
|
3,467 |
| Equity Real Estate Investment Trusts (REITs) — 1.8% | ||
| American Homes 4 Rent, Class A |
7 |
234 |
| Host Hotels & Resorts, Inc. |
3 |
58 |
| Kimco Realty Corp. |
7 |
144 |
| Prologis, Inc. |
8 |
890 |
| SBA Communications Corp. |
1 |
237 |
| Sun Communities, Inc. |
4 |
593 |
| UDR, Inc. |
9 |
349 |
| Ventas, Inc. |
6 |
215 |
| WP Carey, Inc. |
1 |
84 |
| |
|
2,804 |
| Food & Staples Retailing — 0.2% | ||
| Costco Wholesale Corp. |
1 |
251 |
| Food Products — 0.4% | ||
| Hershey Co. (The) |
3 |
631 |
| Mondelez International, Inc., Class A |
1 |
78 |
| |
|
709 |
| Health Care Equipment & Supplies — 0.8% | ||
| Boston Scientific Corp. * |
21 |
874 |
| Intuitive Surgical, Inc. * |
1 |
312 |
| Zimmer Biomet Holdings, Inc. |
1 |
109 |
| |
|
1,295 |
| Health Care Providers & Services — 2.0% | ||
| Centene Corp. * |
6 |
476 |
| CVS Health Corp. (a) |
7 |
697 |
| Humana, Inc. |
1 |
710 |
| UnitedHealth Group, Inc. (a) |
2 |
1,238 |
| |
|
3,121 |
| INVESTMENTS |
SHARES
(000) |
VALUE ($000) |
| | ||
| | ||
| Hotels, Restaurants & Leisure — 2.2% | ||
| Booking Holdings, Inc. * |
— |
256 |
| Chipotle Mexican Grill, Inc. * |
1 |
926 |
| Hilton Worldwide Holdings, Inc. |
1 |
156 |
| Marriott International, Inc., Class A |
2 |
396 |
| McDonald's Corp. |
4 |
955 |
| Yum! Brands, Inc. (a) |
7 |
874 |
| |
|
3,563 |
| Household Products — 0.2% | ||
| Colgate-Palmolive Co. |
4 |
324 |
| Industrial Conglomerates — 1.2% | ||
| Honeywell International, Inc. (a) |
10 |
1,950 |
| Insurance — 2.3% | ||
| Globe Life, Inc. |
14 |
1,593 |
| Progressive Corp. (The) (a) |
16 |
2,053 |
| |
|
3,646 |
| Interactive Media & Services — 0.7% | ||
| Meta Platforms, Inc., Class A * (a) |
11 |
1,041 |
| Internet & Direct Marketing Retail — 1.4% | ||
| Amazon.com, Inc. * (a) |
21 |
2,149 |
| DoorDash, Inc., Class A * |
1 |
31 |
| |
|
2,180 |
| IT Services — 3.6% | ||
| Affirm Holdings, Inc. * |
23 |
458 |
| Automatic Data Processing, Inc. |
1 |
165 |
| Fiserv, Inc. * |
3 |
320 |
| FleetCor Technologies, Inc. * |
5 |
907 |
| Mastercard, Inc., Class A (a) |
9 |
3,011 |
| WEX, Inc. * |
5 |
894 |
| |
|
5,755 |
| Life Sciences Tools & Services — 1.0% | ||
| Danaher Corp. |
3 |
807 |
| Thermo Fisher Scientific, Inc. (a) |
2 |
729 |
| |
|
1,536 |
| Machinery — 2.3% | ||
| Deere & Co. (a) |
5 |
1,917 |
| Dover Corp. |
7 |
929 |
| Ingersoll Rand, Inc. |
15 |
759 |
| |
|
3,605 |
| 12 |
J.P. Morgan Specialty Funds |
October 31, 2022 |
| INVESTMENTS |
SHARES
(000) |
VALUE ($000) |
| Long Positions — continued | ||
| Common Stocks — continued | ||
| Media — 1.0% | ||
| Charter Communications, Inc., Class A * |
1 |
490 |
| Comcast Corp., Class A |
5 |
156 |
| Liberty Media Corp.-Liberty SiriusXM, Class A * |
24 |
1,000 |
| |
|
1,646 |
| Metals & Mining — 0.2% | ||
| Freeport-McMoRan, Inc. |
10 |
324 |
| Multiline Retail — 0.5% | ||
| Dollar General Corp. |
3 |
746 |
| Multi-Utilities — 1.8% | ||
| Ameren Corp. (a) |
16 |
1,247 |
| Dominion Energy, Inc. |
13 |
931 |
| Sempra Energy |
4 |
639 |
| |
|
2,817 |
| Oil, Gas & Consumable Fuels — 2.7% | ||
| ConocoPhillips |
8 |
928 |
| Coterra Energy, Inc. |
21 |
657 |
| Diamondback Energy, Inc. |
6 |
959 |
| EOG Resources, Inc. |
5 |
694 |
| Exxon Mobil Corp. |
2 |
252 |
| HF Sinclair Corp. |
4 |
251 |
| Kinder Morgan, Inc. |
25 |
457 |
| |
|
4,198 |
| Pharmaceuticals — 1.0% | ||
| Bristol-Myers Squibb Co. (a) |
15 |
1,185 |
| Elanco Animal Health, Inc. * |
26 |
339 |
| |
|
1,524 |
| Professional Services — 1.1% | ||
| Booz Allen Hamilton Holding Corp. |
5 |
612 |
| Leidos Holdings, Inc. (a) |
12 |
1,202 |
| |
|
1,814 |
| Road & Rail — 1.8% | ||
| Canadian National Railway Co. (Canada) |
2 |
268 |
| CSX Corp. |
12 |
342 |
| Knight-Swift Transportation Holdings, Inc. |
3 |
158 |
| Norfolk Southern Corp. |
3 |
598 |
| Uber Technologies, Inc. * (a) |
36 |
962 |
| Union Pacific Corp. |
3 |
541 |
| |
|
2,869 |
| INVESTMENTS |
SHARES
(000) |
VALUE ($000) |
| | ||
| | ||
| Semiconductors & Semiconductor Equipment — 6.4% | ||
| Advanced Micro Devices, Inc. * (a) |
20 |
1,228 |
| Analog Devices, Inc. |
4 |
592 |
| ASML Holding NV (Registered), NYRS (Netherlands) |
3 |
1,337 |
| Lam Research Corp. (a) |
5 |
1,968 |
| Marvell Technology, Inc. |
4 |
159 |
| NXP Semiconductors NV (China) |
19 |
2,728 |
| Taiwan Semiconductor Manufacturing Co. Ltd., ADR (Taiwan) |
10 |
592 |
| Teradyne, Inc. |
19 |
1,573 |
| |
|
10,177 |
| Software — 2.3% | ||
| Coupa Software, Inc. * |
4 |
208 |
| DocuSign, Inc. * |
1 |
69 |
| Intuit, Inc. (a) |
5 |
2,056 |
| Microsoft Corp. |
2 |
363 |
| Roper Technologies, Inc. |
2 |
763 |
| Workday, Inc., Class A * |
1 |
237 |
| |
|
3,696 |
| Specialty Retail — 1.8% | ||
| AutoZone, Inc. * |
— |
615 |
| Best Buy Co., Inc. |
5 |
328 |
| Burlington Stores, Inc. * |
2 |
318 |
| Lowe's Cos., Inc. |
4 |
736 |
| O'Reilly Automotive, Inc. * (a) |
1 |
892 |
| |
|
2,889 |
| Technology Hardware, Storage & Peripherals — 1.0% | ||
| Seagate Technology Holdings plc |
30 |
1,511 |
| Wireless Telecommunication Services — 1.0% | ||
| T-Mobile US, Inc. * |
10 |
1,586 |
| Total Common Stocks (Cost $98,884) |
|
108,633 |
| Short-Term Investments — 30.3% | ||
| Investment Companies — 19.6% | ||
| JPMorgan Prime Money Market Fund Class Institutional Shares, 3.12% (b) (c)(Cost $30,959) |
30,958 |
30,961 |
| October 31, 2022 |
J.P. Morgan Specialty Funds |
13 |
AS OF October 31, 2022 (continued)
| INVESTMENTS |
PRINCIPAL
AMOUNT
($000) |
VALUE ($000) |
| U.S. Treasury Obligations—10.7% | ||
| U.S. Treasury Bills |
|
|
| 3.62%, 12/20/2022(d) |
1 |
1 |
| 3.91%, 1/12/2023(d) |
8,570 |
8,503 |
| 3.97%, 1/26/2023(d) |
8,585 |
8,503
|
| Total U.S. Treasury Obligations (Cost $17,009) |
|
17,007 |
| Total Short-Term Investments (Cost $47,968) |
|
47,968 |
| Total Long Positions (Cost $146,852) |
|
156,601 |
| |
SHARES
(000) |
|
| Short Positions — (66.1)% | ||
| Common Stocks — (66.1)% | ||
| Aerospace & Defense — (2.5)% | ||
| Boeing Co. (The) * |
(12) |
(1,679) |
| General Dynamics Corp. |
(2) |
(332) |
| Hexcel Corp. |
(3) |
(181) |
| Huntington Ingalls Industries, Inc. |
(4) |
(1,094) |
| Lockheed Martin Corp. |
(1) |
(619) |
| |
|
(3,905) |
| Air Freight & Logistics — (0.8)% | ||
| CH Robinson Worldwide, Inc. |
(12) |
(1,146) |
| Expeditors International of Washington, Inc. |
(1) |
(133) |
| |
|
(1,279) |
| Auto Components — (0.7)% | ||
| Autoliv, Inc. (Sweden) |
(7) |
(530) |
| BorgWarner, Inc. |
(17) |
(656) |
| |
|
(1,186) |
| Automobiles — (0.1)% | ||
| Harley-Davidson, Inc. |
(3) |
(111) |
| Banks — (2.9)% | ||
| Citizens Financial Group, Inc. |
(11) |
(467) |
| Comerica, Inc. |
(9) |
(603) |
| First Republic Bank |
(7) |
(856) |
| Huntington Bancshares, Inc. |
(67) |
(1,017) |
| KeyCorp |
(53) |
(949) |
| PNC Financial Services Group, Inc. (The) |
(4) |
(661) |
| |
|
(4,553) |
| INVESTMENTS |
SHARES
(000) |
VALUE ($000) |
| | ||
| | ||
| Beverages — (0.5)% | ||
| Brown-Forman Corp., Class B |
(2) |
(146) |
| Molson Coors Beverage Co., Class B |
(12) |
(585) |
| |
|
(731) |
| Biotechnology — (2.9)% | ||
| Amgen, Inc. |
(4) |
(1,157) |
| Gilead Sciences, Inc. |
(20) |
(1,601) |
| Moderna, Inc. * |
(12) |
(1,756)
|
| |
|
(4,514) |
| Building Products — (1.7)% | ||
| Allegion plc |
(9) |
(982) |
| Johnson Controls International plc |
(27) |
(1,532) |
| Lennox International, Inc. |
— |
(103) |
| Masco Corp. |
(3) |
(125) |
| |
|
(2,742) |
| Capital Markets — (2.3)% | ||
| Franklin Resources, Inc. |
(38) |
(896) |
| Goldman Sachs Group, Inc. (The) |
(1) |
(348) |
| Moody's Corp. |
(2) |
(440) |
| Nasdaq, Inc. |
(8) |
(484) |
| Northern Trust Corp. |
(8) |
(676) |
| T. Rowe Price Group, Inc. |
(7) |
(810) |
| |
|
(3,654) |
| Chemicals — (0.9)% | ||
| Celanese Corp. |
(3) |
(258) |
| Dow, Inc. |
(10) |
(467) |
| Ecolab, Inc. |
— |
(32) |
| LyondellBasell Industries NV, Class A |
(4) |
(339) |
| Westlake Corp. |
(3) |
(291) |
| |
|
(1,387) |
| Commercial Services & Supplies — (0.1)% | ||
| Waste Management, Inc. |
(1) |
(216) |
| Communications Equipment — (1.1)% | ||
| Cisco Systems, Inc. |
(30) |
(1,374) |
| Juniper Networks, Inc. |
(14) |
(429) |
| |
|
(1,803) |
| Consumer Finance — (0.9)% | ||
| Capital One Financial Corp. |
(11) |
(1,185) |
| Synchrony Financial |
(8) |
(266) |
| |
|
(1,451) |
| 14 |
J.P. Morgan Specialty Funds |
October 31, 2022 |
| INVESTMENTS |
SHARES
(000) |
VALUE ($000) |
| Short Positions — continued | ||
| Common Stocks — continued | ||
| Containers & Packaging — (0.7)% | ||
| AptarGroup, Inc. |
(4) |
(380) |
| International Paper Co. |
(13) |
(428) |
| Packaging Corp. of America |
(1) |
(97) |
| Silgan Holdings, Inc. |
(3) |
(152) |
| |
|
(1,057) |
| Diversified Financial Services — (0.3)% | ||
| Voya Financial, Inc. |
(7) |
(464)
|
| Diversified Telecommunication Services — (0.8)% | ||
| AT&T, Inc. |
(30) |
(552) |
| Lumen Technologies, Inc. |
(80) |
(588) |
| Verizon Communications, Inc. |
(4) |
(134) |
| |
|
(1,274) |
| Electric Utilities — (2.8)% | ||
| American Electric Power Co., Inc. |
(11) |
(935) |
| Duke Energy Corp. |
(12) |
(1,103) |
| Edison International |
(16) |
(953) |
| Eversource Energy |
(5) |
(403) |
| FirstEnergy Corp. |
(3) |
(126) |
| Pinnacle West Capital Corp. |
(8) |
(514) |
| PPL Corp. |
(14) |
(374) |
| Southern Co. (The) |
(1) |
(55) |
| |
|
(4,463) |
| Electrical Equipment — (0.7)% | ||
| Acuity Brands, Inc. |
(3) |
(560) |
| Hubbell, Inc. |
(2) |
(396) |
| Sensata Technologies Holding plc |
(2) |
(95) |
| |
|
(1,051) |
| Energy Equipment & Services — (0.2)% | ||
| Schlumberger NV |
(5) |
(263) |
| Entertainment — (1.2)% | ||
| AMC Entertainment Holdings, Inc., Class A * |
(30) |
(198) |
| Electronic Arts, Inc. |
(5) |
(611) |
| ROBLOX Corp., Class A * |
(25) |
(1,113) |
| Warner Bros Discovery, Inc. * |
— |
— |
| |
|
(1,922) |
| Equity Real Estate Investment Trusts (REITs) — (2.3)% | ||
| AvalonBay Communities, Inc. |
— |
(78) |
| Digital Realty Trust, Inc. |
(4) |
(413) |
| Extra Space Storage, Inc. |
(2) |
(431) |
| INVESTMENTS |
SHARES
(000) |
VALUE ($000) |
| | ||
| | ||
| Equity Real Estate Investment Trusts (REITs) — continued | ||
| Iron Mountain, Inc. |
(17) |
(844) |
| National Retail Properties, Inc. |
(2) |
(77) |
| Orion Office REIT, Inc. |
— |
— |
| Prologis, Inc. |
— |
— |
| Simon Property Group, Inc. |
(10) |
(1,059) |
| SL Green Realty Corp. |
(15) |
(574) |
| Vornado Realty Trust |
(6) |
(142) |
| |
|
(3,618) |
| Food & Staples Retailing — (4.1)% | ||
| Kroger Co. (The) |
(59) |
(2,775) |
| Sysco Corp. |
(9) |
(812) |
| Walgreens Boots Alliance, Inc. |
(29) |
(1,043) |
| Walmart, Inc. |
(13) |
(1,928) |
| |
|
(6,558) |
| Food Products — (1.6)% | ||
| Campbell Soup Co. |
(15) |
(762) |
| Conagra Brands, Inc. |
(10) |
(361) |
| General Mills, Inc. |
(7) |
(589) |
| Kellogg Co. |
(8) |
(639) |
| Kraft Heinz Co. (The) |
(7) |
(260) |
| |
|
(2,611) |
| Gas Utilities — (0.4)% | ||
| National Fuel Gas Co. |
(10) |
(654) |
| Health Care Equipment & Supplies — (0.7)% | ||
| Stryker Corp. |
(5) |
(1,054) |
| Health Care Providers & Services — (0.7)% | ||
| Henry Schein, Inc. * |
(14) |
(962) |
| Quest Diagnostics, Inc. |
(2) |
(202) |
| |
|
(1,164) |
| Household Durables — (0.4)% | ||
| Mohawk Industries, Inc. * |
(4) |
(362) |
| NVR, Inc. * |
— |
(182) |
| PulteGroup, Inc. |
(3) |
(131) |
| |
|
(675) |
| Household Products — (0.4)% | ||
| Clorox Co. (The) |
(5) |
(713) |
| October 31, 2022 |
J.P. Morgan Specialty Funds |
15 |
AS OF October 31, 2022 (continued)
| INVESTMENTS |
SHARES
(000) |
VALUE ($000) |
| Short Positions — continued | ||
| Common Stocks — continued | ||
| Industrial Conglomerates — (2.4)% | ||
| 3M Co. |
(13) |
(1,612) |
| General Electric Co. |
(27) |
(2,127)
|
| |
|
(3,739) |
| Insurance — (2.4)% | ||
| Allstate Corp. (The) |
(7) |
(855) |
| Chubb Ltd. |
(1) |
(178) |
| Hartford Financial Services Group, Inc. (The) |
(5) |
(342) |
| Marsh & McLennan Cos., Inc. |
(1) |
(235) |
| Principal Financial Group, Inc. |
(15) |
(1,331) |
| Ryan Specialty Holdings, Inc., Class A * |
(9) |
(424) |
| WR Berkley Corp. |
(6) |
(444) |
| |
|
(3,809) |
| Interactive Media & Services — (0.3)% | ||
| Alphabet, Inc., Class A * |
(3) |
(316) |
| Alphabet, Inc., Class C * |
(3) |
(237) |
| |
|
(553) |
| Internet & Direct Marketing Retail — (0.5)% | ||
| eBay, Inc. |
(18) |
(731) |
| IT Services — (2.4)% | ||
| Cognizant Technology Solutions Corp., Class A |
(11) |
(685) |
| DXC Technology Co. * |
(1) |
(34) |
| Global Payments, Inc. |
(6) |
(674) |
| Jack Henry & Associates, Inc. |
(1) |
(217) |
| Paychex, Inc. |
(3) |
(312) |
| Shopify, Inc. (Canada), Class A * |
(20) |
(686) |
| Western Union Co. (The) |
(87) |
(1,183) |
| |
|
(3,791) |
| Life Sciences Tools & Services — (0.8)% | ||
| Agilent Technologies, Inc. |
(4) |
(540) |
| PerkinElmer, Inc. |
(1) |
(108) |
| Waters Corp. * |
(2) |
(690) |
| |
|
(1,338) |
| Machinery — (3.2)% | ||
| Caterpillar, Inc. |
(2) |
(516) |
| Donaldson Co., Inc. |
(16) |
(945) |
| IDEX Corp. |
(5) |
(1,081) |
| Illinois Tool Works, Inc. |
(4) |
(806) |
| INVESTMENTS |
SHARES
(000) |
VALUE ($000) |
| | ||
| | ||
| Machinery — continued | ||
| PACCAR, Inc. |
(7) |
(641) |
| Stanley Black & Decker, Inc. |
(14) |
(1,117)
|
| |
|
(5,106) |
| Media — (3.2)% | ||
| Interpublic Group of Cos., Inc. (The) |
(30) |
(904) |
| Omnicom Group, Inc. |
(30) |
(2,155) |
| Paramount Global, Class B |
(73) |
(1,334) |
| Sirius XM Holdings, Inc. |
(118) |
(715)
|
| |
|
(5,108) |
| Multi-Utilities — (0.8)% | ||
| Consolidated Edison, Inc. |
(8) |
(700) |
| WEC Energy Group, Inc. |
(6) |
(565) |
| |
|
(1,265) |
| Oil, Gas & Consumable Fuels — (1.8)% | ||
| Devon Energy Corp. |
(8) |
(627) |
| Enbridge, Inc. (Canada) |
(14) |
(549) |
| Hess Corp. |
(9) |
(1,305) |
| Pioneer Natural Resources Co. |
(2) |
(384) |
| |
|
(2,865) |
| Pharmaceuticals — (2.9)% | ||
| Catalent, Inc. * |
(4) |
(252) |
| Eli Lilly & Co. |
(2) |
(851) |
| Johnson & Johnson |
(4) |
(650) |
| Merck & Co., Inc. |
(12) |
(1,181) |
| Pfizer, Inc. |
(16) |
(756) |
| Zoetis, Inc. |
(5) |
(839) |
| |
|
(4,529) |
| Professional Services — (1.1)% | ||
| Equifax, Inc. |
(4) |
(737) |
| TransUnion |
(7) |
(413) |
| Verisk Analytics, Inc. |
(3) |
(563) |
| |
|
(1,713) |
| Road & Rail — (0.6)% | ||
| Canadian Pacific Railway Ltd. (Canada) |
(1) |
(50) |
| Heartland Express, Inc. |
(21) |
(322) |
| JB Hunt Transport Services, Inc. |
(2) |
(314) |
| Werner Enterprises, Inc. |
(5) |
(204) |
| |
|
(890) |
| 16 |
J.P. Morgan Specialty Funds |
October 31, 2022 |
| INVESTMENTS |
SHARES
(000) |
VALUE ($000) |
| Short Positions — continued | ||
| Common Stocks — continued | ||
| Semiconductors & Semiconductor Equipment — (2.5)% | ||
| Intel Corp. |
(46) |
(1,315) |
| Microchip Technology, Inc. |
(14) |
(865) |
| QUALCOMM, Inc. |
(11) |
(1,262) |
| Skyworks Solutions, Inc. |
(6) |
(487) |
| |
|
(3,929) |
| Software — (1.3)% | ||
| Ceridian HCM Holding, Inc. * |
(12) |
(826) |
| Oracle Corp. |
(1) |
(91) |
| Paycom Software, Inc. * |
(3) |
(896) |
| Salesforce, Inc. * |
(2) |
(256) |
| |
|
(2,069) |
| Specialty Retail — (0.3)% | ||
| CarMax, Inc. * |
(4) |
(225) |
| Williams-Sonoma, Inc. |
(1) |
(179) |
| |
|
(404) |
| Technology Hardware, Storage & Peripherals — (4.3)% | ||
| Apple, Inc. |
(26) |
(4,047) |
| Dell Technologies, Inc., Class C |
(6) |
(249) |
| Hewlett Packard Enterprise Co. |
(49) |
(694) |
| HP, Inc. |
(18) |
(495) |
| NetApp, Inc. |
(18) |
(1,214) |
| Xerox Holdings Corp. |
(5) |
(77) |
| |
|
(6,776) |
| Textiles, Apparel & Luxury Goods — (0.2)% | ||
| VF Corp. |
(12) |
(340) |
| INVESTMENTS |
SHARES
(000) |
VALUE ($000) |
| | ||
| | ||
| Trading Companies & Distributors — (0.4)% | ||
| Fastenal Co. |
(12) |
(558)
|
| Total Common Stocks (Proceeds $(110,785)) |
|
(104,586) |
| Total Short Positions (Proceeds $(110,785)) |
|
(104,586) |
| Total Investments — 32.8% (Cost $36,067) |
|
52,015 |
| Other Assets Less Liabilities — 67.2% |
|
106,331 |
| Net Assets — 100.0% |
|
158,346 |
| Percentages indicated are based on net assets. | ||
| Amounts presented as a dash ("-") represent amounts that round to less than a thousand. |
| Abbreviations |
|
| ADR |
American Depositary Receipt |
| NYRS |
New York Registry Shares |
| * |
Non-income producing security. |
| (a) |
All or a portion of this security is segregated as collateral for short sales. The total value of securities and cash segregated as collateral is $19,759 and $105,856, respectively. |
| (b) |
Investment in an affiliated fund, which is registered under the Investment Company Act of 1940, as amended, and is advised by J.P. Morgan Investment Management Inc. |
| (c) |
The rate shown is the current yield as of October 31, 2022. |
| (d) |
The rate shown is the effective yield as of October 31, 2022.
|
| DESCRIPTION |
NUMBER OF
CONTRACTS |
EXPIRATION DATE |
TRADING CURRENCY |
NOTIONAL
AMOUNT ($) |
VALUE AND
UNREALIZED APPRECIATION
(DEPRECIATION) ($) |
| Short Contracts |
|
|
|
|
|
| S&P 500 E-Mini Index |
(3) |
12/16/2022 |
USD |
(582) |
(1) |
| Abbreviations |
|
| USD |
United States Dollar |
| October 31, 2022 |
J.P. Morgan Specialty Funds |
17 |
AS OF October 31, 2022
(Amounts in thousands, except per share amounts)
| |
JPMorgan
Opportunistic
Equity
Long/Short Fund |
JPMorgan
Research Market Neutral Fund |
| ASSETS: |
|
|
| Investments in non-affiliates, at value |
$292,042 |
$125,640 |
| Investments in affiliates, at value |
176,262 |
30,961 |
| Cash |
2 |
— |
| Deposits at broker for futures contracts |
— |
210 |
| Deposits at broker for securities sold short |
146,489 |
105,856 |
| Receivables: |
|
|
| Investment securities sold |
18,766 |
3,293 |
| Fund shares sold |
230 |
244 |
| Interest from non-affiliates |
235 |
206 |
| Dividends from non-affiliates |
— |
59 |
| Dividends from affiliates |
380 |
141 |
| Variation margin on futures contracts |
— |
11 |
| Total Assets |
634,406 |
266,621 |
| LIABILITIES: |
|
|
| Payables: |
|
|
| Securities sold short, at value |
149,733 |
104,586 |
| Dividend expense to non-affiliates on securities sold short |
139 |
58 |
| Investment securities purchased |
1,233 |
3,365 |
| Fund shares redeemed |
1,614 |
105 |
| Accrued liabilities: |
|
|
| Investment advisory fees |
457 |
33 |
| Administration fees |
30 |
7 |
| Distribution fees |
7 |
5 |
| Service fees |
60 |
31 |
| Custodian and accounting fees |
7 |
8 |
| Other |
120 |
77 |
| Total Liabilities |
153,400 |
108,275 |
| Net Assets |
$481,006 |
$158,346
|
| 18 |
J.P. Morgan Specialty Funds |
October 31, 2022 |
| |
JPMorgan
Opportunistic
Equity
Long/Short Fund |
JPMorgan
Research Market Neutral Fund |
| NET ASSETS: |
|
|
| Paid-in-Capital |
$525,885
|
$177,209 |
| Total distributable earnings (loss) |
(44,879)
|
(18,863) |
| Total Net Assets |
$481,006 |
$158,346
|
| Net Assets: |
|
|
| Class A |
$14,837
|
$19,898 |
| Class C |
4,799 |
1,476 |
| Class I |
265,338 |
136,972 |
| Class R6 |
196,032 |
— |
| Total |
$481,006 |
$158,346
|
| Outstanding units of beneficial interest (shares) ($0.0001 par value; unlimited number of shares authorized): |
|
|
| Class A |
854 |
1,647 |
| Class C |
290 |
137 |
| Class I |
14,930 |
10,570 |
| Class R6 |
10,800 |
— |
| Net Asset Value (a): |
|
|
| Class A — Redemption price per share |
$17.38 |
$12.08 |
| Class C — Offering price per share (b) |
16.56 |
10.74 |
| Class I — Offering and redemption price per share |
17.77 |
12.96 |
| Class R6 — Offering and redemption price per share |
18.15 |
— |
| Class A maximum sales charge |
5.25% |
5.25% |
| Class A maximum public offering price per share [net asset value per share/(100% – maximum sales charge)] |
$18.34 |
$12.75
|
| Cost of investments in non-affiliates |
$274,416 |
$115,893 |
| Cost of investments in affiliates |
176,262 |
30,959 |
| Proceeds from securities sold short |
145,365 |
110,785 |
| October 31, 2022 |
J.P. Morgan Specialty Funds |
19 |
FOR THE YEAR ENDED October 31, 2022
(Amounts in thousands)
| |
JPMorgan
Opportunistic
Equity
Long/Short Fund |
JPMorgan
Research Market Neutral Fund |
| INVESTMENT INCOME: |
|
|
| Interest income from non-affiliates |
$— |
$10 |
| Interest income from affiliates |
9 |
4 |
| Interest income from non-affiliates on securities sold short |
1,003 |
646 |
| Dividend income from non-affiliates |
3,716 |
1,307 |
| Dividend income from affiliates |
2,471 |
442 |
| Total investment income |
7,199 |
2,409 |
| EXPENSES: |
|
|
| Investment advisory fees |
7,486 |
429 |
| Administration fees |
468 |
92 |
| Distribution fees: |
|
|
| Class A |
63 |
48 |
| Class C |
44 |
9 |
| Service fees: |
|
|
| Class A |
63 |
48 |
| Class C |
15 |
3 |
| Class I |
839 |
256 |
| Custodian and accounting fees |
41 |
41 |
| Interest expense to affiliates |
—(a) |
— |
| Professional fees |
90 |
63 |
| Trustees’ and Chief Compliance Officer’s fees |
27 |
26 |
| Printing and mailing costs |
68 |
4 |
| Registration and filing fees |
81 |
43 |
| Transfer agency fees (See Note 2.I.) |
19 |
6 |
| Dividend expense to non-affiliates on securities sold short |
3,898 |
2,219 |
| Other |
45 |
16 |
| Total expenses |
13,247 |
3,303 |
| Less fees waived |
(421)
|
(225) |
| Net expenses |
12,826 |
3,078 |
| Net investment income (loss) |
(5,627)
|
(669) |
| 20 |
J.P. Morgan Specialty Funds |
October 31, 2022 |
| |
JPMorgan
Opportunistic
Equity
Long/Short Fund |
JPMorgan
Research Market Neutral Fund |
| REALIZED/UNREALIZED GAINS (LOSSES): |
|
|
| Net realized gain (loss) on transactions from: |
|
|
| Investments in non-affiliates |
$(17,275) |
$2,645 |
| Investments in affiliates |
(90) |
(14) |
| Options purchased |
(72) |
— |
| Futures contracts |
— |
(367) |
| Securities sold short |
(14,308)
|
(1,423) |
| Net realized gain (loss) |
(31,745)
|
841 |
| Change in net unrealized appreciation/depreciation on: |
|
|
| Investments in non-affiliates |
(88,697) |
(13,499) |
| Investments in affiliates |
—(a) |
(1) |
| Options purchased |
(21) |
— |
| Futures contracts |
— |
6 |
| Securities sold short |
(4,487)
|
10,054 |
| Change in net unrealized appreciation/depreciation |
(93,205)
|
(3,440) |
| Net realized/unrealized gains (losses) |
(124,950)
|
(2,599) |
| Change in net assets resulting from operations |
$(130,577) |
$(3,268) |
| October 31, 2022 |
J.P. Morgan Specialty Funds |
21 |
FOR THE PERIODS INDICATED
(Amounts in thousands)
| |
JPMorgan
Opportunistic Equity Long/Short Fund |
JPMorgan
Research Market Neutral Fund | ||
| |
Year Ended
October 31, 2022 |
Year Ended
October 31, 2021 |
Year Ended
October 31, 2022 |
Year Ended
October 31, 2021 |
| CHANGE IN NET ASSETS RESULTING FROM OPERATIONS: |
|
|
|
|
| Net investment income (loss) |
$(5,627) |
$(11,007) |
$(669) |
$(1,566) |
| Net realized gain (loss) |
(31,745) |
78,034 |
841 |
5,737 |
| Change in net unrealized appreciation/depreciation |
(93,205)
|
42,356 |
(3,440)
|
(2,033) |
| Change in net assets resulting from operations |
(130,577)
|
109,383 |
(3,268)
|
2,138 |
| DISTRIBUTIONS TO SHAREHOLDERS: |
|
|
|
|
| Class A |
(3,030) |
(918) |
— |
(1,124) |
| Class C |
(702) |
(222) |
— |
(159) |
| Class I |
(38,675) |
(10,347) |
— |
(6,901) |
| Class R6 |
(29,311)
|
(9,883)
|
— |
— |
| Total distributions to shareholders |
(71,718)
|
(21,370)
|
— |
(8,184) |
| CAPITAL TRANSACTIONS: |
|
|
|
|
| Change in net assets resulting from capital transactions |
(62,353)
|
172,125 |
69,424 |
(43,203) |
| NET ASSETS: |
|
|
|
|
| Change in net assets |
(264,648) |
260,138 |
66,156 |
(49,249) |
| Beginning of period |
745,654 |
485,516 |
92,190 |
141,439 |
| End of period |
$481,006 |
$745,654 |
$158,346 |
$92,190
|
| 22 |
J.P. Morgan Specialty Funds |
October 31, 2022 |
| |
JPMorgan
Opportunistic Equity Long/Short Fund |
JPMorgan
Research Market Neutral Fund | ||
| |
Year Ended
October 31, 2022 |
Year Ended
October 31, 2021 |
Year Ended
October 31, 2022 |
Year Ended October
31, 2021 |
| CAPITAL TRANSACTIONS: |
|
|
|
|
| Class A |
|
|
|
|
| Proceeds from shares issued |
$3,909
|
$16,519
|
$8,418
|
$6,793 |
| Distributions reinvested |
2,956 |
913 |
— |
1,075 |
| Cost of shares redeemed |
(14,110)
|
(11,337)
|
(4,824)
|
(8,506) |
| Change in net assets resulting from Class A capital transactions |
(7,245)
|
6,095 |
3,594 |
(638) |
| Class C |
|
|
|
|
| Proceeds from shares issued |
516 |
2,019 |
521 |
417 |
| Distributions reinvested |
692 |
218 |
— |
159 |
| Cost of shares redeemed |
(1,555)
|
(537)
|
(218)
|
(1,175) |
| Change in net assets resulting from Class C capital transactions |
(347)
|
1,700 |
303 |
(599) |
| Class I |
|
|
|
|
| Proceeds from shares issued |
159,788 |
242,796 |
119,488 |
41,158 |
| Distributions reinvested |
38,027 |
10,199 |
— |
6,758 |
| Cost of shares redeemed |
(221,285)
|
(124,700)
|
(53,961)
|
(89,882) |
| Change in net assets resulting from Class I capital transactions |
(23,470)
|
128,295 |
65,527 |
(41,966) |
| Class R6 |
|
|
|
|
| Proceeds from shares issued |
71,118 |
76,310 |
— |
— |
| Distributions reinvested |
6,999 |
2,265 |
— |
— |
| Cost of shares redeemed |
(109,408)
|
(42,540)
|
— |
— |
| Change in net assets resulting from Class R6 capital transactions |
(31,291)
|
36,035 |
— |
— |
| Total change in net assets resulting from capital transactions |
$(62,353) |
$172,125 |
$69,424 |
$(43,203) |
| SHARE TRANSACTIONS: |
|
|
|
|
| Class A |
|
|
|
|
| Issued |
188 |
742 |
683 |
559 |
| Reinvested |
139 |
43 |
— |
90 |
| Redeemed |
(764)
|
(512)
|
(395)
|
(689) |
| Change in Class A Shares |
(437)
|
273 |
288 |
(40) |
| Class C |
|
|
|
|
| Issued |
27 |
94 |
48 |
37 |
| Reinvested |
34 |
11 |
— |
15 |
| Redeemed |
(82)
|
(25)
|
(20)
|
(109) |
| Change in Class C Shares |
(21)
|
80 |
28 |
(57) |
| Class I |
|
|
|
|
| Issued |
7,897 |
10,786 |
9,115 |
3,149 |
| Reinvested |
1,747 |
471 |
— |
532 |
| Redeemed |
(11,277)
|
(5,539)
|
(4,127)
|
(6,877) |
| Change in Class I Shares |
(1,633)
|
5,718 |
4,988 |
(3,196) |
| October 31, 2022 |
J.P. Morgan Specialty Funds |
23 |
FOR THE PERIODS INDICATED (continued)
(Amounts in thousands)
| |
JPMorgan
Opportunistic Equity Long/Short Fund |
JPMorgan Research Market Neutral
Fund | ||
| |
Year Ended
October 31, 2022 |
Year Ended
October 31, 2021 |
Year Ended
October 31, 2022 |
Year Ended October
31, 2021 |
| SHARE TRANSACTIONS: (continued) |
|
|
|
|
| Class R6 |
|
|
|
|
| Issued |
3,442 |
3,324 |
— |
— |
| Reinvested |
315 |
103 |
— |
— |
| Redeemed |
(5,591)
|
(1,866)
|
— |
— |
| Change in Class R6 Shares |
(1,834)
|
1,561 |
— |
— |
| 24 |
J.P. Morgan Specialty Funds |
October 31, 2022 |
FOR THE PERIODS INDICATED
| |
Per share
operating performance | ||||||
| |
|
Investment
operations |
Distributions
| ||||
| |
Net asset
value,
beginning
of period |
Net
investment
income
(loss)(a) |
Net realized
and unrealized
gains
(losses) on
investments |
Total from
investment
operations |
Net
investment
income |
Net
realized
gain |
Total
distributions |
| JPMorgan Opportunistic Equity Long/Short Fund |
|
|
|
|
|
|
|
| Class A |
|
|
|
|
|
|
|
| Year Ended October 31, 2022 |
$23.65 |
$(0.25)
|
$(3.70)
|
$(3.95)
|
$—
|
$(2.32)
|
$(2.32) |
| Year Ended October 31, 2021 |
20.54 |
(0.46) |
4.46 |
4.00 |
— |
(0.89) |
(0.89) |
| Year Ended October 31, 2020 |
17.34 |
(0.29) |
3.49 |
3.20 |
— |
— |
— |
| Year Ended October 31, 2019 |
18.22 |
—(f) |
(0.55) |
(0.55) |
— |
(0.33) |
(0.33) |
| Year Ended October 31, 2018 |
18.13 |
(0.21) |
0.53 |
0.32 |
— |
(0.23) |
(0.23) |
| Class C |
|
|
|
|
|
|
|
| Year Ended October 31, 2022 |
22.75 |
(0.32) |
(3.55) |
(3.87) |
— |
(2.32) |
(2.32) |
| Year Ended October 31, 2021 |
19.88 |
(0.56) |
4.32 |
3.76 |
— |
(0.89) |
(0.89) |
| Year Ended October 31, 2020 |
16.87 |
(0.39) |
3.40 |
3.01 |
— |
— |
— |
| Year Ended October 31, 2019 |
17.83 |
(0.08) |
(0.55) |
(0.63) |
— |
(0.33) |
(0.33) |
| Year Ended October 31, 2018 |
17.83 |
(0.29) |
0.52 |
0.23 |
— |
(0.23) |
(0.23) |
| Class I |
|
|
|
|
|
|
|
| Year Ended October 31, 2022 |
24.08 |
(0.20) |
(3.79) |
(3.99) |
— |
(2.32) |
(2.32) |
| Year Ended October 31, 2021 |
20.84 |
(0.42) |
4.55 |
4.13 |
— |
(0.89) |
(0.89) |
| Year Ended October 31, 2020 |
17.58 |
(0.27) |
3.56 |
3.29 |
(0.03) |
— |
(0.03) |
| Year Ended October 31, 2019 |
18.43 |
0.07 |
(0.59) |
(0.52) |
— |
(0.33) |
(0.33) |
| Year Ended October 31, 2018 |
18.28 |
(0.16) |
0.54 |
0.38 |
— |
(0.23) |
(0.23) |
| Class R6 |
|
|
|
|
|
|
|
| Year Ended October 31, 2022 |
24.48 |
(0.15) |
(3.86) |
(4.01) |
— |
(2.32) |
(2.32) |
| Year Ended October 31, 2021 |
21.13 |
(0.37) |
4.61 |
4.24 |
— |
(0.89) |
(0.89) |
| Year Ended October 31, 2020 |
17.83 |
(0.21) |
3.59 |
3.38 |
(0.08) |
— |
(0.08) |
| Year Ended October 31, 2019 |
18.63 |
0.17 |
(0.64) |
(0.47) |
— |
(0.33) |
(0.33) |
| Year Ended October 31, 2018 |
18.44 |
(0.12) |
0.54 |
0.42 |
— |
(0.23) |
(0.23) |
| | |
| (a) |
Calculated based upon average shares outstanding. |
| (b) |
Includes adjustments in accordance with accounting principles generally accepted in the United States of America and as such, the net asset values for financial
reporting purposes and the returns based upon those net asset values may differ from the net asset values
and returns for shareholder transactions. |
| (c) |
Includes earnings credits and interest expense, if applicable, each of which is less than 0.005% unless otherwise noted. |
| (d) |
|
| |
October 31, 2022 |
October 31, 2021 |
October 31, 2020 |
October 31, 2019 |
October 31, 2018 |
| Net expenses (excluding dividend and interest expense for securities sold short) |
|
|
|
|
|
| Class A |
1.77% |
1.82% |
1.81% |
1.79% |
1.82% |
| Class C |
2.27% |
2.31% |
2.32% |
2.28% |
2.32% |
| Class I |
1.53% |
1.57% |
1.57% |
1.53% |
1.57% |
| Class R6 |
1.26% |
1.31% |
1.31% |
1.29% |
1.32% |
| Expenses without waivers and reimbursements (excluding dividend and interest expense for securities sold short) |
|
|
|
|
|
| Class A |
1.83% |
1.83% |
1.86% |
1.90% |
1.90% |
| Class C |
2.34% |
2.32% |
2.38% |
2.39% |
2.40% |
| Class I |
1.59% |
1.58% |
1.61% |
1.64% |
1.65% |
| Class R6 |
1.33% |
1.32% |
1.35% |
1.39% |
1.38% |
| | |
| (e) |
Interest expense on securities sold short is 0.21%. |
| (f) |
Amount rounds to less than $0.005. |
| (g) |
Amount rounds to less than 0.005%. |
| 26 |
J.P. Morgan Specialty Funds |
October 31, 2022 |
| |
Ratios/Supplemental data | ||||||
| |
|
|
Ratios to average net assets | ||||
| Net asset
value,
end of
period |
Total return
(excludes
sales charge)(b) |
Net assets,
end of
period
(000's) |
Net
expenses
(including dividend
and interest expense
for securities sold
short)(c)(d) |
Net
investment
income
(loss) |
Expenses without
waivers,
reimbursements,
and earnings
credits
(including dividend
and interest expense
for securities sold
short)(d) |
Portfolio
turnover rate
(excluding securities
sold short) |
Portfolio
turnover rate
(including securities
sold short) |
| |
|
|
|
|
|
|
|
| |
|
|
|
|
|
|
|
| $17.38
|
(18.53)% |
$14,837
|
2.40% |
(1.26)% |
2.46% |
943% |
1,864% |
| 23.65 |
19.94 |
30,516 |
2.66(e) |
(2.08) |
2.67 |
548 |
1,013 |
| 20.54 |
18.45 |
20,914 |
2.28 |
(1.54) |
2.33 |
511 |
1,058 |
| 17.34 |
(3.10) |
19,352 |
2.25 |
0.00(g) |
2.36 |
636 |
1,232 |
| 18.22 |
1.80 |
50,803 |
2.55 |
(1.11) |
2.63 |
548 |
995 |
| |
|
|
|
|
|
|
|
| 16.56 |
(18.95) |
4,799 |
2.89 |
(1.71) |
2.96 |
943 |
1,864 |
| 22.75 |
19.37 |
7,079 |
3.15(e) |
(2.57) |
3.16 |
548 |
1,013 |
| 19.88 |
17.84 |
4,596 |
2.79 |
(2.12) |
2.85 |
511 |
1,058 |
| 16.87 |
(3.62) |
2,599 |
2.74 |
(0.45) |
2.85 |
636 |
1,232 |
| 17.83 |
1.32 |
3,544 |
3.05 |
(1.61) |
3.13 |
548 |
995 |
| |
|
|
|
|
|
|
|
| 17.77 |
(18.35) |
265,338 |
2.15 |
(1.00) |
2.21 |
943 |
1,864 |
| 24.08 |
20.28 |
398,771 |
2.41(e) |
(1.84) |
2.42 |
548 |
1,013 |
| 20.84 |
18.71 |
226,048 |
2.04 |
(1.38) |
2.08 |
511 |
1,058 |
| 17.58 |
(2.89) |
132,665 |
1.99 |
0.40 |
2.10 |
636 |
1,232 |
| 18.43 |
2.12 |
151,261 |
2.30 |
(0.87) |
2.38 |
548 |
995 |
| |
|
|
|
|
|
|
|
| 18.15 |
(18.11) |
196,032 |
1.89 |
(0.73) |
1.96 |
943 |
1,864 |
| 24.48 |
20.54 |
309,288 |
2.15(e) |
(1.57) |
2.16 |
548 |
1,013 |
| 21.13 |
19.01 |
233,958 |
1.78 |
(1.09) |
1.82 |
511 |
1,058 |
| 17.83 |
(2.59) |
164,419 |
1.75 |
0.91 |
1.85 |
636 |
1,232 |
| 18.63 |
2.32 |
56,436 |
2.05 |
(0.66) |
2.11 |
548 |
995 |
| October 31, 2022 |
J.P. Morgan Specialty Funds |
27 |
FOR THE PERIODS INDICATED
| |
Per share
operating performance | ||||
| |
|
Investment
operations |
Distributions
| ||
| |
Net asset
value,
beginning
of period |
Net
investment
income
(loss)(a) |
Net realized
and unrealized
gains
(losses) on
investments |
Total from
investment
operations |
Net
realized
gain |
| JPMorgan Research Market Neutral Fund |
|
|
|
|
|
| Class A |
|
|
|
|
|
| Year Ended October 31, 2022 |
$12.41 |
$(0.10)
|
$(0.23)
|
$(0.33)
|
$— |
| Year Ended October 31, 2021 |
13.01 |
(0.21) |
0.52 |
0.31 |
(0.91) |
| Year Ended October 31, 2020 |
13.11 |
(0.20) |
1.59 |
1.39 |
(1.49) |
| Year Ended October 31, 2019 |
14.29 |
(0.04) |
0.31 |
0.27 |
(1.45) |
| Year Ended October 31, 2018 |
14.69 |
(0.11) |
0.10 |
(0.01) |
(0.39) |
| Class C |
|
|
|
|
|
| Year Ended October 31, 2022 |
11.09 |
(0.14) |
(0.21) |
(0.35) |
— |
| Year Ended October 31, 2021 |
11.77 |
(0.25) |
0.48 |
0.23 |
(0.91) |
| Year Ended October 31, 2020 |
12.06 |
(0.23) |
1.43 |
1.20 |
(1.49) |
| Year Ended October 31, 2019 |
13.32 |
(0.10) |
0.29 |
0.19 |
(1.45) |
| Year Ended October 31, 2018 |
13.79 |
(0.17) |
0.09 |
(0.08) |
(0.39) |
| Class I |
|
|
|
|
|
| Year Ended October 31, 2022 |
13.28 |
(0.06) |
(0.26) |
(0.32) |
— |
| Year Ended October 31, 2021 |
13.82 |
(0.20) |
0.57 |
0.37 |
(0.91) |
| Year Ended October 31, 2020 |
13.80 |
(0.19) |
1.70 |
1.51 |
(1.49) |
| Year Ended October 31, 2019 |
14.93 |
—(f) |
0.32 |
0.32 |
(1.45) |
| Year Ended October 31, 2018 |
15.30 |
(0.07) |
0.09 |
0.02 |
(0.39) |
| | |
| (a) |
Calculated based upon average shares outstanding. |
| (b) |
Includes adjustments in accordance with accounting principles generally accepted in the United States of America and as such, the net asset values for financial
reporting purposes and the returns based upon those net asset values may differ from the net asset values
and returns for shareholder transactions. |
| (c) |
Includes earnings credits and interest expense, if applicable, each of which is less than 0.005% unless otherwise noted. |
| (d) |
|
| |
October 31, 2022 |
October 31, 2021 |
October 31, 2020 |
October 31, 2019 |
October 31, 2018 |
| Net expenses (excluding dividend and interest expense for securities sold short) |
|
|
|
|
|
| Class A |
0.92% |
0.93% |
1.08% |
1.22% |
1.22% |
| Class C |
1.41% |
1.43% |
1.60% |
1.73% |
1.73% |
| Class I |
0.65% |
0.68% |
0.76% |
0.96% |
0.96% |
| Expenses without waivers and reimbursements (excluding dividend and interest expense for securities sold short) |
|
|
|
|
|
| Class A |
1.10% |
1.16% |
1.46% |
1.62% |
1.55% |
| Class C |
1.60% |
1.67% |
1.95% |
2.09% |
2.02% |
| Class I |
0.84% |
0.89% |
1.13% |
1.32% |
1.25% |
| | |
| (e) |
Interest expense on securities sold short is 0.16%. |
| (f) |
Amount rounds to less than $0.005. |
| 28 |
J.P. Morgan Specialty Funds |
October 31, 2022 |
| |
Ratios/Supplemental data | ||||||
| |
|
|
Ratios to average net assets | ||||
| Net asset
value,
end of
period |
Total return
(excludes
sales charge)(b) |
Net assets,
end of
period
(000's) |
Net
expenses
(including dividend
expense for
securities sold
short)(c)(d)
|
Net
investment
income
(loss) |
Expenses without
waivers,
reimbursements,
and earnings
credits
(including dividend
expense for
securities sold
short)(d) |
Portfolio
turnover rate
(excluding securities
sold short) |
Portfolio
turnover rate
(including securities
sold short) |
| |
|
|
|
|
|
|
|
| |
|
|
|
|
|
|
|
| $12.08
|
(2.66)% |
$19,898
|
2.77% |
(0.86)% |
2.95% |
100% |
252% |
| 12.41 |
2.72 |
16,867 |
2.99(e) |
(1.77) |
3.22 |
119 |
307 |
| 13.01 |
11.97 |
18,205 |
3.23 |
(1.57) |
3.61 |
224 |
531 |
| 13.11 |
2.01 |
14,276 |
3.69 |
(0.26) |
4.09 |
125 |
356 |
| 14.29 |
(0.01) |
14,973 |
3.50 |
(0.73) |
3.83 |
131 |
252 |
| |
|
|
|
|
|
|
|
| 10.74 |
(3.16) |
1,476 |
3.27 |
(1.31) |
3.46 |
100 |
252 |
| 11.09 |
2.29 |
1,211 |
3.49(e) |
(2.25) |
3.73 |
119 |
307 |
| 11.77 |
11.36 |
1,949 |
3.75 |
(2.00) |
4.10 |
224 |
531 |
| 12.06 |
1.52 |
3,731 |
4.20 |
(0.74) |
4.56 |
125 |
356 |
| 13.32 |
(0.53) |
6,155 |
4.01 |
(1.26) |
4.30 |
131 |
252 |
| |
|
|
|
|
|
|
|
| 12.96 |
(2.41) |
136,972 |
2.45 |
(0.48) |
2.64 |
100 |
252 |
| 13.28 |
3.01 |
74,112 |
2.74(e) |
(1.50) |
2.95 |
119 |
307 |
| 13.82 |
12.26 |
121,285 |
2.91 |
(1.42) |
3.28 |
224 |
531 |
| 13.80 |
2.27 |
27,694 |
3.43 |
0.01 |
3.79 |
125 |
356 |
| 14.93 |
0.20 |
34,927 |
3.24 |
(0.47) |
3.53 |
131 |
252 |
| October 31, 2022 |
J.P. Morgan Specialty Funds |
29 |
AS OF October 31, 2022
(Dollar values in thousands)
| |
Classes Offered |
Diversification Classification |
| JPMorgan Opportunistic Equity Long/Short Fund |
Class A, Class C, Class I and Class R6 |
Non-Diversified |
| JPMorgan Research Market Neutral Fund |
Class A, Class C and Class I |
Diversified |
| 30 |
J.P. Morgan Specialty Funds |
October 31, 2022 |
| Opportunistic Equity Long/Short
Fund |
|
|
|
|
| |
Level 1
Quoted prices |
Level 2
Other significant
observable inputs |
Level 3
Significant
unobservable inputs |
Total |
| Total Investments in Securities
(a) |
$468,304 |
$— |
$— |
$468,304
|
| Total Liabilities for Securities Sold Short (a) |
$(149,733) |
$— |
$— |
$(149,733) |
| | |
| (a) |
Please refer to the SOI for specifics of portfolio holdings. |
| Research Market Neutral Fund |
|
|
|
|
| |
Level 1
Quoted prices |
Level 2
Other significant
observable inputs |
Level 3
Significant
unobservable inputs |
Total |
| Investments in Securities |
|
|
|
|
| Common Stocks |
$108,633 |
$— |
$— |
$108,633 |
| Short-Term Investments |
|
|
|
|
| Investment Companies |
30,961 |
— |
— |
30,961 |
| U.S. Treasury Obligations |
— |
17,007 |
— |
17,007 |
| Total Short-Term Investments |
30,961 |
17,007 |
— |
47,968 |
| Total Investments in Securities
|
$139,594 |
$17,007 |
$— |
$156,601
|
| Liabilities |
|
|
|
|
| Common Stocks |
$(104,586) |
$— |
$— |
$(104,586) |
| Total Liabilities for Securities Sold Short |
$(104,586) |
$— |
$— |
$(104,586) |
| Depreciation in Other Financial Instruments |
|
|
|
|
| Futures Contracts |
$(1) |
$— |
$— |
$(1) |
| October 31, 2022 |
J.P. Morgan Specialty Funds |
31 |
AS OF October 31, 2022 (continued)
(Dollar values in thousands)
| Opportunistic Equity Long/Short
Fund | |||||||||
| For the year ended October 31, 2022 | |||||||||
| Security Description |
Value at
October 31,
2021 |
Purchases at
Cost |
Proceeds from
Sales |
Net Realized
Gain (Loss) |
Change in
Unrealized
Appreciation/
(Depreciation) |
Value at
October 31,
2022 |
Shares at
October 31,
2022 |
Dividend
Income |
Capital Gain Distributions |
| JPMorgan Prime Money Market Fund Class Institutional Shares, 3.12% (a) (b) |
$119,946 |
$2,529,517 |
$2,473,111 |
$(90) |
$—(c) |
$176,262 |
176,245 |
$2,471 |
$—
|
| | |
| (a) |
Investment in an affiliated fund, which is registered under the Investment Company Act of 1940, as amended, and is advised by J.P. Morgan
Investment Management Inc. |
| (b) |
The rate shown is the current yield as of October 31, 2022. |
| (c) |
Amount rounds to less than one thousand. |
| 32 |
J.P. Morgan Specialty Funds |
October 31, 2022 |
| Research Market Neutral
Fund | |||||||||
| For the year ended October 31, 2022 | |||||||||
| Security Description |
Value at
October 31,
2021 |
Purchases at
Cost |
Proceeds from
Sales |
Net Realized
Gain (Loss) |
Change in
Unrealized
Appreciation/
(Depreciation) |
Value at
October 31,
2022 |
Shares at
October 31,
2022 |
Dividend
Income |
Capital Gain Distributions |
| JPMorgan Prime Money Market Fund Class Institutional Shares, 3.12% (a) (b) |
$9,752 |
$201,411 |
$180,187 |
$(14) |
$(1) |
$30,961 |
30,958 |
$442 |
$—
|
| | |
| (a) |
Investment in an affiliated fund, which is registered under the Investment Company Act of 1940, as amended, and is advised by J.P. Morgan
Investment Management Inc. |
| (b) |
The rate shown is the current yield as of October 31, 2022. |
| October 31, 2022 |
J.P. Morgan Specialty Funds |
33 |
AS OF October 31, 2022 (continued)
(Dollar values in thousands)
| 34 |
J.P. Morgan Specialty Funds |
October 31, 2022 |
| |
Opportunistic
Equity Long/
Short Fund |
Research
Market Neutral Fund |
| Futures Contracts: |
|
|
| Average Notional Balance Long |
$— |
$2,463 |
| Average Notional Balance Short |
— |
(1,411) |
| Ending Notional Balance Short |
— |
(582) |
| Exchange-Traded Options: |
|
|
| Average Number of Contracts Purchased |
44 |
— |
| October 31, 2022 |
J.P. Morgan Specialty Funds |
35 |
AS OF October 31, 2022 (continued)
(Dollar values in thousands)
| |
Class A |
Class C |
Class I |
Class R6 |
Total |
| Opportunistic Equity Long/Short Fund |
|
|
|
|
|
| Transfer agency fees |
$1 |
$—(a) |
$17 |
$1 |
$19 |
| Research Market Neutral Fund |
|
|
|
|
|
| Transfer agency fees |
3 |
—(a) |
3 |
n/a |
6 |
| | |
| (a) |
Amount rounds to less than one thousand. |
| |
Paid-in-Capital |
Accumulated
undistributed
(distributions in
excess of)
net investment
income |
Accumulated
net realized gains (losses) |
| Opportunistic Equity Long/Short Fund |
$(1,574)
|
$2,839 |
$(1,265) |
| Research Market Neutral Fund |
(1,545) |
1,565 |
(20) |
| 36 |
J.P. Morgan Specialty Funds |
October 31, 2022 |
| |
|
| Opportunistic Equity Long/Short Fund |
1.20%(1)
|
| Research Market Neutral Fund |
0.35 |
| | |
| (1) |
Effective November 1, 2022, the investment advisory fees changed to 1.05%. |
| |
Class A |
Class C |
| Opportunistic Equity Long/Short Fund |
0.25% |
0.75% |
| Research Market Neutral Fund |
0.25 |
0.75 |
| |
Front-End Sales Charge |
CDSC |
| Opportunistic Equity Long/Short Fund |
$3
|
$— |
| Research Market Neutral Fund |
—(a) |
— |
| | |
| (a) |
Amount rounds to less than one thousand. |
| |
Class A |
Class C |
Class I |
| Opportunistic Equity Long/Short Fund |
0.25% |
0.25% |
0.25% |
| Research Market Neutral Fund |
0.25 |
0.25 |
0.25 |
| October 31, 2022 |
J.P. Morgan Specialty Funds |
37 |
AS OF October 31, 2022 (continued)
(Dollar values in thousands)
| |
Class A |
Class C |
Class I |
Class R6 |
| Opportunistic Equity Long/Short Fund |
1.85%
(1) |
2.35%
(1) |
1.60%
(1) |
1.35%(1) |
| Research Market Neutral Fund |
0.95 |
1.45 |
0.69 |
n/a |
| | |
| (1) |
Effective November 1, 2022, the contractual expense limitation changed to 1.35%, 1.85%, 1.10% and 1.05% for Class A, Class C, Class I, and
Class R6, respectively. |
| |
Contractual
Waivers | |||
| |
Investment
Advisory Fees |
Administration
Fees |
Service
Fees |
Total |
| Opportunistic Equity Long/Short Fund |
$2
|
$2
|
$2 |
$6 |
| Research Market Neutral Fund |
103 |
63 |
7 |
173 |
| |
|
| Opportunistic Equity Long/Short Fund |
$414 |
| Research Market Neutral Fund |
51 |
| |
|
| Opportunistic Equity Long/Short Fund |
$1 |
| Research Market Neutral Fund |
1 |
| 38 |
J.P. Morgan Specialty Funds |
October 31, 2022 |
| |
Purchases
(excluding
U.S. Government) |
Sales
(excluding
U.S. Government) |
Securities
Sold Short |
Covers on
Securities Sold Short |
| Opportunistic Equity Long/Short Fund |
$3,691,442
|
$3,901,355
|
$3,641,372 |
$3,604,893 |
| Research Market Neutral Fund |
127,625 |
89,641 |
139,119 |
97,691 |
| |
Aggregate
Cost |
Gross
Unrealized
Appreciation |
Gross
Unrealized
Depreciation |
Net Unrealized
Appreciation (Depreciation) |
| Opportunistic Equity Long/Short Fund * |
$323,867 |
$16,587 |
$21,883
|
$(5,296) |
| Research Market Neutral Fund * |
42,881 |
20,435 |
11,302 |
9,133 |
| | |
| * |
The tax cost includes the proceeds from short sales which may result in a net negative cost. |
| |
Ordinary
Income* |
Net
Long-Term
Capital Gains |
Total
Distributions Paid |
| Opportunistic Equity Long/Short Fund |
$45,818
|
$25,900 |
$71,718 |
| |
|
|
|
| | |
| * |
Short-term gain distributions are treated as ordinary income for income tax purposes. |
| |
Ordinary
Income* |
Net
Long-Term
Capital Gains |
Total
Distributions Paid |
| Opportunistic Equity Long/Short Fund |
$17,977
|
$3,393 |
$21,370 |
| Research Market Neutral Fund |
1,657 |
6,527 |
8,184 |
| | |
| * |
Short-term gain distributions are treated as ordinary income for income tax purposes. |
| October 31, 2022 |
J.P. Morgan Specialty Funds |
39 |
AS OF October 31, 2022 (continued)
(Dollar values in thousands)
| |
Current
Distributable
Long-Term
Capital Gain
(Tax Basis Capital
Loss Carryover) |
Unrealized
Appreciation (Depreciation) |
| Opportunistic Equity Long/Short Fund |
$(36,767)
|
$(5,296) |
| Research Market Neutral Fund |
(27,620) |
9,092 |
| |
Capital Loss Carryforward Character |
| |
Short-Term |
| Opportunistic Equity Long/Short Fund |
$36,767 |
| Research Market Neutral Fund |
27,620* |
| | |
| * |
Amount includes capital loss carryforwards which are limited in future years under Internal Revenue Code sections 381-384. |
| |
Late Year Ordinary Loss Deferral |
| | |
| Opportunistic Equity Long/Short Fund |
$2,783 |
| Research Market Neutral Fund |
288 |
| |
Capital Loss
Utilized |
| |
Short-Term |
| Research Market Neutral Fund |
$1,595 |
| 40 |
J.P. Morgan Specialty Funds |
October 31, 2022 |
| |
Number of
Individual Shareholder
and/or Non-Affiliated
Omnibus Accounts |
% of the Fund |
| Opportunistic Equity Long/Short Fund |
4 |
68.4% |
| Research Market Neutral Fund |
4 |
58.1 |
| October 31, 2022 |
J.P. Morgan Specialty Funds |
41 |
AS OF October 31, 2022 (continued)
(Dollar values in thousands)
| 42 |
J.P. Morgan Specialty Funds |
October 31, 2022 |
| October 31, 2022 |
J.P. Morgan Specialty Funds |
43 |
(Unaudited)
| Name (Year of Birth); Positions With the Funds (1) |
Principal Occupation
During Past 5 Years |
Number of
Funds in Fund
Complex Overseen
by Trustee (2) |
Other Directorships Held During the Past 5 Years |
| Independent Trustees |
|
|
|
| John F. Finn (1947); Chair since 2020; Trustee since 1998. |
Chairman, Gardner, Inc. (supply chain management company serving industrial and consumer markets) (serving in various roles 1974-present). |
166 |
Director, Greif, Inc. (GEF) (industrial package products and services) (2007-present); Trustee, Columbus Association for the Performing Arts (1988-present). |
| Stephen P. Fisher (1959); Trustee since 2018. |
Retired; Chairman and Chief Executive Officer, NYLIFE Distributors LLC (registered broker-dealer) (serving in various roles 2008-2013); Chairman, NYLIM Service Company LLC (transfer agent) (2008-2017); New York Life Investment Management LLC (registered investment adviser) (serving in various roles 2005-2017); Chairman, IndexIQ Advisors LLC (registered investment adviser for ETFs) (2014-2017); President, MainStay VP Funds Trust (2007-2017), MainStay DefinedTerm Municipal Opportunities Fund (2011-2017) and MainStay Funds Trust (2007-2017) (registered investment companies). |
166 |
Honors Program Advisory Board Member, The Zicklin School of Business, Baruch College, The City University of New York (2017-present). |
| Gary L. French (1951); Trustee since 2014. |
Real Estate Investor (2011-2020); Investment management industry Consultant and Expert Witness (2011-present); Senior Consultant for The Regulatory Fundamentals Group LLC (2011-2017). |
166 |
Independent Trustee, The China Fund, Inc. (2013-2019); Exchange Traded Concepts Trust II (2012-2014); Exchange Traded Concepts Trust I (2011-2014). |
| Kathleen M. Gallagher (1958); Trustee since 2018. |
Retired; Chief Investment Officer — Benefit Plans, Ford Motor Company (serving in various roles 1985-2016). |
166 |
Non- Executive Director, Legal & General Investment Management (Holdings) (2018-present); Non-Executive Director, Legal & General Investment Management America (U.S. Holdings) (financial services and insurance) (2017-present); Advisory Board Member, State Street Global Advisors Total Portfolio Solutions (2017-present); Member, Client Advisory Council, Financial Engines, LLC (registered investment adviser) (2011-2016); Director, Ford Pension Funds Investment Management Ltd. (2007-2016). |
| Robert J. Grassi (1957); Trustee since 2014. |
Sole Proprietor, Academy Hills Advisors LLC (2012-present); Pension Director, Corning Incorporated (2002-2012). |
166 |
None |
| 44 |
J.P. Morgan Specialty Funds |
October 31, 2022 |
| Name (Year of Birth); Positions With the Funds (1) |
Principal Occupation
During Past 5 Years |
Number of
Funds in Fund
Complex Overseen
by Trustee (2) |
Other Directorships Held During the Past 5 Years |
| Frankie D. Hughes (1952); Trustee since 2008. |
President, Ashland Hughes Properties (property management) (2014-present); President and Chief Investment Officer, Hughes Capital Management, Inc. (fixed income asset management) (1993-2014). |
166 |
None |
| Raymond Kanner (1953); Trustee since 2017. |
Retired; Managing Director and Chief Investment Officer, IBM Retirement Funds (2007-2016). |
166 |
Advisory Board Member, Penso Advisors, LLC (2020-present); Advisory Board Member, Los Angeles Capital (2018-present); Advisory Board Member, State Street Global Advisors Total Portfolio Solutions (2017- present); Acting Executive Director, Committee on Investment of Employee Benefit Assets (CIEBA) (2016-2017); Advisory Board Member, Betterment for Business (robo advisor) (2016- 2017); Advisory Board Member, BlueStar Indexes (index creator) (2013-2017); Director, Emerging Markets Growth Fund (registered investment company) (1997-2016); Member, Russell Index Client Advisory Board (2001-2015). |
| Thomas P. Lemke (1954); Trustee since 2014. |
Retired since 2013. |
166 |
(1) Independent Trustee of Advisors’ Inner Circle III fund platform, consisting of the following: (i) the Advisors’ Inner Circle Fund III, (ii) the Gallery Trust, (iii) the Schroder Series Trust, (iv) the Delaware Wilshire Private Markets Fund (since 2020), (v) Chiron Capital Allocation Fund Ltd., and (vi) formerly the Winton Diversified Opportunities Fund (2014-2018); and (2) Independent Trustee of the Symmetry Panoramic Trust (since 2018). |
| Lawrence R. Maffia (1950); Trustee since 2014 |
Retired; Director and President, ICI Mutual Insurance Company (2006-2013). |
166 |
Director, ICI Mutual Insurance Company (1999-2013). |
| Mary E. Martinez (1960); Vice Chair since 2021; Trustee since 2013. |
Associate, Special Properties, a Christie’s International Real Estate Affiliate (2010-present); Managing Director, Bank of America (asset management) (2007-2008); Chief Operating Officer, U.S. Trust Asset Management, U.S. Trust Company (asset management) (2003-2007); President, Excelsior Funds (registered investment companies) (2004-2005). |
166 |
None |
| Marilyn McCoy (1948); Trustee since 2005. |
Vice President of Administration and Planning, Northwestern University (1985-present). |
166 |
None |
| October 31, 2022 |
J.P. Morgan Specialty Funds |
45 |
(Unaudited) (continued)
| Name (Year of Birth); Positions With the Funds (1) |
Principal Occupation
During Past 5 Years |
Number of
Funds in Fund
Complex Overseen
by Trustee (2) |
Other Directorships Held During the Past 5 Years |
| Dr. Robert A. Oden, Jr. (1946); Trustee
since 2005. |
Retired; President, Carleton College (2002-2010); President, Kenyon College (1995-2002). |
166 |
Trustee, The Coldwater Conservation Fund (2017-present); Trustee, American Museum of Fly Fishing (2013-present); Trustee and Vice Chair, Trout Unlimited (2017-2021);Trustee, Dartmouth- Hitchcock MedicalCenter (2011-2020). |
| Marian U. Pardo* (1946); Trustee since 2013. |
Managing Director and Founder, Virtual Capital Management LLC (investment consulting) (2007-present); Managing Director, Credit Suisse Asset Management (portfolio manager) (2003-2006). |
166 |
Board Chair and Member, Board of Governors, Columbus Citizens Foundation (not-for-profit supporting philanthropic and cultural programs) (2006-present). |
| Emily A. Youssouf (1951); Trustee since 2022. |
Adjunct Professor (2011-present) and Clinical Professor (2009-2011), NYU Schack Institute of Real Estate; Board Member and Member of the Audit Committee (2013–present), Chair of Finance Committee (2019-present), Member of Related Parties Committee (2013-2018) and Member of the Enterprise Risk Committee (2015-2018), PennyMac Financial Services, Inc.; Board Member (2005-2018), Chair of Capital Committee (2006-2016), Chair of Audit Committee (2005-2018), Member of Finance Committee (2005-2018) and Chair of IT Committee (2016-2018), NYC Health and Hospitals Corporation. |
166 |
Trustee, NYC School Construction Authority (2009-present); Board Member, NYS Job Development Authority (2008-present); Trustee and Chair of the Audit Committee of the Transit Center Foundation (2015-2019). |
| Interested Trustees |
|
|
|
| Robert F. Deutsch** (1957); Trustee since 2014. |
Retired; Head of ETF Business for JPMorgan Asset Management (2013-2017); Head of Global Liquidity Business for JPMorgan Asset Management (2003-2013). |
166 |
Treasurer and Director of the JUST Capital Foundation (2017-present). |
| Nina O. Shenker** (1957); Trustee since 2022. |
Vice Chair (2017-2021), General Counsel and Managing Director (2008-2016), Associate General Counsel and Managing Director (2004-2008), J.P. Morgan Asset & Wealth Management. |
166 |
Director and Member of Legal and Human Resources Subcommittees, American Jewish Joint Distribution Committee (2018-present). |
| | |||
| (1) |
The year shown is the first year in which a Trustee became a member of any of the following: the Mutual Fund Board, the ETF Board, the
heritage J.P. Morgan Funds or the heritage One Group Mutual Funds. Trustees serve an indefinite term,
until resignation, retirement, removal or death. The Board’s current retirement
policy sets retirement at the end of the calendar year in which the Trustee attains the age of 75, provided that any Board member who was a member of the Mutual Fund Board prior to January 1, 2022 and was born prior to January 1, 1950 shall retire
from the Board at the end of the calendar year in which the Trustee attains the age of 78.
| ||
| (2) |
A Fund Complex means two or more registered investment companies that hold themselves out to investors as related companies for purposes
of investment and investor services or have a common investment adviser or have an investment adviser
that is an affiliated person of the investment adviser of any of the other registered
investment companies. The J.P. Morgan Funds Complex for which the Board of Trustees serves
currently includes nine registered investment companies (166 J.P. Morgan Funds). | ||
| * |
In connection with prior employment with JPMorgan Chase, Ms. Pardo was the recipient of non-qualified pension plan payments from JPMorgan
Chase in the amount of approximately $2,055 per month, which she irrevocably waived effective January 1,
2013, and deferred compensation payments from JPMorgan Chase in the amount of approximately
$7,294 per year, which ended in January 2013. In addition, Ms. Pardo receives payments from
a fully-funded qualified plan, which is not an obligation of JPMorgan Chase. | ||
| ** |
Designation as an “Interested Trustee” is based on prior employment by the Adviser or an affiliate of the Adviser or interests in a control person
of the Adviser. | ||
| 46 |
J.P. Morgan Specialty Funds |
October 31, 2022 |
| |
The contact address for each of the Trustees is 277 Park Avenue, New York, NY 10172. | ||
| October 31, 2022 |
J.P. Morgan Specialty Funds |
47 |
(Unaudited)
| Name (Year of Birth), Positions Held with the Trust (Since) |
Principal Occupations During Past 5 Years |
| Brian S. Shlissel (1964), President and Principal Executive Officer (2016)* |
Managing Director and Chief Administrative Officer for J.P. Morgan pooled vehicles, J.P. Morgan Investment
Management Inc. since 2014. |
| Timothy J. Clemens (1975), Treasurer and Principal Financial Officer (2018) |
Executive Director, J.P. Morgan Investment Management Inc. since February 2016. Mr. Clemens has been with
J.P. Morgan Investment Management Inc. since 2013. |
| Gregory S. Samuels (1980), Secretary (2019) (formerly Assistant
Secretary 2010-2019)** |
Managing Director and Assistant General Counsel, JPMorgan Chase & Co. Mr. Samuels has been with
JPMorgan Chase & Co. since 2010. |
| Stephen M. Ungerman (1953), Chief Compliance Officer (2005) |
Managing Director, JPMorgan Chase & Co. Mr. Ungerman has been with JPMorgan Chase & Co. since 2000. |
| Kiesha Astwood-Smith (1973), Assistant Secretary (2021)** |
Vice President and Assistant General Counsel, JPMorgan Chase & Co. since June 2021; Senior Director and
Counsel, Equitable Financial Life Insurance Company (formerly, AXA Equitable Life Insurance Company) from
September 2015 through June 2021. |
| Matthew Beck (1988), Assistant Secretary (2021)*** |
Vice President and Assistant General Counsel, JPMorgan Chase & Co. since May 2021; Senior Legal Counsel,
Ultimus Fund Solutions from May 2018 through May 2021; General Counsel, The Nottingham Company from
April 2014 through May 2018. |
| Elizabeth A. Davin (1964), Assistant Secretary (2005)*** |
Executive Director and Assistant General Counsel, JPMorgan Chase & Co. Ms. Davin has been with JPMorgan
Chase & Co. (formerly Bank One Corporation) since 2004. |
| Jessica K. Ditullio (1962) Assistant Secretary (2005)*** |
Executive Director and Assistant General Counsel, JPMorgan Chase & Co. Ms. Ditullio has been with JPMorgan
Chase & Co. (formerly Bank One Corporation) since 1990. |
| Anthony Geron (1971), Assistant Secretary (2018)** |
Vice President and Assistant General Counsel, JPMorgan Chase & Co. since September 2018; Lead Director
and Counsel, AXA Equitable Life Insurance Company from 2015 to 2018 and Senior Director and Counsel, AXA
Equitable Life Insurance Company from 2014 to 2015. |
| Carmine Lekstutis (1980), Assistant Secretary (2011)** |
Executive Director and Assistant General Counsel, JPMorgan Chase & Co. Mr. Lekstutis has been with
JPMorgan Chase & Co. since 2011. |
| Max Vogel (1990), Assistant Secretary (2021)** |
Vice President and Assistant General Counsel, JPMorgan Chase & Co. since June 2021; Associate, Proskauer
Rose LLP (law firm) from March 2017 to June 2021. |
| Zachary E. Vonnegut-Gabovitch (1986),
Assistant Secretary (2017)** |
Vice President and Assistant General Counsel, JPMorgan Chase & Co. since September 2016. |
| Michael M. D’Ambrosio (1969), Assistant Treasurer (2012) |
Managing Director, J.P. Morgan Investment Management Inc. Mr. D’Ambrosio has been with J.P. Morgan
Investment Management Inc. since 2012. |
| Aleksandr Fleytekh (1972), Assistant Treasurer (2019) |
Vice President, J.P. Morgan Investment Management Inc. since February 2012. |
| Shannon Gaines (1977), Assistant Treasurer (2018)*** |
Vice President, J.P. Morgan Investment Management Inc. since January 2014. |
| Jeffrey D. House (1972), Assistant Treasurer (2017)*** |
Vice President, J.P. Morgan Investment Management Inc. since July 2006. |
| Michael Mannarino (1985), Assistant Treasurer (2020) |
Vice President, J.P. Morgan Investment Management Inc. since 2014. |
| Joseph Parascondola (1963), Assistant Treasurer (2011)* |
Executive Director, J.P. Morgan Investment Management, Inc. Mr. Parascondola has been with J.P. Morgan
Investment Management Inc. since 2006. |
| Gillian I. Sands (1969), Assistant Treasurer (2012) |
Executive Director, J.P. Morgan Investment Management Inc. Ms. Sands has been with J.P. Morgan Investment
Management Inc. since 2012. |
| | |
| The contact address for each of the officers, unless otherwise noted, is 277 Park Avenue, New York, NY 10172. |
| 48 |
J.P. Morgan Specialty Funds |
October 31, 2022 |
| * |
The contact address for the officer is 575 Washington Boulevard, Jersey City, NJ 07310. |
| ** |
The contact address for the officer is 4 New York Plaza, New York, NY 10004. |
| *** |
The contact address for the officer is 1111 Polaris Parkway, Columbus, OH 43240. |
| October 31, 2022 |
J.P. Morgan Specialty Funds |
49 |
(Unaudited)
Hypothetical $1,000 Investment
| |
Beginning
Account Value
May 1, 2022 |
Ending
Account Value
October 31, 2022 |
Expenses
Paid During
the Period* |
Annualized
Expense Ratio |
| JPMorgan Opportunistic Equity Long/Short Fund |
|
|
|
|
| Class A |
|
|
|
|
| Actual |
$1,000.00
|
$933.90
|
$10.92 |
2.24% |
| Hypothetical |
1,000.00 |
1,013.91 |
11.37 |
2.24 |
| Class C |
|
|
|
|
| Actual |
1,000.00 |
931.40 |
13.29 |
2.73 |
| Hypothetical |
1,000.00 |
1,011.44 |
13.84 |
2.73 |
| Class I |
|
|
|
|
| Actual |
1,000.00 |
934.80 |
9.66 |
1.98 |
| Hypothetical |
1,000.00 |
1,015.22 |
10.06 |
1.98 |
| Class R6 |
|
|
|
|
| Actual |
1,000.00 |
936.00 |
8.44 |
1.73 |
| Hypothetical |
1,000.00 |
1,016.48 |
8.79 |
1.73 |
| JPMorgan Research Market Neutral Fund |
|
|
|
|
| Class A |
|
|
|
|
| Actual |
1,000.00 |
1,000.80 |
12.76 |
2.53 |
| Hypothetical |
1,000.00 |
1,012.45 |
12.83 |
2.53 |
| Class C |
|
|
|
|
| Actual |
1,000.00 |
998.10 |
15.16 |
3.01 |
| Hypothetical |
1,000.00 |
1,010.03 |
15.25 |
3.01 |
| Class I |
|
|
|
|
| Actual |
1,000.00 |
1,002.30 |
11.15 |
2.21 |
| Hypothetical |
1,000.00 |
1,014.06 |
11.22 |
2.21 |
| | |
| * |
Expenses are equal to each Class’ respective annualized expense ratio, multiplied by the average account value over the period, multiplied by
184/365 (to reflect the one-half year period). |
| 50 |
J.P. Morgan Specialty Funds |
October 31, 2022 |
(Unaudited)
| |
|
51 |
(Unaudited)
| 52 |
|
|
| |
|
53 |
(Unaudited)
| 54 |
|
|
(Unaudited)
(Dollar values in thousands)
| |
Long-Term
Capital Gain Distribution |
| JPMorgan Opportunistic Equity Long/Short Fund |
$25,900 |
| October 31, 2022 |
J.P. Morgan Specialty Funds |
55 |
| FACT |
WHAT DOES J.P. MORGAN FUNDS DO WITH YOUR PERSONAL INFORMATION? |
| Why? |
Financial companies choose how they share your personal information. Federal law gives consumers
the right to limit some but not all sharing. Federal law also requires us to tell you
how we collect, share, and protect your personal information. Please read
this notice carefully to understand what we do. |
| What? |
The types of personal information we collect and share depend on the product or service you have
with us. This information can include: |
| |
○Social Security number and account balances |
| |
○transaction history and account transactions |
| |
○checking account information and wire transfer instructions |
| |
When you are no longer our customer, we continue to share your information as described in this notice. |
| How? |
All financial companies need to share customers’ personal information to run
their everyday business. In the section below, we list the reasons
financial companies can share their customers’ personal
information; the reasons J.P. Morgan Funds chooses to share; and whether you can limit this sharing. |
| Reasons we can share your personal information |
Does J.P. Morgan Funds share? |
Can you limit this sharing? |
| For our everyday business purposes — such as to process your transactions, maintain your account(s), respond to court orders and legal investigations, or report to credit bureaus |
Yes |
No |
| For marketing purposes — to offer our products and services to you |
Yes |
No |
| For joint marketing with other financial companies |
No |
We don't share |
| For our affiliates’ everyday business purposes — information about your transactions and experiences |
No |
We don't share |
| For our affiliates’ everyday business purposes — information about your creditworthiness |
No |
We don't share |
| For nonaffiliates to market to you |
No |
We don't share |
| Questions? Call 1-800-480-4111 or go to
www.jpmorganfunds.com |
|

| Who we are | |
| Who is providing this notice? |
J.P. Morgan Funds |
| What we do | |
| How does J.P. Morgan Funds protect my personal information? |
To protect your personal information from unauthorized access and use, we use security measures
that comply with federal law. These measures include computer safeguards and secured
files and buildings. We authorize our employees to access your
information only when they need it to do their work and we require
companies that work for us to protect your information. |
| | |
| How does J.P. Morgan Funds
protect my personal
information? |
We collect your personal information, for example, when you: |
| ○open an account or provide contact information | |
| ○give us your account information or pay us by check |
|
| ○make a wire transfer | |
| We also collect your personal information from others, such as credit bureaus, affiliates and other
companies. | |
| | |
| Why can’t I limit all sharing? |
Federal law gives you the right to limit only: |
| ○sharing for affiliates’ everyday business purposes – information
about your creditworthiness | |
| ○affiliates from using your information to market to you | |
| ○sharing for nonaffiliates to market to you | |
| State laws and individual companies may give you additional rights to limit sharing. | |
| Definitions | |
| Affiliates |
Companies related by common ownership or control. They can be financial and nonfinancial
companies. |
| |
○J.P. Morgan Funds does not share with our
affiliates. |
| | |
| Nonaffiliates |
Companies not related by common ownership or control. They can be financial and nonfinancial
companies. |
| |
○J.P. Morgan Funds does not share with nonaffiliates so they
can market to you. |
| | |
| Joint Marketing |
A formal agreement between nonaffiliated financial companies that together market financial
products or services to you. |
| |
○J.P. Morgan Funds doesn’t jointly market.
|

ITEM 2. CODE OF ETHICS.
Disclose whether, as of the end of the period covered by the report, the registrant has adopted a code of ethics that applies to the registrant’s principal executive officer, principal financial officer, principal accounting officer or controller, or persons performing similar functions, regardless of whether these individuals are employed by the registrant or a third party. If the registrant has not adopted such a code of ethics, explain why it has not done so.
The registrant must briefly describe the nature of any amendment, during the period covered by the report, to a provision of its code of ethics that applies to the registrant’s principal executive officer, principal financial officer, principal accounting officer or controller, or persons performing similar functions, regardless of whether these individuals are employed by the registrant or a third party, and that relates to any element of the code of ethics definition enumerated in paragraph (b) of this Item. The registrant must file a copy of any such amendment as an exhibit pursuant to Item 13(a)(1), unless the registrant has elected to satisfy paragraph (f) of this Item by positing its code of ethics on its website pursuant to paragraph (f)(2) of this Item, or by undertaking to provide its code of ethics to any person without charge, upon request, pursuant to paragraph (f)(3) of this Item.
If the registrant has, during the period covered by the report, granted a waiver, including an implicit waiver, from a provision of the code of ethics that applies to the registrant’s principal executive officer, principal financial officer, principal accounting officer or controller, or persons performing similar functions, regardless of whether these individuals are employed by the registrant or third party, that relates to one or more items set forth in paragraph (b) of this Item, the registrant must briefly describe the nature of the waiver, the name of the person to whom the waiver was granted, and the date of the waiver.
The Registrant has adopted a code of ethics that applies to the Registrant’s principal executive officer and principal financial officer. There were no amendments to the code of ethics or waivers granted with respect to the code of ethics in the period covered by the report.
ITEM 3. AUDIT COMMITTEE FINANCIAL EXPERT.
(a) (1) Disclose that the registrant’s board of directors has determined that the registrant either:
(i) Has at least one audit committee financial expert serving on its audit committee; or
(ii) Does not have an audit committee financial expert serving on its audit committee.
The Registrant’s Board of Trustees has determined that the Registrant has at least one audit committee financial expert serving on its audit committee. The Securities and Exchange Commission has stated that the designation or identification of a person as an audit committee financial expert pursuant to this Item 3 of Form N-CSR does not impose on such person any duties, obligations or liabilities that are greater than the duties, obligations and liabilities imposed on such person as a member of the Audit Committee and the Board of Trustees in the absence of such designation or identification.
(2) If the registrant provides the disclosure required by paragraph (a)(1)(i) of this Item, it must disclose the name of the audit committee financial expert and whether that person is “independent.” In order to be considered “independent” for purposes of this Item, a member of an audit committee may not, other than in his or her capacity as a member of the audit committee, the board of directors, or any other board committee:
(i) Accept directly or indirectly any consulting, advisory, or other compensatory fee from the issuer; or
(ii) Be an “interested person” of the investment company as defined in Section 2(a)(19) of the Act (15 U.S.C. 80a-2(a)(19)).
The Audit committee financial expert is Kathleen M. Gallagher. Ms. Gallagher is not an “interested person” of the Registrant and is also “independent” as defined by the U.S. Securities and Exchange Commission for the purposes of the audit committee financial expert determination.
(3) If the registrant provides the disclosure required by paragraph (a)(1)(ii) of this Item, it must explain why it does not have an audit committee financial expert.
Not applicable.
ITEM 4. PRINCIPAL ACCOUNTANT FEES AND SERVICES.
(a) Disclose, under the caption Audit Fees, the aggregate fees billed for each of the last two fiscal years for professional
services rendered by the principal accountant for the audit of the registrant’s annual financial statements or services that are normally provided by the accountant in connection with statutory and regulatory filings or engagements for those fiscal years.
AUDIT FEES
2022 – $103,423
2021 – $238,801
(b) Disclose, under the caption Audit-Related Fees, the aggregate fees billed in each of the last two fiscal years for assurance and related services by the principal accountant that are reasonably related to the performance of the audit of the registrant’s financial statements and are not reported under paragraph (a) of this Item. Registrants shall describe the nature of the services comprising the fees disclosed under this category.
AUDIT-RELATED FEES
2022 – $23,754
2021 – $35,724
Audit-related fees consists of semi-annual financial statement reviews and security count procedures performed as required under Rule 17f-2 of the Investment Company Act of 1940 during the Registrant’s fiscal year.
(c) Disclose, under the caption Tax Fees, the aggregate fees billed in each of the last two fiscal years for professional services rendered by the principal accountant for tax compliance, tax advice, and tax planning. Registrants shall describe the nature of the services comprising the fees disclosed under this category.
TAX FEES
2022 – $47,282
2021 – $63,749
The tax fees consist of fees billed in connection with preparing the federal regulated investment company income tax returns for the Registrant for the tax years ended October 31, 2022 and 2021, respectively.
For the last fiscal year, no tax fees were required to be approved pursuant to paragraph (c)(7)(ii) of Rule 2-01 of Regulation S-X.
(d) Disclose, under the caption All Other Fees, the aggregate fees billed in each of the last two fiscal years for products and services provided by the principal accountant, other than the services reported in paragraphs (a) through (c) of this Item. Registrants shall describe the nature of the services comprising the fees disclosed under this category.
ALL OTHER FEES
2022 – Not applicable
2021 – Not applicable
(e) (1) Disclose the audit committee’s pre-approval policies and procedures described in paragraph (c)(7) of Rule 2-01 of Regulation S-X.
Pursuant to the Registrant’s Audit Committee Charter and written policies and procedures for the pre-approval of audit and non-audit services (the “Pre-approval Policy”), the Audit Committee pre-approves all audit and non-audit services performed by the Registrant’s independent public registered accounting firm for the Registrant. In addition, the Audit Committee pre-approves the auditor’s engagement for non-audit services with the Registrant’s investment adviser (not including a sub-adviser whose role is primarily portfolio management and is sub-contracted or overseen by another investment adviser) and any Service Affiliate in accordance with paragraph (c)(7)(ii) of Rule 2-01 of Regulation S-X, if the engagement relates directly to the operations and financial reporting of the Registrant. Proposed services may be pre-approved either 1) without consideration of specific case-by-case services or 2) require the specific pre-approval of the Audit Committee. Therefore, initially the Pre-approval Policy listed a number of audit and non-audit services that have been approved by the Audit Committee, or which were not subject to pre-approval under the transition provisions of Sarbanes-Oxley Act of 2002 (the “Pre-approval List”). The Audit Committee annually reviews and pre-approves the services included on the Pre-approval List
that may be provided by the independent public registered accounting firm without obtaining additional specific pre-approval of individual services from the Audit Committee. The Audit Committee adds to, or subtracts from, the list of general pre-approved services from time to time, based on subsequent determinations. All other audit and non-audit services not on the Pre-approval List must be specifically pre-approved by the Audit Committee.
One or more members of the Audit Committee may be appointed as the Committee’s delegate for the purposes of considering whether to approve such services. Any pre-approvals granted by the delegate will be reported, for informational purposes only, to the Audit Committee at its next scheduled meeting. The Audit Committee’s responsibilities to pre-approve services performed by the independent public registered accounting firm are not delegated to management.
(2) Disclose the percentage of services described in each of paragraphs (b) through (d) of this Item that were approved by the audit committee pursuant to paragraph (c)(7)(i)(C) of Rule 2-01 of Regulation S-X.
2022 – 0.0%
2021 – 0.0%
(f) If greater than 50 percent, disclose the percentage of hours expended on the principal accountant’s engagement to audit the registrant’s financial statements for the most recent fiscal year that were attributed to work performed by persons other than the principal accountant’s full-time, permanent employees.
Not applicable – Less than 50%.
(g) Disclose the aggregate non-audit fees billed by the registrant’s accountant for services rendered to the registrant, and rendered to the registrant’s investment adviser (not including any sub-adviser whose role is primarily portfolio management and is subcontracted with or overseen by another investment adviser), and any entity controlling, controlled by, or under common control with the adviser that provides ongoing services to the registrant for each of the last two fiscal years of the registrant.
The aggregate non-audit fees billed by the independent registered public accounting firm for services rendered to the Registrant, and rendered to Service Affiliates, for the last two calendar year ends were:
2021 – $ 30.6 million
2020 – $ 30.1 million
(h) Disclose whether the registrant’s audit committee of the board of directors has considered whether the provision of non-audit services that were rendered to the registrant’s investment adviser (not including any subadviser whose role is primarily portfolio management and is subcontracted with or overseen by another investment adviser), and any entity controlling, controlled by, or under common control with the investment adviser that provides ongoing services to the registrant that were not pre-approved pursuant to paragraph (c)(7)(ii) of Rule 2-01 of Regulation S-X is compatible with maintaining the principal accountant’s independence.
The Registrant’s Audit Committee has considered whether the provision of the non-audit services that were rendered to Service Affiliates that were not pre-approved (not requiring pre-approval) is compatible with maintaining the independent public registered accounting firm’s independence. All services provided by the independent public registered accounting firm to the Registrant or to Service Affiliates that were required to be pre-approved were pre-approved as required.
(i) A registrant identified by the Commission pursuant to Section 104(i)(2)(A) of the Sarbanes-Oxley Act of 2002 (15 U.S.C. 7214(i)(2)(A)), as having retained, for the preparation of the audit report on its financial statements included in the Form NCSR, a registered public accounting firm that has a branch or office that is located in a foreign jurisdiction and that the Public Company Accounting Oversight Board has determined it is unable to inspect or investigate completely because of a position taken by an authority in the foreign jurisdiction must electronically submit to the Commission on a supplemental basis documentation that establishes that the registrant is not owned or controlled by a governmental entity in the foreign jurisdiction. The registrant must submit this documentation on or before the due date for this form. A registrant that is owned or controlled by a foreign governmental entity is not required to submit such documentation.
Not applicable.
(j) A registrant that is a foreign issuer, as defined in 17 CFR 240.3b-4, identified by the Commission pursuant to Section 104(i)(2)(A) of the Sarbanes-Oxley Act of 2002 (15 U.S.C. 7214(i)(2)(A)), as having retained, for the preparation of the audit report on its financial statements included in the Form N-CSR, a registered public accounting firm that has a branch or office that is located in a foreign jurisdiction and that the Public Company Accounting Oversight Board has determined it is unable to inspect or investigate completely because of a position taken by an authority in the foreign jurisdiction, for each year in which the registrant is so identified, must provide the below disclosures. Also, any such identified foreign issuer that uses a variable-interest entity or any similar structure that
results in additional foreign entities being consolidated in the financial statements of the registrant is required to provide the below disclosures for itself and its consolidated foreign operating entity or entities. A registrant must disclose:
| (1) | That, for the immediately preceding annual financial statement period, a registered public accounting firm that the PCAOB was unable to inspect or investigate completely, because of a position taken by an authority in the foreign jurisdiction, issued an audit report for the registrant; |
| (2) | The percentage of shares of the registrant owned by governmental entities in the foreign jurisdiction in which the registrant is incorporated or otherwise organized; |
| (3) | Whether governmental entities in the applicable foreign jurisdiction with respect to that registered public accounting firm have a controlling financial interest with respect to the registrant; |
| (4) | The name of each official of the Chinese Communist Party who is a member of the board of directors of the registrant or the operating entity with respect to the registrant; and |
| (5) | Whether the articles of incorporation of the registrant (or equivalent organizing document) contains any charter of the Chinese Communist Party, including the text of any such charter. |
Not applicable.
ITEM 5. AUDIT COMMITTEE OF LISTED REGISTRANTS.
(a) If the registrant is a listed issuer as defined in Rule 10A-3 under the Exchange Act (17CFR 240.10A-3), state whether or not the registrant has a separately-designated standing audit committee established in accordance with Section 3(a)(58)(A) of the Exchange Act (15 U.S.C. 78c(a)(58)(A)). If the registrant has such a committee, however designated, identify each committee member. If the entire board of directors is acting as the registrant’s audit committee as specified in Section 3(a)(58)(B) of the Exchange Act (15 U.S.C. 78c(a)(58)(B)), so state.
(b) If applicable, provide the disclosure required by Rule 10A-3(d) under the Exchange Act (17CFR 240.10A-3(d)) regarding an exemption from the listing standards for all audit committees.
Not applicable.
ITEM 6. INVESTMENTS.
File Schedule I – Investments in securities of unaffiliated issuers as of the close of the reporting period as set forth in Section 210.12-12 of Regulation S-X, unless the schedule is included as part of the report to shareholders filed under Item 1 of this Form.
Included in Item 1.
ITEM 7. DISCLOSURE OF PROXY VOTING POLICIES AND PROCEDURES FOR CLOSED-END MANAGEMENT INVESTMENT COMPANIES.
Not applicable.
ITEM 8. PORTFOLIO MANAGERS OF CLOSED-END MANAGEMENT INVESTMENT COMPANIES.
Not applicable.
ITEM 9. PURCHASE OF EQUITY SECURITIES BY CLOSED-END MANAGEMENT INVESTMENT COMPANY AND AFFILIATED PURCHASERS.
Not applicable.
ITEM 10. SUBMISSION OF MATTERS TO A VOTE OF SECURITY HOLDERS.
Describe any material changes to the procedures by which shareholders may recommend nominees to the registrant’s board of directors, where those changes were implemented after the registrant last provided disclosure in response to the requirements of Item 7(d)(2)(ii)(G) of Schedule 14A (17 CFR 240.14a-101), or this Item.
No material changes to report.
ITEM 11. CONTROLS AND PROCEDURES.
(a) Disclose the conclusions of the registrant’s principal executive and principal financial officers, or persons performing similar functions, regarding the effectiveness of the registrant’s disclosure controls and procedures (as defined in Rule 30a-3(c) under the Act (17 CFR 270.30a-3(c))) as of a date within 90 days of the filing date of the report that includes the disclosure required by this paragraph, based on the evaluation of these controls and procedures required by Rule 30a-3(b) under the Act (17 CFR 270.30a-3(b)) and Rules 13a-15(b) or 15d-15(b) under the Exchange Act (17 CFR 240.13a-15(b) or 240.15d-15(b)).
The Registrant’s principal executive and principal financial officers have concluded, based on their evaluation of the Registrant’s disclosure controls and procedures as of a date within 90 days of the filing date of this report, that the Registrant’s disclosure controls and procedures are reasonably designed to ensure that information required to be disclosed by the Registrant on Form N-CSR is recorded, processed, summarized and reported within the required time periods and that information required to be disclosed by the Registrant in the reports that it files or submits on Form N-CSR is accumulated and communicated to the Registrant’s management, including its principal executive and principal financial officers, as appropriate to allow timely decisions regarding required disclosure.
(b) Disclose any change in the registrant’s internal control over financial reporting (as defined in Rule 30a-3(d) under the Act (17 CFR 270.30a-3(d)) that occurred during the period covered by this report that has materially affected, or is reasonably likely to materially affect, the registrant’s internal control over financial reporting.
There were no changes in the Registrant’s internal control over financial reporting that occurred during the period covered by this report that have materially affected, or are reasonably likely to materially affect, the Registrant’s internal control over financial reporting.
ITEM 12. DISCLOSURE OF SECURITIES LENDING ACTIVITIES FOR CLOSED-END MANAGEMENT INVESTMENT COMPANIES.
Not applicable.
ITEM 13. EXHIBITS.
| (a) | File the exhibits listed below as part of this Form. Letter or number the exhibits in the sequence indicated. |
(1) Any code of ethics, or amendment thereto, that is the subject of the disclosure required by Item 2, to the extent that the registrant intends to satisfy the Item 2 requirements through filing of an exhibit.
(2) A separate certification for each principal executive officer and principal financial officer of the registrant as required by Rule 30a-2(a) under the Act (17 CFR 270.30a-2), exactly as set forth below:
(1) Any written solicitation to purchase securities under Rule 23c-1 under the Act (17 CFR 270.23c-1) sent or given during the period covered by the report by or on behalf of the registrant to 10 or more persons.
Not applicable.
(2) Change in the registrant’s independent public accountant. Provide the information called for by Item 4 of Form 8-K under the Exchange Act (17 CFR 249.308). Unless otherwise specified by Item 4, or related to and necessary for a complete understanding of information not previously disclosed, the information should relate to events occurring during the reporting period.
Not applicable.
| (b) | A separate or combined certification for each principal executive officer and principal officer of the registrant as required by Rule 30a-2(b) under the Act of 1940. |
SIGNATURES
Pursuant to the requirements of the Securities Exchange Act of 1934 and the Investment Company Act of 1940, the registrant has duly caused this report to be signed on its behalf by the undersigned, thereunto duly authorized.
| JPMorgan Trust IV | ||
| By: | /s/ Brian S. Shlissel | |
| Brian S. Shlissel | ||
| President and Principal Executive Officer | ||
| December 29, 2022 | ||
Pursuant to the requirements of the Securities Exchange Act of 1934 and the Investment Company Act of 1940, this report has been signed below by the following persons on behalf of the registrant and in the capacities and on the dates indicated.
| By: | /s/ Brian S. Shlissel | |
| Brian S. Shlissel | ||
| President and Principal Executive Officer | ||
| December 29, 2022 | ||
| By: | /s/ Timothy J. Clemens | |
| Timothy J. Clemens | ||
| Treasurer and Principal Financial Officer | ||
| December 29, 2022 | ||