UNITED STATES
SECURITIES AND EXCHANGE COMMISSION
Washington, D.C. 20549
FORM 10-K
For the fiscal year ended December 31, 2019
For the transition period from ____________ to __________
Commission file number: 001-37872
(Exact name of registrant as specified in its charter)
(State or other jurisdiction of incorporation or organization) | (I.R.S. Employer Identification No.) | ||
(Address of principal executive offices) | (Zip Code) | ||
Registrant's telephone number, including area code: (800 ) 935-5961
Securities registered pursuant to Section 12(b) of the Act:
Title of each class | Trading symbol | Name of each exchange on which registered | ||
Securities registered pursuant to Section 12(g) of the Act: None
Indicate by check mark if the registrant is a well-known seasoned issuer, as defined in Rule 405 of the Securities Act. Yes ☐ No ☒
Indicate by check mark if the registrant is not required to file reports pursuant to Section 13 or Section 15(d) of the Act. Yes ☐ No ☒
Indicate by check mark whether the registrant (1) has filed all reports required to be filed by Section 13 or 15(d) of the Securities Exchange Act of 1934 during the preceding 12 months (or for such shorter period that the registrant was required to file such reports), and (2) has been subject to such filing requirements for the past 90 days. Yes ☒ No ☐
Indicate by check mark whether the registrant has submitted electronically every Interactive Data File required to be submitted pursuant to Rule 405 of Regulation S-T (§232.405 of this chapter) during the preceding 12 months (or for such shorter period that the registrant was required to submit such files). Yes ☒ No ☐
Indicate by check mark whether the registrant is a large accelerated filer, an accelerated filer, a non-accelerated filer, a smaller reporting company, or an emerging growth company. See the definitions of "large accelerated filer," ''accelerated filer," "smaller reporting company" and "emerging growth company" in Rule 12b-2 of the Exchange Act.
Large accelerated filer | ☐ | Accelerated filer | ☐ |
☒ | Smaller reporting company | ||
Emerging growth company | |||
If an emerging growth company, indicate by check mark if the registrant has elected not to use the extended transition period for complying with any new or revised financial accounting standards provided pursuant to Section 13(a) of the Exchange Act. ☐
Indicate by check mark whether the registrant is a shell company (as defined in Rule 12b-2 of the Exchange Act). Yes ☐ No ☒
As of June 28, 2019, the last business day of the registrant's most recently completed second fiscal quarter, the aggregate market value of the registrant's common stock held by non-affiliates of the registrant was approximately $54.0 million (based upon the closing sale price of the common stock on that date on The Nasdaq Capital Market).
As of March 26, 2020, 67,512,167 shares of common stock, par value $0.001 per share, were issued and 67,060,943 shares were outstanding.
DOCUMENTS INCORPORATED BY REFERENCE
Portions of the definitive proxy statement to be filed with the Securities and Exchange Commission pursuant to Regulation 14A relating to the Annual Meeting of shareholders of Priority Technology Holdings, Inc., scheduled to be held on June 17, 2020, will be incorporated by reference in Part III of this Form 10-K. Priority Technology Holdings, Inc. intends to file such proxy statement with the Securities and Exchange Commission not later than 120 days after its fiscal year ended December 31, 2019.
Priority Technology Holdings, Inc.
Annual Report on Form 10-K
For the Year Ended December 31, 2019
Page | |||
Cautionary Note Regarding Forward-Looking Statements
Some of the statements made in this Annual Report on Form 10-K constitute forward-looking statements within the meaning of the federal securities laws. Such forward-looking statements include, but are not limited to, statements regarding our or our management's expectations, hopes, beliefs, intentions or strategies regarding the future. In addition, any statements that refer to projections, forecasts or other characterizations of future events or circumstances, such as statements about our future financial performance, including any underlying assumptions, are forward- looking statements. The words "anticipate," "believe," "continue," "could," "estimate," "expect," "future," "goal," "intend," "likely," "may," "might," "plan," "possible," "potential," "predict," "project," "seek," "should," "would," "will," "approximately," "shall" and similar expressions may identify forward-looking statements, but the absence of these words does not mean that a statement is not forward-looking. Forward-looking statements contained in this Annual Report on Form 10-K include, but are not limited to, statements about:
• | competition in the payment processing industry; |
• | the use of distribution partners; |
• | any unauthorized disclosures of merchant or cardholder data, whether through breach of our computer systems, computer viruses, or otherwise; |
• | any breakdowns in our processing systems; |
• | government regulation, including regulation of consumer information; |
• | the use of third-party vendors; |
• | any changes in card association and debit network fees or products; |
• | any failure to comply with the rules established by payment networks or standards established by third-party processor; |
• | any proposed acquisitions or any risks associated with completed acquisitions; and |
• | other risks and uncertainties set forth in the "Item 1A - Risk Factors" section of this Annual Report on Form 10-K. |
We caution you that the foregoing list may not contain all of the forward-looking statements made in this Annual Report on Form 10-K.
The forward-looking statements contained in this Annual Report on Form 10-K are based on our current expectations and beliefs concerning future developments and their potential effects on us. You should not place undue reliance on these forward-looking statements in deciding whether to invest in our securities. We cannot assure you that future developments affecting us will be those that we have anticipated. These forward-looking statements involve a number of risks, uncertainties (some of which are beyond our control) or other assumptions, including the risk factors set forth on page 19 of this Annual Report on Form 10-K, that may cause our actual results or performance to be materially different from those expressed or implied by these forward-looking statements. Should one or more of these risks or uncertainties materialize, or should any of our assumptions prove incorrect, actual results may vary in material respects from those projected in these forward-looking statements.
In addition, statements that "we believe" and similar statements reflect our beliefs and opinions on the relevant subject. These statements are based upon information available to us as of the date of this Annual Report on Form 10-K, and while we believe such information forms a reasonable basis for such statements, such information may be limited or incomplete, and our statements should not be read to indicate that we have conducted an exhaustive inquiry into, or review of, all potentially available relevant information. These statements are inherently uncertain, and investors are cautioned not to unduly rely upon these statements.
You should read this Annual Report on Form 10-K with the understanding that our actual future results, levels of activity, performance and achievements may be materially different from what we expect. We qualify all of our forward-looking statements by these cautionary statements.
Forward-looking statements speak only as of the date they were made. We undertake no obligation to update or revise any forward-looking statements, whether as a result of new information, future events or otherwise, except as may be required under applicable securities laws.
Terms Used in the Annual Report on Form 10-K
As used in this Annual Report on Form 10-K, unless the context otherwise requires, references to the terms "Company," "Priority," "we," "us" and "our" refer to Priority Technology Holdings, Inc. and its consolidated subsidiaries.
1
PART I.
ITEM 1. BUSINESS
Basis of Presentation
On July 25, 2018, MI Acquisitions, Inc. ("MI Acquisitions"), which was formed under the laws of the State of Delaware on April 23, 2015, acquired all of the outstanding member equity interests of Priority Holdings, LLC in exchange for the issuance of MI Acquisitions' common stock. As a result, Priority Holdings, LLC, which was previously a privately-owned company, became a wholly-owned subsidiary of MI Acquisitions (the "Business Combination"). Simultaneously, MI Acquisitions changed its name to Priority Technology Holdings, Inc. For financial accounting and reporting purposes under generally accepted accounting principles in the United States ("GAAP"), the acquisition was accounted for as a "reverse merger." Under this method of accounting, MI Acquisitions is treated as the acquired entity whereby Priority Holdings, LLC was deemed to have issued common stock for the net assets and equity of MI Acquisitions accompanied by a simultaneous equity recapitalization of Priority Holdings, LLC. Net assets of the Company are stated at historical cost and accordingly the equity and net assets of the Company have not been adjusted to fair value. As of July 25, 2018, the consolidated financial statements of the Company include the combined operations, cash flows, and financial positions of both MI Acquisitions and Priority Holdings, LLC. Prior to July 25, 2018, the results of operations, cash flows, and financial position are those of Priority Holdings, LLC. The units and corresponding capital amounts and earnings per unit of Priority Holdings, LLC prior to July 25, 2018 have been retroactively revised as shares reflecting the exchange ratio established in the recapitalization.
Overview of the Company
We are a leading provider of merchant acquiring and commercial payments solutions with a platform of microservices that activate and monetize vertically specialized merchant networks. We offer unique product capabilities to businesses, enterprises and distribution partners such as retail independent sales organizations ("ISOs"), financial institutions ("FIs"), wholesale ISOs, and independent software vendors ("ISVs") in the United States. The Company, then Priority Holdings, LLC, was founded in 2005 with a mission to build a merchant inspired payments platform that would advance the goals of our small and medium-size business clients ("SMBs"), enterprise clients, and distribution partners.
Since 2013, we have grown from the 38th largest U.S. merchant acquirer to become the 11th largest and the 5th largest non-bank merchant acquirer as of the end of 2019 according to the Nilson Report issued in March 2020. In 2019 and 2018, we processed over 513 million and 466 million transactions, respectively, and over $43.0 billion and $38.2 billion, respectively, in bankcard payment volume across approximately 203,000 and 181,000, respectively, merchants. Headquartered in Alpharetta, Georgia, we had 588 employees as of December 31, 2019 and are led by an experienced group of payments executives.
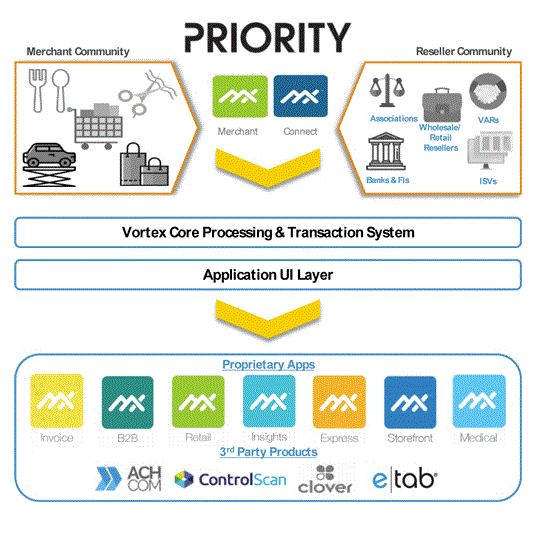
Our growth has been underpinned by three key strengths: (1) a cost-efficient, agile payment and business processing infrastructure, known internally as Vortex.Cloud and Vortex.OS, (2) two proprietary product platforms: the MX product line targeting the consumer payments market and the commercial payments exchange ("CPX") product line targeting the commercial payments market and (3) focused distribution engines dedicated to selling into business-to-consumer ("B2C") and commercial payments business-to-business ("B2B") payments markets.
The MX product line provides technology-enabled payment acceptance and business management capabilities to merchants, enterprises and our distribution partners. The MX product line includes: (1) our MX ISO/Agent and VIMAS reseller technology systems (collectively referred to as "MX Connect") and (2) our MX Merchant products, which together provide resellers and merchant clients, a flexible and customizable set of business applications that help better manage critical business work functions and revenue performance using core payment processing as our leverage point. MX Connect provides our consumer payments reselling partners with automated tools that support low friction merchant on-boarding, underwriting and risk management, client service, and commission processing through a single mobile-enabled, web-based interface. The result is a smooth merchant activation onto our flagship consumer payments offering, MX Merchant, which provides core processing and business solutions to SMB clients. In addition to payment processing, the MX Merchant product line encompasses a variety of proprietary and third-party product applications that merchants can adopt such as MX Insights, MX Storefront, MX Retail, MX Invoice, MX B2B and ACH.com, among others. This comprehensive suite of solutions enables merchants to identify key consumer trends in their business,
2
quickly implement e-commerce or retail point-of-sale ("POS") solutions, and even handle automated clearing house ("ACH") payments. By empowering resellers to adopt a consultative selling approach and embedding our technology into the critical day-to-day workflows and operations of both merchants and resellers, we believe that we have established and maintained "sticky" relationships. We believe that our strong retention, coupled with consistent merchant boarding, have resulted in strong processing volume and revenue growth.
The CPX platform, like the MX product line, provides a complete solution suite designed to monetize all types of B2B payments by maximizing automation for buyers and suppliers. CPX supports virtual card, purchase card, electronic fund transfer, ACH and check payments, intelligently routing each transaction via the optimal payment method. Underlying our MX and CPX platforms is the Company's Vortex.Cloud and Vortex.OS enterprise infrastructure, a curated cloud and application programming interface ("API") driven operating system built for scale and agility.
We developed an entirely virtual computing infrastructure in 2012. This infrastructure, known as Vortex.Cloud, is a highly-available, redundant, and audited payment card industry ("PCI"), Health Insurance Portability and Accountability Act ("HIPAA"), NACHA, and Financial Stability Oversight Council (the "FSOC") computing platform with centralized security and technical operations. We strive to enable Vortex.Cloud to maintain greater than 99% uptime. All computational and IP assets of our operating companies are hosted and managed on Vortex.Cloud infrastructure. With Vortex.Cloud, we have constructed a uniform set of APIs, called Vortex.OS (operating system), that provide critical functionality to our payment divisions. The Vortex OS APIs provide electronic payments, security/crypto, data persistence, time series data (events), and artificial intelligence (AI). The MX and CPX product platforms leverage Vortex.OS and Vortex.Cloud for maximum scalability, high-availability, security, and access to advanced feature sets. The combined result is a purpose build infrastructure and product offering that produces solid organic growth and profit margin results. Furthermore, in addition to supporting a modern product stack, Vortex.Cloud and Vortex.OS enable the rapid inclusion of data and systems of acquisition targets for smooth consolidation to our operating infrastructure and accelerate achievement of revenue and cost synergies.
We sell our B2C merchant acquiring solutions primarily to SMBs through a growing and diverse reseller network, including ISOs, FIs, ISVs, Value-Added Resellers ("VARs") and other referral partners. We maintain stable, long-term relationships with our resellers, bolstered by the integration of MX Connect, a powerful customer relationship management ("CRM") and business operating system. MX Connect is used by our resellers and internal teams to manage their merchant base and accelerate the growth of their businesses through various value-added tools and resources which include marketing resources, automated onboarding, merchant underwriting, merchant activity monitoring and reporting. In addition, we offer ISVs and VARs a technology "agnostic" and feature rich API, providing developers with the ability to integrate electronic payment acceptance into their software and improve boarding efficiency for their merchant base. For the end user, MX Merchant provides a customizable, virtual terminal with proprietary business management tools and add-on applications that create an integrated merchant experience. MX Merchant's add-on applications include invoicing, website builder, inventory management and customer engagement and data analytics focused on targeted marketing among others. These proprietary business management tools and add-on applications, coupled with our omni-channel payment solutions, enable us to achieve attrition rates that, we believe, are well below industry average. MX Merchant can be deployed on hardware from a variety of vendors and operated either as a standalone product or integrated with third-party software. Through MX Merchant, we are well-positioned to capitalize on the trend towards integrated payments solutions, new technology adoption, and value-added service utilization in the SMB market. Our broad go-to-market strategy has resulted in a merchant base that is both industry and geographically diversified in the United States, resulting in low industry and merchant concentration.
In addition to our B2C offering, we have diversified our source of revenues through our growing presence in the B2B market. We work with enterprise clients and leading financial institutions seeking to automate their accounts payable processes. We provide curated managed services and a robust suite of integrated accounts payable automation solutions to industry leading financial institutions and card networks such as Citibank, MasterCard, Visa and American Express, among others. Unlike the consumer payments business which advocates a variable cost indirect sales strategy, Priority Commercial Payments supports a direct sales model that provides turnkey merchant development, product sales, and supplier enablement programs. CPX offers clients a seamless bridge for buyer to supplier (payor to provider) payments by integrating directly to a buyer's payment instruction file and parsing it for payment to suppliers via virtual card, purchase card, ACH +, dynamic discounting, or check. Successful implementation of our Accounts Payable ("AP") automation solutions provides suppliers with the benefits of cash acceleration, buyers with valuable rebate/discount revenue, and the Company with stable sources of payment processing and other revenue. Considering that the commercial payments volume in the United States is over twice the size of consumer payments and substantially less penetrated for electronic payments, we believe that this market represents a high growth opportunity for us.
3
More recently, we began to build our Integrated Partners component which offers solutions for ISVs, third-party integrators, and merchants that allow for the leveraging of our core payments engine via application program interfaces ("APIs") resources. Integrated Partners connects businesses with other businesses and their customers in the real estate, hospitality, and health care marketplaces.
We generate revenue primarily from fees charged for processing payment transactions, and to a lesser extent, from monthly subscription services and other solutions provided to merchants. Processing fees are generated from the ongoing sales of our merchants under multi-year merchant contracts, and thus are highly recurring in nature. Due to the nature of our strong reseller-centric distribution model and differentiated technology offering, we can drive efficient scale and operating leverage, generating robust margins and profitability.
For the year ended December 31, 2019, we generated revenue of $371.9 million (which reflects the adoption of the new revenue recognition standard, ASC 606), a net loss of $33.6 million and Adjusted EBITDA (a non-GAAP measure) of $58.9 million, compared to revenue of $375.8 million (which reflects the retroactive adoption of the new revenue recognition standard, ASC 606), net loss of $17.8 million and Adjusted EBITDA of $49.4 million for the year ended December 31, 2018. For a discussion of Adjusted EBITDA and a reconciliation to net income (loss), the most directly comparable measure under GAAP, please see the section entitled "Item 7 - Management's Discussion and Analysis of Financial Conditions and Results of Operations—Certain Non-GAAP Measures" elsewhere in this Annual Report on Form 10-K.
Industry Overview
The B2C payment processing industry provides merchants with credit, debit, gift and loyalty card and other payment processing services, along with related value-added solutions and information services. The industry continues to grow, driven by wider merchant acceptance, increased consumer use of electronic payments and advances in payment technology. The proliferation of bankcards and use of other payment technologies has made the acceptance of electronic payments through multiple channels a virtual necessity for many businesses, regardless of size, to remain competitive. This increased use and acceptance of bankcards and the availability of more sophisticated products and services has resulted in a highly competitive and specialized industry.
Services to the SMB merchant market have been historically characterized by basic payment processing without ready access to more sophisticated technology, value-added solutions, or customer service that are typically offered to large merchants. To keep up with the changing demands of how consumers wish to pay for goods and services, we believe that SMB merchants increasingly recognize the need for value-added services wrapped around omni-channel payment solutions that are tailored to their specific business needs.
Key Industry Trends
The following are key trends we believe are impacting the merchant acquiring / payment processing industry:
• | Trend Toward Electronic Transactions. We believe the continued shift from cash/paper payments toward electronic / card payments will drive growth for merchant acquirers and processors as volume continues to grow correspondingly. We believe the continued migration from cash to card and overall market growth will continue to provide tailwinds to the electronic payments industry. |
• | Increasing Demand for Integrated Payments. Merchant acquirers are increasingly differentiating themselves from competitors via innovative technology, including integrated POS solutions ("integrated payments"). Integrated payments refer to the integration of payment processing with various software solutions and applications that are sold by VARs and ISVs. Integrated software tools help merchants manage their businesses, streamline processes, lower costs, increase accuracy, and drive growth for businesses. The broader solutions delivered as part of an integrated payments platform have become an increasingly important consideration point for many SMBs, whereas pricing was historically the key factor influencing the selection of a merchant acquirer. Merchant acquirers that partner with VARs and ISVs to integrate payments with software or own the software outright may benefit most from new revenue streams and higher merchant retention. |
4
• | Mobile Payments. Historically, e-commerce was conducted on a computer via a web browser; however, as mobile technologies continue to proliferate, consumers are making more purchases through mobile browsers and native mobile applications. We believe this shift represents a significant opportunity given the high growth rates of mobile payments volume, higher fees for card-not-present and cross-border processing and potential for the in-app economy to stimulate and/or alter consumer spending behavior. |
• | Migration to EMV. EMV, which stands for Europay, MasterCard and Visa, is the global payments standard that utilizes chip technology on cards designed to increase security. EMV technology employs dynamic authentication for each transaction, rendering any data copied from magnetic strip readers to produce counterfeit cards unusable. Demand for EMV ready terminals should remain resilient in the near term due to the following: |
• | The United States was one of the last countries to adopt EMV technology, leaving a large group of merchants still transitioning to the EMV standards; and |
• | U.S. merchants are penalized for failing to comply with EMV standards by bearing the chargeback risk when presented with an EMV enabled card when the terminal is non-compliant. |
The large majority of our third-party products are EMV enabled, and we expect that most new hardware sales will be EMV enabled devices, although all hardware sales constitute only a small portion of our total revenue.
B2B payments is the largest payment market in the United States by volume and presents a significant opportunity for payment providers to capitalize on the conversion of check and paper-based payments to electronic payments, including card-based acceptance. As businesses have increasingly looked to improve efficiency and reduce costs, the electronification of B2B payments has gained momentum.
Electronics Payments Overview
The payment processing and services industry provides the infrastructure and services necessary to enable the acceptance, processing, clearing and settlement of electronic payments predominantly consisting of credit card, debit card, ACH payments, gift cards and loyalty rewards programs. Characterized by recurring revenues, high operating leverage, and robust cash flow generation, the industry continues to benefit from the mass migration from cash and checks to electronic payments.
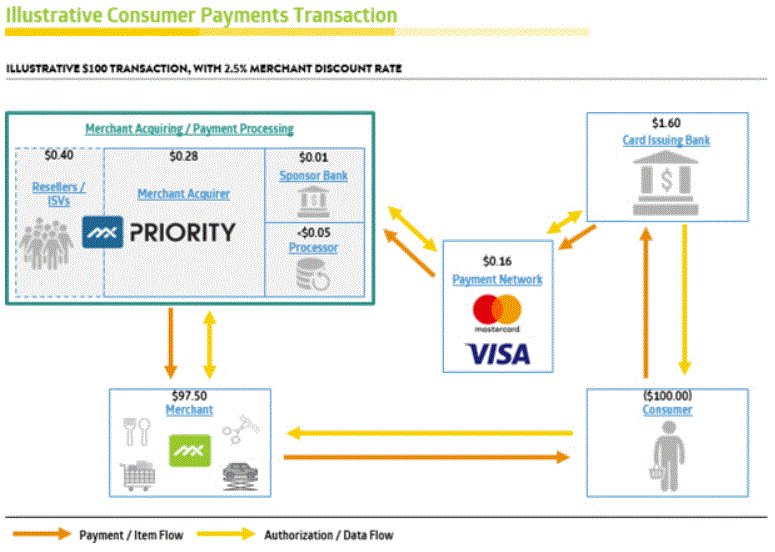
There are five key participants in the payment processing value chain: (i) card issuing banks, (ii) merchant acquirers, (iii) payment networks, (iv) merchant processors and (v) sponsor banks. Each of these participants performs key functions in the electronic payments process, while other entities, such as terminal manufacturers, gateway providers and independent sales organizations also play important functions within the value chain.
• | Card Issuing Banks – Typically financial institutions that issue credit/debit cards to consumers (also underwrite the risk associated the cards), authorize (check for fraud and sufficient funds) transactions and transfer funds through the payment networks for settlement. Some card issuers do not have the ability to process transactions in-house, in which case the issuer may engage a card processor. |
• | Merchant Acquirers – Firms that sign up merchants to their platform through a variety of sales channels, enabling them to accept, process and settle electronic payments. Additionally, merchant acquirers provide other value-added services to help merchants run their businesses more efficiently, such as helping to select POS hardware and providing customer support and services. |
• | Payment Networks – Card brand companies, such as MasterCard or Visa, that set rules and provide the rails to route transactions and information between card issuers, merchant acquirers and payments processors in real-time over vast communication networks. |
• | Merchant Processors – Firms that provide the technology needed to allow for payment authorization, data transmission, data security and settlement functions. Oftentimes the term merchant acquirer and processor are used synonymously; however, they perform two distinct functions (sometimes provided by the same entity). |
5
• | Sponsor Banks – Financial Institutions that are acquiring members of Visa and MasterCard and provide sponsorship access to acquirers and processors to the card networks. Sponsor banks provide merchants the ultimate access to the card networks for their processing activity. |
The industry also includes other third-party providers, including service, software and hardware companies that provide products and services designed to improve the experience for issuers, merchants and merchant acquirers. This category includes mobile payment enablers, terminal manufacturers, and ISV's.
Each electronic payment transaction consists of two key steps: the front-end authorization and back end settlement.
• | Front End Authorization – The original request for payment authorization that occurs when the card is swiped or inserted at the POS or the data is entered into an online gateway. |
• | Back End Settlement – The settlement and clearing process consists of settling outstanding payables and receivables between the card issuing bank & merchant bank. This process is facilitated by a back-end processor that utilizes the network's platform to send outstanding payable information and funds between the two parties. |
A credit or debit card transaction carried out offline or through signature debit is a two-message process, with the front end occurring at the POS and the back end occurring later as a part of a batch processing system that clears all of the day's payments from transaction occurring throughout the day. Credit and debit card transactions carried out with personal identification numbers consist of a single message, whereby the authorization and clearing occur immediately – the money is instantly debited from the cardholder's checking account, although the settlement of funds (the transfer to the merchant's account) may happen later as part of a batch process.
6
Competitive Strengths
We possess certain attributes that we believe differentiate us as a leading provider of merchant acquiring and commercial payment solutions in the United States. Our key competitive strengths include:
Purpose-Built Proprietary Technology
We have strategically built our proprietary software to provide technology-enabled payment acceptance and business management solutions to merchants, enterprises and resellers. The MX product line is embedded into the critical day-to-day workflows and operations of both merchants and resellers, leading to highly "sticky" relationships and high retention. CPX provides a complete commercial solution suite that monetizes commercial payments and maximizes automation for buyers and suppliers. By integrating with Vortex.Cloud and Vortex.OS, MX and CPX can scale in a cost-effective and efficient manner, while enhancing features and functionality. Both product lines also support low friction merchant onboarding and an integrated value-added product offering for merchants, resellers and ISVs in the consumer and commercial payment space. Furthermore, in addition to supporting a modern user experience, Vortex.Cloud enables the rapid inclusion of data and systems of acquisition targets for smooth consolidation to our operating infrastructure and accelerates achievement of revenue and of cost synergies.
Diverse Reseller Community
We maintain strong reseller relationships with approximately 1,300 ISOs, FIs, ISVs, VARs and other referral partners. MX Connect enables resellers to efficiently market merchant acquiring solutions to a broad base of merchants through this one-to-many distribution model. Resellers leverage MX Connect's powerful CRM and business operating features to manage their internal sales teams and engage their merchant base through various value-added tools and resources, such as marketing resources, automated onboarding, merchant underwriting, merchant activity monitoring and reporting, to support the growth of their businesses. We believe that our ability to service our reseller partners through a comprehensive offering provides a competitive advantage that has allowed the company to build a large, diverse merchant base characterized by high retention. The strength of our technology offering is manifest in the fact that we maintain ownership of merchant contracts, with most reseller contracts including strong non-solicit and portability restrictions.
Comprehensive Suite of Payment Solutions
MX Merchant offers a comprehensive and differentiated suite of traditional and emerging payment products and services that enables SMBs to address their payment needs through one provider. We provide a payment processing platform that allows merchants to accept electronic payments (e.g. credit cards, debit cards, and ACH) at the point of sale ("POS"), online, and via mobile payment technologies. In addition, through MX Merchant, we deliver innovative business management products and add-on features that meet the needs of SMBs across different vertical markets. Through our MX Merchant platform, we believe we are well-positioned to capitalize on the trend towards integrated payments solutions, new technology adoption and value-add service utilization that is underway in the SMB market. We believe our solutions facilitate a superior merchant experience that results in increased customer lifetime value.
Highly Scalable Business Model with Operating Leverage
As a result of thoughtful investments in our technology, we have developed robust and differentiated infrastructure that has enabled us to scale in a cost-efficient manner. Our purpose-built proprietary technology platforms, MX and CPX, each serve a unique purpose within consumer and commercial payments, enabling the company to realize significant operating leverage within each business segment. Furthermore, the agility of our Vortex.Cloud and Vortex.OS enterprise infrastructure enables us to quickly and cost efficiently consolidate acquisitions to drive revenue and cost synergies. Our operating efficiency supports a low capital expenditure environment to develop product enhancements that drive organic growth across our consumer and commercial payment ecosystems and attract both reselling partners and enterprise clients looking for best-in-class solutions. By creating a cost-efficient environment that facilitates the combination of ongoing product innovation to drive organic growth and stable cash flow to fund acquisitions, we anticipate ongoing economies of scale and increased margins over time.
7
Experienced Management Team Led by Industry Veterans
Our executive management team has a record of execution in the merchant acquiring and technology-enabled payments industry. Our team has continued to develop and enhance our proprietary and innovative technology platforms that differentiate us with merchants and resellers in the industry. Since founding the Company, our leadership team has built strong, long-term relationships with reseller and enterprise partners by leveraging the MX and CPX product platforms to meet the needs of businesses in specific vertical markets. We invest to attract and retain executive leadership that align with the opportunities in the market and our strategic focus.
Growth Strategies
We intend to continue to execute a multi-pronged growth strategy, with diverse organic initiatives supplemented by acquisitions. Growth strategies include:
Organic Growth in our Consumer Reseller and Merchant Base
We expect to grow through our existing reseller network and merchant base, capitalizing on the inherent growth of existing merchant volume and reseller merchant portfolios. By providing resellers with agile tools to manage their sales businesses and grow their merchant portfolio, we have established a solid base from which to generate new merchant adoption and retain existing merchants. By engaging in a consultative partnership approach, we maintain strong relationships with our reseller partners and continues to exhibit strong merchant adoption and volume growth trends. Through our resellers, we provide merchants with full-service acquiring solutions, as well as value-added services and tools to streamline their business processes and enables them to focus on driving same store sales growth.
Expand our Network of Distribution Partners
We have established and maintain a strong position within the reseller community, with approximately 1,300 partners. We intend to continue to expand our distribution network to reach new partners, particularly with ISVs and VARs to expand technology and integrated partnerships. We believe that our MX Connect technology offering enables us to attract, and retain, high quality resellers focused on growth.
Increase Margin per Merchant with Complementary Products and Services
We intend to drive the adoption of our value-added services and tools with our merchant base. MX Merchant allows merchants to add proprietary Priority applications as well as other third-party applications from the MX Merchant Marketplace to build customized payment solutions that are tailored to a merchant's business needs. As we continue to board new merchants and promote our MX Merchant solution, we can cross-sell these add-on applications. By increasing attachment rates, along with continued benefit from economies of scale, we expect to see improved margins per merchant. Merchants utilizing MX Merchant exhibit somewhat higher retention, contributing to our improving overall retention rates. We believe we are well-positioned to capitalize on the secular trend towards integrated payments solutions, new technology adoption and value-add service utilization in the SMB market.
Deploy Industry Specific Payment Technology
We intend to continue to enhance and deploy our technology-enabled payment solutions in attractive industries. Through MX Merchant, we have developed proprietary applications and added third-party tools that address the specific needs of merchants in certain verticals, including retail, health care and hospitality. We continue to identify and evaluate new and attractive industries where we can deliver differentiated technology-enabled payment solutions that meet merchants' industry-specific needs.
Expand Electronic Payments Share of B2B Transactions with CPX
We have a growing presence in the commercial payments market where we provide curated managed services and AP automation solutions to industry leading financial institutions and card networks such as Citibank, MasterCard, Visa and American Express. The Commercial payments market is the largest and one of the fastest growing payments market in the United States by volume.
8
We are well positioned to capitalize on the secular shift from check to electronic payments, which currently lags the consumer payments markets, by eliminating the friction between buyers and suppliers through our industry leading offering, and driving strong growth and profitability.
Accretive Acquisitions
We intend to selectively pursue strategic and tactical acquisitions that meet certain criteria, with a consistent long-term goal of maximizing stockholder value. We actively seek potential acquisition candidates that exhibit certain attractive attributes including, predictable and recurring revenue, scalable operating model, low capital intensity complementary technology offerings and strong cultural fit. Our Vortex.Cloud operating infrastructure is purpose-built to rapidly and seamlessly consolidate complementary businesses into our ecosystem, optimizing revenue and cost synergies.
Technology Infrastructure and Product Solutions
Infrastructure
Vortex.Cloud
Vortex.Cloud is a highly-available, redundant, and audited (PCI, HIPAA, NACHA, and FSOC) computing platform with centralized security and technical operations. We strive to enable Vortex.Cloud to maintain 99.999% uptime. All computational and IP assets of our payment operating divisions are hosted and managed on Vortex.Cloud infrastructure. Vortex.Cloud enables the rapid inclusion of data and systems of acquisition targets for smooth consolidation to our operating infrastructure and accelerates achievement of revenue and cost synergies.
Vortex.OS
Vortex.OS provides critical technological functionality to our payment operating divisions. The Vortex.OS APIs include: electronic payments, security/crypto, data persistence, time series data (events), and artificial intelligence (AI). Our purpose-built payments engine facilitates industry leading organic growth and efficient consolidation of acquisitions resulting in strong profit margins.
9
Consumer Payments Offering
Reseller Tools
MX Connect
Our objective is to empower our resellers to grow their businesses and improve their merchant portfolios. To do so, we provide our resellers with a feature rich API architecture, powerful merchant relationship management tools, and thought leadership resources. MX Connect provides dynamic portfolio management giving resellers total control over their financial data along with convenient low friction merchant onboarding, automated underwriting, and robust portfolio reporting and compensation tracking.
In addition, we offer our resellers thought leadership resources to support their growth and educate their employees. Priority University ("PriorityU") includes proprietary white papers on Apple Pay, EMV, regulations & compliance, and other industry topics. PriorityU also includes a comprehensive set of marketing and training tools that re-sellers can leverage to train their employees and tactfully engage merchants. In addition to the written and video-based tools on our website, we maintain a live reseller support phone line to provide resellers with real time assistance.
Finally, we offer our resellers Brand Licensing and Wholesale Development Programs which allow resellers to leverage the strength of the Priority brand for immediate and meaningful marketing impact.
Merchant Products
Our core payment processing technology allows merchants to accept electronic payments via multiple integrated POS technologies. However, our payment processing platform goes beyond traditional electronic payments acceptance with a fully integrated platform called MX Merchant. Our proprietary product maximizes the lifetime value of merchant relationships.
10
MX Merchant
Our flagship offering, MX Merchant, is a customizable payments platform that allows merchants to accept electronic payments and manage their business. Merchants can accept credit cards, debit cards, and cash using a virtual terminal, monitor payment activity in real-time, manage payment history and customer data, and create customizable reports and statements. MX Merchant is a proprietary software platform and virtual terminal that can be deployed on hardware from a variety of vendors and operated on a standalone basis or integrated with 3rd party software products.
The MX Merchant platform also allows customers to add applications from the MX Merchant Marketplace to build a payment platform customized to that merchant's business, including:
• | MX Invoice – Invoice and recurring billing app which speeds up the payment process and creates automatic, trustworthy, and easy to use invoices. |
• | MX Retail – Inventory and stock control app utilizing both MX Merchant and MX Retail applications to handle all point-of-sale needs, rewards program and inventory management with an iPhone application. |
• | MX B2B – Ensures merchants receive lower rates for Level II / III processing by setting up user level permissions based on job function. |
• | MX Insights – Customer engagement and data analytics tool focused on marketing campaigns with intelligent customer targeting through use of big data. |
• | MX Storefront – Allows merchants to quickly and easily create a professional, comprehensive, entirely customizable website, complete with full payment integration. |
• | MX Medical – Delivers patient payment estimates at the POS of a medical practice. The tool informs patients of their payment responsibility and presents the patient with a range of payment options. Once the patient leaves the medical practice, notifications and messaging are pushed to the patient's mobile device alerting them to future payments. |
• | ACH.com – Integrated ACH payment processing platform. |
We offer several third-party products and services to our merchants including:
• | ControlScan – On demand tools merchants can utilize to analyze, remediate, and validate PCI compliance. |
• | e-Tab – Provides a mobile restaurant / hospitality ordering and payment platform. We acquired the e-Tab business assets in February 2019. |
• | Terminals – we offer several EMV ready terminals and mobile card readers from manufacturers such as Ingenico, Verifone, and Magtek. |
• | Merchant Financing – we are a reseller of several merchant financing solutions provided by American Express. |
Commercial Payments Offering: Managed Services and CPX
We provide curated managed services and AP automation solutions (CPX) on behalf of industry leading financial institutions and card networks such as Citibank, MasterCard, Visa and American Express ("AMEX"). Our turnkey merchant development, business process outsourcing and refined supplier enablement program, allow commercial partners to leverage our long-standing customer relationships. Established in 2008, our commercial payments offering has allowed us to profit from the large and growing commercial payments market. Priority CPX offers solutions to key pain points such as scalability of expanding supplier onboarding while decreasing costs through automation. Successful implementation of our AP automation strategies provides vendors with the benefits of cash acceleration, buyers with valuable rebate/discount revenue, and the Company with stable sources of merchant acquiring, credit card interchange and discount fee revenue.
11
Managed Services
We provide business process outsourcing services to AMEX that offer AMEX's merchants access to several programs, including AMEX Buyer Initiated Payments ("BIP") and AMEX Merchant Financing loans. Acting as an outsourced sales force, we utilize approximately 160 employees to originate BIP or Merchant Financing loans for AMEX, earning a fee for each origination. Additionally, AMEX compensates us for personnel fees incurred for the employees who sell these outsourced services. We do not take any credit risk associated with the aforementioned programs.
CPX
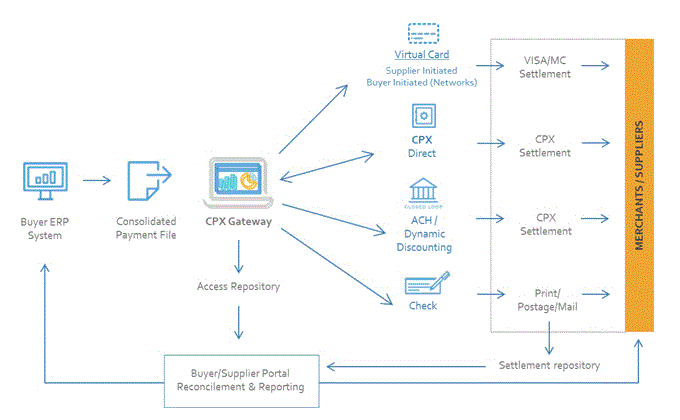
Priority CPX is a turnkey commercial payments platform that automates the AP payment process between buyers and suppliers to maximize financial rebates and ensure timely, automated payment of vendor payments.
• | CPX Access - Interactive portals connecting Buyers and Suppliers to promote the payment and data exchange between partners. |
• | CPX Gateway - Seamless integration with enterprise resource planning systems that produce a single payment file for the entire CPX solutions suite. |
• | CPX Commercial Acceptance - Optimize payment programs with a full suite of targeted solutions and powerful outreach campaign management and automated electronic quick-start application. |
• | CPX Payments - Leveraging a complete suite of traditional and transitional payment solutions to completely automate AP files. |
Sales and Distribution
We reach our consumer payment merchants through three primary sales channels: 1) Retail ISOs/Agents and Financial Institutions, 2) Wholesale ISOs, and 3) Independent Software Vendors and Value-Added Resellers. MX Connect allows resellers to engage merchants for processing services and a host of value-added features designed to enhance their customer relationship. Merchants utilize our diverse product suite to manage their business, increasing our ability to retain the merchant if the ISO were to leave the Company.
• | Retail ISOs/Agents and Financial Institutions (i.e. community banks) – A non-risk bearing independent group of sales agents, individual sales agents, or financial institutions (mostly community banks) that operates as a sales force on behalf |
12
of the Company. Retail resellers are not employed by us but rather are independently contracted to acquire merchants to utilize our payment processing and product offerings. While the reseller serves as the merchant's key contact, the processing contract is between us and the merchant and agreements with resellers include non-solicitation rights. We manage the transaction risk on behalf of retail resellers.
• | Wholesale ISO – A risk bearing independent group of sales agents operating as a sales force on behalf of the Company. Wholesale ISOs are not employed by us but rather are independently contracted to acquire merchants to utilize our payment processing and product offerings. While the ISO serves as the merchant's key contact, the processing contract is between us and the merchant, and agreements with ISOs include non-solicitation rights. Wholesale ISOs are responsible and bear all transaction risk on their merchant portfolios. We underwrite all such merchants even though wholesale ISOs bear the risk. |
• | ISVs and VARs - ISVs develop and sell business management software solutions while VARs sell third-party software solutions to merchants as part of a bundled package that includes the computer systems which operates the software. We partner with ISVs and VARs that can integrate our capabilities into a variety of software applications (e.g. medical billing software). These integrated payment solutions create an extremely "sticky" customer relationship. |
Priority Commercial Payments obtains its "buyer" clients through direct sales initiative and referral and business partnerships with integrated software partners, the card networks (MasterCard, Visa, American Express) and large US banking institutions. We support a direct vendor sales model that provides turnkey merchant development, product sales, and supplier enablement programs. By establishing a seamless bridge for buyer-to-supplier (payor-to-provider) payments that is integrated directly to a buyer's payment instruction file to facilitate payments to vendors via all payment types (virtual card, purchase card, ACH +, dynamic discounting), we have established ourselves as an emerging force in commercial payments.
Our market strategy has resulted in a merchant base that we believe is diversified across both industries and geographies resulting in, what we believe, is more stable average profitability per merchant. No single reseller relationship contributes more than 10% of total bankcard processing volume.
Security, Disaster Recovery and Back-up Systems
As a result of normal business operations, we store information relating to our merchants and their transactions. Because this information is considered sensitive in nature, we maintain a high level of security to attempt to protect it. Our computational systems are continually updated and audited to the latest security standards as defined by payment card industry and data security standards ("PCI DSS"), FSOC, and HIPAA audits. As such, we have a dedicated team responsible for security incident response. This team develops, maintains, tests and verifies our incident response plan. The primary function of this team is to react and respond to intrusions, denial of service, data leakage, malware, vandalism, and many other events that could potentially jeopardize data availability, integrity, and confidentiality. This team is responsible for investigating and reporting on all malicious activity in and around our information systems. In addition to handling security incidents, the incident response team continually educates themselves and us on information security matters.
High-availability and disaster recovery are provided through a combination of redundant hardware and software running at two geographically distinct data centers. Each data center deployment is an exact mirror of the other and each can handle all technical, payment, and business operations for all product lines independently of the other. If one site or service becomes impaired, the traffic is redirected to the other automatically. Business Continuity Planning drills are run each quarter to test fail-over and recovery as well as staff operations and readiness.
Third-Party Processors and Sponsor Banks
We partner with various vendors in the payments value chain to assist us in providing payment processing services to merchant clients, most notably processors and sponsor banks, which sit between us (the merchant acquirer) and the card networks. Processing is a scale driven business in which many acquirers outsource the processing function to a small number of large processors. In these partnerships, we serve as a merchant acquirer and enter into processing agreements with payment processors, such as First Data or TSYS, to assist us in providing front-end and back-end transaction processing services for our merchants. These third parties are compensated for their services. These processors in turn have agreements with card networks such as Visa and MasterCard, through which the transaction information is routed in exchange for network fees.
13
To provide processing services, acquirers like Priority we must be registered with the card networks (e.g. Visa and MasterCard). To register with a card network in the United States, acquirers must maintain relationships with banks willing to sponsor the acquirer's adherence to the rules and standards of the card networks, or a sponsor bank. We maintain sponsor bank relationships with Citizens Bank, Wells Fargo, Synovus Bank, Pueblo Bank, Sutton Bank, and Axiom Bank. For ACH payments, the Company's ACH network (ACH.com) is sponsored by Atlantic Capital Bank and Fifth Third Bank. Sponsor bank relationships enable us to route transactions under the sponsor bank's control and identification number (referred to as a BIN for Visa and ICA for MasterCard) across the card networks (or ACH network) to authorize and clear transactions.
Risk Management
Our thoughtful merchant and reseller underwriting policies combined with our forward-looking transaction management capabilities have enabled us to maintain low credit loss performance. Our risk management strategies are informed by a team with decades of experience managing merchant acquiring risk operations that are augmented by our modern systems designed to manage risk at the transaction level.
Initial Underwriting- Central to our risk management process is our front-line underwriting policies that vet all resellers and merchants prior to their contracting with us. Our automated risk systems pull credit bureau reports, corporate ownership details, as well as anti-money laundering, Office of Foreign Assets Control ("OFAC") and Financial Crimes Enforcement Network ("FinCEN") information from a variety of integrated data bases. This information is put into the hands of a tenured team of underwriters who conduct any necessary industry checks, financial performance analysis or owner background checks, consistent with our policies. Based upon these results the underwriting department rejects or approves and sets appropriate merchant and reseller reserve requirements which are held by our bank sponsors on our behalf. Resellers are subject to quarterly and/or annual assessments for financial strength compliance with our policies and adjustments to reserve levels. The results of our initial merchant underwriting inform the transaction level risk limits for volume, average ticket, transaction types and authorization codes among other items that are captured by our CYRIS risk module—a proprietary risk system that monitors and reports transaction risk activity to our risk team. This transaction level risk module, housed within MX Connect, forms the foundational risk management framework that enables the company to optimize transaction activity and processing scale while preserving a modest aggregate risk profile that has resulted in historically low losses.
Real-Time Risk Monitoring- Merchant transactions are monitored on a transactional basis to proactively enforce risk controls. Our risk systems provide automated evaluation of merchant transaction activity against initial underwriting settings. Transactions that are outside underwriting parameters are queued for further investigation. Also, resellers whose merchant portfolio represents a concentration of investigated merchants are evaluated for risk action (i.e., increased reserves or contract termination).
Risk Audit- Transactions flagged by our risk monitoring systems or that demonstrate suspicious activity traits that have been flagged for review can result in funds being held and other risk mitigation actions. These can include non- authorization of the transaction, debit of reserves or even termination of processing agreement. Merchants are periodically reviewed to assess any risk adjustments based upon their overall financial health and compliance with Network standards. Merchant transaction activity is investigated for instances of business activity changes or credit impairment (and improvement).
Loss Mitigation- In instances where particular transactions and/or individual merchants are flagged for fraud, where transaction activity is resulting in excessive chargebacks, several loss mitigation actions may be taken. These include charge-back dispute resolution, merchant and reseller funds (reserves or processed batches) withheld, inclusion on Network Match List to notify the industry of a "bad actor", and even legal action.
Acquisitions of Businesses
For information regarding our business and asset acquisitions, see Note 4, Business Combinations, Asset Acquisitions and Asset Contributions, to our audited consolidated financial statements included elsewhere in this Annual Report on Form 10-K.
14
Competition
The U.S. acquiring industry is highly competitive, with several large processors accounting for the majority of processing volume; when excluding banks, we ranked 5th among U.S. merchant acquiring as of 2019, according to the 2019 Nilson Report issued in March 2020. When comparing top non-bank U.S. merchant acquirers by volume, FIS (which now includes Worldpay) held the leadership position at the end of 2019 followed by Global Payments (which now includes TSYS), and Fiserv (which now includes First Data).
The concentration at the top of the industry partly reflects consolidation; however, we believe that consolidation has also resulted in many large processors having multiple, inflexible legacy IT systems that are not well equipped to adjust to changing market requirements. We believe that the large merchant acquirers whose innovation has been hindered by these redundant, legacy systems risk losing market share to acquirers with more agile and dynamic IT systems, such as Priority.
Pricing has historically been the key factor influencing the selection of a merchant acquirer. However, providers with more advanced tech-enabled services (primarily online and integrated offerings) have an advantage over providers operating legacy technology and offering undifferentiated services that have come under pricing pressure from higher levels of competition. High quality customer service further differentiates providers as this helps to reduce attrition. Other competitive factors that set acquirers apart include price, partnerships with financial institutions, servicing capability, data security and functionality. Leading acquirers are expected to continue to add additional services to expand cross-selling opportunities, primarily in omni-channel payment solutions, POS software, payments security, customer loyalty and other payments-related offerings.
The largest opportunity for acquirers to expand is within the small to medium-sized merchant market. According to the SMB Group, a markets insight firm for small and medium-sized businesses, the majority of small and medium-sized businesses recognize the upside tech-enabled solutions provide to daily operations and long-term growth potential. As small businesses increasingly demand integrated solutions tailored to specific business functions or industries merchant processors are adopting payment enabled software offerings that combine payments with core business operating software. By subsisting within SMB's critical business software processors are able to improve economic results through better merchant retention and often higher processing margins. Through our MX Merchant platform, we are well-positioned to capitalize on the trend towards integrated solutions, new technology adoption and value added-service utilization in the SMB market.
Government Regulation and Payment Network Rules
We operate in an increasingly complex legal and regulatory environment. We are subject to a variety of federal, state and local laws and regulations and the rules and standards of the payment networks that are utilized to provide our electronic payment services, as more fully described below.
Wall Street Reform and Consumer Protection Act (the "Dodd-Frank Act")
The Dodd-Frank Act of 2010 resulted in significant structural and other changes to the regulation of the financial services industry. The Dodd-Frank Act directed the Board of Governors of the Federal Reserve System (the "Federal Reserve Board") to regulate the debit interchange transaction fees that a card issuer or payment card network receives or charges for an electronic debit transaction. Pursuant to the so-called "Durbin Amendment" to the Dodd-Frank Act, these fees must be "reasonable and proportional" to the cost incurred by the card issuer in authorizing, clearing and settling the transaction. Pursuant to regulations promulgated by the Federal Reserve Board, debit interchange rates for card issuers with assets of $10 billion or more are capped at $0.21 per transaction and an ad valorem component of 5 basis points to reflect a portion of the issuer's fraud losses plus, for qualifying issuers, an additional $0.01 per transaction in debit interchange for fraud prevention costs. The cap on interchange fees has not had a material direct effect on our results of operations.
In addition, the Dodd-Frank Act limits the ability of payment card networks to impose certain restrictions because it allows merchants to: (i) set minimum dollar amounts (not to exceed $10) for the acceptance of a credit card (and allows federal governmental entities and institutions of higher education to set maximum amounts for the acceptance of credit cards) and (ii) provide discounts or incentives to encourage consumers to pay with cash, checks, debit cards or credit cards.
15
The rules also contain prohibitions on network exclusivity and merchant routing restrictions that require a card issuer to enable at least two unaffiliated networks on each debit card, prohibit card networks from entering into exclusivity arrangements and restrict the ability of issuers or networks to mandate transaction routing requirements. The prohibition on network exclusivity has not significantly affected our ability to pass on network fees and other costs to our customers, nor do we expect it to in the future.
The Dodd-Frank Act also created the FSOC, which was established to, among other things, identify risks to the stability of the United States financial system. The FSOC has the authority to require supervision and regulation of nonbank financial companies that the FSOC determines pose a systemic risk to the United States financial system. Accordingly, we may be subject to additional systemic risk-related oversight.
Payment Network Rules and Standards
As a merchant acquirer, we are subject to the rules of Visa, MasterCard, American Express, Discover and other payment networks. In order to provide services, several of our subsidiaries are either registered as service providers for member institutions with MasterCard, Visa and other networks or are direct members of MasterCard, Visa and other networks. Accordingly, we are subject to card association and network rules that could subject us to a variety of fines or penalties that may be levied by the card networks for certain acts or omissions.
Banking Laws and Regulations
The Federal Financial Institutions Examination Council (the "FFIEC") is an interagency body comprised of federal bank and credit union regulators such as the Federal Reserve Board, the Federal Deposit Insurance Corporation ("FDIC"), the National Credit Union Administration, the Office of the Comptroller of the Currency and the Bureau of Consumer Financial Protection. The FFIEC examines large data processors in order to identify and mitigate risks associated with systemically significant service providers, including specifically the risks they may pose to the banking industry.
We are considered by the Federal Financial Institutions Examination Council to be a technology service provider ("TSP") based on the services we provide to financial institutions. As a TSP, we are subject to audits by an interagency group consisting of the Federal Reserve System, FDIC, and the Office of the Comptroller of the Currency.
Privacy and Information Security Laws
We provide services that may be subject to various state, federal and foreign privacy laws and regulations. These laws and regulations include the federal Gramm-Leach-Bliley Act of 1999, which applies to a broad range of financial institutions and to companies that provide services to financial institutions in the United States, certain health care technology laws, including HIPAA and the Health Information Technology for Economic and Clinical Act, and the California Consumer Protection Act ("CCPA"), which establishes a new privacy framework for covered businesses by creating an expanded definition of personal information, establishing new data privacy rights for consumers in the State of California, imposing special rules on the collection of consumer data from minors, and creating a new and potentially severe statutory damages framework for violations of the CCPA and for businesses that fail to implement reasonable security procedures and practices to prevent data breaches. We are also subject to a variety of foreign data protection and privacy laws, including, without limitation, Directive 95/46/EC, as implemented in each member state of the European Union and its successor, the General Data Protection Regulation. Among other things, these foreign and domestic laws, and their implementing regulations, in certain cases restrict the collection, processing, storage, use and disclosure of personal information, require notice to individuals of privacy practices, and provide individuals with certain rights to prevent use and disclosure of protected information. These laws also impose requirements for safeguarding and removal or elimination of personal information.
Anti-Money Laundering and Counter-Terrorism Regulation
The United States federal anti-money laundering laws and regulations, including the Bank Secrecy Act of 1970, as amended by the USA PATRIOT Act of 2001 (collectively, the "BSA"), and the "BSA" implementing regulations administered by FinCEN, a bureau of the United States Department of the Treasury, require, among other things, each financial institution to: (1) develop and implement a risk-based anti-money laundering program; (2) file reports on large currency transactions; (3) file suspicious activity reports if the financial institution believes a customer may be violating U.S. laws and regulations; and (4) maintain transaction records. Given that a number of our clients are financial institutions that are directly subject to U.S. federal anti-money laundering
16
laws and regulations, we have developed an anti-money laundering compliance program to best assist our clients in meeting such legal and regulatory requirements.
We are subject to certain economic and trade sanctions programs that are administered by OFAC of the United States Department of Treasury, which place prohibitions and restrictions on all U.S. citizens and entities with respect to transactions by U.S. persons with specified countries and individuals and entities identified on OFAC's Specially Designated Nationals list (for example, individuals and companies owned or controlled by, or acting for or on behalf of, countries subject to certain economic and trade sanctions, as well as terrorists, terrorist organizations and narcotics traffickers identified by OFAC under programs that are not country specific). Similar anti-money laundering, counter-terrorist financing and proceeds of crime laws apply to movements of currency and payments through electronic transactions and to dealings with persons specified on lists maintained by organizations similar to OFAC in several other countries and which may impose specific data retention obligations or prohibitions on intermediaries in the payment process. We have developed and continue to enhance compliance programs and policies to monitor and address such legal and regulatory requirements and developments. We continue to enhance such programs and policies to ensure that our customers do not engage in prohibited transactions with designated countries, individuals or entities.
Debt Collection and Credit Reporting Laws
Portions of our business may be subject to the Fair Debt Collection Practices Act, the Fair Credit Reporting Act and similar state laws. These debt collection laws are designed to eliminate abusive, deceptive and unfair debt collection practices and may require licensing at the state level. The Fair Credit Reporting Act regulates the use and reporting of consumer credit information and also imposes disclosure requirements on entities that take adverse action based on information obtained from credit reporting agencies. We have procedures in place to comply with the requirements of these laws.
Telephone Consumer Protection Act
We are subject to the Federal Telephone Consumer Protection Act and various state laws to the extent we place telephone calls and short message service ("SMS") messages to clients and consumers. The Telephone Consumer Protection Act regulates certain telephone calls and SMS messages placed using automatic telephone dialing systems or artificial or prerecorded voices.
Escheat Laws
We are subject to U.S. federal and state unclaimed or abandoned property state laws in the United States that requires us to transfer to certain government authorities the unclaimed property of other that we hold when that property has been unclaimed for a certain period of time. Moreover, we are subject to audit by state and foreign regulatory authorities with regard to our escheatment practices.
Other Regulation
The Housing Assistance Tax Act of 2008 requires certain merchant acquiring entities and third-party settlement organizations to provide information returns for each calendar year with respect to payments made in settlement of electronic payment transactions and third-party payment network transactions occurring in that calendar year. Reportable transactions are also subject to backup withholding requirements.
The foregoing is not an exhaustive list of the laws, rules and regulations to which we are subject to and the regulatory framework governing our business is changing continuously.
Intellectual Property
We have developed a payments platform that includes many instances of proprietary software, code sets, workflows and algorithms. It is our practice to enter into confidentiality, non-disclosure, and invention assignment agreements with our employees and contractors, and into confidentiality and non-disclosure agreements with other third parties, to limit access to, and disclosure and use of, our confidential information and proprietary technology. In addition to these contractual measures, we also rely on a combination of trademarks, copyrights, registered domain names, and patent rights to help protect the Priority brand and our other intellectual property.
17
Employees
As of December 31, 2019, we employed 588 employees, of which 580 were employed full-time. None of our employees are represented by a labor union and we have experienced no work stoppages.
Availability of Filings
Our annual reports on Form 10-K, quarterly reports on Form 10-Q, current reports on Form 8-K and amendments to those reports filed or furnished pursuant to Section 13(a) or 15(d) of the Securities Exchange Act of 1934, as amended (the "Exchange Act"), are made available free of charge on our internet web site at www.prth.com, as soon as reasonably practicable after we have electronically filed the material with, or furnished it to, the Securities and Exchange Commission (the "SEC"). The SEC maintains an internet site that contains our reports, proxy and information statements and our other SEC filings. The address of that web site is https://www.sec.gov/. The contents of our websites are not intended to be incorporated by reference into this Annual Report on Form 10-K or in any other report or document we file with the SEC, and any references to our websites are intended to be inactive textual references only.
18
ITEM 1A. RISK FACTORS
An investment in our common stock and our financial results are subject to a number of risks. You should carefully consider the risks described below and all other information contained in this Annual Report on Form 10-K and the documents incorporated by reference. Our business, prospects, financial condition or operating results could be harmed by any of these risks, as well as other risks not currently known to us or that we currently consider immaterial. Additional risks and uncertainties, including those generally affecting the industry in which we operate and risks that management currently deems immaterial, may arise or become material in the future and affect our business.
Risk Factors Related to Our Business
Unauthorized disclosure of merchant or cardholder data, whether through breach of our computer systems, computer viruses, or otherwise, could expose us to liability, protracted and costly litigation and damage our reputation.
We are responsible for data security for ourselves and for third parties with whom we partner, including by contract and under the rules and regulations established by the payment networks, such as Visa, MasterCard, Discover and American Express, as well as debit card networks. These third parties include merchants, our distribution partners and other third-party service providers and agents. We and other third parties collect, process, store and/or transmit sensitive data, such as names, addresses, social security numbers, credit or debit card numbers and expiration dates, driver's license numbers and bank account numbers. We have ultimate liability to the payment networks and our bank sponsors that register us with Visa or MasterCard for our failure or the failure of third parties with whom we contract to protect this data in accordance with payment network requirements. The loss, destruction or unauthorized modification of merchant or cardholder data by us or our contracted third parties could result in significant fines, sanctions and proceedings or actions against us by the payment networks, governmental bodies, consumers or others.
Information security risks for us and our competitors have substantially increased in recent years in part due to the proliferation of new technologies and the increased sophistication, resources and activities of hackers, terrorists, activists, organized crime, and other external parties, including hostile nation-state actors. Examples of such information security risks are the recent Spectre and Meltdown threats which, rather than acting as viruses, were design flaws in many computers that allowed programs to steal data stored in the memory of other running programs and required patch software to correct. The techniques used by these bad actors to obtain unauthorized access, disable or degrade service, sabotage systems or utilize payment systems in an effort to perpetrate financial fraud change frequently and are often difficult to detect. Furthermore, threats may derive from human error, fraud or malice on the part of employees or third parties, or may result from accidental technological failure. For example, certain of our employees have access to sensitive data that could be used to commit identity theft or fraud. Concerns about security increase when we transmit information electronically because such transmissions can be subject to attack, interception or loss. Also, computer viruses can be distributed and spread rapidly over the internet and could infiltrate our systems or those of our contracted third parties. Denial of service or other attacks could be launched against us for a variety of purposes, including interfering with our services or to create a diversion for other malicious activities. These types of actions and attacks and others could disrupt our delivery of services or make them unavailable. Any such actions or attacks against us or our contracted third parties could hurt our reputation, force us to incur significant expenses in remediating the resulting impacts, expose us to uninsured liability, result in the loss of our bank sponsors or our ability to participate in the payment networks, subject us to lawsuits, fines or sanctions, distract our management or increase our costs of doing business. For example, we are presently evaluating whether the recent Spectre and Meltdown threats may require us to replace substantial portions of our current technology hardware and infrastructure in order to mitigate the risk associated with those threats. If we are required to replace a substantial portion of our current technology hardware and infrastructure, either as a result of the Spectre and Meltdown threats or similar future threats, we would likely incur substantial capital expenditures, which may materially and adversely affect our free cash flow and results of operations as a result.
We and our contracted third parties could be subject to breaches of security by hackers, and our encryption of data and other protective measures may not prevent unauthorized access to or use of sensitive data. A breach of a system may subject us to material losses or liability, including payment network fines, assessments and claims for unauthorized purchases with misappropriated credit, debit or card information, impersonation or other similar fraud claims. A misuse of such data or a cybersecurity breach could harm our reputation and deter merchants from using electronic payments generally and our services specifically, thus reducing our revenue. In addition, any such misuse or breach could cause us to incur costs to correct the breaches or failures, expose us to uninsured liability, increase our risk of regulatory scrutiny, subject us to lawsuits, and result in the imposition of material penalties and fines under state and federal laws or by the payment networks. While we maintain insurance coverage that may, subject to
19
policy terms and conditions, cover certain aspects of cyber risks, our insurance coverage may be insufficient to cover all losses. In addition, a significant cybersecurity breach of our systems or communications could result in payment networks prohibiting us from processing transactions on their networks or the loss of our bank sponsors that facilitate our participation in the payment networks, either of which could materially impede our ability to conduct business.
The confidentiality of the sensitive business information and personal consumer information that resides on our systems and our associated third parties' systems are critical to our business. While we maintain controls and procedures to protect the sensitive data we collect, we cannot be certain that these measures will be successful or sufficient to counter all current and emerging technology threats that are designed to breach these systems in order to gain access to confidential information. For example, although we generally require that our agreements with distribution partners or our service providers which may have access to merchant or cardholder data include confidentiality obligations that restrict these parties from using or disclosing any merchant or cardholder data except as necessary to perform their services under the applicable agreements, we cannot guarantee that these contractual measures will prevent the unauthorized use, modification, destruction or disclosure of data or allow us to seek reimbursement from the contracted party. In addition, many of our merchants are small and medium businesses that may have limited competency regarding data security and handling requirements and may thus experience data breaches. Any unauthorized use, modification, destruction or disclosure of data could result in protracted and costly litigation and the incurrence of significant losses.
In addition, our agreements with our bank sponsors and our third-party payment processors (as well as payment network requirements) require us to take certain protective measures to ensure the confidentiality of merchant and consumer data. Any failure to adequately comply with these protective measures could result in fees, penalties, litigation or termination of our bank sponsor agreements or our third-party payment processor agreements.
Any significant unauthorized disclosure of sensitive data entrusted to us would cause significant damage to our reputation and impair our ability to attract new integrated technology and referral partners, and may cause parties with whom we already have such agreements to terminate them.
As a result of information security risks, we must continuously develop and enhance our controls, processes, and practices designed to protect our computer systems, software, data and networks from attack, damage, or unauthorized access. This continuous development and enhancement will require us to expend additional resources, including to investigate and remediate significant information security vulnerabilities detected. Despite our investments in security measures, we are unable to assure that any security measures will not be subject to system or human error.
The payment processing industry is highly competitive and such competition is likely to increase, which may adversely influence the prices we can charge to merchants for our services and the compensation we must pay to our distribution partners, and as a result, our profit margins.
The payment processing industry is highly competitive. We primarily compete in the small to medium-size ("SMB") merchant industry. Competition has increased recently as other providers of payment processing services have established a sizable market share in the SMB merchant acquiring industry. Our primary competitors for SMB merchants in these markets include financial institutions and their affiliates and well-established payment processing companies that target SMB merchants directly and through third parties, including Bank of America Merchant Services, Chase Merchant Services, Elavon, Inc. (a subsidiary of U.S. Bancorp), Wells Fargo Merchant Services, First Data Corporation, Worldpay, Inc., Global Payments/TSYS and Square. We also compete with many of these same entities for the assistance of distribution partners. For example, many of our distribution partners are not exclusive to us but also have relationships with our competitors, such that we have to continually expend resources to maintain those relationships. Our growth will depend on the continued growth of payments with credit, debit and prepaid cards ("Electronic Payments"), particularly Electronic Payments to SMB merchants, and our ability to increase our market share through successful competitive efforts to gain new merchants and distribution partners.
In addition, many financial institutions, subsidiaries of financial institutions or well-established payment-enabled technology providers with which we compete, have substantially greater capital, technological, management and marketing resources than we have. These factors may allow our competitors to offer better pricing terms to merchants and more attractive compensation to distribution partners, which could result in a loss of our potential or current merchants and distribution partners. Competing with financial institutions is also challenging because, unlike us, they often bundle processing services with other banking products and services. This competition may effectively limit the prices we can charge our merchants, cause us to increase the compensation
20
we pay to our distribution partners and require us to control costs aggressively in order to maintain acceptable profit margins. Our current and future competitors may also develop or offer services that have price or other advantages over the services we provide.
We are also facing new, well capitalized, competition from emerging technology and non-traditional payment processing companies as well as traditional companies offering alternative electronic payments services and payment enabled software solutions. If these new entrants gain a greater share of total electronic payments transactions, they could impact our ability to retain and grow our relationships with merchants and distribution partners. Acquirers may be susceptible to the adoption by the broader merchant community of payment enabled software versus terminal based payments.
To acquire and retain a segment of our merchants, we depend in part on distribution partners that may not serve us exclusively and are subject to attrition.
We rely in significant part on the efforts of ISOs, ISVs, and referral partners to market our services to merchants seeking to establish a merchant acquiring relationship. These distribution partners seek to introduce us, as well as our competitors, to newly established and existing SMB merchants, including retailers, restaurants and other businesses. Generally, our agreements with distribution partners (with the exception of a portion of our integrated technology partners and bank referral partners) are not exclusive, and distribution partners retain the right to refer merchants to other merchant acquirers. Gaining and maintaining loyalty or exclusivity can require financial concessions to maintain current distribution partners and merchants or to attract potential distribution partners and merchants from our competitors. We have been required, and expect to be required in the future, to make concessions when renewing contracts with our distribution partners and such concessions can have a material impact on our financial condition or operating performance. If these distribution partners switch to another merchant acquirer, cease operations or become insolvent, we will no longer receive new merchant referrals from them, and we risk losing existing merchants that were originally enrolled by them. Additionally, our distribution partners are subject to the requirements imposed by our bank sponsors, which may result in fines to them for non-compliance and may, in some cases, result in these entities ceasing to refer merchants to us. We cannot accurately predict the level of attrition of our distribution partners or merchants in the future, particularly those merchants we acquired as customers in the portfolio acquisitions we have completed in the past five years, which makes it difficult for us to forecast growth. If we are unable to establish relationships with new distribution partners or merchants, or otherwise increase our transaction processing volume in order to counter the effect of this attrition, our revenues will decline.
We may experience breakdowns in our processing systems that could damage client relations and expose us to liability.
Our core business depends heavily on the reliability of our processing systems. A system outage could have a material adverse effect on our business, financial condition, and results of operations. Not only would we suffer damage to our reputation in the event of a system outage, but we may also be liable to third parties. Many of our contractual agreements with clients require us to pay penalties if our systems do not meet certain operating standards. To successfully operate our business, we must be able to protect our processing and other systems from interruption, including from events that may be beyond our control. Events that could cause system interruptions include, but are not limited to, fire, natural disaster, unauthorized entry, power loss, telecommunications failure, computer viruses, terrorist acts, cyber-attacks and war. Although we have taken steps to protect against data loss and system failures, there is still risk that we may lose critical data or experience system failures. To help protect against these events, we perform the vast majority of disaster recovery operations ourselves, but we also utilize select third parties for certain operations. To the extent we outsource our disaster recovery, we are at risk of the vendor's unresponsiveness or other failures in the event of breakdowns in our systems. In addition, our property and business interruption insurance may not be adequate to compensate us for all losses or failures that may occur.
Governmental regulations designed to protect or limit access to or use of consumer information could adversely affect our ability to effectively provide our services to merchants.
Governmental bodies in the United States have adopted, or are considering the adoption of, laws and regulations restricting the use, collection, storage, and transfer of, and requiring safeguarding of, non-public personal information. Our operations are subject to certain provisions of these laws. Relevant federal privacy laws include the Gramm-Leach-Bliley Act of 1999, which applies directly to a broad range of financial institutions and indirectly, or in some instances directly, to companies that provide services to financial institutions. These laws and regulations restrict the collection, processing, storage, use and disclosure of personal information, require notice to individuals of privacy practices and provide individuals with certain rights to prevent the use and disclosure of protected information. These laws also impose requirements for safeguarding and proper destruction of personal information through the issuance of data security standards or guidelines.
21
The Federal Trade Commission's information safeguarding rules under the Gramm-Leach-Bliley Act require us to develop, implement and maintain a written, comprehensive information security program containing safeguards that are appropriate for our size and complexity, the nature and scope of our activities and the sensitivity of any customer information at issue. Our financial institution clients are subject to similar requirements under the guidelines issued by the federal banking regulators. As part of their compliance with these requirements, each of our financial institution clients is expected to have a program in place for responding to unauthorized access to, or use of, customer information that could result in substantial harm or inconvenience to customers and they are also responsible for our compliance efforts as a major service provider. In addition, regulators are proposing new laws or regulations which could require us to adopt certain cybersecurity and data handling practices. In many jurisdictions consumers must be notified in the event of a data breach, and such notification requirements continue to increase in scope and cost. The changing privacy laws in the United States create new individual privacy rights and impose increased obligations on companies handling personal data.
In addition, there are state laws restricting the ability to collect and utilize certain types of information such as Social Security and driver's license numbers. Certain state laws impose similar privacy obligations as well as obligations to provide notification of security breaches of computer databases that contain personal information to affected individuals, state officers and consumer reporting agencies and businesses and governmental agencies that own data. For example, the CCPA, which went into effect on January 1, 2020, establishes a new privacy framework for covered businesses by creating an expanded definition of personal information, establishing new data privacy rights for consumers in the State of California, imposing special rules on the collection of consumer data from minors, and creating a new and potentially severe statutory damages framework for violations of the CCPA and for businesses that fail to implement reasonable security procedures and practices to prevent data breaches.
In connection with providing services to our merchants, we are required by regulations and contracts with our merchants and with our financial institution referral partners to provide assurances regarding the confidentiality and security of non-public consumer information. These contracts require periodic audits by independent companies regarding our compliance with industry standards and also allow for similar audits regarding best practices established by regulatory guidelines. The compliance standards relate to our infrastructure, components and operational procedures designed to safeguard the confidentiality and security of non-public consumer personal information shared by our merchants with it. Our ability to maintain compliance with these standards and satisfy these audits will affect our ability to attract, grow and maintain business in the future. If we fail to comply with the laws and regulations relating to the protection of data privacy, we could be exposed to suits for breach of contract or to governmental proceedings. In addition, our relationships and reputation could be harmed, which could inhibit our ability to retain existing merchants and distribution partners and obtain new merchants and distribution partners.
If more restrictive privacy laws or rules are adopted by authorities in the future, our compliance costs may increase and our ability to perform due diligence on, and monitor the risk of, our current and potential merchants may decrease, which could create liability for it. Additionally, our opportunities for growth may be curtailed by our compliance capabilities or reputational harm, and our potential liability for security breaches may increase.
Potential distribution partners and merchants may be reluctant to switch to a new merchant acquirer, which may adversely affect our growth.
Many potential distribution partners and merchants worry about potential disadvantages associated with switching merchant acquirers, such as a loss of accustomed functionality, increased costs and business disruption. For our distribution partners, switching to us from another merchant acquirer or integrating with us may be perceived by them as a significant undertaking. As a result, many distribution partners and merchants often resist change. There can be no assurance that our strategies for overcoming potential reluctance to change vendors or initiate a relationship with us will be successful, and this resistance may adversely affect our growth and performance results.
Because we rely on third-party vendors to provide products and services, we could be adversely impacted if they fail to fulfill their obligations.
Our business is dependent on third-party vendors to provide us with certain products and services. For example, we utilize First Data and TSYS to provide authorization and settlement services. Our current amended and restated processing agreement with First Data was entered into in December 2014 and will remain in effect through December 2020 and automatically renews for successive 90-day terms thereafter unless either party provides 30-day written notice of non-renewal to the other party. Our current
22
processing agreement with TSYS is effective January 1, 2019 for a three-year term and automatically renews for a successive one-year term thereafter unless either party provides written notice of non-renewal to the other party.
The failure of these vendors, such as First Data and TSYS, to perform their obligations in a timely manner could adversely affect our operations and profitability. In addition, if we are unable to renew our existing contracts with our most significant vendors, such as First Data and TSYS, we might not be able to replace the related product or service at the same cost, which would negatively impact our profitability. Specifically, while we believe we would be able to locate alternative vendors to provide substantially similar services at comparable rates, or otherwise replicate such services internally, it is not assured that a change will not be disruptive to our business, which could potentially lead to a material adverse impact on our revenue and profitability until resolved.
Changes in card association and debit network fees or products could increase costs or otherwise limit our operations.
From time to time, card associations and debit networks increase the organization and/or processing fees (known as interchange fees) that they charge. It is possible that competitive pressures will result in us absorbing a portion of such increases in the future, which would increase our operating costs, reduce our profit margin, and adversely affect our business, operating results, and financial condition. In addition, the various card associations and networks prescribe certain capital requirements. Any increase in the capital level required would further limit our use of capital for other purposes.
We are subject to extensive government regulation, and any new laws and regulations, industry standards or revisions made to existing laws, regulations or industry standards affecting the electronic payments industry may have an unfavorable impact on our business, financial condition and results of operations.
We are subject to numerous regulations that affect electronic payments including, U.S. financial services regulations, consumer protection laws, escheat regulations, and privacy and information security regulations. Regulation and proposed regulation of our industry has increased significantly in recent years. Changes to statutes, regulations or industry standards, including interpretation and implementation of statutes, regulations or standards, could increase our cost of doing business or affect the competitive balance. For example, the Trump Administration has called for changes in existing regulatory requirements, including those applicable to financial services.
We cannot predict the impact, if any, of such changes on our business. It is likely that some policies adopted by the new administration will benefit us, while others will negatively affect it. Until we know what changes are adopted, we will not know whether in total we benefit from, or are negatively affected by, the changes. Failure to comply with regulations may have an adverse effect on our business, including the limitation, suspension or termination of services provided to, or by, third parties, and the imposition of penalties or fines.
Interchange fees, which are typically paid by the payment processor to the issuer in connection with electronic payments, are subject to increasingly intense legal, regulatory, and legislative scrutiny. In particular, the Dodd-Frank Act significantly changed the United States financial regulatory system, including by regulating and limiting debit card fees charged by certain issuers, allowing merchants to set minimum dollar amounts for the acceptance of credit cards and allowing merchants to offer discounts or other incentives for different payment methods.
Rules implementing the Dodd-Frank Act also contain certain prohibitions on payment network exclusivity and merchant routing restrictions. These restrictions could limit the number of debit transactions, and prices charged per transaction, which would negatively affect our business. The Dodd-Frank Act also created the CFPB, which has assumed responsibility for most federal consumer protection laws, and the FSOC, which has the authority to determine whether any non-bank financial company, which may include us within the definitional scope, should be supervised by the Federal Reserve Board because it is systemically important to the United States financial system. Any such designation would result in increased regulatory burdens on our business, which increases our risk profile and may have an adverse impact on our business, financial condition and results of operations.
We and many of our merchants are subject to Section 5 of the Federal Trade Commission Act prohibiting unfair or deceptive acts or practices. That statement and other laws, rules and or regulations, including the Telemarketing Sales Act, may directly impact the activities of certain of our merchants and, in some cases, may subject us, as the merchant's electronic processor or provider of certain services, to investigations, fees, fines and disgorgement of funds if we were deemed to have improperly aided and abetted or otherwise provided the means and instrumentalities to facilitate the illegal or improper activities of the merchant through our services. Various federal and state regulatory enforcement agencies, including the Federal Trade Commission and state attorneys
23
general, have authority to take action against non-banks that engage in unfair or deceptive practices or violate other laws, rules and regulations and to the extent we are processing payments or providing services for a merchant that may be in violation of laws, rules and regulations, we may be subject to enforcement actions and as a result may incur losses and liabilities that may impact our business.
Our business may also be subject to the Fair Credit Reporting Act (the "FCRA"), which regulates the use and reporting of consumer credit information and also imposes disclosure requirements on entities that take adverse action based on information obtained from credit reporting agencies. We could be liable if our practices under the FCRA are not in compliance with the FCRA or regulations under it.
Separately, the Housing Assistance Tax Act of 2008 included an amendment to the Internal Revenue Code that requires the filing of yearly information returns by payment processing entities and third-party settlement organizations with respect to payments made in settlement of electronic payment transactions and third-party payment network transactions occurring in that calendar year. Transactions that are reportable pursuant to these rules are subject to backup withholding requirements. We could be liable for penalties if our information returns do not comply with these regulations.
These and other laws and regulations, even if not directed at us, may require us to make significant efforts to change our products and services and may require that we incur additional compliance costs and change how we price our services to merchants. Implementing new compliance efforts may be difficult because of the complexity of new regulatory requirements and may cause us to devote significant resources to ensure compliance. Furthermore, regulatory actions may cause changes in business practices by us and other industry participants which could affect how we market, price and distribute our products and services, which could limit our ability to grow, reduce our revenues, or increase our costs. In addition, even an inadvertent failure to comply with laws and regulations, as well as rapidly evolving social expectations of corporate fairness, could damage our business or our reputation.
Failure to comply with the rules established by payment networks or standards established by third-party processors could result in those networks or processors imposing fines or the networks suspending or terminating our registrations through our bank sponsors.
In order to provide our merchant acquiring services, we are registered through our bank sponsors with the Visa and MasterCard networks as service providers for member institutions. As such, we and our merchants are subject to payment network rules. The payment networks routinely update and modify requirements applicable to merchant acquirers including rules regulating data integrity, third-party relationships (such as those with respect to bank sponsors), merchant chargeback standards and PCI DSS. Standards governing our third-party processing agreements may also impose requirements with respect to compliance with PCI DSS.
If we do not comply with the payment network requirements or standards governing our third-party processing agreements, our transaction processing capabilities could be delayed or otherwise disrupted, and recurring non-compliance could result in fines from the payment networks or third-party processors, the payment networks suspending or terminating our registrations which allow us to process transactions on their networks, which would make it impossible for us to conduct our business on our current scale.
Under certain circumstances specified in the payment network rules or our third-party processing agreements, we may be required to submit to periodic audits, self-assessments or other assessments of our compliance with the PCI DSS. Such activities may reveal that we have failed to comply with the PCI DSS. In addition, even if we comply with the PCI DSS, there is no assurance that we will be protected from a security breach. The termination of our registration with the payment networks, or any changes in payment network or issuer rules that limit our ability to provide merchant acquiring services, could have an adverse effect on our payment processing volumes, revenues and operating costs. If an audit or self-assessment under PCI DSS identifies any deficiencies that we need to remediate, the remediation efforts may distract our management team and be expensive and time consuming.
Changes in payment network rules or standards could adversely affect our business, financial condition and results of operations.
Payment network rules are established and changed from time to time by each payment network as they may determine in their sole discretion and with or without advance notice to their participants. The timelines imposed by the payment networks for expected compliance with new rules have historically been, and may continue to be, highly compressed, requiring us to quickly
24
implement changes to our systems which increases the risk of non-compliance with new standards. In addition, the payment networks could make changes to interchange or other elements of the pricing structure of the merchant acquiring industry that would have a negative impact on our results of operations. For example, we closed approximately 1,200 merchant accounts in 2018 in order to ensure compliance with the card association subscription e-commerce criteria.
There may be a decline in the use of electronic payments as a payment mechanism for consumers or adverse developments with respect to the electronic payments industry in general which could adversely affect our business, financial condition and operating results.
Maintaining or increasing our profitability is dependent on consumers and businesses continuing to use credit, debit and prepaid cards at the same or greater rate than previously. If consumers do not continue to use these cards for their transactions or if there is a change in the mix of payments between cash and electronic payments which is adverse to us, our business could decline and we could incur material losses. Regulatory changes may also result in merchants seeking to charge customers additional fees for use of electronic payments. Additionally, in recent years, increased incidents of security breaches have caused some consumers to lose confidence in the ability of retailers to protect their information.
Our business may be adversely affected by the recent coronavirus (COVID-19) outbreak.
In December 2019, a novel strain of coronavirus (COVID-19) was reported to have surfaced in Wuhan, China. In January 2020, this coronavirus spread to other countries, including the U.S., and efforts to contain the spread of this coronavirus intensified. In March 2020, the World Health Organization declared the COVID-19 virus outbreak a global pandemic. The outbreak and any preventative or protective actions that governments or others may take in respect of this coronavirus may result in global business disruptions, including for the Company's customers and business partners, and in a period of business disruption, reduced customer demand and reduced operations. Any resulting financial impact cannot be reasonably estimated at this time but may materially affect our business, financial condition, results of operations, and cash flows, despite the fact that such impacts may not be felt for a significant period of time. Although we are diligently working to ensure that we can operate with minimal disruption, prepare to mitigate the impact of the outbreak on our employees’ health and safety, and address potential business interruptions on ourselves and our customers, the full extent to which the coronavirus could affect the global and U.S. ecomonies and our business will depend on future developments and factors that cannot be predicted.
In order to remain competitive and to continue to increase our revenues and earnings, we must continually update our products and services, a process which could result in increased costs and the loss of revenues, earnings, merchants and distribution partners if the new products and services do not perform as intended or are not accepted in the marketplace.
The electronic payments industry in which we compete is subject to rapid technological changes and is characterized by new technology, product and service introductions, evolving industry standards, changing merchant needs and the entrance of non-traditional competitors. We are subject to the risk that our existing products and services become obsolete, and that we are unable to develop new products and services in response to industry demands. Our future success will depend in part on our ability to develop or adapt to technological changes and the evolving needs of our resellers, merchants and the industry at large. We are continually involved in many business and technology projects, such as CPX, MX Connect and MX Merchant. MX Connect and MX Merchant provide resellers and merchant clients, a flexible and customizable set of business applications that help better manage critical business work functions and revenue performance using core payment processing as our leverage point. Additionally, CPX provides AP automation solutions that offers enterprise clients a bridge for buyer to supplier payments. These may require investment in products or services that may not directly generate revenue. These projects carry the risks associated with any development effort, including difficulty in determining market demand and timing for delivery of new products and services, cost overruns, delays in delivery and performance problems. In addition, new products and offerings may not perform as intended or generate the business or revenue growth expected. Defects in our software and errors or delays in our processing of electronic transactions could result in additional development costs, diversion of technical and other resources from our other development efforts, loss of credibility with current or potential distribution partners and merchants, harm to our reputation, fines imposed by card networks, or exposure to liability claims. Any delay in the delivery of new products or services or the failure to differentiate our products and services could render them less desirable, or possibly even obsolete, to our merchants. Additionally, the market for alternative payment processing products and services is evolving, and we may develop too rapidly or not rapidly enough for us to recover the costs we have incurred in developing new products and services.
25
We may not be able to continue to expand our share of the existing electronic payments industry or expand into new markets, which would inhibit our ability to grow and increase our profitability.
Our future growth and profitability depend, in part, upon our continued expansion within the markets in which we currently operate, the emergence of other markets for electronic payments and our ability to penetrate these markets and our current distribution partners' merchant base. Future growth and profitability of our business may depend upon our ability to penetrate new industries and markets for electronic payments.
Our ability to expand into new industries and markets also depends upon our ability to adapt our existing technology or to develop new technologies to meet the particular needs of each new industry or market. We may not have adequate financial or technological resources to develop effective and secure services or distribution channels that will satisfy the demands of these new industries or markets. Penetrating these new industries or markets may also prove to be more challenging or costly or take longer than we may anticipate. If we fail to expand into new and existing electronic payments industries and markets, we may not be able to continue to grow our revenues and earnings.
Our acquisitions subject us to a variety of risks that could harm our business.
We review and complete selective acquisition opportunities as part of our growth strategy. There can be no assurances that we will be able to complete suitable acquisitions for a variety of reasons, including the identification of and competition for acquisition targets, the need for regulatory approvals, the inability of the parties to agree to the structure or purchase price of the transaction and our inability to finance the transaction on commercially acceptable terms. In addition, any potential acquisition will subject us to a variety of other risks:
• | we may need to allocate substantial operational, financial and management resources in integrating new businesses, technologies and products, and management may encounter difficulties in integrating the operations, personnel or systems of the acquired businesses; |
• | acquisitions may have a material adverse effect on our business relationships with existing or future merchants or distribution partners, in particular, to the extent we consummate acquisitions that increase our sales and distribution capabilities; |
• | we may assume substantial actual or contingent liabilities, known and unknown; |
• | acquisitions may not meet our expectations of future financial performance; |
• | counter-parties to the acquisition transactions may fail to perform their obligations under the applicable acquisition related documents, and/or negligently or intentionally commit misrepresentations as to the condition of the acquired business, asset, or go-forward enterprise; |
• | we may experience delays or reductions in realizing expected synergies or benefits; |
• | we may incur substantial unanticipated costs or encounter other problems associated with acquired businesses or devote time and capital investigating a potential acquisition and not complete the transaction; |
• | we may be unable to achieve our intended objectives for the transaction; and |
• | we may not be able to retain the key personnel, customers and suppliers of the acquired business. |
Additionally, we may be unable to maintain uniform standards, controls, procedures and policies as we attempt to integrate the acquired businesses, and this may lead to operational inefficiencies. These factors related to our acquisition strategy, among others, could have a material adverse effect on our business, financial condition and results of operations.
26
Potential changes in the competitive landscape, including disintermediation from other participants in the payments value chain, could harm our business.
We expect that the competitive landscape will continue to change, including the following developments:
• | rapid and significant changes in technology may result in technology-led marketing that is focused on business solutions rather than pricing, new and innovative payment methods and programs that could place us at a competitive disadvantage and reduce the use of our services; |
• | competitors, distribution partners, and other industry participants may develop products that compete with or replace our value-added products and services; |
• | participants in the financial services, payments and technology industries may merge, create joint ventures or form other business combinations that may strengthen their existing business services or create new payment services that compete with us; and |
• | new services and technologies that we develop may be impacted by industry-wide solutions and standards related to migration to EMV chip technology, tokenization or other security-related technologies. |
Failure to compete effectively against any of these competitive threats could have a material adverse effect on our business, financial condition and results of operations.
We may not be able to successfully manage our intellectual property and may be subject to infringement claims.
We rely on a combination of contractual rights and copyright, trademark, patent and trade secret laws to establish and protect our proprietary technology. Third parties may challenge, circumvent, infringe or misappropriate our intellectual property, or such intellectual property may not be sufficient to permit us to take advantage of current market trends or otherwise to provide competitive advantages, which could result in costly redesign efforts, discontinuance of service offerings or other competitive harm. Others, including our competitors, may independently develop similar technology, duplicate our services or design around our intellectual property and, in such cases, we could not assert our intellectual property rights against such parties. Further, our contractual arrangements may not effectively prevent disclosure of our confidential information or provide an adequate remedy in the event of unauthorized disclosure of our confidential information. We may have to litigate to enforce or determine the scope and enforceability of our intellectual property rights and know-how, which is expensive, could cause a diversion of resources and may not prove successful. Also, because of the rapid pace of technological change in our industry, aspects of our business and our services rely on technologies developed or licensed by third parties, and we may not be able to obtain or continue to obtain licenses and technologies from these third parties on reasonable terms or at all. The loss of intellectual property protection or the inability to license or otherwise use third-party intellectual property could harm our business and ability to compete.
We may also be subject to costly litigation if our services and technology are alleged to infringe upon or otherwise violate a third-party's proprietary rights. Third parties may have, or may eventually be issued, patents that could be infringed by our products, services or technology. Any of these third parties could make a claim of infringement against us with respect to our products, services or technology. We may also be subject to claims by third parties for patent, copyright or trademark infringement, breach of license or violation of other third-party intellectual property rights. Any claim from third parties may result in a limitation on our ability to use the intellectual property subject to these claims. Additionally, in recent years, individuals and groups have been purchasing intellectual property assets for the sole purpose of making claims of infringement or other violations and attempting to extract settlements from companies like ours. Even if we believe that intellectual property related claims are without merit, defending against such claims is time consuming and expensive and could result in the diversion of the time and attention of our management and employees. Claims of intellectual property infringement or violation also might require us to redesign affected products or services, enter into costly settlement or license agreements, pay costly damage awards, or face a temporary or permanent injunction prohibiting us from marketing or selling certain of our products or services. Even if we have an agreement for indemnification against such costs, the indemnifying party, if any in such circumstances, may be unable to uphold our contractual obligations. If we cannot or do not license the infringed technology on reasonable terms or substitute similar technology from another source, our revenue and earnings could be adversely impacted.
27
We are subject to economic and political risk, the business cycles of our merchants and distribution partners and the overall level of consumer and commercial spending, which could negatively impact our business, financial condition and results of operations.
The electronic payments industry depends heavily on the overall level of consumer, commercial and government spending. We are exposed to general economic conditions that affect consumer confidence, consumer spending, consumer discretionary income and changes in consumer purchasing habits. A sustained deterioration in general economic conditions or increases in interest rates could adversely affect our financial performance by reducing the number or aggregate dollar volume of transactions made using electronic payments. If our merchants make fewer sales of their products and services using electronic payments, or consumers spend less money through electronic payments, we will have fewer transactions to process at lower dollar amounts, resulting in lower revenue. In addition, a weakening in the economy could force merchants to close at higher than historical rates, resulting in exposure to potential losses and a decline in the number of transactions that we process. We also have material fixed and semi-fixed costs, including rent, debt service, contractual minimums and salaries, which could limit our ability to quickly adjust costs and respond to changes in our business and the economy.
Global economic, political and market conditions affecting the U.S. markets may adversely affect our business, results of operations and financial condition, including our revenue growth and profitability.
Worldwide financial market conditions, as well as various social and political tensions in the United States and around the world, may contribute to increased market volatility, may have long-term effects on the United States and may cause economic uncertainties or deterioration in the United States. The U.S. markets experienced extreme volatility and disruption during the economic downturn that began in mid-2007, and the U.S. economy was in a recession for several consecutive calendar quarters during the same period. In addition, the fiscal and monetary policies of foreign nations, such as Russia and China, may have a severe impact on U.S. financial markets.
Any new legislation that may be adopted in the United States could significantly affect the regulation of U.S. financial markets. Areas subject to potential change, amendment or repeal include the Dodd-Frank Act and the authority of the Federal Reserve Board and the Financial Stability Oversight Council. The United States may also potentially withdraw from or renegotiate various trade agreements and take other actions that would change current trade policies of the United States. We cannot predict which, if any, of these actions will be taken or, if taken, their effect on the financial stability of the United States. Such actions could have a significant adverse effect on our business, financial condition and results of operations, particularly in view of the regulatory oversight we presently face. We cannot predict the effects of these or similar events in the future on the U.S. economy in general, or specifically on our business model or growth strategy, which typically involves the use of debt financing. To the extent a downturn in the U.S. economy impacts our merchant accounts, regulatory changes increase the burden we face in operating our business, or disruptions in the credit markets prevent us from using debt to finance future acquisitions, our financial condition and results of operations may be materially and adversely impacted.
A substantial portion of all of our merchants are small- and medium-sized businesses, which may increase the impact of economic fluctuations and merchant attrition on it.
We market and sell our solutions primarily to SMB merchants. SMB merchants are typically more susceptible to the adverse effects of economic fluctuations than larger businesses. We experience attrition in merchants and merchant charge volume in the ordinary course of business resulting from several factors, including business closures, transfers of merchants' accounts to our competitors and account closures that we initiate due to heightened credit risks relating to, or contract breaches by, a merchant. Adverse changes in the economic environment or business failures of our SMB merchants may have a greater impact on us than on our competitors who do not focus on SMB merchants to the extent that we do. We cannot accurately predict the level of SMB merchant attrition in the future. If we are unable to establish accounts with new merchants or otherwise increase our payment processing volume in order to counter the effect of this attrition, our revenues will decline.
Our systems and our third-party providers' systems may fail due to factors beyond our control, which could interrupt our service, resulting in our inability to process, cause us to lose business, increase our costs and expose us to liability.
There are factors that may be beyond our control that could affect our operations and business. We depend on the efficient and uninterrupted operation of numerous systems, including our computer network systems, software, data centers and telecommunication networks, as well as the systems and services of our bank sponsors, the payment networks, third-party providers
28
of processing services and other third parties. Our systems and operations or those of our third-party providers, such as our provider of dial-up authorization services, or the payment networks themselves, could be exposed to factors that may be beyond our or their control that could affect our or their operations and business. Such factors include, among other things, fire, natural disasters and health emergencies, including earthquakes, fires, power outages, typhoons, floods, pandemics or epidemics such as the coronavirus, power loss, telecommunications failure, unauthorized entry, computer viruses, denial-of-service attacks, international conflicts, acts of terrorism, wars and civil unrest, human error or sabotage, financial insolvency, labor disruption, international trade disputes, critical infrastructure attacks and the conditions in the domestic and global economies, generally. Any of these events, among others, could materially and adversely affect our financial condition and operating results. For example, the coronavirus may impact the global economy or negatively affect various aspects of our business, including our workforce and demand for our services, which could impact our ability to deliver services to our customers and make it more difficult to meet our expectations and obligations. Our property and business interruption insurance may not be adequate to compensate us for all losses or failures that may occur. At present, our critical operational systems, such as our payment gateway, are fully redundant, while certain of our less critical systems are not. Therefore, certain aspects of our operations may be subject to interruption. Also, while we have disaster recovery policies and arrangements in place, they have not been tested under actual disasters or similar events.
Defects in our systems or those of third parties, errors or delays in the processing of payment transactions, telecommunications failures or other difficulties could result in failure to process transactions, additional operating and development costs, diversion of technical and other resources, loss of revenue, merchants and distribution partners, loss of merchant and cardholder data, harm to our business or reputation, exposure to fraud losses or other liabilities and fines and other sanctions imposed by payment networks.
We rely on other service and technology providers. If they fail or discontinue providing their services or technology generally or to us specifically, our ability to provide services to merchants may be interrupted, and, as a result, our business, financial condition and results of operations could be adversely impacted.
We rely on third parties to provide or supplement bankcard processing services and for infrastructure hosting services. We also rely on third parties for specific software and hardware used in providing our products and services. The termination by our service or technology providers of their arrangements with us or their failure to perform their services efficiently and effectively may adversely affect our relationships with our merchants and, if we cannot find alternate providers quickly, may cause those merchants to terminate their relationship with us.
We also rely in part on third parties for the development and access to new technologies, or updates to existing products and services for which third parties provide ongoing support, which increases the cost associated with new and existing product and service offerings. Failure by these third-party providers to devote an appropriate level of attention to our products and services could result in delays in introducing new products or services, or delays in resolving any issues with existing products or services for which third-party providers provide ongoing support.
Fraud by merchants or others could cause us to incur losses.
We have potential liability for fraudulent electronic payment transactions or credits initiated by merchants or others. Examples of merchant fraud include when a merchant or other party knowingly uses a stolen or counterfeit credit or debit card, card number, or other credentials to record a false sales or credit transaction, processes an invalid card, or intentionally fails to deliver the merchandise or services sold in an otherwise valid transaction. Criminals are using increasingly sophisticated methods to engage in illegal activities such as counterfeiting and fraud. Failure to effectively manage risk and prevent fraud could increase in the future. Increases in chargebacks or other liabilities could have a material adverse effect on our financial condition, results of operations and cash flows.
We incur liability when our merchants refuse or cannot reimburse us for chargebacks resolved in favor of their customers.
We have potential liability for chargebacks associated with the transactions we process. If a billing dispute between a merchant and a cardholder is not ultimately resolved in favor of the merchant, the disputed transaction is "charged back" to the merchant's bank and credited or otherwise refunded to the cardholder. The risk of chargebacks is typically greater with those merchants that promise future delivery of goods and services rather than delivering goods or rendering services at the time of payment. If we or our bank sponsors are unable to collect the chargeback from the merchant's account or reserve account (if applicable), or if the merchant refuses or is financially unable (due to bankruptcy or other reasons) to reimburse the merchant's bank for the chargeback,
29
we may bear the loss for the amount of the refund paid to the cardholder. Any increase in chargebacks not paid by our merchants could increase our costs and decrease our revenues. We have policies to manage merchant-related credit risk and often mitigate such risk by requiring collateral and monitoring transaction activity. Notwithstanding our programs and policies for managing credit risk, it is possible that a default on such obligations by one or more of our merchants could have a material adverse effect on our business.
If we fail to comply with the applicable requirements of the card networks, they could seek to fine us, suspend us or terminate our registrations for membership. If we incur fines or penalties for which our merchants or ISOs are responsible that we cannot collect, we may have to bear the cost of such fines or penalties.
We are subject to card association and network rules that could subject us to a variety of fines or penalties that may be levied by the card networks for certain acts or omissions. The rules of the card networks are set by the card networks themselves and may be influenced by card issuers, some of which are our competitors with respect to processing services. Many banks directly or indirectly sell processing services to merchants in direct competition with us. These banks could attempt, by virtue of their influence on the networks, to alter the networks’ rules or policies to the detriment of non-members, including us. The termination of our registrations or our membership status as a service provider or merchant processor, or any changes in a card association or other network rules or standards, including interpretation and implementation of the rules or standards, that increase the cost of doing business or limit our ability to provide transaction processing services to our customers, could have a material adverse effect on our business, financial condition, results of operations and cash flows. If a merchant or an ISO fails to comply with the applicable requirements of the card associations and networks, we or the merchant or ISO could be subject to a variety of fines or penalties that may be levied by the card associations or networks. If we cannot collect or pursue collection of such amounts from the applicable merchant or ISO, we may have to bear the cost of such fines or penalties, resulting in lower earnings for us. The termination of our registration, or any changes in the Visa or Mastercard rules that would impair our registration, could require us to stop providing Visa and Mastercard payment processing services, which would make it impossible for us to conduct our business on its current scale.
We rely on various financial institutions to provide clearing services in connection with our settlement activities. If we are unable to maintain clearing services with these financial institutions and are unable to find a replacement, our business may be adversely affected.
We rely on various financial institutions to provide clearing services in connection with our settlement activities. If such financial institutions should stop providing clearing services, we must find other financial institutions to provide those services. If we are unable to find a replacement financial institution, we may no longer be able to provide processing services to certain customers, which could negatively affect our revenues, earnings and cash flows.
Our risk management policies and procedures may not be fully effective in mitigating our risk exposure in all market environments or against all types of risks.
We operate in a rapidly changing industry. Accordingly, our risk management policies and procedures may not be fully effective to identify, monitor, manage and remediate our risks. Some of our risk evaluation methods depend upon information provided by others and public information regarding markets, merchants or other matters that are otherwise inaccessible by us. In some cases, that information may not be accurate, complete or up-to-date. Additionally, our risk detection system is subject to a high degree of "false positive" risks being detected, which makes it difficult for us to identify real risks in a timely manner. If our policies and procedures are not fully effective or we are not always successful in capturing all risks to which we are or may be exposed, we may suffer harm to our reputation or be subject to litigation or regulatory actions that materially increase our costs and subject us to reputational damage that could limit our ability to grow and cause us to lose existing merchant clients.
Legal proceedings could have a material adverse effect on our business, financial condition or results of operations.
In the ordinary course of business, we may become involved in various litigation matters, including but not limited to commercial disputes and employee claims, and from time to time may be involved in governmental or regulatory investigations or similar matters arising out of our current or future business. Any claims asserted against us, regardless of merit or eventual outcome, could harm our reputation and have an adverse impact on our relationship with our merchants, distribution partners and other third parties and could lead to additional related claims. Certain claims may seek injunctive relief, which could disrupt the ordinary conduct of our business and operations or increase our cost of doing business. Our insurance or indemnities may not cover all claims that
30
may be asserted against us, and any claims asserted against it, regardless of merit or eventual outcome, may harm our reputation and cause us to expend resources in our defense. Furthermore, there is no guarantee that we will be successful in defending ourselves in future litigation. Should the ultimate judgments or settlements in any pending litigation or future litigation or investigation significantly exceed our insurance coverage, they could have a material adverse effect on our business, financial condition and results of operations.
The loss of, for example, key personnel or of our ability to attract, recruit, retain and develop qualified employees could adversely affect our business, financial condition and results of operations.
Our success depends upon the continued services of our senior management and other key personnel who have substantial experience in the electronic payments industry and the markets in which we offer our services. In addition, our success depends in large part upon the reputation within the industry of our senior managers who have developed relationships with our distribution partners, payment networks and other payment processing and service providers. Further, in order for us to continue to successfully compete and grow, we must attract, recruit, develop and retain personnel who will provide us with expertise across the entire spectrum of our intellectual capital needs. Our success is also dependent on the skill and experience of our sales force, which we must continuously work to maintain. While we have many key personnel who have substantial experience with our operations, we must also develop our personnel to provide succession plans capable of maintaining the continuity of our operations. The market for qualified personnel is competitive, and we may not succeed in recruiting additional personnel or may fail to effectively replace current personnel who depart with qualified or effective successors.
In addition, we rely heavily on several senior key directors and executive officers, including Mr. Thomas Priore, who is our President, Chief Executive Officer and Chairman, who helped found Priority. Our future success will continue to depend on the diligence, skill, network of business contacts and continued service of Thomas Priore, together with members of our senior management team. We cannot assure you that unforeseen business, medical, personal or other circumstances would not lead any such individual to terminate his relationship with us. The loss of Thomas Priore, or any of the members of our senior management team, could have a material adverse effect on our ability to achieve our growth strategy as well as on our future financial condition and results of operations. Failure to retain or attract key personnel could impede our ability to grow and could result in our inability to operate our business profitably. In addition, contractual obligations related to confidentiality, assignment of intellectual property rights, and non-solicitation may be ineffective or unenforceable and departing employees may share our proprietary information with competitors in ways that could adversely impact us or seek to solicit our distribution partners or merchants or recruit our key personnel to competing businesses.
Changes in tax laws and regulations could adversely affect our results of operations and cash flows from operations.
Our operations are subject to tax by U.S. federal, state, local, and non-U.S. taxing jurisdictions. Changes in tax laws in our significant tax jurisdictions could materially increase the amount of taxes we owe, thereby negatively impacting our results of operations as well as our cash flows from operations. For example, restrictions on the deductibility of interest expense in a U.S. jurisdiction without a corresponding reduction in statutory tax rates could negatively impact our effective tax rate, financial position, results of operations, and cash flows in the period that such a change occurs and future periods.
Our reported financial results may be adversely affected by changes in U.S. GAAP.
Generally accepted accounting principles in the United States ("U.S. GAAP") are subject to interpretation by the Financial Accounting Standards Board ("FASB"), the American Institute of Certified Public Accountants, the SEC and various bodies formed to promulgate and interpret appropriate accounting principles. A change in these principles or interpretations, including changes related to revenue recognition, could have a significant effect on our reported financial results, and could affect the reporting of transactions completed before the announcement of a change.
We are an "emerging growth company" and the reduced disclosure requirements applicable to emerging growth companies may make our securities less attractive to investors.
We are an "emerging growth company," as defined in the Jumpstart Our Business Startups Act of 2012 ("JOBS Act"). We may remain an "emerging growth company" until the fiscal year ending December 31, 2021. However, if our non-convertible debt issued within a three-year period or revenues exceeds $1.07 billion, or the market value of our common stock that are held by non-affiliates exceeds $700 million on the last day of the second fiscal quarter of any given fiscal year, we would cease to be an emerging
31
growth company as of the following fiscal year. As an emerging growth company, we are not required to comply with the auditor attestation requirements of Section 404 of the Sarbanes-Oxley Act of 2002, have reduced disclosure obligations regarding executive compensation in our periodic reports and proxy statements, and are exempt from the requirements of holding a non-binding advisory vote on executive compensation and stockholder approval of any golden parachute payments not previously approved. Additionally, as an emerging growth company, we have elected to delay the adoption of new or revised accounting standards that have different effective dates for public and private companies until those standards apply to private companies. As such, our financial statements may not be comparable to companies that comply with public company effective dates. We cannot predict if investors will find our common stock less attractive because we will rely on these exemptions. If some investors find our common stock less attractive as a result, there may be a less active market for our common stock, our share price may be more volatile and the price at which our securities trade could be less than if we did not use these exemptions.
Material weaknesses have been identified in our internal control over financial reporting.
We have identified material weaknesses in internal controls over our financial reporting that remain unremediated. A material weakness is defined as a deficiency, or a combination of deficiencies, in internal control over financial reporting, such that there is a reasonable possibility that a material misstatement of our financial statements will not be prevented or detected on a timely basis. The material weaknesses identified were lack of sufficient accounting and financial reporting resources, deficiencies in certain aspects of our financial statement review and close processes, and functional limitations of the accounting and financial reporting system.
We performed an evaluation of our disclosure controls and internal control over financial reporting as of December 31, 2019 in accordance with the provisions of the Sarbanes-Oxley Act of 2002. As a result of these evaluations, we determined that our disclosure controls and procedures were not effective as of December 31, 2019 and we did not maintain effective internal control over financial reporting as of December 31, 2019, due to the material weaknesses described above.
We have taken steps to enhance our internal control environment and plan to take additional steps to remediate the material weaknesses. Although we plan to complete this remediation process as quickly as possible, we cannot at this time estimate how long it will take.
Risk Factors Related to Our Indebtedness
We face risks related to our substantial indebtedness.
As of December 31, 2019, we had total outstanding debt of $495.5 million compared to $412.7 million as of December 31, 2018, an increase of $82.8 million or 20.1%, consisting of outstanding debt of $400.3 million under a senior credit facility with a syndicate of lenders (the "Senior Credit Facility") and $95.1 million under a subordinated term loan (including accrued payment-in-kind interest through December 31, 2019) (the "Subordinated Term Loan"). In addition, the Senior Credit Facility includes a $25.0 million revolving credit facility, which had outstanding draws totaling $11.5 million as of December 31, 2019. Our total interest expense was $40.7 million, $29.9 million, and $25.1 million in 2019, 2018, and 2017, respectively. In the future, we may elect to use additional forms of indebtedness, including publicly or privately offered notes, which may further increase our levels of indebtedness. See "Item 7 - Management's Discussion and Analysis of Financial Condition and Results of Operations — Liquidity and Capital Resources" for a description of our existing credit facilities.
Our current and future levels of indebtedness could have important consequences to us, including, but not limited to:
• | increasing our vulnerability to, and reducing our flexibility to respond to, general adverse economic and industry conditions; |
• | requiring the dedication of a substantial portion of our cash flow from operations to the payment of principal of, and interest on, our indebtedness, thereby reducing the availability of such cash flow to fund working capital, capital expenditures, acquisitions, joint ventures or other general corporate purposes; |
• | limiting our flexibility in planning for, or reacting to, changes in our business and the competitive environment; and |
32
• | limiting our ability to borrow additional funds and increasing the cost of any such borrowing. |
Substantially all of our indebtedness is floating rate debt. As a result, an increase in interest rates generally, such as those we have recently experienced, would adversely affect our profitability. We may enter into pay-fixed interest rate swaps to limit our exposure to changes in floating interest rates. Such instruments may result in economic losses should interest rates decline to a point lower than our fixed rate commitments. We would be exposed to credit-related losses, which could impact the results of operations in the event of fluctuations in the fair value of the interest rate swaps due to a change in the credit worthiness or non-performance by the counterparties to the interest rate swaps.
We may incur substantial additional indebtedness in the future. Although the agreements governing our existing indebtedness contain restrictions on the incurrence of additional indebtedness, these restrictions are subject to several significant qualifications and exceptions and, under certain circumstances, the amount of indebtedness that could be incurred in compliance with these restrictions could be substantial.
Changes in the method for determining the London Interbank Offered Rate ("LIBOR") and the potential replacement of the LIBOR benchmark interest rate could adversely affect our business, financial condition, results of operations and cash flows.
The majority of our current indebtedness bears interest at a variable rate based on LIBOR, and we may incur additional indebtedness based on LIBOR. In July 2017, the United Kingdom’s Financial Conduct Authority ("FCA"), a regulator of financial services firms and financial markets in the United Kingdom, stated that they will plan for a phase out of regulatory oversight of LIBOR interest rates indices. The FCA has indicated they will support the LIBOR indices through 2021, to allow for an orderly transition to an alternative reference rate. The Alternative Reference Rates Committee has proposed the Secured Overnight Financing Rate ("SOFR") as its recommended alternative to LIBOR, and the Federal Reserve Bank of New York began publishing SOFR rates in April 2018. SOFR is intended to be a broad measure of the cost of borrowing cash overnight collateralized by U.S. Treasury securities.
We are evaluating the potential effect of the eventual replacement of the LIBOR benchmark interest rate, including the possibility of SOFR as the dominant replacement. The market transition away from LIBOR and towards SOFR is expected to be gradual and complicated, including the development of term and credit adjustments to accommodate differences between LIBOR and SOFR. Introduction of an alternative rate also may introduce additional basis risk for market participants as an alternative index is utilized along with LIBOR. There can be no guarantee that SOFR will become widely used and that alternatives may or may not be developed with additional complications. We are not able to predict whether LIBOR will cease to be available after 2021, whether SOFR will become a widely accepted benchmark in place of LIBOR, or what the effect of such a possible transition to SOFR may be on our business, financial condition, results of operations or cash flows.
Our Senior Credit Facility requires us to maintain certain leverage ratios.
Certain of our subsidiaries are borrowers (the "Borrowers") or guarantors under the Senior Credit Facility. The Senior Credit Facility includes a Total Net Leverage Ratio covenant, which requires a Total Net Leverage Ratio of no more than 8.00:1.00 as of December 31, 2019 and March 31, 2020, and further steps down periodically to be no more than 5.50:1.00 at December 31, 2022 for each quarter thereafter. The Senior Credit Facility defines Total Net Leverage Ratio as the consolidated total debt of the Borrowers, less unrestricted cash subject to certain restrictions, divided by the Consolidated Adjusted EBITDA (a non-GAAP measure) of the Borrowers, as defined in the agreement. See "Item 7 - Management's Discussion and Analysis of Financial Condition and Results of Operations - Certain Non-GAAP Measures."
If the Borrowers were to fail to comply with the Total Net Leverage Ratio covenant, it would trigger an event of default under the Senior Credit Facility, as described below. As of December 31, 2019, the Borrowers' were in compliance with the required Total Net Leverage Ratio.
Upon the occurrence of an event of default under the credit agreements relating to our credit facilities or any future debt instruments we may issue, the lenders thereunder could elect to accelerate payments due and terminate all commitments to extend further credit. Consequently, we may not have sufficient assets to repay amounts then outstanding under any such indebtedness.
33
Under the terms of our existing credit facilities, upon the occurrence of an event of default, the lenders will be able to elect to declare all amounts outstanding under such credit facilities to be immediately due and payable and terminate all commitments to lend additional funds. Among other reasons, an event of default could be declared by the lenders in the event we fail to pay when due the interest, principal of or premium on any loan, we fail to comply with certain financial and operational covenants or any negative covenant, or event of default with respect to certain other credit facilities or debt instruments we may issue in the future.
Any future credit facilities or debt instruments we may issue will likely contain similar, or potentially more expansive, events of default as compared to those set forth in the terms of our existing credit facilities, including those breach or defaults with respect to any of our other outstanding debt instruments. Our existing credit facilities are secured by a pledge of substantially all of our assets and any indebtedness we incur in the future may also be secured.
The credit agreements governing our existing credit facilities and any other debt instruments we may issue in the future will contain restrictive covenants that may impair our ability to conduct business.
The credit agreements governing our existing credit facilities contain operating covenants and financial covenants that may limit management's discretion with respect to certain business matters. In addition, any debt instruments we may issue in the future will likely contain similar operating and financial covenants restricting our business. Among other things, these covenants will restrict our ability to:
• | pay dividends, or redeem or purchase equity interests; |
• | incur additional debt; |
• | incur liens; |
• | change the nature of our business; |
• | engage in transactions with affiliates; |
• | sell or otherwise dispose of assets; |
• | make acquisitions or other investments; and |
• | merge or consolidate with other entities. |
In addition, we are required to comply with certain restrictions on the ratio of our indebtedness to our "Consolidated Adjusted EBITDA" (a non-GAAP measure as defined in the credit agreements governing our existing credit facilities).
As a result of these covenants and restrictions, we will be limited in our ability to pay dividends or buy back stock and how we conduct our business, and we may be unable to raise additional debt or other financings to compete effectively or to take advantage of new business opportunities. The terms of any future indebtedness we may incur could also include even more restrictive covenants. Failure to comply with such restrictive covenants may lead to default and acceleration and may impair our ability to conduct business. We may not be able to maintain compliance with these covenants in the future and, if we fail to do so, that we will be able to obtain waivers from the lenders and/or amend the covenants, which may result in foreclosure on our assets and our common stock becoming worthless. See "Item 7 - Management's Discussion and Analysis of Financial Condition and Results of Operations — Liquidity and Capital Resources" for a description of our existing credit facilities.
Risks Factors Related to Our Common Stock
You may not be able to resell shares of our common stock at or above the price you paid or at all, and you could lose all or part of your investment as a result.
The trading price of our common stock is likely to be volatile. The stock market recently has experienced volatility. This volatility often has been unrelated or disproportionate to the operating performance of particular companies. You may not be able to resell
34
your shares at or above the initial price you paid due to a number of factors such as those listed in "—Risks Factors Related to our Business" and the following:
• | results of operations that vary from the expectations of securities analysts and investors; |
• | results of operations that vary from those of our competitors; |
• | changes in expectations as to our future financial performance, including financial estimates and investment recommendations by securities analysts and investors; |
• | declines in the market prices of stocks generally; |
• | strategic actions by us or our competitors; |
• | announcements by us or our competitors of significant contracts, new products, acquisitions, joint marketing relationships, joint ventures, other strategic relationships, or capital commitments; |
• | changes in general economic or market conditions or trends in our industry or markets; |
• | changes in business or regulatory conditions; |
• | future sales of our common stock or other securities; |
• | investor perceptions or the investment opportunity associated with our common stock relative to other investment alternatives; |
• | the public's response to press releases or other public announcements by us or third parties, including our filings with the SEC; |
• | announcements relating to litigation; |
• | guidance, if any, that we provide to the public, any changes in this guidance, or our failure to meet this guidance; |
• | the development and sustainability of an active trading market for our stock; |
• | changes in accounting principles; |
• | occurrences of extreme or inclement weather; and |
• | other events or factors, including those resulting from natural disasters, war, acts of terrorism, pandemics, or responses to these events. |
These broad market and industry fluctuations may adversely affect the market price of our common stock, regardless of our actual operating performance. In addition, price volatility may be greater if the public float and trading volume of our common stock is low.
In the past, following periods of market volatility, stockholders have instituted securities class action litigation. If we were involved in securities litigation, it could have a substantial cost and divert resources and the attention of executive management from our business regardless of the outcome of such litigation.
Because we have no current plans to pay cash dividends on our common stock for the foreseeable future, you may not receive any return on investment unless you sell your common stock for a price greater than that which you paid for it.
We intend to retain future earnings, if any, for future operations, expansion, and debt repayment and have no current plans to pay any cash dividends for the foreseeable future. The declaration, amount, and payment of any future dividends on shares of common
35
stock will be at the sole discretion of our board of directors. Our board of directors may take into account general and economic conditions, our financial condition, and results of operations, our available cash and current and anticipated cash needs, capital requirements, contractual, legal, tax, and regulatory restrictions, implications on the payment of dividends by us to our stockholders or by our subsidiaries to us, and such other factors as our board of directors may deem relevant. In addition, our ability to pay dividends is limited by covenants of our existing and outstanding indebtedness and may be limited by covenants of any future indebtedness we or our subsidiaries incur. As a result, you may not receive any return on an investment in our common stock unless you sell our common stock for a price greater than that which you paid for it.
If securities analysts do not publish research or reports about our business or if they downgrade our common stock or our sector, our stock price and trading volume could decline.
The trading market for our common stock will rely in part on the research and reports that industry or financial analysts publish about us or our business. We do not control these analysts. Furthermore, if one or more of the analysts who do cover us downgrades our common stock or our industry, or the stock of any of our competitors, or publish inaccurate or unfavorable research about our business, the price of our common stock could decline. If one or more of these analysts ceases coverage of the combined company or fails to publish reports on us regularly, we could lose visibility in the market, which in turn could cause our stock price or trading volume to decline.
Anti-takeover provisions in our organizational documents could delay or prevent a change of control.
Certain provisions of our Amended and Restated Certificate of Incorporation and our Amended and Restated Bylaws have an anti-takeover effect and may delay, defer, or prevent a merger, acquisition, tender offer, takeover attempt, or other change of control transaction that a stockholder might consider in its best interest, including those attempts that might result in a premium over the market price for the shares held by our stockholders.
These provisions provide for, among other things:
• | the ability of our board of directors to issue one or more series of preferred stock; |
• | advance notice for nominations of directors by stockholders and for stockholders to include matters to be considered at our annual meetings; and |
• | certain limitations on convening special stockholder meetings. |
In addition, these anti-takeover provisions could make it more difficult for a third-party to acquire us, even if the third-party's offer may be considered beneficial by many of our stockholders. As a result, our stockholders may be limited in their ability to obtain a premium for their shares.
Mr. Thomas Priore, our President, Chief Executive Officer and Chairman, controls the Company, and his interests may conflict with ours or yours in the future.
Thomas Priore and his affiliates have the ability to elect all of the members of our board of directors and thereby control our policies and operations, including the appointment of management, future issuances of our common stock or other securities, the payment of dividends, if any, on our common stock, the incurrence or modification of debt by us, amendments to our Amended and Restated Certificate of Incorporation and our Amended and Restated Bylaws, and the entering into of extraordinary transactions, and their interests may not in all cases be aligned with your interests. In addition, Thomas Priore may have an interest in pursuing acquisitions, divestitures, and other transactions that, in his judgment, could enhance his investment, even though such transactions might involve risks to you. For example, he could cause us to make acquisitions that increase our indebtedness or cause us to sell revenue-generating assets. Additionally, in certain circumstances, acquisitions of debt at a discount by purchasers that are related to a debtor can give rise to cancellation of indebtedness income to such debtor for U.S. federal income tax purposes.
Our Amended and Restated Certificate of Incorporation provides that neither he nor any of his affiliates, or any director who is not employed by us (including any non-employee director who serves as one of our officers in both his director and officer capacities) will have any duty to refrain from engaging, directly or indirectly, in the same business activities or similar business activities or lines of business in which we operate. So long as Thomas Priore continues to own a significant amount of our combined
36
voting power, even if such amount is less than 50%, he will continue to be able to strongly influence or effectively control our decisions. Furthermore, so long as Thomas Priore and his respective affiliates collectively own at least 50% of all outstanding shares of our common stock entitled to vote generally in the election of directors, they will be able to appoint individuals to our board of directors. In addition, given his level of control, Thomas Priore will be able to determine the outcome of all matters requiring stockholder approval and will be able to cause or prevent a change of control of the Company or a change in the composition of our board of directors and could preclude any unsolicited acquisition of the Company. The concentration of ownership could deprive you of an opportunity to receive a premium for your shares of common stock as part of a sale of the Company and ultimately might affect the market price of our common stock.
We are a "controlled company" within the meaning of the rules of the Nasdaq Stock Market, LLC ("Nasdaq") and, as a result, qualify for, and rely on, exemptions from certain corporate governance requirements. You will not have the same protections as those afforded to stockholders of companies that are subject to such governance requirements.
Mr. Thomas Priore controls a majority of the voting power of our outstanding common stock. As a result, we are a "controlled company" within the meaning of the corporate governance standards of Nasdaq. Under these rules, a company of which more than 50% of the voting power is held by an individual, group or another company is a "controlled company" and may elect not to comply with certain corporate governance requirements, including:
• | the requirement that a majority of our board of directors consist of independent directors; |
• | the requirement that we have a Nominating/Corporate Governance Committee that is composed entirely of independent directors with a written charter addressing the committee's purpose and responsibilities; and |
• | the requirement that we have a Compensation Committee that is composed entirely of independent directors with a written charter addressing the committee's purpose and responsibilities. |
We utilize and intend to continue to utilize these exemptions. As a result, we do not have a majority of independent directors and our Compensation Committee and Nominating/Corporate Governance Committee does not consist entirely of independent directors. Accordingly, our stockholders do not have the same protections afforded to stockholders of companies that are subject to all of the corporate governance requirements of Nasdaq.
Risk Factors Related to Our Warrants
We may redeem your unexpired warrants prior to their exercise at a time that is disadvantageous to you, thereby making your warrants worthless.
We have the ability to redeem outstanding warrants (the "Warrants") at any time after they become exercisable and prior to their expiration, at $0.01 per warrant, if the last reported sales price (or the closing bid price of our common stock in the event the common stock is not traded on any specific trading day) of the common stock equals or exceeds $16.00 per share for any 20 trading days within a 30-trading day period ending on the third business day prior to the date we send proper notice of such redemption, provided that on the date we give notice of redemption and during the entire period thereafter until the time we redeem the Warrants, we have an effective registration statement under the Securities Act covering the common stock issuable upon exercise of the Warrants and a current prospectus relating to them is available or cashless exercise is exempt from the registration requirements under the Securities Act. If and when the Warrants become redeemable by us, we may exercise our redemption right even if we are unable to register or qualify the underlying securities for sale under all applicable state securities laws. Redemption of the outstanding Warrants could force a warrant holder: (i) to exercise Warrants and pay the exercise price therefore at a time when it may be disadvantageous for you to do so, (ii) to sell Warrants at the then-current market price when you might otherwise wish to hold your Warrants or (iii) to accept the nominal redemption price which, at the time the outstanding Warrants are called for redemption, may be substantially less than the market value of your Warrants.
37
The liquidity of the Warrants may be limited.
There is a limited trading market for our Warrants, which might adversely affect the liquidity, market price and price volatility of the Warrants. In addition, our publicly-traded Warrants have been removed from quotation on The Nasdaq Global Market. As a result, investors in our Warrants may find it more difficult to dispose of or obtain accurate quotations as to the market value of our Warrants, and the ability of our stockholders to sell our Warrants in the secondary market has been materially limited.
38
ITEM 1B. UNRESOLVED STAFF COMMENTS
N/A
ITEM 2. PROPERTIES
We maintain several offices across the United States, all of which we lease.
Our key office locations include:
• | corporate headquarters in Alpharetta, Georgia; |
• | administrative office in Hicksville, NY; and |
• | administrative office in New York, NY. |
We lease several small facilities for sales and operations. Our current facilities meet the needs of our employee base and can accommodate our currently contemplated growth.
ITEM 3. LEGAL PROCEEDINGS
We are involved in certain other legal proceedings and claims, which arise in the ordinary course of business. In the opinion of the Company, based on consultations with inside and outside counsel, the results of any of these ordinary course matters, individually and in the aggregate, are not expected to have a material effect on our results of operations, financial condition, or cash flows. As more information becomes available and we determine that an unfavorable outcome is probable on a claim and that the amount of probable loss that we will incur on that claim is reasonably estimable, we will record an accrued expense for the claim in question. If and when we record such an accrual, it could be material and could adversely impact our results of operations, financial condition, and cash flows.
ITEM 4. MINE SAFETY DISCLOSURES
N/A
39
PART II.
ITEM 5. MARKET FOR REGISTRANT'S COMMON EQUITY, RELATED STOCKHOLDER MATTERS AND ISSUER PURCHASES OF EQUITY SECURITIES
Market Information
Prior to the consummation of the Business Combination on July 25, 2018, MI Acquisitions' common stock, warrants and units were each listed on The Nasdaq Capital Market under the symbol "MACQ," "MACQW" and "MACQU," respectively. Upon the consummation of the Business Combination and the change of the Company's name to Priority Technology Holdings, Inc., our common stock commenced trading on The Nasdaq Global Market under the symbol "PRTH" and our warrants and units commenced trading under the symbols "PRTHW" and "PRTHU," respectively. As of March 6, 2019, our warrants and units were delisted from trading on The Nasdaq Global Market. Following their delisting, our warrants and units became available to be quoted in the over-the-counter market under the symbols "PRTHW" and "PRTHU," respectively.
Holders
As of March 26, 2020, we had 36 holders of record of our common stock. This figure does not include the number of persons whose securities are held in nominee or "street" name accounts through brokers. With the exception of one holder, all of our outstanding warrants and units were held in nominee or "street" name accounts through brokers.
Dividends
We have never declared or paid, and do not anticipate declaring or paying in the foreseeable future, any cash dividends on our common stock.
Recent Sales of Unregistered Securities
None.
Purchases of Equity Securities by the Issuer and Affiliated Purchasers
On December 19, 2018, the Company's Board of Directors authorized a stock repurchase program. Under the program, the Company was authorized to purchase up to $5.0 million of its outstanding common stock from time to time through June 30, 2019. During the second quarter of 2019, the Company repurchased a total of 451,224 shares of its common stock at an average price of $5.29 per share. Total cash paid by the Company was approximately $2.4 million.
40
ITEM 6. SELECTED FINANCIAL DATA
The following table sets forth selected historical financial information derived from our audited consolidated financial statements included elsewhere in this Annual Report on Form 10-K as of December 31, 2019 and 2018 and for the years then ended. You should read the following selected financial data in conjunction with the sections entitled "Item 7 - Management's Discussion and Analysis of Financial Condition and Results of Operations" and the audited consolidated financial statements and the related notes appearing elsewhere in this Annual Report on Form 10-K.
(in thousands except per share amounts) | Year Ended December 31, | ||||||||||||
As recasted | As restated | As restated | |||||||||||
2019 (a) | 2018 (b) | 2017 (b) | |||||||||||
Statement of operations data | |||||||||||||
Revenues | $ | 371,854 | $ | 375,822 | $ | 382,167 | |||||||
Operating expenses | 364,670 | 359,429 | 347,673 | ||||||||||
Interest expense | (40,653 | ) | (29,935 | ) | (25,058 | ) | |||||||
Other, net | 710 | (6,784 | ) | (5,597 | ) | ||||||||
(Loss) income before income taxes | (32,759 | ) | (20,326 | ) | 3,839 | ||||||||
Income tax expense (benefit) | 830 | (2,490 | ) | — | |||||||||
Net (loss) income | $ | (33,589 | ) | $ | (17,836 | ) | $ | 3,839 | |||||
Basic and diluted (loss) earnings per share | $ | (0.50 | ) | $ | (0.29 | ) | $ | 0.05 | |||||
(a) Recasted to reflect the full retrospective adoption of ASC 606. See Note 1 to the consolidated financial statements in Item 8 of this Annual Report on Form 10-K. | |||||||||||||
(b) Recasted to reflect the full retrospective adoption of ASC 606 and restated to reflect the corrections of errors. See Note 1 and Note 2 to the consolidated financial statements in Item 8 of the Annual Report on Form 10-K. | |||||||||||||
(in thousands) | Year Ended December 31, | ||||||||||||
2019 | 2018 | 2017 | |||||||||||
Statement of cash flows data | |||||||||||||
Net cash provided by (used in): | |||||||||||||
Operating activities | $ | 39,364 | $ | 31,348 | $ | 36,869 | |||||||
Investing activities | $ | (97,747 | ) | $ | (108,928 | ) | $ | (9,037 | ) | ||||
Financing activities | $ | 75,017 | $ | 67,252 | $ | (25,375 | ) | ||||||
(in thousands) | As of December 31, | |||||||
2019 | 2018 (a) | |||||||
Balance Sheet data | ||||||||
Cash and restricted cash | $ | 50,465 | $ | 33,831 | ||||
Total assets | $ | 464,505 | $ | 379,296 | ||||
Total liabilities | $ | 585,194 | $ | 473,314 | ||||
Total stockholders' deficit | $ | (120,689 | ) | $ | (94,018 | ) | ||
Shares of common stock outstanding | 67,061 | 67,038 | ||||||
(a) Restated to reflect the corrections of errors. See Note 2 to the consolidated financial statements in Item 8 of the Annual Report on Form 10-K. | ||||||||
41
ITEM 7. MANAGEMENT'S DISCUSSION AND ANALYSIS OF FINANCIAL CONDITION AND RESULTS OF OPERATIONS
You should read the following management's discussion and analysis of financial condition and results of operations together with "Item 6 - Selected Financial Data" and our audited financial statements and the related notes included elsewhere in this Annual Report on Form 10-K. This discussion contains forward-looking statements about our business, operations and industry that involve risks and uncertainties, such as statements regarding our plans, objectives, expectations and intentions. Our future results and financial condition may differ materially from those currently anticipated by us as a result of the factors described in the sections entitled "Item 1A - Risk Factors" and "Cautionary Note Regarding Forward Looking Statements."
Certain amounts in this section may not foot due to rounding.
For a description and additional information about our three reportable segments, see Note 18, Segment Information, contained in "Item 8 - Financial Statements and Supplementary Data" of this Annual Report on Form 10-K.
Full Retrospective Adoption of ASC 606, Revenues from Contracts with Customers, and Error Corrections in Prior Periods
As disclosed in Notes 1 and 2 to our consolidated financial statements presented in Item 8 of the Annual Report on Form 10-K, we have:
1) recasted our consolidated statements of operations for the years ended December 31, 2019, 2018, and 2017 for the full retrospective adoption of ASC 606, Revenue from Contracts with Customers; and
2) restated our consolidated statements of operations and our consolidated statements of cash flows for the years ended December 31, 2018 and 2017, our consolidated balance sheet as of December 31, 2018, and our consolidated statements of stockholders' equity (deficit) for the years ended December 31, 2018 and 2017 including beginning stockholders equity as of January 1, 2017 for the cumulative effects for reporting periods prior to 2017. The revisions were the result of certain error corrections that occurred in reporting periods prior to 2019.
All results of operations, financial condition, cash flows, and other matters disclosed and discussed in this Item 7 reflect the results of the above revisions.
Additional information about the restatement can be found in the following notes to our consolidated financial statements in Item 8 of this Annual Report on Form 10-K:
• | Note 18, Segment Information |
• | Note 20, Selected Quarterly Financial Results (Unaudited) |
Results of Operations
This section includes a summary of our results of operations for the periods presented followed by a detailed discussion of our results for (i) the year ended December 31, 2019 compared to the year ended December 31, 2018 and (ii) the year ended December 31, 2018 compared to the year ended December 31, 2017. We have derived this data, except key indicators for merchant bankcard processing dollar values and transaction volumes, from our audited consolidated financial statements included elsewhere in this Annual Report on Form 10-K.
Our revenue for the years ended December 31, 2019 and 2018 was negatively affected by the closure of high-margin accounts with certain subscription-billing e-commerce merchants. The closure of merchants in this channel was due to industry-wide changes for enhanced card association compliance. This revenue, which is entirely within our Consumer Payments reportable segment, was $7.8 million, $59.3 million, and $98.9 million for the years ended December 31, 2019, 2018, and 2017, respectively. Our income from operations associated with these merchants was $3.5 million, $21.3 million, and $32.7 million for the years ended December 31, 2019, 2018, and 2017, respectively.
42
In addition to the impact of the closures of certain merchants described above, our income from operations for the years ended December 31, 2018 and 2017 were negatively affected by expenses associated with our Business Combination, conversion to a public company, and certain legal matters. These expenses were $8.9 million, $12.4 million, and $5.6 million, for the years ended December 31, 2019, 2018, and 2017 respectively.
Year Ended December 31, 2019 Compared to Year Ended December 31, 2018
(dollars in thousands) | Year Ended December 31, | ||||||||||||||
As recasted | As restated | ||||||||||||||
2019 | 2018 | $ Change | % Change | ||||||||||||
REVENUES | $ | 371,854 | $ | 375,822 | $ | (3,968 | ) | (1.1 | )% | ||||||
OPERATING EXPENSES: | |||||||||||||||
Costs of services | 252,569 | 269,284 | (16,715 | ) | (6.2 | )% | |||||||||
Salary and employee benefits | 42,214 | 38,324 | 3,890 | 10.2 | % | ||||||||||
Depreciation and amortization | 39,092 | 19,740 | 19,352 | 98.0 | % | ||||||||||
Selling, general and administrative | 30,795 | 32,081 | (1,286 | ) | (4.0 | )% | |||||||||
Total operating expenses | 364,670 | 359,429 | 5,241 | 1.5 | % | ||||||||||
Income from operations | 7,184 | 16,393 | (9,209 | ) | (56.2 | )% | |||||||||
Operating margin | 1.9 | % | 4.4 | % | |||||||||||
OTHER (EXPENSES) INCOME: | |||||||||||||||
Interest expense | (40,653 | ) | (29,935 | ) | (10,718 | ) | 35.8 | % | |||||||
Other, net | 710 | (6,784 | ) | 7,494 | (110.5 | )% | |||||||||
Total other expenses, net | (39,943 | ) | (36,719 | ) | (3,224 | ) | 8.8 | % | |||||||
Loss income before taxes | (32,759 | ) | (20,326 | ) | (12,433 | ) | 61.2 | % | |||||||
Income tax expense (benefit) | 830 | (2,490 | ) | 3,320 | nm | ||||||||||
Net loss | $ | (33,589 | ) | $ | (17,836 | ) | $ | (15,753 | ) | 88.3 | % | ||||
nm = not meaningful
43
The following table shows our segment income statement data and selected performance measures for the periods indicated:
(dollars and volume amounts in thousands) | Year Ended December 31, | ||||||||||||||
As recasted | As restated | ||||||||||||||
2019 | 2018 | Change | % Change | ||||||||||||
Consumer Payments: | |||||||||||||||
Revenue | $ | 330,599 | $ | 347,013 | $ | (16,414 | ) | (4.7 | )% | ||||||
Operating expenses | 298,362 | 300,011 | (1,649 | ) | (0.5 | )% | |||||||||
Income from operations | $ | 32,237 | $ | 47,002 | $ | (14,765 | ) | (31.4 | )% | ||||||
Operating margin | 9.8 | % | 13.5 | % | |||||||||||
Depreciation and amortization | $ | 32,842 | $ | 17,945 | $ | 14,897 | 83.0 | % | |||||||
Key Indicators: | |||||||||||||||
Merchant bankcard processing dollar value | $ | 42,303,880 | $ | 37,892,474 | $ | 4,411,406 | 11.6 | % | |||||||
Merchant bankcard transaction volume | 511,852 | 465,584 | 46,268 | 9.9 | % | ||||||||||
Commercial Payments: | |||||||||||||||
Revenue | $ | 25,980 | $ | 27,056 | $ | (1,076 | ) | (4.0 | )% | ||||||
Operating expenses | 26,871 | 28,008 | (1,137 | ) | (4.1 | )% | |||||||||
Loss from operations | $ | (891 | ) | $ | (952 | ) | $ | 61 | (6.4 | )% | |||||
Operating margin | (3.4 | )% | (3.5 | )% | |||||||||||
Depreciation and amortization | $ | 323 | $ | 557 | $ | (234 | ) | (42.0 | )% | ||||||
Key Indicators: | |||||||||||||||
Merchant bankcard processing dollar value | $ | 312,342 | $ | 257,308 | $ | 55,034 | 21.4 | % | |||||||
Merchant bankcard transaction volume | 109 | 118 | (9 | ) | (7.6 | )% | |||||||||
Integrated Partners: | |||||||||||||||
Revenue | $ | 15,275 | $ | 1,753 | $ | 13,522 | nm | ||||||||
Operating expenses | 14,550 | 3,722 | 10,828 | nm | |||||||||||
Income (loss) from operations | $ | 725 | $ | (1,969 | ) | $ | 2,694 | nm | |||||||
Depreciation and amortization | $ | 4,398 | $ | 145 | $ | 4,253 | nm | ||||||||
Key Indicators: | |||||||||||||||
Merchant bankcard processing dollar value | $ | 386,101 | $ | 5,516 | $ | 380,585 | nm | ||||||||
Merchant bankcard transaction volume | 1,380 | 55 | 1,325 | nm | |||||||||||
Income from operations of reportable segments | $ | 32,071 | $ | 44,081 | $ | (12,010 | ) | (27.2 | )% | ||||||
Corporate expenses | 24,887 | 27,688 | (2,801 | ) | (10.1 | )% | |||||||||
Consolidated income from operations | $ | 7,184 | $ | 16,393 | $ | (9,209 | ) | (56.2 | )% | ||||||
Corporate depreciation and amortization | $ | 1,529 | $ | 1,093 | $ | 436 | 39.9 | % | |||||||
Key Indicators: | |||||||||||||||
Merchant bankcard processing dollar value | $ | 43,002,323 | $ | 38,155,298 | $ | 4,847,025 | 12.7 | % | |||||||
Merchant bankcard transaction volume | 513,341 | 465,757 | 47,584 | 10.2 | % | ||||||||||
nm = not meaningful
44
Revenue
For the year ended December 31, 2019, our consolidated revenue decreased by $4.0 million, or 1.1%, from the year ended December 31, 2018 to $371.9 million. This decrease was driven by a $16.4 million, or 4.7%, decrease in revenue from our Consumer Payments segment and a $1.1 million, or 4.0%, decrease in revenue from our Commercial Payments segment, partially offset by a $13.5 million increase in revenue from our Integrated Partners segment. Consolidated bankcard processing dollar value and merchant bankcard transactions increased 12.7% and 10.2%, respectively.
For the year ended December 31, 2019, the decrease in Consumer Payments revenue was primarily attributable to a decrease in revenue of $51.5 million from certain subscription-billing e-commerce merchants, largely offset by revenue resulting from the overall increases in bankcard processing dollar value and merchant bankcard transactions of 11.6% and 9.9%, respectively, compared to the year ended December 31, 2018. The higher merchant bankcard processing dollar value and transaction volume in 2019 were mainly due to the continuation of higher consumer spending trends in 2019 and positive net onboarding of new merchants. Additionally, the average dollar amount per bankcard transaction increased to $82.65, or 1.5%, in 2019 from $81.39 in 2018.
For the year ended December 31, 2019, the decrease in Commercial Payments revenue was attributable to a $2.3 million decrease in revenue from our curated managed services program, partially offset by a $1.2 million increase in revenue from our CPX accounts payable solutions. The managed services decline was largely driven by lower incentive revenue and the CPX increase was driven by customer additions and higher merchant bankcard processing dollar value.
For the year ended December 31, 2019, the increase in our Integrated Partners revenue was due primarily to a $12.3 million increase in revenue from Priority Real Estate Technology ("PRET"). PRET's revenue growth included $11.7 million from our March 2019 acquisition of a portfolio of customers from YapStone, Inc. Revenue from Priority PayRight Health Solutions and Priority Hospitality Technology, which commenced operations in April 2018 and February 2019, respectively, comprised the remainder of this reportable segment’s $1.2 million revenue growth.
Operating expenses
Our consolidated operating expenses increased by $5.2 million, or 1.5%, from $359.4 million for the year ended December 31, 2018 to $364.7 million for the year ended December 31, 2019, driven primarily by a $19.4 million, or 98.0%, increase in amortization and depreciation expense related to asset acquisitions that occurred in late 2018 and 2019. Salary and employee benefits increased $3.9 million, or 10.2%, related to increases in corporate and operations headcount and higher headcount from business and asset acquisitions in 2019 and 2018. These increases were partially offset by a $16.7 million, or 6.2%, decrease in costs of services in correlation with lower revenues in 2019 and due to lower residual expenses in 2019 resulting from buyouts of residual commission rights in 2019 and 2018. Costs of merchant card fees as a percentage of merchant card fee revenue dropped by 190 basis points in 2019 from 2018. Selling, General, and Administrative ("SG&A") expenses decreased by $1.3 million, or 4.0%, due primarily to a $0.6 million reduction in the fair value of contingent consideration and to lower corporate expenses related to transaction costs associated with the Business Combination and conversion to a public company, such as legal, accounting and other advisory and consulting expenses.
Income from operations
Consolidated income from operations decreased $9.2 million, or 56.2%, for the year ended December 31, 2019 compared to the year ended December 31, 2018. Our consolidated operating margin for year ended December 31, 2019 was 1.9% compared to 4.4% for the year ended December 31, 2018. The margin decrease was primarily due to the loss of certain subscription-billing e-commerce merchants.
Our Consumer Payments reportable segment earned $32.2 million in income from operations for the year ended December 31, 2019, a decrease of $14.8 million, or 31.4%, from $47.0 million for the year ended December 31, 2018. This decrease largely reflected the loss of certain subscription-billing e-commerce merchants, which contributed $3.5 million and $21.3 million of income from operations in the years ended December 31, 2019 and 2018, respectively, partially offset by income resulting from the growth in merchant bankcard processing dollar value and transaction volume.
45
Our Commercial Payments reportable segment incurred a $0.9 million loss from operations for the year ended December 31, 2019, compared to a $1.0 million loss from operations for the year ended December 31, 2018.
Our Integrated Partners segment earned income from operations of $0.7 million for the year ended December 31, 2019 compared to a loss from operations of $2.0 million for the year ended December 31, 2018. This increase in income from operations in 2019 was due primarily to the 2019 acquisition of certain portfolio assets from YapStone, Inc., which included $4.0 million of increased depreciation expense and $2.9 million of transitional acquisition integration costs.
Corporate expenses were $24.9 million for the year ended December 31, 2019, a decrease of $2.8 million, or 10.1%, over expenses of $27.7 million for the year ended December 31, 2018. This decrease was driven primarily by a $6.4 million decrease in expenses associated with our Business Combination, conversion to a public company, and certain legal matters. These expenses were $6.0 million and $12.4 million for the years ended December 31, 2019 and 2018, respectively.
Interest expense
Interest expense, including amortization of deferred debt issuance costs and discount, increased by $10.7 million, or 35.8%, to $40.7 million in 2019 from $29.9 million in 2018. This increase was primarily due to higher outstanding borrowings in 2019 driven by acquisition related borrowings.
Other, net
Other, net increased $7.5 million from a net expense of $6.8 million in the year ended December 31, 2018 to net income of $0.7 million in the year ended December 31, 2019. The 2018 amount included $3.5 million expense from the change in fair value of a prior warrant liability and also included $3.3 million of debt modification and other net costs.
Income tax expense (benefit)
We became part of a C-Corporation reporting tax group on July 25, 2018 in connection with the Business Combination. On July 25, 2018, we recognized a net deferred income tax asset of $47.5 million, which also resulted in a credit to our additional paid-in capital within our consolidated stockholders' deficit. The net deferred tax asset is the result of the difference between the initial tax bases in the assets and liabilities and their respective carrying amounts for financial statement purposes.
For the year ended December 31, 2019, our income tax expense was $0.8 million, resulting in an effective income tax benefit rate of 2.5%. See note 11, Income Taxes, to our consolidated financial statements in Item 8 of the Annual Report on Form 10-K.
For the year ended December 31, 2018, our income tax benefit was $2.5 million, resulting in an effective income tax rate of 12.5%. This income tax benefit was based on the pre-tax loss incurred after July 25, 2018. On a pro-forma basis assuming C-Corporation status for the full year 2018, our income tax benefit would have been $3.2 million, resulting in a pro-forma effective income tax rate of 15.6%. Our annualized pro-forma effective income tax rate for 2018 was less than the statutory rate due to timing and permanent differences between amounts calculated under GAAP and the tax code.
The effective income tax rate for 2019 may not be indicative of our effective tax rate for future periods.
Net loss
Our consolidated net loss for the year ended December 31, 2019 was $33.6 million compared to a net loss of $17.8 million for the year ended December 31, 2018 for the aforementioned reasons.
46
Year Ended December 31, 2018 Compared to Year Ended December 31, 2017
The following table shows our consolidated income statement data for the periods indicated:
(dollars in thousands) | Year Ended December 31, | ||||||||||||||
As restated | As restated | ||||||||||||||
2018 | 2017 | $ Change | % Change | ||||||||||||
REVENUES | $ | 375,822 | $ | 382,167 | $ | (6,345 | ) | (1.7 | )% | ||||||
OPERATING EXPENSES: | |||||||||||||||
Costs of services | 269,284 | 278,507 | (9,223 | ) | (3.3 | )% | |||||||||
Salary and employee benefits | 38,324 | 32,357 | 5,967 | 18.4 | % | ||||||||||
Depreciation and amortization | 19,740 | 14,674 | 5,066 | 34.5 | % | ||||||||||
Selling, general and administrative | 32,081 | 22,135 | 9,946 | 44.9 | % | ||||||||||
Total operating expenses | 359,429 | 347,673 | 11,756 | 3.4 | % | ||||||||||
Income from operations | 16,393 | 34,494 | (18,101 | ) | (52.5 | )% | |||||||||
Operating margin | 4.4 | % | 9.0 | % | |||||||||||
OTHER (EXPENSES) INCOME: | |||||||||||||||
Interest expense | (29,935 | ) | (25,058 | ) | (4,877 | ) | 19.5 | % | |||||||
Other, net | (6,784 | ) | (5,597 | ) | (1,187 | ) | 21.2 | % | |||||||
Total other expenses, net | (36,719 | ) | (30,655 | ) | (6,064 | ) | 19.8 | % | |||||||
(Loss) income before taxes | (20,326 | ) | 3,839 | (24,165 | ) | (629.5 | )% | ||||||||
Income tax expense (benefit) | (2,490 | ) | — | (2,490 | ) | nm | |||||||||
Net (loss) income | $ | (17,836 | ) | $ | 3,839 | $ | (21,675 | ) | nm | ||||||
nm = not meaningful
47
The following table shows our segment income statement data and selected performance measures for the periods indicated:
(dollars and volume amounts in thousands) | Years Ended December 31, | ||||||||||||||
As restated | As restated | ||||||||||||||
2018 | 2017 | Change | % Change | ||||||||||||
Consumer Payments: | |||||||||||||||
Revenue | $ | 347,013 | $ | 357,168 | $ | (10,155 | ) | (2.8 | )% | ||||||
Operating expenses | 300,011 | 302,450 | (2,439 | ) | (0.8 | )% | |||||||||
Income from operations | $ | 47,002 | $ | 54,718 | $ | (7,716 | ) | (14.1 | )% | ||||||
Operating margin | 13.5 | % | 15.3 | % | |||||||||||
Depreciation and amortization | $ | 17,945 | $ | 13,336 | $ | 4,609 | 34.6 | % | |||||||
Key Indicators: | |||||||||||||||
Merchant bankcard processing dollar value | $ | 37,892,474 | $ | 34,465,600 | $ | 3,426,874 | 9.9 | % | |||||||
Merchant bankcard transaction volume | 465,584 | 439,055 | 26,529 | 6.0 | % | ||||||||||
Commercial Payments: | |||||||||||||||
Revenue | $ | 27,056 | $ | 24,999 | $ | 2,057 | 8.2 | % | |||||||
Operating expenses | 28,008 | 24,027 | 3,981 | 16.6 | % | ||||||||||
(Loss) income from operations | $ | (952 | ) | $ | 972 | $ | (1,924 | ) | (197.9 | )% | |||||
Operating margin | (3.5 | )% | 3.9 | % | |||||||||||
Depreciation and amortization | $ | 557 | $ | 451 | $ | 106 | 23.5 | % | |||||||
Key Indicators: | |||||||||||||||
Merchant bankcard processing dollar value | $ | 257,308 | $ | 190,338 | $ | 66,970 | 35.2 | % | |||||||
Merchant bankcard transaction volume | 118 | 95 | 23 | 24.2 | % | ||||||||||
Integrated Partners: | |||||||||||||||
Revenue | $ | 1,753 | $ | — | $ | 1,753 | nm | ||||||||
Operating expenses | 3,722 | — | 3,722 | nm | |||||||||||
Loss from operations | $ | (1,969 | ) | $ | — | $ | (1,969 | ) | nm | ||||||
Depreciation and amortization | $ | 145 | $ | — | $ | 145 | nm | ||||||||
Key Indicators: | |||||||||||||||
Merchant bankcard processing dollar value | $ | 5,516 | $ | — | $ | 5,516 | nm | ||||||||
Merchant bankcard transaction volume | 55 | — | 55 | nm | |||||||||||
Income from operations of reportable segments | $ | 44,081 | $ | 55,690 | $ | (11,609 | ) | (20.8 | )% | ||||||
Corporate expenses | 27,688 | 21,196 | 6,492 | 30.6 | % | ||||||||||
Consolidated income from operations | $ | 16,393 | $ | 34,494 | $ | (18,101 | ) | nm | |||||||
Corporate depreciation and amortization | $ | 1,093 | $ | 887 | $ | 206 | 23.2 | % | |||||||
Key Indicators: | |||||||||||||||
Merchant bankcard processing dollar value | $ | 38,155,298 | $ | 34,655,938 | $ | 3,499,360 | 10.1 | % | |||||||
Merchant bankcard transaction volume | 465,757 | 439,150 | 26,607 | 6.1 | % | ||||||||||
nm = not meaningful
48
Revenue
For the year ended December 31, 2018, our consolidated revenue decreased by $6.3 million, or 1.7%, from the year ended December 31, 2017 to $375.8 million. This decrease was driven by a $10.2 million, or 2.8%, decrease in revenue from our Consumer Payments segment, partially offset by a $2.1 million, or 8.2%, increase in revenue from our Commercial Payments segment and revenue of $1.8 million in our new Integrated Partners segment. Consolidated bankcard processing dollar value and merchant bankcard transactions increased 10.1% and 6.1%, respectively.
For the year ended December 31, 2018, the decrease in Consumer Payments revenue was primarily attributable to a decrease in revenue of $39.6 million from certain subscription-billing e-commerce merchants, largely offset by revenue resulting from the overall increases in bankcard processing dollar value and merchant bankcard transactions of 9.9% and 6.0%, respectively, compared to the year ended December 31, 2017. The higher merchant bankcard processing dollar value and transaction volume in 2018 were mainly due to the continuation of higher consumer spending trends in 2018 and positive net onboarding of new merchants. Additionally, the average dollar amount per bankcard transaction increased to $81.39, or 3.7%, in 2018 from $78.50 in 2017.
The increase in Commercial Payments revenue for the year ended December 31, 2018 was attributable in part by increases in CPX merchant bankcard processing dollar value and the number of merchant bankcard transaction volume of 35.2% and 24.2%, respectively. Revenues from our managed services customers grew in 2018 due to an increase in headcount of our in-house sales force dedicated to selling merchant financing products on behalf of our financial institution partners, for which we record revenue on a cost-plus basis.
Integrated Partners revenue increased in 2018 due to the acquisitions of RadPad and PayRight.
Operating expenses
Our consolidated operating expenses increased $11.8 million, or 3.4%, from $347.7 million for the year ended December 31, 2017 to $359.4 million for the year ended December 31, 2018, driven primarily by a $9.9 million, or 44.9%, increase in SG&A expenses. The increase in SG&A expenses was due primarily to in-house sales force expansion and corporate expenses related to transaction costs associated with the Business Combination and conversion to a public company, such as legal, accounting and other advisory and consulting expenses. Higher consolidated operating expenses were partially offset by lower costs of merchant card fees attributable to 2018 acquisitions of residual portfolio commission rights, partially offset by growth in processing volume. Costs of merchant card fees as a percentage of merchant card fee revenue dropped by 10 basis points in 2018 from 2017. Salary and employee benefits increased $6.0 million, or 18.4%, related to increases in corporate and operations headcount and increases in headcount from business acquisition in 2018. Depreciation and amortization increased $5.1 million, or 34.5% attributable mainly to the internally developed software for the MX Connect and CPX platforms and amortization of intangible assets.
Income from operations
Consolidated income from operations decreased $18.1 million, or 52.5%, for the year ended December 31, 2018 compared to the year ended December 31, 2017. Our consolidated operating margin for the year ended December 31, 2018 was 4.4% compared to 9.0% for the year ended December 31, 2017. The margin decrease was primarily due to the loss of certain subscription-billing e-commerce merchants and increases in expenses related to the Business Combination, conversion to a public company, and certain legal matters.
Our Consumer Payments segment earned $47.0 million in segment income from operations for the year ended December 31, 2018, a decrease of $7.7 million, or 14.1%, from $54.7 million for the year ended December 31, 2017. This decrease largely reflected the loss of certain subscription-billing e-commerce merchants, which contributed $21.3 million and $32.7 million of income from operations in the years ended December 31, 2018 and 2017, respectively, partially offset by income resulting from the growth in merchant bankcard processing dollar value and transaction volume.
Our Commercial Payments segment earned $1.0 million in income from operations for the year ended December 31, 2018, compared to a $1.0 million loss from operations for the year ended December 31, 2017.
49
Our Integrated Partners segment incurred a loss from operations of $2.0 million for the year ended December 31, 2018. This loss was due to the startup of this new segment.
Corporate expenses were $27.7 million for year ended December 31, 2018, an increase of $6.5 million over expenses of $21.2 million in the year ended December 31, 2017. This increase was driven primarily by a $6.8 million increase in expenses associated with our Business Combination, conversion to a public company, and certain legal matters. These expenses were $12.4 million and $5.6 million for the years ended December 31, 2018 and 2017, respectively.
Interest expense
Interest expense, including amortization of deferred debt issuance costs and discount, increased by $4.9 million, or 19.5%, to $29.9 million in 2018 from $25.1 million in 2017. This increase was due to higher outstanding borrowings in 2018, partially offset by lower applicable interest rates as a result of the debt modification in January 2018.
Other, net
Other, net decreased $1.2 million from a net expense of $5.6 million in the year ended December 31, 2017 to a net expense of $6.8 million in the year ended December 31, 2018. This change was primarily due to debt modification costs of $2.0 million in the year ended December 31, 2018.
Income tax expense (benefit)
We became part of a "C-corporation" reporting tax group on July 25, 2018 in connection with the Business Combination. On July 25, 2018, we recognized a net deferred income tax asset of $47.5 million, which also resulted in a credit to our additional paid-in capital within our consolidated stockholders' deficit. The net deferred tax asset is the result of the difference between the initial tax bases in the assets and liabilities and their respective carrying amounts for financial statement purposes.
For the year ended December 31, 2018, our income tax benefit was $2.5, resulting in an effective income tax rate of 12.5%. This income tax benefit was based on the pre-tax loss incurred after July 25, 2018. On a pro-forma basis assuming C-corp status for the full year 2018, our income tax benefit would have been $3.2 million, resulting in a pro-forma effective income tax rate of 15.6%. Our annualized pro-forma effective income tax rate for 2018 was less than the statutory rate due to timing and permanent differences between amounts calculated under GAAP and the tax code.
Net income (loss)
Our consolidated net loss for the year ended December 31, 2018 was $17.8 million compared to net income $3.8 million for the year ended December 31, 2017 for the aforementioned reasons.
50
Certain Non-GAAP Financial Measures
We periodically review the following key non-GAAP measures to evaluate our business and trends, measure our performance, prepare financial projections and make strategic decisions.
EBITDA, which represents net income (loss) before interest, income tax, and depreciation and amortization, is reconciled to net income (loss) calculated under GAAP.
Adjusted EBITDA starts with EBITDA and further adjusts for certain non-cash, non-recurring or non-core expenses including: 1) non-cash equity-based compensation; 2) debt modification and extinguishment costs and fair value changes; 3) certain legal expenses; 4) certain professional, accounting and consulting fees; and 5) temporary transition services related to acquisitions.
In addition, the financial covenants under the debt agreements of the Company's subsidiaries (the "Borrowers") are based on a non-GAAP measure referred to as Consolidated Adjusted EBITDA. The calculation of Consolidated Adjusted EBITDA starts with Adjusted EBITDA and further adjusts for the pro-forma impact of acquisitions and residual streams and run rate adjustments for certain contracted savings on an annualized basis, other consulting and professional fees, and other tax expenses and other adjustments, which are not included as adjustments to Adjusted EBITDA.
We believe these non-GAAP measures illustrate the underlying financial and business trends relating to our results of operations and comparability between current and prior periods. We also use these non-GAAP measures to establish and monitor operational goals.
These non-GAAP measures are not in accordance with, or an alternative to, GAAP and should be considered in addition to, and not as a substitute or superior to, the other measures of financial performance prepared in accordance with GAAP. Using only the non-GAAP financial measures, particularly Adjusted EBITDA and Consolidated Adjusted EBITDA, to analyze our performance would have material limitations because their calculations are based on subjective determination regarding the nature and classification of events and circumstances that investors may find significant. We compensate for these limitations by presenting both the GAAP and non-GAAP measures of our operating results. Although other companies may report measures entitled "Adjusted EBITDA" or similar in nature, numerous methods may exist for calculating a company's Adjusted EBITDA or similar measures. As a result, the methods we use to calculate Adjusted EBITDA may differ from the methods used by other companies to calculate their non-GAAP measures.
The non-GAAP reconciliations of EBITDA, Adjusted EBITDA, and Consolidated Adjusted EBITDA to net income (loss), the most directly comparable financial measure calculated and presented in accordance with GAAP, are shown in the table below:
51
(in thousands) | For the Year ended December 31, | ||||||||||
As restated | As restated | ||||||||||
2019 | 2018 | 2017 | |||||||||
Net (Loss) Income (GAAP) | $ | (33,589 | ) | $ | (17,836 | ) | $ | 3,839 | |||
Add: Interest expense (1) | 40,653 | 29,935 | 25,058 | ||||||||
Add: Depreciation and amortization | 39,092 | 19,740 | 14,674 | ||||||||
Add: Income tax expense (benefit) | 830 | (2,490 | ) | — | |||||||
EBITDA (non-GAAP) | 46,986 | 29,349 | 43,571 | ||||||||
Further adjusted by: | |||||||||||
Add: Non-cash equity-based compensation | 3,652 | 1,649 | 1,021 | ||||||||
Add: Debt modification costs and warrant fair value changes | — | 6,042 | 5,966 | ||||||||
Add: Changes in fair value of contingent consideration | (620 | ) | — | (410 | ) | ||||||
Add: Litigation settlement (recoveries) costs | (377 | ) | 1,615 | 2,329 | |||||||
Add: Certain legal services (2) | 3,779 | 4,900 | 2,699 | ||||||||
Add: Professional, accounting and consulting fees (3) | 2,574 | 5,856 | 952 | ||||||||
Add: YapStone transition services | 2,910 | — | — | ||||||||
Adjusted EBITDA (non-GAAP) | 58,904 | 49,411 | 56,128 | ||||||||
Further adjusted by: | |||||||||||
Add: Pro-forma impacts for acquisitions | 6,801 | 14,010 | 1,303 | ||||||||
Add: Contracted revenue and savings | 4,069 | 2,924 | 1,743 | ||||||||
Add: Other professional and consulting fees | 1,717 | 1,236 | 713 | ||||||||
Add: Other tax expenses and other adjustments | 596 | 1,566 | 690 | ||||||||
Consolidated Adjusted EBITDA (non-GAAP) (4) | $ | 72,087 | $ | 69,147 | $ | 60,577 | |||||
(1) | Interest expense includes amortization of debt issuance costs and discount. |
(2) | Legal expenses related to business and asset acquisition activity and settlement negotiation and other litigation expenses. |
(3) | Primarily transaction-related, capital markets and accounting advisory services. |
(4) | Presented to reflect the definition in the Company's credit agreements, as amended (See Note 10, Long-Term Debt and Warrant Liability). The Consolidated Adjusted EBITDA of the Borrowers under the credit agreements excluded expenses of Priority Technology Holdings, Inc., which is neither a Borrower nor a guarantor under the credit agreements, subsequent to the Business Combination until December 31, 2019. Effective December 31, 2019, in accordance with the Sixth Amendment to the Company's Credit and Guaranty Agreement, the Consolidated Adjusted EBITDA of the Borrowers under the credit agreements includes expenses of Priority Technology Holdings, Inc. Consolidated Adjusted EBITDA of the Borrowers was approximately $72.1 million and $75.0 million for the years ended December 31, 2019 and 2018, respectively. The 2018 amount excludes $5.8 million of expenses of Priority Technology Holdings, Inc. |
52
Liquidity and Capital Resources
Liquidity and capital resource management is a process focused on providing the funding we need to meet our short-term and long-term cash and working capital needs. We have used our funding sources to build our merchant portfolio, technology solutions, and to make acquisitions with the expectation that such investments will generate cash flows sufficient to cover our working capital needs and other anticipated needs, including for our acquisition strategy. We anticipate that cash on hand, funds generated from operations and available borrowings under our revolving credit agreement are sufficient to meet our working capital requirements for at least the next twelve months.
Our principal uses of cash are to fund business operations, administrative costs, and debt service.
Our working capital, defined as current assets less current liabilities, was $1.2 million at December 31, 2019 and $11.8 million at December 31, 2018. As of December 31, 2019, we had cash totaling $3.2 million compared to $15.6 million at December 31, 2018. These cash balances do not include restricted cash of $47.2 million and $18.2 million at December 31, 2019 and 2018, respectively, which reflects cash accounts holding customer settlement funds and cash reserves for potential losses at December 31, 2019 and December 31, 2018.
At December 31, 2019, we had availability of $13.5 million under our revolving credit arrangement.
The following tables and narrative reflect our changes in cash flows for the comparative annual periods.
Year Ended December 31, 2019 Compared to Year Ended December 31, 2018
Year Ended December 31, | ||||||||
(in thousands) | 2019 | 2018 | ||||||
Net cash provided by (used in): | ||||||||
Operating activities | $ | 39,364 | $ | 31,348 | ||||
Investing activities | (97,747 | ) | (108,928 | ) | ||||
Financing activities | 75,017 | 67,252 | ||||||
Net increase (decrease) increase in cash and restricted cash | $ | 16,634 | $ | (10,328 | ) | |||
Cash Provided By Operating Activities
Net cash provided by operating activities was $39.4 million and $31.3 million for the years ended December 31, 2019 and 2018, respectively. The $8.0 million, or 25.6%, increase in 2019 was principally the result of changes in working capital, settlement funds, and restricted cash, partially offset by the increase in the net loss in 2019.
Cash Used In Investing Activities
Net cash used in investing activities was $97.7 million and $108.9 million for the years ended December 31, 2019 and 2018, respectively. Cash flow used in investing activities includes the acquisitions of merchant portfolios, residual buyouts, purchases of property, equipment and software, and acquisitions of businesses. For the years ended December 31, 2019 and 2018, we invested $82.9 million and $90.9 million, respectively, in merchant portfolios and residual buyouts. We used $0.2 million for business acquisitions for the year ended December 31, 2019, compared to $7.5 million in the prior year. Cash used for purchases of property, equipment, and software for the year ended December 31, 2019 was $11.1 million, an increase of $0.6 million from the year ended December 31, 2018. The increase in purchases was driven primarily by capitalization of internally developed software.
53
Cash Provided By Financing Activities
Net cash provided by financing activities was $75.0 million in the year ended December 31, 2019 compared to $67.3 million in the prior year. Cash flows from financing activities for the years ended December 31, 2019 and 2018 resulted primarily from proceeds received from additional borrowings under our term debt in and revolving credit facility. Proceeds received in 2018 also included cash received from the Business Combination and equity recapitalization.
Year Ended December 31, 2018 Compared to Year Ended December 31, 2017
Year Ended December 31, | |||||||||
(in thousands) | 2018 | 2017 | |||||||
Net cash provided by (used in): | |||||||||
Operating activities | $ | 31,348 | $ | 36,869 | |||||
Investing activities | (108,928 | ) | (9,037 | ) | |||||
Financing activities | 67,252 | (25,375 | ) | ||||||
Net (decrease) increase in cash and restricted cash | $ | (10,328 | ) | $ | 2,457 | ||||
Cash Provided By Operating Activities
Net cash provided by operating activities was $31.3 million and $36.9 million for the year ended December 31, 2018 and 2017, respectively. The $5.5 million, or 15.0%, decrease was principally the result of reduced income from operations of $18.1 million, partially offset by changes in operating working capital. Changes in operating working capital increased by $11.9 million for the year ended December 31, 2018 compared to the year ended December 31, 2017.
Cash Used In Investing Activities
Net cash used in investing activities was $108.9 million and $9.0 million for the year ended December 31, 2018 and 2017, respectively. Cash flows used in investing includes the acquisitions of merchant portfolios, purchases of property, equipment and software, and acquisitions of businesses. For the year ended December 31, 2018, we invested $90.9 million in merchant portfolio acquisitions and residual buyouts, an $88.4 million increase from the year ended December 31, 2017. We used $7.5 million for business acquisitions for the year ended December 31, 2018, compared to zero in the prior year. Cash used for purchases of property, plant and equipment for the year ended December 31, 2018 was $10.6 million, an increase of $4.0 million from the year ended December 31, 2017. The increase in purchases was driven primarily by equipment purchases for MX Connect and CPX, capitalization of internally developed software, and improvements to the legal and CPX office space.
Cash Provided By (Used In) Financing Activities
Net cash provided by financing activities was $67.3 million in the year ended December 31, 2018 compared to net cash used in financing activities of $25.4 million in the prior year. Cash flows from financing activities for the year ended December 31, 2018 resulted primarily from the proceeds received in the January 2018 and December 2018 debt upsizing and the equity recapitalization in connection with the Business Combination, offset in part by cash used for equity redemptions, the redemption of the Goldman Sachs warrant, and equity distributions prior to July 25, 2018. Cash flows used in financing activities for the year ended December 31, 2017 primarily reflected equity redemptions, partially offset by a net increase in long-term debt.
54
Long-Term Debt
As of December 31, 2019, we had outstanding long-term debt of $495.5 million compared to $412.7 million at December 31, 2018, an increase of $82.8 million. The debt balance consisted of outstanding term debt of $388.8 million under the Senior Credit Facility and $95.1 million in term debt under the subordinated Credit and Guaranty Agreement with Goldman Sachs Specialty Lending Group, L.P. (the "GS Credit Facility") (including accrued payment-in-kind ("PIK") interest through December 31, 2019). Additionally, under the Senior Credit Facility, we have a $25.0 million revolving credit facility, which had $11.5 million drawn and outstanding as of December 31, 2019. No amount was outstanding on the revolving credit facility at December 31, 2018. The outstanding principal amounts under the Senior Credit Facility and the subordinated GS Credit Facility mature in January 2023 and July 2023, respectively. The $25 million revolving credit facility expires in January 2022.
The Senior Credit Facility and the subordinated GS Credit Facility are secured by substantially all of our assets, however, the parent entity, Priority Technology Holdings, Inc., is neither a borrower nor guarantor to the Senior Credit Facility or the GS Credit Facility.
On March 18, 2020, we modified the Senior Credit Agreement and the GS Credit Amendment (collectively, the "Sixth Amendment"). As of December 31, 2019, financial covenants, as amended, under the Senior Credit Facility required the Total Net Leverage Ratio, as defined in the agreement, not to exceed 8.00:1.00 at December 31, 2019 and March 31, 2020 and 7.75:1.00 at June 30, 2020 through December 31, 2020. The Total Net Leverage Ratio steps down thereafter. As of December 31, 2019, we were in compliance with our financial covenants.
Contractual Obligations
The following table sets forth our contractual obligations and commitments for the periods indicated as of December 31, 2019.
(in thousands) | Payments Due by Period | |||||||||||||||||||||
Contractual Obligations | Total | Less than 1 year | 1 to 3 years | 3 to 5 Years | More than 5 years | |||||||||||||||||
Operating leases | $ | 12,579 | $ | 1,829 | $ | 3,496 | $ | 3,246 | $ | 4,008 | ||||||||||||
Debt principal (a) | 495,479 | 4,007 | 19,514 | 471,958 | — | |||||||||||||||||
Interest on debt (b) | 124,105 | 34,774 | 68,704 | 20,627 | — | |||||||||||||||||
Contingent consideration (c) | 2,493 | 2,493 | — | — | — | |||||||||||||||||
Processing minimums (d) | 14,000 | 7,000 | 7,000 | — | — | |||||||||||||||||
$ | 648,656 | $ | 50,103 | $ | 98,714 | $ | 495,831 | $ | 4,008 | |||||||||||||
(a) Reflects contractual principal payments on term debt outstanding at December 31, 2019 on the revolving credit facility. Does not include future "payment-in-kind" ("PIK") interest that will be added to the principal outstanding for the GS Credit Facility as this interest is included in Interest on debt in (b).
(b) Reflects interest payable and future PIK interest on term debt under the Senior Credit Facility and the subordinated GS Credit Facility. Amounts based on outstanding balances and interest rates as of December 31, 2019.
(c) Reflects estimated fair value of amounts accrued for business combinations and amounts payable for asset acquisitions.
(d) Reflects minimum annual spend commitments with third-party processor partners. In the event we fail to meet the minimum annual spend commitment, we are required to pay the difference between the minimum and the actual dollar amount spent in the year.
55
Off-Balance Sheet Arrangements
We have not entered into any transactions with third parties or unconsolidated entities whereby we have financial guarantees, subordinated retained interest, derivative instruments, or other contingent arrangements that expose us to material continuing risks, contingent liabilities or other obligations.
Critical Accounting Policies and Estimates
Our accounting policies are more fully described in Note 1, Nature of Business and Accounting Policies. The preparation of financial statements in conformity with GAAP requires management to make estimates and assumptions about future events that affect the amounts reported in the financial statements and accompanying notes. Actual results could differ significantly from those estimates. We believe that the following discussion addresses our most critical accounting policies, which are those that are most important to the portrayal of our financial condition and results of operations and require management's most difficult, subjective, and complex judgments.
Revenue Recognition
We adopted the provisions of ASC 606, Revenue from Contracts with Customers, effective for the annual reporting period ended December 31, 2019. We used the full retrospective adoption and transition method, and accordingly, all periods presented in this Form 10-K have been recasted to reflect the provisions of ASC 606.
Under the provisions of ASC 606, we recognize revenue when we satisfy a performance obligation by transferring a service or good to the customer in an amount to which we expect to be entitled (i.e., transaction price) allocated to the distinct or services or goods.
At contract inception, we assess the services and goods promised in our contracts with customers and identify the performance obligation for each promise to transfer to the customer a service or good that is distinct. For substantially all of our services, the nature of our promise to the customer is to stand ready to accept and process the transactions that customers request on a daily basis over the contract term. Since the timing and quantity of transactions to be processed is not determinable, the services comprise an obligation to stand ready to process as many transactions as the customer requires. Under a stand-ready obligation, the evaluation of the nature of our performance obligation is focused on each time increment rather than the underlying activities. Therefore, we have determined that our services comprise a series of distinct days of service that are substantially the same and have the same pattern of transfer to the customer. Accordingly, the promise to stand ready is accounted for as a single-series performance obligation.
When third parties are involved in the transfer of services or goods to the customer, we consider the nature of each specific promised service or good and applies judgment to determine whether we control the service or good before it is transferred to the customer or whether we are acting as an agent of the third party. We follow the requirements of ASC 606-10, Principal Agent Considerations, which states that the determination of whether an entity should recognize revenue based on the gross amount billed to a customer or the net amount retained is a matter of judgment that depends on the facts and circumstances of the arrangement. To determine whether or not we control the service or good, we assess indicators including: 1) whether we or the third party is primarily responsible for fulfillment; 2) if we or the third party provides a significant service of integrating two or more services or goods into a combined item that is a service or good that the customer contracted to receive; 3) which party has discretion in determining pricing for the service or good; and 4) other considerations deemed to be applicable to the specific situation.
Income Taxes
We account for income taxes under the asset and liability method. Under this method, deferred tax assets and liabilities are determined based on differences between financial reporting and tax bases of assets and liabilities and are measured using enacted tax rates and laws that are expected to be in effect when the differences are expected to be recovered or settled. Realization of deferred tax assets is dependent upon future taxable income. A valuation allowance is recognized if it is more likely than not that some portion or all of a deferred tax asset will not be realized based on the weight of available evidence, including expected future earnings.
56
We recognize an uncertain tax position in our financial statements when we conclude that a tax position is more likely than not to be sustained upon examination based solely on its technical merits. Only after a tax position passes the first step of recognition will measurement be required. Under the measurement step, the tax benefit is measured as the largest amount of benefit that is more likely than not to be realized upon effective settlement. This is determined on a cumulative probability basis. The full impact of any change in recognition or measurement is reflected in the period in which such change occurs. Interest and penalties related to income taxes are recognized in the provision for income taxes.
Goodwill and Long-Lived Assets
We test goodwill for impairment for each of our reporting units on an annual basis or when events occur, or circumstances indicate the fair value of a reporting unit is below our carrying value. We perform the impairment tests by using market data and discounted cash flow analysis, which involve estimates of future revenues and operating cash flows.
We review our long-lived assets for impairment whenever events or changes in circumstances indicate the carrying amount of an asset may not be recoverable. For long-lived assets, except goodwill, an impairment loss is indicated when the undiscounted future cash flows estimated to be generated by the asset group are not sufficient to recover the unamortized balance of the asset group.
We amortize the cost of our acquired intangible assets over their estimated useful lives using either a straight-line or an accelerated method that most accurately reflects the estimated pattern in which the economic benefits of the respective asset is consumed.
Potential Impacts of Recently Issued Accounting Standards
For the potential impacts that pending adoptions of recently issued accounting standards may have on our future financial position, results of operations, or cash flows, see Note 1, Nature of Business and Accounting Policies, under the header "Recently Issued Standards Not Yet Adopted."
ITEM 7A. QUALITATIVE AND QUANTITATIVE DISCLOSURE ABOUT MARKET RISK
Interest rate risk
Our Senior Credit Facility bears interest at a rate based on LIBOR plus a fixed margin. As of December 31, 2019, we had $400.3 million in outstanding borrowings under our Senior Credit Facility. A hypothetical 1% increase or decrease in the applicable LIBOR rate on our outstanding indebtedness under the Senior Credit Facility would have increased or decreased cash interest expense on our indebtedness by approximately $4.0 million per annum. The discrepancy between the hypothetical increase and decrease is attributable to the 1.0% LIBOR floor under the Senior Credit Facility. The applicable LIBOR rate stood at approximately 1.71% at December 31, 2019.
We do not currently hedge against interest rate risk.
57
ITEM 8. FINANCIAL STATEMENTS AND SUPPLEMENTARY DATA
PRIORITY TECHNOLOGY HOLDINGS, INC.
INDEX TO CONSOLIDATED FINANCIAL STATEMENTS
Page | |
58
Report of Independent Registered Public Accounting Firm
To the Stockholders and Board of Directors of Priority Technology Holdings, Inc. and Subsidiaries
Opinion on the Financial Statements
We have audited the accompanying consolidated balance sheets of Priority Technology Holdings, Inc. and Subsidiaries (the "Company") as of December 31, 2019 and 2018, the related consolidated statements of operations, changes in stockholders' deficit and cash flows for each of the three years in the period ended December 31, 2019, and the related notes to the consolidated financial statements (collectively, the financial statements). In our opinion, the financial statements present fairly, in all material respects, the financial position of the Company as of December 31, 2019 and 2018, and the results of its operations and its cash flows for each of the three years in the period ended December 31, 2019, in conformity with accounting principles generally accepted in the United States of America.
Restatement
As discussed in Note 2 to the financial statements, the financial statements as of December 31, 2018 and for the years ended December 31, 2018 and 2017 have been restated to correct a misstatement.
Change in Accounting Principle
As discussed in Note 1 to the financial statements, the Company changed its method of accounting for revenue from contracts with customers for all periods presented due to the adoption of Accounting Standards Codification, Topic 606, Revenue from Contracts with Customers.
Basis for Opinion
These financial statements are the responsibility of the Company's management. Our responsibility is to express an opinion on the Company's financial statements based on our audits. We are a public accounting firm registered with the Public Company Accounting Oversight Board (United States) (PCAOB) and are required to be independent with respect to the Company in accordance with U.S. federal securities laws and the applicable rules and regulations of the Securities and Exchange Commission and the PCAOB.
We conducted our audits in accordance with the standards of the PCAOB. Those standards require that we plan and perform the audit to obtain reasonable assurance about whether the financial statements are free of material misstatement, whether due to error or fraud. The Company is not required to have, nor were we engaged to perform, an audit of its internal control over financial reporting. As part of our audits we are required to obtain an understanding of internal control over financial reporting but not for the purpose of expressing an opinion on the effectiveness of the Company's internal control over financial reporting. Accordingly, we express no such opinion.
Our audits included performing procedures to assess the risks of material misstatement of the financial statements, whether due to error or fraud, and performing procedures that respond to those risks. Such procedures included examining, on a test basis, evidence regarding the amounts and disclosures in the financial statements. Our audits also included evaluating the accounting principles used and significant estimates made by management, as well as evaluating the overall presentation of the financial statements. We believe that our audits provide a reasonable basis for our opinion.
/s/ RSM US LLP
We have served as the Company's auditor since 2014.
Atlanta, Georgia
March 30, 2020
59
Consolidated Balance Sheets
As of December 31, 2019 and 2018
(in thousands, except share and per share amounts) | As restated - Note 2 | ||||||
December 31, 2019 | December 31, 2018 | ||||||
ASSETS | |||||||
Current assets: | |||||||
Cash | $ | $ | |||||
Restricted cash | |||||||
Accounts receivable, net of allowances of $803 and $511, respectively | |||||||
Prepaid expenses and other current assets | |||||||
Current portion of notes receivable | |||||||
Settlement assets | |||||||
Total current assets | |||||||
Notes receivable, less current portion | |||||||
Property, equipment, and software, net | |||||||
Goodwill | |||||||
Intangible assets, net | |||||||
Deferred income tax assets, net | |||||||
Other non-current assets | |||||||
Total assets | $ | $ | |||||
LIABILITIES AND STOCKHOLDERS' DEFICIT | |||||||
Current liabilities: | |||||||
Accounts payable and accrued expenses | $ | $ | |||||
Accrued residual commissions | |||||||
Customer deposits and advance payments | |||||||
Current portion of long-term debt | |||||||
Settlement obligations | |||||||
Total current liabilities | |||||||
Long-term debt, net of discounts and deferred financing costs | |||||||
Other non-current liabilities | |||||||
Total long-term liabilities | |||||||
Total liabilities | |||||||
Commitments and contingencies | |||||||
Stockholders' deficit: | |||||||
Preferred stock, par value $0.001 per share; 100,000,000 and zero shares authorized at December 31, 2019 and 2018, respectively; and zero shares issued and outstanding at December 31, 2019 and 2018. | |||||||
Common stock, par value of $0.001 per share; 1 billion shares authorized; 67,512,167 shares issued and 67,060,943 outstanding at December 31, 2019; and 67,038,304 shares issued and outstanding at December 31, 2018. | |||||||
Additional paid-in capital | |||||||
Treasury stock, at cost (451,224 shares) | ( | ) | |||||
Accumulated deficit | ( | ) | ( | ) | |||
Total deficit attributable to stockholders of PRTH | ( | ) | ( | ) | |||
Non-controlling interest | |||||||
Total stockholders' deficit | ( | ) | ( | ) | |||
Total liabilities and stockholders' deficit | $ | $ | |||||
See Notes to Consolidated Financial Statements
60
Consolidated Statements of Operations
For the Years Ended December 31, 2019, 2018, and 2017
(in thousands, except per share amounts) | As Recasted - Note 1 | As restated- Note 2 | As restated - Note 2 | |||||||||
2019 | 2018 | 2017 | ||||||||||
REVENUES | $ | $ | $ | |||||||||
OPERATING EXPENSES: | ||||||||||||
Costs of services | ||||||||||||
Salary and employee benefits | ||||||||||||
Depreciation and amortization | ||||||||||||
Selling, general and administrative | ||||||||||||
Total operating expenses | ||||||||||||
Income from operations | ||||||||||||
OTHER (EXPENSES) INCOME: | ||||||||||||
Interest expense | ( | ) | ( | ) | ( | ) | ||||||
Other income (expense), net | ( | ) | ( | ) | ||||||||
Total other expenses, net | ( | ) | ( | ) | ( | ) | ||||||
(Loss) income before income taxes | ( | ) | ( | ) | ||||||||
Income tax expense (benefit) | ( | ) | ||||||||||
Net (loss) income | $ | ( | ) | $ | ( | ) | $ | |||||
(Loss) income per common share: | ||||||||||||
Basic and diluted | $ | ( | ) | $ | ( | ) | $ | |||||
Weighted-average common shares outstanding: | ||||||||||||
Basic and diluted | ||||||||||||
PRO FORMA (C-corporation basis): | ||||||||||||
Pro forma income tax (benefit) expense (unaudited) | $ | ( | ) | $ | ||||||||
Pro forma net (loss) income (unaudited) | $ | ( | ) | $ | ||||||||
(Loss) earnings per common share: | ||||||||||||
Basic and diluted (unaudited) | $ | ( | ) | $ | ||||||||
See Notes to Consolidated Financial Statements
61
Consolidated Statements of Changes in Stockholders' Deficit
For the Years Ended December 31, 2019, 2018, and 2017
(in thousands) | Year Ended December 31, | |||||||||||
2019 | 2018 | 2017 | ||||||||||
Preferred Stock shares | ||||||||||||
Preferred Stock amounts | $ | $ | $ | |||||||||
Common Stock shares: | ||||||||||||
Beginning balance | ||||||||||||
Member redemptions | ( | ) | ( | ) | ||||||||
Elimination of Class C Units | ( | ) | ||||||||||
Elimination of Preferred Units | ( | ) | ||||||||||
Pro-rata adjustments and forfeitures | ( | ) | ( | ) | ||||||||
Conversion of MI Acquisitions, Inc. shares | ||||||||||||
Founders' Shares | ( | ) | ||||||||||
Vesting of equity-based compensation | ||||||||||||
Common stock issued for business combinations | ||||||||||||
Warrant redemptions | ||||||||||||
Shares repurchased | ( | ) | ||||||||||
Ending balance | ||||||||||||
Common Stock amounts: | ||||||||||||
Beginning balance | $ | $ | $ | |||||||||
Member redemptions | ( | ) | ( | ) | ||||||||
Conversion of MI Acquisitions, Inc. shares | ||||||||||||
Vesting of equity-based compensation | (a) | |||||||||||
Warrant redemptions | (a) | — | — | |||||||||
Ending balance | $ | $ | $ | |||||||||
Treasury Stock shares: | ||||||||||||
Beginning balance | ||||||||||||
Repurchases of common stock | ||||||||||||
Ending balance | ||||||||||||
Treasury Stock amounts: | ||||||||||||
Beginning balance | $ | $ | $ | |||||||||
Repurchases of common stock | ( | ) | ||||||||||
Ending balance | $ | ( | ) | $ | $ | |||||||
Additional Paid-In Capital: | ||||||||||||
Beginning balance | $ | $ | $ | |||||||||
Distributions to members | ( | ) | ( | ) | ||||||||
Member redemptions | ( | ) | ( | ) | ||||||||
Reclass for common shares repurchase obligation | ( | ) | ||||||||||
Release of contingent consideration | ||||||||||||
Equity-based compensation | ||||||||||||
Vesting of equity-based compensation | ( | ) | ||||||||||
Conversion of MI Acquisitions, Inc. shares | ||||||||||||
Founders' Shares | ( | ) | ||||||||||
Recapitalization costs | ( | ) | ||||||||||
Common stock issued for business combinations | ||||||||||||
Ending balance | $ | $ | $ | |||||||||
62
(in thousands) | Year Ended December 31, | |||||||||||
As restated - Note 2 | As restated - Note 2 | |||||||||||
2019 | 2018 | 2017 | ||||||||||
Accumulated (Deficit) Earnings: | ||||||||||||
Beginning balance | $ | ( | ) | $ | ( | ) | $ | |||||
Cumulative corrections of errors for periods prior to 2017 (Note 2) | ( | ) | ||||||||||
Restated accumulated earnings at January 1, 2017 (Note 2) | ||||||||||||
Member redemptions | ( | ) | ( | ) | ||||||||
Net deferred income tax asset related to loss of partnership status | ||||||||||||
Equity-based compensation | ||||||||||||
Net (loss) income prior to corrections of errors (Note 2) | ( | ) | ( | ) | ||||||||
Corrections of errors (Note 2) | ( | ) | ( | ) | ||||||||
Ending balance - restated (Note 2) | $ | ( | ) | $ | ( | ) | $ | ( | ) | |||
Non-controlling Interest: | ||||||||||||
Beginning balance | $ | $ | $ | |||||||||
Issuance of non-controlling interest in subsidiary | ||||||||||||
Ending balance | $ | $ | $ | |||||||||
PRTH stockholders' ending deficit balance - restated (Note 2) | ( | ) | $ | ( | ) | $ | ( | ) | ||||
Non-controlling interest balance | ||||||||||||
Total stockholders' deficit balance - restated (Note 2) | $ | ( | ) | $ | ( | ) | $ | ( | ) | |||
(a) Rounds to less than one thousand dollars.
See Notes to Consolidated Financial Statements
63
Consolidated Statements of Cash Flows
For the Years Ended December 31, 2019, 2018, and 2017
(in thousands) | As restated - Note 2 | As restated - Note 2 | |||||||||||
2019 | 2018 | 2017 | |||||||||||
Cash Flows From Operating Activities: | |||||||||||||
Net (loss) income | $ | ( | ) | $ | ( | ) | $ | ||||||
Adjustments to reconcile net (loss) income to net cash provided by operating activities: | |||||||||||||
Depreciation and amortization of assets | |||||||||||||
Equity-based compensation | |||||||||||||
Amortization of debt issuance costs and discount | |||||||||||||
Equity in losses and impairment of unconsolidated entities | |||||||||||||
Provision for deferred income taxes | ( | ) | ( | ) | |||||||||
Provision (reduction) for allowance for deferred income tax assets | ( | ) | |||||||||||
Change in fair value of warrant liability | |||||||||||||
Change in fair value of contingent consideration | ( | ) | ( | ) | |||||||||
Loss on debt extinguishment | |||||||||||||
Payment-in-kind interest | |||||||||||||
Other non-cash items | ( | ) | |||||||||||
Change in operating assets and liabilities (net of business combinations): | |||||||||||||
Accounts receivable | ( | ) | ( | ) | |||||||||
Settlement assets and obligations, net | |||||||||||||
Prepaid expenses and other current assets | ( | ) | |||||||||||
Notes receivable | ( | ) | ( | ) | |||||||||
Customer deposits and advance payments | ( | ) | |||||||||||
Accounts payable and other current liabilities | ( | ) | |||||||||||
Other assets and liabilities | ( | ) | |||||||||||
Net Cash Provided By Operating Activities | |||||||||||||
Cash Flows From Investing Activities: | |||||||||||||
Acquisitions of businesses | ( | ) | ( | ) | |||||||||
Additions to property, equipment, and software | ( | ) | ( | ) | ( | ) | |||||||
Notes receivable loan funding | ( | ) | |||||||||||
Acquisitions of intangible assets | ( | ) | ( | ) | ( | ) | |||||||
Net Cash Used In Investing Activities | ( | ) | ( | ) | ( | ) | |||||||
Cash Flows From Financing Activities: | |||||||||||||
Proceeds from issuance of long-term debt, net of issue discount | |||||||||||||
Repayments of long-term debt | ( | ) | ( | ) | ( | ) | |||||||
Borrowings under revolving line of credit | |||||||||||||
Repayments of borrowings under revolving line of credit | ( | ) | ( | ) | |||||||||
Debt issuance costs refunded (paid) | ( | ) | ( | ) | |||||||||
Repurchases of common stock | ( | ) | |||||||||||
Distributions from equity | ( | ) | ( | ) | |||||||||
Redemptions of equity interests | ( | ) | ( | ) | |||||||||
Recapitalization proceeds | |||||||||||||
Redemption of warrants | ( | ) | |||||||||||
Recapitalization costs | ( | ) | |||||||||||
64
Net Provided By (Used In) Financing Activities | ( | ) | |||||||||||
Net change in cash and restricted cash | ( | ) | |||||||||||
Cash and restricted cash at beginning of year | |||||||||||||
Cash and restricted cash at end of year | $ | $ | $ | ||||||||||
Reconciliation of cash and restricted cash: | |||||||||||||
Cash | $ | $ | $ | ||||||||||
Restricted cash | |||||||||||||
Total cash and restricted cash | $ | $ | $ | ||||||||||
Supplemental cash flow information: | |||||||||||||
Cash paid for interest | $ | $ | $ | ||||||||||
Recognition of initial net deferred income tax asset | $ | $ | $ | ||||||||||
Non-cash investing and financing activities: | |||||||||||||
Purchases of property, equipment, and software through accounts payable | $ | $ | 60 | $ | |||||||||
Intangible assets acquired by issuing non-controlling interest in a subsidiary | $ | $ | $ | ||||||||||
Notes receivable from sellers used as partial consideration for business acquisitions | $ | $ | $ | ||||||||||
Common stock issued as partial consideration in business acquisitions in Consumer Payments segment | $ | $ | $ | ||||||||||
Cash consideration payable for business acquisition | $ | $ | $ | ||||||||||
Accrual for asset acquisition contingent consideration | $ | $ | $ | ||||||||||
Common share repurchase obligation | $ | $ | $ | ||||||||||
See Notes to Consolidated Financial Statements
65
NOTES TO CONSOLIDATED FINANCIAL STATEMENTS
1. NATURE OF BUSINESS AND ACCOUNTING POLICIES
The Business
Headquartered in Alpharetta, Georgia, Priority Technology Holdings, Inc. and subsidiaries (together, the "Company") began operations in 2005 with a mission to build a merchant inspired payments platform that would advance the goals of its customers and partners. Today, the Company is a leading provider of merchant acquiring and commercial payment solutions, offering unique product capabilities to small and medium size businesses ("SMBs") and enterprises and distribution partners in the United States. The Company operates from a purpose-built business platform that includes tailored customer service offerings and bespoke technology development, allowing the Company to provide end-to-end solutions for payment and payment-adjacent needs.
The Company provides:
• | Consumer payments processing solutions for business-to-consumer ("B2C") transactions through independent sales organizations ("ISOs"), financial institutions, independent software vendors ("ISVs"), and other referral partners. Our proprietary MX platform for B2C payments provides merchants a fully customizable suite of business management solutions. |
• | Commercial payments solutions such as automated vendor payments and professionally curated managed services to industry leading financial institutions and networks. Our proprietary business-to-business ("B2B") Commercial Payment Exchange (CPX) platform was developed to be a best-in-class solution for buyer/supplier payment enablement. |
• | Institutional services (also known as Managed Services) solutions that provide audience-specific programs for institutional partners and other third parties looking to leverage the Company's professionally trained and managed call center teams for customer onboarding, assistance, and support, including marketing and direct-sales resources. |
• | Integrated partners solutions for ISVs and other third-parties that allow them to leverage the Company's core payments engine via robust application program interfaces ("APIs") resources and high-utility embeddable code. |
• | Consulting and development solutions focused on the increasing demand for integrated payments solutions for transitioning to the digital economy. |
The Company provides its services through three reportable segments: (1) Consumer Payments, (2) Commercial Payments, and (3) Integrated Partners. For additional information about our reportable segments, see Note 18, Segment Information.
To provide many of its services, the Company enters into agreements with payment processors which in turn have agreements with multiple card associations. These card associations comprise an alliance aligned with insured financial institutions ("member banks") that work in conjunction with various local, state, territory, and federal government agencies to make the rules and guidelines regarding the use and acceptance of credit and debit cards. Card association rules require that vendors and processors be sponsored by a member bank and register with the card associations. The Company has multiple sponsorship bank agreements and is itself a registered ISO with Visa®. The Company is also a registered member service provider with MasterCard®. The Company's sponsorship agreements allow the capture and processing of electronic data in a format to allow such data to flow through networks for clearing and fund settlement of merchant transactions.
Corporate History and Recapitalization
M I Acquisitions, Inc. ("MI Acquisitions") was incorporated under the laws of the state of Delaware as a special purpose acquisition company ("SPAC") whose objective was to acquire, through a merger, share exchange, asset acquisition, stock purchase, recapitalization, reorganization or other similar business combination, one or more businesses or entities. MI Acquisitions completed an initial public offering ("IPO") in September 2016, and MI Acquisitions' common stock began trading on The Nasdaq Capital Market with the symbol MACQ. In addition, MI Acquisitions completed a private placement to certain initial stockholders of MI Acquisitions. MI Acquisitions received gross proceeds of approximately $54.0 million from the IPO and private placement.
On July 25, 2018, MI Acquisitions acquired all of the outstanding member equity interests of Priority Holdings, LLC ("Priority") in exchange for the issuance of MI Acquisitions' common stock (the "Business Combination") from a private placement. As a
66
result, Priority, which was previously a privately-owned company, became a wholly-owned subsidiary of MI Acquisitions. Simultaneously with the Business Combination, MI Acquisitions changed its name to Priority Technology Holdings, Inc. and its common stock began trading on The Nasdaq Global Market with the symbol PRTH.
As a SPAC, MI Acquisitions had substantially no business operations prior to July 25, 2018. For financial accounting and reporting purposes under accounting principles generally accepted in the United States ("U.S. GAAP"), the acquisition was accounted for as a "reverse merger," with no recognition of goodwill or other intangible assets. Under this method of accounting, MI Acquisitions was treated as the acquired entity whereby Priority was deemed to have issued common stock for the net assets and equity of MI Acquisitions consisting mainly of cash of $49.4 million, accompanied by a simultaneous equity recapitalization (the "Recapitalization") of Priority. The net assets of MI Acquisitions are stated at historical cost and, accordingly, the equity and net assets of the Company have not been adjusted to fair value. As of July 25, 2018, the consolidated financial statements of the Company include the combined operations, cash flows, and financial positions of both MI Acquisitions and Priority. Prior to July 25, 2018, the results of operations, cash flows, and financial position are those of Priority. The units and corresponding capital amounts and earnings per unit of Priority prior to the Recapitalization have been retroactively revised as shares reflecting the exchange ratio established in the Recapitalization.
The Company's President, Chief Executive Officer and Chairman controls a majority of the voting power of the Company's outstanding common stock. As a result, the Company is a "controlled company" within the meaning of the corporate governance standards of the Nasdaq Stock Market, LLC ("Nasdaq").
Emerging Growth Company
The Company is an "emerging growth company" (EGC), as defined in the Jumpstart Our Business Startups Act of 2012 ("JOBS Act"). The Company may remain an EGC until December 31, 2021. However, if the Company's non-convertible debt issued within a rolling three-year period or if its revenue for any year exceeds $1.07 billion, the Company would cease to be an EGC immediately, or the market value of its common stock that is held by non-affiliates exceeds $700.0 million on the last day of the second quarter of any given year, the Company would cease to be an EGC as of the beginning of the following year. As an EGC, the Company is not required to comply with the auditor attestation requirements of Section 404 of the Sarbanes-Oxley Act of 2002. Additionally, the Company as an EGC may continue to elect to delay the adoption of any new or revised accounting standards that have different effective dates for public and private companies until those standards apply to private companies. As such, the Company's financial statements may not be comparable to companies that comply with public company effective dates.
Basis of Presentation and Consolidation
The accompanying consolidated financial statements include those of the Company and its controlled subsidiaries. All intercompany accounts and transactions have been eliminated upon consolidation. Investments in unconsolidated affiliated companies are accounted for under the equity method and are included in "Other non-current assets" in the accompanying consolidated balance sheets. The Company generally utilizes the equity method of accounting when it has an ownership interest of between 20% and 50% in an entity, provided the Company is able to exercise significant influence over the investee's operations.
Use of Estimates
The preparation of consolidated financial statements in conformity with U.S. GAAP requires management to make estimates and assumptions that affect the reported amounts of assets and liabilities and disclosure of contingent assets and liabilities at the date of the consolidated financial statements and the reported amounts of revenues and expenses during the reported period. Actual results could materially differ from those estimates.
Components of Revenues and Expenses
Revenues
See Note 3, Revenue, for information about our revenue.
67
Costs of Services
Costs of services primarily consist of residual payments to ISOs and other direct costs of providing payment services. The residual payments represent commissions paid to ISOs is generally based upon a percentage of the net revenues generated from merchant transactions. Other costs of services consist of third-party costs related to the Company's commercial payment services, ACH processing services, salaries that are reimbursed under cost-plus business process outsourcing services, and the cost of equipment (point of sale terminals).
Selling, General and Administrative
SG&A expenses include mainly professional services, advertising, rent, office supplies, software licenses, utilities, state and local franchise and sales taxes, litigation settlements, executive travel, insurance, and expenses related to the Business Combination.
Interest Expense
Interest expense consists of interest on outstanding debt and amortization of deferred financing costs and original issue discounts.
Other, net
Other, net is composed of interest income, debt modification and extinguishment expenses, changes in fair value of warrant liabilities, and equity in losses and impairment of unconsolidated entities. Interest income consists mainly of interest received pursuant to notes receivable from independent sales agents and another entity (see Note 13, Related Party Matters). Debt modification and extinguishment expenses includes write-offs of unamortized deferred financing costs and original issue discount relating to the extinguished debt. Equity in loss and impairment of unconsolidated entities consists of the Company's share of the income or loss of its equity method investment as well as any impairment charges related to such investments.
Comprehensive Income (Loss)
Comprehensive income (loss) represents the sum of net income (loss) and other amounts that are not included in the audited consolidated statement of operations as the amounts have not been realized. For the years ended December 31, 2018, 2017, and 2016, there were no differences between the Company's net income (loss) and comprehensive income (loss). Therefore, no separate Statements of Other Comprehensive Income (Loss) are included in the financial statements for the reporting periods.
Significant Accounting Policies
Revenue Recognition
The Company recognizes revenue when it satisfies a performance obligation by transferring a service or good to the customer in an amount to which the Company expects to be entitled (i.e., transaction price) allocated to the distinct services or goods.
The Company uses the 5-step model in ASC 606 to determine when and how much revenue to recognize:
Step 1 - Identify the contract with the customer
Step 2 - Identify the performance obligation
Step 3 - Determine the transaction price
Step 4 - Allocate the transaction price to the performance obligation
Step 5 - Recognize revenue when (or as) the Company satisfies the performance obligation
68
Instead of evaluating each contract with a customer on an individual basis, the Company elects the permitted practical expedient that allows it to use the portfolio approach for many of its contracts since this approach’s impact on the financial statements, when applied to a group of contracts (or performance obligations) with similar characteristics, is not materially different from the impact of applying the revenue standard on an individual contract basis. Under the portfolio practical expedient, collectability is still assessed at the individual contract level when determining if a contract exists.
Deferred revenues are not material.
The Company's reportable segments are organized by services the Company provides through distinct business units. Set forth below is a description of the Company's revenue recognition polices by segment.
Consumer Payments - Revenue in this segment represents merchant card fee revenues, which involves promises to the customer for services related to the electronic authorization, acceptance, processing, and settlement of credit, debit and electronic benefit payment transactions through the payment networks. Merchants, who are the Company’s customers, are charged rates which are based on various factors, including the type of bank card, card brand, merchant charge volume, the merchant's industry and the merchant's risk profile. Typically, revenues generated from these transactions are based on a variable percentage of the dollar amount of each transaction, and in some instances, additional fees are charged for each transaction. The Company's merchant contracts involve three parties: the Company, the merchant and the sponsoring bank. The Company's sponsoring banks collect the gross merchant discount from the card holder’s issuing bank, pay the interchange fees and assessments to the payment networks and credit card associations, retain their fees, and pay to the Company the remaining amount which represents the Company's revenue. The Company recognizes its revenue net of the amounts retained by these third parties. The Company incurs internal costs and costs of other third parties related to processing services. Merchant customers may also be charged miscellaneous fees, including statement fees, annual fees, and monthly minimum fees, fees for handling chargebacks, gateway fees and fees for other miscellaneous services.
Commercial Payments - This segment provides business-to-business ("B2B") automated payment services for customers, including virtual payments, purchase cards, electronic funds transfers, ACH payments, and check payments. Revenues are generally earned on a per-transaction basis and are recognized by the Company net of certain third-party costs for interchange fees, assessments to the payment networks, credit card associations, and sponsor bank fees. In this segment, a portion of the revenue is rebated to certain customers, and these rebates are reported as a reduction of revenue. Additionally, this segment provides outsourced business process services by providing a sales force to certain enterprise customers. Such business process services are provided on a cost-plus fee arrangement and revenue is recognized to the extent of billable rates times hours worked and other reimbursable costs incurred. For most performance obligations associated with outsourced services that are satisfied over time, the Company applies the permitted practical expedient known as the “invoice practical expedient” that allows the Company to recognize revenue in the amount of consideration to which the Company has the right to invoice when that amount corresponds directly to the value transferred to the customer.
Integrated Partners - The Integrated Partners segment earns revenue by providing services for payment-adjacent technologies that facilitate the acceptance of electronic payments from customers who conduct business in the rental real estate, rental storage, medical, and hospitality industries. A substantial portion of this segment’s revenues are earned as an agent of a third party, and therefore this earned revenue is reported as a net amount within revenue.
Cash and Restricted Cash
Accounts Receivable
Accounts receivable are stated net of allowance for doubtful accounts and are amounts primarily due from the Company's sponsor banks for revenues earned, net of related interchange and processing fees, and do not bear interest. Other types of accounts receivable are from agents, merchants and other customers. Amounts due from sponsor banks are typically paid within 30 days following the end of each month.
69
Allowance for Doubtful Accounts Receivable
Customer Deposits and Advance Payments
The Company may receive cash payments from certain customers and vendors that require future performance obligations by the Company. Amounts associated with obligations expected to be satisfied within one year are reported in Customer deposits and advance payments on the Company's consolidated balance sheets and amounts associated with obligations expected to be satisfied after one year are reported as a component of Other non-current liabilities on the Company's consolidated balance sheets. These payments are subsequently recognized in the Company's consolidated statements of operations when the Company satisfies the performance obligations required to retain and earn these deposits and advance payments.
A vendor may make an upfront payment to the Company to offset costs that the Company incurs to integrate the vendor into the Company’s operations. These upfront payments are deferred by the Company and are subsequently amortized against expense in its statement of operations as the related costs are incurred by the Company in accordance with the agreement with the vendor.
Property and Equipment, Including Leases
Property and equipment are stated at cost, except for property and equipment acquired in a merger or business combination, which is recorded at fair value at the time of the transaction. Depreciation is calculated using the straight-line method over the estimated useful lives of the assets.
The Company has multiple operating leases related to office space. Operating leases do not involve transfer of risks and rewards of ownership of the leased asset to the lessee, therefore the Company expenses the costs of its operating leases. The Company may make various alterations (leasehold improvements) to the office space and capitalize these costs as part of property and equipment. Leasehold improvements are amortized on a straight-line basis over the useful life of the improvement or the term of the lease, whichever is shorter.
Expenditures for repairs and maintenance which do not extend the useful life of the respective assets are charged to expense as incurred. Expenditures that increase the value or productive capacity of assets are capitalized. At the time of retirements, sales, or other dispositions of property and equipment, the original cost and related accumulated depreciation are removed from the respective accounts, and the gains or losses are presented as a component of income or loss from operations.
Costs Incurred to Develop Software for Internal Use
70
Settlement Assets and Obligations
Settlement processing assets and obligations recognized on the Company's consolidated balance sheet represent intermediary balances arising in the Company's settlement process for merchants and other customers. See Note 5, Settlement Assets and Obligations.
Debt Issuance Costs
Eligible debt issuance costs associated with the Company's credit facilities are deferred and amortized to interest expense over the term of the related debt using the effective interest method. Debt issuance costs associated with Company's term debt are presented on the Company's consolidated balance sheets as a direct reduction in the carrying value of the associated debt liability.
Business Combinations
The Company uses the acquisition method of accounting for business combinations which requires assets acquired and liabilities assumed to be recognized at their fair values on the acquisition date. Goodwill represents the excess of the purchase price over the fair value of the net assets acquired. The fair values of the assets acquired and liabilities assumed are determined based upon the valuation of the acquired business and involves making significant estimates and assumptions based on facts and circumstances that existed as of the acquisition date. The Company uses a measurement period following the acquisition date to gather information that existed as of the acquisition date that is needed to determine the fair value of the assets acquired and liabilities assumed. The measurement period ends once all information is obtained, but no later than one year from the acquisition date.
Non-Controlling Interests
The Company has issued non-voting profit-sharing interests in three of its subsidiaries that were formed in 2018 or 2019 to acquire the operating assets of certain businesses (see Note 4, Business Combinations, Asset Acquisitions, and Asset Contributions). The Company is still the majority owner of these subsidiaries and therefore the profit-sharing interests are deemed to be non-controlling interests ("NCI").
To estimate the initial fair value of a profit-sharing interest, the Company utilizes future cash flow scenarios with focus on those cash flow scenarios that could result in future distributions to the NCIs. In subsequent periods, profits or losses are attributed to an NCI based on the hypothetical-liquidation-at-book-value method that utilizes the terms of the profit-sharing agreement between the Company and the NCIs.
As the majority owner, the Company has call rights on the profit-sharing interests issued to the NCIs. These call rights can be executed only under certain circumstances and execution is always voluntary at the Company's discretion. The call rights do not meet the definition of a free-standing financial instrument or derivative, thus no separate accounting is required for these call rights.
Goodwill
Intangible Assets
Intangible assets are initially recorded at cost upon acquisition by the Company. The carrying value of an intangible asset acquired in an asset acquisition may be subsequently increased for contingent consideration when due to the seller. The portion of any unpaid purchase price that is contingent on future activities is not initially recorded by the Company on the date of acquisition. Rather, the Company recognizes contingent consideration when it becomes probable and estimable. All of the Company's intangible
71
assets, except Goodwill, have finite lives and are subject to amortization. Intangible assets consist of acquired merchant portfolios, customer relationships, ISO relationships, residual buyouts, trade names, technology, and non-compete agreements.
Merchant portfolios
Merchant portfolios consist of the acquired rights to a portfolio of merchants such as those acquired from Direct Connect Merchant Services, LLC, and YapStone, Inc. The Company amortizes the cost of its acquired merchant portfolios over their estimated useful lives, which range from five to fifteen years using a straight-line amortization method.
Customer Relationships
Customer relationships represent the cost of the acquired customer relationship, which typically consists of a portfolio of merchants or contracted business relationships. The Company amortizes the cost of its acquired customer relationships over their estimated useful lives, which range from ten years to fifteen years , using either a straight-line or an accelerated amortization method that most accurately reflects the pattern in which the economic benefits of the respective asset is consumed.
ISO Relationships
ISO relationships represent the cost of acquired relationships with ISOs. The Company amortizes the cost of its acquired ISO relationships over their estimated useful lives, which range from 11 years to 25 years, using an accelerated amortization method that most accurately reflects the pattern in which the economic benefits of the respective asset is consumed.
Residual Buyouts
Most of the Company's merchant customers in its Consumer Payments reportable segment are associated with independent ISOs, and these ISOs typically have a right to receive commissions from the Company based on the revenue earned by the associated merchants. Although not obligated to do so, the Company may occasionally decide to pay an ISO an agreed-upon amount in exchange for the ISO's surrender of its right to receive future commissions from the Company, either temporarily or permanently. The amount that the Company pays for these residual buyouts is capitalized and subsequently amortized over the term of the residual buyout agreement, or if the residual buyout is permanent, over the expected life of the underlying merchant relationships. These amortization periods range between one year and nine years and the Company uses either a straight-line or an accelerated amortization method that most accurately reflects the pattern in which the economic benefits of the respective asset is consumed.
Technology
Technology intangible assets represent acquired technology, such as proprietary software and website domains. The Company amortizes the cost of acquired technology over their estimated useful lives, which range from 5 years to 7 years, using a straight-line amortization method that most accurately reflects the pattern in which the economic benefits of the respective asset is consumed.
Other Intangible Assets
The Company's intangible assets also include acquired trade names and non-compete agreements. These assets are amortized over their estimated useful lives ranging from five years to 25 years using a straight-line amortization method. All non-compete agreements were fully amortized at December 31, 2019 and 2018.
Impairment of Long-lived Assets
72
Accrued Residual Commissions
Accrued residual commissions consist of amounts due to independent sales organizations ("ISOs") and independent sales agents on the processing volume of the Company's merchant customers. The commissions due are based on varying percentages of the volume processed by the Company on behalf of the merchants. Percentages vary based on the program type and transaction volume of each merchant. Residual commission expenses, adjusted for the Company's retrospective adoption of ASC 606 (see Note 1, Nature of Business and Accounting Policies) were $213.8 million, $230.2 million, and $238.5 million, respectively, for the years ended December 31, 2019, 2018 and 2017, and are included in costs of services in the accompanying consolidated statements of operations.
ISO Deposit and Loss Reserve
ISOs may partner with the Company in an executive partner program in which ISOs are given negotiated pricing in exchange for bearing risk of loss. Through the arrangement, the Company accepts deposits on behalf of the ISO and a reserve account is established by the Company. All amounts maintained by the Company are included in the accompanying consolidated balance sheets as other liabilities, which are directly offset by restricted cash accounts owned by the Company.
Equity-Based Compensation
The Company recognizes the cost resulting from all equity-based payment transactions in the financial statements at grant date fair value. Equity-based compensation expense is recognized over the requisite service period and is reflected in Salary and employee benefits expense on the Company's consolidated statements of operations. The effects of forfeitures are recognized as they occur.
Stock options
Under the Company's 2018 Equity Incentive Plan, the Company determines the fair value of stock options using the Black-Scholes option pricing model, which requires the use of the following subjective assumptions:
Expected Volatility - Measure of the amount by which a stock price has fluctuated or is expected to fluctuate. Due to the relatively short amount of time that the Company's common stock (Nasdaq: PRTH) has traded on a public market, the Company uses volatility data for the common stocks of a peer group of comparable public companies. An increase in the expected volatility will increase the fair value of the stock option and related compensation expense.
Risk-free interest rate - U.S. Treasury rate for a stripped-principal treasury note as of the grant date having a term equal to the expected term of the stock option. An increase in the risk-free interest rate will increase the fair value of the stock option and related compensation expense.
Expected term - Period of time over which the stock options granted are expected to remain outstanding. As a newly-public company, the Company lacks sufficient exercise information for its stock option plan. Accordingly, the Company uses a method permitted by the Securities and Exchange Commission ("SEC") whereby the expected term is estimated to be the mid-point between the vesting dates and the expiration dates of the stock option grants. An increase in the expected term will increase the fair value of the stock option and the related compensation expense.
Dividend yield - The Company used an amount of zero as the Company has paid no cash or stock dividends and does not anticipate doing so in the foreseeable future. An increase in the dividend yield will decrease the fair value of the stock option and the related compensation expenses.
Time-Based Restricted Stock Awards
The fair value of time-based restricted stock awards is determined based on the quoted closing price of the Company's common stock on the date of grant and is recognized as compensation expense over the vesting term of the awards.
73
Performance-Based Restricted Stock Awards
The Company accounts for its performance-based restricted equity awards based on the quoted closing price of the Company's common stock on the date of grant, adjusted for any market-based vesting criteria, and records equity-based compensation expense over the vesting term of the awards based on the probability that the performance criteria will be achieved. The Company reassesses the probability of vesting at each reporting period and prospectively adjusts equity-based compensation expense based on its probability assessment.
Repurchased Stock
Pursuant to the provisions of ASC 505-30, Treasury Stock, the Company has elected to apply the cost method when accounting for treasury stock resulting from the repurchase of its common stock. Under the cost method, the gross cost of the shares reacquired is charged to a contra equity account labeled Treasury Stock. The equity accounts that were originally credited for the original share issuance, common stock and additional paid-in capital, remain intact. See Note 14, Stockholders' Deficit Information.
If the treasury shares are ever reissued in the future, proceeds in excess of repurchased cost will be credited to additional paid-in capital. Any deficiency will be charged to retained earnings (accumulated deficit), unless additional paid-in capital from previous treasury stock transactions exists, in which case the deficiency will be charged to that account, with any excess charged to retained earnings (accumulated deficit). If treasury stock is reissued in the future, a cost flow assumption (e.g., FIFO, LIFO, or specific identification) will be adopted to compute excesses and deficiencies upon subsequent share reissuance.
Earnings (Loss) Per Share
Basic earnings (loss) per share ("EPS") is computed by dividing net income (loss) available to common stockholders by the weighted-average number of shares of common stock outstanding during the period, excluding the effects of any potentially dilutive securities. Diluted EPS gives effect to the potential dilution, if any, that could occur if securities or other contracts to issue common stock were exercised or converted into common stock, using the more dilutive of the two-class method or if-converted method. Diluted EPS excludes potential shares of common stock if their effect is anti-dilutive. If there is a net loss in any period, basic and diluted EPS are computed in the same manner.
The two-class method determines net income (loss) per common share for each class of common stock and participating securities according to dividends declared or accumulated and participation rights in undistributed earnings. The two-class method requires income available to common shareholders for the period to be allocated between common stock and participating securities based upon their respective rights to receive dividends as if all income for the period had been distributed. Prior to redemption in July 2018, the Goldman Sachs warrants were deemed to be participating securities because they had a contractual right to participate in non-forfeitable dividends on a one-for-one basis with the Company's common stock. Accordingly, the Company applied the two-class method for EPS when computing net income (loss) per common share. For periods beginning after September 30, 2018, EPS using the two-class method is no longer required due to the redemption of the Goldman Sachs warrant. See Note 10, Long-term Debt and Warrant Liability.
Income Taxes
Prior to July 25, 2018, Priority was a "pass-through" entity for income tax purposes and had no material income tax accounting reflected in its financial statements since taxable income and deductions were "passed through" to Priority's unconsolidated owners. As a limited liability company, Priority Holdings, LLC elected to be treated as a partnership for the purpose of filing income tax returns, and as such, the income and losses of Priority Holdings, LLC flowed through to its members. Accordingly, no provisions for federal and most state income taxes was provided in the consolidated financial statements. However, periodic distributions were made to members to cover company-related tax liabilities.
MI Acquisitions was a taxable "C-Corp" for income tax purposes. As a result of Priority's acquisition by MI Acquisitions, the combined Company is now a taxable "C-Corp" that reports all of Priority's income and deductions for income tax purposes. Accordingly, subsequent to July 25, 2018, the consolidated financial statements of the Company reflect the accounting for income taxes in accordance with Financial Accounting Standards Board 's ("FASB") Accounting Standards Codification ("ASC") 740, Income Taxes ("ASC 740").
74
The Company accounts for income taxes under the asset and liability method. Under this method, deferred tax assets and liabilities are determined based on differences between financial reporting and tax bases of assets and liabilities and are measured using enacted tax rates and laws that are expected to be in effect when the differences are expected to be recovered or settled. Realization of deferred tax assets is dependent upon future taxable income. A valuation allowance is recognized if it is more likely than not that some portion or all of a deferred tax asset will not be realized based on the weight of available evidence, including expected future earnings.
The Company recognizes an uncertain tax position in its financial statements when it concludes that a tax position is more likely than not to be sustained upon examination based solely on its technical merits. Only after a tax position passes the first step of recognition will measurement be required. Under the measurement step, the tax benefit is measured as the largest amount of benefit that is more likely than not to be realized upon effective settlement. This is determined on a cumulative probability basis. The full impact of any change in recognition or measurement is reflected in the period in which such change occurs. The Company recognized interest and penalties associated with uncertain tax positions as a component of income tax expense.
Fair Value Measurements
The Company measures certain assets and liabilities at fair value. Fair value is defined as the exchange price that would be received for an asset or paid to transfer a liability (an exit price) in the principal or most advantageous market for the asset or liability in an orderly transaction between market participants at the measurement date. The Company uses a three-level fair value hierarchy to prioritize the inputs used to measure fair value and maximizes the use of observable inputs and minimizes the use of unobservable inputs. The three levels of inputs used to measure fair value are as follows:
Level 1 – Quoted market prices in active markets for identical assets or liabilities as of the reporting date.
Level 2 – Observable market-based inputs or unobservable inputs that are corroborated by market data.
Level 3 – Unobservable inputs that are not corroborated by market data.
The fair values of the Company's merchant portfolios, assets and liabilities acquired in mergers and business combinations, and contingent consideration are primarily based on Level 3 inputs and are generally estimated based upon valuation techniques that include discounted cash flow analysis based on cash flow projections and, for years beyond the projection period, estimates based on assumed growth rates. Assumptions are also made regarding appropriate discount rates, perpetual growth rates, and capital expenditures, among others. In certain circumstances, the discounted cash flow analysis is corroborated by a market-based approach that utilizes comparable company public trading values and, where available, values observed in public market transactions.
The carrying values of accounts and notes receivable, accounts payable and accrued expenses, long-term debt and cash, including settlement assets and the associated deposit liabilities approximate fair value due to either the short-term nature of such instruments or the fact that the interest rate of the debt is based upon current market rates.
New Accounting and Reporting Standards
Prior to July 25, 2018, Priority was defined as a non-public entity for purposes of applying transition guidance related to new or revised accounting standards under U.S. GAAP, and as such was typically required to adopt new or revised accounting standards subsequent to the required adoption dates that applied to public companies. MI Acquisitions was classified as an EGC. Subsequent to the Business Combination, the Company will cease to be an EGC no later than December 31, 2021. The Company will maintain the election available to an EGC to use any extended transition period applicable to non-public companies when complying with a new or revised accounting standards. Therefore, as long as the Company retains EGC status, the Company can continue to elect to adopt any new or revised accounting standards on the adoption date (including early adoption) required for a private company.
Accounting Standards Adopted in 2019
Revenue Recognition (ASC 606) and Related Costs to Obtain or Fulfill a Contracts with Customers (ASC 340-40)
75
For the annual reporting period that began on January 1, 2019, the Company adopted ASU 2014-09 and the other clarifications and technical guidance issued by the Financial Accounting Standards Board ("FASB") related to this new revenue standard that have been collectively codified in Accounting Standards Codification ("ASC") Topic 606, Revenue from Contracts with Customers, and the related ASC Subtopic 340-40, Other Assets and Deferred Costs - Contracts with Customers, (together, "ASC 606"). As an emerging growth company, the Company adopted ASC 606 under the extended transition provisions available to a non-public business entity. Accordingly, the Company was not required to report under the new standards until the Company’s annual reporting period for the year ended December 31, 2019. As such, amounts previously reported in the Company’s unaudited condensed consolidated financial statements and related disclosures for prior quarterly periods in 2019 on Forms 10-Q were under the legacy guidance of ASC 605, Revenue Recognition, and the SEC’s Topic 13, Revenue Recognition.
In reporting the effects of the adoption of ASC 606 in its consolidated financial statements and related disclosures, the Company elected the full retrospective transition method. Under this method, all annual periods presented herein (2019, 2018, and 2017) in these consolidated financial statements and related disclosures have been retrospectively recasted to reflect the provisions of ASC 606. In connection with the Company’s evaluation and adoption of ASC 606, the classification of certain transactions previously presented in revenue at their gross amounts were re-evaluated under the principal-agent guidance and have been retrospectively recasted within the Company’s statements of operations to a net presentation (see Note 2, Restatement of Previously Issued Consolidated Financial Statements). There were no other adjustments as the result of the adoption of ASC 606 and, accordingly, no adjustment was required to the Company’s beginning retained earnings (deficit) at January 1, 2017 to reflect the cumulative effect of initially applying the new standards. These reclassifications did not have any impact on income from operations, income (loss) before income taxes, net income (loss), assets, liabilities, stockholders’ deficit, or cash flows for any period. Beginning first quarter 2020, all interim reporting periods, including comparative periods, will also reflect the provisions of ASC 606.
The effects on the Company's consolidated balance sheets and consolidated statements of cash flows related to the full retrospective adoption of ASC 606 were not material and therefore no adjustments have been made for the adoption of the new accounting standard.
For a summary of the effects of the adoption of ASC 606, along with the effects of certain error corrections, on line items in the Company's consolidated statements of operations for the years ended December 31, 2018 and 2017, see Note 2, Restatement of Previously Issued Consolidated Financial Statements.
The following table summarizes the effects of the Company's full retrospective adoption of ASC 606 on line items in the Company's consolidated statements of operations for the year ended December 31, 2019:
(in thousands) | For the Year Ended December 31, 2019 | |||||||||||
As recasted | Effects of Adoption of ASC 606 | Balances Without Adoption of ASC 606 | ||||||||||
Consolidated: | ||||||||||||
Revenues | $ | $ | ( | ) | $ | |||||||
Costs of Services | $ | $ | ( | ) | $ | |||||||
See Note 20, Selected Quarterly Financial Results (Unaudited), for information about how the full retrospective adoption of ASC 606 effected the Company's consolidated revenues and costs of services for each interim quarterly reporting period in the years ended December 31, 2019 and 2018.
See Note 18, Segment Information, for information on the effects that the full retrospective adoption of ASC 606 had on the revenues of the Company's reportable segments for the years ended December 31, 2019, 2018, and 2017.
76
Gains and Losses from Derecognition of Non-Financial Assets (ASU 2017-05)
Concurrent with the adoption of ASC 606, the Company was also required to adopt the provisions of ASU 2017-05, Other Income-Gains and Losses from the Derecognition of Non-financial Assets ("ASU 2017-05"). ASU 2017-05 clarifies that the guidance in ASC 610-20 on accounting for derecognition of a non-financial asset and an in-substance non-financial asset applies only when the asset or asset group does not meet the definition of a business or is not a non-for-profit entity. Non-financial assets include, but are not limited to, intangible assets, property and equipment. This ASU also clarifies that the provisions of ASC 606 apply if an entity transfers an asset to a customer. If an asset transfer in within the scope of ASU 2017-05, an entity measures its gain or loss on derecognition of each distinct asset as the difference between the amount of consideration received and the carrying amount of the distinct asset. The adoption of ASU 2017-05 had no impact on the Company's results of operations, financial position, or cash flows for the year ended December 31, 2019. However, the application of ASU 2017-05 to future transactions could be material.
Measurements of Certain Equity Investments (ASU 2016-01)
Under ASU 2016-01, Recognition and Measurement of Financial Assets and Financial Liabilities, entities have to measure equity investments (except those accounted for under the equity method, those that result in consolidation of the investee and certain other investments) at fair value and recognize any changes in fair value in net income. However, for equity investments that do not have readily determinable fair values and do not qualify for the existing practical expedient in ASC 820 to estimate fair value using the net asset value per share (or its equivalent) of the investment, the guidance provides a new measurement alternative. Entities may choose to measure those investments at cost, less any impairment, plus or minus changes resulting from observable price changes in orderly transactions for the identical or a similar investment of the same issuer. The Company early adopted the provisions of ASU 2016-01 on April 1, 2019 and applied them to an acquired warrant to purchase equity of another entity, the same entity that borrowed $3.5 million from the Company during 2019 under a $10.0 million loan and loan commitment agreement. The carrying value, at cost, and fair value of the warrant were not material. See Note 13, Related Party Matters.
Statement of Cash Flows (ASU 2016-15)
In August 2016, the FASB issued ASU No. 2016-15, Statement of Cash Flows (Topic 230). This ASU represents a consensus of the FASB's Emerging Issues Task Force on eight separate issues that each impact classifications on the statement of cash flows. In particular, issue number three addresses the classification of contingent consideration payments made after a business combination. Under ASU 2016-15, cash payments made soon after an acquisition's consummation date (i.e., approximately three months or less) will be classified as cash outflows from investing activities. Payments made thereafter will be classified as cash outflows from financing activities up to the amount of the original contingent consideration liability. Payments made in excess of the amount of the original contingent consideration liability will be classified as cash outflows from operating activities. As an EGC, this ASU was effective for the Company's annual reporting period beginning in 2019 and will be effective for interim periods beginning in 2020. The Company made no payments in 2019 for contingent consideration related to business combinations.
Income Taxes for Intra-Entity Transfers of Assets Other Than Inventory (ASU 2016-16)
In October 2016, the FASB issued ASU 2016-16, Intra-Entity Transfers of Assets Other Inventory ("ASU 2016-16"). ASU 2016-16 removes the prohibition in ASC 740 against the immediate recognition of the current and deferred income tax effects of intra-entity transfers of assets other than inventory. The ASU is intended to reduce the complexity of U.S. GAAP and diversity in practice related to the tax consequences of certain types of intra-entity asset transfers, particularly those involving intellectual property. ASU 2016-16 was effective for the Company's annual reporting period ended December 31, 2019 and will be effective for interim periods beginning in 2020. The adoption of ASU 2016-16 did not have a material effect on the Company's results of operations, financial position, or cash flows. However, any future inter-entity transfers of assets within scope of this ASU may be affected.
77
Accounting Standards Adopted in 2018
Modifications to Share-Based Compensation Awards (ASU 2017-09)
As of January 1, 2018, the Company adopted Accounting Standards Update ("ASU") No. 2017-09, Compensation-Stock Compensation Topic 718 - Scope of Modification Accounting ("ASU 2017-09"). ASU 2017-09 clarifies when changes to the terms and conditions of share-based payment awards must be accounted for as modifications. Entities apply the modification accounting guidance if the value, vesting conditions, or classification of an award changes. The Company has not modified any share-based payment awards since the adoption of ASU 2017-09, therefore this new ASU has had no impact on the Company's financial position, operations, or cash flows. Should the Company modify share-based payment awards in the future, it will apply the provisions of ASU 2017-09.
Balance Sheet Classification of Deferred Income Taxes (ASU 2015-17)
In connection with the Business Combination and Recapitalization, the Company prospectively adopted the provisions of ASU No. 2015-17, Balance Sheet Classification of Deferred Taxes ("ASU 2015-17"), during the third quarter of 2018. ASU 2015-17 simplifies the balance sheet presentation of deferred income taxes by reporting the net amount of deferred tax assets and liabilities for each tax-paying jurisdiction as non-current on the balance sheet. Prior guidance required the deferred taxes for each tax-paying jurisdiction to be presented as a net current asset or liability and net non-current asset or liability.
Definition of a Business (ASU 2017-01)
On October 1, 2018, the Company prospectively adopted the provisions of ASU No. 2017-01, Business Combinations (Topic 805): Clarifying the Definition of a Business ("ASU 2017-01"). ASU 2017-01 assists entities in determining if acquired assets constitute the acquisition of a business or the acquisition of assets for accounting and reporting purposes. The guidance requires an entity to evaluate if substantially all of the fair value of the gross assets acquired is concentrated in a single identifiable asset or a group of similar identifiable assets; if so, the set of transferred assets and activities is not a business. In practice prior to ASU 2017-01, if revenues were generated immediately before and after a transaction, the acquisition was typically considered a business. The Company's December 2018 acquisition of certain assets of Direct Connect Merchant Services, LLC was not deemed to be the acquisition of a business under ASU 2017-01 because substantially all of the fair value was concentrated in a single identifiable group of similar identifiable assets.
Accounting for Share-Based Payments to Employees (ASU 2016-09)
For its annual reporting period beginning January 1, 2018, the Company adopted the provisions of ASU 2016-09, Improvements to Employee Share-Based Payment Accounting ("ASU 2016-09"), which amends ASC Topic 718, Compensation–Stock Compensation. This adoption of this new ASU had the following effects:
Consolidated Statement of Operations - ASU 2016-09 imposes a new requirement to record all of the excess income tax benefits and deficiencies (that result from an increase or decrease in the value of an award from grant date to settlement date) related to share-based payments at settlement through the statement of operations instead of the former requirement to record income tax benefits in excess of compensation cost ("windfalls") in equity, and income tax deficiencies ("shortfalls") in equity to the extent of previous windfalls, and then to operations. This change is required to be applied prospectively upon adoption of ASU 2016-09 to all excess income tax benefits and deficiencies resulting from settlements of share-based payments after the date of adoption. This particular provision of ASU 2016-09 had no material effect on the Company's financial position, operations, or cash flows.
Consolidated Statement of Cash Flows - ASU 2016-09 requires that all income tax-related cash flows resulting from share-based payments, such as excess income tax benefits, are to be reported as operating activities on the statement of cash flows, a change from the prior requirement to present windfall income tax benefits as an inflow from financing activities and an offsetting outflow from operating activities. This particular provision of ASU 2016-09 had no material effect on the Company's financial position, operations, or cash flows.
78
Additionally, ASU 2016-09 clarifies that:
• | All cash payments made to taxing authorities on an employee's behalf for withheld shares at settlement are presented as financing activities on the statement of cash flows. This change must be applied retrospectively. This particular provision of ASU 2016-09 had no material effect on the Company's financial position, operations, or cash flows. |
• | Entities are permitted to make an accounting policy election for the impact of forfeitures on the recognition of expense for share-based payment awards. Forfeitures can be estimated or recognized when they occur. Estimates of forfeitures will still be required in certain circumstances, such as at the time of modification of an award or issuance of a replacement award in a business combination. If elected, the change to recognize forfeitures when they occur needs to be adopted using a modified retrospective approach, with a cumulative effect adjustment recorded to opening retained earnings. The Company made a policy election to recognize the impact of forfeitures when they occur. This policy election primarily impacted the Company's new equity compensation plans originating in 2018 (see Note 15, Equity-Based Compensation), thus not requiring a cumulative effect adjustment to opening retained earnings for these new plans. For the Company's previously existing equity compensation plan (the Management Incentive Plan), see Note 15, Equity-Based Compensation. The amount of the cumulative effect upon adoption of ASU 2016-09 was not material and therefore has not been reflected in opening retained earnings on the Company's consolidated balance sheets or consolidated statements of changes in stockholders' deficit. |
Recently Issued Accounting Standards Pending Adoption
Leases (ASC 842)
In February 2016, the FASB issued new lease accounting guidance in ASU No. 2016-02, Leases-Topic 842, which has been codified in ASC 842, Leases. Under this new guidance, lessees will be required to recognize for all leases (with the exception of short-term leases): 1) a lease liability equal to the lessee's obligation to make lease payments arising from a lease, measured on a discounted basis and 2) a right-of-use asset which will represent the lessee's right to use, or control the use of, a specified asset for the lease term. As an EGC, this standard is effective for the Company's annual reporting period beginning in 2021 and interim reporting periods beginning first quarter of 2022. The adoption of ASC 842 will require the Company to recognize non-current assets and liabilities for right-of-use assets and operating lease liabilities on its consolidated balance sheet, but it is not expected to have a material effect on the Company's results of operations or cash flows. ASC 842 will also require additional footnote disclosures to the Company's consolidated financial statements.
Credit Losses (ASU 2016-13 and ASU 2018-19)
In June 2016, the FASB issued ASU No. 2016-13, Financial Instruments-Credit Losses (Topic 326): Measurement of Credit Losses on Financial Instruments. This new guidance will change how entities account for credit impairment for trade and other receivables, as well as for certain financial assets and other instruments. ASU 2016-13 will replace the current "incurred loss" model with an "expected loss" model. Under the "incurred loss" model, a loss (or allowance) is recognized only when an event has occurred (such as a payment delinquency) that causes the entity to believe that a loss is probable (i.e., that it has been "incurred"). Under the "expected loss" model, a loss (or allowance) is recognized upon initial recognition of the asset that reflects all future events that leads to a loss being realized, regardless of whether it is probable that the future event will occur. The "incurred loss" model considers past events and current conditions, while the "expected loss" model includes expectations for the future which have yet to occur. ASU 2018-19, Codification Improvements to Topic 326, Financial Instruments – Credit Losses, was issued in November 2018 and excludes operating leases from the new guidance. The standard will require entities to record a cumulative-effect adjustment to the balance sheet as of the beginning of the first reporting period in which the guidance is effective. The Company is currently evaluating the potential impact that ASU 2016-13 may have on the timing of recognizing future provisions for expected losses on the Company's accounts receivable. As a Smaller Reporting Company (as defined by the SEC), the Company must adopt this new standard no later than the beginning of 2023.
79
Goodwill Impairment Testing (ASU 2017-04)
In January 2017, the FASB issued ASU No. 2017-04, Intangibles-Goodwill and Other (Topic 350): Simplifying the Test for Goodwill Impairment. ASU 2017-04 will eliminate the requirement to calculate the implied fair value of goodwill (i.e., step 2 of the current goodwill impairment test) to measure a goodwill impairment charge. Instead, entities will record an impairment charge based on the excess of a reporting unit's carrying amount over its fair value (i.e., measure the charge based on the current step 1). Any impairment charge will be limited to the amount of goodwill allocated to an impacted reporting unit. ASU 2017-04 will not change the current guidance for completing Step 1 of the goodwill impairment test, and an entity will still be able to perform the current optional qualitative goodwill impairment assessment before determining whether to proceed to Step 1. Upon adoption, the ASU will be applied prospectively. As an EGC, this ASU will be effective for annual and interim impairment tests performed in periods beginning in 2022. The impact that ASU 2017-04 may have on the Company's financial condition or results of operations will depend on the circumstances of any goodwill impairment event that may occur after adoption.
Share-Based Payments to Non-Employees (ASU 2018-07)
In June 2018, the FASB issued ASU 2018-07, Share-based Payments to Non-Employees, to simplify the accounting for share-based payments to non-employees by aligning it with the accounting for share-based payments to employees, with certain exceptions. As an EGC, the ASU is effective for annual reporting periods beginning in 2020 and interim periods within annual periods beginning first quarter 2021. The Company is evaluating the impact this ASU will have on its consolidated financial statements, and such impact will be dependent on any share-based payments issued to non-employees.
Share-Based Payments to Customers (ASU 2019-08)
In November 2019, the FASB issued ASU 2019-08, Stock Compensation and Revenue from Contracts with Customers ("ASU 2019-08"). ASU 2019-08 will apply to share-based payments granted in conjunction with the sale of goods and services to a customer that are not in exchange for a distinct good or service. Entities will apply ASC 718 to measure and classify share-based sales incentives, and reflect the measurement of such incentives, as a reduction of the transaction price and also recognize such incentives in accordance with the guidance in ASC 606 on consideration payable to a customer. Entities that receive distinct goods or services from a customer will account for the share-based payment in the same manner as they account for other purchases from suppliers (i.e., by applying the guidance in ASC 718). Any excess of the fair-value-based measure of the share-based payment award over the fair value of the distinct goods or services received will be reflected as a reduction to the transaction price and recognized in accordance with the guidance in ASC 606 on consideration payable to a customer. ASU 2019-08 is effective for the Company at the same time it adopts ASU 2018-07, which is annual reporting periods beginning in 2020 and interim periods within annual periods beginning first quarter 2021. The Company is evaluating the impact this ASU will have on its consolidated financial statements, and such such impact will be dependent on any shard-based payments issued to customer.
Disclosures for Fair Value Measurements (ASU 2018-13)
In August 2018, the FASB issued ASU 2018-13, Fair Value Measurement (Topic 820): Disclosure Framework — Changes to the Disclosure Requirements for Fair Value Measurement. This ASU eliminates, adds and modifies certain disclosure requirements for fair value measurements as part of the FASB's disclosure framework project. For all entities, this ASU is effective for annual and interim reporting periods beginning in 2020. Certain amendments must be applied prospectively while others are to be applied on a retrospective basis to all periods presented. As disclosure guidance, the adoption of this ASU will not have an effect on the Company's financial position, results of operations or cash flows.
Implementation Costs Incurred in Cloud Computing Arrangements (ASU 2018-15)
In August 2018, the FASB issued ASU 2018-15, Implementation Costs Incurred in Cloud Computing Arrangements ("ASU 2018-15"), which aligns the requirements for capitalizing implementation costs incurred in a hosting arrangement that is a service contract with the requirements for capitalizing implementation costs incurred to develop or obtain internal-use software (and hosting arrangements that include an internal-use software license). As an EGC, this ASU is effective for the Company for annual
80
reporting periods beginning in 2021, and interim periods within annual periods beginning in 2022. The amendments should be applied either retrospectively or prospectively to all implementation costs incurred after the date of adoption. The Company is evaluating the impact this ASU will have on its consolidated financial statements.
Simplifying the Accounting for Income Taxes (ASU 2019-12)
In December 2019, the FASB issued ASU 2019-12, Simplifying the Accounting for Income Taxes ("ASU 2019-12"). ASU 2019-12 will affect several topics of income tax accounting, including: tax-basis step-up in goodwill obtained in a transaction that is not a business combination; intra-period tax allocation; ownership changes in investments when an equity method investment becomes a subsidiary of an entity; interim-period accounting for enacted changes in tax law; and year-to-date loss limitation in interim-period tax accounting. This ASU is effective for the Company on January 1, 2022. The effects that the adoption of this ASU will have on the Company's results of operations, financial position, and cash flows will depend on specific events occurring for the Company after the adoption of ASU 2019-12.
Concentration of Risk
A substantial portion of the Company's revenues and receivables are attributable to merchants. In 2019, 2018, and 2017, no one merchant customer accounted for 10% or more of the Company's consolidated revenues. Most of the Company's merchant customers were referred to the Company by an ISO or other referral partners. If the Company's agreement with an ISO allows the ISO to have merchant portability rights, the ISO can move the underlying merchant relationships to another merchant acquirer upon notice to the Company and completion of a "wind down" period. For the years ended December 31, 2019, 2018, and 2017, merchants referred by one ISO organization with merchant portability rights generated revenue within the Company's Consumer Payments reportable segment that represented approximately 18 %, 14 %, and 10 % of the Company's consolidated revenues.
A majority of the Company's cash and restricted cash is held in certain financial institutions, substantially all of which is in excess of federal deposit insurance corporation limits. The Company does not believe it is exposed to any significant credit risk from these transactions.
Reclassifications
Certain prior year amounts in these consolidated financial statements have been reclassified to conform to the current year presentation, with no net effect on the Company's income from operations, income (loss) before income tax expense (benefit), net income (loss), stockholders' deficit, or cash flows from operations, investing, or financing activities.
2. RESTATEMENT OF PREVIOUSLY ISSUED CONSOLIDATED FINANCIAL STATEMENTS
Corrections of Errors
On March 26, 2020, the Audit Committee of the Board of Directors (the “Audit Committee”) of the Company, after considering the recommendations of management, and discussing such recommendations with counsel, concluded that its 2018 and 2017 audited financial statements included in its Annual Report on Form 10-K as of and for the year ended December 31, 2018 (the “2018 Annual Report”) and its unaudited condensed consolidated financial statements as of and for the quarterly periods ended March 31, 2018, June 30, 2018, and September 30, 2018 included in the Company's Quarterly Reports on Form 10-Q for the quarterly periods ended March 31, 2019 and 2018, June 30, 2019 and 2018, and September 30, 2019 and 2018 (the “2019 Quarterly Reports”) should no longer be relied upon due to misstatements that are described in greater detail below, and that the Company would restate such financial statements to make the necessary accounting corrections.
During the preparation of its Annual Report on Form 10-K for the year ended December 31, 2019 (the “2019 Annual Report”), the Company noted two errors within its Consumer Payments reportable segment. First, the Company noted an understatement of losses related to certain settlement activities with the Company’s sponsor banks, merchants and ISOs. The second error noted involved an out-of-period recognition of certain chargeback revenues and related costs of services between 2018 and 2017. An
81
investigation was conducted with the assistance of outside accounting consultants. As a result of the investigation, the Company concluded that the errors had resulted in misstatements in its consolidated financial statements for the periods identified above that were due to a failure to appropriately reconcile certain settlement accounts with the Company’s general ledger.
The Company evaluated these errors and their effects on the its consolidated financial statements and related disclosures using the guidance in ASC No. 250, Accounting Changes and Error Corrections, Staff Accounting Bulletin Topic 1.M, Materiality ("SAB 99"), and Topic 1.N, Considering the Effects of Prior Year Misstatements When Quantifying Misstatements in Current Year Financial Statements ("SAB108"). The Company considered both quantitative and qualitative characteristics of the errors and as a result it has restated its consolidated financial statements as of and for the years ended December 31, 2018 and 2017 included in its 2018 Annual Report and the unaudited condensed consolidated financial statements as of and for the quarterly periods ended March 31, 2018, June 30, 2018, and September 30, 2018 included in its 2019 Quarterly Reports.
Based on the analysis noted above, the correction of errors resulting from the failure to appropriately reconcile the settlement ledger to the Company's general ledger were not material to the previously reported consolidated financial statements for the year ended December 31, 2016. The restatement adjustments and error corrections and their impacts on previously reported consolidated financial statements are described below. The cumulative effect to correct the errors for all periods prior to 2017 resulted in a $5.0 reduction on January 1, 2017 to the Company’s consolidated statement of stockholders’ equity (deficit) presented herein.
Restated Consolidated Statements of Operations
For the years ended December 31, 2018 and 2017, the following tables show the effects, by line item, on the Company’s consolidated statements of operations presented herein for: 1) the correction of the errors related to certain settlement activities and out-of-period chargeback revenue described above and 2) the full retrospective adoption of ASC 606, Revenue from Contracts with Customers, described in the section "Accounting Standards Adopted in 2019" in Note 1, Nature of business and Accounting Policies:
(in thousands) | For the Year Ended December 31, 2018 | |||||||||||||||||||
Full | ||||||||||||||||||||
Error | Error | Retrospective | ||||||||||||||||||
Corrections | Corrections | Adoption | ||||||||||||||||||
As | Related to | Related to | of ASC 606 | Originally | ||||||||||||||||
Line | Restated | Settlement | Chargebacks | (Note 1) | Reported | |||||||||||||||
Revenues | $ | $ | ( | ) | $ | ( | ) | $ | ||||||||||||
Costs of services | $ | $ | $ | $ | ( | ) | $ | |||||||||||||
Income from operations | $ | $ | ( | ) | $ | ( | ) | $ | ||||||||||||
Loss before income taxes | $ | ( | ) | $ | ( | ) | $ | ( | ) | $ | ( | ) | ||||||||
Income tax benefit | $ | ( | ) | $ | ( | ) | $ | ( | ) | $ | ( | ) | ||||||||
Net loss | $ | ( | ) | $ | ( | ) | $ | ( | ) | $ | ( | ) | ||||||||
Basic and diluted loss per share | $ | ( | ) | $ | ( | ) | $ | ( | ) | $ | ( | ) | ||||||||
Pro forma income tax benefit (unaudited) | $ | ( | ) | $ | ( | ) | $ | ( | ) | $ | ( | ) | ||||||||
Pro forma net loss (unaudited) | $ | ( | ) | $ | ( | ) | $ | ( | ) | $ | ( | ) | ||||||||
Pro forma loss per share (unaudited) | $ | ( | ) | $ | ( | ) | $ | ( | ) | $ | ( | ) | ||||||||
82
(in thousands) | For the Year Ended December 31, 2017 | |||||||||||||||||||
Full | ||||||||||||||||||||
Error | Error | Retrospective | ||||||||||||||||||
Corrections | Corrections | Adoption | ||||||||||||||||||
As | Related to | Related to | of ASC 606 | Originally | ||||||||||||||||
Line | Restated | Settlement | Chargebacks | (Note 1) | Reported | |||||||||||||||
Revenues | $ | $ | ( | ) | $ | $ | ( | ) | $ | |||||||||||
Costs of services | $ | $ | $ | $ | ( | ) | $ | |||||||||||||
Income from operations | $ | $ | ( | ) | $ | $ | ||||||||||||||
Net income | $ | $ | ( | ) | $ | $ | ||||||||||||||
Basic and diluted income per share | $ | $ | ( | ) | $ | $ | ||||||||||||||
Pro forma income tax expense (unaudited) | $ | $ | $ | ( | ) | $ | ||||||||||||||
Pro forma net income (unaudited) | $ | $ | ( | ) | $ | $ | ||||||||||||||
Pro forma income per share (unaudited) | $ | $ | ( | ) | $ | $ | ||||||||||||||
For information on the effects that the full retrospective adoption of ASC 606 had on line items in the Company's consolidated statement of operations for the year ended December 31, 2019, see the section “Accounting Standards Adopted in 2019” in Note 1, Nature of Business and Accounting Policies.
For information about the effects on revenues and income (loss) from operations of the Company's reportable segments related to the full retrospective adoption of ASC 606 and the corrections of errors for the years ended December 31, 2019, 2018, and 2017, see Note 18, Segment Information.
See Note 20, Selected Quarterly Financial Results (Unaudited), for information about how the full retrospective adoption of ASC 606 and the corrections of the errors affected the Company's consolidated revenues, income (loss) from operations, and earnings (loss) per share for each interim quarterly reporting period in the years ended December 31, 2019 and 2018.
Restated Consolidated Balance Sheet
As a result of the changes to the Company's consolidated statements of operations for the years ended December 31, 2018 and 2017 and the adjustment to accumulated earnings at January 1, 2017 in the Company's consolidated statement of stockholders' equity (deficit), the following line items were affected on the Company's consolidated balance sheet as of December 31, 2018 presented herein, as follows:
83
(in thousands) | As of December 31, 2018 | |||||||||||||||
Error | Error | |||||||||||||||
Corrections | Corrections | |||||||||||||||
Related to | Related to | Originally | ||||||||||||||
Line | As restated | Settlement | Chargebacks | Reported | ||||||||||||
Accounts receivable, net | $ | $ | ( | ) | $ | |||||||||||
Settlement assets | $ | $ | ( | ) | $ | |||||||||||
Total current assets | $ | $ | ( | ) | $ | |||||||||||
Deferred income tax asset, net | $ | $ | $ | $ | ||||||||||||
Total assets | $ | $ | ( | ) | $ | $ | ||||||||||
Settlement obligations | $ | $ | ( | ) | $ | |||||||||||
Total current liabilities | $ | $ | ( | ) | $ | |||||||||||
Total liabilities | $ | $ | ( | ) | $ | |||||||||||
Accumulated deficit | $ | ( | ) | $ | ( | ) | $ | $ | ( | ) | ||||||
Total stockholders' deficit | $ | ( | ) | $ | ( | ) | $ | $ | ( | ) | ||||||
Total liabilities and stockholders' deficit | $ | $ | ( | ) | $ | $ | ||||||||||
Restated Consolidated Statements of Changes in Stockholder's Equity (Deficit)
For reporting periods prior to January 1, 2017, the cumulative effect of correcting the errors related to the settlement matters was approximately $5.0 million. Opening cumulative earnings in the Company's consolidated statement of stockholders' equity (deficit) presented herein has been reduced as of January 1, 2017 by this amount.
As a result of the changes related to the error corrections to the Company's consolidated statements of operations for the years ended December 31, 2018 and 2017 and the adjustment to accumulated earnings at January 1, 2017 in the Company's consolidated statement of stockholders' equity (deficit), the following line items were affected on the Company's consolidated statements of stockholders' equity (deficit) at December 31, 2018, December 31, 2017, and January 1, 2017 presented herein, as follows:
84
(in thousands) | As of | ||||||||||
December 31, 2018 | December 31, 2017 | January 1, 2017 | |||||||||
Accumulated (deficit) earnings prior to error corrections | $ | ( | ) | $ | ( | ) | $ | ||||
Correction of accumulated earnings at January 1, 2017 | ( | ) | ( | ) | ( | ) | |||||
Correction of net income for 2017 | ( | ) | ( | ) | |||||||
Correction of net loss for 2018, net of income taxes | ( | ) | |||||||||
Corrected accumulated (deficit) earnings | $ | ( | ) | $ | ( | ) | $ | ||||
Total stockholders' (deficit) equity prior to error corrections | $ | ( | ) | $ | ( | ) | $ | ||||
Correction of accumulated earnings at January 1, 2017 | ( | ) | ( | ) | ( | ) | |||||
Correction of net income for 2017 | ( | ) | ( | ) | |||||||
Correction of net loss for 2018, net of income taxes | ( | ) | |||||||||
Corrected total stockholders' (deficit) equity | $ | ( | ) | $ | ( | ) | $ | ||||
Restated Consolidated Statements of Cash Flows
As a result of the error corrections to the Company's consolidated statements of operations for the years ended December 31, 2018 and 2017, its consolidated balance sheet as of December 2018, and the adjustment to accumulated earnings at January 1, 2017 in the Company's consolidated statement of stockholders' equity (deficit), the following line items were affected on the Company's consolidated statements of cash flows for the years ended December 31, 2018 and 2017 presented herein, as noted in the following table. The restatement did not change the Company's net cash flows from operations, investing, or financing activities for any reporting period.
(in thousands) | Year Ended December 31, 2018 | |||||||||||||||
Error | Error | |||||||||||||||
Corrections | Corrections | |||||||||||||||
Related to | Related to | Originally | ||||||||||||||
Line | As Restated | Settlements | Chargebacks | Reported * | ||||||||||||
Net loss | $ | ( | ) | $ | ( | ) | $ | ( | ) | $ | ( | ) | ||||
Adjustments to reconcile net loss to net cash provided by operating activities: | ||||||||||||||||
Provision for deferred income taxes | $ | ( | ) | $ | ( | ) | $ | ( | ) | $ | ( | ) | ||||
Change in operating assets and liabilities (net of business combinations): | ||||||||||||||||
Accounts receivable | $ | $ | $ | $ | ||||||||||||
Settlement assets and obligations, net | $ | $ | ( | ) | $ | $ | ||||||||||
Accounts payable and other current liabilities | $ | $ | $ | ( | ) | $ | ||||||||||
* Reflects certain reclassifications to conform to current year presentation.
85
(in thousands) | Year Ended December 31, 2017 | |||||||||||||||
Error | Error | |||||||||||||||
Corrections | Corrections | |||||||||||||||
Related to | Related to | Originally | ||||||||||||||
Line | As Restated | Settlements | Chargebacks | Reported * | ||||||||||||
Net income | $ | $ | ( | ) | $ | $ | ||||||||||
Change in operating assets and liabilities: | ||||||||||||||||
Accounts receivable | $ | ( | ) | $ | $ | ( | ) | $ | ( | ) | ||||||
Settlement assets and obligations, net | $ | $ | $ | $ | ||||||||||||
Accounts payable and other current liabilities | $ | $ | $ | $ | ||||||||||||
* Reflects certain reclassifications to conform to current year presentation.
3. REVENUE
For all periods presented, most of the Company’s revenues were recognized over time. Revenues and commissions earned from the sales of payment equipment are typically recognized at a point in time.
Nature of our Customer Arrangements
The Company’s payment services customers contract with the Company for payment services, which the Company provides in exchange for consideration for completed transactions. Some of these payment services are performed by third parties.
The Company’s consumer payment services enable the Company’s customers to accept card, electronic, and digital-based payments at the point of sale. These services may include authorization services, settlement and funding services, customer support and help-desk functions, chargeback resolution, payment security services, consolidated billing and statements, and on-line reporting. The Company also earns revenue and commissions from resale of electronic point-of-sale (“POS”) equipment.
The Company’s commercial payment services enable the Company’s customers to automate their accounts payable and other commercial payments functions with the Company’s payment services that utilize physical and virtual payment cards as well as ACH transactions. In addition, the Company provides cost-plus-fee turnkey business process outsourcing and assists commercial customers with programs that are designed to increase acceptance of electronic payments.
More recently, the Company formed its Integrated Partners segment which uses payment-adjacent technologies to facilitate the acceptance of electronic payments from customers in the rental real estate, rental storage businesses, medical, and hospitality industries.
Applying the Revenue Recognition Accounting Standard
At contract inception, the Company assesses the services and goods promised in its contracts with customers and identifies the performance obligation for each promise to transfer to the customer a service or good that is distinct. For substantially all of the Company's services, the nature of the Company’s promise to the customer is to stand ready to accept and process the transactions that customers request on a daily basis over the contract term. Since the timing and quantity of transactions to be processed is not determinable, the services comprise an obligation to stand ready to process as many transactions as the customer requires. Under a stand-ready obligation, the evaluation of the nature of the Company’s performance obligation is focused on each time increment rather than the underlying activities. Therefore, the Company has determined that its services comprise a series of distinct days of
86
service that are substantially the same and have the same pattern of transfer to the customer. Accordingly, the promise to stand ready is accounted for as a single-series performance obligation.
When third parties are involved in the transfer of services or goods to the customer, the Company considers the nature of each specific promised service or good and applies judgment to determine whether the Company controls the service or good before it is transferred to the customer or whether the Company is acting as an agent of the third party. The Company follows the requirements of ASC 606-10, Principal Agent Considerations, which states that the determination of whether an entity should recognize revenue based on the gross amount billed to a customer or the net amount retained is a matter of judgment that depends on the facts and circumstances of the arrangement. To determine whether or not the Company controls the service or good, it assesses indicators including: 1) whether the Company or the third party is primarily responsible for fulfillment; 2) if the Company or the third party provides a significant service of integrating two or more services or goods into a combined item that is a service or good that the customer contracted to receive; 3) which party has discretion in determining pricing for the service or good; and 4) other considerations deemed to be applicable to the specific situation.
Based on assessments of these indicators, the Company concluded:
• | Promises to customers to provide certain payment services is distinct from the other payment services provided by the card-issuing financial institutions, payment networks, and sponsor banks. The Company does not have the ability to direct the use of and obtain substantially all of the benefits of the services provided by the card-issuing financial institutions, payment networks, and sponsor banks before those services are transferred to the customer, and on that basis, the Company does not control those services prior to being transferred to the customer. The Company has either no or little discretion in setting the price that the customer pays for these specific services. The Company therefore acts as agent for these payment services provided by the card-issuing financial institutions, payment networks, and sponsor banks. |
• | For other promises to customers to provide other significant payment services such as onboarding, underwriting, processing, customer service, and fraud detection/prevention services, the Company has discretion in setting the price that the customer ultimately pays for these services and the Company either is responsible for fulfillment or has shared responsibility. If a third party is partially responsible for fulfillment, the Company provides a significant service of integrating two or more services, which may include services from other parties, and directs their use to create a combined item that is a specified service requested by the customer. For services that involve these other parties, the Company has direct contractual relationships with these parties. |
Substantially all of the Company’s payment services are priced as a percentage of transaction value or a specified fee per transaction, or a combination of both. Given the nature of the promise and the underlying fees based on unknown quantities or outcomes of services to be performed over the contract terms with customers, the total consideration is determined to be variable consideration. The variable consideration for payment services is usage-based and therefore it specifically relates to efforts to satisfy the payment services obligation. Said another way, the variability is satisfied each day the service is provided to the customer. The Company directly ascribes variable fees to the distinct day of service to which it relates, and considers the services performed each day in order to ascribe the appropriate amount of total fees to that day. Therefore, the Company measures revenue for payment services on a daily basis based on the services that are performed on that day.
Once the Company determines the performance obligations and the transaction price, including an estimate of any variable consideration, the Company then allocates the transaction price to each performance obligation in the contract using a relative standalone selling price method. The Company determines standalone selling price based on the price at which the service or good is sold separately. If the standalone selling price is not observable through past transactions, the Company estimates the standalone selling price by considering all reasonably available information, including market conditions, trends or other company-specific or customer-specific factors. Substantially all of the performance obligations described above that involve services are satisfied over time. Equipment sales are generally transferred to the customer at a point in time.
In delivering payment services to the customer, the Company may also provide a limited license agreement to the customer for use of one or more of the Company’s proprietary cloud-based software applications. The Company grants a right to use its software applications only when the customer has contracted with the Company to receive related payment services. When combined with the underlying payment services, the license and the payment services provided to the customer are a single stand-ready obligation and the Company’s performance obligation is defined by each time increment, rather than by the underlying activities, satisfied over time based on days elapsed.
87
Interest income is reported separately on the Company’s statement of operations within Other, net and was approximately $561,000 , $617,000 , and $637,000 for the years ended December 31, 2019, 2018, and 2017, respectively.
Transaction Price Allocated to Future Performance Obligations
ASC 606 requires disclosure of the aggregate amount of the transaction price allocated to unsatisfied performance obligations. However, as allowed by ASC 606, the Company has elected to exclude from this disclosure any contracts with an original duration of one year or less and any variable consideration that meets specified criteria. As described above, the Company’s most significant performance obligations consist of variable consideration under a stand-ready series of distinct days of service. Such variable consideration meets the specified criteria for the disclosure exclusion. Therefore, the majority of the aggregate amount of transaction price that is allocated to performance obligations that have not yet been satisfied is variable consideration that is not required for this disclosure. The aggregate fixed consideration portion of customer contracts with an initial contract duration greater than one year is not material.
Contract Costs
For new, renewed, or anticipated contracts with customers, the Company does not incur material amounts of incremental costs to obtain such contracts, as those costs are defined by ASC 340-40.
Fulfillment costs, as defined by ASC 340-40, typically benefit only the period (typically a month in duration) in which they are incurred and therefore are expensed in the period incurred (i.e., not capitalized) unless they meet criteria to be capitalized under other accounting guidance.
The Company pays commissions to most of its ISOs, and for certain ISOs the Company also pays (through a higher commission rate) them to provide customer service and other services directly to our merchant customers. The ISO is typically an independent contractor or agent of the Company. Although certain ISOs may have merchant portability rights, the merchant meets the definition of a customer for the Company even if the ISO has merchant portability rights. Since payments to ISOs are dependent substantially on variable merchant payment volumes generated after the merchant enters into a new or renewed contract, these payments to ISOs are not deemed to be a cost to acquire a new contract since the ISO payments are based on factors that will arise subsequent to the event of obtaining a new or renewed contract. Also, payments to ISOs pertain only to a specific month’s activity. For payments made, or due, to an ISO, the expenses are reported within income from operations on our statements of operations.
The Company from time-to-time may elect to buy out all or a portion of an ISO’s rights to receive future commission payments related to certain merchants. Amounts paid to the ISO for these residual buyouts are capitalized by the Company under the accounting guidance for intangible assets.
Contract Assets and Contract Liabilities
A contract with a customer creates legal rights and obligations. As the Company performs under customer contracts, its right to consideration that is unconditional is considered to be accounts receivable. If the Company’s right to consideration for such performance is contingent upon a future event or satisfaction of additional performance obligations, the amount of revenues recognized in excess of the amount billed to the customer is recognized as a contract asset. Contract liabilities represent consideration received from customers in excess of revenues recognized. Material contract assets and liabilities are presented net at the individual contract level in the consolidated balance sheet and are classified as current or noncurrent based on the nature of the underlying contractual rights and obligations.
88
Supplemental balance sheet information related to contracts from customers as of December 31, 2019 and 2018 was as follows:
(in thousands) | Consolidated Balance Sheet Location | December 31, 2019 | December 31, 2018 | |||||||
Liabilities: | ||||||||||
Contract liabilities, net (current) | Customer deposits and advance payments | $ | $ | |||||||
The balance for the contract liabilities was approximately $2.2 million and $3.4 million at January 1, 2018 and January 1, 2017, respectively. Substantially all of these balances are recognized as revenue within twelve months. The changes in the balances during the years ended December 31, 2019, 2018, and 2017 were due to the timing of advance payments received from the customer.
Net contract assets were not material for any period presented.
Impairment losses recognized on receivables or contract assets arising from the Company's contracts with customers were not material for the years ended December 31, 2019, 2018, or 2017.
Disaggregation of Revenues
The following table presents a disaggregation of our consolidated revenues by type for the years ended December 31, 2019, 2018 and 2017:
(in thousands) | Year Ended December 31, | |||||||||||
As recasted | As restated | As restated | ||||||||||
2019 | 2018 | 2017 | ||||||||||
Revenue Type: | ||||||||||||
Merchant card fees | $ | $ | $ | |||||||||
Outsourced services | ||||||||||||
Other services | ||||||||||||
Equipment | ||||||||||||
Total revenues | $ | $ | $ | |||||||||
4. BUSINESS COMBINATIONS, ASSET ACQUISITIONS, AND ASSET CONTRIBUTIONS
Asset Acquisitions in 2019
See Note 12, Commitments and Contingencies, for information about a merchant portfolio acquired in 2019 for a contingent purchase price.
YapStone
In March 2019, the Company, through one of its subsidiaries, Priority Real Estate Technology, LLC ("PRET"), acquired certain assets and assumed certain related liabilities (the "YapStone net assets") from YapStone under an asset purchase and contribution agreement. The purchase price for the YapStone net assets was $65.0 million in cash plus a non-controlling interest in PRET with a fair value that was estimated to be approximately $5.7 million. The total purchase price was assigned to customer relationships, except for $1.0 million and $1.2 million which were assigned to a software license agreement and a services agreement, respectively. The $65.0 million of cash was funded from the Company's Senior Credit Facility. PRET is part of the Company's Integrated Partners reportable segment.
89
During the year ended December 31, 2019, no earnings of PRET were allocated to the non-controlling interest pursuant to the profit-sharing agreement between the Company and the non-controlling interest.
Residual Portfolio Rights Acquired
On March 15, 2019, a subsidiary of the Company paid $15.2 million cash to acquire certain residual portfolio rights. Of the $15.2 million, $5.0 million was funded from the Senior Credit Facility, $10.0 million was funded from revolving credit facility under the Senior Credit Facility, and cash on hand was used to fund the remaining amount. The purchase price may be subject to an increase of up to $6.4 million in accordance with the terms of the agreement between the Company and the sellers. Additional purchase price is accounted for when payment to the seller becomes probable and is added to the carrying value of the asset. This acquisition became part of the Company's Consumer Payments reportable segment.
Asset Contributions in 2019
eTab and Cumulus (Related Party)
In February 2019, a subsidiary of the Company, Priority Hospitality Technology, LLC ("PHOT"), received a contribution of substantially all of the operating assets of eTab, LLC ("eTab") and CUMULUS POS, LLC ("Cumulus") under asset contribution agreements. No material liabilities were assumed by PHOT. These contributed assets were composed substantially of technology-related assets. Prior to these transactions, eTab was 80 % owned by the Company's Chairman and Chief Executive Officer. No cash consideration was paid to the contributors of the eTab or Cumulus assets on the date of the transactions. As consideration for these contributed assets, the contributors were issued redeemable preferred equity interests in PHOT. Under these redeemable preferred equity interests, the contributors are eligible to receive up to $4.5 million of profits earned by PHOT, plus a preferred yield (6 % per annum) on any of the $4.5 million amount that has not been distributed to them. The Company's Chairman and Chief Executive Officer owns 83.3 % of the redeemable preferred equity interests in PHOT. Once a total of $4.5 million plus the preferred yield has been distributed to the holders of the redeemable preferred equity interests, the redeemable preferred equity interests will cease to exist. The Company determined that the contributor's carrying value of the eTab net assets (as a common control transaction under GAAP) was not material. Under the guidance for a common control transaction, the contribution of the eTab net assets did not result in a change of entity or the receipt of a business, therefore the Company's financial statements for prior periods have not been adjusted to reflect the historical results attributable to the eTab net assets. Additionally, no material amount was estimated for the fair value of the contributed Cumulus net assets. PHOT is a part of the Company's Integrated Partners reportable segment.
Pursuant to the limited liability company agreement of PHOT, any material future earnings generated by the eTab and Cumulus assets that are attributable to the holders of the preferred equity interests will be reported by the Company as a form of non-controlling interests classified as mezzanine equity on the Company's consolidated balance sheet until $4.5 million and the preferred yield have been distributed to the holders of the preferred equity interests. Subsequent changes, if material, in the value of the NCI will be reported as an equity transaction between the Company's consolidated retained earnings (accumulated deficit) and any carrying value of the non-controlling interests in mezzanine equity. Such amounts were not material to the Company's results of operations, financial position, or cash flows for the period covering February 1, 2019 (date the assets were contributed to the Company) through December 31, 2019, and therefore no recognition of the NCI has been reflected in the Company's unaudited condensed consolidated financial statements.
Business Combinations in 2018
PayRight
In April 2018, Priority PayRight Health Solutions, LLC ("PPRHS"), a subsidiary of the Company, purchased the majority of the operating assets and certain operating liabilities of PayRight Health Solutions LLC ("PayRight"). This purchase allowed PPRHS to gain control over the PayRight business and therefore the Company's consolidated financial statements include the financial position, results of operations, and cash flows of PayRight from the date of acquisition. PayRight utilizes technology assets to
90
deliver customized payment solutions to the health care industry. The results of the acquired business and goodwill of $0.3 million from the transaction are being reported by the Company as part of the Commercial Payments and Managed Services reportable segment. Additionally, the acquisition resulted in the recognition of intangible and net tangible assets with a fair value of $0.6 million. The Company transferred total consideration with a fair value of $0.9 million consisting of: $0.5 million in cash and forgiveness of amounts owed to the Company by PayRight; $0.3 million fair value of the Company's previous equity-method investment in PayRight described in the following paragraph; and $0.1 million of other consideration. Certain PayRight sellers were provided profit-sharing rights in PayRight as non-controlling interests, however, based on this arrangement no losses or earnings were allocated to the non-controlling interests for the years ended December 31, 2019 and 2018. PayRight is part of the Company's Integrated Partners reportable segment.
Previously, in October 2015, the Company purchased a non-controlling interest in the equity of PayRight, and prior to April 2018 the Company accounted for this investment using the equity method of accounting. At December 31, 2017, the Company's carrying value of this investment was $1.1 million. Immediately prior to PPRHS' April 2018 purchase of substantially all of PayRight's business assets, the Company's existing non-controlling investment in PayRight had a carrying value of approximately $1.1 million with an estimated fair value on the acquisition date of approximately $0.3 million. The Company recorded an impairment loss of $0.8 million during the second quarter of 2018 for the difference between the carrying value and the fair value of the non-controlling equity-method investment in PayRight. The loss is reported within Other, net in the Company's consolidated statements of operations for the year ended December 31, 2018.
RadPad and Landlord Station
In July 2018, the Company acquired substantially all of the net operating assets of RadPad Holdings, Inc. ("RadPad") and Landlord Station, LLC ("Landlord Station"). RadPad is a marketplace for the rental real estate market. Landlord Station offers a complementary toolset that focuses on facilitation of tenant screening and other services to the fast-growing independent landlord market. These asset purchases were deemed to be a business under ASC 805. The Company formed a new entity, Priority Real Estate Technology, LLC ("PRET"), to acquire and operate these businesses. Due to the related nature of the two sets of business assets, same acquisition dates, and how the Company intends to operate them under the "RadPad" name and operating platform within PRET, the Company deemed them to be one business for accounting and reporting purposes. PRET is reported within the Company's Integrated Partners reportable segment.
Total consideration paid for RadPad and Landlord Station was $4.3 million consisting of $3.9 million in cash plus forgiveness of pre-existing debt owed by the sellers to the Company of $0.4 million. Additionally, the Company paid and expensed $0.1 million for transaction costs. Net tangible and separately-identifiable intangible assets with an initial fair value of $2.1 million were acquired along with goodwill with an initial value of $2.2 million. Non-controlling equity interests in PRET were issued to certain sellers in the form of residual profit interests and distribution rights, however the fair value of these non-controlling interests was deemed to be immaterial at time of acquisition due to the nature of the profit-sharing and liquidations provisions contained in the operating agreement for PRET. Under the terms of the profit-sharing arrangement between the controlling and non-controlling interests, no losses or earnings were allocated to the non-controlling interests for the years ended December 31, 2019 and 2018.
During the fourth quarter of 2018, the Company received additional information about the fair values of assets acquired and liabilities assumed. Accordingly, measurement period adjustments were made to the opening balance sheet to decrease net assets acquired and increase goodwill by $0.2 million.
Priority Payment Systems Northeast
In July 2018, the Company acquired substantially all of the net operating assets of Priority Payment Systems Northeast, Inc. ("PPS Northeast"). This purchase of these net assets was deemed to be a business under ASC 805. Prior to this acquisition, PPS Northeast was an independent brand-licensed office of the Company where it developed expertise in software-integrated payment services designed to manage turnkey installations of point-of-sale and supporting systems, as well as marketing programs that place emphasis on online ordering systems and digital marketing campaigns. PPS Northeast is reported within the Company's Consumer Payments reportable segment.
91
Initial consideration of $3.5 million consisted of $0.5 million plus 285,117 shares of common stock of the Company with a fair value of approximately of $3.0 million. In addition, contingent consideration in an amount up to $0.5 million was deemed to have a fair value of $0.4 million at acquisition date. If earned, the seller can receive this contingent consideration in either cash or additional shares of the Company's common stock, as mutually agreed by the Company and seller. Net tangible and separately-identifiable intangible assets with an initial fair value of $2.0 million were acquired along with goodwill with an initial value of $1.9 million, including the $0.4 million estimated fair value of the contingent consideration due to the seller. Transaction costs were not material and were expensed. At December 31, 2019, the fair value of the contingent consideration was estimated to be approximately $0.2 million, which resulted in a $0.2 million reduction in the carrying value. No amount has been paid to the seller.
Priority Payment Systems Tech Partners
In August 2018, the Company acquired substantially all of the net operating assets of M.Y. Capital, Inc. and Payments In Kind, Inc., collectively doing business as Priority Payment Systems Tech Partners ("PPS Tech"). These related asset purchases were deemed to be a business under ASC 805. Due to the related nature of the two sets of business assets and how the Company intends to operate them, the Company deemed them to be one business for accounting and reporting purposes. Prior to this acquisition, PPS Tech was an independent brand-licensed office of the Company where it developed a track record and extensive network in the integrated payments and B2B marketplaces. PPS Tech is reported within the Company's Consumer Payments reportable segment.
Initial consideration of $5.0 million consisted of $3.0 million plus 190,078 shares of common stock of the Company with a fair value of approximately $2.0 million. In addition, contingent consideration in an amount up to $1.0 million was deemed to have a fair value of $0.6 million at acquisition date. If earned, the seller will receive half of any contingent consideration in cash and the other half in a number of shares of common stock of the Company equal to the portion of the earned contingent consideration payable in shares of common stock of the Company. Net tangible and separately-identifiable intangible assets with an initial fair value of $2.2 million were acquired along with goodwill with an initial value of $3.4 million, including the $0.6 million estimated fair value of the contingent consideration due to the seller. Transaction costs were not material and were expensed. At December 31, 2019, the fair value of the contingent consideration was estimated to be approximately $0.2 million, which resulted in a $0.4 million reduction in the carrying value. No amount has been paid to the seller.
Other Information
Based on their purchase prices and pre-acquisition operating results and assets, none of the business combinations consummated by the Company in 2018, as described above, met the materiality requirements for disclosure of pro-forma financial information, either individually or in the aggregate. The measurement periods, as defined by ASC 805, Business Combination ("ASC 805"), is closed for these 2018 business combinations.
Goodwill for all 2018 business combinations is deductible by the Company for income tax purposes.
Asset Acquisitions in 2018
In December 2018, the Company acquired a merchant portfolio for $44.8 million from Direct Connect Merchant Services, LLC. The purchase price included cash contingent consideration of up to approximately $7.3 million, determinable over a period that ended on December 31, 2019. At December 31, 2019, the Company has determined that it will owe no contingent consideration.
92
5. SETTLEMENT ASSETS AND OBLIGATIONS
Consumer Payments Segment
In the Company’s Consumer Payments reportable segment, funds settlement refers to the process of transferring funds for sales and credits between card issuers and merchants. The standards of the card networks restrict non-members, such as the Company, from performing funds settlement or accessing merchant settlement funds. Instead, these funds must be in the possession of a member bank until the merchant is funded. The Company has agreements with member banks which allow the Company to route transactions under the member bank's control to clear transactions through the card networks. Timing differences, interchange fees, merchant reserves and exception items cause differences between the amounts received from the card networks and the amounts funded to the merchants. Since settlement funds are required to be in the possession of a member bank until the merchant is funded, these funds are not assets of the Company and the associated obligations are not liabilities of the Company. Therefore, neither is recognized in the Company’s consolidated balance sheets. Member banks held merchant funds of approximately $79.8 million and $186.2 million at December 31, 2019 and 2018, respectively.
Exception items include items such as customer chargeback amounts received from merchants and other losses. Under agreements between the Company and its merchant customers, the merchants assume liability for such chargebacks and losses. If the Company is ultimately unable to collect amounts from the merchants for any charges or losses due to merchant fraud, insolvency, bankruptcy or any other reason, it may be liable for these charges. In order to mitigate the risk of such liability, the Company may 1) require certain merchants to establish and maintain reserves designed to protect the Company from such charges or losses under its risk-based underwriting policy and 2) engage with certain ISOs in partner programs in which the ISOs assume liability for these charges or losses. A merchant reserve account is funded by the merchant and held by the member bank during the term of the merchant agreement. Unused merchant reserves are returned to the merchant after termination of the merchant agreement or in certain instances upon a reassessment of risks during the term of the merchant agreement.
Exception items that the Company is attempting to collect from the merchants through the funds settlement process, merchant reserves or from the ISO partners are recognized as settlement assets in the Company’s consolidated balance sheets, with an offsetting reserve for those amounts the Company estimates it will not be able to recover. Provisions for merchant losses are included as a component of costs of services in the Company’s consolidated statements of operations.
Commercial Payments Segment
In the Company’s Commercial Payments segment, the Company earns revenue from certain of its services by processing ACH transactions for financial institutions and other business customers. Customers transfer funds to the Company, which are held in bank accounts controlled by the Company until such time as the ACH transactions are made. The Company recognizes these cash balances within restricted cash and settlement obligations in its consolidated balance sheets.
The Company's settlement assets and obligations at December 31, 2019 and 2018 were as follows:
As restated - Note 2 | |||||||
(in thousands) | December 31, 2019 | December 31, 2018 | |||||
Settlement Assets: | |||||||
Card settlements due from merchants, net of estimated losses | $ | $ | |||||
Card settlements due from processors | |||||||
Total Settlement Assets | $ | $ | |||||
Settlement Obligations: | |||||||
Card settlements due to merchants | $ | $ | |||||
Due to ACH payees (1) | |||||||
Total Settlement Obligations | $ | $ | |||||
(1) Amounts due to ACH payees are held by the Company in restricted cash.
93
6. NOTES RECEIVABLE
The Company has notes receivable from ISOs and another entity (see Note 13, Related Party Matters) totaling approximately $5.7 million and $1.8 million as of December 31, 2019 and 2018, respectively. These notes receivable are reported as current and non-current on the Company's consolidated balance sheet. The notes bear an average interest rate of 12.4 % and 12.8 % as of December 31, 2019 and 2018, respectively.
Under the terms of the agreements with ISOs, the Company preserves the right to holdback residual payments due to the ISOs and to apply such residuals against future payments due to the Company. The term note due to the other party is secured by business assets and a personal guarantee. Based on the terms of these agreements and historical experience, no reserves have been recorded for notes receivable as of December 31, 2019 and 2018.
Principal contractual maturities on the notes receivable at December 31, 2019 were as follows:
(in thousands) | ||||
Year Ended December 31, | Maturities | |||
2020 | $ | |||
2021 | ||||
2022 | ||||
2023 | ||||
2024 | ||||
Total principal due | ||||
Discount | ( | ) | ||
Carrying amount of loans | $ | |||
7. GOODWILL AND INTANGIBLE ASSETS
The Company records goodwill when an acquisition is made and the purchase price is greater than the fair value assigned to the underlying tangible and intangible assets acquired and the liabilities assumed. The Company's goodwill is allocated to reporting units as follows:
(in thousands) | December 31, 2019 | December 31, 2018 | |||||
Consumer Payments | $ | $ | |||||
Integrated Partners | |||||||
$ | $ | ||||||
The Company's intangible assets include acquired merchant portfolios, customer relationships, ISO relationships, trade names, technology, non-compete agreements, and residual buyouts. For the year ended December 31, 2019, the Company acquired $69.8 million of merchant portfolios (including $68.7 million related to the asset acquisition from YapStone, Inc.), $19.9 million in residual buyouts, and $1.0 million of technology intangibles. For the year ended December 31, 2018, the Company acquired a $44.8 merchant portfolio from Direct Connect Merchant Services, LLC, $46.1 million in residual buyouts, $4.9 million in customer relationships, and $0.3 million for a trade name.
There were no business combinations consummated or changes in the carrying amount of goodwill for the year ended December 31, 2019. The following table summarizes goodwill as of December 31, 2019 and 2018:
94
(in thousands) | Amount | ||
Balance at January 1, 2018 | $ | ||
Addition for the year ended December 31, 2018: | |||
PayRight | |||
RadPad/Landlord Station | |||
PPS Northeast | |||
PPS Tech | |||
Balance at December 31, 2019 and 2018 | $ | ||
For business combinations consummated during the year ended December 31, 2018, goodwill is deductible for income tax purposes.
At December 31, 2019 and December 31, 2018, intangible assets consisted of the following:
(in thousands) | December 31, 2019 | December 31, 2018 | |||||
Capitalized: | |||||||
Merchant portfolios | $ | $ | |||||
Customer relationships | |||||||
Residual buyouts | |||||||
Non-compete agreements | |||||||
Trade names | |||||||
Technology | |||||||
ISO relationships | |||||||
Total capitalized | |||||||
Less accumulated amortization: | |||||||
Merchant portfolios | ( | ) | ( | ) | |||
Customer relationships | ( | ) | ( | ) | |||
Residual buyouts | ( | ) | ( | ) | |||
Non-compete agreements | ( | ) | ( | ) | |||
Trade names | ( | ) | ( | ) | |||
Technology | ( | ) | ( | ) | |||
ISO relationships | ( | ) | ( | ) | |||
Total accumulated amortization | ( | ) | ( | ) | |||
Net carrying value | $ | $ | |||||
95
The weighted-average amortization periods for intangible assets held at December 31, 2019 are as follows:
Useful Life | Amortization Method | Weighted-Average Life | |||
Merchant portfolios | 5 - 15 years | Straight-line | |||
Residual buyouts | 1 - 9 years | Straight-line and double declining | |||
Non-compete agreements | Straight-line | ||||
Trade name | 5 - 12 years | Straight-line | |||
Technology | 5 - 7 years | Straight-line | |||
ISO relationships | 11 - 25 years | Sum-of-years digits | |||
Customer relationships | 10 - 15 years | Straight-line and sum-of-years digits | |||
Amortization expense for intangible assets was $32.4 million, $14.7 million, and $10.5 million for the years ended December 31, 2019, 2018 and 2017, respectively.
The estimated amortization expense of intangible assets as of December 31, 2019 for the next five years and thereafter is:
(in thousands) | ||||
Estimated | ||||
Year Ending December 31, | Amortization Expense | |||
2020 | $ | |||
2021 | ||||
2022 | ||||
2023 | ||||
2024 | ||||
Thereafter | ||||
Total | $ | |||
Actual amortization expense to be reported in future periods could differ from these estimates as a result of new intangible asset acquisitions, changes in useful lives, and other relevant events or circumstances.
See Note 12, Commitments and Contingencies, for information about a merchant portfolio acquisition with a contingent purchase price.
The Company tests goodwill for impairment for each of its reporting units on an annual basis, or when events occur or circumstances indicate the fair value of a reporting unit is below its carrying value. The Company performed its most recent annual goodwill impairment test as of November 30, 2019 using market data and discounted cash flow analysis. The Company concluded there were no indicators of impairment as of December 31, 2019 and December 31, 2018. As such, there was no impairment loss for the years ended December 31, 2019, 2018, and 2017.
8. PROPERTY, EQUIPMENT AND SOFTWARE
The Company's property, equipment, and software balance primarily consists of furniture, fixtures, and equipment used in the normal course of business, computer software developed for internal use, and leasehold improvements. Computer software
96
represents purchased software and internally developed back office and merchant interfacing systems used to assist the reporting of merchant processing transactions and other related information.
A summary of property, equipment, and software as of December 31, 2019 and December 31, 2018 was as follows:
(in thousands) | December 31, 2019 | December 31, 2018 | Useful Life | ||||||
Furniture and fixtures | $ | $ | 2-7 years | ||||||
Equipment | 3-7 years | ||||||||
Computer software | 3-5 years | ||||||||
Leasehold improvements | 5-10 years | ||||||||
Less accumulated depreciation | ( | ) | ( | ) | |||||
Property, equipment, and software, net | $ | $ | |||||||
9. ACCOUNTS PAYABLE AND ACCRUED EXPENSES
The Company accrues for certain expenses that have been incurred and not paid, which are classified within accounts payable and accrued expenses in the accompanying consolidated balance sheets.
The components of accounts payable and accrued expenses that exceeded five percent of total current liabilities consisted of the following at December 31, 2019 and December 31, 2018 consisted of the following:
(in thousands) | December 31, 2019 | December 31, 2018 | |||||
Accounts payable | $ | $ | |||||
Accrued compensation | $ | $ | |||||
Accrued network fees | $ | $ | |||||
10. LONG-TERM DEBT AND WARRANT LIABILITY
Long-term debt owed by certain subsidiaries (the "Borrowers") of the Company consisted of the following as of December 31, 2019 and December 31, 2018:
97
(dollar amounts in thousands) | December 31, 2019 | December 31, 2018 | |||||
Term Loan - Senior, matures January 3, 2023 and bears interest at LIBOR plus 5.0% at December 31, 2019 and December 31, 2018 (actual rate of approximately 6.71% at December 31, 2019 and 7.5% at December 31, 2018) | $ | $ | |||||
Term Loan - Subordinated, matures July 3, 2023 and bears interest at 5.0% plus payment-in-kind interest (actual rate of 10.5% at December 31, 2019 and December 31, 2018) | |||||||
Revolving Credit Facility, matures January 22, 2022 | |||||||
Total debt | |||||||
Less: current portion of long-term debt | ( | ) | ( | ) | |||
Less: unamortized debt discounts | ( | ) | ( | ) | |||
Less: deferred financing costs | ( | ) | ( | ) | |||
Total long-term debt, net | $ | $ | |||||
Substantially all of the Company's assets are pledged as collateral under the long-term debt agreements, which are described in more detail in the following sections of this footnote. The Company's parent entity, Priority Technology Holdings, Inc., is neither a borrower nor a guarantor of the long-term debt.
Long-Term Debt
On January 3, 2017, the Company refinanced existing long-term debt whereby the Borrowers entered into a credit agreement with a syndicate of lenders (the "Senior Credit Agreement"). The Senior Credit Agreement had an original maximum borrowing amount of $225.0 million, consisting of a $200.0 million term loan and a $25.0 million revolving credit facility. As part of the debt refinancing on January 3, 2017, the Borrowers also entered into a Credit and Guaranty Agreement (the "GS Credit Agreement") with Goldman Sachs Specialty Lending Group, L.P. ("Goldman Sachs" or "GS") for an $80.0 million term loan, the proceeds of which were used to refinance the amounts previously outstanding with Goldman Sachs. This refinancing was deemed to be a debt modification for GAAP purposes.
The term loans under the Senior Credit Agreement and the GS Credit Agreement were issued at a discount of $3.7 million. The Company determined that the 2018 debt refinancing should be accounted for as a debt extinguishment. The Company recorded an extinguishment loss of approximately $1.8 million, which consisted primarily of lender fees incurred in connection with the refinancing and the write-off of unamortized deferred financing fees and original issue discount. The extinguishment loss is reported within "Other, net" on the Company's consolidated statements of operations.
Amendments
The following table summarizes key changes made as the results of amendments to the Senior Credit Agreement and the GS Credit Agreements through December 31, 2019:
98
(in millions) | GS Credit | |||||||||||||||||||||
Senior Credit Agreement | Agreement | Discounts and Costs | ||||||||||||||||||||
Revolving | ||||||||||||||||||||||
Principal | Line | Amendment | Principal | Issue | Costs | Costs | ||||||||||||||||
Amendment | Established | Established | Type | Established (a) | Discount | Expensed (b) | Capitalized | |||||||||||||||
January 2017 | $ | $ | Extinguishment | $ | $ | $ | $ | |||||||||||||||
January 2018 | — | Modification | — | $ | $ | $ | ||||||||||||||||
December 2018 | — | Modification | — | $ | $ | $ | ||||||||||||||||
$ | $ | $ | ||||||||||||||||||||
(a) The GS Credit Agreement allows for payment-in-kind interest which will subsequently increase the amount outstanding.
(b) Reported within "Other, net" on the Company's consolidated statements of operations.
The Senior Credit Agreement and the GS Credit Agreement were also amended on November 14, 2017. The First Amendment allows for loan advances of less than $5.0 million and for certain liens on cash securing the Company's funding obligations under a new product involving a virtual credit card program. This amendment did not affect any of the material terms, conditions, or covenants of the Senior Credit Agreement or the GS Credit Agreement.
Additionally, two amendments were executed in 2019 that concerned procedural changes to the quarterly and annual reporting for lenders and did not affect any of the material terms, conditions, or covenants of the Senior Credit Agreement or the GS Credit Agreement.
Amendments in March 2020
On March 18, 2020, the Borrowers modified the Senior Credit Agreement and the GS Credit Amendment (collectively, the "Sixth Amendment"). Under the Sixth Amendment, calculation of the permitted Total Net Leverage Ratio was modified to include certain expenses of the Company's parent entity and the permitted maximum ratio for each test period was adjusted to the ratios described in the subsequent disclosures for covenants. Neither the existing applicable margins or interest rates changed as a result of the Sixth Amendment. The terms of the GS Credit Agreement were amended to allow for amendments under the Senior Credit Agreement, but otherwise the terms of the GS Credit Agreement were not substantively changed by the Sixth Amendment.
Additional Information
Beginning with the January 2018 amendment, borrowings under the Senior Credit Agreement are subject to an applicable margin, or percentage per annum, equal to: (i) with respect to initial term loans, (a) for LIBOR rate loans, 5.00 % per annum, and (b) for base rate loans, 4.00 % per annum; and (ii) with respect to revolving loans (a) for LIBOR rate loans and letter of credit fees, 5.00 %, (b) for base rate loans, 4.00 %, and (c) for unused commitment fees, 0.50 %.
At December 31, 2019, there was $11.5 million outstanding on the revolving credit facility. The revolving credit facility bears interest at LIBOR plus 5.0 % at December 31, 2019, which resulted in an interest rate of 6.71 %. No amounts were outstanding on the revolving credit facility at December 31, 2018.
The Senior Credit Agreement matures on January 3, 2023, with the exception of the revolving credit facility which expires on January 2, 2022. Any amounts outstanding under the revolving credit facility must be paid in full before the maturity date of January 2, 2022. The GS Credit Agreement matures on July 3, 2023.
Under the Senior Credit Agreement, the Company is required to make quarterly principal payments of approximately $1.0 million. Additionally, the Company may be obligated to make certain additional mandatory prepayments based on excess cash flow, as defined in the Senior Credit Agreement. No such prepayments were due for the years ended December 31, 2019 and 2018. Principal
99
contractual maturities on long-term debt, including amount outstanding on the revolving line of credit, at December 31, 2019 are as follows:
(in thousands) | ||||
Year Ending December 31, | Maturities | |||
2020 | $ | |||
2021 | ||||
2022 | ||||
2023 | ||||
$ | ||||
For the years ended December 31, 2019 and 2018, the payment-in-kind (PIK) interest under the GS Credit Agreement added $5.1 million and $4.9 million, respectively, to the principal amount of the subordinated debt, which totaled $95.1 million and $90.0 million as of December 31, 2019 and 2018, respectively.
For the years ended December 31, 2019, 2018, and 2017, the Company recorded interest expense, including amortization of deferred financing costs and debt discounts, of $40.7 million, $29.9 million, and $25.1 million, respectively.
Covenants
The Senior Credit Agreement and the GS Credit Agreement, as amended, contain representations and warranties, financial and collateral requirements, mandatory payment events, events of default, and affirmative and negative covenants, including without limitation, covenants that restrict among other things, the ability to create liens, pay dividends or distribute assets from the Company's subsidiaries to Priority Technology Holdings, Inc., merge or consolidate, dispose of assets, incur additional indebtedness, make certain investments or acquisitions, enter into certain transactions (including with affiliates), and to enter into certain leases. Substantially all of the borrowers' assets are pledged as collateral under the Senior Credit Agreement and GS Credit Agreement.
The borrowers are also required to comply with certain restrictions for the Total Net Leverage Ratio, which is defined in the Senior Credit Agreement and GS Credit Agreement as: the consolidated total debt of the Borrowers, less unrestricted cash subject to certain restrictions, divided by the Consolidated Adjusted EBITDA (a non-GAAP measure) of the Borrowers for the prior four quarters.
The table below sets forth the maximum permitted Total Net Leverage Ratio for the indicated test periods:
Test Period Ending | Total Net Leverage Ratio Maximum Permitted | |
December 31, 2019 to March 31, 2020 | 8.00 : 1.00 | |
June 30, 2020 to December 31, 2020 | 7.75 : 1.00 | |
March 31, 2021 | 7.71 : 1.00 | |
June 30, 2021 | 7.44 : 1.00 | |
September 30, 2021 | 7.19 : 1.00 | |
December 31, 2021 | 7.00 : 1.00 | |
March 31, 2022 | 6.75 : 1.00 | |
June 30, 2022 | 6.72 : 1.00 | |
September 30, 2022 to December 31, 2022 | 6.50 : 1.00 | |
Each test period thereafter | 5.50 : 1.00 | |
100
As of December 31, 2019, the Borrowers were in compliance with the covenants, as amended in the Sixth Amendment.
Deferred Financing Costs and Debt Discount
Unamortized capitalized deferred financing costs related to the Company's credit facilities totaled $3.0 million and $4.0 million at December 31, 2019 and December 31, 2018, respectively. Unamortized debt discount related to the Company's credit facilities totaled $2.9 million and $3.3 million at December 31, 2019 and 2018, respectively. Deferred financing costs and debt discount are being amortized using the effective interest method over the remaining term of the respective debt and are recorded as a component of interest expense. Interest expense related to amortization of deferred financing costs and debt discount, including accelerated amortization due to debt modification or extinguishment, was $1.7 million, $1.4 million, and $3.4 million for the years ended December 31, 2019, 2018, and 2017, respectively. Unamortized deferred financing costs and debt discount are included in net long-term debt in the Company's consolidated balance sheets.
Redeemed Goldman Sachs Warrant ("GS Warrant")
In connection with the prior GS Credit Agreement, Priority Holdings, LLC issued a warrant to GS to purchase 1.0 % of Priority Holdings, LLC's outstanding Class A common units. As part of the 2017 debt amendment, the 1.0 % warrant with GS was extinguished and Priority Holdings, LLC issued a new warrant to GS to purchase 1.8 % of Priority Holding, LLC's outstanding Class A common units. As of December 31, 2017, the warrant had a fair value of $8.7 million and was presented as a warrant liability in the accompanying consolidated balance sheets.
11. INCOME TAXES
In connection with the Business Combination as disclosed in Note 1, Nature of Business and Accounting Policies, the partnership tax status was terminated on July 25, 2018. Under the former partnership status, Priority Holdings, LLC was a dual member limited liability company and as such its financial statements reflected no income tax provisions as a pass-through entity. As a result of the Business Combination, for income tax purposes Priority Holdings, LLC became a disregarded subsidiary of the Company, the successor entity to MI Acquisitions, Inc., whereby its operations became taxable. For all periods subsequent to the Business Combination, the income tax provision reflects the taxable status of the Company as a corporation. The initial net deferred tax asset from the Business Combination is the result of the difference between initial tax basis, generally substituted tax basis, and the reflective carrying amounts of the assets and liabilities for financial statement purposes. The net deferred tax asset as of July 25, 2018 was approximately $47.5 million, which was recorded and classified on the Company's consolidated balance sheet in accordance with ASU 2015-17 and as an adjustment to Additional Paid-In Capital in the Company's consolidated statement of changes in stockholders' deficit. In addition, the Company's consolidated financial statements for the years ended December 31, 2018 and 2017 reflect unaudited pro-forma income tax disclosure amounts to illustrate the income tax effects had the Company been subject to federal and state income taxes for both full years.
101
Components of income tax (benefit) expense for the years ended December 31, 2019 and 2018 were as follows:
(in thousands) | For the Year Ended | ||||||
As restated - Note 2 | |||||||
December 31, 2019 | December 31, 2018 | ||||||
U.S. current income tax expense | |||||||
Federal | $ | ( | ) | $ | |||
State and local | |||||||
Total current income tax expense | $ | ||||||
U.S. deferred income tax expense (benefit) | |||||||
Federal | $ | $ | ( | ) | |||
State and local | ( | ) | ( | ) | |||
Total deferred income tax expense (benefit) | $ | ( | ) | ||||
Total income tax expense (benefit) | $ | $ | ( | ) | |||
The Company's effective income tax benefit rate was 2.5 % for the year ended December 31, 2019. For the year ended December 31, 2018, the Company's effective income tax rate was 12.5 %. For 2019, this rate differed from the statutory federal rate of 21% primarily due to valuation allowance changes against certain business interest carryover deferred tax assets. For 2018, this rate differed from the statutory federal rate of 21% primarily due to the partnership status of Priority Holdings, LLC. for periods prior to July 25, 2018. The following table provides a reconciliation of the income tax benefit at the statutory U.S. federal tax rate to actual income tax benefit for the years ended December 31, 2019 and 2018:
(in thousands) | For the Year Ended | ||||||
As restated - Note 2 | |||||||
December 31, 2019 | December 31, 2018 | ||||||
U.S. federal statutory (benefit) | $ | ( | ) | $ | ( | ) | |
Earnings as dual-member LLC | |||||||
State and local income taxes, net | ( | ) | ( | ) | |||
Excess tax benefits pursuant to ASU 2016-09 | |||||||
Valuation allowance changes | ( | ) | |||||
Nondeductible items | |||||||
Tax credits | ( | ) | ( | ) | |||
Other, net | ( | ) | |||||
Income tax expense (benefit) | $ | $ | ( | ) | |||
Deferred income taxes reflect the expected future tax consequences of temporary differences between the financial statement carrying amount of the Company's assets and liabilities, tax credits and their respective tax bases, and loss carry forwards. The significant components of deferred income taxes were as follows:
102
(in thousands) | As of | ||||||
As restated - Note 2 | |||||||
December 31, 2019 | December 31, 2018 | ||||||
Deferred Tax Assets: | |||||||
Accruals and reserves | $ | $ | |||||
Intangible assets | |||||||
Net operating loss carryforwards | |||||||
Interest limitation carryforwards | |||||||
Other | |||||||
Gross deferred tax assets | |||||||
Valuation allowance | ( | ) | ( | ) | |||
Total deferred tax assets | |||||||
Deferred Tax Liabilities: | |||||||
Prepaid assets | ( | ) | ( | ) | |||
Investments in partnership | ( | ) | ( | ) | |||
Property and equipment | ( | ) | ( | ) | |||
Total deferred tax liabilities | ( | ) | ( | ) | |||
Net deferred tax assets | $ | $ | |||||
In accordance with the provisions of ASC 740, Income Taxes ("ASC 740"), the Company provides a valuation allowance against deferred tax assets when it is more likely than not that some portion or all of the deferred tax assets will not be realized. The assessment considers all available positive and negative evidence and is measured quarterly. As of December 31, 2019 and 2018, the Company has recorded a valuation allowance of approximately $10.1 million and $0.8 million, respectively, against certain deferred income tax assets related to business interest deduction carryovers and Business Combination costs that the Company believes are not more likely than not to be realized.
The Company recognizes the tax effects of uncertain tax positions only if such positions are more likely than not to be sustained based solely upon its technical merits at the reporting date. The Company refers to the difference between the tax benefit recognized in its financial statements and the tax benefit claimed in the income tax return as an "unrecognized tax benefit." As of December 31, 2019 and 2018, the net amounts of our unrecognized tax benefits were not material.
The Company is subject to U.S. federal income tax and income tax in multiple state jurisdictions. Tax periods for 2016 and all years thereafter remain open to examination by the federal and state taxing jurisdictions and tax periods for 2015 and all years thereafter remain open for certain state taxing jurisdictions to which the Company is subject.
A change in MI Acquisitions' beneficial ownership occurred concurrent with the Business Combination and Recapitalization on July 25, 2018, which likely caused a stock ownership change for purposes of Section 382 of the Internal Revenue Code. However, this ownership change should have no material impact to the net operating losses ("NOLs") available as of this date. At December 31, 2019, the Company had federal NOL carryforwards of approximately $14.5 million which can offset future taxable income as follows: 1) approximately $14.3 million can offset 80% of future taxable income for an indefinite period of time and 2) approximately $0.2 million can offset 100% of future taxable income through expiration dates ranging from 2036 to 2038. At December 31, 2018, the Company had federal NOL carryforwards of approximately $5.1 million which can offset future taxable income as follows: 1) approximately $4.9 million can offset 80% of future taxable income for an indefinite period of time and 2) approximately $0.2 million can offset 100% of future taxable income through expiration dates ranging from 2036 to 2038. Also, at December 31, 2019 and 2018, the Company had state NOL carryforwards of approximately $19.5 million and $6.6 million, respectively, with expirations dates ranging from 2023 to 2044.
103
On December 22, 2017, the Tax Cuts and Jobs Act ("Tax Act") was enacted. The Tax Act included a number of changes to existing U.S. tax laws. The most notable provisions of the Tax Act that impacted the Company included a reduction of the U.S. corporate income tax rate from 35% to 21% and the limitations on interest deductibility, both effective January 1, 2018, as well as immediate expensing for certain assets placed into service after September 27, 2017. The Company did not experience any material impacts of the provisions of the Tax Act for the year ended December 31, 2018 other than the impact of the reduction of the U.S. corporate rate from 35% to 21% and the limitation on interest deductibility. As of December 31, 2018, the Company has completed the accounting for the income tax effects of all elements of the Tax Act in accordance with the SEC's Staff Accounting Bulletin No. 118.
12. COMMITMENTS AND CONTINGENCIES
Leases
The Company has various operating leases for office space and equipment. These leases range in terms from one to 16 years. Most of these leases are renewable at expiration, subject to terms acceptable to the lessors and the Company.
Future minimum lease commitments under non-cancelable operating leases with initial or remaining terms in excess of one year are as follows:
(in thousands) | ||
Due In | Amount Due | |
2020 | $ | |
2021 | ||
2022 | ||
2023 | ||
2024 | ||
Thereafter | ||
Total | $ | |
Total rent expenses for the years ended December 31, 2019, 2018, and 2017 was $2.0 million, $1.9 million, and $1.5 million, respectively, which is included in SG&A expenses in the Company's consolidated statements of operations.
Minimum Annual Commitments with Third-Party Processors
The Company has multi-year agreements with third parties to provide certain payment processing services to the Company. The Company pays processing fees under these agreements that are based on the volume and dollar amounts of processed payments transactions. Some of these agreements have minimum annual requirements for processing volumes. As of December 31, 2019, the Company is committed to pay minimum processing fees under these agreements of approximately $14.0 million over the next two years.
104
Merchant Reserves
See Note 5, Settlement Assets and Obligations, for information about merchant reserves.
Commitment to Lend
See Note 13, Related Party and Other Transactions, for information on a loan commitment extended by the Company to another entity.
Contingent Consideration
See Note 4, Business Combination, Asset Acquisitions, and Asset Contributions, for information about contingent consideration related to acquisitions consummated in 2019 and 2018.
Merchant Portfolio Rights and Reseller Agreement
During the year ended December 31, 2019, the Company simultaneously entered into two agreements with another entity. These two related agreements 1) transfer to the Company certain perpetual rights to a merchant portfolio and 2) form a 5 -year reseller arrangement whereby the Company will offer and sell to its customer base certain on-line services to be fulfilled by the other entity. No cash consideration was paid to, or received from, the other entity at execution of either agreement. Subsequent cash payments from the Company to the other entity for the merchant portfolio rights are determined based on a combination of both: 1) the actual financial performance of the acquired merchant portfolio rights and 2) actual sales and variable wholesale costs for the on-line services sold by the Company under the reseller arrangement. Amounts subsequently paid to the other entity are accounted for as either 1) standard costs of the services sold by the Company under the 5 -year reseller agreement or 2) consideration for the merchant portfolio rights. Amounts paid that are accounted for as consideration for the merchant portfolio rights are capitalized and amortized over the estimated useful life of the merchant portfolio rights. For the year ended December 31, 2019, approximately $1.1 million was capitalized as contingent cost for the merchant portfolio. The capitalized cost is being amortized using an accelerated method. At this time, the Company cannot reasonably estimate the allocation of future cash payments. However, under the two contracts the Company does not anticipate any net losses.
Legal Proceedings
The Company is involved in certain legal proceedings and claims which arise in the ordinary course of business. In the opinion of the Company and based on consultations with inside and outside counsel, the results of any of these matters, individually and in the aggregate, are not expected to have a material effect on the Company's results of operations, financial condition, or cash flows. As more information becomes available, and the Company determines that an unfavorable outcome is probable on a claim and that the amount of probable loss that the Company will incur on that claim is reasonably estimable, the Company will record an accrued expense for the claim in question. If and when the Company records such an accrual, it could be material and could adversely impact the Company's results of operations, financial condition, and cash flows.
13. RELATED PARTY MATTERS
Contributed Assets of eTab and Cumulus
See Note 4, Business Combinations, Asset Acquisitions, and Asset Contributions, for information about the contributions from related parties of certain assets and liabilities of eTab and Cumulus.
105
Loan with Warrant
During 2019, the Company, through one of its wholly-owned subsidiaries, executed an interest-bearing loan and commitment agreement with another entity. The Company loaned the entity a total of $3.5 million during 2019, with a commitment to loan up to $10.0 million based on certain growth metrics of the entity and continued compliance by the entity with the terms and covenants of the agreement. The Company's commitment to make additional advances under the loan agreement is dependent upon such advances not conflicting with covenants or restrictions under any of the Company's debt or other applicable agreements. Amounts loaned to this entity by the Company are secured by substantially all of the assets of the entity and by a personal guarantee. The note receivable has an interest rate of 12.0 % per annum and is repayable in full in May 2024. The Company also received a warrant to purchase a non-controlling interest in this entity's equity at a fixed amount. The loan agreement also gives the Company certain rights to purchase some or all of this entity's equity in the future, at the entity's then-current fair value. The fair values of the warrant, loan commitment, and purchase right were not material at inception or at December 31, 2019.
Prior Management Services Agreement
During the years ended December 31, 2018 and 2017, Priority Holdings, LLC had a management services agreement with PSD Partners LP, which is owned by Mr. Thomas Priore, the Company's President, Chief Executive Officer and Chairman. The Company incurred total expenses of $1.1 million and $0.8 million for the years ended December 31, 2018 and 2017 related to management service fees, annual bonus payout, and occupancy fees, which are recorded in SG&A expenses in the Company's consolidated statements of operations.
Due from Members of Priority Holdings, LLC
As noted in Note 1, Nature of Business and Accounting Policies, on July 25, 2018 the owners of Priority Holdings, LLC contributed their member equity interests in exchange for the issuance of MI Acquisitions Inc.'s common stock, and MI Acquisitions, Inc. simultaneously changed its name to Priority Technology Holdings, Inc. Subsequent to July 25, 2018, the Company has made cash payments to, and received cash refund payments from, the former owners of Priority Holdings, LLC, mostly related to pass-through tax amounts for periods prior to July 25, 2018. At December 31, 2019 and 2018, the net amounts receivable from these parties were approximately $0.2 million and $0.3 million, respectively.
Underwriting Commissions
During the year ended December 31, 2018, the Company paid and capitalized in additional paid-in capital underwriting commissions of $8.0 million related to the recapitalization. See Note 14, Stockholders' Deficit Information.
Call Right
The Company's President, Chief Executive Officer and Chairman was given the right to require any of the founders of MI Acquisitions to sell all or a portion of their Company securities at a call-right purchase price, payable in cash. The call right purchase price for common stock will be based on the greater of: 1) $10.30 ; 2) a preceding volume-weighted average closing price (as defined in the governing document); or 3) a subsequent volume-weighted average closing price (as defined in the governing document). The call right purchase price for warrants will be determined by the greater of: 1) a preceding volume-weighted average closing price (as defined in the governing document) of the called security or 2) a subsequent volume-weighted average closing price of the called security. For the Company, the call right does not constitute a financial instrument or derivative under GAAP since it does not represent an asset or obligation of the Company, however the Company discloses it as a related party matter.
106
14. STOCKHOLDERS' DEFICIT INFORMATION
As disclosed in Note 1, Nature of Business and Accounting Policies, on July 25, 2018 the Company executed the Business Combination which was accounted for as a "reverse merger" between Priority Holdings, LLC and MI Acquisitions, resulting in the Recapitalization of the Company's equity. The combined entity was renamed Priority Technology Holdings, Inc.
Common and Preferred Stock
For periods prior to July 25, 2018, equity has been retroactively revised to reflect the number of shares received as a result of the Recapitalization.
The equity structure of the Company was as follows on December 31, 2019 and 2018:
(in thousands) | December 31, 2019 | December 31, 2018 | |||||||||||||
Authorized | Issued | Outstanding | Authorized | Issued and Outstanding | |||||||||||
Common stock, par value $0.001 | |||||||||||||||
Preferred stock, par value $0.001 | |||||||||||||||
In connection with the Business Combination and Recapitalization, the following occurred in 2018:
• | In exchange for the |
• | Approximately |
• | $ |
• | The MI Founders forfeited |
At December 31, 2018, the Company had 67,038,304 shares of common stock outstanding, of which: 1) 60,071,200 shares were issued in the Recapitalization through the private placement; 2) 874,317 shares were transferred to the sellers of Priority Holdings, LLC that were purchased from the MI Founders; 3) 4,918,138 shares were issued in MI Acquisitions' 2016 IPO; 4) 699,454 shares were issued to the MI Founders; and 5) 475,195 shares were issued as partial consideration for two business acquisitions. Certain holders of common stock from the private placement may be subject to holding period restrictions under applicable securities laws.
During the second quarter of 2019, the Company repurchased a total of 451,224 shares of its common stock at an average price of $5.29 per share. Total cash paid by the Company was approximately $2.4 million. The repurchases were authorized under a December 2018 resolution by the Company's board of directors, which expired during the second quarter of 2019.
Except as otherwise required by law or as otherwise provided in any certificate of designation for any series of preferred stock, the holders of the Company's common stock possess all voting power for the election of members of the Company's board of directors and all other matters requiring stockholder action and will at all times vote together as one class on all matters submitted to a vote of the Company's stockholders. Holders of the Company's common stock are entitled to one vote per share on matters to be voted on by stockholders. Holders of the Company's common stock will be entitled to receive such dividends and other distributions, if any, as may be declared from time to time by the Company's board of directors in its discretion. Since the Business Combination and Recapitalization, the Company has neither declared nor paid dividends. The holders of the Company's common
107
stock have no conversion, preemptive or other subscription rights and there is no sinking fund or redemption provisions applicable to the common stock.
The Company is authorized to issue 100,000,000 shares of preferred stock with such designations, voting and other rights and preferences as may be determined from time to time by the board of directors. As of December 31, 2019, the Company has not issued any shares of preferred stock.
Warrants issued by MI Acquisitions
Prior to July 25, 2018, MI Acquisitions issued warrants that allow the holders to purchase up to 5,731,216 shares of the Company's common stock at an exercise price of $11.50 per share, subject to certain adjustments (5,310,109 of these warrants are designated as "public warrants" and 421,107 are designated as "private warrants"). The warrants may only be exercised during the period commencing on the later to occur of (i) 30 days following the completion of the MI Acquisitions' initial business combination and (ii) 12 months following the closing of MI Acquisitions' IPO, and terminating on the earlier to occur of (i) five years following the date the warrants became exercisable, and (ii) the date fixed for redemption upon the Company electing to redeem the warrants. The Company has the option to redeem all (and not less than all) of the outstanding public warrants at any time from and after the warrants become exercisable, and prior to their expiration, at the price of $0.01 per warrant; provided that the last sales price of the Company's common stock has been equal to or greater than $16.00 per share (subject to adjustment for splits, dividends, recapitalizations and other similar events), for any 20 trading days within a 30 trading day period ending on the third business day prior to the date on which notice of redemption is given and provided further that (i) there is a current registration statement in effect with respect to the shares of common stock underlying the public warrants for each day in the 30-day trading period and continuing each day thereafter until the redemption date or (ii) the cashless exercise is exempt from the registration requirements under the Securities Act of 1933, as amended. The warrants are classified as equity.
The outstanding purchase option that was sold to the underwriters (in addition to the warrants discussed above) for an aggregate purchase price of $100 , allows the holders to purchase up to a total of 300,000 units (each consisting of a share of common stock and a public warrant) exercisable at $12.00 per unit commencing on the later of the consummation of a business combination and six months from September 13, 2016 (the "Purchase Option"). The Purchase Option expires on August 24, 2023, which is the end of the five-year period that commenced 30 days after the Business Combination of July 25, 2018. The units issuable upon exercise of the Purchase Option are identical to the units offered in MI Acquisitions' IPO. The Purchase Option is classified as equity.
In August 2018, the Company was informed by Nasdaq that it intended to delist the Company's outstanding warrants and units due to an insufficient number of round lot holders for the public warrants. The Company subsequently filed a Registration Statement on Form S-4 with the SEC for the purpose of offering holders of the Company's outstanding 5,310,109 public warrants and 421,107 private warrants the opportunity to exchange each warrant for 0.192 shares of the Company's common stock. The exchange offer expired in February 2019 resulting in a total of 2,174,746 warrants being tendered in exchange for 417,538 shares of the Company's common stock plus cash in lieu of fractional shares. Nasdaq proceeded to delist the remaining outstanding warrants and units, which were comprised of one share of common stock and one warrant, from The Nasdaq Global Market at the open of business on March 6, 2019. The delisting of the remaining outstanding warrants and units had no impact on the Company's financial statements.
Business Combination and Recapitalization Costs
In connection with the Business Combination and Recapitalization, the Company incurred $13.3 million in fees and expenses, of which $9.7 million of recapitalization costs were charged to Additional Paid in Capital in 2018 since these costs were less than the cash received in conjunction with the Recapitalization costs and were directly related to the issuance of equity for the Recapitalization. These costs are presented as Recapitalization costs in the accompanying consolidated statements of changes in stockholders' deficit. The remaining $3.6 million of expenses were related to the Business Combination and are presented in SG&A expenses in the accompanying consolidated statements of operations.
108
Equity Events for Priority Holdings, LLC that Occurred Prior to July 25, 2018 (date of Business Combination)
On January 3, 2017, Priority used the proceeds from the 2017 debt refinancing (see Note 10, Long-Term Debt and Warrant Liability) to redeem 4,681,590 Class A common units for $200.0 million (the "Redemption"). Concurrent with the Redemption, (i) Priority and its members entered into an amended and restated operating agreement that eliminated the Class A preferred units and the Class C common units and (ii) the Plan of Merger, dated as of May 21, 2014 between Priority Payment Systems Holdings, LLC and Pipeline Cynergy Holdings, LLC was terminated which resulted in the cancellation of related contingent consideration due to holders of Class A preferred units.
On January 31, 2017, Priority entered into a redemption agreement with one of its minority unit holders to redeem their former Class A common membership units for a total redemption price of $12.2 million. Priority accounted for the Common Unit Repurchase Obligation as a liability because it was required to redeem these former Class A common units for cash. The liability was recorded at fair value at the date of the redemption agreement, which was equal to the redemption value. Under this agreement, Priority redeemed $3.0 million of 69,450 former Class A common units in April 2017. As of December 31, 2018, the Common Unit Repurchase Obligation had a redemption value of $9.2 million.
The remaining $9.2 million was redeemed through the January 17, 2018 redemption of 115,751 former Class A common units for $5.0 million and the February 23, 2018 redemption of 96,999 former Class A common units for $4.2 million.
In addition to the aforementioned redemptions, Priority redeemed 295,834 former Class A common units for $25.9 million on January 17, 2018 and 445,410 former Class A common units for $39.0 million on January 19, 2018. As a result of the aforementioned redemptions, Priority was 100 % owned by Priority Investment Holdings, LLC and Priority Incentive Equity Holdings, LLC until July 25, 2018.
The former Class A common units redeemed in January and February 2018 were then canceled by Priority. The redemption transactions and the amended and restated operating agreement resulted in one unit-holder gaining control and becoming the majority unit holder of the Company. These changes in the equity structure of Priority were recorded as capital transactions.
At December 31, 2017, Priority had 5,249 voting former Class A common stock authorized and issued, and 335 and 302 non-voting former Class B common stock authorized and issued, respectively.
15. EQUITY-BASED COMPENSATION PLANS
During 2019 and 2018, the Company had three equity-based compensation plans: 2018 Equity Incentive Plan; Earnout Incentive Plan; and 2014 Management Incentive Plan. Total equity-based compensation expense was approximately $3.7 million, $1.6 million, and $1.0 million for the years ended December 31, 2019, 2018, and 2017, respectively, which is included in Salary and employee benefits in the accompanying consolidated statements of operations. For the years ended December 31, 2019 and 2018, the Company recognized an income tax benefit of approximately $0.5 million and $0.1 million, respectively, for equity-based compensation expense. No tax benefit was recognized for the year ended December 31, 2017 due to the Company's tax status.
109
For the years ended December 31, 2019, 2018, and 2017, equity-based compensation was recognized as follows:
(in thousands) | ||||||||||||
Year Ended December 31, | ||||||||||||
2019 | 2018 | 2017 | ||||||||||
Plan: | ||||||||||||
2018 Equity Incentive Plan | $ | $ | $ | |||||||||
Earnout Incentive Plan | ||||||||||||
2014 Management Incentive Plan | ||||||||||||
Total | $ | $ | $ | |||||||||
2018 Equity Incentive Plan
The 2018 Equity Incentive Plan ("2018 Plan") was approved by the Company's board of directors and shareholders in July 2018. The 2018 Plan provides for the issuance of up to 6,685,696 of the Company's common stock. Under the 2018 Plan, the Company's compensation committee may grant awards of non-qualified stock options, incentive stock options, stock appreciation rights ("SARs"), restricted stock awards ("RSU"), restricted stock units, other stock-based awards (including cash bonus awards) or any combination of the foregoing. Any current or prospective employees, officers, consultants or advisors that the Company's compensation committee (or, in the case of non-employee directors, the Company's board of directors) selects, from time to time, are eligible to receive awards under the 2018 Plan. If any award granted under the 2018 Plan expires, terminates, or is canceled or forfeited without being settled or exercised, or if a SAR is settled in cash or otherwise without the issuance of shares, shares of the Company's common stock subject to such award will again be made available for future grants. In addition, if any shares are surrendered or tendered to pay the exercise price of an award or to satisfy withholding taxes owed, such shares will again be available for grants under the 2018 Plan.
A summary of the activity for the 2018 Plan that occurred during the years ended December 31, 2019 and 2018 is as follows:
Common stock authorized for the 2018 Plan | |||
( | ) | Stock options granted in December 2018 | |
Stock option grants forfeited in 2018 | |||
( | ) | RSUs granted in 2018 | |
Common stock available for issuance under the 2018 Plan at December 31, 2018 | |||
Stock option grants forfeited in 2019 | |||
( | ) | RSUs granted in 2019 | |
RSUs forfeited in 2019 | |||
Common stock available for issuance under the 2018 Plan at December 31, 2019 | |||
Stock Options
In December 2018, the Company issued stock option grants to substantially all of the Company's employees excluding the Company's executive officers. The stock options vest as follows: 50 % on July 27, 2019; 25 % on July 27, 2020; and 25 % on July 27, 2021. If a participant terminates employment with the Company, vested options may be exercised for a short period of time while unvested options are forfeited. However, in any event, a stock option will expire ten years from date of grant.
110
Details about the time-based stock options issued under the plan are as follows:
Weighted- | ||||||||||||
Options for | average | Weighted-average | Aggregate | |||||||||
number of | exercise | remaining | intrinsic value | |||||||||
shares | price | contractual terms | (in thousands) | |||||||||
Outstanding, January 1, 2018 | ||||||||||||
Granted in 2018 | $ | |||||||||||
Exercised in 2018 | ||||||||||||
Forfeited in 2018 | ( | ) | $ | |||||||||
Expired in 2018 | ||||||||||||
Outstanding, December 31, 2018 | $ | $ | ||||||||||
Granted in 2019 | ||||||||||||
Exercised in 2019 | ||||||||||||
Forfeited or expired in 2019 | ( | ) | ||||||||||
Outstanding, December 31, 2019 | $ | $ | ||||||||||
Vested and Expected to Vest | $ | $ | ||||||||||
Exercisable at December 31, 2019 | $ | $ | ||||||||||
The table below presents the assumptions used to calculate the fair value of the stock options issued during the year ended December 31, 2018:
Expected volatility | % | ||
Risk-free interest rate | % | ||
Expected term (years) | |||
Dividend yield | % | ||
Exercise price | $ | ||
Restricted Stock Units - Service Based
During December 2018, the Company issued 107,143 RSUs with a grant-date fair value of $7.00 each and a total grant-date fair value of approximately $0.8 million. These RSUs have service-based vesting with 50 % vesting in each of the years 2019 and 2020. In December 2019, 53,571.5 of these RSUs vested as scheduled and resulted in the issuance of 53,571 shares of the Company's common stock with a value of $3.20 per share and an aggregate value of $0.2 million. At December 31, 2019, all remaining unrecognized compensation of approximately $0.4 million is expected to be recognized at the end of 2020. Compensation expense for the year ended December 31, 2019 was approximately $0.4 million. Compensation expense for the year ended December 31, 2018 was not material.
111
During 2019, the Company issued 36,657 service-vesting RSUs with a grant-date fair value of $6.82 each. All of these RSUs subsequently were forfeited in 2019 before any had vested, resulting in no net compensation expense for the year ended December 31, 2019.
Restricted Stock Units - Performance Based
During the third quarter of 2018, the Company issued 95,057 RSUs with a fair value of $10.52 each. In addition to the service vesting requirements, these RSUs vest only if certain performance metrics are achieved for various periods of time the four-year period subsequent to grant date. At December 31, 2019, none of the performance metrics have been achieved, which resulted in the forfeiture of 23,764 of these RSUs. At December 31, 2019, it is not probable that any of the remaining performance metrics will be be achieved subsequent to 2019. No compensation expense has ever been recognized for these RSU grants. At the end of each subsequent reporting period, the Company will evaluate the probability of achievement for the performance metrics and adjust cumulative recognized compensation expense accordingly if the service requirements are also expected to be achieved.
Earnout Incentive Plan
The Company's Earnout Incentive Plan (the "EIP") expired on December 31, 2019. No shares were issued under the EIP. During the fourth quarter of 2019, a total of 95,057 RSUs expired under the EIP with a grant-date fair value of $10.52 each (these grants were in addition to the 95,057 RSUs issued under the 2018 Plan, as previously noted above). Prior to December 31, 2019, it was not probable that the performance metrics would be achieved, thus no compensation expense was recognized for these RSUs for any reporting period.
2014 Management Incentive Plan
16. EMPLOYEE BENEFIT PLANS
The Company sponsors a 401(k) defined contribution savings plan that covers substantially all of its eligible employees. Under the plan, the Company contributes safe-harbor matching contributions to eligible plan participants on an annual basis. The Company may also contribute additional discretionary amounts to plan participants. Company contributions to the plan were $1.3 million, $0.9 million, and $1.0 million for the years ended December 31, 2019, 2018, and 2017, respectively.
The Company offers a comprehensive medical benefit plan to eligible employees. All obligations under the plan are fully insured through third-party insurance companies. Employees participating in the medical plan pay a portion of the costs for the insurance benefits.
17. FAIR VALUE
Fair Value Measurements
The following is a description of the valuation methodologies used for contingent consideration and for the Goldman Sachs warrant prior to its July 2018 redemption (see Note 10, Long-Term Debt and Warrant Liability), both of which were initially recorded and remeasured at fair value at the end of each reporting period.
112
Redeemed Goldman Sachs Warrant
Prior to its redemption in July 2018, the Goldman Sachs warrant was classified as level 3 in the fair value hierarchy. Historically, the fair value of the Goldman Sachs warrant was estimated based on the fair value of Priority Holdings, LLC using a weighted-average of values derived from generally accepted valuation techniques, including market approaches, which consider the guideline public company method, the guideline transaction method, the recent funding method, and an income approach, which considers discounted cash flows. Priority Holdings, LLC adjusted the carrying value of the warrant to fair value as determined by the valuation model and recognized the change in fair value as an increase or decrease in interest and other expense. On July 25, 2018, the Goldman Sachs warrant was fully redeemed in exchange for $12.7 million cash, which resulted in a gain of $0.1 million, as the value of the Goldman Sachs warrant immediately prior to the cancellation was $12.8 million. The warrant is no longer outstanding as of December 31, 2019 or 2018.
Contingent Consideration for Business Combinations
The initial estimated fair value of approximately $1.0 million for the contingent consideration related to the 2018 business combinations for PPS Tech and PPS Northeast (see Note 4, Business Combinations, Asset Acquisitions, and Asset Contributions) were based on a weighted payout probability at the measurement date, which falls within Level 3 on the fair value hierarchy. At December 31, 2019 and 2018, the fair value of this contingent consideration was estimated to be an aggregate of approximately $0.4 million and $1.0 million, respectively. During the year ended December 31, 2019, the carrying values of these contingent consideration arrangements were reduced by approximately $0.6 million, and this amount is reported within SG&A expense on the Company's consolidated statement of operations. As of December 31, 2019, the Company has paid no amounts under either of these earnout arrangements.
The following table shows a reconciliation of the beginning and ending balances for liabilities measured at fair value on a recurring basis using significant unobservable inputs that are classified as Level 3 in the fair value hierarchy for the years ended December 31, 2019, 2018, and 2017:
(in thousands) | Warrant Liability | Contingent Consideration | |||||
Balance at January1, 2017 | $ | $ | |||||
Extinguishment of GS 1.8% warrant liability (Note 10) | ( | ) | |||||
GS 2.2% warrant liability (Note 10) | |||||||
Adjustment to fair value included in earnings | |||||||
Extinguishment of GS 2.2% warrant liability (Note 10) | ( | ) | |||||
Change in fair value of warrant liability | ( | ) | |||||
Earnout liabilities arising from business combinations (Note 4) | |||||||
Balance at December 31, 2018 | |||||||
Adjustment to fair value included in earnings | ( | ) | |||||
Balance at December 31, 2019 | $ | $ | |||||
There were no transfers among the fair value levels during the years ended December 31, 2019, 2018, and 2017.
Fair Value of Debt
The Company's outstanding debt obligations (see Note 10, Long-term Debt and Warrant Liability) are reflected in the consolidated balance sheets at carrying value since the Company did not elect to remeasure its debt obligations to fair value at the end of each reporting period. The carrying values of the Company's long-term debt approximate fair value due to mechanisms in the credit agreements that adjust the applicable interest rates.
113
18. SEGMENT INFORMATION
The Company has three reportable segments that are reviewed by the Company's chief operating decision maker ("CODM"), who is the Company's President, Chief Executive Officer and Chairman. The Consumer Payments operating segment is one reportable segment. The Commercial Payments and Institutional Services (aka Managed Services) operating segments are aggregated into one reportable segment, Commercial Payments. The Integrated Partners operating segment is one reportable segment.
Prior to second quarter of 2019, the Integrated Partners operating segment was aggregated with the Commercial Payments and Institutional Services operating segments and reported as one aggregated reportable segment, Commercial Payments. As of the second quarter of 2019, the Integrated Partners operating segment is no longer aggregated into the Commercial Payments operating segment. All comparative periods have been adjusted to reflect the current three reportable segments.
More information about our three reportable segments:
• | Consumer Payments – represents consumer-related services and offerings including merchant acquiring and transaction processing services including the proprietary MX enterprise suite. Either through acquisition of merchant portfolios or through resellers, the Company becomes a party or enters into contracts with a merchant and a sponsor bank. Pursuant to the contracts, for each card transaction, the sponsor bank collects payment from the credit, debit or other payment card issuing bank, net of interchange fees due to the issuing bank, pays credit card association (e.g., Visa, MasterCard) assessments and pays the transaction fee due to the Company for the suite of processing and related services it provides to merchants, with the remainder going to the merchant. |
• | Commercial Payments – represents services provided to certain enterprise customers, including outsourced sales force to those customers and accounts payable automation services to commercial customers. |
• | Integrated Partners - represents payment adjacent services that are provided primarily to the health care and residential real estate industries. Integrated Partners had no material operations prior to 2018. |
Corporate includes costs of corporate functions and shared services not allocated to our reportable segments. For the year ended December 31, 2018, the Company adjusted its methodology of allocating certain corporate overhead costs to its reportable segments. The current and all prior periods presented herein have been adjusted to reflect the current allocation methodology.
114
Information on segments and reconciliations to consolidated revenues, consolidated income (loss) from operations, and consolidated depreciation and amortization are as follows for the years presented:
(in thousands) | Year Ended December 31, | |||||||||||
As recasted | As restated | As restated | ||||||||||
2019 | 2018 | 2017 | ||||||||||
Revenues: | ||||||||||||
Consumer Payments (a) (b) | $ | $ | $ | |||||||||
Commercial Payments (a) | ||||||||||||
Integrated Partners (a) | ||||||||||||
Consolidated revenues (a) | $ | $ | $ | |||||||||
Income (loss) from operations: | ||||||||||||
Consumer Payments (b) | $ | $ | $ | |||||||||
Commercial Payments | ( | ) | ( | ) | ||||||||
Integrated Partners | ( | ) | ||||||||||
Corporate | ( | ) | ( | ) | ( | ) | ||||||
Consolidated income from operations (b) | $ | $ | $ | |||||||||
Depreciation and amortization: | ||||||||||||
Consumer Payments | $ | $ | $ | |||||||||
Commercial Payments | ||||||||||||
Integrated Partners | ||||||||||||
Corporate | $ | $ | $ | |||||||||
Consolidated depreciation and amortization | $ | $ | $ | |||||||||
(a) Revenue for the years ended December 2019, 2018, and 2017 have been adjusted to reflect the full retrospective adoption of ASC 606, Revenues from Contracts with Customers, as presented in following table. See the section "Accounting Standards Adopted in 2019" in Note 1, Nature of Business and Accounting Policies, for additional information. However, the Integrated Partners reportable segment was not affected in 2018 by the retrospective adoption of ASC 606 and this reportable segment had no material operations prior to 2018.
(b) In addition to certain adjustments made to revenues noted above for the years ended December 31, 2019, 2018, and 2017 related to the full retrospective adoption of ASC 606, the results of operations for the Consumer Payments reportable segment and consolidated results of operations for the years ended December 31, 2018 and 2017 have been restated to correct certain errors, as presented in the following table. See Note 2, Restatement of Previously Issued Consolidated Financial Statements, for additional information.
115
(in thousands) | For the Year Ended December 31, 2019 | |||||||||||
As recasted | Effects of Adoption of ASC 606 - Note 1 | Balances Before Adoption of ASC 606 | ||||||||||
Revenues by reportable segment: | ||||||||||||
Consumer Payments | $ | $ | ( | ) | $ | |||||||
Commercial Payments | ( | ) | ||||||||||
Integrated Partners | ( | ) | ||||||||||
Consolidated revenues | $ | $ | ( | ) | $ | |||||||
(in thousands) | Year Ended December 31, 2018 | |||||||||||||||
As restated | Effect of Adoption of ASC 606 - Note 1 | Corrections of Errors - Note 2 | Balances Before Adoption of ASC 606 and Error Corrections | |||||||||||||
Revenues by reportable segment: | ||||||||||||||||
Consumer Payments | $ | $ | ( | ) | $ | ( | ) | $ | ||||||||
Commercial Payments | ( | ) | ||||||||||||||
Integrated Partners | ||||||||||||||||
Consolidated revenues | $ | $ | ( | ) | $ | ( | ) | $ | ||||||||
Income from operations: | ||||||||||||||||
Consumer Payments | $ | $ | ( | ) | $ | |||||||||||
Consolidated | $ | $ | ( | ) | $ | |||||||||||
(in thousands) | Year Ended December 31, 2017 | |||||||||||||||
As restated | Effect of Adoption of ASC 606 - Note 1 | Corrections of Errors - Note 2 | Balances Before Adoption of ASC 606 and Error Corrections | |||||||||||||
Revenues by reportable segment: | ||||||||||||||||
Consumer Payments | $ | $ | ( | ) | $ | $ | ||||||||||
Commercial Payments | ( | ) | ||||||||||||||
Consolidated revenues | $ | $ | ( | ) | $ | $ | ||||||||||
Income from operations: | ||||||||||||||||
Consumer Payments | $ | $ | ( | ) | $ | |||||||||||
Consolidated | $ | $ | ( | ) | $ | |||||||||||
116
The Integrated Partners reportable segment had no material operations prior to 2018.
A reconciliation of total income from operations of reportable segments to the Company's net (loss) income is provided in the following table:
(in thousands) | Year Ended December 31, | |||||||||||
As restated - Note 2 | As restated - Note 2 | |||||||||||
2019 | 2018 | 2017 | ||||||||||
Total income from operations of reportable segments | $ | $ | $ | |||||||||
Less Corporate | ( | ) | ( | ) | ( | ) | ||||||
Less interest expense | ( | ) | ( | ) | ( | ) | ||||||
Add (less) other, net | ( | ) | ( | ) | ||||||||
Income tax (expense) benefit | ( | ) | ||||||||||
Net (loss) income | $ | ( | ) | $ | ( | ) | $ | |||||
The Company is not significantly reliant upon any single customer for the years ended December 31, 2019, 2018, or 2017. Most of the Company's merchant customers were referred to the Company by an ISO or other referral partners. Some of these ISOs have merchant portability rights whereby the ISO can move certain merchant relationships to another merchant acquirer upon notice to the Company and completion of a "wind down" period. In the years ended December 31, 2019, 2018, and 2017, merchants referred by one ISO organizations with merchant portability rights generated approximately 18 %, 14 % and 10 % of the Company's consolidated revenues.
Total assets, all located in the United States, by reportable segment reconciled to consolidated assets as of December 31, 2019 and 2018 were as follows:
(in thousands) | As of December 31, | |||||||
As restated - Note 2 | ||||||||
2019 | 2018 | |||||||
Consumer Payments | $ | $ | ||||||
Commercial Payments | ||||||||
Integrated Partners | ||||||||
Corporate | ||||||||
Total consolidated assets | $ | $ | ||||||
Assets in Corporate at December 31, 2019 and 2018 primarily represent internally-developed software and net deferred income tax assets. Substantially all assets related to business operations are assigned to one of the Company's three reportable segments even though some of those assets result in Corporate expenses.
19. (LOSS) EARNINGS PER SHARE
As a result of the Recapitalization, the Company has retrospectively adjusted the weighted-average Class A units outstanding prior to July 25, 2018 by multiplying them by the exchange ratio used to determine the number of Class A common stock into which they converted.
117
The following tables set forth the computation of the Company's (loss) earnings per share:
(in thousands except per share amounts) | Year Ended December 31, | ||||||||||
As restated - Note 2 | As restated - Note 2 | ||||||||||
2019 | 2018 | 2017 | |||||||||
Numerator: | |||||||||||
Net (loss) income | $ | ( | ) | $ | ( | ) | $ | ||||
Less: Income allocated to participating securities | ( | ) | ( | ) | |||||||
Net (loss) income available to common stockholders | $ | ( | ) | $ | ( | ) | $ | ||||
Denominator: | |||||||||||
Weighted-average common shares outstanding - basic and diluted | |||||||||||
Basic and diluted (loss) earnings per share | $ | ( | ) | $ | ( | ) | $ | ||||
Anti-dilutive securities that were excluded from EPS that could potentially be dilutive in future periods are as follows:
(in thousands) | As of December 31, | |||||||
2019 | 2018 | 2017 | ||||||
Stock options | ||||||||
Restricted stock awards | ||||||||
Earnout incentive awards subject to vesting | ||||||||
Warrants on common stock (see Note 14, Stockholders' Deficit Information) | ||||||||
Earnout incentive awards subject to issuance | ||||||||
Total | ||||||||
20. SELECTED QUARTERLY FINANCIAL RESULTS (UNAUDITED)
The Company's consolidated financial statements for all annual reporting periods presented elsewhere in this Annual Report on Form 10-K reflect the full retrospective adoption of the new revenue accounting standard, ASC 606 (see Note 1, Nature of Business and Accounting Policies).
As an emerging growth company, the Company elected to take advantage of the extended transition provisions for the adoption of ASC 606. As a result, unaudited quarterly financial results previously reported by the Company in its Unaudited Condensed Consolidated Statements of Operations included in its Form 10-Q for each of the first three quarterly periods of 2019, and the applicable year-to-date reporting periods and comparative prior-period reporting periods presented in each of these Form 10-Q, were not required to reflect the adoption of ASC 606 and were therefore presented using a different basis of accounting than the basis used to prepare the consolidated financial statements for all annual reporting periods presented.
The following tables show a summary of the Company's quarterly financial information for each of: 1) the four quarters of 2019 as effected for the full retrospective adoption of ASC 606 (see the section "Accounting Principles Adopted in 2019" in Note 1, Nature of Business and Accounting Principles) and 2) the four quarters of 2018 for the full retrospective adoption of ASC 606 and the correction of errors (see Note 2, Restatement of Previously Issued Consolidated Financial Statements).
118
(in thousands, except per share amounts) | 2019 - As recasted | |||||||||||||||||||
1Q | 2Q | 3Q | 4Q | Year | ||||||||||||||||
Revenues prior to ASC 606 | $ | $ | $ | $ | $ | |||||||||||||||
Full retrospective adoption of ASC 606 (1) | ( | ) | ( | ) | ( | ) | ( | ) | ( | ) | ||||||||||
Revenues, adjusted | $ | $ | $ | $ | $ | |||||||||||||||
Operating expenses prior to ASC 606 | $ | $ | $ | $ | $ | |||||||||||||||
Full retrospective adoption of ASC 606 (1) | ( | ) | ( | ) | ( | ) | ( | ) | ( | ) | ||||||||||
Operating expenses, adjusted | $ | $ | $ | $ | $ | |||||||||||||||
Income from operations | $ | $ | $ | $ | $ | |||||||||||||||
Interest expense | ( | ) | ( | ) | ( | ) | ( | ) | ( | ) | ||||||||||
Other, net | ||||||||||||||||||||
Income tax (benefit) expense | ( | ) | ( | ) | ( | ) | ||||||||||||||
Net loss | $ | ( | ) | $ | ( | ) | $ | ( | ) | $ | ( | ) | $ | ( | ) | |||||
Basic and diluted loss per common share (2) | $ | ( | ) | $ | ( | ) | $ | ( | ) | $ | ( | ) | $ | ( | ) | |||||
(in thousands, except per share amounts) | 2018 - As restated | |||||||||||||||||||
1Q | 2Q | 3Q | 4Q | Year | ||||||||||||||||
Revenues prior to ASC 606 and error corrections | $ | $ | $ | $ | $ | |||||||||||||||
Full retrospective adoption of ASC 606 (1) | ( | ) | ( | ) | ( | ) | ( | ) | ( | ) | ||||||||||
Errors corrections (3) | ( | ) | ( | ) | ( | ) | ( | ) | ( | ) | ||||||||||
Revenues, restated | $ | $ | $ | $ | $ | |||||||||||||||
Operating expenses prior to ASC 606 and error corrections | $ | $ | $ | $ | $ | |||||||||||||||
Full retrospective adoption of ASC 606 (1) | ( | ) | ( | ) | ( | ) | ( | ) | ( | ) | ||||||||||
Error corrections (3) | ||||||||||||||||||||
Operating expenses, restated | $ | $ | $ | $ | $ | |||||||||||||||
Income from operations, restated | $ | $ | $ | $ | $ | |||||||||||||||
Interest expense | ( | ) | ( | ) | ( | ) | ( | ) | ( | ) | ||||||||||
Other, net | ( | ) | ( | ) | ( | ) | ( | ) | ||||||||||||
Income tax benefit, restated (3) | ( | ) | ( | ) | ( | ) | ||||||||||||||
Net loss, restated | $ | ( | ) | $ | ( | ) | $ | ( | ) | $ | ( | ) | $ | ( | ) | |||||
Basic and diluted loss per common share, restated (2) | $ | ( | ) | $ | ( | ) | $ | ( | ) | $ | ( | ) | $ | ( | ) | |||||
(1) See Note 1, Nature of Business and Accounting Policies.
(2) May not be additive to the net loss per common share amounts for the year due to the calculation provision of ASC 260, Earnings Per Share.
(3) Affected the Company's Consumer Payments reportable segment. See Note 2, Restatement of Previously Issued Consolidated Financial Statements, and Note 18, Segment Information.
119
21. SUBSEQUENT EVENTS
Amendments to Credit Agreements
On March 18, 2020, amendments were executed for the Senior Credit Agreement and the GS Credit Amendment. See Note 10, Long-Term Debt and Warrant Liability.
COVID-19 Pandemic (Coronavirus)
In December 2019, a novel strain of coronavirus (COVID-19) was reported to have surfaced in Wuhan, China. In January 2020, this coronavirus spread to other countries, including the U.S., and efforts to contain the spread of this coronavirus intensified. In March 2020, the World Health Organization declared the COVID-19 virus outbreak a global pandemic. The outbreak and any preventative or protective actions that governments or others may take in respect of this coronavirus may result in global business disruptions, including for the Company's customers and business partners, and in a period of business disruption, reduced customer demand and reduced operations. Any resulting financial impact cannot be reasonably estimated at this time but may materially affect the Company's business, financial condition, results of operations, and cash flows, despite the fact that such impacts may not be felt for a significant period of time. Although the Company is diligently working to ensure that it can operate with minimal disruption, prepare to mitigate the impact of the outbreak on the Company's employees’ health and safety, and address potential business interruptions on the Company and its customers, the full extent to which the coronavirus could affect the global and U.S. economies and the Company will depend on future developments and factors that cannot be predicted.
120
ITEM 9. CHANGES IN AND DISAGREEMENTS WITH ACCOUNTANTS ON ACCOUNTING AND FINANCIAL DISCLOSURE
N/A
ITEM 9A. CONTROLS AND PROCEDURES
a) | Evaluation of Disclosure Controls and Procedures |
We maintain disclosure controls and procedures, as defined in Rules 13a-15(e) and 15d-15(e) of the Securities Exchange Act of 1934 (the "Exchange Act"), designed to provide reasonable assurance that information required to be disclosed by the Company in reports that it files or submits under the Exchange Act is recorded, processed, summarized or reported within the time periods specified in SEC rules and regulations and that such information is accumulated and communicated to our management, including our principal executive officer (CEO) and chief financial officer (CFO) and, as appropriate, to allow timely decisions regarding required disclosures.
Management, with the participation of the CEO and CFO, has evaluated the effectiveness of the Company's disclosure controls and procedures as of December 31, 2019. Based on that evaluation, the Company's CEO and CFO concluded that the Company's disclosure controls and procedures were not effective as of December 31, 2019 due to the material weaknesses in our internal control over financial reporting described in Report of Management on Internal Control Over Financial Reporting.
b) | Report of Management on Internal Control over Financial Reporting |
Our management is responsible for establishing and maintaining adequate internal control over financial reporting as defined in Rules 13a-15(f) and 15d-15(f) under the Securities Exchange Act of 1934. Our internal control over financial reporting is a process designed to provide reasonable assurance regarding the reliability of financial reporting and the preparation of financial statements for external purposes in accordance with generally accepted accounting principles. The Company's internal control over financial reporting includes those policies and procedures that:
(i) pertain to maintenance of records that, in reasonable detail, accurately and fairly reflect the transactions and disposition of the Company's assets;
(ii) provide reasonable assurance that transactions are recorded as necessary to permit preparation of financial statements in accordance with U.S. generally accepted accounting principles, and that receipts and expenditures of the Company are made only in accordance with authorizations of the Company's management and directors; and
(iii) provide reasonable assurance regarding prevention or timely detection of unauthorized acquisition, use or disposition of the Company's assets that could have a material effect on the financial statements.
Because of its inherent limitations, internal control over financial reporting may not prevent or detect all misstatements. Also, projections of any evaluation of effectiveness to future periods are subject to the risk that controls may become inadequate because of changes in conditions, or that the degree of compliance with the policies or procedures may deteriorate.
Management assessed the effectiveness of the Company's internal control over financial reporting as of December 31, 2019. In making this assessment, management used the criteria set forth by the Committee of Sponsoring Organizations of the Treadway Commission (COSO) in Internal Control-Integrated Framework. Based on this assessment, management determined that the Company did not maintain effective internal control over financial reporting as of December 31, 2019 due to lack of sufficient accounting and financial reporting resources, deficiencies in certain aspects of our financial statement review and close processes, and functional limitations of the accounting and financial reporting system. Specifically, the Company did not maintain adequate reconciliation processes and management oversight related to the accounting for certain settlement activities with the Company’s sponsor banks, merchants and ISOs and for the accounting for certain chargeback revenues and related costs in the correct accounting periods in accordance with U.S. GAAP. Also, certain accounting entries lacked sufficient supporting documentation and evidence of review. These control deficiencies resulted in misstatements to our annual or interim financial statements in reporting periods
121
in 2018, 2017, and prior periods. These control deficiencies constitute material weaknesses and could result in a material misstatement in our annual or interim consolidated financial statements in the future.
A material weakness is a deficiency, or a combination of deficiencies, in internal control over financial reporting such that there is a reasonable possibility that a material misstatement of the annual or interim financial statements will not be prevented or detected on a timely basis.
(c) Remediation of Material Weakness
As a result of these weaknesses, in December 2018 the Company hired an experienced Chief Financial Officer with significant public accounting and reporting experience and throughout 2019 has hired additional accounting and finance staff with significant public accounting and reporting experience. We also engaged third party consultants to assist in the preparation of our financial statements and SEC disclosures.
Beginning in 2019, we also began to implement additional policies and procedures to enhance our internal controls with respect to timely reconciliations. As we continue to evaluate and improve our internal control over financial reporting, additional measures to remediate the material weaknesses or modifications to certain of the remediation procedures described above may be necessary, including improvements to, or replacement of the accounting and financial reporting system.
Management is committed to improving our internal control processes and meets with our Audit Committee on a regular basis to monitor the status of remediation activities. Management believes that, once fully completed, the measures described above should remediate the material weaknesses identified and strengthen our internal control over financial reporting.
d) Attestation Report of Independent Registered Public Accounting Firm
Not applicable due to the Company’s status as an Emerging Growth Company and a non-accelerated filer.
e) Changes in Internal Control over Financial Reporting
There were no changes in the Company’s internal control over financial reporting during the fourth quarter of 2019 that have materially affected, or are reasonably likely to materially affect, the Company's internal control over financial reporting. Subsequent to 2017 and in connection with the identification of the material weakness described above, the Company has taken, or plans to take a number of remediation activities designed to remediate such material weakness, as described above.
ITEM 9B. OTHER INFORMATION
N/A
122
PART III.
ITEM 10. DIRECTORS, EXECUTIVE OFFICERS AND CORPORATE GOVERNANCE
The information called for by Item 10 is incorporated herein by reference to the definitive proxy statement relating to the Company's 2020 Annual Meeting of Stockholders. We intend to file such definitive proxy statement with the SEC pursuant to Regulation 14A within 120 days of the end of the fiscal year covered by this Annual Report on Form 10-K.
ITEM 11. EXECUTIVE COMPENSATION
The information called for by Item 11 is incorporated herein by reference to the definitive proxy statement referenced above in Item 10.
ITEM 12. SECURITY OWNERSHIP OF CERTAIN BENEFICIAL OWNERS AND MANAGEMENT AND RELATED STOCKHOLDER MATTERS
The information called for by Item 12 is incorporated herein by reference to the definitive proxy statement referenced above in Item 10.
ITEM 13. CERTAIN RELATIONSHIPS AND RELATED TRANSACTIONS, AND DIRECTOR INDEPENDENCE
The information called for by Item 13 is incorporated herein by reference to the definitive proxy statement referenced above in Item 10.
ITEM 14. PRINCIPAL ACCOUNTING FEES AND SERVICES
The information called for by Item 14 is incorporated herein by reference to the definitive proxy statement referenced above in Item 10.
123
PART IV.
ITEM 15. EXHIBITS, FINANCIAL STATEMENT SCHEDULES
(a) (1) Our consolidated financial statements listed below are set forth in "Item 8 - Financial Statements and Supplementary Data" of this Annual Report on Form 10-K:
Page | |
(2) Financial Statement Schedules
N/A
(b) Exhibits
Exhibit | Description | |
4.5 * | ||
124
10.5 † | ||
125
23.1 * | ||
31.1 * | ||
31.2 * | ||
32 ** | ||
101.INS * | XBRL Instance Document - the instance document does not appear in the Interactive Data File because its XBRL tags are embedded within the Inline XBRL document. | |
101.SCH * | XBRL Taxonomy Extension Schema Document | |
101.CAL * | XBRL Taxonomy Extension Calculation Linkbase Document | |
101.LAB * | XBRL Taxonomy Extension Label Linkbase Document | |
101.PRE * | XBRL Taxonomy Extension Presentation Linkbase Document | |
101.DEF * | XBRL Taxonomy Extension Definition Linkbase Document | |
* Filed herewith
** Furnished herewith
† Indicates exhibits that constitute management contracts or compensation plans or arrangements.
ITEM 16. FORM 10-K SUMMARY
None.
126
SIGNATURES
Pursuant to the requirements of Section 13 or 15(d) of the Securities Exchange Act of 1934, the registrant has duly caused this report to be signed on its behalf by the undersigned, thereunto duly authorized.
PRIORITY TECHNOLOGY HOLDINGS, INC.
March 30, 2020 | /s/ Thomas C. Priore Thomas C. Priore President, Chief Executive Officer and Chairman (Principal Executive Officer) |
Pursuant to the requirements of the Securities Exchange Act of 1934, this report has been signed below by the following persons on behalf of the registrant and in the capacities and on the dates indicated.
Signature | Title | Date |
/s/ Thomas C. Priore Thomas C. Priore | President, Chief Executive Officer and Chairman (Principal Executive Officer) | March 30, 2020 |
/s/ Michael Vollkommer Michael Vollkommer | Chief Financial Officer (Principal Financial Officer) | March 30, 2020 |
/s/ Pamela Teft Pamela Teft | Controller and Chief Accounting Officer (Principal Accounting Officer) | March 30, 2020 |
/s/ John Priore | Vice-Chairman | March 30, 2020 |
John Priore | ||
/s/ Michael Passilla Michael Passilla | Director | March 30, 2020 |
/s/ William Gahan William Gahan | Director | March 30, 2020 |
/s/ Matthew Kearney Matthew Kearney | Director | March 30, 2020 |
/s/ Christina M. Favilla Christina M. Favilla | Director | March 30, 2020 |
127