11827321P90DP90DP90D659296441143901900016510522022FYP3YP3YP7YP3YP7Yfalse65320124P90DP90DP90DP90DP90DP90DP90DP90DP90DP90DP90D0.00501.000001651052us-gaap:CommonClassBMember2022-08-012022-08-310001651052us-gaap:CommonClassBMember2022-05-012022-05-310001651052us-gaap:CommonClassAMember2022-11-012022-11-300001651052us-gaap:CommonClassAMember2022-08-012022-08-310001651052us-gaap:CommonClassAMember2022-05-012022-05-310001651052us-gaap:CommonClassAMember2022-03-012022-03-310001651052us-gaap:CommonClassBMember2022-11-012022-11-300001651052us-gaap:CommonClassBMember2022-04-012022-04-300001651052us-gaap:CommonClassBMember2022-02-012022-02-280001651052us-gaap:RetainedEarningsMember2022-12-310001651052us-gaap:ParentMember2022-12-310001651052us-gaap:NoncontrollingInterestMember2022-12-310001651052us-gaap:AdditionalPaidInCapitalMember2022-12-310001651052us-gaap:AccumulatedOtherComprehensiveIncomeMember2022-12-310001651052us-gaap:RetainedEarningsMember2021-12-310001651052us-gaap:ParentMember2021-12-310001651052us-gaap:NoncontrollingInterestMember2021-12-310001651052us-gaap:AdditionalPaidInCapitalMember2021-12-310001651052us-gaap:AccumulatedOtherComprehensiveIncomeMember2021-12-310001651052us-gaap:RetainedEarningsMember2020-12-310001651052us-gaap:ParentMember2020-12-310001651052us-gaap:NoncontrollingInterestMember2020-12-310001651052us-gaap:AdditionalPaidInCapitalMember2020-12-310001651052us-gaap:AccumulatedOtherComprehensiveIncomeMember2020-12-310001651052us-gaap:RetainedEarningsMember2019-12-310001651052us-gaap:ParentMember2019-12-310001651052us-gaap:NoncontrollingInterestMember2019-12-310001651052us-gaap:AdditionalPaidInCapitalMember2019-12-310001651052us-gaap:AccumulatedOtherComprehensiveIncomeMember2019-12-310001651052us-gaap:CommonClassBMemberus-gaap:CommonStockMember2022-12-310001651052us-gaap:CommonClassAMemberus-gaap:CommonStockMember2022-12-310001651052us-gaap:CommonClassBMemberus-gaap:CommonStockMember2021-12-310001651052us-gaap:CommonClassAMemberus-gaap:CommonStockMember2021-12-310001651052us-gaap:CommonClassBMemberus-gaap:CommonStockMember2020-12-310001651052us-gaap:CommonClassAMemberus-gaap:CommonStockMember2020-12-310001651052us-gaap:CommonClassBMemberus-gaap:CommonStockMember2019-12-310001651052us-gaap:CommonClassAMemberus-gaap:CommonStockMember2019-12-310001651052focs:SharePriceUseIsEqualToOrLessThan33.00Memberfocs:MarketConditionBasedAwardsMemberus-gaap:IPOMember2022-03-310001651052focs:SharePriceUseIs110.00Memberfocs:MarketConditionBasedAwardsMemberus-gaap:IPOMember2022-03-310001651052us-gaap:EmployeeStockOptionMemberus-gaap:CommonStockMember2022-12-310001651052us-gaap:EmployeeStockOptionMemberus-gaap:CommonStockMember2021-12-310001651052us-gaap:EmployeeStockOptionMemberus-gaap:CommonStockMember2020-12-310001651052us-gaap:EmployeeStockOptionMemberus-gaap:CommonStockMember2019-12-310001651052focs:FocusLLCRestrictedCommonUnitsMember2022-12-310001651052us-gaap:RestrictedStockUnitsRSUMember2021-12-310001651052focs:FocusLLCRestrictedCommonUnitsMember2021-12-310001651052us-gaap:RestrictedStockUnitsRSUMember2020-12-310001651052focs:FocusLLCRestrictedCommonUnitsMember2020-12-310001651052us-gaap:RestrictedStockUnitsRSUMember2019-12-310001651052us-gaap:RestrictedStockUnitsRSUMember2021-01-012021-12-310001651052focs:FocusLLCRestrictedCommonUnitsMember2021-01-012021-12-310001651052us-gaap:RestrictedStockUnitsRSUMember2020-01-012020-12-310001651052focs:FocusLLCRestrictedCommonUnitsMember2020-01-012020-12-310001651052focs:MarketConditionBasedAwardsMemberus-gaap:CommonClassAMember2018-07-012018-07-310001651052us-gaap:EmployeeStockOptionMemberus-gaap:CommonStockMember2022-01-012022-12-310001651052us-gaap:EmployeeStockOptionMemberus-gaap:CommonStockMember2021-01-012021-12-310001651052us-gaap:EmployeeStockOptionMemberus-gaap:CommonStockMember2020-01-012020-12-310001651052srt:MaximumMemberus-gaap:EmployeeStockOptionMemberfocs:OmnibusIncentivePlan2018Memberus-gaap:CommonClassAMember2018-07-300001651052focs:IncentiveUnitsMemberfocs:HurdleRate9.00Member2022-12-310001651052focs:IncentiveUnitsMemberfocs:HurdleRate7.00Member2022-12-310001651052focs:IncentiveUnitsMemberfocs:HurdleRate6.00Member2022-12-310001651052focs:IncentiveUnitsMemberfocs:HurdleRate58.50Member2022-12-310001651052focs:IncentiveUnitsMemberfocs:HurdleRate5.50Member2022-12-310001651052focs:IncentiveUnitsMemberfocs:HurdleRate44.71Member2022-12-310001651052focs:IncentiveUnitsMemberfocs:HurdleRate43.50Member2022-12-310001651052focs:IncentiveUnitsMemberfocs:HurdleRate43.07Member2022-12-310001651052focs:IncentiveUnitsMemberfocs:HurdleRate37.59Member2022-12-310001651052focs:IncentiveUnitsMemberfocs:HurdleRate36.64Member2022-12-310001651052focs:IncentiveUnitsMemberfocs:HurdleRate33.00Member2022-12-310001651052focs:IncentiveUnitsMemberfocs:HurdleRate30.48Member2022-12-310001651052focs:IncentiveUnitsMemberfocs:HurdleRate28.50Member2022-12-310001651052focs:IncentiveUnitsMemberfocs:HurdleRate27.90Member2022-12-310001651052focs:IncentiveUnitsMemberfocs:HurdleRate27.00Member2022-12-310001651052focs:IncentiveUnitsMemberfocs:HurdleRate26.26Member2022-12-310001651052focs:IncentiveUnitsMemberfocs:HurdleRate23.00Member2022-12-310001651052focs:IncentiveUnitsMemberfocs:HurdleRate22.00Member2022-12-310001651052focs:IncentiveUnitsMemberfocs:HurdleRate21.00Member2022-12-310001651052focs:IncentiveUnitsMemberfocs:HurdleRate19.00Member2022-12-310001651052focs:IncentiveUnitsMemberfocs:HurdleRate17.00Member2022-12-310001651052focs:IncentiveUnitsMemberfocs:HurdleRate16.00Member2022-12-310001651052focs:IncentiveUnitsMemberfocs:HurdleRate14.00Member2022-12-310001651052focs:IncentiveUnitsMemberfocs:HurdleRate13.00Member2022-12-310001651052focs:IncentiveUnitsMemberfocs:HurdleRate12.00Member2022-12-310001651052focs:IncentiveUnitsMemberfocs:HurdleRate11.00Member2022-12-310001651052focs:IncentiveUnitsMemberfocs:HurdleRate1.42Member2022-12-310001651052focs:TimeBasedIncentiveUnitsMember2021-01-012021-12-310001651052focs:TimeBasedAwardsMember2021-01-012021-12-310001651052focs:TimeBasedIncentiveUnitsMember2020-01-012020-12-310001651052focs:TimeBasedAwardsMember2020-01-012020-12-310001651052focs:ThirdAnniversaryOfCompanySIpoScenarioTwoMember2021-07-310001651052focs:ThirdAnniversaryOfCompanySIpoScenarioOneMember2021-07-310001651052focs:IndividualsOtherThanCertainOfficersMemberfocs:IncentiveUnitsMember2021-02-280001651052focs:IncentiveUnitsMemberus-gaap:ShareBasedPaymentArrangementNonemployeeMember2021-02-280001651052focs:ThirdAnniversaryOfCompanySIpoScenarioTwoMember2021-07-012021-07-310001651052focs:ThirdAnniversaryOfCompanySIpoScenarioOneMember2021-07-012021-07-310001651052focs:SharePriceUseIsEqualToOrLessThan33.00Memberfocs:MarketConditionBasedAwardsMemberus-gaap:IPOMember2022-03-012022-03-310001651052focs:SharePriceUseIs110.00Memberfocs:MarketConditionBasedAwardsMemberus-gaap:IPOMember2022-03-012022-03-310001651052focs:IncentiveUnitsMemberus-gaap:ShareBasedPaymentArrangementNonemployeeMemberfocs:ShareBasedPaymentArrangementVestingConditionsIfWeightedAveragePricePerShareWasLessThan42Member2021-02-012021-02-280001651052focs:IncentiveUnitsMemberus-gaap:ShareBasedPaymentArrangementNonemployeeMemberfocs:ShareBasedPaymentArrangementVestingConditionsIfWeightedAveragePricePerShareWasBetweenThan42And63Member2021-02-012021-02-280001651052focs:TimeBasedAwardsMember2022-01-012022-12-310001651052focs:FocusLLCRestrictedCommonUnitsMember2022-01-012022-12-310001651052us-gaap:NonUsMember2022-01-012022-12-310001651052focs:WealthManagementServicesMember2022-01-012022-12-310001651052focs:OtherServicesMember2022-01-012022-12-310001651052country:US2022-01-012022-12-310001651052us-gaap:NonUsMember2021-01-012021-12-310001651052focs:WealthManagementServicesMember2021-01-012021-12-310001651052focs:OtherServicesMember2021-01-012021-12-310001651052country:US2021-01-012021-12-310001651052us-gaap:NonUsMember2020-01-012020-12-310001651052focs:WealthManagementServicesMember2020-01-012020-12-310001651052focs:OtherServicesMember2020-01-012020-12-310001651052country:US2020-01-012020-12-310001651052srt:ChiefExecutiveOfficerMember2022-01-012022-12-310001651052srt:ChiefExecutiveOfficerMember2021-01-012021-12-310001651052srt:ChiefExecutiveOfficerMember2020-01-012020-12-310001651052srt:MinimumMemberus-gaap:FurnitureAndFixturesMember2022-01-012022-12-310001651052srt:MinimumMemberus-gaap:EquipmentMember2022-01-012022-12-310001651052srt:MinimumMemberus-gaap:CustomerRelationshipsMember2022-01-012022-12-310001651052srt:MinimumMemberus-gaap:ContractBasedIntangibleAssetsMember2022-01-012022-12-310001651052srt:MinimumMemberus-gaap:ComputerEquipmentMember2022-01-012022-12-310001651052srt:MaximumMemberus-gaap:FurnitureAndFixturesMember2022-01-012022-12-310001651052srt:MaximumMemberus-gaap:EquipmentMember2022-01-012022-12-310001651052srt:MaximumMemberus-gaap:CustomerRelationshipsMember2022-01-012022-12-310001651052srt:MaximumMemberus-gaap:ContractBasedIntangibleAssetsMember2022-01-012022-12-310001651052srt:MaximumMemberus-gaap:ComputerEquipmentMember2022-01-012022-12-310001651052us-gaap:LeaseholdsAndLeaseholdImprovementsMember2022-12-310001651052us-gaap:FurnitureAndFixturesMember2022-12-310001651052focs:ComputersSoftwareDevelopmentAndEquipmentMember2022-12-310001651052us-gaap:LeaseholdsAndLeaseholdImprovementsMember2021-12-310001651052us-gaap:FurnitureAndFixturesMember2021-12-310001651052focs:ComputersSoftwareDevelopmentAndEquipmentMember2021-12-310001651052us-gaap:RetainedEarningsMember2022-01-012022-12-310001651052us-gaap:RetainedEarningsMember2021-01-012021-12-310001651052us-gaap:RetainedEarningsMember2020-01-012020-12-310001651052focs:WealthManagementBusinessMemberus-gaap:SubsequentEventMember2023-01-012023-02-160001651052focs:FirstLienTermLoanTrancheMember2021-01-012021-07-310001651052focs:CertainHoldersOfClassCommonStockAndClassBCommonStockMemberfocs:FirstLienTermLoanMember2022-01-012022-12-310001651052focs:FirstLienRevolvingCreditFacilityMember2022-01-012022-12-310001651052focs:CertainHoldersOfClassCommonStockAndClassBCommonStockMemberfocs:FirstLienTermLoanMember2021-01-012021-12-310001651052us-gaap:AccumulatedOtherComprehensiveIncomeMember2022-01-012022-12-310001651052us-gaap:AccumulatedOtherComprehensiveIncomeMember2021-01-012021-12-310001651052us-gaap:AccumulatedOtherComprehensiveIncomeMember2020-01-012020-12-310001651052focs:FirstLienRevolvingCreditFacilityMember2022-11-012022-11-300001651052focs:FirstLienRevolverStepDownTwoMember2022-11-012022-11-300001651052focs:FirstLienRevolverStepDownOneMember2022-11-012022-11-300001651052focs:FirstLienTermLoanBTrancheBMember2022-11-012022-11-300001651052focs:FirstLienRevolvingCreditFacilityMember2022-11-300001651052us-gaap:StandbyLettersOfCreditMember2022-01-012022-12-310001651052us-gaap:StandbyLettersOfCreditMember2021-01-012021-12-310001651052us-gaap:StandbyLettersOfCreditMember2022-12-310001651052us-gaap:StandbyLettersOfCreditMember2021-12-310001651052focs:PrepaidExpensesAndOtherAssetsMemberus-gaap:InterestRateSwapMember2022-12-310001651052focs:ContingentConsiderationAndOtherLiabilitiesMemberus-gaap:InterestRateSwapMember2021-12-310001651052focs:FirstLienTermLoanBAndFirstLienTermLoanMember2022-01-012022-12-310001651052us-gaap:OtherIntangibleAssetsMember2022-12-310001651052us-gaap:CustomerRelationshipsMember2022-12-310001651052us-gaap:ContractBasedIntangibleAssetsMember2022-12-310001651052us-gaap:OtherIntangibleAssetsMember2021-12-310001651052us-gaap:CustomerRelationshipsMember2021-12-310001651052us-gaap:ContractBasedIntangibleAssetsMember2021-12-310001651052focs:MarketConditionBasedAwardsMemberus-gaap:IPOMember2022-03-310001651052focs:MarketBasedIncentiveUnitsMemberus-gaap:IPOMember2022-03-310001651052us-gaap:ShareBasedPaymentArrangementNonemployeeMember2021-02-280001651052us-gaap:RestrictedStockUnitsRSUMember2022-01-012022-12-310001651052us-gaap:EmployeeStockOptionMember2022-01-012022-12-310001651052focs:RestrictedCommonUnitsMember2022-01-012022-12-310001651052us-gaap:RestrictedStockUnitsRSUMember2022-12-310001651052us-gaap:EmployeeStockOptionMember2022-12-310001651052focs:RestrictedCommonUnitsMember2022-12-310001651052us-gaap:InterestRateSwapMember2022-11-300001651052us-gaap:InterestRateSwapMember2022-12-310001651052us-gaap:InterestRateSwapMember2021-12-310001651052us-gaap:InterestRateSwapMemberus-gaap:SecuredOvernightFinancingRateSofrOvernightIndexSwapRateMember2022-12-310001651052us-gaap:InterestRateSwapMemberus-gaap:LondonInterbankOfferedRateLiborSwapRateMember2021-12-310001651052focs:CompensationAndRelatedExpensesMember2022-01-012022-12-310001651052focs:CompensationAndRelatedExpensesMember2021-01-012021-12-310001651052focs:CompensationAndRelatedExpensesMember2020-01-012020-12-310001651052focs:ThenExistingFirstLienTermLoanBTrancheMember2022-11-300001651052focs:FirstLienTermLoanBTrancheMember2021-12-310001651052focs:FirstLienTermLoanBTrancheBMember2021-12-310001651052focs:FirstLienRevolvingCreditFacilityMember2021-12-310001651052focs:FirstLienTermLoanTrancheMemberus-gaap:FairValueInputsLevel2Member2022-12-310001651052focs:FirstLienTermLoanTrancheBMemberus-gaap:FairValueInputsLevel2Member2022-12-310001651052focs:FirstLienTermLoanTrancheMemberus-gaap:FairValueInputsLevel2Member2021-12-310001651052focs:FirstLienTermLoanTrancheBMemberus-gaap:FairValueInputsLevel2Member2021-12-310001651052focs:FirstLienTermLoanBTrancheMember2022-12-310001651052focs:FirstLienTermLoanBTrancheBMember2022-12-310001651052focs:FirstLienTermLoanBMember2022-12-310001651052focs:FirstLienRevolvingCreditFacilityMember2022-12-310001651052focs:FirstsLienTermLoanMember2022-11-300001651052focs:FirstLienTermLoanBTrancheMember2022-11-300001651052focs:FirstsLienTermLoanMemberus-gaap:SecuredOvernightFinancingRateSofrOvernightIndexSwapRateMember2022-11-012022-11-300001651052focs:FirstsLienTermLoanMemberus-gaap:BaseRateMember2022-11-012022-11-300001651052focs:FirstLienTermLoanBTrancheMemberus-gaap:SecuredOvernightFinancingRateSofrOvernightIndexSwapRateMember2022-11-012022-11-300001651052focs:FirstLienTermLoanBTrancheMemberus-gaap:BaseRateMember2022-11-012022-11-300001651052focs:FirstLienTermLoanBTrancheBMemberus-gaap:SecuredOvernightFinancingRateSofrOvernightIndexSwapRateMember2022-11-012022-11-300001651052focs:FirstLienTermLoanBTrancheBMemberus-gaap:BaseRateMember2022-11-012022-11-300001651052focs:FirstLienRevolvingCreditFacilityMemberus-gaap:SecuredOvernightFinancingRateSofrOvernightIndexSwapRateMember2022-11-012022-11-300001651052focs:FirstLienRevolverStepDownTwoMemberus-gaap:SecuredOvernightFinancingRateSofrOvernightIndexSwapRateMember2022-11-012022-11-300001651052focs:FirstLienRevolverStepDownTwoMemberus-gaap:BaseRateMember2022-11-012022-11-300001651052focs:FirstLienRevolverStepDownOneMemberus-gaap:SecuredOvernightFinancingRateSofrOvernightIndexSwapRateMember2022-11-012022-11-300001651052focs:FirstLienRevolvingCreditFacilityMemberus-gaap:BaseRateMember2022-10-012022-12-310001651052focs:FirstLienRevolverStepDownOneMemberus-gaap:BaseRateMember2022-10-012022-10-310001651052us-gaap:MemberUnitsMember2022-12-310001651052us-gaap:CommonClassBMember2021-12-310001651052us-gaap:CommonClassAMember2021-12-3100016510522019-12-310001651052us-gaap:SeriesOfIndividuallyImmaterialBusinessAcquisitionsMember2021-12-310001651052us-gaap:SeriesOfIndividuallyImmaterialBusinessAcquisitionsMember2020-12-310001651052us-gaap:SeriesOfIndividuallyImmaterialBusinessAcquisitionsMemberus-gaap:OtherIntangibleAssetsMember2022-12-310001651052us-gaap:SeriesOfIndividuallyImmaterialBusinessAcquisitionsMemberus-gaap:CustomerRelationshipsMember2022-12-310001651052us-gaap:SeriesOfIndividuallyImmaterialBusinessAcquisitionsMemberus-gaap:ContractBasedIntangibleAssetsMember2022-12-310001651052us-gaap:SeriesOfIndividuallyImmaterialBusinessAcquisitionsMemberus-gaap:OtherIntangibleAssetsMember2021-12-310001651052us-gaap:SeriesOfIndividuallyImmaterialBusinessAcquisitionsMemberus-gaap:CustomerRelationshipsMember2021-12-310001651052us-gaap:SeriesOfIndividuallyImmaterialBusinessAcquisitionsMemberus-gaap:ContractBasedIntangibleAssetsMember2021-12-310001651052us-gaap:SeriesOfIndividuallyImmaterialBusinessAcquisitionsMemberus-gaap:OtherIntangibleAssetsMember2020-12-310001651052us-gaap:SeriesOfIndividuallyImmaterialBusinessAcquisitionsMemberus-gaap:CustomerRelationshipsMember2020-12-310001651052us-gaap:SeriesOfIndividuallyImmaterialBusinessAcquisitionsMemberus-gaap:ContractBasedIntangibleAssetsMember2020-12-310001651052srt:MinimumMemberus-gaap:FairValueInputsLevel3Memberus-gaap:ValuationTechniqueOptionPricingModelMember2022-12-310001651052srt:MaximumMemberus-gaap:FairValueInputsLevel3Memberus-gaap:ValuationTechniqueOptionPricingModelMember2022-12-310001651052srt:MinimumMemberus-gaap:FairValueInputsLevel3Memberus-gaap:ValuationTechniqueOptionPricingModelMember2021-12-310001651052srt:MaximumMemberus-gaap:FairValueInputsLevel3Memberus-gaap:ValuationTechniqueOptionPricingModelMember2021-12-310001651052us-gaap:FairValueInputsLevel3Member2022-12-310001651052us-gaap:FairValueInputsLevel3Member2021-12-310001651052focs:FocusFinancialPartnersLLCMemberus-gaap:SeriesOfIndividuallyImmaterialBusinessAcquisitionsMember2022-01-012022-12-310001651052us-gaap:SeriesOfIndividuallyImmaterialBusinessAcquisitionsMemberus-gaap:CommonClassAMember2021-01-012021-12-310001651052focs:FocusFinancialPartnersLLCMemberus-gaap:SeriesOfIndividuallyImmaterialBusinessAcquisitionsMember2021-01-012021-12-310001651052us-gaap:SeriesOfIndividuallyImmaterialBusinessAcquisitionsMember2022-12-310001651052us-gaap:PrepaidExpensesAndOtherCurrentAssetsMemberus-gaap:InterestRateSwapMember2022-12-310001651052us-gaap:PrepaidExpensesAndOtherCurrentAssetsMemberus-gaap:InterestRateSwapMember2021-12-310001651052focs:FirstsLienTermLoanMember2022-12-012022-12-310001651052us-gaap:EmployeeStockOptionMemberus-gaap:CommonClassAMember2022-01-012022-12-310001651052us-gaap:EmployeeStockOptionMemberus-gaap:CommonClassAMember2021-01-012021-12-310001651052us-gaap:ShareBasedPaymentArrangementNonemployeeMember2021-01-012021-12-310001651052us-gaap:EmployeeStockOptionMemberus-gaap:CommonClassAMember2020-01-012020-12-310001651052us-gaap:SeriesOfIndividuallyImmaterialAssetAcquisitionsMemberus-gaap:OtherIntangibleAssetsMember2022-01-012022-12-310001651052us-gaap:SeriesOfIndividuallyImmaterialAssetAcquisitionsMemberus-gaap:CustomerRelationshipsMember2022-01-012022-12-310001651052us-gaap:SeriesOfIndividuallyImmaterialAssetAcquisitionsMemberus-gaap:ContractBasedIntangibleAssetsMember2022-01-012022-12-310001651052us-gaap:SeriesOfIndividuallyImmaterialAssetAcquisitionsMemberus-gaap:OtherIntangibleAssetsMember2021-01-012021-12-310001651052us-gaap:SeriesOfIndividuallyImmaterialAssetAcquisitionsMemberus-gaap:CustomerRelationshipsMember2021-01-012021-12-310001651052us-gaap:SeriesOfIndividuallyImmaterialAssetAcquisitionsMemberus-gaap:ContractBasedIntangibleAssetsMember2021-01-012021-12-310001651052us-gaap:SeriesOfIndividuallyImmaterialAssetAcquisitionsMemberus-gaap:OtherIntangibleAssetsMember2020-01-012020-12-310001651052us-gaap:SeriesOfIndividuallyImmaterialAssetAcquisitionsMemberus-gaap:CustomerRelationshipsMember2020-01-012020-12-310001651052us-gaap:SeriesOfIndividuallyImmaterialAssetAcquisitionsMemberus-gaap:ContractBasedIntangibleAssetsMember2020-01-012020-12-310001651052focs:CertainHoldersOfClassCommonStockAndClassBCommonStockMember2021-01-012021-12-310001651052us-gaap:CommonClassBMember2022-03-012022-03-310001651052us-gaap:CommonClassBMemberus-gaap:CommonStockMember2022-01-012022-12-310001651052us-gaap:CommonClassAMemberus-gaap:CommonStockMember2022-01-012022-12-310001651052us-gaap:CommonClassBMemberus-gaap:CommonStockMember2020-01-012020-12-310001651052us-gaap:CommonClassBMemberus-gaap:CommonStockMember2021-01-012021-12-310001651052us-gaap:CommonClassAMemberus-gaap:CommonStockMember2021-01-012021-12-310001651052focs:ShareBasedCompensationArrangementSharePriceUsedInChangeOfControlTransactionIsEqualToOrLessThan33.00Memberfocs:MarketBasedStockOptionsMember2022-01-012022-12-310001651052focs:ShareBasedCompensationArrangementSharePriceUsedInChangeOfControlTransactionIs110Memberfocs:MarketBasedStockOptionsMember2022-01-012022-12-310001651052focs:ShareBasedCompensationArrangementSharePriceUsedInChangeOfControlTransactionIsEqualToOrLessThan33.00Memberfocs:MarketBasedStockOptionsMember2021-01-012021-12-310001651052focs:ShareBasedCompensationArrangementSharePriceUsedInChangeOfControlTransactionIs110Memberfocs:MarketBasedStockOptionsMember2021-01-012021-12-310001651052focs:ShareBasedCompensationArrangementSharePriceUsedInChangeOfControlTransactionIsEqualToOrLessThan33.00Memberfocs:MarketBasedStockOptionsMember2020-01-012020-12-310001651052focs:ShareBasedCompensationArrangementSharePriceUsedInChangeOfControlTransactionIs110Memberfocs:MarketBasedStockOptionsMember2020-01-012020-12-310001651052focs:MarketConditionBasedAwardsMemberus-gaap:IPOMember2022-03-012022-03-310001651052focs:MarketBasedIncentiveUnitsMemberus-gaap:IPOMember2022-03-012022-03-310001651052focs:MarketBasedStockOptionsMember2022-01-012022-12-310001651052focs:MarketBasedStockOptionsMember2021-01-012021-12-310001651052focs:MarketBasedStockOptionsMember2020-01-012020-12-310001651052focs:ShareBasedCompensationArrangementHighest90DayVwapIs80OrLessMemberfocs:MarketConditionBasedAwardsMemberus-gaap:IPOMember2022-03-012022-03-310001651052focs:ShareBasedCompensationArrangementHighest90DayVwapIs80OrLessMemberfocs:MarketBasedIncentiveUnitsMemberus-gaap:IPOMember2022-03-012022-03-310001651052focs:ShareBasedCompensationArrangementHighest90DayVwapIs110OrMoreMemberfocs:MarketConditionBasedAwardsMemberus-gaap:IPOMember2022-03-012022-03-310001651052focs:ShareBasedCompensationArrangementHighest90DayVwapIs110OrMoreMemberfocs:MarketBasedIncentiveUnitsMemberus-gaap:IPOMember2022-03-012022-03-310001651052focs:ShareBasedCompensationArrangementHighest90DayVwapIs80OrLessMemberfocs:MarketBasedStockOptionsMemberus-gaap:IPOMember2022-01-012022-12-310001651052focs:ShareBasedCompensationArrangementHighest90DayVwapIs110OrMoreMemberfocs:MarketBasedStockOptionsMemberus-gaap:IPOMember2022-01-012022-12-310001651052srt:MinimumMemberfocs:IncentiveUnitsMemberus-gaap:ShareBasedPaymentArrangementNonemployeeMemberfocs:ShareBasedPaymentArrangementVestingConditionsIfWeightedAveragePricePerShareWasBetweenThan42And63Member2021-02-012021-02-280001651052srt:MaximumMemberfocs:IncentiveUnitsMemberus-gaap:ShareBasedPaymentArrangementNonemployeeMemberfocs:ShareBasedPaymentArrangementVestingConditionsIfWeightedAveragePricePerShareWasBetweenThan42And63Member2021-02-012021-02-280001651052srt:MinimumMemberus-gaap:ShareBasedPaymentArrangementNonemployeeMemberfocs:ShareBasedPaymentArrangementVestingConditionsIfWeightedAveragePricePerShareWasBetweenThan42And63Member2021-02-012021-02-280001651052srt:MaximumMemberus-gaap:ShareBasedPaymentArrangementNonemployeeMemberfocs:ShareBasedPaymentArrangementVestingConditionsIfWeightedAveragePricePerShareWasBetweenThan42And63Member2021-02-012021-02-280001651052focs:IncentiveUnitsMemberus-gaap:ShareBasedPaymentArrangementNonemployeeMemberfocs:ShareBasedPaymentArrangementVestingConditionsIfWeightedAveragePricePerShareWasGreaterThan63Member2021-02-012021-02-280001651052us-gaap:ShareBasedPaymentArrangementNonemployeeMemberfocs:ShareBasedPaymentArrangementVestingConditionsIfWeightedAveragePricePerShareWasLessThan42Member2021-02-012021-02-280001651052focs:ShareBasedCompensationArrangementHighest90DayVwapIs80OrLessMemberfocs:MarketBasedStockOptionsMemberus-gaap:IPOMember2021-01-012021-12-310001651052focs:ShareBasedCompensationArrangementHighest90DayVwapIs110OrMoreMemberfocs:MarketBasedStockOptionsMemberus-gaap:IPOMember2021-01-012021-12-310001651052focs:ShareBasedCompensationArrangementHighest90DayVwapIs80OrLessMemberfocs:MarketBasedStockOptionsMemberus-gaap:IPOMember2020-01-012020-12-310001651052focs:ShareBasedCompensationArrangementHighest90DayVwapIs110OrMoreMemberfocs:MarketBasedStockOptionsMemberus-gaap:IPOMember2020-01-012020-12-310001651052focs:MarketConditionBasedAwardsMember2018-07-012018-07-310001651052us-gaap:ShareBasedPaymentArrangementNonemployeeMember2021-02-012021-02-280001651052focs:IncentiveUnitsMember2020-01-012020-12-310001651052focs:IncentiveUnitsMemberfocs:HurdleRate9.00Member2022-01-012022-12-310001651052focs:IncentiveUnitsMemberfocs:HurdleRate7.00Member2022-01-012022-12-310001651052focs:IncentiveUnitsMemberfocs:HurdleRate6.00Member2022-01-012022-12-310001651052focs:IncentiveUnitsMemberfocs:HurdleRate58.50Member2022-01-012022-12-310001651052focs:IncentiveUnitsMemberfocs:HurdleRate5.50Member2022-01-012022-12-310001651052focs:IncentiveUnitsMemberfocs:HurdleRate44.71Member2022-01-012022-12-310001651052focs:IncentiveUnitsMemberfocs:HurdleRate43.50Member2022-01-012022-12-310001651052focs:IncentiveUnitsMemberfocs:HurdleRate43.07Member2022-01-012022-12-310001651052focs:IncentiveUnitsMemberfocs:HurdleRate37.59Member2022-01-012022-12-310001651052focs:IncentiveUnitsMemberfocs:HurdleRate36.64Member2022-01-012022-12-310001651052focs:IncentiveUnitsMemberfocs:HurdleRate33.00Member2022-01-012022-12-310001651052focs:IncentiveUnitsMemberfocs:HurdleRate30.48Member2022-01-012022-12-310001651052focs:IncentiveUnitsMemberfocs:HurdleRate28.50Member2022-01-012022-12-310001651052focs:IncentiveUnitsMemberfocs:HurdleRate27.90Member2022-01-012022-12-310001651052focs:IncentiveUnitsMemberfocs:HurdleRate27.00Member2022-01-012022-12-310001651052focs:IncentiveUnitsMemberfocs:HurdleRate26.26Member2022-01-012022-12-310001651052focs:IncentiveUnitsMemberfocs:HurdleRate23.00Member2022-01-012022-12-310001651052focs:IncentiveUnitsMemberfocs:HurdleRate22.00Member2022-01-012022-12-310001651052focs:IncentiveUnitsMemberfocs:HurdleRate21.00Member2022-01-012022-12-310001651052focs:IncentiveUnitsMemberfocs:HurdleRate19.00Member2022-01-012022-12-310001651052focs:IncentiveUnitsMemberfocs:HurdleRate17.00Member2022-01-012022-12-310001651052focs:IncentiveUnitsMemberfocs:HurdleRate16.00Member2022-01-012022-12-310001651052focs:IncentiveUnitsMemberfocs:HurdleRate14.00Member2022-01-012022-12-310001651052focs:IncentiveUnitsMemberfocs:HurdleRate13.00Member2022-01-012022-12-310001651052focs:IncentiveUnitsMemberfocs:HurdleRate12.00Member2022-01-012022-12-310001651052focs:IncentiveUnitsMemberfocs:HurdleRate11.00Member2022-01-012022-12-310001651052focs:IncentiveUnitsMemberfocs:HurdleRate1.42Member2022-01-012022-12-310001651052focs:IncentiveUnitsMember2019-12-310001651052focs:IncentiveUnitsMember2022-12-310001651052focs:IncentiveUnitsMember2021-12-310001651052focs:IncentiveUnitsMember2020-12-310001651052focs:IncentiveUnitsMember2021-01-012021-12-310001651052focs:TimeBasedIncentiveUnitsMember2022-01-012022-12-310001651052focs:IncentiveUnitsMember2022-01-012022-12-310001651052focs:ShareBasedCompensationArrangementExercisesOnAndFollowingDateOfVestingMemberfocs:MarketConditionBasedAwardsMemberus-gaap:IPOMember2022-03-012022-03-310001651052focs:ShareBasedCompensationArrangementExercisesOnAndFollowingDateOfVestingMemberfocs:MarketBasedIncentiveUnitsMemberus-gaap:IPOMember2022-03-012022-03-310001651052focs:ZeroToSixtyDaysFromClosingDateMemberfocs:FirstsLienTermLoanMember2022-11-012022-11-300001651052focs:SixtyOneDaysToOneHundredTwentyDaysFromClosingDateMemberfocs:FirstsLienTermLoanMember2022-11-012022-11-300001651052focs:AfterOneHundredTwentyOneDaysOfClosingDateMemberfocs:FirstsLienTermLoanMember2022-11-012022-11-300001651052srt:MaximumMemberus-gaap:EmployeeStockOptionMemberfocs:OmnibusIncentivePlan2018Memberus-gaap:CommonClassAMember2018-07-302018-07-3000016510522023-02-012023-02-280001651052us-gaap:SeriesOfIndividuallyImmaterialAssetAcquisitionsMember2022-12-310001651052us-gaap:CommonClassBMember2022-12-310001651052us-gaap:CommonClassAMember2022-12-3100016510522020-03-3100016510522018-07-310001651052focs:FirstLienTermLoanBTrancheMember2022-11-012022-11-300001651052us-gaap:CommonClassAMember2022-01-012022-12-310001651052us-gaap:CommonClassAMember2021-01-012021-12-310001651052us-gaap:CommonClassAMember2020-01-012020-12-310001651052focs:MarketBasedIncentiveUnitsMember2018-07-012018-07-310001651052us-gaap:CommonClassAMemberus-gaap:CommonStockMember2020-01-012020-12-310001651052srt:MaximumMemberus-gaap:LineOfCreditMember2022-01-012022-12-3100016510522020-12-310001651052focs:InterestRateSwapTwoMember2022-11-300001651052focs:InterestRateSwapThreeMember2022-11-300001651052focs:InterestRateSwapOneMember2022-11-300001651052focs:InterestRateSwapTwoMember2022-12-310001651052focs:InterestRateSwapThreeMember2022-12-310001651052focs:InterestRateSwapOneMember2022-12-310001651052us-gaap:InterestRateSwapMemberus-gaap:LondonInterbankOfferedRateLiborSwapRateMember2022-11-300001651052focs:FirstsLienTermLoanMember2022-12-310001651052focs:FirstsLienTermLoanMemberus-gaap:SecuredOvernightFinancingRateSofrOvernightIndexSwapRateMember2022-11-300001651052focs:FirstLienTermLoanBTrancheMemberus-gaap:SecuredOvernightFinancingRateSofrOvernightIndexSwapRateMember2022-11-300001651052focs:FirstLienTermLoanBTrancheBMemberus-gaap:SecuredOvernightFinancingRateSofrOvernightIndexSwapRateMember2022-11-300001651052focs:FirstsLienTermLoanMember2022-11-012022-11-300001651052focs:ShareBasedCompensationArrangementExercisesOnAndFollowingSecondAnniversaryOfDateOfVestingInJuly2026Memberfocs:MarketConditionBasedAwardsMemberus-gaap:IPOMember2022-03-012022-03-310001651052focs:ShareBasedCompensationArrangementExercisesOnAndFollowingSecondAnniversaryOfDateOfVestingInJuly2026Memberfocs:MarketBasedIncentiveUnitsMemberus-gaap:IPOMember2022-03-012022-03-310001651052focs:ShareBasedCompensationArrangementExercisesOnAndFollowingFirstAnniversaryOfDateOfVestingInJuly2025Memberfocs:MarketBasedIncentiveUnitsMemberus-gaap:IPOMember2022-03-012022-03-310001651052focs:ShareBasedCompensationArrangementExercisesOnAndFollowingFirstAnniversaryOfDateOfVestingInJuly2025Memberfocs:MarketConditionBasedAwardsMember2022-03-012022-03-310001651052us-gaap:LineOfCreditMember2021-01-012021-12-310001651052focs:FocusFinancialPartnersLLCMember2022-11-012022-11-300001651052focs:FocusFinancialPartnersLLCMember2022-08-012022-08-310001651052focs:FocusFinancialPartnersLLCMember2022-05-012022-05-310001651052focs:FocusFinancialPartnersLLCMember2022-03-012022-03-310001651052focs:FocusFinancialPartnersLLCMember2022-12-310001651052focs:FocusFinancialPartnersLLCMember2021-12-310001651052us-gaap:SeriesOfIndividuallyImmaterialBusinessAcquisitionsMember2020-01-012020-12-310001651052focs:WealthManagementBusinessMemberus-gaap:SubsequentEventMember2023-02-160001651052focs:ContingentConsiderationAndOtherLiabilitiesMember2022-12-310001651052focs:ContingentConsiderationAndOtherLiabilitiesMember2021-12-310001651052srt:MinimumMemberus-gaap:FairValueInputsLevel3Memberus-gaap:ValuationTechniqueDiscountedCashFlowMember2022-12-310001651052srt:MaximumMemberus-gaap:FairValueInputsLevel3Memberus-gaap:ValuationTechniqueDiscountedCashFlowMember2022-12-310001651052srt:MinimumMemberus-gaap:FairValueInputsLevel3Memberus-gaap:ValuationTechniqueDiscountedCashFlowMember2021-12-310001651052srt:MaximumMemberus-gaap:FairValueInputsLevel3Memberus-gaap:ValuationTechniqueDiscountedCashFlowMember2021-12-310001651052us-gaap:SeriesOfIndividuallyImmaterialBusinessAcquisitionsMember2021-01-012021-12-310001651052us-gaap:SeriesOfIndividuallyImmaterialBusinessAcquisitionsMember2022-01-012022-12-310001651052us-gaap:SeriesOfIndividuallyImmaterialAssetAcquisitionsMember2022-01-012022-12-310001651052us-gaap:SeriesOfIndividuallyImmaterialAssetAcquisitionsMember2021-01-012021-12-310001651052us-gaap:SeriesOfIndividuallyImmaterialAssetAcquisitionsMember2020-01-012020-12-310001651052focs:ManagementAgreementMember2022-01-012022-12-3100016510522022-12-3100016510522021-12-310001651052us-gaap:ParentMember2022-01-012022-12-310001651052us-gaap:NoncontrollingInterestMember2022-01-012022-12-310001651052us-gaap:AdditionalPaidInCapitalMember2022-01-012022-12-310001651052us-gaap:ParentMember2021-01-012021-12-310001651052us-gaap:NoncontrollingInterestMember2021-01-012021-12-310001651052us-gaap:AdditionalPaidInCapitalMember2021-01-012021-12-310001651052us-gaap:ParentMember2020-01-012020-12-310001651052us-gaap:NoncontrollingInterestMember2020-01-012020-12-310001651052us-gaap:AdditionalPaidInCapitalMember2020-01-012020-12-3100016510522020-01-012020-12-3100016510522021-01-012021-12-310001651052us-gaap:LineOfCreditMember2022-01-012022-12-3100016510522022-06-300001651052us-gaap:CommonClassBMember2023-02-130001651052us-gaap:CommonClassAMember2023-02-1300016510522022-01-012022-12-31xbrli:sharesiso4217:USDxbrli:pureiso4217:USDxbrli:sharesfocs:itemfocs:agreementfocs:Votefocs:segment

Table of Contents

UNITED STATES

SECURITIES AND EXCHANGE COMMISSION

WASHINGTON, D.C. 20549

FORM 10-K

(Mark One)

     ANNUAL REPORT PURSUANT TO SECTION 13 OR 15(d) OF THE SECURITIES EXCHANGE ACT OF 1934

For the fiscal year ended December 31, 2022

OR

     TRANSITION REPORT PURSUANT TO SECTION 13 OR 15(d) OF THE SECURITIES EXCHANGE ACT OF 1934

Commission File No. 001-38604

Focus Financial Partners Inc.

(Exact Name of Registrant as Specified in its Charter)

Delaware

47-4780811

(State or Other Jurisdiction
of Incorporation or Organization)

(I.R.S. Employer
Identification No.)

875 Third Avenue, 28th Floor
New York, NY

10022

(Address of Principal Executive Offices)

(Zip Code)

(646519-2456

(Registrant’s Telephone Number, Including Area Code)

Securities registered pursuant to Section 12(b) of the Act:

Title of each class


Trading Symbol(s)


Name of each exchange on which registered

Class A common stock, par value $0.01 per share

FOCS

Nasdaq Global Select Market

Securities registered pursuant to Section 12(g) of the Act: None

Indicate by check mark if the registrant is a well-known seasoned issuer, as defined in Rule 405 of the Securities Act. Yes No

Indicate by check mark if the registrant is not required to file reports pursuant to Section 13 or Section 15(d) of the Act. Yes No

Indicate by check mark whether the registrant (1) has filed all reports required to be filed by Section 13 or 15(d) of the Securities Exchange Act of 1934 during the preceding 12 months (or for such shorter period that the registrant was required to file such reports), and (2) has been subject to such filing requirements for the past 90 days. Yes No

Indicate by check mark whether the registrant has submitted electronically every Interactive Data File required to be submitted pursuant to Rule 405 of Regulation S -T (§232.405 of this chapter) during the preceding 12 months (or for such shorter period that the registrant was required to submit such files). Yes No

Indicate by check mark whether the registrant is a large accelerated filer, an accelerated filer, a non-accelerated filer, smaller reporting company, or an emerging growth company. See the definitions of “large accelerated filer,” “accelerated filer,” “smaller reporting company,” and “emerging growth company” in Rule 12b-2 of the Exchange Act.

Large accelerated filer 

Accelerated filer 

Non-accelerated filer 

Smaller reporting company 

Emerging growth company 

If an emerging growth company, indicate by check mark if the registrant has elected not to use the extended transition period for complying with any new or revised financial accounting standards provided pursuant to Section 13(a) of the Exchange Act.

Indicate by check mark whether the registrant has filed a report on and attestation to its management’s assessment of the effectiveness of its internal control over financial reporting under Section 404(b) of the Sarbanes-Oxley Act (15 U.S.C. 7262(b)) by the registered public accounting firm that prepared or issued its audit report.

If securities are registered pursuant to Section 12(b) of the Act, indicate by check mark whether the financial statements of the registrant included in the filing reflect the correction of an error to previously issued financial statements.

Indicate by check mark whether any of those error corrections are restatements that required a recovery analysis of incentive-based compensation received by any of the registrant’s executive officers during the relevant recovery period pursuant to §240.10D-1(b).

Indicate by check mark whether the registrant is a shell company (as defined in Rule 12b -2 of the Exchange Act): Yes No

The aggregate market value of the Class A common stock held by non-affiliates was $1,963,340,301 on June 30, 2022, the last business day of the registrant’s most recently completed second fiscal quarter.

As of February 13, 2023, the registrant had 65,935,962 shares of Class A common stock and 11,827,321 shares of Class B common stock outstanding.

Documents incorporated by reference:

The registrant’s definitive proxy statement relating to the annual meeting of shareholders (to be held May 24, 2023) will be filed with the Securities and Exchange Commission within 120 days after the close of the registrant’s fiscal year ended December 31, 2022 and is incorporated by reference in Part III to the extent described herein.

Table of Contents

FOCUS FINANCIAL PARTNERS INC.

INDEX TO FORM 10-K

FOR THE YEAR ENDED DECEMBER 31, 2022

Cautionary Statement Regarding Forward-Looking Statements

1

Glossary

2

PART I

3

Item 1.

Business

3

Item 1A.

Risk Factors

22

Item 1B.

Unresolved Staff Comments

37

Item 2.

Properties

37

Item 3.

Legal Proceedings

38

Item 4.

Mine Safety Disclosures

38

PART II

39

Item 5.

Market For Registrant’s Common Equity, Related Stockholder Matters and Issuer Purchases of Equity Securities

39

Item 6.

(Reserved)

39

Item 7.

Management’s Discussion and Analysis of Financial Condition and Results of Operations

40

Item 7A.

Quantitative and Qualitative Disclosures about Market Risk

61

Item 8.

Financial Statements and Supplementary Data

62

Item 9.

Changes in and Disagreements With Accountants on Accounting and Financial Disclosure

62

Item 9A.

Controls and Procedures

62

Item 9B.

Other Information

64

Item 9C.

Disclosure Regarding Foreign Jurisdictions that Prevent Inspections

65

PART III

65

Item 10.

Directors, Executive Officers and Corporate Governance

65

Item 11.

Executive Compensation

65

Item 12.

Security Ownership of Certain Beneficial Owners and Management and Related Stockholder Matters

65

Item 13.

Certain Relationships and Related Transactions, and Director Independence

65

Item 14.

Principal Accountant Fees and Services

65

PART IV

66

Item 15.

Exhibits

66

Signatures

70

Index To Financial Statements

F-1

i

Table of Contents

CAUTIONARY STATEMENT REGARDING FORWARD-LOOKING STATEMENTS

Some of the information in this Annual Report on Form 10-K (this “Annual Report”) may contain forward-looking statements. Forward-looking statements give our current expectations, contain projections of results of operations or of financial condition, or forecasts of future events. Words such as “may,” “assume,” “forecast,” “position,” “predict,” “strategy,” “expect,” “intend,” “plan,” “estimate,” “anticipate,” “believe,” “project,” “budget,” “potential,” “continue,” “will” and similar expressions are used to identify forward-looking statements. They can be affected by assumptions used or by known or unknown risks or uncertainties. Consequently, no forward-looking statements can be guaranteed. When considering these forward-looking statements, you should keep in mind the risk factors and other cautionary statements described under “Part I, Item 1A, Risk Factors.” Actual results may vary materially. You are cautioned not to place undue reliance on any forward-looking statements. You should also understand that it is not possible to predict or identify all such factors and should not consider the following list to be a complete statement of all potential risks and uncertainties. Factors that could cause our actual results to differ materially from the results contemplated by such forward-looking statements include:

fluctuations in wealth management fees;
our reliance on our partner firms and the principals who manage their businesses;
our ability to make successful acquisitions;
unknown liabilities of or poor performance by acquired businesses;
harm to our reputation;
our inability to facilitate smooth succession planning at our partner firms;
our inability to compete;
our reliance on key personnel and principals;
our inability to attract, develop and retain talented wealth management professionals;
our inability to retain clients following an acquisition;
our reliance on key vendors;
write down of goodwill and other intangible assets;
our failure to maintain and properly safeguard an adequate technology infrastructure;
cyber-attacks and other disruptions;
our inability to recover from business continuity problems;
inadequate insurance coverage;
the termination of management agreements by management companies;
our inability to generate sufficient cash to service all of our indebtedness or our ability to access additional capital;
the failure of our partner firms to comply with applicable U.S. and non-U.S. regulatory requirements and the highly regulated nature of our business;
worsening economic conditions, including inflation, in the United States or internationally;
wars or other geopolitical conflict;

1

Table of Contents

changes to laws and regulations;
legal proceedings, governmental inquiries; and
other factors discussed in this Annual Report.

All forward-looking statements are expressly qualified in their entirety by the foregoing cautionary statements. Our forward-looking statements speak only as of the date of this Annual Report or as of the date as of which they are made. Except as required by applicable law, including federal securities laws, we do not intend to update or revise any forward-looking statements.

GLOSSARY

The following terms are used throughout this Annual Report:

Base Earnings. This is a percentage of the estimated operating cash flow earnings before partner compensation (i.e., Target Earnings) upon which we apply a multiple to determine acquisition prices. We retain a preferred position in Base Earnings.

Commission-based. Commission-based revenue is derived from commissions paid by clients or payments from third parties for sales of investment or insurance products.

Fee-based. Fee-based services are those for which a partner firm primarily charges a fee directly to the client for wealth management services, recordkeeping and administration services and other services rather than being primarily compensated through commissions from clients or from third parties for recommending financial products.

Fiduciary Duty. A fiduciary duty is a legal duty to act in another party’s interests, with utmost good faith, to make full and fair disclosure of all material facts and to exercise all reasonable care to avoid misleading clients.

GAAP. Accounting principles generally accepted in the United States of America.

High Net Worth. High net worth individuals are generally defined in the financial industry as those with liquid financial assets, excluding primary residence, in excess of $1 million.

Lift Out. The circumstance when a group of wealth management professionals, already working as a team, seeks to leave their current employer and join another employer or start their own registered investment advisor firm.

Open-architecture. An investment platform that grants clients access to a wide range of investment funds and products offered by third parties. By contrast, a closed architecture is an investment platform that grants clients access only to proprietary investment funds and products.

Partnership. The term we use to refer to our business and relationship with our partner firms. It is not intended to describe a particular form of legal entity or a legal relationship.

Target Earnings. The estimated operating cash flow earnings before partner compensation.

Ultra-High Net Worth. Ultra-high net worth individuals are generally defined in the financial industry as those with liquid financial assets, excluding primary residence, in excess of $30 million.

Wealth Management. Comprehensive professional services that combine investment advice, financial and tax planning, consulting, tax return preparation, family office services and other services that help clients achieve their objectives regarding accumulation, preservation and distribution of long-term wealth.

Wirehouse. Brokerage firm that provides a full range of investment, research, trading and wealth management services to clients. The term originated prior to the advent of modern wireless communications, when brokerage firms were connected to their branches primarily through telephone and telegraph wires.

2

Table of Contents

PART I

Unless otherwise indicated or the context requires, all references to “we,” “us,” “our,” the “Company,” and “Focus Inc,” refer to Focus Financial Partners Inc. and its consolidated subsidiaries. “Focus LLC” refers to Focus Financial Partners, LLC, a Delaware limited liability company and a consolidated subsidiary of ours.

The term “partner firms” refers to our consolidated subsidiaries engaged in wealth management and related services, the businesses of which are typically managed by the principals. The term “principals” refers to the wealth management professionals who manage the businesses of our partner firms pursuant to the relevant management agreement. The term “our partnership” refers to our business and relationship with our partner firms and is not intended to describe a particular form of legal entity or a legal relationship.

Item 1. Business

Corporate Structure

Focus Inc. is a holding company whose most significant asset is a membership interest in Focus LLC. Focus LLC directly or indirectly owns all of the outstanding equity interests in our partner firms. Focus Inc. is the sole managing member of Focus LLC and is responsible for all operational, management and administrative decisions of Focus LLC. Subject to certain restrictions, unitholders of Focus LLC (other than Focus Inc. and any of its subsidiaries) may receive shares of our Class A common stock pursuant to the exercise of an exchange right or a call right.

Our Company

We are a leading partnership of independent, fiduciary wealth management firms operating in the highly fragmented registered investment adviser (“RIA”) industry, with a footprint of over 85 partner firms primarily in the United States. We have achieved this market leadership by positioning ourselves as the partner of choice for many firms in an industry where a number of secular trends are driving consolidation. Our partner firms primarily service ultra-high net worth and high net worth individuals and families by providing highly differentiated and comprehensive wealth management services. Our partner firms benefit from our intellectual and financial resources, operating as part of a scaled business model with aligned economic interests, while retaining their entrepreneurial culture and independence.

Our partnership is built on the following principles, which enable us to attract and retain high-quality wealth management firms and accelerate their growth:

Entrepreneurship:

Maintain the entrepreneurial spirit, independence and unique culture of each partner firm.

Fiduciary Standard:

Partner with wealth management firms that are held to the fiduciary standard in serving their clients.

Alignment of Interests:

Align principals’ interests with our interests through our differentiated partnership and economic model.

Value-Add Services:

Empower our partner firms through collaboration on strategy, growth and acquisition opportunities, marketing, technology and operational expertise, access to best practices and access to cash and credit, insurance, trust and valuation solutions. Provide access to world class intellectual resources and capital to fund expansion and acquisitions.

We were founded by entrepreneurs and began revenue-generating and acquisition activities in 2006. Since that time, we have:

created a partnership of over 85 partner firms, the substantial majority of which are RIAs registered with the Securities and Exchange Commission (the “SEC”) pursuant to the Investment Advisers Act of 1940 (the “Advisers Act”);

3

Table of Contents

built a business with revenues in excess of $2.1 billion for the year ended December 31, 2022;
increased revenues at a compound annual growth rate of 32.3% since 2006;
established an attractive revenue model whereby in excess of 95% of our revenues for the year ended December 31, 2022 were fee-based and recurring in nature;
built a partnership currently comprised of over 5,800 wealth management-focused principals and employees; and
established a national footprint across the United States and an international presence with partner firms primarily in Australia, Canada, Switzerland and the United Kingdom.

We are in the midst of a fundamental shift in the growing wealth management services industry. The delivery of wealth management services is moving from traditional brokerage, commission-based platforms to a fiduciary, open-architecture and fee-based structure. This shift has resulted in a significant transfer of client assets and wealth management professionals from traditional brokerage, commission-based platforms to independent wealth management practices. We believe that our leading partnership of independent, fiduciary wealth management firms positions us to benefit from these trends.

The independent wealth management industry, including RIAs, is highly fragmented, which we believe enables us to continue our growth strategy of acquiring high-quality independent wealth management firms, directly and through acquisitions by our partner firms. We have a track record of enhancing the competitive position of our partner firms by providing them with access to the intellectual expertise, resources and network benefits of our large organization. Our scale enables us to help our partner firms achieve operational efficiencies and ensure organizational continuity. Additionally, our scale, resources and value-added services increase our partner firms’ ability to achieve growth through a variety of tactical, operational and strategic initiatives, as well as the consummation of their own acquisitions.

Our partnership is composed of trusted professionals providing comprehensive wealth management services through a largely recurring, fee-based model, which differentiates our partner firms from the traditional brokerage platforms whose revenues are largely derived from commissions. We derive a substantial majority of our revenues from wealth management fees for investment advice, financial and tax planning, consulting, tax return preparation, family office services and other services. We also generate other revenues from recordkeeping and administration service fees, commissions and distribution fees and outsourced services.

Recent Development

On February 2, 2023, we announced that we had entered into an exclusivity agreement for a limited period with Clayton, Dubilier & Rice, LLC ("CD&R"), a private investment firm, to engage in negotiations regarding the terms and definitive agreements whereby CD&R may potentially acquire us for $53 per share in cash. A Special Committee of our Board of Directors approved the exclusivity agreement.

Funds managed by Stone Point Capital LLC (together with its affiliates, “Stone Point”) are considering retaining a portion of their investment in us and providing new equity financing as part of the proposed transaction, subject to negotiation with CD&R of definitive agreements on mutually agreeable terms.

Negotiations regarding definitive terms and agreements are ongoing and there is no certainty that final terms of any transaction will be agreed upon or, if agreed upon, completed. Any transaction would be subject to the completion of due diligence, Board and stockholder approval, regulatory approvals and other customary conditions. We will cease to be a publicly traded company if such a transaction is consummated.

See also Part I, Item 1A. Risk Factors – Risk Related to Possible Transaction.

4

Table of Contents

Our Growth Strategy

We believe we are well-positioned to take advantage of favorable trends in the wealth management industry, including the migration of wealth management professionals from traditional brokerage, commission-based platforms to a fiduciary, open-architecture and fee-based structure. We plan to grow our business through the growth of our existing partner firms and the expansion of our partnership.

Growth of Our Existing Partner Firms

High-Quality, Growth-Oriented Partner Firms

Our goal has been and continues to be to acquire high-quality, entrepreneurial wealth management firms that have built their businesses through a proven track record of growth. We believe that our partner firms will continue to take advantage of the shift in client assets to the RIA space and grow organically through acquisitions of wealth management practices and customer relationships, by attracting new clients, adding new wealth management professionals, increasing client assets from existing clients and through financial market appreciation over time. The economic arrangements put in place at the time of acquisition through our management agreements incentivize the principals of our partner firms to continue executing on their growth plans.

Value-Added Services

We have a team of over 100 professionals who support our partner firms by providing value added services, including marketing and business development support; human resources support, including adviser coaching and development and structuring compensation and incentive models, career path planning and succession planning advice, recruiting and talent management, operational and technology expertise, cash and credit solutions, trust services, insurance solutions, valuation solutions, legal and regulatory support and providing negotiating leverage with vendors. Our value added services also include access to our M&A expertise, which facilitates acquisition opportunities for our partner firms through a proactive outreach program, structuring, executing and funding transactions and providing guidance to partner firms to facilitate their integration into our partnership as well as integration of mergers they execute. We assign a relationship leader to each partner firm who is responsible for coordinating our value added services to assist that partner firm in accelerating its growth. Our partner firms also have access to our intellectual expertise and partner firm network, which ultimately enhance their operations, enabling them to better serve their clients.

Some of our key value-added services are described in detail below.

Marketing and Business Development. We offer marketing and business development coaching to our partner firms on topics including referral programs, revenue enhancement measures, communications, website and social media, brand strategy and public relations support. Our marketing team works closely with each of our partner firms to understand their unique value proposition and help them better market themselves to their clients and their centers of influence, including accounting and law firms who serve as potential referral sources. To further support our partner firms, we hold a minority investment in Financial Insight Technology, Inc. (known as SmartAsset), a New York-based fintech company that connects prospective clients with financial advisers and provides tools to help individuals make more informed financial decisions.

Talent Management. We support the mentoring of next generation talent at each of our partner firms through continuous coaching programs that we organize and execute. These programs emphasize key learnings gained from observing top talent across our organization, allowing our firms to benefit from best practices across our talent pool. We also help our partner firms recruit new talent, helping them to grow and enhance their businesses through the addition of experienced advisors and other professionals.

Compensation Structures and Succession Planning. We help our partner firms align their compensation models to further incentivize their teams. We also facilitate wealth management professional career path planning and advise on

5

Table of Contents

principal promotions to the respective management company. These services allow our partner firms to attract and retain the highest quality wealth management professionals. Our acquisition structure facilitates succession planning by maintaining the partner firm and management company as separate entities, thereby allowing for the principals owning the management company to transition over time without disrupting client relationships at the partner firm.

Operations and Technology. We assist partner firms in selecting and implementing third-party technology solutions that strengthen each firm’s operational performance. Our partner firms can request that our operations team conduct detailed operational assessments to determine their staffing and operating efficiency. Additionally, our operations team provides partner firms negotiating leverage with vendors and cost-efficient access to third-party technology.

Cash and Credit Solutions. Through Focus Treasury & Credit Solutions we have created a network of third-party banks and non-bank lenders to provide a competitive array of cash and credit solutions. These alternatives enable our partner firms to proactively help their clients achieve higher yields on cash, as well as unlock home equity and business opportunities through refinancing, commercial lending and other options.

Insurance Solutions. Through Focus Risk Solutions we have created a network of third-party insurance brokers who can facilitate a competitive array of insurance solutions through their relationships with established insurance carriers. These solutions enable our partner firms to proactively help their clients with risk management in various lines of insurance, including life, health, and property and casualty.

Trust Services. Through Focus Fiduciary Solutions we have created a network of third-party advisor-coordinated, independent trustees who have the scale and expertise to meet the diverse needs of our partners firms’ clients and can do so at highly competitive pricing. We work on a consultative basis with our partners to help them explore and develop service offerings for their clients.

Valuation Services. Through Focus Valuation Solutions, we have created a network of third-party valuation firms that can help clients value a wide variety of business interests and financial assets. Valuation solutions are important for ultra-high net worth and high net worth individuals with unique and hard to value assets, such as closely held businesses, real estate and life insurance.

Legal and Regulatory Support. We have an experienced team of legal professionals in place to help support our partner firms in fulfilling their regulatory responsibilities by providing subject matter guidance and expertise. We also assist our partner firms in negotiating and drafting acquisition and other agreements. We also have relationships with numerous high quality law firms and compliance consultants that can assist our partner firms create, implement and maintain a robust compliance environment.

Sharing of Best Practices / Collaboration with Other Partner Firms. Our partner firms have access to networking opportunities, best practices roundtable discussions and training seminars. We offer offsite and virtual meetings, seminars and other forums for partner firms to learn and adopt best practices. We host partners meetings where wealth management professionals from our partner firms have opportunities to collaborate and share ideas. In addition, we host periodic summits for chief investment officers, chief compliance officers, chief operating officers, chief financial officers and chief marketing officers, where our partner firms can share specialized expertise and business development practices. Our partner firms are also encouraged to share best practices regularly in order to enhance their collective ability to better serve their clients.

Expansion of Our Partnership

Our Acquisition Models

We are a source of permanent capital and buy substantially all of the assets or equity of the firms we acquire. We utilize three models for acquisitions: (1) direct acquisitions of wealth management practices who become partner firms of Focus but operate on an autonomous basis, (2) acquisitions of wealth management practices and customer relationships on behalf of our partner firms to accelerate the growth of their businesses, and (3) acquisitions of wealth

6

Table of Contents

management practices on behalf of Connectus Wealth Advisers (“Connectus”), one of our partner firms. Firms that join Connectus manage their client relationships and retain their brand identity post-acquisition, but rely on a shared infrastructure and other services provided by Connectus.

Acquisitions of New Partner Firms

Since inception, a fundamental aspect of our growth strategy has been the acquisition of high-quality, independent wealth management firms to expand our partnership. We believe that there are approximately 1,000 firms in the United States that are high-quality targets for future acquisitions. While most of our acquisitions have taken place in the United States, we also see opportunities in several countries where market and regulatory trends toward the fiduciary standard and open-architecture access mirror those occurring in the United States. We have already begun expansion primarily into Australia, Canada, Switzerland and the United Kingdom.

Our unique value proposition, differentiated partnership model and track record have allowed us to grow and enhance our leadership position in the independent wealth management industry.

We are highly selective in choosing our partner firms and conduct extensive financial, legal, regulatory, tax, operational and business due diligence. We evaluate a variety of criteria including the quality of the wealth management professionals, client characteristics, historical revenues and cash flows, the recurring nature of the revenues, compliance policies and procedures and the alignment of interests between the wealth management professionals and their clients. We focus on firms with owners who are committed to the long-term management and growth of their businesses.

Our partner firm acquisitions have been structured as acquisitions of substantially all of the assets or equity of the firm we chose to partner with but only a portion of the underlying economics in order to align the principals’ interests with our own objectives. To determine the acquisition price, we first estimate the operating cash flow of the business based on current and projected levels of revenue and expense, before compensation and benefits to the selling principals or other individuals who become principals. We refer to the operating cash flow of the business as Earnings Before Partner Compensation (“EBPC”), and to this EBPC estimate as Target Earnings (“Target Earnings”). In economic terms, we typically purchase 40% to 60% of the partner firm’s EBPC. The purchase price is a multiple of the corresponding percentage of Target Earnings and may consist of cash or a combination of cash and equity, and the right to receive contingent consideration. We refer to the corresponding percentage of Target Earnings on which we base the purchase price as Base Earnings (“Base Earnings”). Under a management agreement between our operating subsidiary and the management company and the principals, the management company is entitled to management fees typically consisting of all future EBPC of the acquired wealth management firm in excess of Base Earnings up to Target Earnings, plus a percentage of any EBPC in excess of Target Earnings. Through the management agreement, we create downside earnings protection for ourselves by retaining a preferred position in Base Earnings.

7

Table of Contents

Since 2006, when we began revenue-generating and acquisition activities, we have grown to a partnership with over 85 partner firms. Acquisitions of partner firms to date have been structured as illustrated below, with limited exceptions. Subsidiary mergers at the partner firm level and acquisitions in foreign jurisdictions have been structured differently, and we expect some differences in the future depending on legal and tax considerations.
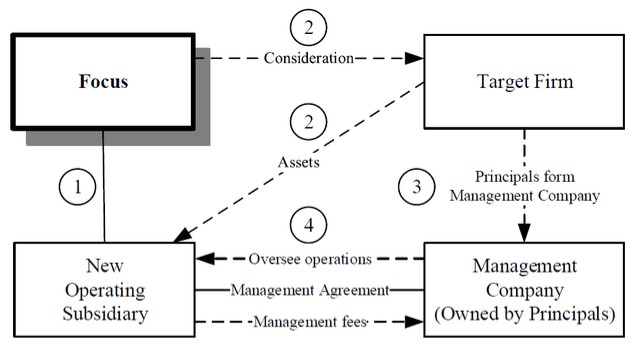
Graphic

(1)Focus LLC forms a wholly owned subsidiary.
(2)In exchange for cash or a combination of cash and equity and the right to receive contingent consideration, the new operating subsidiary acquires substantially all of the assets or equity of the target firm, which is owned by the selling principals, and becomes the new operating subsidiary of Focus.
(3)The selling principals form a management company. In addition to the selling principals, the management company may include non-selling principals who become newly admitted in connection with the acquisition or thereafter.
(4)The new operating subsidiary, the principals and the management company enter into a management agreement which typically has an initial term of six years subject to automatic renewals for consecutive one-year terms, unless earlier terminated by either the management company or us in certain limited situations. Under the management agreement, the management company is entitled to management fees typically consisting of all future EBPC of the new operating subsidiary in excess of Base Earnings up to Target Earnings, plus a percentage of any EBPC in excess of Target Earnings. Pursuant to the management agreement, the management company provides the personnel who lead the day-to-day operations of the new operating subsidiary. Through the management agreement, we create downside protection for ourselves by retaining a preferred position in each partner firm’s Base Earnings.

In connection with a typical acquisition, we enter into an acquisition agreement with the target firm and its selling principals pursuant to which we purchase substantially all of the assets or equity of the target firm. The purchase price is a multiple of Base Earnings, which is a percentage of Target Earnings. The purchase price is comprised of a base purchase price and a right to receive contingent consideration in the form of earn out payments. The contingent consideration for acquisitions of new partner firms is generally paid over a six-year period upon the satisfaction of specified growth thresholds in years three and six. These growth thresholds are typically tied to the compound annual growth rate (“CAGR”) of the partner firm’s earnings. Such growth thresholds can be set annually or for different time frames as well, for example, annually over a six-year period. The contingent consideration for acquisitions made by our partner firms is paid upon the satisfaction of specified financial thresholds. These thresholds are typically tied to revenue as adjusted for certain criteria or other operating metrics, based on the retention or growth of the business acquired. These arrangements may result in the payment of additional purchase price consideration to the sellers for periods

8

Table of Contents

following the closing of an acquisition. Contingent consideration payments are typically payable in cash and, in some cases, equity.

The acquisition agreements contain customary representations and warranties of the parties, and closing is generally conditioned on the delivery of certain ancillary documents, including an executed management agreement, a confidentiality and non-solicitation agreement, a non-competition agreement and, when required, confirmation that clients have consented at agreed-upon levels to the assignment of their advisory agreements to our subsidiary.

In connection with the acquisition, management companies and selling principals agree to non-competition and non-solicitation provisions of the management agreement, as well as standalone non-competition and non-solicitation agreements required by the acquisition agreement. Such non-competition and non-solicitation agreements typically have five-year terms. The non-competition and non-solicitation provisions of the management agreement continue during the term of the management agreement and for a period of two years thereafter.

Our partner firms are primarily overseen by the principals who own the management company formed concurrently with the acquisition. Our operating subsidiary, the management company and the principals enter into a long-term management agreement pursuant to which the management company provides the personnel responsible for overseeing the day-to-day operations of the partner firm. The term of the management agreement is generally six years subject to automatic renewals for consecutive one-year terms, unless earlier terminated by either the management company or us in certain limited situations. Subject to applicable cure periods, we may terminate the management agreement upon the occurrence of an event of cause, which may include willful misconduct by the management company or any principal that is reasonably likely to result in a material adverse effect, the failure of the management company to comply with regulatory or other governmental compliance procedures or a material breach of the agreement by the management company or the principals. In some cases, we may have the right to terminate the agreement if any principal ceases to be involved on a full-time basis in the management of the management company or the performance of services under the agreement. Generally, the management company may terminate the management agreement upon a material breach of the agreement by us and the expiration of the applicable cure period.

This ownership and management structure allows the principals to maintain their entrepreneurial spirit through autonomous day-to-day decision making, while gaining access to our extensive resources and preserving the principals’ long-term economic incentive to continue to grow the business. The management company structure provides both flexibility to us and stability to our partner firms by permitting the principals to continue to build equity value in the management company as the partner firm grows and to control their internal economics and succession plans within the management company.

9

Table of Contents

The following table provides an illustrative example of our economics, including management fees earned by the management company, for periods of projected revenues, +10% growth in revenues and −10% growth in revenues. This example assumes (i) Target Earnings of $3.0 million; (ii) Base Earnings acquired of 60% of Target Earnings or $1.8 million; and (iii) a percentage of earnings in excess of Target Earnings retained by the management company of 40%.


Projected


+10% Growth


−10% Growth 

Revenues

in Revenues

in Revenues

(in thousands)

New Partner Firm

New partner firm revenues

$

5,000

$

5,500

$

4,500

Less:

Operating expenses (excluding management fees)


(2,000)


(2,000)


(2,000)

EBPC

$

3,000

$

3,500

$

2,500

Base Earnings to Focus Inc. (60%)


1,800


1,800


1,800

Management fees to management company (40%)


1,200


1,200


700

EBPC in excess of Target Earnings:

To Focus Inc. (60%)


300


To management company as management fees (40%)


200


Focus Inc.

Focus Inc. revenues

$

5,000

$

5,500

$

4,500

Less:

Operating expenses (excluding management fees)


(2,000)


(2,000)


(2,000)

Less:

Management fees to management company


(1,200)


(1,400)


(700)

Operating income

$

1,800

$

2,100

$

1,800

In certain circumstances, the structure of our relationship with partner firms may differ from the typical structure described above. For example, the economic structure in some non-U.S. partner firms differs from the way in which we own our U.S. partner firms. We expect some differences in the structure of our future international acquisitions as well.

Acquisitions by Our Partner Firms

We are instrumental to, and support the acquisition of, wealth management practices and customer relationships by our partner firms to further expand their businesses. Partner firms pursue acquisitions for a variety of reasons, including geographic expansion, acquisition of new talent and/or specific expertise and succession planning. Acquisitions by our partner firms allow them to add new talent and services to better support their client base while simultaneously capturing synergies from the acquired businesses. We believe there are approximately 5,000 firms in the United States that are suitable targets for our partner firms. We have an experienced team of professionals with deep industry relationships to assist in identifying potential acquisition targets for our partner firms. Through our proprietary in-house sourcing effort, we frequently identify acquisition opportunities for our partner firms. Additionally, many of our partner firms are well known in the industry and have developed extensive relationships. In recent years, principals and employees of our partner firms have identified attractive merger candidates, and we believe this trend will continue as our partner firms continue to build scale.

In addition to sourcing opportunities, we are actively involved through each stage of the process to provide legal, financial, tax, compliance and operational expertise to guide our partner firms through the acquisition due diligence process and execution. We provide the funding for acquisitions in the same manner that a parent company would typically fund acquisitions by its subsidiaries.

10

Table of Contents

Our partner firms typically acquire substantially all of the assets or equity of a target firm for cash or a combination of cash and equity and the right to receive contingent consideration. In certain situations, when the acquisition involves a merger with a corporation, and the consideration includes our Class A common stock, Focus Inc. may purchase all of the equity of a target firm and then contribute the assets to our partner firm. In certain instances, our partner firms may acquire only the customer relationships. At the time a partner firm consummates an acquisition, we typically amend our management agreement with the partner firm to adjust Base Earnings and Target Earnings to reflect the projected post acquisition EBPC of the partner firm.

Our partner firms completed 18 transactions in 2020 (including 4 transactions completed by Connectus), 24 transactions in 2021 (including 8 transactions completed by Connectus) and 19 transactions in 2022 (including 1 transaction completed by Connectus). With our approval and support, our partner firms may choose to merge with each other as well. Consolidation of our existing partner firms leads to efficiencies and incremental growth in our cash flows.

Acquisitions Through Connectus

Connectus has wealth advisory subsidiaries in the United States, Australia, Canada and the United Kingdom. It was launched through a partner firm that joined us in 2007 and subsequently expanded in the United States, Australia, Canada and the United Kingdom. Connectus completed 4 transactions in 2020, 8 transactions in 2021 and 1 transaction in 2022. We expect that Connectus’ international footprint will expand further. Connectus is designed for founders and teams of wealth management practices who want to continue managing their client relationships and maintaining their boutique cultures under their own brand names, while gaining the operational efficiencies of shared infrastructure and other services provided by Connectus. Connectus offers integrated technology, investment support and centralized services, including compliance, accounting and talent management. Connectus also provides marketing capabilities to support business expansion through lead generation and organic growth programs. Through us, Connectus advisers gain a strategic growth partner with specialized capabilities. They benefit from our global scale and extensive network of partner firms, continuity planning expertise and client solutions.

In connection with a typical Connectus acquisition, we enter into an acquisition agreement with the target firm and its selling principals pursuant to which Connectus purchases substantially all of the assets or equity of the target firm for cash. Because of Connectus’ unique structure, Focus in most cases retains 100% of post-acquisition profitability and the selling principals and advisers of the target firm receive market-based compensation and growth-based economics generally based on the growth of revenues.

Lift Outs of Established Wealth Management Professionals

From time to time, partner firms hire individuals or wealth management teams from traditional brokerage firms and wirehouses, or through Focus Independence, we offer such individuals or teams the opportunity to establish their own independent wealth management firms and ultimately join our partnership as a new partner firm. If joining as a new partner firm, we typically enter into an option agreement, which provides us with the option to acquire substantially all of the assets of a new wealth management firm that such teams managed after their resignation from the brokerage firm or wirehouse approximately 12 to 13 months from such resignation date.

Our Partner Firms

Our partner firms provide comprehensive wealth management services to ultra-high net worth and high net worth individuals and families, as well as business entities, under a largely recurring, fee-based model. Our partner firms provide these services across a diverse range of investment styles, asset classes and clients. The substantial majority of our partner firms are RIAs, and certain of our partner firms also have affiliated broker-dealers and/or insurance brokers. Several of our partner firms and their principals have been recognized as leading wealth management firms and advisers by financial publications such as Barron’s, The Financial Times and Forbes.

Our partner firms derive a substantial majority of their revenues from wealth management fees, which are composed of fees earned from wealth management services, including investment advice, financial and tax planning, consulting, tax return preparation, family office services and other services. Fees are primarily based either on a

11

Table of Contents

contractual percentage of the client’s assets based on the market value of the client’s assets on the predetermined billing date, a flat fee, an hourly rate based on predetermined billing rates or a combination of such fees and are billed either in advance or arrears on a monthly, quarterly or semiannual basis. In certain cases, such wealth management fees may be subject to minimum fee levels depending on the services performed. We also generate other revenue from recordkeeping and administration service fees, commissions and distribution fees and outsourced services.

We currently have over 85 partner firms. All of our partner firm acquisitions have been paid for with cash or a combination of cash and equity and the right to receive contingent consideration. We have to date, with limited exceptions, acquired substantially all of the assets or equity of the firms we choose to partner with and have assumed only post-closing contractual obligations, not any material existing liabilities.

The following is a list of our partner firms as of February 16, 2023:


Joined through


Acquisition(s)

Partner

Focus

Completed by

Partner Firm

Firm Since

Independence

Partner Firm


2006

1

StrategicPoint


January

2

HoyleCohen


May


Ö


2007

3

Sentinel Benefits & Financial Group


January


Ö

4

Buckingham


February


Ö

5

Benefit Financial Services Group


March


Ö

6

JFS Wealth Advisors


August


Ö

7

Connectus Wealth Advisers (1)


September


Ö

8

GW & Wade


September


Ö


2008

9

Greystone


April


Ö

10

WESPAC


July


2009

11

Joel Isaacson & Co.


November

12

Coastal Bridge Advisors


December


Ö


Ö


2010

13

Pettinga


December


2011

14

Sapient Private Wealth Management


September


Ö


Ö

15

The Colony Group


October


Ö

16

LVW Advisors


October


Ö


Ö


2012

17

Vestor Capital


October

Ö

18

Merriman


December


Ö

19

The Portfolio Strategy Group


December


2013

20

LaFleur & Godfrey


August

Ö

21

Telemus Capital


August


Ö


2014

22

Summit Financial


April


Ö


Ö

23

Flynn Family Office


June


Ö

24

Gratus Capital


October


Ö

25

Strategic Wealth Partners


November


Ö


2015

26

IFAM Capital


February


Ö

27

Dorchester Wealth Management


April


Ö

28

The Fiduciary Group


April

29

Quadrant Private Wealth


July


Ö

Ö

30

Relative Value Partners


July

Ö

31

Fort Pitt Capital Group


October

Ö

32

Patton Albertson Miller Group


October

Ö


2016

33

Douglas Lane & Associates


January

34

Kovitz Investment Group Partners


January


Ö

35

Waddell & Associates


April

36

Transform Wealth


April


Ö

37

GYL Financial Synergies


August


Ö

Ö

38

XML Financial Group


October


Ö

Ö


2017

39

Crestwood Advisors


January

Ö

40

CFO4Life


February


Ö

41

One Charles Private Wealth


February


Ö

Ö

42

Bordeaux Wealth Advisors


March

43

Gelfand, Rennert & Feldman


April


Ö

44

Lake Street Advisors


April

12

Table of Contents


Joined through


Acquisition(s)

Partner

Focus

Completed by

Partner Firm

Firm Since

Independence

Partner Firm

45

SCS Financial Services


July


Ö

46

Brownlie & Braden


July

47

Eton Advisors


September


2018

48

Cornerstone Wealth


January


Ö

49

Fortem Financial


February


Ö

50

Bartlett Wealth Management


April

Ö

51

Campbell Deegan Financial


April


Ö

52

Nigro, Karlin, Segal, Feldstein & Bolno (NKSFB)


April


Ö

53

TrinityPoint Wealth


May


Ö

Ö

54

Asset Advisors Investment Management


July

55

Edge Capital Group


August

Ö

56

Adero Partners


August

Ö


2019

57

Altman, Greenfield & Selvaggi


January

58

Prime Quadrant


February

Ö

59

Foster, Dykema & Cabot


March

60

Escala Partners

April

Ö

61

Sound View Wealth Advisors

April

Ö

62

Williams Jones

August

2020

63

Nexus Investment Management

February

64

Mediq Financial Services

May

65

TMD Wealth Management

October

Ö

66

InterOcean Capital

October

Ö

67

Seasons of Advice

November

68

CornerStone Partners

December

69

Fairway Wealth Management

December

70

Kavar Capital Partners

December

2021

71

Hill Investment Group

March

Ö

72

Prairie Capital Management

April

73

Rollins Financial

April

74

ARS Wealth Advisors

July

Ö

75

Badgley Phelps Wealth Managers

August

76

Ancora Holdings

October

Ö

77

Sonora Investment Management

October

78

Cardinal Point

November

Ö

79

Ullmann Wealth Partners

December

80

Mosaic Family Wealth

December

81

Alley Company

December

82

Cassaday & Company

December

83

Provident Financial Management

December

Ö

2022

84

Azimuth Capital Investment Management

April

85

Octogone Holding

July

86

Icon Wealth Partners

August

87

FourThought Private Wealth

November

88

Beaumont Financial Partners

November

2023

89

Spectrum Wealth Management

January

(1) In October 2022, Financial Professionals was merged into Connectus Wealth Advisors.

13

Table of Contents

The following shows certain of the value-added services we have provided to our partner firms through February 16, 2023:

ValueAdded Services

Operational

Marketing and

and

Legal and

Business

Technology

Compliance

Talent

Succession

Partner Firm


Development


Enhancements


Support


Management


Planning

1

StrategicPoint


Ö


Ö


Ö


Ö


Ö

2

HoyleCohen


Ö


Ö


Ö


Ö


Ö

3

Sentinel Benefits & Financial Group


Ö


Ö


Ö


Ö


Ö

4

Buckingham


Ö


Ö


Ö


Ö


Ö

5

Benefit Financial Services Group


Ö


Ö


Ö


Ö


Ö

6

JFS Wealth Advisors


Ö


Ö


Ö


Ö


Ö

7

Connectus Wealth Advisers (1)


Ö


Ö


Ö


Ö


Ö

8

GW & Wade


Ö


Ö


Ö


Ö


Ö

9

Greystone


Ö


Ö


Ö


Ö

10

WESPAC


Ö


Ö


Ö


Ö

11

Joel Isaacson & Co.


Ö


Ö


Ö


Ö


Ö

12

Coastal Bridge Advisors


Ö


Ö


Ö


Ö

Ö

13

Pettinga


Ö


Ö


Ö


Ö

Ö

14

Sapient Private Wealth Management


Ö


Ö


Ö


Ö


Ö

15

The Colony Group


Ö


Ö


Ö


Ö


Ö

16

LVW Advisors


Ö


Ö


Ö


Ö


Ö

17

Vestor Capital


Ö


Ö


Ö


Ö


Ö

18

Merriman


Ö


Ö


Ö


Ö


Ö

19

The Portfolio Strategy Group


Ö


Ö


Ö


Ö

Ö

20

LaFleur & Godfrey


Ö


Ö


Ö


Ö


Ö

21

Telemus Capital


Ö


Ö


Ö


Ö


Ö

22

Summit Financial


Ö


Ö


Ö


Ö


Ö

23

Flynn Family Office

Ö


Ö


Ö

24

Gratus Capital


Ö


Ö


Ö


Ö

Ö

25

Strategic Wealth Partners


Ö


Ö


Ö


Ö

Ö

26

IFAM Capital


Ö


Ö


Ö


Ö


Ö

27

Dorchester Wealth Management


Ö


Ö


Ö


Ö


Ö

28

The Fiduciary Group


Ö


Ö


Ö


Ö

Ö

29

Quadrant Private Wealth


Ö


Ö


Ö


Ö

Ö

30

Relative Value Partners


Ö


Ö


Ö


Ö

Ö

31

Fort Pitt Capital Group


Ö


Ö


Ö


Ö

Ö

32

Patton Albertson Miller Group


Ö


Ö


Ö


Ö

Ö

33

Douglas Lane & Associates


Ö


Ö


Ö

Ö

Ö

34

Kovitz Investment Group Partners


Ö


Ö


Ö


Ö


Ö

35

Waddell & Associates


Ö


Ö


Ö


Ö


Ö

36

Transform Wealth


Ö


Ö


Ö


Ö

Ö

37

GYL Financial Synergies


Ö


Ö


Ö


Ö


Ö

38

XML Financial Group


Ö


Ö


Ö


Ö


Ö

39

Crestwood Advisors


Ö


Ö


Ö


Ö

40

CFO4Life


Ö


Ö


Ö


Ö

Ö

41

One Charles Private Wealth

Ö


Ö


Ö


Ö

Ö

42

Bordeaux Wealth Advisors


Ö


Ö


Ö


Ö


Ö

43

Gelfand, Rennert & Feldman

Ö


Ö


Ö

Ö


Ö

44

Lake Street Advisors

Ö

Ö


Ö


Ö


Ö

45

SCS Financial Services

Ö


Ö


Ö


Ö


Ö

46

Brownlie & Braden


Ö


Ö


Ö


Ö

Ö

47

Eton Advisors


Ö

Ö


Ö


Ö


Ö

48

Cornerstone Wealth


Ö


Ö


Ö


Ö

Ö

49

Fortem Financial

Ö


Ö


Ö


Ö

50

Bartlett Wealth Management


Ö


Ö


Ö

Ö

Ö

51

Campbell Deegan Financial


Ö

Ö

52

Nigro, Karlin, Segal, Feldstein, & Bolno (NKSFB)

Ö


Ö


Ö

Ö


Ö

53

TrinityPoint Wealth


Ö


Ö


Ö

Ö


Ö

54

Asset Advisors Investment Management

Ö


Ö


Ö

Ö

55

Edge Capital Group

Ö

Ö


Ö

Ö

56

Adero Partners

Ö


Ö


Ö


Ö

Ö

57

Altman, Greenfield & Selvaggi

Ö

Ö


Ö

Ö

Ö

58

Prime Quadrant

Ö

Ö

Ö

Ö

Ö

59

Foster, Dykema & Cabot

Ö

Ö


Ö

Ö

Ö

60

Escala Partners

Ö

Ö

Ö

Ö

Ö

61

Sound View Wealth Advisors

Ö

Ö

Ö

Ö

62

Williams Jones

Ö

Ö

Ö

Ö

63

Nexus Investment Management

Ö

Ö

Ö

Ö

64

Mediq Financial Services

Ö

Ö

65

TMD Wealth Management

Ö

Ö

Ö

Ö

Ö

66

InterOcean Capital

Ö

Ö

Ö

Ö

Ö

67

Seasons of Advice

Ö

Ö

Ö

68

CornerStone Partners

Ö

Ö

Ö

Ö

69

Fairway Wealth Management

Ö

Ö

Ö

Ö

Ö

70

Kavar Capital Partners

Ö

Ö

Ö

Ö

Ö

71

Hill Investment Group

Ö

Ö

Ö

72

Prairie Capital Management

Ö

Ö

Ö

Ö

73

Rollins Financial

Ö

Ö

74

ARS Wealth Advisors

Ö

Ö

75

Badgley Phelps Wealth Managers

Ö

Ö

Ö

Ö

76

Ancora Holdings

Ö

Ö

Ö

Ö

Ö

77

Sonora Investment Management

Ö

Ö

Ö

78

Cardinal Point

Ö

Ö

Ö

Ö

Ö

79

Ullmann Wealth Partners

Ö

Ö

Ö

80

Mosaic Family Wealth

Ö

Ö

Ö

81

Alley Company

Ö

Ö

Ö

Ö

14

Table of Contents

ValueAdded Services

Operational

Marketing and

and

Legal and

Business

Technology

Compliance

Talent

Succession

Partner Firm


Development


Enhancements


Support


Management


Planning

82

Cassaday & Company

Ö

Ö

Ö

Ö

83

Provident Financial Management

Ö

Ö

84

Azimuth Capital Investment Management

Ö

Ö

85

Octogone Holding

Ö

Ö

Ö

Ö

86

Icon Wealth Partners

Ö

Ö

87

FourThought Private Wealth

Ö

Ö

88

Beaumont Financial Partners

Ö

89

Spectrum Wealth Management

Ö

(1) In October 2022, Financial Professionals was merged into Connectus Wealth Advisors.

Our partner firms are primarily located in the United States. Outside of the United States, we have two partner firms, Escala Partners and MEDIQ Financial Services, in Australia, four partner firms, Dorchester Wealth Management, Prime Quadrant, Nexus Investment Management and Cardinal Point, in Canada, one partner firm in Switzerland, Octogone Holding, and one partner firm, Greystone, in the United Kingdom. Our partner firm Connectus also has locations in Australia, Canada and the United Kingdom. The following table shows our domestic and international revenues for the years ended December 31, 2020, 2021 and 2022:


Year Ended December 31, 


2020


2021


2022


(dollars in thousands)


Domestic revenue

$

1,291,630


94.9

%  

$

1,691,345


94.1

%  

$

2,016,845


94.1

%

International revenue


69,689


5.1

%  


106,606


5.9

%  


126,476


5.9

%

Total revenue

$

1,361,319


100.0

%  

$

1,797,951


100.0

%  

$

2,143,321


100.0

%

15

Table of Contents

The maps below show the locations of our partner firms as of February 16, 2023. The majority of our partner firms operate multiple offices.

Graphic

16

Table of Contents

Upon joining our partnership, each partner firm transitions its operations to our common general ledger, payroll and cash management systems. Our common general ledger system provides us access to financial information of each partner firm and is designed to accommodate the varied needs of each individual business. We control payroll and payment of management fees for partner firms through a common disbursement process. The common payroll system allows us to effectively monitor compensation, new hires, terminations and other personnel changes. We employ a cash management system under which cash held by partner firms above a threshold is transferred into our centralized accounts. The cash management system enables us to control and secure our cash flow and more efficiently monitor partner firm earnings and financial position.

We and our partner firms devote substantial time and effort to remaining current on, and addressing, regulatory and compliance matters. Each of our registered partner firms has its own chief compliance officer or other senior officer responsible for compliance and has established a compliance program to help detect and prevent compliance violations.

While the chief compliance officers at our partner firms are principally responsible for maintaining their respective compliance programs and for tailoring them to the specifics of their partner firms’ businesses, we have an experienced team of legal professionals in place at the holding company to support our partner firms in fulfilling their regulatory responsibilities by providing additional guidance and expertise. We collaborate with each of our registered partner firms in their completion of an annual compliance risk assessment, which is conducted by an outside law firm or a compliance consulting firm. We engage third-party firms to conduct periodic cybersecurity audits and help coordinate completion of certain other employee training. We monitor how our partner firms address risk assessment recommendations and regulatory exam findings. We also work with our partner firms to assist them in identifying qualified legal and compliance advisers by leveraging our extensive relationships.

Competition

The wealth management industry is very competitive. We compete with a broad range of wealth management firms, including public and privately held investment advisers, traditional brokerage firms and wirehouses, firms associated with securities broker-dealers, financial institutions, private equity firms, asset managers and insurance companies. We believe that important factors affecting our partner firms’ ability to compete for clients include the ability to attract and retain key wealth management professionals, investment performance, wealth management fee rates, the quality of services provided to clients, the depth and continuity of client relationships, adherence to the fiduciary standard and reputation.

We strategically built a leading partnership of independent, fiduciary wealth management firms led by entrepreneurs through a unique, disciplined and proven acquisition strategy. Our differentiated partnership model has allowed us to grow and enhance our leadership position in the wealth management industry. As we continue our growth strategy of acquiring high-quality partner firms, we believe that important factors affecting our ability to compete for future acquisitions include:

the degree to which target wealth management firms view our partnership model as preferable, financially and operationally or otherwise, to acquisition or other arrangements offered by other potential purchasers;
the reputation and performance of our existing and future partner firms, by which target wealth management firms may judge us and our future prospects; and
the quality and breadth of our value-added services.

Human Capital

As of December 31, 2022, we had over 5,000 employees, 119 of whom were employed at the holding company. Additionally, as of December 31, 2022, there were over 700 management company principals that oversaw partner firms and were not our employees.

17

Table of Contents

People are the key to our business, and we are guided in our human capital initiatives, as in all of our efforts, by our culture which we conscientiously work to foster. We are committed to developing the following four fundamental behaviors and skills to further our mission to be the globally recognized leader in independent fiduciary financial advice: Be Entrepreneurial; Be Collaborative; Be Curious; and Be Professional. We seek to develop and reinforce these behaviors and skills through frequent on-site and off-site training sessions, programs and presentations, and how we work with one another every day.

We recognize that the diversity of our employees, including our partner firms, is a tremendous asset, and are firmly committed to providing equal opportunity in all aspects of employment in order to attract, retain and develop human capital.

Accordingly, discrimination, abuse or harassment of any kind is prohibited in our workplace. Our non-harassment policy details our commitment to providing equal employment opportunities and a workplace that is respectful, productive, and free from unlawful discrimination, abuse or harassment, including sexual harassment. This policy, which is included in our Code of Business Conduct and Ethics and our Employee Handbook, outlines clear procedures for reporting and responding to issues of concern.

We are committed to ensuring a healthy and safe environment and the wellness of our employees and this is exhibited through a number of wellness, training and other programs.

We also conduct regular assessments of our compensation and benefit practices and pay levels to help ensure that employees are compensated fairly and competitively.

For additional information on our human capital programs and initiatives, please see our “Policy on Human Rights, Human Capital Development and Information Protection” available in the Sustainability section of the Investor Relations page of our website, www.focusfinancialpartners.com.

Trademarks

We own many registered trademarks and service marks. We believe the Focus Financial Partners name and the many distinctive marks associated with it are of significant value and are very important to our business. Accordingly, as a general policy, we monitor the use of our marks and vigorously oppose any unauthorized use of them.

We register some of our copyrighted material and otherwise rely on common law protection of our copyrighted materials, but these are not material to our business.

Available Information

We are required to file annual, quarterly and current reports, proxy statements and certain other information with the SEC. The SEC maintains a website at www.sec.gov that contains reports, proxy and information statements and other information regarding registrants that file electronically with the SEC. Any documents filed by us with the SEC, including this Annual Report, can be downloaded from the SEC’s website.

We also make available free of charge through our website, www.focusfinancialpartners.com, electronic copies of certain documents that we file with the SEC, including our Annual Reports on Form 10-K, Quarterly Reports on Form 10-Q, Current Reports on Form 8-K and amendments to those reports filed or furnished pursuant to Section 13(a) or 15(d) of the Securities Exchange Act of 1934, as amended (the “Exchange Act”), as soon as reasonably practicable after we electronically file such material with, or furnish it to, the SEC.

18

Table of Contents

Regulatory Environment

Existing Regulation

Most of our partner firms are subject to extensive regulation in the United States. In addition, some of our partner firms are subject to extensive regulation in Australia, Canada, Switzerland, the United Kingdom and other jurisdictions, as applicable. In the United States, our wealth management partner firms are subject to regulation primarily at the federal level, including regulation by the SEC under the Advisers Act, by the U.S. Department of Labor (the “DOL”) under the Employee Retirement Income Security Act of 1974, as amended (“ERISA”), by the Internal Revenue Service (the “IRS”) under the Internal Revenue Code of 1986, as amended (“IRC”), and by the SEC and the Financial Industry Regulatory Authority (“FINRA”) for our partner firm subsidiaries that are broker dealers. Our partner firms may also be subject to regulation by state regulators for insurance and several other aspects of our partner firms’ activities. Outside of the United States, our firms are primarily regulated by the Australian Securities & Investments Commission (“ASIC”) in Australia, the securities regulators of Canada’s provinces in Canada, the Swiss Financial Market Supervisory Authority (“FINMA”) in Switzerland, the Financial Conduct Authority (“FCA”) in the United Kingdom and other similar regulatory bodies in the jurisdictions in which our partner firms conduct business. Connectus’ operations are regulated by the U.S., U.K., Canada and Australia regulators mentioned above.

Our U.S. based partner firms that are investment advisers are registered with the SEC under the Advisers Act. The Advisers Act imposes numerous obligations on RIAs, including fiduciary duties, compliance and disclosure obligations, recordkeeping requirements and operational requirements. Certain of our partner firms sponsor unregistered and registered funds in the United States and certain foreign jurisdictions. These activities subject those partner firms to additional regulatory requirements in those jurisdictions. In addition, many state securities commissions impose filing requirements on investment advisers that operate or have places of business in their states. Similarly, many states require certain client facing employees of RIAs and FINRA‑registered broker‑dealers to become state-licensed.

Certain of our partner firms have affiliated SEC-registered broker‑dealers for the purpose of distributing funds or other securities products or facilitating securities transactions. Broker‑dealers and their personnel are regulated, to a large extent, by the SEC and self‑regulatory organizations, principally FINRA. In addition, state regulators have supervisory authority over broker‑dealer activities conducted in their states. Broker‑dealers are subject to regulations which cover virtually all aspects of their business, including sales practices, trading practices, use and safekeeping of clients’ funds and securities, recordkeeping and the conduct of directors, officers, employees and representatives. Broker‑dealers are also subject to net capital rules that mandate that they maintain certain levels of capital. Certain partner firms have employees who are registered representatives with either affiliated or unaffiliated broker‑dealers.

Certain of our partner firms have licensed insurance affiliates. State insurance laws grant state insurance regulators broad administrative powers. These supervisory agencies regulate many aspects of the insurance business, including the licensing of insurance brokers and agents and other insurance intermediaries, and trade practices such as marketing, advertising and compensation arrangements entered into by insurance brokers and agents.

Our partner firms are also subject to regulation by the DOL under ERISA and related regulations with respect to investment advisory and management services provided to participants in retirement plans covered by ERISA and subject to regulation by the Internal Revenue Service (“IRS”) with respect to individual retirement accounts (“IRAs”) pursuant to comparable provisions within the IRC. Among other requirements, ERISA and the IRC imposes duties on persons who are fiduciaries under ERISA and the IRC, respectively, and prohibit certain transactions involving related parties.

Additionally, we and our partner firms are subject to various state, federal and international data privacy and cybersecurity laws designed to protect client and employee personally identifiable information. These laws and regulations are increasing in complexity and number, which has resulted in greater compliance risk and cost for us. The unauthorized access, use, theft or destruction of client or employee personal, financial or other data could expose us to potential financial penalties and legal liability.

19

Table of Contents

Certain of our partner firms, with the assistance of certain of our subsidiaries, deploy value-added services to clients in areas such as lending, cash management, valuation, trust and fiduciary services, and insurance. These partner firms and other subsidiaries are subject to additional regulation in the applicable areas to varying degrees.

Additional Regulatory Reform

Our partner firms are subject to numerous regulatory reform initiatives in the United States and in the international jurisdictions where they operate. New laws or regulations, or changes in enforcement of existing laws or regulations, could have a material and adverse impact on the scope or profitability of our partner firms’ business activities or require us and/or our partner firms to change business practices and incur additional costs as well as potential reputational harm.

On December 15, 2020, the DOL adopted a new prohibited transaction exemption that is broadly aligned with the SEC’s rulemaking regarding conduct standards for broker-dealers and investment advisers. The new exemption went into effect on February 16, 2021, and full enforcement began on July 1, 2022. Among other things, the new DOL exemption clarified when advice regarding rollovers from ERISA plans could be considered fiduciary advice.

On December 22, 2020, the SEC announced it had finalized reforms under the Advisers Act regarding investment adviser advertisements and payments to solicitors, and the final compliance date for these new rules was November 4, 2022. These new rules replaced the prior advertising rule’s broad prohibitions and limitations with principles-based regulation. The new rules also clarified that both cash and non-cash compensation paid to solicitors qualify as compensation for referrals. While the impact of these rules appears positive for the business of our partner firms at this early stage, the ultimate impact will only become apparent as the rules are interpreted and clarified over time.

On January 5, 2023, the U.S. Federal Trade Commission (the “FTC”) proposed a rule, which if adopted in its current form, would limit the use of non-competition provisions in employment relationships across the United States. While the proposed rule includes exceptions for non-competition provisions used in acquisition contexts, and notably does not prohibit non-solicitation, confidentiality and other provisions, the proposal, if adopted could limit one important tool that we and our partner firms use to incentivize retention and protect the know-how and assets of our company. A number of states already have similar statutes in force restricting the use of non-competition agreements.

In 2019, a Royal Commission in Australia issued recommendations following a lengthy inquiry into misconduct in the banking, superannuation and financial services industry. Many of those recommendations have now become law, with various regulations having gone into effect throughout 2021 and 2022. In 2021, reforms were introduced which have restricted or prevented product issuers from remunerating financial advisory firms who recommend their products to advisory clients and also require product issuers and product distributors to ensure that products are made available only to persons within the target market determined by the product issuer. Additionally, the Australian government will soon concentrate the regulation of financial advisers in the hands of ASIC following the decommissioning of other regulatory bodies. Some of the other regulations include a repeal of carve-outs and grandfathering of certain conflicted remuneration prohibitions. In 2022, a registration system for financial advisers was introduced which makes it an offense from January 2023 to provide personal financial advice while unregistered. Further, the Quality of Advice Review recommended by the Royal Commission proposes a radical overhaul to improve the quality of financial advice and includes recommendations to broaden the definition of personal advice and introduces changes to the provision of disclosure documents. The final report was provided to the Government at the end of 2022, and the Government is currently working on responding to and implementing the recommendations.

In December 2019, the Canadian Securities Administrators (the “CSA”) adopted amendments to National Instrument 31-103 and its related Companion Policy which impose new heightened requirements on our Canadian partner firms with respect to conflicts of interest, know your client, know your product and suitability obligations. Furthermore, in December 2021, the CSA adopted amendments to National Instrument 33-109 and its related Companion Policy which provide greater clarity on the information to be submitted by our Canadian partner firms to Canadian securities regulators and help individuals and firms provide complete and accurate registration information. These amendments came into force on June 6, 2022.

20

Table of Contents

In January 2020, the new Financial Services Act ("FinSA") and Financial Institutions Act ("FinIA") came into force in Switzerland, together with three implementing ordinances (the Financial Services Ordinance ("FinSO"), the Financial Institutions Ordinance ("FinIO") and the Supervisory Organizations Ordinance ("SOO")). The core objective of this new legislation was to create uniform competitive licensing conditions and supervisory regime for financial institutions in Switzerland and to improve client protection at the point-of-sale. In particular, the FinIA governs the prudential requirements applicable to portfolio managers, trustees, managers of collective assets, fund management companies and securities firms while the FinSA mainly governs the provision of financial services, as well as the offering of financial instruments in Switzerland or to clients in Switzerland, and includes certain organizational requirements and rules of conduct for financial service providers. Our Swiss wealth management partner firm entities have applied under the FinIA transitional provisions for a license with the Swiss Financial Markets Supervisory Authority (“FINMA”) within the applicable deadline (i.e., prior to December 31, 2022). The FINMA licensing process is nearly completed for both of our Swiss wealth management partner firm entities, and the final licensing decisions are expected to be issued in early 2023.

In December 2019, our U.K. wealth management partner firms became subject to the new Senior Managers and Certification Regime, which provides for additional firm and individual responsibilities and enhanced oversight by the U.K. Financial Conduct Authority (the “FCA”). This regime came fully into effect on March 31, 2021. Beginning January 1, 2022, our firms in the U.K. became subject to the new Investment Firms Prudential Regime. The new rules will extend the framework for prudential requirements to consider the potential harm firms pose to clients, consumers and the market. In addition, our U.K. wealth management partner firms will become subject to the new Consumer Duty regime that requires firms to act to deliver good outcomes for retail customers and which will come into effect fully on July 31, 2023 for open products/services and on July 31, 2024 for closed products/services. Our U.K. wealth management partner firms also became subject from December 8, 2022 to additional rules for the U.K. Appointed Representative regime, requiring principals to provide more information on appointed representatives and clarifying the responsibilities of principals for their appointed representatives. On December 9, 2022, the U.K. Government announced a number of proposed reforms aimed at making some areas of U.K. financial services regulation more proportionate, as well as completing the onshoring of rules adopted prior to the U.K.’s exit from the European Union. A number of these reforms are contained in the Financial Services and Markets Bill, which is expected to be passed into law in the first half of 2023. The Bill also includes provisions to limit the ability of firms in the U.K. to approve financial promotions made by unauthorized persons. The U.K. Government also announced plans to review the boundary between regulated financial advice and financial guidance, with the objective of improving access to helpful support, information and advice for consumers, as well as proposals to extend the scope of U.K. regulation in relation to cryptoassets. The U.K. is also in the process of promulgating and implementing climate-related rules, some of which are in effect already. For example, the FCA is proposing new rules relating to the use of terms such as “green” and “ESG,” including a general anti-greenwashing rule applicable to all firms.

Of the many data privacy and cybersecurity laws being enacted or considered, the California Consumer Privacy Act (“CCPA”) became effective on January 1, 2020. The CCPA requires certain partner firms to review and enhance their governance regarding the collection and categorizing of certain personal information. They were also required to develop procedures to respond to consumer and employee requests to be informed of their personal information that is collected and to have such information deleted if desired, among other elements. In November 2021, California extended until January 1, 2023 the exemption from the CCPA for information collected by businesses about employees. Further, in November 2020, California voters approved the California Privacy Rights Act (“CPRA”), which, among other things, expands California residents’ rights over the processing of their personal information and creates a dedicated privacy protection agency. The CPRA will become effective on January 1, 2023. Additionally, our U.K. based partner firms are subject to the U.K. Data Protection Act 2018 (“DPA”) which became effective on May 23, 2018 and the U.K. General Data Protection Regulation (“U.K. GDPR”), which became effective on January 1, 2021. The DPA and U.K. GDPR require these partner firms to enhance (over standards applying prior to May 2018) their governance regarding the collection, sharing and use of personal information. For example, specific disclosures are required about how personal information is collected, shared and used, affected individuals are given certain rights to control use of their personal information, and standards are set out relating to data transfers and the security of personal information.

In addition, financial regulators are increasing their enforcement and examination attention across a wide range of activities and business practices, including disclosure, conflicts of interest, cryptoassets, cybersecurity, business

21

Table of Contents

continuity and succession planning. Such enhanced scrutiny may increase the likelihood of enforcement actions or violation findings, or cause us or our partner firms to change business practices or incur additional costs. It is also not possible to predict how such changes may impact the businesses of our competitors and the competitive dynamics of the industry.

Item 1A. Risk Factors

You should carefully consider the information in this Annual Report and the following risks. Our business, financial condition and results of operations could be materially and adversely affected by any of these risks. The risks described below are not the only ones facing us. Additional risks not presently known to us or which we consider immaterial also may adversely affect us.

Risk Related to Possible Transaction

The announcement of a possible transaction with CD&R could adversely affect our business, financial condition and results of operations. There is no certainty that final terms of any transaction will be agreed upon or, if agreed upon, completed.

On February 2, 2023, we announced that we had entered into an exclusivity agreement for a limited period with CD&R. The announcement of a possible transaction with CD&R could cause disruptions to our business or business relationships and create uncertainty surrounding our business, which could have an adverse impact on our financial condition and results of operations, regardless of whether a definitive agreement is ultimately entered into, including:

partner firm clients, or other parties with which we or our partner firms maintain business relationships may experience uncertainty prior to signing any definitive agreement and then prior to closing of any such transaction or seek to terminate or renegotiate their relationships with us;

principals of our partner firms and employees may experience uncertainty about their future roles with us, which might adversely affect our ability to attract, retain and motivate key personnel and other employees;

the attention of our management may be directed to transaction-related considerations and may be diverted from the day-to-day operations of our business; and

there may be litigation relating to a potential transaction, or injunctions or governmental orders initiated by a governmental entity restraining, enjoining or prohibiting the consummation of any potential transaction, and there may be costs related thereto.

Negotiations regarding definitive terms and agreements are ongoing and there is no certainty that final terms of any transaction will be agreed upon or, if agreed upon, completed. Any transaction would be subject to the completion of due diligence, Board and stockholder approval, regulatory approvals and other customary conditions. We will cease to be a publicly traded company if such a transaction is consummated.

Risks Related to Capital Markets and Competition

Our financial results largely depend on wealth management fees received by our partner firms, which are impacted by market fluctuations.

The substantial majority of our revenues are derived from the wealth management fees charged by our partner firms for providing clients with investment advice, financial and tax planning, consulting, tax return preparation, family office services and other services. A material portion of these wealth management fees are calculated based on a contractual percentage of the client’s assets. Wealth management fees may be adversely affected by prolonged declines in the capital markets because assets of clients (including cryptoassets) may decline and clients may reduce or eliminate

22

Table of Contents

the amount of their assets with respect to which our partner firms provide advice, which in turn could have an adverse effect on our results of operations and financial condition.

Our partner firms may not be able to maintain their current wealth management fee structures.

Our partner firms may not be able to maintain their current wealth management fee structures for any number of reasons, including as a result of poor investment performance, competitive pressures or changes in their mix of wealth management services, including transitioning from a “fee-only” wealth management model to a “fee-based” wealth management model. In order to maintain their fee structure in a competitive environment, our partner firms must be able to continue to provide clients with services that their clients believe justify their fees. Any decline in fee rates could have an adverse effect on our results of operations and financial condition.

The wealth management industry is very competitive.

We compete for acquisition opportunities and our partner firms compete for clients, advisers and other personnel with a broad range of wealth management firms, including public and privately held investment advisers, traditional brokerage firms and wirehouses, firms associated with securities broker-dealers, financial institutions, private equity firms, asset managers and insurance companies, many of whom have greater resources than we do. The wealth management industry is very competitive, with competition based on a variety of factors, including the ability to attract and retain key wealth management professionals, investment performance, wealth management fee rates, the quality of services provided to clients, the depth and continuity of client relationships and adherence to the fiduciary standard and reputation. A number of factors, including the following, serve to increase the competitive risks of our partner firms: (i) many competitors have greater financial, technical, marketing, name recognition and other resources and more personnel than our partner firms do, (ii) potential competitors have a relatively low cost of entering the wealth management industry, (iii) some competitors may invest according to different investment styles or in alternative asset classes that the markets may perceive as more attractive than the investment strategies our partner firms offer, (iv) some competitors charge lower fees for their wealth management services than our partner firms do and (v) some competitors may be able to engage in more widespread marketing activities or may have access to products and services to which our partner firms do not. If we are unable to compete effectively, our results of operations and financial condition may be adversely affected.

Risks Related to Our Operations

Our partner firms’ clients can terminate their client service contracts at any time.

Our partner firms’ clients can generally terminate their client service contracts with us at any time. We cannot be certain that we will be able to retain our existing clients or attract new clients, and these client service contracts and client relationships may be terminated or not renewed for any number of reasons. In particular, poor wealth management service, value-added services or performance of the investment strategies that our partner firms recommend relative to the performance of other wealth management firms could result in the loss of accounts.

Our results of operations could be adversely affected if we are unable to facilitate smooth succession planning.

We cannot predict with certainty how long the principals or employees of our partner firms will continue working, and upon the retirement or exit of a principal or employee, a partner firm’s business may be adversely affected. If we are not successful in facilitating succession planning of our partner firms, our results of operations and financial condition could be adversely affected.

Our business and the businesses of our partner firms are heavily dependent on our respective reputations.

Our business and the businesses of our partner firms depends on earning and maintaining the trust and confidence of our partner firms and the clients of our partner firms. Our reputation is critical to our business and is vulnerable to threats that may be difficult or impossible to control and costly or impossible to remediate. For example,

23

Table of Contents

failure to comply with applicable laws, rules or regulations, errors in our public reports or litigation or the publicity surrounding these events, even if satisfactorily addressed, could adversely impact our reputation, our relationships with our partner firms and the clients of our partner firms and our ability to negotiate acquisitions and partner firm-level acquisitions with wealth management firms, as well as adversely affect our results of operations and financial condition.

Our reliance on our partner firms to report their results to us may make it difficult to respond quickly to negative business developments.

We rely on our partner firms to report their results to us on a monthly basis. We have implemented common general ledger, payroll and cash management systems that allow us to monitor the financial performance and overall operations of our partner firms. However, if our partner firms delay reporting results or informing us of negative business developments, we may not be able to address the situation on a timely basis, which could have an adverse effect on our results of operations and financial condition.

Our controls and procedures may fail or be circumvented, our risk management policies and procedures may be inadequate and operational risks could adversely affect our reputation and financial condition.

We and our partner firms have adopted various controls, procedures, policies and systems to monitor and manage risk in our business. Effective internal controls are necessary for us to provide reliable financial reports, prevent fraud and operate successfully as a public company. Some of our risk evaluation methods depend upon information provided by our partner firms and others and public information regarding markets, clients or other matters. In some cases, however, that information may not be accurate, complete or up-to-date. While we currently believe that our operational controls are effective, we cannot provide assurance that those controls, procedures, policies and systems will always be adequate to identify and manage the internal and external risks in our business in a timely manner. Furthermore, we may have errors in our business processes or fail to implement proper procedures in operating our business, which may expose us to risk of financial loss. We are also subject to the risk that our employees or contractors, the employees or contractors of our partner firms or other third parties may deliberately seek to circumvent established controls to commit fraud or act in ways that are inconsistent with our and our partner firms’ controls, policies and procedures. The financial and reputational impact of control failures could be significant.

The potential for human error in connection with the operational systems of Focus Inc. or its partner firms could disrupt operations, cause losses or lead to regulatory fines.

The operations of Focus Inc. and its partner firms are dependent on its employees and principals. From time-to-time, employees or principals may make mistakes that are not always immediately detected by systems and controls and policies and procedures intended to prevent and detect such errors. These can include calculation errors, errors in processing orders, errors in software implementation, failure to ensure data security, follow processes, patch systems or report issues, failure to follow regulations or internal compliance procedures or errors in judgment. Human errors, even if promptly discovered and remediated, may disrupt operations or result in regulatory fines or sanctions, breach of client contracts, reputational harm or legal liability, which, in turn, may adversely affect our results of operations and financial condition.

Cyber-attacks and other disruptions could compromise our technology infrastructure, which may limit our growth, result in losses or disrupt our business.

Our business is reliant upon financial, accounting and technology systems and networks to process, transmit and store information, including sensitive client and proprietary information, and to conduct many business activities and transactions with clients, advisers, vendors and other third parties. The failure to implement, maintain and safeguard an infrastructure commensurate with the size and scope of our business could impede our productivity and growth, which could adversely impact our results of operations and financial condition. Further, we rely heavily on third parties for certain aspects of our business, including financial intermediaries and technology infrastructure and service providers, and these parties are also susceptible to similar risks.

24

Table of Contents

Although we and our partner firms take protective measures and endeavor to modify them as circumstances warrant, our computer systems, software, networks and mobile devices, and those of third parties on whom we rely, have been subject to and may in the future be vulnerable to cyber-attacks, breaches, unauthorized access, theft, including wire and check fraud, misuse, computer viruses or other malicious code and other events that could have a security impact. Further, our back-up procedures, cyber defenses and capabilities in the event of a failure, interruption or breach of security may not be adequate. If any such events occur, it could jeopardize our, as well as our clients’, employees’ or counterparties’ confidential, proprietary and other sensitive information processed and stored in, and transmitted through, our or third-party computer systems, networks and mobile devices or otherwise cause interruptions or malfunctions in our, as well as our clients’, employees’ or counterparties’ operations. Despite our efforts to ensure the integrity of our systems and networks, it is possible that we may not be able to anticipate or to implement effective preventive measures against all threats, especially because the techniques used change frequently and can originate from a wide variety of sources. As a result, we could experience business disruptions, significant losses, increased costs, reputational harm, regulatory actions or legal liability, any of which could have an adverse effect on our results of operations and financial condition. We may in the future be required to spend significant additional resources to modify existing protective measures or to investigate and remediate vulnerabilities or other exposures, including hiring third-party technology service providers and additional information technology staff. The regulatory framework for data privacy and security worldwide continues to evolve and develop. New, or amendments to or reinterpretations of existing laws, regulations, standards and other obligations may require us to incur additional costs to implement new or revise processes to comply. Any actual or perceived failure to comply with any such laws, regulations and other obligations could result in fines, penalties or other liability. Additionally, we may be subject to litigation and financial losses that are either not insured against fully or not fully covered through any insurance that we maintain.

Our inability to successfully recover from a disaster or other business continuity problem could cause material financial loss, regulatory actions, reputational harm or legal liability.

Should we experience a local or regional disaster or other business continuity problem, such as a terrorist attack, pandemic, security breach, power loss, telecommunications failure, earthquake, hurricane or other natural or man made disaster, our continued success will depend, in part, on the availability of personnel and office facilities, and the proper functioning of computer, telecommunication and other related systems and operations. Further, we could potentially lose client data or experience adverse interruptions to our operations or delivery of services to clients in a disaster recovery scenario, which could result in material financial loss, regulatory action, reputational harm or legal liability.

Focus and its partner firms are dependent on a number of key vendors.

Focus and its partner firms depend on a number of key vendors for various accounting, custody, brokerage and trading, software and technology systems and other operational needs (“Key Vendors”). Moreover, while Focus and its partner firms perform diligence on its Key Vendors in an effort to ensure they operate in accordance with expectations, to the extent any significant deficiencies are uncovered, there may be few, or no, alternative vendors available. In addition, Focus or its partner firms may from time to time transfer key contracts from one vendor to another. Key contract transfers may be costly and complex, and expose Focus or its partner firms to heightened operational risks. Any failure to mitigate such risks could result in reputational harm, as well as financial losses to Focus or its partner firms.

Our insurance coverage may be inadequate or expensive.

We maintain voluntary and required insurance coverage, including, among others, general liability, property, director and officer, errors and omissions, network security and privacy, fidelity bond and fiduciary liability insurance, and insurance required under ERISA. While we endeavor to purchase coverage that is appropriate to our assessment of our risk, we are unable to predict with certainty the frequency, nature or magnitude of claims for direct or consequential damages. Our business may be negatively affected if in the future our insurance proves to be inadequate or unavailable. In addition, insurance claims may harm our reputation or divert management resources away from operating our business.

25

Table of Contents

The ongoing conflict in Ukraine has, and will likely continue to, negatively impact the global economy and may have a material adverse effect on our business, operations and financial results.

The military conflict in Ukraine and the ongoing geopolitical tensions have created significant volatility, uncertainty and economic disruption. The United States, European Union and other countries have announced economic sanctions against Russia. While it has not had a material adverse effect on our business, operations and financial results, the extent to which the conflict impacts our business, operations and financial results going forward will depend on numerous evolving factors that we may not be able to accurately predict, including: the duration and scope of the conflict, governmental and business actions that have been and continue to be taken in response to the conflict, the impact of the conflict on economic activity and any retaliatory actions taken by Russia.

Negotiations regarding definitive terms and agreements are ongoing and there is no certainty that final terms of any transaction will be agreed upon or, if agreed upon, completed. Any transaction would be subject to the completion of due diligence, Board and stockholder approval, regulatory approvals and other customary conditions. We will cease to be a publicly traded company if such a transaction is consummated.

Risks Related to Our Partnership Model and Growth Strategy

Our success depends, in part, on our ability to make successful acquisitions.

Our continued success will depend, in part, upon our ability to find suitable firms to acquire, either directly or on behalf of our existing partner firms, our ability to acquire such firms on acceptable terms and our ability to raise the capital necessary to finance such transactions. We compete with banks, outsourced service providers, private equity firms, asset managers and other wealth management and advisory firms to acquire high-quality wealth management firms. Some of our competitors may be able to outbid us for these acquisition targets. If we identify suitable acquisition targets, we may not be able to complete any such acquisition on terms that are commercially acceptable to us. If we are not successful in acquiring suitable acquisition candidates, it may have an adverse effect on our business and on our earnings and revenue growth.

Acquired businesses may not perform as expected and our due diligence process might not uncover all risk or liabilities.

Acquisitions involve a number of risks, including the following, any of which could have an adverse effect on our partner firms’ and our earnings and revenue growth: (i) incurring costs in excess of, or achieving synergies less than, what we anticipated; (ii) potential loss of key wealth management professionals or other team members of the predecessor firm; (iii) inability to generate sufficient revenue to offset transaction costs; (iv) inability to retain clients following an acquisition; (v) incurring expenses associated with the amortization or impairment of intangible assets, particularly for goodwill and other intangible assets; and (vi) payment of more than fair market value for the assets of the partner firm.

While we intend that our completed acquisitions will improve profitability, past or future acquisitions may not be accretive to earnings or otherwise meet operational or strategic expectations. The failure of any partner firm to perform as expected after acquisition may have an adverse effect on our earnings and revenue growth.

In connection with our acquisitions, we conduct due diligence that we deem reasonable and appropriate based on the facts and circumstances applicable to such transactions. Despite our efforts, due diligence might not reveal all issues and existing and potential liabilities at a given firm.

Contingent consideration payments could result in a higher than expected impact on our future earnings.

Our acquisition structures typically include contingent consideration paid to the sellers upon the achievement of specified financial thresholds. The contingent consideration for acquisitions of new partner firms is typically paid upon the satisfaction of specified growth thresholds typically over a six-year period, and for acquisitions made by our partner

26

Table of Contents

firms, upon the satisfaction of thresholds tied to revenue as adjusted for certain criteria or other operating metrics based on the retention or growth of the business acquired. These arrangements may result in the payment of additional purchase price consideration to the sellers for periods following the closing of an acquisition and payments may occur in periods subsequent to the periods in which the additional earnings or other specified financial thresholds are achieved.

We may incur debt, issue additional equity or use cash on hand to pay for future acquisitions, each of which could adversely affect our financial condition or the market price of our Class A common stock. Additionally, difficulty in obtaining debt, issuing equity or generating cash flow could affect our growth and financial condition and the market price of our Class A common stock.

We will finance future acquisitions through debt financing, including significant draws on our first lien revolving credit facility (the “First Lien Revolver”), issuance of additional term debt, the issuance of equity securities, the use of existing cash or cash equivalents or any combination of the foregoing. Acquisitions financed with debt could require us to dedicate a substantial portion of our cash flow to principal and interest payments. Acquisitions financed with the issuance of our equity securities would be dilutive to the share value and voting power of our existing Class A common stock, which could affect the market price of our Class A common stock. Future acquisitions financed with our own cash could deplete the cash and working capital available to fund our operations adequately. Difficulty borrowing funds, selling securities or generating sufficient cash from operations to finance our activities may have a material adverse effect on our results of operations and financial condition.

The growth of Connectus may create unique challenges and risks.

Our partner firm Connectus has completed acquisitions of wealth management firms and intends to acquire additional wealth management firms in the future. Connectus is different from our other partner firms in that we have a greater degree of management control over areas other than client service and investment operations. Additionally, Connectus is designed to offer integrated technology, investment support, regulatory compliance support and other centralized services on a countrywide basis. If these centralized services are not adequate, or other unanticipated issues with Connectus arise as it grows, such as inability to find a sufficient number of firms to merge into Connectus or integrate them effectively, then our reputation and our results of operations and financial condition could be adversely impacted.

The success of Focus Independence depends upon our ability to lift out teams of wealth management professionals from traditional brokerages and wirehouses.

Our ability to lift out teams of wealth management professionals from traditional brokerages and wirehouses depends on our ability to offer more favorable opportunities than those provided by their current employers, many of which have substantially greater financial resources and may be able to entice their employees to stay. If we are not successful in attracting and lifting out suitable wealth management professionals for our Focus Independence program, it may have an adverse effect on the growth of our revenues and earnings.

We may face operational risks associated with expanding internationally.

Our business strategy includes expanding our presence in non U.S. markets through acquisitions. This strategy presents a number of risks, including: (i) greater difficulties in supporting, or the need to hire additional personnel to support, the operations of foreign partner firms, including an initial unfamiliarity with the laws and regulations applicable in such non-U.S. markets, (ii) language and cultural differences, (iii) unfavorable fluctuations in foreign currency exchange rates, (iv) higher operating costs, (v) unexpected changes in wealth management policies and other regulatory requirements, (vi) adverse tax consequences and (vii) more complex acquisition structures. If our international business increases relative to our total business, these factors could have a more pronounced effect on our results of operations and financial condition.

27

Table of Contents

Risks Related to Our Business Model and Key Professionals

Our partner firms’ autonomy limits our ability to alter their management practices and policies, and our dependence on the principals who manage the businesses of our partner firms may have an adverse effect on our business.

Under the management agreements between our partner firms and the management companies formed by the principals, the management companies provide the personnel who manage the partner firm’s day to day operations and oversee the provision of wealth management and other financial services, the implementation of employment policies, the negotiation, execution and delivery of contracts in connection with the management and operation of the partner firm’s business in the ordinary course and the implementation of policies and procedures to facilitate compliance with all applicable laws, rules and regulations. Such individuals also maintain the primary relationships with clients and vendors. As a consequence, we are exposed to losses resulting from day to day decisions of the principals who manage our partner firm, and our financial condition and results of operations may be adversely affected by problems stemming from the day to day operations of a partner firm, where weaknesses or failures in internal processes or systems could lead to a disruption of the partner firm’s operations, liability to its clients or exposure to regulatory or disciplinary action. Unsatisfactory performance by the principals could also hinder the partner firms’ ability to grow and could have an adverse effect on our business. Further, there is a risk of financial and reputational harm to us if any of our partner firms, among other things, have engaged in, or in the future were to engage in, poor or non compliant business practices or were to experience adverse results.

We rely on our key personnel and principals.

We depend on the efforts of our executive officers, other management team members, employees and principals. Our executive officers, in particular, play an important role in the stability and growth of our business, including the growth and stability of existing partner firms and in identifying potential acquisition opportunities for us. However, there is no guarantee that these officers will remain with us. In addition, our partner firms depend heavily on the services of key principals, who in many cases have managed their predecessor firms for many years. Although we use a combination of economic incentives, transfer restrictions and non-solicitation and non-competition agreements in an effort to retain key management personnel, there is no guarantee that these principals will remain with the respective partner firms. The loss of key management personnel at our partner firms could have an adverse impact on our business. Of the combination of retention mechanics and incentives we use, we note that certain states have enacted laws that restrict the use of non-competition provisions in many instances and that the FTC has recently issued a proposed rulemaking, which if adopted, would restrict the use of non-competition provisions across the United States.

If a management company terminates its management agreement with us, our financial condition and results could be negatively affected.

At the time of the acquisition of a partner firm, we enter into a management agreement with the management company that is substantially owned by the selling principals. Pursuant to the management agreement, the management company provides the personnel who conduct the day to day management and operation of the partner firm. These management agreements can be terminated by the management company at the end of the initial term, which is typically six years. Termination of a management agreement could lead to a disruption of the partner firm’s operations, which could negatively affect our financial condition and results of operations.

Our partner firms may be unable to attract, develop and retain talented wealth management professionals.

Attracting, developing and retaining talented wealth management and other financial services professionals are essential components of the business strategy of our partner firms. To do so, it is critical that they continue to foster an environment and provide compensation that is attractive for their existing and prospective wealth management professionals. If they are unsuccessful in maintaining such an environment (for instance, because of changes in management structure, corporate culture or corporate governance arrangements) or compensation levels for any reason, their existing wealth management professionals may leave the firm or fail to produce their best work on a consistent, long-term basis and/or our partner firms may be unsuccessful in attracting talented new wealth management

28

Table of Contents

professionals, any of which could negatively impact their financial results and our ability to grow and may have an adverse effect on our results of operations and financial condition.

Risks Related to Our Structure

Focus Inc. is dependent upon distributions from Focus LLC. Additionally, to the extent Focus Inc. receives distributions in excess of its tax liabilities and other obligations and retains such excess cash, the unitholders of Focus LLC would benefit from such accumulated cash balances if they exercise their exchange right.

Focus Inc. is a holding company and its most significant asset is its equity interest in Focus LLC. Focus Inc. has no independent means of generating revenue. To the extent Focus LLC has available cash and subject to the terms of Focus LLC’s credit agreements and any other debt instruments, we have caused and intend to continue to cause Focus LLC to make (i) generally pro rata distributions to its unitholders, including Focus Inc., in an amount generally intended to allow such unitholders to satisfy their respective income tax liabilities with respect to their allocable share of the income of Focus LLC, based on certain assumptions and conventions (and actual liability in the case of Focus Inc.), and to allow Focus Inc. to make payments under its three and any subsequent tax receivable agreements (“Tax Receivable Agreements”), and (ii) non pro rata distributions to Focus Inc. in an amount at least sufficient to reimburse Focus Inc. for its corporate and other overhead expenses. We are limited, however, in our ability to cause Focus LLC and its subsidiaries to make these and other distributions to Focus Inc. due to the restrictions under our credit facilities entered into in July 2017, as amended (collectively, the “Credit Facility”). Funds used by Focus LLC to satisfy its distribution obligations will not be available for reinvestment in our business. To the extent that Focus Inc. needs funds and Focus LLC or its subsidiaries are restricted from making such distributions under applicable law or regulation or under the terms of their financing arrangements or are otherwise unable to provide such funds, Focus Inc.’s liquidity and financial condition could be adversely affected.

As a result of potential differences in the amount of net taxable income allocable to Focus Inc. and to the other Focus LLC unitholders, as well as the use of an assumed tax rate in calculating Focus LLC’s tax distribution obligations, Focus Inc. may receive distributions significantly in excess of its tax liabilities and obligations to make payments under the Tax Receivable Agreements. If Focus Inc. retains such cash balances, the unitholders of Focus LLC would benefit from any value attributable to such accumulated cash balances as a result of their exercise of an exchange right.

Focus Inc. is required to make payments under the Tax Receivable Agreements for certain tax benefits it may claim, and the amounts of such payments is expected to be substantial.

The Tax Receivable Agreements generally provide for the payment by Focus Inc. to each TRA holder of 85% of the net cash savings, if any, in U.S. federal, state and local income and franchise tax that Focus Inc. actually realizes (computed using simplifying assumptions to address the impact of state and local taxes) or is deemed to realize in certain circumstances in periods after the IPO as a result of certain increases in tax basis and certain tax benefits attributable to imputed interest. We will retain the benefit of the remaining 15% of these cash savings.

The payment obligations under the Tax Receivable Agreements are Focus Inc.’s obligations and not obligations of Focus LLC, and we expect that such payments required to be made under the Tax Receivable Agreements will be substantial. Estimating the amount and timing of payments that may become due under the Tax Receivable Agreements is by its nature imprecise. Please read “Part II, Item 7, Management’s Discussion and Analysis of Financial Condition and Results of Operations—Liquidity and Capital Resources—Tax Receivable Agreements.”

In certain cases, payments under the Tax Receivable Agreements may be accelerated and/or significantly exceed the actual benefits, if any, realized in respect of the tax attributes subject to the Tax Receivable Agreements.

If we experience a change of control (as defined under the Tax Receivable Agreements, which includes certain mergers, asset sales and other forms of business combinations) or the Tax Receivable Agreements terminate early (at our election or as a result of our breach), Focus Inc. could be required to make a substantial, immediate lump-sum payment. This payment would equal the present value of hypothetical future payments that could be required to be paid under the Tax Receivable Agreements (determined by applying a discount rate of one-year London Interbank Offered Rate

29

Table of Contents

(“LIBOR”) or the functional replacement of LIBOR, plus 1.5%). The calculation of hypothetical future payments will be based upon certain assumptions and deemed events set forth in the Tax Receivable Agreements, and may materially exceed, the actual realization, if any, of the future tax benefits to which the termination payments relate.

Any such accelerated payments could have a substantial negative impact on our liquidity and could have the effect of delaying, deferring or preventing certain mergers, asset sales or other forms of business combinations or changes of control. There can be no assurance that we will be able to finance any payments required to be made under the Tax Receivable Agreements. Please read “Part II, Item 7, Management’s Discussion and Analysis of Financial Condition and Results of Operations—Liquidity and Capital Resources—Tax Receivable Agreements.”

As a result of this payment obligation, holders of our Class A common stock could receive substantially less consideration in connection with a change of control transaction than they would receive in the absence of such obligation. Further, any payment obligations under the Tax Receivable Agreements will not be conditioned upon the TRA holders’ having a continued interest in Focus Inc. or Focus LLC. Accordingly, the TRA holders’ interests may conflict with those of the holders of our Class A common stock.

We will not be reimbursed for any payments made under the Tax Receivable Agreements in the event that any tax benefits are subsequently disallowed.

Payments under the Tax Receivable Agreements will be based on the tax reporting positions that we will determine. The TRA holders will not reimburse us for any payments previously made under the Tax Receivable Agreements if any tax benefits that have given rise to payments under the Tax Receivable Agreements are subsequently disallowed, except that excess payments made to any TRA holder will be netted against payments that would otherwise be made to such TRA holder, if any, after our determination of such excess. As a result, in such circumstances, we could make payments that are greater than our actual cash tax savings, if any, and may not be able to recoup those payments, which could adversely affect our liquidity.

If Focus LLC were to become a publicly traded partnership taxable as a corporation for U.S. federal income tax purposes, significant tax inefficiencies might result.

A number of aspects of our structure depend on the classification of Focus LLC as a partnership for U.S. federal income tax purposes. While Focus LLC has taken steps to avail itself of safe harbors to protect itself from being treated as a “publicly traded partnership” under U.S. Treasury regulations, such a treatment would likely result in significant tax inefficiencies, including as a result of Focus Inc.’s inability to file a consolidated U.S. federal income tax return with Focus LLC. In addition, Focus Inc. would no longer have the benefit of the increases in tax basis covered under the Tax Receivable Agreements, and Focus Inc. would not be able to recover any payments previously made under the Tax Receivable Agreements, even if the corresponding tax benefits (including any claimed increase in the tax basis of Focus LLC’s assets) were subsequently determined to have been unavailable.

Risks Related to Financing and Liquidity

We may not be able to generate sufficient cash to service all of our indebtedness and may be forced to take other actions to satisfy our obligations under applicable debt instruments, which may not be successful.

At December 31, 2022, we had outstanding borrowings under the Credit Facility of approximately $2.6 billion at stated value. Our ability to make scheduled payments on or to refinance our indebtedness including the Credit Facility, depends on our financial condition and operating performance, which are subject to prevailing economic and competitive conditions and certain financial, business and other factors beyond our control. We may not be able to maintain a level of cash flow from operating activities sufficient to permit us to pay the principal and interest on our indebtedness.

If our cash flows and capital resources are insufficient to fund debt service obligations, we may be forced to reduce or delay acquisitions or partner firm-level acquisitions and capital expenditures, sell assets, seek additional capital or restructure or refinance indebtedness. Our ability to restructure or refinance indebtedness will depend on the condition

30

Table of Contents

of the capital markets and our financial condition at such time. Any refinancing of indebtedness could be at higher interest rates and may require us to comply with more onerous covenants, which could further restrict business operations. The terms of existing or future debt instruments may restrict us from adopting some of these alternatives. In addition, any failure to make payments of interest and principal on outstanding indebtedness on a timely basis could harm our ability to incur additional indebtedness. In the absence of sufficient cash flows and capital resources, we could face substantial liquidity problems and might be required to dispose of material assets or operations to meet debt service and other obligations. The Credit Facility currently restricts our ability to dispose of assets and our use of the proceeds from such disposition. We may not be able to consummate those dispositions, and the proceeds of any such disposition may not be adequate to meet any debt service obligations then due. These alternative measures may not be successful and may not permit us to meet scheduled debt service obligations.

Restrictions in our existing and future debt agreements could limit our growth and our ability to engage in certain activities.

The Credit Facility contains a number of customary covenants, including provisions regarding (i) incurring additional indebtedness or guarantees, (ii) creating liens or other encumbrances on property or granting negative pledges, (iii) entering into a merger or similar transaction, (iv) selling or transferring certain property and (v) declaring dividends or making other restricted payments.

In addition, the Credit Facility requires us to maintain certain financial ratios. These restrictions may also limit our ability to obtain future financings, to withstand a future downturn in our business or the economy in general, or to otherwise conduct necessary corporate activities. We may also be prevented from taking advantage of acquisitions or other business opportunities that arise because of the limitations that the restrictive covenants under the Credit Facility impose on us.

A breach of any covenant in the Credit Facility would result in a default under the applicable agreement after any applicable grace periods. A default, if not waived, could result in acceleration of the indebtedness outstanding under the Credit Facility. The accelerated indebtedness would become immediately due and payable. If that occurs, we may not be able to make all of the required payments or borrow on short notice sufficient funds to refinance such indebtedness.

Risks Related to Regulation and Litigation

Our business is highly regulated.

Our partner firms are subject to extensive regulation by various regulatory and self-regulatory authorities in the United States, Australia, Canada, Switzerland, the United Kingdom and other jurisdictions in which our partner firms conduct business. See “Part I. Item 1, Business—Regulatory Environment.”

Providing investment advice to clients is regulated at both the federal and state level in the United States. Our partner firms are predominantly investment advisers registered with the SEC under the Advisers Act. Each firm that is a federally registered investment adviser is regulated and subject to examination by the SEC. The Advisers Act imposes numerous obligations on RIAs, including fiduciary duties, disclosure obligations, recordkeeping and reporting requirements, marketing restrictions and general anti-fraud prohibitions. Some of our partner firms manage registered and unregistered funds that subject them to additional disclosure and compliance requirements. The failure to comply with the Advisers Act and other securities laws and regulations could cause the SEC to institute proceedings and impose sanctions for violations, including censure or terminating their SEC registrations and could also result in litigation or reputational harm. In addition, our partner firms who are investment advisers are subject to notice filings and the anti-fraud rules of state securities regulators and certain individuals are subject to state registration in many instances under applicable state securities laws.

Our U.S. partner firms are also subject to regulation by the DOL under ERISA and related regulations with respect to investment advisory and management services provided to retirement plans and plan participants covered by ERISA and by the IRS with respect to IRAs pursuant to comparable provisions within the IRC. Among other

31

Table of Contents

requirements, ERISA and the IRC impose duties on persons who are fiduciaries under ERISA and the IRC, respectively, and prohibits certain transactions involving related parties.

Certain of our partner firms have affiliated SEC-registered broker-dealers. Broker-dealers and their personnel are regulated, to a large extent, by the SEC and self-regulatory organizations, principally FINRA and are subject to regulations which cover all aspects of the securities business. Further, certain of our partner firms have licensed insurance affiliates. State insurance laws grant supervisory agencies, including state insurance departments, broad administrative authority. Further, we and our partner firms are subject to anti-corruption laws and certain of our firms are subject to anti-money laundering laws in the jurisdictions in which we operate, as well as regulation and enforcement by agencies charged with administering those laws.

Certain of our partner firms, with the assistance of certain of our subsidiaries, deploy value-added services to clients in areas such as lending, cash management, valuation, trust and fiduciary services, and insurance. These partner firms and other subsidiaries are subject to additional regulation in the applicable areas to varying degrees.

Our international operations are subject to additional non-U.S. regulatory requirements.

We have partner firms located in Australia, Canada, Switzerland, the United Kingdom and other jurisdictions. We may have partner firms located in additional non-U.S. jurisdictions in the future. Failure to comply with the applicable laws, rules, regulations, codes, directives, notices or guidelines in any jurisdiction outside of the United States could result in a wide range of penalties and disciplinary actions, including fines, censures and the suspension or expulsion from a particular jurisdiction or market or the revocation of licenses, any of which could adversely affect our reputation and operations and our partner firms in those jurisdictions. Regulators in jurisdictions outside of the United States could also change their policies or laws in a manner that might restrict or otherwise impede the ability of such partner firms to offer wealth management services in their respective markets, or they may be unable to keep up with, or adapt to, changing, complex regulatory requirements in such jurisdictions or markets, which could further negatively impact our business.

The regulatory environment in which our partner firms operate is subject to continuous change, and regulatory developments designed to increase oversight may adversely affect our business.

The legislative and regulatory environment in which our partner firms operate has undergone significant changes in the recent past. Regulatory review or the issuance of interpretations of existing laws and regulations may result in the enactment of new laws and regulations that could adversely affect our operations or our ability to conduct business profitably. We are unable to predict whether any such laws or regulations will be enacted and to what extent such laws and regulations would affect our business. See “Part I. Item 1, Business – Regulatory Environment.”

Changes to applicable tax laws and regulations or exposure to additional income tax liabilities could affect our business and future profitability.

We are subject to various complex and evolving U.S. federal, state and local and non-U.S. taxes. U.S. federal, state and local and non-U.S. tax laws, policies, statutes, rules, regulations or ordinances could be interpreted, changed, modified or applied adversely to us, in each case, possibly with retroactive effect, and may have an adverse effect on our business and future profitability.

Our business is subject to risks related to legal proceedings and governmental inquiries.

Our business is subject to litigation, regulatory investigations and claims arising in the normal course of operations. The risks associated with these matters often may be difficult to assess or quantify and the existence and magnitude of potential claims often remain unknown for substantial periods of time.

Our partner firms depend to a large extent on their network of relationships and on their reputation to attract and retain clients. The principals and other wealth management professionals at our partner firms make investment decisions on behalf of clients that could result in substantial losses. If clients suffer significant losses, or are otherwise dissatisfied

32

Table of Contents

with wealth management or value-added services, we could be subject to the risk of legal liabilities or actions alleging, breach of fiduciary duties, negligent misconduct, breach of contract, unjust enrichment and/or fraud. Moreover, our partner firms are predominantly U.S. RIAs and have a legal obligation to operate under the fiduciary standard, a heightened standard as compared to the standard of conduct applicable to broker-dealers. These risks are often difficult to assess or quantify and their existence and magnitude often remain unknown for substantial periods of time, even after an action has been commenced.

Our involvement in any investigations and lawsuits would cause us to incur additional legal and other costs and, if we were found to have violated any laws, we could be required to pay fines, damages and other costs, perhaps in material amounts. Regardless of final costs, these matters could have an adverse effect on our business by exposing us to negative publicity, reputational damage, harm to our partner firms’ client relationships or diversion of personnel and management resources.

Principal or employee misconduct or disclosure of confidential information could expose us to significant legal liability and reputational harm.

We are vulnerable to reputational harm because our partner firms operate in an industry in which personal relationships, integrity and the confidence of clients are of critical importance. The principals and employees at our partner firms could engage in misconduct that adversely affects our business. For example, if a principal or employee were to engage in illegal or suspicious activities, a partner firm could be subject to regulatory sanctions and we could suffer serious harm to our reputation (as a consequence of the negative perception resulting from such activities), our financial position, our partner firms’ client relationships and their ability to attract new clients.

The wealth management business often requires that we deal with confidential information. If principals or employees at our partner firms were to improperly use or disclose this information, even if inadvertently, we or our partner firms could be subject to legal action and suffer serious harm to our reputation, financial position and current and future business relationships or those of our partner firms. It is not always possible to deter misconduct, and the precautions we take to detect and prevent this activity may not always be effective. Misconduct by principals or employees at our partner firms, or even unsubstantiated allegations of misconduct, could result in an adverse effect on our reputation and our business.

Failure to properly disclose conflicts of interest and comply with fiduciary duty requirements could harm our reputation, business and results of operations.

Some of our partner firms have affiliated SEC registered broker dealers and licensed insurance affiliates, which create conflicts of interests. Certain of our partner firms, with the assistance of certain of our subsidiaries, offer clients value-added services through third-party service providers in exchange for compensation to such partner firms and/or to us, creating a conflict of interest. Certain of our partner firms entrust the management of their clients’ assets to other partner firms (i.e., affiliates), which is also a conflict of interest. Certain of our partner firms also have compensation arrangements pursuant to which they receive payments based on client assets invested in certain third party mutual funds. Such arrangements allow a partner firm to receive payments from multiple parties based on the same client asset and can incentivize a partner firm to act in a manner contrary to the best interests of its clients. As investment advisers subject to a legal obligation to operate under the fiduciary standard, these partner firms must fully disclose any conflicts between their interests and those of their clients. The SEC and other regulators have increased their scrutiny of potential conflicts of interest, and our partner firms have implemented policies and procedures to mitigate conflicts of interest. However, if our partner firms fail to fully disclose conflicts of interest or if their policies and procedures are not effective, they could face reputational damage, litigation or regulatory proceedings or penalties, any of which may adversely affect our reputation, business and results of operations.

The hiring of certain advisers or acquisitions of newly established RIA firms expose us to litigation risk.

Our partner firms may from time to time hire advisers employed at traditional brokerages and wirehouses or unaffiliated RIA firms. Additionally, our Focus Independence program has typically involved the acquisition of substantially all of the assets of new wealth management firms formed by teams of wealth management professionals

33

Table of Contents

formerly employed at traditional brokerages and wirehouses. These hirings and acquisitions may expose us to the risk of legal actions alleging misappropriation of confidential information, including client information, unfair competition, and breach of contract. These risks are often difficult to assess or quantify and their existence and magnitude often remain unknown for substantial periods of time, even after an action has been commenced. We may incur significant legal expenses in defending against litigation commenced by any such brokerage, wirehouse or unaffiliated RIA firm. Substantial legal liability could have an adverse effect on our business, results of operations or financial condition or cause significant reputational harm to us.

In the event of a change of control of our company, we will likely be required to obtain the consent of our partner firms’ advisory clients to the change of control.

As required by the Advisers Act, the investment advisory agreements entered into by our investment adviser subsidiaries provide that an “assignment” of the agreement may not be made without the client’s consent. Under the Investment Company Act of 1940 (the “Investment Company Act”), advisory agreements with registered funds provide that they terminate automatically upon “assignment” and the board of directors and the shareholders of the registered fund must approve a new agreement for advisory services to continue. Under both the Advisers Act and the Investment Company Act, a change of ownership may constitute such an “assignment” if it is a change of control. For example, under certain circumstances, an assignment may be deemed to occur if a controlling block of voting securities is transferred, if any party acquires control, or, in certain circumstances, if a controlling party gives up control. Under the Investment Company Act, a 25% voting interest is presumed to constitute control. An assignment or a change of control could be deemed to occur in the future if we, or one of our investment adviser subsidiaries, were to gain or lose a controlling person, or in other situations that may depend significantly on facts and circumstances. In any such case we would seek to obtain the consent of our advisory clients, including any funds, to the assignment. To the extent of any failure to obtain these consents, our results of operations, financial condition or business could be adversely affected.

Risks Related to Our Class A Common Stock, Ownership and Governance

An active, liquid and orderly trading market for our Class A common stock may not be maintained, and our stock price may be volatile.

An active, liquid and orderly trading market for our Class A common stock may not be maintained. Active, liquid and orderly trading markets usually result in less price volatility and more efficiency in carrying out investors’ purchase and sale orders. The market price of our Class A common stock could vary significantly as a result of a number of factors, some of which are beyond our control. In the event of a drop in the market price of our Class A common stock, you could lose a substantial part or all of your investment in our Class A common stock.

If our operating and financial performance in any given period does not meet the guidance that we have provided to the public or the expectations of our investors and analysts, our stock price may decline.

We provide public guidance on our expected operating and financial results for future periods. Although we believe that this guidance provides investors and analysts with a better understanding of management’s expectations for the future and is useful to our stockholders and potential stockholders, such guidance is comprised of forward-looking statements subject to the risks and uncertainties described in this report and in our other public filings and public statements. Our actual results may not always be in line with or exceed the guidance we have provided or the expectations of our investors and analysts, especially in times of economic uncertainty. In the past, when results have differed from such guidance or expectations, the market price of our common stock has declined. If, in the future, our operating or financial results for a particular period do not meet our guidance or the expectations of our investors and analysts or if we reduce our guidance for future periods, the market price of our common stock may decline.

Investment vehicles affiliated with our private equity investor own a substantial percentage of the voting power of our common stock.

Holders of Class A common stock and Class B common stock vote together as a single class on all matters presented to our shareholders for their vote or approval, except as otherwise required by applicable law or our certificate

34

Table of Contents

of incorporation. As of February 13, 2023, investment vehicles affiliated with Stone Point owned approximately 11.8% of our Class A common stock (representing 9.1% of the economic interest and 10.0% of the voting power) and 69.8% of our Class B common stock (representing 0% of the economic interest and 10.6% of the voting power).

Stone Point has the right to nominate two members of our board of directors for so long as they maintain certain ownership stakes. The existence of a significant shareholder may also have the effect of deterring hostile takeovers, delaying or preventing changes in control or changes in management, or limiting the ability of our other shareholders to approve transactions that they may deem to be in the best interests of our company.

Moreover, this concentration of stock ownership may also adversely affect the trading price of our Class A common stock to the extent investors perceive a disadvantage in owning stock of our company.

The interests of our private equity investor may differ from those of our public shareholders.

So long as Stone Point continues to control a significant amount of our common stock, it will continue to be able to strongly influence all matters requiring shareholder approval, regardless of whether or not other shareholders believe that a potential transaction is in their own best interests. In any of these matters, the interests of Stone Point (including its interests, if any, as a TRA holder) may differ or conflict with the interests of our other shareholders. For example, Stone Point may have different tax positions from us which could influence its decisions regarding whether and when to dispose of assets, whether and when to incur new or refinance existing indebtedness, especially in light of the existence of the Tax Receivable Agreements, and whether and when Focus Inc. should terminate the Tax Receivable Agreements and accelerate its obligations thereunder; provided that any decision to terminate the Tax Receivable Agreements and accelerate the obligations thereunder would also require the approval of a majority of the disinterested directors of Focus Inc. In addition, the structuring of future transactions may take into consideration Stone Point’s tax or other considerations even where no similar benefit would accrue to us. See “Part II, Item 7, Management’s Discussion and Analysis of Financial Condition and Results of Operations—Liquidity and Capital Resources—Tax Receivable Agreements.”

Our certificate of incorporation and bylaws, as well as Delaware law, contain provisions that could discourage acquisition bids or merger proposals, which may adversely affect the market price of our Class A common stock.

Our certificate of incorporation authorizes our board of directors to issue one or more classes or series of preferred stock, the terms of which may be established and the shares of which may be issued without shareholder approval, and which may include super voting, special approval, dividend, repurchase rights, liquidation preferences or other rights or preferences superior to the rights of the holders of Class A common stock. The terms of one or more classes or series of preferred stock could adversely impact the value or our Class A common stock. Furthermore, if our board of directors elects to issue preferred stock it could be more difficult for a third party to acquire us. For example, our board of directors may grant holders of preferred stock the right to elect some number of our directors in all events or upon the occurrence of specified events or the right to veto specified transactions.

In addition, some provisions of our certificate of incorporation and bylaws could make it more difficult for a third party to acquire control of us, even if the change of control would be beneficial to our shareholders, including: (i) prohibiting us from engaging in any business combination with any interested shareholder for a period of three years following the time that the shareholder became an interested shareholder, subject to certain exceptions, (ii) establishing advance notice provisions with regard to shareholder proposals relating to the nomination of candidates for election as directors or new business to be brought before meetings of our shareholders, (iii) providing that the authorized number of directors may be changed only by resolution of the board of directors, (iv) providing that all vacancies in our board of directors may, except as otherwise be required, be filled by the affirmative vote of a majority of directors then in office, even if less than a quorum, (v) providing that our amended and restated certificate of incorporation and amended and restated bylaws may be amended by the affirmative vote of the holders of at least two-thirds of our then outstanding voting stock, (vi) providing for our board of directors to be divided into three classes of directors, (vii) providing that our amended and restated bylaws can be amended by the board of directors, (viii) limitations on the ability of shareholders to call special meetings, (ix) limitations on the ability of shareholders to act by written consent, and (x) renouncing any

35

Table of Contents

reasonable expectancy interest that we have in, or right to be offered an opportunity to participate in, any corporate or business opportunities that are from time to time presented to Stone Point directors affiliated with these parties and their respective affiliates.

Our amended and restated certificate of incorporation designates the Court of Chancery of the State of Delaware as the sole and exclusive forum for certain types of actions and proceedings that may be initiated by our shareholders, which could limit our shareholders’ ability to obtain a favorable judicial forum for disputes with us or our directors, officers, employees or agents.

Our amended and restated certificate of incorporation provides that, unless we consent in writing to the selection of an alternative forum, the Court of Chancery of the State of Delaware will, to the fullest extent permitted by applicable law, be the sole and exclusive forum for (i) any derivative action or proceeding brought on our behalf, (ii) any action asserting a claim of breach of a fiduciary duty owed by any of our directors, officers, employees, agents or trustees to us or our shareholders, (iii) any action asserting a claim against us or any director or officer or other employee of ours arising pursuant to any provision of the Delaware General Corporation Law (the “DGCL”), our amended and restated certificate of incorporation or our bylaws or (iv) any action asserting a claim against us or any director or officer or other employee of ours that is governed by the internal affairs doctrine, in each such case subject to such Court of Chancery having personal jurisdiction over the indispensable parties named as defendants therein. Unless we consent in writing to the selection of an alternative forum, to the fullest extent permitted by law, the federal district courts of the United States will be the exclusive forum for resolving any complaint asserting a cause of action arising under the federal securities laws of the United States. Any person or entity purchasing or otherwise acquiring any interest in shares of our capital stock will be deemed to have notice of, and consented to, the provisions of our amended and restated certificate of incorporation described in the preceding sentence. This choice of forum provision may limit a shareholder’s ability to bring a claim in a judicial forum that it finds favorable for disputes with us or our directors, officers, employees or agents, which may discourage such lawsuits against us and such persons. Alternatively, if a court were to find these provisions of our amended and restated certificate of incorporation inapplicable to, or unenforceable in respect of, one or more of the specified types of actions or proceedings, we may incur additional costs associated with resolving such matters in other jurisdictions, which could adversely affect our results of operations and financial condition.

We do not have any current plans to pay dividends on our Class A common stock. Consequently, the only opportunity that holders of our Class A common stock will have to achieve a return on their investment in our Class A common stock is if the price of our Class A common stock appreciates.

We do not have any current plans to declare dividends on shares of our Class A common stock in the foreseeable future. Consequently, the only opportunity that holders of our Class A common stock will have to achieve a return on their investment in our Class A common stock will be if they sell their shares of Class A common stock at a price greater than they may pay for them. There is no guarantee that the price of our Class A common stock will ever exceed the price that a holder of our Class A common stock may pay for them.

Future sales or other issuances of our Class A common stock in the public market could reduce our stock price, and any additional capital raised by us through the sale of equity or convertible securities may dilute your ownership in us.

Unitholders of Focus LLC (other than Focus Inc. and any of its subsidiaries) may receive shares of our Class A common stock pursuant to the exercise of an exchange right or the call right and then sell those shares of Class A common stock. Additionally, we may issue additional shares of Class A common stock or convertible securities in subsequent offerings or as consideration for future acquisitions.

We have approximately 4,100,000 shares of our Class A common stock registered under our registration statements on Form S-8 for additional issuances under our equity incentive plan, that are available for resale in the public market without restriction, subject to the satisfaction of vesting, the requirements of Rule 144 and any other conditions.

36

Table of Contents

We cannot predict the size of future issuances or sales of our Class A common stock or securities convertible into Class A common stock or the effect, if any, that future issuances and sales of shares of our Class A common stock will have on the market price of our Class A common stock. Sales of substantial amounts or other issuances of our Class A common stock (including shares issued in connection with an acquisition), or the perception that such could occur, may adversely affect prevailing market prices of our Class A common stock.

Item 1B. Unresolved Staff Comments

None.

Item 2. Properties

We and our partner firms conduct our operations using leased office facilities. While we believe we have suitable office space currently, we will continue to evaluate our office space requirements and will complement these facilities as necessary.

Our corporate headquarters is located at 875 Third Avenue, 28th Floor, New York, New York, where we occupy approximately 29,700 square feet of space under a lease, the term of which expires in 2035. In addition, each of our partner firms lease office space in the city or cities in which it conducts business.

37

Table of Contents

Item 3. Legal Proceedings

We are, from time to time, involved in various legal claims and regulatory matters arising out of our operations in the normal course of business. After consultation with legal counsel, we do not believe that the resolutions of any matters we are currently involved in, individually or in the aggregate, will have a material adverse impact on our financial condition, results of operations or cash flows. However, we can provide no assurance that any pending or future matters will not have a material effect on our financial condition, results of operations or cash flows in future reporting periods.

From time to time, we and our partner firms receive requests for information from governmental authorities. While we are unable to determine the ultimate outcome of any matter, we believe that the resolution of all current governmental inquiries will not have a material impact on our financial condition, results of operations or cash flows.

Item 4. Mine Safety Disclosures

Not applicable

38

Table of Contents

PART II

Item 5. Market For Registrant’s Common Equity, Related Stockholder Matters and Issuer Purchases of Equity Securities

Market Information and Holders

Our Class A common stock trades on the Nasdaq Global Select Market under the symbol “FOCS”.

As of February 13, 2023, we had 5 holders of record of our Class A common stock. This number excludes owners for whom Class A common stock may be held in “street” name.

There is no public market for our Class B common stock. As of February 13, 2023, we had 39 holders of record of our Class B common stock.

Dividends

We do not have any current plans to declare dividends on shares of our Class A common stock in the foreseeable future. We currently intend to retain future earnings, if any, to finance the growth of our business and for other ordinary corporate purposes. Our future dividend policy is within the discretion of our board of directors and will depend upon then-existing conditions, including our results of operations, financial condition, capital requirements, investment opportunities, statutory restrictions on our ability to pay dividends and other factors our board of directors may deem relevant. In addition, the Credit Facility contains certain restrictions on our ability to pay cash dividends.

Securities Authorized for Issuance Under Equity Compensation Plans

The information relating to our equity compensation plans required by Item 5 is incorporated by reference to such information as set forth in “Part III, Item 12, Security Ownership of Certain Beneficial Owners and Management and Related Stockholder Matters.”

Recent Sales of Unregistered Securities

During the three months ended December 31, 2022, we issued an aggregate of 28,291 shares of Class A common stock and retired 1,685 shares of Class B common stock and 71,176 incentive units in Focus LLC and acquire 28,291 common units in Focus LLC, in each case as part of our regular quarterly exchanges offered to holders of units in Focus LLC.

During the three months ended December 31, 2022, Focus LLC issued 139,099 common units and we issued a corresponding number of shares of Class B common stock in connection with an acquisition.

The issuance of such securities was made in reliance upon an exemption from the registration requirements of the Securities Act of 1933, as amended, pursuant to Section 4(a)(2) thereof.

Each Focus LLC common unit, together with a corresponding share of Class B common stock, and Focus LLC incentive unit (after conversion into a number of common units taking into account the then current value of the common units and such incentive unit’s aggregate hurdle amount) is exchangeable, pursuant to the terms and subject to the conditions set forth in the Operating Agreement, for one share of our Class A common stock, or, if either we or Focus LLC so elects, cash.

Item 6. (Reserved)

39

Table of Contents

Item 7. Management’s Discussion and Analysis of Financial Condition and Results of Operations

You should read this discussion and analysis of our financial condition and results of operations in conjunction with the historical financial statements and related notes included elsewhere in this Annual Report. The information in this section contains forward-looking statements. Please read “Cautionary Statement Regarding Forward-Looking Statements.” Our actual results may differ significantly from the results suggested by these forward-looking statements and from our historical results. Some factors that may cause our results to differ are described in “Part I, Item 1A, Risk Factors.”

Overview

We are a leading partnership of independent, fiduciary wealth management firms operating in the highly fragmented RIA industry, with a footprint of over 85 partner firms primarily in the United States. We have achieved this market leadership by positioning ourselves as the partner of choice for many firms in an industry where a number of secular trends are driving consolidation. Our partner firms primarily service ultra-high net worth and high net worth individuals and families by providing highly differentiated and comprehensive wealth management services. Our partner firms benefit from our intellectual and financial resources, operating as part of a scaled business model with aligned economic interests, while retaining their entrepreneurial culture and independence.

Our partnership is comprised of trusted professionals providing comprehensive wealth management services through a largely recurring, fee-based model, which differentiates our partner firms from the traditional brokerage platforms whose revenues are largely derived from commissions. We derive a substantial majority of our revenues from wealth management fees for investment advice, financial and tax planning, consulting, tax return preparation, family office services and other services. We also generate other revenues primarily from recordkeeping and administration service fees, commissions and distribution fees and outsourced services.

Since we began revenue-generating and acquisition activities in 2006, we have created a partnership of over 85 partner firms, the substantial majority of which are RIAs registered with the SEC and built a business with revenues in excess of $2.1 billion for the year ended December 31, 2022. For the year ended December 31, 2022, in excess of 95% of our revenues were fee-based and recurring in nature. We have established a national footprint across the United States and primarily expanded our international presence into Australia, Canada, Switzerland and the United Kingdom.

Sources of Revenue

Our partner firms provide comprehensive wealth management services through a largely recurring, fee-based model. We derive a substantial majority of our revenue from wealth management fees, which are composed of fees earned from wealth management services, including investment advice, financial and tax planning, consulting, tax return preparation, family office services and other services. Fees are primarily based either on a contractual percentage of the client’s assets based on the market value of the client’s assets on the predetermined billing date, a flat fee, an hourly rate based on predetermined billing rates or a combination of such fees and are billed either in advance or arrears on a monthly, quarterly or semiannual basis. In certain cases, such wealth management fees may be subject to minimum fee levels depending on the services performed. We also generate other revenues, which primarily include recordkeeping and administration service fees, commissions and distribution fees and outsourced services. The following table summarizes our sources of revenue:

Year Ended December 31, 


2020

2021

2022


% of Total


% of Total


% of Total


Revenues

Revenues

Revenues

Revenues

Revenues

Revenues


(dollars in thousands)


Wealth management fees

$

1,286,130


94.5

%  

$

1,717,365


95.5

%  

$

2,056,328


95.9

%

Other


75,189


5.5

%  


80,586


4.5

%  


86,993


4.1

%

Total revenues

$

1,361,319


100.0

%  

$

1,797,951


100.0

%  

$

2,143,321


100.0

%

40

Table of Contents

During the years ended December 31, 2020, 2021 and 2022, our wealth management fees were impacted by the acquisitions of new partner firms and the growth of existing partner firms, which includes the acquisitions of wealth management practices and customer relationships by our existing partner firms. In 2020, 2021 and 2022, we completed acquisitions of 7, 14 and 5 partner firms, respectively. In 2020, the new partner firms were Nexus Investment Management, MEDIQ Financial Services, InterOcean Capital, Seasons of Advice, CornerStone Partners, Fairway Wealth Management and Kavar Capital Partners. In 2021, the new partner firms were Hill Investment Group, Prairie Capital Management, Rollins Financial, ARS Wealth Advisors, Badgley Phelps Wealth Managers, Ancora Holdings, Sonora Investment Management, Cardinal Point, Ullmann Wealth Partners, Mosaic Family Wealth, Alley Company, Cassaday & Company, Provident Financial Management and London & Co. The new partner firms Provident Financial Management and London & Co. combined their respective businesses in December 2021 and operate as Provident Financial Management. In 2022, the new partner firms were Azimuth Capital Investment Management, Octogone Holding, Icon Wealth Partners, FourThought Private Wealth and Beaumont Financial Partners.

In 2020, 2021 and 2022, our partner firms completed 18, 24 and 19 transactions, respectively, consisting of business acquisitions accounted for in accordance with Accounting Standard Codification (“ASC”) Topic 805: Business Combinations and asset acquisitions, including, 4, 8 and 1 transactions completed by Connectus in 2020, 2021 and 2022, respectively.

See Note 4 to our consolidated financial statements for additional information about our acquisitions.

For the year ended December 31, 2022, in excess of 95% of our revenues were fee-based and recurring in nature. Although the substantial majority of our revenues are fee-based and recurring, our revenues can fluctuate due to macroeconomic factors and the overall state of the financial markets, particularly in the United States. Our partner firms’ wealth management fees are primarily based either on a contractual percentage of the client’s assets based on the market value of the client’s assets on the predetermined billing date, a flat fee, an hourly rate based on predetermined billing rates or a combination of such fees and are billed either in advance or arrears on a monthly, quarterly or semiannual basis. We estimate that approximately 24% of our revenues for the year ended December 31, 2022 were not directly correlated to the financial markets. Of the 76% of our revenues that were directly correlated to the financial markets, primarily equities and fixed income, for the year ended December 31, 2022, we estimate that approximately 66% of such revenues were generated from advance billings. We estimate that approximately 28% of our revenues for the three months ended December 31, 2022 were not directly correlated to the financial markets. Of the 72% of our revenues that were directly correlated to the financial markets, primarily equities and fixed income, for the three months ended December 31, 2022, we estimate that approximately 65% of such revenues were generated from advance billings. These revenues are impacted by market movements as a result of contractual provisions with clients that entitle our partner firms to bill for their services either in advance or arrears based on the value of client assets at such time. Since approximately 65% of our market correlated revenues are set based on the market value of client assets in advance of the respective service period, this generally results in a one quarter lagged effect of any market movements on our revenues. Longer term trends in the financial markets may favorably or unfavorably impact our total revenues, but not in a linear relationship. For example, during 2020, 2021 and 2022, the Standard & Poor’s 500 Index had a total return of 18.4%, 28.7% and (18.1)%, respectively, and the Barclays U.S. Aggregate Bond Index had a total return for the same periods of 7.5%, (1.5)% and (13.0)% respectively. By comparison, for the same periods our organic revenue growth was 7.0%, 24.0% and 8.5%, respectively. For additional information, please read “—How We Evaluate our Business.”

Operating Expenses

Our operating expenses consist of compensation and related expenses, management fees, selling, general and administrative expenses, management contract buyout, intangible amortization, non-cash changes in fair value of estimated contingent consideration and depreciation and other amortization expense.

Compensation and Related Expenses

Compensation and related expenses include salaries and wages, including variable compensation, related employee benefits and taxes for employees at our partner firms and employees at the Focus LLC company level.

41

Table of Contents

Compensation and related expenses also include non-cash compensation expense, associated with both Focus Inc.’s and Focus LLC’s equity grants to employees and non-employees, including management company principals.

Management Fees

While we have to date, with limited exceptions, acquired substantially all of the assets or equity of a target firm, following our acquisition of a new partner firm, the partner firm continues to be primarily managed by its principals through their 100% ownership of a management company formed by them concurrently with the acquisition. Our operating subsidiary, the management company and the principals enter into a management agreement that provides for the payment of ongoing management fees to the management company. The terms of the management agreements are generally six years subject to automatic renewals for consecutive one-year terms, unless earlier terminated by either the management company or us in certain limited situations. Under the management agreement, the management company is entitled to management fees typically consisting of all EBPC in excess of Base Earnings up to Target Earnings, plus a percentage of EBPC in excess of Target Earnings.

We retain a preferred position in Base Earnings. To the extent earnings of an acquired business in any year are less than Base Earnings, in the following year we are entitled to receive Base Earnings together with the prior years’ shortfall before any management fees are earned by the management company.

The following table provides an illustrative example of our economics, including management fees earned by the management company, for periods of projected revenues, +10% growth in revenues and −10% growth in revenues. This example assumes (i) Target Earnings of $3.0 million; (ii) Base Earnings acquired of 60% of Target Earnings or $1.8 million; and (iii) a percentage of earnings in excess of Target Earnings retained by the management company of 40%.

Projected

+10% Growth in

−10% Growth


Revenues


Revenues


in Revenues

(in thousands)

New Partner Firm

New partner firm revenues

$

5,000

$

5,500

$

4,500

Less:

Operating expenses (excluding management fees)


(2,000)


(2,000)


(2,000)

EBPC

$

3,000

$

3,500

$

2,500

Base Earnings to Focus Inc. (60%)


1,800


1,800


1,800

Management fees to management company (40%)


1,200


1,200


700

EBPC in excess of Target Earnings:

To Focus Inc. (60%)


300


To management company as management fees (40%)


200


Focus Inc.

Focus Inc. revenues

$

5,000

$

5,500

$

4,500

Less:

Operating expenses (excluding management fees)


(2,000)


(2,000)


(2,000)

Less:

Management fees to management company


(1,200)


(1,400)


(700)

Operating income

$

1,800

$

2,100

$

1,800

As a result of our economic arrangements with the various management company entities, 100% of management fees are variable expenses.

42

Table of Contents

Selling, General and Administrative

Selling, general and administrative expenses include rent, insurance premiums, professional fees, travel and entertainment and other costs.

Intangible Amortization

Amortization of intangibles consists primarily of the amortization of intangibles we acquired through our various acquisitions of new partner firms and acquisitions by our partner firms.

Non-Cash Changes in Fair Value of Estimated Contingent Consideration

We have typically incorporated into our acquisition structure contingent consideration paid to the sellers upon the satisfaction of specified financial thresholds, and the purchase price for a typical acquisition is comprised of a base purchase price and the right to receive such contingent consideration in the form of earn out payments. The contingent consideration for acquisitions of new partner firms is generally paid over a six-year period upon the satisfaction of specified growth thresholds, in years three and six. These growth thresholds are typically tied to the compound annual growth rate (“CAGR”) of the partner firm’s earnings. Such growth thresholds can be set annually or for different time frames as well, for example, annually over a six-year period. The contingent consideration for acquisitions made by our partner firms is paid upon the satisfaction of specified financial thresholds. These thresholds are generally tied to revenue as adjusted for certain criteria or other operating metrics based on the retention or growth of the business acquired. These arrangements may result in the payment of additional purchase price consideration to the sellers for periods following the closing of an acquisition. Contingent consideration payments are typically payable in cash and, in some cases, equity.

For business acquisitions, we recognize the fair value of estimated contingent consideration at the acquisition date as part of the consideration transferred in exchange for substantially all of the assets or equity of the wealth management firm. The contingent consideration is remeasured to fair value at each reporting date until the contingency is resolved. Any changes in fair value are recognized each reporting period in non-cash changes in fair value of estimated contingent consideration in our consolidated statements of operations.

Depreciation and Other Amortization

Depreciation and other amortization expense primarily represents the benefits we received from using long-lived assets such as computers and equipment, leasehold improvements and furniture and fixtures. Those assets primarily consist of purchased fixed assets as well as fixed assets acquired through our acquisitions.

Business Acquisitions

We completed 21, 36 and 18 business acquisitions during the years ended December 31, 2020, 2021 and 2022, respectively, consisting of both new partner firms and acquisitions by our partner firms. Such business acquisitions were accounted for in accordance with ASC Topic 805: Business Combinations.

The purchase price is comprised of a base purchase price and a right to receive contingent consideration in the form of earn out payments. The base purchase price can consist of an upfront cash payment, deferred cash consideration and may include equity. The contingent consideration for acquisitions of new partner firms generally consists of earn outs over a six year period following the closing, with payment upon the satisfaction of specified growth thresholds in years three and six. The growth thresholds are typically tied to the CAGR of the partner firm’s earnings. Such growth thresholds can be set annually or for different time frames as well, for example, annually over a six-year period. The contingent consideration for acquisitions made by our partner firms generally is earned upon the satisfaction of specified financial thresholds. These thresholds are generally tied to revenue as adjusted for certain criteria or other operating metrics based on the retention or growth of the business acquired. The contingent consideration is typically payable in cash and, in some cases, equity.

43

Table of Contents

The following table summarizes our business acquisitions for the years ended December 31, 2020, 2021 and 2022 (dollars in thousands):


2020


2021

2022

Number of business acquisitions closed


21


36


18

Consideration:

Cash due at closing

$

327,722

$

983,240

$

450,943

Estimated working capital adjustment and other

(174)

(577)

1,127

Cash due subsequent to closing at net present value


86,778


9,611

Fair market value of Focus LLC common units issued


23,118


28,992

Fair market value of Class A common stock issued


3,515


Fair market value of estimated contingent consideration


46,918


212,074


56,604

Total consideration

$

374,466

$

1,308,148

$

547,277

In addition, we completed four, two and six acquisitions during the years ended December 31, 2020, 2021 and 2022, respectively, that did not meet the definition of a business under ASC Topic 805: Business Combinations. These acquisitions primarily related to the acquisition of customer relationships.

Our acquisitions have been paid for with a combination of cash on hand, cash generated by our operations, borrowings under the Credit Facility, Focus LLC common units or our Class A common stock.

2023 Acquisition Developments

From January 1, 2023 to February 16, 2023, we completed seven business acquisitions (accounted for in accordance with ASC Topic 805: Business Combinations), consisting of the acquisition of one new partner firm and six acquisitions by partner firms. The Acquired Base Earnings associated with the acquisition of the new partner firm during this period is approximately $1.7 million. For additional information regarding Acquired Base Earnings, please see “—How We Evaluate Our Business.”

44

Table of Contents

How We Evaluate Our Business

We focus on several key financial metrics in evaluating the success of our business, the success of our partner firms and our resulting financial position and operating performance. Key metrics include the following:


Year Ended December 31, 

2020


2021


2022


(dollars in thousands, except per share data)


Revenue Metrics:


Revenues

$

1,361,319

$

1,797,951

$

2,143,321

Revenue growth (1) from prior period


11.7

%


32.1

%


19.2

%

Organic revenue growth (2) from prior period


7.0

%


24.0

%


8.5

%

Management Fees Metrics (operating expense):

Management fees

$

349,475

$

491,433

$

530,329

Management fees growth (3) from prior period


14.7

%


40.6

%


7.9

%

Organic management fees growth (4) from prior period


7.8

%


32.1

%


(0.4)

%

Net Income Metrics:

Net income

$

48,965

$

24,440

$

125,278

Net income growth from prior period

*

(50.1)

%

*

Income per share of Class A common stock:

Basic

$

0.58

$

0.18

$

1.40

Diluted

$

0.57

$

0.18

$

1.39

Income per share of Class A common stock growth from prior period:

Basic

*

(69.0)

%

*

Diluted

*

(68.4)

%

*

Adjusted EBITDA Metrics:

Adjusted EBITDA (5)

$

321,763

$

451,296

$

537,456

Adjusted EBITDA growth (5) from prior period


19.2

%


40.3

%


19.1

%

Adjusted Net Income Excluding Tax Adjustments Metrics:

Adjusted Net Income Excluding Tax Adjustments (5)

$

195,562

$

278,681

$

300,548

Adjusted Net Income Excluding Tax Adjustments growth (5) from prior period


33.3

%


42.5

%


7.8

%

Tax Adjustments

Tax Adjustments (5)(6)

$

37,254

$

46,805

$

64,359

Tax Adjustments growth from prior period (5)(6)

16.9

%

25.6

%

37.5

%

Adjusted Net Income Excluding Tax Adjustments Per Share and Tax Adjustments Per Share Metrics:

Adjusted Net Income Excluding Tax Adjustments Per Share (5)

$

2.46

$

3.36

$

3.62

Tax Adjustments Per Share (5)(6)

$

0.47

$

0.56

$

0.77

Adjusted Net Income Excluding Tax Adjustments Per Share growth (5) from prior period


25.5

%


36.6

%


7.7

%

Tax Adjustments Per Share growth from prior period (5)(6)

11.9

%

19.1

%

37.5

%

Adjusted Shares Outstanding

Adjusted Shares Outstanding (5)


79,397,568


82,893,928


83,093,073

Other Metrics:

Net Leverage Ratio (7) at period end

3.89x

3.85x

4.19x

Acquired Base Earnings (8)

$

22,121

$

71,400

$

26,568

Number of partner firms at period end (9)


71


84


88

* Not meaningful

(1)Represents period-over-period growth in our GAAP revenue.

45

Table of Contents

(2)Organic revenue growth represents the period-over-period growth in revenue related to partner firms, including growth related to acquisitions of wealth management practices and customer relationships by our partner firms, including Connectus, and partner firms that have merged, that for the entire periods presented, are included in our consolidated statements of operations for each of the entire periods presented. We believe these growth statistics are useful in that they present full-period revenue growth of partner firms on a “same store” basis exclusive of the effect of the partial results of partner firms that are acquired during the comparable periods.
(3)The terms of our management agreements entitle the management companies to management fees typically consisting of all EBPC in excess of Base Earnings up to Target Earnings, plus a percentage of any EBPC in excess of Target Earnings. Management fees growth represents the period-over-period growth in GAAP management fees earned by management companies. While an expense, we believe that growth in management fees reflect the strength of the partnership.
(4)Organic management fees growth represents the period-over-period growth in management fees earned by management companies related to partner firms, including growth related to acquisitions of wealth management practices and customer relationships by our partner firms and partner firms that have merged, that for the entire periods presented, are included in our consolidated statements of operations for each of the entire periods presented. We believe that these growth statistics are useful in that they present full-period growth of management fees on a “same store” basis exclusive of the effect of the partial period results of partner firms that are acquired during the comparable periods.
(5)For additional information regarding Adjusted EBITDA, Adjusted Net Income Excluding Tax Adjustments, Adjusted Net Income Excluding Tax Adjustments Per Share, Tax Adjustments, Tax Adjustments Per Share and Adjusted Shares Outstanding, including a reconciliation of Adjusted EBITDA, Adjusted Net Income Excluding Tax Adjustments and Adjusted Net Income Excluding Tax Adjustments Per Share to the most directly comparable GAAP financial measure, please read “—Adjusted EBITDA” and “—Adjusted Net Income Excluding Tax Adjustments and Adjusted Net Income Excluding Tax Adjustments Per Share.”
(6)Tax Adjustments represent the tax benefits of intangible assets, including goodwill, associated with deductions allowed for tax amortization of intangible assets in the respective periods based on a pro forma 27% income tax rate. Such amounts were generated from acquisitions completed where we received a step-up in basis for tax purposes. Acquired intangible assets may be amortized for tax purposes, generally over a 15-year period. Due to our acquisitive nature, tax deductions allowed on acquired intangible assets provide additional significant supplemental economic benefit. The tax benefit from amortization is included to show the full economic benefit of deductions for acquired intangible assets with the step-up in tax basis. As of December 31, 2022, estimated Tax Adjustments from intangible asset related income tax benefits from closed acquisitions based on a pro forma 27% income tax rate for the next 12 months is $67,806.
(7)Net Leverage Ratio represents the First Lien Leverage Ratio (as defined in the Credit Facility), and means the ratio of amounts outstanding under the first lien term loan A (the “First Lien Term Loan A”), first lien term loan B (the “First Lien Term Loan B” and together with the “First Lien Term Loan A,” the “First Lien Term Loan”), and First Lien Revolver plus other outstanding debt obligations secured by a lien on the assets of Focus LLC (excluding letters of credit other than unpaid drawings thereunder) minus unrestricted cash and cash equivalents to Consolidated EBITDA (as defined in the Credit Facility).
(8)The terms of our management agreements entitle the management companies to management fees typically consisting of all future EBPC of the acquired wealth management firm in excess of Base Earnings up to Target Earnings, plus a percentage of any EBPC in excess of Target Earnings. Acquired Base Earnings is equal to our preferred position in Base Earnings. We are entitled to receive these earnings notwithstanding any earnings that we are entitled to receive in excess of Target Earnings. Base Earnings may change in future periods for various business or contractual matters. For example, from time to time when a partner firm consummates an acquisition, the management agreement among the partner firm, the management company and the principals is amended to adjust Base Earnings and Target Earnings to reflect the projected post-acquisition earnings of the partner firm.

46

Table of Contents

(9)Represents the number of partner firms on the last day of the period presented.

Adjusted EBITDA

Adjusted EBITDA is a non-GAAP measure. Adjusted EBITDA is defined as net income excluding interest income, interest expense, income tax expense, amortization of debt financing costs, intangible amortization and impairments, if any, depreciation and other amortization, non-cash equity compensation expense, non-cash changes in fair value of estimated contingent consideration, loss on extinguishment of borrowings, other expense-net and secondary offering expenses, if any. We believe that Adjusted EBITDA, viewed in addition to and not in lieu of, our reported GAAP results, provides additional useful information to investors regarding our performance and overall results of operations for various reasons, including the following:

non-cash equity grants made to employees or non-employees at a certain price and point in time do not necessarily reflect how our business is performing at any particular time; stock-based compensation expense is not a key measure of our operating performance;
contingent consideration or earn outs can vary substantially from company to company and depending upon each company’s growth metrics and accounting assumption methods; the non-cash changes in fair value of estimated contingent consideration is not considered a key measure in comparing our operating performance; and
amortization expenses can vary substantially from company to company and from period to period depending upon each company’s financing and accounting methods, the fair value and average expected life of acquired intangible assets and the method by which assets were acquired; the amortization of intangible assets obtained in acquisitions are not considered a key measure in comparing our operating performance.

We use Adjusted EBITDA:

as a measure of operating performance;
for planning purposes, including the preparation of budgets and forecasts;
to allocate resources to enhance the financial performance of our business;
to evaluate the effectiveness of our business strategies; and
as a consideration in determining compensation for certain employees.

Adjusted EBITDA does not purport to be an alternative to net income or cash flows from operating activities. The term Adjusted EBITDA is not defined under GAAP, and Adjusted EBITDA is not a measure of net income, operating income or any other performance or liquidity measure derived in accordance with GAAP. Therefore, Adjusted EBITDA has limitations as an analytical tool and should not be considered in isolation or as a substitute for analysis of our results as reported under GAAP. Some of these limitations are:

Adjusted EBITDA does not reflect all cash expenditures, future requirements for capital expenditures or contractual commitments;
Adjusted EBITDA does not reflect changes in, or cash requirements for, working capital needs; and
Adjusted EBITDA does not reflect the interest expense on our debt or the cash requirements necessary to service interest or principal payments.

47

Table of Contents

In addition, Adjusted EBITDA can differ significantly from company to company depending on strategic decisions regarding capital structure, the tax jurisdictions in which companies operate and capital investments. We compensate for these limitations by also relying on the GAAP results and using Adjusted EBITDA as supplemental information.

Set forth below is a reconciliation of net income to Adjusted EBITDA:

Year Ended December 31, 

2020


2021


2022

(in thousands)

Net income

$

48,965

$

24,440

$

125,278

Interest income


(453)


(422)


(791)

Interest expense


41,658


55,001


99,887

Income tax expense


20,660


20,082


53,077

Amortization of debt financing costs


2,909


3,958


3,999

Intangible amortization


147,783


187,848


261,842

Depreciation and other amortization


12,451


14,625


15,281

Non‑cash equity compensation expense


22,285


31,602


30,453

Non‑cash changes in fair value of estimated contingent consideration


19,197


112,416


(64,747)

Loss on extinguishment of borrowings


6,094


1,807

Other expense-net


214


337


11,370

Secondary offering expenses


1,409


Adjusted EBITDA

$

321,763

$

451,296

$

537,456

Adjusted Net Income Excluding Tax Adjustments and Adjusted Net Income Excluding Tax Adjustments Per Share

We analyze our performance using Adjusted Net Income Excluding Tax Adjustments and Adjusted Net Income Excluding Tax Adjustments Per Share. Adjusted Net Income Excluding Tax Adjustments and Adjusted Net Income Excluding Tax Adjustments Per Share are non GAAP measures. We define Adjusted Net Income Excluding Tax Adjustments as net income excluding income tax expense, amortization of debt financing costs, intangible amortization and impairments, if any, non-cash equity compensation expense, non-cash changes in fair value of estimated contingent consideration, loss on extinguishment of borrowings and secondary offering expenses, if any. The calculation of Adjusted Net Income Excluding Tax Adjustments also includes adjustments to reflect a pro forma 27% income tax rate reflecting the estimated U.S. federal, state, local and foreign income tax rates applicable to corporations in the jurisdictions we conduct business and is used for comparative purposes. The actual effective income tax rate, in current or future periods, may differ significantly from the pro forma income tax rate of 27%.

Adjusted Net Income Excluding Tax Adjustments Per Share is calculated by dividing Adjusted Net Income Excluding Tax Adjustments by the Adjusted Shares Outstanding. Adjusted Shares Outstanding includes: (i) the weighted average shares of Class A common stock outstanding during the periods, (ii) the weighted average incremental shares of Class A common stock related to stock options outstanding during the periods, (iii) the weighted average incremental shares of Class A common stock related to unvested Class A common stock outstanding during the periods, (iv) the weighted average incremental shares of Class A common stock related to restricted stock units outstanding during the periods, (v) the weighted average number of Focus LLC common units outstanding during the periods (assuming that 100% of such Focus LLC common units, including contingently issuable Focus LLC common units, if any, have been exchanged for Class A common stock), (vi) the weighted average number of Focus LLC restricted common units outstanding during the periods (assuming that 100% of such Focus LLC restricted common units have been exchanged for Class A common stock) and (vii) the weighted average number of common unit equivalents of Focus LLC vested and unvested incentive units outstanding during the periods based on the closing price of our Class A common stock on the last trading day of the periods (assuming that 100% of such Focus LLC common units have been exchanged for Class A common stock).

48

Table of Contents

We believe that Adjusted Net Income Excluding Tax Adjustments and Adjusted Net Income Excluding Tax Adjustments Per Share, viewed in addition to and not in lieu of, our reported GAAP results, provide additional useful information to investors regarding our performance and overall results of operations for various reasons, including the following:

non-cash equity grants made to employees or non-employees at a certain price and point in time do not necessarily reflect how our business is performing at any particular time; stock-based compensation expense is not a key measure of our operating performance;
contingent consideration or earn outs can vary substantially from company to company and depending upon each company’s growth metrics and accounting assumption methods; the non-cash changes in fair value of estimated contingent consideration is not considered a key measure in comparing our operating performance; and
amortization expenses can vary substantially from company to company and from period to period depending upon each company’s financing and accounting methods, the fair value and average expected life of acquired intangible assets and the method by which assets were acquired; the amortization of intangible assets obtained in acquisitions are not considered a key measure in comparing our operating performance.

Adjusted Net Income Excluding Tax Adjustments and Adjusted Net Income Excluding Tax Adjustments Per Share do not purport to be an alternative to net income or cash flows from operating activities. The terms Adjusted Net Income Excluding Tax Adjustments and Adjusted Net Income Excluding Tax Adjustments Per Share are not defined under GAAP, and Adjusted Net Income Excluding Tax Adjustments and Adjusted Net Income Excluding Tax Adjustments Per Share are not a measure of net income, operating income or any other performance or liquidity measure derived in accordance with GAAP. Therefore, Adjusted Net Income Excluding Tax Adjustments and Adjusted Net Income Excluding Tax Adjustments Per Share have limitations as an analytical tool and should not be considered in isolation or as a substitute for analysis of our results as reported under GAAP. Some of these limitations are:

Adjusted Net Income Excluding Tax Adjustments and Adjusted Net Income Excluding Tax Adjustments Per Share do not reflect all cash expenditures, future requirements for capital expenditures or contractual commitments;
Adjusted Net Income Excluding Tax Adjustments and Adjusted Net Income Excluding Tax Adjustments Per Share do not reflect changes in, or cash requirements for, working capital needs; and
Other companies in the financial services industry may calculate Adjusted Net Income Excluding Tax Adjustments and Adjusted Net Income Excluding Tax Adjustments Per Share differently than we do, limiting its usefulness as a comparative measure.

In addition, Adjusted Net Income Excluding Tax Adjustments and Adjusted Net Income Excluding Tax Adjustments Per Share can differ significantly from company to company depending on strategic decisions regarding capital structure, the tax jurisdictions in which companies operate and capital investments. We compensate for these limitations by relying also on the GAAP results and use Adjusted Net Income Excluding Tax Adjustments and Adjusted Net Income Excluding Tax Adjustments Per Share as supplemental information.

Tax Adjustments and Tax Adjustments Per Share

Tax Adjustments represent the tax benefits of intangible assets, including goodwill, associated with deductions allowed for tax amortization of intangible assets in the respective periods based on a pro forma 27% income tax rate. Such amounts were generated from acquisitions completed where we received a step-up in basis for tax purposes. Acquired intangible assets may be amortized for tax purposes, generally over a 15-year period. Due to our acquisitive nature, tax deductions allowed on acquired intangible assets provide additional significant supplemental economic

49

Table of Contents

benefit. The tax benefit from amortization is included to show the full economic benefit of deductions for acquired intangible assets with the step-up in tax basis.

Tax Adjustments Per Share is calculated by dividing Tax Adjustments by the Adjusted Shares Outstanding.

Set forth below is a reconciliation of net income to Adjusted Net Income Excluding Tax Adjustments and Adjusted Net Income Excluding Tax Adjustments Per Share:

Year Ended December 31, 

2020


2021


2022

(dollars in thousands, except per share data)

Net income

$

48,965

$

24,440

$

125,278

Income tax expense


20,660


20,082


53,077

Amortization of debt financing costs


2,909


3,958


3,999

Intangible amortization


147,783


187,848


261,842

Non‑cash equity compensation expense


22,285


31,602


30,453

Non‑cash changes in fair value of estimated contingent consideration


19,197


112,416


(64,747)

Loss on extinguishment of borrowings


6,094


1,807

Secondary offering expenses (1)


1,409


Subtotal


267,893


381,755


411,709

Pro forma income tax expense (27%) (2)


(72,331)


(103,074)


(111,161)

Adjusted Net Income Excluding Tax Adjustments

$

195,562

$

278,681

$

300,548

Tax Adjustments (2)(3)

$

37,254

$

46,805

$

64,359

Adjusted Net Income Excluding Tax Adjustments Per Share

$

2.46

$

3.36

$

3.62

Tax Adjustments Per Share (3)

$

0.47

$

0.56

$

0.77

Adjusted Shares Outstanding


79,397,568


82,893,928


83,093,073

Calculation of Adjusted Shares Outstanding:

Weighted average shares of Class A common stock outstanding—basic (4)


48,678,584


57,317,477


65,552,592

Adjustments:

Weighted average incremental shares of Class A common stock related to stock options, unvested Class A common stock and restricted stock units (5)


118,029


513,674


257,623

Weighted average Focus LLC common units outstanding (6)


21,461,080


15,200,900


11,857,164

Weighted average Focus LLC restricted common units outstanding (7)

5,005

73,983

199,495

Weighted average common unit equivalent of Focus LLC incentive units outstanding (8)


9,134,870


9,787,894


5,226,199

Adjusted Shares Outstanding


79,397,568


82,893,928


83,093,073

(1)Relates to offering expenses associated with the March 2021 and June 2021 secondary equity offerings.
(2)The pro forma income tax rate of 27% reflects the estimated U.S. federal, state, local and foreign income tax rates applicable to corporations in the jurisdictions we conduct business and is used for comparative purposes. The actual effective income tax rate, in current or future periods, may differ significantly from the pro forma income tax rate of 27%. The actual effective income tax rate is the percentage of income tax after taking into consideration various tax deductions, credits and limitations. Among other things, periods of increased interest expense and limits on our ability to deduct interest expense may, in current or future periods, contribute to an actual effective income tax rate that is less than or greater than the pro forma income tax rate of 27%.
(3)Tax Adjustments represent the tax benefits of intangible assets, including goodwill, associated with deductions allowed for tax amortization of intangible assets in the respective periods based on a pro forma 27% income tax rate. Such amounts were generated from acquisitions completed where we received a step-up in basis for tax purposes. Acquired intangible assets may be amortized for tax purposes, generally over a 15-year period. Due to our acquisitive nature, tax deductions allowed on acquired intangible assets provide additional significant

50

Table of Contents

supplemental economic benefit. The tax benefit from amortization is included to show the full economic benefit of deductions for acquired intangible assets with the step-up in tax basis. As of December 31, 2022, estimated Tax Adjustments from intangible asset related income tax benefits from closed acquisitions based on a pro forma 27% income tax rate for the next 12 months is $67,806.
(4)Represents our GAAP weighted average Class A common stock outstanding—basic.
(5)Represents the incremental shares related to stock options, unvested Class A common stock and restricted stock units as calculated under the treasury stock method.
(6)Assumes that 100% of Focus LLC common units, including contingently issuable Focus LLC common units, if any, were exchanged for Class A common stock.
(7)Assumes that 100% of Focus LLC restricted common units were exchanged for Class A common stock.
(8)Assumes that 100% of the vested and unvested Focus LLC incentive units were converted into Focus LLC common units based on the closing price of our Class A common stock at the end of the respective period and such Focus LLC common units were exchanged for Class A common stock.

Factors Affecting Comparability

Our future results of operations may not be comparable to our historical results of operations, principally for the following reasons:

Tax Treatment

As a flow-through entity, Focus LLC is generally not and has not been subject to U.S. federal and certain state income taxes at the entity level, although it has been subject to the New York City Unincorporated Business Tax. Instead, for U.S. federal and certain state income tax purposes, taxable income was and is passed through to its unitholders, including Focus Inc. Focus Inc. is subject to U.S. federal and certain state income taxes applicable to corporations.

Results of Operations

Year Ended December 31, 2020 Compared to Year Ended December 31, 2021

For a comparison of the years ended December 31, 2020 and 2021, see Part II. Item 7, Management’s Discussion and Analysis of Financial Condition and Results of Operations, in our Form 10-K for the year ended December 31, 2021.

51

Table of Contents

Year Ended December 31, 2021 Compared to Year Ended December 31, 2022

The following discussion presents an analysis of our results of operations for the years ended December 31, 2021 and 2022. Where appropriate, we have identified specific events and changes that affect comparability or trends and, where possible and practical, have quantified the impact of such items.

Year Ended


December 31, 


2021


2022


$ Change


% Change


(dollars in thousands)


Revenues:

Wealth management fees

$

1,717,365

$

2,056,328

$

338,963


19.7

%

Other


80,586


86,993


6,407


8.0

%

Total revenues


1,797,951


2,143,321


345,370


19.2

%

Operating expenses:

Compensation and related expenses


591,121


729,891


138,770


23.5

%

Management fees


491,433


530,329


38,896


7.9

%

Selling, general and administrative


297,636


376,417


78,781


26.5

%

Intangible amortization


187,848


261,842


73,994


39.4

%

Non‑cash changes in fair value of estimated contingent consideration


112,416


(64,747)


(177,163)


*

Depreciation and other amortization


14,625


15,281


656


4.5

%

Total operating expenses


1,695,079


1,849,013


153,934


9.1

%

Income from operations


102,872


294,308


191,436


186.1

%

Other income (expense):

Interest income


422


791


369


87.4

%

Interest expense


(55,001)


(99,887)


(44,886)


(81.6)

%

Amortization of debt financing costs


(3,958)


(3,999)


(41)


(1.0)

%

Loss on extinguishment of borrowings


(1,807)


(1,807)


*

Other expense—net


(337)


(11,370)


(11,033)


*

Income from equity method investments

524


319


(205)


(39.1)

%

Total other expense—net


(58,350)


(115,953)


(57,603)


(98.7)

%

Income before income tax


44,522


178,355


133,833


300.6

%

Income tax expense


20,082


53,077


32,995


164.3

%

Net income

$

24,440

$

125,278

$

100,838


412.6

%

*            Not meaningful

Revenues

Wealth management fees increased $339.0 million, or 19.7%, for the year ended December 31, 2022 compared to the year ended December 31, 2021. New partner firms added subsequent to the year ended December 31, 2021 that are included in our results of operations for the year ended December 31, 2022 include Azimuth Capital Investment Management, Octogone Holding, Icon Wealth Partners, FourThought Private Wealth and Beaumont Financial Partners. Additionally, our partner firms completed 19 acquisitions subsequent to the year ended December 31, 2021. The new partner firms contributed approximately $27.5 million in wealth management fees during the year ended December 31, 2022. The balance of the increase of $311.5 million was due to the revenue growth at our existing partner firms, including Connectus, associated with wealth management services, which includes partner firm-level acquisitions, as well as a full period of revenue recognized during the year ended December 31, 2022 for partner firms that were acquired during the year ended December 31, 2021. Six partner firms, which closed in the prior year on December 31, 2021, contributed $90.9 million of the increase.

Other revenues increased $6.4 million, or 8.0%, for the year ended December 31, 2022 compared to the year ended December 31, 2021. The increase related to new partner firms was approximately $2.4 million.

52

Table of Contents

Operating Expenses

Compensation and related expenses increased $138.8 million, or 23.5%, for the year ended December 31, 2022 compared to the year ended December 31, 2021. The increase related to new partner firms was approximately $9.0 million. The balance of the increase of $129.8 million was due to an increase in salaries and related expense due to growth of our existing partner firms including Connectus, partner firm-level acquisitions and a full period of expense during the year ended December 31, 2022 for partner firms acquired during the year ended December 31, 2021, offset in part by a decrease in non-cash equity compensation of $1.1 million. Six partner firms, which closed in the prior year on December 31, 2021, contributed $27.9 million of the increase.

Management fees increased $38.9 million, or 7.9%, for the year ended December 31, 2022 compared to the year ended December 31, 2021. The increase related to new partner firms was approximately $3.2 million. Management fees are variable and a function of earnings during the period. The balance of the increase of $35.7 million was due to partner firm-level acquisitions as well as a full year of earnings recognized during the year ended December 31, 2022 for partner firms acquired during the year ended December 31, 2021. Six partner firms, which closed in the prior year on December 31, 2021, contributed $20.5 million of the increase.

Selling, general and administrative expenses increased $78.8 million, or 26.5%, for the year ended December 31, 2022 compared to the year ended December 31, 2021. New partner firms added approximately $7.2 million. The balance of the increase of $71.6 million was due primarily to an increase in expenses related to professional fees and information technology expenses related to the growth of our existing partner firms, including Connectus, and partner firm-level acquisitions.

Intangible amortization increased $74.0 million, or 39.4%, for the year ended December 31, 2022 compared to the year ended December 31, 2021. The increase related to new partner firms was approximately $9.2 million. The balance of the increase of $64.8 million was due to partner firm-level acquisitions as well as a full year of amortization recognized during the year ended December 31, 2022 for partner firms acquired during the year ended December 31, 2021. Six partner firms, which closed in the prior year on December 31, 2021, contributed $20.6 million of the increase.

Non-cash changes in fair value of estimated contingent consideration decreased $177.2 million for the year ended December 31, 2022 compared to the year ended December 31, 2021. During the year ended December 31, 2022, the probability that certain contingent consideration payments would be achieved decreased due to Monte Carlo Simulation changes associated with market conditions and forecasts, resulting in a decrease in the fair value of the contingent consideration liability.

Depreciation and other amortization expense increased $0.7 million, or 4.5%, for the year ended December 31, 2022 compared to the year ended December 31, 2021. The increase related to new partner firms was approximately $0.3 million.

53

Table of Contents

Other income (expense)

Interest expense increased $44.9 million, or 81.6%, for the year ended December 31, 2022 compared to the year ended December 31, 2021. The increase was due primarily to higher average interest rates on outstanding borrowings during the year ended December 31, 2022 compared to the year ended December 31, 2021.

During the year ended December 31, 2022, a loss on extinguishment of borrowings of $1.8 million was recognized in connection with the November 2022 Credit Facility amendment.

Other expense-net increased $11.0 million for the year ended December 31, 2022 compared to the year ended December 31, 2021. The increase was due primarily to a 2022 partial write-off of an insurance receivable that was initially recorded during the year ended December 31, 2021.

Income Tax Expense

Income tax expense increased $33.0 million, or 164.3%, for the year ended December 31, 2022 compared to the year ended December 31, 2021. For the year ended December 31, 2022, we recorded a tax expense of approximately $53.1 million resulting in an annual effective tax rate of 29.8%. The annual effective tax rate is primarily related to federal, state and local income taxes imposed on Focus Inc.’s allocable portion of taxable income from Focus LLC.

Liquidity and Capital Resources

Sources of Liquidity

During the year ended December 31, 2022, we met our cash and liquidity needs primarily through cash on hand, cash generated by our operations and borrowings under our Credit Facility. Over the next twelve months, and in the longer term, we expect that our cash and liquidity needs will continue to be met by cash generated by our ongoing operations and our Credit Facility, especially for acquisition activities. If our acquisition activity continues at an accelerated pace, or for larger acquisition opportunities, we may decide to issue equity either as consideration or, if market conditions are favorable, in an offering. For information regarding the Credit Facility, please read “—Credit Facilities.”

Tax Receivable Agreements

Our Tax Receivable Agreements with the TRA holders generally provide for the payment by Focus Inc. to each TRA holder of 85% of the net cash savings, if any, in U.S. federal, state and local income and franchise tax that Focus Inc. actually realizes (computed using simplifying assumptions to address the impact of state and local taxes) or is deemed to realize in certain circumstances as a result of certain increases in tax basis and certain tax benefits attributable to imputed interest. Focus Inc. will retain the benefit of the remaining 15% of these cash savings.

The payment obligations under the Tax Receivable Agreements are Focus Inc.’s obligations and not obligations of Focus LLC, and we expect that such payments required to be made under the Tax Receivable Agreements will be substantial. Estimating the amount and timing of payments that may become due under the Tax Receivable Agreements is by its nature imprecise. For purposes of the Tax Receivable Agreements, cash savings in tax generally are calculated by comparing Focus Inc.’s actual tax liability (determined by using the actual applicable U.S. federal income tax rate and an assumed combined state and local income and franchise tax rate) to the amount Focus Inc. would have been required to pay had it not been able to utilize any of the tax benefits subject to the Tax Receivable Agreements. As of December 31, 2022, we expect that future payments to the TRA holders will be $224.6 million, in aggregate. Future payments under the Tax Receivable Agreements in respect of subsequent exchanges will be in addition to this amount.

The actual increases in tax basis, as well as the amount and timing of any payments under the Tax Receivable Agreements, will vary depending upon a number of factors, including the timing of any exchange of units, the price of our Class A common stock at the time of each exchange, the extent to which such exchanges are taxable transactions, the amount of Focus LLC’s assets that consist of equity in entities taxed as corporations at the time of each exchange, the

54

Table of Contents

amount and timing of the taxable income we generate in the future, the U.S. federal income tax rates then applicable and the portion of the payments under the Tax Receivable Agreements that constitute imputed interest or give rise to depreciable or amortizable tax basis.

The foregoing amount of expected future payments to TRA holders is merely an estimate and the actual payments could differ materially. It is possible that future transactions or events could increase or decrease the actual tax benefits realized and the corresponding payments under the Tax Receivable Agreements as compared to the foregoing estimates. Moreover, there may be a negative impact on our liquidity if, as a result of timing discrepancies or otherwise, (i) the payments under the Tax Receivable Agreements exceed the actual benefits realized in respect of the tax attributes subject to the Tax Receivable Agreements and/or (ii) distributions to Focus Inc. by Focus LLC are not sufficient to permit Focus Inc. to make payments under the Tax Receivable Agreements after it has paid its taxes and other obligations.

The payments under the Tax Receivable Agreements will not be conditioned upon a TRA holder’s having a continued ownership interest in either Focus Inc. or Focus LLC.

We expect that future unitholders may become party to one or more Tax Receivable Agreements entered into in connection with future acquisitions by Focus LLC or issuances of units of Focus LLC to employees, partners and directors.

Cash Flows

The following table presents information regarding our cash flows and cash and cash equivalents for the year ended December 31, 2021 compared to the year ended December 31, 2022. For information regarding our cash flows and cash and cash equivalents for the year ended December 31, 2020 compared to the year ended December 31, 2021, see Part II. Item 7, Management’s Discussion and Analysis of Financial Condition and Results of Operations, in our Form 10-K for the year ended December 31, 2021:

Year Ended


December 31, 


2021


2022


$ Change


% Change


(dollars in thousands)

Cash provided by (used in):

Operating activities

$

313,918

$

288,599

$

(25,319)


(8.1)

%

Investing activities


(1,007,312)


(475,181)


532,131


52.8

%

Financing activities


938,797


16,992


(921,805)


(98.2)

%

Cash and cash equivalents—end of period


310,684


139,973


(170,711)


(54.9)

%

Operating Activities

Net cash provided by operating activities includes net income adjusted for non-cash expenses such as intangible amortization, depreciation and other amortization, amortization of debt financing costs, non-cash equity compensation expense, non-cash changes in fair value of estimated contingent consideration, other non-cash items and changes in cash resulting from changes in operating assets and liabilities. Operating assets and liabilities include receivables from our clients, prepaid expenses and other assets, accounts payable and accrued expenses, deferred revenues and other assets and liabilities.

Net cash provided by operating activities decreased $25.3 million, or 8.1%, for the year ended December 31, 2022 compared to the year ended December 31, 2021. The decrease was primarily related to the timing of management fee payments which resulted in an increase of payments to affiliates, an increase in payments of interest and other working capital changes, which were offset, in part, by an increase in Adjusted EBITDA.

55

Table of Contents

Investing Activities

Net cash used in investing activities decreased $532.1 million, or 52.8%, for the year ended December 31, 2022 compared to the year ended December 31, 2021. The decrease was due primarily to a decrease of $517.5 million in cash paid for acquisitions and contingent consideration.

Financing Activities

Net cash provided by financing activities for the year ended December 31, 2022 decreased $921.8 million, or 98.2%, compared to the year ended December 31, 2021. The decrease was primarily due to a reduction in net borrowings from credit facilities of $767.5 million and a decrease in proceeds from issuance of common stock of $219.6 million, which were offset, in part, by reduced unit redemptions and distributions of $67.1 million and, to a lesser extent, a decrease in contingent consideration paid of $16.1 million in the year ended December 31, 2022 compared to the year ended December 31, 2021.

Adjusted Free Cash Flow

To supplement our statements of cash flows presented on a GAAP basis, we use a non-GAAP liquidity measure on a trailing 4-quarter basis to analyze cash flows generated from our operations. We consider Adjusted Free Cash Flow to be a liquidity measure that provides useful information to investors about the amount of cash generated by the business and is one factor in evaluating the amount of cash available to pay contingent consideration and deferred cash consideration, make strategic acquisitions and repay outstanding borrowings. Adjusted Free Cash Flow does not represent our residual cash flow available for discretionary expenditures as it does not deduct our mandatory debt service requirements and other non-discretionary expenditures. We define Adjusted Free Cash Flow as net cash provided by operating activities, less purchase of fixed assets, distributions for Focus LLC unitholders and payments under Tax Receivable Agreements (if any). Adjusted Free Cash Flow is not defined under GAAP and should not be considered as an alternative to net cash from operating, investing or financing activities. Adjusted free cash flow may not be calculated the same for us as for other companies. The table below reconciles net cash provided by operating activities, as reflected on our cash flow statement, to our adjusted free cash flow.

Trailing 4-Quarters Ended December 31, 


2021


2022

(in thousands)

Net cash provided by operating activities (1)(2)


$

313,918

$

288,599

Purchase of fixed assets


(11,018)


(21,017)

Distributions for unitholders

(32,311)

(22,984)

Payments under tax receivable agreements

(4,423)

(3,856)

Adjusted Free Cash Flow

$

266,166

$

240,742

(1)A portion of contingent consideration paid is classified as operating cash outflows in accordance with GAAP, with the balance reflected in investing and financing cash flows. Contingent consideration paid classified as operating cash outflows for each quarter in the trailing 4-quarters ended December 31, 2021 was $5.3 million, $11.6 million, $20.4 million and $16.4 million, respectively, totaling $53.7 million for the trailing 4-quarters ended December 31, 2021. Contingent consideration paid classified as operating cash outflows for each quarter in the trailing 4-quarters ended December 31, 2022 was $23.0 million, $18.2 million, $29.6 and $6.1 million, respectively, totaling $76.9 million for the trailing 4-quarters ended December 31, 2022. See Note 7 to our consolidated financial statements for additional information.
(2)A portion of deferred cash consideration paid is classified as operating cash outflows in accordance with GAAP, with the balance reflected in financing cash outflows. Deferred cash consideration paid classified as operating cash outflows was $16.0 thousand for the trailing 4-quarters ended December 31, 2022. No deferred consideration was paid in the year ended December 31, 2021.

56

Table of Contents

Credit Facilities

As of December 31, 2022, our Credit Facility consisted of a $2.5 billion First Lien Term Loan B, consisting of a $1.75 billion tranche A (“First Lien Term Loan B - Tranche A”) and $788.4 million tranche B (“First Lien Term Loan B - Tranche B”), a $240.0 million delayed draw First Lien Term Loan A, and a $650.0 million First Lien Revolver.

In April 2022, we amended the First Lien Revolver to extend the maturity date to June 2024 and change the benchmark interest rate from LIBOR to the Secured Overnight Financing Rate (“SOFR”).

In November 2022, we amended the Credit Facility to, among other things, (i) repay the then existing $1.6 billion First Lien Term Loan B - Tranche A and issue approximately $1.8 billion stated value First Lien Term Loan B - Tranche A with a maturity date of June 2028, (ii) change the First Lien Term Loan B - Tranche B benchmark interest rate from LIBOR to SOFR, (iii) issue $240.0 million delayed draw First Lien Term Loan A with a maturity date of November 2027 and (iv) change the maturity date of the First Lien Revolver to November 2027.

The First Lien Term Loan B - Tranche A bears interest (at our option) at: (i) SOFR plus a margin of 3.25% with a 0.50% SOFR floor or (ii) the lender’s Base Rate (as defined in the Credit Facility) plus a margin of 2.25%. The First Lien Term Loan B - Tranche A requires quarterly installment repayments of $4.4 million and has a maturity date of June 2028. The debt was issued at a discount of 1.75% or $30.8 million. The First Lien Term Loan B - Tranche A also requires a prepayment penalty of 1%, of the then outstanding principal amount of the First Lien Term Loan B - Tranche A if repaid prior to May 2023.

The First Lien Term Loan B - Tranche B bears interest (at our option) at: (i) SOFR plus a margin of 2.50% with a 0.50% SOFR floor or (ii) the lender’s Base Rate plus a margin of 1.50%. The First Lien Term Loan B - Tranche B requires quarterly installment repayments of $2.0 million and has a maturity date of June 2028.

The First Lien Term Loan A bears interest (at our option) at: (i) SOFR plus a margin of 2.50% with a 0.50% SOFR floor or (ii) the lender’s Base Rate plus a margin of 1.50%. The First Lien Term Loan A has a nine month delayed draw feature, which expires in August 2023. The delayed draw feature has a ticking fee with respect to the undrawn commitments with (i) no fee from 0-60 days from the closing date, (ii) 50% of the interest rate margin for the First Lien Term Loan A from 61-120 days of the closing date and (iii) 100% of the interest rate margin for the First Lien Term Loan A after 121 days of the closing date. The First Lien Term Loan A, when drawn, will be issued at a discount of 1.50%. When drawn, the First Lien Term Loan A will require quarterly amortization equal to 0.25% in 2023, 0.50% in 2024 and 2025, 1.25% in 2026 and 1.875% in 2027. In December 2022, $20.0 million was borrowed under the First Lien Term Loan A at a discount of $300.0 thousand with quarterly installment repayments of $50.0 thousand. The First Lien Term Loan A has a maturity date of November 2027.

As amended, the First Lien Revolver bears interest (at our option) at SOFR plus a margin of 2.25% with step downs to 2.00% and 1.75% or the lender’s Base Rate plus a margin of 1.25% with step downs to 1.00% and 0.75%, based on achievement of a specified First Lien Leverage Ratio. The First Lien Revolver unused commitment fee is 0.50% with step downs to 0.375% and 0.25% based on achievement of a specified First Lien Leverage Ratio. Up to $30.0 million of the First Lien Revolver is available for the issuance of letters of credit, subject to certain limitations. The First Lien Revolver has a maturity date of November 2027.

Our obligations under the Credit Facility are collateralized by the majority of our assets. The Credit Facility contains various customary covenants, including, but not limited to: (i) incurring additional indebtedness or guarantees, (ii) creating liens or other encumbrances on property or granting negative pledges, (iii) entering into a merger or similar transaction, (iv) selling or transferring certain property and (v) declaring dividends or making other restricted payments.

We are required to maintain a First Lien Leverage Ratio (as defined in the Credit Facility) of not more than 6.25:1.00 as of the last day of each fiscal quarter. At December 31, 2022, our First Lien Leverage Ratio was 4.19:1.00, which satisfied the maximum ratio of 6.25:1.00. First Lien Leverage Ratio means the ratio of amounts outstanding under the Credit Facility plus other outstanding debt obligations secured by a lien on the assets of Focus LLC (excluding letters

57

Table of Contents

of credit other than unpaid drawings thereunder) minus unrestricted cash and cash equivalents to Consolidated EBITDA (as defined in the Credit Facility). Consolidated EBITDA for purposes of the Credit Facility was $578.4 million at December 31, 2022. Focus LLC is also subject on an annual basis to contingent principal payments based on an excess cash flow calculation (as defined in the Credit Facility) for any fiscal year if the First Lien Leverage Ratio exceeds 3.75:1.00. No contingent principal payments were required to be made in 2022. Based on the excess cash flow calculation for the year ended December 31, 2022, no contingent principal payments are required to be made in 2023.

At December 31, 2022, outstanding stated value borrowings under the Credit Facility were approximately $2.6 billion. The weighted-average interest rate for outstanding borrowings was approximately 4% for the year ended December 31, 2022. As of December 31, 2022, the First Lien Revolver available unused commitment line was $640.0 million. At December 31, 2022, we had outstanding letters of credit in the amount of $10.0 million bearing interest at an annual rate of approximately 2%.

In connection with the November 2022 amendment to the Credit Facility, we terminated our three then existing interest rate swaps, with notional amounts of $400.0 million, $250.0 million and $200.0 million, which provided we pay interest to the counterparty each month at a rate of 0.713%, 0.537% and 0.5315%, respectively, and receive interest from each of the counterparties each month at the 1 month LIBOR rate, subject to a 0.0% floor, and entered into the SOFR Swaps (as defined below) with the same notional amounts.

At December 31, 2022, we have three floating to fixed interest rate swap agreements with notional amounts of $400.0 million, $250.0 million and $200.0 million, the terms of which provide that we pay interest to the counterparty each month at a rate of 0.619%, 0.447% and 0.440%, respectively, and receive interest from each of the counterparties each month at the 1 month USD Term SOFR rate, subject to a 0.50% floor (the "SOFR Swaps").

The interest rate swaps effectively fix the variable interest rate applicable to $850.0 million or approximately 33% of the First Lien Term Loan borrowings outstanding, resulting in a weighted average interest rate on these borrowings of approximately 0.53% plus a margin of 3.25%.

Critical Accounting Policies

Our financial statements are prepared in accordance with GAAP. Our financial statements include the accounts of Focus Inc. and our subsidiaries. Intercompany transactions and balances are eliminated in consolidation. Critical accounting policies are those that are the most important to the preparation of our financial condition and results of operations and that require our most difficult, subjective and complex judgments as a result of the need to make estimates about the effect of matters that are inherently uncertain. While our significant accounting policies are described in more detail in the Note 2 to our financial statements, our most critical accounting policies are discussed below. The preparation of the consolidated financial statements in conformity with GAAP requires management to make estimates and assumptions that affect the amounts reported in our financial statements and the accompanying notes. Management believes that the estimates utilized in preparing the financial statements are reasonable and prudent. Actual results could differ from those estimates.

Revenue Recognition

Wealth Management Fees

We recognize revenue from wealth management fees, which are primarily composed of fees earned for advising on the assets of clients, financial and tax planning fees, consulting fees, tax return preparation fees, fees for family office services, and fees for wealth management and operational support services provided to third-party wealth management firms. Client arrangements may contain one of the services or multiple services, resulting in either a single or multiple performance obligations within the same client arrangement, each of which are separately identifiable and priced, and accounted for as the related services are provided and consumed over time. Fees are primarily based either on a contractual percentage of the client’s assets based on the market value of the client’s assets on the predetermined billing date, a flat fee, an hourly rate based on predetermined billing rates or a combination of such fees and are billed either in advance or arrears on a monthly, quarterly, or semiannual basis. Revenue is recognized over the respective service

58

Table of Contents

period based on time elapsed or hours expended, as the case may be, which is deemed to be the most faithful depiction of the transfer of services as clients benefit from services over the respective period. Revenue for wealth management and operational support services provided to third party wealth management firms is presented net since these services are performed in an agent capacity. Client agreements typically do not have a specified term and may be terminated at any time by either party subject to the respective termination and notification provisions in each agreement.

A majority of our wealth management fees are correlated to the markets, and therefore are considered variable consideration. Our market-correlated fees are dependent on the market and, thus, are susceptible to factors outside our control. Therefore, at inception of the contractual service period for fees which are based on the market values at the end of the service period, we cannot conclude that it is probable that a reversal in the cumulative revenue recognized would not occur if the estimate was included in the transaction price at that time. However, at each quarterly reporting date, we update our estimate of the transaction price as the market uncertainty is typically resolved. We can then reasonably conclude that a reversal of the variable consideration will not occur for those services already provided.

Wealth management fees are recorded when: (i) an arrangement with a client has been identified; (ii) the performance obligations have been identified; (iii) the fee or other transaction price has been determined; (iv) the fee or other transaction price has been allocated to each performance obligation based on standalone fee rates; and (v) we have satisfied the applicable performance obligation.

Other

Other revenue primarily includes recordkeeping and administration service fees, commissions and distribution fees and outsourced services. Client arrangements may contain a single or multiple performance obligations, each of which are separately identifiable and accounted for as the related services are provided and consumed over time. Recordkeeping and administration and outsourced services revenue, in accordance with the same five criteria above, are recognized over the period in which services are provided. Commissions and distribution fees are recognized when earned.

Business Acquisitions

Business acquisitions are accounted for in accordance with ASC Topic 805: Business Combinations. Business acquisitions are accounted for by allocating the purchase price consideration to the fair value of assets acquired and liabilities assumed. The purchase price allocations are based upon preliminary valuations, and our estimates and assumptions are subject to change within the measurement period as valuations are finalized. Any change in the estimated fair value of the net assets, prior to the finalization of the more detailed analyses, but not to exceed one year from the dates of acquisition, will change the amount of the purchase price allocations. Goodwill is recognized as the excess of the purchase price consideration over the fair value of net assets of the business acquired. All transaction costs are expensed as incurred.

We have incorporated contingent consideration into the structure of our partner firm acquisitions. These arrangements may result in the payment of additional purchase price consideration to the sellers based on the growth of certain financial thresholds for periods following the closing of the respective acquisition. The additional purchase price consideration is payable in the form of cash and, in some cases, equity.

For business acquisitions, we recognize the fair value of estimated contingent consideration at the acquisition date as part of the consideration transferred in exchange for the acquired wealth management firm. The contingent consideration is remeasured to fair value at each reporting date until the contingency is resolved. Any changes in fair value are recognized each reporting period in non-cash changes in fair value of estimated contingent consideration in the consolidated statements of operations.

The results of the acquired wealth management firms are included in our consolidated financial statements from the respective dates of acquisition.

59

Table of Contents

Goodwill, Intangible Assets and Other Long-Lived Assets

Goodwill is deemed to have an indefinite useful life and is not amortized. Intangible assets are amortized over their respective estimated useful lives. We have no indefinite-lived intangible assets.

Goodwill is tested annually for impairment as of October 1, or more frequently if events and circumstances change that would more likely than not reduce the fair value of a reporting unit below its carrying amount. We compare the fair value of the reporting unit to the carrying value of the net assets of the reporting unit. The fair value of the reporting unit is determined using a market approach. If the fair value of the reporting unit exceeds the carrying value of the net assets of the reporting unit no further consideration is necessary. If the carrying value exceeds the fair value of the reporting unit, we would record an impairment charge for the amount that the carrying value exceeds the fair value of the reporting unit.

Intangible assets and other long-lived assets are reviewed for impairment whenever events or changes in circumstances indicate that the asset might be impaired or that the estimated useful life should be changed prospectively. If impairment indicators are present, the recoverability of these assets is measured by a comparison of the carrying amount of the asset to estimated undiscounted future cash flows expected to be generated by the asset. If the carrying amount of the asset exceeds its estimated undiscounted future cash flows, an impairment charge is recognized by the amount by which the carrying amount of the asset exceeds the fair value of the asset, which is determined using a discounted cash flow approach.

Income Taxes and Tax Receivable Agreements

Focus Inc. is a holding company whose most significant asset is a membership interest in Focus LLC. Focus Inc. is subject to U.S. federal, state and local income taxes on Focus Inc.’s allocable portion of taxable income from Focus LLC. Focus LLC is treated as a partnership for U.S. federal income tax purposes. Accordingly, Focus LLC is generally not and has not been subject to U.S. federal and certain state income taxes at the entity level, although it has been subject to the New York City Unincorporated Business Tax and certain of its subsidiaries have been subject to U.S. federal and certain state and local or foreign income taxes. Instead, for U.S. federal and certain state income tax purposes, the income, deductions, losses and credits of Focus LLC are passed through to its unitholders, including Focus Inc. Focus LLC makes tax distribution payments to the extent of available cash, in accordance with the Fourth Amended and Restated Focus LLC Agreement. Focus Inc. files income tax returns with the U.S. federal government as well as various state and local jurisdictions.

We apply the asset and liability method for deferred income taxes. Deferred tax assets and liabilities are recognized for future tax consequences attributable to differences between the financial statement carrying amounts of existing assets and liabilities and their respective tax basis. Deferred tax assets and liabilities are measured using tax rates expected to apply to taxable income in years in which those temporary differences are expected to be recovered or settled. Valuation allowances, if any, are recorded to reduce the deferred tax assets to an amount that is more likely than not to be realized.

We review and evaluate tax positions in our major tax jurisdictions and determine whether or not there are uncertain tax positions that require financial statement recognition. Based on this review, we have recorded no reserves for uncertain tax positions at December 31, 2021 and December 31, 2022.

Focus Inc. entered into Tax Receivable Agreements with the TRA holders. The agreements generally provide for the payment by us to each TRA holder of 85% of the net cash savings, if any, in U.S. federal, state and local income and franchise tax that Focus Inc. actually realizes (computed using simplifying assumptions to address the impact of state and local taxes) or is deemed to realize in certain circumstances as a result of certain increases in tax bases and certain tax benefits attributable to imputed interest. Focus Inc. will retain the benefit of the remaining 15% of these cash savings.

As of December 31, 2022, Focus Inc. had a liability of $224.6 million relating to its obligations under the Tax Receivable Agreements. The foregoing amount of expected future payments to TRA holders is merely an estimate and the actual payments could differ materially. It is possible that future transactions or events could increase or decrease the

60

Table of Contents

actual tax benefits realized and the corresponding payments under the Tax Receivable Agreements as compared to the foregoing estimates.

Consolidation Considerations

ASC Topic 810, Consolidation, requires an entity to perform a qualitative analysis to determine whether its variable interests give it a controlling financial interest in a variable interest entity (“VIE”). Under the standard, an enterprise has a controlling financial interest when it has (a) the power to direct the activities of a VIE that most significantly impact the entity’s economic performance and (b) the obligation to absorb losses of the entity or the right to receive benefits from the entity that could potentially be significant to the VIE. An enterprise that holds a controlling financial interest is deemed to be the primary beneficiary and is required to consolidate the VIE.

Certain of our subsidiaries have management agreements with the respective management company, which causes these operating subsidiaries to be VIEs. We have assessed whether or not we are the primary beneficiary for these operating subsidiaries and have concluded that we are the primary beneficiary. Accordingly, the results of these subsidiaries have been consolidated.

Certain of our subsidiaries have variable interests in certain investment funds that are deemed voting interest entities. Due to substantive kick-out rights possessed by the limited partners of these funds, we do not consolidate the investment funds.

From time to time, we enter into option agreements with wealth management firms (each, an “Optionee”) and their owners. In exchange for payment of an option premium, the option agreement allows us, at our sole discretion, to acquire substantially all of the assets of the Optionee at a predetermined time and at a predetermined purchase price formula. If we choose to exercise our option, the acquisition and the corresponding management agreement would be executed in accordance with our typical acquisition structure. We have determined that the respective option agreements with the Optionees qualify the Optionees as VIEs. We have determined that we are not the primary beneficiary of the Optionees and do not consolidate the results of the Optionees.

Stock Based Compensation Costs

Compensation cost for Focus LLC incentive units and Focus Inc. stock option awards is measured based on the fair value of awards determined by the Black-Scholes option pricing model or the Monte Carlo Simulation Model on the date that the awards are granted or modified, and is adjusted for the estimated number of awards that are expected to be forfeited. Compensation cost for unvested Class A common stock and restricted stock units, as well as Focus LLC restricted common units, is measured based on the market value of the Class A common stock on the date that the awards are granted and is adjusted for the estimated number of awards that are expected to be forfeited. The compensation cost is recognized on a straight-line basis over the requisite service period. Non-cash equity compensation expense, associated with employees and non-employees, including principals in the management companies, is included in compensation and related expenses in the consolidated statements of operations. We estimate forfeitures at the time of the respective grant and revise those estimates in subsequent periods if actual forfeitures differ materially from those estimates. We use historical data to estimate forfeitures and record non-cash equity compensation expense only for those awards that are expected to vest.

Recent Accounting Pronouncements

See Note 2 to our consolidated financial statements.

Item 7A. Quantitative and Qualitative Disclosures about Market Risk

Market Risk

Our exposure to market risk is primarily related to our partner firms’ wealth management services. For the year ended December 31, 2022, over 95% of our revenues were fee-based and recurring in nature. Although the substantial

61

Table of Contents

majority of our revenues are fee-based and recurring, our revenues can fluctuate due to macroeconomic factors and the overall state of the financial markets, particularly in the United States. The substantial majority of our revenues are derived from the wealth management fees charged by our partner firms for providing clients with investment advice, financial and tax planning, consulting, tax return preparation, family office services and other services. The majority of our wealth management fees are based on the value of the client assets and we expect those fees to increase over time as the assets increase. A decrease in the aggregate value of client assets across our partner firms may cause our revenue and income to decline.

Interest Rate Risk

Interest payable on our Credit Facility is variable. Interest rate changes will therefore affect the amount of our interest payments, future earnings and cash flows. We entered into interest rate swap agreements to manage interest rate exposure in connection with our variable interest rate borrowings. As of December 31, 2022, we had total stated value borrowings outstanding under our Credit Facility of approximately $2.6 billion. At December 31, 2022, interest payments associated with $850 million of these borrowings was effectively converted to a fixed rate through the use of interest rate swaps and interest on the remaining borrowings under our Credit Facility remained subject to variable rates based on SOFR, respectively. If 1 month USD Term SOFR or 1 month LIBOR was 1.0% higher throughout the year ended December 31, 2022, our interest expense would have increased by approximately $15.8 million.

Item 8. Financial Statements and Supplementary Data

Our financial statements and supplementary data are included in this Annual Report beginning on page F-1 and incorporated by reference herein.

Item 9. Changes in and Disagreements With Accountants on Accounting and Financial Disclosure

None.

Item 9A. Controls and Procedures

Conclusion Regarding the Effectiveness of Disclosure Controls and Procedures

Our management, with the participation of our principal executive officer and principal financial officer, evaluated the effectiveness of the design and operation of our disclosure controls and procedures (as such term is defined in Rules 13a-15(e) and 15d-15(e) under the Exchange Act) as of December 31, 2022. Our disclosure controls and procedures are designed to provide reasonable assurance that information required to be disclosed in the reports we file or submit under the Exchange Act is recorded, processed, summarized and reported within the time periods specified in the SEC’s rules and forms and that such information is accumulated and communicated to management, including the principal executive officer and principal financial officer, to allow timely decisions regarding required disclosure. Based on such evaluation, our principal executive officer and principal financial officer concluded that, as of December 31, 2022, our disclosure controls and procedures were effective, at the reasonable assurance level. Any controls and procedures, no matter how well designed and operated can only provide reasonable assurance of achieving the desired control objective and management necessarily applies its judgment in evaluating the cost-benefit relationship of all possible controls and procedures.

Management’s Report on Internal Control Over Financial Reporting

The Company’s management is responsible for establishing and maintaining adequate internal control over financial reporting for the Company. Management assessed the effectiveness of the Company’s internal control over financial reporting as of December 31, 2022. Based on management’s assessment, management has concluded that the Company’s internal control over financial reporting was effective as of December 31, 2022 using the criteria set forth in Internal Control—Integrated Framework issued by the Committee of Sponsoring Organizations of the Treadway Commission (2013 framework).

62

Table of Contents

Under guidelines established by the SEC, companies are permitted to exclude acquired businesses from management’s report on internal control over financial reporting for up to one year from the date of the acquisition while integrating the acquired operations. Accordingly, internal control over financial reporting of certain acquired businesses have been excluded from management’s report on internal control over financial reporting as of December 31, 2022. These acquired businesses represent approximately 3% of our consolidated revenues for the year ended December 31, 2022 and approximately 1% of our consolidated assets as of December 31, 2022.

Our internal control over financial reporting is designed to provide reasonable, but not absolute, assurance regarding the reliability of financial reporting and the preparation of financial statements in accordance with U.S. generally accepted accounting principles. There are inherent limitations to the effectiveness of any system of internal control over financial reporting. These limitations include the possibility of human error, the circumvention or overriding of the system and reasonable resource constraints. Because of its inherent limitations, our internal control over financial reporting may not prevent or detect misstatements. Projections of any evaluation of effectiveness to future periods are subject to the risks discussed in Part I Item 1A—Risk Factors of this report.

The effectiveness of our internal control over financial reporting as of December 31, 2022, has been audited by Deloitte & Touche LLP, an independent registered public accounting firm.

REPORT OF INDEPENDENT REGISTERED PUBLIC ACCOUNTING FIRM

To the Shareholders and the Board of Directors of Focus Financial Partners Inc.

Opinion on Internal Control over Financial Reporting

We have audited the internal control over financial reporting of Focus Financial Partners Inc. and subsidiaries (the “Company”) as of December 31, 2022, based on criteria established in Internal Control — Integrated Framework (2013) issued by the Committee of Sponsoring Organizations of the Treadway Commission (COSO). In our opinion, the Company maintained, in all material respects, effective internal control over financial reporting as of December 31, 2022, based on criteria established in Internal Control — Integrated Framework (2013) issued by COSO.

We have also audited, in accordance with the standards of the Public Company Accounting Oversight Board (United States) (PCAOB), the consolidated financial statements as of and for the year ended December 31, 2022, of the Company and our report dated February 16, 2023, expressed an unqualified opinion on those consolidated financial statements.

As described in the Management’s Report on Internal Controls Over Financial Reporting, management excluded from its assessment the internal control over financial reporting of certain businesses acquired during the 12-month period ended December 31, 2022, whose financial statements constitute approximately 1% of assets and 3% of revenues of the consolidated financial statement amounts as of and for the year ended December 31, 2022. Accordingly, our audit did not include the internal control over financial reporting of these acquired businesses.

Basis for Opinion

The Company’s management is responsible for maintaining effective internal control over financial reporting and for its assessment of the effectiveness of internal control over financial reporting, included in the accompanying Management’s Report on Internal Controls Over Financial Reporting. Our responsibility is to express an opinion on the Company’s internal control over financial reporting based on our audit. We are a public accounting firm registered with the PCAOB and are required to be independent with respect to the Company in accordance with the U.S. federal securities laws and the applicable rules and regulations of the Securities and Exchange Commission and the PCAOB.

We conducted our audit in accordance with the standards of the PCAOB. Those standards require that we plan and perform the audit to obtain reasonable assurance about whether effective internal control over financial reporting was maintained in all material respects. Our audit included obtaining an understanding of internal control over financial reporting, assessing the risk that a material weakness exists, testing and evaluating the design and operating effectiveness of internal control based on the assessed risk, and performing such other procedures as we considered necessary in the circumstances. We believe that our audit provides a reasonable basis for our opinion.

63

Table of Contents

Definition and Limitations of Internal Control over Financial Reporting

A company’s internal control over financial reporting is a process designed to provide reasonable assurance regarding the reliability of financial reporting and the preparation of financial statements for external purposes in accordance with generally accepted accounting principles. A company’s internal control over financial reporting includes those policies and procedures that (1) pertain to the maintenance of records that, in reasonable detail, accurately and fairly reflect the transactions and dispositions of the assets of the company; (2) provide reasonable assurance that transactions are recorded as necessary to permit preparation of financial statements in accordance with generally accepted accounting principles, and that receipts and expenditures of the company are being made only in accordance with authorizations of management and directors of the company; and (3) provide reasonable assurance regarding prevention or timely detection of unauthorized acquisition, use, or disposition of the company’s assets that could have a material effect on the financial statements.

Because of its inherent limitations, internal control over financial reporting may not prevent or detect misstatements. Also, projections of any evaluation of effectiveness to future periods are subject to the risk that controls may become inadequate because of changes in conditions, or that the degree of compliance with the policies or procedures may deteriorate.

/s/ DELOITTE & TOUCHE LLP

New York, New York

February 16, 2023

Changes in Internal Control over Financial Reporting

In preparation for management’s report on internal control over financial reporting, we documented and tested the design and operating effectiveness of our internal control over financial reporting. There were no significant changes in our internal controls over financial reporting that occurred during the year ended December 31, 2022, that have materially affected, or are reasonably likely to materially affect, the Company’s internal control over financial reporting.

Item 9B. Other Information

None.

64

Table of Contents

Item 9C. Disclosure Regarding Foreign Jurisdictions that Prevent Inspections

Not applicable

PART III

Item 10. Directors, Executive Officers and Corporate Governance

Information as to Item 10 will be set forth in the Proxy Statement for the Annual Meeting of Shareholders to be held on May 24, 2023 (the “Annual Meeting”) and is incorporated herein by reference.

Our board of directors has adopted a Code of Business Conduct and Ethics applicable to all of our directors, officers and employees, including our principal executive officer, principal financial officer, principal accounting officer and controller or persons performing similar functions, as well as to directors, principals, officers and employees of each of our subsidiaries and a Financial Code of Ethics, applicable to our chief executive officer, chief financial officer and principal accounting officer, in accordance with applicable U.S. federal securities laws and corporate governance rules of NASDAQ. Our Code of Business Conduct and Ethics and our Financial Code of Ethics are available on our website at www.focusfinancialpartners.com under “Corporate Governance” within the “Investor Relations” section. We will provide copies of these documents to any person, without charge, upon request, by writing to us at Focus Financial Partners Inc., Attn: Investor Relations, 875 Third Avenue, 28th Floor, New York, NY. We intend to satisfy the disclosure requirement under Item 406(b) of Regulation S-K regarding amendments to, or waivers from, provisions of our Code of Business Conduct and Ethics and our Financial Code of Ethics by posting such information on our website at the address and the location specified above.

Item 11. Executive Compensation

Information as to Item 11 will be set forth in the Proxy Statement for the Annual Meeting and is incorporated herein by reference.

Item 12. Security Ownership of Certain Beneficial Owners and Management and Related Stockholder Matters

Information as to Item 12 will be set forth in the Proxy Statement for the Annual Meeting and is incorporated herein by reference.

Item 13. Certain Relationships and Related Transactions, and Director Independence

Information as to Item 13 will be set forth in the Proxy Statement for the Annual Meeting and is incorporated herein by reference.

Item 14. Principal Accountant Fees and Services

Information as to Item 14 will be set forth in the Proxy Statement for the Annual Meeting and is incorporated herein by reference.

65

Table of Contents

PART IV

Item 15. Exhibits

Financial Statements

The consolidated financial statements of Focus Financial Partners Inc. and Subsidiaries and the Report of Independent Registered Public Accounting Firm are included in “Part II, Item 8, Financial Statements and Supplementary Data.” Reference is made to the accompanying Index to Financial Statements.

Financial Statement Schedules

All financial statement schedules have been omitted because they are not applicable or the required information is presented in the financial statements or the notes thereto.

Index to Exhibits

The exhibits required to be filed or furnished pursuant to Item 601 of Regulation S-K are set forth below.

Exhibit

Number


Description

3.1

Amended and Restated Certificate of Incorporation of Focus Financial Partners Inc.(1)

3.2

Amended and Restated Bylaws of Focus Financial Partners Inc.(1)

4.1

Registration Rights Agreement, dated as of July 30, 2018, by and among Focus Financial Partners Inc., Focus Financial Partners, LLC and the other parties named therein(1)

4.2

*

Description of Securities registered under Section 12 of the Securities Exchange Act of 1934

10.1

Nomination Agreement, dated as of July 30, 2018, by and among Focus Financial Partners Inc. and the affiliates of Stone Point Capital LLC named therein(1)

10.2

Fourth Amended and Restated Operating Agreement of Focus Financial Partners, LLC(1)

10.3

Amendment No.1 to the Fourth Amended and Restated Operating Agreement of Focus Financial Partners, LLC(4)

10.4

Tax Receivable Agreement, dated as of July 30, 2018, by and among Focus Financial Partners Inc. and the affiliates of the Private Equity Investors named therein(1)

10.5

Tax Receivable Agreement, dated as of July 30, 2018, by and among Focus Financial Partners Inc. and the parties named therein(1)

10.6

Tax Receivable Agreement, dated as of March 25, 2020, by and among Focus Financial Partners Inc. and the parties named therein(8)

10.7

Focus Financial Partners Inc. 2018 Omnibus Incentive Plan(1)

10.8

First Lien Credit Agreement, dated as of July 3, 2017, by and among Focus Financial Partners, LLC, the lenders party thereto, Bank of America, N.A., as revolver administrative agent for the Lenders, Swing Line Lender and L/C Issuer and Royal Bank of Canada, as term administrative agent for the Lenders(2)

10.9

Amendment No. 1 to First Lien Credit Agreement, dated as of January 17, 2018, by and among Focus Financial Partners, LLC, Royal Bank of Canada, as term administrative agent and collateral agent, and the lenders party thereto(2)

10.10

Amendment No. 2 to First Lien Credit Agreement, dated as of March 2, 2018, by and among Focus Financial Partners, LLC and Royal Bank of Canada, as term administrative agent and collateral agent(2)

10.11

Amendment No. 3 to First Lien Credit Agreement, dated as of April 2, 2018, by and among Focus Financial Partners, LLC, Royal Bank of Canada, as term administrative agent and collateral agent, and the lenders party thereto(2)

66

Table of Contents

Exhibit

Number


Description

10.12

Amendment No. 4 to First Lien Credit Agreement, dated as of June 29, 2018, by among Focus LLC, as borrower, the lenders party thereto, Royal Bank of Canada, as term administrative agent, collateral agent and fronting bank, and Bank of America, N.A., as revolver administrative agent and letter of credit issuer(3)

10.13

Amendment No. 5 to the First Lien Credit Agreement, dated as of July 26, 2019, among Focus Financial Partners, LLC, Royal Bank of Canada, as term administrative agent and collateral agent and each new term loan lender party thereto(5)

10.14

Amendment No. 6 to the First Lien Credit Agreement, dated as of January 27, 2020, among Focus Financial Partners, LLC, Royal Bank of Canada, as term administrative agent, collateral agent and fronting bank and the lender parties thereto(6)

10.15

Amendment No. 7 to the First Lien Credit Agreement, dated as of January 25, 2021, among Focus Financial Partners, LLC, Royal Bank of Canada, as term administrative agent and collateral agent and each lender party thereto(11)

10.16

Amendment No. 8 to First Lien Credit Agreement, dated as of July 1, 2021, among Focus Financial Partners, LLC, Royal Bank of Canada, as term administrative agent and collateral agent, and each new term loan lender party thereto(12)

10.17

Amendment No. 9 to First Lien Credit Agreement, dated as of April 13, 2022, among Focus Financial Partners, LLC, Bank of America, N.A., as revolver administrative agent, and the lenders party thereto(13)

10.18

Waiver and Amendment No. 10 to First Lien Credit Agreement, dated as of November 28, 2022, by among Focus LLC, as borrower, Royal Bank of Canada, as term administrative agent, collateral agent and fronting bank, Bank of America, N.A., as revolver administrative agent and and the lenders party thereto(14)

10.19

*

Amendment No. 11 to First Lien Credit Agreement, dated as of December 9, 2022, by among Focus LLC, as borrower and Bank of America, N.A., as revolver administrative agent

10.20

Amended and Restated Employment Agreement, by and between Ruediger Adolf and Focus Financial Partners, LLC(3)

10.21

Amended and Restated Employment Agreement, by and between Rajini Sundar Kodialam and Focus Financial Partners, LLC(3)

10.22

Amended and Restated Employment Agreement, by and between James Shanahan and Focus Financial Partners, LLC(3)

10.23†

Employment Agreement, by and between Leonard R. Chang and Focus Financial Partners, LLC(7)

10.24

Amendment No. 1 to the Employment Agreement, by and between Leonard R. Chang and Focus Financial Partners, LLC(9)

10.25

Amended and Restated Employment Agreement, by and between J. Russell McGranahan and Focus Financial Partners, LLC(7)

10.26

Form of Incentive Unit Award Agreement pursuant to the Fourth Amended and Restated Operating Agreement of Focus Financial Partners, LLC, dated as of July 3, 2017, as amended(3)

10.27

Form of Restricted Unit Award Agreement pursuant to the Fourth Amended and Restated Operating Agreement of Focus Financial Partners, LLC, dated as of July 3, 2017, as amended(3)

10.28

Indemnification Agreement (Ruediger Adolf)(1)

10.29

Indemnification Agreement (Rajini Sundar Kodialam)(1)

10.30

Indemnification Agreement (James Shanahan)(1)

10.31

Indemnification Agreement (James D. Carey)(1)

10.32

Indemnification Agreement (Fayez S. Muhtadie)(1)

67

Table of Contents

Exhibit

Number


Description

10.33

Indemnification Agreement (Joseph Feliciani Jr.)(4)

10.34

Indemnification Agreement (Leonard R. Chang)(7)

10.35

Indemnification Agreement (J. Russell McGranahan)(7)

10.36

Indemnification Agreement (Greg S. Morganroth, MD)(10)

10.37*

Indemnification Agreement (Elizabeth R. Neuhoff)

10.38*

Indemnification Agreement (George S. LeMieux)

21.1*

List of Subsidiaries of Focus Financial Partners Inc.

23.1*

Consent of Independent Registered Public Accounting Firm

31.1*

Certification of Chief Executive Officer pursuant to Section 302 of the Sarbanes-Oxley Act of 2002

31.2*

Certification of Chief Financial Officer pursuant to Section 302 of the Sarbanes-Oxley Act of 2002

32.1*

Certification of Chief Executive Officer and Chief Financial Officer pursuant to 18 U.S.C. § 1350, as adopted pursuant to Section 906 of the Sarbanes-Oxley Act of 2002

101.INS*

Inline XBRL Instance Document

101.SCH*

Inline XBRL Taxonomy Extension Schema Document

101.CAL*

Inline XBRL Taxonomy Extension Calculation Linkbase Document

101.LAB*

Inline XBRL Taxonomy Extension Label Linkbase Document

101.PRE*

Inline XBRL Taxonomy Extension Presentation Linkbase Document

101.DEF*

Inline XBRL Taxonomy Extension Definition Linkbase Document

104*

Cover Page Interactive Data File - the cover page iXBRL tags are embedded within the inline XBRL document.

*            Filed or furnished herewith.

†            Compensation, plan or arrangement.

(1)Incorporated by reference to the Registrant’s Current Report on Form 8-K (File No. 001-38604) filed with the SEC on July 31, 2018.
(2)Incorporated by reference to the Registrant’s Registration Statement on Form S-1 (File No. 333-225166) filed with the SEC on May 24, 2018.
(3)Incorporated by reference to the Registrant’s Registration Statement on Form S-1 (File No. 333-225166) filed with the SEC on June 29, 2018.
(4)Incorporated by reference to the Registrant’s Quarterly Report on Form 10-Q (File No. 001-38604) filed with the SEC on May 9, 2019.
(5)Incorporated by reference to the Registrant’s Current Report on Form 8-K (File No. 001-38604) filed with the SEC on July 26, 2019.
(6)Incorporated by reference to the Registrant’s Current Report on Form 8-K (File No. 001-38604) filed with the SEC on January 27, 2020.
(7)Incorporated by reference to the Registrant’s Annual Report on Form 10-K (File No. 001-38604) filed with the SEC on February 25, 2020.

68

Table of Contents

(8)Incorporated by reference to the Registrant’s Current Report on Form 8-K (File No. 001-38604) filed with the SEC on March 27, 2020.
(9)Incorporated by reference to the Registrant’s Quarterly Report on Form 10-Q (File No. 001-38604) filed with the SEC on May 7, 2020.
(10)Incorporated by reference to the Registrant’s Quarterly Report on Form 10-Q (File No. 001-38604) filed with the SEC on November 5, 2020.
(11)Incorporated by reference to the Registrant’s Current Report on Form 8-K (File No. 001-38604) filed with the SEC on January 25, 2021.
(12)Incorporated by reference to the Registrant’s Current Report on Form 8-K (File No. 001-38604) filed with the SEC on July 1, 2021.
(13)Incorporated by reference to the Registrant’s Current Report on Form 8-K (File No. 001-38604) filed with the SEC on April 18, 2022.
(14)Incorporated by reference to the Registrant’s Current Report on Form 8-K (File No. 001-38604) filed with the SEC on November 29, 2022.

69

Table of Contents

SIGNATURES

Pursuant to the requirements of Section 13 or 15(d) of the Securities Exchange Act of 1934, the registrant has duly caused this report to be signed on its behalf by the undersigned, thereunto duly authorized.

FOCUS FINANCIAL PARTNERS INC.

By:

/s/ RUEDIGER ADOLF

Ruediger Adolf

Chairman and Chief Executive Officer

(Principal Executive Officer)

Date: February 16, 2023

By:

/s/ JAMES SHANAHAN

James Shanahan

Chief Financial Officer

(Principal Financial Officer and Principal Accounting Officer)

Pursuant to the requirements of the Securities Exchange Act of 1934, this report has been signed below by the following persons on behalf of the registrant and in the capacities and on the dates indicated.

Signature


Title


Date

/s/ RUEDIGER ADOLF

Chief Executive Officer and Chairman

(Principal Executive Officer)

February 16, 2023

Ruediger Adolf

/s/ JAMES SHANAHAN

Chief Financial Officer (Principal Financial

Officer and Principal Accounting Officer)

February 16, 2023

James Shanahan

/s/ JAMES D. CAREY

Director

February 16, 2023

James D. Carey

/s/ JOSEPH FELICIANI JR.

Director

February 16, 2023

Joseph Feliciani Jr.

/s/ RAJINI SUNDAR KODIALAM

Director

February 16, 2023

Rajini Sundar Kodialam

/s/ GEORGE S. LEMIEUX

Director

February 16, 2023

George S. LeMieux

/s/GREG S. MORGANROTH, MD

Director

February 16, 2023

Greg S. Morganroth, MD

/s/ FAYEZ S. MUHTADIE

Director

February 16, 2023

Fayez S. Muhtadie

/s/ ELIZABETH R. NEUHOFF

Director

February 16, 2023

Elizabeth R. Neuhoff

70

Table of Contents

INDEX TO FINANCIAL STATEMENTS

FOCUS FINANCIAL PARTNERS INC.


Page

Consolidated Financial Statements as of December 31, 2021 and 2022 and for the Years Ended December 31, 2020, 2021 and 2022

Report of independent registered public accounting firm (PCAOB ID: 34)

F-2

Balance sheets as of December 31, 2021 and 2022

F-5

Statements of operations for the years ended December 31, 2020, 2021 and 2022

F-6

Statements of comprehensive income for the years ended December 31, 2020, 2021 and 2022

F-7

Statements of cash flows for the years ended December 31, 2020, 2021 and 2022

F-8

Statements of equity for the years ended December 31, 2020, 2021 and 2022

F-9

Notes to consolidated financial statements

F-10

F-1

Table of Contents

REPORT OF INDEPENDENT REGISTERED PUBLIC ACCOUNTING FIRM

To the Shareholders and the Board of Directors of Focus Financial Partners Inc.

Opinion on the Financial Statements

We have audited the accompanying consolidated balance sheets of Focus Financial Partners Inc. and subsidiaries (the "Company") as of December 31, 2022 and 2021, the related consolidated statements of operations, comprehensive income, cash flows and equity, for each of the three years in the period ended December 31, 2022, and the related notes (collectively referred to as the "financial statements"). In our opinion, the financial statements present fairly, in all material respects, the financial position of the Company as of December 31, 2022 and 2021, and the results of its operations and its cash flows for each of the three years in the period ended December 31, 2022, in conformity with accounting principles generally accepted in the United States of America.

We have also audited, in accordance with the standards of the Public Company Accounting Oversight Board (United States) (PCAOB), the Company's internal control over financial reporting as of December 31, 2022, based on criteria established in Internal Control — Integrated Framework (2013) issued by the Committee of Sponsoring Organizations of the Treadway Commission and our report dated February 16, 2023, expressed an unqualified opinion on the Company's internal control over financial reporting.

Basis for Opinion

These financial statements are the responsibility of the Company's management. Our responsibility is to express an opinion on the Company's financial statements based on our audits. We are a public accounting firm registered with the PCAOB and are required to be independent with respect to the Company in accordance with the U.S. federal securities laws and the applicable rules and regulations of the Securities and Exchange Commission and the PCAOB.

We conducted our audits in accordance with the standards of the PCAOB. Those standards require that we plan and perform the audit to obtain reasonable assurance about whether the financial statements are free of material misstatement, whether due to error or fraud. Our audits included performing procedures to assess the risks of material misstatement of the financial statements, whether due to error or fraud, and performing procedures that respond to those risks. Such procedures included examining, on a test basis, evidence regarding the amounts and disclosures in the financial statements. Our audits also included evaluating the accounting principles used and significant estimates made by management, as well as evaluating the overall presentation of the financial statements. We believe that our audits provide a reasonable basis for our opinion.

Critical Audit Matters

The critical audit matters communicated below are matters arising from the current period audit of the financial statements that were communicated or required to be communicated to the audit committee and that (1) relate to accounts or disclosures that are material to the financial statements and (2) involved our especially challenging, subjective, or complex judgments. The communication of critical audit matters does not alter in any way our opinion on the financial statements, taken as a whole, and we are not, by communicating the critical audit matters below, providing separate opinions on the critical audit matters or on the accounts or disclosures to which they relate.

Goodwill and Other Intangible Assets Valuation pertaining to current year acquisitions — Refer to Notes 2, 4 and 5 to the financial statements

Critical Audit Matter Description

The Company acquires businesses throughout the year in transactions which qualify as business acquisitions. The Company may also separately purchase customer relationships and other intangible assets in asset acquisitions that do not qualify as business acquisitions.

F-2

Table of Contents

The purchase price associated with each business acquisition consists of cash, may include equity, and the right of the seller to receive contingent consideration. The purchase price is allocated across the estimated fair value of tangible assets acquired, liabilities assumed and the fair value of intangible assets, with the excess purchase price allocated to goodwill.

The fair value of other intangible assets and the calculation of goodwill involves significant management judgment in estimating projections, forecasting growth rates used to produce financial projections for the acquired entities, and the selection of unobservable inputs and other assumptions. The inputs used in establishing the fair value of other intangible assets are in most cases unobservable and reflect the Company’s own judgments about the assumptions market participants would use in pricing the asset.

Auditing the fair value of other intangible assets and the calculation of goodwill involves a high degree of auditor judgment and an increased extent of effort, including the need to involve our fair value specialists for certain acquisitions, when performing audit procedures to evaluate the reasonableness of management’s forecasts of future growth rates and the selection of the unobservable inputs used in the models.

How the Critical Audit Matter Was Addressed in the Audit

Our audit procedures related to the purchase price allocation for business acquisitions occurring during the year included the following, utilizing fair value specialists for certain procedures and transactions:

1.

We tested the design, implementation and operating effectiveness of controls over the purchase price allocation, including understanding management’s processes and controls over the valuation of other intangible assets and the underlying assumptions used for estimating the fair value of assets acquired and liabilities assumed.

2.

We evaluated management’s policies and methodology for establishing the fair values used in the purchase price allocations and the prospective financial information, including testing the completeness and accuracy of underlying data.

3.

We evaluated the reasonableness of the unobservable inputs, and other key judgments made by management to determine the reasonableness of the fair value of the other intangible assets and the calculation of goodwill.

4.

We evaluated the reasonableness of management’s revenue and operating margin forecasts by comparing the forecasts to:

· Actual historical revenues and operating margins of the acquired entity

· Internal communications to management and the Board of Directors

· Forecasted information included in Company press releases, analyst and industry reports for the Company, market trends, and certain of its guideline companies.

5.

We evaluated the future revenue growth rates used by the Company to determine forecasted revenues and operating margins, by comparing them to industry benchmarks and data, as well as evaluated the relevance and reliability of third-party market data points used to develop the future revenue growth rates.

6.

We evaluated the reasonableness of management’s assumptions through independent analysis using publicly available market data for comparable entities and comparison to industry benchmark and data.

7.

We engaged internal fair value specialists (IFVS) from Deloitte Transactions and Business Analytics LLP to test valuation methodology and challenge the key valuation assumptions on selected acquisitions.

Contingent Consideration Valuation — Refer to Notes 2, 4 and 7 to the financial statements

Critical Audit Matter Description

The purchase price associated with acquisitions consists of cash, may include equity, and contingent consideration. For business acquisitions, the Company recognizes the fair value of estimated contingent consideration at the acquisition date as part of purchase price allocation. Contingent consideration is paid upon the passage of time and the satisfaction of specified financial performance targets. The performance targets are typically tied to acquired entity’s revenues or earnings. The estimated contingent consideration is remeasured to fair value at each reporting date until the contingency

F-3

Table of Contents

is resolved. Any changes in fair value are recognized each reporting period in non-cash changes in fair value of estimated contingent consideration. In determining fair value of the estimated contingent consideration, the acquired business’s future performance is estimated using financial projections for the acquired businesses. The Company uses the Monte Carlo Simulation Model to determine the fair value of the Company's estimated contingent consideration given the non-linear nature of the arrangements.

The fair value of the estimated contingent consideration involves significant management judgment in forecasting growth rates used to produce financial projections for the acquired businesses and selecting unobservable inputs and other assumptions used in the Monte Carlo Simulation Model.

We identified the valuation of estimated contingent consideration at acquisition and the remeasurement thereafter as a critical audit matter because of the significant estimates and assumptions management makes related to the unobservable inputs and financial projections. This required a high degree of auditor judgment and an increased extent of effort, including the need to involve our fair value specialists for certain acquisitions and year-end estimates, when performing audit procedures to evaluate the reasonableness of the financial projections and the selection of the unobservable inputs used in the Monte Carlo Simulation Model.

How the Critical Audit Matter Was Addressed in the Audit

Our audit procedures related to the valuation of contingent consideration included the following, utilizing fair value specialists for certain procedures and transactions:

1.

We tested the design, implementation and operating effectiveness of controls over the valuation of contingent consideration including understanding management processes and controls in forecasting future revenues and operating margins as well as those over the estimation process for inputs used in the Monte Carlo Simulation Model.

2.

We evaluated management’s policies and methodology for establishing the valuation of estimated contingent consideration.

3.

We evaluated the reasonableness of the unobservable inputs, and other key judgments made by management as well as independently running the Monte Carlo Simulations to calculate an independent estimate of fair value on acquisitions that were selected for testing by the specialists. We compared the results of our estimate of fair value of the contingent consideration liabilities to the Company’s fair value estimate.

4.

We evaluated the reasonableness of management’s revenue and operating margin forecasts of the acquired businesses by comparing the forecasts to:

· Actual historical revenues and operating margins

· Internal communications to management and the Board of Directors

· Performing sensitivity analysis and evaluating potential effect of changes in certain assumptions.

5.

We evaluated management’s ability to accurately estimate fair value by comparing management’s historical estimates to subsequent results.

6.

We evaluated the reasonableness of management’s assumptions through independent analysis using publicly available market data for comparable entities and comparison to industry benchmarks and data.

7.We engaged internal fair value specialists (IFVS) from Deloitte Transactions and Business Analytics LLP to test valuation methodology and challenge the key valuation assumptions on selected acquisitions.

/s/ DELOITTE & TOUCHE LLP

New York, New York

February 16, 2023

We have served as the Company’s auditor since 2008.

F-4

Table of Contents

FOCUS FINANCIAL PARTNERS INC.

CONSOLIDATED BALANCE SHEETS

AS OF DECEMBER 31, 2021 AND DECEMBER 31, 2022

(In thousands, except share and per share amounts)

2021

2022

ASSETS


Cash and cash equivalents

$

310,684

$

139,973

Accounts receivable less allowances of $3,255 at 2021 and $3,862 at 2022


198,827


217,219

Prepaid expenses and other assets


123,826


151,356

Fixed assets—net


47,199


54,748

Operating lease assets

249,850

258,697

Debt financing costs—net


4,254


7,590

Deferred tax assets—net

267,332

230,130

Goodwill


1,925,315


2,167,917

Other intangible assets—net


1,581,719


1,639,124

TOTAL ASSETS

$

4,709,006

$

4,866,754

LIABILITIES AND EQUITY


LIABILITIES


Accounts payable

$

11,580

$

12,213

Accrued expenses


72,572


80,679

Due to affiliates


105,722


70,974

Deferred revenue


10,932


10,726

Contingent consideration and other liabilities


468,284


335,033

Deferred tax liabilities

31,973

29,579

Operating lease liabilities

277,324

288,895

Borrowings under credit facilities (stated value of $2,407,302 and $2,563,970 at December 31, 2021 and December 31, 2022, respectively)


2,393,669


2,510,749

Tax receivable agreements obligations

219,542

224,611

TOTAL LIABILITIES


3,591,598


3,563,459

COMMITMENTS AND CONTINGENCIES (Note 14)


EQUITY

Class A common stock, par value $0.01, 500,000,000 shares authorized; 65,320,124 and 65,929,644 shares issued and outstanding at December 31, 2021 and December 31, 2022, respectively

653

659

Class B common stock, par value $0.01, 500,000,000 shares authorized; 11,439,019 and 11,827,321 shares issued and outstanding at December 31, 2021 and December 31, 2022, respectively

114

118

Additional paid-in capital

841,753

918,044

Retained earnings

24,995

116,779

Accumulated other comprehensive income

3,029

18,318

Total shareholders' equity

870,544

1,053,918

Non-controlling interest

246,864

249,377

Total equity

1,117,408

1,303,295

TOTAL LIABILITIES AND EQUITY

$

4,709,006

$

4,866,754

See notes to consolidated financial statements

F-5

Table of Contents

FOCUS FINANCIAL PARTNERS INC.

CONSOLIDATED STATEMENTS OF OPERATIONS

FOR THE YEARS ENDED DECEMBER 31, 2020, 2021 and 2022

(In thousands, except share and per share amounts)

2020


2021


2022

REVENUES:


Wealth management fees

$

1,286,130

$

1,717,365

$

2,056,328

Other


75,189


80,586


86,993

Total revenues


1,361,319


1,797,951


2,143,321

OPERATING EXPENSES:


Compensation and related expenses


476,208


591,121


729,891

Management fees


349,475


491,433


530,329

Selling, general and administrative


236,377


297,636


376,417

Intangible amortization


147,783


187,848


261,842

Non-cash changes in fair value of estimated contingent consideration


19,197


112,416


(64,747)

Depreciation and other amortization


12,451


14,625


15,281

Total operating expenses


1,241,491


1,695,079


1,849,013

INCOME FROM OPERATIONS


119,828


102,872


294,308

OTHER INCOME (EXPENSE):


Interest income


453


422


791

Interest expense


(41,658)


(55,001)


(99,887)

Amortization of debt financing costs


(2,909)


(3,958)


(3,999)

Loss on extinguishment of borrowings


(6,094)


(1,807)

Other expense—net


(214)


(337)


(11,370)

Income from equity method investments

219

524

319

Total other expense—net


(50,203)


(58,350)


(115,953)

INCOME BEFORE INCOME TAX


69,625


44,522


178,355

INCOME TAX EXPENSE


20,660


20,082


53,077

NET INCOME

$

48,965

$

24,440

$

125,278

Non-controlling interest

(20,920)

(14,028)

(33,494)

NET INCOME ATTRIBUTABLE TO COMMON SHAREHOLDERS

$

28,045

$

10,412

$

91,784

Income per share of Class A common stock:

Basic

$

0.58

$

0.18

$

1.40

Diluted

$

0.57

$

0.18

$

1.39

Weighted average shares of Class A common stock outstanding:

Basic

48,678,584

57,317,477

65,552,592

Diluted

48,796,613

57,831,151

65,810,215

See notes to consolidated financial statements

F-6

Table of Contents

FOCUS FINANCIAL PARTNERS INC.

CONSOLIDATED STATEMENTS OF COMPREHENSIVE INCOME

FOR THE YEARS ENDED DECEMBER 31, 2020, 2021 and 2022

(In thousands)


2020


2021


2022

Net income

$

48,965

$

24,440

$

125,278

Other comprehensive income (loss), net of tax:


Foreign currency translation adjustments


7,555


(5,332)


(10,255)

Unrealized gain (loss) on interest rate swaps designated as cash flow hedges

(8,596)

13,212

30,145

Comprehensive income

$

47,924

$

32,320

$

145,168

Less: Comprehensive income attributable to noncontrolling interest

(20,747)

(16,712)

(38,095)

Comprehensive income attributable to common shareholders

$

27,177

$

15,608

$

107,073

See notes to consolidated financial statements

F-7

Table of Contents

FOCUS FINANCIAL PARTNERS INC.

CONSOLIDATED STATEMENTS OF CASH FLOWS

FOR THE YEARS ENDED DECEMBER 31, 2020, 2021 and 2022

(In thousands)


2020


2021


2022

CASH FLOWS FROM OPERATING ACTIVITIES:


Net income

$

48,965

$

24,440

$

125,278

Adjustments to reconcile net income to net cash provided by operating activities—net of effect of acquisitions:


Intangible amortization

147,783


187,848


261,842

Depreciation and other amortization

12,451


14,625


15,281

Amortization of debt financing costs

2,909


3,958


3,999

Non-cash equity compensation expense

22,285


31,602


30,453

Non-cash changes in fair value of estimated contingent consideration

19,197


112,416


(64,747)

Income from equity method investments

(219)


(524)


(319)

Distributions received from equity method investments

231


1,143


1,396

Deferred taxes and other non-cash items

2,618


(8,568)


32,243

Loss on extinguishment of borrowings

6,094


1,807

Changes in cash resulting from changes in operating assets and liabilities:


Accounts receivable

(37,913)


(32,006)


(16,778)

Prepaid expenses and other assets

74


2,103


(245)

Accounts payable

606


486


(82)

Accrued expenses

10,876


14,444


10,445

Due to affiliates

7,650


38,831


(35,060)

Contingent consideration and other liabilities

(29,683)


(77,423)


(74,765)

Deferred revenue

(2,563)


543


(2,149)

Net cash provided by operating activities

211,361


313,918


288,599

CASH FLOWS FROM INVESTING ACTIVITIES:


Cash paid for acquisitions and contingent consideration—net of cash acquired

(348,674)


(979,062)


(461,522)

Purchase of fixed assets

(19,349)


(11,018)


(21,017)

Investments and other, net

(4,950)


(17,232)


7,358

Net cash used in investing activities

(372,973)


(1,007,312)


(475,181)

CASH FLOWS FROM FINANCING ACTIVITIES:


Borrowings under credit facilities

555,000


1,318,375


1,998,900

Repayments of borrowings under credit facilities

(326,566)


(425,320)


(1,873,332)

Proceeds from issuance of common stock, net

219,636

Payments in connection with unit redemption, net

(57,735)

Payments in connection with tax receivable agreements

(4,423)

(3,856)

Contingent consideration paid

(49,891)


(78,092)


(62,025)

Payments of deferred cash consideration

(1,484)

Payments of debt financing costs

(634)


(8,282)


(19,072)

Proceeds from exercise of stock options

6,912

8,350

1,158

Equity awards withholding

(386)

(1,343)

(685)

Other

(147)

(58)

372

Distributions for unitholders

(22,457)


(32,311)


(22,984)

Net cash provided by financing activities

161,831


938,797


16,992

EFFECT OF EXCHANGE RATES ON CASH AND CASH EQUIVALENTS

461


(577)


(1,121)

CHANGE IN CASH AND CASH EQUIVALENTS

680


244,826


(170,711)

CASH AND CASH EQUIVALENTS:


Beginning of period

65,178


65,858


310,684

End of period

$

65,858

$

310,684

$

139,973

See Note 17 for Supplemental Cash Flow Disclosure

See notes to consolidated financial statements

F-8

Table of Contents

FOCUS FINANCIAL PARTNERS INC.

CONSOLIDATED STATEMENTS OF EQUITY

FOR THE YEARS ENDED DECEMBER 31, 2020, 2021 and 2022

(Dollars in thousands)


Accumulated

Class A

Class B

Additional

Retained

Other

Total

Non-

Common Stock

Common Stock

Paid-In

Earnings

Comprehensive

Shareholders'

controlling

Total


Shares


Amount


Shares


Amount


Capital


(Deficit)


Income (Loss)


Equity


Interest


Equity

Balance at—January 1, 2020

47,421,315

$

474

22,075,749

$

221

$

498,186

$

(13,462)

$

(1,299)

$

484,120

$

319,850

$

803,970

Net income

28,045

28,045

20,920

48,965

Issuance (cancellation) of common stock in connection with exercise of Focus LLC common unit exchange rights

1,414,154

14

(1,414,154)

(14)

43,235

43,235

43,235

Issuance of common stock in connection with exercise of Focus LLC incentive unit exchange rights

2,058,146

21

69,436

69,457

69,457

Forfeiture of unvested Class A common stock

(834)

(27)

(27)

(27)

Exercise of stock options

251,913

2

7,799

7,801

7,801

Restricted stock units vesting and related withholdings

14,018

1

(387)

(386)

(386)

Change in non-controlling interest allocation

(96,443)

(96,443)

(21,517)

(117,960)

Non-cash equity compensation expenses

4,798

4,798

4,798

Currency translation adjustment—net of tax

4,689

4,689

2,866

7,555

Unrealized loss on interest rate swaps designated as cash flow hedges—net of tax

(5,557)

(5,557)

(3,039)

(8,596)

Adjustments of deferred taxes, net of amounts payable under tax receivable agreements and changes from Focus LLC interest transactions

67

67

67

Balance at—December 31, 2020

51,158,712

$

512

20,661,595

$

207

$

526,664

$

14,583

$

(2,167)

$

539,799

$

319,080

$

858,879

Net income

10,412

10,412

14,028

24,440

Issuance of common stock in connection with acquisitions and contingent consideration

58,657

1

614,362

5

3,514

3,520

3,520

Issuance (cancellation) of common stock in connection with offerings, net

10,114,939

100

(6,306,301)

(63)

511,691

511,728

511,728

Issuance (cancellation) of common stock in connection with exercise of Focus LLC common unit exchange rights

3,542,853

35

(3,542,853)

(35)

194,410

194,410

194,410

Issuance of common stock in connection with exercise of Focus LLC incentive unit exchange rights

185,563

2

9,398

9,400

9,400

Exercise of stock options

235,684

3

7,458

7,461

7,461

Restricted stock units vesting and related withholdings

23,716

(971)

(971)

(971)

Restricted common units vesting

12,216

Change in non-controlling interest allocation

(434,901)

(434,901)

(88,928)

(523,829)

Non-cash equity compensation expenses

6,036

6,036

6,036

Currency translation adjustment—net of tax

(4,175)

(4,175)

(1,157)

(5,332)

Unrealized gain on interest rate swaps designated as cash flow hedges—net of tax

9,371

9,371

3,841

13,212

Adjustments of deferred taxes, net of amounts payable under tax receivable agreements and changes from Focus LLC interest transactions

18,454

18,454

18,454

Balance at—December 31, 2021

65,320,124

$

653

11,439,019

$

114

$

841,753

$

24,995

$

3,029

$

870,544

$

246,864

$

1,117,408

Net income

91,784

91,784

33,494

125,278

Issuance of common stock in connection with acquisitions and contingent consideration

839,184

9

9

9

Issuance (cancellation) of common stock in connection with exercise of Focus LLC common unit exchange rights

488,258

5

(488,258)

(5)

19,657

19,657

19,657

Issuance of common stock in connection with exercise of Focus LLC incentive unit exchange rights

43,720

1

1,734

1,735

1,735

Exercise of stock options

42,076

1,158

1,158

1,158

Restricted stock units vesting and related withholdings

35,466

(763)

(763)

(763)

Restricted common units vesting

37,376

Change in non-controlling interest allocation

53,127

53,127

(35,582)

17,545

Non-cash equity compensation expenses

8,726

8,726

8,726

Currency translation adjustment—net of tax

(8,336)

(8,336)

(1,919)

(10,255)

Unrealized gain on interest rate swaps designated as cash flow hedges—net of tax

23,625

23,625

6,520

30,145

Adjustments of deferred taxes, net of amounts payable under tax receivable agreements and changes from Focus LLC interest transactions

(7,348)

(7,348)

(7,348)

Balance at—December 31, 2022

65,929,644

$

659

11,827,321

$

118

$

918,044

$

116,779

$

18,318

$

1,053,918

$

249,377

$

1,303,295

See notes to consolidated financial statements

F-9

Table of Contents

FOCUS FINANCIAL PARTNERS INC.

NOTES TO CONSOLIDATED FINANCIAL STATEMENTS

FOR THE YEARS ENDED DECEMBER 31, 2020, 2021 and 2022

(In thousands, except unit data, share and per share amounts)

1. GENERAL

Organization

Focus Financial Partners Inc. (“Focus Inc.”) is a holding company that was formed as a Delaware corporation on July 29, 2015. Focus Inc. is the managing member of Focus Financial Partners, LLC (“Focus LLC”) and operates and controls the businesses and affairs of Focus LLC.

Focus LLC is a Delaware limited liability company that was formed in November 2004. Focus LLC’s subsidiaries commenced revenue generating and acquisition activities in January 2006. Focus LLC’s activities are governed by its Fourth Amended and Restated Operating Agreement, as amended (the “Operating Agreement”).

The consolidated financial statements reflect the results of operations and financial position of Focus Inc. and its subsidiaries (the “Company”).

Business

The Company is in the business of acquiring and overseeing independent fiduciary wealth management and related businesses. The Company typically acquires 100% of the net assets or equity of the wealth management businesses on terms that are generally consistent for each acquisition. To determine the acquisition price, the Company first estimates the operating cash flow of the business to be acquired based on current and projected levels of revenue and expenses. For this purpose, the Company defines operating cash flow as cash revenue of the business, less cash expenses, other than compensation and benefits to the selling entrepreneurs or individuals who typically become principals of the management entities discussed below. The Company refers to the estimated operating cash flow earnings before partner compensation as target earnings (“Target Earnings”). The acquisition price is a multiple of a portion of the Target Earnings, referred to as base earnings (“Base Earnings”).

At the date of each of the respective acquisitions, the Company typically enters into a management agreement (“Management Agreement”) with a management company (“Management Company”) that is owned substantially by the selling principals of the acquired businesses. The Management Company earns management fees to manage the daily operations of the acquired business. The terms of the Management Agreements are generally six years with automatic renewals for consecutive one-year terms, unless terminated by either the Management Company or the Company. Under the Management Agreement, the Management Company is entitled to management fees typically consisting of all future earnings of the acquired business in excess of the Base Earnings up to Target Earnings, plus a percentage of any earnings in excess of Target Earnings. The Company, through its respective operating subsidiary, retains a preferred position in the Base Earnings. To the extent earnings of an acquired business in any year are less than the Base Earnings, in the following year the Company, through its respective operating subsidiary, is entitled to receive the Base Earnings together with the prior years’ shortfall before any management fees are earned by the Management Company. Since each Management Company is neither acquired nor consolidated, management fees are included in the Company’s consolidated statements of operations as operating expenses. Estimated management fees due are included in due to affiliates in the accompanying consolidated balance sheets.

2. SUMMARY OF SIGNIFICANT ACCOUNTING POLICIES

Basis of Presentation

The accompanying consolidated financial statements have been prepared in accordance with accounting principles generally accepted in the United States of America (“U.S. GAAP”). The consolidated financial statements

F-10

Table of Contents

FOCUS FINANCIAL PARTNERS INC.

NOTES TO CONSOLIDATED FINANCIAL STATEMENTS

FOR THE YEARS ENDED DECEMBER 31, 2020, 2021 and 2022

(In thousands, except unit data, share and per share amounts)

include the accounts of the Company and its subsidiaries. The Company consolidates Focus LLC and its subsidiaries’ financial statements and records the interests in Focus LLC consisting of common units, restricted common units and the common unit equivalent of incentive units of Focus LLC that the Company does not own as non-controlling interests, see Note 3. Intercompany transactions and balances have been eliminated in consolidation.

Use of Estimates

The preparation of the consolidated financial statements in conformity with U.S. GAAP requires management to make estimates and assumptions that affect the reported amounts of assets and liabilities and disclosure of contingent assets and liabilities at the date of the financial statements and the reported amounts of revenue and expenses during the reporting period. Actual results could differ from those estimates.

Income Per Share

Income per share is computed in accordance with Accounting Standards Codification (“ASC”) Topic 260, Earnings Per Share. Basic income per share is computed by dividing the net income attributable to common shareholders by the weighted average number of shares outstanding for that period. Diluted income per share is calculated by dividing the net income attributable to common shareholders by the weighted average number of shares of Class A common stock outstanding during the same periods plus the effect, if any, of the potentially dilutive shares of the Company’s Class A common stock from stock options, unvested Class A common stock, restricted stock units and Focus LLC common units, including contingently issuable Focus LLC common units, if any, restricted common units, and incentive units as calculated using the treasury stock method.

Revenue Recognition

Wealth Management Fees

The Company recognizes revenue from wealth management fees, which are primarily composed of fees earned for advising on the assets of clients, financial and tax planning fees, consulting fees, tax return preparation fees, fees for family office services, and fees for wealth management and operational support services provided to third-party wealth management firms. Client arrangements may contain one of the services or multiple services, resulting in either a single or multiple performance obligations within the same client arrangement, each of which are separately identifiable and priced, and accounted for as the related services are provided and consumed over time. Fees are primarily based either on a contractual percentage of the client’s assets based on the market value of the client’s assets on the predetermined billing date, a flat fee, an hourly rate based on predetermined billing rates or a combination of such fees and are billed either in advance or arrears on a monthly, quarterly, or semiannual basis. Revenue is recognized over the respective service period based on time elapsed or hours expended, as the case may be, which is deemed to be the most faithful depiction of the transfer of services as clients benefit from services over the respective period. Revenue for wealth management and operational support services provided to third party wealth management firms is presented net since these services are performed in an agent capacity. Client agreements typically do not have a specified term and may be terminated at any time by either party subject to the respective termination and notification provisions in each agreement.

A majority of the Company’s wealth management fees are correlated to the markets, and therefore are considered variable consideration. The Company’s market-correlated fees are dependent on the market and, thus, are susceptible to factors outside the Company’s control. Therefore, at inception of the contractual service period for fees which are based on the market values at the end of the service period, the Company cannot conclude that it is probable that a reversal in the cumulative revenue recognized would not occur if the estimate was included in the transaction price at that time. However, at each quarterly reporting date, the Company updates its estimate of the transaction price as the

F-11

Table of Contents

FOCUS FINANCIAL PARTNERS INC.

NOTES TO CONSOLIDATED FINANCIAL STATEMENTS

FOR THE YEARS ENDED DECEMBER 31, 2020, 2021 and 2022

(In thousands, except unit data, share and per share amounts)

market uncertainty is typically resolved. The Company can then reasonably conclude that a reversal of the variable consideration will not occur for those services already provided.

Wealth management fees are recorded when: (i) an arrangement with a client has been identified; (ii) the performance obligations have been identified; (iii) the fee or other transaction price has been determined; (iv) the fee or other transaction price has been allocated to each performance obligation based on standalone fee rates; and (v) the Company has satisfied the applicable performance obligation.

Other

Other revenue includes fees earned for recordkeeping and administration services provided to employee benefit plans as well as commissions and distribution fees and outsourced services. Client arrangements may contain a single or multiple performance obligations, each of which are separately identifiable and accounted for as the related services are provided and consumed over time. Recordkeeping and administration and outsourced services revenue, in accordance with the same five criteria above, are recognized over the period in which services are provided. Commissions and distribution fees are recognized when earned.

The Company disaggregates revenue based on the above two categories. The Company does not allocate revenue by the type of service provided in connection with providing holistic wealth management client services. The Company generally manages its business based on the operating results of the enterprise taken as a whole, not by geographic region. The following table disaggregates the revenues based on the location of the partner firm legal entities that generate the revenues, and therefore may not be reflective of the geography in which clients are located, for the years ended December 31, 2020, 2021 and 2022:

2020


2021


2022

Domestic revenue

$

1,291,630

$

1,691,345

$

2,016,845

International revenue


69,689


106,606


126,476

Total revenue

$

1,361,319

$

1,797,951

$

2,143,321

International revenue consists of revenue generated by partner firm legal entities primarily in Australia, Canada, Switzerland, the United Kingdom and in other non-US jurisdictions.

Deferred Revenue

Fees collected in advance are deferred and recognized in revenue over the period earned with the unrecognized portion of fees collected in advance recorded as deferred revenue in the accompanying consolidated balance sheets.

Cash and Cash Equivalents

The Company considers all highly liquid instruments with a maturity of three months or less when purchased to be cash equivalents.

Accounts Receivable

Accounts receivable are stated at their net realizable value. Allowances for uncollectible accounts are maintained for estimated losses resulting from the inability of customers to make required payments. In determining

F-12

Table of Contents

FOCUS FINANCIAL PARTNERS INC.

NOTES TO CONSOLIDATED FINANCIAL STATEMENTS

FOR THE YEARS ENDED DECEMBER 31, 2020, 2021 and 2022

(In thousands, except unit data, share and per share amounts)

these estimates, historical write-offs, the aging of the receivables and other factors, such as overall economic conditions, are considered.

Fixed Assets

Fixed assets are initially recorded at cost and are depreciated using the straight-line method over their estimated useful lives. The estimated useful lives for fixed assets, primarily consisting of computers, equipment, and furniture and fixtures, are generally between three to seven years. Leasehold improvements are amortized over the shorter of their estimated economic useful lives or the terms of the leases. The costs of improvements that extend the life of a fixed asset are capitalized, while the costs of repairs and maintenance are expensed as incurred.

Debt Financing Costs

Direct costs incurred with obtaining debt financing are capitalized or recorded as a reduction of the underlying debt. The costs are amortized over the respective term of the underlying debt and are included in amortization of debt financing costs in the accompanying consolidated statements of operations.

Business Acquisitions

Business acquisitions are accounted for in accordance with ASC Topic 805: Business Combinations. Business acquisitions are accounted for by allocating the purchase price consideration to the fair value of assets acquired and liabilities assumed. The purchase price allocations are based upon preliminary valuations, and the Company’s estimates and assumptions are subject to change within the measurement period as valuations are finalized. Any change in the estimated fair value of the net assets, prior to the finalization of the more detailed analyses, but not to exceed one year from the dates of acquisition, will change the amount of the purchase price allocations. Goodwill is recognized as the excess of the purchase price consideration over the fair value of net assets of the business acquired. All transaction costs are expensed as incurred.

The Company has incorporated contingent consideration, or earn out provisions, into the structure of its business acquisitions. These arrangements may result in the payment of additional purchase price consideration to the sellers based on the growth of certain financial thresholds for periods following the closing of the respective acquisition. The additional purchase price consideration is payable in the form of cash and, in some cases, equity.

The Company recognizes the fair value of estimated contingent consideration at the acquisition date as part of the consideration transferred in exchange for the acquired business. The contingent consideration is remeasured to fair value at each reporting date until the contingency is resolved. Any changes in fair value are recognized each reporting period in non-cash changes in fair value of estimated contingent consideration in the accompanying consolidated statements of operations.

The results of the acquired businesses have been included in the Company’s consolidated financial statements from the respective dates of acquisition.

Investments

The equity method of accounting is applied to investments where the Company has the ability to exercise significant influence over operating and financial matters. During the years ended December 2021 and 2022, the Company acquired minority equity interests in wealth management firms for $1,632 and $5,232 in cash that are accounted for using the equity method of accounting.

F-13

Table of Contents

FOCUS FINANCIAL PARTNERS INC.

NOTES TO CONSOLIDATED FINANCIAL STATEMENTS

FOR THE YEARS ENDED DECEMBER 31, 2020, 2021 and 2022

(In thousands, except unit data, share and per share amounts)

The Company records other equity investments that do not have readily determinable fair values at cost less impairment, if any, plus or minus changes resulting from observable price changes. Investments are periodically reviewed for impairment.

During the year ended December 31, 2021, the Company invested $18,000 in a publicly traded mutual fund that was sold during the year ended December 31, 2022. Unrealized and realized gains and losses are recognized in other expense-net in the consolidated statements of operations.

The Company’s investments are included in prepaid expenses and other assets in the consolidated balance sheets.

Goodwill, Intangible Assets and Other Long-Lived Assets

Goodwill is deemed to have an indefinite useful life and is not amortized. Intangible and other long-lived assets are amortized over their respective estimated useful lives. The Company has no indefinite-lived intangible assets.

Goodwill is tested annually for impairment as of October 1, or more frequently if events and circumstances change that would more likely than not reduce the fair value of a reporting unit below its carrying amount. The Company compares the fair value of the reporting unit to the carrying value of the net assets of the reporting unit. The fair value of the reporting unit is determined using a market approach. If the fair value of the reporting unit exceeds the carrying value of the net assets of the reporting unit no further consideration is necessary. If the carrying value exceeds the fair value of the reporting unit, the Company would record an impairment charge for the amount that the carrying value exceeds the fair value of the reporting unit.

Intangible assets and other long-lived assets are reviewed for impairment whenever events or changes in circumstances indicate that the asset might be impaired or that the estimated useful life should be changed prospectively. If impairment indicators are present, the recoverability of these assets is measured by a comparison of the carrying amount of the asset to estimated undiscounted future cash flows expected to be generated by the asset. If the carrying amount of the asset exceeds its estimated undiscounted future cash flows, an impairment charge is recognized by the amount by which the carrying amount of the asset exceeds the fair value of the asset, which is determined using a discounted cash flow approach.

Fair Value of Financial Instruments

The carrying amounts of substantially all of the Company’s financial assets and liabilities are considered to approximate their fair values because of their short-term nature. The carrying amount of First Lien Revolver borrowings (as defined below) and First Lien Term Loan A borrowings (as defined below) under the Credit Facility (as defined below) approximates fair value, as the debt bears interest at selected short-term variable market rates. The Company measures the implied fair value of its First Lien Term Loan B (as defined below) and interest rate swap agreements using trading levels and the relevant interest rate forward curves obtained from third-party service providers; accordingly, they are classified within Level 2 of the valuation hierarchy. The fair value of the Company’s investment in a mutual fund was determined using quoted market prices within Level 1 of the valuation hierarchy. See Note 7 for further information regarding the Company’s fair value measurements.

Derivatives

The Company uses derivative instruments for purposes other than trading. Derivative instruments are accounted for in accordance with ASC Topic No. 815, Derivatives and Hedging, which requires that all derivative instruments be recognized as assets or liabilities on the balance sheet at fair value. Changes in the fair value of derivatives that qualify

F-14

Table of Contents

FOCUS FINANCIAL PARTNERS INC.

NOTES TO CONSOLIDATED FINANCIAL STATEMENTS

FOR THE YEARS ENDED DECEMBER 31, 2020, 2021 and 2022

(In thousands, except unit data, share and per share amounts)

as hedges and have been designated as part of a hedging relationship for accounting purposes do not impact earnings until the hedged item is recognized in earnings. The Company uses interest rate swaps to manage its mix of fixed and floating rate debt. These instruments have been designated as cash flow hedges at inception and are measured for effectiveness both at inception and on an ongoing basis.

In March 2020, the Financial Accounting Standards Board issued Accounting Standards Update (“ASU”) No. 2020-04, “Facilitation of the Effects of Reference Rate Reform on Financial Reporting.” ASU No. 2020-04 provides optional expedients and exceptions for applying generally accepted accounting principles to contract modifications and hedging relationships, subject to meeting certain criteria, that reference the London InterBank Offered Rate (“LIBOR”) or another rate that is expected to be discontinued. The Company applied the provisions of ASU No. 2020-04 in connection with the November 2022 amendment to the Credit Facility and related modification of its derivative contracts (See Notes 8 and 9).

Income Taxes

Focus Inc. is a holding company whose most significant asset is a membership interest in Focus LLC. Focus Inc. is subject to U.S. federal, state and local income taxes on Focus Inc.’s allocable portion of taxable income from Focus LLC. Focus LLC is treated as a partnership for U.S. federal income tax purposes. Accordingly, Focus LLC is generally not and has not been subject to U.S. federal and certain state income taxes at the entity level, although it has been subject to the New York City Unincorporated Business Tax and certain of its subsidiaries have been subject to U.S. federal and certain state and local or foreign income taxes. Instead, for U.S. federal and certain state income tax purposes, the income, deductions, losses and credits of Focus LLC are passed through to its unitholders, including Focus Inc. Focus LLC makes tax distribution payments to the extent of available cash, in accordance with the Operating Agreement. The Company files income tax returns with the U.S. federal government as well as various state and local jurisdictions.

The asset and liability method is applied for deferred income taxes. Deferred tax assets and liabilities are recognized on a net basis for each tax paying component for future tax consequences attributable to differences between the financial statement carrying amounts of existing assets and liabilities and their respective tax basis. Deferred tax assets and liabilities are measured using tax rates expected to apply to taxable income in years in which those temporary differences are expected to be recovered or settled. Valuation allowances, if any, are recorded to reduce the deferred tax assets to an amount that is more likely than not to be realized.

The Company reviews and evaluates tax positions in its major tax jurisdictions and determines whether or not there are uncertain tax positions that require financial statement recognition. Based on this review, no reserves for uncertain tax positions were recorded at December 31, 2021 and 2022.

Segment Reporting

Management has determined that the Company operates in one operating segment, as a wealth management focused organization, which is consistent with its structure and how the Company manages the business. The Company’s acquired businesses have similar economic and business characteristics. The services provided are wealth management related and the Company’s businesses are subject to a similar regulatory framework. Furthermore, the Company’s Chief Operating Decision Maker, which is the Company’s Chief Executive Officer, monitors and reviews financial information at a consolidated level for assessing operating results and the allocation of resources.

F-15

Table of Contents

FOCUS FINANCIAL PARTNERS INC.

NOTES TO CONSOLIDATED FINANCIAL STATEMENTS

FOR THE YEARS ENDED DECEMBER 31, 2020, 2021 and 2022

(In thousands, except unit data, share and per share amounts)

Translation of Non-U.S. Currency Amounts

Assets and liabilities of non-U.S. subsidiaries that have a foreign currency as their functional currency are re-measured to U.S. dollars at year-end exchange rates, and revenues and expenses are re-measured at average rates of exchange prevailing during the year. The resulting translation adjustments are recorded in accumulated other comprehensive income (loss). Gains or losses resulting from foreign currency transactions are included in other expense—net in the consolidated statements of operations.

Consolidation Considerations

ASC Topic 810, Consolidations, requires an entity to perform a qualitative analysis to determine whether its variable interests give it a controlling financial interest in a variable interest entity (“VIE”). Under the standard, an enterprise has a controlling financial interest when it has (a) the power to direct the activities of a VIE that most significantly impact the entity’s economic performance and (b) the obligation to absorb losses of the entity or the right to receive benefits from the entity that could potentially be significant to the VIE. An enterprise that holds a controlling financial interest is deemed to be the primary beneficiary and is required to consolidate the VIE.

The Company’s subsidiaries have Management Agreements with the respective Management Company, which causes these Company subsidiaries to be VIEs. The Company has assessed whether or not it is the primary beneficiary for these subsidiaries and has concluded that it is the primary beneficiary. Accordingly, the results of these subsidiaries have been consolidated.

Certain of the Company’s subsidiaries have variable interests in certain investment funds that are deemed voting interest entities. Due to substantive kick-out rights possessed by the limited partners of these funds, the Company does not consolidate the investment funds.

From time to time, the Company enters into option agreements with wealth management businesses (the “Optionee”). In exchange for payment of an option premium, the option agreement allows the Company, at its sole discretion, to acquire the Optionee at a predetermined time and at a predetermined purchase price formula. If the Company chooses to exercise its option to acquire the Optionee, the acquisition and the corresponding Management Agreement would be executed in accordance with the Company’s typical acquisition structure as discussed in Note 1. The Company has determined that the option agreements with the Optionees qualify the Optionees as VIEs. The Company has determined that it is not the primary beneficiary of the Optionees and does not consolidate the results of the Optionees. An option premium of $2,000 was paid by the Company to a Singapore based wealth management firm during the year ended December 31, 2022 and is included in prepaid expenses and other assets in the consolidated balance sheets as of December 31, 2022. There were no option premiums as of December 31, 2021.

Stock Based Compensation Costs

Compensation cost for Focus LLC incentive units and Focus Inc. stock option awards is measured based on the fair value of awards determined by the Black-Scholes option pricing model or the Monte Carlo Simulation Model on the date that the awards are granted or modified, and is adjusted for the estimated number of awards that are expected to be forfeited. Compensation cost for unvested Class A common stock and restricted stock units, as well as Focus LLC restricted common units, is measured based on the market value of the Company’s Class A common stock on the date that the awards are granted and is adjusted for the estimated number of awards that are expected to be forfeited. The compensation cost is recognized on a straight-line basis over the requisite service period. Non-cash equity compensation expense, associated with employees and non-employees, including principals in the management companies, is included in compensation and related expenses in the consolidated statements of operations. The Company estimates forfeitures at the time of the respective grant and revises those estimates in subsequent periods if actual forfeitures differ from those

F-16

Table of Contents

FOCUS FINANCIAL PARTNERS INC.

NOTES TO CONSOLIDATED FINANCIAL STATEMENTS

FOR THE YEARS ENDED DECEMBER 31, 2020, 2021 and 2022

(In thousands, except unit data, share and per share amounts)

estimates. The Company uses historical data to estimate forfeitures and records non-cash equity compensation expense only for those awards that are expected to vest.

Leases

The Company leases office space in various locations under noncancelable lease agreements with various expiration dates. The Company determines if a contract contains a lease at inception. The lease terms may include options to extend or terminate the lease when it is reasonably certain that the Company will exercise that option. Many of these lease agreements provide for tenant improvement allowances, rent increases, and/or rent-free periods. Operating lease expense is recognized on a straight-line basis commencing with the possession date of the property, which is typically the earlier of the lease commencement date or the date when the Company takes possession of the property. Operating lease costs are included in selling, general and administrative expenses in the consolidated statements of operations.

Lease assets and liabilities are recognized at the present value of the future lease payments at the lease commencement date. The interest rate used to determine the present value of the future lease payments is an estimated incremental borrowing rate, because the interest rate implicit in the Company’s leases is not readily determinable. The incremental borrowing rate is estimated to approximate the interest rate on a collateralized basis with similar terms and payments, and in economic environments where the leased asset is located. We generally use the base, non-cancelable, lease term when determining the lease assets and liabilities. Lease assets also include any prepaid lease payments and lease incentives. Leases with an initial term of 12 months or less, which are immaterial to the consolidated financial statements, are not recorded on the balance sheet. The Company has a limited number of finance leases which are not material to the consolidated financial statements.

3. NON-CONTROLLING INTERESTS AND INCOME PER SHARE

The calculation of controlling and non-controlling interest is as follows as of December 31, 2021 and 2022:


2021

2022

Focus LLC common units


11,439,019

11,827,321

Focus LLC restricted common units

193,625

296,548

Common unit equivalents of outstanding vested and unvested Focus LLC incentive units(1)

8,996,789

5,196,288

Total common units, restricted common units and common unit equivalents attributable to non-controlling interest

20,629,433

17,320,157

Total common units, restricted common units and common unit equivalents of incentive units outstanding

85,949,557

83,249,801

Non-controlling interest allocation

24.0

%

20.8

%

Company’s interest in Focus LLC

76.0

%

79.2

%

(1)Focus LLC common units issuable upon conversion of 16,146,524 and 16,602,886 (see Note 10) vested and unvested Focus LLC incentive units outstanding as of December 31, 2021 and 2022, respectively, were calculated using the common unit equivalent of vested and unvested Focus LLC incentive units based on the closing price of the Company’s Class A common stock on the last trading day of the period.

F-17

Table of Contents

FOCUS FINANCIAL PARTNERS INC.

NOTES TO CONSOLIDATED FINANCIAL STATEMENTS

FOR THE YEARS ENDED DECEMBER 31, 2020, 2021 and 2022

(In thousands, except unit data, share and per share amounts)

Basic income per share is calculated utilizing net income attributable to common shareholders divided by the weighted average number of shares of Class A common stock outstanding during the same period. The calculation of basic income per share for the years ended December 31, 2020, 2021 and 2022 is as follows:

2020

2021

2022

Basic income per share:


Net income attributable to common shareholders

$

28,045

$

10,412

$

91,784

Weighted average shares of Class A common stock outstanding


48,678,584


57,317,477


65,552,592

Basic income per share

$

0.58

$

0.18

$

1.40

Diluted income per share is calculated utilizing net income attributable to common shareholders divided by the weighted average number of shares of Class A common stock outstanding during the same periods plus the effect, if any, of the potentially dilutive shares of the Company’s Class A common stock from stock options, unvested Class A Common Stock, restricted stock units and Focus LLC common units, including contingently issuable Focus LLC common units, if any, restricted common units and incentive units as calculated using the treasury stock method. The calculation of diluted income per share for the years ended December 31, 2020, 2021 and 2022 is as follows:


2020


2021


2022

Diluted income per share:


Net income attributable to common shareholders

$

28,045

$

10,412

$

91,784

Weighted average shares of Class A common stock outstanding


48,678,584


57,317,477


65,552,592

Effect of dilutive stock options

77,302

461,306

235,187

Effect of dilutive unvested Class A common stock

23,822

Effect of dilutive restricted stock units

16,905

52,368

22,436

Total


48,796,613


57,831,151


65,810,215

Diluted income per share

$

0.57

$

0.18

$

1.39

Diluted income per share for the years ended December 31, 2020, 2021 and 2022 excludes shares related to market-based stock options and Focus LLC incentive units, as modified, that vest on the sixth anniversary of the pricing of the Company’s initial public offering (“IPO”) with vesting based on the highest volume weighted average per share price for any ninety-calendar day period (“90-day VWAP”) prior to the anniversary, with 0% vesting if the highest 90-day VWAP is $80.00 or less and 100% vesting if the highest 90-day VWAP is $110.00 or more, with linear interpolation in between (see Note 10). These market-based stock options and Focus LLC incentive units will also vest upon a change of control linearly based on the share price used in the transaction with 100% vesting if the price used is $110.00, 0% vesting if the price used is equal to or less than $33.00, and linear interopolation in between, except as governed by the employment agreements entered into with the Company’s executive officers. Such market-based and other criteria were not met during the years ended December 31, 2020, 2021 and 2022.

Focus LLC common units and vested incentive units may be exchanged for Class A common stock, subject to certain limitations (see Note 10). In computing the dilutive effect, if any, that the exchange would have on net income per share, net income attributable to Class A common shareholders would be adjusted due to the elimination of the non-controlling interests (including any associated tax impact). For the years ended December 31, 2020, 2021 and 2022, such exchange is not reflected in diluted income per share as the assumed exchange is not dilutive.

F-18

Table of Contents

FOCUS FINANCIAL PARTNERS INC.

NOTES TO CONSOLIDATED FINANCIAL STATEMENTS

FOR THE YEARS ENDED DECEMBER 31, 2020, 2021 and 2022

(In thousands, except unit data, share and per share amounts)

4. ACQUISITIONS

Business Acquisitions

The purchase price associated with business acquisitions and the allocation thereof during the years ended December 31, 2020, 2021 and 2022, is summarized as follows:


2020


2021


2022

Number of business acquisitions closed

21

36


18

Consideration:


Cash due at closing

$

327,722

$

983,240

$

450,943

Estimated working capital adjustments and other

(174)

(577)

1,127

Cash due subsequent to closing at net present value

86,778

9,611

Fair market value of Focus LLC common units issued


23,118

28,992

Fair market value of Class A common stock issued

3,515

Fair market value of estimated contingent consideration


46,918

212,074

56,604

Total consideration

$

374,466

$

1,308,148

$

547,277

Allocation of purchase price:


Total tangible assets

$

21,216

$

61,854

$

29,991

Total liabilities assumed


(31,680)

(83,444)

(32,551)

Customer relationships


215,686

616,283

287,172

Management contracts


7,774

33,350

11,414

Goodwill


160,341

677,195

249,677

Other acquired intangibles


1,129

2,910

1,574

Total allocated consideration

$

374,466

$

1,308,148

$

547,277

Management believes approximately $461,746 of tax goodwill and intangibles related to business acquisitions completed during the year ended December 31, 2022 will be deductible for tax purposes over a 15 year period. Additional tax goodwill may be deductible when estimated contingent consideration is earned and paid.

A portion of the cash due at closing for one of the Company’s 2021 business acquisitions was placed in escrow for the satisfaction of certain indemnifications and other related items, if any.

The accompanying consolidated statement of operations for the year ended December 31, 2022 includes revenue and income from operations for business acquisitions that are new subsidiary partner firms from the date they were acquired of $29,883 and $3,140, respectively.

Asset Acquisitions

The Company also separately purchases customer relationships and other intangible assets. These purchases are accounted for as asset acquisitions as they do not qualify as business acquisitions pursuant to ASC Topic 805, Business Combinations. The Company completed four, two and six asset acquisitions during the years ended December 31, 2020, 2021 and 2022, respectively. Total purchase consideration, inclusive of transaction costs, for asset acquisitions during the year ended December 31, 2020 was $26,159 in cash. Total purchase consideration for the asset acquisitions during the year ended December 31, 2021 was $3,041 in cash. Total purchase consideration for the asset acquisitions during the year ended December 31, 2022 was $9,718 in cash and cash due subsequent to closing of $3,000. Certain asset acquisitions include contingent consideration provisions. The Company records the contingent consideration as additional purchase consideration when the outcome of the contingency is determinable. During the years ended

F-19

Table of Contents

FOCUS FINANCIAL PARTNERS INC.

NOTES TO CONSOLIDATED FINANCIAL STATEMENTS

FOR THE YEARS ENDED DECEMBER 31, 2020, 2021 and 2022

(In thousands, except unit data, share and per share amounts)

December 31, 2020, 2021 and 2022, the Company paid $2,451, $4,577 and $9,071, respectively, of additional purchase price consideration related to asset acquisitions.

Intangible assets acquired in asset acquisitions for the years ended December 31, 2020, 2021 and 2022 were as follows:

2020


2021


2022

Customer relationships

$

24,851

$

2,916

$

12,297

Other acquired intangibles


1,308


125


495

Total

$

26,159

$

3,041

$

12,792

The weighted-average useful life of intangibles acquired during the years ended December 31, 2020, 2021 and 2022 through business acquisitions and asset acquisitions are as follows:

2020

2021


2022

Management contracts


18

14

7

Customer relationships


9

9

9

Other acquired intangibles


5

5

5

Weighted-average useful life of all intangibles acquired


9

9

9

From January 1, 2023 to February 16, 2023, the Company completed wealth management business acquisitions for cash consideration of $28,771 at closing, deferred cash consideration of $2,366, plus contingent consideration.

5. GOODWILL AND OTHER INTANGIBLE ASSETS

The following table summarizes the change in the goodwill balances for the years ended December 31, 2020, 2021 and 2022:

2020

2021

2022

Balance beginning of period:

Goodwill

$

1,112,855

$

1,278,183

$

1,947,939

Cumulative impairment losses


(22,624)


(22,624)

(22,624)

1,090,231

1,255,559

1,925,315

Goodwill acquired


160,341


677,195

249,677

Other


4,987


(7,439)

(7,075)


165,328


669,756

242,602

Balance end of period:

Goodwill


1,278,183


1,947,939

2,190,541

Cumulative impairment losses


(22,624)


(22,624)

(22,624)

$

1,255,559

$

1,925,315

$

2,167,917

There were no goodwill impairment losses during the years ended December 31, 2020, 2021 and 2022.

F-20

Table of Contents

FOCUS FINANCIAL PARTNERS INC.

NOTES TO CONSOLIDATED FINANCIAL STATEMENTS

FOR THE YEARS ENDED DECEMBER 31, 2020, 2021 and 2022

(In thousands, except unit data, share and per share amounts)

The following table summarizes the amortizing acquired intangible assets at December 31, 2021:

Gross Carry

Accumulated

Net Book


Amount


Amortization


Value

Customer relationships

$

2,228,461

$

(787,016)

$

1,441,445

Management contracts


191,578


(57,153)


134,425

Other acquired intangibles


10,911


(5,062)


5,849

Total

$

2,430,950

$

(849,231)

$

1,581,719

The following table summarizes the amortizing acquired intangible assets at December 31, 2022:


Gross Carry


Accumulated


Net Book

Amount

Amortization

Value

Customer relationships

$

2,530,062

$

(1,029,197)

$

1,500,865

Management contracts


202,479

(70,624)

131,855

Other acquired intangibles


13,416

(7,012)

6,404

Total

$

2,745,957

$

(1,106,833)

$

1,639,124

Management contracts and other acquired intangibles are amortized on a straight-line basis over their estimated useful lives ranging from 2 to 20 years. Customer relationships are amortized on a straight-line basis over their estimated useful lives of 4 to 10 years.

Estimated amortization expense for each of the next five years is as follows:

Years Ending December 31, 


Amount

2023

$

270,828

2024


254,749

2025


241,575

2026


217,115

2027


181,401

6. FIXED ASSETS

Fixed assets consist of the following at December 31, 2021 and 2022:


2021


2022

Leasehold improvements

$

46,252

$

51,926

Computers, software development and equipment

39,074

44,612

Furniture and fixtures


20,834


24,689

Subtotal


106,160


121,227

Less accumulated depreciation and amortization


(58,961)


(66,479)

Total

$

47,199

$

54,748

F-21

Table of Contents

FOCUS FINANCIAL PARTNERS INC.

NOTES TO CONSOLIDATED FINANCIAL STATEMENTS

FOR THE YEARS ENDED DECEMBER 31, 2020, 2021 and 2022

(In thousands, except unit data, share and per share amounts)

7. FAIR VALUE MEASUREMENTS

ASC Topic 820, Fair Value Measurement establishes a hierarchy for inputs used in measuring fair value that maximizes the use of observable inputs and minimizes the use of unobservable inputs by requiring that the most observable inputs be used when available. Observable inputs reflect the assumptions market participants would use in pricing the asset or liability, developed based on market data obtained from sources independent of the Company. Unobservable inputs reflect the Company’s own assumptions about the assumptions market participants would use in pricing the asset or liability, developed based on the best information available in the circumstances.

The fair value hierarchy prioritizes the inputs to valuation techniques used to measure fair value into three broad levels, as follows:

Level 1—Unadjusted price quotations in active markets for identical assets or liabilities.

Level 2—Observable inputs other than Level 1 prices, such as quoted prices for similar assets or liabilities, or other inputs that are observable or can be corroborated by observable market data for substantially the full term of the assets or liabilities.

Level 3—Significant unobservable inputs that are not corroborated by market data.

First Lien Term Loan B

The implied fair value of the Company’s First Lien Term Loan B (as defined below) based on Level 2 inputs is as follows as of December 31, 2021 and 2022:

2021

2022


Stated


Fair


Stated


Fair

Value

Value

Value

Value

First Lien Term Loan B - Tranche A

$

1,610,928

$

1,598,846

$

1,755,600

$

1,735,850

First Lien Term Loan B - Tranche B


796,374


792,392


788,370


772,603

Derivatives

At December 31, 2021 and 2022, the fair value of the Company’s $850,000 notional amount interest rate swap agreements was $5,810 and $44,219, respectively, which are included in prepaid expenses and other assets in the accompanying consolidated balance sheets. The fair value was based on Level 2 inputs which included the relevant interest rate forward curves.

Business acquisitions

For business acquisitions, the Company recognizes the fair value of goodwill and other acquired intangible assets, and estimated contingent consideration at the acquisition date as part of purchase price. This fair value measurement is based on unobservable (Level 3) inputs.

At December 31, 2021 and 2022, deferred cash consideration in connection with business acquisitions of $114,156 and $122,079, respectively, are included in contingent consideration and other liabilities in the consolidated balance sheets at present value. At December 31, 2022, amounts due are as follows: $19,357 in 2023, $21,947 in 2024, $8,157 in 2025, $0 in 2026, $4,748 in 2027, $0 in 2028 and $67,870 in 2029.

F-22

Table of Contents

FOCUS FINANCIAL PARTNERS INC.

NOTES TO CONSOLIDATED FINANCIAL STATEMENTS

FOR THE YEARS ENDED DECEMBER 31, 2020, 2021 and 2022

(In thousands, except unit data, share and per share amounts)

The following table represents changes in the fair value of estimated contingent consideration for business acquisitions for the years ended December 31, 2021 and 2022:


2021


2022

Balance at January 1,

$

169,670


$

350,027

Additions to estimated contingent consideration


212,074

56,604

Assumed estimated contingent consideration obligation

12,637

Payments of contingent consideration


(143,107)

(148,638)

Non-cash changes in fair value of estimated contingent consideration


112,416

(64,747)

Other


(1,026)

(1,575)

Balance at December 31,

$

350,027

$

204,308

Estimated contingent consideration is included in contingent consideration and other liabilities in the accompanying consolidated balance sheets.

During the year ended December 31, 2021, the Company paid $131,827 in cash and issued $11,280 in Focus LLC common units as contingent consideration associated with business acquisitions. During the the year ended December 31, 2022, the Company paid $138,940 in cash and issued $9,698 in Focus LLC common units as contingent consideration associated with business acquisitions

During the years ended December 31, 2021 and 2022, the Company paid cash of $4,577 and $9,071, respectively, as contingent consideration associated with asset acquisitions. These amounts are included in cash paid for acquisitions and contingent consideration—net of cash acquired in investing activities in the consolidated statement of cash flows.

In determining fair value of the estimated contingent consideration, the acquired business’s future performance is estimated using financial projections for the acquired business. These financial projections, as well as alternative scenarios of financial performance, are measured against the performance targets specified in each respective acquisition agreement. In addition, discount rates are established based on the cost of debt and the cost of equity. The Company uses the Monte Carlo Simulation Model to determine the fair value of the Company’s estimated contingent consideration.

The significant unobservable inputs used in the fair value measurement of the Company’s estimated contingent consideration are the forecasted growth rates over the measurement period and discount rates. Significant increases or decreases in the Company’s forecasted growth rates over the measurement period or discount rates would result in a higher or lower fair value measurement.

Inputs used in the fair value measurement of estimated contingent consideration at December 31, 2021 and 2022 are summarized below:

Quantitative Information About Level 3


Fair Value Measurements


Fair Value at


Valuation


Unobservable


December 31, 2021

Techniques

Inputs

Ranges


$

350,027

Monte Carlo Simulation Model

Forecasted growth rates

0.7% - 20.1

%

Discount rates

9.0% - 15.0

%

F-23

Table of Contents

FOCUS FINANCIAL PARTNERS INC.

NOTES TO CONSOLIDATED FINANCIAL STATEMENTS

FOR THE YEARS ENDED DECEMBER 31, 2020, 2021 and 2022

(In thousands, except unit data, share and per share amounts)

Quantitative Information About Level 3


Fair Value Measurements


Fair Value at


Valuation


Unobservable


December 31, 2022

Techniques

Inputs

Ranges


$

204,308

Monte Carlo Simulation Model

Forecasted growth rates

(7.8)% - 32.4

%

Discount rates

13.0% - 19.0

%

8. CREDIT FACILITY

As of December 31, 2022, Focus LLC’s credit facility (the “Credit Facility”) consisted of a $2,543,970 first lien term loan B (the “First Lien Term Loan B”), consisting of a $1,755,600 tranche A (“First Lien Term Loan B - Tranche A”) and $788,370 tranche B (“First Lien Term Loan B - Tranche B”), a $240,000 delayed draw first lien term loan A (the “First Lien Term Loan A”), and a $650,000 first lien revolving credit facility (the “First Lien Revolver”).

In April 2022, Focus LLC amended the First Lien Revolver to extend the maturity date to June 2024 and change the benchmark interest rate from LIBOR to the Secured Overnight Financing Rate (“SOFR”).

In November 2022, Focus LLC amended the Credit Facility to, among other things, (i) repay the then existing $1,598,408 First Lien Term Loan B - Tranche A and issue $1,760,000 stated value First Lien Term Loan B - Tranche A with a maturity date of June 2028, (ii) change the First Lien Term Loan B - Tranche B benchmark interest rate from LIBOR to SOFR, (iii) issue $240,000 delayed draw First Lien Term Loan A with a maturity date of November 2027 and (iv) change the maturity date of the First Lien Revolver to November 2027.

The First Lien Term Loan B - Tranche A bears interest (at Focus LLC’s option) at: (i) SOFR plus a margin of 3.25% with a 0.50% SOFR floor or (ii) the lender’s Base Rate (as defined in the Credit Facility) plus a margin of 2.25%. The First Lien Term Loan B - Tranche A requires quarterly installment repayments of $4,400 and has a maturity date of June 2028. The refinanced debt was issued at a discount of 1.75% or $30,800 which is being amortized to interest expense over the term of the First Lien Term Loan B - Tranche A. The First Lien Term Loan B - Tranche A also requires a prepayment penalty of 1%, of the then outstanding principal amount of the First Lien Term Loan B - Tranche A if repaid prior to May 2023.

The First Lien Term Loan B - Tranche B bears interest (at Focus LLC’s option) at: (i) SOFR plus a margin of 2.50% with a 0.50% SOFR floor or (ii) the lender’s Base Rate plus a margin of 1.50%. The First Lien Term Loan B - Tranche B requires quarterly installment repayments of $2,001 and has a maturity date of June 2028.

The First Lien Term Loan A bears interest (at Focus LLC’s option) at: (i) SOFR plus a margin of 2.50% with a 0.50% SOFR floor or (ii) the lender’s Base Rate plus a margin of 1.50%. The First Lien Term Loan A has a nine month delayed draw feature, which expires in August 2023. The delayed draw feature has a ticking fee with respect to the undrawn commitments with (i) no fee from 0-60 days from the closing date, (ii) 50% of the interest rate margin for the First Lien Term Loan A from 61-120 days of the closing date and (iii) 100% of the interest rate margin for the First Lien Term Loan A after 121 days of the closing date. The First Lien Term Loan A, when drawn, will be issued at a discount of 1.50% which will be amortized to interest expense over the remaining term from the date that it is drawn. When drawn, the First Lien Term Loan A will require quarterly installment repayments equal to 0.25% in 2023, 0.50% in 2024 and 2025, 1.25% in 2026 and 1.875% in 2027. In December 2022, $20,000 was borrowed under the First Lien Term Loan A at a discount of $300 with quarterly installment repayments of $50. The First Lien Term Loan A has a maturity date of November 2027.

As amended, the First Lien Revolver bears interest (at Focus LLC’s option) at SOFR plus a margin of 2.25% with step downs to 2.00% and 1.75% or the lender’s Base Rate plus a margin of 1.25% with step downs to 1.00% and

F-24

Table of Contents

FOCUS FINANCIAL PARTNERS INC.

NOTES TO CONSOLIDATED FINANCIAL STATEMENTS

FOR THE YEARS ENDED DECEMBER 31, 2020, 2021 and 2022

(In thousands, except unit data, share and per share amounts)

0.75%, based on achievement of a specified First Lien Leverage Ratio. The First Lien Revolver unused commitment fee is 0.50% with step downs to 0.375% and 0.25% based on achievement of a specified First Lien Leverage Ratio. Up to $30,000 of the First Lien Revolver is available for the issuance of letters of credit, subject to certain limitations. The First Lien Revolver has a maturity date of November 2027.

Focus LLC’s obligations under the Credit Facility are collateralized by the majority of Focus LLC’s assets. The Credit Facility contains various customary covenants, including, but not limited to: (i) incurring additional indebtedness or guarantees, (ii) creating liens or other encumbrances on property or granting negative pledges, (iii) entering into a merger or similar transaction, (iv) selling or transferring certain property and (v) declaring dividends or making other restricted payments.

Focus LLC is required to maintain a First Lien Leverage Ratio (as defined in the Credit Facility) of not more than 6.25:1.00 as of the last day of each fiscal quarter. At December 31, 2022, Focus LLC's First Lien Leverage Ratio was 4.19:1.00, which satisfied the maximum ratio of 6.25:1.00. First Lien Leverage Ratio means the ratio of amounts outstanding under the Credit Facility plus other outstanding debt obligations secured by a lien on the assets of Focus LLC (excluding letters of credit other than unpaid drawings thereunder) minus unrestricted cash and cash equivalents to Consolidated EBITDA (as defined in the Credit Facility). Consolidated EBITDA for purposes of the Credit Facility was $578,396 at December 31, 2022. Focus LLC is also subject on an annual basis to contingent principal payments based on an excess cash flow calculation (as defined in the Credit Facility) for any fiscal year if the First Lien Leverage Ratio exceeds 3.75:1.00. No contingent principal payments were required to be made during the years ended December 31, 2021 and 2022. Based on the excess cash flow calculation for the year ended December 31, 2022, no contingent principal payments are required to be made during the year ending December 31, 2023.

In connection with the April 2022 and November 2022 amendments, Focus LLC paid $1,111 and $17,961, respectively, in debt financing costs and recognized a loss on extinguishment of borrowings of $1,807 in connection with the November 2022 amendment.

The Company defers and amortizes its debt financing costs and original issue discounts over the respective terms of the borrowings. The debt financing costs related to the First Lien Term Loan B and First Lien Term Loan A are recorded as a reduction of the carrying amounts of the respective borrowings in the consolidated balance sheets. The debt financing costs related to the First Lien Revolver are recorded in debt financing costs-net in the consolidated balance sheets.

The following is a reconciliation of principal amounts outstanding under the Credit Facility to borrowings under the Credit Facility recorded in the consolidated balance sheets at December 31, 2021 and 2022:

2021

2022

First Lien Term Loan B - Tranche A

$

1,610,928

$

1,755,600

First Lien Term Loan B - Tranche B

796,374

788,370

First Lien Term Loan A

20,000

First Lien Revolver

Unamortized debt financing costs


(7,523)


(17,750)

Unamortized discount


(6,110)


(35,471)

Total

$

2,393,669

$

2,510,749

At December 31, 2021 and 2022, unamortized debt financing costs associated with the First Lien Revolver of $4,254 and $7,590, respectively, were recorded in debt financing costs-net in the consolidated balance sheets.

F-25

Table of Contents

FOCUS FINANCIAL PARTNERS INC.

NOTES TO CONSOLIDATED FINANCIAL STATEMENTS

FOR THE YEARS ENDED DECEMBER 31, 2020, 2021 and 2022

(In thousands, except unit data, share and per share amounts)

In connection with January 2021 and July 2021 amendments to its First Lien Term Loan B Focus LLC paid $8,282 in debt financing costs.

For the years ended December 31, 2021 and 2022, weighted-average interest rates for borrowings were approximately 3% and 4%, respectively.

As of December 31, 2021 and 2022, the First Lien Revolver available unused commitment line was $642,085 and $639,997 respectively.

As of December 31, 2021 and 2022, Focus LLC was contingently obligated for letters of credit in the amount of $7,915 and $10,003, respectively, each bearing interest at an annual rate of approximately 2%.

9. DERIVATIVES

In connection with the November 2022 amendment to the Credit Facility, the Company terminated its three then existing interest rate swaps, with notional amounts of $400,000, $250,000 and $200,000, which provided the Company pay interest to the counterparty each month at a rate of 0.713%, 0.537% and 0.5315%, respectively, and receive interest from each of the counterparties each month at the 1 month LIBOR rate, subject to a 0.0% floor (the “LIBOR Swaps”), and entered into the SOFR Swaps (as defined below) with the same notional amounts.

At December 31, 2022, the Company has three floating to fixed interest rate swap agreements with notional amounts of $400,000, $250,000 and $200,000, the terms of which provide that the Company pay interest to the counterparty each month at a rate of 0.619%, 0.447% and 0.440%, respectively, and receive interest from each of the counterparties each month at the 1 month USD Term SOFR rate, subject to a 0.50% floor (the "SOFR Swaps").

The interest rate swaps effectively fix the variable interest rate applicable to the first $850,000 of the Company’s variable interest rate borrowings outstanding. The Company designated these swaps as cash flow hedges of the Company’s exposure to the variability of the payment of interest on this portion of its borrowings.

At December 31, 2021, the fair value of the LIBOR Swaps was $5,810, and at December 31, 2022, the fair value of the SOFR Swaps was $44,219. These amounts are included in prepaid expenses and other assets in the accompanying consolidated balance sheets. The interest rate swaps continue to be effective hedges, and as such, the offsetting adjustment to the fair value is recorded in accumulated other comprehensive income (loss), net of tax of $1,194 and $9,458 at December 31, 2021 and 2022, respectively.

10. EQUITY

The following is a summary of the capital stock of the Company:

Class A Common Stock

Voting Rights

Holders of shares of the Company’s Class A common stock are entitled to one vote per share held of record on all matters to be voted upon by the shareholders. The holders of Class A common stock do not have cumulative voting rights in the election of directors.

F-26

Table of Contents

FOCUS FINANCIAL PARTNERS INC.

NOTES TO CONSOLIDATED FINANCIAL STATEMENTS

FOR THE YEARS ENDED DECEMBER 31, 2020, 2021 and 2022

(In thousands, except unit data, share and per share amounts)

Dividend Rights

Holders of shares of the Company’s Class A common stock are entitled to ratably receive dividends when and if declared by the Company’s Board of Directors (the “Board”) out of funds legally available for that purpose, subject to any statutory or contractual restrictions on the payment of dividends and to any prior rights and preferences that may be applicable to any outstanding preferred stock.

Liquidation Rights

Upon the Company’s liquidation, dissolution, distribution of assets or other winding up, the holders of Class A common stock are entitled to receive ratably the assets available for distribution to the shareholders after payment of liabilities and the liquidation preference of any of the Company’s outstanding shares of preferred stock.

Other Matters

The shares of the Company’s Class A common stock have no preemptive or conversion rights and are not subject to further calls or assessment by the Company. There are no redemption or sinking fund provisions applicable to the Class A common stock. All outstanding shares of the Company’s Class A common stock are fully paid and non-assessable.

Class B Common Stock

Voting Rights

Holders of shares of the Company’s Class B common stock are entitled to one vote per share held of record on all matters to be voted upon by the shareholders. Holders of shares of the Company’s Class A common stock and Class B common stock vote together as a single class on all matters presented to the Company’s shareholders for their vote or approval, except the amendment of certain provisions of the Company’s certificate of incorporation that would alter or change the powers, preferences or special rights of the Class B common stock so as to affect them adversely must be approved by a majority of the votes entitled to be cast by the holders of the shares affected by the amendment, voting as a single class, or as otherwise required by applicable law.

Dividend and Liquidation Rights

Holders of the Company’s Class B common stock do not have any right to receive dividends, unless the dividend consists of shares of the Company’s Class B common stock or of rights, options, warrants or other securities convertible or exercisable into or exchangeable for shares of Class B common stock paid proportionally with respect to each outstanding share of our Class B common stock and a dividend consisting of shares of Class A common stock or of rights, options, warrants or other securities convertible or exercisable into or exchangeable for shares of Class A common stock on equivalent terms is simultaneously paid to the holders of Class A common stock. Holders of the Company’s Class B common stock do not have any right to receive a distribution upon a liquidation, dissolution or winding up of the Company.

Preferred Stock

The Company’s certificate of incorporation authorizes the Board, subject to any limitations prescribed by law, without further shareholder approval, to establish and to issue from time to time one or more classes or series of preferred stock, par value $0.01 per share, covering up to an aggregate of 500,000,000 shares of preferred stock. Each class or series of preferred stock will cover the number of shares and will have the powers, preferences, rights,

F-27

Table of Contents

FOCUS FINANCIAL PARTNERS INC.

NOTES TO CONSOLIDATED FINANCIAL STATEMENTS

FOR THE YEARS ENDED DECEMBER 31, 2020, 2021 and 2022

(In thousands, except unit data, share and per share amounts)

qualifications, limitations and restrictions determined by the Board, which may include, among others, dividend rights, liquidation preferences, voting rights, conversion rights, preemptive rights and redemption rights. Except as provided by law or in a preferred stock designation, the holders of preferred stock will not be entitled to vote at or receive notice of any meeting of shareholders.

Other

In February 2022, Focus LLC issued 187,795 common units and Focus Inc. issued a corresponding number of shares of Class B common stock in connection with a contingent consideration payment.

In April 2022, Focus LLC issued 512,290 common units and Focus Inc. issued a corresponding number of shares of Class B common stock in connection with an acquisition.

In November 2022, Focus LLC issued 139,099 common units and Focus Inc. issued a corresponding number of shares of Class B common stock in connection with an acquisition.

2018 Omnibus Incentive Plan

On July 30, 2018, the Board adopted the Focus Financial Partners Inc. 2018 Omnibus Incentive Plan (the “Omnibus Plan”) for the employees, consultants and the directors of the Company and its affiliates who perform services for it. The Omnibus Plan provides for potential grants of the following awards with respect to shares of the Company’s Class A common stock, to the extent applicable: (i) incentive stock options qualified as such under U.S. federal income tax laws; (ii) non-qualified stock options or any other form of stock options; (iii) restricted stock awards; (iv) phantom stock awards; (v) restricted stock units; (vi) bonus stock; (vii) performance awards; (viii) annual cash incentive awards; (ix) any of the foregoing award types (other than incentive stock options) as awards related to Focus LLC’s units; and (x) incentive units in Focus LLC.

The maximum aggregate number of shares of the Company’s Class A common stock that may be issued pursuant to awards under the Omnibus Plan shall not exceed 6,000,000 shares (including such number of Focus LLC’s units or other securities which can be exchanged or converted into shares of Class A common stock). The reserve pool is subject to adjustment due to recapitalization or reorganization, or related to forfeitures or the expiration of awards, as provided under the Omnibus Plan. If the shares or units subject to any award are not issued or transferred, or cease to be issuable or transferable for any reason, including (but not exclusively) because shares or units are withheld or surrendered in payment of taxes or any exercise or purchase price relating to an award or because an award is forfeited, terminated, expires unexercised, is settled in cash or is otherwise terminated without a delivery of shares or units, those shares or units will again be available for issue, transfer or exercise pursuant to awards under the Omnibus Plan to the extent allowable by law. The Omnibus Plan also contains a provision that will add an additional number of shares of Class A common stock equal to the lesser of (a) 3,000,000 shares, (b) 5% of the outstanding (vested and unvested) shares of Class A common stock and Focus LLC units on the last day of the previous year, and (c) an amount determined by the Board, each year between 2019 and 2028.

F-28

Table of Contents

FOCUS FINANCIAL PARTNERS INC.

NOTES TO CONSOLIDATED FINANCIAL STATEMENTS

FOR THE YEARS ENDED DECEMBER 31, 2020, 2021 and 2022

(In thousands, except unit data, share and per share amounts)

Stock Options

The following table provides information relating to the status of, and changes in, the Company’s stock options granted during years ended December 31, 2020, 2021 and 2022:


Stock


Weighted Average

Options

Exercise Price

Outstanding—January 1, 2020


1,832,966

$

30.42

Granted


286,081

44.71

Exercised

(251,913)

30.97

Forfeited


(21,817)

29.27

Outstanding—December 31, 2020


1,845,317


32.57

Vested—December 31, 2020

785,257

31.36

Granted

357,141

58.50

Exercised

(235,684)

31.65

Forfeited

(34,906)

32.65

Outstanding—December 31, 2021

1,931,868

37.47

Vested—December 31, 2021


852,579

31.56

Granted

686,130

44.82

Exercised

(42,076)

27.54

Forfeited

(114,605)

47.27

Outstanding—December 31, 2022

2,461,317

39.24

Vested—December 31, 2022

1,172,105

33.53

F-29

Table of Contents

FOCUS FINANCIAL PARTNERS INC.

NOTES TO CONSOLIDATED FINANCIAL STATEMENTS

FOR THE YEARS ENDED DECEMBER 31, 2020, 2021 and 2022

(In thousands, except unit data, share and per share amounts)

For the purpose of calculating equity-based compensation expense for time-based stock option awards, the grant date fair value was determined using the Black-Scholes model with the following weighted average assumptions for the years ended December 31, 2020, 2021 and 2022:

2020

2021

2022

Expected term

6.3

years

6.3

years


6.3

years

Expected stock price volatility

34

%

34

%

34

%

Risk-free interest rate

0.54

%

1.29

%

2.78

%

Expected dividend yield

%

%

%

Weighted average grant date fair value

$

15.37

$

20.89

$

17.27

Time-based stock options generally vest ratably over a four-year period commencing on the grant date.

In connection with the IPO, the Company granted market-based stock options to purchase an aggregate of 155,000 shares of Class A common stock that would have vested on the fifth anniversary of the IPO if the 90-day VWAP within such five year period immediately following the IPO reaches at least $100. In March 2022, these stock options were modified whereby the stock options will vest in July 2024, the sixth anniversary of the pricing of the Company’s IPO, with vesting based on the highest 90-day VWAP prior to the anniversary, with 0% vesting if the highest 90-day VWAP is $80.00 or less and 100% vesting if the highest 90-day VWAP is $110.00 or more, with linear interpolation in between. The vested stock options can only be exercised in accordance with the following schedule: (i) a total of 25% of the vested stock options may be exercised on and following the date of vesting, (ii) an additional 25% (for a total of 50%) of the vested stock options may be exercised on and following the first anniversary of the date of vesting in July 2025, and (iii) an additional 50% (for a total of 100%) of the vested stock options may be exercised on and following the second anniversary of the date of vesting in July 2026. These market-based stock options will also vest upon a change of control linearly based on the share price used in the transaction with 100% vesting if the price used is $110.00, 0% vesting if the price used is equal to or less than $33.00, and linear interopolation in between. In connection with the modification, the Company will recognize incremental non-cash equity compensation expense of $518, less any forfeitures, from the modification date through July 2026.

Restricted stock units

The following table provides information relating to the status of, and changes in, the Company’s restricted stock units granted during the year ended December 31, 2020, 2021 and 2022:

Weighted

Restricted

Average

Stock

Grant Date


Units


Fair Value

Outstanding—January 1, 2020

98,061

$

27.90

Granted

73,310

44.71

Forfeited

(7,707)

27.90

Vested

(22,569)

27.90

Outstanding—December 31, 2020

141,095

36.63

Granted

92,420

58.46

Forfeited

(6,954)

34.46

Vested

(38,805)

35.53

Outstanding—December 31, 2021


187,756

47.69

Granted

138,708

37.59

Forfeited

(17,245)

46.49

Vested

(56,500)

44.16

Outstanding—December 31, 2022

252,719

43.02

F-30

Table of Contents

FOCUS FINANCIAL PARTNERS INC.

NOTES TO CONSOLIDATED FINANCIAL STATEMENTS

FOR THE YEARS ENDED DECEMBER 31, 2020, 2021 and 2022

(In thousands, except unit data, share and per share amounts)

Restricted stock units generally vest ratably over a four-year period commencing on the grant date.

The Company recognized $5,485, $6,036 and $8,727 of non-cash equity compensation expense in relation to stock options, unvested Class A common stock and restricted stock units during the years ended December 31, 2020, 2021 and 2022, respectively.

Total unrecognized expense, adjusted for estimated forfeitures, related to unvested stock options at December 31, 2022 was $17,078 and is expected to be recognized over a weighted-average period of 3.1 years.

Total unrecognized expense, adjusted for estimated forfeitures, related to restricted stock units at December 31, 2022 was $10,252, and is expected to be recognized over a period of 3.2 years.

Focus LLC Common Units

As of December 31, 2022, Focus LLC had 11,827,321 common units that had a corresponding share of the Company’s Class B common stock outstanding.

Each common unit holder, restricted common unit holder and incentive unitholder of Focus LLC (other than the Company), subject to certain limitations, has the right to cause Focus LLC to redeem all or a portion of their vested common units and vested incentive units (“Exchange Right”). Upon an exercise of an Exchange Right with respect to vested incentive units, such incentive units will first be converted into a number of common units that takes into account the then-current value of the common units and such incentive units’ aggregate hurdle amount. Upon an exercise of an Exchange Right with respect to vested common units, and immediately after the conversion of vested incentive units into common units, Focus LLC will acquire each tendered common unit for, at its election, (i) one share of Class A common stock, subject to conversion rate adjustments for stock splits, stock dividends, reclassification and other similar transactions, or (ii) an equivalent amount of cash. In addition, in connection with any redemption of vested common units (other than common units received upon a conversion of incentive units as described in this paragraph), the corresponding shares of Class B common stock will be cancelled. Alternatively, upon the exercise of any Exchange Right, the Company (instead of Focus LLC) will have the right to acquire each tendered common unit (and corresponding share of Class B common stock, as applicable) from the exchanging unitholder for, at its election, (i) one share of Class A common stock, subject to conversion rate adjustments for stock splits, stock dividends, reclassification and other similar transactions, or (ii) an equivalent amount of cash. The Exchange Rights are subject to certain limitations and restrictions intended to ensure that Focus LLC will continue to be treated as a partnership for U.S. federal income tax purposes.

In March 2022, the Company issued an aggregate of 26,956 shares of Class A common stock and retired 25,000 shares of Class B common stock and 4,250 incentive units in Focus LLC and acquired 26,956 common units in Focus LLC, in each case as part of the regular quarterly exchanges offered to holders of units in Focus LLC.

In May 2022, the Company issued an aggregate of 80,000 shares of Class A common stock and retired 80,000 shares of Class B common stock and acquired 80,000 common units in Focus LLC, in each case as part of the regular quarterly exchanges offered to holders of units in Focus LLC.

In August 2022, the Company issued an aggregate of 396,731 shares of Class A common stock and retired 381,573 shares of Class B common stock and 36,357 incentive units in Focus LLC and acquired 396,731 common units in Focus LLC, in each case as part of the regular quarterly exchanges offered to holders of units in Focus LLC.

F-31

Table of Contents

FOCUS FINANCIAL PARTNERS INC.

NOTES TO CONSOLIDATED FINANCIAL STATEMENTS

FOR THE YEARS ENDED DECEMBER 31, 2020, 2021 and 2022

(In thousands, except unit data, share and per share amounts)

In November 2022, the Company issued an aggregate of 28,291 shares of Class A common stock and retired 1,685 shares of Class B common stock and 71,176 incentive units in Focus LLC and acquired 28,291 common units in Focus LLC, in each case as part of the regular quarterly exchanges offered to holders of units in Focus LLC.

Focus LLC Restricted Common Units

The following table provides information relating to the changes in Focus LLC restricted common units during the years ended December 31, 2020, 2021 and 2022:

Weighted

Restricted

Average

Common

Grant Date


Units


Fair Value

Outstanding—January 1, 2020

$

Granted

73,276

44.71

Outstanding—December 31, 2020

73,276

44.71

Granted

140,258

58.50

Forfeited

(1,902)

44.71

Vested

(18,007)

44.71

Outstanding—December 31, 2021


193,625

54.70

Granted

157,057

37.59

Vested

(54,134)

53.91

Outstanding—December 31, 2022

296,548

45.78

Restricted common units generally vest ratably over a four-year period commencing on the grant date.

Focus LLC Incentive Units

Focus LLC’s Operating Agreement provides for the granting of incentive units. Grants are designed as profits interests, which entitle a holder to receive distributions in excess of a specific hurdle amount, subject to the provisions of Focus LLC’s Operating Agreement.

F-32

Table of Contents

FOCUS FINANCIAL PARTNERS INC.

NOTES TO CONSOLIDATED FINANCIAL STATEMENTS

FOR THE YEARS ENDED DECEMBER 31, 2020, 2021 and 2022

(In thousands, except unit data, share and per share amounts)

The following table provides information relating to the status of, and changes in, Focus LLC incentive units granted during the years ended December 31, 2020, 2021 and 2022:


Weighted Average

Incentive Units

Hurdle Price

Outstanding—January 1, 2020

19,754,450

$

21.59

Granted

855,006

44.21

Forfeited

(3,153,308)

12.51

Forfeited

(221,651)

24.67

Outstanding—December 31, 2020

17,234,497

24.34

Vested—December 31, 2020

8,509,652

18.31

Granted

692,277

57.85

Exchanged

(1,580,792)

17.65

Forfeited

(199,458)

23.22

Outstanding—December 31, 2021

16,146,524

26.44

Vested—December 31, 2021

9,804,757

20.44

Granted


568,145


38.17

Exchanged

(111,783)

24.93

Outstanding—December 31, 2022


16,602,886


26.86

Vested—December 31, 2022


11,021,925


22.15

The Company uses the Black-Scholes option-pricing model to determine the fair value of time-based incentive units. The determination of the fair value using the Black-Scholes option-pricing model is affected by the Company’s estimated common unit price, as well as by assumptions regarding a number of complex and subjective variables. These variables include the Company’s expected unit price volatility over the term of the incentive unit, expected term, risk-free interest rates and expected dividend yield.

The estimated grant-date fair values of the 2020, 2021 and 2022 time-based incentive unit grants were calculated based on the following weighted-average assumptions:


2020


2021


2022


Expected term


5.0

years

5.0

years

5.0

years

Expected unit price volatility


35

%  

34

%  

36

%

Risk-free interest rate


0.39

%  

1.19

%  

3.58

%

Expected dividend yield


%  

%  

%

Weighted average grant date fair value

$

13.72

$

18.35

$

14.30

Incentive units generally vest ratably over a four-year period commencing on the grant date.

In connection with the IPO, Focus LLC granted 3,845,000 market-based incentive units with a hurdle rate of $33.00 that would have vested on the fifth anniversary of the IPO if the 90-day VWAP within such five year period immediately following the IPO reaches at least $100. In March 2022, these incentive units were modified whereby the incentive units will vest in July 2024, the sixth anniversary of the pricing of the Company’s IPO, with vesting based on the highest 90-day VWAP prior to the anniversary, with 0% vesting if the highest 90-day VWAP is $80.00 or less and 100% vesting if the highest 90-day VWAP is $110.00 or more, with linear interpolation in between. The vested incentive units can only be exchanged for Class A common stock in accordance with the following schedule: (i) a total of 25% of the vested incentive units may be exchanged on and following the date of vesting, (ii) an additional 25% (for a total of 50%) of the vested incentive units may be exchanged on and following the first anniversary of the date of vesting

F-33

Table of Contents

FOCUS FINANCIAL PARTNERS INC.

NOTES TO CONSOLIDATED FINANCIAL STATEMENTS

FOR THE YEARS ENDED DECEMBER 31, 2020, 2021 and 2022

(In thousands, except unit data, share and per share amounts)

in July 2025, and (iii) an additional 50% (for a total of 100%) of the vested incentive units may be exchanged on and following the second anniversary of the date of vesting in July 2026. These market-based incentive units will also vest upon a change of control linearly based on the share price used in the transaction with 100% vesting if the price used is $110.00, 0% vesting if the price used is equal to or less than $33.00, and linear interopolation in between, except as governed by the employment agreements entered into with the Company’s executive officers. In connection with the modification, the Company will recognize incremental non-cash equity compensation expense of $10,144, less any forfeitures, from the modification date through July 2024, the sixth anniversary of the IPO.

In February 2021, the compensation committee of the Company applied its discretion to provide for a new measurement period for 1,162,500 incentive units of certain officers of the Company. As a result of the modification, 896,230 units were vested based on the weighted average price per share for the seven days prior to February 23, 2021, with vesting calculated based on the same stock price hurdles that were to apply on the third anniversary of the IPO. This vesting criteria provided that if the specified weighted average price per share was: (i) less than $42.00, then none of such incentive units would vest; (ii) greater than $63.00, then all of such incentive units would vest; and (iii) if between $42.00 and $63.00, then (x) fifty percent of such incentive units would vest and (y) the remaining fifty percent of the remaining unvested incentive units would vest linearly based on where the price falls within the range of $42.00 and $63.00. The remaining 266,270 units that did not vest during the February measurement period, and 337,500 units held by individuals other than certain officers, that were not modified, were eligible to vest pursuant to the same criteria but using the weighted average price per share for the ninety day period immediately preceding the third anniversary of the Company’s IPO. In July 2021, the third anniversary of the Company’s IPO, 186,545 of the 266,270 units vested and 79,725 were forfeited pursuant to the vesting criteria, and 236,449 of the 337,500 units vested and 101,051 were forfeited pursuant to the vesting criteria.

In connection with the modification that resulted in the vesting of 896,230 units, the Company recognized additional non-cash equity compensation expense of $6,439 during the year ended December 31, 2021. In connection with the modification of the vesting terms of the 266,270 incentive units, the Company recognized incremental non-cash equity compensation expense of $1,544 during the year ended December 31, 2021.

F-34

Table of Contents

FOCUS FINANCIAL PARTNERS INC.

NOTES TO CONSOLIDATED FINANCIAL STATEMENTS

FOR THE YEARS ENDED DECEMBER 31, 2020, 2021 and 2022

(In thousands, except unit data, share and per share amounts)

Incentive units outstanding and vested at December 31, 2022 were as follows:


Number 


Vested
Incentive

Hurdle Rates

Outstanding

Units

$1.42


421

421

5.50


798

798

6.00


386

386

7.00


1,081

1,081

9.00


708,107

708,107

11.00


813,001

813,001

12.00


513,043

513,043

13.00


540,000

540,000

14.00


10,098

10,098

16.00


45,191

45,191

17.00


20,000

20,000

19.00


527,928

527,928

21.00


3,017,692

3,017,692

22.00


796,417

796,417

23.00


524,828

524,828

26.26

12,500

6,250

27.00


12,484

12,484

27.90

1,890,440

1,395,592

28.50

1,424,225

1,424,225

30.48

30,000

20,000

33.00


3,617,500

7,500

36.64

30,000

30,000

37.59

508,145

43.07

60,000

43.50

30,000

30,000

44.71

806,324

406,279

58.50

662,277

170,604

16,602,886

11,021,925

The Company has recorded $16,800, $25,566 and $21,726 of non-cash equity compensation expense for incentive units and restricted common units during the years ended December 31, 2020, 2021 and 2022, respectively.

Total unrecognized expense, adjusted for estimated forfeitures, related to restricted common units at December 31, 2022, was $13,113 and is expected to be recognized over a weighted-average period of 3.3 years.

Total unrecognized expense, adjusted for estimated forfeitures, related to unvested incentive units at December 31, 2022, was $27,427 and is expected to be recognized over a weighted-average period of 2.5 years.

11. INCOME TAXES

Income tax expense for year ended December 31, 2022 is primarily related to U.S. federal, state and local income taxes imposed on Focus Inc.’s allocable portion of taxable income from Focus LLC. The allocable portion of

F-35

Table of Contents

FOCUS FINANCIAL PARTNERS INC.

NOTES TO CONSOLIDATED FINANCIAL STATEMENTS

FOR THE YEARS ENDED DECEMBER 31, 2020, 2021 and 2022

(In thousands, except unit data, share and per share amounts)

taxable income primarily differs from the net income attributable to Focus Inc. due to permanent differences such as non-deductible equity-based compensation expense of Focus LLC.

The following represents the U.S. and foreign components of income before income tax for the years ended December 31, 2020, 2021 and 2022:


2020


2021


2022

Income before income tax:


United States

$

65,472

$

36,274

$

163,923

Foreign


4,153


8,248


14,432

Total income before income tax

$

69,625

$

44,522

$

178,355

The following represents the U.S. and foreign components of income tax expense for the years ended December 31, 2020, 2021 and 2022:


2020


2021


2022

Current provision:


Federal

$

10,363

$

19,742

$

12,373

State and local


5,355


7,855


8,221

Foreign


4,169


6,906


8,726

Subtotal


19,887

34,503

29,320

Deferred provision (benefit):


Federal


1,854


(7,958)


19,913

State and local


580


(3,674)


8,065

Foreign


(1,661)


(2,789)


(4,221)

Subtotal


773


(14,421)


23,757

Total income tax expense

$

20,660

$

20,082

$

53,077

At December 31, 2021 and 2022, tax effects of book/tax temporary differences give rise to deferred tax assets (liabilities) as follows:


2021


2022

Deferred tax assets:


Investment in Focus LLC, net

$

254,454

$

224,004

Federal net operating loss carryforwards

11,561

5,289

Business interest carryforwards

6,494

Deferred rent and other


2,353


2,479

Gross deferred tax assets


268,368


238,266

Valuation allowance

(6,494)

Deferred tax assets:

268,368

231,772

Deferred tax liabilities:


Intangible assets


(32,483)


(30,811)

Fixed assets and other


(526)


(410)

Gross deferred tax liabilities


(33,009)


(31,221)

Net deferred tax assets

$

235,359

$

200,551

F-36

Table of Contents

FOCUS FINANCIAL PARTNERS INC.

NOTES TO CONSOLIDATED FINANCIAL STATEMENTS

FOR THE YEARS ENDED DECEMBER 31, 2020, 2021 and 2022

(In thousands, except unit data, share and per share amounts)

A reconciliation of the differences between the U.S. federal statutory tax rate and the effective tax rate for the years ended December 31, 2020, 2021 and 2022 is as follows:


2020


2021


2022


U.S. federal statutory tax rate


21.0

%  

21.0

%  

21.0

%

Income passed through to individual members


(7.6)


(6.1)


(4.7)

Foreign income taxes


3.6


9.2


2.5

Non-cash equity compensation expense

3.5

7.7

1.8

Non-cash changes in fair value of estimated contingent consideration

(1.5)

Other non-deductible expenses


0.9


2.7


0.3

State and local income taxes, net of U.S. federal tax benefit


7.0


8.1


6.6

Valuation allowance


3.6

Other


1.3


2.5


0.2

Effective income tax rate


29.7

%  

45.1

%  

29.8

%

At December 31, 2022, the Company had $25,185 of U.S. federal net operating loss carryforwards. At December 31, 2022, the Company had $24,053 of business interest carryforwards. These net operating loss carryforwards and business interest carryforwards have an indefinite carryforward period.

In assessing the realizability of deferred tax assets, management considers whether it is more likely than not that some portion or all of the deferred tax assets will be realized. The ultimate realization of deferred tax assets is dependent upon the generation of future taxable income. Due to the uncertainty regarding the Company’s ability to utilize certain deferred tax assets in the future, the Company provided a valuation allowance of $6,494 at December 31, 2022 against certain of its deferred tax assets, which more than likely will not be realized.

The Company files tax returns in U.S. federal, local and state jurisdictions and certain of the Company’s subsidiaries file income tax returns in foreign jurisdictions. The Company is no longer subject to income tax examinations for years prior to 2019. In addition, open tax years related to local, state and foreign jurisdictions remain subject to examination, but are not considered material to the Company’s consolidated financial position, results of operations or cash flows. The Company is not aware of any tax position for which it is reasonably possible that the total amount of unrecognized benefits will change materially in the next 12 months.

12. TAX RECEIVABLE AGREEMENTS

In connection with the IPO and the reorganization transactions that occurred in connection with the IPO, Focus Inc. entered into two tax receivable agreements: one with certain entities affiliated with the private equity investors of Focus LLC and the other with certain other continuing and former owners of Focus LLC. In March 2020, Focus Inc. entered into an additional tax receivable agreement (the three agreements, collectively, the “Tax Receivable Agreements”) for tax receivable agreement holders that join Focus LLC as members after the closing of the IPO (the parties to the Tax Receivable Agreements, collectively, the “TRA Holders”). New Focus LLC owners in the future may also become party to this additional Tax Receivable Agreement. The Tax Receivable Agreements generally provide for the payment by Focus Inc. to each TRA holder of 85% of the net cash savings, if any, in U.S. federal, state and local income and franchise tax that Focus Inc. actually realizes (computed using simplifying assumptions to address the impact of state and local taxes) or is deemed to realize in certain circumstances in connection with the reorganization transactions that occurred in connection with the IPO and in periods after the IPO or after entering into the Tax Receivable Agreements, as applicable, as a result of certain increases in tax bases and certain tax benefits attributable to imputed interest. Focus Inc. will retain the benefit of the remaining 15% of these cash savings.

F-37

Table of Contents

FOCUS FINANCIAL PARTNERS INC.

NOTES TO CONSOLIDATED FINANCIAL STATEMENTS

FOR THE YEARS ENDED DECEMBER 31, 2020, 2021 and 2022

(In thousands, except unit data, share and per share amounts)

The Company had a liability of $219,542 and $224,611 relating to its obligations under the Tax Receivable Agreements as of December 31, 2021 and 2022, respectively. During the years ended December 31, 2021 and 2022, payments totaling $4,423 and $3,856, respectively, were made under the Tax Receivable Agreements. In February 2023, payments totaling $9,598 were made under the Tax Receivable Agreements.

13. LEASES

The future minimum lease payments under operating leases in place as of December 31, 2022 were as follows:

Year ending December 31,


Amount

2023


$

60,113

2024


56,357

2025


49,917

2026


43,387

2027


37,541

2028 and thereafter


99,413

346,728

Less: present value discount

(57,833)

Operating lease liabilities at December 31, 2022

$

288,895

The weighted average discount rate used to determine the Company’s operating lease liabilities was approximately 5% at December 31, 2021 and 2022. The weighted average remaining lease term at December 31, 2021 and 2022 was approximately seven years.

Other information pertaining to leases for the years ended December 31, 2021 and 2022 consists of the following:


2021


2022

Operating lease costs included in selling, general and administrative expenses

$

74,340

$

61,057

Operating cash flows from operating leases

73,481

59,090

Operating lease assets obtained in exchange for operating lease obligations

61,750

72,012

14. COMMITMENTS AND CONTINGENCIES

Credit Risk

The Company’s broker-dealer subsidiaries clear all transactions through clearing brokers on a fully disclosed basis. Pursuant to the terms of the agreements between the Company’s broker-dealer subsidiaries and their clearing brokers, the clearing brokers have the right to charge the Company’s broker-dealer subsidiaries for losses that result from a counterparty’s failure to fulfill its contractual obligations. This right applies to all trades executed through its clearing brokers, and therefore, the Company believes there is no maximum amount assignable to the right of the clearing brokers. Accordingly, at December 31, 2021 and 2022, the Company had recorded no liabilities in connection with this right.

In addition, the Company has the right to pursue collection or performance from the counterparties who do not perform under their contractual obligations. The Company monitors the credit standing of the clearing brokers and counterparties with which they conduct business.

F-38

Table of Contents

FOCUS FINANCIAL PARTNERS INC.

NOTES TO CONSOLIDATED FINANCIAL STATEMENTS

FOR THE YEARS ENDED DECEMBER 31, 2020, 2021 and 2022

(In thousands, except unit data, share and per share amounts)

The Company is exposed to credit risk for accounts receivable from clients. Such credit risk is limited to the amount of accounts receivable.

The Company maintains its cash in bank depository accounts, which, at times, may exceed federally insured limits. The Company selects depository institutions based, in part, upon management’s review of the financial stability of the institution. At December 31, 2021 and 2022, a significant portion of cash and cash equivalents were held at a single institution.

Contingent Consideration Arrangements

As discussed in Notes 2 and 7, contingent consideration is payable in the form of cash, and in some cases, equity. Since the contingent consideration to be paid is based on forecasted growth rates over the measurement period, the Company cannot calculate the maximum contingent consideration that may be payable under these arrangements.

Legal and Regulatory Matters

In the ordinary course of business, the Company and its subsidiaries are involved in lawsuits, regulatory matters and other claims. The Company has insurance to cover certain losses that arise in such matters; however, this insurance may not be sufficient to cover these losses. Management, after consultation with legal counsel, currently does not anticipate that the aggregate liability, if any, arising out of any existing legal matters will have a material effect on the Company’s consolidated financial position, results of operations or cash flows.

From time to time, the Company and its subsidiaries receive requests for information from governmental authorities regarding business activities. The Company continues to believe that the resolution of any governmental inquiry will not have a material impact on the Company’s consolidated financial position, results of operations or cash flows.

Indemnifications

In the ordinary course of business, the Company enters into contracts pursuant to which it may agree to indemnify third parties in certain circumstances. The terms of these indemnities vary from contract to contract and the amount of indemnification liability, if any, cannot be determined.

Management believes that the likelihood of any liability arising under these indemnification provisions is remote. Management cannot estimate any potential maximum exposure due to both the remoteness of any potential claims and the fact that items that would be included within any such calculated claim would be beyond the control of the Company. Consequently, no liability has been recorded in the consolidated balance sheets.

15. EMPLOYEE BENEFIT PLANS

The Company and its subsidiaries have defined contribution retirement plans, including 401(k) and profit-sharing plans covering eligible employees. During the years ended December 31, 2020, 2021 and 2022, the amounts recorded in expense relating to these plans were $9,357, $13,628 and $16,726, respectively, and are included in compensation and related expenses in the consolidated statements of operations.

16. NET CAPITAL REQUIREMENTS

Certain of the Company’s regulated subsidiaries are subject to minimum net capital requirements. As of December 31, 2021 and 2022, all regulated subsidiaries subject to minimum net capital requirements individually had

F-39

Table of Contents

FOCUS FINANCIAL PARTNERS INC.

NOTES TO CONSOLIDATED FINANCIAL STATEMENTS

FOR THE YEARS ENDED DECEMBER 31, 2020, 2021 and 2022

(In thousands, except unit data, share and per share amounts)

net capital in excess of minimum net capital requirements. As of December 31, 2021, these subsidiaries had aggregate net capital of $19,520, which was $15,853 in excess of aggregate minimum net capital requirements of $3,667. As of December 31, 2022, these subsidiaries had aggregate net capital of $25,318 which was $20,280 in excess of aggregate minimum net capital requirements of $5,038.

17. CASH FLOW INFORMATION

Year Ended

December 31, 


2020


2021


2022

Supplemental disclosures of cash flow information—cash paid for:

Interest

$

41,352

$

53,721

$

93,851

Income taxes

$

18,927

$

36,806

$

33,212

Supplemental non-cash cash flow information:


Fair market value of estimated contingent consideration in connection with acquisitions

$

46,918

$

212,074

$

56,604

18. RELATED PARTIES

The Company’s Chief Executive Officer, through an entity owned and controlled by him, owns a personal aircraft that was acquired without Company resources that he uses for business travel. The Company reimburses the Company’s Chief Executive Officer for certain costs and third-party payments associated with the use of his personal aircraft for Company-related business travel. The Company also pays pilot fees for such business travel flights. During the years ended December 31, 2020, 2021 and 2022, the Company recognized expenses of $1,280, $2,326 and $3,678, respectively, related to these reimbursements. Given the geography of the Company’s partner firms and prospects, the Company believes that the use of private aircraft creates efficiencies to enhance the productivity of the Company’s Chief Executive Officer and certain other authorized personnel.

Certain Company employees perform outsourced accounting services to an affiliated entity. In connection with these services, the Company recognized revenues of $12,298, $12,384 and $12,459 during the years ended December 31, 2020, 2021 and 2022, respectively.

Affiliates of current and former holders of the Company’s Class A common stock and Class B common stock earned underwriting fees of $5,644 in connection with equity offerings during the year ended December 31, 2021.

At December 31, 2022, affiliates of current holders of the Company’s Class A common stock and Class B common stock are lenders under the First Lien Term Loan B. During the years ended December 31, 2021 and 2022, certain current and former affiliates received $394 and $1,000 in fees, respectively, in connection with amendments to the Credit Facility.

F-40