Focus Financial Partners Reports First Quarter 2019 Results
Year-Over-Year Revenue Growth of 32.5%, Supported by Record M&A Activity
New York, New York — May 9, 2019 — Focus Financial Partners Inc. (Nasdaq: FOCS) (“Focus Inc.”, “Focus”, the “Company”, “we”, “us” or “our”), a leading partnership of independent, fiduciary wealth management firms, today reported results for its first quarter ended March 31, 2019.
First Quarter 2019 Highlights
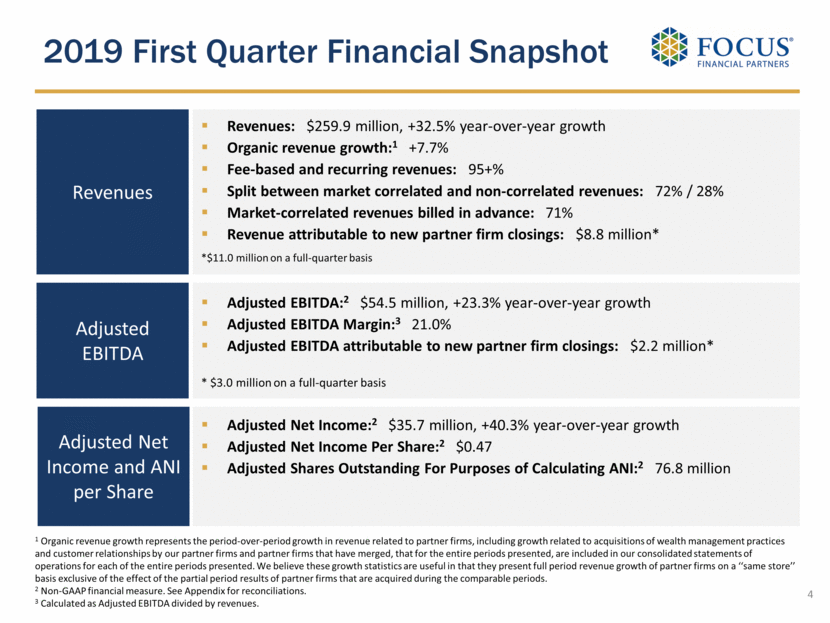
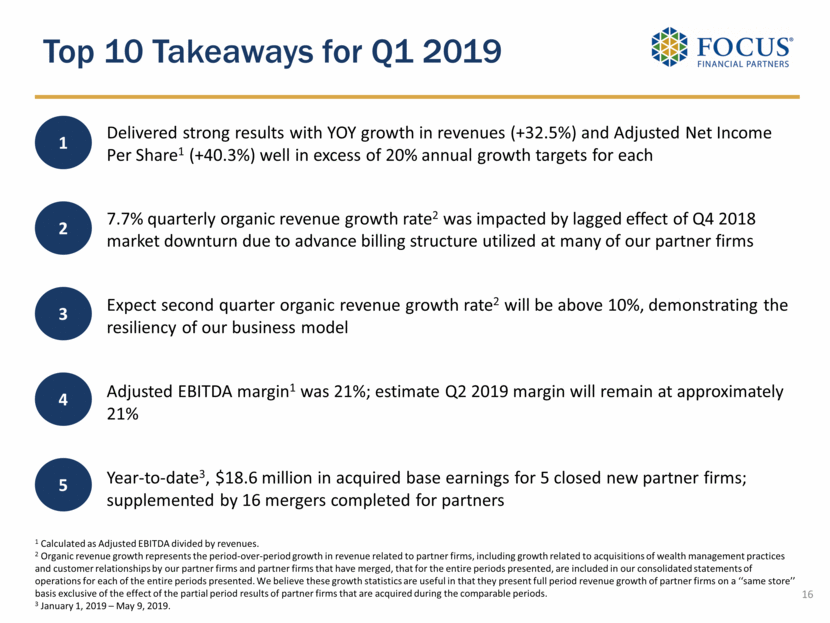
· Total revenues of $259.9 million, reflecting year-over-year growth of 32.5%
· GAAP net loss of $2.8 million
· GAAP basic and diluted net loss per share of $0.06
· Adjusted Net Income(1) of $35.7 million, 40.3% higher than the prior year quarter
· Adjusted Net Income Per Share(1) of $0.47, reflecting year-over-year growth of 34.3%
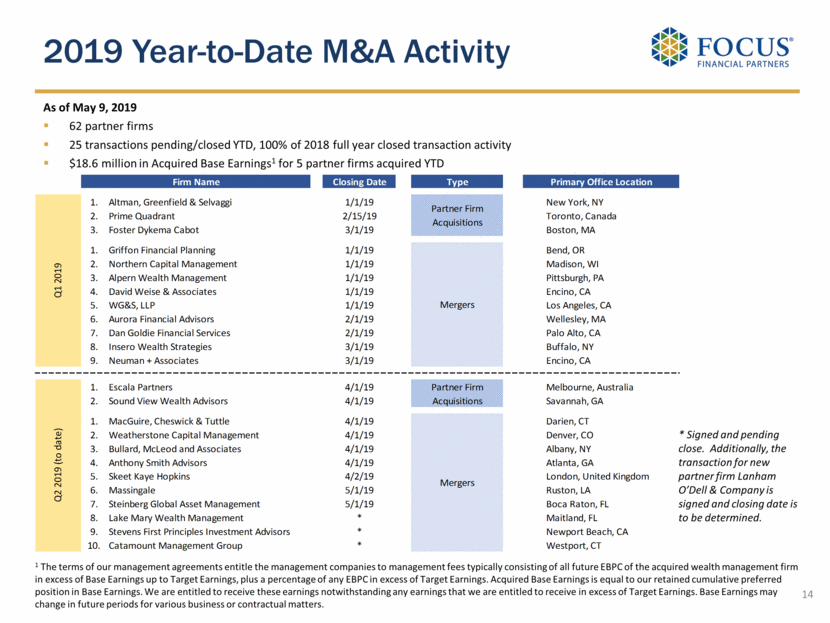
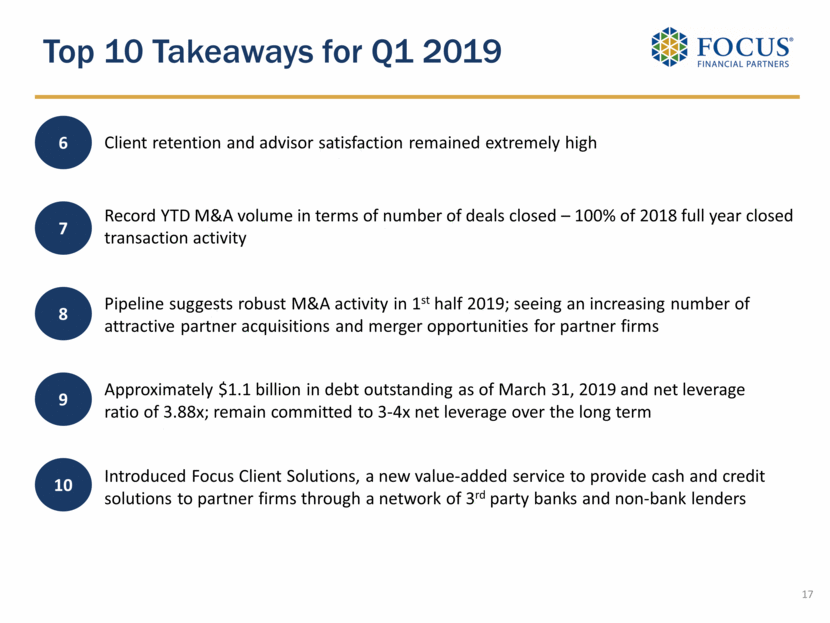
· Closed on three new partner firms, adding acquired base earnings(2) of $11.9 million
· Closed on nine mergers for existing partner firms
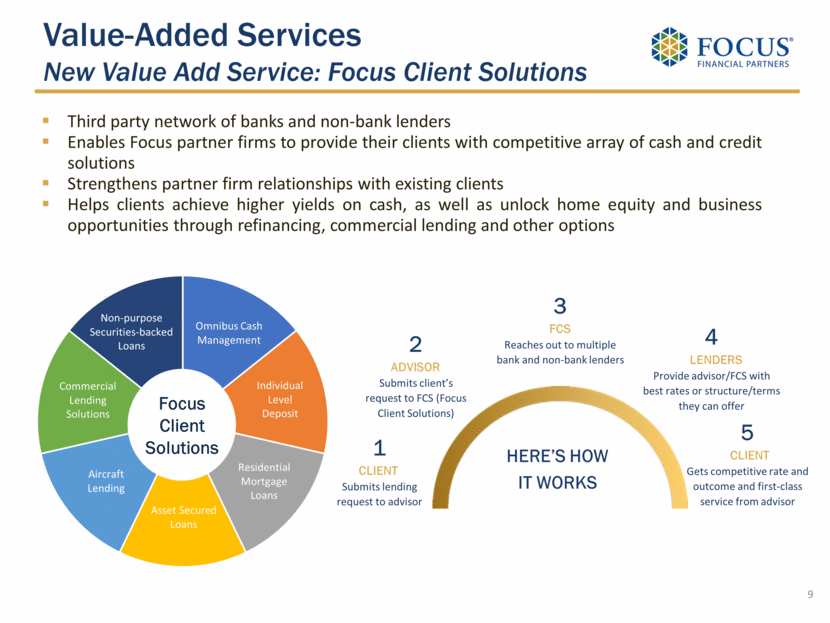
· Introduced Focus Client Solutions, enabling partner firms to offer clients cash and credit solutions through a network of third-party banks and non-bank lenders
(1) Non-GAAP financial measures. Please see “Reconciliation of Non-GAAP Financial Measures” later in this press release for a reconciliation and more information on these measures.
(2) Please see footnote 6 under “How We Evaluate Our Business” later in this press release
“The first quarter again demonstrated the power of the Focus model in a highly attractive growth industry,” said Rudy Adolf, Founder, Chief Executive Officer and Chairman. “We had a record first quarter of M&A activity, further increasing our presence in the ultra-high net worth and high net worth markets and expanding our international footprint. We continued to identify opportunities for our partner firms to benefit from our scale, intellectual and financial resources, which will drive value for years to come. Our momentum this year remains very strong as we build our business and deliver on our strategic priorities.”
“We are extremely pleased with our year-over-year growth in revenues and Adjusted Net Income Per Share,” said Jim Shanahan, Chief Financial Officer. “These results, combined with the level of M&A activity we achieved during the quarter and a robust pipeline, reinforce our confidence in our 20/20 long-term growth targets. We acquired three new partner firms and completed nine mergers for our existing partner firms that also contributed to our revenue growth in the quarter. Subsequent to the end of the quarter, we closed on two additional partner firms and completed seven additional mergers.”
Presentation
This press release presents our results of operations and financial position, including consolidation of our investment in Focus Financial Partners, LLC (“Focus LLC”), since July 30, 2018. Prior to July 30, 2018, the closing date of our initial public offering (“IPO”), the financial statements included herein represent those of Focus LLC. The financial results of Focus Inc. prior to July 30, 2018 have not been included in these financial statements as it had not engaged in any business activities during such period. Accordingly, these results do not purport to reflect what the results of operations of Focus Inc. would have been had Focus Inc.’s IPO and related transactions occurred prior to July 30, 2018.
First Quarter Financial Highlights
Total revenues were $259.9 million, 32.5% or $63.7 million higher than the first quarter of the prior year. The primary driver of this increase was attributable to new partner firms acquired over the twelve months ended March 31, 2019, which contributed approximately $48.4 million in revenue during the quarter. The balance of the increase of $15.3 million was primarily due to revenue growth from our existing partner firms partially offset by the lagged effect of the market decline, primarily in equities and fixed income, in the 2018 fourth quarter. The majority of this growth was the result of higher wealth management fees, which is inclusive of mergers completed by partner firms in the last twelve months.
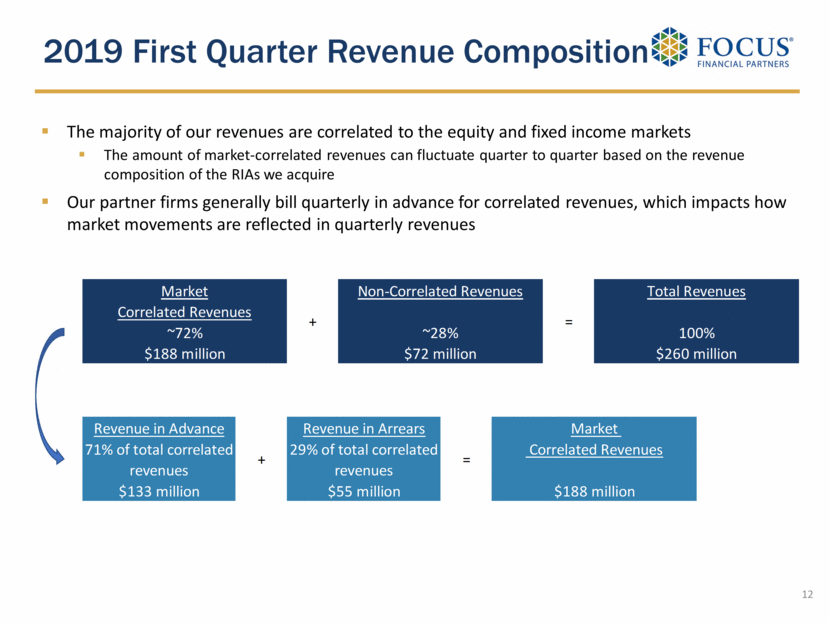
In the first quarter ended March 31, 2019, an estimated 72%, or approximately $188 million, of revenues were correlated to the financial markets, primarily equities and fixed income, of which 71%, or approximately $133 million, were generated from advance billings. The remaining 28%, or approximately $72 million, of revenues were not correlated to the markets. These revenues typically consist of fixed fees for investment advice, tax fees and family office type services, primarily for high and ultra-high net worth clients. In excess of 95% of revenues were fee-based and recurring during the first quarter ended March 31, 2019.
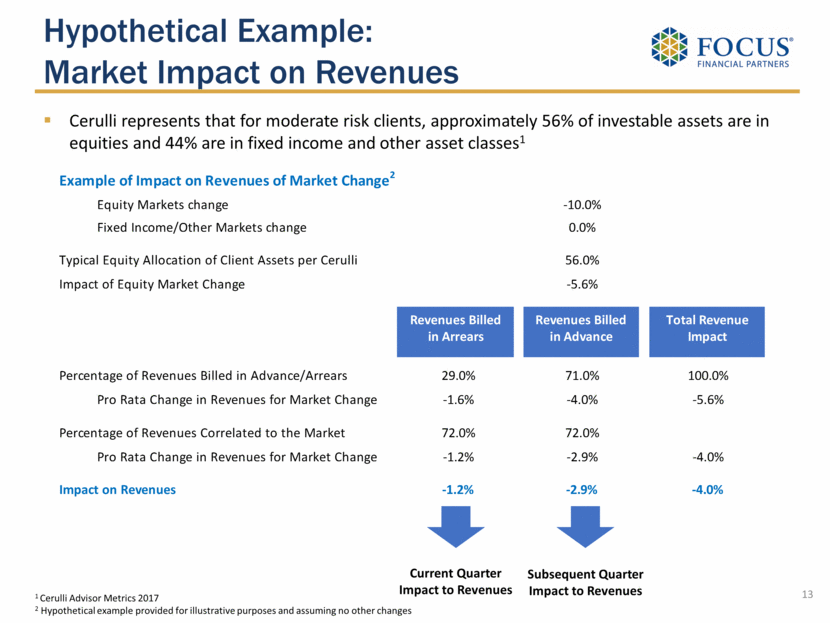
Organic revenue growth(1) was 7.7%, which when compared to the prior year quarter, was impacted by the effect of the markets, primarily equities and fixed income, decline in the 2018 fourth quarter and the advanced billing structure utilized by certain of our partner firms. Based on our M&A momentum and the general recovery in the financial markets, our organic revenue growth for the second quarter of 2019 is expected to be above 10%, demonstrating the resiliency of our business model.
Adjusted Net Income(2) was $35.7 million, an increase of 40.3%, or $10.3 million over the prior year quarter. Adjusted Net Income Per Share(2) was $0.47 per share, $0.12, or 34.3%, higher than the prior year quarter, reflecting both acquisition activity completed over the past year and organic growth.
(1) Please see footnote 2 under “How We Evaluate Our Business” later in this press release.
(2) Non-GAAP financial measures. Please see “Reconciliation of Non-GAAP Financial Measures” later in this press release for a reconciliation and more information on these measures.
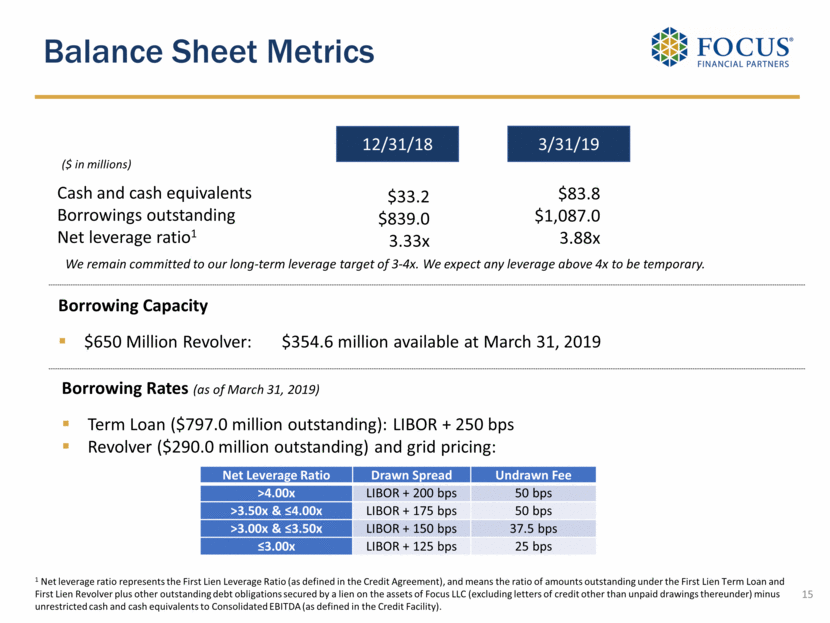
Balance Sheet and Liquidity
As of March 31, 2019, cash and cash equivalents were $83.8 million, compared to $33.2 million at December 31, 2018. Debt outstanding under the Company’s credit facilities was approximately $1.1 billion, compared to $839.0 million at the end of the prior year. The increase was primarily attributable to the cash funding of the acquisitions of new partner firms and mergers completed by our partner firms during the first quarter.
Of the total debt outstanding as of March 31, 2019, $797.0 million were term loan borrowings and $290.0 million were borrowings under the Company’s revolving credit agreement. The Company’s net leverage ratio at March 31, 2019 was 3.88x and a reflection of the strong M&A momentum during the first quarter.
New Developments
In the second quarter of 2019, we introduced Focus Client Solutions, a new value-added service we are offering to our partner firms. We have created a network of third-party banks and non-bank lenders to provide a competitive array of cash and credit solutions that enables our partners to proactively help their clients achieve higher yields on cash, as well as unlock home equity and business opportunities through refinancing, commercial lending and other options. This is a unique offering in the RIA industry and another example of how we use our scale, access and purchasing power to help our partners deliver exceptional services to their clients.
Teleconference, Webcast and Presentation Information
Founder and Chief Executive Officer, Rudy Adolf, and Chief Financial Officer, Jim Shanahan, will host a conference call today, May 9, 2019 at 8:30 a.m. Eastern Time to discuss the Company’s 2019 first quarter results. The call can be accessed by dialing +1-877-504-6131 (inside the U.S.) or +1-786-815-8445 (outside the U.S.) and entering the passcode 8787832.
A live, listen-only webcast, together with a slide presentation titled “2019 First Quarter Earnings Release Supplement” dated May 9, 2019, will be available under “Events” in the “Investor Relations” section of the Company’s website, www.focusfinancialpartners.com. A webcast replay of the call will be available shortly after the event at the same address.
About Focus Financial Partners Inc.
Focus Financial Partners is a leading partnership of independent, fiduciary wealth management firms. Focus provides access to best practices, resources, and continuity planning for its partner firms who serve individuals, families, employers and institutions with comprehensive wealth management services. Focus partner firms maintain their operational independence, while they benefit from the synergies, scale, economics and best practices offered by Focus to achieve their business objectives.
Cautionary Note Concerning Forward-Looking Statements
The foregoing information contains certain forward-looking statements that reflect the Company’s current views with respect to certain current and future events and financial performance. These forward-looking statements are and will be, as the case may be, subject to many risks, uncertainties and factors relating to the Company’s operations and business environment which may cause the Company’s actual results to be materially different
from any future results, expressed or implied, in these forward-looking statements. Any forward-looking statements in this release are based upon information available to the Company on the date of this release. The Company does not undertake to publicly update or revise its forward-looking statements even if experience or future changes make it clear that any statements expressed or implied therein will not be realized. Additional information on risk factors that could potentially affect the Company’s financial results may be found in the Company’s annual report on Form 10-K for the year ended December 31, 2018 filed with the Securities and Exchange Commission.
Investor and Media Contact Information
Tina Madon
Head of Investor Relations & Corporate Communications
Tel: (646) 813-2909
tmadon@focuspartners.com
How We Evaluate Our Business
We focus on several key financial metrics in evaluating the success of our business, the success of our partner firms and our resulting financial position and operating performance. Key metrics for the three months ended March 31, 2018 and 2019 include the following:
|
|
|
Three Months Ended |
| ||||
|
|
|
March 31, |
| ||||
|
|
|
2018 |
|
2019 |
| ||
|
|
|
(In thousands, except share |
| ||||
|
Revenue Metrics: |
|
|
|
|
| ||
|
Revenues |
|
$ |
196,229 |
|
$ |
259,924 |
|
|
Revenue growth (1) from prior period |
|
44.8 |
% |
32.5 |
% | ||
|
Organic revenue growth (2) from prior period |
|
17.6 |
% |
7.7 |
% | ||
|
|
|
|
|
|
| ||
|
Management Fees Metrics (operating expense): |
|
|
|
|
| ||
|
Management fees |
|
$ |
46,300 |
|
$ |
57,006 |
|
|
Management fees growth (3) from prior period |
|
39.3 |
% |
23.1 |
% | ||
|
Organic management fees growth (4) from prior period |
|
24.5 |
% |
1.8 |
% | ||
|
|
|
|
|
|
| ||
|
Adjusted EBITDA Metrics: |
|
|
|
|
| ||
|
Adjusted EBITDA (5) |
|
$ |
44,221 |
|
$ |
54,514 |
|
|
Adjusted EBITDA growth (5) from prior period |
|
56.8 |
% |
23.3 |
% | ||
|
|
|
|
|
|
| ||
|
Adjusted Net Income Metrics: |
|
|
|
|
| ||
|
Adjusted Net Income (5) |
|
$ |
25,456 |
|
$ |
35,714 |
|
|
Adjusted Net Income growth (5) from prior period |
|
38.8 |
% |
40.3 |
% | ||
|
|
|
|
|
|
| ||
|
Adjusted Net Income Per Share Metrics: |
|
|
|
|
| ||
|
Adjusted Net Income Per Share (5) |
|
$ |
0.35 |
|
$ |
0.47 |
|
|
Adjusted Net Income Per Share growth (5) from prior period |
|
38.8 |
% |
34.3 |
% | ||
|
Adjusted Shares Outstanding (5) |
|
71,843,916 |
|
76,793,979 |
| ||
|
|
|
|
|
|
| ||
|
Other Metrics: |
|
|
|
|
| ||
|
Acquired Base Earnings (6) |
|
$ |
2,750 |
|
$ |
11,913 |
|
|
Number of partner firms at period end (7) |
|
52 |
|
60 |
| ||
(1) Represents period-over-period growth in our GAAP revenue.
(2) Organic revenue growth represents the period-over-period growth in revenue related to partner firms, including growth related to acquisitions of wealth management practices and customer relationships by our partner firms and partner firms that have merged, that for the entire periods presented, are included in our consolidated statements of operations for each of the entire periods presented. We believe these growth statistics are useful in that they present full-period revenue growth of partner firms on a ‘‘same store’’ basis exclusive of the effect of the partial period results of partner firms that are acquired during the comparable periods.
(3) The terms of our management agreements entitle the management companies to management fees typically consisting of all Earnings Before Partner Compensation (“EBPC”) in excess of Base Earnings up to Target Earnings, plus a percentage of any EBPC in excess of Target Earnings. Management fees growth represents the growth in GAAP management fees earned by management companies. While an expense, we believe that growth in management fees reflect the strength of the partnership.
(4) Organic management fee growth represents the period-over-period growth in management fees earned by management companies related to partner firms, including growth related to acquisitions of wealth management practices and customer relationships by our partner firms and partner firms that have merged, that for the entire periods presented, are included in our consolidated statements of operations for each of the entire periods presented. We believe that these growth statistics are useful in that they present full-period growth of management fees on a ‘‘same store’’ basis exclusive of the effect of the partial period results of partner firms that are acquired during the comparable periods.
(5) For additional information regarding Adjusted EBITDA, Adjusted Net Income, Adjusted Net Income Per Share and Adjusted Shares Outstanding, including a reconciliation of Adjusted EBITDA, Adjusted Net Income and Adjusted Net Income Per Share to the most directly comparable GAAP financial measure, please read ‘‘Reconciliation of Non-GAAP Financial Measures—Adjusted EBITDA’’ and ‘‘Reconciliation of Non-GAAP Financial Measures —Adjusted Net Income and Adjusted Net Income Per Share’’.
(6) The terms of our management agreements entitle the management companies to management fees typically consisting of all future EBPC of the acquired wealth management firm in excess of Base Earnings up to Target Earnings, plus a percentage of any EBPC in excess of Target Earnings. Acquired Base Earnings is equal to our retained cumulative preferred position in Base Earnings. We are entitled to receive these earnings notwithstanding any earnings that we are entitled to receive in excess of Target Earnings. Base Earnings may change in future periods for various business or contractual matters. For example, from time to time when a partner firm consummates an acquisition, the management agreement among the partner firm, the management company and the principals is amended to adjust Base Earnings and Target Earnings to reflect the projected post-acquisition earnings of the partner firm.
(7) Represents the number of partner firms on the last day of the period presented. The number includes new partner firms acquired during the period reduced by any partner firms that merged with existing partner firms prior to the last day of the period.
Unaudited Condensed Consolidated Financial Statements
FOCUS FINANCIAL PARTNERS INC.
Unaudited condensed consolidated statements of operations
(In thousands, except share and per share data)
|
|
|
Three Months Ended |
| ||||
|
|
|
March 31, |
| ||||
|
|
|
2018 |
|
2019 |
| ||
|
REVENUES: |
|
|
|
|
| ||
|
Wealth management fees |
|
$ |
184,323 |
|
$ |
243,084 |
|
|
Other |
|
11,906 |
|
16,840 |
| ||
|
Total revenues |
|
196,229 |
|
259,924 |
| ||
|
OPERATING EXPENSES: |
|
|
|
|
| ||
|
Compensation and related expenses |
|
73,349 |
|
101,448 |
| ||
|
Management fees |
|
46,300 |
|
57,006 |
| ||
|
Selling, general and administrative |
|
36,287 |
|
52,257 |
| ||
|
Management contract buyout |
|
— |
|
1,428 |
| ||
|
Intangible amortization |
|
19,494 |
|
28,741 |
| ||
|
Non-cash changes in fair value of estimated contingent consideration |
|
6,371 |
|
7,414 |
| ||
|
Depreciation and other amortization |
|
1,882 |
|
2,313 |
| ||
|
Total operating expenses |
|
183,683 |
|
250,607 |
| ||
|
INCOME FROM OPERATIONS |
|
12,546 |
|
9,317 |
| ||
|
OTHER INCOME (EXPENSE): |
|
|
|
|
| ||
|
Interest income |
|
142 |
|
197 |
| ||
|
Interest expense |
|
(14,272 |
) |
(12,859 |
) | ||
|
Amortization of debt financing costs |
|
(959 |
) |
(782 |
) | ||
|
Gain on sale of investment |
|
5,509 |
|
— |
| ||
|
Loss on extinguishment of borrowings |
|
(14,011 |
) |
— |
| ||
|
Other income (expense) —net |
|
93 |
|
(236 |
) | ||
|
Income from equity method investments |
|
74 |
|
314 |
| ||
|
Total other expense—net |
|
(23,424 |
) |
(13,366 |
) | ||
|
LOSS BEFORE INCOME TAX |
|
(10,878 |
) |
(4,049 |
) | ||
|
INCOME TAX EXPENSE (BENEFIT) |
|
1,176 |
|
(1,221 |
) | ||
|
NET LOSS |
|
$ |
(12,054 |
) |
(2,828 |
) | |
|
Non-controlling interest |
|
|
|
(114 |
) | ||
|
NET LOSS ATTRIBUTABLE TO COMMON SHAREHOLDERS |
|
|
|
$ |
(2,942 |
) | |
|
|
|
|
|
|
| ||
|
Loss per share of Class A common stock: |
|
|
|
|
| ||
|
Basic |
|
|
|
$ |
(0.06 |
) | |
|
Diluted |
|
|
|
$ |
(0.06 |
) | |
|
|
|
|
|
|
| ||
|
Weighted average shares of Class A common stock outstanding: |
|
|
|
|
| ||
|
Basic |
|
|
|
46,211,599 |
| ||
|
Diluted |
|
|
|
46,211,599 |
| ||
FOCUS FINANCIAL PARTNERS INC.
Unaudited condensed consolidated balance sheets
(In thousands, except share data)
|
|
|
December 31, |
|
March 31, |
| ||
|
|
|
2018 |
|
2019 |
| ||
|
ASSETS |
|
|
|
|
| ||
|
Cash and cash equivalents |
|
$ |
33,213 |
|
$ |
83,779 |
|
|
Accounts receivable less allowances of $576 at 2018 and $661 at 2019 |
|
98,596 |
|
119,202 |
| ||
|
Prepaid expenses and other assets |
|
76,150 |
|
83,501 |
| ||
|
Fixed assets—net |
|
24,780 |
|
24,860 |
| ||
|
Operating lease assets |
|
— |
|
171,189 |
| ||
|
Debt financing costs—net |
|
12,340 |
|
11,666 |
| ||
|
Deferred tax assets—net |
|
70,009 |
|
75,360 |
| ||
|
Goodwill |
|
860,495 |
|
945,503 |
| ||
|
Other intangible assets—net |
|
762,195 |
|
881,096 |
| ||
|
TOTAL ASSETS |
|
$ |
1,937,778 |
|
$ |
2,396,156 |
|
|
LIABILITIES AND EQUITY |
|
|
|
|
| ||
|
LIABILITIES |
|
|
|
|
| ||
|
Accounts payable |
|
$ |
8,935 |
|
$ |
13,603 |
|
|
Accrued expenses |
|
36,252 |
|
42,054 |
| ||
|
Due to affiliates |
|
39,621 |
|
41,281 |
| ||
|
Deferred revenue |
|
6,215 |
|
7,870 |
| ||
|
Other liabilities |
|
158,497 |
|
169,717 |
| ||
|
Operating lease liabilities |
|
— |
|
181,597 |
| ||
|
Borrowings under credit facilities (stated value of $838,985 and $1,086,978 at December 31, 2018 and March 31, 2019, respectively) |
|
836,582 |
|
1,084,683 |
| ||
|
Tax receivable agreements obligation |
|
39,156 |
|
43,075 |
| ||
|
TOTAL LIABILITIES |
|
1,125,258 |
|
1,583,880 |
| ||
|
EQUITY |
|
|
|
|
| ||
|
Class A common stock, par value $0.01, 500,000,000 shares authorized; 46,265,903 and 46,675,183 shares issued and outstanding at December 31, 2018 and March 31, 2019, respectively |
|
462 |
|
467 |
| ||
|
Class B common stock, par value $0.01, 500,000,000 shares authorized; 22,823,272 and 22,568,831 shares issued and outstanding at December 31, 2018 and March 31, 2019, respectively |
|
228 |
|
225 |
| ||
|
Additional paid-in capital |
|
471,386 |
|
459,488 |
| ||
|
Accumulated deficit |
|
(590 |
) |
(3,532 |
) | ||
|
Accumulated other comprehensive loss |
|
(1,824 |
) |
(1,594 |
) | ||
|
Total shareholders’ equity |
|
469,662 |
|
455,054 |
| ||
|
Non-controlling interest |
|
342,858 |
|
357,222 |
| ||
|
Total equity |
|
812,520 |
|
812,276 |
| ||
|
TOTAL LIABILITIES AND EQUITY |
|
$ |
1,937,778 |
|
$ |
2,396,156 |
|
FOCUS FINANCIAL PARTNERS INC.
Unaudited condensed consolidated statements of cash flows
(In thousands)
|
|
|
Three Months Ended |
| ||||
|
|
|
March 31, |
| ||||
|
|
|
2018 |
|
2019 |
| ||
|
CASH FLOWS FROM OPERATING ACTIVITIES: |
|
|
|
|
| ||
|
Net loss |
|
$ |
(12,054 |
) |
$ |
(2,828 |
) |
|
Adjustments to reconcile net loss to net cash provided by operating activities—net of effect of acquisitions: |
|
|
|
|
| ||
|
Intangible amortization |
|
19,494 |
|
28,741 |
| ||
|
Depreciation and other amortization |
|
1,882 |
|
2,313 |
| ||
|
Amortization of debt financing costs |
|
959 |
|
782 |
| ||
|
Non-cash equity compensation expense |
|
3,854 |
|
3,921 |
| ||
|
Non-cash changes in fair value of estimated contingent consideration |
|
6,371 |
|
7,414 |
| ||
|
Income from equity method investments |
|
(74 |
) |
(314 |
) | ||
|
Distributions received from equity method investments |
|
344 |
|
263 |
| ||
|
Other non-cash items |
|
(368 |
) |
(575 |
) | ||
|
Loss on extinguishment of borrowings |
|
14,011 |
|
— |
| ||
|
Changes in cash resulting from changes in operating assets and liabilities: |
|
|
|
|
| ||
|
Accounts receivable |
|
(11,017 |
) |
(20,690 |
) | ||
|
Prepaid expenses and other assets |
|
(8,167 |
) |
(5,788 |
) | ||
|
Accounts payable |
|
1,410 |
|
4,662 |
| ||
|
Accrued expenses |
|
5,383 |
|
3,741 |
| ||
|
Due to affiliates |
|
(9,914 |
) |
1,723 |
| ||
|
Other liabilities |
|
(1,280 |
) |
(7,537 |
) | ||
|
Deferred revenue |
|
1,891 |
|
85 |
| ||
|
Net cash provided by operating activities |
|
12,725 |
|
15,913 |
| ||
|
CASH FLOWS FROM INVESTING ACTIVITIES: |
|
|
|
|
| ||
|
Cash paid for acquisitions and contingent consideration—net of cash acquired |
|
(25,531 |
) |
(203,394 |
) | ||
|
Purchase of fixed assets |
|
(2,312 |
) |
(1,875 |
) | ||
|
Other |
|
(3,400 |
) |
— |
| ||
|
Net cash used in investing activities |
|
(31,243 |
) |
(205,269 |
) | ||
|
CASH FLOWS FROM FINANCING ACTIVITIES: |
|
|
|
|
| ||
|
Borrowings under credit facilities |
|
— |
|
295,000 |
| ||
|
Repayments of borrowings under credit facilities |
|
(1,987 |
) |
(47,007 |
) | ||
|
Contingent consideration paid |
|
(2,180 |
) |
(7,649 |
) | ||
|
Payments of debt financing costs |
|
(634 |
) |
— |
| ||
|
Proceeds from exercise of stock options |
|
— |
|
214 |
| ||
|
Payments on finance lease obligations |
|
(59 |
) |
(57 |
) | ||
|
Distributions for unitholders |
|
(138 |
) |
(596 |
) | ||
|
Net cash (used in) provided by financing activities |
|
(4,998 |
) |
239,905 |
| ||
|
EFFECT OF EXCHANGE RATES ON CASH AND CASH EQUIVALENTS |
|
10 |
|
17 |
| ||
|
CHANGE IN CASH AND CASH EQUIVALENTS |
|
(23,506 |
) |
50,566 |
| ||
|
CASH AND CASH EQUIVALENTS: |
|
|
|
|
| ||
|
Beginning of period |
|
51,455 |
|
33,213 |
| ||
|
End of period |
|
$ |
27,949 |
|
$ |
83,779 |
|
Reconciliation of Non-GAAP Financial Measures
Adjusted EBITDA
Adjusted EBITDA is a non-GAAP measure. Adjusted EBITDA is defined as net income (loss) excluding interest income, interest expense, income tax expense (benefit), amortization of debt financing costs, intangible amortization and impairments, if any, depreciation and other amortization, non-cash equity compensation expense, non-cash changes in fair value of estimated contingent consideration, gain on sale of investment, loss on extinguishment of borrowings, other expense/income, net, other one-time transaction expenses, and management contract buyout, if any. We believe that Adjusted EBITDA, viewed in addition to and not in lieu of, our reported GAAP results, provides additional useful information to investors regarding our performance and overall results of operations for various reasons, including the following:
· Non-cash equity grants made to employees or non-employees at a certain price and point in time do not necessarily reflect how our business is performing at any particular time; stock-based compensation expense is not a key measure of our operating performance;
· Contingent consideration or earn outs can vary substantially from company to company and depending upon each company’s growth metrics and accounting assumption methods, the non-cash changes in fair value of estimated contingent consideration is not considered a key measure in comparing our operating performance; and
· Amortization expenses can vary substantially from company to company and from period to period depending upon each company’s financing and accounting methods; the fair value and average expected life of acquired intangible assets and the method by which assets were acquired; the amortization of intangible assets obtained in acquisitions are not considered a key measure in comparing our operating performance.
We use Adjusted EBITDA:
· As a measure of operating performance;
· For planning purposes, including the preparation of budgets and forecasts;
· To allocate resources to enhance the financial performance of our business; and
· To evaluate the effectiveness of our business strategies.
Adjusted EBITDA does not purport to be an alternative to net income (loss) or cash flows from operating activities. The term Adjusted EBITDA is not defined under GAAP, and Adjusted EBITDA is not a measure of net income (loss), operating income or any other performance or liquidity measure derived in accordance with GAAP. Therefore, Adjusted EBITDA has limitations as an analytical tool and should not be considered in isolation or as a substitute for analysis of our results as reported under GAAP. Some of these limitations are:
· Adjusted EBITDA does not reflect all cash expenditures, future requirements for capital expenditures or contractual commitments;
· Adjusted EBITDA does not reflect changes in, or cash requirements for, working capital needs; and
· Adjusted EBITDA does not reflect the interest expense on our debt or the cash requirements necessary to service interest or principal payments.
In addition, Adjusted EBITDA can differ significantly from company to company depending on strategic decisions regarding capital structure, the tax jurisdictions in which companies operate and capital investments. We compensate for these limitations by relying also on the GAAP results and using Adjusted EBITDA as supplemental information.
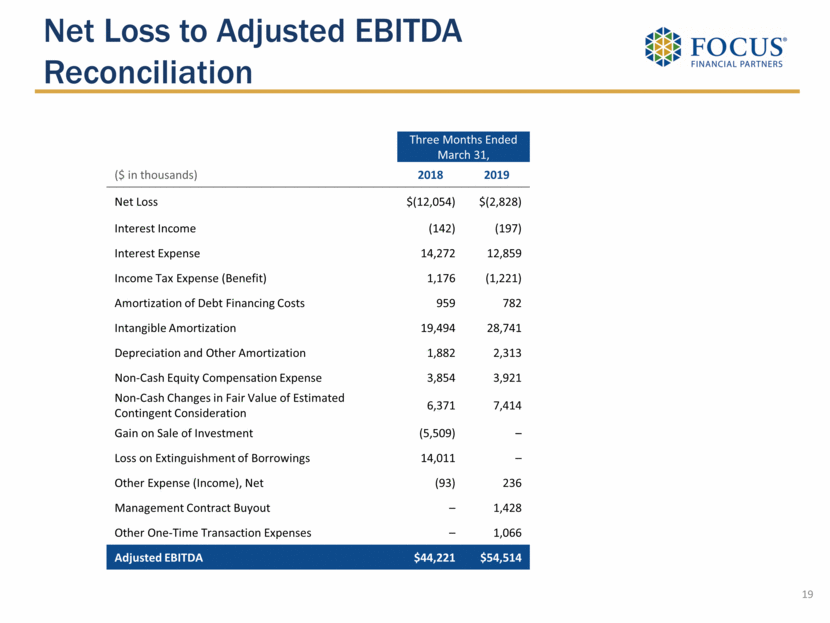
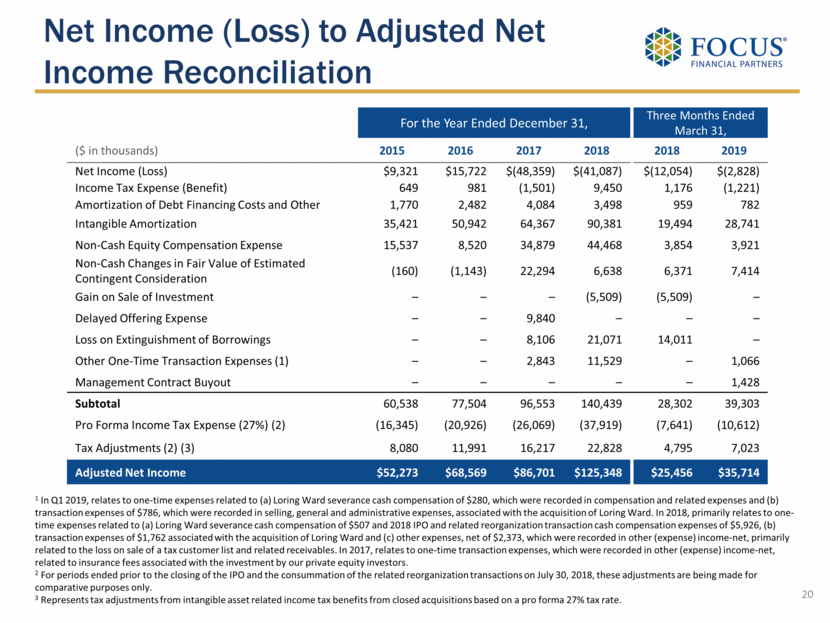
Set forth below is a reconciliation of net loss to Adjusted EBITDA for the three months ended March 31, 2018 and 2019:
|
|
|
Three Months Ended |
| ||||
|
|
|
March 31, |
| ||||
|
|
|
2018 |
|
2019 |
| ||
|
|
|
(In thousands) |
| ||||
|
Net loss |
|
$ |
(12,054 |
) |
$ |
(2,828 |
) |
|
Interest income |
|
(142 |
) |
(197 |
) | ||
|
Interest expense |
|
14,272 |
|
12,859 |
| ||
|
Income tax expense (benefit) |
|
1,176 |
|
(1,221 |
) | ||
|
Amortization of debt financing costs |
|
959 |
|
782 |
| ||
|
Intangible amortization |
|
19,494 |
|
28,741 |
| ||
|
Depreciation and other amortization |
|
1,882 |
|
2,313 |
| ||
|
Non-cash equity compensation expense |
|
3,854 |
|
3,921 |
| ||
|
Non-cash changes in fair value of estimated contingent consideration |
|
6,371 |
|
7,414 |
| ||
|
Gain on sale of investment |
|
(5,509 |
) |
— |
| ||
|
Loss on extinguishment of borrowings |
|
14,011 |
|
— |
| ||
|
Other expense (income), net |
|
(93 |
) |
236 |
| ||
|
Management contract buyout |
|
— |
|
1,428 |
| ||
|
Other one-time transaction expenses |
|
— |
|
1,066 |
| ||
|
Adjusted EBITDA |
|
$ |
44,221 |
|
$ |
54,514 |
|
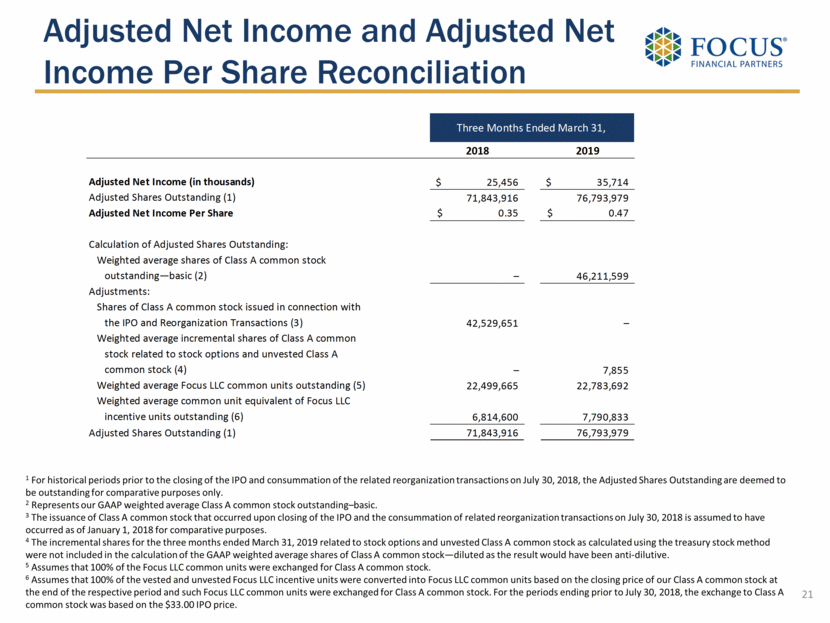
Adjusted Net Income and Adjusted Net Income Per Share
We analyze our performance using Adjusted Net Income and Adjusted Net Income Per Share. Adjusted Net Income and Adjusted Net Income Per Share are non-GAAP measures. We define Adjusted Net Income as net income (loss) excluding income tax expense (benefit), amortization of debt financing costs, intangible amortization and impairments, if any, non-cash equity compensation expense, non-cash changes in fair value of estimated contingent consideration, gain on sale of investment, loss on extinguishment of borrowings, management contract buyout, if any, and other one-time transaction expenses. The calculation of Adjusted Net Income also includes adjustments to reflect (i) a pro forma 27% income tax rate assuming all earnings of Focus LLC were recognized by Focus Inc. and no earnings were attributable to non-controlling interests and (ii) tax adjustments from intangible asset related income tax benefits from acquisitions based on a pro forma 27% tax rate.
Adjusted Net Income Per Share for the three months ended March 31, 2019 is calculated by dividing Adjusted Net Income by the Adjusted Shares Outstanding. Adjusted Shares Outstanding for the three months ended March 31, 2019 includes: (i) the weighted average shares of Class A common stock outstanding during the period, (ii) the weighted average incremental shares of Class A common stock related to stock options and unvested Class A common stock, if any, outstanding during the period, (iii) the weighted average number of
Focus LLC common units outstanding during the period (assuming that 100% of such Focus LLC common units have been exchanged for Class A common stock) and (iv) the weighted average number of common unit equivalents of Focus LLC vested and unvested incentive units outstanding during the period based on the closing price of our Class A common stock on the last trading day of the period (assuming that 100% of such Focus LLC common units have been exchanged for Class A common stock).
Adjusted Net Income Per Share for the periods prior to July 30, 2018 is calculated by dividing Adjusted Net Income by the Adjusted Shares Outstanding. Adjusted Shares Outstanding for the periods prior to July 30, 2018 was 71,843,916 and includes all vested and unvested shares of Class A common stock issued in connection with the IPO and Reorganization Transactions, assumes that all vested non-compensatory stock options and unvested compensatory stock options outstanding at the closing of the IPO have been exercised (assuming vesting of unvested compensatory stock options and a then-current value of the Class A common stock equal to the $33.00 IPO price) and assumes that 100% of the Focus LLC common units and vested and unvested incentive units outstanding at the closing of the IPO have been exchanged for Class A common stock (assuming vesting of the unvested incentive units and a then-current value of the Focus LLC common units equal to the $33.00 IPO price).
We believe that Adjusted Net Income and Adjusted Net Income Per Share, viewed in addition to and not in lieu of, our reported GAAP results, provide additional useful information to investors regarding our performance and overall results of operations for various reasons, including the following:
· Non-cash equity grants made to employees or non-employees at a certain price and point in time do not necessarily reflect how our business is performing at any particular time; stock-based compensation expense is not a key measure of our operating performance;
· Contingent consideration or earn outs can vary substantially from company to company and depending upon each company’s growth metrics and accounting assumption methods; the non-cash changes in fair value of estimated contingent consideration is not considered a key measure in comparing our operating performance; and
· Amortization expenses can vary substantially from company to company and from period to period depending upon each company’s financing and accounting methods, the fair value and average expected life of acquired intangible assets and the method by which assets were acquired; the amortization of intangible assets obtained in acquisitions are not considered a key measure in comparing our operating performance.
Adjusted Net Income and Adjusted Net Income Per Share do not purport to be an alternative to net income (loss) or cash flows from operating activities. The terms Adjusted Net Income and Adjusted Net Income Per Share are not defined under GAAP, and Adjusted Net Income and Adjusted Net Income Per Share are not a measure of net income (loss), operating income or any other performance or liquidity measure derived in accordance with GAAP. Therefore, Adjusted Net Income and Adjusted Net Income Per Share have limitations as an analytical tool and should not be considered in isolation or as a substitute for analysis of our results as reported under GAAP. Some of these limitations are:
· Adjusted Net Income and Adjusted Net Income Per Share do not reflect all cash expenditures, future requirements for capital expenditures or contractual commitments;
· Adjusted Net Income and Adjusted Net Income Per Share do not reflect changes in, or cash requirements for, working capital needs; and
· Other companies in the financial services industry may calculate Adjusted Net Income and Adjusted Net Income Per Share differently than we do, limiting its usefulness as a comparative measure.
In addition, Adjusted Net Income and Adjusted Net Income Per Share can differ significantly from company to company depending on strategic decisions regarding capital structure, the tax jurisdictions in which companies operate and capital investments. We compensate for these limitations by relying also on the GAAP results and use Adjusted Net Income and Adjusted Net Income Per Share as supplemental information.
Set forth below is a reconciliation of net loss to Adjusted Net Income and Adjusted Net Income Per Share for the three months ended March 31, 2018 and 2019:
|
|
|
Three Months Ended |
| ||||
|
|
|
March 31, |
| ||||
|
|
|
2018 |
|
2019 |
| ||
|
|
|
(In thousands, except share |
| ||||
|
Net loss |
|
$ |
(12,054 |
) |
$ |
(2,828 |
) |
|
Income tax expense (benefit) |
|
1,176 |
|
(1,221 |
) | ||
|
Amortization of debt financing costs |
|
959 |
|
782 |
| ||
|
Intangible amortization |
|
19,494 |
|
28,741 |
| ||
|
Non-cash equity compensation expense |
|
3,854 |
|
3,921 |
| ||
|
Non-cash changes in fair value of estimated contingent consideration |
|
6,371 |
|
7,414 |
| ||
|
Gain on sale of investment |
|
(5,509 |
) |
— |
| ||
|
Loss on extinguishment of borrowings |
|
14,011 |
|
— |
| ||
|
Management contract buyout |
|
— |
|
1,428 |
| ||
|
Other one-time transaction expenses (1) |
|
— |
|
1,066 |
| ||
|
Subtotal |
|
$ |
28,302 |
|
$ |
39,303 |
|
|
Pro forma income tax expense (27%) (2) |
|
(7,641 |
) |
(10,612 |
) | ||
|
Tax Adjustments (2) (3) |
|
4,795 |
|
7,023 |
| ||
|
Adjusted Net Income |
|
$ |
25,456 |
|
$ |
35,714 |
|
|
Adjusted Shares Outstanding (4) |
|
71,843,916 |
|
76,793,979 |
| ||
|
Adjusted Net Income Per Share |
|
$ |
0.35 |
|
$ |
0.47 |
|
|
|
|
|
|
|
| ||
|
Calculation of Adjusted Shares Outstanding: |
|
|
|
|
| ||
|
Weighted average shares of Class A common stock outstanding—basic (5) |
|
— |
|
46,211,599 |
| ||
|
Adjustments: |
|
|
|
|
| ||
|
Shares of Class A common stock issued in connection with the IPO and Reorganization Transactions (6) |
|
42,529,651 |
|
— |
| ||
|
Weighted average incremental shares of Class A common stock related to stock options and unvested Class A common stock (7) |
|
— |
|
7,855 |
| ||
|
Weighted average Focus LLC common units outstanding (8) |
|
22,499,665 |
|
22,783,692 |
| ||
|
Weighted average common unit equivalent of Focus LLC incentive units outstanding (9) |
|
6,814,600 |
|
7,790,833 |
| ||
|
Adjusted Shares Outstanding (4) |
|
71,843,916 |
|
76,793,979 |
| ||
(1) In Q1 2019, relates to one-time expenses related to (a) Loring Ward severance cash compensation of $280, which were recorded in compensation and related expenses and (b) transaction expenses of $786, which were recorded in selling, general and administrative expenses, associated with the acquisition of Loring Ward.
(2) For periods ended prior to the closing of the IPO and the consummation of the related reorganization transactions on July 30, 2018, these adjustments are being made for comparative purposes only.
(3) As of March 31, 2019, estimated tax adjustments from intangible asset related income tax benefits from closed acquisitions based on a pro forma 27% tax rate for the next 12 months is $29,157.
(4) For historical periods prior to the closing of the IPO and consummation of the related reorganization transactions on July 30, 2018, the Adjusted Shares Outstanding are deemed to be outstanding for comparative purposes only.
(5) Represents our GAAP weighted average Class A common stock outstanding—basic.
(6) The issuance of Class A common stock that occurred upon closing of the IPO and the consummation of related reorganization transactions on July 30, 2018 is assumed to have occurred as of January 1, 2018 for comparative purposes.
(7) The incremental shares for the three months ended March 31, 2019 related to stock options and unvested Class A common stock as calculated using the treasury stock method were not included in the calculation of the GAAP weighted average shares of Class A common stock—diluted as the result would have been anti-dilutive.
(8) Assumes that 100% of the Focus LLC common units were exchanged for Class A common stock.
(9) Assumes that 100% of the vested and unvested Focus LLC incentive units were converted into Focus LLC common units based on the closing price of our Class A common stock at the end of the respective period and such Focus LLC common units were exchanged for Class A common stock. For the periods ending prior to July 30, 2018, the conversion to Focus LLC common units was based on the $33.00 IPO price.
The following table provides supplemental information regarding the economic ownership of Focus Financial Partners, LLC, as of March 31, 2019:
|
|
|
As of March 31, 2019 |
| ||
|
Economic Ownership of Focus Financial Partners, LLC Interests: |
|
Interest |
|
% |
|
|
Focus Financial Partners Inc. (1) |
|
46,675,183 |
|
60.7 |
% |
|
Non-Controlling Interests (2) |
|
30,183,233 |
|
39.3 |
% |
|
Total |
|
76,858,416 |
|
100.0 |
% |
(1) Includes 118,169 unvested common units.
(2) Includes 7,614,402 Focus LLC common units issuable upon conversion of the outstanding 18,048,706 vested and unvested incentive units (assuming vesting of the unvested incentive units and a March 31, 2019 period end value of the Focus LLC common units equal to $35.64).
The following table provides supplemental information regarding the outstanding Focus LLC vested and unvested Incentive Units (“IUs”) at March 31, 2019. The vested IUs in future periods can be exchanged into shares of Class A common stock (after conversion into a number of Focus LLC common units that takes into account the then-current value of common units and such IUs aggregate hurdle amount), and therefore, the Company calculates the Class A common stock equivalent of such IUs for purposes of calculating Adjusted Net Income per Share. The period-end share price of the Company’s Class A common stock is used to calculate the intrinsic value of the outstanding units in order to calculate a common unit equivalent of the Focus LLC IUs.
Focus Financial Partners, LLC Incentive Units by Hurdle:
|
Hurdle |
|
Number |
| |
|
$ |
1.42 |
|
175,421 |
|
|
5.50 |
|
97,798 |
| |
|
6.00 |
|
56,702 |
| |
|
7.00 |
|
514,609 |
| |
|
9.00 |
|
2,081,799 |
| |
|
11.00 |
|
1,372,761 |
| |
|
12.00 |
|
520,000 |
| |
|
13.00 |
|
858,817 |
| |
|
14.00 |
|
56,205 |
| |
|
16.00 |
|
168,552 |
| |
|
17.00 |
|
80,000 |
| |
|
19.00 |
|
884,797 |
| |
|
21.00 |
|
3,975,500 |
| |
|
22.00 |
|
1,289,667 |
| |
|
23.00 |
|
524,828 |
| |
|
27.00 |
|
29,484 |
| |
|
28.50 |
|
1,646,766 |
| |
|
33.00 |
|
3,715,000 |
| |
|
|
|
18,048,706 |
| |
The following table provides supplemental information regarding the Company’s Class A and B common stock:
|
|
|
Q1 2019 |
|
Number of Shares |
|
Number of Shares |
|
|
Class A |
|
46,211,599 |
|
46,675,183 |
|
46,692,832 |
|
|
Class B |
|
22,783,692 |
|
22,568,831 |
|
22,568,831 |
|