UNITED STATES
SECURITIES AND EXCHANGE COMMISSION
Washington, D.C. 20549
SECURITIES AND EXCHANGE COMMISSION
Washington, D.C. 20549
FORM N-CSR
CERTIFIED SHAREHOLDER REPORT OF REGISTERED
MANAGEMENT INVESTMENT COMPANIES
Investment Company Act file number 811-23084
Series Portfolios Trust
(Exact name of registrant as specified in charter)
(Exact name of registrant as specified in charter)
615 East Michigan Street
Milwaukee, WI 53202
(Address of principal executive offices) (Zip code)
(Address of principal executive offices) (Zip code)
Ryan Roell, President
Series Portfolios Trust
c/o U.S. Bancorp Fund Services, LLC
777 East Wisconsin Ave, 6th Fl
Milwaukee, WI 53202
(Name and address of agent for service)
(Name and address of agent for service)
(414) 516-1709
Registrant's telephone number, including area code
Date of fiscal year end: October 31, 2023
Date of reporting period: October 31, 2023
Item 1. Report to Stockholders.
|
(a)
|
|
Weiss Alternative Multi-Strategy Fund
Class K – weisx
Investor Class – weizx
Annual Report
October 31, 2023
WEISS ALTERNATIVE MULTI-STRATEGY FUND
Dear Shareholders:
The Weiss Alternative Multi-Strategy Fund (the “Fund” or “WEISX”) was launched on December 1, 2015 in response to investors’ search for a daily liquid, actively managed, multi-alternative strategy. The
Fund seeks to provide returns with moderate volatility, lower drawdowns, and reduced correlation to the overall performance of bond and equity markets. The Fund employs a risk-controlled approach to liquid and diversified strategies. The Fund seeks
to generate its return from three sources:
|
(1)
|
Core Market Neutral: Employs approximately 20 industry-focused, differentiated strategies and aims to generate performance through security price dispersion instead of market direction.
|
|
|
(2)
|
Growth: A pro-cyclical strategy typically offering exposure to the US equity markets.
|
|
|
(3)
|
Defensive: Income-generating strategy created to provide high liquidity and capital preservation, typically offering exposure to US treasuries and corporate credit.
|
In the trailing 3-month period (Aug 01, 2023 – Oct 31, 2023), the Weiss Alternative Multi-Strategy Fund (WEISX) returned -6.37% net of fees while its benchmark, the Bloomberg US Corporate Bond Index
returned -5.23%. Overall portfolio annualized volatility for the trailing 3 months was 6.82%.
For the trailing 1-year, WEISX returned 1.2% net on 9.63% volatility. Over the same time-period, the Corporate Bond Index benchmark returned 2.77% on 7.82% volatility.
In the trailing 3-month period, The Core Market Neutral component of WEISX produced gross returns of 1.42%, the Growth Component returned -13.86% gross and Defensive finished with returns of -4.04%
gross. The current month end gross exposure weights across the three asset classes in the Fund are as follows: Growth Component 12.78%, Defensive Component 31.51% and the Core Market Neutral 55.71%.
WEISX illustrated its effort to minimize volatility and mitigate downside risk during periods of increased financial market instability. The Core Market Neutral strategy continued to contribute a return
stream with low levels of correlation to other asset classes which complemented the pro-cyclical Growth sleeve and the Defensive sleeve.
Sincerely,
/s/ Weiss Portfolio Managers
1
WEISS ALTERNATIVE MULTI-STRATEGY FUND
Performance data quoted represents past performance; past performance does not guarantee future results.
The Bloomberg U.S. Corporate Bond Index measures the investment grade, fixed-rate, taxable corporate bond market. It includes USD denominated securities publicly issued by U.S. and non-U.S. industrial,
utility and financial issuers.
Gross performance is shown for illustrative purposes only and does not reflect the fees and expenses of an investment in the Fund.
Volatility/Standard Deviation is defined as a quantity calculated to indicate the extent of deviation for a group as a whole.
Correlation is a statistical measure of the degree to which the movements of two variables (stock/option/convertible prices or returns) are related.
Opinions expressed are subject to change at any time, are not guaranteed and should not be considered investment advice.
Diversification does not assure a profit nor protect against loss in a declining market.
Mutual fund investing involves risk. Principal loss is possible. Derivatives involve special risks including correlation, counterparty, liquidity, operational,
accounting and tax risks. These risks, in certain cases, may be greater than the risks presented by more traditional investments. The Fund may also use options and future contracts, which have the risks of unlimited losses of the underlying holdings
due to unanticipated market movements and failure to correctly predict the direction of securities prices, interest rates and currency exchange rates. The investment in options is not suitable for all investors. The Fund invests in foreign securities
which involve greater volatility and political, economic and currency risks and differences in accounting methods. These risks are greater in emerging markets. Investment by the Fund in lower-rated and non-rated securities presents a greater risk of
loss to principal and interest than higher-rated securities. The Fund may use leverage which may exaggerate the effect of any increase or decrease in the value of portfolio securities or the Net Asset Value (“NAV”) of the Fund, and money borrowed
will be subject to interest costs. Small- and Medium-capitalization companies tend to have limited liquidity and greater price volatility than large-capitalization companies. Investing in ETFs are subject to additional risks that do not apply to
conventional mutual funds, including the risks that the market price of the shares may trade at a discount to its NAV, an active secondary trading market may not develop or be maintained, or trading may be halted by the exchange in which they trade,
which may impact the Fund’s ability to sell its shares. The Fund may make short sales of securities, which involves the risk that losses may exceed the original amount invested.
Must be preceded or accompanied by a prospectus.
The Weiss Alternative Multi-Strategy Fund is distributed by Quasar Distributors, LLC.
2
WEISS ALTERNATIVE MULTI-STRATEGY FUND
Value of $20,000 Investment (Unaudited)
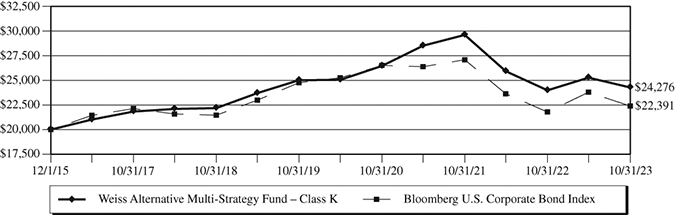
The chart assumes an initial investment of $20,000. Performance reflects waivers of fees and operating expenses in effect. In the absence of such waivers, total return would be
reduced. Past performance is not predictive of future performance. Investment return and principal value will fluctuate, so that your shares, when redeemed, may be worth more or less than their original cost. Performance assumes the reinvestment of
capital gains and income distributions. The performance does not reflect the deduction of taxes that a shareholder would pay on Fund distributions or the redemption of Fund shares. Current performance of the Fund may be lower or higher than the
performance quoted. Performance data current to the most recent month end may be obtained by visiting www.weissfunds.com or calling 1-866-530-2690.
Rates of Return (%) – As of October 31, 2023
|
One Year
|
Five Year
|
Since Inception(1)(2)
|
|
|
Class K
|
1.20%
|
1.82%
|
2.48%
|
|
Bloomberg U.S. Corporate Bond Index(3)
|
2.77%
|
0.85%
|
1.44%
|
|
Investor Class
|
0.85%
|
1.46%
|
1.95%
|
|
Bloomberg U.S. Corporate Bond Index(3)
|
2.77%
|
0.85%
|
0.78%
|
|
(1)
|
Inception Date of Class K was December 1, 2015.
|
|
(2)
|
Inception Date of Investor Class was February 28, 2017.
|
|
(3)
|
The Bloomberg Barclays U.S. Corporate Bond Index measures the investment grade, fixed-rate, taxable corporate bond market. It includes USD-denominated securities publicly issued by U.S. and
non-U.S. industrial, utility and financial issuers. The securities that comprise the Bloomberg U.S. Corporate Bond Index may differ substantially from the securities in the Fund’s portfolio. It is not possible to directly invest in an index.
|
The returns reflect the actual performance for each period and do not include the impact of trades executed on the last business day of the period that were recorded on the first
business day of the next period.
3
WEISS ALTERNATIVE MULTI-STRATEGY FUND
The Fund’s Class K gross expense ratio is 3.14% and the net expense ratio is 2.84%. The Fund’s Investor Class gross expense ratio is 3.49% and the net expense ratio is 3.19% (as of the most recent
prospectus dated February 28, 2023). The expense ratios stated here may differ from that of the expense ratios provided in the Fund’s financial highlights herewithin due to the timing of financial information and the inclusion of acquired fund fees
and expenses (“AFFE”) in the prospectus only. The Fund’s investment advisor has contractually agreed to waive a portion or all of its management fees and reimburse Fund expenses (excluding Rule 12b-1 fees, shareholder servicing fees, acquired fund
fees and expenses, front-end or contingent deferred sales loads, swap fees and expenses, dividends and interest on short positions, taxes, leverage interest, brokerage fees (including commissions, mark-ups and mark-downs), annual account fees for
margin accounts, expenses incurred in connection with any merger or reorganization, or extraordinary expenses such as litigation) in order to limit the Total Annual Fund Operating Expenses to 1.50% of the average daily net assets of the Fund or by
the Fund’s investment advisor through at least February 28, 2024. The advisor may request recoupment of previously waived fees and reimbursed expenses from the Fund for three years from the date they were waived or reimbursed, provided that after
payment of the recoupment, the Total Annual Fund Operating Expenses do not exceed the lesser of the Expense Cap: (i) in effect at the time of the waiver or reimbursement; or (ii) in effect at the time of recoupment.
4
WEISS ALTERNATIVE MULTI-STRATEGY FUND
Expense Example (Unaudited)
October 31, 2023
As a shareholder of the Fund, you incur two types of costs: (1) transaction costs, and (2) ongoing costs, including management fees and other Fund specific expenses. The expense example is intended to
help the shareholder understand ongoing costs (in dollars) of investing in the Fund and to compare these costs with the ongoing costs of investing in other mutual funds. The example is based on an investment of $1,000 invested at the beginning of the
period and held for the most recent six-month period.
The Actual Expenses comparison provides information about actual account values and actual expenses. A shareholder may use the information in this line, together with the amount invested, to estimate
the expenses paid over the period. A shareholder may divide his/her account value by $1,000 (e.g., an $8,600 account value divided by $1,000 = 8.6), then multiply the result by the number in the first line under the heading entitled “Expenses Paid
During Period” to estimate the expenses paid on his/her account during this period.
The Hypothetical Example for Comparison Purposes provides information about hypothetical account values and hypothetical expenses based on each Fund’s actual expense ratio and an assumed rate of return
of 5% per year before expenses, which is not the Fund’s actual return. The hypothetical account values and expenses may not be used to estimate the actual ending account balance or expenses paid for the period. A shareholder may use this information
to compare the ongoing costs of investing in the Fund and other funds. To do so, a shareholder would compare this 5% hypothetical example with the 5% hypothetical examples that appear in the shareholder reports of other funds.
The expenses shown in the table are meant to highlight your ongoing costs only and do not reflect any transactional costs, such as sales charges (loads), redemptions fees or exchange fees. Therefore,
the Hypothetical Example for Comparisons Purposes is useful in comparing ongoing costs only and will not help to determine the relevant total costs of owning different funds. In addition, if these transactional costs were included, shareholder costs
would have been higher.
|
Expenses Paid
|
||||
|
Annualized Net
|
Beginning
|
Ending
|
During Period(1)
|
|
|
Expense Ratio
|
Account Value
|
Account Value
|
(05/01/2023 to
|
|
|
(10/31/2023)
|
(05/01/2023)
|
(10/31/2023)
|
10/31/2023)
|
|
|
Class K Actual(2)(3)
|
3.70%
|
$1,000.00
|
$ 960.50
|
$18.28
|
|
Class K Hypothetical
|
||||
|
(5% annual return before expenses)(4)
|
3.70%
|
$1,000.00
|
$1,006.55
|
$18.71
|
|
Investor Class Actual(2)(3)
|
4.05%
|
$1,000.00
|
$ 959.70
|
$20.01
|
|
Investor Class Hypothetical
|
||||
|
(5% annual return before expenses)(4)
|
4.05%
|
$1,000.00
|
$1,004.79
|
$20.47
|
|
(1)
|
Expenses are equal to the Fund’s annualized expense ratio for the period multiplied by the average account value over the period, multiplied by 184/365 to reflect its six-month period.
|
|
(2)
|
Based on the actual returns for the period from May 1, 2023 through October 31, 2023, of -3.95% and -4.03% for Class K and Investor Class, respectively.
|
|
(3)
|
Excluding dividends on short positions and borrowing expense, your actual cost of investing in Class K and Investor Class would be $7.41 and $9.14, respectively.
|
|
(4)
|
Excluding dividends on short positions and borrowing expense, your hypothetical cost of investing in Class K and Investor Class would be $7.63 and $9.40, respectively.
|
5
WEISS ALTERNATIVE MULTI-STRATEGY FUND
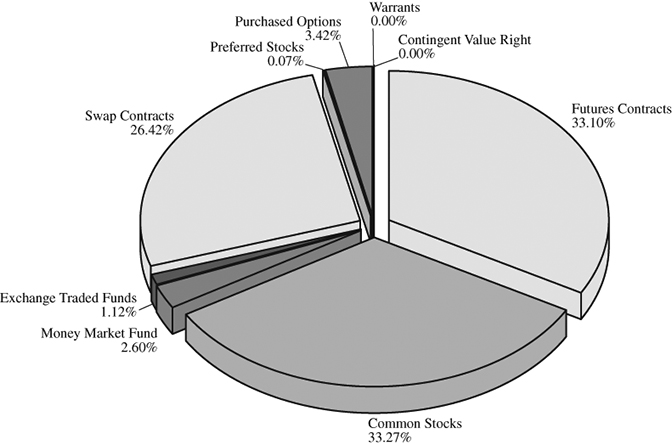
Allocation of Portfolio (Unaudited)
October 31, 2023
LONG INVESTMENTS(1)(2)
|
(1)
|
Data expressed as a percentage of common stocks, exchange traded funds, warrants, purchased options, money market fund, long swap contracts, and long futures contracts as of October 31, 2023.
Data expressed excludes securities sold short, written options, short swap contracts, short futures contracts and other assets in excess of liabilities. Please refer to the Schedule of Investments, Schedule of Written Options, Schedule of
Open Swap Contracts, and Schedule of Open Futures Contracts for more details on the Fund’s individual holdings.
|
|
(2)
|
The value of option, swap and futures contracts are expressed as notional and not market value.
|
6
WEISS ALTERNATIVE MULTI-STRATEGY FUND
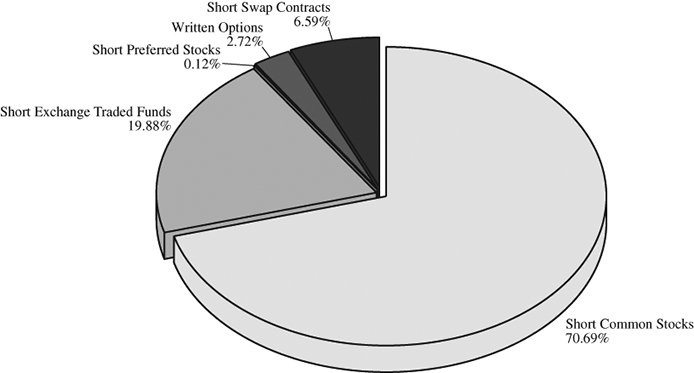
Allocation of Portfolio (Unaudited)
October 31, 2023
SHORT INVESTMENTS(3)(4)
|
(3)
|
Data expressed as a percentage of short common stocks, short exchange traded funds, written options, short preferred stocks and short swap contracts, as of October 31, 2023. Data expressed
excludes long investments, long swap contracts, long futures contracts and other assets in excess of liabilities. Please refer to the Schedule of Investments, Schedule of Written Options, Schedule of Open Swap Contracts and Schedule of Open
Futures Contracts for more details on the Fund’s individual holdings.
|
|
(4)
|
The value of option and swap contracts are expressed as notional and not market value.
|
7
WEISS ALTERNATIVE MULTI-STRATEGY FUND
Schedule of Investments
October 31, 2023
|
Shares
|
Value
|
|||||||
|
COMMON STOCKS – 54.03%
|
||||||||
|
Aerospace & Defense – 0.38%
|
||||||||
|
Boeing Co. (a)
|
1,745
|
$
|
326,001
|
|||||
|
HEICO Corp. – Class A
|
586
|
74,498
|
||||||
|
L3Harris Technologies, Inc.
|
1,113
|
199,683
|
||||||
|
Lockheed Martin Corp.
|
306
|
139,120
|
||||||
|
TransDigm Group, Inc. (a)
|
97
|
80,325
|
||||||
|
819,627
|
||||||||
|
Air Freight & Logistics – 0.55%
|
||||||||
|
C.H. Robinson Worldwide, Inc.
|
129
|
10,556
|
||||||
|
DSV A/S (b)
|
1,499
|
224,012
|
||||||
|
FedEx Corp.
|
1,813
|
435,302
|
||||||
|
Forward Air Corp.
|
1,999
|
128,756
|
||||||
|
GXO Logistics, Inc. (a)
|
6,819
|
344,428
|
||||||
|
United Parcel Service, Inc. – Class B
|
360
|
50,850
|
||||||
|
1,193,904
|
||||||||
|
Automobile Components – 0.14%
|
||||||||
|
Autoliv, Inc.
|
2,290
|
209,879
|
||||||
|
Goodyear Tire & Rubber Co. (a)
|
8,126
|
96,699
|
||||||
|
306,578
|
||||||||
|
Banks – 2.39%
|
||||||||
|
Banc of California, Inc.
|
25,051
|
280,822
|
||||||
|
Bank of America Corp.
|
22,462
|
591,650
|
||||||
|
Bank OZK
|
1,276
|
45,694
|
||||||
|
Banner Corp.
|
3,439
|
145,160
|
||||||
|
Citizens Financial Group, Inc.
|
12,219
|
286,291
|
||||||
|
Columbia Banking System, Inc.
|
7,450
|
146,541
|
||||||
|
Comerica, Inc.
|
2,430
|
95,742
|
||||||
|
ConnectOne Bancorp, Inc.
|
1,991
|
32,433
|
||||||
|
East West Bancorp, Inc.
|
1,755
|
94,103
|
||||||
|
Fifth Third Bancorp
|
7,946
|
188,400
|
||||||
|
First BanCorp (b)
|
4,741
|
63,292
|
||||||
|
First Citizens BancShares, Inc. – Class A
|
254
|
350,708
|
||||||
|
First Horizon Corp.
|
3,149
|
33,852
|
||||||
|
Independent Bank Group, Inc.
|
1,484
|
52,459
|
||||||
|
Pacific Premier Bancorp, Inc.
|
6,007
|
114,133
|
||||||
|
Pinnacle Financial Partners, Inc.
|
2,218
|
138,314
|
||||||
|
Popular, Inc. (b)
|
1,055
|
68,618
|
||||||
|
Regions Financial Corp.
|
9,482
|
137,773
|
||||||
|
Truist Financial Corp.
|
28,361
|
804,319
|
||||||
The accompanying notes are an integral part of these financial statements.
8
WEISS ALTERNATIVE MULTI-STRATEGY FUND
Schedule of Investments – Continued
October 31, 2023
|
Shares
|
Value
|
|||||||
|
Banks – 2.39% (Continued)
|
||||||||
|
UniCredit SpA (b)
|
10,434
|
$
|
261,576
|
|||||
|
Valley National Bancorp
|
40,043
|
311,535
|
||||||
|
Webster Financial Corp.
|
8,942
|
339,528
|
||||||
|
Wells Fargo & Co.
|
4,898
|
194,793
|
||||||
|
Western Alliance Bancorp
|
6,031
|
247,874
|
||||||
|
Wintrust Financial Corp.
|
2,447
|
182,766
|
||||||
|
5,208,376
|
||||||||
|
Beverages – 0.98%
|
||||||||
|
Coca-Cola Co.
|
6,604
|
373,060
|
||||||
|
Coca-Cola Europacific Partners plc (b)
|
9,312
|
544,845
|
||||||
|
Keurig Dr. Pepper, Inc. (c)
|
37,731
|
1,144,381
|
||||||
|
Molson Coors Brewing Co. – Class B
|
1,260
|
72,790
|
||||||
|
2,135,076
|
||||||||
|
Biotechnology – 0.99%
|
||||||||
|
89bio, Inc. (a)
|
2,364
|
17,494
|
||||||
|
AbbVie, Inc.
|
134
|
18,918
|
||||||
|
Alnylam Pharmaceuticals, Inc. (a)
|
31
|
4,706
|
||||||
|
Argenx S.E. – ADR (a)(b)
|
457
|
214,594
|
||||||
|
Biogen, Inc. (a)
|
1,101
|
261,531
|
||||||
|
Biohaven Ltd. (a)
|
918
|
24,336
|
||||||
|
BioMarin Pharmaceutical, Inc. (a)
|
49
|
3,991
|
||||||
|
Cytokinetics, Inc. (a)
|
1,583
|
55,183
|
||||||
|
Dynavax Technologies Corp. (a)
|
671
|
9,535
|
||||||
|
Exact Sciences Corp. (a)
|
639
|
39,356
|
||||||
|
Exelixis, Inc. (a)
|
1,997
|
41,118
|
||||||
|
Heron Therapeutics, Inc. (a)
|
3,943
|
2,511
|
||||||
|
Immunovant, Inc. (a)
|
3,108
|
102,719
|
||||||
|
Incyte Corp. (a)
|
376
|
20,278
|
||||||
|
Insmed, Inc. (a)
|
843
|
21,126
|
||||||
|
Karuna Therapeutics, Inc. (a)
|
320
|
53,315
|
||||||
|
Karyopharm Therapeutics, Inc. (a)
|
976
|
849
|
||||||
|
Madrigal Pharmaceuticals, Inc. (a)
|
584
|
76,726
|
||||||
|
Merus N.V. (a)(b)
|
384
|
7,722
|
||||||
|
MoonLake Immunotherapeutics (a)(b)
|
1,129
|
58,493
|
||||||
|
Morphic Holding, Inc. (a)
|
2,665
|
53,167
|
||||||
|
Natera, Inc. (a)
|
3,227
|
127,370
|
||||||
|
Point Biopharma Global, Inc. (a)
|
11,207
|
141,881
|
||||||
|
Regeneron Pharmaceuticals, Inc. (a)
|
18
|
14,038
|
||||||
|
Rigel Pharmaceuticals, Inc. (a)
|
3,654
|
2,950
|
||||||
|
Roivant Sciences Ltd. (a)
|
9,308
|
80,421
|
||||||
The accompanying notes are an integral part of these financial statements.
9
WEISS ALTERNATIVE MULTI-STRATEGY FUND
Schedule of Investments – Continued
October 31, 2023
|
Shares
|
Value
|
|||||||
|
Biotechnology – 0.99% (Continued)
|
||||||||
|
Sage Therapeutics, Inc. (a)
|
86
|
$
|
1,611
|
|||||
|
Sarepta Therapeutics, Inc. (a)
|
921
|
61,993
|
||||||
|
TG Therapeutics, Inc. (a)
|
1,299
|
10,041
|
||||||
|
United Therapeutics Corp. (a)
|
158
|
35,212
|
||||||
|
Vera Therapeutics, Inc. (a)
|
1,386
|
14,442
|
||||||
|
Vertex Pharmaceuticals, Inc. (a)
|
1,316
|
476,536
|
||||||
|
Viking Therapeutics, Inc. (a)
|
5,195
|
50,963
|
||||||
|
Viridian Therapeutics, Inc. (a)
|
3,210
|
40,125
|
||||||
|
Xenon Pharmaceuticals, Inc. (a)(b)
|
34
|
1,054
|
||||||
|
2,146,305
|
||||||||
|
Broadline Retail – 0.69%
|
||||||||
|
Alibaba Group Holding Ltd. – ADR (a)(b)
|
371
|
30,622
|
||||||
|
Amazon.com, Inc. (a)(d)
|
10,884
|
1,448,551
|
||||||
|
Savers Value Village, Inc. (a)
|
1,127
|
16,871
|
||||||
|
1,496,044
|
||||||||
|
Building Products – 0.16%
|
||||||||
|
Armstrong World Industries, Inc.
|
856
|
64,962
|
||||||
|
Carlisle Cos., Inc.
|
192
|
48,785
|
||||||
|
Johnson Controls International plc (b)
|
638
|
31,275
|
||||||
|
Masco Corp.
|
1,659
|
86,417
|
||||||
|
Owens Corning
|
732
|
82,987
|
||||||
|
Trane Technologies plc (b)
|
125
|
23,789
|
||||||
|
338,215
|
||||||||
|
Capital Markets – 2.95%
|
||||||||
|
Affiliated Managers Group, Inc.
|
2,169
|
266,266
|
||||||
|
Allfunds Group plc (b)
|
11,454
|
58,623
|
||||||
|
AllianceBernstein Holding LP
|
31,137
|
894,566
|
||||||
|
Bank of New York Mellon Corp.
|
11,330
|
481,525
|
||||||
|
BGC Group, Inc.
|
109,595
|
643,324
|
||||||
|
Blue Owl Capital, Inc. – Class A
|
7,953
|
98,060
|
||||||
|
Brightsphere Investment Group, Inc.
|
5,847
|
91,564
|
||||||
|
Brookfield Asset Management Ltd. – Class A (b)
|
4,336
|
124,313
|
||||||
|
CBOE Holdings, Inc.
|
1,079
|
176,837
|
||||||
|
Charles Schwab Corp.
|
4,397
|
228,820
|
||||||
|
EQT AB (b)
|
4,160
|
76,002
|
||||||
|
Federated Hermes, Inc.
|
6,888
|
218,350
|
||||||
|
Franklin Resources, Inc.
|
4,293
|
97,837
|
||||||
|
Goldman Sachs Group, Inc.
|
1,102
|
334,578
|
||||||
|
Interactive Brokers Group, Inc. – Class A
|
1,788
|
143,165
|
||||||
The accompanying notes are an integral part of these financial statements.
10
WEISS ALTERNATIVE MULTI-STRATEGY FUND
Schedule of Investments – Continued
October 31, 2023
|
Shares
|
Value
|
|||||||
|
Capital Markets – 2.95% (Continued)
|
||||||||
|
Intercontinental Exchange, Inc.
|
510
|
$
|
54,794
|
|||||
|
KKR & Co., Inc.
|
8,409
|
465,859
|
||||||
|
Lazard Ltd. – Class A
|
35,430
|
983,891
|
||||||
|
LPL Financial Holdings, Inc.
|
1,851
|
415,587
|
||||||
|
Nasdaq, Inc.
|
4,770
|
236,592
|
||||||
|
Tradeweb Markets, Inc. – Class A
|
2,153
|
193,792
|
||||||
|
Virtu Financial, Inc. – Class A
|
2,632
|
48,666
|
||||||
|
Virtus Investment Partners, Inc.
|
405
|
74,613
|
||||||
|
6,407,624
|
||||||||
|
Chemicals – 0.65%
|
||||||||
|
Ashland, Inc.
|
3,989
|
305,676
|
||||||
|
Chemours Co.
|
14,918
|
359,672
|
||||||
|
HB Fuller Co.
|
957
|
63,306
|
||||||
|
PureCycle Technologies, Inc. (a)(d)
|
66,548
|
296,139
|
||||||
|
RPM International, Inc.
|
869
|
79,314
|
||||||
|
Sherwin-Williams Co.
|
455
|
108,386
|
||||||
|
Tronox Holdings plc (b)
|
18,203
|
194,590
|
||||||
|
1,407,083
|
||||||||
|
Commercial Services & Supplies – 0.02%
|
||||||||
|
GEO Group, Inc. (a)
|
4,134
|
36,131
|
||||||
|
Communications Equipment – 0.78%
|
||||||||
|
ADTRAN Holdings, Inc.
|
41,705
|
274,002
|
||||||
|
Calix, Inc. (a)
|
10,335
|
342,295
|
||||||
|
Ciena Corp. (a)
|
10,335
|
436,137
|
||||||
|
Cisco Systems, Inc.
|
2,392
|
124,695
|
||||||
|
CommScope Holding Co., Inc. (a)
|
270,861
|
400,874
|
||||||
|
Lumentum Holdings, Inc. (a)
|
3,190
|
125,080
|
||||||
|
1,703,083
|
||||||||
|
Construction & Engineering – 0.25%
|
||||||||
|
Dycom Industries, Inc. (a)
|
6,377
|
543,193
|
||||||
|
Construction Materials – 0.10%
|
||||||||
|
CRH plc (b)
|
2,723
|
145,871
|
||||||
|
Vulcan Materials Co.
|
351
|
68,968
|
||||||
|
214,839
|
||||||||
|
Consumer Finance – 0.27%
|
||||||||
|
Ally Financial, Inc.
|
8,661
|
209,510
|
||||||
|
Capital One Financial Corp.
|
1,272
|
128,841
|
||||||
The accompanying notes are an integral part of these financial statements.
11
WEISS ALTERNATIVE MULTI-STRATEGY FUND
Schedule of Investments – Continued
October 31, 2023
|
Shares
|
Value
|
|||||||
|
Consumer Finance – 0.27% (Continued)
|
||||||||
|
FirstCash Holdings, Inc.
|
1,757
|
$
|
191,372
|
|||||
|
OneMain Holdings, Inc.
|
1,366
|
49,080
|
||||||
|
578,803
|
||||||||
|
Consumer Staples Distribution & Retail – 0.71%
|
||||||||
|
BJ’s Wholesale Club Holdings, Inc. (a)
|
2,321
|
158,107
|
||||||
|
Casey’s General Stores, Inc.
|
888
|
241,456
|
||||||
|
Dollar Tree, Inc. (a)
|
177
|
19,663
|
||||||
|
Maplebear, Inc. (a)
|
1,590
|
39,162
|
||||||
|
Sysco Corp.
|
3,151
|
209,510
|
||||||
|
Target Corp.
|
797
|
88,300
|
||||||
|
Walgreens Boots Alliance, Inc.
|
32
|
675
|
||||||
|
Wal-Mart Stores, Inc.
|
4,860
|
794,172
|
||||||
|
1,551,045
|
||||||||
|
Containers & Packaging – 0.07%
|
||||||||
|
Crown Holdings, Inc.
|
1,755
|
141,453
|
||||||
|
Distributors – 0.04%
|
||||||||
|
Pool Corp.
|
300
|
94,731
|
||||||
|
Diversified Consumer Services – 0.01%
|
||||||||
|
WW International, Inc. (a)(d)
|
2,207
|
17,259
|
||||||
|
Diversified REITs – 0.55%
|
||||||||
|
Essential Properties Realty Trust, Inc.
|
54,159
|
1,188,790
|
||||||
|
Diversified Telecommunication Services – 0.19%
|
||||||||
|
AT&T, Inc.
|
26,998
|
415,769
|
||||||
|
Electric Utilities – 0.04%
|
||||||||
|
Kansai Electric Power Co., Inc. (b)
|
6,380
|
81,689
|
||||||
|
Electrical Equipment – 0.47%
|
||||||||
|
Acuity Brands, Inc.
|
277
|
44,866
|
||||||
|
AMETEK, Inc.
|
407
|
57,293
|
||||||
|
Emerson Electric Co.
|
1,243
|
110,590
|
||||||
|
Enovix Corp. (a)
|
21,303
|
189,810
|
||||||
|
Eos Energy Enterprises, Inc. (a)
|
7,026
|
12,366
|
||||||
|
FREYR Battery S.A. (a)(b)
|
3,150
|
10,112
|
||||||
|
nVent Electric plc (b)
|
3,641
|
175,241
|
||||||
The accompanying notes are an integral part of these financial statements.
12
WEISS ALTERNATIVE MULTI-STRATEGY FUND
Schedule of Investments – Continued
October 31, 2023
|
Shares
|
Value
|
|||||||
|
Electrical Equipment – 0.47% (Continued)
|
||||||||
|
Regal Rexnord Corp.
|
318
|
$
|
37,654
|
|||||
|
Vertiv Holdings Co.
|
9,872
|
387,672
|
||||||
|
1,025,604
|
||||||||
|
Electronic Equipment, Instruments & Components – 0.10%
|
||||||||
|
Coherent Corp. (a)
|
5,583
|
165,257
|
||||||
|
Zebra Technologies Corp. – Class A (a)
|
259
|
54,242
|
||||||
|
219,499
|
||||||||
|
Energy Equipment & Services – 1.22%
|
||||||||
|
Archrock, Inc.
|
207
|
2,623
|
||||||
|
Baker Hughes Co.
|
7,916
|
272,468
|
||||||
|
Borr Drilling Ltd. (a)(b)
|
415
|
2,544
|
||||||
|
Bristow Group, Inc. (a)
|
99
|
2,588
|
||||||
|
Cactus, Inc.
|
55
|
2,582
|
||||||
|
ChampionX Corp.
|
4,104
|
126,403
|
||||||
|
Core Laboratories, Inc.
|
116
|
2,485
|
||||||
|
Diamond Offshore Drilling, Inc. (a)
|
7,371
|
91,474
|
||||||
|
Dril-Quip, Inc. (a)
|
968
|
20,967
|
||||||
|
Expro Group Holdings N.V. (a)(b)
|
10,386
|
163,580
|
||||||
|
Halliburton Co.
|
1,887
|
74,235
|
||||||
|
Helix Energy Solutions Group, Inc. (a)
|
12,027
|
117,865
|
||||||
|
Helmerich & Payne, Inc.
|
65
|
2,572
|
||||||
|
Liberty Energy, Inc.
|
131
|
2,581
|
||||||
|
Newpark Resources, Inc. (a)
|
380
|
2,630
|
||||||
|
Noble Corp. plc (b)
|
2,379
|
111,076
|
||||||
|
North American Construction Group Ltd. (b)
|
128
|
2,638
|
||||||
|
NOV, Inc.
|
21,208
|
423,311
|
||||||
|
Oceaneering International, Inc. (a)
|
17,738
|
390,058
|
||||||
|
Oil States International, Inc. (a)
|
357
|
2,592
|
||||||
|
Patterson-UTI Energy, Inc.
|
1,792
|
22,758
|
||||||
|
Precision Drilling Corp. (a)(b)
|
398
|
23,104
|
||||||
|
ProPetro Holding Corp. (a)
|
248
|
2,599
|
||||||
|
Schlumberger N.V. Ltd. (b)
|
4,603
|
256,203
|
||||||
|
SEACOR Marine Holdings, Inc. (a)
|
194
|
2,689
|
||||||
|
Seadrill Ltd. (a)(b)
|
66
|
2,608
|
||||||
|
Select Water Solutions, Inc.
|
3,255
|
24,217
|
||||||
|
TechnipFMC plc (b)
|
5,923
|
127,463
|
||||||
|
TETRA Technologies, Inc. (a)
|
4,120
|
19,529
|
||||||
|
Tidewater, Inc. (a)
|
38
|
2,597
|
||||||
|
Transocean Ltd. (a)(b)
|
386
|
2,555
|
||||||
|
U.S. Silica Holdings, Inc. (a)
|
209
|
2,523
|
||||||
The accompanying notes are an integral part of these financial statements.
13
WEISS ALTERNATIVE MULTI-STRATEGY FUND
Schedule of Investments – Continued
October 31, 2023
|
Shares
|
Value
|
|||||||
|
Energy Equipment & Services – 1.22% (Continued)
|
||||||||
|
Valaris Ltd. (a)(b)
|
2,748
|
$
|
181,478
|
|||||
|
Weatherford International plc (a)(b)
|
1,998
|
185,994
|
||||||
|
2,673,589
|
||||||||
|
Entertainment – 0.70%
|
||||||||
|
AMC Entertainment Holdings, Inc. – Class A (a)
|
507
|
5,415
|
||||||
|
Cinemark Holdings, Inc. (a)
|
7,053
|
116,304
|
||||||
|
Cineplex, Inc. (a)(b)
|
5,540
|
33,318
|
||||||
|
Endeavor Group Holdings, Inc. – Class A (d)
|
8,338
|
189,773
|
||||||
|
Liberty Media Corp.-Liberty Formula One – Class C (a)
|
1,386
|
89,660
|
||||||
|
Live Nation Entertainment, Inc. (a)
|
1,467
|
117,389
|
||||||
|
Take-Two Interactive Software, Inc. (a)
|
6,010
|
803,838
|
||||||
|
The Madison Square Garden Co. (a)
|
53
|
8,911
|
||||||
|
TKO Group Holdings, Inc.
|
1,048
|
85,915
|
||||||
|
Warner Music Group Corp. – Class A
|
2,550
|
79,815
|
||||||
|
1,530,338
|
||||||||
|
Financial Services – 0.90%
|
||||||||
|
Apollo Global Management, Inc.
|
5,272
|
408,265
|
||||||
|
AvidXchange Holdings, Inc. (a)
|
7,841
|
67,746
|
||||||
|
Corebridge Financial, Inc.
|
1,889
|
37,780
|
||||||
|
Equitable Holdings, Inc.
|
2,170
|
57,657
|
||||||
|
Flywire Corp. (a)
|
2,233
|
60,045
|
||||||
|
Global Payments, Inc.
|
2,606
|
276,809
|
||||||
|
I3 Verticals, Inc. – Class A (a)
|
4,799
|
89,981
|
||||||
|
Jackson Financial, Inc. – Class A
|
1,664
|
61,085
|
||||||
|
Mr. Cooper Group, Inc. (a)
|
6,714
|
379,543
|
||||||
|
Payoneer Global, Inc. (a)
|
8,967
|
51,919
|
||||||
|
PennyMac Financial Services, Inc.
|
2,782
|
186,950
|
||||||
|
Repay Holdings Corp. (a)
|
3,804
|
22,786
|
||||||
|
Shift4 Payments, Inc. – Class A (a)
|
3,829
|
170,467
|
||||||
|
WEX, Inc. (a)
|
542
|
90,232
|
||||||
|
1,961,265
|
||||||||
|
Food Products – 1.28%
|
||||||||
|
Cal-Maine Foods, Inc.
|
5,635
|
255,322
|
||||||
|
Campbell Soup Co.
|
2,752
|
111,208
|
||||||
|
Freshpet, Inc. (a)
|
485
|
27,839
|
||||||
|
Kraft Heinz Co.
|
1,782
|
56,062
|
||||||
|
Lamb Weston Holdings, Inc.
|
6,672
|
599,146
|
||||||
|
Mondelez International, Inc. – Class A
|
7,513
|
497,436
|
||||||
|
Pilgrim’s Pride Corp. (a)
|
34,415
|
877,582
|
||||||
The accompanying notes are an integral part of these financial statements.
14
WEISS ALTERNATIVE MULTI-STRATEGY FUND
Schedule of Investments – Continued
October 31, 2023
|
Shares
|
Value
|
|||||||
|
Food Products – 1.28% (Continued)
|
||||||||
|
Post Holdings, Inc. (a)
|
4,006
|
$
|
321,602
|
|||||
|
Utz Brands, Inc.
|
4,134
|
50,393
|
||||||
|
2,796,590
|
||||||||
|
Ground Transportation – 1.01%
|
||||||||
|
Canadian National Railway Co. (b)
|
96
|
10,155
|
||||||
|
Canadian Pacific Kansas City Ltd. (b)
|
765
|
54,292
|
||||||
|
CSX Corp.
|
1,973
|
58,894
|
||||||
|
Heartland Express, Inc.
|
993
|
11,578
|
||||||
|
J.B. Hunt Transport Services, Inc.
|
287
|
49,327
|
||||||
|
Knight-Swift Transportation Holdings, Inc.
|
3,853
|
188,373
|
||||||
|
Norfolk Southern Corp.
|
287
|
54,757
|
||||||
|
Saia, Inc. (a)
|
105
|
37,641
|
||||||
|
TFI International, Inc. (b)
|
595
|
65,819
|
||||||
|
Uber Technologies, Inc. (a)(d)
|
3,361
|
145,464
|
||||||
|
Union Pacific Corp.
|
2,985
|
619,716
|
||||||
|
Werner Enterprises, Inc.
|
518
|
18,814
|
||||||
|
XPO Logistics, Inc. (a)
|
11,368
|
861,807
|
||||||
|
2,176,637
|
||||||||
|
Health Care Equipment & Supplies – 1.06%
|
||||||||
|
Abbott Laboratories
|
2,129
|
201,297
|
||||||
|
Boston Scientific Corp. (a)
|
10,751
|
550,343
|
||||||
|
CVRx, Inc. (a)
|
359
|
4,803
|
||||||
|
DexCom, Inc. (a)(d)
|
2,789
|
247,746
|
||||||
|
Edwards Lifesciences Corp. (a)
|
664
|
42,310
|
||||||
|
Enovis Corp. (a)
|
5,243
|
240,653
|
||||||
|
Globus Medical, Inc. – Class A (a)
|
4,105
|
187,640
|
||||||
|
Haemonetics Corp. (a)
|
963
|
82,076
|
||||||
|
IDEXX Laboratories, Inc. (a)
|
4
|
1,598
|
||||||
|
Inari Medical, Inc. (a)
|
1,008
|
61,196
|
||||||
|
Inspire Medical Systems, Inc. (a)
|
112
|
16,482
|
||||||
|
Intuitive Surgical, Inc. (a)
|
117
|
30,680
|
||||||
|
iRhythm Technologies, Inc. (a)
|
96
|
7,538
|
||||||
|
Masimo Corp. (a)
|
305
|
24,745
|
||||||
|
Medtronic plc (b)
|
60
|
4,234
|
||||||
|
Penumbra, Inc. (a)
|
510
|
97,487
|
||||||
|
RxSight, Inc. (a)
|
297
|
6,576
|
||||||
|
Shockwave Medical, Inc. (a)
|
36
|
7,425
|
||||||
|
Silk Road Medical, Inc. (a)
|
258
|
1,938
|
||||||
|
STAAR Surgical Co. (a)
|
83
|
3,471
|
||||||
|
Stryker Corp.
|
885
|
239,145
|
||||||
The accompanying notes are an integral part of these financial statements.
15
WEISS ALTERNATIVE MULTI-STRATEGY FUND
Schedule of Investments – Continued
October 31, 2023
|
Shares
|
Value
|
|||||||
|
Health Care Equipment & Supplies – 1.06% (Continued)
|
||||||||
|
Tandem Diabetes Care, Inc. (a)
|
944
|
$
|
16,331
|
|||||
|
Teleflex, Inc.
|
301
|
55,610
|
||||||
|
Zimmer Biomet Holdings, Inc.
|
1,683
|
175,722
|
||||||
|
2,307,046
|
||||||||
|
Health Care Providers & Services – 0.66%
|
||||||||
|
Acadia Healthcare Co., Inc. (a)
|
1,977
|
145,329
|
||||||
|
Amedisys, Inc. (a)
|
160
|
14,638
|
||||||
|
Centene Corp. (a)
|
388
|
26,764
|
||||||
|
CVS Health Corp.
|
351
|
24,223
|
||||||
|
Elevance Health, Inc.
|
32
|
14,403
|
||||||
|
Guardant Health, Inc. (a)
|
1,690
|
43,737
|
||||||
|
HealthEquity, Inc. (a)
|
2,209
|
158,341
|
||||||
|
Humana, Inc.
|
516
|
270,224
|
||||||
|
Option Care Health, Inc. (a)
|
5,896
|
163,496
|
||||||
|
Pennant Group, Inc. (a)
|
386
|
4,196
|
||||||
|
Privia Health Group, Inc. (a)
|
1,197
|
25,161
|
||||||
|
Progyny, Inc. (a)
|
109
|
3,364
|
||||||
|
Quest Diagnostics, Inc.
|
122
|
15,872
|
||||||
|
UnitedHealth Group, Inc.
|
961
|
514,673
|
||||||
|
Universal Health Services, Inc. – Class B
|
160
|
20,142
|
||||||
|
1,444,563
|
||||||||
|
Health Care REITs – 2.00%
|
||||||||
|
Medical Properties Trust, Inc.
|
51,200
|
244,736
|
||||||
|
Sabra Health Care REIT, Inc.
|
66,138
|
902,122
|
||||||
|
Ventas, Inc. (c)
|
75,981
|
3,226,153
|
||||||
|
4,373,011
|
||||||||
|
Health Care Technology – 0.13%
|
||||||||
|
Evolent Health, Inc. – Class A (a)
|
3,589
|
87,679
|
||||||
|
Phreesia, Inc. (a)
|
15,232
|
208,070
|
||||||
|
295,749
|
||||||||
|
Hotels, Restaurants & Leisure – 3.55%
|
||||||||
|
Aramark
|
6,238
|
167,989
|
||||||
|
Bloomin’ Brands, Inc.
|
7,975
|
186,137
|
||||||
|
Bowlero Corp. (a)(d)
|
6,719
|
67,795
|
||||||
|
Brinker International, Inc. (a)
|
2,004
|
67,976
|
||||||
|
Chipotle Mexican Grill, Inc. (a)
|
239
|
464,186
|
||||||
|
Choice Hotels International, Inc.
|
1,122
|
123,981
|
||||||
|
Churchill Downs, Inc.
|
1,993
|
218,911
|
||||||
|
Darden Restaurants, Inc.
|
1,318
|
191,809
|
||||||
The accompanying notes are an integral part of these financial statements.
16
WEISS ALTERNATIVE MULTI-STRATEGY FUND
Schedule of Investments – Continued
October 31, 2023
|
Shares
|
Value
|
|||||||
|
Hotels, Restaurants & Leisure – 3.55% (Continued)
|
||||||||
|
Domino’s Pizza, Inc.
|
816
|
$
|
276,616
|
|||||
|
Expedia Group, Inc. (a)
|
924
|
88,048
|
||||||
|
Full House Resorts, Inc. (a)
|
789
|
2,959
|
||||||
|
Hilton Grand Vacations, Inc. (a)
|
2,233
|
80,276
|
||||||
|
Hilton Worldwide Holdings, Inc.
|
4,136
|
626,728
|
||||||
|
International Game Technology plc (b)(d)
|
9,759
|
248,073
|
||||||
|
Las Vegas Sands Corp.
|
2,774
|
131,654
|
||||||
|
Marriott International, Inc. – Class A
|
922
|
173,852
|
||||||
|
McDonald’s Corp.
|
763
|
200,036
|
||||||
|
Papa John’s International, Inc.
|
1,431
|
93,044
|
||||||
|
Penn National Gaming, Inc. (a)(d)
|
20,701
|
408,431
|
||||||
|
Planet Fitness, Inc. – Class A (a)
|
3,498
|
193,334
|
||||||
|
Restaurant Brands International, Inc. (b)
|
8,958
|
601,978
|
||||||
|
Royal Caribbean Cruises Ltd. (a)(b)
|
13,606
|
1,152,836
|
||||||
|
Shake Shack, Inc. – Class A (a)
|
2,871
|
160,891
|
||||||
|
Starbucks Corp.
|
1,751
|
161,512
|
||||||
|
Sweetgreen, Inc. – Class A (a)
|
270
|
2,789
|
||||||
|
Vail Resorts, Inc.
|
1,356
|
287,811
|
||||||
|
Wingstop, Inc.
|
1,402
|
256,244
|
||||||
|
Wyndham Hotels & Resorts, Inc. (d)
|
1,024
|
74,138
|
||||||
|
Wynn Resorts Ltd.
|
11,466
|
1,006,485
|
||||||
|
7,716,519
|
||||||||
|
Household Durables – 0.08%
|
||||||||
|
D.R. Horton, Inc.
|
309
|
32,260
|
||||||
|
Lennar Corp. – Class A
|
302
|
32,217
|
||||||
|
PulteGroup, Inc.
|
954
|
70,206
|
||||||
|
TopBuild Corp. (a)
|
147
|
33,628
|
||||||
|
168,311
|
||||||||
|
Household Products – 1.06%
|
||||||||
|
Church & Dwight Co., Inc.
|
900
|
81,846
|
||||||
|
Clorox Co.
|
9,071
|
1,067,658
|
||||||
|
Colgate-Palmolive Co. (c)
|
12,778
|
959,883
|
||||||
|
Spectrum Brands Holdings, Inc.
|
2,413
|
181,747
|
||||||
|
2,291,134
|
||||||||
|
Industrial Conglomerates – 0.11%
|
||||||||
|
Honeywell International, Inc.
|
1,334
|
244,469
|
||||||
The accompanying notes are an integral part of these financial statements.
17
WEISS ALTERNATIVE MULTI-STRATEGY FUND
Schedule of Investments – Continued
October 31, 2023
|
Shares
|
Value
|
|||||||
|
Industrial REITs – 3.29%
|
||||||||
|
Americold Realty Trust (c)
|
119,633
|
$
|
3,136,777
|
|||||
|
Plymouth Industrial REIT, Inc.
|
36,921
|
736,205
|
||||||
|
Rexford Industrial Realty, Inc. (c)
|
75,937
|
3,283,516
|
||||||
|
7,156,498
|
||||||||
|
Insurance – 1.42%
|
||||||||
|
Aflac, Inc.
|
699
|
54,599
|
||||||
|
Allstate Corp.
|
2,492
|
319,300
|
||||||
|
Arthur J. Gallagher & Co.
|
215
|
50,630
|
||||||
|
ASR Nederland N.V. (b)
|
1,715
|
64,001
|
||||||
|
Brown & Brown, Inc.
|
1,502
|
104,269
|
||||||
|
Chubb Ltd. (b)
|
989
|
212,259
|
||||||
|
Cincinnati Financial Corp.
|
1,627
|
162,163
|
||||||
|
Everest Re Group Ltd. (b)
|
1,015
|
401,554
|
||||||
|
Fidelis Insurance Holdings Ltd. (a)(b)
|
4,170
|
58,964
|
||||||
|
International General Insurance Holdings Ltd. (b)
|
14,142
|
155,421
|
||||||
|
MetLife, Inc.
|
2,222
|
133,342
|
||||||
|
Old Republic International Corp.
|
2,455
|
67,218
|
||||||
|
Progressive Corp.
|
1,143
|
180,697
|
||||||
|
Reinsurance Group America, Inc.
|
1,617
|
241,693
|
||||||
|
RenaissanceRe Holdings Ltd. (b)
|
1,856
|
407,559
|
||||||
|
Travelers Cos., Inc.
|
2,226
|
372,722
|
||||||
|
Unum Group
|
2,366
|
115,697
|
||||||
|
3,102,088
|
||||||||
|
Interactive Media & Services – 0.60%
|
||||||||
|
Alphabet, Inc. – Class C (a)
|
3,416
|
428,025
|
||||||
|
Meta Platforms, Inc. – Class A (a)(d)
|
2,416
|
727,869
|
||||||
|
Pinterest, Inc. – Class A (a)
|
3,816
|
114,022
|
||||||
|
QuinStreet, Inc. (a)
|
1,595
|
18,039
|
||||||
|
Vimeo, Inc. (a)
|
4,134
|
12,733
|
||||||
|
1,300,688
|
||||||||
|
IT Services – 0.03%
|
||||||||
|
Cognizant Technology Solutions Corp. – Class A
|
795
|
51,253
|
||||||
|
Leisure Products – 0.01%
|
||||||||
|
Hasbro, Inc.
|
383
|
17,292
|
||||||
|
Old PSG Wind-Down Ltd. (a)(b)(e)
|
2,127
|
202
|
||||||
|
17,494
|
||||||||
The accompanying notes are an integral part of these financial statements.
18
WEISS ALTERNATIVE MULTI-STRATEGY FUND
Schedule of Investments – Continued
October 31, 2023
|
Shares
|
Value
|
|||||||
|
Life Sciences Tools & Services – 0.64%
|
||||||||
|
Agilent Technologies, Inc.
|
382
|
$
|
39,487
|
|||||
|
Akoya Biosciences, Inc. (a)
|
1,840
|
6,440
|
||||||
|
Bruker Corp.
|
2,364
|
134,748
|
||||||
|
Charles River Laboratories International, Inc. (a)
|
20
|
3,367
|
||||||
|
Danaher Corp.
|
1,351
|
259,419
|
||||||
|
Fortrea Holdings, Inc. (a)
|
8,138
|
231,119
|
||||||
|
Lonza Group AG (b)
|
778
|
272,458
|
||||||
|
Pacific Biosciences of California, Inc. (a)
|
2,703
|
16,705
|
||||||
|
Qiagen N.V. (a)(b)
|
3,182
|
118,953
|
||||||
|
Repligen Corp. (a)
|
96
|
12,918
|
||||||
|
Standard BioTools, Inc. (a)
|
196
|
390
|
||||||
|
Thermo Fisher Scientific, Inc.
|
651
|
289,545
|
||||||
|
1,385,549
|
||||||||
|
Machinery – 0.59%
|
||||||||
|
AGCO Corp.
|
228
|
26,142
|
||||||
|
Deere & Co.
|
91
|
33,248
|
||||||
|
Flowserve Corp.
|
13,882
|
509,746
|
||||||
|
Greenbrier Cos., Inc.
|
4,946
|
171,082
|
||||||
|
IDEX Corp.
|
678
|
129,776
|
||||||
|
Illinois Tool Works, Inc.
|
287
|
64,322
|
||||||
|
Oshkosh Corp.
|
705
|
61,850
|
||||||
|
PACCAR, Inc.
|
1,145
|
94,497
|
||||||
|
Parker-Hannifin Corp.
|
181
|
66,773
|
||||||
|
Xylem, Inc.
|
1,350
|
126,279
|
||||||
|
1,283,715
|
||||||||
|
Marine Transportation – 0.09%
|
||||||||
|
AP Moller – Maersk AS – Class B (b)
|
54
|
89,976
|
||||||
|
Kirby Corp. (a)
|
1,366
|
102,040
|
||||||
|
192,016
|
||||||||
|
Media – 0.57%
|
||||||||
|
comScore, Inc. (a)
|
307,389
|
196,698
|
||||||
|
Criteo S.A. – ADR (a)(b)
|
18,755
|
530,204
|
||||||
|
Liberty Media Corp.-Liberty SiriusXM (a)
|
13,854
|
340,116
|
||||||
|
Nexstar Media Group, Inc.
|
1,281
|
179,442
|
||||||
|
1,246,460
|
||||||||
|
Metals & Mining – 2.10%
|
||||||||
|
Adriatic Metals plc (a)(b)
|
25,617
|
55,230
|
||||||
|
Algoma Steel Group, Inc. (b)
|
147,601
|
1,034,682
|
||||||
|
ArcelorMittal S.A. (b)
|
18,862
|
415,340
|
||||||
The accompanying notes are an integral part of these financial statements.
19
WEISS ALTERNATIVE MULTI-STRATEGY FUND
Schedule of Investments – Continued
October 31, 2023
|
Shares
|
Value
|
|||||||
|
Metals & Mining – 2.10% (Continued)
|
||||||||
|
Atlas Lithium Corp. (a)
|
8,676
|
$
|
190,872
|
|||||
|
BHP Group Ltd. – ADR (b)
|
862
|
49,186
|
||||||
|
BlueScope Steel Ltd. (b)
|
3,360
|
40,278
|
||||||
|
Capstone Copper Corp. (a)(b)
|
135,678
|
461,800
|
||||||
|
Carpenter Technology Corp.
|
589
|
36,942
|
||||||
|
Century Aluminum Co. (a)
|
3,994
|
26,400
|
||||||
|
Cleveland-Cliffs, Inc. (a)
|
3,813
|
63,982
|
||||||
|
Commercial Metals Co.
|
2,564
|
108,432
|
||||||
|
Filo Corp. (a)(b)
|
46,392
|
604,176
|
||||||
|
Latin Resources Ltd. (a)(b)
|
584,989
|
92,155
|
||||||
|
Li-FT Power Ltd. (a)(b)
|
13,888
|
70,103
|
||||||
|
Lithium Ionic Corp. (a)(b)
|
19,755
|
23,505
|
||||||
|
Lundin Mining Corp. (b)
|
18,127
|
113,200
|
||||||
|
NGEx Minerals Ltd. (a)(b)
|
80,943
|
344,376
|
||||||
|
Norsk Hydro ASA (b)
|
4,297
|
24,505
|
||||||
|
Northam Platinum Holdings Ltd. (b)
|
38,145
|
230,231
|
||||||
|
Schnitzer Steel Industries, Inc. – Class A
|
3,704
|
84,118
|
||||||
|
Sigma Lithium Corp. (a)(b)
|
6,005
|
146,822
|
||||||
|
United States Steel Corp.
|
2,544
|
86,216
|
||||||
|
Vale SA – ADR (b)
|
12,760
|
174,940
|
||||||
|
WA1 Resources Ltd. (a)(b)
|
14,560
|
79,163
|
||||||
|
4,556,654
|
||||||||
|
Mortgage Real Estate Investment Trusts (REITs) – 0.08%
|
||||||||
|
Rithm Capital Corp.
|
18,934
|
176,654
|
||||||
|
Office REITs – 2.94%
|
||||||||
|
Boston Properties, Inc. (c)
|
58,836
|
3,151,844
|
||||||
|
Cousins Properties, Inc.
|
115,983
|
2,072,616
|
||||||
|
Douglas Emmett, Inc.
|
85,019
|
953,063
|
||||||
|
Kilroy Realty Corp.
|
7,540
|
215,493
|
||||||
|
6,393,016
|
||||||||
|
Oil, Gas & Consumable Fuels – 2.10%
|
||||||||
|
Alliance Resource Partners LP
|
11,757
|
267,178
|
||||||
|
Antero Midstream Corp.
|
1,973
|
24,347
|
||||||
|
Antero Resources Corp. (a)
|
10,608
|
312,299
|
||||||
|
Calumet Specialty Products Partners LP (a)
|
561
|
7,310
|
||||||
|
Cameco Corp. (b)
|
68
|
2,782
|
||||||
|
Cenovus Energy, Inc. (b)
|
134
|
2,557
|
||||||
|
Chevron Corp. (d)
|
17
|
2,477
|
||||||
|
Chord Energy Corp.
|
1,787
|
295,427
|
||||||
The accompanying notes are an integral part of these financial statements.
20
WEISS ALTERNATIVE MULTI-STRATEGY FUND
Schedule of Investments – Continued
October 31, 2023
|
Shares
|
Value
|
|||||||
|
Oil, Gas & Consumable Fuels – 2.10% (Continued)
|
||||||||
|
CNX Resources Corp. (a)
|
120
|
$
|
2,606
|
|||||
|
Comstock Resources, Inc.
|
8,109
|
102,173
|
||||||
|
DHT Holdings, Inc. (b)
|
247
|
2,747
|
||||||
|
Diamondback Energy, Inc.
|
1,803
|
289,057
|
||||||
|
Energy Transfer LP
|
608
|
7,995
|
||||||
|
Enerplus Corp. (b)
|
153
|
2,587
|
||||||
|
Enviva, Inc. (a)
|
6,457
|
23,374
|
||||||
|
Equitrans Midstream Corp.
|
303
|
2,688
|
||||||
|
Exxon Mobil Corp.
|
24
|
2,540
|
||||||
|
Genesis Energy LP
|
721
|
7,989
|
||||||
|
Global Partners LP
|
271
|
8,612
|
||||||
|
Golar LNG Ltd. (b)
|
31,313
|
702,350
|
||||||
|
Hallador Energy Co. (a)
|
180
|
2,516
|
||||||
|
Hess Corp.
|
2,095
|
302,518
|
||||||
|
Holly Energy Partners LP
|
396
|
8,415
|
||||||
|
KNOT Offshore Partners LP (b)
|
706
|
3,996
|
||||||
|
Marathon Oil Corp.
|
11,038
|
301,448
|
||||||
|
Marathon Petroleum Corp.
|
636
|
96,195
|
||||||
|
Murphy Oil Corp.
|
6,883
|
308,840
|
||||||
|
Natural Resource Partners LP
|
124
|
8,184
|
||||||
|
New Fortress Energy, Inc.
|
7,425
|
224,978
|
||||||
|
NextDecade Corp. (a)
|
1,653
|
7,257
|
||||||
|
Northern Oil and Gas, Inc.
|
6,951
|
266,501
|
||||||
|
Par Pacific Holdings, Inc. (a)
|
84
|
2,757
|
||||||
|
PBF Energy, Inc. – Class A
|
146
|
6,939
|
||||||
|
Peabody Energy Corp.
|
582
|
13,729
|
||||||
|
Permian Basin Royalty Trust
|
684
|
13,577
|
||||||
|
Pioneer Natural Resources Co.
|
1,398
|
334,121
|
||||||
|
Range Resources Corp.
|
6,764
|
242,422
|
||||||
|
REX American Resources Corp. (a)
|
72
|
2,737
|
||||||
|
Sabine Royalty Trust
|
344
|
19,866
|
||||||
|
SM Energy Co.
|
7,601
|
306,472
|
||||||
|
StealthGas, Inc. (a)(b)
|
504
|
2,822
|
||||||
|
Teekay Corp. (a) (b)
|
384
|
2,700
|
||||||
|
Valero Energy Corp.
|
21
|
2,667
|
||||||
|
YPF SA – ADR (a)(b)
|
244
|
2,423
|
||||||
|
4,553,175
|
||||||||
|
Paper & Forest Products – 0.03%
|
||||||||
|
Sylvamo Corp.
|
1,493
|
66,140
|
||||||
The accompanying notes are an integral part of these financial statements.
21
WEISS ALTERNATIVE MULTI-STRATEGY FUND
Schedule of Investments – Continued
October 31, 2023
|
Shares
|
Value
|
|||||||
|
Passenger Airlines – 0.01%
|
||||||||
|
Delta Air Lines, Inc.
|
524
|
$
|
16,375
|
|||||
|
Personal Care Products – 0.20%
|
||||||||
|
BellRing Brands, Inc. (a)
|
2,616
|
114,398
|
||||||
|
Coty, Inc. – Class A (a)
|
14,068
|
131,817
|
||||||
|
e.l.f. Beauty, Inc. (a)
|
604
|
55,949
|
||||||
|
Kenvue, Inc. (d)
|
5,295
|
98,487
|
||||||
|
Oddity Tech Ltd. – Class A (a)(b)
|
512
|
13,082
|
||||||
|
413,733
|
||||||||
|
Pharmaceuticals – 1.08%
|
||||||||
|
Aclaris Therapeutics, Inc. (a)
|
1,546
|
7,699
|
||||||
|
Amylyx Pharmaceuticals, Inc. (a)
|
431
|
7,030
|
||||||
|
AstraZeneca plc – ADR (b)
|
182
|
11,508
|
||||||
|
Bristol-Myers Squibb Co.
|
638
|
32,876
|
||||||
|
Catalent, Inc. (a)
|
159
|
5,468
|
||||||
|
Elanco Animal Health, Inc. (a)
|
19,458
|
171,425
|
||||||
|
Eli Lilly & Co.
|
798
|
442,036
|
||||||
|
Green Thumb Industries, Inc. (a)
|
16,685
|
138,258
|
||||||
|
GSK plc – ADR (b)
|
1,320
|
47,124
|
||||||
|
Intra-Cellular Therapies, Inc. (a)
|
636
|
31,647
|
||||||
|
Jazz Pharmaceuticals plc (a)
|
746
|
94,757
|
||||||
|
Johnson & Johnson
|
1,197
|
177,563
|
||||||
|
Merck & Co., Inc.
|
2,623
|
269,382
|
||||||
|
Novo Nordisk A/S – ADR (b)
|
1,773
|
171,219
|
||||||
|
Novo Nordisk A/S – Class B (b)
|
1,322
|
127,542
|
||||||
|
Pfizer, Inc.
|
6,967
|
212,912
|
||||||
|
Sanofi SA – ADR (b)
|
1,440
|
65,160
|
||||||
|
Structure Therapeutics, Inc. (a)
|
1,357
|
100,825
|
||||||
|
Teva Pharmaceutical Industries Ltd. – ADR (a)(b)
|
20,344
|
174,552
|
||||||
|
Verano Holdings Corp. (a)
|
11,221
|
37,545
|
||||||
|
2,326,528
|
||||||||
|
Professional Services – 0.03%
|
||||||||
|
Jacobs Solutions, Inc.
|
474
|
63,184
|
||||||
|
Retail REITs – 2.81%
|
||||||||
|
Acadia Realty Trust
|
51,545
|
738,124
|
||||||
|
Agree Realty Corp.
|
31,950
|
1,787,283
|
||||||
|
Brixmor Property Group, Inc.
|
85,867
|
1,785,175
|
||||||
The accompanying notes are an integral part of these financial statements.
22
WEISS ALTERNATIVE MULTI-STRATEGY FUND
Schedule of Investments – Continued
October 31, 2023
|
Shares
|
Value
|
|||||||
|
Retail REITs – 2.81% (Continued)
|
||||||||
|
Kimco Realty Corp.
|
13,557
|
$
|
243,213
|
|||||
|
Retail Opportunity Investments Corp.
|
133,916
|
1,572,174
|
||||||
|
6,125,969
|
||||||||
|
Semiconductors & Semiconductor Equipment – 1.01%
|
||||||||
|
Advanced Micro Devices, Inc. (a)(d)
|
4,803
|
473,096
|
||||||
|
Intel Corp.
|
11,150
|
406,975
|
||||||
|
Marvell Technology, Inc.
|
1,638
|
77,346
|
||||||
|
Micron Technology, Inc.
|
5,583
|
373,335
|
||||||
|
Monolithic Power Systems, Inc.
|
477
|
210,710
|
||||||
|
NVIDIA Corp.
|
637
|
259,769
|
||||||
|
Qorvo, Inc. (a)
|
2,711
|
236,996
|
||||||
|
Synaptics, Inc. (a)
|
1,538
|
128,669
|
||||||
|
2,166,896
|
||||||||
|
Software – 2.40%
|
||||||||
|
Adobe, Inc. (a)
|
213
|
113,329
|
||||||
|
Alteryx, Inc. – Class A (a)(d)
|
8,286
|
265,235
|
||||||
|
Applied Digital Corp. (a)(d)
|
8,160
|
39,821
|
||||||
|
Aspen Technology, Inc. (a)
|
119
|
21,152
|
||||||
|
Braze, Inc. – Class A (a)
|
3,180
|
135,404
|
||||||
|
CyberArk Software Ltd. (a)(b)
|
795
|
130,094
|
||||||
|
Descartes Systems Group, Inc. (a)(b)
|
128
|
9,243
|
||||||
|
Envestnet, Inc. (a)
|
7,815
|
289,155
|
||||||
|
Freshworks, Inc. – Class A (a)
|
9,875
|
177,158
|
||||||
|
Intuit, Inc.
|
957
|
473,667
|
||||||
|
LiveRamp Holdings, Inc. (a)
|
21,528
|
595,464
|
||||||
|
Microsoft Corp. (d)
|
5,461
|
1,846,419
|
||||||
|
NCR Voyix Corp. (a)
|
1,053
|
16,100
|
||||||
|
Palo Alto Networks, Inc. (a)
|
957
|
232,570
|
||||||
|
Riot Platforms, Inc. (a)
|
1,755
|
17,164
|
||||||
|
Riskfield Ltd. – Class A (a)(b)
|
11,000
|
41,030
|
||||||
|
Roper Technologies, Inc.
|
210
|
102,600
|
||||||
|
SentinelOne, Inc. – Class A (a)
|
23,850
|
372,776
|
||||||
|
ServiceNow, Inc. (a)
|
239
|
139,062
|
||||||
|
Workday, Inc. – Class A (a)
|
479
|
101,409
|
||||||
|
Zscaler, Inc. (a)
|
797
|
126,476
|
||||||
|
5,245,328
|
||||||||
|
Specialized REITs – 2.91%
|
||||||||
|
CubeSmart (c)
|
67,942
|
2,316,143
|
||||||
|
SBA Communications Corp.
|
19,136
|
3,992,344
|
||||||
|
6,308,487
|
||||||||
The accompanying notes are an integral part of these financial statements.
23
WEISS ALTERNATIVE MULTI-STRATEGY FUND
Schedule of Investments – Continued
October 31, 2023
|
Shares
|
Value
|
|||||||
|
Specialty Retail – 0.52%
|
||||||||
|
Advance Auto Parts, Inc.
|
1,275
|
$
|
66,338
|
|||||
|
AutoNation, Inc. (a)
|
369
|
48,000
|
||||||
|
Bath & Body Works, Inc.
|
3,201
|
94,910
|
||||||
|
Five Below, Inc. (a)
|
512
|
89,078
|
||||||
|
Gap, Inc. (d)
|
14
|
179
|
||||||
|
Home Depot, Inc.
|
1,077
|
306,611
|
||||||
|
O’Reilly Automotive, Inc. (a)
|
236
|
219,584
|
||||||
|
RH (a)
|
64
|
13,949
|
||||||
|
Ross Stores, Inc.
|
1,399
|
162,242
|
||||||
|
Signet Jewelers Ltd.
|
613
|
42,806
|
||||||
|
Urban Outfitters, Inc. (a)
|
2,526
|
87,450
|
||||||
|
1,131,147
|
||||||||
|
Technology Hardware, Storage & Peripherals – 0.25%
|
||||||||
|
Pure Storage, Inc. – Class A (a)
|
11,314
|
382,526
|
||||||
|
Western Digital Corp. (a)
|
3,975
|
159,596
|
||||||
|
542,122
|
||||||||
|
Textiles, Apparel & Luxury Goods – 0.11%
|
||||||||
|
Crocs, Inc. (a)
|
659
|
58,862
|
||||||
|
Kontoor Brands, Inc.
|
1,320
|
61,314
|
||||||
|
Skechers U.S.A., Inc. – Class A (a)
|
2,164
|
104,348
|
||||||
|
224,524
|
||||||||
|
Trading Companies & Distributors – 0.70%
|
||||||||
|
AerCap Holdings N.V. (a)(b)
|
15,009
|
932,358
|
||||||
|
Fastenal Co.
|
1,121
|
65,399
|
||||||
|
Ferguson plc (b)
|
129
|
19,376
|
||||||
|
FTAI Aviation Ltd. (b)
|
5,760
|
216,634
|
||||||
|
MRC Global, Inc. (a)
|
23,107
|
242,854
|
||||||
|
MSC Industrial Direct Co., Inc. – Class A
|
328
|
31,078
|
||||||
|
NOW, Inc. (a)
|
984
|
10,844
|
||||||
|
Russel Metals, Inc. (b)
|
326
|
8,122
|
||||||
|
1,526,665
|
||||||||
|
Wireless Telecommunication Services – 0.27%
|
||||||||
|
NII Holdings, Inc. (a)(e)
|
6,235
|
2,494
|
||||||
|
Telephone & Data Systems, Inc.
|
2,559
|
46,548
|
||||||
|
T-Mobile U.S., Inc. (a)
|
3,313
|
476,608
|
||||||
|
United States Cellular Corp. (a)
|
1,360
|
57,161
|
||||||
|
582,811
|
||||||||
|
Total Common Stocks
|
||||||||
|
(Cost $124,716,587)
|
117,405,110
|
|||||||
The accompanying notes are an integral part of these financial statements.
24
WEISS ALTERNATIVE MULTI-STRATEGY FUND
Schedule of Investments – Continued
October 31, 2023
|
Shares
|
Value
|
|||||||
|
EXCHANGE TRADED FUNDS – 1.82%
|
||||||||
|
Commodity – 0.41%
|
||||||||
|
Sprott Physical Gold Trust (a)(b)
|
1,645
|
$
|
180,498
|
|||||
|
Sprott Physical Uranium Trust (a)(b)
|
38,937
|
705,036
|
||||||
|
885,534
|
||||||||
|
Equity – 1.09%
|
||||||||
|
Energy Select Sector SPDR Fund
|
1,038
|
88,427
|
||||||
|
Invesco S&P 500 Equal Weight ETF
|
2,189
|
297,332
|
||||||
|
iShares MSCI Brazil ETF
|
5,524
|
164,449
|
||||||
|
iShares Russell 2000 ETF
|
1,916
|
315,220
|
||||||
|
ProShares VIX Short-Term Futures ETF (a)
|
13,381
|
313,383
|
||||||
|
SPDR Dow Jones Industrial Average ETF Trust
|
1,796
|
593,542
|
||||||
|
SPDR S&P 500 ETF Trust
|
1,219
|
509,786
|
||||||
|
U.S. Global Jets ETF (a)
|
483
|
7,206
|
||||||
|
United States Oil Fund LP (a)
|
1,002
|
75,170
|
||||||
|
Utilities Select Sector SPDR Fund
|
97
|
5,790
|
||||||
|
2,370,305
|
||||||||
|
Fixed Income – 0.32%
|
||||||||
|
iShares 20+ Year Treasury Bond ETF (d)
|
7,504
|
627,184
|
||||||
|
iShares 7-10 Year Treasury Bond ETF
|
714
|
63,967
|
||||||
|
691,151
|
||||||||
|
Total Exchange Traded Funds
|
||||||||
|
(Cost $3,856,898)
|
3,946,990
|
|||||||
|
PREFERRED STOCKS – 0.11%
|
||||||||
|
Oil, Gas & Consumable Fuels – 0.11%
|
||||||||
|
Petroleo Brasileiro SA (b)
|
17,680
|
244,514
|
||||||
|
Total Preferred Stocks
|
||||||||
|
(Cost $224,495)
|
244,514
|
|||||||
The accompanying notes are an integral part of these financial statements.
25
WEISS ALTERNATIVE MULTI-STRATEGY FUND
Schedule of Investments – Continued
October 31, 2023
|
Notional
|
||||||||||||
|
Contracts
|
Amount
|
Value
|
||||||||||
|
PURCHASED OPTIONS – 0.08%
|
||||||||||||
|
Calls – 0.06%
|
||||||||||||
|
Advanced Micro Devices, Inc. (f)
|
||||||||||||
|
Exercise Price: $100.00, Expiration: 11/03/2023
|
48
|
$
|
472,800
|
$
|
14,519
|
|||||||
|
Alteryx, Inc. (f)
|
||||||||||||
|
Exercise Price: $35.00, Expiration: 02/16/2024
|
45
|
144,045
|
15,299
|
|||||||||
|
Amazon.com, Inc. (f)
|
||||||||||||
|
Exercise Price: $130.00, Expiration: 11/17/2023
|
19
|
252,871
|
10,830
|
|||||||||
|
Exercise Price: $135.00, Expiration: 11/17/2023
|
3
|
39,927
|
852
|
|||||||||
|
Apple, Inc. (f)
|
||||||||||||
|
Exercise Price: $172.50, Expiration: 11/03/2023
|
16
|
273,232
|
4,168
|
|||||||||
|
Baxter International, Inc. (f)
|
||||||||||||
|
Exercise Price: $37.50, Expiration: 11/17/2023
|
1
|
3,243
|
10
|
|||||||||
|
Caesars Entertainment, Inc. (f)
|
||||||||||||
|
Exercise Price: $40.00, Expiration: 11/17/2023
|
16
|
63,824
|
3,240
|
|||||||||
|
Cameco Corp. (f)
|
||||||||||||
|
Exercise Price: $47.00, Expiration: 11/17/2023
|
26
|
106,366
|
364
|
|||||||||
|
Cinemark Holdings, Inc. (f)
|
||||||||||||
|
Exercise Price: $16.00, Expiration: 12/15/2023
|
6
|
9,894
|
930
|
|||||||||
|
CommScope Holding Co., Inc. (f)
|
||||||||||||
|
Exercise Price: $5.00, Expiration: 11/17/2023
|
350
|
51,800
|
875
|
|||||||||
|
Danaher Corp. (f)
|
||||||||||||
|
Exercise Price: $200.00, Expiration: 11/03/2023
|
8
|
153,616
|
220
|
|||||||||
|
Endeavor Group Holdings, Inc. (f)
|
||||||||||||
|
Exercise Price: $22.50, Expiration: 12/15/2023
|
32
|
72,832
|
4,401
|
|||||||||
|
Enovix Corp. (f)
|
||||||||||||
|
Exercise Price: $15.00, Expiration: 01/19/2024
|
6
|
5,346
|
150
|
|||||||||
|
Exercise Price: $20.00, Expiration: 01/19/2024
|
17
|
15,147
|
213
|
|||||||||
|
Fortrea Holdings, Inc. (f)
|
||||||||||||
|
Exercise Price: $30.00, Expiration: 11/17/2023
|
17
|
48,280
|
1,105
|
|||||||||
|
FREYR Battery S.A. (f)
|
||||||||||||
|
Exercise Price: $10.00, Expiration: 01/19/2024
|
34
|
10,914
|
85
|
|||||||||
|
General Motors Co. (f)
|
||||||||||||
|
Exercise Price: $34.00, Expiration: 11/17/2023
|
32
|
90,240
|
80
|
|||||||||
|
Illinois Tool Works, Inc. (f)
|
||||||||||||
|
Exercise Price: $240.00, Expiration: 11/17/2023
|
9
|
201,708
|
270
|
|||||||||
|
International Game Technology plc (f)
|
||||||||||||
|
Exercise Price: $28.00, Expiration: 11/17/2023
|
16
|
40,672
|
400
|
|||||||||
|
iShares 20+ Year Treasury Bond ETF (f)
|
||||||||||||
|
Exercise Price: $94.00, Expiration: 12/15/2023
|
41
|
342,678
|
1,066
|
|||||||||
The accompanying notes are an integral part of these financial statements.
26
WEISS ALTERNATIVE MULTI-STRATEGY FUND
Schedule of Investments – Continued
October 31, 2023
|
Notional
|
||||||||||||
|
Contracts
|
Amount
|
Value
|
||||||||||
|
Calls – 0.06% (Continued)
|
||||||||||||
|
Kenvue, Inc. (f)
|
||||||||||||
|
Exercise Price: $20.00, Expiration: 01/19/2024
|
96
|
$
|
178,560
|
$
|
5,280
|
|||||||
|
Exercise Price: $22.50, Expiration: 11/17/2023
|
51
|
94,860
|
128
|
|||||||||
|
Merck & Co., Inc. (f)
|
||||||||||||
|
Exercise Price: $110.00, Expiration: 11/17/2023
|
32
|
328,640
|
272
|
|||||||||
|
Microsoft Corp. (f)
|
||||||||||||
|
Exercise Price: $330.00, Expiration: 01/19/2024
|
3
|
101,433
|
6,705
|
|||||||||
|
Exercise Price: $340.00, Expiration: 01/19/2024
|
3
|
101,433
|
4,905
|
|||||||||
|
Monolithic Power Systems, Inc. (f)
|
||||||||||||
|
Exercise Price: $410.00, Expiration: 11/17/2023
|
2
|
88,348
|
7,860
|
|||||||||
|
Penn Entertainment, Inc. (f)
|
||||||||||||
|
Exercise Price: $25.00, Expiration: 01/19/2024
|
29
|
57,217
|
1,929
|
|||||||||
|
Pfizer, Inc. (f)
|
||||||||||||
|
Exercise Price: $34.00, Expiration: 11/17/2023
|
64
|
195,584
|
256
|
|||||||||
|
PureCycle Technologies, Inc. (f)
|
||||||||||||
|
Exercise Price: $9.00, Expiration: 11/17/2023
|
207
|
92,115
|
1,035
|
|||||||||
|
Seagen, Inc. (f)
|
||||||||||||
|
Exercise Price: $230.00, Expiration: 06/21/2024
|
18
|
383,058
|
405
|
|||||||||
|
Sigma Lithium Corp. (f)
|
||||||||||||
|
Exercise Price: $30.00, Expiration: 12/15/2023
|
127
|
310,515
|
14,923
|
|||||||||
|
Exercise Price: $35.00, Expiration: 11/17/2023
|
14
|
34,230
|
280
|
|||||||||
|
Sirius XM Holdings, Inc. (f)
|
||||||||||||
|
Exercise Price: $5.00, Expiration: 11/17/2023
|
65
|
27,820
|
715
|
|||||||||
|
Southwestern Energy Co. (f)
|
||||||||||||
|
Exercise Price: $7.00, Expiration: 11/17/2023
|
64
|
45,632
|
2,368
|
|||||||||
|
Exercise Price: $7.50, Expiration: 11/17/2023
|
103
|
73,439
|
1,648
|
|||||||||
|
Exercise Price: $8.00, Expiration: 11/17/2023
|
76
|
54,188
|
494
|
|||||||||
|
SPDR S&P 500 ETF (f)
|
||||||||||||
|
Exercise Price: $422.00, Expiration: 11/03/2023
|
38
|
1,589,160
|
5,415
|
|||||||||
|
SPDR S&P Biotech ETF (f)
|
||||||||||||
|
Exercise Price: $66.00, Expiration: 11/03/2023
|
24
|
158,952
|
2,424
|
|||||||||
|
SPDR S&P Oil & Gas Exploration & Production ETF (f)
|
||||||||||||
|
Exercise Price: $149.00, Expiration: 11/17/2023
|
10
|
145,220
|
2,230
|
|||||||||
|
Spirit Airlines, Inc. (f)
|
||||||||||||
|
Exercise Price: $20.00, Expiration: 12/15/2023
|
20
|
22,960
|
990
|
|||||||||
|
Exercise Price: $20.00, Expiration: 01/19/2024
|
5
|
5,740
|
538
|
|||||||||
|
Sprott Uranium Miners ETF (f)
|
||||||||||||
|
Exercise Price: $55.00, Expiration: 12/15/2023
|
23
|
106,490
|
2,588
|
|||||||||
|
TETRA Technologies, Inc. (f)
|
||||||||||||
|
Exercise Price: $5.00, Expiration: 12/15/2023
|
95
|
45,030
|
1,900
|
|||||||||
The accompanying notes are an integral part of these financial statements.
27
WEISS ALTERNATIVE MULTI-STRATEGY FUND
Schedule of Investments – Continued
October 31, 2023
|
Notional
|
||||||||||||
|
Contracts
|
Amount
|
Value
|
||||||||||
|
Calls – 0.06% (Continued)
|
||||||||||||
|
Valley National Bancorp (f)
|
||||||||||||
|
Exercise Price: $10.00, Expiration: 01/19/2024
|
406
|
$
|
315,868
|
$
|
5,075
|
|||||||
|
Wyndham Hotels & Resorts, Inc. (f)
|
||||||||||||
|
Exercise Price: $75.00, Expiration: 11/17/2023
|
8
|
57,920
|
680
|
|||||||||
|
Exercise Price: $80.00, Expiration: 12/15/2023
|
7
|
50,680
|
403
|
|||||||||
|
130,523
|
||||||||||||
|
Puts – 0.02%
|
||||||||||||
|
Advance Auto Parts, Inc. (f)
|
||||||||||||
|
Exercise Price: $47.50, Expiration: 11/17/2023
|
22
|
114,466
|
4,015
|
|||||||||
|
Caterpillar, Inc. (f)
|
||||||||||||
|
Exercise Price: $230.00, Expiration: 11/17/2023
|
3
|
67,815
|
2,228
|
|||||||||
|
Dexcom, Inc. (f)
|
||||||||||||
|
Exercise Price: $80.00, Expiration: 11/17/2023
|
1
|
8,883
|
86
|
|||||||||
|
Ferrari N.V. (f)
|
||||||||||||
|
Exercise Price: $290.00, Expiration: 11/17/2023
|
3
|
90,492
|
1,065
|
|||||||||
|
Goodyear Tire & Rubber Co. (f)
|
||||||||||||
|
Exercise Price: $11.50, Expiration: 11/17/2023
|
48
|
57,120
|
2,400
|
|||||||||
|
Exercise Price: $11.50, Expiration: 11/03/2023
|
32
|
38,080
|
400
|
|||||||||
|
GSK plc (f)
|
||||||||||||
|
Exercise Price: $34.50, Expiration: 11/03/2023
|
32
|
114,240
|
800
|
|||||||||
|
Health Care Select Sector SPDR Fund (f)
|
||||||||||||
|
Exercise Price: $123.00, Expiration: 11/03/2023
|
8
|
99,632
|
160
|
|||||||||
|
Exercise Price: $127.00, Expiration: 11/03/2023
|
8
|
99,632
|
2,244
|
|||||||||
|
Humana, Inc. (f)
|
||||||||||||
|
Exercise Price: $510.00, Expiration: 11/03/2023
|
3
|
157,107
|
1,410
|
|||||||||
|
iShares iBoxx High Yield Corporate Bond ETF (f)
|
||||||||||||
|
Exercise Price: $67.00, Expiration: 12/15/2023
|
97
|
703,929
|
922
|
|||||||||
|
iShares Russell 2000 ETF (f)
|
||||||||||||
|
Exercise Price: $154.00, Expiration: 11/17/2023
|
40
|
658,080
|
2,160
|
|||||||||
|
Knight-Swift Transportation Holdings, Inc. (f)
|
||||||||||||
|
Exercise Price: $45.00, Expiration: 11/17/2023
|
38
|
185,782
|
855
|
|||||||||
|
Liberty Media Corp.-Liberty SiriusXM (f)
|
||||||||||||
|
Exercise Price: $23.00, Expiration: 11/17/2023
|
64
|
157,120
|
1,760
|
|||||||||
|
NVIDIA Corp. (f)
|
||||||||||||
|
Exercise Price: $365.00, Expiration: 11/17/2023
|
3
|
122,340
|
930
|
|||||||||
|
O’Reilly Automotive, Inc. (f)
|
||||||||||||
|
Exercise Price: $830.00, Expiration: 11/17/2023
|
2
|
186,088
|
100
|
|||||||||
|
Pfizer, Inc. (f)
|
||||||||||||
|
Exercise Price: $29.00, Expiration: 11/03/2023
|
48
|
146,688
|
168
|
|||||||||
The accompanying notes are an integral part of these financial statements.
28
WEISS ALTERNATIVE MULTI-STRATEGY FUND
Schedule of Investments – Continued
October 31, 2023
|
Notional
|
||||||||||||
|
Contracts
|
Amount
|
Value
|
||||||||||
|
Puts – 0.02% (Continued)
|
||||||||||||
|
Sanofi SA (f)
|
||||||||||||
|
Exercise Price: $52.50, Expiration: 11/17/2023
|
19
|
$
|
85,975
|
$
|
13,585
|
|||||||
|
Sirius XM Holdings, Inc. (f)
|
||||||||||||
|
Exercise Price: $4.00, Expiration: 11/17/2023
|
65
|
27,820
|
1,528
|
|||||||||
|
Exercise Price: $4.00, Expiration: 11/03/2023
|
82
|
35,096
|
246
|
|||||||||
|
Exercise Price: $4.50, Expiration: 11/03/2023
|
35
|
14,980
|
1,138
|
|||||||||
|
SPDR S&P 500 ETF (f)
|
||||||||||||
|
Exercise Price: $397.00, Expiration: 11/17/2023
|
32
|
1,338,240
|
3,776
|
|||||||||
|
Exercise Price: $415.00, Expiration: 11/03/2023
|
8
|
334,560
|
1,620
|
|||||||||
|
TechnipFMC plc (f)
|
||||||||||||
|
Exercise Price: $20.00, Expiration: 11/17/2023
|
16
|
34,432
|
360
|
|||||||||
|
Veeva Systems, Inc. (f)
|
||||||||||||
|
Exercise Price: $190.00, Expiration: 11/17/2023
|
8
|
154,168
|
3,120
|
|||||||||
|
47,076
|
||||||||||||
|
Total Purchased Options
|
||||||||||||
|
(Cost $274,807)
|
177,599
|
|||||||||||
|
Contracts
|
||||||||
|
WARRANT – 0.00%
|
||||||||
|
Biotechnology – 0.00%
|
||||||||
|
Zealand Pharma A/S (a)(b)(e)
|
||||||||
|
Exercise Price: $12.00, Expiration: 11/20/2023
|
1,688
|
—
|
||||||
|
Total Warrant
|
||||||||
|
(Cost $17)
|
—
|
|||||||
|
CONTINGENT VALUE RIGHTS – 0.00%
|
||||||||
|
Novartis AG (a)(e)
|
63
|
—
|
||||||
|
Kinross Gold Corp. (a)(b)(e)
|
835
|
—
|
||||||
|
Resolute Forest Products (a)(e)
|
873
|
—
|
||||||
|
Total Contingent Value Rights
|
||||||||
|
(Cost $2,357)
|
—
|
|||||||
The accompanying notes are an integral part of these financial statements.
29
WEISS ALTERNATIVE MULTI-STRATEGY FUND
Schedule of Investments – Continued
October 31, 2023
|
Shares
|
Value
|
|||||||
|
MONEY MARKET FUND – 4.23%
|
||||||||
|
Fidelity Government Portfolio, Class I, 5.24% (g)
|
9,191,406
|
$
|
9,191,406
|
|||||
|
Total Money Market Fund
|
||||||||
|
(Cost $9,191,406)
|
9,191,406
|
|||||||
|
Total Investments
|
||||||||
|
(Cost $138,266,567) – 60.27%
|
130,965,619
|
|||||||
|
Other Assets in Excess of Liabilities – 39.73%
|
86,349,949
|
|||||||
|
Total Net Assets – 100.00%
|
$
|
217,315,568
|
||||||
|
(a)
|
Non-income producing security.
|
|
(b)
|
Foreign issued security.
|
|
(c)
|
All or a portion of security has been committed as collateral for open securities sold short, written option contracts, swap contacts, and futures contracts. The total value of assets committed
as collateral as of October 31, 2023 is $95,322,759.
|
|
(d)
|
Held in connection with written option contracts. See Schedule of Written Options for further information.
|
|
(e)
|
Level three security. See Note 2 in the Notes to Financial Statements.
|
|
(f)
|
100 shares per contract.
|
|
(g)
|
The rate quoted is the annualized seven-day effective yield as of October 31, 2023.
|
ADR – American Depository Receipt
ETF – Exchange Traded Fund
plc – Public Limited Company
The Global Industry Classification Standard (GICS®) was developed by and/or is the exclusive property of MSCI, Inc. and
Standard & Poor Financial Services LLC (“S&P”). GICS is a service mark of MSCI and S&P and has been licensed for use by U.S. Bancorp Fund Services, LLC.
The accompanying notes are an integral part of these financial statements.
30
WEISS ALTERNATIVE MULTI-STRATEGY FUND
Schedule of Securities Sold Short
October 31, 2023
|
Shares
|
Value
|
|||||||
|
SHORT COMMON STOCKS (a) – (37.40)%
|
||||||||
|
Aerospace & Defense – (0.07)%
|
||||||||
|
HEICO Corp. – Class A
|
(470
|
)
|
$
|
(74,453
|
)
|
|||
|
MTU Aero Engines AG (b)
|
(479
|
)
|
(90,031
|
)
|
||||
|
(164,484
|
)
|
|||||||
|
Air Freight & Logistics – (0.09)%
|
||||||||
|
C.H. Robinson Worldwide, Inc.
|
(319
|
)
|
(26,104
|
)
|
||||
|
Expeditors International of Washington, Inc.
|
(954
|
)
|
(104,225
|
)
|
||||
|
Hub Group, Inc. – Class A
|
(957
|
)
|
(65,794
|
)
|
||||
|
(196,123
|
)
|
|||||||
|
Automobiles – (0.28)%
|
||||||||
|
Ford Motor Co.
|
(4,387
|
)
|
(42,773
|
)
|
||||
|
General Motors Co.
|
(1,193
|
)
|
(33,643
|
)
|
||||
|
Lucid Group, Inc.
|
(6,397
|
)
|
(26,356
|
)
|
||||
|
Stellantis N.V. (b)
|
(12,084
|
)
|
(225,729
|
)
|
||||
|
Tesla Motors, Inc.
|
(1,382
|
)
|
(277,560
|
)
|
||||
|
(606,061
|
)
|
|||||||
|
Banks – (1.85)%
|
||||||||
|
Associated Banc-Corp.
|
(8,897
|
)
|
(144,220
|
)
|
||||
|
Cadence Bank
|
(6,498
|
)
|
(137,628
|
)
|
||||
|
Citigroup, Inc.
|
(11,050
|
)
|
(436,365
|
)
|
||||
|
First Hawaiian, Inc.
|
(2,548
|
)
|
(45,686
|
)
|
||||
|
First Horizon Corp.
|
(3,980
|
)
|
(42,785
|
)
|
||||
|
Hancock Whitney Corp.
|
(5,376
|
)
|
(185,096
|
)
|
||||
|
JPMorgan Chase & Co.
|
(3,005
|
)
|
(417,875
|
)
|
||||
|
KeyCorp
|
(32,726
|
)
|
(334,460
|
)
|
||||
|
M&T Bank Corp.
|
(1,643
|
)
|
(185,248
|
)
|
||||
|
New York Community Bancorp, Inc.
|
(45,955
|
)
|
(435,653
|
)
|
||||
|
PNC Financial Services Group, Inc.
|
(2,311
|
)
|
(264,540
|
)
|
||||
|
Prosperity Bancshares, Inc.
|
(2,050
|
)
|
(111,807
|
)
|
||||
|
Regions Financial Corp.
|
(19,994
|
)
|
(290,513
|
)
|
||||
|
Simmons First National Corp. – Class A
|
(6,401
|
)
|
(90,958
|
)
|
||||
|
Synovus Financial Corp.
|
(3,758
|
)
|
(97,971
|
)
|
||||
|
U.S. Bancorp
|
(13,933
|
)
|
(444,184
|
)
|
||||
|
United Bankshares, Inc.
|
(4,090
|
)
|
(116,320
|
)
|
||||
|
United Community Banks, Inc.
|
(4,145
|
)
|
(91,563
|
)
|
||||
|
Zions Bancorporation NA
|
(5,329
|
)
|
(164,400
|
)
|
||||
|
(4,037,272
|
)
|
|||||||
The accompanying notes are an integral part of these financial statements.
31
WEISS ALTERNATIVE MULTI-STRATEGY FUND
Schedule of Securities Sold Short – Continued
October 31, 2023
|
Shares
|
Value
|
|||||||
|
Beverages – (0.75)%
|
||||||||
|
Constellation Brands, Inc. – Class A
|
(243
|
)
|
$
|
(56,899
|
)
|
|||
|
Monster Beverage Corp.
|
(3,555
|
)
|
(181,661
|
)
|
||||
|
National Beverage Corp.
|
(1,640
|
)
|
(76,063
|
)
|
||||
|
PepsiCo, Inc.
|
(8,091
|
)
|
(1,321,098
|
)
|
||||
|
(1,635,721
|
)
|
|||||||
|
Biotechnology – (0.86)%
|
||||||||
|
Akero Therapeutics, Inc.
|
(797
|
)
|
(9,500
|
)
|
||||
|
Alnylam Pharmaceuticals, Inc.
|
(479
|
)
|
(72,712
|
)
|
||||
|
Amgen, Inc.
|
(998
|
)
|
(255,189
|
)
|
||||
|
Arcellx, Inc.
|
(849
|
)
|
(29,927
|
)
|
||||
|
Arcturus Therapeutics Holdings, Inc.
|
(2,893
|
)
|
(55,256
|
)
|
||||
|
Arrowhead Pharmaceuticals, Inc.
|
(1,310
|
)
|
(32,213
|
)
|
||||
|
Beam Therapeutics, Inc.
|
(318
|
)
|
(6,723
|
)
|
||||
|
BeiGene Ltd. – ADR (b)
|
(655
|
)
|
(122,013
|
)
|
||||
|
Bicycle Therapeutics plc – ADR (b)
|
(1,341
|
)
|
(20,182
|
)
|
||||
|
BioMarin Pharmaceutical, Inc.
|
(1,335
|
)
|
(108,736
|
)
|
||||
|
BioNTech S.E. – ADR (b)
|
(766
|
)
|
(71,652
|
)
|
||||
|
Bridgebio Pharma, Inc.
|
(3,105
|
)
|
(80,854
|
)
|
||||
|
Cabaletta Bio, Inc.
|
(1,670
|
)
|
(23,814
|
)
|
||||
|
Editas Medicine, Inc.
|
(1,841
|
)
|
(12,298
|
)
|
||||
|
Exact Sciences Corp.
|
(1,433
|
)
|
(88,258
|
)
|
||||
|
Gilead Sciences, Inc.
|
(4,263
|
)
|
(334,817
|
)
|
||||
|
Halozyme Therapeutics, Inc.
|
(931
|
)
|
(31,533
|
)
|
||||
|
IGM Biosciences, Inc.
|
(957
|
)
|
(3,771
|
)
|
||||
|
Immunocore Holdings plc – ADR (b)
|
(880
|
)
|
(39,072
|
)
|
||||
|
Intellia Therapeutics, Inc.
|
(1,436
|
)
|
(35,972
|
)
|
||||
|
Ionis Pharmaceuticals, Inc.
|
(1,211
|
)
|
(53,611
|
)
|
||||
|
iTeos Therapeutics, Inc.
|
(1,251
|
)
|
(12,585
|
)
|
||||
|
Krystal Biotech, Inc.
|
(191
|
)
|
(22,322
|
)
|
||||
|
Moderna, Inc.
|
(1,372
|
)
|
(104,217
|
)
|
||||
|
Nurix Therapeutics, Inc.
|
(1,244
|
)
|
(6,954
|
)
|
||||
|
PTC Therapeutics, Inc.
|
(207
|
)
|
(3,881
|
)
|
||||
|
RAPT Therapeutics, Inc.
|
(2,480
|
)
|
(32,612
|
)
|
||||
|
Recursion Pharmaceuticals, Inc. – Class A
|
(5,591
|
)
|
(29,520
|
)
|
||||
|
Revolution Medicines, Inc.
|
(160
|
)
|
(3,168
|
)
|
||||
|
Rhythm Pharmaceuticals, Inc.
|
(1,167
|
)
|
(26,969
|
)
|
||||
|
Rocket Pharmaceuticals, Inc.
|
(2,737
|
)
|
(49,540
|
)
|
||||
|
Scholar Rock Holding Corp.
|
(1,848
|
)
|
(21,732
|
)
|
||||
|
Seagen, Inc.
|
(218
|
)
|
(46,393
|
)
|
||||
|
Zealand Pharma A/S (b)
|
(506
|
)
|
(21,019
|
)
|
||||
|
(1,869,015
|
)
|
|||||||
The accompanying notes are an integral part of these financial statements.
32
WEISS ALTERNATIVE MULTI-STRATEGY FUND
Schedule of Securities Sold Short – Continued
October 31, 2023
|
Shares
|
Value
|
|||||||
|
Broadline Retail – (0.02)%
|
||||||||
|
Etsy, Inc.
|
(281
|
)
|
$
|
(17,506
|
)
|
|||
|
PDD Holdings, Inc. – ADR (b)
|
(335
|
)
|
(33,975
|
)
|
||||
|
(51,481
|
)
|
|||||||
|
Building Products – (0.09)%
|
||||||||
|
Allegion plc (b)
|
(175
|
)
|
(17,213
|
)
|
||||
|
Armstrong World Industries, Inc.
|
(513
|
)
|
(38,932
|
)
|
||||
|
Carrier Global Corp.
|
(1,611
|
)
|
(76,780
|
)
|
||||
|
Fortune Brands Home & Security, Inc.
|
(1,189
|
)
|
(66,346
|
)
|
||||
|
(199,271
|
)
|
|||||||
|
Capital Markets – (2.41)%
|
||||||||
|
Ameriprise Financial, Inc.
|
(619
|
)
|
(194,719
|
)
|
||||
|
Ares Management Corp. – Class A
|
(2,862
|
)
|
(282,165
|
)
|
||||
|
Artisan Partners Asset Management, Inc. – Class A
|
(6,121
|
)
|
(201,993
|
)
|
||||
|
B Riley Financial, Inc.
|
(300
|
)
|
(10,863
|
)
|
||||
|
BlackRock, Inc.
|
(1,113
|
)
|
(681,467
|
)
|
||||
|
Blackstone, Inc.
|
(4,799
|
)
|
(443,188
|
)
|
||||
|
Brookfield Asset Management Ltd. – Class A (b)
|
(2,242
|
)
|
(64,278
|
)
|
||||
|
Carlyle Group, Inc.
|
(3,483
|
)
|
(95,922
|
)
|
||||
|
CME Group, Inc.
|
(2,084
|
)
|
(444,851
|
)
|
||||
|
Coinbase Global, Inc. – Class A
|
(508
|
)
|
(39,177
|
)
|
||||
|
Deutsche Bank AG (b)
|
(4,611
|
)
|
(50,742
|
)
|
||||
|
Evercore, Inc. – Class A
|
(2,617
|
)
|
(340,681
|
)
|
||||
|
Franklin Resources, Inc.
|
(3,180
|
)
|
(72,472
|
)
|
||||
|
Hamilton Lane, Inc. – Class A
|
(563
|
)
|
(47,360
|
)
|
||||
|
Intercontinental Exchange, Inc.
|
(949
|
)
|
(101,961
|
)
|
||||
|
Invesco Ltd. (b)
|
(25,788
|
)
|
(334,470
|
)
|
||||
|
Janus Henderson Group plc (b)
|
(6,137
|
)
|
(141,581
|
)
|
||||
|
Moelis & Co. – Class A
|
(5,105
|
)
|
(212,572
|
)
|
||||
|
Moody’s Corp.
|
(520
|
)
|
(160,160
|
)
|
||||
|
Morgan Stanley
|
(4,137
|
)
|
(292,982
|
)
|
||||
|
Northern Trust Corp.
|
(2,311
|
)
|
(152,318
|
)
|
||||
|
Raymond James Financial, Inc.
|
(2,308
|
)
|
(220,276
|
)
|
||||
|
State Street Corp.
|
(4,372
|
)
|
(282,562
|
)
|
||||
|
T. Rowe Price Group, Inc.
|
(2,962
|
)
|
(268,061
|
)
|
||||
|
TPG, Inc.
|
(3,513
|
)
|
(97,099
|
)
|
||||
|
(5,233,920
|
)
|
|||||||
|
Chemicals – (0.40)%
|
||||||||
|
Albemarle Corp.
|
(827
|
)
|
(104,847
|
)
|
||||
|
Dow, Inc.
|
(1,595
|
)
|
(77,102
|
)
|
||||
The accompanying notes are an integral part of these financial statements.
33
WEISS ALTERNATIVE MULTI-STRATEGY FUND
Schedule of Securities Sold Short – Continued
October 31, 2023
|
Shares
|
Value
|
|||||||
|
Chemicals – (0.40)% (Continued)
|
||||||||
|
DuPont de Nemours, Inc.
|
(408
|
)
|
$
|
(29,735
|
)
|
|||
|
LyondellBasell Industries N.V. – Class A (b)
|
(2,011
|
)
|
(181,473
|
)
|
||||
|
PPG Industries, Inc.
|
(955
|
)
|
(117,245
|
)
|
||||
|
Scotts Miracle-Gro Co.
|
(368
|
)
|
(16,354
|
)
|
||||
|
Westlake Corp.
|
(2,918
|
)
|
(336,621
|
)
|
||||
|
(863,377
|
)
|
|||||||
|
Commercial Services & Supplies – (0.08)%
|
||||||||
|
MillerKnoll, Inc.
|
(1,113
|
)
|
(26,156
|
)
|
||||
|
Tetra Tech, Inc.
|
(700
|
)
|
(105,637
|
)
|
||||
|
Vestis Corp.
|
(1,594
|
)
|
(24,372
|
)
|
||||
|
Waste Management, Inc.
|
(122
|
)
|
(20,048
|
)
|
||||
|
(176,213
|
)
|
|||||||
|
Communications Equipment – (0.07)%
|
||||||||
|
NetScout Systems, Inc.
|
(1,600
|
)
|
(34,928
|
)
|
||||
|
Telefonaktiebolaget LM Ericsson – ADR (b)
|
(13,859
|
)
|
(61,811
|
)
|
||||
|
ViaSat, Inc.
|
(1,725
|
)
|
(31,809
|
)
|
||||
|
Viavi Solutions, Inc.
|
(3,195
|
)
|
(24,857
|
)
|
||||
|
(153,405
|
)
|
|||||||
|
Construction & Engineering – (0.03)%
|
||||||||
|
MasTec, Inc.
|
(499
|
)
|
(29,661
|
)
|
||||
|
WillScot Mobile Mini Holdings Corp.
|
(954
|
)
|
(37,597
|
)
|
||||
|
(67,258
|
)
|
|||||||
|
Construction Materials – (0.03)%
|
||||||||
|
Vulcan Materials Co.
|
(287
|
)
|
(56,393
|
)
|
||||
|
Consumer Finance – (0.68)%
|
||||||||
|
American Express Co.
|
(3,694
|
)
|
(539,435
|
)
|
||||
|
Capital One Financial Corp.
|
(2,811
|
)
|
(284,726
|
)
|
||||
|
Credit Acceptance Corp.
|
(55
|
)
|
(22,134
|
)
|
||||
|
Discover Financial Services
|
(3,541
|
)
|
(290,645
|
)
|
||||
|
SoFi Technologies, Inc.
|
(1,276
|
)
|
(9,634
|
)
|
||||
|
Synchrony Financial
|
(11,902
|
)
|
(333,851
|
)
|
||||
|
(1,480,425
|
)
|
|||||||
|
Consumer Staples Distribution & Retail – (0.45)%
|
||||||||
|
BJ’s Wholesale Club Holdings, Inc.
|
(1,696
|
)
|
(115,532
|
)
|
||||
|
Costco Wholesale Corp.
|
(760
|
)
|
(419,855
|
)
|
||||
|
Dollar General Corp.
|
(411
|
)
|
(48,925
|
)
|
||||
|
Kroger Co.
|
(2,711
|
)
|
(122,998
|
)
|
||||
The accompanying notes are an integral part of these financial statements.
34
WEISS ALTERNATIVE MULTI-STRATEGY FUND
Schedule of Securities Sold Short – Continued
October 31, 2023
|
Shares
|
Value
|
|||||||
|
Consumer Staples Distribution & Retail – (0.45)% (Continued)
|
||||||||
|
US Foods Holding Corp.
|
(4,540
|
)
|
$
|
(176,788
|
)
|
|||
|
Weis Markets, Inc.
|
(1,574
|
)
|
(102,467
|
)
|
||||
|
(986,565
|
)
|
|||||||
|
Diversified REITs – (0.16)%
|
||||||||
|
Broadstone Net Lease, Inc.
|
(23,808
|
)
|
(336,883
|
)
|
||||
|
Diversified Telecommunication Services – (0.03)%
|
||||||||
|
Verizon Communications, Inc.
|
(1,914
|
)
|
(67,239
|
)
|
||||
|
Electrical Equipment – (0.07)%
|
||||||||
|
Acuity Brands, Inc.
|
(158
|
)
|
(25,591
|
)
|
||||
|
Atkore, Inc.
|
(191
|
)
|
(23,737
|
)
|
||||
|
Hubbell, Inc.
|
(204
|
)
|
(55,100
|
)
|
||||
|
Rockwell Automation, Inc.
|
(199
|
)
|
(52,299
|
)
|
||||
|
(156,727
|
)
|
|||||||
|
Electronic Equipment, Instruments & Components – (0.20)%
|
||||||||
|
Belden, Inc.
|
(2,385
|
)
|
(169,097
|
)
|
||||
|
Cognex Corp.
|
(542
|
)
|
(19,507
|
)
|
||||
|
Keysight Technologies, Inc.
|
(1,605
|
)
|
(195,889
|
)
|
||||
|
Vishay Intertechnology, Inc.
|
(2,824
|
)
|
(62,806
|
)
|
||||
|
(447,299
|
)
|
|||||||
|
Energy Equipment & Services – (0.72)%
|
||||||||
|
Baker Hughes Co.
|
(18,650
|
)
|
(641,934
|
)
|
||||
|
Geospace Technologies Corp.
|
(218
|
)
|
(2,614
|
)
|
||||
|
Helmerich & Payne, Inc.
|
(3,818
|
)
|
(151,078
|
)
|
||||
|
Kodiak Gas Services, Inc.
|
(153
|
)
|
(2,630
|
)
|
||||
|
Liberty Energy, Inc.
|
(8,632
|
)
|
(170,051
|
)
|
||||
|
Nine Energy Service, Inc.
|
(722
|
)
|
(2,541
|
)
|
||||
|
ProFrac Holding Corp. – Class A
|
(294
|
)
|
(2,769
|
)
|
||||
|
RPC, Inc.
|
(2,722
|
)
|
(22,647
|
)
|
||||
|
Schlumberger N.V. Ltd. (b)
|
(2,233
|
)
|
(124,289
|
)
|
||||
|
TechnipFMC plc (b)
|
(20,263
|
)
|
(436,060
|
)
|
||||
|
(1,556,613
|
)
|
|||||||
|
Entertainment – (0.08)%
|
||||||||
|
Electronic Arts, Inc.
|
(320
|
)
|
(39,613
|
)
|
||||
|
Liberty Media Corp.-Liberty Formula One – Class C
|
(189
|
)
|
(12,226
|
)
|
||||
|
Manchester United plc – Class A (b)
|
(60
|
)
|
(1,076
|
)
|
||||
The accompanying notes are an integral part of these financial statements.
35
WEISS ALTERNATIVE MULTI-STRATEGY FUND
Schedule of Securities Sold Short – Continued
October 31, 2023
|
Shares
|
Value
|
|||||||
|
Entertainment – (0.08)% (Continued)
|
||||||||
|
Netflix, Inc.
|
(33
|
)
|
$
|
(13,586
|
)
|
|||
|
Spotify Technology S.A. (b)
|
(609
|
)
|
(100,339
|
)
|
||||
|
(166,840
|
)
|
|||||||
|
Financial Services – (0.20)%
|
||||||||
|
Affirm Holdings, Inc.
|
(2,385
|
)
|
(42,000
|
)
|
||||
|
Fiserv, Inc.
|
(542
|
)
|
(61,653
|
)
|
||||
|
Jack Henry & Associates, Inc.
|
(339
|
)
|
(47,796
|
)
|
||||
|
PayPal Holdings, Inc.
|
(1,743
|
)
|
(90,287
|
)
|
||||
|
Visa, Inc. – Class A
|
(624
|
)
|
(146,702
|
)
|
||||
|
Voya Financial, Inc.
|
(638
|
)
|
(42,599
|
)
|
||||
|
(431,037
|
)
|
|||||||
|
Food Products – (1.03)%
|
||||||||
|
Archer-Daniels-Midland Co.
|
(5,866
|
)
|
(419,830
|
)
|
||||
|
Bunge Ltd. (b)
|
(1,282
|
)
|
(135,866
|
)
|
||||
|
Flowers Foods, Inc.
|
(3,521
|
)
|
(77,216
|
)
|
||||
|
General Mills, Inc.
|
(11,714
|
)
|
(764,221
|
)
|
||||
|
Hain Celestial Group, Inc.
|
(7,727
|
)
|
(85,383
|
)
|
||||
|
Hershey Co.
|
(552
|
)
|
(103,417
|
)
|
||||
|
Hormel Foods Corp.
|
(5,460
|
)
|
(177,723
|
)
|
||||
|
J M Smucker Co.
|
(563
|
)
|
(64,092
|
)
|
||||
|
Nestle S.A. (b)
|
(1,501
|
)
|
(161,866
|
)
|
||||
|
Tyson Foods, Inc. – Class A
|
(5,341
|
)
|
(247,555
|
)
|
||||
|
(2,237,169
|
)
|
|||||||
|
Ground Transportation – (0.85)%
|
||||||||
|
ArcBest Corp.
|
(542
|
)
|
(59,013
|
)
|
||||
|
Canadian Pacific Kansas City Ltd. (b)
|
(236
|
)
|
(16,749
|
)
|
||||
|
Covenant Logistics Group, Inc.
|
(139
|
)
|
(5,488
|
)
|
||||
|
Landstar System, Inc.
|
(913
|
)
|
(150,444
|
)
|
||||
|
Old Dominion Freight Line, Inc.
|
(1,891
|
)
|
(712,264
|
)
|
||||
|
Ryder System, Inc.
|
(5,556
|
)
|
(541,932
|
)
|
||||
|
Saia, Inc.
|
(908
|
)
|
(325,509
|
)
|
||||
|
Schneider National, Inc. – Class B
|
(1,219
|
)
|
(30,877
|
)
|
||||
|
(1,842,276
|
)
|
|||||||
|
Health Care Equipment & Supplies – (0.37)%
|
||||||||
|
Align Technology, Inc.
|
(429
|
)
|
(79,189
|
)
|
||||
|
Baxter International, Inc.
|
(4,124
|
)
|
(133,741
|
)
|
||||
|
Becton Dickinson & Co.
|
(176
|
)
|
(44,489
|
)
|
||||
|
GE HealthCare Technologies, Inc.
|
(1,656
|
)
|
(110,240
|
)
|
||||
|
IDEXX Laboratories, Inc.
|
(44
|
)
|
(17,577
|
)
|
||||
The accompanying notes are an integral part of these financial statements.
36
WEISS ALTERNATIVE MULTI-STRATEGY FUND
Schedule of Securities Sold Short – Continued
October 31, 2023
|
Shares
|
Value
|
|||||||
|
Health Care Equipment & Supplies – (0.37)% (Continued)
|
||||||||
|
Medtronic plc (b)
|
(3,355
|
)
|
$
|
(236,729
|
)
|
|||
|
ResMed, Inc.
|
(1,173
|
)
|
(165,651
|
)
|
||||
|
Shockwave Medical, Inc.
|
(87
|
)
|
(17,945
|
)
|
||||
|
(805,561
|
)
|
|||||||
|
Health Care Providers & Services – (0.66)%
|
||||||||
|
Amedisys, Inc.
|
(1,207
|
)
|
(110,428
|
)
|
||||
|
Centene Corp.
|
(2,349
|
)
|
(162,034
|
)
|
||||
|
DaVita, Inc.
|
(1,792
|
)
|
(138,396
|
)
|
||||
|
Elevance Health, Inc.
|
(653
|
)
|
(293,909
|
)
|
||||
|
Fresenius Medical Care AG & Co. KGaA (b)
|
(2,314
|
)
|
(76,885
|
)
|
||||
|
HCA Holdings, Inc.
|
(1,170
|
)
|
(264,584
|
)
|
||||
|
LifeStance Health Group, Inc.
|
(1,426
|
)
|
(8,314
|
)
|
||||
|
Molina Healthcare, Inc.
|
(476
|
)
|
(158,484
|
)
|
||||
|
R1 RCM, Inc.
|
(10,217
|
)
|
(120,458
|
)
|
||||
|
UnitedHealth Group, Inc.
|
(190
|
)
|
(101,756
|
)
|
||||
|
(1,435,248
|
)
|
|||||||
|
Health Care REITs – (1.15)%
|
||||||||
|
Omega Healthcare Investors, Inc.
|
(35,759
|
)
|
(1,183,623
|
)
|
||||
|
Welltower, Inc.
|
(15,676
|
)
|
(1,310,670
|
)
|
||||
|
(2,494,293
|
)
|
|||||||
|
Health Care Technology – (0.06)%
|
||||||||
|
Doximity, Inc. – Class A
|
(4,721
|
)
|
(96,450
|
)
|
||||
|
Schrodinger, Inc.
|
(1,657
|
)
|
(35,957
|
)
|
||||
|
Veeva Systems, Inc. – Class A
|
(21
|
)
|
(4,047
|
)
|
||||
|
(136,454
|
)
|
|||||||
|
Hotel & Resort REITs – (0.18)%
|
||||||||
|
Host Hotels & Resorts, Inc.
|
(16,839
|
)
|
(260,668
|
)
|
||||
|
Park Hotels & Resorts, Inc.
|
(5,883
|
)
|
(67,831
|
)
|
||||
|
Pebblebrook Hotel Trust
|
(5,200
|
)
|
(62,036
|
)
|
||||
|
(390,535
|
)
|
|||||||
|
Hotels, Restaurants & Leisure – (2.27)%
|
||||||||
|
Airbnb, Inc. – Class A
|
(1,571
|
)
|
(185,834
|
)
|
||||
|
Caesars Entertainment, Inc.
|
(1,469
|
)
|
(58,598
|
)
|
||||
|
Carnival Corp. (b)
|
(45,980
|
)
|
(526,931
|
)
|
||||
|
Cheesecake Factory, Inc.
|
(5,381
|
)
|
(167,188
|
)
|
||||
|
Chipotle Mexican Grill, Inc.
|
(7
|
)
|
(13,595
|
)
|
||||
|
Choice Hotels International, Inc.
|
(962
|
)
|
(106,301
|
)
|
||||
|
Cracker Barrel Old Country Store, Inc.
|
(2,582
|
)
|
(171,342
|
)
|
||||
The accompanying notes are an integral part of these financial statements.
37
WEISS ALTERNATIVE MULTI-STRATEGY FUND
Schedule of Securities Sold Short – Continued
October 31, 2023
|
Shares
|
Value
|
|||||||
|
Hotels, Restaurants & Leisure – (2.27)% (Continued)
|
||||||||
|
Darden Restaurants, Inc.
|
(699
|
)
|
$
|
(101,726
|
)
|
|||
|
Dave & Buster’s Entertainment, Inc.
|
(2,995
|
)
|
(104,645
|
)
|
||||
|
DoorDash, Inc. – Class A
|
(4,746
|
)
|
(355,713
|
)
|
||||
|
Evolution AB(b)
|
(772
|
)
|
(68,789
|
)
|
||||
|
Expedia Group, Inc.
|
(2,806
|
)
|
(267,384
|
)
|
||||
|
H World Group Ltd. – ADR (b)
|
(4,080
|
)
|
(153,653
|
)
|
||||
|
Hyatt Hotels Corp. – Class A
|
(2,999
|
)
|
(307,218
|
)
|
||||
|
Jack in the Box, Inc.
|
(1,835
|
)
|
(115,935
|
)
|
||||
|
Las Vegas Sands Corp.
|
(1,649
|
)
|
(78,262
|
)
|
||||
|
Marriott International, Inc. – Class A
|
(3,086
|
)
|
(581,896
|
)
|
||||
|
McDonald’s Corp.
|
(1,708
|
)
|
(447,786
|
)
|
||||
|
MGM Resorts International
|
(11,340
|
)
|
(395,993
|
)
|
||||
|
Norwegian Cruise Line Holdings Ltd. (b)
|
(23,559
|
)
|
(320,402
|
)
|
||||
|
Red Rock Resorts, Inc. – Class A
|
(954
|
)
|
(37,731
|
)
|
||||
|
Restaurant Brands International, Inc. (b)
|
(2,354
|
)
|
(158,189
|
)
|
||||
|
Texas Roadhouse, Inc.
|
(2,077
|
)
|
(210,899
|
)
|
||||
|
(4,936,010
|
)
|
|||||||
|
Household Durables – (0.05)%
|
||||||||
|
Leggett & Platt, Inc.
|
(404
|
)
|
(9,466
|
)
|
||||
|
Mohawk Industries, Inc.
|
(236
|
)
|
(18,970
|
)
|
||||
|
Toll Brothers, Inc.
|
(890
|
)
|
(62,932
|
)
|
||||
|
Whirlpool Corp.
|
(160
|
)
|
(16,730
|
)
|
||||
|
(108,098
|
)
|
|||||||
|
Household Products – (0.57)%
|
||||||||
|
Central Garden & Pet Co.
|
(281
|
)
|
(12,260
|
)
|
||||
|
Kimberly-Clark Corp.
|
(1,542
|
)
|
(184,485
|
)
|
||||
|
Procter & Gamble Co.
|
(6,926
|
)
|
(1,039,108
|
)
|
||||
|
(1,235,853
|
)
|
|||||||
|
Industrial Conglomerates – (0.08)%
|
||||||||
|
3M Company
|
(771
|
)
|
(70,122
|
)
|
||||
|
General Electric Co.
|
(955
|
)
|
(103,742
|
)
|
||||
|
(173,864
|
)
|
|||||||
|
Industrial REITs – (2.43)%
|
||||||||
|
Prologis, Inc.
|
(31,473
|
)
|
(3,170,905
|
)
|
||||
|
Terreno Realty Corp.
|
(39,601
|
)
|
(2,109,941
|
)
|
||||
|
(5,280,846
|
)
|
|||||||
The accompanying notes are an integral part of these financial statements.
38
WEISS ALTERNATIVE MULTI-STRATEGY FUND
Schedule of Securities Sold Short – Continued
October 31, 2023
|
Shares
|
Value
|
|||||||
|
Insurance – (0.63)%
|
||||||||
|
American International Group, Inc.
|
(1,436
|
)
|
$
|
(88,041
|
)
|
|||
|
Aon plc – Class A (b)
|
(727
|
)
|
(224,934
|
)
|
||||
|
First American Financial Corp.
|
(5,429
|
)
|
(279,268
|
)
|
||||
|
Hanover Insurance Group, Inc.
|
(986
|
)
|
(115,569
|
)
|
||||
|
Lemonade, Inc.
|
(132
|
)
|
(1,444
|
)
|
||||
|
Lincoln National Corp.
|
(2,988
|
)
|
(65,049
|
)
|
||||
|
Manulife Financial Corp. (b)
|
(7,991
|
)
|
(139,104
|
)
|
||||
|
Palomar Holdings, Inc.
|
(1,478
|
)
|
(74,018
|
)
|
||||
|
Principal Financial Group, Inc.
|
(1,801
|
)
|
(121,892
|
)
|
||||
|
Prudential Financial, Inc.
|
(303
|
)
|
(27,706
|
)
|
||||
|
Ryan Specialty Holdings, Inc.
|
(2,074
|
)
|
(89,597
|
)
|
||||
|
Zurich Insurance Group AG (b)
|
(296
|
)
|
(140,598
|
)
|
||||
|
(1,367,220
|
)
|
|||||||
|
Interactive Media & Services – (0.16)%
|
||||||||
|
Alphabet, Inc. – Class C
|
(234
|
)
|
(29,320
|
)
|
||||
|
fuboTV, Inc.
|
(40
|
)
|
(97
|
)
|
||||
|
Meta Platforms, Inc. – Class A
|
(780
|
)
|
(234,991
|
)
|
||||
|
Snap, Inc. – Class A
|
(8,514
|
)
|
(85,225
|
)
|
||||
|
(349,633
|
)
|
|||||||
|
IT Services – (0.27)%
|
||||||||
|
Accenture plc – Class A (b)
|
(1,595
|
)
|
(473,859
|
)
|
||||
|
Cognizant Technology Solutions Corp. – Class A
|
(666
|
)
|
(42,937
|
)
|
||||
|
Shopify, Inc. – Class A (b)
|
(702
|
)
|
(33,127
|
)
|
||||
|
Snowflake, Inc. – Class A
|
(234
|
)
|
(33,960
|
)
|
||||
|
(583,883
|
)
|
|||||||
|
Leisure Products – (0.02)%
|
||||||||
|
YETI Holdings, Inc.
|
(872
|
)
|
(37,077
|
)
|
||||
|
Life Sciences Tools & Services – (0.36)%
|
||||||||
|
10X Genomics, Inc. – Class A
|
(921
|
)
|
(32,493
|
)
|
||||
|
Avantor, Inc.
|
(9,512
|
)
|
(165,794
|
)
|
||||
|
Charles River Laboratories International, Inc.
|
(828
|
)
|
(139,402
|
)
|
||||
|
Evotec S.E. (b)
|
(1,973
|
)
|
(34,113
|
)
|
||||
|
ICON plc (b)
|
(424
|
)
|
(103,439
|
)
|
||||
|
IQVIA Holdings, Inc.
|
(966
|
)
|
(174,682
|
)
|
||||
|
PerkinElmer, Inc.
|
(564
|
)
|
(46,727
|
)
|
||||
|
Repligen Corp.
|
(687
|
)
|
(92,443
|
)
|
||||
|
(789,093
|
)
|
|||||||
The accompanying notes are an integral part of these financial statements.
39
WEISS ALTERNATIVE MULTI-STRATEGY FUND
Schedule of Securities Sold Short – Continued
October 31, 2023
|
Shares
|
Value
|
|||||||
|
Machinery – (0.64)%
|
||||||||
|
Caterpillar, Inc.
|
(61
|
)
|
$
|
(13,789
|
)
|
|||
|
CNH Industrial N.V. (b)
|
(5,606
|
)
|
(61,554
|
)
|
||||
|
Cummins, Inc.
|
(57
|
)
|
(12,329
|
)
|
||||
|
Deere & Co.
|
(412
|
)
|
(150,528
|
)
|
||||
|
Donaldson Co., Inc.
|
(1,863
|
)
|
(107,421
|
)
|
||||
|
Dover Corp.
|
(1,216
|
)
|
(158,019
|
)
|
||||
|
Fortive Corp.
|
(1,211
|
)
|
(79,054
|
)
|
||||
|
Gates Industrial Corp. plc (b)
|
(3,546
|
)
|
(38,722
|
)
|
||||
|
Illinois Tool Works, Inc.
|
(862
|
)
|
(193,191
|
)
|
||||
|
Ingersoll Rand, Inc.
|
(266
|
)
|
(16,141
|
)
|
||||
|
Kennametal, Inc.
|
(1,149
|
)
|
(26,553
|
)
|
||||
|
Lincoln Electric Holdings, Inc.
|
(1,038
|
)
|
(181,442
|
)
|
||||
|
Otis Worldwide Corp.
|
(1,259
|
)
|
(97,207
|
)
|
||||
|
PACCAR, Inc.
|
(128
|
)
|
(10,564
|
)
|
||||
|
RBC Bearings, Inc.
|
(159
|
)
|
(34,955
|
)
|
||||
|
Stanley Black & Decker, Inc.
|
(799
|
)
|
(67,955
|
)
|
||||
|
Terex Corp.
|
(1,793
|
)
|
(82,119
|
)
|
||||
|
Timken Co.
|
(771
|
)
|
(53,292
|
)
|
||||
|
(1,384,835
|
)
|
|||||||
|
Marine Transportation – (0.06)%
|
||||||||
|
Kuehne + Nagel International AG (b)
|
(445
|
)
|
(120,000
|
)
|
||||
|
Media – (0.51)%
|
||||||||
|
Charter Communications, Inc. – Class A
|
(585
|
)
|
(235,638
|
)
|
||||
|
Comcast Corp. – Class A
|
(11,130
|
)
|
(459,558
|
)
|
||||
|
Fox Corp. – Class A
|
(2,226
|
)
|
(67,648
|
)
|
||||
|
Paramount Global – Class B
|
(15,425
|
)
|
(167,824
|
)
|
||||
|
Sinclair, Inc.
|
(4,745
|
)
|
(51,578
|
)
|
||||
|
Sirius XM Holdings, Inc.
|
(9,163
|
)
|
(39,218
|
)
|
||||
|
The New York Times Co. – Class A
|
(2,153
|
)
|
(86,787
|
)
|
||||
|
(1,108,251
|
)
|
|||||||
|
Metals & Mining – (0.91)%
|
||||||||
|
Alumina Ltd. (b)
|
(212,566
|
)
|
(105,631
|
)
|
||||
|
Constellium SE (b)
|
(11,846
|
)
|
(187,167
|
)
|
||||
|
Core Lithium Ltd. (b)
|
(159,928
|
)
|
(36,774
|
)
|
||||
|
Coronado Global Resources, Inc. (b)
|
(32,845
|
)
|
(36,130
|
)
|
||||
|
First Quantum Minerals Ltd. (b)
|
(1,811
|
)
|
(20,986
|
)
|
||||
|
Fortescue Metals Group Ltd. (b)
|
(3,365
|
)
|
(47,870
|
)
|
||||
|
Freeport-McMoRan, Inc.
|
(12,542
|
)
|
(423,668
|
)
|
||||
|
IGO Ltd. (b)
|
(31,142
|
)
|
(188,576
|
)
|
||||
The accompanying notes are an integral part of these financial statements.
40
WEISS ALTERNATIVE MULTI-STRATEGY FUND
Schedule of Securities Sold Short – Continued
October 31, 2023
|
Shares
|
Value
|
|||||||
|
Metals & Mining – (0.91)% (Continued)
|
||||||||
|
Ivanhoe Mines Ltd. – Class A (b)
|
(11,374
|
)
|
$
|
(83,824
|
)
|
|||
|
Lithium Americas Corp. (b)
|
(8,902
|
)
|
(59,643
|
)
|
||||
|
MP Materials Corp.
|
(1,919
|
)
|
(31,472
|
)
|
||||
|
Newmont Corp.
|
(957
|
)
|
(35,859
|
)
|
||||
|
Nucor Corp.
|
(420
|
)
|
(62,072
|
)
|
||||
|
Pilbara Minerals Ltd. (b)
|
(63,800
|
)
|
(149,866
|
)
|
||||
|
Sibanye Stillwater Ltd. – ADR (b)
|
(11,881
|
)
|
(60,355
|
)
|
||||
|
Southern Copper Corp.
|
(5,523
|
)
|
(391,581
|
)
|
||||
|
Steel Dynamics, Inc.
|
(34
|
)
|
(3,621
|
)
|
||||
|
Stelco Holdings, Inc. (b)
|
(1,970
|
)
|
(55,517
|
)
|
||||
|
(1,980,612
|
)
|
|||||||
|
Mortgage Real Estate Investment Trusts (REITs) – (0.18)%
|
||||||||
|
AGNC Investment Corp.
|
(26,327
|
)
|
(194,293
|
)
|
||||
|
Annaly Capital Management, Inc.
|
(6,239
|
)
|
(97,391
|
)
|
||||
|
Blackstone Mortgage Trust, Inc. – Class A
|
(4,562
|
)
|
(91,012
|
)
|
||||
|
(382,696
|
)
|
|||||||
|
Office REITs – (1.13)%
|
||||||||
|
Alexandria Real Estate Equities, Inc.
|
(26,394
|
)
|
(2,458,073
|
)
|
||||
|
Oil, Gas & Consumable Fuels – (1.92)%
|
||||||||
|
APA Corp.
|
(4,638
|
)
|
(184,221
|
)
|
||||
|
Berry Petroleum Corp.
|
(315
|
)
|
(2,630
|
)
|
||||
|
Black Stone Minerals LP
|
(4,161
|
)
|
(74,898
|
)
|
||||
|
BP plc – ADR (b)
|
(1,932
|
)
|
(70,673
|
)
|
||||
|
BP Prudhoe Bay Royalty Trust
|
(499
|
)
|
(2,410
|
)
|
||||
|
Callon Petroleum Co.
|
(3,480
|
)
|
(129,978
|
)
|
||||
|
Canadian Natural Resources Ltd. (b)
|
(3,465
|
)
|
(220,131
|
)
|
||||
|
Cenovus Energy, Inc. (b)
|
(9,592
|
)
|
(183,015
|
)
|
||||
|
Cheniere Energy Partners LP
|
(150
|
)
|
(8,364
|
)
|
||||
|
Cheniere Energy, Inc.
|
(1,336
|
)
|
(222,337
|
)
|
||||
|
Chesapeake Energy Corp.
|
(3,336
|
)
|
(287,163
|
)
|
||||
|
Civitas Resources, Inc.
|
(2,384
|
)
|
(179,825
|
)
|
||||
|
CNX Resources Corp.
|
(14,026
|
)
|
(304,645
|
)
|
||||
|
Comstock Resources, Inc.
|
(1,964
|
)
|
(24,746
|
)
|
||||
|
ConocoPhillips
|
(1,585
|
)
|
(188,298
|
)
|
||||
|
CONSOL Energy, Inc.
|
(1,479
|
)
|
(135,905
|
)
|
||||
|
Coterra Energy, Inc.
|
(94
|
)
|
(2,585
|
)
|
||||
|
CVR Energy, Inc.
|
(85
|
)
|
(2,784
|
)
|
||||
|
Delek Logistics Partners LP
|
(194
|
)
|
(8,967
|
)
|
||||
|
Devon Energy Corp.
|
(4,057
|
)
|
(188,934
|
)
|
||||
The accompanying notes are an integral part of these financial statements.
41
WEISS ALTERNATIVE MULTI-STRATEGY FUND
Schedule of Securities Sold Short – Continued
October 31, 2023
|
Shares
|
Value
|
|||||||
|
Oil, Gas & Consumable Fuels – (1.92)% (Continued)
|
||||||||
|
Dorchester Minerals LP
|
(286
|
)
|
$
|
(7,979
|
)
|
|||
|
Earthstone Energy, Inc. – Class A
|
(1,097
|
)
|
(23,224
|
)
|
||||
|
Ecopetrol SA – ADR (b)
|
(218
|
)
|
(2,575
|
)
|
||||
|
Encore Energy Corp. (b)
|
(809
|
)
|
(2,670
|
)
|
||||
|
Energy Fuels, Inc. (b)
|
(3,027
|
)
|
(24,246
|
)
|
||||
|
Eni SpA – ADR (b)
|
(81
|
)
|
(2,637
|
)
|
||||
|
EOG Resources, Inc.
|
(1,888
|
)
|
(238,360
|
)
|
||||
|
EQT Corp.
|
(566
|
)
|
(23,987
|
)
|
||||
|
Equinor ASA – ADR (b)
|
(3,940
|
)
|
(131,478
|
)
|
||||
|
Evolution Petroleum Corp.
|
(403
|
)
|
(2,591
|
)
|
||||
|
Excelerate Energy, Inc. – Class A
|
(176
|
)
|
(2,503
|
)
|
||||
|
Gran Tierra Energy, Inc. (b)
|
(2,080
|
)
|
(12,730
|
)
|
||||
|
Granite Ridge Resources, Inc.
|
(426
|
)
|
(2,624
|
)
|
||||
|
International Seaways, Inc.
|
(56
|
)
|
(2,693
|
)
|
||||
|
Kimbell Royalty Partners LP
|
(163
|
)
|
(2,628
|
)
|
||||
|
Kinetik Holdings, Inc.
|
(76
|
)
|
(2,693
|
)
|
||||
|
Magnolia Oil & Gas Corp. – Class A
|
(117
|
)
|
(2,627
|
)
|
||||
|
MPLX LP
|
(230
|
)
|
(8,289
|
)
|
||||
|
New Fortress Energy, Inc.
|
(1,742
|
)
|
(52,783
|
)
|
||||
|
NexGen Energy Ltd. (b)
|
(4,030
|
)
|
(24,382
|
)
|
||||
|
NextDecade Corp.
|
(579
|
)
|
(2,542
|
)
|
||||
|
NuStar Energy LP
|
(482
|
)
|
(8,242
|
)
|
||||
|
Obsidian Energy Ltd. (b)
|
(319
|
)
|
(2,712
|
)
|
||||
|
Occidental Petroleum Corp.
|
(3,088
|
)
|
(190,869
|
)
|
||||
|
ONEOK, Inc.
|
(40
|
)
|
(2,608
|
)
|
||||
|
OPAL Fuels, Inc. – Class A
|
(2,103
|
)
|
(12,113
|
)
|
||||
|
Overseas Shipholding Group, Inc. – Class A
|
(555
|
)
|
(2,714
|
)
|
||||
|
Ovintiv, Inc.
|
(2,056
|
)
|
(98,688
|
)
|
||||
|
Pembina Pipeline Corp. (b)
|
(778
|
)
|
(23,947
|
)
|
||||
|
Pioneer Natural Resources Co.
|
(11
|
)
|
(2,629
|
)
|
||||
|
Plains All American Pipeline LP
|
(4,819
|
)
|
(73,008
|
)
|
||||
|
Plains GP Holdings LP – Class A
|
(1,484
|
)
|
(23,269
|
)
|
||||
|
San Juan Basin Royalty Trust
|
(366
|
)
|
(2,738
|
)
|
||||
|
SandRidge Energy, Inc.
|
(167
|
)
|
(2,647
|
)
|
||||
|
Scorpio Tankers, Inc. (b)
|
(48
|
)
|
(2,695
|
)
|
||||
|
SFL Corp. Ltd. (b)
|
(2,200
|
)
|
(23,892
|
)
|
||||
|
Shell plc – ADR (b)
|
(3,935
|
)
|
(256,327
|
)
|
||||
|
SM Energy Co.
|
(64
|
)
|
(2,580
|
)
|
||||
|
Southwestern Energy Co.
|
(373
|
)
|
(2,659
|
)
|
||||
|
Teekay Corp. – Class A (b)
|
(56
|
)
|
(2,783
|
)
|
||||
|
TORM plc – Class A (b)
|
(87
|
)
|
(2,640
|
)
|
||||
The accompanying notes are an integral part of these financial statements.
42
WEISS ALTERNATIVE MULTI-STRATEGY FUND
Schedule of Securities Sold Short – Continued
October 31, 2023
|
Shares
|
Value
|
|||||||
|
Oil, Gas & Consumable Fuels – (1.92)% (Continued)
|
||||||||
|
TotalEnergies S.E. – ADR (b)
|
(3,454
|
)
|
$
|
(230,036
|
)
|
|||
|
Transportadora de Gas del Sur SA – ADR (b)
|
(240
|
)
|
(2,450
|
)
|
||||
|
Ultrapar Participacoes SA – ADR (b)
|
(692
|
)
|
(2,775
|
)
|
||||
|
Unit Corp.
|
(49
|
)
|
(2,698
|
)
|
||||
|
Uranium Energy Corp.
|
(4,142
|
)
|
(24,645
|
)
|
||||
|
Uranium Royalty Corp. (b)
|
(8,477
|
)
|
(24,244
|
)
|
||||
|
Vermilion Energy, Inc. (b)
|
(181
|
)
|
(2,610
|
)
|
||||
|
Vertex Energy, Inc.
|
(604
|
)
|
(2,603
|
)
|
||||
|
Viper Energy Partners LP
|
(283
|
)
|
(8,060
|
)
|
||||
|
Vital Energy, Inc.
|
(2,256
|
)
|
(112,890
|
)
|
||||
|
Vitesse Energy, Inc.
|
(769
|
)
|
(18,218
|
)
|
||||
|
W&T Offshore, Inc.
|
(642
|
)
|
(2,664
|
)
|
||||
|
(4,172,403
|
)
|
|||||||
|
Paper & Forest Products – (0.02)%
|
||||||||
|
Louisiana-Pacific Corp.
|
(882
|
)
|
(45,229
|
)
|
||||
|
Passenger Airlines – (0.17)%
|
||||||||
|
American Airlines Group, Inc.
|
(11,416
|
)
|
(127,288
|
)
|
||||
|
Frontier Group Holdings, Inc.
|
(3,180
|
)
|
(10,780
|
)
|
||||
|
Southwest Airlines Co.
|
(10,456
|
)
|
(232,437
|
)
|
||||
|
(370,505
|
)
|
|||||||
|
Personal Care Products – (0.06)%
|
||||||||
|
Estee Lauder Cos., Inc. – Class A
|
(771
|
)
|
(99,359
|
)
|
||||
|
Medifast, Inc.
|
(599
|
)
|
(41,427
|
)
|
||||
|
(140,786
|
)
|
|||||||
|
Pharmaceuticals – (0.67)%
|
||||||||
|
Athira Pharma, Inc.
|
(116
|
)
|
(181
|
)
|
||||
|
Catalent, Inc.
|
(2,666
|
)
|
(91,684
|
)
|
||||
|
GSK plc – ADR (b)
|
(3,681
|
)
|
(131,412
|
)
|
||||
|
H Lundbeck A/S (b)
|
(21,435
|
)
|
(112,042
|
)
|
||||
|
Merck KGaA (b)
|
(1,137
|
)
|
(171,730
|
)
|
||||
|
Novartis AG – ADR (b)
|
(2,218
|
)
|
(207,561
|
)
|
||||
|
Novartis AG (b)
|
(1,302
|
)
|
(121,893
|
)
|
||||
|
Perrigo Co. plc (b)
|
(5,219
|
)
|
(144,253
|
)
|
||||
|
Roche Holding AG (b)
|
(608
|
)
|
(156,687
|
)
|
||||
|
Roche Holding AG – ADR (b)
|
(2,226
|
)
|
(71,967
|
)
|
||||
|
Royalty Pharma plc – Class A
|
(4,466
|
)
|
(120,001
|
)
|
||||
|
Sanofi SA – ADR (b)
|
(159
|
)
|
(7,195
|
)
|
||||
|
Tarsus Pharmaceuticals, Inc.
|
(481
|
)
|
(6,849
|
)
|
||||
|
Zoetis, Inc.
|
(714
|
)
|
(112,098
|
)
|
||||
|
(1,455,553
|
)
|
|||||||
The accompanying notes are an integral part of these financial statements.
43
WEISS ALTERNATIVE MULTI-STRATEGY FUND
Schedule of Securities Sold Short – Continued
October 31, 2023
|
Shares
|
Value
|
|||||||
|
Professional Services – (0.19)%
|
||||||||
|
Equifax, Inc.
|
(719
|
)
|
$
|
(121,921
|
)
|
|||
|
Exponent, Inc.
|
(1,079
|
)
|
(79,080
|
)
|
||||
|
FTI Consulting, Inc.
|
(439
|
)
|
(93,182
|
)
|
||||
|
Paychex, Inc.
|
(1,103
|
)
|
(122,488
|
)
|
||||
|
(416,671
|
)
|
|||||||
|
Residential REITs – (0.83)%
|
||||||||
|
Apartment Income REIT Corp.
|
(10,381
|
)
|
(303,229
|
)
|
||||
|
AvalonBay Communities, Inc.
|
(893
|
)
|
(148,006
|
)
|
||||
|
Camden Property Trust
|
(5,405
|
)
|
(458,776
|
)
|
||||
|
Equity Residential
|
(13,376
|
)
|
(740,094
|
)
|
||||
|
UDR, Inc.
|
(4,800
|
)
|
(152,688
|
)
|
||||
|
(1,802,793
|
)
|
|||||||
|
Retail REITs – (3.25)%
|
||||||||
|
Federal Realty Investment Trust
|
(19,148
|
)
|
(1,746,106
|
)
|
||||
|
Kite Realty Group Trust
|
(59,436
|
)
|
(1,267,176
|
)
|
||||
|
NETSTREIT Corp.
|
(13,674
|
)
|
(194,855
|
)
|
||||
|
Phillips Edison & Co., Inc.
|
(54,252
|
)
|
(1,915,637
|
)
|
||||
|
Realty Income Corp.
|
(21,211
|
)
|
(1,004,977
|
)
|
||||
|
Regency Centers Corp.
|
(4,618
|
)
|
(278,281
|
)
|
||||
|
Simon Property Group, Inc.
|
(323
|
)
|
(35,494
|
)
|
||||
|
SITE Centers Corp.
|
(6,594
|
)
|
(76,886
|
)
|
||||
|
Tanger Factory Outlet Centers, Inc.
|
(23,981
|
)
|
(540,772
|
)
|
||||
|
(7,060,184
|
)
|
|||||||
|
Semiconductors & Semiconductor Equipment – (0.71)%
|
||||||||
|
Allegro Microsystems, Inc.
|
(957
|
)
|
(24,844
|
)
|
||||
|
Ambarella, Inc. (b)
|
(2,769
|
)
|
(124,577
|
)
|
||||
|
Analog Devices, Inc.
|
(1,487
|
)
|
(233,950
|
)
|
||||
|
BE Semiconductor Industries N.V. (b)
|
(960
|
)
|
(99,168
|
)
|
||||
|
Cirrus Logic, Inc.
|
(2
|
)
|
(134
|
)
|
||||
|
Diodes, Inc.
|
(552
|
)
|
(35,924
|
)
|
||||
|
GlobalFoundries, Inc.
|
(640
|
)
|
(31,757
|
)
|
||||
|
NXP Semiconductors N.V. (b)
|
(960
|
)
|
(165,533
|
)
|
||||
|
ON Semiconductor Corp.
|
(957
|
)
|
(59,947
|
)
|
||||
|
Power Integrations, Inc.
|
(557
|
)
|
(38,617
|
)
|
||||
|
Silicon Laboratories, Inc.
|
(633
|
)
|
(58,350
|
)
|
||||
|
Skyworks Solutions, Inc.
|
(1,600
|
)
|
(138,784
|
)
|
||||
|
STMicroelectronics N.V. (b)
|
(1,914
|
)
|
(72,694
|
)
|
||||
|
Texas Instruments, Inc.
|
(3,191
|
)
|
(453,154
|
)
|
||||
|
(1,537,433
|
)
|
|||||||
The accompanying notes are an integral part of these financial statements.
44
WEISS ALTERNATIVE MULTI-STRATEGY FUND
Schedule of Securities Sold Short – Continued
October 31, 2023
|
Shares
|
Value
|
|||||||
|
Software – (0.18)%
|
||||||||
|
Aurora Innovation, Inc.
|
(41,470
|
)
|
$
|
(72,573
|
)
|
|||
|
Fortinet, Inc.
|
(1,595
|
)
|
(91,186
|
)
|
||||
|
HashiCorp, Inc. – Class A
|
(3,199
|
)
|
(62,988
|
)
|
||||
|
HubSpot, Inc.
|
(140
|
)
|
(59,328
|
)
|
||||
|
Model N, Inc.
|
(366
|
)
|
(8,821
|
)
|
||||
|
Oracle Corp.
|
(636
|
)
|
(65,762
|
)
|
||||
|
Palantir Technologies, Inc. – Class A
|
(1,180
|
)
|
(17,464
|
)
|
||||
|
UiPath, Inc. – Class A
|
(175
|
)
|
(2,718
|
)
|
||||
|
(380,840
|
)
|
|||||||
|
Specialized REITs – (3.67)%
|
||||||||
|
American Tower Corp.
|
(8,613
|
)
|
(1,534,750
|
)
|
||||
|
Equinix, Inc.
|
(3,989
|
)
|
(2,910,534
|
)
|
||||
|
Four Corners Property Trust, Inc.
|
(55,572
|
)
|
(1,183,684
|
)
|
||||
|
Public Storage
|
(9,651
|
)
|
(2,303,790
|
)
|
||||
|
Weyerhaeuser Co.
|
(1,282
|
)
|
(36,781
|
)
|
||||
|
(7,969,539
|
)
|
|||||||
|
Specialty Retail – (0.63)%
|
||||||||
|
AutoNation, Inc.
|
(158
|
)
|
(20,553
|
)
|
||||
|
AutoZone, Inc.
|
(89
|
)
|
(220,465
|
)
|
||||
|
Best Buy Co., Inc.
|
(1,306
|
)
|
(87,267
|
)
|
||||
|
Carvana Co.
|
(954
|
)
|
(25,758
|
)
|
||||
|
Dick’s Sporting Goods, Inc.
|
(997
|
)
|
(106,629
|
)
|
||||
|
Floor & Decor Holdings, Inc. – Class A
|
(234
|
)
|
(19,282
|
)
|
||||
|
Foot Locker, Inc.
|
(2,703
|
)
|
(56,736
|
)
|
||||
|
Gap, Inc.
|
(6,177
|
)
|
(79,066
|
)
|
||||
|
Home Depot, Inc.
|
(170
|
)
|
(48,397
|
)
|
||||
|
Lithia Motors, Inc.
|
(235
|
)
|
(56,919
|
)
|
||||
|
Lowe’s Cos., Inc.
|
(1,420
|
)
|
(270,609
|
)
|
||||
|
RH
|
(95
|
)
|
(20,706
|
)
|
||||
|
Tractor Supply Co.
|
(1,547
|
)
|
(297,890
|
)
|
||||
|
Ulta Beauty, Inc.
|
(127
|
)
|
(48,426
|
)
|
||||
|
(1,358,703
|
)
|
|||||||
|
Technology Hardware, Storage & Peripherals – (0.60)%
|
||||||||
|
Apple, Inc.
|
(7,594
|
)
|
(1,296,827
|
)
|
||||
|
Textiles, Apparel & Luxury Goods – (0.12)%
|
||||||||
|
Adidas AG (b)
|
(413
|
)
|
(73,435
|
)
|
||||
|
Canada Goose Holdings, Inc. (b)
|
(521
|
)
|
(5,783
|
)
|
||||
|
Levi Strauss & Co. – Class A
|
(5,627
|
)
|
(76,921
|
)
|
||||
The accompanying notes are an integral part of these financial statements.
45
WEISS ALTERNATIVE MULTI-STRATEGY FUND
Schedule of Securities Sold Short – Continued
October 31, 2023
|
Shares
|
Value
|
|||||||
|
Textiles, Apparel & Luxury Goods – (0.12)% (Continued)
|
||||||||
|
Ralph Lauren Corp.
|
(512
|
)
|
$
|
(57,615
|
)
|
|||
|
Under Armour, Inc. – Class A
|
(7,634
|
)
|
(52,293
|
)
|
||||
|
(266,047
|
)
|
|||||||
|
Trading Companies & Distributors – (0.19)%
|
||||||||
|
Air Lease Corp.
|
(4,361
|
)
|
(151,021
|
)
|
||||
|
Fastenal Co.
|
(810
|
)
|
(47,255
|
)
|
||||
|
Ferguson plc (b)
|
(221
|
)
|
(33,194
|
)
|
||||
|
United Rentals, Inc.
|
(80
|
)
|
(32,502
|
)
|
||||
|
W.W. Grainger, Inc.
|
(45
|
)
|
(32,842
|
)
|
||||
|
Watsco, Inc.
|
(185
|
)
|
(64,545
|
)
|
||||
|
WESCO International, Inc.
|
(468
|
)
|
(59,998
|
)
|
||||
|
(421,357
|
)
|
|||||||
|
Total Short Common Stocks
|
||||||||
|
(Proceeds $(84,998,703))
|
(81,272,072
|
)
|
||||||
|
SHORT EXCHANGE TRADED FUNDS – (10.52)%
|
||||||||
|
Equity – (10.28)%
|
||||||||
|
AdvisorShares Pure US Cannabis ETF
|
(11,017
|
)
|
(61,695
|
)
|
||||
|
ARK Genomic Revolution ETF
|
(120
|
(2,762
|
)
|
|||||
|
ARK Innovation ETF
|
(966
|
)
|
(33,887
|
)
|
||||
|
Consumer Staples Select Sector SPDR Fund
|
(20,180
|
)
|
(1,369,415
|
)
|
||||
|
Energy Select Sector SPDR Fund
|
(6,073
|
)
|
(517,359
|
)
|
||||
|
ETFMG Alternative Harvest ETF
|
(28,389
|
)
|
(81,760
|
)
|
||||
|
Financial Select Sector SPDR Fund
|
(7,767
|
)
|
(251,340
|
)
|
||||
|
Global X Lithium & Battery Tech ETF
|
(4,279
|
)
|
(204,279
|
)
|
||||
|
Health Care Select Sector SPDR Fund
|
(6,679
|
)
|
(831,803
|
)
|
||||
|
Industrial Select Sector SPDR Fund
|
(4,488
|
)
|
(441,440
|
)
|
||||
|
Invesco QQQ Trust Series 1
|
(4,715
|
)
|
(1,654,352
|
)
|
||||
|
iShares China Large-Cap ETF
|
(10,582
|
)
|
(270,053
|
)
|
||||
|
iShares Core DAX UCITS ETF(a)
|
(957
|
)
|
(125,461
|
)
|
||||
|
iShares MSCI Eurozone ETF
|
(751
|
)
|
(30,866
|
)
|
||||
|
iShares Nasdaq Biotechnology ETF
|
(1,025
|
)
|
(116,522
|
)
|
||||
|
iShares North American Tech-Software ETF
|
(2,236
|
)
|
(754,538
|
)
|
||||
|
iShares Russell 2000 ETF
|
(4,179
|
)
|
(687,529
|
)
|
||||
|
iShares S&P Mid-Cap 400 Growth ETF
|
(1,805
|
)
|
(124,094
|
)
|
||||
|
iShares Transportation Average ETF
|
(834
|
)
|
(181,679
|
)
|
||||
|
iShares U.S. Home Construction ETF
|
(2,238
|
)
|
(164,538
|
)
|
||||
|
Material Select Sector SPDR
|
(1,594
|
)
|
(121,240
|
)
|
||||
|
SPDR S&P 500 ETF Trust
|
(18,851
|
)
|
(7,883,489
|
)
|
||||
|
SPDR S&P Biotech ETF
|
(2,689
|
)
|
(178,092
|
)
|
||||
The accompanying notes are an integral part of these financial statements.
46
WEISS ALTERNATIVE MULTI-STRATEGY FUND
Schedule of Securities Sold Short – Continued
October 31, 2023
|
Shares
|
Value
|
|||||||
|
SHORT EXCHANGE TRADED FUNDS – (10.52)% (Continued)
|
||||||||
|
SPDR S&P Homebuilders ETF
|
(1,352
|
)
|
$
|
(96,830
|
)
|
|||
|
SPDR S&P Metals & Mining ETF
|
(4,988
|
)
|
(246,706
|
)
|
||||
|
SPDR S&P Oil & Gas Exploration & Production ETF
|
(1,369
|
)
|
(198,806
|
)
|
||||
|
SPDR S&P Regional Banking ETF
|
(7,979
|
)
|
(316,527
|
)
|
||||
|
SPDR S&P Retail ETF
|
(5,729
|
)
|
(336,235
|
)
|
||||
|
U.S. Global Jets ETF
|
(18,463
|
)
|
(275,468
|
)
|
||||
|
Utilities Select Sector SPDR Fund
|
(247
|
)
|
(14,743
|
)
|
||||
|
VanEck Oil Services ETF
|
(1,523
|
)
|
(494,061
|
)
|
||||
|
VanEck Vectors Semiconductor ETF
|
(483
|
)
|
(67,113
|
)
|
||||
|
Vanguard REIT ETF
|
(57,816
|
)
|
(4,215,943
|
)
|
||||
|
(22,350,625
|
)
|
|||||||
|
Fixed Income – (0.24)%
|
||||||||
|
iShares iBoxx High Yield Corporate Bond ETF
|
(7,028
|
)
|
(510,022
|
)
|
||||
|
Total Short Exchange Traded Funds
|
||||||||
|
(Proceeds $(23,142,639))
|
(22,860,647
|
)
|
||||||
|
SHORT PREFERRED STOCKS – (0.06)%
|
||||||||
|
Life Sciences Tools & Services
|
||||||||
|
Sartorius AG (b)
|
(560
|
)
|
(140,358
|
)
|
||||
|
Total Short Preferred Stocks
|
||||||||
|
(Proceeds $(179,254))
|
(140,358
|
)
|
||||||
|
Total Securities Sold Short
|
||||||||
|
(Proceeds $(108,320,596)) – (47.98)%
|
$
|
(104,273,077
|
)
|
|||||
|
(a)
|
Securities sold short are not owned by the Fund and cannot produce income.
|
|
(b)
|
Foreign security.
|
ADR – American Depository Receipt
ETF – Exchange Traded Fund
plc – Public Limited Company
The accompanying notes are an integral part of these financial statements.
47
WEISS ALTERNATIVE MULTI-STRATEGY FUND
Schedule of Written Options
October 31, 2023
|
Contracts
|
Notional Amount
|
Value
|
||||||||||
|
WRITTEN OPTIONS
|
||||||||||||
|
Call
|
||||||||||||
|
Advanced Micro Devices, Inc. (a)
|
||||||||||||
|
Exercise Price: $106.00, Expiration: 11/03/2023
|
(32
|
)
|
$
|
(315,200
|
)
|
$
|
(3,264
|
)
|
||||
|
Alteryx, Inc. (a)
|
||||||||||||
|
Exercise Price: $45.00, Expiration: 02/16/2024
|
(45
|
)
|
(144,045
|
)
|
(2,925
|
)
|
||||||
|
Amazon.com, Inc. (a)
|
||||||||||||
|
Exercise Price: $140.00, Expiration: 11/17/2023
|
(19
|
)
|
(252,871
|
)
|
(2,071
|
)
|
||||||
|
Exercise Price: $145.00, Expiration: 11/17/2023
|
(3
|
)
|
(39,927
|
)
|
(105
|
)
|
||||||
|
Bowlero Corp. (a)
|
||||||||||||
|
Exercise Price: $12.50, Expiration: 11/17/2023
|
(8
|
)
|
(8,072
|
)
|
(80
|
)
|
||||||
|
Caesars Entertainment, Inc. (a)
|
||||||||||||
|
Exercise Price: $45.00, Expiration: 11/17/2023
|
(16
|
)
|
(63,824
|
)
|
(744
|
)
|
||||||
|
Endeavor Group Holdings, Inc. (a)
|
||||||||||||
|
Exercise Price: $22.50, Expiration: 11/17/2023
|
(8
|
)
|
(18,208
|
)
|
(760
|
)
|
||||||
|
Exercise Price: $24.00, Expiration: 11/17/2023
|
(27
|
)
|
(61,452
|
)
|
(877
|
)
|
||||||
|
Exercise Price: $25.00, Expiration: 12/15/2023
|
(32
|
)
|
(72,832
|
)
|
(1,360
|
)
|
||||||
|
Gap, Inc. (a)
|
||||||||||||
|
Exercise Price: $13.00, Expiration: 11/10/2023
|
(16
|
)
|
(20,480
|
)
|
(560
|
)
|
||||||
|
International Game Technology plc (a)
|
||||||||||||
|
Exercise Price: $32.00, Expiration: 11/17/2023
|
(16
|
)
|
(40,672
|
)
|
(128
|
)
|
||||||
|
iShares 20+ Year Treasury Bond ETF (a)
|
||||||||||||
|
Exercise Price: $100.00, Expiration: 12/15/2023
|
(41
|
)
|
(342,678
|
)
|
(451
|
)
|
||||||
|
Kenvue, Inc. (a)
|
||||||||||||
|
Exercise Price: $20.00, Expiration: 11/17/2023
|
(32
|
)
|
(59,520
|
)
|
(160
|
)
|
||||||
|
Exercise Price: $21.00, Expiration: 11/17/2023
|
(32
|
)
|
(59,520
|
)
|
(80
|
)
|
||||||
|
Exercise Price: $25.00, Expiration: 11/17/2023
|
(33
|
)
|
(61,380
|
)
|
(83
|
)
|
||||||
|
Exercise Price: $20.00, Expiration: 12/01/2023
|
(32
|
)
|
(59,520
|
)
|
(400
|
)
|
||||||
|
Penn Entertainment, Inc. (a)
|
||||||||||||
|
Exercise Price: $30.00, Expiration: 01/19/2024
|
(29
|
)
|
(57,217
|
)
|
(667
|
)
|
||||||
|
PureCycle Technologies, Inc. (a)
|
||||||||||||
|
Exercise Price: $11.00, Expiration: 11/17/2023
|
(207
|
)
|
(92,115
|
)
|
(5,175
|
)
|
||||||
|
Spirit Airlines, Inc. (a)
|
||||||||||||
|
Exercise Price: $30.00, Expiration: 12/15/2023
|
(21
|
)
|
(24,108
|
)
|
(1,050
|
)
|
||||||
|
Uber Technologies, Inc. (a)
|
||||||||||||
|
Exercise Price: $44.00, Expiration: 11/03/2023
|
(19
|
)
|
(82,232
|
)
|
(826
|
)
|
||||||
|
Veeva Systems, Inc. (a)
|
||||||||||||
|
Exercise Price: $210.00, Expiration: 11/17/2023
|
(1
|
)
|
(19,271
|
)
|
(65
|
)
|
||||||
|
Wyndham Hotels & Resorts, Inc. (a)
|
||||||||||||
|
Exercise Price: $80.00, Expiration: 11/17/2023
|
(8
|
)
|
(57,920
|
)
|
(160
|
)
|
||||||
|
Exercise Price: $85.00, Expiration: 12/15/2023
|
(7
|
)
|
(50,680
|
)
|
(158
|
)
|
||||||
|
(22,149
|
)
|
|||||||||||
The accompanying notes are an integral part of these financial statements.
48
WEISS ALTERNATIVE MULTI-STRATEGY FUND
Schedule of Written Options – Continued
October 31, 2023
|
Contracts
|
Notional Amount
|
Value
|
||||||||||
|
Put
|
||||||||||||
|
Amazon.com, Inc. (a)
|
||||||||||||
|
Exercise Price: $110.00, Expiration: 11/17/2023
|
(3
|
)
|
$
|
(39,927
|
)
|
$
|
(35
|
)
|
||||
|
Exercise Price: $130.00, Expiration: 01/19/2024
|
(9
|
)
|
(119,781
|
)
|
(5,310
|
)
|
||||||
|
Apple, Inc. (a)
|
||||||||||||
|
Exercise Price: $162.50, Expiration: 11/03/2023
|
(16
|
)
|
(273,232
|
)
|
(1,360
|
)
|
||||||
|
Applied Digital Corp. (a)
|
||||||||||||
|
Exercise Price: $5.00, Expiration: 12/15/2023
|
(32
|
)
|
(15,616
|
)
|
(2,400
|
)
|
||||||
|
Chevron Corp. (a)
|
||||||||||||
|
Exercise Price: $145.00, Expiration: 11/17/2023
|
(9
|
)
|
(131,157
|
)
|
(2,695
|
)
|
||||||
|
Dexcom, Inc. (a)
|
||||||||||||
|
Exercise Price: $75.00, Expiration: 11/17/2023
|
(1
|
)
|
(8,883
|
)
|
(33
|
)
|
||||||
|
Gap, Inc. (a)
|
||||||||||||
|
Exercise Price: $13.00, Expiration: 11/03/2023
|
(32
|
)
|
(40,960
|
)
|
(1,152
|
)
|
||||||
|
Meta Platforms, Inc. (a)
|
||||||||||||
|
Exercise Price: $250.00, Expiration: 01/19/2024
|
(8
|
)
|
(241,016
|
)
|
(3,080
|
)
|
||||||
|
Exercise Price: $280.00, Expiration: 01/19/2024
|
(3
|
)
|
(90,381
|
)
|
(3,015
|
)
|
||||||
|
Microsoft Corp. (a)
|
||||||||||||
|
Exercise Price: $310.00, Expiration: 01/19/2024
|
(7
|
)
|
(236,677
|
)
|
(4,060
|
)
|
||||||
|
Phreesia, Inc. (a)
|
||||||||||||
|
Exercise Price: $12.50, Expiration: 11/17/2023
|
(8
|
)
|
(10,928
|
)
|
(200
|
)
|
||||||
|
Sirius XM Holdings, Inc. (a)
|
||||||||||||
|
Exercise Price: $3.50, Expiration: 11/17/2023
|
(65
|
)
|
(27,820
|
)
|
(487
|
)
|
||||||
|
Veeva Systems, Inc. (a)
|
||||||||||||
|
Exercise Price: $180.00, Expiration: 11/17/2023
|
(8
|
)
|
(154,168
|
)
|
(1,160
|
)
|
||||||
|
WW International, Inc. (a)
|
||||||||||||
|
Exercise Price: $7.50, Expiration: 01/19/2024
|
(65
|
)
|
(50,830
|
)
|
(8,125
|
)
|
||||||
|
Exercise Price: $10.00, Expiration: 01/19/2024
|
(24
|
)
|
(18,768
|
)
|
(6,900
|
)
|
||||||
|
(40,012
|
)
|
|||||||||||
|
TOTAL WRITTEN OPTIONS
|
||||||||||||
|
(Premiums received $77,748)
|
$
|
(62,161
|
)
|
|||||||||
|
(a)
|
100 shares per contract.
|
plc – Public Limited Company
The accompanying notes are an integral part of these financial statements.
49
WEISS ALTERNATIVE MULTI-STRATEGY FUND
Schedule of Open Futures Contracts
October 31, 2023
|
Value and
|
|||||||||||||
|
Number of
|
Unrealized
|
||||||||||||
|
Contracts
|
Notional
|
Appreciation
|
|||||||||||
|
Expiration Date
|
Description
|
Purchased
|
Amount
|
(Depreciation)
|
|||||||||
|
LONG FUTURES CONTRACTS
|
|||||||||||||
|
12/27/2023
|
100 Ounce Gold Futures
|
77
|
$
|
15,356,110
|
$
|
194,882
|
|||||||
|
12/19/2023
|
CBT 10-Year U.S. Treasury Note
|
3
|
286,764
|
755
|
|||||||||
|
12/29/2023
|
CBT 2-Year U.S. Treasury Note
|
218
|
43,399,849
|
(172,050
|
)
|
||||||||
|
12/15/2023
|
E-Mini Russell 2000
|
339
|
28,279,380
|
(3,455,840
|
)
|
||||||||
|
12/15/2023
|
E-Mini S&P 500
|
140
|
29,485,750
|
(2,079,246
|
)
|
||||||||
|
$
|
(5,511,499
|
)
|
|||||||||||
The accompanying notes are an integral part of these financial statements.
50
WEISS ALTERNATIVE MULTI-STRATEGY FUND
Schedule of Swap Contracts
October 31, 2023
|
Received by
|
Paid by
|
|||||||||||||||||
|
the Fund
|
the Fund
|
Unrealized
|
||||||||||||||||
|
Counter-
|
Financing
|
Financing
|
Payment
|
Maturity
|
Number of
|
Notional
|
Upfront
|
Appreciation
|
||||||||||
|
party
|
Rate/Security
|
Currency
|
Rate/Security
|
Frequency
|
Date
|
Shares/Units
|
Amount
|
Payment
|
(Depreciation)*
|
|||||||||
|
LONG EQUITY SWAP CONTRACTS
|
||||||||||||||||||
|
Morgan
|
Admiral
|
GBP
|
5.79%
|
Monthly
|
4/29/25
|
2,226
|
$
|
54,417
|
$
|
—
|
$
|
(863
|
)
|
|||||
|
Stanley
|
Group plc
|
(0.60% + Sterling
|
||||||||||||||||
|
Overnight
|
||||||||||||||||||
|
Index Average)
|
||||||||||||||||||
|
Morgan
|
Axa S.A.
|
EUR
|
4.59%
|
Monthly
|
4/29/25
|
2,712
|
75,945
|
—
|
(1,409
|
)
|
||||||||
|
Stanley
|
(0.60% + Euro
|
|||||||||||||||||
|
Short-Term
|
||||||||||||||||||
|
Rate)
|
||||||||||||||||||
|
Morgan
|
CaixaBank
|
EUR
|
4.59%
|
Monthly
|
4/29/25
|
53,914
|
207,154
|
—
|
3,673
|
|||||||||
|
Stanley
|
S.A.
|
(0.60% + Euro
|
||||||||||||||||
|
Short-Term
|
||||||||||||||||||
|
Rate)
|
||||||||||||||||||
|
Morgan
|
Cyclical vs.
|
USD
|
3.59%
|
Monthly
|
4/29/25
|
321
|
39,339
|
—
|
(570
|
)
|
||||||||
|
Stanley
|
Defensive Basket
|
(0.60% + Euro
|
||||||||||||||||
|
Short-Term
|
||||||||||||||||||
|
Rate)
|
||||||||||||||||||
|
Morgan
|
Entain plc
|
GBP
|
5.79%
|
Monthly
|
6/4/25
|
1,316
|
12,291
|
—
|
(5,158
|
)
|
||||||||
|
Stanley
|
(0.60% + Sterling
|
|||||||||||||||||
|
Overnight
|
||||||||||||||||||
|
Index Average)
|
||||||||||||||||||
|
Morgan
|
Entain plc
|
GBP
|
5.79%
|
Monthly
|
6/3/25
|
5,321
|
49,698
|
—
|
(2,252
|
)
|
||||||||
|
Stanley
|
(0.60% + Sterling
|
|||||||||||||||||
|
Overnight
|
||||||||||||||||||
|
Index Average)
|
||||||||||||||||||
|
Morgan
|
Entain plc
|
GBP
|
5.79%
|
Monthly
|
4/29/25
|
72,426
|
676,459
|
—
|
(91,873
|
)
|
||||||||
|
Stanley
|
(0.60% + Sterling
|
|||||||||||||||||
|
Overnight
|
||||||||||||||||||
|
Index Average)
|
||||||||||||||||||
|
Morgan
|
Flutter
|
GBP
|
5.79%
|
Monthly
|
6/3/25
|
408
|
52,791
|
—
|
(629
|
)
|
||||||||
|
Stanley
|
Entertainment plc
|
(0.60% + Sterling
|
||||||||||||||||
|
Overnight
|
||||||||||||||||||
|
Index Average)
|
||||||||||||||||||
|
Morgan
|
Growth vs
|
USD
|
0.85%
|
Monthly
|
4/29/25
|
976
|
114,719
|
—
|
(2,502
|
)
|
||||||||
|
Stanley
|
Value Basket
|
Fixed Rate
|
||||||||||||||||
|
Morgan
|
GSK plc
|
GBP
|
5.79%
|
Monthly
|
4/29/25
|
10,060
|
147,548
|
—
|
3,125
|
|||||||||
|
Stanley
|
(0.60% + Sterling
|
|||||||||||||||||
|
Overnight
|
||||||||||||||||||
|
Index Average)
|
||||||||||||||||||
|
Morgan
|
Haleon plc
|
GBP
|
5.79%
|
Monthly
|
4/29/25
|
5,163
|
17,026
|
—
|
860
|
|||||||||
|
Stanley
|
(0.60% + Sterling
|
|||||||||||||||||
|
Overnight
|
||||||||||||||||||
|
Index Average)
|
||||||||||||||||||
The accompanying notes are an integral part of these financial statements.
51
WEISS ALTERNATIVE MULTI-STRATEGY FUND
Schedule of Swap Contracts – Continued
October 31, 2023
|
Received by
|
Paid by
|
|||||||||||||||||
|
the Fund
|
the Fund
|
Unrealized
|
||||||||||||||||
|
Counter-
|
Financing
|
Financing
|
Payment
|
Maturity
|
Number of
|
Notional
|
Upfront
|
Appreciation
|
||||||||||
|
party
|
Rate/Security
|
Currency
|
Rate/Security
|
Frequency
|
Date
|
Shares/Units
|
Amount
|
Payment
|
(Depreciation)*
|
|||||||||
|
LONG EQUITY SWAP CONTRACTS (Continued)
|
||||||||||||||||||
|
Morgan
|
iShares iBoxx
|
USD
|
5.68%
|
Monthly
|
4/29/25
|
422,760
|
41,925,109
|
$
|
—
|
$
|
(4,346,934
|
)
|
||||||
|
Stanley
|
$Investment
|
(0.35% + U.S.
|
||||||||||||||||
|
Grade Corporate
|
Federal Funds
|
|||||||||||||||||
|
Bond ETF
|
Effective Rate)
|
|||||||||||||||||
|
Morgan
|
iShares iBoxx
|
USD
|
5.33%
|
Monthly
|
4/29/25
|
585,822
|
42,513,103
|
—
|
(1,356,164
|
)
|
||||||||
|
Stanley
|
High Yield
|
0.00% + U.S.
|
||||||||||||||||
|
Corporate
|
(Federal Funds
|
|||||||||||||||||
|
Bond ETF
|
Effective Rate)
|
|||||||||||||||||
|
Morgan
|
Lancashire
|
GBP
|
5.79%
|
Monthly
|
4/29/25
|
14,239
|
80,878
|
—
|
1,431
|
|||||||||
|
Stanley
|
Holdings Ltd.
|
(0.60% + Sterling
|
||||||||||||||||
|
Overnight
|
||||||||||||||||||
|
Index Average)
|
||||||||||||||||||
|
Morgan
|
Man Group
|
GBP
|
5.79%
|
Monthly
|
4/29/25
|
18,411
|
40,499
|
—
|
635
|
|||||||||
|
Stanley
|
plc
|
(0.60% + Sterling
|
||||||||||||||||
|
Overnight
|
||||||||||||||||||
|
Index Average)
|
||||||||||||||||||
|
Morgan
|
New Melrose
|
GBP
|
5.79%
|
Monthly
|
4/29/25
|
68,886
|
321,698
|
—
|
(990
|
)
|
||||||||
|
Stanley
|
Industries plc
|
(0.60% + Sterling
|
||||||||||||||||
|
Overnight
|
||||||||||||||||||
|
Index Average)
|
||||||||||||||||||
|
Morgan
|
Prudential plc
|
GBP
|
5.79%
|
Monthly
|
4/29/25
|
2,857
|
24,578
|
—
|
(1,917
|
)
|
||||||||
|
Stanley
|
(0.60% + Sterling
|
|||||||||||||||||
|
Overnight
|
||||||||||||||||||
|
Index Average)
|
||||||||||||||||||
|
Morgan
|
Rolls-Royce
|
GBP
|
5.79%
|
Monthly
|
4/29/25
|
85,728
|
185,656
|
—
|
(1,640
|
)
|
||||||||
|
Stanley
|
Holdings plc
|
(0.60% + Sterling
|
||||||||||||||||
|
Overnight
|
||||||||||||||||||
|
Index Average)
|
||||||||||||||||||
|
Morgan
|
Sanofi
|
EUR
|
4.59%
|
Monthly
|
4/29/25
|
2,755
|
236,434
|
—
|
(31,488
|
)
|
||||||||
|
Stanley
|
(0.60% + Euro
|
|||||||||||||||||
|
Short-Term
|
||||||||||||||||||
|
Rate)
|
||||||||||||||||||
|
Morgan
|
Schneider
|
EUR
|
4.59%
|
Monthly
|
4/29/25
|
542
|
78,812
|
—
|
1,392
|
|||||||||
|
Stanley
|
S.A.
|
(0.60% + Euro
|
||||||||||||||||
|
Short-Term
|
||||||||||||||||||
|
Rate)
|
||||||||||||||||||
|
Morgan
|
Sector-Neutral
|
USD
|
0.80%
|
Monthly
|
4/29/25
|
68,637
|
5,433,305
|
(a)
|
—
|
(211,233
|
)
|
|||||||
|
Stanley
|
Dividend
|
Fixed Rate
|
||||||||||||||||
|
Yield Basket
|
||||||||||||||||||
|
Morgan
|
U.S. Momentum
|
USD
|
1.15%
|
Monthly
|
4/29/25
|
600
|
70,435
|
—
|
(291
|
)
|
||||||||
|
Stanley
|
Basket
|
Fixed Rate
|
||||||||||||||||
|
Morgan
|
U.S. Quality
|
USD
|
0.95%
|
Monthly
|
4/29/25
|
1,610
|
125,918
|
—
|
1,633
|
|||||||||
|
Stanley
|
Basket
|
Fixed Rate
|
||||||||||||||||
The accompanying notes are an integral part of these financial statements.
52
WEISS ALTERNATIVE MULTI-STRATEGY FUND
Schedule of Swap Contracts – Continued
October 31, 2023
|
Received by
|
Paid by
|
|||||||||||||||||
|
the Fund
|
the Fund
|
Unrealized
|
||||||||||||||||
|
Counter-
|
Financing
|
Financing
|
Payment
|
Maturity
|
Number of
|
Notional
|
Upfront
|
Appreciation
|
||||||||||
|
party
|
Rate/Security
|
Currency
|
Rate/Security
|
Frequency
|
Date
|
Shares/Units
|
Amount
|
Payment
|
(Depreciation)*
|
|||||||||
|
LONG EQUITY SWAP CONTRACTS (Continued)
|
||||||||||||||||||
|
Morgan
|
U.S. Sector-
|
USD
|
0.85%
|
Monthly
|
4/29/25
|
139
|
11,675
|
$
|
—
|
$
|
1,128
|
|||||||
|
Stanley
|
Neutral Quality
|
Fixed Rate
|
||||||||||||||||
|
Basket
|
||||||||||||||||||
|
Morgan
|
Weiss –
|
USD
|
5.83%
|
Monthly
|
4/29/25
|
539
|
57,889
|
—
|
(3,364
|
)
|
||||||||
|
Stanley
|
MSGWARO2
|
(0.50% + U.S.
|
||||||||||||||||
|
Basket
|
Federal Funds
|
|||||||||||||||||
|
Effective Rate)
|
||||||||||||||||||
|
Morgan
|
Weiss –
|
USD
|
5.68%
|
Monthly
|
4/29/25
|
840
|
76,961
|
—
|
(6,216
|
)
|
||||||||
|
Stanley
|
MSGWAUSP
|
(0.35% + U.S.
|
||||||||||||||||
|
Basket
|
Federal Funds
|
|||||||||||||||||
|
Effective Rate)
|
||||||||||||||||||
|
Morgan
|
Weiss –
|
USD
|
5.83%
|
Monthly
|
4/29/25
|
390
|
35,276
|
—
|
(178
|
)
|
||||||||
|
Stanley
|
MSGWDEF
|
(0.50% + U.S.
|
||||||||||||||||
|
Basket
|
Federal Funds
|
|||||||||||||||||
|
Effective Rate)
|
||||||||||||||||||
|
Morgan
|
Weiss –
|
USD
|
5.83%
|
Monthly
|
4/29/25
|
3,501
|
360,288
|
—
|
(19,191
|
)
|
||||||||
|
Stanley
|
MSGWIND
|
(0.50% + U.S.
|
||||||||||||||||
|
Basket
|
Federal Funds
|
|||||||||||||||||
|
Effective Rate)
|
||||||||||||||||||
|
Morgan
|
Weiss –
|
USD
|
5.68%
|
Monthly
|
4/29/25
|
1,804
|
203,708
|
—
|
(2,820
|
)
|
||||||||
|
Stanley
|
MSGWLCT
|
(0.35% + U.S.
|
||||||||||||||||
|
Basket
|
Federal Funds
|
|||||||||||||||||
|
Effective Rate)
|
||||||||||||||||||
|
Morgan
|
Weiss –
|
USD
|
5.68%
|
Monthly
|
4/29/25
|
256
|
26,757
|
—
|
(841
|
)
|
||||||||
|
Stanley
|
MSGWTRNS
|
(0.35% + U.S.
|
||||||||||||||||
|
Basket
|
Federal Funds
|
|||||||||||||||||
|
Effective Rate)
|
||||||||||||||||||
The accompanying notes are an integral part of these financial statements.
53
WEISS ALTERNATIVE MULTI-STRATEGY FUND
Schedule of Swap Contracts – Continued
October 31, 2023
|
Paid by
|
Received by
|
|||||||||||||||||
|
the Fund
|
the Fund
|
Unrealized
|
||||||||||||||||
|
Counter-
|
Financing
|
Financing
|
Payment
|
Maturity
|
Number of
|
Notional
|
Upfront
|
Appreciation
|
||||||||||
|
party
|
Rate/Security
|
Currency
|
Rate/Security
|
Frequency
|
Date
|
Shares/Units
|
Amount
|
Payment
|
(Depreciation)*
|
|||||||||
|
SHORT EQUITY SWAP CONTRACTS
|
||||||||||||||||||
|
Morgan
|
3.49% ((0.50)%
|
EUR
|
ABN AMRO
|
Monthly
|
4/29/25
|
(2,356)
|
(29,990
|
)
|
$
|
—
|
$
|
1,517
|
||||||
|
Stanley
|
+ Euro
|
Bank N.V.
|
||||||||||||||||
|
Short-Term Rate)
|
||||||||||||||||||
|
Morgan
|
4.69% ((0.50)%
|
GBP
|
Abrdn plc
|
Monthly
|
4/29/25
|
(57,814)
|
(90,808
|
)
|
—
|
(2,515
|
)
|
|||||||
|
Stanley
|
+ Sterling
|
|||||||||||||||||
|
Overnight
|
||||||||||||||||||
|
Index Average)
|
||||||||||||||||||
|
Morgan
|
4.69% ((0.50)%
|
GBP
|
Anglo
|
Monthly
|
4/29/25
|
(5,051)
|
(105,885
|
)
|
—
|
12,102
|
||||||||
|
Stanley
|
+ Sterling
|
American plc
|
||||||||||||||||
|
Overnight
|
||||||||||||||||||
|
Index Average)
|
||||||||||||||||||
|
Morgan
|
4.69% ((0.50)%
|
GBP
|
Antofagasta plc
|
Monthly
|
4/29/25
|
(15,031)
|
(202,213
|
)
|
—
|
22,411
|
||||||||
|
Stanley
|
+ Sterling
|
|||||||||||||||||
|
Overnight
|
||||||||||||||||||
|
Index Average)
|
||||||||||||||||||
|
Morgan
|
4.69% ((0.50)%
|
GBP
|
Ashtead
|
Monthly
|
7/2/25
|
(640)
|
(30,199
|
)
|
—
|
1,246
|
||||||||
|
Stanley
|
+ Sterling
|
Group plc
|
||||||||||||||||
|
Overnight
|
||||||||||||||||||
|
Index Average)
|
||||||||||||||||||
|
Morgan
|
4.69% ((0.50)%
|
GBP
|
Astrazeneca
|
Monthly
|
4/29/25
|
(954)
|
(98,272
|
)
|
—
|
3,673
|
||||||||
|
Stanley
|
+ Sterling
|
plc
|
||||||||||||||||
|
Overnight
|
||||||||||||||||||
|
Index Average)
|
||||||||||||||||||
|
Morgan
|
5.08% ((0.25)%+
|
USD
|
Casual Dining
|
Monthly
|
4/29/25
|
(1,658)
|
(140,416
|
)
|
—
|
(5,185
|
)
|
|||||||
|
Stanley
|
U.S. Federal Funds
|
MSGWCASD
|
||||||||||||||||
|
Effective Rate)
|
Basket
|
|||||||||||||||||
|
Morgan
|
5.08% ((0.25)%+
|
USD
|
Casual Dining
|
Monthly
|
8/13/25
|
(3,404)
|
(288,285
|
)
|
—
|
(1,497
|
)
|
|||||||
|
Stanley
|
U.S. Federal Funds
|
MSGWCASD
|
||||||||||||||||
|
Effective Rate)
|
Basket
|
|||||||||||||||||
|
Morgan
|
(0.65)%
|
USD
|
Cyclical vs.
|
Monthly
|
4/29/25
|
(114)
|
(13,971
|
)
|
—
|
808
|
||||||||
|
Stanley
|
Fixed Rate
|
Defensive Basket
|
||||||||||||||||
|
Morgan
|
4.69% ((0.50)%
|
GBP
|
Flutter
|
Monthly
|
4/29/25
|
(668)
|
(86,432
|
)
|
—
|
(1,295
|
)
|
|||||||
|
Stanley
|
+ Sterling
|
Entertainment
|
||||||||||||||||
|
Overnight
|
plc
|
|||||||||||||||||
|
Index Average)
|
||||||||||||||||||
|
Morgan
|
5.08% ((0.25)%+
|
USD
|
Growth
|
Monthly
|
4/29/25
|
(976)
|
(165,081
|
)
|
—
|
(4,575
|
)
|
|||||||
|
Stanley
|
U.S. Federal Funds
|
Software
|
||||||||||||||||
|
Effective Rate)
|
Basket
|
|||||||||||||||||
|
Morgan
|
3.68% ((0.50)%
|
GBP
|
International
|
Monthly
|
4/29/25
|
(79,750)
|
(115,276
|
)
|
—
|
278
|
||||||||
|
Stanley
|
+ Sterling
|
Consolidated
|
||||||||||||||||
|
Overnight
|
Airlines
|
|||||||||||||||||
|
Index Average)
|
Group S.A.
|
|||||||||||||||||
|
Morgan
|
4.56% ((0.63)%
|
GBP
|
iShares plc –
|
Monthly
|
6/3/25
|
(19,821)
|
(142,112
|
)
|
—
|
2,065
|
||||||||
|
Stanley
|
+ Sterling
|
iShares Core
|
||||||||||||||||
|
Overnight
|
FTSE
|
|||||||||||||||||
|
Index Average)
|
100 UCIT
|
|||||||||||||||||
The accompanying notes are an integral part of these financial statements.
54
WEISS ALTERNATIVE MULTI-STRATEGY FUND
Schedule of Swap Contracts – Continued
October 31, 2023
|
Paid by
|
Received by
|
|||||||||||||||||
|
the Fund
|
the Fund
|
Unrealized
|
||||||||||||||||
|
Counter-
|
Financing
|
Financing
|
Payment
|
Maturity
|
Number of
|
Notional
|
Upfront
|
Appreciation
|
||||||||||
|
party
|
Rate/Security
|
Currency
|
Rate/Security
|
Frequency
|
Date
|
Shares/Units
|
Amount
|
Payment
|
(Depreciation)*
|
|||||||||
|
SHORT EQUITY SWAP CONTRACTS (Continued)
|
||||||||||||||||||
|
Morgan
|
4.81% ((0.52)%
|
USD
|
MS Consumer
|
Monthly
|
4/29/25
|
(390)
|
(36,325
|
)
|
$
|
—
|
$
|
95
|
||||||
|
Stanley
|
+ U.S. Federal
|
Discretionary
|
||||||||||||||||
|
Funds
|
||||||||||||||||||
|
Effective Rate)
|
||||||||||||||||||
|
Morgan
|
5.07% ((0.26)%+
|
USD
|
MS Grow
|
Monthly
|
8/20/25
|
(134)
|
(62,709
|
)
|
—
|
4,361
|
||||||||
|
Stanley
|
U.S. Federal Funds
|
Basket
|
||||||||||||||||
|
Effective Rate)
|
||||||||||||||||||
|
Morgan
|
5.07% ((0.26)%+
|
USD
|
MS Grow
|
Monthly
|
9/2/25
|
(119)
|
(55,690
|
)
|
—
|
1,898
|
||||||||
|
Stanley
|
U.S. Federal Funds
|
Basket
|
||||||||||||||||
|
Effective Rate)
|
||||||||||||||||||
|
Morgan
|
5.08% ((0.25)%+
|
USD
|
MS High
|
Monthly
|
4/29/25
|
(815)
|
(55,004
|
)
|
—
|
3,369
|
||||||||
|
Stanley
|
U.S. Federal Funds
|
Beta Cyclicals
|
||||||||||||||||
|
Effective Rate)
|
Basket
|
|||||||||||||||||
|
Morgan
|
4.98% ((0.35)%+
|
USD
|
MS Leisure
|
Monthly
|
4/29/25
|
(4,862)
|
(299,062
|
)
|
—
|
41,505
|
||||||||
|
Stanley
|
U.S. Federal Funds
|
Travel
|
||||||||||||||||
|
Effective Rate)
|
||||||||||||||||||
|
Morgan
|
5.03% ((0.30)%+
|
USD
|
MS Technology
|
Monthly
|
4/29/25
|
(2,829)
|
(168,410
|
)
|
—
|
(4,233
|
)
|
|||||||
|
Stanley
|
U.S. Federal Funds
|
Hardware
|
||||||||||||||||
|
Effective Rate)
|
Basket
|
|||||||||||||||||
|
Morgan
|
5.08% ((0.25)%+
|
USD
|
MSGWRAIL
|
Monthly
|
4/29/25
|
(325)
|
(29,055
|
)
|
—
|
(595
|
)
|
|||||||
|
Stanley
|
U.S. Federal Funds
|
Basket
|
||||||||||||||||
|
Effective Rate)
|
||||||||||||||||||
|
Morgan
|
5.08% ((0.25)%+
|
USD
|
MSGWREIT
|
Monthly
|
4/29/25
|
(677)
|
(58,906
|
)
|
—
|
4,022
|
||||||||
|
Stanley
|
U.S. Federal Funds
|
Basket
|
||||||||||||||||
|
Effective Rate)
|
||||||||||||||||||
|
Morgan
|
5.08% ((0.25)%+
|
USD
|
MSGWTRN4
|
Monthly
|
4/29/25
|
(325)
|
(37,781
|
)
|
—
|
2,440
|
||||||||
|
Stanley
|
U.S. Federal Funds
|
Basket
|
||||||||||||||||
|
Effective Rate)
|
||||||||||||||||||
|
Morgan
|
4.79% ((0.54)%+
|
USD
|
MSGWXRT
|
Monthly
|
4/29/25
|
(5,003)
|
(435,411
|
)
|
—
|
44,489
|
||||||||
|
Stanley
|
U.S. Federal Funds
|
Basket
|
||||||||||||||||
|
Effective Rate)
|
||||||||||||||||||
|
Morgan
|
4.98% ((0.35)%+
|
USD
|
MSGWXSD
|
Monthly
|
4/29/25
|
(6,504)
|
(1,115,436
|
)
|
—
|
42,578
|
||||||||
|
Stanley
|
U.S. Federal Funds
|
Basket
|
||||||||||||||||
|
Effective Rate)
|
||||||||||||||||||
|
Morgan
|
4.93% ((0.40)%+
|
USD
|
MSXXAIB
|
Monthly
|
9/4/25
|
(536)
|
(64,143
|
)
|
—
|
4,987
|
||||||||
|
Stanley
|
U.S. Federal Funds
|
Basket
|
||||||||||||||||
|
Effective Rate)
|
||||||||||||||||||
|
Morgan
|
4.95% ((0.38)%+
|
USD
|
MSXXCCC
|
Monthly
|
4/29/25
|
(210)
|
(18,417
|
)
|
—
|
1,433
|
||||||||
|
Stanley
|
U.S. Federal Funds
|
Basket
|
||||||||||||||||
|
Effective Rate)
|
||||||||||||||||||
|
Morgan
|
4.80% ((0.53)%+
|
USD
|
MSXXONSH
|
Monthly
|
4/29/25
|
(1,028)
|
(95,162
|
)
|
—
|
3,045
|
||||||||
|
Stanley
|
U.S. Federal Funds
|
Basket
|
||||||||||||||||
|
Effective Rate)
|
||||||||||||||||||
The accompanying notes are an integral part of these financial statements.
55
WEISS ALTERNATIVE MULTI-STRATEGY FUND
Schedule of Swap Contracts – Continued
October 31, 2023
|
Paid by
|
Received by
|
|||||||||||||||||
|
the Fund
|
the Fund
|
Unrealized
|
||||||||||||||||
|
Counter-
|
Financing
|
Financing
|
Payment
|
Maturity
|
Number of
|
Notional
|
Upfront
|
Appreciation
|
||||||||||
|
party
|
Rate/Security
|
Currency
|
Rate/Security
|
Frequency
|
Date
|
Shares/Units
|
Amount
|
Payment
|
(Depreciation)*
|
|||||||||
|
SHORT EQUITY SWAP CONTRACTS (Continued)
|
||||||||||||||||||
|
Morgan
|
3.49% ((0.50)%
|
EUR
|
Rexel
|
Monthly
|
4/29/25
|
(2,255)
|
(43,525
|
)
|
$
|
—
|
$
|
4,979
|
||||||
|
Stanley
|
+ Euro
|
Promesses
|
||||||||||||||||
|
Short-Term Rate)
|
||||||||||||||||||
|
Morgan
|
3.49% ((0.50)%
|
EUR
|
Safran S.A.
|
Monthly
|
5/7/25
|
(96)
|
(14,174
|
)
|
—
|
(76
|
)
|
|||||||
|
Stanley
|
+ Euro
|
|||||||||||||||||
|
Short-Term Rate)
|
||||||||||||||||||
|
Morgan
|
4.69% ((0.50)%
|
GBP
|
Schroders plc
|
Monthly
|
4/29/25
|
(21,494)
|
(79,632
|
)
|
—
|
4,523
|
||||||||
|
Stanley
|
+ Sterling
|
|||||||||||||||||
|
Overnight
|
||||||||||||||||||
|
Index Average)
|
||||||||||||||||||
|
Morgan
|
4.81% ((0.52)%+
|
USD
|
Unprofitable
|
Monthly
|
4/29/25
|
(1,923)
|
(68,497
|
)
|
—
|
5,735
|
||||||||
|
Stanley
|
U.S. Federal Funds
|
Technology
|
||||||||||||||||
|
Effective Rate)
|
Co. Basket
|
|||||||||||||||||
|
Morgan
|
4.81% ((0.52)%+
|
USD
|
Unprofitable
|
Monthly
|
4/29/25
|
(3,252)
|
(119,056
|
)
|
—
|
29,244
|
||||||||
|
Stanley
|
U.S. Federal Funds
|
Technology
|
||||||||||||||||
|
Effective Rate)
|
Co. Basket
|
|||||||||||||||||
|
Morgan
|
(0.81)%
|
USD
|
U.S. 3 Month
|
Monthly
|
9/9/25
|
(381)
|
(38,313
|
)
|
—
|
(790
|
)
|
|||||||
|
Stanley
|
Fixed Rate
|
Momentum Basket
|
||||||||||||||||
|
Morgan
|
0.95%
|
USD
|
U.S. Quality
|
Monthly
|
10/1/25
|
(4,065)
|
(317,924
|
)
|
—
|
(5,557
|
)
|
|||||||
|
Stanley
|
Fixed Rate
|
Basket
|
||||||||||||||||
|
Morgan
|
4.98% ((0.35)%+
|
USD
|
U.S. Quality
|
Monthly
|
10/22/25
|
(5,672)
|
(1,144,836
|
)
|
—
|
35,458
|
||||||||
|
Stanley
|
U.S. Federal Funds
|
Long Basket
|
||||||||||||||||
|
Effective Rate)
|
||||||||||||||||||
|
Morgan
|
4.88% ((0.45)%+
|
USD
|
Weiss –
|
Monthly
|
4/29/25
|
(4,862)
|
(722,396
|
)
|
—
|
69,455
|
||||||||
|
Stanley
|
U.S. Federal Funds
|
Infotech
|
||||||||||||||||
|
Effective Rate)
|
Basket
|
|||||||||||||||||
|
Morgan
|
4.98% ((0.35)%+
|
USD
|
Weiss –
|
Monthly
|
4/29/25
|
(682)
|
(57,950
|
)
|
—
|
(4,197
|
)
|
|||||||
|
Stanley
|
U.S. Federal Funds
|
MSGWAERO
|
||||||||||||||||
|
Effective Rate)
|
Basket
|
|||||||||||||||||
|
Morgan
|
5.08% ((0.25)%+
|
USD
|
Weiss –
|
Monthly
|
4/29/25
|
(721)
|
(49,194
|
)
|
—
|
4,593
|
||||||||
|
Stanley
|
U.S. Federal Funds
|
MSGWAIR
|
||||||||||||||||
|
Effective Rate)
|
Basket
|
|||||||||||||||||
|
Morgan
|
5.08% ((0.25)%+
|
USD
|
Weiss –
|
Monthly
|
4/29/25
|
(51)
|
(3,788
|
)
|
—
|
598
|
||||||||
|
Stanley
|
U.S. Federal Funds
|
MSGWOFRE
|
||||||||||||||||
|
Effective Rate)
|
Basket
|
|||||||||||||||||
|
Morgan
|
4.96% ((0.37)%+
|
USD
|
Weiss – QQQE
|
Monthly
|
4/29/25
|
(9,755)
|
(877,267
|
)
|
—
|
8,694
|
||||||||
|
Stanley
|
U.S. Federal Funds
|
MSGWQQQE
|
||||||||||||||||
|
Effective Rate)
|
Basket
|
|||||||||||||||||
|
$
|
(5,743,560
|
)
|
||||||||||||||||
EUR – Euro
GBP – British Pound Sterling
plc – Public Limited Co.
USD – U.S. Dollar
|
*
|
Based on the net swap value held at each counterparty, unrealized appreciation is a receivable and unrealized depreciation is a payable.
|
The accompanying notes are an integral part of these financial statements.
56
WEISS ALTERNATIVE MULTI-STRATEGY FUND
Schedule of Swap Contracts – Continued
October 31, 2023
|
(a)
|
The components of the Sector-Neutral Dividend Yield Basket are shown below. The fifty largest components of each leg of the basket as of October 31, 2023, are shown below.
|
|
Shares
|
Value
|
% of basket
|
||||||||||
|
COMMON STOCKS
|
||||||||||||
|
Banks
|
||||||||||||
|
Citigroup, Inc.
|
662
|
$
|
26,149
|
0.48
|
%
|
|||||||
|
Fifth Third Bancorp
|
1,038
|
24,612
|
0.45
|
%
|
||||||||
|
Huntington Bancshares, Inc.
|
2,490
|
24,032
|
0.44
|
%
|
||||||||
|
KeyCorp
|
2,461
|
25,155
|
0.46
|
%
|
||||||||
|
PNC Financial Services Group, Inc.
|
227
|
26,028
|
0.48
|
%
|
||||||||
|
Truist Financial Corp.
|
906
|
25,683
|
0.47
|
%
|
||||||||
|
US Bancorp
|
753
|
24,006
|
0.44
|
%
|
||||||||
|
Zions Bancorp
|
780
|
24,070
|
0.44
|
%
|
||||||||
|
199,735
|
||||||||||||
|
Beverages
|
||||||||||||
|
Coca-Cola Co.
|
477
|
26,964
|
0.50
|
%
|
||||||||
|
PepsiCo, Inc.
|
159
|
26,027
|
0.48
|
%
|
||||||||
|
52,991
|
||||||||||||
|
Biotechnology
|
||||||||||||
|
AbbVie, Inc.
|
377
|
53,178
|
0.98
|
%
|
||||||||
|
Amgen, Inc.
|
245
|
62,655
|
1.15
|
%
|
||||||||
|
Gilead Sciences, Inc.
|
509
|
39,970
|
0.74
|
%
|
||||||||
|
Pfizer, Inc.
|
1,760
|
53,790
|
0.99
|
%
|
||||||||
|
209,593
|
||||||||||||
|
Capital Markets
|
||||||||||||
|
Becton Dickinson & Co.
|
123
|
31,213
|
0.57
|
%
|
||||||||
|
Communications Equipment
|
||||||||||||
|
Cisco Systems, Inc.
|
1,923
|
100,229
|
1.84
|
%
|
||||||||
|
Juniper Networks, Inc.
|
938
|
25,262
|
0.46
|
%
|
||||||||
|
125,491
|
||||||||||||
|
Consumer Staples Distribution & Retail
|
||||||||||||
|
Target Corp.
|
227
|
25,190
|
0.46
|
%
|
||||||||
|
Diversified Telecommunication Services
|
||||||||||||
|
AT&T, Inc.
|
8,086
|
124,523
|
2.29
|
%
|
||||||||
|
Verizon Communications Inc
|
3,438
|
120,790
|
2.22
|
%
|
||||||||
|
245,313
|
||||||||||||
|
Health Care Equipment & Supplies
|
||||||||||||
|
Abbott Laboratories
|
418
|
39,531
|
0.73
|
%
|
||||||||
|
Medtronic plc
|
490
|
34,568
|
0.64
|
%
|
||||||||
|
74,099
|
||||||||||||
The accompanying notes are an integral part of these financial statements.
57
WEISS ALTERNATIVE MULTI-STRATEGY FUND
Schedule of Swap Contracts – Continued
October 31, 2023
|
Shares
|
Value
|
% of basket
|
||||||||||
|
Health Care Providers & Services
|
||||||||||||
|
Cigna Group
|
133
|
$
|
41,232
|
0.76
|
%
|
|||||||
|
CVS Health Corp.
|
928
|
64,071
|
1.18
|
%
|
||||||||
|
UnitedHealth Group, Inc.
|
129
|
68,849
|
1.27
|
%
|
||||||||
|
174,152
|
||||||||||||
|
Industrials
|
||||||||||||
|
Dolby Laboratories, Inc.
|
342
|
27,690
|
0.51
|
%
|
||||||||
|
Insurance
|
||||||||||||
|
Prudential Financial, Inc.
|
290
|
26,524
|
0.49
|
%
|
||||||||
|
IT Services
|
||||||||||||
|
Accenture plc
|
338
|
100,387
|
1.85
|
%
|
||||||||
|
Cognizant Technology Solutions Corp.
|
1,093
|
70,454
|
1.30
|
%
|
||||||||
|
International Business Machines Corp.
|
744
|
107,576
|
1.98
|
%
|
||||||||
|
278,417
|
||||||||||||
|
Media
|
||||||||||||
|
Interpublic Group of Cos., Inc.
|
1,856
|
52,696
|
0.97
|
%
|
||||||||
|
Nexstar Media Group, Inc.
|
192
|
26,955
|
0.50
|
%
|
||||||||
|
Telephone and Data Systems, Inc.
|
2,004
|
36,450
|
0.67
|
%
|
||||||||
|
116,101
|
||||||||||||
|
Pharmaceuticals
|
||||||||||||
|
Bristol-Myers Squibb Co.
|
1,013
|
52,198
|
0.96
|
%
|
||||||||
|
Johnson & Johnson
|
386
|
57,249
|
1.05
|
%
|
||||||||
|
Merck & Co., Inc.
|
573
|
58,883
|
1.08
|
%
|
||||||||
|
Omnicom Group, Inc.
|
761
|
56,992
|
1.05
|
%
|
||||||||
|
225,322
|
||||||||||||
|
Semiconductors & Semiconductor Equipment
|
||||||||||||
|
Analog Devices, Inc.
|
602
|
94,645
|
1.74
|
%
|
||||||||
|
Broadcom, Inc.
|
122
|
102,995
|
1.90
|
%
|
||||||||
|
Intel Corp.
|
3,163
|
115,459
|
2.13
|
%
|
||||||||
|
Microchip Technology, Inc.
|
1,332
|
94,972
|
1.75
|
%
|
||||||||
|
QUALCOMM, Inc.
|
964
|
105,100
|
1.93
|
%
|
||||||||
|
Skyworks Solutions, Inc.
|
433
|
37,573
|
0.69
|
%
|
||||||||
|
Texas Instruments, Inc.
|
645
|
91,658
|
1.69
|
%
|
||||||||
|
642,402
|
||||||||||||
|
Software
|
||||||||||||
|
Oracle Corp.
|
902
|
93,247
|
1.72
|
%
|
||||||||
|
Specialty Retail
|
||||||||||||
|
Gap, Inc.
|
1,956
|
25,036
|
0.46
|
%
|
||||||||
|
Williams-Sonoma, Inc.
|
158
|
23,781
|
0.44
|
%
|
||||||||
|
48,817
|
||||||||||||
The accompanying notes are an integral part of these financial statements.
58
WEISS ALTERNATIVE MULTI-STRATEGY FUND
Schedule of Swap Contracts – Continued
October 31, 2023
|
Shares
|
Value
|
% of basket
|
||||||||||
|
Technology Hardware, Storage & Periperals
|
||||||||||||
|
Hewlett Packard Enterprise Co.
|
3,325
|
$
|
51,140
|
0.94
|
%
|
|||||||
|
HP, Inc.
|
1,721
|
45,322
|
0.83
|
%
|
||||||||
|
NetApp, Inc.
|
577
|
42,001
|
0.77
|
%
|
||||||||
|
138,463
|
||||||||||||
|
SHORT COMMON STOCKS
|
||||||||||||
|
Capital Markets
|
||||||||||||
|
Intercontinental Exchange, Inc.
|
(232
|
)
|
$
|
(24,906
|
)
|
0.46
|
%
|
|||||
|
Consumer Finance
|
||||||||||||
|
American Express Co.
|
(171
|
)
|
(24,918
|
)
|
0.46
|
%
|
||||||
|
Consumer Staples Distribution & Retail
|
||||||||||||
|
Costco Wholesale Corp.
|
(53
|
)
|
(29,337
|
)
|
0.54
|
%
|
||||||
|
Walmart, Inc.
|
(179
|
)
|
(29,192
|
)
|
0.54
|
%
|
||||||
|
(58,529
|
)
|
|||||||||||
|
Electronic Equipment, Instruments & Components
|
||||||||||||
|
Amphenol Corp.
|
(713
|
)
|
(57,393
|
)
|
1.06
|
%
|
||||||
|
Jabil, Inc.
|
(200
|
)
|
(39,982
|
)
|
0.74
|
%
|
||||||
|
CDW Corp.
|
(445
|
)
|
(54,652
|
)
|
1.01
|
%
|
||||||
|
(152,027
|
)
|
|||||||||||
|
Entertainment
|
||||||||||||
|
Electronic Arts, Inc.
|
(930
|
)
|
(115,166
|
)
|
2.12
|
%
|
||||||
|
Financial Services
|
||||||||||||
|
Marsh & McLennan Cos. Inc.
|
(139
|
)
|
(26,425
|
)
|
0.49
|
%
|
||||||
|
Mastercard, Inc.
|
(66
|
)
|
(24,851
|
)
|
0.46
|
%
|
||||||
|
Visa, Inc.
|
(111
|
)
|
(26,095
|
)
|
0.48
|
%
|
||||||
|
(77,371
|
)
|
|||||||||||
|
Food Products
|
||||||||||||
|
Mondelez International, Inc.
|
(402
|
)
|
(26,640
|
)
|
0.49
|
%
|
||||||
|
Health Care Equipment & Supplies
|
||||||||||||
|
GE HealthCare Technologies, Inc.
|
(376
|
)
|
(25,032
|
)
|
0.46
|
%
|
||||||
|
ResMed, Inc.
|
(245
|
)
|
(34,653
|
)
|
0.64
|
%
|
||||||
|
Stryker Corp.
|
(162
|
)
|
(43,748
|
)
|
0.81
|
%
|
||||||
|
Teradyne, Inc.
|
(536
|
)
|
(44,592
|
)
|
0.82
|
%
|
||||||
|
Zimmer Biomet Holdings Inc.
|
(245
|
)
|
(25,533
|
)
|
0.47
|
%
|
||||||
|
(173,558
|
)
|
|||||||||||
The accompanying notes are an integral part of these financial statements.
59
WEISS ALTERNATIVE MULTI-STRATEGY FUND
Schedule of Swap Contracts – Continued
October 31, 2023
|
Shares
|
Value
|
% of basket
|
||||||||||
|
Health Care Providers & Services
|
||||||||||||
|
Elevance Health, Inc.
|
(115
|
)
|
$
|
(51,816
|
)
|
0.95
|
%
|
|||||
|
HCA Healthcare, Inc.
|
(143
|
)
|
(32,328
|
)
|
0.60
|
%
|
||||||
|
Humana, Inc.
|
(131
|
)
|
(68,526
|
)
|
1.26
|
%
|
||||||
|
McKesson Corp.
|
(123
|
)
|
(55,993
|
)
|
1.03
|
%
|
||||||
|
(208,663
|
)
|
|||||||||||
|
Household Products
|
||||||||||||
|
Procter & Gamble Co.
|
(187
|
)
|
(28,047
|
)
|
0.52
|
%
|
||||||
|
Insurance
|
||||||||||||
|
Aon plc
|
(82
|
)
|
(25,270
|
)
|
0.47
|
%
|
||||||
|
Arthur J. Gallagher & Co.
|
(118
|
)
|
(27,880
|
)
|
0.51
|
%
|
||||||
|
Chubb Ltd.
|
(135
|
)
|
(29,073
|
)
|
0.54
|
%
|
||||||
|
Progressive Corp.
|
(204
|
)
|
(32,237
|
)
|
0.59
|
%
|
||||||
|
Willis Towers Watson plc
|
(131
|
)
|
(30,914
|
)
|
0.57
|
%
|
||||||
|
(145,374
|
)
|
|||||||||||
|
Life Sciences Tools & Services
|
||||||||||||
|
Agilent Technologies, Inc.
|
(251
|
)
|
(25,932
|
)
|
0.48
|
%
|
||||||
|
Thermo Fisher Scientific, Inc
|
(113
|
)
|
(50,160
|
)
|
0.92
|
%
|
||||||
|
(76,092
|
)
|
|||||||||||
|
Media
|
||||||||||||
|
Comcast Corp.
|
(2,522
|
)
|
(104,127
|
)
|
1.92
|
%
|
||||||
|
Fox Corp.
|
(2,094
|
)
|
(63,644
|
)
|
1.17
|
%
|
||||||
|
News Corp.
|
(1,289
|
)
|
(26,652
|
)
|
0.49
|
%
|
||||||
|
New York Times Co.
|
(734
|
)
|
(29,601
|
)
|
0.54
|
%
|
||||||
|
Paramount Global
|
(5,000
|
)
|
(54,397
|
)
|
1.00
|
%
|
||||||
|
(278,421
|
)
|
|||||||||||
|
Pharmaceuticals
|
||||||||||||
|
Cencora, Inc.
|
(352
|
)
|
(65,135
|
)
|
1.20
|
%
|
||||||
|
Danaher Corp.
|
(239
|
)
|
(45,824
|
)
|
0.84
|
%
|
||||||
|
Eli Lilly & Co.
|
(115
|
)
|
(63,725
|
)
|
1.17
|
%
|
||||||
|
Zoetis, Inc.
|
(250
|
)
|
(39,309
|
)
|
0.72
|
%
|
||||||
|
(213,993
|
)
|
|||||||||||
|
Semiconductors & Semiconductor Equipment
|
||||||||||||
|
Applied Materials, Inc.
|
(722
|
)
|
(95,546
|
)
|
1.76
|
%
|
||||||
|
Entegris, Inc.
|
(445
|
)
|
(39,159
|
)
|
0.72
|
%
|
||||||
|
KLA Corp.
|
(219
|
)
|
(102,719
|
)
|
1.89
|
%
|
||||||
|
Lam Research Corp.
|
(159
|
)
|
(93,369
|
)
|
1.72
|
%
|
||||||
|
Marvell Technology, Inc.
|
(1,900
|
)
|
(89,741
|
)
|
1.65
|
%
|
||||||
|
Micron Technology, Inc.
|
(1,600
|
)
|
(107,021
|
)
|
1.97
|
%
|
||||||
The accompanying notes are an integral part of these financial statements.
60
WEISS ALTERNATIVE MULTI-STRATEGY FUND
Schedule of Swap Contracts – Continued
October 31, 2023
|
Shares
|
Value
|
% of basket
|
||||||||||
|
Semiconductors & Semiconductor
|
||||||||||||
|
Equipment (Continued)
|
||||||||||||
|
Monolithic Power Systems, Inc.
|
(200
|
)
|
$
|
(88,290
|
)
|
1.62
|
%
|
|||||
|
NVIDIA Corp.
|
(221
|
)
|
(90,207
|
)
|
1.66
|
%
|
||||||
|
(706,052
|
)
|
|||||||||||
|
Software
|
||||||||||||
|
Intuit, Inc.
|
(202
|
)
|
(99,775
|
)
|
1.84
|
%
|
||||||
|
Microsoft Corp.
|
(331
|
)
|
(112,063
|
)
|
2.06
|
%
|
||||||
|
Roper Technologies, Inc.
|
(116
|
)
|
(56,559
|
)
|
1.04
|
%
|
||||||
|
(268,397
|
)
|
|||||||||||
|
Technology Hardware, Storage & Periperals
|
||||||||||||
|
Apple, Inc.
|
(581
|
)
|
(99,171
|
)
|
1.83
|
%
|
||||||
The accompanying notes are an integral part of these financial statements.
61
WEISS ALTERNATIVE MULTI-STRATEGY FUND
Statement of Assets and Liabilities
October 31, 2023
|
ASSETS:
|
||||
|
Investments, at value (Cost $138,266,567)
|
$
|
130,965,619
|
||
|
Cash(1)
|
59,011,651
|
|||
|
Foreign currency, at value (Cost $8,188,553)
|
8,069,462
|
|||
|
Deposits at broker for securities sold short and written options
|
101,708,277
|
|||
|
Collateral for swap contracts
|
23,340,000
|
|||
|
Deposits for futures
|
4,984,210
|
|||
|
Dividends and interest receivable
|
703,160
|
|||
|
Receivable for investments sold
|
29,620,303
|
|||
|
Variation margin receivable, net
|
320,521
|
|||
|
Receivable for fund shares sold
|
95,224
|
|||
|
Prepaid expenses and other receivables
|
14,734
|
|||
|
Total assets
|
358,833,161
|
|||
|
LIABILITIES:
|
||||
|
Securities sold short, at value (proceeds of $108,320,596)
|
104,273,077
|
|||
|
Written option contracts, at value (premiums received $77,748)
|
62,161
|
|||
|
Payable for investments purchased
|
29,893,678
|
|||
|
Payable for swap contracts, net
|
5,743,560
|
|||
|
Payable to broker for foreign currency (proceeds $274,836)
|
273,913
|
|||
|
Payable for fund shares redeemed
|
568,566
|
|||
|
Payable to Adviser, net
|
196,600
|
|||
|
Dividends and interest payable for securities sold short
|
239,448
|
|||
|
Payable for fund administration and fund accounting fees
|
81,953
|
|||
|
Payable for custodian fees
|
70,168
|
|||
|
Payable for transfer agent fees and expenses
|
26,860
|
|||
|
Payable for swap interest and dividends, net
|
13,117
|
|||
|
Payable for compliance fees
|
3,995
|
|||
|
Distribution and shareholder servicing fees payable
|
270
|
|||
|
Accrued expenses and other liabilities
|
70,227
|
|||
|
Total liabilities
|
141,517,593
|
|||
|
NET ASSETS
|
$
|
217,315,568
|
||
|
NET ASSETS CONSISTS OF:
|
||||
|
Paid-in capital
|
$
|
270,043,580
|
||
|
Total accumulated losses
|
(52,728,012
|
)
|
||
|
Total net assets
|
$
|
217,315,568
|
||
|
Class K
|
Investor
|
|||||||
|
Shares
|
Class Shares
|
|||||||
|
Net assets
|
$
|
216,198,165
|
$
|
1,117,403
|
||||
|
Shares issued and outstanding(2)
|
25,357,743
|
133,912
|
||||||
|
Net asset value, offering, and redemption price per share
|
$
|
8.53
|
$
|
8.34
|
||||
|
(1)
|
Includes restricted cash of $58,855,013.
|
|
(2)
|
Unlimited shares authorized without par value.
|
The accompanying notes are an integral part of these financial statements.
62
WEISS ALTERNATIVE MULTI-STRATEGY FUND
Statement of Operations
For the Year Ended October 31, 2023
|
INVESTMENT INCOME:
|
||||
|
Dividend income on long positions (net of foreign withholding taxes of $31,292)
|
$
|
2,916,314
|
||
|
Interest income, including broker interest on short positions
|
7,170,681
|
|||
|
Total investment income
|
10,086,995
|
|||
|
EXPENSES:
|
||||
|
Investment advisory fees (See Note 3)
|
3,551,281
|
|||
|
Dividends on securities sold short
|
2,842,509
|
|||
|
Borrowing expense on securities sold short
|
1,445,686
|
|||
|
Fund administration and fund accounting fees (See Note 3)
|
333,658
|
|||
|
Custodian fees (See Note 3)
|
237,633
|
|||
|
Transfer agent fees (See Note 3)
|
108,315
|
|||
|
Federal and state registration fees
|
42,024
|
|||
|
Audit fees
|
54,500
|
|||
|
Legal fees
|
28,855
|
|||
|
Reports to shareholders
|
30,269
|
|||
|
Compliance fees (See Note 3)
|
16,662
|
|||
|
Trustees’ fees (See Note 3)
|
14,008
|
|||
|
Distribution fees – Investor Class (See Note 3)
|
3,666
|
|||
|
Shareholder servicing fees – Investor Class (See Note 5)
|
1,466
|
|||
|
Other
|
21,702
|
|||
|
Total expense before reimbursement
|
8,732,234
|
|||
|
Less: Expense reimbursement by Adviser (see Note 3)
|
(887,626
|
)
|
||
|
Net expenses
|
7,844,608
|
|||
|
NET INVESTMENT INCOME
|
2,242,387
|
|||
|
REALIZED AND UNREALIZED GAIN (LOSS) ON INVESTMENTS:
|
||||
|
Realized gain (loss) on:
|
||||
|
Investments
|
(2,960,647
|
)
|
||
|
Securities sold short
|
(1,638,134
|
)
|
||
|
Written option contracts expired or closed
|
1,306,553
|
|||
|
Swap contracts
|
(9,153,448
|
)
|
||
|
Future contracts
|
220,617
|
|||
|
Forward currency exchange contracts
|
(6,507
|
)
|
||
|
Foreign currency translation
|
35,911
|
|||
|
Net realized loss
|
(12,195,655
|
)
|
||
|
Change in unrealized appreciation (depreciation) on:
|
||||
|
Investments
|
2,842,736
|
|||
|
Securities sold short
|
4,595,829
|
|||
|
Written option contracts
|
(390,961
|
)
|
||
|
Swap contracts
|
4,743,952
|
|||
|
Future contracts
|
1,203,011
|
|||
|
Forward currency exchange contracts
|
(2,579
|
)
|
||
|
Foreign currency translation
|
(93,393
|
)
|
||
|
Net change in unrealized appreciation (depreciation)
|
12,898,595
|
|||
|
Net realized and unrealized gain on investments
|
702,940
|
|||
|
NET INCREASE IN NET ASSETS RESULTING FROM OPERATIONS
|
$
|
2,945,327
|
||
The accompanying notes are an integral part of these financial statements.
63
WEISS ALTERNATIVE MULTI-STRATEGY FUND
Statements of Changes in Net Assets
|
Year Ended
|
Year Ended
|
|||||||
|
October 31, 2023
|
October 31, 2022
|
|||||||
|
OPERATIONS:
|
||||||||
|
Net investment income (loss)
|
$
|
2,242,387
|
$
|
(1,334,348
|
)
|
|||
|
Net realized loss on investments, securities sold short,
|
||||||||
|
written option contracts expired or closed, swap contracts,
|
||||||||
|
futures contracts, forward currency contracts, and foreign currency transactions
|
(12,195,655
|
)
|
(26,864,866
|
)
|
||||
|
Change in unrealized appreciation (depreciation) on investments,
|
||||||||
|
securities sold short, written option contracts, swap contracts,
|
||||||||
|
futures contracts, forward currency contracts and foreign currency translation
|
12,898,595
|
(29,843,337
|
)
|
|||||
|
Net increase (decrease) in net assets resulting from operations
|
2,945,327
|
(58,042,551
|
)
|
|||||
|
DISTRIBUTIONS TO SHAREHOLDERS:
|
||||||||
|
Class K
|
(29,340
|
)
|
(15,007,578
|
)
|
||||
|
Investor Class
|
—
|
(709,286
|
)
|
|||||
|
Total distributions to shareholders
|
(29,340
|
)
|
(15,716,864
|
)
|
||||
|
CAPITAL SHARE TRANSACTIONS:
|
||||||||
|
Net increase (decrease) in net assets resulting from capital share transactions(1)
|
(39,326,988
|
)
|
96,793,567
|
|||||
|
NET INCREASE (DECREASE) IN NET ASSETS
|
(36,411,001
|
)
|
23,034,152
|
|||||
|
NET ASSETS:
|
||||||||
|
Beginning of year
|
253,726,569
|
230,692,417
|
||||||
|
End of year
|
$
|
217,315,568
|
$
|
253,726,569
|
||||
|
(1)
|
A summary of capital share transactions is as follows:
|
SHARE TRANSACTIONS:
|
For the Year Ended
|
For the Year Ended
|
|||||||||||||||
|
October 31, 2023
|
October 31, 2022
|
|||||||||||||||
|
Shares
|
Amount
|
Shares
|
Amount
|
|||||||||||||
|
Class K:
|
||||||||||||||||
|
Issued
|
10,469,048
|
$
|
92,132,665
|
21,436,992
|
$
|
207,598,738
|
||||||||||
|
Issued to holders in
|
||||||||||||||||
|
reinvestment of dividends
|
3,311
|
28,602
|
1,434,757
|
14,835,381
|
||||||||||||
|
Redeemed
|
(14,953,150
|
)
|
(130,311,043
|
)
|
(13,061,945
|
)
|
(121,379,526
|
)
|
||||||||
|
Net increase (decrease) in Class K
|
(4,480,791
|
)
|
$
|
(38,149,776
|
)
|
9,809,804
|
$
|
101,054,593
|
||||||||
|
Investor Class:
|
||||||||||||||||
|
Issued
|
13,103
|
$
|
113,689
|
434,793
|
$
|
4,492,482
|
||||||||||
|
Issued to holders in
|
||||||||||||||||
|
reinvestment of dividends
|
—
|
—
|
69,674
|
709,286
|
||||||||||||
|
Redeemed
|
(150,943
|
)
|
(1,290,901
|
)
|
(1,044,210
|
)
|
(9,462,794
|
)
|
||||||||
|
Net increase in Investor Class
|
(137,840
|
)
|
$
|
(1,177,211
|
)
|
(539,743
|
)
|
$
|
(4,261,026
|
)
|
||||||
|
Net increase (decrease)
|
||||||||||||||||
|
in shares outstanding
|
(4,618,631
|
)
|
$
|
(39,326,988
|
)
|
9,270,061
|
$
|
96,793,567
|
||||||||
The accompanying notes are an integral part of these financial statements.
64
WEISS ALTERNATIVE MULTI-STRATEGY FUND
Financial Highlights
For a Fund share outstanding throughout the year.
|
Year Ended
|
Year Ended
|
Year Ended
|
Year Ended
|
Year Ended
|
||||||||||||||||
|
October 31,
|
October 31,
|
October 31,
|
October 31,
|
October 31,
|
||||||||||||||||
|
2023
|
2022
|
2021
|
2020
|
2019
|
||||||||||||||||
|
Class K
|
||||||||||||||||||||
|
PER SHARE DATA:
|
||||||||||||||||||||
|
Net asset value, beginning of year
|
$
|
8.43
|
$
|
11.08
|
$
|
10.67
|
$
|
11.25
|
$
|
10.44
|
||||||||||
|
INVESTMENT OPERATIONS:
|
||||||||||||||||||||
|
Net investment income (loss)(1)
|
0.08
|
(0.05
|
)
|
(0.08
|
)
|
(0.02
|
)
|
0.08
|
||||||||||||
|
Net realized and unrealized
|
||||||||||||||||||||
|
gain (loss) on investments
|
0.02
|
(1.92
|
)
|
1.30
|
0.62
|
1.18
|
||||||||||||||
|
Total from investment operations
|
0.10
|
(1.97
|
)
|
1.22
|
0.60
|
1.26
|
||||||||||||||
|
LESS DISTRIBUTIONS FROM:
|
||||||||||||||||||||
|
Net investment income
|
0.00
|
(2)
|
—
|
(0.02
|
)
|
(0.11
|
)
|
(0.21
|
)
|
|||||||||||
|
Net realized gains
|
—
|
(0.68
|
)
|
(0.79
|
)
|
(1.07
|
)
|
(0.24
|
)
|
|||||||||||
|
Total distributions
|
—
|
(0.68
|
)
|
(0.81
|
)
|
(1.18
|
)
|
(0.45
|
)
|
|||||||||||
|
Redemption fees
|
—
|
—
|
—
|
—
|
—
|
|||||||||||||||
|
Net asset value, end of year
|
$
|
8.53
|
$
|
8.43
|
$
|
11.08
|
$
|
10.67
|
$
|
11.25
|
||||||||||
|
TOTAL RETURN
|
1.20
|
%
|
-18.99
|
%
|
11.88
|
%
|
5.79
|
%
|
12.76
|
%
|
||||||||||
|
SUPPLEMENTAL DATA AND RATIOS:
|
||||||||||||||||||||
|
Net assets, end of year (in thousands)
|
$
|
216,198
|
$
|
251,477
|
$
|
221,827
|
$
|
91,865
|
$
|
89,627
|
||||||||||
|
Ratio of gross expenses to average net assets:
|
||||||||||||||||||||
|
Before expense reimbursement(3)
|
3.69
|
%
|
3.01
|
%
|
3.46
|
%
|
4.07
|
%
|
3.95
|
%
|
||||||||||
|
After expense reimbursement(3)
|
3.31
|
%
|
2.71
|
%
|
2.79
|
%
|
3.05
|
%
|
3.16
|
%
|
||||||||||
|
Ratio of dividends, interest, and borrowing expense
|
||||||||||||||||||||
|
on securities sold short to average net assets(3)
|
1.81
|
%
|
1.21
|
%
|
1.29
|
%
|
1.55
|
%
|
1.66
|
%
|
||||||||||
|
Ratio of operating expenses to average net assets
|
||||||||||||||||||||
|
excluding dividends, interest, and borrowing
|
||||||||||||||||||||
|
expense on securities sold short(3)
|
1.50
|
%
|
1.50
|
%
|
1.50
|
%
|
1.50
|
%
|
1.50
|
%
|
||||||||||
|
Ratio of net investment income (loss)
|
||||||||||||||||||||
|
to average net assets(3)
|
0.95
|
%
|
(0.49
|
)%
|
(0.77
|
)%
|
(0.24
|
)%
|
0.78
|
%
|
||||||||||
|
Portfolio turnover rate(4)
|
1,160
|
%
|
734
|
%
|
576
|
%
|
738
|
%
|
585
|
%
|
||||||||||
|
(1)
|
Calculated based on average shares outstanding during the years.
|
|
(2)
|
Amount per share is less than $0.005.
|
|
(3)
|
These ratios exclude the impact of expenses of the underlying exchange-traded funds as represented in the Schedule of Investments. Recognition of net investment income by the Fund is affected by
the timing of the declaration of dividends by the underlying exchange-traded funds in which the Fund invests.
|
|
(4)
|
The portfolio turnover disclosed is for the Fund as a whole. The numerator for the portfolio turnover rate includes the lesser of purchases or sales (excluding short-term investments, short-term
options, swap contracts, futures contracts and short positions). The denominator includes the average fair value of long positions throughout the years ended.
|
The accompanying notes are an integral part of these financial statements.
65
WEISS ALTERNATIVE MULTI-STRATEGY FUND
Financial Highlights
For a Fund share outstanding throughout the year.
|
Year Ended
|
Year Ended
|
Year Ended
|
Year Ended
|
Year Ended
|
||||||||||||||||
|
October 31,
|
October 31,
|
October 31,
|
October 31,
|
October 31,
|
||||||||||||||||
|
2023
|
2022
|
2021
|
2020
|
2019
|
||||||||||||||||
|
Investor Class
|
||||||||||||||||||||
|
PER SHARE DATA:
|
||||||||||||||||||||
|
Net asset value, beginning of year
|
$
|
8.28
|
$
|
10.92
|
$
|
10.56
|
$
|
11.16
|
$
|
10.38
|
||||||||||
|
INVESTMENT OPERATIONS:
|
||||||||||||||||||||
|
Net investment income (loss)(1)
|
0.04
|
(0.08
|
)
|
(0.12
|
)
|
(0.06
|
)
|
0.05
|
||||||||||||
|
Net realized and unrealized
|
||||||||||||||||||||
|
gain (loss) on investments(2)
|
0.02
|
(1.88
|
)
|
1.28
|
0.61
|
1.18
|
||||||||||||||
|
Total from investment operations
|
0.06
|
(1.96
|
)
|
1.16
|
0.55
|
1.23
|
||||||||||||||
|
LESS DISTRIBUTIONS FROM:
|
||||||||||||||||||||
|
Net investment income
|
—
|
—
|
(0.01
|
)
|
(0.08
|
)
|
(0.21
|
)
|
||||||||||||
|
Net realized gains
|
—
|
(0.68
|
)
|
(0.79
|
)
|
(1.07
|
)
|
(0.24
|
)
|
|||||||||||
|
Total distributions
|
—
|
(0.68
|
)
|
(0.80
|
)
|
(1.15
|
)
|
(0.45
|
)
|
|||||||||||
|
Redemption fees
|
—
|
—
|
—
|
0.00(3
|
)
|
0.00
|
(3)
|
|||||||||||||
|
Net asset value, end of year
|
$
|
8.34
|
$
|
8.28
|
$
|
10.92
|
$
|
10.56
|
$
|
11.16
|
||||||||||
|
TOTAL RETURN
|
0.85
|
%
|
-19.26
|
%
|
11.43
|
%
|
5.48
|
%
|
12.36
|
%
|
||||||||||
|
SUPPLEMENTAL DATA AND RATIOS:
|
||||||||||||||||||||
|
Net assets, end of year (in thousands)
|
$
|
1,117
|
$
|
2,249
|
$
|
8,865
|
$
|
5,905
|
$
|
5,487
|
||||||||||
|
Ratio of gross expenses to average net assets:
|
||||||||||||||||||||
|
Before expense reimbursement(4)
|
4.04
|
%
|
3.36
|
%
|
3.80
|
%
|
4.42
|
%
|
4.30
|
%
|
||||||||||
|
After expense reimbursement(4)
|
3.66
|
%
|
3.06
|
%
|
3.14
|
%
|
3.40
|
%
|
3.51
|
%
|
||||||||||
|
Ratio of dividends, interest, and borrowing expense
|
||||||||||||||||||||
|
on securities sold short to average net assets(4)
|
1.81
|
%
|
1.21
|
%
|
1.29
|
%
|
1.55
|
%
|
1.66
|
%
|
||||||||||
|
Ratio of operating expenses to average net assets
|
||||||||||||||||||||
|
excluding dividends, interest, and borrowing
|
||||||||||||||||||||
|
expense on securities sold short(4)
|
1.85
|
%
|
1.85
|
%
|
1.85
|
%
|
1.85
|
%
|
1.85
|
%
|
||||||||||
|
Ratio of net investment income (loss)
|
||||||||||||||||||||
|
to average net assets(4)
|
0.60
|
%
|
(0.84
|
)%
|
(1.11
|
)%
|
(0.59
|
)%
|
0.43
|
%
|
||||||||||
|
Portfolio turnover rate(5)
|
1,160
|
%
|
734
|
%
|
576
|
%
|
738
|
%
|
585
|
%
|
||||||||||
|
(1)
|
Calculated based on average shares outstanding during the years.
|
|
(2)
|
Realized and unrealized gains and losses per share in this caption are balancing amounts necessary to reconcile the change in net asset value per share for the years, and may not reconcile with
the aggregate gains and losses in the Statement of Operations due to share transactions for the year.
|
|
(3)
|
Amount per share is less than $0.005.
|
|
(4)
|
These ratios exclude the impact of expenses of the underlying exchange traded funds as represented in the Schedule of Investments. Recognition of net investment income by the Fund is affected by
the timing of the declaration of dividends by the underlying exchange traded funds in which the Fund invests.
|
|
(5)
|
The portfolio turnover disclosed is for the Fund as a whole. The numerator for the portfolio turnover rate includes the lesser of purchases or sales (excluding short-term investments, short-term
options, swap contracts, futures contracts and short positions). The denominator includes the average fair value of long positions throughout the years end.
|
The accompanying notes are an integral part of these financial statements.
66
WEISS ALTERNATIVE MULTI-STRATEGY FUND
Notes to the Financial Statements
October 31, 2023
1. ORGANIZATION
Series Portfolios Trust (the “Trust”) was organized as a Delaware statutory trust under a Declaration of Trust dated July 27, 2015. The Trust is registered under the Investment Company Act of 1940, as
amended (the “1940 Act”), as an open-end management investment company. The Weiss Alternative Multi-Strategy Fund (the “Fund”) is a diversified series with its own investment objectives and policies within the Trust. The Fund’s investment adviser,
Weiss Multi-Strategy Advisers LLC (the “Adviser”), is responsible for investment advisory services, day-to-day management of the Fund’s assets, as well as compliance, sales, marketing and operation services to the Fund. The primary investment
objective of the Fund is to provide returns with moderate volatility and reduced correlation to the bond and equity markets. The Fund commenced operations on December 1, 2015. The Fund is an investment company and accordingly follows the investment
company accounting and reporting guidance of the Financial Accounting Standards Board (“FASB”) Accounting Standards Codification (the “Codification”) Topic 946 Financial Services – Investment Companies. The Fund does not hold itself out as related to
any other series of the Trust for purposes of investment and investor services, nor does it share the same investment adviser with any other series of the Trust.
The Fund offers four share classes, Class A, Class I, Class K and Investor Class. Effective March 31, 2017, the Fund ceased offering Class I. As of October 31, 2023, Class A and Class I shares are not
available for purchase. Class K and Investor Class shares have no front-end sales load, no deferred sales charge, and a 1.00% redemption fee prior to November 22, 2019. Investor Class shares are subject to a 0.25% distribution fee and a shareholder
servicing fee of up to 0.10% of average daily net assets. Class K shares are not subject to a distribution fee or a shareholder servicing fee.
The Fund may issue an unlimited number of shares of beneficial interest, with no par value. All shares of the Fund have equal rights and privileges except with respect to distribution fees and voting
rights on matters affecting a single share class.
2. SIGNIFICANT ACCOUNTING POLICIES
The following is a summary of significant accounting policies consistently followed by the Fund in the preparation of its financial statements. These policies are in conformity with generally accepted
accounting principles in the United States of America (“GAAP”).
A. Investment Valuation – The following is a summary of the Fund’s pricing procedures. It is intended to be a general discussion and may not necessarily
reflect all the pricing procedures followed by the Fund. Equity securities, including common stocks, preferred stocks, and real estate investment trusts (“REITS”) that are traded on a national securities exchange, except those listed on the Nasdaq
Global Market®, Nasdaq Global Select Market® and the Nasdaq Capital Market® exchanges (collectively “Nasdaq”), are valued at the last reported sale price on that exchange on which the security is principally traded. Securities traded on Nasdaq
will be valued at the Nasdaq Official Closing Price (“NOCP”). If, on a particular day, an exchange traded or Nasdaq security does not trade, then the mean between the most recent quoted bid and asked prices will be used. All equity securities that
are not traded on a listed exchange are valued at the last sale price in the over-the-counter (“OTC”) market. If a non-exchanged traded equity security does not trade on a particular day, then the mean between the last quoted closing bid and asked
price will be used. To the extent these securities are actively traded and valuation adjustments are not applied, they are categorized in Level 1 of the fair value hierarchy.
67
WEISS ALTERNATIVE MULTI-STRATEGY FUND
Notes to the Financial Statements – Continued
October 31, 2023
Fixed income securities, including short-term debt instruments having a maturity less than 60 days, are valued at the evaluated mean price supplied by an approved independent third-party pricing service
(“Pricing Service”). These securities are categorized in Level 2 of the fair value hierarchy.
In the case of foreign securities, the occurrence of events after the close of foreign markets, but prior to the time the Fund’s NAV is calculated will result in an adjustment to the trading prices of
foreign securities when foreign markets open on the following business day. The Fund will value foreign securities at fair value, taking into account such events in calculating the NAV. In such cases, use of fair valuation can reduce an investor’s
ability to seek profit by estimating the Fund’s NAV in advance of the time the NAV is calculated. These securities are categorized in Level 2 of the fair value hierarchy.
Exchange traded funds and closed-end funds are valued at the last reported sale price on the exchange on which the security is principally traded. If, on a particular day, an exchange-traded fund does
not trade, then the mean between the most recent quoted bid and asked prices will be used. To the extent these securities are actively traded and valuation adjustments are not applied, they are categorized in Level 1 of the fair value hierarchy.
Investments in registered open-end investment companies (including money market funds), other than exchange-traded funds, are typically valued at their reported NAV per share. To the extent these
securities are valued at their NAV per share, they are categorized in Level 1 of the fair value hierarchy.
Forward currency contracts maturing in two or fewer days are valued at the spot rate. Forward currency contracts maturing in three days or more are valued at the midpoint prices calculated by U.S.
Bancorp Fund Services, LLC, doing business as U.S. Bank Global Fund Services (“Fund Services” or the “Administrator”) using an “interpolation” methodology that incorporates foreign-exchange prices obtained from an approved pricing service for
standard forward-settlement periods, such as one month, three months, six months and one year. These securities are categorized in Level 2 of the fair value hierarchy.
Exchange traded options and Flexible Exchange® options (“FLEX options”) are valued at the composite mean price, which
calculates the mean of the highest bid price and lowest ask price across the exchanges where the option is principally traded. If the composite mean price is not available, the last sale or settlement price maybe be used. For non-exchange traded
options, models such as Black-Scholes can be used to value the options. On the last trading day prior to expiration, expiring options may be priced at intrinsic value. These securities are categorized in Level 2 of the fair value hierarchy.
Futures contracts are valued at the settlement price on the exchange on which they are principally traded. The settlement price is the average of the prices at which a futures contract trades
immediately before the close of trading for the day. Equity swap contract prices are determined by using the same methods used to price the underlying security. These securities are categorized in Level 1 or Level 2 of the fair value hierarchy.
The Board of Trustees (the “Board”) has adopted a pricing and valuation policy for use by the Fund and its Valuation Designee (as defined below) in calculating the Fund’s NAV. Pursuant to Rule 2a-5
under the 1940 Act, the Fund has designated Weiss Multi-Strategy Advisers LLC (the “Adviser”) as its “Valuation Designee” to perform all of the fair value determinations as well as to perform all of the responsibilities that may be performed by the
Valuation Designee in accordance with Rule 2a-5. The Valuation Designee is authorized to make all necessary determinations of the fair values of the portfolio securities and other assets for which market quotations are not readily available or if it
is deemed that the prices obtained from brokers and dealers or independent pricing services are unreliable.
68
WEISS ALTERNATIVE MULTI-STRATEGY FUND
Notes to the Financial Statements – Continued
October 31, 2023
The Fund has adopted authoritative fair value accounting standards which establish an authoritative definition of fair value and set out a hierarchy for measuring fair value. These standards require
additional disclosures about the various inputs and valuation techniques used to develop the measurements of fair value, a discussion in changes in valuation techniques and related inputs during the period and expanded disclosure of valuation levels
for major security types. These inputs are summarized in the three broad levels listed below:
|
Level 1 –
|
Unadjusted quoted prices in active markets for identical assets or liabilities that the Fund has the ability to access.
|
|
Level 2 –
|
Observable inputs other than quoted prices included in Level 1 that are observable for the asset or liability, either directly or indirectly. These inputs may include quoted prices for the
identical instrument on an inactive market, prices for similar instruments, interest rates, prepayment speeds, credit risk, yield curves, default rates and similar data.
|
|
Level 3 –
|
Unobservable inputs for the asset or liability, to the extent relevant observable inputs are not available, representing the Fund’s own assumptions about the assumptions a market participant
would use in valuing the asset or liability, and would be based on the best information available.
|
The inputs or methodology used for valuing securities are not an indication of the risk associated with investing in those securities.
The following table is a summary of the inputs used to value the Fund’s securities by level within the fair value hierarchy as of October 31, 2023:
|
Level 1
|
Level 2
|
Level 3
|
Total
|
|||||||||||||
|
Assets
|
||||||||||||||||
|
Investments at Fair Value
|
||||||||||||||||
|
Common Stocks
|
||||||||||||||||
|
Aerospace & Defense
|
$
|
819,627
|
$
|
—
|
$
|
—
|
$
|
819,627
|
||||||||
|
Air Freight & Logistics
|
969,892
|
224,012
|
—
|
1,193,904
|
||||||||||||
|
Automobile Components
|
306,578
|
—
|
—
|
306,578
|
||||||||||||
|
Banks
|
4,946,800
|
261,576
|
—
|
5,208,376
|
||||||||||||
|
Beverages
|
2,135,076
|
—
|
—
|
2,135,076
|
||||||||||||
|
Biotechnology
|
2,146,305
|
—
|
—
|
2,146,305
|
||||||||||||
|
Broadline Retail
|
1,496,044
|
—
|
—
|
1,496,044
|
||||||||||||
|
Building Products
|
338,215
|
—
|
—
|
338,215
|
||||||||||||
|
Capital Markets
|
6,272,999
|
134,625
|
—
|
6,407,624
|
||||||||||||
|
Chemicals
|
1,407,083
|
—
|
—
|
1,407,083
|
||||||||||||
|
Commercial Services & Supplies
|
36,131
|
—
|
—
|
36,131
|
||||||||||||
|
Communications Equipment
|
1,703,083
|
—
|
—
|
1,703,083
|
||||||||||||
|
Construction & Engineering
|
543,193
|
—
|
—
|
543,193
|
||||||||||||
|
Construction Materials
|
214,839
|
—
|
—
|
214,839
|
||||||||||||
|
Consumer Finance
|
578,803
|
—
|
—
|
578,803
|
||||||||||||
|
Consumer Staples Distribution & Retail
|
1,551,045
|
—
|
—
|
1,551,045
|
||||||||||||
|
Containers & Packaging
|
141,453
|
—
|
—
|
141,453
|
||||||||||||
|
Distributors
|
94,731
|
—
|
—
|
94,731
|
||||||||||||
|
Diversified Consumer Services
|
17,259
|
—
|
—
|
17,259
|
||||||||||||
69
WEISS ALTERNATIVE MULTI-STRATEGY FUND
Notes to the Financial Statements – Continued
October 31, 2023
|
Level 1
|
Level 2
|
Level 3
|
Total
|
|||||||||||||
|
Assets – Continued
|
||||||||||||||||
|
Investments at Fair Value – Continued
|
||||||||||||||||
|
Diversified REITs
|
$
|
1,188,790
|
$
|
—
|
$
|
—
|
$
|
1,188,790
|
||||||||
|
Diversified Telecommunication Services
|
415,769
|
—
|
—
|
415,769
|
||||||||||||
|
Electric Utilities
|
—
|
81,689
|
—
|
81,689
|
||||||||||||
|
Electrical Equipment
|
1,025,604
|
—
|
—
|
1,025,604
|
||||||||||||
|
Electronic Equipment, Instruments & Components
|
219,499
|
—
|
—
|
219,499
|
||||||||||||
|
Energy Equipment & Services
|
2,673,589
|
—
|
—
|
2,673,589
|
||||||||||||
|
Entertainment
|
1,530,338
|
—
|
—
|
1,530,338
|
||||||||||||
|
Financial Services
|
1,961,265
|
—
|
—
|
1,961,265
|
||||||||||||
|
Food Products
|
2,796,590
|
—
|
—
|
2,796,590
|
||||||||||||
|
Ground Transportation
|
2,176,637
|
—
|
—
|
2,176,637
|
||||||||||||
|
Health Care Equipment & Supplies
|
2,307,046
|
—
|
—
|
2,307,046
|
||||||||||||
|
Health Care Providers & Services
|
1,444,563
|
—
|
—
|
1,444,563
|
||||||||||||
|
Health Care REITs
|
4,373,011
|
—
|
—
|
4,373,011
|
||||||||||||
|
Health Care Technology
|
295,749
|
—
|
—
|
295,749
|
||||||||||||
|
Hotels, Restaurants & Leisure
|
7,716,519
|
—
|
—
|
7,716,519
|
||||||||||||
|
Household Durables
|
168,311
|
—
|
—
|
168,311
|
||||||||||||
|
Household Products
|
2,291,134
|
—
|
—
|
2,291,134
|
||||||||||||
|
Industrial Conglomerates
|
244,469
|
—
|
—
|
244,469
|
||||||||||||
|
Industrial REITs
|
7,156,498
|
—
|
—
|
7,156,498
|
||||||||||||
|
Insurance
|
3,038,087
|
64,001
|
—
|
3,102,088
|
||||||||||||
|
Interactive Media & Services
|
1,300,688
|
—
|
—
|
1,300,688
|
||||||||||||
|
IT Services
|
51,253
|
—
|
—
|
51,253
|
||||||||||||
|
Leisure Products
|
17,292
|
—
|
202
|
(1)
|
17,494
|
|||||||||||
|
Life Sciences Tools & Services
|
1,078,655
|
306,894
|
—
|
1,385,549
|
||||||||||||
|
Machinery
|
1,283,715
|
—
|
—
|
1,283,715
|
||||||||||||
|
Marine Transportation
|
102,040
|
89,976
|
—
|
192,016
|
||||||||||||
|
Media
|
1,246,460
|
—
|
—
|
1,246,460
|
||||||||||||
|
Metals & Mining
|
4,195,221
|
361,433
|
—
|
4,556,654
|
||||||||||||
|
Mortgage Real Estate Investment Trusts (REITs)
|
176,654
|
–
|
—
|
176,654
|
||||||||||||
|
Office REITs
|
6,393,016
|
—
|
—
|
6,393,016
|
||||||||||||
|
Oil, Gas & Consumable Fuels
|
4,553,175
|
—
|
—
|
4,553,175
|
||||||||||||
|
Paper & Forest Products
|
66,140
|
—
|
—
|
66,140
|
||||||||||||
|
Passenger Airlines
|
16,375
|
—
|
—
|
16,375
|
||||||||||||
|
Personal Care Products
|
413,733
|
—
|
—
|
413,733
|
||||||||||||
|
Pharmaceuticals
|
2,161,441
|
165,087
|
—
|
2,326,528
|
||||||||||||
|
Professional Services
|
63,184
|
—
|
—
|
63,184
|
||||||||||||
|
Retail REITs
|
6,125,969
|
—
|
—
|
6,125,969
|
||||||||||||
|
Semiconductors & Semiconductor Equipment
|
2,166,896
|
—
|
—
|
2,166,896
|
||||||||||||
|
Software
|
5,245,328
|
—
|
—
|
5,245,328
|
||||||||||||
|
Specialized REITs
|
6,308,487
|
—
|
—
|
6,308,487
|
||||||||||||
70
WEISS ALTERNATIVE MULTI-STRATEGY FUND
Notes to the Financial Statements – Continued
October 31, 2023
|
Level 1
|
Level 2
|
Level 3
|
Total
|
|||||||||||||
|
Assets – Continued
|
||||||||||||||||
|
Investments at Fair Value – Continued
|
||||||||||||||||
|
Specialty Retail
|
$
|
1,131,147
|
$
|
—
|
$
|
—
|
$
|
1,131,147
|
||||||||
|
Technology Hardware, Storage & Peripherals
|
542,122
|
—
|
—
|
542,123
|
||||||||||||
|
Textiles, Apparel & Luxury Goods
|
224,524
|
—
|
—
|
224,524
|
||||||||||||
|
Trading Companies & Distributors
|
1,526,665
|
—
|
—
|
1,526,665
|
||||||||||||
|
Wireless Telecommunication Services
|
580,317
|
—
|
2,494
|
(1)
|
582,811
|
|||||||||||
|
Total Common Stocks
|
115,713,121
|
1,689,293
|
2,696
|
117,405,110
|
||||||||||||
|
Contingent Value Rights
|
—
|
—
|
—
|
(1)(2)
|
—
|
|||||||||||
|
Exchange Traded Funds(3)
|
3,946,990
|
—
|
—
|
3,946,990
|
||||||||||||
|
Purchased Options
|
5,040
|
172,559
|
—
|
177,599
|
||||||||||||
|
Preferred Stocks
|
244,514
|
—
|
—
|
244,514
|
||||||||||||
|
Warrant(3)
|
—
|
—
|
—
|
(1)(2)
|
—
|
|||||||||||
|
Money Market Fund
|
9,191,406
|
—
|
—
|
9,191,406
|
||||||||||||
|
$
|
129,101,071
|
$
|
1,861,852
|
$
|
2,696
|
$
|
130,965,619
|
|||||||||
|
Liabilities
|
||||||||||||||||
|
Investments at Fair Value
|
||||||||||||||||
|
Common Stocks
|
||||||||||||||||
|
Aerospace & Defense
|
$
|
(74,453
|
)
|
$
|
(90,031
|
)
|
$
|
—
|
$
|
(164,484
|
)
|
|||||
|
Air Freight & Logistics
|
(196,124
|
)
|
—
|
—
|
(196,124
|
)
|
||||||||||
|
Automobiles
|
(606,061
|
)
|
—
|
—
|
(606,061
|
)
|
||||||||||
|
Banks
|
(4,037,272
|
)
|
—
|
—
|
(4,037,272
|
)
|
||||||||||
|
Beverages
|
(1,635,721
|
)
|
—
|
—
|
(1,635,721
|
)
|
||||||||||
|
Biotechnology
|
(1,847,996
|
)
|
(21,019
|
)
|
—
|
(1,869,015
|
)
|
|||||||||
|
Broadline Retail
|
(51,481
|
)
|
—
|
—
|
(51,481
|
)
|
||||||||||
|
Building Products
|
(199,271
|
)
|
—
|
—
|
(199,271
|
)
|
||||||||||
|
Capital Markets
|
(5,183,178
|
)
|
(50,742
|
)
|
—
|
(5,233,920
|
)
|
|||||||||
|
Chemicals
|
(863,377
|
)
|
—
|
—
|
(863,377
|
)
|
||||||||||
|
Commercial Services & Supplies
|
(176,213
|
)
|
—
|
—
|
(176,213
|
)
|
||||||||||
|
Communications Equipment
|
(153,405
|
)
|
—
|
—
|
(153,405
|
)
|
||||||||||
|
Construction & Engineering
|
(67,258
|
)
|
—
|
—
|
(67,258
|
)
|
||||||||||
|
Construction Materials
|
(56,393
|
)
|
—
|
—
|
(56,393
|
)
|
||||||||||
|
Consumer Finance
|
(1,480,425
|
)
|
—
|
—
|
(1,480,425
|
)
|
||||||||||
|
Consumer Staples Distribution & Retail
|
(986,565
|
)
|
—
|
—
|
(986,565
|
)
|
||||||||||
|
Diversified REITs
|
(336,883
|
)
|
—
|
—
|
(336,883
|
)
|
||||||||||
|
Diversified Telecommunication Services
|
(67,239
|
)
|
—
|
—
|
(67,239
|
)
|
||||||||||
|
Electrical Equipment
|
(156,727
|
)
|
—
|
—
|
(156,727
|
)
|
||||||||||
|
Electronic Equipment, Instruments & Components
|
(447,299
|
)
|
—
|
—
|
(447,299
|
)
|
||||||||||
|
Energy Equipment & Services
|
(1,556,613
|
)
|
—
|
—
|
(1,556,613
|
)
|
||||||||||
|
Entertainment
|
(166,840
|
)
|
—
|
—
|
(166,840
|
)
|
||||||||||
|
Financial Services
|
(431,037
|
)
|
—
|
—
|
(431,037
|
)
|
||||||||||
|
Food Products
|
(2,075,303
|
)
|
(161,866
|
)
|
—
|
(2,237,169
|
)
|
|||||||||
|
Ground Transportation
|
(1,842,276
|
)
|
—
|
—
|
(1,842,276
|
)
|
||||||||||
71
WEISS ALTERNATIVE MULTI-STRATEGY FUND
Notes to the Financial Statements – Continued
October 31, 2023
|
Level 1
|
Level 2
|
Level 3
|
Total
|
|||||||||||||
|
Liabilities – Continued
|
||||||||||||||||
|
Investments at Fair Value – Continued
|
||||||||||||||||
|
Health Care Equipment & Supplies
|
$
|
(805,561
|
)
|
$
|
—
|
$
|
—
|
$
|
(805,561
|
)
|
||||||
|
Health Care Providers & Services
|
(1,358,363
|
)
|
(76,885
|
)
|
—
|
(1,435,248
|
)
|
|||||||||
|
Health Care REITs
|
(2,494,293
|
)
|
—
|
—
|
(2,494,293
|
)
|
||||||||||
|
Health Care Technology
|
(136,454
|
)
|
—
|
—
|
(136,454
|
)
|
||||||||||
|
Hotel & Resort REITs
|
(390,535
|
)
|
—
|
—
|
(390,535
|
)
|
||||||||||
|
Hotels, Restaurants & Leisure
|
(4,867,221
|
)
|
(68,789
|
)
|
—
|
(4,936,010
|
)
|
|||||||||
|
Household Durables
|
(108,098
|
)
|
—
|
—
|
(108,098
|
)
|
||||||||||
|
Household Products
|
(1,235,853
|
)
|
—
|
—
|
(1,235,853
|
)
|
||||||||||
|
Industrial Conglomerates
|
(173,864
|
)
|
—
|
—
|
(173,864
|
)
|
||||||||||
|
Industrial REITs
|
(5,280,846
|
)
|
—
|
—
|
(5,280,846
|
)
|
||||||||||
|
Insurance
|
(1,226,622
|
)
|
(140,598
|
)
|
—
|
(1,367,220
|
)
|
|||||||||
|
Interactive Media & Services
|
(349,633
|
)
|
—
|
—
|
(349,633
|
)
|
||||||||||
|
IT Services
|
(583,883
|
)
|
—
|
—
|
(583,883
|
)
|
||||||||||
|
Leisure Products
|
(37,077
|
)
|
—
|
—
|
(37,077
|
)
|
||||||||||
|
Life Sciences Tools & Services
|
(754,980
|
)
|
(34,113
|
)
|
—
|
(789,093
|
)
|
|||||||||
|
Machinery
|
(1,384,835
|
)
|
—
|
—
|
(1,384,835
|
)
|
||||||||||
|
Marine Transportation
|
—
|
(120,000
|
)
|
—
|
(120,000
|
)
|
||||||||||
|
Media
|
(1,108,251
|
)
|
—
|
—
|
(1,108,251
|
)
|
||||||||||
|
Metals & Mining
|
(1,415,765
|
)
|
(564,847
|
)
|
—
|
(1,980,612
|
)
|
|||||||||
|
Mortgage Real Estate Investment Trusts (REITs)
|
(382,696
|
)
|
—
|
—
|
(382,696
|
)
|
||||||||||
|
Office REITs
|
(2,458,073
|
)
|
—
|
—
|
(2,458,073
|
)
|
||||||||||
|
Oil, Gas & Consumable Fuels
|
(4,172,402
|
)
|
—
|
—
|
(4,172,402
|
)
|
||||||||||
|
Paper & Forest Products
|
(45,229
|
)
|
—
|
—
|
(45,229
|
)
|
||||||||||
|
Passenger Airlines
|
(370,505
|
)
|
—
|
—
|
(370,505
|
)
|
||||||||||
|
Personal Care Products
|
(140,786
|
)
|
—
|
—
|
(140,786
|
)
|
||||||||||
|
Pharmaceuticals
|
(893,201
|
)
|
(562,352
|
)
|
—
|
(1,455,553
|
)
|
|||||||||
|
Professional Services
|
(416,671
|
)
|
—
|
—
|
(416,671
|
)
|
||||||||||
|
Residential REITs
|
(1,802,793
|
)
|
—
|
—
|
(1,802,793
|
)
|
||||||||||
|
Retail REITs
|
(7,060,184
|
)
|
—
|
—
|
(7,060,184
|
)
|
||||||||||
|
Semiconductors & Semiconductor Equipment
|
(1,438,265
|
)
|
(99,168
|
)
|
—
|
(1,537,433
|
)
|
|||||||||
|
Software
|
(380,840
|
)
|
—
|
—
|
(380,840
|
)
|
||||||||||
|
Specialized REITs
|
(7,969,539
|
)
|
—
|
—
|
(7,969,539
|
)
|
||||||||||
|
Specialty Retail
|
(1,358,703
|
)
|
—
|
—
|
(1,358,703
|
)
|
||||||||||
|
Technology Hardware, Storage & Peripherals
|
(1,296,827
|
)
|
—
|
—
|
(1,296,827
|
)
|
||||||||||
|
Textiles, Apparel & Luxury Goods
|
(192,612
|
)
|
(73,435
|
)
|
—
|
(266,047
|
)
|
|||||||||
|
Trading Companies & Distributors
|
(421,357
|
)
|
—
|
—
|
(421,357
|
)
|
||||||||||
|
Total Common Stocks
|
(79,208,227
|
)
|
(2,063,845
|
)
|
—
|
(81,272,072
|
)
|
|||||||||
|
Exchange Traded Funds(3)
|
(22,860,647
|
)
|
—
|
—
|
(22,860,647
|
)
|
||||||||||
|
Preferred Stocks
|
—
|
(140,358
|
)
|
—
|
(140,358
|
)
|
||||||||||
|
$
|
(102,068,874
|
)
|
$
|
(2,204,203
|
)
|
$
|
—
|
$
|
(104,273,077
|
)
|
||||||
72
WEISS ALTERNATIVE MULTI-STRATEGY FUND
Notes to the Financial Statements – Continued
October 31, 2023
|
Level 1
|
Level 2
|
Level 3
|
Total
|
|||||||||||||
|
Liabilities – Continued
|
||||||||||||||||
|
Other Instruments
|
||||||||||||||||
|
Written Options
|
$
|
(5,864
|
)
|
$
|
(56,297
|
)
|
$
|
—
|
$
|
(62,161
|
)
|
|||||
|
Futures Contracts(4)
|
—
|
(5,511,499
|
)
|
—
|
(5,511,499
|
)
|
||||||||||
|
Swap Contracts(4)
|
(5,743,560
|
)
|
—
|
(5,743,560
|
)
|
|||||||||||
|
$
|
(5,864
|
)
|
$
|
(11,311,356
|
)
|
$
|
—
|
$
|
(11,317,220
|
)
|
||||||
|
(1)
|
Management has deemed these Level 3 securities as immaterial and therefore no further disclosure is needed.
|
|
(2)
|
Amount less than $0.50.
|
|
(3)
|
See the Schedule of Investments for industry classifications.
|
|
(4)
|
Swap contracts and future contracts are valued at the net unrealized appreciation (depreciation) on the instrument as presented on the Schedules of Open Swap and Open Futures contracts.
|
For the year ended October 31, 2023, there were no transfers into or out of Level 3 securities.
B. Securities Sold Short – The Fund sells securities or currencies short for economic hedging purposes or any other investment purpose. For financial statement
purposes, an amount equal to the settlement amount is initially included in the Statement of Assets and Liabilities as an asset and an equivalent liability. The amount of the liability is subsequently priced to reflect the current value of the short
position. Subsequent fluctuations in the market prices of securities or currencies sold, but not yet purchased, may require purchasing the securities or currencies at prices which may differ from the fair value reflected on the Statement of Assets
and Liabilities. Short sale transactions result in off balance sheet risk because the ultimate obligation may exceed the related amounts shown in the Statement of Assets and Liabilities. The Fund will incur losses if the price of the security
increases between the date of the short sale and the date on which the Fund purchases the securities to replace the borrowed securities. The Fund’s losses on short sales are potentially unlimited because there is no upward limit on the price a
borrowed security could attain.
The Fund is liable for any dividends and interest payable on securities while those securities are sold short. Until the security is replaced, the Fund is required to pay to the lender any income
earned, which is recorded as an expense by the Fund.
C. Transactions with Brokers – The Fund’s deposits at brokers for securities sold short are with one securities dealer. The Fund does not require the brokers
to maintain collateral in support of the receivables from the brokers for proceeds on securities sold short. The Fund is required by the brokers to maintain collateral at the brokers or in a segregated account at the Fund’s custodian for securities
sold short. The Fund may maintain cash deposits at brokers beyond the receivables for short sales.
The Fund’s written options contracts’, equity swap contracts’, forward currency contracts’ and futures contracts cash deposits are monitored daily by the Adviser and counterparty. Cash deposits beyond
the short sale proceeds by the Fund are presented as deposits at brokers on the Statement of Assets and Liabilities. The Fund’s securities sold short and written option contracts are traded through the same account at Morgan Stanley and the deposits
associated with these investments are not able to be determined by security or contract type. These transactions may involve market risk in excess of the amounts receivable or payable reflected on the Statement of Assets and Liabilities.
73
WEISS ALTERNATIVE MULTI-STRATEGY FUND
Notes to the Financial Statements – Continued
October 31, 2023
D. Written Option Contracts – The Fund is subject to equity price risk in the normal course of pursuing its investment objectives. The Fund writes (sells) put
or call options for hedging purposes, volatility management purposes, or otherwise to gain, or reduce, long or short exposure to one or more asset classes or issuers. When a Fund writes (sells) an option, an amount equal to the premium received by
the Fund is included in the Statement of Assets and Liabilities as an asset and an equivalent liability. The amount of the liability is subsequently priced daily to reflect the current value of the option written. Refer to Note 2 A. for a pricing
description. By writing an option, a Fund may become obligated during the term of the option to deliver or purchase the securities underlying the option at the exercise price if the option is exercised. These contracts may involve market risk in
excess of the amounts receivable or payable reflected on the Statement of Assets and Liabilities. Refer to Note 2 R. for further derivative disclosures, and Note 2 P. for further counterparty risk disclosure.
When an option expires on its stipulated expiration date or the Fund enters into a closing purchase transaction, the Fund realizes gains or losses if the cost of the closing purchase transaction differs
from the premium received when the option was sold without regard to any unrealized appreciation or depreciation on the underlying security, and the liability related to such option is eliminated. When a written call option is exercised, the premium
originally received decreases the cost basis of the security and the Fund realizes gains or losses from the sale of the underlying security. When a written put option is exercised, the cost of the security acquired is decreased by the premium
received for the put.
E. Purchased Option Contracts – The Fund is subject to equity price risk in the normal course of pursuing its investment objectives. The Fund purchases put or
call options for hedging purposes, volatility management purposes, or otherwise to gain, or reduce, long or short exposure to one or more asset classes or issuers. When the Fund purchases an option contract, an amount equal to the premiums paid is
included in the Statement of Assets and Liabilities Investments at value as an investment, and is subsequently priced daily to reflect the value of the purchased option contract. Refer to Note 2 A. for a pricing description. Refer to Note 2 R. for
further derivative disclosures, and Note 2 O. for further counterparty risk disclosure.
F. Flex Options – The Fund principally uses options to hedge exposure to underlying positions given projected increases in volatility or to crystalize price
gains or losses in individual securities. FLEX Options are customized option contracts available through the CBOE that are guaranteed for settlement by The Options Clearing Corporation (“OCC” or the “Clearinghouse”). FLEX Options provide investors
with the ability to customize exercise prices and expiration dates, while achieving price discovery in competitive, transparent auctions markets and avoiding the counterparty exposure of over-the-counter (“OTC”) options positions. The Fund bears the
risk that the Clearinghouse will be unable or unwilling to perform its obligations under the FLEX Options contracts.
G. Forward Currency Contracts – The Fund is subject to foreign currency rate risk in the normal course of pursuing its investment objectives. Forward foreign
currency exchange contracts are entered into to gain or reduce exposure to foreign currencies (foreign currency exchange risk). A forward foreign currency exchange contract is an agreement between two parties to buy or sell a currency at a set
exchange rate on a specified date. These contracts help to manage the overall exposure to the currencies in which some of the investments held by the Fund are denominated and in some cases, may be used to obtain exposure to a particular market. The
Fund may enter into forward contracts for foreign currency hedging purposes, volatility management purposes or otherwise to gain, or reduce, long or short exposure to one or more asset classes or issuers. The Fund may enter into forward currency
exchange contracts obligating the Fund to deliver and receive a currency at a specified future date. Forward contracts are valued daily, and unrealized appreciation or depreciation is recorded daily as the difference between the contract exchange
rate and the closing forward rate applied to the face amount of the contract. Refer
74
WEISS ALTERNATIVE MULTI-STRATEGY FUND
Notes to the Financial Statements – Continued
October 31, 2023
to Note 2 A. for a pricing description. A realized gain or loss is recorded at the time the forward contract expires. Credit risk may arise as a result of the failure of the counterparty to comply with
the terms of the contract. Refer to Note 2 P. for further counterparty risk disclosure.
The use of forward currency exchange contracts does not eliminate fluctuations in the underlying prices of the Fund’s investment securities. The use of forward currency exchange contracts involves the
risk that anticipated currency movements will not be accurately predicted. A forward currency exchange contract would limit the risk of loss due to a decline in the value of a particular currency; however, it would also limit any potential gain that
might result should the value of the currency increase instead of decrease. These contracts may involve market risk in excess of the amounts receivable or payable reflected on the Statement of Assets and Liabilities. Refer to Note 2 R. for further
derivative disclosures.
H. Futures Contracts – The Fund may enter into futures contracts traded on domestic and international exchanges, including stock index and fixed income futures
contracts. The Fund principally uses futures for attractive liquidity offered in portfolio construction and management than available using equity and fixed income exchange traded funds. Upon entering into a contract, the Fund deposits and maintains
as collateral such initial margin as required by the exchange on which the transaction is affected. Pursuant to the contract, the Fund agrees to receive from or pay to the broker an amount of cash equal to the daily fluctuation in value of the
contract. Such receipts or payments are known as variation margin and are recorded by the Fund as unrealized gains and losses. When the contract is closed, the Fund records a realized gain or loss equal to the difference between the value of the
contract at the time it was opened and the value at the time it was closed. The risks inherent in the use of futures contracts include adverse changes in the value of such instruments. Refer to Note 2 A. for a pricing description. Refer to Note 2 R.
for further derivative disclosures, and Note 2 P. for further counterparty risk disclosure.
I. Equity Swap Contracts – The Fund is subject to equity price risk and interest rate risk in the normal course of pursuing its investment objectives. During
the year ended October 31, 2023, the Fund entered into both long and short equity swap contracts. Swap contracts are entered into to manage exposure to issuers, markets and securities. A long equity swap contract entitles the Fund to receive from the
counterparty any appreciation and dividends paid on an individual security, while obligating the Fund to pay the counterparty any depreciation on the security as well as interest on the notional amount of the contract generally at a rate equal to the
Euro OverNight Index Average (“EONIA”) or the Sterling OverNight Index Average (“SONIA”), Bank of Japan Estimate Unsecured Overnight Call Rate (“TONAR”) or the Federal Funds Rate (“FED”) (plus an additional rate. Please see the Schedule of Open Swap
for details on a contract by contract basis). A short equity swap contract obligates the Fund to pay the counterparty any appreciation and dividends paid on an individual security, while entitling the Fund to receive from the counterparty any
depreciation on the security, and to pay to or receive from the counterparty interest on the notional value of the contract generally at a rate equal to EONIA, SONIA, TONAR or FED (plus an additional rate. Please see the Schedule of Open Swap
Contracts for details on a contract by contract basis).
Fluctuations in the value of an open contract are recorded daily as net unrealized appreciation or depreciation. The Fund will realize gains or losses upon termination or reset of the contract. Either
party, under certain conditions, may terminate the contract prior to the contract’s expiration date. Refer to Note 2 A. for a pricing description. Credit risk may arise as a result of the failure of the counterparty to comply with the terms of the
contract. Refer to Note 2 P. for further counterparty risk disclosure. Additionally, risk may arise from unanticipated movements in interest rates or in the value of the underlying securities. These contracts may involve market risk in excess of the
amounts receivable or payable reflected on the Statement of Assets and Liabilities. Refer to Note 2 R. for further derivative disclosures.
75
WEISS ALTERNATIVE MULTI-STRATEGY FUND
Notes to the Financial Statements – Continued
October 31, 2023
J. Foreign Securities and Currency Translation – Investment securities and other assets and liabilities denominated in foreign currencies are translated into
U.S. dollar amounts at the date of valuation. Purchases and sales of investment securities and income and expense items denominated in foreign currencies are translated into U.S. dollar amounts on the respective dates of such transactions. The Fund
does not isolate the portion of the results of operations from changes in foreign exchange rates on investments from the fluctuations arising from changes in market prices of securities held. Reported net realized foreign exchange gains or losses
arise from sales of foreign currencies, and the difference between the amounts of dividends, interest, and foreign withholding taxes recorded on the Fund’s books and the U.S. dollar equivalent of the amounts actually received or paid. Net unrealized
foreign exchange gains and losses arise from changes in the fair values of assets and liabilities, other than investments in securities at fiscal year-end, resulting from changes in exchange rates.
Investments in foreign securities entail certain risks. There may be a possibility of nationalization or expropriation of assets, confiscatory taxation, political or financial instability, and
diplomatic developments that could affect the value of the Fund’s investments in certain foreign countries. Since foreign securities normally are denominated and traded in foreign currencies, the value of the Fund’s assets may be affected favorably
or unfavorably by currency exchange rates, currency exchange control regulations, foreign withholding taxes, and restrictions or prohibitions on the repatriation of foreign currencies. There may be less information publicly available about a foreign
issuer than about a U.S. issuer, and foreign issuers are not generally subject to accounting, auditing, and financial reporting standards and practices comparable to those in the United States. The securities of some foreign issuers are less liquid
and at times more volatile than securities of comparable U.S. issuers.
K. Cash and Cash Equivalents – The Fund considers highly liquid short-term fixed income investments purchased with an original maturity of less than three
months to be cash equivalents. Cash equivalents are included in short-term investments on the Schedule of Investments as well as in investments on the Statement of Assets and Liabilities.
L. Guarantees and Indemnifications – In the normal course of business, the Fund enters into contracts with service providers that contain general
indemnification clauses. The Fund’s maximum exposure under these arrangements is unknown, as this would involve future claims that may be made against the Fund that have not yet occurred.
M. Security Transactions, Income and Expenses – The Fund follows industry practice and records security transactions on the trade date. Realized gains and
losses on sales of securities are calculated on the basis of identified cost. Dividend income and expense is recorded on the ex-dividend date and interest income and expense is recorded on an accrual basis. Withholding taxes on foreign dividends have
been provided for in accordance with the Fund’s understanding of the applicable country’s tax rules and regulations. Discounts and premiums on securities purchased are amortized over the expected life of the respective securities. Interest income is
accounted for on the accrual basis and includes amortization of premiums and accretion of discounts on the effective interest method.
N. Allocation of Income, Expenses and Gains/Losses – Income, expenses (other than those deemed attributable to a specific share class), and gains and losses of
the Fund are allocated daily to each class of shares based upon the ratio of net assets represented by each class as a percentage of the net assets of the Fund. Expenses deemed directly attributable to a class of shares are recorded by the specific
class. Most Fund expenses are allocated by class based on relative net assets. 12b-1 fees are expensed at 0.25% of average daily net assets of Investor Class shares (See Note 5). Shareholder servicing fees are expensed at an annual rate of up to
0.10% of average daily net assets of Investor Class shares (See Note 5). Trust Expenses associated with a specific fund in the Trust are charged to that fund. Common Trust expenses are typically allocated evenly between the funds of the Trust, or by
other equitable means.
76
WEISS ALTERNATIVE MULTI-STRATEGY FUND
Notes to the Financial Statements – Continued
October 31, 2023
O. Share Valuation – The NAV per share of the Fund is calculated by dividing the sum of the value of the securities held by the Fund, plus cash and other
assets, minus all liabilities (including estimated accrued expenses) by the total number of shares outstanding for the Fund, rounded to the nearest cent. The Fund’s shares will not be priced on days which the New York Stock Exchange (“NYSE”) is
closed for trading.
P. Counterparty Risk – The Fund helps manage counterparty credit risk by entering into agreements only with counterparties the Adviser believes have the
financial resources to honor its obligations. The Adviser considers the credit worthiness of each counterparty to a contract in evaluating potential credit risk. The counterparty risk for forward currency exchange contracts to the Fund includes the
amount of any net unrealized appreciation on the contract. The counterparty risk for equity swaps contracts to the Fund includes the risk of loss of the full amount of any net unrealized appreciation on the contract, along with dividends receivable
on long equity contracts and interest receivable on short equity contracts. Written and purchased options and futures contracts sold on an exchange do not expose the Fund to counterparty risk; the exchange’s clearinghouse guarantees the options and
futures against counterparty nonperformance. Over-the-counter options counterparty risk includes the risk of loss of the full amount of any net unrealized appreciation.
Q. Use of Estimates – The preparation of financial statements in conformity with GAAP requires management to make estimates and assumptions that affect the
reported amounts of assets and liabilities and disclosure of contingent assets and liabilities at the date of the financial statements and the reported amounts of revenues and expenses during the reporting period. Actual results could differ from
those estimates.
R. Derivatives – The Fund may utilize derivative instruments such as options, swaps, futures, forward currency exchange contracts and other instruments with
similar characteristics to the extent that they are consistent with the Fund’s respective investment objectives and limitations. The use of these instruments may involve additional investment risks, including the possibility of illiquid markets or
imperfect correlation between the value of the instruments and the underlying securities. Derivatives also may create leverage which will amplify the effect of their performance on the Fund and may produce significant losses. Refer to Note 7 for
further derivative disclosure.
The Fund employs a risk optimized allocation strategy by investing in (1) an actively managed, diversified, market neutral multi-strategy portfolio that includes equity securities, debt securities,
and/or derivatives (the “Core Market Neutral Component”), (2) a long-only “growth” overlay of equity securities (the “Growth Component”), and (3) a long-only “defensive” overlay of debt securities (the “Defensive Component”). To implement its
strategy, the Fund may also use derivatives, such as swaps and futures on indexes, in the Growth and Defensive Components. The Fund’s Growth and Defensive Components consist only of securities purchased with the objective of seeking an increase in
the underlying prices of such securities. The Fund’s Growth Component will, under normal circumstances, consist of domestically traded large- and midcap equity securities that aim to approximately track price performance in the overall stock market.
The portion of the Fund’s overall portfolio comprised of debt securities, which are held in the Defensive and Core Market Neutral Components, will, under normal market conditions, have a weighted average maturity that exceeds 9 years and will consist
primarily of investment-grade debt securities with an average credit rating in excess of “A” by Standard & Poor’s, or an equivalent quality rating from another Nationally Recognized Statistical Rating Organization. The Fund may also invest in
below-investment grade debt securities (also referred to as high yield debt securities or “junk” bonds).
The Fund’s Core Market Neutral Component consists of a combination of “long” securities purchased that seek to benefit from an increase in the underlying prices of such securities and “short” securities
sold that seek to benefit from a decrease in the underlying prices of such securities. The Fund’s Core Market Neutral Component may be characterized by sector focus, geographic definition, quantitative method, event orientation or some other
77
WEISS ALTERNATIVE MULTI-STRATEGY FUND
Notes to the Financial Statements – Continued
October 31, 2023
dominant characteristic. The strategies employed and the allocation among them will vary over time. The common attribute of these strategies is a long/short investment approach whereby various
securities or instruments are held long and others are sold short. The Adviser, therefore, applies moderate leverage (i.e., borrowed capital to increase investment exposure) to the Core Market Neutral Component in an effort to enhance absolute
returns. In addition, in order to take advantage of certain opportunities in the securities markets, the Fund may engage in active and frequent trading with respect to the Core Market Neutral Component.
The Adviser seeks to allocate assets to each of the three components based on the Adviser’s assessment of each component’s expected contribution to the Fund’s overall portfolio risk. The Adviser
utilizes the historical price return and volatility (among other proprietary measures) of each component in order to estimate a component’s risk contribution. Although there is no requirement to invest a specific percentage of the Fund’s assets in a
particular component, it is generally expected that a larger percentage of the Fund’s assets will be allocated to low risk asset classes (i.e., those that comprise the bond or Defensive Component) than to higher risk asset classes (i.e., those that
comprise the equity or Growth Component). Given that the Adviser seeks to allocate assets to each individual component according to its risk contribution (as measured by its historical price return and volatility), the Fund’s allocation of assets to
the Core Market Neutral, Growth and Defensive Components can fluctuate widely.
The equity securities that comprise the Fund’s Growth Component may at any time include positions in U.S. common, preferred or convertible securities of large- or mid- capitalization issuers; securities
of other investment companies, including exchange-traded funds (“ETFs”); depositary receipts, including American Depositary Receipts (“ADRs”), and derivatives, such as swaps and futures on indexes. The equity securities that comprise the Fund’s Core
Market Neutral Component may at any time include positions in U.S. or non-U.S. common, preferred or convertible securities of any market capitalization throughout the world, including emerging markets countries; securities of other investment
companies, including ETFs; and depositary receipts, including ADRs. The debt securities that comprise the Fund’s Defensive Component and Core Market Neutral Component may include corporate debt securities, bonds (including inflation-indexed bonds),
notes or other debentures, U.S. Government and foreign government securities, high yield or junk bonds, ETFs, and derivatives, such as swaps and futures on indexes. In addition, the Core Market Neutral Component may invest in derivative instruments,
including swaps, interest rate swaps, options or index options (e.g., calls and puts may be purchased or written), futures contracts, and forward contracts. The Fund’s derivative instruments are used for several purposes, including to create
investment leverage; as a substitute for securities, interest rates, currencies and commodities; and/or to hedge against market movements.
The Fund has adopted authoritative standards regarding disclosure about derivatives and hedging activities and how they affect the Fund’s Statement of Assets and Liabilities and Statement of Operations.
For the year ended October 31, 2023, the Fund’s average derivative volume is described below:
|
Monthly Average
|
Monthly Average
|
|||||||
|
Quantity
|
Notional Value
|
|||||||
|
Purchased Option Contracts
|
2,863
|
26,000,298
|
||||||
|
Written Option Contracts
|
1,536
|
8,247,892
|
||||||
|
Long Total Return Swap Contracts
|
1,406,854
|
99,506,013
|
||||||
|
Short Total Return Swap Contracts
|
222,481
|
9,559,504
|
||||||
|
Long Futures Contracts
|
947
|
125,926,100
|
||||||
|
Short Futures Contracts
|
1
|
188,236
|
||||||
|
Long Forward Contracts
|
28,764
|
28,764
|
||||||
|
Short Forward Contracts
|
198,841
|
28,813
|
||||||
78
WEISS ALTERNATIVE MULTI-STRATEGY FUND
Notes to the Financial Statements – Continued
October 31, 2023
Statement of Assets and Liabilities
The effect of derivative instruments on the Statement of Assets and Liabilities as of October 31, 2023.
|
Statement of Assets and
|
Fair Value
|
||||||||
|
Liabilities Location
|
Assets
|
Liabilities
|
|||||||
|
Purchased Option Contracts
|
|||||||||
|
Equity
|
Investments, at value
|
$
|
177,599
|
$
|
—
|
||||
|
Written Option Contracts
|
|||||||||
|
Equity
|
Written option contracts, at value
|
—
|
62,161
|
||||||
|
Swap Contracts
|
|||||||||
|
Equity
|
Payable for swap contracts, net
|
—
|
5,743,560
|
||||||
|
Futures Contracts
|
|||||||||
|
Commodity
|
Variation margin receivable, net
|
—
|
87,010
|
||||||
|
Equity
|
Variation margin receivable, net
|
436,360
|
—
|
||||||
|
Interest rate
|
Variation margin receivable, net
|
—
|
28,829
|
||||||
|
Total Futures Contracts
|
436,360
|
115,839
|
|||||||
|
$
|
613,959
|
$
|
5,921,560
|
||||||
Statement of Operations
The effect of derivative instruments on the Statement of Operations for the year ended October 31, 2023:
|
Net Realized Gain (Loss) on Derivatives
|
||||||||||||||||||||||||
|
Forward
|
||||||||||||||||||||||||
|
Purchased
|
Written
|
Currency
|
||||||||||||||||||||||
|
Option
|
Option
|
Swap
|
Futures
|
Exchange
|
||||||||||||||||||||
|
Derivatives
|
Contracts*
|
Contracts
|
Contracts
|
Contracts
|
Contracts
|
Total
|
||||||||||||||||||
|
Equity Contracts
|
$
|
(1,889,268
|
)
|
$
|
1,306,553
|
$
|
(9,153,448
|
)
|
$
|
3,306,599
|
$
|
—
|
$
|
(6,429,564
|
)
|
|||||||||
|
Commodity Contracts
|
—
|
—
|
—
|
1,363,889
|
—
|
1,363,889
|
||||||||||||||||||
|
Interest Rate Contracts
|
—
|
—
|
—
|
(4,468,397
|
)
|
—
|
(4,468,397
|
)
|
||||||||||||||||
|
Foreign Exchange Contracts
|
—
|
—
|
—
|
18,526
|
(6,507
|
)
|
12,019
|
|||||||||||||||||
|
Total
|
$
|
(1,889,268
|
)
|
$
|
1,306,553
|
$
|
(9,153,448
|
)
|
$
|
220,617
|
$
|
(6,507
|
)
|
$
|
(9,522,053
|
)
|
||||||||
|
Net Change in Unrealized Appreciation (Depreciation) on Derivatives
|
||||||||||||||||||||||||
|
Forward
|
||||||||||||||||||||||||
|
Purchased
|
Written
|
Currency
|
||||||||||||||||||||||
|
Option
|
Option
|
Swap
|
Futures
|
Exchange
|
||||||||||||||||||||
|
Derivatives
|
Contracts**
|
Contracts
|
Contracts
|
Contracts
|
Contracts
|
Total
|
||||||||||||||||||
|
Equity Contracts
|
$
|
(7,211
|
)
|
$
|
(390,961
|
)
|
$
|
4,743,952
|
$
|
(5,257,037
|
)
|
$
|
—
|
$
|
(911,257
|
)
|
||||||||
|
Commodity Contracts
|
—
|
—
|
—
|
1,155,168
|
—
|
1,155,168
|
||||||||||||||||||
|
Interest Rate Contracts
|
—
|
—
|
—
|
5,304,880
|
—
|
5,304,880
|
||||||||||||||||||
|
Foreign Exchange Contracts
|
—
|
—
|
—
|
—
|
(2,579
|
)
|
(2,579
|
)
|
||||||||||||||||
|
Total
|
$
|
(7,211
|
)
|
$
|
(390,961
|
)
|
$
|
4,743,952
|
$
|
1,203,011
|
$
|
(2,579
|
)
|
$
|
5,546,212
|
|||||||||
|
*
|
The amounts disclosed are included in the realized gain (loss) on investments.
|
|
|
**
|
The amounts disclosed are included in the change in unrealized appreciation (depreciation) on investments.
|
79
WEISS ALTERNATIVE MULTI-STRATEGY FUND
Notes to the Financial Statements – Continued
October 31, 2023
3. RELATED PARTY TRANSACTIONS
The Trust has an agreement with the Adviser to furnish investment advisory services to the Fund. Pursuant to an Investment Advisory Agreement between the Trust and the Adviser, the Adviser is entitled
to receive, on a monthly basis, an annual advisory fee equal to 1.50% of the Fund’s average daily net assets.
The Fund’s Adviser has contractually agreed in an Operating Expense Limitation Agreement to reduce its management fees and/or absorb expenses of the Fund to ensure that total annual operating expenses
after fee waiver and/or expense reimbursement (excluding 12b-1 fees – Class A and Investor Class (see Note 5), shareholder servicing fees – Class A, Class I and Investor Class (see Note 5), any acquired fund fees and expenses, front-end or contingent
deferred loads, redemption fees, swap fees and expenses, dividends and interest on short positions, taxes, leverage interest, brokerage fees (including commissions, mark-ups and mark-downs), annual account fees for margin accounts, expenses incurred
in connection with any merger or reorganization and extraordinary expenses such as litigation) do not exceed 1.50% of the Fund’s average daily net assets. As of October 31, 2023, Class A shares and Class I shares are not available. The Adviser may
request recoupment of previously waived fees and reimbursed Fund expenses from the Fund for three years from the date they were waived or reimbursed, provide that, after payment of the recoupment, the Total Annual Fund Operating Expenses do no exceed
the lesser of the Expense Cap: (i) in effect at the time of the waiver or reimbursement; or (ii) in effect at the time of recoupment. The Operating Expense Limitation Agreement is intended to be continual in nature and cannot be terminated within one
year after the effective date of the Fund’s prospectus and subject thereafter to termination at any time upon 60 days written notice and approval by the Board or the Advisor, with consent of the Board. Waived fees and reimbursed expenses subject to
potential recovery during the fiscal year of expiration are as follows:
|
Expiration
|
Amount
|
|||
|
November 2023 to October 2024
|
$
|
1,165,912
|
||
|
November 2024 to October 2025
|
814,144
|
|||
|
November 2025 to October 2026
|
887,626
|
|||
Fund Services acts as the Fund’s Administrator, transfer agent, and fund accountant. U.S. Bank N.A. (the “Custodian”) serves as the custodian to the Fund. The Custodian is an affiliate of the
Administrator. The Administrator performs various administrative and accounting services for the Fund. The Administrator prepares various federal and state regulatory filings, reports and returns for the Fund; prepares reports and materials to be
supplied to the Trustees; monitors the activities of the Fund’s custodian; coordinates the payment of the Fund’s expenses and reviews the Fund’s expense accruals. The officers of the Trust, including the Chief Compliance Officer, are employees of the
Administrator. A trustee of the Trust is an officer of the Administrator. As compensation for its services, the Administrator is entitled to a monthly fee at an annual rate based upon the average daily net assets of the Fund, subject to annual
minimums. Fees paid by the Fund for administration and accounting, transfer agency, custody and compliance services for the year ended October 31, 2023, are disclosed in the Statement of Operations.
Quasar Distributors, LLC, is the Fund’s distributor (the “Distributor”). The Distributor is not affiliated with the Adviser, Fund Services, or its affiliated companies.
80
WEISS ALTERNATIVE MULTI-STRATEGY FUND
Notes to the Financial Statements – Continued
October 31, 2023
4. TAX FOOTNOTE
Federal Income Taxes – The Fund intends to comply with the requirements of Subchapter M of the Internal Revenue Code of 1986, as amended, necessary to qualify as
a regulated investment company and distributes substantially all net taxable investment income and net realized gains to shareholders in a manner which results in no tax cost to the Fund. Therefore, no federal income or excise tax provision is
required. As of and during the year ended October 31, 2022, the Fund did not have any tax positions that did not meet the “more-likely-than-not” threshold of being sustained by the applicable tax authority and did not have liabilities for any
unrecognized tax benefits. The Fund recognizes interest and penalties, if any, related to unrecognized tax benefits on uncertain tax positions as income tax expense in the Statement of Operations. The Fund is not subject to examination by taxing
authorities for the tax years prior to October 31, 2020.
As of October 31, 2023, the components of distributable earnings (accumulated losses) and cost of investments on a tax basis were as follows:
|
Tax cost of investments*
|
$
|
22,034,486
|
||
|
Gross unrealized appreciation
|
$
|
7,605,926
|
||
|
Gross unrealized depreciation
|
(22,178,808
|
)
|
||
|
Net unrealized depreciation
|
(14,572,882
|
)
|
||
|
Undistributed ordinary income
|
3,472,757
|
|||
|
Undistributed long-term capital gain
|
—
|
|||
|
Other accumulated losses
|
(41,627,887
|
)
|
||
|
Total accumulated losses
|
$
|
(52,728,012
|
)
|
|
*
|
Represents cost for federal income tax purposes and differs from the cost for financial reporting purposes due to partnership adjustments, wash sales, derivatives and constructive sales.
|
As of October 31, 2023, the Fund had $40,490,612 in long-term capital loss carryovers which will be permitted to be carried over for an unlimited period. A regulated investment company may elect for any
taxable year to treat any portion of any qualified late year loss as arising on the first day of the next taxable year. Qualified late year losses are certain ordinary losses which occur during the portion of the Fund’s taxable period subsequent to
December 31, respectively. For the taxable year ended October 31, 2023, the Fund does not plan to defer any qualified late year losses.
Distributions to Shareholders – The Fund distributes substantially all net investment income, if any, and net realized capital gains, if any, annually.
Distributions to shareholders are recorded on the ex-dividend date. The treatment for financial reporting purposes of distributions made to shareholders during the year from net investment income or net realized capital gains may differ from their
treatment for federal income tax purposes. These differences are caused primarily by differences in the timing of the recognition of certain components of income, expense or realized capital gain for federal income tax purposes. Where such
differences are permanent in nature, GAAP requires that they be reclassified in the components of the net assets based on their ultimate characterization for federal income tax purposes. Any such reclassifications will have no effect on net assets,
results of operations or net asset values per share of the Fund. For the year ended October 31, 2023 the following table shows the reclassifications made:
|
Total
|
|||
|
Distributable
|
|||
|
Earnings
|
Paid-in Capital
|
||
|
$(66,997)
|
$66,997
|
81
WEISS ALTERNATIVE MULTI-STRATEGY FUND
Notes to the Financial Statements – Continued
October 31, 2023
The tax character of distributions paid for the year ended October 31, 2023 and the year ended October 31, 2022, respectively, were as follows:
|
Ordinary Income*
|
Long-Term Capital Gain
|
Total
|
||||||||||||
|
2023
|
$
|
29,340
|
$
|
—
|
$
|
29,340
|
||||||||
|
2022
|
12,810,319
|
2,906,545
|
15,716,864
|
|||||||||||
|
*
|
For federal income tax purposes, distributions of short-term capital gains are treated as ordinary income distributions.
|
5. DISTRIBUTION & SHAREHOLDER SERVICING FEES
The Fund has adopted a Distribution Plan pursuant to Rule 12b-1 (the “Plan”) for Class A and the Investor Class. The Plan permits the Fund to pay for distribution and related expenses at an annual rate
of 0.25% average daily net assets of Class A and the Investor Class. Amounts paid under the Plan are paid to the Distributor to compensate it for costs of the services it provides to Class A and Investor Class shares of the Fund and the expenses it
bears in the distribution of the Fund’s Class A and Investor Class shares, including overhead and telephone expenses; printing and distribution of prospectuses and reports used in connection with the offering of the Fund’s Investor class shares to
prospective investors; and preparation, printing, payments to intermediaries and distribution of sales literature and advertising materials.
Under the Plan, the Trustees will be furnished quarterly with information detailing the amount of expenses paid under the Plan and the purposes for which payments were made. The Plan may be terminated
at any time by vote of a majority of the Trustees of the Trust who are not interested persons. Continuation of the Plan is considered by such Trustees no less frequently than annually. As of October 31, 2023, Class A shares were not available. For
the year ended October 31, 2023, the Investor Class incurred expenses of $3,666 pursuant to the Plan.
In addition, pursuant to a Shareholder Service Plan (the “Shareholder Servicing Plan”) adopted by the Trust on behalf of the Fund, the Advisor is authorized to engage financial institutions, securities
dealers and other industry professionals (“Shareholder Servicing Agent”) to provide personal shareholder services relating to the servicing and maintenance of shareholder accounts not otherwise provided to the Fund. Payments made pursuant to the
Shareholder Servicing Plan shall not exceed 0.10% of the average daily net asset value of Class A, Class I and the Investor Class of the Fund’s shares. For the year ended October 31, 2023, the Investor Class incurred expenses of $1,466 to the plan.
As of October 31, 2023, Class A and Class I shares were not available for purchase.
Payments made under the Shareholder Servicing Plan shall be used to compensate Shareholder Servicing Agents for providing general shareholder liaison services, including, but not limited to: (i)
answering inquiries from shareholders regarding account status and history, the manner in which purchases and redemptions of the Fund shares may be effected, and other matters pertaining to the Fund; (ii) assisting shareholders in designating and
changing dividend options, account designations and addresses; (iii) arranging for wiring of funds and transmitting and receiving funds in connection with orders to purchase or redeem Fund shares; (iv) verifying and guaranteeing shareholder
signatures in connection with orders to purchase or redeem Fund shares; (v) providing such other similar services related to the maintenance of shareholder accounts; and (vi) providing necessary personnel and facilities to conduct the activities
described above.
Distributions and shareholder servicing fees are not subject to the Operating Expense Limitation Agreement to reduce management fees and/or absorb Fund expenses by the Adviser. Distribution and
shareholder servicing fees will increase the expenses beyond the Operating Expense Limitation Agreement rate of 1.50% for Class A, Class I and Investor Class.
82
WEISS ALTERNATIVE MULTI-STRATEGY FUND
Notes to the Financial Statements – Continued
October 31, 2023
6. INVESTMENT TRANSACTIONS
The aggregate purchases and sales, excluding short-term investments, by the Fund for the year ended October 31, 2023, were as follows:
|
Purchases
|
Sales
|
|||||||
|
U.S. Government
|
$
|
—
|
$
|
—
|
||||
|
Other
|
1,607,295,329
|
1,641,856,739
|
||||||
7. OFFSETTING ASSETS AND LIABILITIES
The Fund is subject to various Master Netting Arrangements, which govern the terms of certain transactions with select counterparties. The Master Netting Arrangements allow the Fund to close out and net
its total exposure to a counterparty in the event of a default with respect to all the transactions governed under a single agreement with a counterparty. The Master Netting Arrangements also specify collateral posting arrangements at pre-arranged
exposure levels. Under the Master Netting Arrangements, collateral is routinely transferred if the total net exposure to certain transactions (net of existing collateral already in place) governed under the relevant Master Netting Arrangement with a
counterparty in a given account exceeds a specified threshold depending on the counterparty and the type of Master Netting Arrangement. Morgan Stanley is the prime broker for exchange traded derivatives and the counterparty for swaps.
|
Gross
|
Gross Amounts not
offset in the Statement
of Assets and Liabilities
|
|||||||||||||||||||||||
|
Gross
|
Amounts
|
Net Amounts
|
||||||||||||||||||||||
|
Amounts of
|
Offset in the
|
Presented in
|
||||||||||||||||||||||
|
Recognized
|
Statement of
|
the Statement
|
Collateral
|
|||||||||||||||||||||
|
Assets/
|
Assets and
|
of Assets
|
Financial
|
Received/
|
Net
|
|||||||||||||||||||
|
Liabilities
|
Liabilities
|
and Liabilities
|
Instruments
|
Pledged*
|
Amount
|
|||||||||||||||||||
|
Assets:
|
||||||||||||||||||||||||
|
Description
|
||||||||||||||||||||||||
|
Futures Contracts
|
$
|
436,484
|
$
|
115,963
|
$
|
320,521
|
$
|
—
|
$
|
—
|
$
|
320,521
|
||||||||||||
|
Swap Contracts
|
375,478
|
375,478
|
—
|
—
|
—
|
—
|
||||||||||||||||||
|
$
|
811,962
|
$
|
491,441
|
$
|
320,521
|
$
|
—
|
$
|
—
|
$
|
320,521
|
|||||||||||||
|
Liabilities:
|
||||||||||||||||||||||||
|
Description
|
||||||||||||||||||||||||
|
Futures Contracts
|
$
|
115,963
|
$
|
115,963
|
$
|
—
|
$
|
—
|
$
|
—
|
$
|
—
|
||||||||||||
|
Swap Contracts
|
6,119,038
|
375,478
|
5,743,560
|
—
|
5,743,560
|
—
|
||||||||||||||||||
|
Written Option Contracts
|
62,161
|
—
|
62,161
|
—
|
62,161
|
—
|
||||||||||||||||||
|
$
|
6,297,162
|
$
|
491,441
|
$
|
5,805,721
|
$
|
—
|
$
|
5,805,721
|
$
|
—
|
|||||||||||||
|
*
|
In some instances, the actual collateral pledged/received may be more than amount shown.
|
8. BENEFICIAL OWNERSHIP
The beneficial ownership, either directly or indirectly, of more than 25% of the voting securities of a fund creates a presumption of control of the fund, under Section 2(a)(9) of the Investment Company
Act of 1940. As of October 31, 2023, Charles Schwab and National Financial Services, for the benefit of its customers, owned 26.47% and 45.28% of the outstanding shares of the Fund, respectively.
83
WEISS ALTERNATIVE MULTI-STRATEGY FUND
Notes to the Financial Statements – Continued
October 31, 2023
9. OTHER REGULATORY MATTERS
In October 2022, the Securities and Exchange Commission (the “SEC”) adopted a final rule relating to Tailored Shareholder Reports for Mutual Funds and Exchange-Traded Funds; Fee Information in
Investment Company Advertisements. The rule and form amendments will, among other things, require the Fund to transmit concise and visually engaging shareholder reports that highlight key information. The amendments will require that funds tag
information in a structured data format and that certain more in-depth information be made available online and available for delivery free of charge to investors on request. The amendments became effective January 24, 2023. There is an 18-month
transition period after the effective date of the amendment.
10. SUBSEQUENT EVENTS
On December 19, 2023, the Fund’s Investor Class declared an income distribution of $0.11096521 and the Fund’s Class K shares declared an income distribution of $0.15394021 payable on December 20, 2023,
to shareholders of record on December 19, 2023.
As of November 20, 2023, Cullen Small no longer serves as Vice President, Treasurer, and Principal Financial Officer of the Trust. As of November 20, 2023, Douglas Schafer has replaced Mr. Small as Vice
President, Treasurer, and Principal Financial Officer of the Trust. These changes were approved by the Board on October 26, 2023.
Management has evaluated events and transactions for potential recognition or disclosure through the date the financial statements were issued and there were no additional subsequent events to report
that would have a material impact on the Fund’s financial statements and the notes to the financial statements.
84
WEISS ALTERNATIVE MULTI-STRATEGY FUND
Report of Independent Registered Public Accounting Firm
To the Shareholders of Weiss Alternative Multi-Strategy Fund and
Board of Trustees of Series Portfolios Trust
Opinion on the Financial Statements
We have audited the accompanying statement of assets and liabilities, including the schedules of investments, securities sold short, written options, open futures contracts, and swap contracts, of Weiss
Alternative Multi-Strategy Fund (the “Fund”), a series of Series Portfolios Trust, as of October 31, 2023, the related statement of operations for the year then ended, the statements of changes in net assets for each of the two years in the period
then ended, the related notes, and the financial highlights for each of the five years in the period then ended (collectively referred to as the “financial statements”). In our opinion, the financial statements present fairly, in all material
respects, the financial position of the Fund as of October 31, 2023, the results of its operations for the year then ended, the changes in net assets for each of the two years in the period then ended, and the financial highlights for each of the
five years in the period then ended, in conformity with accounting principles generally accepted in the United States of America.
Basis for Opinion
These financial statements are the responsibility of the Fund’s management. Our responsibility is to express an opinion on the Fund’s financial statements based on our audits. We are a public accounting
firm registered with the Public Company Accounting Oversight Board (United States) (“PCAOB”) and are required to be independent with respect to the Fund in accordance with the U.S. federal securities laws and the applicable rules and regulations of
the Securities and Exchange Commission and the PCAOB.
We conducted our audits in accordance with the standards of the PCAOB. Those standards require that we plan and perform the audit to obtain reasonable assurance about whether the financial statements
are free of material misstatement whether due to error or fraud.
Our audits included performing procedures to assess the risks of material misstatement of the financial statements, whether due to error or fraud, and performing procedures that respond to those risks.
Such procedures included examining, on a test basis, evidence regarding the amounts and disclosures in the financial statements. Our procedures included confirmation of securities owned as of October 31, 2023, by correspondence with the custodian and
brokers; when replies were not received from brokers, we performed other auditing procedures. Our audits also included evaluating the accounting principles used and significant estimates made by management, as well as evaluating the overall
presentation of the financial statements. We believe that our audits provide a reasonable basis for our opinion.
We have served as the Fund’s auditor since 2015.

COHEN & COMPANY, LTD.
Milwaukee, Wisconsin
December 29, 2023
85
WEISS ALTERNATIVE MULTI-STRATEGY FUND
Board Consideration of Investment Advisory Agreement (Unaudited)
October 31, 2023
Under Section 15 of the Investment Company Act of 1940 (the “1940 Act”), the Board of Trustees (the “Board” or the “Trustees”) of Series Portfolios Trust (the “Trust”), including a majority of the
Trustees who have no direct or indirect interest in the investment advisory agreement and who are not “interested persons” of the Trust, as defined in the 1940 Act (the “Independent Trustees”), must determine annually whether to approve the
continuation of the Trust’s investment advisory agreements.
At a meeting held on July 26-27, 2023 (the “Meeting”), the Board, including the Independent Trustees, considered and approved the continuance of the investment advisory agreement (the “Advisory
Agreement”) between the Trust, on behalf of the Weiss Alternative Multi-Strategy Fund (the “Fund”), and Weiss Multi-Strategy Advisers, LLC (“Weiss”), for an additional one-year term. At the Meeting, the Board considered the factors and reached the
conclusions described below in reviewing and approving Weiss to continue serving as the Fund’s investment adviser for another year.
In connection with the annual review process and in advance of the Meeting, Weiss provided information to the Board in response to requests submitted to it by U.S. Bank Global Fund Services (“Fund
Services”), the Fund’s administrator, on behalf of the Board, to facilitate the Board’s evaluation of the terms of the Advisory Agreement. The information furnished by Weiss included materials describing, among other matters: (i) the nature, extent,
and quality of the services provided by Weiss, including Weiss’ portfolio managers and other personnel, and the investment practices and techniques used by Weiss in managing the Fund; (ii) the historical investment performance of the Fund; (iii) the
management fees payable by the Fund to Weiss and the Fund’s total operating expenses compared with those of a peer group of mutual funds; (iv) the financial condition of Weiss; (v) the costs of the services provided and Weiss’ profitability with
respect to managing the Fund; (vi) the extent to which any economies of scale realized by Weiss in connection with its services to the Fund are shared with Fund shareholders; and (v) other ancillary or “fall-out” benefits Weiss and/or its affiliates,
if any, may receive based on Weiss’ relationship with the Fund. In addition to the Meeting, the Board met on June 21, 2023, with Fund Services and counsel to the Independent Trustees to discuss the materials that had been furnished by Weiss in
response to the information requests. The Board also considered information furnished to the Board at its meetings periodically over the course of the year. At these meetings, representatives of Weiss furnished quarterly reports and other information
to the Board regarding the performance of the Fund, the services provided to the Fund by Weiss, Weiss’ personnel and business operations, marketing and distribution activity for the Fund, and compliance and operational matters related to the Fund and
Weiss. The Board also considered the presentation by representatives of Weiss received at the Board’s meeting held on October 26-27, 2022.
In considering and approving the Advisory Agreement for another year, the Board considered the information it deemed relevant, including but not limited to the information discussed below. The Board
considered not only the specific information presented in connection with the Meeting, but also the knowledge and experience gained over time through previous interactions with Weiss in overseeing the Fund. The Board did not identify any particular
information or consideration that was all-important or controlling, and each individual Trustee may have attributed different weights to various factors. The Independent Trustees were assisted in their evaluation of the Advisory Agreement by
independent legal counsel, from whom they received separate legal advice and with whom they met separately from Weiss, Fund Services and the Interested Trustee on several occasions. The following summarizes a number of relevant, but not necessarily
all, factors considered by the Board in approving the continuation of the Advisory Agreement.
86
WEISS ALTERNATIVE MULTI-STRATEGY FUND
Board Consideration of Investment Advisory Agreement (Unaudited) – Continued
October 31, 2023
NATURE, EXTENT AND QUALITY OF SERVICES TO BE PROVIDED TO THE FUND
The Board considered the nature, extent and quality of services provided to the Fund by Weiss under the Advisory Agreement. The Board received and considered information regarding, among other things,
the qualifications, background, tenure and responsibilities of each of the portfolio managers who are primarily responsible for the day-to-day portfolio management of the Fund. The Board also received and considered information about Weiss’
investment process and investment strategy for the Fund, Weiss’ approach to security selection, Weiss’ investment research capabilities and resources, and the overall positioning of the Fund’s portfolio. The Board also considered Weiss’ trade
execution capabilities and experience. The Board noted that Weiss had been managing the Fund’s portfolio since its inception.
The Board evaluated the ability of Weiss, based on attributes such as its financial condition, resources and reputation, to attract and retain qualified investment professionals to service the Fund,
including research, advisory and supervisory personnel. The Board further considered Weiss’ compliance program and its compliance record since the inception of the Fund, including past reports from the Trust’s Chief Compliance Officer (“CCO”)
regarding the CCO’s review of Weiss’ compliance program. The Board also considered the entrepreneurial and other risks assumed by Weiss in connection with the services provided to the Fund.
Based on these considerations, the Board concluded, within the context of its full deliberations, that Weiss is capable of continuing to provide services of the nature, extent and quality contemplated
by the terms of the Advisory Agreement.
INVESTMENT PERFORMANCE
The Board considered the Fund’s investment performance. In this regard, the Board reviewed the performance of the Fund as of June 30, 2023, as compared to its benchmark index, the Bloomberg Barclays
U.S. Corporate Bond Index, and noted that the Fund’s Class K and Investor Class shares outperformed the index for the year-to-date, one-year, three-year, five-year and since inception periods ended June 30, 2023. Additionally, the Board considered
the Fund’s investment performance as compared to an appropriate universe of peer funds compiled by Broadridge Financial Solutions (“Broadridge”), an independent provider of investment company data, based on Morningstar fund classifications (the
“Performance Universe”). The Trustees considered that the performance data provided by Broadridge included, among other things, performance comparisons for the one-year, two-year, three-year, four-year, and five-year periods ended April 30, 2023. The
Trustees noted that the Fund’s Class K shares outperformed the Performance Universe average and median for the five-year period but underperformed the Performance Universe average and median for the one-year, two-year, three-year and four-year
periods. The Board noted that while it found the comparative data provided by Broadridge generally useful in evaluating the Fund’s performance, the Board recognized the limitations of such data, including that notable differences may exist between
the Fund and its peers. Additionally, at the Board’s request, Weiss identified the funds it considered to be the Fund’s top competitors (the “Selected Peer Group”) and provided the Selected Peer Group’s performance results. The Board also considered
that, in connection with its meetings held during the course of the prior year, the Board received and considered reports regarding the Fund’s performance over various time periods and Weiss’ analysis of the Fund’s performance for these time periods.
Based on these considerations, the Trustees concluded that the performance results achieved by Weiss for the Fund were satisfactory given market conditions. Although past performance is not a guarantee
or indication of future results, the Trustees further concluded that they continue to have confidence in Weiss’s overall capabilities to manage the Fund.
87
WEISS ALTERNATIVE MULTI-STRATEGY FUND
Board Consideration of Investment Advisory Agreement (Unaudited) – Continued
October 31, 2023
FEES AND EXPENSES
The Board reviewed and considered the contractual investment management fee rate payable by the Fund to Weiss for investment management services (the “Management Fee Rate”). Among other information
reviewed by the Board was a comparison of the Management Fee Rate of the Fund with those of an appropriate group of peer funds (the “Expense Group”), as determined by Broadridge, based on Morningstar fund classifications. The Board noted that the
Management Fee Rate was higher than the Expense Group average and median, but the Board noted that the overall expense structure of the Fund is competitive in the context of other factors considered by the Board.
The Board noted that Weiss reported that it does not manage any other accounts or funds with investment strategies similar to those utilized for the Fund.
The Board received and considered information regarding the Fund’s net operating expense ratio and its various components, including management fees, administrative fees, custodian and other
non-management fees, Rule 12b-1 fees and non-Rule 12b-1 service fees, as well as the Fund’s fee waiver and expense reimbursement arrangements. The Board noted that Weiss had entered into an expense limitation agreement (the “Expense Limitation
Agreement”) to limit the total annual fund operating expenses of each class of the Fund (excluding Rule 12b-1 fees, shareholder servicing fees, redemption fees, swap fees and expenses, dividends and interest on short positions, taxes, leverage
interest, brokerage fees (including commissions, mark-ups and mark-downs), annual account fees for margin accounts, expenses incurred in connection with any merger or reorganization, or extraordinary expenses such as litigation). The Board considered
the net operating expense ratio in comparison to the average and median of the Expense Group. The Board noted that the Fund’s net expense ratio for Class K was higher than both the average and median of the Expense Group. The Board acknowledged that,
pursuant to the Expense Limitation Agreement, Weiss reimburses all expenses incurred by the Fund in excess of its management fee, excluding any expenses not covered under the Expense Limitation Agreement.
The Board received a description of the methodology and screening criteria used by Broadridge to determine the registered funds and share classes in the Expense Group. While the Board recognized that
comparisons between the Fund and Expense Peer Group may be imprecise, the comparative, independently selected information provided by Broadridge assisted the Board in evaluating the reasonableness of the Fund’s Management Fee Rate and net expense
ratio. Additionally, the Board received and considered information comparing the Fund’s Management Fee Rate and net expense ratio to the Fund’s Selected Peer Group.
Based on these considerations, the Board concluded that the expense structure of the Fund supported the continuation of the Advisory Agreement.
PROFITABILITY AND ECONOMIES OF SCALE
The Board requested and received a report on Weiss’ revenue and expenses resulting from services provided to the Fund pursuant to the Advisory Agreement for the twelve months ended March 31, 2023. The
Board noted that Weiss has subsidized the Fund’s operations since inception pursuant to the Expense Limitation Agreement and has not recouped those subsidies. The Board received and considered a description of the expense allocation methodology used
by Weiss in calculating profitability in connection with the continuation of the Advisory Agreement. The Board also considered Weiss’ financial resources and information regarding Weiss’ commitment
88
WEISS ALTERNATIVE MULTI-STRATEGY FUND
Board Consideration of Investment Advisory Agreement (Unaudited) – Continued
October 31, 2023
with respect to the Fund and its ability to support its management of the Fund and obligations under the Advisory Agreement. The Board concluded that Weiss’ profit from managing the Fund had not been,
and currently was not, excessive.
With respect to economies of scale, the Board reviewed the Fund’s operating history and noted that the Fund had experienced growth since it commenced operations. The Board then considered information
regarding whether and the extent to which economies of scale may be realized as the Fund’s assets grow and whether the Fund’s fee structure reflects these economies of scale for the benefit of for shareholders. The Board considered that the Expense
Limitation Agreement limits costs to shareholders and provides a means of sharing potential economies of scale with the Fund’s shareholders. The Board noted that it would continue to monitor any future growth in the Fund’s assets and the
appropriateness of implementing management fee breakpoints or other methods to share benefits from h economies of scale as part of its future review of the Advisory Agreement.
ANCILLARY BENEFITS DERIVED FROM THE RELATIONSHIP WITH THE FUND
The Board received and considered information regarding ancillary or “fall-out” benefits to Weiss and/or its affiliates, if any, as a result of Weiss’s relationship with the Fund. Ancillary benefits
could include, among others, benefits attributable to research credits generated by Fund portfolio transactions. In this regard, the Board considered that Weiss confirmed it had benefited firm-wide from research credits generated by Fund portfolio
transactions over the past twelve months. Ancillary benefits could also include benefits potentially derived from an increase in Weiss’ business as a result of its relationship with the Fund (such as the ability to market to shareholders other
potential financial products and services offered by Weiss, or to operate other products and services that follow investment strategies similar to those of the Fund). Based on its consideration of the factors and information it deemed relevant,
including those described here, the Board did not find that ancillary benefits received by Weiss and/or its affiliates, if any, were unreasonable.
CONCLUSIONS
In considering the renewal of the Advisory Agreement, the Trustees did not identify any one factor as all-important, but rather considered these factors collectively in light of the Fund’s surrounding
circumstances. Based on its deliberations and its evaluation of the information and factors described above, among others, the Board unanimously approved the Advisory Agreement for an additional one-year term.
89
WEISS ALTERNATIVE MULTI-STRATEGY FUND
Statement Regarding the Fund’s Liquidity Risk Management Program (Unaudited)
October 31, 2023
In accordance with Rule 22e-4 under the Investment Company Act of 1940, as amended, Series Portfolios Trust (the “Trust”) has adopted and implemented a liquidity risk management program (the “Trust
Program”). As required under the Trust Program, Weiss Multi-Strategy Advisers, LLC (the “Adviser”), the investment adviser to the Weiss Alternative Balanced Risk Fund (the “Fund”), a series of the Trust, has adopted and implemented a liquidity risk
management program tailored specifically to the Fund (the “Adviser Program”). The Adviser Program seeks to promote effective liquidity risk management for the Fund and to protect Fund shareholders from dilution of their interests. The Board of
Trustees (the “Board”) of the Trust has approved the Adviser as the administrator for the Adviser Program (the “Program Administrator”). The Program Administrator has further delegated administration of the Adviser Program to its Liquidity Risk
Management Committee. The Program Administrator is required to provide a written annual report to the Board and the Trust’s chief compliance officer regarding the adequacy and effectiveness of the Adviser Program, including the operation of the
Fund’s highly liquid investment minimum, if applicable, and any material changes to the Adviser Program.
On October 25-26, 2023, the Board reviewed the Program Administrator’s written annual report for the period June 1, 2022 through May 31, 2023 (the “Report”). The Report provided an assessment of the
Fund’s liquidity risk: the risk that the Fund could not meet requests to redeem shares issued by the Fund without significant dilution of the remaining investors’ interests in the Fund. The Adviser Program assesses liquidity risk under both normal
and reasonably foreseeable stressed market conditions. The Program Administrator has retained ICE Data Services, Inc., a third-party vendor, to provide portfolio investment classification services, and the Report noted that the Fund primarily held
investments that were classified as highly liquid during the review period. The Report noted that the Fund’s portfolio is expected to continue to primarily hold highly liquid investments and the determination that the Fund be designated as a
“primarily highly liquid fund” (as defined in Rule 22e-4) remains appropriate and the Fund can therefore continue to rely on the exclusion in Rule 22e-4 from the requirements to determine and review a highly liquid investment minimum for the Fund and
to adopt policies and procedures for responding to a highly liquid investment minimum shortfall. The Report noted that there were no breaches of the Fund’s restriction on holding illiquid investments exceeding 15% of its net assets during the review
period. The Report confirmed that the Fund’s investment strategy was appropriate for an open-end management investment company. The Report also indicated that no material changes had been made to the Adviser Program during the review period.
The Program Administrator determined that the Fund is reasonably likely to be able to meet redemption requests without adversely affecting non-redeeming Fund shareholders through significant dilution.
The Program Administrator concluded that the Adviser Program was adequately designed and effectively implemented during the review period.
90
WEISS ALTERNATIVE MULTI-STRATEGY FUND
Additional Information (Unaudited)
October 31, 2023
TRUSTEES AND EXECUTIVE OFFICERS
The Board oversees the management and operations of the Trust. The Board, in turn, elects the officers of the Trust, who are responsible for the day-to-day operations of the Trust and its separate
series. The current Trustees and officers of the Trust, their year of birth, positions with the Trust, terms of office with the Trust and length of time served, principal occupations during the past five years and other directorships are set forth in
the table below. Unless noted otherwise, the principal business address of each Trustee is c/o U.S. Bank Global Fund Services, 615 East Michigan Street, Milwaukee, Wisconsin 53202.
|
Number of
|
|||||
|
Portfolios
|
|||||
|
in Fund
|
Other
|
||||
|
Positions
|
Term of Office
|
Complex(2)
|
Directorships
|
||
|
Name and
|
with
|
and Length of
|
Principal Occupations
|
Overseen
|
Held During
|
|
Year of Birth
|
the Trust
|
Time Served
|
During Past Five Years
|
by Trustees
|
Past Five Years
|
|
Independent Trustees of the Trust(1)
|
|||||
|
Koji Felton
|
Trustee
|
Indefinite Term;
|
Retired.
|
2
|
Independent
|
|
(born 1961)
|
Since
|
Trustee, Listed
|
|||
|
September 2015.
|
Funds Trust
|
||||
|
(15 portfolios)
|
|||||
|
(Since 2019).
|
|||||
|
Debra McGinty-Poteet
|
Trustee
|
Indefinite Term;
|
Retired.
|
2
|
Independent
|
|
(born 1956)
|
Since
|
Trustee, F/m
|
|||
|
September 2015.
|
Funds Trust
|
||||
|
(3 portfolios)
|
|||||
|
(Since May
|
|||||
|
2015).
|
|||||
|
Daniel B. Willey
|
Trustee
|
Indefinite Term;
|
Retired. Chief Compliance
|
2
|
None
|
|
(born 1955)
|
Since
|
Officer, United Nations
|
|||
|
September 2015.
|
Joint Staff Pension
|
||||
|
Fund (2009 – 2017).
|
|||||
|
Interested Trustee
|
|||||
|
Elaine E. Richards(3)
|
Chair,
|
Indefinite Term;
|
Senior Vice President,
|
2
|
None
|
|
(born 1968)
|
Trustee
|
Since
|
U.S. Bancorp Fund
|
||
|
July 2021.
|
Services, LLC (since 2007).
|
||||
|
Officers of the Trust
|
|||||
|
Ryan L. Roell
|
President and
|
Indefinite Term;
|
Vice President,
|
Not
|
Not
|
|
(born 1973)
|
Principal
|
Since
|
U.S. Bancorp Fund
|
Applicable
|
Applicable
|
|
Executive
|
July 2019.
|
Services, LLC (since 2005).
|
|||
|
Officer
|
|||||
|
Cullen O. Small(4)
|
Vice
|
Indefinite Term;
|
Vice President,
|
Not
|
Not
|
|
(born 1987)
|
President,
|
Since
|
U.S. Bancorp Fund
|
Applicable
|
Applicable
|
|
Treasurer and
|
January 2019.
|
Services, LLC (since 2010).
|
|||
|
Principal
|
|||||
|
Financial
|
|||||
|
Officer
|
|||||
91
WEISS ALTERNATIVE MULTI-STRATEGY FUND
Additional Information (Unaudited) – Continued
October 31, 2023
|
Number of
|
|||||
|
Portfolios
|
|||||
|
in Fund
|
Other
|
||||
|
Positions
|
Term of Office
|
Complex(2)
|
Directorships
|
||
|
Name and
|
with
|
and Length of
|
Principal Occupations
|
Overseen
|
Held During
|
|
Year of Birth
|
the Trust
|
Time Served
|
During Past Five Years
|
by Trustees
|
Past Five Years
|
|
Douglas Schafer(4)
|
Vice
|
Indefinite Term;
|
Assistant Vice President,
|
Not
|
Not
|
|
(born 1970)
|
President,
|
Since
|
U.S. Bancorp Fund
|
Applicable
|
Applicable
|
|
Treasurer and
|
November 2023.
|
Services, LLC (since 2002).
|
|||
|
Principal
|
|||||
|
Financial
|
|||||
|
Officer
|
|||||
|
Donna Barrette
|
Vice
|
Indefinite Term;
|
Senior Vice President
|
Not
|
Not
|
|
(born 1966)
|
President,
|
Since
|
and Compliance Officer,
|
Applicable
|
Applicable
|
|
Chief
|
November 2019.
|
U.S. Bancorp Fund
|
|||
|
Compliance
|
Services, LLC (since 2004).
|
||||
|
Officer and
|
|||||
|
Anti-Money
|
|||||
|
Laundering
|
|||||
|
Officer
|
|||||
|
Adam W. Smith
|
Secretary
|
Indefinite Term;
|
Vice President,
|
Not
|
Not
|
|
(born 1981)
|
Since
|
U.S. Bancorp Fund
|
Applicable
|
Applicable
|
|
|
June 2019.
|
Services, LLC (since 2012).
|
||||
|
Richard E. Grange
|
Assistant
|
Indefinite Term;
|
Officer, U.S. Bank
|
Not
|
Not
|
|
(born 1982)
|
Treasurer
|
Since
|
U.S. Bancorp Fund
|
Applicable
|
Applicable
|
|
October 2022.
|
Services, LLC (since 2017).
|
||||
|
Leone Logan
|
Assistant
|
Indefinite Term;
|
Officer, U.S. Bank
|
Not
|
Not
|
|
(born 1986)
|
Treasurer
|
Since
|
U.S. Bancorp Fund
|
Applicable
|
Applicable
|
|
November 2023.
|
Services, LLC (since 2022):
|
||||
|
Senior Financial Reporting
|
|||||
|
Analyst, BNY Mellon
|
|||||
|
(2014 – 2022).
|
|
(1)
|
The Trustees of the Trust who are not “interested persons” of the Trust as defined under the 1940 Act (“Independent Trustees”).
|
|
(2)
|
As of the date September 30, 2023, the Trust was comprised of 19 portfolios (including the Fund) managed by unaffiliated investment advisers. The term “Fund Complex” applies only to the Fund.
The Fund does not hold itself out as related to any other series within the Trust for investment purposes, nor does it share the same investment adviser with any other series within the Trust.
|
|
(3)
|
Ms. Richards, as a result of her employment with U.S. Bancorp Fund Services, LLC, which acts as transfer agent, administrator, and fund accountant to the Trust, is considered to be an
“interested person” of the Trust, as defined by the 1940 Act.
|
|
(4)
|
Refer to Note 10 in Notes to the Financial Statements.
|
92
WEISS ALTERNATIVE MULTI-STRATEGY FUND
Additional Information (Unaudited) – Continued
October 31, 2023
AVAILABILITY OF FUND PORTFOLIO INFORMATION
The Fund files complete schedules of portfolio holdings with the SEC for the first and third quarters of each fiscal year on Part F of Form N-PORT, which is available on the SEC’s website at
www.sec.gov. The Fund’s Part F of Form N-PORT may be reviewed and copied at the SEC’s Public Reference Room in Washington, D.C. For information on the Public Reference Room call 1-800-SEC-0330. In addition, the Fund’s Part F of Form N-PORT is
available without charge upon request by calling 1-866-530-2690.
AVAILABILITY OF PROXY VOTING INFORMATION
A description of the Fund’s Proxy Voting Policies and Procedures is available without charge, upon request, by calling 1-866-530-2690. Information regarding how the Fund voted proxies relating to
portfolio securities during the most recent period ended June 30, is available (1) without charge, upon request, by calling 1-866-530-2690, or (2) on the SEC’s website at www.sec.gov.
QUALIFIED DIVIDEND INCOME/DIVIDENDS RECEIVED DEDUCTION
For the year ended October 31, 2023, certain dividends paid by the Fund may be reported as qualified dividend income (QDI) and maybe eligible for taxation at capital gains rates. The percentage of
dividends declared from ordinary income designated as qualified dividend income was 26.19%.
For corporate shareholders, the percent of ordinary income distributions qualifying for the corporate dividends received deduction for the year ended October 31, 2023 was 20.33%.
The percentage of taxable ordinary income distributions that are designated as short-term capital gain distributions under Internal Revenue Section 871 (k)(2)(c) was 100%.
93
WEISS ALTERNATIVE MULTI-STRATEGY FUND
Privacy Notice (Unaudited)
The Fund collects non-public information about you from the following sources:
• Information we receive about you on applications or other forms;
• Information you give us orally; and/or
• Information about your transactions with us or others
We do not disclose any non-public personal information about our customers or former customers without the customer’s authorization, except as permitted by law. We may share information with affiliated
and unaffiliated third parties with whom we have contracts for servicing the Fund. We will provide unaffiliated third parties with only the information necessary to carry out their assigned responsibilities. We maintain physical, electronic and
procedural safeguards to guard your personal information and require third parties to treat your personal information with the same high degree of confidentiality.
In the event that you hold shares of the Fund through a financial intermediary, including, but not limited to, a broker-dealer, bank, or trust company, the privacy policy of your financial intermediary
would govern how your non-public personal information would be shared with unaffiliated third parties.
94
(This Page Intentionally Left Blank.)
INVESTMENT ADVISER
Weiss Multi-Strategy Advisers LLC
320 Park Avenue, 20th Floor
New York, NY 10022
DISTRIBUTOR
Quasar Distributors, LLC
111 East Kilbourn Avenue, Suite 2200
Milwaukee, WI 53202
CUSTODIAN
U.S. Bank N.A.
1555 North Rivercenter Drive, Suite 302
Milwaukee, WI 53212
ADMINISTRATOR, FUND ACCOUNTANT
AND TRANSFER AGENT
U.S. Bancorp Fund Services, LLC
615 East Michigan Street
Milwaukee, WI 53202
INDEPENDENT REGISTERED PUBLIC ACCOUNTING FIRM
Cohen & Company, Ltd.
342 North Water Street, Suite 830
Milwaukee, WI 53202
LEGAL COUNSEL
Goodwin Procter LLP
1900 N Street NW
Washington, DC 20036
This report should be accompanied or preceded by a prospectus.
The Fund’s Statement of Additional Information contains additional information about the
Fund’s trustees and is available without charge upon request by calling 1-866-530-2690.
|
(b)
|
Not applicable.
|
Item 2. Code of Ethics.
The registrant has adopted a code of ethics that applies to the registrant’s principal executive officer and principal financial officer. The registrant has not made any substantive amendments to its code of ethics during the period covered by
this report. The registrant has not granted any waivers from any provisions of the code of ethics during the period covered by this report.
File: A copy of the registrant’s Code of Ethics is filed herewith.
Item 3. Audit Committee Financial Expert.
The registrant’s board of trustees has determined that there is at least one audit committee financial expert serving on its audit committee. Debra McGinty-Poteet is the “audit committee financial expert” and is considered to be “independent”
as each term is defined in Item 3 of Form N‑CSR.
Item 4. Principal Accountant Fees and Services.
The registrant has engaged its principal accountant to perform audit services, audit-related services, tax services and other services during the past fiscal year. “Audit services” refer to performing an audit of the registrant's annual
financial statements or services that are normally provided by the accountant in connection with statutory and regulatory filings or engagements for the past fiscal year. “Audit-related services” refer to the assurance and related services by the
principal accountant that are reasonably related to the performance of the audit. “Tax services” refer to professional services rendered by the principal accountant for tax compliance, tax advice, and tax planning; including reviewing the Fund’s
tax returns and distribution calculations. There were no “other services” provided by the principal accountant. For the fiscal years ended October 31, 2023, and October 31, 2022, the Fund’s principal accountant was Cohen & Company, Ltd. The
following table details the aggregate fees billed or expected to be billed for the last fiscal year for audit fees, audit-related fees, tax fees and other fees by the principal accountant.
|
FYE 10/31/2023
|
FYE 10/31/2022
|
|
|
(a) Audit Fees
|
$48,000
|
$46,000
|
|
(b) Audit-Related Fees
|
$0
|
$0
|
|
(c) Tax Fees
|
$7,000
|
$7,000
|
|
(d) All Other Fees
|
$0
|
$0
|
(e)(1) The audit committee has adopted pre-approval policies and procedures that require the audit committee to pre‑approve all audit and non‑audit services of the registrant, including services provided to any entity affiliated with the
registrant.
(e)(2) The percentage of fees billed by Cohen & Company, Ltd. applicable to non-audit services pursuant to waiver of pre-approval
requirement were as follows:
|
FYE 10/31/2023
|
FYE 10/31/2022
|
|
|
Audit-Related Fees
|
0%
|
0%
|
|
Tax Fees
|
0%
|
0%
|
|
All Other Fees
|
0%
|
0%
|
(f) All of the principal accountant’s hours spent on auditing the registrant’s financial statements were attributed to work performed by full‑time permanent employees of the principal accountant.
(g) The following table indicates the non-audit fees billed or expected to be billed by the registrant’s accountant for services to the registrant and to the registrant’s investment adviser (and any other
controlling entity, etc.—not sub-adviser) for the last two fiscal years.
|
Non-Audit Related Fees
|
FYE 10/31/2023
|
FYE 10/31/2022
|
|
Registrant
|
$0
|
$0
|
|
Registrant’s Investment Adviser
|
$0
|
$0
|
(h) The audit committee of the board of trustees has considered whether the provision of non-audit services that were rendered to the Registrant's
investment adviser is compatible with maintaining the principal accountant's independence and has concluded that the provision of such non-audit services by the accountant has not compromised the accountant’s independence.
(i) Not applicable.
(j) Not applicable.
Item 5. Audit Committee of Listed Registrants.
Not applicable to registrants who are not listed issuers (as defined in Rule 10A-3 under the Securities Exchange Act of 1934).
(b) Not applicable.
Item 6. Investments.
|
(a)
|
Schedule of Investments is included as part of the report to shareholders filed under Item 1 of this Form.
|
|
(b)
|
Not applicable.
|
Item 7. Disclosure of Proxy Voting Policies and Procedures for Closed-End Management Investment Companies.
Not applicable to open-end investment companies.
Item 8. Portfolio Managers of Closed-End Management Investment Companies.
Not applicable to open-end investment companies.
Item 9. Purchases of Equity Securities by Closed‑End Management Investment Company and Affiliated Purchasers.
Not applicable to open-end investment companies.
Item 10. Submission of Matters to a Vote of Security Holders.
There have been no material changes to the procedures by which shareholders may recommend nominees to the registrant’s board of trustees.
Item 11. Controls and Procedures.
|
(a)
|
The Registrant’s President and Treasurer have reviewed the Registrant's disclosure controls and procedures (as defined in Rule 30a-3(c) under the Investment Company Act of 1940 (the “Act”)) as of a date within 90 days of the filing of
this report, as required by Rule 30a-3(b) under the Act and Rules 13a-15(b) or 15d‑15(b) under the Securities Exchange Act of 1934. Based on their review, such officers have concluded that the disclosure controls and procedures are
effective in ensuring that information required to be disclosed in this report is appropriately recorded, processed, summarized and reported and made known to them by others within the Registrant and by the Registrant’s service provider.
|
|
(b)
|
There were no changes in the Registrant's internal control over financial reporting (as defined in Rule 30a-3(d) under the Act) that occurred during the period covered by this report that has materially affected, or is reasonably
likely to materially affect, the Registrant's internal control over financial reporting.
|
Item 12. Disclosure of Securities Lending Activities for Closed-End management Investment Companies.
Not applicable to open-end investment companies.
Item 13. Exhibits.
(3) Any written solicitation to purchase securities under Rule 23c‑1 under the Act sent or given during the period covered by the report by or on behalf of the registrant to 10 or
more persons. Not applicable to open-end investment companies.
(4) Change in the registrant’s independent public accountant. There was no change in the registrant’s independent public accountant for the period covered by this report.
SIGNATURES
Pursuant to the requirements of the Securities Exchange Act of 1934 and the Investment Company Act of 1940, the registrant has duly caused this report to be signed on its behalf by the undersigned, thereunto duly
authorized.
(Registrant) Series Portfolios Trust
By (Signature and Title) /s/Ryan Roell
Ryan Roell, President
Date 1/08/2024
Pursuant to the requirements of the Securities Exchange Act of 1934 and the Investment Company Act of 1940, this report has been signed below by the following persons on behalf of the registrant and in the capacities
and on the dates indicated.
By (Signature and Title) /s/Ryan Roell
Ryan Roell, President
Date 1/08/2024
By (Signature and Title) /s/Douglas Schafer
Douglas Schafer, Treasurer
Date 1/08/2024