UNITED STATES
SECURITIES AND EXCHANGE COMMISSION
Washington, D.C. 20549
SECURITIES AND EXCHANGE COMMISSION
Washington, D.C. 20549
FORM N-CSR
CERTIFIED SHAREHOLDER REPORT OF REGISTERED
MANAGEMENT INVESTMENT COMPANIES
Investment Company Act file number 811-23084
Series Portfolios Trust
(Exact name of registrant as specified in charter)
(Exact name of registrant as specified in charter)
615 East Michigan Street
Milwaukee, WI 53202
(Address of principal executive offices) (Zip code)
(Address of principal executive offices) (Zip code)
Ryan Roell, President
Series Portfolios Trust
c/o U.S. Bancorp Fund Services, LLC
777 East Wisconsin Ave, 5th Fl
Milwaukee, WI 53202
(Name and address of agent for service)
(Name and address of agent for service)
(414) 765-6839
Registrant's telephone number, including area code
Date of fiscal year end: October 31, 2021
Date of reporting period: April 30, 2021
Item 1. Reports to Stockholders.
|
(a)
|
|
Weiss Alternative Multi-Strategy Fund
Class K – weisx
Investor Class – weizx
Semi-Annual Report
April 30, 2021
WEISS ALTERNATIVE MULTI-STRATEGY FUND
Dear Shareholders:
The Weiss Alternative Multi-Strategy Fund (the “Fund” or “WEISX”) was launched on December 1, 2015 in response to investors’ search for a daily liquid, actively managed, multi-alternative strategy. The Fund seeks to
provide returns with moderate volatility and reduced correlation to the overall performance of bond and equity markets. This is achieved by using a rigorous, risk-controlled multi-strategy investment approach that seeks to harvest returns from highly
liquid and diversified sub-strategies set out below. The Fund is focused on generating the consistency of returns typically associated with fixed income and alternative investment allocations. The Fund’s strategy will seek to benefit from active
management, diversification, and liquidity both within and across the following three principal sources. The goal is for all three sources to contribute positively to overall Fund returns over time. The Fund seeks to generate its return from three
sources:
|
•
|
(1) Core Market Neutral portfolio (“Core portfolio”) – a market neutral, multi-strategy portfolio which consists of approximately 20 fundamentally driven, actively managed, diversified sub-strategies with a
sector or asset class focus. Each sub-strategy is market neutral and seeks to benefit from price dispersion instead of market direction.
|
|
|
•
|
The Core portfolio is complimented by risk-optimized allocation to two overlay components:
|
|
o
|
(2) A highly diversified portfolio of equities, aiming to outperform in positive economic and financial environments (the “Growth component”).
|
||
|
o
|
(3) An allocation to defensive assets, such as bonds, designed to limit downside loss and duration (the “Defensive component”).
|
In the trailing 3-month period (February 2021 – April 2021), the Weiss Alternative Multi-Strategy Fund (ticker: WEISX) returned +2.89% net of fees while its benchmark, the Bloomberg Barclays US Aggregate Bond Index
declined -1.91%.
In the trailing 3-month period, the Core portfolio of WEISX produced gross returns of +12.57%. During the same timeframe, the Growth component returned +19.12% gross and the Defensive component finished with returns of
-4.02% gross. The average gross notional exposure as a percent of Fund capital for the trailing 3-month period across the three components were as follows: Core portfolio (109.22%), Defensive component (75.11%) and Growth component (18.13%).
For the time period detailed in this Semi-Annual report (November 2020 – April 2021), WEISX generated +7.74% on an annualized volatility of 7.06%. In contrast, the benchmark declined -1.52% with a volatility measure of
3.38% as detailed above.
WEISX minimized volatility and limited downside loss during periods of increased financial market instability, particularly as the COVID pandemic entered its second year. The Core portfolio continued to contribute a
return stream with low levels of correlation to other asset classes, nicely assisted by strong performance from the pro-cyclical Growth component and staving off poor performance in fixed income securities as a result of inflationary fears.
Sincerely,
/s/ Weiss Portfolio Managers
1
WEISS ALTERNATIVE MULTI-STRATEGY FUND
Bloomberg Barclays US Aggregate Bond Index is a broad-based flagship benchmark that measures the investment grade, US dollar-denominated, fixed-rate taxable bond market. The index includes Treasuries,
government-related and corporate securities, MBS (agency fixed-rate and hybrid ARM pass-throughs), ABS and CMBS (agency and non-agency). One cannot invest directly in an index.
Duration is defined as a measure of the sensitivity of the price of a bond or other debt instrument to a change in interest rates.
Standard Deviation is defined as a quantity calculated to indicate the extent of deviation for a group as a whole.
Correlation is a statistical measure of the degree to which the movements of two variables (stock/option/convertible prices or returns) are related.
Opinions expressed are subject to change at any time, are not guaranteed and should not be considered investment advice.
Diversification does not assure a profit nor protect against loss in a declining market.
Mutual fund investing involves risk. Principal loss is possible. Derivatives involve special risks including correlation, counterparty, liquidity, operational, accounting and tax risks. These risks,
in certain cases, may be greater than the risks presented by more traditional investments. The Fund may also use options and future contracts, which have the risks of unlimited losses of the underlying holdings due to unanticipated market movements
and failure to correctly predict the direction of securities prices, interest rates and currency exchange rates. The investment in options is not suitable for all investors. The Fund invests in foreign securities which involve greater volatility and
political, economic and currency risks and differences in accounting methods. These risks are greater in emerging markets. Investment by the Fund in lower-rated and non-rated securities presents a greater risk of loss to principal and interest than
higher-rated securities. The Fund may use leverage which may exaggerate the effect of any increase or decrease in the value of portfolio securities or the Net Asset Value (“NAV”) of the Fund, and money borrowed will be subject to interest costs.
Small- and Medium-capitalization companies tend to have limited liquidity and greater price volatility than large-capitalization companies. Investing in ETFs are subject to additional risks that do not apply to conventional mutual funds, including
the risks that the market price of the shares may trade at a discount to its NAV, an active secondary trading market may not develop or be maintained, or trading may be halted by the exchange in which they trade, which may impact the Fund’s ability
to sell its shares. The Fund may make short sales of securities, which involves the risk that losses may exceed the original amount invested.
Must be preceded or accompanied by a prospectus.
The Weiss Alternative Multi-Strategy Fund is distributed by Quasar Distributors, LLC.
2
WEISS ALTERNATIVE MULTI-STRATEGY FUND
Expense Example (Unaudited)
April 30, 2021
As a shareholder of the Fund, you incur two types of costs: (1) transaction costs, and (2) ongoing costs, including management fees and other Fund specific expenses. The expense example is intended to help the
shareholder understand ongoing costs (in dollars) of investing in the Fund and to compare these costs with the ongoing costs of investing in other mutual funds. The example is based on an investment of $1,000 invested at the beginning of the period
and held for the most recent six-month period.
The Actual Expenses comparison provides information about actual account values and actual expenses. A shareholder may use the information in this line, together with the amount invested, to estimate the expenses paid
over the period. A shareholder may divide his/her account value by $1,000 (e.g., an $8,600 account value divided by $1,000 = 8.6), then multiply the result by the number in the first line under the heading entitled “Expenses Paid During Period” to
estimate the expenses paid on his/her account during this period.
The Hypothetical Example for Comparison Purposes provides information about hypothetical account values and hypothetical expenses based on each Fund’s actual expense ratio and an assumed rate of return of 5% per year
before expenses, which is not the Fund’s actual return. The hypothetical account values and expenses may not be used to estimate the actual ending account balance or expenses paid for the period. A shareholder may use this information to compare the
ongoing costs of investing in the Funds and other funds. To do so, a shareholder would compare this 5% hypothetical example with the 5% hypothetical examples that appear in the shareholder reports of other funds.
The expenses shown in the table are meant to highlight your ongoing costs only and do not reflect any transactional costs, such as sales charges (loads), redemptions fees or exchange fees. Therefore, the Hypothetical
Example for Comparisons Purposes is useful in comparing ongoing costs only and will not help to determine the relevant total costs of owning different funds. In addition, if these transactional costs were included, shareholder costs would have been
higher.
|
Expenses Paid
|
||||
|
Annualized Net
|
Beginning
|
Ending
|
During Period(1)
|
|
|
Expense Ratio
|
Account Value
|
Account Value
|
(11/1/2020 to
|
|
|
(4/30/2021)
|
(11/1/2020)
|
(4/30/2021)
|
4/30/2021)
|
|
|
Class K
|
||||
|
Actual(2)(3)
|
2.85%
|
$1,000.00
|
$1,077.40
|
$14.68
|
|
Hypothetical (5% annual return
|
||||
|
before expenses)(4)
|
2.85%
|
$1,000.00
|
$1,010.66
|
$14.21
|
|
Investor Class
|
||||
|
Actual(2)(3)
|
3.20%
|
$1,000.00
|
$1,074.60
|
$16.46
|
|
Hypothetical (5% annual return
|
||||
|
before expenses)(4)
|
3.20%
|
$1,000.00
|
$1,008.93
|
$15.94
|
|
(1)
|
Expenses are equal to the Fund’s annualized expense ratio for the period multiplied by the average account value over the period, multiplied by 181/365 to reflect its six-month period.
|
|
(2)
|
Based on the actual returns for the period from November 1, 2020 through April 30, 2021, of 7.74% and 7.46% for Class K and Investor Class, respectively.
|
|
(3)
|
Excluding dividends on short positions and borrowing expense, your actual cost of investing in Class K and Investor Class would be $7.73 and $9.52, respectively.
|
|
(4)
|
Excluding dividends on short positions and borrowing expense, your hypothetical cost of investing in Class K and Investor Class would be $7.50 and $9.25, respectively.
|
3
WEISS ALTERNATIVE MULTI-STRATEGY FUND
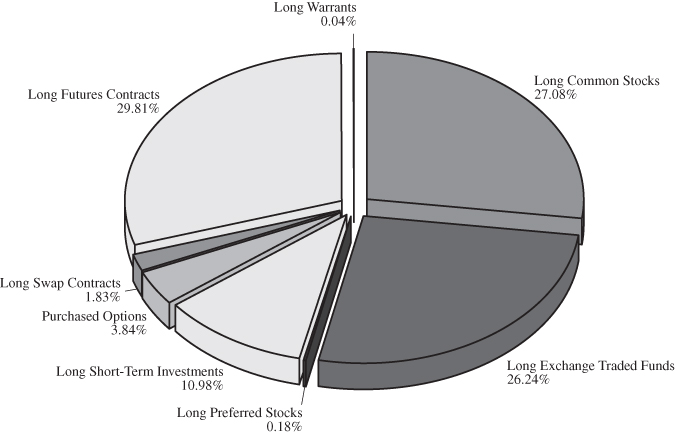
Allocation of Portfolio (Unaudited)
April 30, 2021
LONG INVESTMENTS(1)(2)
|
(1)
|
Data expressed as a percentage of long common stocks, long contingent value rights, long exchange traded funds, long preferred stocks, long warrants, long short-term investments, purchased options, long swap
contracts, and long futures contracts as of April 30, 2021. Data expressed excludes securities sold short, written options, and other assets in excess of liabilities. Please refer to the Schedule of Investments, Schedule of Written Options,
Schedule of Swap Contracts, and Schedule of Open Futures Contracts for more details on the Fund’s individual holdings.
|
|
(2)
|
The value of option, swap, and futures contracts are expressed as notional and not fair value.
|
4
WEISS ALTERNATIVE MULTI-STRATEGY FUND
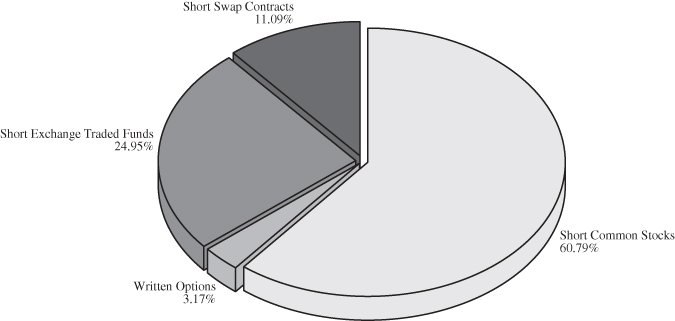
Allocation of Portfolio (Unaudited)
April 30, 2021
SHORT INVESTMENTS(3)(4)
|
(3)
|
Data expressed as a percentage of short common stocks, short exchange traded funds, written options and short swap contracts as of April 30, 2021. Data expressed excludes long investments, long swap contracts,
long futures contracts and other assets in excess of liabilities. Please refer to the Schedule of Investments, Schedule of Written Options and Schedule of Swap Contracts for more details on the Fund’s individual holdings.
|
|
(4)
|
The value of option and swap contracts are expressed as notional and not fair value.
|
5
WEISS ALTERNATIVE MULTI-STRATEGY FUND
Schedule of Investments (Unaudited)
April 30, 2021
|
Shares
|
Value
|
|||||||
|
LONG COMMON STOCKS – 41.13%
|
||||||||
|
Aerospace & Defense – 0.06%
|
||||||||
|
Aerojet Rocketdyne Holdings, Inc.
|
1,149
|
$
|
53,681
|
|||||
|
The Boeing Company (a)
|
5
|
1,171
|
||||||
|
Howmet Aerospace, Inc. (a)
|
28
|
895
|
||||||
|
Huntington Ingalls Industries, Inc.
|
5
|
1,062
|
||||||
|
Northrop Grumman Corporation
|
97
|
34,381
|
||||||
|
TransDigm Group, Inc. (a)
|
17
|
10,434
|
||||||
|
101,624
|
||||||||
|
Air Freight & Logistics – 0.70%
|
||||||||
|
C.H. Robinson Worldwide, Inc.
|
1,134
|
110,089
|
||||||
|
FedEx Corporation
|
2,214
|
642,746
|
||||||
|
Forward Air Corporation
|
895
|
79,020
|
||||||
|
Hub Group, Inc., Class A (a)
|
2,670
|
175,472
|
||||||
|
United Parcel Service, Inc., Class B
|
819
|
166,961
|
||||||
|
XPO Logistics, Inc. (a)
|
563
|
78,325
|
||||||
|
1,252,613
|
||||||||
|
Airlines – 0.31%
|
||||||||
|
Air Canada (a)(b)
|
1,734
|
34,944
|
||||||
|
Alaska Air Group, Inc. (a)
|
972
|
67,204
|
||||||
|
Copa Holdings SA, Class A (a)(b)
|
279
|
24,134
|
||||||
|
Delta Air Lines, Inc. (a)
|
161
|
7,554
|
||||||
|
Deutsche Lufthansa AG – Reg (a)(b)
|
6,579
|
84,990
|
||||||
|
Ryanair Holdings plc – ADR (a)(b)
|
751
|
87,754
|
||||||
|
Southwest Airlines Company (a)
|
2,013
|
126,376
|
||||||
|
United Airlines Holdings, Inc. (a)
|
2,244
|
122,074
|
||||||
|
555,030
|
||||||||
|
Auto Components – 0.10%
|
||||||||
|
Adient plc (a)
|
929
|
43,050
|
||||||
|
American Axle & Manufacturing Holdings, Inc. (a)
|
1,458
|
13,530
|
||||||
|
BorgWarner, Inc.
|
80
|
3,887
|
||||||
|
Cooper Tire & Rubber Company
|
375
|
21,371
|
||||||
|
Dana, Inc.
|
644
|
16,293
|
||||||
|
Lear Corporation
|
38
|
6,986
|
||||||
|
Magna International, Inc. (b)
|
731
|
69,021
|
||||||
|
QuantumScape Corporation (a)
|
241
|
8,806
|
||||||
|
182,944
|
||||||||
|
Automobiles – 0.21%
|
||||||||
|
Daimler AG – Reg (b)
|
693
|
61,676
|
||||||
|
Ford Motor Company (a)
|
10,857
|
125,290
|
||||||
The accompanying notes are an integral part of these financial statements.
6
WEISS ALTERNATIVE MULTI-STRATEGY FUND
Schedule of Investments (Unaudited) – Continued
April 30, 2021
|
Shares
|
Value
|
|||||||
|
Automobiles – 0.21% (Continued)
|
||||||||
|
General Motors Company (a)
|
2,852
|
$
|
163,192
|
|||||
|
Stellantis NV (b)
|
702
|
11,632
|
||||||
|
Tesla, Inc. (a)
|
18
|
12,770
|
||||||
|
374,560
|
||||||||
|
Banks – 2.02%
|
||||||||
|
Banco Comercial Portugues SA (a)(b)
|
450,755
|
67,403
|
||||||
|
Bank of America Corporation
|
761
|
30,843
|
||||||
|
Banner Corporation
|
1,451
|
82,475
|
||||||
|
CIT Group, Inc.
|
93
|
4,956
|
||||||
|
Citigroup, Inc.
|
17
|
1,211
|
||||||
|
Citizens Financial Group, Inc.
|
3,632
|
168,089
|
||||||
|
Commerzbank AG (a)(b)
|
19,984
|
131,778
|
||||||
|
DNB ASA (b)
|
5,695
|
122,136
|
||||||
|
East West Bancorp, Inc.
|
2,605
|
198,371
|
||||||
|
Fifth Third Bancorp
|
3,108
|
125,998
|
||||||
|
FinecoBank Banca Fineco SpA (a)(b)
|
8,098
|
139,285
|
||||||
|
First BanCorp (b)
|
6,848
|
86,079
|
||||||
|
First Republic Bank
|
469
|
85,940
|
||||||
|
Hancock Whitney Corporation
|
1,701
|
78,654
|
||||||
|
Home BancShares, Inc.
|
3,253
|
90,531
|
||||||
|
Huntington Bancshares, Inc.
|
10,729
|
164,368
|
||||||
|
International Bancshares Corporation
|
1,605
|
76,061
|
||||||
|
KBC Group NV (b)
|
1,674
|
129,884
|
||||||
|
M&T Bank Corporation
|
1,049
|
165,417
|
||||||
|
PacWest Bancorp
|
1,620
|
70,324
|
||||||
|
Pinnacle Financial Partners, Inc.
|
2,185
|
191,493
|
||||||
|
Prosperity Bancshares, Inc.
|
1,059
|
77,688
|
||||||
|
Royal Bank of Canada (b)
|
2,882
|
275,058
|
||||||
|
Signature Bank
|
570
|
143,361
|
||||||
|
Skandinaviska Enskilda Banken AB, Class A (b)
|
6,301
|
80,736
|
||||||
|
Sterling Bancorp
|
42
|
1,056
|
||||||
|
SVB Financial Group (a)
|
301
|
172,121
|
||||||
|
Triumph Bancorp, Inc. (a)
|
807
|
71,524
|
||||||
|
Truist Financial Corporation
|
17
|
1,008
|
||||||
|
Webster Financial Corporation
|
18
|
952
|
||||||
|
Wells Fargo & Company
|
9,832
|
442,932
|
||||||
|
Zions Bancorporation
|
2,920
|
162,936
|
||||||
|
3,640,668
|
||||||||
The accompanying notes are an integral part of these financial statements.
7
WEISS ALTERNATIVE MULTI-STRATEGY FUND
Schedule of Investments (Unaudited) – Continued
April 30, 2021
|
Shares
|
Value
|
|||||||
|
Beverages – 0.48%
|
||||||||
|
The Coca-Cola Company
|
4,667
|
$
|
251,925
|
|||||
|
Coca-Cola European Partners plc (b)
|
2,019
|
114,719
|
||||||
|
Constellation Brands, Inc., Class A
|
549
|
131,936
|
||||||
|
PepsiCo, Inc.
|
2,513
|
362,274
|
||||||
|
Primo Water Corporation (b)
|
742
|
12,421
|
||||||
|
873,275
|
||||||||
|
Biotechnology – 1.06%
|
||||||||
|
AbbVie, Inc. (h)
|
485
|
54,078
|
||||||
|
Acadia Pharmaceuticals, Inc. (a)
|
1,047
|
21,526
|
||||||
|
Acceleron Pharma, Inc. (a)
|
604
|
75,482
|
||||||
|
Albireo Pharma, Inc. (a)
|
217
|
6,966
|
||||||
|
Aldeyra Therapeutics, Inc. (a)
|
2,268
|
28,509
|
||||||
|
Alexion Pharmaceuticals, Inc. (a)
|
4,762
|
803,254
|
||||||
|
Applied Genetic Technologies Corporation (a)
|
162
|
685
|
||||||
|
Argenx SE – ADR (a)(b)
|
207
|
59,349
|
||||||
|
Arrowhead Pharmaceuticals, Inc. (a)
|
8
|
582
|
||||||
|
Ascendis Pharma A/S – ADR (a)(b)
|
177
|
25,660
|
||||||
|
Aurinia Pharmaceuticals, Inc. (a)(b)
|
486
|
6,449
|
||||||
|
Autolus Therapeutics plc (a)(b)
|
225
|
1,310
|
||||||
|
AVEO Pharmaceuticals, Inc. (a)
|
388
|
2,735
|
||||||
|
BELLUS Health, Inc. (a)(b)
|
512
|
2,099
|
||||||
|
Biohaven Pharmaceutical Holding Company Ltd. (a)
|
1,430
|
107,393
|
||||||
|
BioMarin Pharmaceutical, Inc. (a)
|
296
|
23,064
|
||||||
|
Bioxcel Therapeutics, Inc. (a)
|
356
|
12,093
|
||||||
|
Deciphera Pharmaceuticals, Inc. (a)
|
163
|
7,558
|
||||||
|
Dynavax Technologies Corporation (a)
|
242
|
2,415
|
||||||
|
Eiger BioPharmaceuticals, Inc. (a)
|
3,223
|
27,363
|
||||||
|
Epizyme, Inc. (a)
|
406
|
3,171
|
||||||
|
Esperion Therapeutics, Inc. (a)
|
201
|
5,417
|
||||||
|
Exact Sciences Corporation (a)
|
111
|
14,632
|
||||||
|
Exelixis, Inc. (a)
|
1,220
|
30,036
|
||||||
|
Fate Therapeutics, Inc. (a)
|
194
|
16,954
|
||||||
|
Galera Therapeutics, Inc. (a)
|
97
|
791
|
||||||
|
Global Blood Therapeutics, Inc. (a)
|
259
|
10,562
|
||||||
|
Heron Therapeutics, Inc. (a)
|
311
|
5,436
|
||||||
|
Incyte Corporation (a)
|
397
|
33,896
|
||||||
|
Insmed, Inc. (a)
|
372
|
12,548
|
||||||
|
Ionis Pharmaceuticals, Inc. (a)
|
193
|
8,264
|
||||||
|
Iovance Biotherapeutics, Inc. (a)
|
823
|
25,875
|
||||||
|
Karyopharm Therapeutics, Inc. (a)
|
518
|
4,838
|
||||||
The accompanying notes are an integral part of these financial statements.
8
WEISS ALTERNATIVE MULTI-STRATEGY FUND
Schedule of Investments (Unaudited) – Continued
April 30, 2021
|
Shares
|
Value
|
|||||||
|
Biotechnology – 1.06% (Continued)
|
||||||||
|
Legend Biotech Corporation – ADR (a)
|
154
|
$
|
4,635
|
|||||
|
Merus NV (a)(b)
|
319
|
6,680
|
||||||
|
Mirati Therapeutics, Inc. (a)
|
14
|
2,327
|
||||||
|
Molecular Templates, Inc. (a)
|
882
|
8,256
|
||||||
|
Neurocrine Biosciences, Inc. (a)
|
501
|
47,339
|
||||||
|
Passage Bio, Inc. (a)
|
25
|
469
|
||||||
|
Regeneron Pharmaceuticals, Inc. (a)
|
91
|
43,798
|
||||||
|
Rigel Pharmaceuticals, Inc. (a)
|
6,204
|
23,079
|
||||||
|
Rocket Pharmaceuticals, Inc. (a)
|
388
|
17,786
|
||||||
|
Sage Therapeutics, Inc. (a)
|
72
|
5,671
|
||||||
|
Seagen, Inc. (a)
|
468
|
67,280
|
||||||
|
Turning Point Therapeutics, Inc. (a)
|
98
|
7,471
|
||||||
|
Twist Bioscience Corporation (a)
|
16
|
2,147
|
||||||
|
United Therapeutics Corporation (a)
|
250
|
50,390
|
||||||
|
Vertex Pharmaceuticals, Inc. (a)(h)
|
806
|
175,869
|
||||||
|
Zymeworks, Inc. (a)(b)
|
265
|
8,618
|
||||||
|
1,912,805
|
||||||||
|
Building Products – 0.13%
|
||||||||
|
The AZEK Company, Inc. (a)
|
318
|
15,353
|
||||||
|
Builders FirstSource, Inc. (a)
|
843
|
41,029
|
||||||
|
Carrier Global Corporation
|
596
|
25,974
|
||||||
|
Fortune Brands Home & Security, Inc.
|
645
|
67,712
|
||||||
|
Johnson Controls International plc
|
568
|
35,409
|
||||||
|
Trane Technologies plc (b)
|
251
|
43,631
|
||||||
|
Trex Company, Inc. (a)
|
106
|
11,447
|
||||||
|
240,555
|
||||||||
|
Capital Markets – 0.44%
|
||||||||
|
Allfunds Group plc (a)(b)
|
2,948
|
49,549
|
||||||
|
The Bank New York Mellon Corporation
|
2,511
|
125,249
|
||||||
|
BlackRock, Inc.
|
118
|
96,677
|
||||||
|
Blucora, Inc. (a)
|
1,007
|
14,496
|
||||||
|
The Charles Schwab Corporation
|
469
|
33,018
|
||||||
|
Coinbase Global, Inc., Class A (a)
|
200
|
59,528
|
||||||
|
Credit Suisse Group AG – Reg (b)
|
7,348
|
77,007
|
||||||
|
FactSet Research Systems, Inc.
|
24
|
8,069
|
||||||
|
Flow Traders (b)
|
1,474
|
60,855
|
||||||
|
Franklin Resources, Inc.
|
41
|
1,230
|
||||||
|
The Goldman Sachs Group, Inc.
|
352
|
122,654
|
||||||
|
Morgan Stanley
|
1,759
|
145,205
|
||||||
|
State Street Corporation
|
14
|
1,175
|
||||||
|
794,712
|
||||||||
The accompanying notes are an integral part of these financial statements.
9
WEISS ALTERNATIVE MULTI-STRATEGY FUND
Schedule of Investments (Unaudited) – Continued
April 30, 2021
|
Shares
|
Value
|
|||||||
|
Chemicals – 0.43%
|
||||||||
|
Atotech Ltd. (b)
|
1,269
|
$
|
27,372
|
|||||
|
Axalta Coating Systems Ltd. (a)
|
2,051
|
65,406
|
||||||
|
CF Industries Holdings, Inc.
|
28
|
1,362
|
||||||
|
Covestro AG (b)
|
334
|
21,844
|
||||||
|
Danimer Scientific, Inc. (a)
|
5,744
|
146,759
|
||||||
|
Huntsman Corporation
|
486
|
13,934
|
||||||
|
LyondellBasell Industries NV, Class A
|
168
|
17,428
|
||||||
|
The Mosaic Company
|
49
|
1,724
|
||||||
|
PureCycle Technologies, Inc. (a)
|
6,417
|
165,687
|
||||||
|
The Scotts Miracle-Gro Company
|
806
|
186,315
|
||||||
|
Tronox Holdings plc, Class A (b)
|
261
|
5,533
|
||||||
|
Westlake Chemical Corporation
|
1,284
|
120,555
|
||||||
|
773,919
|
||||||||
|
Commercial Services & Supplies – 0.18%
|
||||||||
|
IAA, Inc. (a)
|
329
|
20,664
|
||||||
|
Knoll, Inc.
|
5,143
|
122,918
|
||||||
|
Republic Services, Inc.
|
1,134
|
120,544
|
||||||
|
Waste Management, Inc.
|
446
|
61,535
|
||||||
|
325,661
|
||||||||
|
Communications Equipment – 0.99%
|
||||||||
|
Applied Optoelectronics, Inc. (a)
|
3,300
|
24,453
|
||||||
|
Arista Networks, Inc. (a)
|
973
|
306,660
|
||||||
|
Calix, Inc. (a)
|
2,275
|
96,210
|
||||||
|
Ciena Corporation (a)
|
5,677
|
286,518
|
||||||
|
Cisco Systems, Inc.
|
285
|
14,509
|
||||||
|
CommScope Holding Company, Inc. (a)
|
43,297
|
712,236
|
||||||
|
F5 Networks, Inc. (a)
|
567
|
105,893
|
||||||
|
Juniper Networks, Inc.
|
2,137
|
54,259
|
||||||
|
Nokia OYJ – ADR (a)(b)
|
9,094
|
42,560
|
||||||
|
Telefonaktiebolaget LM Ericsson – ADR (b)
|
9,846
|
135,776
|
||||||
|
1,779,074
|
||||||||
|
Construction & Engineering – 0.08%
|
||||||||
|
Dycom Industries, Inc. (a)
|
504
|
47,280
|
||||||
|
MasTec, Inc. (a)
|
409
|
42,683
|
||||||
|
Quanta Services, Inc.
|
485
|
46,871
|
||||||
|
136,834
|
||||||||
The accompanying notes are an integral part of these financial statements.
10
WEISS ALTERNATIVE MULTI-STRATEGY FUND
Schedule of Investments (Unaudited) – Continued
April 30, 2021
|
Shares
|
Value
|
|||||||
|
Construction Materials – 0.05%
|
||||||||
|
Eagle Materials, Inc. (a)
|
181
|
$
|
25,004
|
|||||
|
Martin Marietta Materials, Inc.
|
52
|
18,362
|
||||||
|
Vulcan Materials Company
|
268
|
47,768
|
||||||
|
91,134
|
||||||||
|
Consumer Finance – 0.31%
|
||||||||
|
Capital One Financial Corporation
|
983
|
146,546
|
||||||
|
Curo Group Holdings Corporation
|
543
|
7,763
|
||||||
|
Encore Capital Group, Inc. (a)
|
2,107
|
82,889
|
||||||
|
Kaspi.KZ JSC – GDR (b)
|
400
|
34,000
|
||||||
|
LendingClub Corporation (a)
|
2,607
|
40,122
|
||||||
|
Santander Consumer USA Holdings, Inc.
|
2,516
|
85,393
|
||||||
|
Synchrony Financial
|
3,607
|
157,770
|
||||||
|
554,483
|
||||||||
|
Containers & Packaging – 0.03%
|
||||||||
|
Berry Global Group, Inc. (a)
|
780
|
49,624
|
||||||
|
Distributors – 0.01%
|
||||||||
|
Pool Corporation
|
43
|
18,168
|
||||||
|
Diversified Consumer Services – 0.03%
|
||||||||
|
Coursera, Inc. (a)
|
781
|
34,911
|
||||||
|
WW International, Inc. (a)
|
810
|
22,469
|
||||||
|
57,380
|
||||||||
|
Diversified Financial Services – 0.07%
|
||||||||
|
Element Fleet Management Corporation (b)
|
10,938
|
133,927
|
||||||
|
Diversified Telecommunication Services – 0.21%
|
||||||||
|
AT&T, Inc.
|
11,413
|
358,482
|
||||||
|
ORBCOMM, Inc. (a)
|
1,830
|
20,972
|
||||||
|
379,454
|
||||||||
|
Electric Utilities – 0.08%
|
||||||||
|
PNM Resources, Inc.
|
3,069
|
151,486
|
||||||
|
Electrical Equipment – 0.54%
|
||||||||
|
AMETEK, Inc.
|
1,114
|
150,312
|
||||||
|
Eaton Corporation plc
|
49
|
7,003
|
||||||
|
Generac Holdings, Inc. (a)
|
104
|
33,691
|
||||||
The accompanying notes are an integral part of these financial statements.
11
WEISS ALTERNATIVE MULTI-STRATEGY FUND
Schedule of Investments (Unaudited) – Continued
April 30, 2021
|
Shares
|
Value
|
|||||||
|
Electrical Equipment – 0.54% (Continued)
|
||||||||
|
Prysmian SpA (b)
|
5,199
|
$
|
162,660
|
|||||
|
Sensata Technologies Holding plc (a)
|
15
|
866
|
||||||
|
Siemens Energy AG (a)(b)
|
6,017
|
201,251
|
||||||
|
Vertiv Holdings Company
|
18,654
|
423,446
|
||||||
|
979,229
|
||||||||
|
Electronic Equipment, Instruments & Components – 1.24%
|
||||||||
|
908 Devices, Inc. (a)
|
278
|
14,731
|
||||||
|
Coherent, Inc. (a)
|
4,794
|
1,246,392
|
||||||
|
Corning, Inc.
|
2,774
|
122,639
|
||||||
|
Flex Ltd. (a)
|
1,999
|
34,783
|
||||||
|
FLIR Systems, Inc.
|
3,186
|
191,064
|
||||||
|
Hitachi Ltd. (b)
|
9,306
|
460,626
|
||||||
|
II-VI, Inc. (a)
|
449
|
30,146
|
||||||
|
nLight, Inc. (a)
|
404
|
11,853
|
||||||
|
SYNNEX Corporation
|
807
|
97,808
|
||||||
|
Vontier Corporation (a)
|
625
|
19,588
|
||||||
|
2,229,630
|
||||||||
|
Energy Equipment & Services – 0.37%
|
||||||||
|
Baker Hughes, Inc.
|
11,296
|
226,824
|
||||||
|
ChampionX Corporation (a)
|
6,974
|
146,524
|
||||||
|
Halliburton Company
|
41
|
802
|
||||||
|
Schlumberger NV Ltd.
|
6,872
|
185,887
|
||||||
|
TechnipFMC plc (a)(b)
|
13,014
|
96,304
|
||||||
|
U.S. Silica Holdings, Inc. (a)
|
894
|
9,559
|
||||||
|
665,900
|
||||||||
|
Entertainment – 0.55%
|
||||||||
|
Activision Blizzard, Inc.
|
1,917
|
174,811
|
||||||
|
Cinemark Holdings, Inc. (a)
|
1,368
|
29,002
|
||||||
|
IMAX Corporation (a)(b)
|
2,187
|
45,096
|
||||||
|
Netflix, Inc. (a)
|
40
|
20,539
|
||||||
|
Roblox Corporation, Class A (a)
|
828
|
61,727
|
||||||
|
Roku, Inc. (a)
|
8
|
2,744
|
||||||
|
Sciplay Corporation, Class A (a)
|
1,377
|
24,304
|
||||||
|
Score Media and Gaming, Inc., Class A (a)(b)
|
805
|
13,934
|
||||||
|
Take-Two Interactive Software, Inc. (a)
|
162
|
28,412
|
||||||
|
The Walt Disney Company (a)(h)
|
1,450
|
269,729
|
||||||
|
World Wrestling Entertainment, Inc., Class A
|
966
|
53,236
|
||||||
|
Zynga, Inc., Class A (a)(h)
|
23,968
|
259,334
|
||||||
|
982,868
|
||||||||
The accompanying notes are an integral part of these financial statements.
12
WEISS ALTERNATIVE MULTI-STRATEGY FUND
Schedule of Investments (Unaudited) – Continued
April 30, 2021
|
Shares
|
Value
|
|||||||
|
Food & Staples Retailing – 0.11%
|
||||||||
|
Alimentation Couche-Tard, Inc., Class B (b)
|
2,340
|
$
|
79,291
|
|||||
|
Performance Food Group Company (a)
|
1,852
|
108,712
|
||||||
|
Sysco Corporation
|
187
|
15,845
|
||||||
|
203,848
|
||||||||
|
Food Products – 0.55%
|
||||||||
|
Bunge Ltd.
|
1,460
|
123,253
|
||||||
|
General Mills, Inc.
|
529
|
32,195
|
||||||
|
The Hershey Company
|
1,088
|
178,758
|
||||||
|
Hostess Brands, Inc. (a)
|
15,533
|
237,499
|
||||||
|
Lamb Weston Holdings, Inc.
|
1,452
|
116,886
|
||||||
|
Lancaster Colony Corporation
|
129
|
23,828
|
||||||
|
Mondelez International, Inc., Class A
|
1,127
|
68,533
|
||||||
|
Nomad Foods Ltd. (a)(b)
|
3,256
|
94,945
|
||||||
|
Pilgrim’s Pride Corporation (a)
|
729
|
17,467
|
||||||
|
The Simply Good Foods Company (a)
|
2,822
|
97,500
|
||||||
|
990,864
|
||||||||
|
Health Care Equipment & Supplies – 0.43%
|
||||||||
|
ABIOMED, Inc. (a)
|
178
|
57,090
|
||||||
|
Boston Scientific Corporation (a)
|
1,879
|
81,925
|
||||||
|
Cardiovascular Systems, Inc. (a)
|
159
|
6,411
|
||||||
|
Danaher Corporation
|
493
|
125,193
|
||||||
|
DENTSPLY SIRONA, Inc.
|
16
|
1,080
|
||||||
|
DexCom, Inc. (a)
|
202
|
77,992
|
||||||
|
Eargo, Inc. (a)
|
485
|
27,761
|
||||||
|
Edwards Lifesciences Corporation (a)
|
1,308
|
124,940
|
||||||
|
Envista Holdings Corporation (a)
|
701
|
30,339
|
||||||
|
Haemonetics Corporation (a)
|
81
|
5,448
|
||||||
|
Inari Medical, Inc. (a)
|
185
|
21,144
|
||||||
|
Intersect ENT, Inc. (a)
|
624
|
13,609
|
||||||
|
iRhythm Technologies, Inc. (a)
|
109
|
8,487
|
||||||
|
LivaNova plc (a)(b)
|
13
|
1,103
|
||||||
|
NeuroPace, Inc. (a)
|
156
|
3,769
|
||||||
|
Outset Medical, Inc. (a)
|
160
|
9,587
|
||||||
|
Penumbra, Inc. (a)
|
16
|
4,896
|
||||||
|
Pulmonx Corporation (a)
|
1,399
|
65,767
|
||||||
|
Quidel Corporation (a)
|
47
|
4,925
|
||||||
|
Silk Road Medical, Inc. (a)
|
113
|
6,909
|
||||||
|
STAAR Surgical Company (a)
|
81
|
11,098
|
||||||
|
Tactile Systems Technology, Inc. (a)
|
73
|
4,183
|
||||||
|
Tandem Diabetes Care, Inc. (a)
|
158
|
14,520
|
||||||
The accompanying notes are an integral part of these financial statements.
13
WEISS ALTERNATIVE MULTI-STRATEGY FUND
Schedule of Investments (Unaudited) – Continued
April 30, 2021
|
Shares
|
Value
|
|||||||
|
Health Care Equipment & Supplies – 0.43% (Continued)
|
||||||||
|
Treace Medical Concepts, Inc. (a)
|
626
|
$
|
19,631
|
|||||
|
ViewRay, Inc. (a)
|
81
|
390
|
||||||
|
Zimmer Biomet Holdings, Inc.
|
295
|
52,262
|
||||||
|
780,459
|
||||||||
|
Health Care Providers & Services – 0.10%
|
||||||||
|
Amedisys, Inc. (a)
|
43
|
11,603
|
||||||
|
Aveanna Healthcare Holdings, Inc. (a)
|
3,402
|
39,736
|
||||||
|
Centene Corporation (a)
|
162
|
10,002
|
||||||
|
Cigna Corporation
|
4
|
996
|
||||||
|
CVS Health Corporation
|
12
|
917
|
||||||
|
Guardant Health, Inc. (a)
|
16
|
2,543
|
||||||
|
Humana, Inc.
|
178
|
79,253
|
||||||
|
Oak Street Health, Inc. (a)
|
219
|
13,497
|
||||||
|
Option Care Health, Inc. (a)
|
835
|
15,932
|
||||||
|
The Pennant Group, Inc. (a)
|
81
|
3,274
|
||||||
|
177,753
|
||||||||
|
Health Care Technology – 0.14%
|
||||||||
|
Change Healthcare, Inc. (a)
|
10,049
|
230,625
|
||||||
|
Inspire Medical Systems, Inc. (a)
|
81
|
19,182
|
||||||
|
249,807
|
||||||||
|
Hotels, Restaurants & Leisure – 1.78%
|
||||||||
|
Aramark
|
3,517
|
136,706
|
||||||
|
Bally’s Corporation (a)
|
2,776
|
160,897
|
||||||
|
Basic-Fit NV (a)(b)
|
1,215
|
54,695
|
||||||
|
Booking Holdings, Inc. (a)
|
101
|
249,074
|
||||||
|
Brinker International, Inc. (a)
|
3,034
|
203,672
|
||||||
|
Caesars Entertainment, Inc. (a)
|
1,212
|
118,582
|
||||||
|
Cedar Fair LP (a)
|
3,667
|
180,966
|
||||||
|
Choice Hotels International, Inc. (a)
|
732
|
83,302
|
||||||
|
Darden Restaurants, Inc.
|
836
|
122,658
|
||||||
|
DraftKings, Inc., Class A (a)
|
669
|
37,905
|
||||||
|
Expedia Group, Inc. (a)
|
1,474
|
259,763
|
||||||
|
Extended Stay America, Inc.
|
3,082
|
61,301
|
||||||
|
Hilton Grand Vacations, Inc. (a)
|
1,291
|
57,527
|
||||||
|
Hilton Worldwide Holdings, Inc. (a)
|
350
|
45,045
|
||||||
|
Las Vegas Sands Corporation (a)(h)
|
3,942
|
241,487
|
||||||
|
Marriott International, Inc., Class A (a)
|
7
|
1,040
|
||||||
|
Marriott Vacations Worldwide Corporation (a)
|
825
|
146,545
|
||||||
|
McDonald’s Corporation
|
741
|
174,935
|
||||||
The accompanying notes are an integral part of these financial statements.
14
WEISS ALTERNATIVE MULTI-STRATEGY FUND
Schedule of Investments (Unaudited) – Continued
April 30, 2021
|
Shares
|
Value
|
|||||||
|
Hotels, Restaurants & Leisure – 1.78% (Continued)
|
||||||||
|
MGM Resorts International
|
1,056
|
$
|
42,959
|
|||||
|
Norwegian Cruise Line Holdings Ltd. (a)
|
1,298
|
40,303
|
||||||
|
Restaurant Brands International, Inc.(b)
|
2,037
|
139,758
|
||||||
|
Royal Caribbean Cruises Ltd. (a)(h)
|
163
|
14,173
|
||||||
|
Scientific Games Corporation (a)
|
2,319
|
135,708
|
||||||
|
SeaWorld Entertainment, Inc. (a)
|
1,746
|
95,611
|
||||||
|
Six Flags Entertainment Corporation (a)
|
1,127
|
52,946
|
||||||
|
Texas Roadhouse, Inc. (a)
|
483
|
51,691
|
||||||
|
Travel + Leisure Company
|
2,020
|
130,351
|
||||||
|
The Wendy’s Company
|
2,417
|
54,552
|
||||||
|
Wyndham Hotels & Resorts, Inc.
|
492
|
35,970
|
||||||
|
Wynn Resorts Ltd. (a)
|
581
|
74,600
|
||||||
|
3,204,722
|
||||||||
|
Household Durables – 0.18%
|
||||||||
|
D.R. Horton, Inc.
|
223
|
21,919
|
||||||
|
Installed Building Products, Inc.
|
52
|
7,002
|
||||||
|
Meritage Homes Corporation (a)
|
381
|
40,534
|
||||||
|
Mohawk Industries, Inc. (a)
|
81
|
16,645
|
||||||
|
Newell Brands, Inc.
|
5,503
|
148,361
|
||||||
|
TopBuild Corporation (a)
|
76
|
16,901
|
||||||
|
Vizio Holding Corporation, Class A (a)
|
1,026
|
26,378
|
||||||
|
Whirlpool Corporation
|
164
|
38,778
|
||||||
|
316,518
|
||||||||
|
Household Products – 0.16%
|
||||||||
|
Energizer Holdings, Inc.
|
1,866
|
91,993
|
||||||
|
Kimberly-Clark Corporation
|
324
|
43,274
|
||||||
|
Spectrum Brands Holdings, Inc.
|
1,699
|
149,750
|
||||||
|
285,017
|
||||||||
|
Industrial Conglomerates – 0.16%
|
||||||||
|
General Electric Company
|
112
|
1,469
|
||||||
|
Roper Technologies, Inc.
|
121
|
54,019
|
||||||
|
Siemens AG – Reg (b)
|
428
|
71,406
|
||||||
|
Toshiba Corporation (b)
|
3,940
|
162,845
|
||||||
|
289,739
|
||||||||
|
Insurance – 0.43%
|
||||||||
|
Aegon NV (b)
|
30,840
|
142,923
|
||||||
|
Allianz SE – Reg (b)
|
356
|
92,424
|
||||||
|
The Allstate Corporation
|
9
|
1,141
|
||||||
|
American International Group, Inc.
|
22
|
1,066
|
||||||
The accompanying notes are an integral part of these financial statements.
15
WEISS ALTERNATIVE MULTI-STRATEGY FUND
Schedule of Investments (Unaudited) – Continued
April 30, 2021
|
Shares
|
Value
|
|||||||
|
Insurance – 0.43% (Continued)
|
||||||||
|
The Hartford Financial Services Group, Inc.
|
489
|
$
|
32,254
|
|||||
|
International General Insurance Holdings Ltd. (b)
|
29,450
|
252,681
|
||||||
|
Lincoln National Corporation
|
19
|
1,219
|
||||||
|
MetLife, Inc.
|
8
|
509
|
||||||
|
NN Group NV (b)
|
1,109
|
55,316
|
||||||
|
Principal Financial Group, Inc.
|
17
|
1,086
|
||||||
|
Syncora Holdings Ltd. (a)
|
2,808
|
758
|
||||||
|
Willis Towers Watson plc (b)
|
737
|
190,780
|
||||||
|
772,157
|
||||||||
|
Interactive Media & Services – 0.86%
|
||||||||
|
Alphabet, Inc., Class A (a)
|
319
|
750,766
|
||||||
|
Baidu, Inc. – ADR (a)(b)
|
56
|
11,779
|
||||||
|
Bumble, Inc., Class A (a)
|
7
|
422
|
||||||
|
Facebook, Inc., Class A (a)
|
745
|
242,185
|
||||||
|
Match Group, Inc. (a)
|
928
|
144,425
|
||||||
|
Pinterest, Inc., Class A (a)
|
1,093
|
72,542
|
||||||
|
QuinStreet, Inc. (a)
|
4,150
|
84,120
|
||||||
|
Snap, Inc., Class A (a)
|
1,563
|
96,625
|
||||||
|
TripAdvisor, Inc. (a)(h)
|
2,593
|
122,208
|
||||||
|
Twitter, Inc. (a)
|
259
|
14,302
|
||||||
|
Yelp, Inc. (a)
|
22
|
865
|
||||||
|
Zillow Group, Inc., Class C (a)
|
112
|
14,573
|
||||||
|
1,554,812
|
||||||||
|
Internet & Direct Marketing Retail – 0.49%
|
||||||||
|
Alibaba Group Holding Ltd. – ADR (a)(b)
|
262
|
60,509
|
||||||
|
Amazon.com, Inc. (a)
|
216
|
748,963
|
||||||
|
Coupang, Inc. (a)(b)
|
664
|
27,822
|
||||||
|
MercadoLibre, Inc. (a)(b)
|
21
|
32,990
|
||||||
|
Overstock.com, Inc. (a)
|
202
|
16,463
|
||||||
|
886,747
|
||||||||
|
IT Services – 2.55%
|
||||||||
|
Accenture plc, Class A (b)
|
810
|
234,876
|
||||||
|
Akamai Technologies, Inc. (a)
|
1,093
|
118,809
|
||||||
|
Cognizant Technology Solutions Corporation, Class A
|
2,939
|
236,296
|
||||||
|
Concentrix Corporation (a)
|
1,065
|
165,480
|
||||||
|
Conduent, Inc. (a)
|
5,225
|
35,530
|
||||||
|
DXC Technology Company (a)
|
13,325
|
438,526
|
||||||
|
Euronet Worldwide, Inc. (a)
|
1,771
|
254,015
|
||||||
|
Fidelity National Information Services, Inc.
|
2,887
|
441,422
|
||||||
The accompanying notes are an integral part of these financial statements.
16
WEISS ALTERNATIVE MULTI-STRATEGY FUND
Schedule of Investments (Unaudited) – Continued
April 30, 2021
|
Shares
|
Value
|
|||||||
|
IT Services – 2.55% (Continued)
|
||||||||
|
Fiserv, Inc. (a)
|
2,659
|
$
|
319,399
|
|||||
|
FleetCor Technologies, Inc. (a)
|
3
|
863
|
||||||
|
Global Payments, Inc.
|
1,491
|
320,013
|
||||||
|
LiveRamp Holdings, Inc. (a)
|
6,459
|
316,362
|
||||||
|
Nexi SpA (a)(b)
|
10,876
|
208,335
|
||||||
|
Okta, Inc. (a)
|
531
|
143,211
|
||||||
|
Pagseguro Digital Ltd., Class A (a)(b)
|
4,147
|
189,684
|
||||||
|
PayPal Holdings, Inc. (a)
|
171
|
44,852
|
||||||
|
Sabre Corporation (a)
|
4,416
|
66,152
|
||||||
|
Shift4 Payments, Inc., Class A (a)
|
1,280
|
126,579
|
||||||
|
Shopify, Inc., Class A (a)(b)
|
14
|
16,555
|
||||||
|
Square, Inc., Class A (a)
|
106
|
25,951
|
||||||
|
StoneCo Ltd., Class A (a)(b)
|
3,241
|
209,498
|
||||||
|
Twilio, Inc., Class A (a)
|
643
|
236,495
|
||||||
|
Visa, Inc., Class A
|
1,891
|
441,662
|
||||||
|
4,590,565
|
||||||||
|
Leisure Products – 0.03%
|
||||||||
|
Brunswick Corporation
|
243
|
25,910
|
||||||
|
Callaway Golf Company (a)
|
843
|
24,405
|
||||||
|
Old PSG Wind-Down Ltd. (a)(b)(g)
|
2,127
|
202
|
||||||
|
50,517
|
||||||||
|
Life Sciences Tools & Services – 0.33%
|
||||||||
|
Adaptive Biotechnologies Corporation (a)
|
6
|
250
|
||||||
|
Berkeley Lights, Inc. (a)
|
419
|
20,577
|
||||||
|
Fluidigm Corporation (a)
|
139
|
696
|
||||||
|
ICON plc (a)(b)
|
1,196
|
259,472
|
||||||
|
Illumina, Inc. (a)
|
2
|
786
|
||||||
|
NanoString Technologies, Inc. (a)
|
258
|
20,555
|
||||||
|
Pacific Biosciences of California, Inc. (a)
|
445
|
13,283
|
||||||
|
PPD, Inc. (a)
|
3,537
|
163,409
|
||||||
|
PRA Health Sciences, Inc. (a)
|
287
|
47,898
|
||||||
|
Repligen Corporation (a)
|
340
|
71,981
|
||||||
|
598,907
|
||||||||
|
Machinery – 0.76%
|
||||||||
|
AGCO Corporation
|
705
|
102,874
|
||||||
|
Atlas Copco AB, Class A (b)
|
707
|
42,872
|
||||||
|
Caterpillar, Inc. (h)
|
372
|
84,857
|
||||||
|
Crane Company
|
10
|
941
|
||||||
|
Deere & Company
|
626
|
232,152
|
||||||
The accompanying notes are an integral part of these financial statements.
17
WEISS ALTERNATIVE MULTI-STRATEGY FUND
Schedule of Investments (Unaudited) – Continued
April 30, 2021
|
Shares
|
Value
|
|||||||
|
Machinery – 0.76% (Continued)
|
||||||||
|
Dover Corporation
|
331
|
$
|
49,382
|
|||||
|
Evoqua Water Technologies Corporation (a)
|
3,689
|
105,432
|
||||||
|
The ExOne Company (a)
|
94
|
2,185
|
||||||
|
Hydrofarm Holdings Group, Inc. (a)
|
79
|
5,190
|
||||||
|
Illinois Tool Works, Inc.
|
216
|
49,779
|
||||||
|
Ingersoll Rand, Inc. (a)
|
1,933
|
95,509
|
||||||
|
The Middleby Corporation (a)
|
193
|
34,995
|
||||||
|
Navistar International Corporation (a)
|
1,409
|
62,348
|
||||||
|
Nordson Corporation
|
81
|
17,124
|
||||||
|
Oshkosh Corporation
|
11
|
1,369
|
||||||
|
Otis Worldwide Corporation
|
617
|
48,046
|
||||||
|
PACCAR, Inc.
|
518
|
46,558
|
||||||
|
Parker-Hannifin Corporation
|
354
|
111,089
|
||||||
|
Rexnord Corporation
|
1,368
|
68,304
|
||||||
|
Stanley Black & Decker, Inc.
|
216
|
44,662
|
||||||
|
Terex Corporation
|
507
|
23,824
|
||||||
|
The Timken Company
|
447
|
37,490
|
||||||
|
Welbilt, Inc. (a)
|
2,894
|
64,652
|
||||||
|
Woodward, Inc.
|
258
|
32,253
|
||||||
|
1,363,887
|
||||||||
|
Marine – 0.07%
|
||||||||
|
Kirby Corporation (a)
|
1,853
|
118,036
|
||||||
|
Media – 0.77%
|
||||||||
|
Altice USA, Inc., Class A (a)
|
1,611
|
58,495
|
||||||
|
Audacy, Inc. (a)
|
6,413
|
31,039
|
||||||
|
Comcast Corporation, Class A
|
1,209
|
67,885
|
||||||
|
comScore, Inc. (a)
|
106,679
|
393,645
|
||||||
|
Criteo SA – ADR (a)(b)
|
5,211
|
207,033
|
||||||
|
Discovery, Inc., Class A (a)
|
3,743
|
140,961
|
||||||
|
DISH Network Corporation, Class A (a)
|
2,226
|
99,703
|
||||||
|
Fox Corporation, Class A
|
2,924
|
109,416
|
||||||
|
Gray Television, Inc.
|
1,610
|
32,715
|
||||||
|
iHeartMedia, Inc., Class A (a)
|
3,392
|
64,923
|
||||||
|
Nexstar Media Group, Inc., Class A
|
161
|
23,733
|
||||||
|
Shaw Communications, Inc., Class B (b)
|
1,417
|
40,994
|
||||||
|
Sinclair Broadcast Group, Inc., Class A
|
806
|
26,171
|
||||||
|
TEGNA, Inc.
|
3,178
|
63,751
|
||||||
|
ViacomCBS, Inc., Class B
|
484
|
19,854
|
||||||
|
1,380,318
|
||||||||
The accompanying notes are an integral part of these financial statements.
18
WEISS ALTERNATIVE MULTI-STRATEGY FUND
Schedule of Investments (Unaudited) – Continued
April 30, 2021
|
Shares
|
Value
|
|||||||
|
Metals & Mining – 0.55%
|
||||||||
|
ArcelorMittal SA – Reg (a)(b)
|
7,830
|
$
|
229,341
|
|||||
|
Barrick Gold Corporation (a)(b)
|
948
|
20,145
|
||||||
|
Freeport-McMoRan, Inc. (h)
|
11,256
|
424,464
|
||||||
|
Steel Dynamics, Inc.
|
21
|
1,138
|
||||||
|
Vale SA – ADR (b)
|
15,248
|
306,790
|
||||||
|
981,878
|
||||||||
|
Multiline Retail – 0.07%
|
||||||||
|
Dollar General Corporation
|
389
|
83,538
|
||||||
|
Target Corporation
|
238
|
49,328
|
||||||
|
132,866
|
||||||||
|
Oil, Gas & Consumable Fuels – 2.57%
|
||||||||
|
Antero Resources Corporation (a)
|
28,506
|
257,124
|
||||||
|
APA Corporation
|
60
|
1,200
|
||||||
|
Chevron Corporation
|
7
|
722
|
||||||
|
Cimarex Energy Company
|
6,167
|
408,255
|
||||||
|
ConocoPhillips (h)
|
1,029
|
52,623
|
||||||
|
Devon Energy Corporation
|
18,267
|
427,083
|
||||||
|
Diamondback Energy, Inc.
|
18
|
1,471
|
||||||
|
Exxon Mobil Corporation
|
7,773
|
444,927
|
||||||
|
Hess Corporation
|
14
|
1,043
|
||||||
|
Kinder Morgan, Inc.
|
48
|
818
|
||||||
|
Marathon Oil Corporation
|
35,678
|
401,734
|
||||||
|
Marathon Petroleum Corporation
|
3,920
|
218,148
|
||||||
|
Matador Resources Company
|
13,986
|
367,972
|
||||||
|
Northern Oil and Gas, Inc. (a)
|
22,919
|
331,867
|
||||||
|
Occidental Petroleum Corporation
|
16,811
|
426,327
|
||||||
|
Ovintiv, Inc.
|
17,957
|
429,711
|
||||||
|
PBF Energy, Inc., Class A (a)(h)
|
2,756
|
39,080
|
||||||
|
PDC Energy, Inc. (a)
|
10,914
|
398,470
|
||||||
|
Phillips 66
|
10
|
809
|
||||||
|
Pioneer Natural Resources Company
|
7
|
1,077
|
||||||
|
Royal Dutch Shell plc, Class A – ADR (b)
|
402
|
15,276
|
||||||
|
Suncor Energy, Inc. (b)
|
3,637
|
77,905
|
||||||
|
Valero Energy Corporation
|
4,226
|
312,555
|
||||||
|
The Williams Companies. Inc.
|
30
|
731
|
||||||
|
World Fuel Services Corporation
|
322
|
9,959
|
||||||
|
4,626,887
|
||||||||
The accompanying notes are an integral part of these financial statements.
19
WEISS ALTERNATIVE MULTI-STRATEGY FUND
Schedule of Investments (Unaudited) – Continued
April 30, 2021
|
Shares
|
Value
|
|||||||
|
Paper & Forest Products – 0.14%
|
||||||||
|
Interfor Corporation (a)(b)
|
820
|
$
|
21,795
|
|||||
|
Louisiana-Pacific Corporation
|
405
|
26,681
|
||||||
|
West Fraiser Timber Company Ltd. (b)
|
2,557
|
197,733
|
||||||
|
246,209
|
||||||||
|
Personal Products – 0.13%
|
||||||||
|
BellRing Brands, Inc., Class A (a)
|
1,996
|
51,477
|
||||||
|
Coty, Inc., Class A (a)
|
93
|
931
|
||||||
|
e.l.f. Beauty, Inc. (a)
|
3,441
|
104,090
|
||||||
|
The Estee Lauder Companies, Inc., Class A (h)
|
225
|
70,605
|
||||||
|
227,103
|
||||||||
|
Pharmaceuticals – 0.57%
|
||||||||
|
Aerie Pharmaceuticals, Inc. (a)
|
85
|
1,456
|
||||||
|
AstraZeneca plc – ADR (b)
|
571
|
30,303
|
||||||
|
Axsome Therapeutics, Inc. (a)
|
202
|
12,213
|
||||||
|
Ayr Wellness, Inc. (a)(b)
|
1,826
|
53,392
|
||||||
|
Bristol Myers-Squibb Company
|
1,691
|
105,552
|
||||||
|
Catalent, Inc. (a)
|
193
|
21,707
|
||||||
|
Cresco Labs, Inc. CA (a)
|
2,073
|
27,052
|
||||||
|
Cresco Labs, Inc. (a)
|
6,606
|
85,878
|
||||||
|
Curaleaf Holdings, Inc. (a)
|
2,163
|
30,532
|
||||||
|
Eli Lilly & Company
|
322
|
58,852
|
||||||
|
Green Thumb Industries, Inc. (a)
|
5,164
|
165,248
|
||||||
|
Green Thumb Industries, Inc. CA (a)
|
4,391
|
139,537
|
||||||
|
Harmony Biosciences Holdings, Inc. (a)
|
48
|
1,406
|
||||||
|
Horizon Therapeutics plc (a)
|
640
|
60,557
|
||||||
|
Intra-Cellular Therapies, Inc. (a)
|
323
|
11,121
|
||||||
|
Merck & Company, Inc.
|
194
|
14,453
|
||||||
|
TherapeuticsMD, Inc. (a)
|
2,849
|
3,447
|
||||||
|
Reata Pharmaceuticals, Inc., Class A (a)
|
44
|
4,462
|
||||||
|
Relmada Therapeutics, Inc. (a)
|
77
|
2,969
|
||||||
|
Viatris, Inc. (a)
|
55
|
732
|
||||||
|
Zoetis, Inc.
|
1,057
|
182,893
|
||||||
|
Zogenix, Inc. (a)
|
434
|
8,198
|
||||||
|
1,021,960
|
||||||||
|
Professional Services – 0.30%
|
||||||||
|
CACI International, Inc., Class A (a)
|
4
|
1,019
|
||||||
|
IHS Markit Ltd. (b)
|
4,928
|
530,154
|
||||||
|
Leidos Holdings, Inc.
|
9
|
911
|
||||||
|
Nielsen Holdings plc
|
39
|
1,001
|
||||||
|
533,085
|
||||||||
The accompanying notes are an integral part of these financial statements.
20
WEISS ALTERNATIVE MULTI-STRATEGY FUND
Schedule of Investments (Unaudited) – Continued
April 30, 2021
|
Shares
|
Value
|
|||||||
|
Real Estate Investment Trusts (REITs) – 6.87%
|
||||||||
|
Acadia Realty Trust
|
24,294
|
$
|
507,502
|
|||||
|
AFC Gamma, Inc. (a)(b)
|
6,292
|
142,954
|
||||||
|
Agree Realty Corporation
|
2,447
|
172,171
|
||||||
|
Alexandria Real Estate Equities, Inc.
|
2,337
|
423,231
|
||||||
|
Americold Realty Trust
|
15,401
|
622,046
|
||||||
|
Spirit Realty Capital, Inc.
|
7,752
|
368,530
|
||||||
|
AvalonBay Communities, Inc.
|
2,213
|
424,896
|
||||||
|
Brixmor Property Group, Inc.
|
14,837
|
331,458
|
||||||
|
CareTrust REIT, Inc.
|
7,652
|
185,025
|
||||||
|
Corporate Office Properties Trust
|
9,866
|
276,643
|
||||||
|
Duke Realty Corporation
|
1,936
|
90,063
|
||||||
|
Equity LifeStyle Properties, Inc.
|
4,490
|
311,606
|
||||||
|
Equity Residential
|
5,686
|
422,072
|
||||||
|
First Industrial Realty Trust, Inc.
|
2,781
|
138,410
|
||||||
|
Gaming and Leisure Properties, Inc.
|
3,594
|
167,085
|
||||||
|
Host Hotels & Resorts, Inc. (a)
|
1,161
|
21,084
|
||||||
|
Invitation Homes, Inc.
|
8,815
|
309,054
|
||||||
|
Kilroy Realty Corporation
|
5,887
|
403,495
|
||||||
|
Medical Properties Trust, Inc.
|
26,474
|
583,752
|
||||||
|
Mid-America Apartment Communities, Inc.
|
2,776
|
436,748
|
||||||
|
NETSTREIT Corporation
|
30,347
|
632,128
|
||||||
|
New Senior Investment Group, Inc.
|
15,714
|
104,027
|
||||||
|
Outfront Media, Inc. (a)
|
2,212
|
53,906
|
||||||
|
Paramount Group, Inc.
|
18,385
|
195,065
|
||||||
|
Park Hotels & Resorts, Inc. (a)
|
230
|
5,131
|
||||||
|
Piedmont Office Realty Trust, Inc., Class A
|
32,956
|
613,641
|
||||||
|
Plymouth Industrial REIT, Inc.
|
10,239
|
190,855
|
||||||
|
QTS Realty Trust, Inc., Class A
|
1,787
|
118,817
|
||||||
|
Realty Income Corporation
|
5,167
|
357,298
|
||||||
|
RPT Realty
|
36,783
|
467,512
|
||||||
|
Sabra Health Care REIT, Inc.
|
25,476
|
462,899
|
||||||
|
Simon Property Group, Inc.
|
336
|
40,905
|
||||||
|
SITE Centers Corporation
|
26,009
|
383,633
|
||||||
|
Sun Communities, Inc.
|
465
|
77,576
|
||||||
|
Terreno Realty Corporation
|
6,460
|
416,799
|
||||||
|
UDR, Inc.
|
5,513
|
256,079
|
||||||
|
Ventas, Inc.
|
10,084
|
559,259
|
||||||
|
VEREIT, Inc.
|
9,835
|
470,506
|
||||||
|
VICI Properties, Inc.
|
2,025
|
64,192
|
||||||
|
Weingarten Realty Investors
|
15,572
|
503,598
|
||||||
|
Weyerhaeuser Company
|
1,377
|
53,386
|
||||||
|
12,365,037
|
||||||||
The accompanying notes are an integral part of these financial statements.
21
WEISS ALTERNATIVE MULTI-STRATEGY FUND
Schedule of Investments (Unaudited) – Continued
April 30, 2021
|
Shares
|
Value
|
|||||||
|
Real Estate Management & Development – 0.07%
|
||||||||
|
Brookfield Property Partners LP
|
6,725
|
$
|
120,983
|
|||||
|
CBRE Group, Inc., Class A (a)
|
14
|
1,193
|
||||||
|
122,176
|
||||||||
|
Road & Rail – 1.65%
|
||||||||
|
Canadian National Railway Company (b)
|
43
|
4,629
|
||||||
|
Canadian Pacific Railway Ltd. (b)
|
1,033
|
385,443
|
||||||
|
CSX Corporation
|
1,381
|
139,136
|
||||||
|
Heartland Express, Inc.
|
1,074
|
19,966
|
||||||
|
Kansas City Southern
|
5,020
|
1,466,894
|
||||||
|
Knight-Swift Transportation Holdings, Inc.
|
477
|
22,476
|
||||||
|
Lyft, Inc., Class A (a)
|
66
|
3,674
|
||||||
|
Norfolk Southern Corporation
|
765
|
213,619
|
||||||
|
Old Dominion Freight Line, Inc.
|
720
|
185,623
|
||||||
|
Ryder System, Inc.
|
8
|
639
|
||||||
|
Saia, Inc. (a)
|
149
|
34,941
|
||||||
|
Schneider National, Inc., Class B
|
725
|
17,567
|
||||||
|
TFI International, Inc.
|
373
|
32,693
|
||||||
|
Uber Technologies, Inc. (a)(h)
|
1,626
|
89,056
|
||||||
|
Union Pacific Corporation
|
616
|
136,807
|
||||||
|
Werner Enterprises, Inc.
|
1,127
|
52,101
|
||||||
|
Yellow Corporation (a)
|
18,272
|
167,554
|
||||||
|
2,972,818
|
||||||||
|
Semiconductors & Semiconductor Equipment – 2.31%
|
||||||||
|
Advanced Micro Devices, Inc. (a)
|
563
|
45,952
|
||||||
|
Ambarella, Inc. (a)
|
562
|
54,789
|
||||||
|
Applied Materials, Inc. (h)
|
960
|
127,402
|
||||||
|
ASML Holding NV – Reg (b)
|
203
|
131,564
|
||||||
|
Broadcom, Inc.
|
81
|
36,952
|
||||||
|
Ichor Holdings Ltd. (a)
|
1,127
|
62,853
|
||||||
|
Intel Corporation
|
3,140
|
180,644
|
||||||
|
Kulicke & Soffa Industries, Inc. (b)
|
1,376
|
78,226
|
||||||
|
Lam Research Corporation
|
145
|
89,965
|
||||||
|
Magnachip Semiconductor Corporation (a)(b)
|
16,064
|
401,761
|
||||||
|
Marvell Technology, Inc.
|
6,435
|
290,946
|
||||||
|
Maxim Integrated Products, Inc.
|
4,452
|
418,488
|
||||||
|
Microchip Technology, Inc.
|
1,544
|
232,048
|
||||||
|
Micron Technology, Inc. (a)
|
6,600
|
568,062
|
||||||
|
NVIDIA Corporation
|
266
|
159,701
|
||||||
|
NXP Semiconductors NV (b)
|
1,535
|
295,503
|
||||||
|
ON Semiconductor Corporation (a)
|
1,259
|
49,101
|
||||||
The accompanying notes are an integral part of these financial statements.
22
WEISS ALTERNATIVE MULTI-STRATEGY FUND
Schedule of Investments (Unaudited) – Continued
April 30, 2021
|
Shares
|
Value
|
|||||||
|
Semiconductors & Semiconductor Equipment – 2.31% (Continued)
|
||||||||
|
QUALCOMM, Inc.
|
169
|
$
|
23,457
|
|||||
|
Silicon Laboratories, Inc. (a)
|
162
|
22,834
|
||||||
|
Skyworks Solutions, Inc.
|
259
|
46,965
|
||||||
|
Synaptics, Inc. (a)
|
1,449
|
202,672
|
||||||
|
Taiwan Semiconductor Manufacturing Company Ltd. – ADR (b)
|
1,150
|
134,251
|
||||||
|
Ultra Clean Holdings, Inc. (a)
|
2,106
|
107,553
|
||||||
|
Xilinx, Inc.
|
3,126
|
400,003
|
||||||
|
4,161,692
|
||||||||
|
Software – 3.86%
|
||||||||
|
Adobe, Inc. (a)
|
347
|
176,394
|
||||||
|
AppLovin Corporation, Class A (a)
|
897
|
52,035
|
||||||
|
Aspen Technology, Inc. (a)
|
308
|
40,299
|
||||||
|
Atlassian Corporation plc, Class A (a)(b)
|
235
|
55,827
|
||||||
|
Autodesk, Inc. (a)
|
113
|
32,986
|
||||||
|
Avalara, Inc. (a)
|
81
|
11,478
|
||||||
|
Avaya Holdings Corporation (a)(h)
|
4,589
|
132,025
|
||||||
|
BlackBerry Ltd. (a)(b)
|
161
|
1,422
|
||||||
|
Cadence Design Systems, Inc. (a)
|
564
|
74,318
|
||||||
|
Cloudera, Inc. (a)
|
1,536
|
19,492
|
||||||
|
Cognyte Software Ltd. (a)(b)
|
3,807
|
99,477
|
||||||
|
CommVault Systems, Inc. (a)
|
1,853
|
128,802
|
||||||
|
Cornerstone OnDemand, Inc. (a)
|
962
|
42,583
|
||||||
|
Coupa Software, Inc. (a)
|
105
|
28,249
|
||||||
|
Crowdstrike Holdings, Inc., Class A (a)
|
1,107
|
230,821
|
||||||
|
CyberArk Software Ltd. (a)(b)
|
2,303
|
323,571
|
||||||
|
The Descartes Systems Group, Inc. (a)(b)
|
160
|
10,250
|
||||||
|
Domo, Inc., Class B (a)
|
2,828
|
181,812
|
||||||
|
Elastic NV (a)
|
202
|
24,365
|
||||||
|
FireEye, Inc. (a)
|
8,748
|
173,866
|
||||||
|
Five9, Inc. (a)
|
156
|
28,446
|
||||||
|
Fortinet, Inc. (a)
|
138
|
28,184
|
||||||
|
HubSpot, Inc. (a)
|
307
|
161,620
|
||||||
|
Intuit, Inc.
|
202
|
83,256
|
||||||
|
Lightspeed POS, Inc. (a)(b)
|
1,357
|
94,732
|
||||||
|
Manhattan Associates, Inc. (a)
|
1,178
|
161,669
|
||||||
|
Microsoft Corporation
|
1,608
|
405,505
|
||||||
|
NortonLifeLock, Inc.
|
1,471
|
31,788
|
||||||
|
Nuance Communications, Inc. (a)
|
4,330
|
230,226
|
||||||
|
Oracle Corporation (h)
|
448
|
33,954
|
||||||
|
Palo Alto Networks, Inc. (a)
|
1,670
|
590,161
|
||||||
The accompanying notes are an integral part of these financial statements.
23
WEISS ALTERNATIVE MULTI-STRATEGY FUND
Schedule of Investments (Unaudited) – Continued
April 30, 2021
|
Shares
|
Value
|
|||||||
|
Software – 3.86% (Continued)
|
||||||||
|
Paycom Software, Inc. (a)
|
843
|
$
|
324,058
|
|||||
|
Proofpoint, Inc. (a)
|
1,225
|
210,835
|
||||||
|
PROS Holdings, Inc. (a)
|
808
|
34,728
|
||||||
|
RingCentral, Inc., Class A (a)
|
153
|
48,799
|
||||||
|
SailPoint Technologies Holdings, Inc. (a)
|
563
|
27,491
|
||||||
|
salesforce.com, Inc. (a)
|
878
|
202,221
|
||||||
|
ServiceNow, Inc. (a)
|
226
|
114,440
|
||||||
|
Slack Technologies, Inc., Class A (a)
|
35,837
|
1,519,489
|
||||||
|
Smartsheet, Inc., Class A (a)
|
810
|
48,033
|
||||||
|
Splunk, Inc. (a)
|
137
|
17,320
|
||||||
|
Synopsys, Inc. (a)
|
273
|
67,447
|
||||||
|
Talend SA – ADR (a)
|
3,331
|
214,550
|
||||||
|
Tenable Holdings, Inc. (a)
|
547
|
20,510
|
||||||
|
Tufin Software Technologies Ltd. (a)(b)
|
6,193
|
56,976
|
||||||
|
UiPath, Inc., Class A (a)
|
161
|
11,592
|
||||||
|
Varonis Systems, Inc. (a)
|
806
|
42,678
|
||||||
|
Verint Systems, Inc. (a)
|
727
|
35,310
|
||||||
|
Workday, Inc., Class A (a)
|
462
|
114,114
|
||||||
|
Zendesk, Inc. (a)
|
613
|
89,590
|
||||||
|
Zscaler, Inc. (a)
|
258
|
48,411
|
||||||
|
6,938,205
|
||||||||
|
Special Purpose Acquisition Companies – 0.34%
|
||||||||
|
Aequi Acquisition Corporation, Class A (a)(b)
|
1,800
|
17,712
|
||||||
|
Altaba, Inc. (a)(b)(g)
|
5,796
|
83,752
|
||||||
|
CM Life Sciences, Inc., Class A (a)
|
30,850
|
418,018
|
||||||
|
Landcadia Holdings III, Inc., Class A (a)
|
224
|
2,569
|
||||||
|
Thoma Bravo Advantage, Class A (a)
|
7,312
|
79,920
|
||||||
|
601,971
|
||||||||
|
Specialty Retail – 0.20%
|
||||||||
|
Advance Auto Parts, Inc.
|
322
|
64,451
|
||||||
|
Asbury Automotive Group, Inc. (a)
|
32
|
6,356
|
||||||
|
CarMax, Inc. (a)
|
675
|
89,937
|
||||||
|
Carvana Company (a)
|
97
|
27,670
|
||||||
|
Citi Trends, Inc. (a)
|
639
|
66,839
|
||||||
|
Gamestop Corporation, Class A (a)
|
2
|
347
|
||||||
|
The Home Depot, Inc.
|
89
|
28,807
|
||||||
|
L Brands, Inc. (a)
|
251
|
16,541
|
||||||
|
Lithia Motors, Inc., Class A
|
31
|
11,916
|
||||||
|
Lowe’s Companies, Inc.
|
130
|
25,512
|
||||||
The accompanying notes are an integral part of these financial statements.
24
WEISS ALTERNATIVE MULTI-STRATEGY FUND
Schedule of Investments (Unaudited) – Continued
April 30, 2021
|
Shares
|
Value
|
|||||||
|
Specialty Retail – 0.20% (Continued)
|
||||||||
|
RH (a)
|
29
|
$
|
19,953
|
|||||
|
Ross Stores, Inc.
|
8
|
1,048
|
||||||
|
359,377
|
||||||||
|
Technology Hardware, Storage & Peripherals – 0.38%
|
||||||||
|
3D Systems Corporation (a)
|
405
|
8,724
|
||||||
|
Apple, Inc. (h)
|
2,132
|
280,273
|
||||||
|
Dell Technologies, Inc., Class C (a)
|
354
|
34,809
|
||||||
|
Hewlett Packard Enterprise Company
|
1,205
|
19,304
|
||||||
|
NCR Corporation (a)
|
7,523
|
344,177
|
||||||
|
NetApp, Inc.
|
17
|
1,270
|
||||||
|
Western Digital Corporation (a)
|
20
|
1,412
|
||||||
|
689,969
|
||||||||
|
Textiles, Apparel & Luxury Goods – 0.03%
|
||||||||
|
Columbia Sportswear Corporation
|
8
|
872
|
||||||
|
PVH Corporation (a)
|
12
|
1,358
|
||||||
|
Ralph Lauren Corporation (a)
|
334
|
44,519
|
||||||
|
Tapestry, Inc. (a)
|
33
|
1,579
|
||||||
|
Under Armour, Inc., Class A (a)
|
43
|
1,045
|
||||||
|
49,373
|
||||||||
|
Thrifts & Mortgage Finance – 0.14%
|
||||||||
|
Mr Cooper Group, Inc. (a)
|
3,078
|
106,130
|
||||||
|
New York Community Bancorp, Inc.
|
6,679
|
79,881
|
||||||
|
PennyMac Financial Services, Inc.
|
973
|
58,584
|
||||||
|
244,595
|
||||||||
|
Trading Companies & Distributors – 0.23%
|
||||||||
|
AerCap Holdings NV (a)(b)
|
3,533
|
205,797
|
||||||
|
Fortress Transportation and Infrastructure Investors, LLC
|
605
|
17,085
|
||||||
|
United Rentals, Inc. (a)
|
473
|
151,336
|
||||||
|
WESCO International, Inc. (a)
|
355
|
32,561
|
||||||
|
406,779
|
||||||||
|
Transportation Infrastructure – 0.05%
|
||||||||
|
Aena SME SA (a)(b)
|
170
|
29,545
|
||||||
|
Getlink SE (b)
|
3,298
|
52,463
|
||||||
|
82,008
|
||||||||
|
Water Utilities – 0.02%
|
||||||||
|
Essential Utilities, Inc.
|
896
|
42,228
|
||||||
The accompanying notes are an integral part of these financial statements.
25
WEISS ALTERNATIVE MULTI-STRATEGY FUND
Schedule of Investments (Unaudited) – Continued
April 30, 2021
|
Shares
|
Value
|
|||||||
|
Wireless Communication Services – 0.01%
|
||||||||
|
NII Holdings, Inc. (a)(b)(g)
|
6,235
|
$
|
13,094
|
|||||
|
Wireless Telecommunication Services – 0.06%
|
||||||||
|
Gogo, Inc. (a)
|
657
|
6,846
|
||||||
|
T-Mobile U.S., Inc. (a)
|
833
|
110,064
|
||||||
|
116,910
|
||||||||
|
Total Long Common Stocks
|
||||||||
|
(Cost $70,867,566)
|
73,988,450
|
|||||||
|
LONG CONTINGENT VALUE RIGHTS – 0.00%
|
||||||||
|
A. Menarini Industrie Farmaceutiche Riunite Srl (g)
|
523
|
209
|
||||||
|
Total Long Contingent Value Rights
|
||||||||
|
(Cost $—)
|
209
|
|||||||
|
LONG WARRANTS – 0.06%
|
||||||||
|
Health Care Equipment & Supplies – 0.00%
|
||||||||
|
Valeritas Holdings, Inc. (a)(b)(g)
|
||||||||
|
Exercise Price: $12.00, 11/14/2023
|
1,688
|
—
|
||||||
|
Health Care Technology – 0.00%
|
||||||||
|
Multiplan Corporation
|
||||||||
|
Exercise Price: $25.00, 2/13/2025
|
884
|
1,326
|
||||||
|
Insurance – 0.01%
|
||||||||
|
International General Insurance Holdings Ltd. (b)
|
||||||||
|
Exercise Price: $25.00, 3/17/2025
|
29,450
|
27,830
|
||||||
|
Special Purpose Acquisition Companies – 0.05%
|
||||||||
|
Aequi Acquisition Corporation (b)
|
||||||||
|
Exercise Price: $27.00, 11/30/2027
|
600
|
486
|
||||||
|
CM Life Sciences, Inc.
|
||||||||
|
Exercise Price: $27.00, 9/4/2027
|
20,875
|
85,588
|
||||||
|
86,074
|
||||||||
|
Total Long Warrants
|
||||||||
|
(Cost $95,529)
|
115,230
|
|||||||
|
LONG EXCHANGE TRADED FUNDS – 39.86%
|
||||||||
|
ARK Innovation ETF
|
210
|
25,362
|
||||||
|
Energy Select Sector SPDR Fund
|
4,127
|
203,833
|
||||||
|
Financial Select Sector SPDR Fund
|
3,888
|
140,979
|
||||||
|
Industrial Select Sector SPDR Fund
|
164
|
16,716
|
||||||
The accompanying notes are an integral part of these financial statements.
26
WEISS ALTERNATIVE MULTI-STRATEGY FUND
Schedule of Investments (Unaudited) – Continued
April 30, 2021
|
Shares
|
Value
|
|||||||
|
LONG EXCHANGE TRADED FUNDS – 39.86% (Continued)
|
||||||||
|
Invesco KBW Bank ETF
|
2,093
|
$
|
137,385
|
|||||
|
Invesco QQQ Trust Series 1
|
1,430
|
483,326
|
||||||
|
Invesco S&P 500 Equal Weight ETF
|
647
|
95,937
|
||||||
|
iShares Global Clean Energy ETF
|
1,620
|
37,649
|
||||||
|
iShares iBoxx High Yield Corporate Bond ETF (d)
|
390,978
|
34,187,116
|
||||||
|
iShares iBoxx $ Investment Grade Corporate Bond ETF (d)
|
260,642
|
34,183,198
|
||||||
|
iShares MSCI Brazil ETF
|
3,240
|
115,214
|
||||||
|
iShares MSCI China ETF
|
78
|
6,394
|
||||||
|
iShares MSCI Mexico ETF
|
1,622
|
73,736
|
||||||
|
iShares Russell 2000 ETF
|
3,809
|
856,606
|
||||||
|
ProShares UltraShort 20+ Year Treasury
|
7,065
|
146,033
|
||||||
|
ProShares VIX Short-Term Futures ETF (a)
|
11,352
|
93,427
|
||||||
|
SPDR Gold Shares (a)
|
230
|
38,102
|
||||||
|
SPDR S&P 500 ETF Trust
|
240
|
100,152
|
||||||
|
SPDR S&P Biotech ETF
|
319
|
43,582
|
||||||
|
SPDR S&P Metals & Mining ETF
|
233
|
9,427
|
||||||
|
SPDR S&P Oil & Gas Exploration & Production ETF
|
1,296
|
103,939
|
||||||
|
SPDR S&P Retail ETF
|
1,792
|
166,333
|
||||||
|
United States Oil Fund LP (a)
|
1,069
|
46,256
|
||||||
|
VanEck Vectors Gold Miners ETF
|
2,916
|
100,194
|
||||||
|
VanEck Vectors Junior Gold Miners ETF
|
5,248
|
249,018
|
||||||
|
VanEck Vectors Semiconductor ETF
|
160
|
38,880
|
||||||
|
Total Long Exchange Traded Funds
|
||||||||
|
(Cost $70,454,897)
|
71,698,794
|
|||||||
|
LONG PREFERRED STOCKS – 0.28%
|
||||||||
|
Azul SA (a)(b)
|
2,555
|
54,370
|
||||||
|
Gol Linhas Aereas Inteligentes SA (a)(b)
|
329
|
2,829
|
||||||
|
Volkswagen AG (a)(b)
|
1,720
|
447,821
|
||||||
|
Total Long Preferred Stocks
|
||||||||
|
(Cost $523,883)
|
505,020
|
|||||||
|
Notional
|
||||||||||||
|
PURCHASED OPTIONS – 0.05%
|
Contracts (c)
|
Amount
|
||||||||||
|
Purchased Call Options – 0.02%
|
||||||||||||
|
Apple, Inc. (h)
|
||||||||||||
|
Expiration: April 2021, Exercise Price: $136.00
|
4
|
$
|
52,584
|
2
|
||||||||
|
Expiration: May 2021, Exercise Price: $130.00
|
5
|
65,730
|
1,850
|
|||||||||
|
Autoliv, Inc. (b)(h)
|
||||||||||||
|
Expiration: May 2021, Exercise Price: $110.00
|
3
|
30,198
|
112
|
|||||||||
The accompanying notes are an integral part of these financial statements.
27
WEISS ALTERNATIVE MULTI-STRATEGY FUND
Schedule of Investments (Unaudited) – Continued
April 30, 2021
|
Notional
|
||||||||||||
|
Contracts (c)
|
Amount
|
Value
|
||||||||||
|
Purchased Call Options – 0.02% (Continued)
|
||||||||||||
|
Avaya Holdings Corporation (h)
|
||||||||||||
|
Expiration: July 2021, Exercise Price: $35.00
|
4
|
$
|
11,508
|
$
|
360
|
|||||||
|
Best Buy Company, Inc. (h)
|
||||||||||||
|
Expiration: May 2021, Exercise Price: $125.00
|
3
|
34,881
|
156
|
|||||||||
|
Caterpillar, Inc. (h)
|
||||||||||||
|
Expiration: April 2021, Exercise Price: $232.50
|
16
|
364,976
|
8
|
|||||||||
|
Clever Leaves Holdings, Inc. (b)(h)
|
||||||||||||
|
Expiration: August 2021, Exercise Price: $25.00
|
14
|
14,028
|
105
|
|||||||||
|
ConocoPhillips (h)
|
||||||||||||
|
Expiration: May 2021, Exercise Price: $55.00
|
7
|
35,798
|
451
|
|||||||||
|
Energy Select Sector SPDR Fund
|
||||||||||||
|
Expiration: April 2021, Exercise Price: $49.50
|
5
|
24,695
|
55
|
|||||||||
|
Fastly, Inc.
|
||||||||||||
|
Expiration: May 2021, Exercise Price: $68.00
|
8
|
51,096
|
2,204
|
|||||||||
|
Freeport-McMoRan, Inc. (h)
|
||||||||||||
|
Expiration: May 2021, Exercise Price: $41.00
|
10
|
37,710
|
570
|
|||||||||
|
iPath Series B S&P 500 VIX Short-Term Futures ETN (h)
|
||||||||||||
|
Expiration: May 2021, Exercise Price: $13.00
|
3
|
12,048
|
81
|
|||||||||
|
iShares Silver Trust
|
||||||||||||
|
Expiration: April 2021, Exercise Price: $24.50
|
4
|
9,604
|
2
|
|||||||||
|
Las Vegas Sands Corporation (h)
|
||||||||||||
|
Expiration: May 2021, Exercise Price: $65.00
|
7
|
42,882
|
574
|
|||||||||
|
Expiration: June 2021, Exercise Price: $65.00
|
2
|
12,252
|
363
|
|||||||||
|
LiveRamp Holdings, Inc.
|
||||||||||||
|
Expiration: May 2021, Exercise Price: $50.00
|
16
|
78,368
|
3,680
|
|||||||||
|
Micron Technology, Inc.
|
||||||||||||
|
Expiration: July 2021, Exercise Price: $87.50
|
5
|
43,035
|
2,850
|
|||||||||
|
Oracle Corporation (h)
|
||||||||||||
|
Expiration: May 2021, Exercise Price: $75.00
|
29
|
219,791
|
5,409
|
|||||||||
|
PBF Energy, Inc. (h)
|
||||||||||||
|
Expiration: June 2021, Exercise Price: $15.00
|
65
|
92,170
|
7,962
|
|||||||||
|
Royal Caribbean Cruises Ltd. (h)
|
||||||||||||
|
Expiration: May 2021, Exercise Price: $93.00
|
7
|
60,865
|
970
|
|||||||||
|
SmileDirectClub, Inc.
|
||||||||||||
|
Expiration: May 2021, Exercise Price: $11.00
|
3
|
3,191
|
234
|
|||||||||
|
SPDR S&P Oil & Gas Exploration & Production ETF
|
||||||||||||
|
Expiration: May 2021, Exercise Price: $90.00
|
124
|
994,480
|
9,796
|
|||||||||
|
TripAdvisor, Inc. (h)
|
||||||||||||
|
Expiration: June 2021, Exercise Price: $50.00
|
7
|
32,991
|
1,943
|
|||||||||
The accompanying notes are an integral part of these financial statements.
28
WEISS ALTERNATIVE MULTI-STRATEGY FUND
Schedule of Investments (Unaudited) – Continued
April 30, 2021
|
Notional
|
||||||||||||
|
Contracts (c)
|
Amount
|
Value
|
||||||||||
|
Purchased Call Options – 0.02% (Continued)
|
||||||||||||
|
Uber Technologies, Inc. (h)
|
||||||||||||
|
Expiration: May 2021, Exercise Price: $60.00
|
7
|
$
|
38,339
|
$
|
826
|
|||||||
|
Zynga, Inc. (h)
|
||||||||||||
|
Expiration: May 2021, Exercise Price: $12.00
|
79
|
85,478
|
1,304
|
|||||||||
|
41,867
|
||||||||||||
|
Purchased Put Options – 0.03%
|
||||||||||||
|
AbbVie, Inc. (h)
|
||||||||||||
|
Expiration: May 2021, Exercise Price: $110.00
|
2
|
22,300
|
273
|
|||||||||
|
AMC Entertainment Holdings, Inc. (h)
|
||||||||||||
|
Expiration: May 2021, Exercise Price: $7.00
|
12
|
12,036
|
138
|
|||||||||
|
ARK Genomic Revolution ETF
|
||||||||||||
|
Expiration: May 2021, Exercise Price: $81.00
|
69
|
613,203
|
5,002
|
|||||||||
|
ARK Innovation ETF
|
||||||||||||
|
Expiration: May 2021, Exercise Price: $110.00
|
109
|
1,316,393
|
19,892
|
|||||||||
|
DexCom, Inc. (h)
|
||||||||||||
|
Expiration: May 2021, Exercise Price: $410.00
|
1
|
38,610
|
2,635
|
|||||||||
|
DraftKings, Inc. (h)
|
||||||||||||
|
Expiration: May 2021, Exercise Price: $50.00
|
2
|
11,332
|
208
|
|||||||||
|
Gentex Corporation (h)
|
||||||||||||
|
Expiration: May 2021, Exercise Price: $30.00
|
1
|
3,518
|
5
|
|||||||||
|
iShares iBoxx $ Investment Grade Corporate Bond ETF
|
||||||||||||
|
Expiration: May 2021, Exercise Price: $128.00
|
210
|
2,754,150
|
2,940
|
|||||||||
|
iShares Russell 2000 ETF (h)
|
||||||||||||
|
Expiration: May 2021, Exercise Price: $220.00
|
6
|
134,934
|
1,974
|
|||||||||
|
Las Vegas Sands Corporation
|
||||||||||||
|
Expiration: January 2022, Exercise Price: $60.00
|
14
|
85,764
|
9,835
|
|||||||||
|
The Scotts Miracle-Gro Company (h)
|
||||||||||||
|
Expiration: May 2021, Exercise Price: $210.00
|
4
|
92,464
|
710
|
|||||||||
|
SPDR S&P 500 ETF Trust (h)
|
||||||||||||
|
Expiration: April 2021, Exercise Price: $405.00
|
16
|
667,680
|
8
|
|||||||||
|
Expiration: May 2021, Exercise Price: $395.00
|
15
|
625,950
|
2,242
|
|||||||||
|
Expiration: May 2021, Exercise Price: $398.00
|
37
|
1,544,010
|
6,531
|
|||||||||
|
SPDR S&P Biotech ETF
|
||||||||||||
|
Expiration: May 2021, Exercise Price: $132.00
|
1
|
13,662
|
211
|
|||||||||
|
Take-Two Interactive Software, Inc. (h)
|
||||||||||||
|
Expiration: May 2021, Exercise Price: $150.00
|
3
|
52,614
|
233
|
|||||||||
|
Expiration: May 2021, Exercise Price: $155.00
|
3
|
52,614
|
353
|
|||||||||
|
53,190
|
||||||||||||
|
Total Purchased Options
|
||||||||||||
|
(Cost $226,130)
|
95,057
|
|||||||||||
The accompanying notes are an integral part of these financial statements.
29
WEISS ALTERNATIVE MULTI-STRATEGY FUND
Schedule of Investments (Unaudited) – Continued
April 30, 2021
|
Shares
|
Value
|
|||||||
|
LONG SHORT-TERM INVESTMENTS – 16.68%
|
||||||||
|
Fidelity Investments Money Market Funds Government Portfolio,
|
||||||||
|
Institutional Class, 0.01% (e)
|
30,000,406
|
$
|
30,000,406
|
|||||
|
Total Long Short-Term Investments
|
||||||||
|
(Cost $30,000,406)
|
30,000,406
|
|||||||
|
Total Long Investments
|
||||||||
|
(Cost $172,168,411) – 98.06%
|
176,403,166
|
|||||||
|
SECURITIES SOLD SHORT (f) – (36.62)%
|
||||||||
|
SHORT COMMON STOCKS – (25.96)%
|
||||||||
|
Aerospace & Defense – (0.35)%
|
||||||||
|
The Boeing Company
|
(1,724
|
)
|
(403,951
|
)
|
||||
|
General Dynamics Corporation
|
(82
|
)
|
(15,599
|
)
|
||||
|
Hexcel Corporation
|
(324
|
)
|
(18,137
|
)
|
||||
|
Howmet Aerospace, Inc.
|
(394
|
)
|
(12,592
|
)
|
||||
|
L3Harris Technologies, Inc.
|
(75
|
)
|
(15,692
|
)
|
||||
|
Lockheed Martin Corporation
|
(97
|
)
|
(36,914
|
)
|
||||
|
Teledyne Technologies, Inc.
|
(232
|
)
|
(103,878
|
)
|
||||
|
Textron, Inc.
|
(245
|
)
|
(15,739
|
)
|
||||
|
(622,502
|
)
|
|||||||
|
Air Freight & Logistics – (0.18)%
|
||||||||
|
Atlas Air Worldwide Holdings, Inc.
|
(1,210
|
)
|
(82,171
|
)
|
||||
|
Expeditors International of Washington, Inc.
|
(2,259
|
)
|
(248,174
|
)
|
||||
|
(330,345
|
)
|
|||||||
|
Auto Components – (0.04)%
|
||||||||
|
Autoliv, Inc. (b)
|
(240
|
)
|
(24,158
|
)
|
||||
|
BorgWarner, Inc.
|
(739
|
)
|
(35,901
|
)
|
||||
|
The Goodyear Tire & Rubber Company
|
(400
|
)
|
(6,884
|
)
|
||||
|
(66,943
|
)
|
|||||||
|
Automobiles – (0.01)%
|
||||||||
|
Harley-Davidson, Inc.
|
(273
|
)
|
(13,248
|
)
|
||||
|
Tesla, Inc.
|
(8
|
)
|
(5,676
|
)
|
||||
|
(18,924
|
)
|
|||||||
|
Banks – (1.71)%
|
||||||||
|
Associated Banc-Corp
|
(5,534
|
)
|
(121,139
|
)
|
||||
|
BancorpSouth Bank
|
(2,095
|
)
|
(61,991
|
)
|
||||
|
Bank OZK
|
(1,880
|
)
|
(77,061
|
)
|
||||
|
BOK Financial Corporation
|
(852
|
)
|
(74,925
|
)
|
||||
|
Boston Private Financial Holdings, Inc.
|
(1,296
|
)
|
(19,118
|
)
|
||||
The accompanying notes are an integral part of these financial statements.
30
WEISS ALTERNATIVE MULTI-STRATEGY FUND
Schedule of Investments (Unaudited) – Continued
April 30, 2021
|
Shares
|
Value
|
|||||||
|
Banks – (1.71)% (Continued)
|
||||||||
|
Citigroup, Inc.
|
(4,618
|
)
|
$
|
(328,986
|
)
|
|||
|
Citizens Financial Group, Inc.
|
(1,128
|
)
|
(52,204
|
)
|
||||
|
Columbia Banking System, Inc.
|
(1,223
|
)
|
(53,237
|
)
|
||||
|
Danske Bank A/S (b)
|
(6,404
|
)
|
(121,726
|
)
|
||||
|
Erste Group Bank AG (b)
|
(2,151
|
)
|
(76,452
|
)
|
||||
|
First Citizens BancShares, Inc., Class A
|
(7
|
)
|
(6,072
|
)
|
||||
|
FNB Corporation
|
(10,261
|
)
|
(132,264
|
)
|
||||
|
Great Western Bancorp, Inc.
|
(1,343
|
)
|
(44,386
|
)
|
||||
|
Hilltop Holdings, Inc.
|
(2,506
|
)
|
(88,211
|
)
|
||||
|
Investors Bancorp, Inc.
|
(6,480
|
)
|
(94,867
|
)
|
||||
|
JPMorgan Chase & Company
|
(810
|
)
|
(124,586
|
)
|
||||
|
KeyCorp
|
(10,347
|
)
|
(225,151
|
)
|
||||
|
National Bank of Canada (b)
|
(2,906
|
)
|
(211,268
|
)
|
||||
|
Nordea Bank Abp (b)
|
(6,045
|
)
|
(62,580
|
)
|
||||
|
The PNC Financial Services Group, Inc.
|
(990
|
)
|
(185,081
|
)
|
||||
|
Regions Financial Corporation
|
(10,287
|
)
|
(224,257
|
)
|
||||
|
Renasant Corporation
|
(1,009
|
)
|
(42,509
|
)
|
||||
|
Simmons First National Corporation, Class A
|
(2,500
|
)
|
(71,250
|
)
|
||||
|
Swedbank AB, Class A (b)
|
(4,072
|
)
|
(71,485
|
)
|
||||
|
Synovus Financial Corporation
|
(1,733
|
)
|
(81,208
|
)
|
||||
|
Texas Capital Bancshares, Inc.
|
(1,825
|
)
|
(125,250
|
)
|
||||
|
Truist Financial Corporation
|
(3,482
|
)
|
(206,517
|
)
|
||||
|
UniCredit SpA (b)
|
(4,079
|
)
|
(41,900
|
)
|
||||
|
Wintrust Financial Corporation
|
(653
|
)
|
(50,346
|
)
|
||||
|
(3,076,027
|
)
|
|||||||
|
Beverages – (0.21)%
|
||||||||
|
The Boston Beer Company, Inc., Class A
|
(34
|
)
|
(41,360
|
)
|
||||
|
Keurig Dr Pepper, Inc.
|
(4,088
|
)
|
(146,555
|
)
|
||||
|
National Beverage Corporation
|
(4,074
|
)
|
(197,956
|
)
|
||||
|
(385,871
|
)
|
|||||||
|
Biotechnology – (0.22)%
|
||||||||
|
Amgen, Inc.
|
(1,479
|
)
|
(354,427
|
)
|
||||
|
Amicus Therapeutics, Inc.
|
(16
|
)
|
(157
|
)
|
||||
|
Biomea Fusion, Inc.
|
(48
|
)
|
(814
|
)
|
||||
|
Connect Biopharma Holdings Ltd. (b)
|
(81
|
)
|
(1,318
|
)
|
||||
|
Instil Bio, Inc.
|
(41
|
)
|
(842
|
)
|
||||
|
Invitae Corporation
|
(121
|
)
|
(4,223
|
)
|
||||
|
Lava Therapeutics NV (b)
|
(97
|
)
|
(1,154
|
)
|
||||
|
Moderna, Inc.
|
(78
|
)
|
(13,948
|
)
|
||||
|
Novavax, Inc.
|
(48
|
)
|
(11,373
|
)
|
||||
The accompanying notes are an integral part of these financial statements.
31
WEISS ALTERNATIVE MULTI-STRATEGY FUND
Schedule of Investments (Unaudited) – Continued
April 30, 2021
|
Shares
|
Value
|
|||||||
|
Biotechnology – (0.22)% (Continued)
|
||||||||
|
Sana Biotechnology, Inc.
|
(47
|
)
|
$
|
(1,010
|
)
|
|||
|
VectivBio Holding AG (b)
|
(56
|
)
|
(871
|
)
|
||||
|
Vor BioPharma, Inc.
|
(64
|
)
|
(1,803
|
)
|
||||
|
(391,940
|
)
|
|||||||
|
Building Products – (0.16)%
|
||||||||
|
A.O. Smith Corporation
|
(900
|
)
|
(60,975
|
)
|
||||
|
Allegion plc (b)
|
(80
|
)
|
(10,750
|
)
|
||||
|
American Woodmark Corporation
|
(112
|
)
|
(11,140
|
)
|
||||
|
Armstrong World Industries, Inc.
|
(454
|
)
|
(47,057
|
)
|
||||
|
Carrier Global Corporation
|
(1,270
|
)
|
(55,347
|
)
|
||||
|
Lennox International, Inc.
|
(162
|
)
|
(54,325
|
)
|
||||
|
Masco Corporation
|
(125
|
)
|
(7,985
|
)
|
||||
|
Owens Corning
|
(374
|
)
|
(36,207
|
)
|
||||
|
Resideo Technologies, Inc.
|
(110
|
)
|
(3,301
|
)
|
||||
|
(287,087
|
)
|
|||||||
|
Capital Markets – (0.63)%
|
||||||||
|
Brookfield Asset Management, Inc., Class A (b)
|
(912
|
)
|
(41,569
|
)
|
||||
|
The Charles Schwab Corporation
|
(1,280
|
)
|
(90,112
|
)
|
||||
|
Credit Suisse Group AG – ADR (b)
|
(25,634
|
)
|
(270,952
|
)
|
||||
|
Deutsche Bank AG – Reg (b)
|
(10,101
|
)
|
(140,720
|
)
|
||||
|
Deutsche Boerse AG (b)
|
(183
|
)
|
(31,536
|
)
|
||||
|
Julius Baer Group Ltd. (b)
|
(1,995
|
)
|
(125,560
|
)
|
||||
|
S&P Global, Inc.
|
(670
|
)
|
(261,561
|
)
|
||||
|
State Street Corporation
|
(1,987
|
)
|
(166,809
|
)
|
||||
|
(1,128,819
|
)
|
|||||||
|
Chemicals – (0.43)%
|
||||||||
|
Axalta Coating Systems Ltd.
|
(1,306
|
)
|
(41,648
|
)
|
||||
|
Chr Hansen Holding A/S (b)
|
(1,794
|
)
|
(164,703
|
)
|
||||
|
Dow, Inc.
|
(728
|
)
|
(45,500
|
)
|
||||
|
DuPont de Nemours, Inc.
|
(207
|
)
|
(15,962
|
)
|
||||
|
Ecolab, Inc.
|
(180
|
)
|
(40,342
|
)
|
||||
|
International Flavors & Fragrances, Inc.
|
(1,730
|
)
|
(245,954
|
)
|
||||
|
Olin Corporation
|
(78
|
)
|
(3,356
|
)
|
||||
|
PPG Industries, Inc.
|
(1,051
|
)
|
(179,973
|
)
|
||||
|
RPM International, Inc.
|
(204
|
)
|
(19,348
|
)
|
||||
|
Westlake Chemical Corporation
|
(88
|
)
|
(8,262
|
)
|
||||
|
(765,048
|
)
|
|||||||
The accompanying notes are an integral part of these financial statements.
32
WEISS ALTERNATIVE MULTI-STRATEGY FUND
Schedule of Investments (Unaudited) – Continued
April 30, 2021
|
Shares
|
Value
|
|||||||
|
Commercial Services & Supplies – (0.08)%
|
||||||||
|
Cintas Corporation
|
(194
|
)
|
$
|
(66,957
|
)
|
|||
|
Herman Miller, Inc.
|
(1,644
|
)
|
(68,226
|
)
|
||||
|
KAR Auction Services, Inc.
|
(498
|
)
|
(7,465
|
)
|
||||
|
(142,648
|
)
|
|||||||
|
Consumer Finance – (0.49)%
|
||||||||
|
American Express Company
|
(1,857
|
)
|
(284,771
|
)
|
||||
|
Credit Acceptance Corporation
|
(288
|
)
|
(113,699
|
)
|
||||
|
Discover Financial Services
|
(2,668
|
)
|
(304,152
|
)
|
||||
|
FirstCash, Inc.
|
(851
|
)
|
(61,297
|
)
|
||||
|
OneMain Holdings, Inc.
|
(729
|
)
|
(41,236
|
)
|
||||
|
Upstart Holdings, Inc.
|
(383
|
)
|
(41,755
|
)
|
||||
|
World Acceptance Corporation
|
(297
|
)
|
(38,830
|
)
|
||||
|
(885,740
|
)
|
|||||||
|
Containers & Packaging – (0.04)%
|
||||||||
|
Amcor plc (b)
|
(2,340
|
)
|
(27,495
|
)
|
||||
|
Graphic Packaging Holding Company
|
(702
|
)
|
(13,022
|
)
|
||||
|
Greif, Inc., Class A
|
(270
|
)
|
(16,338
|
)
|
||||
|
O-I Glass, Inc.
|
(485
|
)
|
(7,998
|
)
|
||||
|
Pactiv Evergreen, Inc.
|
(546
|
)
|
(8,037
|
)
|
||||
|
(72,890
|
)
|
|||||||
|
Diversified Consumer Services – (0.24)%
|
||||||||
|
Chegg, Inc.
|
(3,517
|
)
|
(317,691
|
)
|
||||
|
frontdoor, Inc.
|
(215
|
)
|
(11,509
|
)
|
||||
|
Terminix Global Holdings, Inc.
|
(1,979
|
)
|
(100,711
|
)
|
||||
|
(429,911
|
)
|
|||||||
|
Diversified Financial Services – (0.05)%
|
||||||||
|
Exor NV (b)
|
(1,122
|
)
|
(92,086
|
)
|
||||
|
Diversified Telecommunication Services – (0.43)%
|
||||||||
|
Verizon Communications, Inc.
|
(13,451
|
)
|
(777,333
|
)
|
||||
|
Electrical Equipment – (0.10)%
|
||||||||
|
Acuity Brands, Inc.
|
(53
|
)
|
(9,833
|
)
|
||||
|
Eaton Corporation plc
|
(143
|
)
|
(20,439
|
)
|
||||
|
Emerson Electric Company
|
(324
|
)
|
(29,319
|
)
|
||||
|
Hubbell, Inc.
|
(155
|
)
|
(29,761
|
)
|
||||
|
nVent Electric plc (b)
|
(358
|
)
|
(10,901
|
)
|
||||
|
Rockwell Automation, Inc.
|
(204
|
)
|
(53,909
|
)
|
||||
The accompanying notes are an integral part of these financial statements.
33
WEISS ALTERNATIVE MULTI-STRATEGY FUND
Schedule of Investments (Unaudited) – Continued
April 30, 2021
|
Shares
|
Value
|
|||||||
|
Electrical Equipment – (0.10)% (Continued)
|
||||||||
|
Sensata Technologies Holding plc
|
(405
|
)
|
$
|
(23,385
|
)
|
|||
|
(177,547
|
)
|
|||||||
|
Electronic Equipment, Instruments & Components – (0.01)%
|
||||||||
|
II-VI, Inc.
|
(360
|
)
|
(24,170
|
)
|
||||
|
Energy Equipment & Services – (0.25)%
|
||||||||
|
Halliburton Company
|
(4,025
|
)
|
(78,729
|
)
|
||||
|
Helmerich & Payne, Inc.
|
(5,172
|
)
|
(132,558
|
)
|
||||
|
NOV, Inc.
|
(10,082
|
)
|
(150,726
|
)
|
||||
|
Patterson-UTI Energy, Inc.
|
(7,015
|
)
|
(47,421
|
)
|
||||
|
Tenaris SA – ADR (b)
|
(1,620
|
)
|
(34,636
|
)
|
||||
|
(444,070
|
)
|
|||||||
|
Entertainment – (0.80)%
|
||||||||
|
AMC Entertainment Holdings, Inc., Class A
|
(4,064
|
)
|
(40,762
|
)
|
||||
|
Electronic Arts, Inc.
|
(6,931
|
)
|
(984,756
|
)
|
||||
|
Netflix, Inc.
|
(352
|
)
|
(180,741
|
)
|
||||
|
Roku, Inc.
|
(254
|
)
|
(87,114
|
)
|
||||
|
Sea Ltd. – ADR (b)
|
(553
|
)
|
(139,655
|
)
|
||||
|
(1,433,028
|
)
|
|||||||
|
Food & Staples Retailing – (0.15)%
|
||||||||
|
Costco Wholesale Corporation
|
(43
|
)
|
(16,000
|
)
|
||||
|
The Kroger Company
|
(1,458
|
)
|
(53,583
|
)
|
||||
|
Sysco Corporation
|
(944
|
)
|
(79,985
|
)
|
||||
|
Walgreens Boots Alliance, Inc.
|
(286
|
)
|
(15,187
|
)
|
||||
|
Wal-Mart Stores, Inc.
|
(762
|
)
|
(106,611
|
)
|
||||
|
(271,366
|
)
|
|||||||
|
Food Products – (1.12)%
|
||||||||
|
AAK AB (b)
|
(3,152
|
)
|
(72,183
|
)
|
||||
|
Archer-Daniels-Midland Company
|
(1,653
|
)
|
(104,354
|
)
|
||||
|
B&G Foods, Inc.
|
(687
|
)
|
(20,047
|
)
|
||||
|
Beyond Meat, Inc.
|
(765
|
)
|
(100,735
|
)
|
||||
|
Calavo Growers, Inc.
|
(191
|
)
|
(14,923
|
)
|
||||
|
Campbell Soup Company
|
(2,272
|
)
|
(108,488
|
)
|
||||
|
Conagra Brands, Inc.
|
(6,097
|
)
|
(226,138
|
)
|
||||
|
Flowers Foods, Inc.
|
(9,177
|
)
|
(219,881
|
)
|
||||
|
General Mills, Inc.
|
(2,844
|
)
|
(173,086
|
)
|
||||
|
The Hain Celestial Group, Inc.
|
(645
|
)
|
(26,451
|
)
|
||||
|
Hormel Foods Corporation
|
(5,829
|
)
|
(269,300
|
)
|
||||
|
The JM Smucker Company
|
(1,815
|
)
|
(237,747
|
)
|
||||
The accompanying notes are an integral part of these financial statements.
34
WEISS ALTERNATIVE MULTI-STRATEGY FUND
Schedule of Investments (Unaudited) – Continued
April 30, 2021
|
Shares
|
Value
|
|||||||
|
Food Products – (1.12)% (Continued)
|
||||||||
|
Kellogg Company
|
(5,776
|
)
|
$
|
(360,538
|
)
|
|||
|
The Kraft Heinz Company
|
(875
|
)
|
(36,129
|
)
|
||||
|
McCormick & Company, Inc.
|
(546
|
)
|
(49,336
|
)
|
||||
|
(2,019,336
|
)
|
|||||||
|
Health Care Equipment & Supplies – (0.10)%
|
||||||||
|
Baxter International, Inc.
|
(386
|
)
|
(33,076
|
)
|
||||
|
Becton, Dickinson and Company
|
(186
|
)
|
(46,279
|
)
|
||||
|
Medtronic plc (b)
|
(371
|
)
|
(48,571
|
)
|
||||
|
Novocure Ltd. (b)
|
(97
|
)
|
(19,798
|
)
|
||||
|
Pulse Biosciences, Inc.
|
(48
|
)
|
(925
|
)
|
||||
|
STERIS plc
|
(172
|
)
|
(36,295
|
)
|
||||
|
(184,944
|
)
|
|||||||
|
Health Care Providers & Services – (0.14)%
|
||||||||
|
Alignment Healthcare, Inc.
|
(64
|
)
|
(1,699
|
)
|
||||
|
Apria, Inc.
|
(32
|
)
|
(958
|
)
|
||||
|
Aveanna Healthcare Holdings, Inc.
|
(81
|
)
|
(946
|
)
|
||||
|
HCA Holdings, Inc.
|
(580
|
)
|
(116,615
|
)
|
||||
|
Quest Diagnostics, Inc.
|
(309
|
)
|
(40,751
|
)
|
||||
|
Signify Health, Inc., Class A
|
(48
|
)
|
(1,361
|
)
|
||||
|
UnitedHealth Group, Inc.
|
(218
|
)
|
(86,938
|
)
|
||||
|
(249,268
|
)
|
|||||||
|
Health Care Technology – (0.01)%
|
||||||||
|
Teladoc Health, Inc.
|
(81
|
)
|
(13,960
|
)
|
||||
|
Hotels, Restaurants & Leisure – (1.00)%
|
||||||||
|
Airbnb, Inc., Class A
|
(2,566
|
)
|
(443,174
|
)
|
||||
|
Boyd Gaming Corporation
|
(364
|
)
|
(24,078
|
)
|
||||
|
Carnival Corporation
|
(130
|
)
|
(3,635
|
)
|
||||
|
The Cheesecake Factory, Inc.
|
(1,646
|
)
|
(103,023
|
)
|
||||
|
Chipotle Mexican Grill, Inc.
|
(24
|
)
|
(35,809
|
)
|
||||
|
Domino’s Pizza, Inc.
|
(1,199
|
)
|
(506,386
|
)
|
||||
|
DraftKings, Inc., Class A
|
(1,629
|
)
|
(92,299
|
)
|
||||
|
Marriott International, Inc., Class A
|
(1,922
|
)
|
(285,455
|
)
|
||||
|
NeoGames SA (b)
|
(891
|
)
|
(43,739
|
)
|
||||
|
Restaurant Brands International, Inc. (b)
|
(2,285
|
)
|
(156,774
|
)
|
||||
|
SeaWorld Entertainment, Inc.
|
(625
|
)
|
(34,225
|
)
|
||||
|
Six Flags Entertainment Corporation
|
(769
|
)
|
(36,128
|
)
|
||||
|
Wyndham Hotels & Resorts, Inc.
|
(489
|
)
|
(35,751
|
)
|
||||
|
(1,800,476
|
)
|
|||||||
The accompanying notes are an integral part of these financial statements.
35
WEISS ALTERNATIVE MULTI-STRATEGY FUND
Schedule of Investments (Unaudited) – Continued
April 30, 2021
|
Shares
|
Value
|
|||||||
|
Household Durables – (0.17)%
|
||||||||
|
Garmin Ltd. (b)
|
(687
|
)
|
$
|
(94,284
|
)
|
|||
|
Helen of Troy Ltd.
|
(209
|
)
|
(44,143
|
)
|
||||
|
Leggett & Platt, Inc.
|
(489
|
)
|
(24,289
|
)
|
||||
|
Lennar Corporation, Class A
|
(634
|
)
|
(65,682
|
)
|
||||
|
MDC Holdings, Inc.
|
(551
|
)
|
(32,322
|
)
|
||||
|
Mohawk Industries, Inc.
|
(97
|
)
|
(19,933
|
)
|
||||
|
Sonos, Inc.
|
(539
|
)
|
(21,576
|
)
|
||||
|
Taylor Morrison Home Corporation
|
(293
|
)
|
(9,145
|
)
|
||||
|
(311,374
|
)
|
|||||||
|
Household Products – (0.74)%
|
||||||||
|
Church & Dwight Company, Inc.
|
(3,599
|
)
|
(308,578
|
)
|
||||
|
The Clorox Company
|
(1,712
|
)
|
(312,440
|
)
|
||||
|
Colgate-Palmolive Company
|
(2,997
|
)
|
(241,858
|
)
|
||||
|
The Procter & Gamble Company
|
(3,319
|
)
|
(442,821
|
)
|
||||
|
Reynolds Consumer Products, Inc.
|
(1,239
|
)
|
(36,328
|
)
|
||||
|
(1,342,025
|
)
|
|||||||
|
Industrial Conglomerates – (0.26)%
|
||||||||
|
3M Company
|
(1,847
|
)
|
(364,118
|
)
|
||||
|
Honeywell International, Inc.
|
(245
|
)
|
(54,645
|
)
|
||||
|
Roper Technologies, Inc.
|
(124
|
)
|
(55,358
|
)
|
||||
|
(474,121
|
)
|
|||||||
|
Insurance – (0.39)%
|
||||||||
|
Aon plc, Class A
|
(804
|
)
|
(202,158
|
)
|
||||
|
First American Financial Corporation
|
(1,101
|
)
|
(71,014
|
)
|
||||
|
Gjensidige Forsikring ASA (b)
|
(2,172
|
)
|
(49,324
|
)
|
||||
|
Manulife Financial Corporation (b)
|
(3,878
|
)
|
(84,681
|
)
|
||||
|
Storebrand ASA (b)
|
(5,799
|
)
|
(55,352
|
)
|
||||
|
Swiss Re AG (b)
|
(2,520
|
)
|
(233,960
|
)
|
||||
|
(696,489
|
)
|
|||||||
|
Interactive Media & Services – (0.02)%
|
||||||||
|
Bumble, Inc., Class A
|
(353
|
)
|
(21,265
|
)
|
||||
|
Twitter, Inc.
|
(143
|
)
|
(7,896
|
)
|
||||
|
(29,161
|
)
|
|||||||
|
Internet & Direct Marketing Retail – (0.39)%
|
||||||||
|
Chewy, Inc., Class A
|
(2,702
|
)
|
(215,404
|
)
|
||||
|
DoorDash, Inc., Class A
|
(1,632
|
)
|
(233,653
|
)
|
||||
|
eBay, Inc.
|
(661
|
)
|
(36,877
|
)
|
||||
|
ETSY, Inc.
|
(1,093
|
)
|
(217,278
|
)
|
||||
|
(703,212
|
)
|
|||||||
The accompanying notes are an integral part of these financial statements.
36
WEISS ALTERNATIVE MULTI-STRATEGY FUND
Schedule of Investments (Unaudited) – Continued
April 30, 2021
|
Shares
|
Value
|
|||||||
|
IT Services – (1.67)%
|
||||||||
|
Automatic Data Processing, Inc.
|
(1,236
|
)
|
$
|
(231,120
|
)
|
|||
|
Broadridge Financial Solutions, Inc.
|
(3,123
|
)
|
(495,401
|
)
|
||||
|
Fastly, Inc., Class A
|
(3,342
|
)
|
(213,454
|
)
|
||||
|
FleetCor Technologies, Inc.
|
(744
|
)
|
(214,064
|
)
|
||||
|
Infosys Ltd. – ADR (b)
|
(7,656
|
)
|
(138,420
|
)
|
||||
|
International Business Machines Corporation
|
(2,418
|
)
|
(343,066
|
)
|
||||
|
Jack Henry & Associates, Inc.
|
(1,595
|
)
|
(259,714
|
)
|
||||
|
Okta, Inc.
|
(50
|
)
|
(13,485
|
)
|
||||
|
Paychex, Inc.
|
(2,639
|
)
|
(257,276
|
)
|
||||
|
PayPal Holdings, Inc.
|
(787
|
)
|
(206,422
|
)
|
||||
|
Shopify, Inc., Class A (b)
|
(119
|
)
|
(140,719
|
)
|
||||
|
Snowflake, Inc., Class A
|
(614
|
)
|
(142,196
|
)
|
||||
|
The Western Union Company
|
(12,880
|
)
|
(331,789
|
)
|
||||
|
VeriSign, Inc.
|
(65
|
)
|
(14,220
|
)
|
||||
|
(3,001,346
|
)
|
|||||||
|
Leisure Products – (0.08)%
|
||||||||
|
Acushnet Holdings Corporation
|
(355
|
)
|
(15,020
|
)
|
||||
|
Peloton Interactive, Inc., Class A
|
(1,308
|
)
|
(128,642
|
)
|
||||
|
(143,662
|
)
|
|||||||
|
Life Sciences Tools & Services – (0.04)%
|
||||||||
|
Evotec SE (b)
|
(15
|
)
|
(624
|
)
|
||||
|
ICON plc (b)
|
(92
|
)
|
(19,959
|
)
|
||||
|
Thermo Fisher Scientific, Inc.
|
(109
|
)
|
(51,255
|
)
|
||||
|
(71,838
|
)
|
|||||||
|
Machinery – (0.47)%
|
||||||||
|
AGCO Corporation
|
(89
|
)
|
(12,987
|
)
|
||||
|
Allison Transmission Holdings, Inc.
|
(917
|
)
|
(38,028
|
)
|
||||
|
Colfax Corporation
|
(873
|
)
|
(39,451
|
)
|
||||
|
Cummins, Inc.
|
(39
|
)
|
(9,829
|
)
|
||||
|
Dover Corporation
|
(130
|
)
|
(19,395
|
)
|
||||
|
Flowserve Corporation
|
(254
|
)
|
(10,068
|
)
|
||||
|
Hydrofarm Holdings Group, Inc.
|
(397
|
)
|
(26,083
|
)
|
||||
|
IDEX Corporation
|
(386
|
)
|
(86,541
|
)
|
||||
|
Illinois Tool Works, Inc.
|
(283
|
)
|
(65,220
|
)
|
||||
|
ITT, Inc.
|
(199
|
)
|
(18,768
|
)
|
||||
|
Kennametal, Inc.
|
(1,542
|
)
|
(61,927
|
)
|
||||
|
The Middleby Corporation
|
(417
|
)
|
(75,610
|
)
|
||||
|
Otis Worldwide Corporation
|
(241
|
)
|
(18,767
|
)
|
||||
|
PACCAR, Inc.
|
(84
|
)
|
(7,550
|
)
|
||||
The accompanying notes are an integral part of these financial statements.
37
WEISS ALTERNATIVE MULTI-STRATEGY FUND
Schedule of Investments (Unaudited) – Continued
April 30, 2021
|
Shares
|
Value
|
|||||||
|
Machinery – (0.47)% (Continued)
|
||||||||
|
Pentair plc (b)
|
(964
|
)
|
$
|
(62,188
|
)
|
|||
|
SKF AB, Class B (b)
|
(968
|
)
|
(25,009
|
)
|
||||
|
Stanley Black & Decker, Inc.
|
(107
|
)
|
(22,124
|
)
|
||||
|
Terex Corporation
|
(124
|
)
|
(5,827
|
)
|
||||
|
Trinity Industries, Inc.
|
(810
|
)
|
(22,388
|
)
|
||||
|
Wabtec Corporation
|
(2,095
|
)
|
(171,937
|
)
|
||||
|
Xylem, Inc.
|
(369
|
)
|
(40,830
|
)
|
||||
|
(840,527
|
)
|
|||||||
|
Marine – (0.03)%
|
||||||||
|
Kuehne + Nagel International AG – Reg (b)
|
(201
|
)
|
(60,098
|
)
|
||||
|
Media – (0.38)%
|
||||||||
|
Altice USA, Inc., Class A
|
(1,589
|
)
|
(57,697
|
)
|
||||
|
AMC Networks, Inc., Class A
|
(234
|
)
|
(11,766
|
)
|
||||
|
Charter Communications, Inc., Class A
|
(592
|
)
|
(398,682
|
)
|
||||
|
The New York Times Company, Class A
|
(322
|
)
|
(14,622
|
)
|
||||
|
Nexstar Media Group, Inc., Class A
|
(269
|
)
|
(39,653
|
)
|
||||
|
Omnicom Group, Inc.
|
(680
|
)
|
(55,937
|
)
|
||||
|
Sinclair Broadcast Group, Inc., Class A
|
(1,954
|
)
|
(63,446
|
)
|
||||
|
ViacomCBS, Inc., Class B
|
(1,113
|
)
|
(45,655
|
)
|
||||
|
(687,458
|
)
|
|||||||
|
Multiline Retail – (0.01)%
|
||||||||
|
Macy’s, Inc.
|
(1,134
|
)
|
(18,802
|
)
|
||||
|
Oil, Gas & Consumable Fuels – (2.31)%
|
||||||||
|
APA Corporation
|
(15,450
|
)
|
(309,000
|
)
|
||||
|
BP plc – ADR (b)
|
(12,196
|
)
|
(306,851
|
)
|
||||
|
Cabot Oil & Gas Corporation
|
(16,382
|
)
|
(273,088
|
)
|
||||
|
Cenovus Energy, Inc. (b)
|
(11,340
|
)
|
(88,112
|
)
|
||||
|
Chevron Corporation
|
(3,650
|
)
|
(376,205
|
)
|
||||
|
CNX Resources Corporation
|
(11,968
|
)
|
(160,611
|
)
|
||||
|
Comstock Resources, Inc.
|
(20,869
|
)
|
(114,571
|
)
|
||||
|
Continental Resources, Inc.
|
(11,234
|
)
|
(306,014
|
)
|
||||
|
Delek U.S. Holdings, Inc.
|
(1,431
|
)
|
(33,958
|
)
|
||||
|
Diamondback Energy, Inc.
|
(3,339
|
)
|
(272,896
|
)
|
||||
|
EOG Resources, Inc.
|
(4,180
|
)
|
(307,815
|
)
|
||||
|
EQT Corporation
|
(10,542
|
)
|
(201,352
|
)
|
||||
|
Hess Corporation
|
(5,150
|
)
|
(383,727
|
)
|
||||
|
Murphy Oil Corporation
|
(6,405
|
)
|
(108,437
|
)
|
||||
|
Pioneer Natural Resources Company
|
(2,216
|
)
|
(340,887
|
)
|
||||
The accompanying notes are an integral part of these financial statements.
38
WEISS ALTERNATIVE MULTI-STRATEGY FUND
Schedule of Investments (Unaudited) – Continued
April 30, 2021
|
Shares
|
Value
|
|||||||
|
Oil, Gas & Consumable Fuels – (2.31)% (Continued)
|
||||||||
|
Range Resources Corporation
|
(9,740
|
)
|
$
|
(95,647
|
)
|
|||
|
Royal Dutch Shell plc – ADR (b)
|
(4,046
|
)
|
(153,748
|
)
|
||||
|
Southwestern Energy Company
|
(11,034
|
)
|
(47,115
|
)
|
||||
|
TOTAL SE – ADR (b)
|
(6,151
|
)
|
(272,366
|
)
|
||||
|
(4,152,400
|
)
|
|||||||
|
Paper & Forest Products – 0.00%
|
||||||||
|
Louisiana-Pacific Corporation
|
(121
|
)
|
(7,971
|
)
|
||||
|
Personal Products – (0.05)%
|
||||||||
|
Beiersdorf AG (b)
|
(728
|
)
|
(82,170
|
)
|
||||
|
Pharmaceuticals – (0.56)%
|
||||||||
|
AstraZeneca plc – ADR (b)
|
(9,376
|
)
|
(497,584
|
)
|
||||
|
Aurora Cannabis, Inc. (b)
|
(1,616
|
)
|
(14,447
|
)
|
||||
|
Bristol Myers-Squibb Company
|
(6,240
|
)
|
(389,501
|
)
|
||||
|
Canopy Growth Corporation (b)
|
(484
|
)
|
(13,044
|
)
|
||||
|
Edgewise Therapeutics, Inc.
|
(32
|
)
|
(916
|
)
|
||||
|
GlaxoSmithKline plc – ADR (b)
|
(157
|
)
|
(5,862
|
)
|
||||
|
Novartis AG – ADR (b)
|
(347
|
)
|
(29,578
|
)
|
||||
|
Pfizer, Inc.
|
(1,126
|
)
|
(43,520
|
)
|
||||
|
Roche Holding AG – ADR (b)
|
(156
|
)
|
(6,351
|
)
|
||||
|
Royalty Pharma plc, Class A
|
(178
|
)
|
(7,832
|
)
|
||||
|
Tarsus Pharmaceuticals, Inc.
|
(48
|
)
|
(1,475
|
)
|
||||
|
(1,010,110
|
)
|
|||||||
|
Real Estate Investment Trusts (REITs) – (5.38)%
|
||||||||
|
American Campus Communities, Inc.
|
(8,711
|
)
|
(393,824
|
)
|
||||
|
American Homes 4 Rent, Class A
|
(15,003
|
)
|
(555,711
|
)
|
||||
|
Brandywine Realty Trust
|
(43,140
|
)
|
(583,684
|
)
|
||||
|
Camden Property Trust
|
(4,519
|
)
|
(544,449
|
)
|
||||
|
Douglas Emmett, Inc.
|
(5,926
|
)
|
(198,758
|
)
|
||||
|
EastGroup Properties, Inc.
|
(1,421
|
)
|
(225,456
|
)
|
||||
|
Empire State Realty Trust, Inc., Class A
|
(16,851
|
)
|
(191,933
|
)
|
||||
|
Essential Properties Realty Trust, Inc.
|
(14,614
|
)
|
(382,741
|
)
|
||||
|
Four Corners Property Trust, Inc.
|
(3,531
|
)
|
(101,940
|
)
|
||||
|
Healthcare Realty Trust, Inc.
|
(15,447
|
)
|
(496,775
|
)
|
||||
|
Healthpeak Properties, Inc.
|
(5,865
|
)
|
(201,404
|
)
|
||||
|
Host Hotels & Resorts, Inc.
|
(1,972
|
)
|
(35,812
|
)
|
||||
|
Hudson Pacific Properties, Inc.
|
(3,175
|
)
|
(89,249
|
)
|
||||
|
Kite Realty Group Trust
|
(18,936
|
)
|
(394,058
|
)
|
||||
|
LTC Properties, Inc.
|
(9,412
|
)
|
(400,292
|
)
|
||||
The accompanying notes are an integral part of these financial statements.
39
WEISS ALTERNATIVE MULTI-STRATEGY FUND
Schedule of Investments (Unaudited) – Continued
April 30, 2021
|
Shares
|
Value
|
|||||||
|
Real Estate Investment Trusts (REITs) – (5.38)% (Continued)
|
||||||||
|
MGM Growth Properties LLC, Class A
|
(3,134
|
)
|
$
|
(112,887
|
)
|
|||
|
National Health Investors, Inc.
|
(5,455
|
)
|
(400,452
|
)
|
||||
|
National Retail Properties, Inc.
|
(12,361
|
)
|
(573,798
|
)
|
||||
|
Omega Healthcare Investors, Inc.
|
(10,243
|
)
|
(389,234
|
)
|
||||
|
Park Hotels & Resorts, Inc.
|
(2,754
|
)
|
(61,442
|
)
|
||||
|
Pebblebrook Hotel Trust
|
(324
|
)
|
(7,737
|
)
|
||||
|
PS Business Parks, Inc.
|
(496
|
)
|
(80,535
|
)
|
||||
|
Prologis, Inc.
|
(5,904
|
)
|
(687,993
|
)
|
||||
|
Regency Centers Corporation
|
(4,807
|
)
|
(306,014
|
)
|
||||
|
Retail Opportunity Investments Corporation
|
(13,666
|
)
|
(240,522
|
)
|
||||
|
Retail Properties of America, Inc., Class A
|
(32,902
|
)
|
(385,940
|
)
|
||||
|
Rexford Industrial Realty, Inc.
|
(7,353
|
)
|
(408,459
|
)
|
||||
|
SL Green Realty Corporation
|
(4,060
|
)
|
(300,481
|
)
|
||||
|
STORE Capital Corporation
|
(11,564
|
)
|
(413,876
|
)
|
||||
|
Tanger Factory Outlet Centers, Inc.
|
(3,078
|
)
|
(53,711
|
)
|
||||
|
Urban Edge Properties
|
(16,375
|
)
|
(308,669
|
)
|
||||
|
Washington Real Estate Investment Trust
|
(6,678
|
)
|
(155,063
|
)
|
||||
|
(9,682,899
|
)
|
|||||||
|
Real Estate Management & Development – (0.11)%
|
||||||||
|
Compass, Inc., Class A
|
(1,757
|
)
|
(33,418
|
)
|
||||
|
Opendoor Technologies, Inc.
|
(7,833
|
)
|
(158,775
|
)
|
||||
|
Rafael Holdings, Inc., Class B
|
(16
|
)
|
(661
|
)
|
||||
|
(192,854
|
)
|
|||||||
|
Road & Rail – (0.58)%
|
||||||||
|
ArcBest Corporation
|
(1,771
|
)
|
(128,858
|
)
|
||||
|
Avis Budget Group, Inc.
|
(567
|
)
|
(50,809
|
)
|
||||
|
Canadian Pacific Railway Ltd. (b)
|
(1,474
|
)
|
(549,994
|
)
|
||||
|
Covenant Transportation Group, Inc.
|
(5,661
|
)
|
(121,768
|
)
|
||||
|
J.B. Hunt Transport Services, Inc.
|
(248
|
)
|
(42,336
|
)
|
||||
|
Landstar System, Inc.
|
(729
|
)
|
(125,592
|
)
|
||||
|
Lyft, Inc., Class A
|
(162
|
)
|
(9,017
|
)
|
||||
|
Saia, Inc.
|
(18
|
)
|
(4,221
|
)
|
||||
|
Uber Technologies, Inc.
|
(85
|
)
|
(4,655
|
)
|
||||
|
US Xpress Enterprises, Inc., Class A
|
(219
|
)
|
(2,243
|
)
|
||||
|
(1,039,493
|
)
|
|||||||
|
Semiconductors & Semiconductor Equipment – (0.71)%
|
||||||||
|
Advanced Micro Devices, Inc.
|
(5,418
|
)
|
(442,217
|
)
|
||||
|
Analog Devices, Inc.
|
(2,786
|
)
|
(426,704
|
)
|
||||
|
Lattice Semiconductor Corporation
|
(2,415
|
)
|
(121,499
|
)
|
||||
The accompanying notes are an integral part of these financial statements.
40
WEISS ALTERNATIVE MULTI-STRATEGY FUND
Schedule of Investments (Unaudited) – Continued
April 30, 2021
|
Shares
|
Value
|
|||||||
|
Semiconductors & Semiconductor Equipment – (0.71)% (Continued)
|
||||||||
|
Onto Innovation, Inc.
|
(405
|
)
|
$
|
(27,961
|
)
|
|||
|
QUALCOMM, Inc.
|
(81
|
)
|
(11,243
|
)
|
||||
|
Texas Instruments, Inc.
|
(1,377
|
)
|
(248,562
|
)
|
||||
|
(1,278,186
|
)
|
|||||||
|
Software – (1.99)%
|
||||||||
|
2U, Inc.
|
(162
|
)
|
(6,358
|
)
|
||||
|
Alteryx, Inc., Class A
|
(810
|
)
|
(66,536
|
)
|
||||
|
Autodesk, Inc.
|
(588
|
)
|
(171,643
|
)
|
||||
|
Bill.com Holdings, Inc.
|
(229
|
)
|
(35,410
|
)
|
||||
|
Blackline, Inc.
|
(56
|
)
|
(6,499
|
)
|
||||
|
C3.ai, Inc., Class A
|
(1,769
|
)
|
(117,214
|
)
|
||||
|
Citrix Systems, Inc.
|
(632
|
)
|
(78,273
|
)
|
||||
|
Datadog, Inc., Class A
|
(3,482
|
)
|
(298,651
|
)
|
||||
|
DocuSign, Inc.
|
(57
|
)
|
(12,708
|
)
|
||||
|
Everbridge, Inc.
|
(40
|
)
|
(5,308
|
)
|
||||
|
fuboTV, Inc.
|
(812
|
)
|
(16,370
|
)
|
||||
|
Intuit, Inc.
|
(426
|
)
|
(175,580
|
)
|
||||
|
Materialise NV – ADR (b)
|
(967
|
)
|
(28,933
|
)
|
||||
|
nCino, Inc.
|
(564
|
)
|
(36,880
|
)
|
||||
|
New Relic, Inc.
|
(1,146
|
)
|
(73,688
|
)
|
||||
|
Oracle Corporation
|
(1,777
|
)
|
(134,679
|
)
|
||||
|
PagerDuty, Inc.
|
(323
|
)
|
(13,715
|
)
|
||||
|
Palantir Technologies, Inc., Class A
|
(4,070
|
)
|
(93,773
|
)
|
||||
|
Qualys, Inc.
|
(81
|
)
|
(8,210
|
)
|
||||
|
RingCentral, Inc., Class A
|
(1,118
|
)
|
(356,586
|
)
|
||||
|
salesforce.com, Inc.
|
(2,758
|
)
|
(635,223
|
)
|
||||
|
SAP SE – ADR (b)
|
(725
|
)
|
(101,456
|
)
|
||||
|
Temenos AG – Reg (b)
|
(438
|
)
|
(64,395
|
)
|
||||
|
The Trade Desk, Inc., Class A
|
(343
|
)
|
(250,153
|
)
|
||||
|
UiPath, Inc., Class A
|
(1,226
|
)
|
(88,272
|
)
|
||||
|
Unity Software, Inc.
|
(1,025
|
)
|
(104,120
|
)
|
||||
|
Viant Technology, Inc., Class A
|
(1,175
|
)
|
(38,587
|
)
|
||||
|
VMware, Inc., Class A
|
(2,159
|
)
|
(347,232
|
)
|
||||
|
Workday, Inc., Class A
|
(80
|
)
|
(19,760
|
)
|
||||
|
Zoom Video Communications, Inc., Class A
|
(202
|
)
|
(64,553
|
)
|
||||
|
Zscaler, Inc.
|
(698
|
)
|
(130,973
|
)
|
||||
|
(3,581,738
|
)
|
|||||||
|
Special Purpose Acquisition Companies – (0.01)%
|
||||||||
|
Stem, Inc.
|
(668
|
)
|
(16,961
|
)
|
||||
The accompanying notes are an integral part of these financial statements.
41
WEISS ALTERNATIVE MULTI-STRATEGY FUND
Schedule of Investments (Unaudited) – Continued
April 30, 2021
|
Shares
|
Value
|
|||||||
|
Specialty Retail – (0.06)%
|
||||||||
|
AutoZone, Inc.
|
(44
|
)
|
$
|
(64,421
|
)
|
|||
|
Best Buy Company, Inc.
|
(167
|
)
|
(19,396
|
)
|
||||
|
Lithia Motors, Inc., Class A
|
(30
|
)
|
(11,531
|
)
|
||||
|
Vroom, Inc.
|
(161
|
)
|
(7,450
|
)
|
||||
|
(102,798
|
)
|
|||||||
|
Technology Hardware, Storage & Peripherals – (0.24)%
|
||||||||
|
Dell Technologies, Inc., Class C
|
(1,870
|
)
|
(183,877
|
)
|
||||
|
Hewlett Packard Enterprise Company
|
(2,268
|
)
|
(36,334
|
)
|
||||
|
HP, Inc.
|
(4,035
|
)
|
(137,634
|
)
|
||||
|
NetApp, Inc.
|
(567
|
)
|
(42,349
|
)
|
||||
|
Pure Storage, Inc., Class A
|
(1,538
|
)
|
(31,098
|
)
|
||||
|
(431,292
|
)
|
|||||||
|
Textiles, Apparel & Luxury Goods – (0.01)%
|
||||||||
|
NIKE, Inc., Class B
|
(119
|
)
|
(15,782
|
)
|
||||
|
Thrifts & Mortgage Finance – (0.12)%
|
||||||||
|
MGIC Investment Corporation
|
(2,939
|
)
|
(44,791
|
)
|
||||
|
Radian Group, Inc.
|
(1,717
|
)
|
(42,307
|
)
|
||||
|
Rocket Companies, Inc., Class A
|
(3,645
|
)
|
(81,830
|
)
|
||||
|
WSFS Financial Corporation
|
(815
|
)
|
(41,638
|
)
|
||||
|
(210,566
|
)
|
|||||||
|
Tobacco – (0.02)%
|
||||||||
|
British American Tobacco plc – ADR (b)
|
(1,011
|
)
|
(37,923
|
)
|
||||
|
Trading Companies & Distributors – (0.16)%
|
||||||||
|
Fastenal Company
|
(3,503
|
)
|
(183,137
|
)
|
||||
|
MSC Industrial Direct Company, Inc., Class A
|
(907
|
)
|
(81,775
|
)
|
||||
|
W.W. Grainger, Inc.
|
(61
|
)
|
(26,446
|
)
|
||||
|
Watsco, Inc.
|
(11
|
)
|
(3,221
|
)
|
||||
|
(294,579
|
)
|
|||||||
|
Wireless Telecommunication Services – (0.05)%
|
||||||||
|
T-Mobile U.S., Inc.
|
(712
|
)
|
(94,077
|
)
|
||||
|
Total Short Common Stocks
|
||||||||
|
Proceeds $(45,187,976)
|
(46,704,191
|
)
|
||||||
The accompanying notes are an integral part of these financial statements.
42
WEISS ALTERNATIVE MULTI-STRATEGY FUND
Schedule of Investments (Unaudited) – Continued
April 30, 2021
|
Shares
|
Value
|
|||||||
|
SHORT EXCHANGE TRADED FUNDS – (10.66)%
|
||||||||
|
AdvisorShares Pure US Cannabis ETF
|
(216
|
)
|
$
|
(9,215
|
)
|
|||
|
Amplify Online Retail ETF
|
(167
|
)
|
(20,908
|
)
|
||||
|
ARK Innovation ETF
|
(9,474
|
)
|
(1,144,175
|
)
|
||||
|
Communication Services Select Sector SPDR Fund
|
(2,025
|
)
|
(158,051
|
)
|
||||
|
Consumer Discretionary Select Sector SPDR Fund
|
(577
|
)
|
(103,237
|
)
|
||||
|
Consumer Staples Select Sector SPDR Fund
|
(3,088
|
)
|
(214,863
|
)
|
||||
|
Defiance NextGen SPAC Derived ETF
|
(277
|
)
|
(7,113
|
)
|
||||
|
ETFMG Alternative Harvest ETF
|
(1,492
|
)
|
(31,899
|
)
|
||||
|
ETFMG Prime Cyber Security ETF
|
(3,513
|
)
|
(200,803
|
)
|
||||
|
Financial Select Sector SPDR Fund
|
(6,310
|
)
|
(228,801
|
)
|
||||
|
Health Care Select Sector SPDR Fund
|
(3,180
|
)
|
(385,829
|
)
|
||||
|
Industrial Select Sector SPDR Fund
|
(3,431
|
)
|
(349,722
|
)
|
||||
|
Invesco QQQ Trust Series 1
|
(8,728
|
)
|
(2,949,977
|
)
|
||||
|
Invesco S&P 500 Low Volatility ETF
|
(1,208
|
)
|
(73,012
|
)
|
||||
|
iShares China Large-Cap ETF
|
(69
|
)
|
(3,193
|
)
|
||||
|
iShares Cohen & Steers REIT ETF
|
(6,714
|
)
|
(420,498
|
)
|
||||
|
iShares MSCI Emerging Markets ETF
|
(1,516
|
)
|
(81,834
|
)
|
||||
|
iShares MSCI Eurozone ETF
|
(3,114
|
)
|
(151,309
|
)
|
||||
|
iShares MSCI Germany ETF
|
(2,025
|
)
|
(70,105
|
)
|
||||
|
iShares MSCI India ETF
|
(805
|
)
|
(33,021
|
)
|
||||
|
iShares Nasdaq Biotechnology ETF
|
(712
|
)
|
(110,104
|
)
|
||||
|
iShares North American Tech-Software ETF
|
(2,880
|
)
|
(1,041,379
|
)
|
||||
|
iShares Russell 2000 ETF
|
(9,948
|
)
|
(2,237,206
|
)
|
||||
|
iShares S&P 500 Value ETF
|
(6
|
)
|
(878
|
)
|
||||
|
iShares Transportation Average ETF
|
(1,785
|
)
|
(482,075
|
)
|
||||
|
iShares U.S. Home Construction ETF
|
(1,039
|
)
|
(76,076
|
)
|
||||
|
iShares U.S. Medical Devices ETF
|
(72
|
)
|
(25,518
|
)
|
||||
|
iShares U.S. Real Estate ETF
|
(7,743
|
)
|
(768,028
|
)
|
||||
|
iShares U.S. Technology ETF
|
(6,682
|
)
|
(621,827
|
)
|
||||
|
Material Select Sector SPDR
|
(156
|
)
|
(12,954
|
)
|
||||
|
SPDR Dow Jones Industrial Average ETF Trust
|
(46
|
)
|
(15,591
|
)
|
||||
|
SPDR EURO STOXX 50 ETF
|
(1,286
|
)
|
(59,760
|
)
|
||||
|
SPDR S&P 500 ETF Trust
|
(10,135
|
)
|
(4,229,335
|
)
|
||||
|
SPDR S&P Biotech ETF
|
(885
|
)
|
(120,909
|
)
|
||||
|
SPDR S&P Homebuilders ETF
|
(494
|
)
|
(37,223
|
)
|
||||
|
SPDR S&P Metals & Mining ETF
|
(810
|
)
|
(32,773
|
)
|
||||
|
SPDR S&P Retail ETF
|
(592
|
)
|
(54,949
|
)
|
||||
|
SPDR S&P Semiconductor ETF
|
(2,430
|
)
|
(429,648
|
)
|
||||
|
US Global Jets ETF
|
(3,490
|
)
|
(91,019
|
)
|
||||
|
Utilities Select Sector SPDR Fund
|
(1,240
|
)
|
(82,733
|
)
|
||||
The accompanying notes are an integral part of these financial statements.
43
WEISS ALTERNATIVE MULTI-STRATEGY FUND
Schedule of Investments (Unaudited) – Continued
April 30, 2021
|
Shares
|
Value
|
|||||||
|
SHORT EXCHANGE TRADED FUNDS – (10.66)% (Continued)
|
||||||||
|
VanEck Vectors Semiconductor ETF
|
(2,464
|
)
|
$
|
(598,752
|
)
|
|||
|
Vanguard Real Estate ETF
|
(14,171
|
)
|
(1,404,063
|
)
|
||||
|
Total Short Exchange Traded Funds
|
||||||||
|
Proceeds $(18,690,121)
|
(19,170,365
|
)
|
||||||
|
SHORT RIGHTS – 0.00%
|
||||||||
|
Credit Suisse Group AG (b)
|
(1,506
|
)
|
—
|
|||||
|
Total Short Rights
|
||||||||
|
Proceeds $(—)
|
—
|
|||||||
|
Total Securities Sold Short
|
||||||||
|
Proceeds $(63,878,097) – (36.62)%
|
(65,874,556
|
)
|
||||||
|
Total Investments
|
||||||||
|
(Cost $108,290,314) – 61.44%
|
110,528,610
|
|||||||
|
Other Assets In Excess Of Liabilities – 38.56%
|
69,356,573
|
|||||||
|
Total Net Assets – 100.00%
|
$
|
179,885,183
|
||||||
The Global Industry Classification Standard (GICS®) was developed by and/or is the exclusive property of MSCI, Inc. and Standard &
Poor Financial Services LLC (“S&P”). GICS is a service mark of MSCI and S&P and has been licensed for use by U.S. Bancorp Fund Services, LLC, doing business as U.S. Bank Global Fund Services (“Fund Services”).
|
(a)
|
Non-income producing security.
|
|
(b)
|
Foreign security.
|
|
(c)
|
100 shares per contract unless otherwise noted.
|
|
(d)
|
All or a portion of the assets have been committed as collateral for open securities sold short, written option contracts, swap contacts and futures contracts. The total value of assets committed as collateral
as of April 30, 2021, is $109,149,870.
|
|
(e)
|
The rate quoted is the annualized seven-day effective yield as of April 30, 2021.
|
|
(f)
|
Securities sold short are not owned by the Fund and cannot produce income.
|
|
(g)
|
Level 3 security. Please see Note 2 for more information.
|
|
(h)
|
Held in connection with a written option contract, see Schedule of Written Options for more details.
|
ADR – American Depository Receipt
CA – Canadian
ETF – Exchange Traded Fund
GDR – Global Depository Receipt
plc – Public Limited Company
Reg – Registered
The accompanying notes are an integral part of these financial statements.
44
WEISS ALTERNATIVE MULTI-STRATEGY FUND
Schedule of Written Options (Unaudited)
April 30, 2021
|
Contracts (a)
|
Notional Amount
|
Value
|
||||||||||
|
WRITTEN CALL OPTIONS
|
||||||||||||
|
AbbVie, Inc.
|
||||||||||||
|
Expiration: May 2021, Exercise Price: $115.00
|
(2
|
)
|
$
|
(22,300
|
)
|
$
|
(152
|
)
|
||||
|
Apple, Inc.
|
||||||||||||
|
Expiration: April 2021, Exercise Price: $141.00
|
(4
|
)
|
(52,584
|
)
|
(2
|
)
|
||||||
|
Expiration: May 2021, Exercise Price: $140.00
|
(5
|
)
|
(65,730
|
)
|
(270
|
)
|
||||||
|
Applied Materials, Inc.
|
||||||||||||
|
Expiration: May 2021, Exercise Price: $135.00
|
(2
|
)
|
(26,542
|
)
|
(825
|
)
|
||||||
|
Autoliv, Inc. (b)
|
||||||||||||
|
Expiration: May 2021, Exercise Price: $105.00
|
(3
|
)
|
(30,198
|
)
|
(330
|
)
|
||||||
|
Avaya Holdings Corporation
|
||||||||||||
|
Expiration: July 2021, Exercise Price: $45.00
|
(4
|
)
|
(11,508
|
)
|
(160
|
)
|
||||||
|
Best Buy Company, Inc.
|
||||||||||||
|
Expiration: May 2021, Exercise Price: $135.00
|
(3
|
)
|
(34,881
|
)
|
(46
|
)
|
||||||
|
Caterpillar, Inc.
|
||||||||||||
|
Expiration: May 2021, Exercise Price: $232.50
|
(1
|
)
|
(22,811
|
)
|
(347
|
)
|
||||||
|
Clever Leaves Holdings, Inc.
|
||||||||||||
|
Expiration: August 2021, Exercise Price: $35.00
|
(14
|
)
|
(14,028
|
)
|
(70
|
)
|
||||||
|
ConocoPhillips
|
||||||||||||
|
Expiration: May 2021, Exercise Price: $60.00
|
(7
|
)
|
(35,798
|
)
|
(168
|
)
|
||||||
|
The Estee Lauder Companies, Inc.
|
||||||||||||
|
Expiration: May 2021, Exercise Price: $320.00
|
(2
|
)
|
(62,760
|
)
|
(1,390
|
)
|
||||||
|
Freeport-McMoRan, Inc.
|
||||||||||||
|
Expiration: May 2021, Exercise Price: $46.00
|
(10
|
)
|
(37,710
|
)
|
(120
|
)
|
||||||
|
iPath Series B S&P 500 VIX Short-Term Futures ETN
|
||||||||||||
|
Expiration: May 2021, Exercise Price: $25.00
|
(3
|
)
|
(12,048
|
)
|
(18
|
)
|
||||||
|
Las Vegas Sands Corporation
|
||||||||||||
|
Expiration: May 2021, Exercise Price: $72.50
|
(7
|
)
|
(42,882
|
)
|
(94
|
)
|
||||||
|
Expiration: June 2021, Exercise Price: $72.50
|
(2
|
)
|
(12,252
|
)
|
(96
|
)
|
||||||
|
Expiration: January 2022, Exercise Price: $80.00
|
(14
|
)
|
(85,764
|
)
|
(3,381
|
)
|
||||||
|
Oracle Corporation
|
||||||||||||
|
Expiration: May 2021, Exercise Price: $75.00
|
(5
|
)
|
(37,895
|
)
|
(933
|
)
|
||||||
|
Expiration: May 2021, Exercise Price: $80.00
|
(28
|
)
|
(212,212
|
)
|
(798
|
)
|
||||||
|
PBF Energy, Inc.
|
||||||||||||
|
Expiration: June 2021, Exercise Price: $20.00
|
(65
|
)
|
(92,170
|
)
|
(1,625
|
)
|
||||||
|
Royal Caribbean Cruises Ltd.
|
||||||||||||
|
Expiration: May 2021, Exercise Price: $100.00
|
(7
|
)
|
(60,865
|
)
|
(322
|
)
|
||||||
|
SmileDirectClub, Inc.
|
||||||||||||
|
Expiration: May 2021, Exercise Price: $14.00
|
(3
|
)
|
(3,191
|
)
|
(45
|
)
|
||||||
|
TripAdvisor, Inc.
|
||||||||||||
|
Expiration: June 2021, Exercise Price: $60.00
|
(7
|
)
|
(32,991
|
)
|
(494
|
)
|
||||||
|
Uber Technologies, Inc.
|
||||||||||||
|
Expiration: May 2021, Exercise Price: $70.00
|
(7
|
)
|
(38,339
|
)
|
(137
|
)
|
||||||
The accompanying notes are an integral part of these financial statements.
45
WEISS ALTERNATIVE MULTI-STRATEGY FUND
Schedule of Written Options (Unaudited) – Continued
April 30, 2021
|
Contracts (a)
|
Notional Amount
|
Value
|
||||||||||
|
WRITTEN CALL OPTIONS (Continued)
|
||||||||||||
|
Vertex Pharmaceuticals, Inc.
|
||||||||||||
|
Expiration: June 2021, Exercise Price: $250.00
|
(1
|
)
|
$
|
(21,820
|
)
|
$
|
(520
|
)
|
||||
|
The Walt Disney Company
|
||||||||||||
|
Expiration: May 2021, Exercise Price: $190.00
|
(4
|
)
|
(74,408
|
)
|
(1,620
|
)
|
||||||
|
Zynga, Inc.
|
||||||||||||
|
Expiration: May 2021, Exercise Price: $14.00
|
(79
|
)
|
(85,478
|
)
|
(277
|
)
|
||||||
| (14,240 | ) | |||||||||||
|
WRITTEN PUT OPTIONS
|
||||||||||||
|
AMC Entertainment Holdings, Inc.
|
||||||||||||
|
Expiration: May 2021, Exercise Price: $5.00
|
(12
|
)
|
(12,036
|
)
|
(30
|
)
|
||||||
|
Apple, Inc.
|
||||||||||||
|
Expiration: May 2021, Exercise Price: $125.00
|
(5
|
)
|
(65,730
|
)
|
(430
|
)
|
||||||
|
ConocoPhillips
|
||||||||||||
|
Expiration: May 2021, Exercise Price: $45.00
|
(7
|
)
|
(35,798
|
)
|
(238
|
)
|
||||||
|
DexCom, Inc.
|
||||||||||||
|
Expiration: May 2021, Exercise Price: $370.00
|
(1
|
)
|
(38,610
|
)
|
(595
|
)
|
||||||
|
Expiration: May 2021, Exercise Price: $380.00
|
(1
|
)
|
(38,610
|
)
|
(930
|
)
|
||||||
|
DraftKings, Inc.
|
||||||||||||
|
Expiration: May 2021, Exercise Price: $45.00
|
(2
|
)
|
(11,332
|
)
|
(72
|
)
|
||||||
|
Gentex Corporation
|
||||||||||||
|
Expiration: May 2021, Exercise Price: $35.00
|
(1
|
)
|
(3,518
|
)
|
(65
|
)
|
||||||
|
iShares Russell 2000 ETF
|
||||||||||||
|
Expiration: May 2021, Exercise Price: $212.00
|
(6
|
)
|
(134,934
|
)
|
(930
|
)
|
||||||
|
QUALCOMM, Inc.
|
||||||||||||
|
Expiration: May 2021, Exercise Price: $137.00
|
(3
|
)
|
(41,640
|
)
|
(793
|
)
|
||||||
|
The Scotts Miracle-Gro Company
|
||||||||||||
|
Expiration: May 2021, Exercise Price: $220.00
|
(4
|
)
|
(92,464
|
)
|
(1,420
|
)
|
||||||
|
SPDR S&P 500 ETF Trust
|
||||||||||||
|
Expiration: May 2021, Exercise Price: $385.00
|
(15
|
)
|
(625,950
|
)
|
(1,328
|
)
|
||||||
|
Take-Two Interactive Software, Inc.
|
||||||||||||
|
Expiration: May 2021, Exercise Price: $160.00
|
(3
|
)
|
(52,614
|
)
|
(540
|
)
|
||||||
|
Expiration: May 2021, Exercise Price: $165.00
|
(3
|
)
|
(52,614
|
)
|
(885
|
)
|
||||||
|
(8,256
|
)
|
|||||||||||
|
TOTAL WRITTEN OPTIONS
|
||||||||||||
|
(Premiums received $37,599)
|
$
|
(22,496
|
)
|
|||||||||
|
(a)
|
100 shares per contract.
|
|
(b)
|
Foreign security.
|
ETF – Exchange Traded Fund
The accompanying notes are an integral part of these financial statements.
46
WEISS ALTERNATIVE MULTI-STRATEGY FUND
Schedule of Open Swap Contracts (Unaudited)
April 30, 2021
|
Value of
|
|||||||||
|
Pay/Receive
|
Number of
|
Unrealized
|
|||||||
|
Counter-
|
Maturity
|
Financing
|
Financing
|
Payment
|
Shares/
|
Notional
|
Upfront
|
Appreciation
|
|
|
party
|
Security
|
Date
|
Rate
|
Rate
|
Frequency
|
Units
|
Amount
|
Payment
|
(Depreciation)*
|
|
LONG EQUITY SWAP CONTRACTS
|
|||||||||
|
Morgan
|
Accor SA
|
11/29/21
|
Pay
|
0.600% +
|
Monthly
|
9,650
|
$ 388,571
|
$ —
|
$ 6,468
|
|
Stanley
|
1 Day EONIA(3)
|
||||||||
|
Morgan
|
AIB Group plc
|
2/1/22
|
Pay
|
0.600%
|
Monthly
|
37,369
|
109,173
|
—
|
15,180
|
|
Stanley
|
+ 1 Day SONIA(1)
|
||||||||
|
Morgan
|
Airbus Group SE
|
11/29/22
|
Receive
|
(0.500)% +
|
Monthly
|
5,768
|
693,661
|
—
|
6,647
|
|
Stanley
|
1 Day EONIA(3)
|
||||||||
|
Morgan
|
Banco Bilbao
|
5/6/22
|
Pay
|
0.600% +
|
Monthly
|
43,124
|
241,478
|
—
|
9,586
|
|
Stanley
|
Vizcaya
|
1 Day EONIA(3)
|
|||||||
|
Argentaria SA
|
|||||||||
|
Morgan
|
Bankinter SA
|
5/6/22
|
Pay
|
0.600% +
|
Monthly
|
28,864
|
157,845
|
—
|
(38,251)
|
|
Stanley
|
1 Day EONIA(3)
|
||||||||
|
Morgan
|
Barclays plc
|
5/6/22
|
Pay
|
0.600% +
|
Monthly
|
102,606
|
248,405
|
—
|
(14,804)
|
|
Stanley
|
1 Day SONIA(1)
|
||||||||
|
Morgan
|
BNP
|
5/6/22
|
Pay
|
0.600% +
|
Monthly
|
4,911
|
314,884
|
—
|
12,082
|
|
Stanley
|
Paribas SA
|
1 Day SONIA(1)
|
|||||||
|
Morgan
|
Coca-Cola
|
5/6/22
|
Receive
|
(0.500)% +
|
Monthly
|
2,384
|
82,395
|
—
|
330
|
|
Stanley
|
HBC AG
|
1 Day EONIA(3)
|
|||||||
|
Morgan
|
Custom Weiss US
|
4/1/22
|
Pay
|
0.500% +
|
Monthly
|
138
|
32,228
|
—
|
720
|
|
Stanley
|
Quality Short
|
FED(2)
|
|||||||
|
Morgan
|
easyJet plc
|
5/6/22
|
Receive
|
(0.500)% +
|
Monthly
|
6,435
|
92,000
|
—
|
3,796
|
|
Stanley
|
1 Day SONIA(1)
|
||||||||
|
Morgan
|
Entain plc
|
4/25/22
|
Pay
|
0.600% + 1
|
Monthly
|
11,005
|
257,259
|
—
|
20,223
|
|
Stanley
|
Day SONIA(1)
|
||||||||
|
Morgan
|
Flutter
|
5/6/22
|
Receive
|
(0.500)% +
|
Monthly
|
405
|
82,993
|
—
|
(5,194)
|
|
Stanley
|
Entertainment plc
|
1 Day EONIA(3)
|
|||||||
|
Morgan
|
High Beta
|
2/2/22
|
Receive
|
(0.450)% +
|
Monthly
|
567
|
35,965
|
—
|
(552)
|
|
Stanley
|
Cyclicals
|
FED(2)
|
|||||||
|
Morgan
|
InterContinental
|
3/22/23
|
Pay
|
0.600% +
|
Monthly
|
886
|
62,962
|
—
|
(195)
|
|
Stanley
|
Hotels Group plc
|
1 Day SONIA(1)
|
|||||||
|
Morgan
|
International
|
1/9/23
|
Receive
|
(0.500)% +
|
Monthly
|
22,683
|
63,610
|
—
|
(373)
|
|
Stanley
|
Consolidated
|
1 Day SONIA(1)
|
|||||||
|
Airlines Group SA
|
|||||||||
|
Morgan
|
Lloyds Banking
|
5/6/22
|
Pay
|
0.600% +
|
Monthly
|
458,982
|
287,817
|
—
|
14,653
|
|
Stanley
|
Group plc
|
1 Day SONIA(1)
|
|||||||
|
Morgan
|
London Stock
|
5/6/22
|
Receive
|
(0.500)% +
|
Monthly
|
545
|
55,681
|
—
|
(1,418)
|
|
Stanley
|
Exchange Group
|
1 Day EONIA(3)
|
|||||||
|
Morgan
|
MSGWELVE
|
3/22/23
|
Pay
|
0.500% +
|
Monthly
|
13
|
1,877
|
—
|
(35)
|
|
Stanley
|
Basket
|
FED(2)
|
|||||||
|
Morgan
|
MSWEJTRD
|
2/9/22
|
Receive
|
(0.450)% +
|
Monthly
|
16,256
|
195,215
|
—
|
4,679
|
|
Stanley
|
Basket
|
1 Day EONIA(3)
|
|||||||
The accompanying notes are an integral part of these financial statements.
47
WEISS ALTERNATIVE MULTI-STRATEGY FUND
Schedule of Open Swap Contracts (Unaudited) – Continued
April 30, 2021
|
Value of
|
|||||||||
|
Pay/Receive
|
Number of
|
Unrealized
|
|||||||
|
Counter-
|
Maturity
|
Financing
|
Financing
|
Payment
|
Shares/
|
Notional
|
Upfront
|
Appreciation
|
|
|
party
|
Security
|
Date
|
Rate
|
Rate
|
Frequency
|
Units
|
Amount
|
Payment
|
(Depreciation)*
|
|
LONG EQUITY SWAP CONTRACTS (Continued)
|
|||||||||
|
Morgan
|
Ocado
|
4/18/23
|
Pay
|
0.600% +
|
Monthly
|
909
|
$ 26,314
|
$ —
|
$ (539)
|
|
Stanley
|
Group plc
|
1 Day SONIA(1)
|
|||||||
|
Morgan
|
Poste
|
3/22/23
|
Receive
|
(0.500)% +
|
Monthly
|
6,965
|
91,180
|
—
|
2,974
|
|
Stanley
|
Italiane SpA
|
1 Day EONIA(3)
|
|||||||
|
Morgan
|
Schneider
|
11/29/21
|
Pay
|
0.600% +
|
Monthly
|
251
|
40,049
|
—
|
(1,547)
|
|
Stanley
|
Electric SA
|
1 Day EONIA(3)
|
|||||||
|
Morgan
|
Standard
|
1/9/23
|
Pay
|
0.600% +
|
Monthly
|
40,236
|
288,649
|
—
|
10,864
|
|
Stanley
|
Chartered plc
|
1 Day SONIA(1)
|
|||||||
|
Morgan
|
Tate & Lyle plc
|
4/18/23
|
Pay
|
0.600% +
|
Monthly
|
6,885
|
76,165
|
—
|
2,824
|
|
Stanley
|
1 Day SONIA(1)
|
||||||||
|
Morgan
|
The Morgan
|
7/20/21
|
Receive
|
(0.850)%
|
Monthly
|
1,688
|
168,445
|
—
|
(2,126)
|
|
Stanley
|
Stanley Cyclicals
|
Fixed Rate
|
|||||||
|
vs. Defensives
|
|||||||||
|
Baskets
|
|||||||||
|
Morgan
|
The Morgan
|
2/8/22
|
Pay
|
0.860%
|
Monthly
|
402
|
42,396
|
—
|
(255)
|
|
Stanley
|
Stanley U.S.
|
Fixed Rate
|
|||||||
|
Momentum
|
|||||||||
|
Long Basket
|
|||||||||
|
Morgan
|
U.S. Quality
|
12/31/22
|
Pay
|
0.085%
|
Monthly
|
2,869
|
215,146
|
—
|
(1,081)
|
|
Stanley
|
Basket
|
Fixed Rate
|
|||||||
|
Morgan
|
U.S. 3-Month
|
12/31/22
|
Pay
|
0.500%
|
Monthly
|
16
|
1,976
|
—
|
28
|
|
Stanley
|
Momentum
|
Fixed Rate
|
|||||||
|
Morgan
|
Vacation
|
2/9/22
|
Receive
|
(0.450)% +
|
Monthly
|
1,066
|
184,215
|
—
|
(5,095)
|
|
Stanley
|
Basket
|
1 Day EONIA(3)
|
|||||||
|
Morgan
|
Worldline SA
|
12/7/22
|
Pay
|
0.600% +
|
Monthly
|
4,896
|
480,653
|
—
|
56,096
|
|
Stanley
|
1 Day SONIA(1)
|
||||||||
|
SHORT EQUITY SWAP CONTRACTS
|
|||||||||
|
Morgan
|
ABN AMRO
|
5/6/22
|
Receive
|
0.600% +
|
Monthly
|
(14,187)
|
(183,185)
|
—
|
(2,390)
|
|
Stanley
|
Bank
|
1 Day EONIA(3)
|
|||||||
|
Morgan
|
Adyen NV
|
6/30/22
|
Pay
|
(0.400)% +
|
Monthly
|
(49)
|
(120,594)
|
—
|
(13,843)
|
|
Stanley
|
FED(2)
|
||||||||
|
Morgan
|
Airbus
|
11/29/22
|
Receive
|
0.600% +
|
Monthly
|
(159)
|
(19,121)
|
—
|
61
|
|
Stanley
|
Group SE
|
1 Day EONIA(3)
|
|||||||
|
Morgan
|
Aviva plc
|
5/6/22
|
Pay
|
(0.500)% +
|
Monthly
|
(11,586)
|
(64,054)
|
—
|
767
|
|
Stanley
|
1 Day SONIA(1)
|
||||||||
|
Morgan
|
AXA SA
|
5/6/22
|
Receive
|
0.600% +
|
Monthly
|
(2,338)
|
(66,037)
|
—
|
(290)
|
|
Stanley
|
1 Day EONIA(3)
|
||||||||
|
Morgan
|
Banco
|
5/6/22
|
Pay
|
(0.650)% +
|
Monthly
|
(76,654)
|
(295,698)
|
—
|
(36,928)
|
|
Stanley
|
Santander SA
|
1 Day EONIA(3)
|
|||||||
The accompanying notes are an integral part of these financial statements.
48
WEISS ALTERNATIVE MULTI-STRATEGY FUND
Schedule of Open Swap Contracts (Unaudited) – Continued
April 30, 2021
|
Value of
|
|||||||||
|
Pay/Receive
|
Number of
|
Unrealized
|
|||||||
|
Counter-
|
Maturity
|
Financing
|
Financing
|
Payment
|
Shares/
|
Notional
|
Upfront
|
Appreciation
|
|
|
party
|
Security
|
Date
|
Rate
|
Rate
|
Frequency
|
Units
|
Amount
|
Payment
|
(Depreciation)*
|
|
SHORT EQUITY SWAP CONTRACTS (Continued)
|
|||||||||
|
Morgan
|
Bank of
|
2/1/22
|
Pay
|
(0.500)% +
|
Monthly
|
(32,396)
|
$(189,836)
|
$ —
|
$(20,785)
|
|
Stanley
|
Ireland Group plc
|
1 Day SONIA(1)
|
|||||||
|
Morgan
|
CaixaBank SA
|
1/9/23
|
Receive
|
0.600% +
|
Monthly
|
(64,167)
|
(205,269)
|
—
|
(8,934)
|
|
Stanley
|
1 Day SONIA(1)
|
||||||||
|
Morgan
|
Communications
|
3/22/23
|
Receive
|
0.500% +
|
Monthly
|
(2,113)
|
(116,849)
|
—
|
(12,827)
|
|
Stanley
|
Equipment
|
FED(2)
|
|||||||
|
Basket
|
|||||||||
|
Morgan
|
Custom Weiss US
|
4/1/22
|
Pay
|
(0.400)% +
|
Monthly
|
(1,460)
|
(348,122)
|
—
|
(3,942)
|
|
Stanley
|
Momentum Long
|
FED(2)
|
|||||||
|
Morgan
|
Danone SA
|
5/6/22
|
Pay
|
(0.650)% +
|
Monthly
|
(470)
|
(33,177)
|
—
|
81
|
|
Stanley
|
1 Day EONIA(3)
|
||||||||
|
Morgan
|
Dassault
|
11/29/21
|
Pay
|
(0.500)% +
|
Monthly
|
(776)
|
(180,012)
|
—
|
(5,235)
|
|
Stanley
|
Systems SE
|
1 Day SONIA(1)
|
|||||||
|
Morgan
|
Entain plc
|
2/1/22
|
Pay
|
(0.500)% +
|
Monthly
|
(7,320)
|
(171,116)
|
—
|
(17,364)
|
|
Stanley
|
1 Day SONIA(1)
|
||||||||
|
Morgan
|
Growth vs.
|
2/8/22
|
Receive
|
0.900%
|
Monthly
|
(1,575)
|
(228,863)
|
—
|
3,610
|
|
Stanley
|
Value Basket
|
Fixed Rate
|
|||||||
|
Morgan
|
Hitachi Ltd.
|
9/8/21
|
Receive
|
0.200% +
|
Monthly
|
(36,828)
|
(399,723)
|
—
|
(27,707)
|
|
Stanley
|
1 Month LIBOR(5)
|
||||||||
|
Morgan
|
HSBC
|
5/6/22
|
Pay
|
(0.500)% +
|
Monthly
|
(19,265)
|
(120,285)
|
—
|
(880)
|
|
Stanley
|
Holdings plc
|
1 Day SONIA(1)
|
|||||||
|
Morgan
|
Infotech
|
6/30/22
|
Pay
|
(0.400)% +
|
Monthly
|
(3,408)
|
(671,853)
|
—
|
(35,652)
|
|
Stanley
|
Basket
|
FED(2)
|
|||||||
|
Morgan
|
Lyxor
|
5/6/22
|
Pay
|
(0.500)% +
|
Monthly
|
(648)
|
(48,277)
|
—
|
—
|
|
Stanley
|
CAC 40 (DR)
|
1 Day EONIA(3)
|
|||||||
|
UCITS ETF
|
|||||||||
|
Morgan
|
Media Basket
|
11/23/22
|
Pay
|
(0.500)% +
|
Monthly
|
(1,328)
|
(120,662)
|
—
|
(418)
|
|
Stanley
|
FED(2)
|
||||||||
|
Morgan
|
MSGWNPTC
|
2/2/22
|
Pay
|
(0.300)% +
|
Monthly
|
(125)
|
(10,191)
|
—
|
2,707
|
|
Stanley
|
Basket
|
FED(2)
|
|||||||
|
Morgan
|
MSGWUQLS
|
4/1/22
|
Receive
|
0.500% +
|
Monthly
|
(861)
|
(201,078)
|
—
|
(4,229)
|
|
Stanley
|
INDEX SWAP
|
FED(2)
|
|||||||
|
Morgan
|
U.S. Quality
|
2/2/22
|
Pay
|
(0.550)%
|
Monthly
|
(831)
|
(193,274)
|
—
|
(873)
|
|
Stanley
|
Short Basket
|
Fixed Rate
|
|||||||
|
Morgan
|
MSWI0001
|
6/30/22
|
Pay
|
(0.500)% +
|
Monthly
|
(4,870)
|
(637,256)
|
—
|
(23,394)
|
|
Stanley
|
Basket
|
FED(2)
|
|||||||
|
Morgan
|
Morgan
|
11/23/22
|
Pay
|
(0.200)% +
|
Monthly
|
(1,287)
|
(228,443)
|
—
|
(1,029)
|
|
Stanley
|
Stanley Crowd
|
FED(2)
|
|||||||
|
Basket
|
|||||||||
|
Morgan
|
Natixis
|
5/3/23
|
Pay
|
(0.500)% +
|
Monthly
|
(11,596)
|
(56,624)
|
—
|
(1,271)
|
|
Stanley
|
1 Day SONIA(1)
|
||||||||
The accompanying notes are an integral part of these financial statements.
49
WEISS ALTERNATIVE MULTI-STRATEGY FUND
Schedule of Open Swap Contracts (Unaudited) – Continued
April 30, 2021
|
Value of
|
|||||||||
|
Pay/Receive
|
Number of
|
Unrealized
|
|||||||
|
Counter-
|
Maturity
|
Financing
|
Financing
|
Payment
|
Shares/
|
Notional
|
Upfront
|
Appreciation
|
|
|
party
|
Security
|
Date
|
Rate
|
Rate
|
Frequency
|
Units
|
Amount
|
Payment
|
(Depreciation)*
|
|
SHORT EQUITY SWAP CONTRACTS (Continued)
|
|||||||||
|
Morgan
|
NatWest
|
4/18/23
|
Receive
|
0.600% +
|
Monthly
|
(75,705)
|
$(205,448)
|
$ —
|
$ (3,182)
|
|
Stanley
|
Group plc
|
1 Day SONIA(1)
|
|||||||
|
Morgan
|
Prudential plc
|
5/6/22
|
Pay
|
(0.500)% +
|
Monthly
|
(7,721)
|
(163,486)
|
—
|
(3,973)
|
|
Stanley
|
1 Day SONIA(1)
|
||||||||
|
Morgan
|
Royal Mail plc
|
5/6/22
|
Receive
|
0.600% +
|
Monthly
|
(7,230)
|
(49,534)
|
—
|
(1,731)
|
|
Stanley
|
1 Day EONIA(3)
|
||||||||
|
Morgan
|
SAAS Basket
|
6/30/22
|
Pay
|
(0.400)% +
|
Monthly
|
(243)
|
(150,981)
|
—
|
3,861
|
|
Stanley
|
FED(2)
|
||||||||
|
Morgan
|
Schroders plc
|
5/6/22
|
Pay
|
(0.500)% +
|
Monthly
|
(601)
|
(29,944)
|
—
|
(3,646)
|
|
Stanley
|
1 Day SONIA(1)
|
||||||||
|
Morgan
|
Societe
|
5/6/22
|
Pay
|
(0.500)% +
|
Monthly
|
(11,012)
|
(313,262)
|
—
|
(13,695)
|
|
Stanley
|
Generale SA
|
1 Day SONIA(1)
|
|||||||
|
Morgan
|
Software
|
4/1/22
|
Pay
|
(0.400)% +
|
Monthly
|
(2,396)
|
(477,379)
|
—
|
28,475
|
|
Stanley
|
Basket
|
FED(2)
|
|
||||||
|
Morgan
|
Standard
|
1/9/23
|
Pay
|
(0.500)% +
|
Monthly
|
(2,335)
|
(16,751)
|
—
|
(845)
|
|
Stanley
|
Chartered plc
|
1 Day SONIA(1)
|
|||||||
|
Morgan
|
Stay at
|
2/2/22
|
Pay
|
(0.250)% +
|
Monthly
|
(140)
|
(25,663)
|
—
|
3,076
|
|
Stanley
|
Home Basket
|
FED(2)
|
|||||||
|
Morgan
|
The Morgan
|
7/20/21
|
Receive
|
0.850%
|
Monthly
|
(599)
|
(59,774)
|
—
|
672
|
|
Stanley
|
Stanley Cyclicals
|
Fixed Rate
|
|||||||
|
vs. Defensives
|
|||||||||
|
Baskets
|
|||||||||
|
Morgan
|
The Morgan
|
3/27/23
|
Pay
|
(0.750)% +
|
Monthly
|
(2,765)
|
(674,446)
|
—
|
(53,457)
|
|
Stanley
|
Stanley U.S.
|
FED(2)
|
|||||||
|
Growth
|
|||||||||
|
Long Basket
|
|||||||||
|
Morgan
|
U.S. Value
|
9/8/21
|
Pay
|
(0.400)% +
|
Monthly
|
(78)
|
(29,075)
|
—
|
1,403
|
|
Stanley
|
Short Basket
|
TONAR(4)
|
|||||||
|
Morgan
|
Unprofitable
|
2/8/22
|
Receive
|
0.500% +
|
Monthly
|
(12,802)
|
(1,023,904)
|
—
|
25,367
|
|
Stanley
|
Tech Basket
|
FED(2)
|
|||||||
|
Morgan
|
Volkswagon
|
4/1/22
|
Pay
|
(0.700)% +
|
Monthly
|
(3,023)
|
(390,700)
|
—
|
1,763
|
|
Stanley
|
Group Hedged
|
FED(2)
|
|||||||
|
Basket
|
|||||||||
|
$(130,992)
|
|||||||||
|
(1)
|
Sterling OverNight Index Average
|
|
(2)
|
Federal Funds Rate
|
|
(3)
|
Euro OverNight Index Average
|
|
(4)
|
Bank of Japan Estimate Unsecured Overnight Call Rate
|
|
(5)
|
London Interbank Offered Rate
|
|
plc –
|
Public Limited Company |
|
*
|
Based on the net swap value held at each counterparty, unrealized appreciation is a receivable and unrealized depreciation is a payable.
|
The accompanying notes are an integral part of these financial statements.
50
WEISS ALTERNATIVE MULTI-STRATEGY FUND
Schedule of Open Futures Contracts (Unaudited)
April 30, 2021
|
Value and
|
|||||||||||||
|
Number of
|
Unrealized
|
||||||||||||
|
Contracts
|
Notional
|
Appreciation
|
|||||||||||
|
Expiration Date
|
Description
|
Purchased
|
Amount
|
(Depreciation)
|
|||||||||
|
LONG FUTURES CONTRACTS
|
|||||||||||||
|
6/21/21
|
CBT 10-Year U.S. Treasury Bond
|
260
|
$
|
28,396,229
|
$
|
(452,264
|
)
|
||||||
|
6/21/21
|
CBT Long Term U.S. Treasury Bond
|
22
|
3,027,062
|
(52,910
|
)
|
||||||||
|
6/21/21
|
CBT Ultra Long Term U.S. Treasury Bond
|
166
|
18,846,471
|
(474,734
|
)
|
||||||||
|
6/18/21
|
E-Mini Russell 2000
|
18
|
2,035,350
|
(72,297
|
)
|
||||||||
|
6/18/21
|
E-Mini S&P 500
|
90
|
18,784,800
|
948,674
|
|||||||||
|
6/18/21
|
E-Mini S&P MidCap 400
|
38
|
10,337,140
|
164,611
|
|||||||||
|
$
|
81,427,052
|
$
|
61,080
|
||||||||||
The accompanying notes are an integral part of these financial statements.
51
WEISS ALTERNATIVE MULTI-STRATEGY FUND
(This Page Intentionally Left Blank.)
52
WEISS ALTERNATIVE MULTI-STRATEGY FUND
Statement of Assets and Liabilities (Unaudited)
April 30, 2021
|
ASSETS:
|
||||
|
Investments, at value (Cost $172,168,411)
|
$
|
176,403,166
|
||
|
Cash
|
100,000
|
|||
|
Deposits at broker for securities sold short
|
65,169,150
|
|||
|
Receivable for investments sold
|
28,393,622
|
|||
|
Deposits for futures
|
3,081,196
|
|||
|
Collateral for swap contracts
|
1,501,000
|
|||
|
Receivable for fund shares sold
|
236,382
|
|||
|
Dividends and interest receivable
|
30,849
|
|||
|
Prepaid expenses and other receivables
|
33,902
|
|||
|
Total assets
|
274,949,267
|
|||
|
LIABILITIES:
|
||||
|
Securities sold short, at value (Proceeds of $63,878,097)
|
65,874,556
|
|||
|
Written option contracts, at value (Premiums received $37,599)
|
22,496
|
|||
|
Payable for foreign currency, at value (Proceeds $570,186)
|
557,144
|
|||
|
Payable for investments purchased
|
27,888,594
|
|||
|
Variation margin payable, net
|
235,132
|
|||
|
Payable to Adviser
|
127,182
|
|||
|
Payable for swap contracts, net
|
125,524
|
|||
|
Payable for custodian fees
|
56,879
|
|||
|
Dividends and interest payable for securities sold short
|
74,656
|
|||
|
Payable for fund administration and fund accounting fees
|
30,462
|
|||
|
Payable for transfer agent fees and expenses
|
13,078
|
|||
|
Payable for fund shares redeemed
|
5,317
|
|||
|
Payable for compliance fees
|
2,576
|
|||
|
Distribution and shareholder servicing fees payable
|
2,575
|
|||
|
Accrued expenses and other liabilities
|
47,913
|
|||
|
Total liabilities
|
95,064,084
|
|||
|
NET ASSETS
|
$
|
179,885,183
|
||
|
NET ASSETS CONSISTS OF:
|
||||
|
Paid-in capital
|
$
|
176,981,944
|
||
|
Total distributable earnings
|
2,903,239
|
|||
|
Total net assets
|
$
|
179,885,183
|
||
|
Class K
|
Investor
|
|||||||
|
Shares
|
Class Shares
|
|||||||
|
Net assets
|
$
|
171,945,299
|
$
|
7,939,884
|
||||
|
Shares issued and outstanding(1)
|
16,117,247
|
753,154
|
||||||
|
Net asset value and offering price per share
|
$
|
10.67
|
$
|
10.54
|
||||
|
(1)
|
Unlimited shares authorized without par value.
|
The accompanying notes are an integral part of these financial statements.
53
WEISS ALTERNATIVE MULTI-STRATEGY FUND
Statement of Operations (Unaudited)
For the Six Months Ended April 30, 2021
|
INVESTMENT INCOME:
|
||||
|
Dividend income on long positions (net of foreign withholding taxes of $7,048)
|
$
|
1,432,223
|
||
|
Interest income, including broker interest on short positions
|
144,928
|
|||
|
Total investment income
|
1,577,151
|
|||
|
EXPENSES:
|
||||
|
Investment advisory fees (See Note 3)
|
1,019,973
|
|||
|
Dividends on securities sold short
|
613,893
|
|||
|
Borrowing expense on securities sold short
|
301,059
|
|||
|
Custodian fees (See Note 3)
|
270,370
|
|||
|
Fund administration and fund accounting fees (See Note 3)
|
115,497
|
|||
|
Transfer agent fees (See Note 3)
|
48,537
|
|||
|
Audit fees
|
24,546
|
|||
|
Federal and state registration fees
|
17,314
|
|||
|
Legal fees
|
16,251
|
|||
|
Distribution fees – Investor Class (See Note 5)
|
8,841
|
|||
|
Compliance fees (See Note 3)
|
8,009
|
|||
|
Reports to shareholders
|
6,761
|
|||
|
Trustees’ fees (See Note 3)
|
6,190
|
|||
|
Insurance fees
|
4,552
|
|||
|
Shareholder servicing fees – Investor Class (See Note 5)
|
3,536
|
|||
|
Other
|
2,430
|
|||
|
Total expenses before reimbursement
|
2,467,759
|
|||
|
Less: Expense reimbursement by Adviser (See Note 3)
|
(520,457
|
)
|
||
|
Net expenses
|
1,947,302
|
|||
|
NET INVESTMENT LOSS
|
(370,151
|
)
|
||
|
REALIZED AND CHANGE IN UNREALIZED GAIN (LOSS) ON INVESTMENTS:
|
||||
|
Net realized gain (loss) on:
|
||||
|
Investments
|
19,551,032
|
|||
|
Securities sold short
|
(14,292,079
|
)
|
||
|
Written option contracts expired or closed
|
32,307
|
|||
|
Swap contracts
|
206,764
|
|||
|
Futures contracts
|
2,417,040
|
|||
|
Forward currency contracts
|
(2,530
|
)
|
||
|
Foreign currency transactions
|
(24,168
|
)
|
||
|
Net realized gain
|
7,888,366
|
|||
|
Net change in unrealized appreciation (depreciation) on:
|
||||
|
Investments
|
3,792,884
|
|||
|
Securities sold short
|
(3,327,670
|
)
|
||
|
Written option contracts
|
8,626
|
|||
|
Swap contracts
|
39,064
|
|||
|
Futures contracts
|
446,841
|
|||
|
Forward currency contracts
|
71
|
|||
|
Foreign currency translation
|
11,086
|
|||
|
Net change in unrealized appreciation
|
970,902
|
|||
|
Net realized and change in unrealized gain on investments
|
8,859,268
|
|||
|
NET INCREASE IN NET ASSETS RESULTING FROM OPERATIONS
|
$
|
8,489,117
|
||
The accompanying notes are an integral part of these financial statements.
54
WEISS ALTERNATIVE MULTI-STRATEGY FUND
Statements of Changes in Net Assets
|
Six Months Ended
|
||||||||
|
April 30, 2021
|
Year Ended
|
|||||||
|
(Unaudited)
|
October 31, 2020
|
|||||||
|
OPERATIONS:
|
||||||||
|
Net investment loss
|
$
|
(370,151
|
)
|
$
|
(242,607
|
)
|
||
|
Net realized gain on investments, securities sold short, written option contracts
|
||||||||
|
expired or closed, swap contracts, futures contracts, forward currency contracts,
|
||||||||
|
and foreign currency transactions
|
7,888,366
|
5,158,137
|
||||||
|
Change in unrealized appreciation on investments, securities sold short,
|
||||||||
|
written option contracts, swap contracts, futures contracts, forward currency
|
||||||||
|
contracts, and foreign currency translation
|
970,902
|
221,999
|
||||||
|
Net increase in net assets resulting from operations
|
8,489,117
|
5,137,529
|
||||||
|
DISTRIBUTIONS TO SHAREHOLDERS:
|
||||||||
|
Class K
|
(6,974,185
|
)
|
(9,169,641 | ) | ||||
|
Investor Class
|
(457,953
|
)
|
(568,710 | ) | ||||
|
Total distributions to shareholders
|
(7,432,138
|
)
|
(9,738,351
|
)
|
||||
|
CAPITAL SHARE TRANSACTIONS:
|
||||||||
|
Net increase in net assets resulting from capital share transactions(1)
|
81,058,314
|
7,256,590
|
||||||
|
NET INCREASE IN NET ASSETS
|
82,115,293
|
2,655,768
|
||||||
|
NET ASSETS:
|
||||||||
|
Beginning of period
|
97,769,890
|
95,114,122
|
||||||
|
End of period
|
$
|
179,885,183
|
$
|
97,769,890
|
||||
|
(1)
|
A summary of capital share transactions is a3s follows:
|
SHARE TRANSACTIONS:
|
For the Six Months Ended
|
||||||||||||||||
|
April 30, 2021
|
For the Year Ended
|
|||||||||||||||
|
(Unaudited)
|
October 31, 2020
|
|||||||||||||||
|
Shares
|
Amount
|
Shares
|
Amount
|
|||||||||||||
|
Class K:
|
||||||||||||||||
|
Issued
|
8,969,215
|
$
|
95,124,815
|
1,268,413
|
$
|
13,295,986
|
||||||||||
|
Issued to holders in
|
||||||||||||||||
|
reinvestment of dividends
|
666,111
|
6,974,185
|
617,320
|
6,315,180
|
||||||||||||
|
Redeemed
|
(2,128,924
|
)
|
(23,080,229
|
)
|
(1,242,096
|
)
|
(13,070,540
|
)
|
||||||||
|
Redemption fees
|
—
|
—
|
—
|
—
|
||||||||||||
|
Net increase in Class K
|
7,506,402
|
$
|
79,018,771
|
643,637
|
$
|
6,540,626
|
||||||||||
|
Investor Class:
|
||||||||||||||||
|
Issued
|
194,822
|
$
|
2,052,346
|
97,053
|
$
|
1,005,108
|
||||||||||
|
Issued to holders in
|
||||||||||||||||
|
reinvestment of dividends
|
44,204
|
457,953
|
55,975
|
568,710
|
||||||||||||
|
Redeemed
|
(45,021
|
)
|
(470,756
|
)
|
(85,616
|
)
|
(857,855
|
)
|
||||||||
|
Redemption fees
|
—
|
—
|
—
|
1
|
||||||||||||
|
Net increase in Investor Class
|
194,005
|
$
|
2,039,543
|
67,412
|
$
|
715,964
|
||||||||||
|
Net increase in shares outstanding
|
7,700,407
|
$
|
81,058,314
|
711,049
|
$
|
7,256,590
|
||||||||||
The accompanying notes are an integral part of these financial statements.
55
WEISS ALTERNATIVE MULTI-STRATEGY FUND
Statement of Cash Flows
For the Period Ended April 30, 2021
|
CASH FLOWS FROM OPERATING ACTIVITIES:
|
||||
|
Net increase in net assets resulting from operations
|
$
|
8,489,117
|
||
|
Adjustments to reconcile net increase in net assets from operations to net cash from operating activities:
|
||||
|
Purchases of investments
|
(452,883,397
|
)
|
||
|
Purchases of short-term investments, net
|
(18,311,425
|
)
|
||
|
Proceeds from sales of investments
|
411,242,480
|
|||
|
Increase in variation margin for futures contracts
|
(22,338
|
)
|
||
|
Increase in receivable for investments sold
|
(18,430,794
|
)
|
||
|
Increase in net receivable for swap contracts
|
(44,532
|
)
|
||
|
Decrease in payable for forward currency contracts
|
(71
|
)
|
||
|
Increase in net payable to Adviser
|
169,895
|
|||
|
Increase in dividends and interest receivable
|
(5,838
|
)
|
||
|
Increase in prepaid expenses and other receivables
|
(25,663
|
)
|
||
|
Proceeds from securities sold short
|
407,431,120
|
|||
|
Purchases to cover securities sold short
|
(394,672,430
|
)
|
||
|
Premiums received on written option contracts
|
526,393
|
|||
|
Written option contracts expired or closed
|
(480,616
|
)
|
||
|
Increase in payable for investments purchased
|
16,615,285
|
|||
|
Decrease in payable for fund administration and fund accounting fees
|
(12,162
|
)
|
||
|
Decrease in payable for custodian fees
|
(31,212
|
)
|
||
|
Decrease in payable for transfer agent fees and expenses
|
(2,726
|
)
|
||
|
Decrease in net payable for unsettled futures contracts
|
(2,155
|
)
|
||
|
Increase in dividends and interest payable for securities sold short
|
44,220
|
|||
|
Decrease in payable for compliance fees
|
(117
|
)
|
||
|
Decrease in payable for trustees’ fees
|
(373
|
)
|
||
|
Increase in distribution and shareholder servicing fees payable
|
825
|
|||
|
Decrease in accrued expenses and other liabilities
|
(23,745
|
)
|
||
|
Net realized gain on investments
|
(19,551,032
|
)
|
||
|
Net realized loss on securities sold short
|
14,292,079
|
|||
|
Net realized gain on written option contracts expired or closed
|
(32,307
|
)
|
||
|
Net realized loss on foreign currency transactions
|
24,168
|
|||
|
Change in unrealized appreciation/depreciation on investments
|
(3,792,884
|
)
|
||
|
Change in unrealized appreciation/depreciation on securities sold short
|
3,327,670
|
|||
|
Change in unrealized appreciation/depreciation on written option contracts
|
(8,626
|
)
|
||
|
Change in unrealized appreciation/depreciation on foreign currency translation
|
(11,086
|
)
|
||
|
Net cash from operating activities
|
(46,182,277
|
)
|
||
|
CASH FLOWS FROM FINANCING ACTIVITIES:
|
||||
|
Proceeds from shares sold
|
$
|
97,035,779
|
||
|
Payment for shares redeemed
|
(23,545,668
|
)
|
||
|
Net cash provided by financing activities
|
73,490,111
|
|||
|
Net change in cash
|
$
|
27,307,834
|
||
|
CASH, FOREIGN CURRENCY AND RESTRICTED CASH:
|
||||
|
Beginning Balance
|
$
|
41,986,367
|
||
|
Ending Balance
|
$
|
69,294,201
|
||
The accompanying notes are an integral part of these financial statements.
56
WEISS ALTERNATIVE MULTI-STRATEGY FUND
Statement of Cash Flows – Continued
For the Period Ended April 30, 2021
|
SUPPLEMENTAL DISCLOSURES:
|
||||
|
Borrowing expense on securities sold short
|
$
|
301,059
|
||
|
Non-cash financing activities – reinvestment of distributions
|
$
|
7,432,138
|
||
|
Non-cash financing activities – increase in receivable for Fund shares sold
|
$
|
141,382
|
||
|
RECONCILIATION OF RESTRICTED AND UNRESTRICTED CASH AT THE
|
||||
|
BEGINNING OF YEAR TO THE STATEMENT OF ASSETS AND LIABILITIES
|
||||
|
Cash
|
$
|
90,675
|
||
|
Cash held in foreign currency
|
1,405,177
|
|||
|
Deposit with brokers
|
||||
|
Collateral for swap contracts
|
1,236,000
|
|||
|
Deposits for futures
|
1,930,880
|
|||
|
Short sale proceeds
|
37,323,635
|
|||
|
RECONCILIATION OF RESTRICTED AND UNRESTRICTED CASH AT THE
|
||||
|
END OF YEAR TO THE STATEMENT OF ASSETS AND LIABILITIES
|
||||
|
Cash
|
$
|
100,000
|
||
|
Cash held in foreign currency
|
(557,144
|
)
|
||
|
Deposit with brokers
|
||||
|
Collateral for swap contracts
|
1,501,000
|
|||
|
Deposits for futures
|
3,081,196
|
|||
|
Short sale proceeds
|
65,169,150
|
|||
The accompanying notes are an integral part of these financial statements.
57
WEISS ALTERNATIVE MULTI-STRATEGY FUND
Financial Highlights
|
Six Months Ended
|
Year Ended
|
Year Ended
|
Year Ended
|
Year Ended
|
Period Ended
|
|||||||||||||||||||
|
April 30, 2021
|
October 31,
|
October 31,
|
October 31,
|
October 31,
|
October 31,
|
|||||||||||||||||||
|
Class K
|
(Unaudited)
|
2020
|
2019
|
2018
|
2017
|
2016(1)
|
||||||||||||||||||
|
PER SHARE DATA(2):
|
||||||||||||||||||||||||
|
Net asset value, beginning of period
|
$
|
10.67
|
$
|
11.25
|
$
|
10.44
|
$
|
10.45
|
$
|
10.40
|
$
|
10.00
|
||||||||||||
|
INVESTMENT OPERATIONS:
|
||||||||||||||||||||||||
|
Net investment income (loss)(3)
|
(0.03
|
)
|
(0.02
|
)
|
0.08
|
0.01
|
(0.10
|
)
|
(0.05
|
)
|
||||||||||||||
|
Net realized and unrealized
|
||||||||||||||||||||||||
|
gain on investments
|
0.84
|
0.62
|
1.18
|
0.17
|
0.59
|
0.45
|
||||||||||||||||||
|
Total from investment operations
|
0.81
|
0.60
|
1.26
|
0.18
|
0.49
|
0.40
|
||||||||||||||||||
|
LESS DISTRIBUTIONS FROM:
|
||||||||||||||||||||||||
|
Net investment income
|
(0.02
|
)
|
(0.11
|
)
|
(0.21
|
)
|
—
|
(0.05
|
)
|
—
|
||||||||||||||
|
Net realized gains
|
(0.79
|
)
|
(1.07
|
)
|
(0.24
|
)
|
(0.19
|
)
|
(0.39
|
)
|
—
|
|||||||||||||
|
Total distributions
|
(0.81
|
)
|
(1.18
|
)
|
(0.45
|
)
|
(0.19
|
)
|
(0.44
|
)
|
—
|
|||||||||||||
|
Redemption fees
|
—
|
—
|
—
|
0.00
|
(4)
|
—
|
—
|
|||||||||||||||||
|
Net asset value, end of period
|
$
|
10.67
|
$
|
10.67
|
$
|
11.25
|
$
|
10.44
|
$
|
10.45
|
$
|
10.40
|
||||||||||||
|
TOTAL RETURN(5)
|
7.74
|
%
|
5.79
|
%
|
12.76
|
%
|
1.61
|
%
|
4.97
|
%
|
4.00
|
%
|
||||||||||||
|
SUPPLEMENTAL DATA AND RATIOS:
|
||||||||||||||||||||||||
|
Net assets, end of period (in thousands)
|
$
|
171,945
|
$
|
91,865
|
$
|
89,627
|
$
|
81,498
|
$
|
33,214
|
$
|
2,701
|
||||||||||||
|
Ratio of gross expenses
|
||||||||||||||||||||||||
|
to average net assets:
|
||||||||||||||||||||||||
|
Before expense reimbursement(6)(7)
|
3.61
|
%
|
4.07
|
%
|
3.95
|
%
|
4.25
|
%
|
8.70
|
%
|
12.86
|
%
|
||||||||||||
|
After expense reimbursement(6)(7)
|
2.85
|
%
|
3.05
|
%
|
3.16
|
%
|
3.27
|
%
|
3.37
|
%
|
3.44
|
%
|
||||||||||||
|
Ratio of dividends, interest,
and borrowing
|
||||||||||||||||||||||||
|
expense on securities sold short
|
||||||||||||||||||||||||
|
to average net assets(6)
|
1.35
|
%
|
1.55
|
%
|
1.66
|
%
|
1.77
|
%
|
1.69
|
%
|
1.29
|
%
|
||||||||||||
|
Ratio of operating expenses to average
|
||||||||||||||||||||||||
|
net assets excluding dividends, interest,
|
||||||||||||||||||||||||
|
and borrowing expense on
|
||||||||||||||||||||||||
|
securities sold short(6)(7)
|
1.50
|
%
|
1.50
|
%
|
1.50
|
%
|
1.50
|
%
|
1.68
|
%
|
2.15
|
%
|
||||||||||||
|
Ratio of net investment income (loss)
|
||||||||||||||||||||||||
|
to average net assets(6)(7)
|
(0.53
|
)%
|
(0.24
|
)%
|
0.78
|
%
|
0.11
|
%
|
(0.96
|
)%
|
(0.53
|
)%
|
||||||||||||
|
Portfolio turnover rate(5)(8)
|
385
|
%
|
738
|
%
|
585
|
%
|
700
|
%
|
494
|
%
|
304
|
%
|
||||||||||||
|
(1)
|
Inception date of Class K was December 1, 2015.
|
|
(2)
|
For a Class K share outstanding for the entire period.
|
|
(3)
|
Calculated based on average shares outstanding during the periods.
|
|
(4)
|
Amount per share is less than $0.005.
|
|
(5)
|
Not annualized for periods less than one year.
|
|
(6)
|
Annualized for periods less than one year.
|
|
(7)
|
These ratios exclude the impact of expenses of the underlying exchange-traded funds as represented in the Schedule of Investments. Recognition of net investment income by the Fund is affected by the timing of
the declaration of dividends by the underlying exchange-traded funds in which the Fund invests.
|
|
(8)
|
The portfolio turnover disclosed is for the Fund as a whole. The numerator for the portfolio turnover rate includes the lesser of purchases or sales (excluding short-term investments, short-term options, swap
contracts, futures contracts and short positions). The denominator includes the average fair value of long positions throughout the periods ended.
|
The accompanying notes are an integral part of these financial statements.
58
WEISS ALTERNATIVE MULTI-STRATEGY FUND
Financial Highlights
|
Six Months Ended
|
Year Ended
|
Year Ended
|
Year Ended
|
Period Ended
|
||||||||||||||||
|
April 30, 2021
|
October 31,
|
October 31,
|
October 31,
|
October 31,
|
||||||||||||||||
|
Investor Class
|
(Unaudited)
|
2020
|
2019
|
2018
|
2017(1)
|
|||||||||||||||
|
PER SHARE DATA(2):
|
||||||||||||||||||||
|
Net asset value, beginning of period
|
$
|
10.56
|
$
|
11.16
|
$
|
10.38
|
$
|
10.44
|
$
|
9.99
|
||||||||||
|
INVESTMENT OPERATIONS:
|
||||||||||||||||||||
|
Net investment income (loss)(3)
|
(0.05
|
)
|
(0.06
|
)
|
0.05
|
(0.02
|
)
|
(0.07
|
)
|
|||||||||||
|
Net realized and unrealized
|
||||||||||||||||||||
|
gain on investments(9)
|
0.83
|
0.61
|
1.18
|
0.15
|
0.52
|
|||||||||||||||
|
Total from investment operations
|
0.78
|
0.55
|
1.23
|
0.13
|
0.45
|
|||||||||||||||
|
LESS DISTRIBUTIONS FROM:
|
||||||||||||||||||||
|
Net investment income
|
(0.01
|
)
|
(0.08
|
)
|
(0.21
|
)
|
—
|
—
|
||||||||||||
|
Net realized gains
|
(0.79
|
)
|
(1.07
|
)
|
(0.24
|
)
|
(0.19
|
)
|
—
|
|||||||||||
|
Total distributions
|
(0.80
|
)
|
(1.15
|
)
|
(0.45
|
)
|
(0.19
|
)
|
—
|
|||||||||||
|
Redemption fees
|
—
|
0.00
|
(4)
|
0.00
|
(4)
|
0.00
|
(4)
|
—
|
||||||||||||
|
Net asset value, end of period
|
$
|
10.54
|
$
|
10.56
|
$
|
11.16
|
$
|
10.38
|
$
|
10.44
|
||||||||||
|
TOTAL RETURN(5)
|
7.46
|
%
|
5.48
|
%
|
12.36
|
%
|
1.22
|
%
|
4.50
|
%
|
||||||||||
|
SUPPLEMENTAL DATA AND RATIOS:
|
||||||||||||||||||||
|
Net assets, end of period (in thousands)
|
$
|
7,940
|
$
|
5,905
|
$
|
5,487
|
$
|
4,128
|
$
|
2,989
|
||||||||||
|
Ratio of gross expenses to average net assets:
|
||||||||||||||||||||
|
Before expense reimbursement(6)(7)
|
3.96
|
%
|
4.42
|
%
|
4.30
|
%
|
4.60
|
%
|
11.46
|
%
|
||||||||||
|
After expense reimbursement(6)(7)
|
3.20
|
%
|
3.40
|
%
|
3.51
|
%
|
3.62
|
%
|
3.96
|
%
|
||||||||||
|
Ratio of dividends, interest, and borrowing expense on
|
||||||||||||||||||||
|
securities sold short to average net assets(6)
|
1.35
|
%
|
1.55
|
%
|
1.66
|
%
|
1.77
|
%
|
1.95
|
%
|
||||||||||
|
Ratio of operating expenses to average net assets
|
||||||||||||||||||||
|
excluding dividends, interest, and borrowing expense
|
||||||||||||||||||||
|
on securities sold short(6)(7)
|
1.85
|
%
|
1.85
|
%
|
1.85
|
%
|
1.85
|
%
|
2.01
|
%
|
||||||||||
|
Ratio of net investment income (loss)
|
||||||||||||||||||||
|
to average net assets(6)(7)
|
(0.88
|
)%
|
(0.59
|
)%
|
0.43
|
%
|
(0.24
|
)%
|
(1.02
|
)%
|
||||||||||
|
Portfolio turnover rate(5)(8)
|
385
|
%
|
738
|
%
|
585
|
%
|
700
|
%
|
494
|
%
|
||||||||||
|
(1)
|
Inception date of the Investor Class was February 28, 2017.
|
|
(2)
|
For an Investor Class share outstanding for the entire period.
|
|
(3)
|
Calculated based on average shares outstanding during the year.
|
|
(4)
|
Amount per share is less than $0.005.
|
|
(5)
|
Not annualized for periods less than one year.
|
|
(6)
|
Annualized for periods less than one year.
|
|
(7)
|
These ratios exclude the impact of expenses of the underlying exchange-traded funds as represented in the Schedule of Investments. Recognition of net investment income by the Fund is affected by the timing of
the declaration of dividends by the underlying exchange traded funds in which the Fund invests.
|
|
(8)
|
The portfolio turnover disclosed is for the Fund as a whole. The numerator for the portfolio turnover rate includes the lesser of purchases or sales (excluding short-term investments, short-term options, swap
contracts, futures contracts and short positions). The denominator includes the average fair value of long positions throughout the periods ended.
|
|
(9)
|
Realized and unrealized gains and losses per share in this caption are balancing amounts necessary to reconcile the change in net asset value per share for the periods, and may not reconcile with the aggregate
gains and losses in the Statement of Operations due to share transactions for the period.
|
The accompanying notes are an integral part of these financial statements.
59
WEISS ALTERNATIVE MULTI-STRATEGY FUND
Notes to the Financial Statements (Unaudited)
April 30, 2021
1. ORGANIZATION
Series Portfolios Trust (the “Trust”) was organized as a Delaware statutory trust under a Declaration of Trust dated July 27, 2015. The Trust is registered under the Investment Company Act of 1940, as amended (the
“1940 Act”), as an open-end management investment company. The Weiss Alternative Multi-Strategy Fund (the “Fund”) is a diversified series with its own investment objectives and policies within the Trust. The Fund’s investment adviser, Weiss
Multi-Strategy Advisers LLC (the “Adviser”), is responsible for investment advisory services, day-to-day management of the Fund’s assets, as well as compliance, sales, marketing and operation services to the Fund. The primary investment objective of
the Fund is to provide returns with moderate volatility and reduced correlation to the bond and equity markets. A secondary objective of the Fund is to limit capital losses during periods when the bond and equity markets decline. The Fund commenced
operations on December 1, 2015. The Fund is an investment company and accordingly follows the investment company accounting and reporting guidance of the Financial Accounting Standards Board (“FASB”) Accounting Standards Codification (the
“Codification”) Topic 946 Financial Services – Investment Companies. The Fund does not hold itself out as related to any other series of the Trust for purposes of investment and investor services, nor does it share the same investment adviser with
any other series of the Trust.
The Fund offers four share classes, Class A, Class I, Class K and Investor Class. Effective March 31, 2017, the Fund ceased offering Class I. As of April 30, 2021, Class A and Class I shares are not available for
purchase. Class K and Investor Class shares have no front-end sales load, no deferred sales charge, and a 1.00% redemption fee prior to November 22, 2019. Investor Class shares are subject to a 0.25% distribution fee and a shareholder servicing fee
of up to 0.10% of average daily net assets. Class K shares are not subject to a distribution fee or a shareholder servicing fee.
The Fund may issue an unlimited number of shares of beneficial interest, with no par value. All shares of the Fund have equal rights and privileges except with respect to distribution fees and voting rights on matters
affecting a single share class.
2. SIGNIFICANT ACCOUNTING POLICIES
The following is a summary of significant accounting policies consistently followed by the Fund in the preparation of its financial statements. These policies are in conformity with generally accepted accounting
principles in the United States of America (“GAAP”).
A. Investment Valuation – The following is a summary of the Fund’s pricing procedures. It is intended to be a general discussion and may not necessarily reflect all the
pricing procedures followed by the Fund. Equity securities, including common stocks, preferred stocks, and real estate investment trusts (“REITS”) that are traded on a national securities exchange, except those listed on the Nasdaq Global Market®, Nasdaq Global Select Market® and the Nasdaq Capital Market® exchanges (collectively “Nasdaq”), are valued at the last reported sale price on that exchange on which the security is principally traded. Securities traded on Nasdaq will be valued at the
Nasdaq Official Closing Price (“NOCP”). If, on a particular day, an exchange traded or Nasdaq security does not trade, then the mean between the most recent quoted bid and asked prices will be used. All equity securities that are not traded on a
listed exchange are valued at the last sale price in the over-the-counter (“OTC”) market. If a non-exchanged traded equity security does not trade on a particular day, then the mean between the last quoted closing bid and asked price will be used. To
the extent these securities are actively traded and valuation adjustments are not applied, they are categorized in Level 1 of the fair value hierarchy.
Fixed income securities, including short-term debt instruments having a maturity less than 60 days, are valued at the evaluated mean price supplied by an approved independent third-party pricing service (“Pricing
Service”). These securities are categorized in Level 2 of the fair value hierarchy.
60
WEISS ALTERNATIVE MULTI-STRATEGY FUND
Notes to the Financial Statements (Unaudited) – Continued
April 30, 2021
In the case of foreign securities, the occurrence of events after the close of foreign markets, but prior to the time the Fund’s NAV is calculated will result in an adjustment to the trading prices of foreign
securities when foreign markets open on the following business day. The Fund will value foreign securities at fair value, taking into account such events in calculating the NAV. In such cases, use of fair valuation can reduce an investor’s ability to
seek profit by estimating the Fund’s NAV in advance of the time the NAV is calculated. These securities are categorized in Level 2 of the fair value hierarchy.
Exchange traded funds and closed-end funds are valued at the last reported sale price on the exchange on which the security is principally traded. If, on a particular day, an exchange-traded fund does not trade, then
the mean between the most recent quoted bid and asked prices will be used. To the extent these securities are actively traded and valuation adjustments are not applied, they are categorized in Level 1 of the fair value hierarchy.
Investments in registered open-end investment companies (including money market funds), other than exchange-traded funds, are typically valued at their reported NAV per share. To the extent these securities are valued
at their NAV per share, they are categorized in Level 1 of the fair value hierarchy.
Forward currency contracts maturing in two or fewer days are valued at the spot rate. Forward currency contracts maturing in three days or more are valued at the midpoint prices calculated by U.S. Bancorp Fund
Services, LLC, doing business as U.S. Bank Global Fund Services (“Fund Services” or the “Administrator”) using an “interpolation” methodology that incorporates foreign-exchange prices obtained from an approved pricing service for standard
forward-settlement periods, such as one month, three months, six months and one year. These securities are categorized in Level 2 of the fair value hierarchy.
Exchange traded options and Flexible Exchange® options (“FLEX options”) are valued at the composite mean price, which calculates the mean
of the highest bid price and lowest ask price across the exchanges where the option is principally traded. If the composite mean price is not available, the last sale or settlement price maybe be used. For non-exchange traded options, models such as
Black-Scholes can be used to value the options. On the last trading day prior to expiration, expiring options may be priced at intrinsic value. These securities are categorized in Level 2 of the fair value hierarchy.
Future contracts are valued at the settlement price on the exchange on which they are principally traded. The settlement price is the average of the prices at which a futures contract trades immediately before the
close of trading for the day. Equity swap contract prices are determined by using the same methods used to price the underlying security. These securities are categorized in Level 1 or Level 2 of the fair value hierarchy.
Securities for which market quotations are not readily available, or if the closing price does not represent fair value, are valued following procedures approved by the Board of Trustees (the “Board”). These procedures
consider many factors, including the type of security, size of holding, trading volume and news events. There can be no assurance that the Fund could obtain the fair value assigned to a security if they were to sell the security at approximately the
time at which the Fund determines their net asset values per share. The Board has established a Valuation Committee to administer, implement, and oversee the fair valuation process, and to make fair value decisions when necessary. The Board
regularly reviews reports that describe any fair value determinations and methods.
The Fund has adopted authoritative fair value accounting standards which establish an authoritative definition of fair value and set out a hierarchy for measuring fair value. These standards require additional
disclosures about the various inputs and valuation techniques used to develop the measurements of fair value, a discussion in changes in valuation techniques and related inputs during the period and expanded disclosure of valuation levels for major
security types. These inputs are summarized in the three broad levels listed below:
61
WEISS ALTERNATIVE MULTI-STRATEGY FUND
Notes to the Financial Statements (Unaudited) – Continued
April 30, 2021
|
Level 1 –
|
Unadjusted quoted prices in active markets for identical assets or liabilities that the Fund has the ability to access.
|
|
Level 2 –
|
Observable inputs other than quoted prices included in Level 1 that are observable for the asset or liability, either directly or indirectly. These inputs may include quoted prices for the identical instrument
on an inactive market, prices for similar instruments, interest rates, prepayment speeds, credit risk, yield curves, default rates and similar data.
|
|
Level 3 –
|
Unobservable inputs for the asset or liability, to the extent relevant observable inputs are not available, representing the Fund’s own assumptions about the assumptions a market participant would use in
valuing the asset or liability, and would be based on the best information available.
|
The inputs or methodology used for valuing securities are not an indication of the risk associated with investing in those securities.
The following table is a summary of the inputs used to value the Fund’s securities by level within the fair value hierarchy as of April 30, 2021:
|
Level 1
|
Level 2
|
Level 3
|
Total
|
|||||||||||||
|
Assets
|
||||||||||||||||
|
Investments at Fair Value
|
||||||||||||||||
|
Long Common Stocks(1)
|
$
|
70,952,790
|
$
|
2,938,612
|
$
|
97,048
|
$
|
73,988,450
|
||||||||
|
Long Contingent Value Rights
|
—
|
—
|
209
|
209
|
||||||||||||
|
Long Warrants
|
115,230
|
—
|
—
|
(3)
|
115,230
|
|||||||||||
|
Long Exchange Traded Funds
|
71,698,794
|
—
|
—
|
71,698,794
|
||||||||||||
|
Long Preferred Stocks
|
57,200
|
447,820
|
—
|
505,020
|
||||||||||||
|
Purchased Options
|
—
|
95,057
|
—
|
95,057
|
||||||||||||
|
Long Short-Term Investments
|
30,000,406
|
—
|
—
|
30,000,406
|
||||||||||||
|
Other Instruments
|
||||||||||||||||
|
Futures Contracts(2)
|
—
|
61,080
|
—
|
61,080
|
||||||||||||
|
$
|
172,824,420
|
$
|
3,542,569
|
$
|
97,257
|
$
|
176,464,246
|
|||||||||
|
Liabilities
|
||||||||||||||||
|
Investments at Fair Value
|
||||||||||||||||
|
Common Stocks Sold Short(1)
|
$
|
(45,194,910
|
)
|
$
|
(1,509,281
|
)
|
$
|
—
|
$
|
(46,704,191
|
)
|
|||||
|
Exchange Traded Funds Sold Short
|
(19,170,365
|
)
|
—
|
—
|
(19,170,365
|
)
|
||||||||||
|
Short Rights
|
—
|
—
|
(3)
|
—
|
—
|
(3)
|
||||||||||
|
Other Instruments
|
||||||||||||||||
|
Written Options
|
—
|
(22,496
|
)
|
—
|
(22,496
|
)
|
||||||||||
|
Swap Contracts(2)
|
—
|
(130,992
|
)
|
—
|
(130,992
|
)
|
||||||||||
|
$
|
(64,365,275
|
)
|
$
|
(1,662,769
|
)
|
$
|
—
|
$
|
(66,028,044
|
)
|
||||||
|
(1)
|
Please refer to the Schedule of Investments to view long and short common stocks/convertible preferred stocks segregated by industry type.
|
|
(2)
|
Swap contracts, futures contracts and forward currency contracts are valued at the net unrealized appreciation (depreciation) on the instrument as presented on the Schedules of Open Swap and Open Futures
contracts.
|
|
(3)
|
Amount less than $0.50.
|
For the period ended April 30, 2021, there were no transfers into or out of Level 3 securities.
62
WEISS ALTERNATIVE MULTI-STRATEGY FUND
Notes to the Financial Statements (Unaudited) – Continued
April 30, 2021
B. Securities Sold Short – The Fund sells securities or currencies short for economic hedging purposes or any other investment purpose. For financial statement purposes, an
amount equal to the settlement amount is initially included in the Statement of Assets and Liabilities as an asset and an equivalent liability. The amount of the liability is subsequently priced to reflect the current value of the short position.
Subsequent fluctuations in the market prices of securities or currencies sold, but not yet purchased, may require purchasing the securities or currencies at prices which may differ from the fair value reflected on the Statement of Assets and
Liabilities. Short sale transactions result in off balance sheet risk because the ultimate obligation may exceed the related amounts shown in the Statement of Assets and Liabilities. The Fund will incur losses if the price of the security increases
between the date of the short sale and the date on which the Fund purchases the securities to replace the borrowed securities. The Fund’s losses on short sales are potentially unlimited because there is no upward limit on the price a borrowed
security could attain.
The Fund is liable for any dividends and interest payable on securities while those securities are sold short. Until the security is replaced, the Fund is required to pay to the lender any income earned, which is
recorded as an expense by the Fund. The Fund’s policy is to segregate liquid assets in an amount equal to the fair value of securities sold short (not including proceeds received), which is reflected in the Schedule of Investments. These assets are
required to be adjusted daily to reflect changes in the value of the securities or currencies sold short.
C. Transactions with Brokers – The Fund’s deposits at brokers for securities sold short are with one securities dealer. The Fund does not require the brokers to maintain
collateral in support of the receivables from the brokers for proceeds on securities sold short. The Fund is required by the brokers to maintain collateral at the brokers or in a segregated account at the Fund’s custodian for securities sold short.
The Fund may maintain cash deposits at brokers beyond the receivables for short sales.
The Fund’s written options contracts’, equity swap contracts’, forward currency contracts’ and futures contracts cash deposits are monitored daily by the Adviser and counterparty. Cash deposits beyond the short sale
proceeds by the Fund are presented as deposits at brokers on the Statement of Assets and Liabilities. The Fund’s securities sold short and written option contracts are traded through the same account at Morgan Stanley and the deposits associated with
these investments are not able to be determined by security or contract type. These transactions may involve market risk in excess of the amounts receivable or payable reflected on the Statement of Assets and Liabilities.
D. Written Option Contracts – The Fund is subject to equity price risk in the normal course of pursuing its investment objectives. The Fund writes (sells) put or call options
for hedging purposes, volatility management purposes, or otherwise to gain, or reduce, long or short exposure to one or more asset classes or issuers. When a Fund writes (sells) an option, an amount equal to the premium received by the Fund is
included in the Statement of Assets and Liabilities as an asset and an equivalent liability. The amount of the liability is subsequently priced daily to reflect the current value of the option written. Refer to Note 2 A. for a pricing description. By
writing an option, a Fund may become obligated during the term of the option to deliver or purchase the securities underlying the option at the exercise price if the option is exercised. These contracts may involve market risk in excess of the
amounts receivable or payable reflected on the Statement of Assets and Liabilities. Refer to Note 2 R. for further derivative disclosures, and Note 2 P. for further counterparty risk disclosure.
When an option expires on its stipulated expiration date or the Fund enters into a closing purchase transaction, the Fund realizes gains or losses if the cost of the closing purchase transaction differs from the
premium received when the option was sold without regard to any unrealized appreciation or depreciation on the underlying security, and the liability related to such option is eliminated. When a written call option is exercised, the premium
63
WEISS ALTERNATIVE MULTI-STRATEGY FUND
Notes to the Financial Statements (Unaudited) – Continued
April 30, 2021
originally received decreases the cost basis of the security and the Fund realizes gains or losses from the sale of the underlying security. When a written put option is exercised, the cost of the security acquired is
decreased by the premium received for the put.
E. Purchased Option Contracts – The Fund is subject to equity price risk in the normal course of pursuing its investment objectives. The Fund purchases put or call options for
hedging purposes, volatility management purposes, or otherwise to gain, or reduce, long or short exposure to one or more asset classes or issuers. When the Fund purchases an option contract, an amount equal to the premiums paid is included in the
Statement of Assets and Liabilities Investments at value as an investment, and is subsequently priced daily to reflect the value of the purchased option contract. Refer to Note 2 A. for a pricing description. Refer to Note 2 Q. for further derivative
disclosures, and Note 2 O. for further counterparty risk disclosure.
F. Flex Options – FLEX Options are customized option contracts available through the CBOE that are guaranteed for settlement by The Options Clearing Corporation (“OCC” or the
“Clearinghouse”). FLEX Options provide investors with the ability to customize exercise prices and expiration dates, while achieving price discovery in competitive, transparent auctions markets and avoiding the counterparty exposure of
over-the-counter (“OTC”) options positions. The Fund bears the risk that the Clearinghouse will be unable or unwilling to perform its obligations under the FLEX Options contracts.
G. Forward Currency Contracts – The Fund is subject to foreign currency rate risk in the normal course of pursuing its investment objectives. The Fund may enter into forward
contracts for foreign currency hedging purposes, volatility management purposes or otherwise to gain, or reduce, long or short exposure to one or more asset classes or issuers. The Fund may enter into forward currency exchange contracts obligating
the Fund to deliver and receive a currency at a specified future date. Forward contracts are valued daily, and unrealized appreciation or depreciation is recorded daily as the difference between the contract exchange rate and the closing forward rate
applied to the face amount of the contract. Refer to Note 2 A. for a pricing description. A realized gain or loss is recorded at the time the forward contract expires. Credit risk may arise as a result of the failure of the counterparty to comply
with the terms of the contract. Refer to Note 2 P. for further counterparty risk disclosure.
The use of forward currency exchange contracts does not eliminate fluctuations in the underlying prices of the Fund’s investment securities. The use of forward currency exchange contracts involves the risk that
anticipated currency movements will not be accurately predicted. A forward currency exchange contract would limit the risk of loss due to a decline in the value of a particular currency; however, it would also limit any potential gain that might
result should the value of the currency increase instead of decrease. These contracts may involve market risk in excess of the amounts receivable or payable reflected on the Statement of Assets and Liabilities. Refer to Note 2 R. for further
derivative disclosures.
H. Futures Contracts – The Fund may enter into futures contracts traded on domestic and international exchanges, including stock index and fixed income futures contracts. The
Fund may enter into futures contracts for hedging purposes, volatility management purposes, or otherwise to gain or reduce long or short exposure to one or more asset classes. Upon entering into a contract, the Fund deposits and maintains as
collateral such initial margin as required by the exchange on which the transaction is affected. Pursuant to the contract, the Fund agrees to receive from or pay to the broker an amount of cash equal to the daily fluctuation in value of the contract
(with the exception of futures contracts traded on the London Metal Exchange (“LME”)). Such receipts or payments are known as variation margin and are recorded by the Fund as unrealized gains and losses. When the contract is closed, the Fund records
a realized gain or loss equal to the difference between the value of the contract at the time
64
WEISS ALTERNATIVE MULTI-STRATEGY FUND
Notes to the Financial Statements (Unaudited) – Continued
April 30, 2021
it was opened and the value at the time it was closed. The variation margin on LME futures contracts do not settle daily, but rather settle at their respective maturity dates. At year end, the unrealized appreciation
and depreciation on LME futures contracts is shown as a receivable for unsettled open futures contracts and payable for unsettled futures contracts, respectively, on the Statement of Assets and Liabilities. The risks inherent in the use of futures
contracts include adverse changes in the value of such instruments. Refer to Note 2 A. for a pricing description. Refer to Note 2 R. for further derivative disclosures, and Note 2 P. for further counterparty risk disclosure.
I. Equity Swap Contracts – The Fund is subject to equity price risk and interest rate risk in the normal course of pursuing its investment objectives. During the period ended
April 30, 2021, the Fund entered into both long and short equity swap contracts. The Fund may enter into swap contracts for hedging purposes, volatility management purposes, or otherwise to gain or reduce long or short exposure to one or more asset
classes. A long equity swap contract entitles the Fund to receive from the counterparty any appreciation and dividends paid on an individual security, while obligating the Fund to pay the counterparty any depreciation on the security as well as
interest on the notional amount of the contract generally at a rate equal to the Euro OverNight Index Average (“EONIA”) or the Sterling OverNight Index Average (“SONIA”), Bank of Japan Estimate Unsecured Overnight Call Rate (“TONAR”), Federal Funds
Rate (“FED”) or London Interbank Offered Rate (“LIBOR”) (plus an additional rate. Please see the Schedule of Swaps for details on a contract by contract basis). A short equity swap contract obligates the Fund to pay the counterparty any appreciation
and dividends paid on an individual security, while entitling the Fund to receive from the counterparty any depreciation on the security, and to pay to or receive from the counterparty interest on the notional value of the contract generally at a
rate equal to EONIA, SONIA, TONAR, FED or LIBOR (plus an additional rate. Please see the Schedule of Open Swap Contracts for details on a contract by contract basis).
Fluctuations in the value of an open contract are recorded daily as net unrealized appreciation or depreciation. The Fund will realize gains or losses upon termination or reset of the contract. Either party, under
certain conditions, may terminate the contract prior to the contract’s expiration date. Refer to Note 2 A. for a pricing description. Credit risk may arise as a result of the failure of the counterparty to comply with the terms of the contract. Refer
to Note 2 P. for further counterparty risk disclosure. Additionally, risk may arise from unanticipated movements in interest rates or in the value of the underlying securities. These contracts may involve market risk in excess of the amounts
receivable or payable reflected on the Statement of Assets and Liabilities. Refer to Note 2 R. for further derivative disclosures.
J. Foreign Securities and Currency Translation – Investment securities and other assets and liabilities denominated in foreign currencies are translated into U.S. dollar
amounts at the date of valuation. Purchases and sales of investment securities and income and expense items denominated in foreign currencies are translated into U.S. dollar amounts on the respective dates of such transactions. The Fund does not
isolate the portion of the results of operations from changes in foreign exchange rates on investments from the fluctuations arising from changes in market prices of securities held. Reported net realized foreign exchange gains or losses arise from
sales of foreign currencies, and the difference between the amounts of dividends, interest, and foreign withholding taxes recorded on the Fund’s books and the U.S. dollar equivalent of the amounts actually received or paid. Net unrealized foreign
exchange gains and losses arise from changes in the fair values of assets and liabilities, other than investments in securities at fiscal year-end, resulting from changes in exchange rates.
Investments in foreign securities entail certain risks. There may be a possibility of nationalization or expropriation of assets, confiscatory taxation, political or financial instability, and diplomatic developments
that could affect the value of the Fund’s investments in certain foreign countries. Since foreign securities normally are denominated and traded in foreign currencies, the value of the Fund’s assets may be affected favorably or unfavorably by
65
WEISS ALTERNATIVE MULTI-STRATEGY FUND
Notes to the Financial Statements (Unaudited) – Continued
April 30, 2021
currency exchange rates, currency exchange control regulations, foreign withholding taxes, and restrictions or prohibitions on the repatriation of foreign currencies. There may be less information publicly available
about a foreign issuer than about a U.S. issuer, and foreign issuers are not generally subject to accounting, auditing, and financial reporting standards and practices comparable to those in the United States. The securities of some foreign issuers
are less liquid and at times more volatile than securities of comparable U.S. issuers.
K. Cash and Cash Equivalents – The Fund considers highly liquid short-term fixed income investments purchased with an original maturity of less than three months to be cash
equivalents. Cash equivalents are included in short-term investments on the Schedule of Investments as well as in investments on the Statement of Assets and Liabilities.
L. Guarantees and Indemnifications – In the normal course of business, the Fund enters into contracts with service providers that contain general indemnification clauses. The
Fund’s maximum exposure under these arrangements is unknown, as this would involve future claims that may be made against the Fund that have not yet occurred.
M. Security Transactions, Income and Expenses – The Fund follows industry practice and records security transactions on the trade date. Realized gains and losses on sales of
securities are calculated on the basis of identified cost. Dividend income and expense is recorded on the ex-dividend date and interest income and expense is recorded on an accrual basis. Withholding taxes on foreign dividends have been provided for
in accordance with the Fund’s understanding of the applicable country’s tax rules and regulations. Discounts and premiums on securities purchased are amortized over the expected life of the respective securities. Interest income is accounted for on
the accrual basis and includes amortization of premiums and accretion of discounts on the effective interest method.
N. Allocation of Income, Expenses and Gains/Losses – Income, expenses (other than those deemed attributable to a specific share class), and gains and losses of the Fund are
allocated daily to each class of shares based upon the ratio of net assets represented by each class as a percentage of the net assets of the Fund. Expenses deemed directly attributable to a class of shares are recorded by the specific class. Most
Fund expenses are allocated by class based on relative net assets. 12b-1 fees are expensed at 0.25% of average daily net assets of Investor Class shares (See Note 5). Shareholder servicing fees are expensed at an annual rate of up to 0.10% of average
daily net assets of Investor Class shares (See Note 5). Trust Expenses associated with a specific fund in the Trust are charged to that fund. Common Trust expenses are typically allocated evenly between the funds of the Trust, or by other equitable
means.
O. Share Valuation – The NAV per share of the Fund is calculated by dividing the sum of the value of the securities held by the Fund, plus cash and other assets, minus all
liabilities (including estimated accrued expenses) by the total number of shares outstanding for the Fund, rounded to the nearest cent. The Fund’s shares will not be priced on days which the New York Stock Exchange (“NYSE”) is closed for trading.
P. Counterparty Risk – The Fund helps manage counterparty credit risk by entering into agreements only with counterparties the Adviser believes have the financial resources to
honor its obligations. The Adviser considers the credit worthiness of each counterparty to a contract in evaluating potential credit risk. The counterparty risk for forward currency exchange contracts to the Fund includes the amount of any net
unrealized appreciation on the contract. The counterparty risk for equity swaps contracts to the Fund includes the risk of loss of the full amount of any net unrealized appreciation on the contract, along with dividends receivable on long equity
contracts and interest receivable on short equity contracts. Written and purchased options and futures contracts sold on an
66
WEISS ALTERNATIVE MULTI-STRATEGY FUND
Notes to the Financial Statements (Unaudited) – Continued
April 30, 2021
exchange do not expose the Fund to counterparty risk; the exchange’s clearinghouse guarantees the options and futures against counterparty nonperformance. Over-the-counter options counterparty risk includes the risk of
loss of the full amount of any net unrealized appreciation.
Q. Use of Estimates – The preparation of financial statements in conformity with GAAP requires management to make estimates and assumptions that affect the reported amounts of
assets and liabilities and disclosure of contingent assets and liabilities at the date of the financial statements and the reported amounts of revenues and expenses during the reporting period. Actual results could differ from those estimates.
R. Derivatives – The Fund may utilize derivative instruments such as options, swaps, futures, forward currency exchange contracts and other instruments with similar
characteristics to the extent that they are consistent with the Fund’s respective investment objectives and limitations. The use of these instruments may involve additional investment risks, including the possibility of illiquid markets or imperfect
correlation between the value of the instruments and the underlying securities. Derivatives also may create leverage which will amplify the effect of their performance on the Fund and may produce significant losses. Refer to Note 7 for further
derivative disclosure.
The Fund employs a risk optimized allocation strategy by investing in (1) an actively managed, diversified, market neutral multi-strategy portfolio that includes equity securities, debt securities, and/or derivatives
(the “Core Market Neutral Component”), (2) a long-only “growth” overlay of equity securities (the “Growth Component”), and (3) a long-only “defensive” overlay of debt securities (the “Defensive Component”). To implement its strategy, the Fund may
also use derivatives, such as swaps and futures on indexes, in the Growth and Defensive Components. The Fund’s Growth and Defensive Components consist only of securities purchased with the objective of seeking an increase in the underlying prices of
such securities. The Fund’s Growth Component will, under normal circumstances, consist of domestically traded large- and midcap equity securities that aim to approximately track price performance in the overall stock market. The portion of the Fund’s
overall portfolio comprised of debt securities, which are held in the Defensive and Core Market Neutral Components, will, under normal market conditions, have a weighted average maturity that exceeds 9 years and will consist primarily of
investment-grade debt securities with an average credit rating in excess of “A” by Standard & Poor’s, or an equivalent quality rating from another Nationally Recognized Statistical Rating Organization. The Fund may also invest in below-investment
grade debt securities (also referred to as high yield debt securities or “junk” bonds).
The Fund’s Core Market Neutral Component consists of a combination of “long” securities purchased that seek to benefit from an increase in the underlying prices of such securities and “short” securities sold that seek
to benefit from a decrease in the underlying prices of such securities. The Fund’s Core Market Neutral Component may be characterized by sector focus, geographic definition, quantitative method, event orientation or some other dominant
characteristic. The strategies employed and the allocation among them will vary over time. The common attribute of these strategies is a long/short investment approach whereby various securities or instruments are held long and others are sold short.
The Adviser, therefore, applies moderate leverage (i.e., borrowed capital to increase investment exposure) to the Core Market Neutral Component in an effort to enhance absolute returns. In addition, in order to take advantage of certain opportunities
in the securities markets, the Fund may engage in active and frequent trading with respect to the Core Market Neutral Component.
The Adviser seeks to allocate assets to each of the three components based on the Adviser’s assessment of each component’s expected contribution to the Fund’s overall portfolio risk. The Adviser utilizes the historical
price return and volatility (among other proprietary measures) of each component in order to estimate a component’s risk
67
WEISS ALTERNATIVE MULTI-STRATEGY FUND
Notes to the Financial Statements (Unaudited) – Continued
April 30, 2021
contribution. Although there is no requirement to invest a specific percentage of the Fund’s assets in a particular component, it is generally expected that a larger percentage of the Fund’s assets will be allocated to
low risk asset classes (i.e., those that comprise the bond or Defensive Component) than to higher risk asset classes (i.e., those that comprise the equity or Growth Component). Given that the Adviser seeks to allocate assets to each individual
component according to its risk contribution (as measured by its historical price return and volatility), the Fund’s allocation of assets to the Core Market Neutral, Growth and Defensive Components can fluctuate widely.
The equity securities that comprise the Fund’s Growth Component may at any time include positions in U.S. common, preferred or convertible securities of large- or mid- capitalization issuers; securities of other
investment companies, including exchange-traded funds (“ETFs”); depositary receipts, including American Depositary Receipts (“ADRs”), and derivatives, such as swaps and futures on indexes. The equity securities that comprise the Fund’s Core Market
Neutral Component may at any time include positions in U.S. or non-U.S. common, preferred or convertible securities of any market capitalization throughout the world, including emerging markets countries; securities of other investment companies,
including ETFs; and depositary receipts, including ADRs. The debt securities that comprise the Fund’s Defensive Component and Core Market Neutral Component may include corporate debt securities, bonds (including inflation-indexed bonds), notes or
other debentures, U.S. Government and foreign government securities, high yield or junk bonds, ETFs, and derivatives, such as swaps and futures on indexes. In addition, the Core Market Neutral Component may invest in derivative instruments, including
swaps, interest rate swaps, options or index options (e.g., calls and puts may be purchased or written), futures contracts, and forward contracts. The Fund’s derivative instruments are used for several purposes, including to create investment
leverage; as a substitute for securities, interest rates, currencies and commodities; and/or to hedge against market movements.
The Fund has adopted authoritative standards regarding disclosure about derivatives and hedging activities and how they affect the Fund’s Statement of Assets and Liabilities and Statement of Operations. For the period
ended April 30, 2021, the Fund’s average derivative volume is described below:
|
Monthly Average
|
Monthly Average
|
||||||||
|
Quantity
|
Notional Value
|
||||||||
|
Purchased Option Contracts
|
903
|
$
|
7,726,345
|
||||||
|
Written Option Contracts
|
460
|
3,607,562
|
|||||||
|
Long Total Return Swap Contracts
|
523,433
|
5,290,360
|
|||||||
|
Short Total Return Swap Contracts
|
333,793
|
6,683,077
|
|||||||
|
Long Futures Contracts
|
470
|
67,290,883
|
|||||||
|
Short Futures Contracts
|
—
|
13,936
|
|||||||
|
Long Forward Contracts
|
7,504
|
912
|
|||||||
|
Short Forward Contracts
|
92,662
|
897
|
|||||||
68
WEISS ALTERNATIVE MULTI-STRATEGY FUND
Notes to the Financial Statements (Unaudited) – Continued
April 30, 2021
Statement of Assets and Liabilities
Fair values of derivative instruments as of April 30, 2021:
|
Statement of Assets and
|
Fair Value | ||||||||
|
Liabilities Location
|
Assets |
Liabilities
|
|||||||
|
Purchased Option Contracts
|
|||||||||
|
Equity
|
Investments, at value
|
$
|
95,057
|
$
|
—
|
||||
|
Written Option Contracts
|
|||||||||
|
Equity
|
Written option contracts, at value
|
—
|
22,496
|
||||||
|
Swap Contracts
|
|||||||||
|
Equity
|
Payable for swap contracts
|
—
|
125,524
|
||||||
|
Futures Contracts
|
|||||||||
|
Equity
|
Variation margin for futures contracts
|
—
|
979,908
|
||||||
|
Interest rate
|
Variation margin for futures contracts
|
1,040,988
|
—
|
||||||
|
Total Futures Contracts
|
1,040,988
|
979,908
|
|||||||
|
Total
|
$
|
1,136,045
|
$
|
1,127,928
|
|||||
Statement of Operations
The effect of derivative instruments on the Statement of Operations for the period ended April 30, 2021:
|
Net Realized Gain (Loss) on Derivatives
|
||||||||||||||||||||||||
|
Purchased
|
Written
|
Forward
|
||||||||||||||||||||||
|
Option
|
Option
|
Swap
|
Futures
|
Currency
|
||||||||||||||||||||
|
Derivatives
|
Contracts*
|
Contracts
|
Contracts
|
Contracts
|
Contracts
|
Total
|
||||||||||||||||||
|
Equity Contracts
|
$
|
(121,836
|
)
|
$
|
32,307
|
$
|
206,764
|
$
|
5,762,153
|
$
|
—
|
$
|
5,879,388
|
|||||||||||
|
Commodity Contracts
|
—
|
—
|
—
|
(2,154
|
)
|
—
|
(2,154
|
)
|
||||||||||||||||
|
Interest Rate Contracts
|
—
|
—
|
—
|
(3,342,959
|
)
|
—
|
(3,342,959
|
)
|
||||||||||||||||
|
Foreign Exchange Contracts
|
—
|
—
|
—
|
—
|
(2,530
|
)
|
(2,530
|
)
|
||||||||||||||||
|
Total
|
$
|
(121,836
|
)
|
$
|
32,307
|
$
|
206,764
|
$
|
2,417,040
|
$
|
(2,530
|
)
|
$
|
2,531,745
|
||||||||||
|
Net Change in Unrealized Appreciation (Depreciation) on Derivatives
|
||||||||||||||||||||||||
|
Purchased
|
Written
|
Forward
|
||||||||||||||||||||||
|
Option
|
Option
|
Swap
|
Futures
|
Currency
|
||||||||||||||||||||
|
Derivatives
|
Contracts**
|
Contracts
|
Contracts
|
Contracts
|
Contracts
|
Total
|
||||||||||||||||||
|
Equity Contracts
|
$
|
(118,006
|
)
|
$
|
8,626
|
$
|
39,064
|
$
|
1,409,477
|
$
|
—
|
$
|
1,339,161
|
|||||||||||
|
Commodity Contracts
|
—
|
—
|
—
|
2,154
|
—
|
2,154
|
||||||||||||||||||
|
Interest Rate Contracts
|
—
|
—
|
—
|
(964,790
|
)
|
—
|
(964,790
|
)
|
||||||||||||||||
|
Foreign Exchange Contracts
|
—
|
—
|
—
|
—
|
71
|
71
|
||||||||||||||||||
|
Total
|
$
|
(118,006
|
)
|
$
|
8,626
|
$
|
39,064
|
$
|
446,841
|
$
|
71
|
$
|
376,596
|
|||||||||||
|
*
|
The amounts disclosed are included in the realized gain (loss) on investments.
|
|
|
**
|
The amounts disclosed are included in the change in unrealized appreciation (depreciation) on investments.
|
69
WEISS ALTERNATIVE MULTI-STRATEGY FUND
Notes to the Financial Statements (Unaudited) – Continued
April 30, 2021
3. RELATED PARTY TRANSACTIONS
The Trust has an agreement with the Adviser to furnish investment advisory services to the Fund. Pursuant to an Investment Advisory Agreement between the Trust and the Adviser, the Adviser is entitled to receive, on a
monthly basis, an annual advisory fee equal to 1.50% of the Fund’s average daily net assets.
The Fund’s Adviser has contractually agreed in an Operating Expense Limitation Agreement to reduce its management fees and/or absorb expenses of the Fund to ensure that total annual operating expenses after fee waiver
and/or expense reimbursement (excluding 12b-1 fees – Class A and Investor Class (see Note 5), shareholder servicing fees – Class A, Class I and Investor Class (see Note 5), any acquired fund fees and expenses, front-end or contingent deferred loads,
redemption fees, swap fees and expenses, dividends and interest on short positions, taxes, leverage interest, brokerage fees (including commissions, mark-ups and mark-downs), annual account fees for margin accounts, expenses incurred in connection
with any merger or reorganization and extraordinary expenses such as litigation) do not exceed 1.50% of the Fund’s average daily net assets. As of April 30, 2021, Class A shares and Class I shares are not available. The Adviser may request recoupment
of previously waived fees and reimbursed Fund expenses from the Fund for three years from the date they were waived or reimbursed, provide that, after payment of the recoupment, the Total Annual Fund Operating Expenses do no exceed the lesser of the
Expense Cap: (i) in effect at the time of the waiver or reimbursement; or (ii) in effect at the time of recoupment. The Operating Expense Limitation Agreement is intended to be continual in nature and cannot be terminated within one year after the
effective date of the Fund’s prospectus and subject thereafter to termination at any time upon 60 days written notice and approval by the Board or the Advise, with consent of the Board. Waived fees and reimbursed expenses subject to potential
recovery during the fiscal year of expiration are as follows:
|
Expiration
|
Amount
|
|
|
May 2021 to October 2021
|
$344,720
|
|
|
November 2021 to October 2022
|
712,179
|
|
|
November 2022 to October 2023
|
969,449
|
|
|
November 2023 to October 2024
|
520,457
|
Fund Services acts as the Fund’s Administrator, transfer agent, and fund accountant. U.S. Bank N.A. (the “Custodian”) serves as the custodian to the Fund. The Custodian is an affiliate of the Administrator. The
Administrator performs various administrative and accounting services for the Fund. The Administrator prepares various federal and state regulatory filings, reports and returns for the Fund; prepares reports and materials to be supplied to the
Trustees; monitors the activities of the Fund’s custodian; coordinates the payment of the Fund’s expenses and reviews the Fund’s expense accruals. The officers of the Trust, including the Chief Compliance Officer, are employees of the Administrator.
A trustee of the Trust is an officer of the Administrator. As compensation for its services, the Administrator is entitled to a monthly fee at an annual rate based upon the average daily net assets of the Fund, subject to annual minimums. Fees paid
by the Fund for administration and accounting, transfer agency, custody and compliance services for the period ended April 30, 2021, are disclosed in the Statement of Operations.
Quasar Distributors, LLC, is the Fund’s distributor (the “Distributor”). The Distributor is not affiliated with the Adviser, Fund Services, or its affiliated companies.
70
WEISS ALTERNATIVE MULTI-STRATEGY FUND
Notes to the Financial Statements (Unaudited) – Continued
April 30, 2021
4. TAX FOOTNOTE
Federal Income Taxes – The Fund intends to comply with the requirements of Subchapter M of the Internal Revenue Code of 1986, as amended, necessary to qualify as a regulated
investment company and distributes substantially all net taxable investment income and net realized gains to shareholders in a manner which results in no tax cost to the Fund. Therefore, no federal income or excise tax provision is required. As of
and during the year ended October 31, 2020, the Fund did not have any tax positions that did not meet the “more-likely-than-not” threshold of being sustained by the applicable tax authority and did not have liabilities for any unrecognized tax
benefits. The Fund recognizes interest and penalties, if any, related to unrecognized tax benefits on uncertain tax positions as income tax expense in the Statement of Operations. The Fund is not subject to examination by taxing authorities for the
tax years prior to October 31, 2018.
As of October 31, 2020, the components of accumulated earnings (losses) on a tax basis were as follows:
| Tax cost of investments* |
$
|
63,689,304
|
|||
|
Gross unrealized appreciation
|
$
|
4,778,962
|
|||
|
Gross unrealized depreciation
|
(10,012,756
|
)
|
|||
|
Net unrealized depreciation
|
(5,233,794
|
)
|
|||
|
Undistributed ordinary income
|
—
|
||||
|
Undistributed long-term capital gain
|
7,264,313
|
||||
|
Other accumulated losses
|
(184,259
|
)
|
|||
|
Total distributable earnings
|
$
|
1,846,260
|
|
*
|
Represents cost for federal income tax purposes and differs from the cost for financial reporting purposes due to partnership adjustments, wash sales, derivatives and constructive sales.
|
As of October 31, 2020, the Fund did not have any capital loss carryovers. A regulated investment company may elect for any taxable year to treat any portion of any qualified late year loss as arising on the first day
of the next taxable year. Qualified late year losses are certain ordinary losses which occur during the portion of the Fund’s taxable period subsequent to December 31. For the taxable year ended October 31, 2020, the Fund does not plan to defer any
qualified late year losses.
Distributions to Shareholders – The Fund distributes substantially all net investment income, if any, and net realized capital gains, if any, annually. Distributions to
shareholders are recorded on the ex-dividend date. The treatment for financial reporting purposes of distributions made to shareholders during the year from net investment income or net realized capital gains may differ from their treatment for
federal income tax purposes. These differences are caused primarily by differences in the timing of the recognition of certain components of income, expense or realized capital gain for federal income tax purposes. Where such differences are
permanent in nature, GAAP requires that they be reclassified in the components of the net assets based on their ultimate characterization for federal income tax purposes. Any such reclassifications will have no effect on net assets, results of
operations or net asset values per share of the Fund. For the year ended October 31, 2020 the following table shows the reclassifications made:
|
Total
|
|||
|
Distributable
|
|||
|
Earnings
|
Paid-in Capital
|
||
|
$(433,751)
|
$433,751
|
71
WEISS ALTERNATIVE MULTI-STRATEGY FUND
Notes to the Financial Statements (Unaudited) – Continued
April 30, 2021
The tax character of distributions paid for the period ended April 30, 2021 and October 31, 2020 were as follows:
|
Ordinary Income*
|
Long-Term Capital Gain
|
Total
|
||
|
2021
|
$7,432,138
|
$ —
|
$7,432,138
|
|
|
2020
|
6,836,476
|
2,901,875
|
9,738,351
|
* For federal income tax purposes, distributions of short-term capital gains are treated as ordinary income distributions.
5. DISTRIBUTION & SHAREHOLDER SERVICING FEES
The Fund has adopted a Distribution Plan pursuant to Rule 12b-1 (the “Plan”) for Class A and the Investor Class. The Plan permits the Fund to pay for distribution and related expenses at an annual rate of 0.25% average
daily net assets of Class A and the Investor Class. Amounts paid under the Plan are paid to the Distributor to compensate it for costs of the services it provides to Class A and Investor Class shares of the Fund and the expenses it bears in the
distribution of the Fund’s Class A and Investor Class shares, including overhead and telephone expenses; printing and distribution of prospectuses and reports used in connection with the offering of the Fund’s Investor class shares to prospective
investors; and preparation, printing, payments to intermediaries and distribution of sales literature and advertising materials.
Under the Plan, the Trustees will be furnished quarterly with information detailing the amount of expenses paid under the Plan and the purposes for which payments were made. The Plan may be terminated at any time by
vote of a majority of the Trustees of the Trust who are not interested persons. Continuation of the Plan is considered by such Trustees no less frequently than annually. With the exception of the Distributor and the Adviser, in their capacities as
the Fund’s principal underwriter and distribution coordinator, respectively, no interested person has or had a direct or indirect financial interest in the Plan or any related agreement. As of April 30, 2021, Class A shares are not available. For the
period ended April 30, 2021, the Investor Class incurred expenses of $8,841 pursuant to the Plan.
In addition, pursuant to a Shareholder Service Plan (the “Shareholder Servicing Plan”) adopted by the Trust on behalf of the Fund, the Advisor is authorized to engage financial institutions, securities dealers and
other industry professionals (“Shareholder Servicing Agent”) to provide personal shareholder services relating to the servicing and maintenance of shareholder accounts not otherwise provided to the Fund. Payments made pursuant to the Shareholder
Servicing Plan shall not exceed 0.10% of the average daily net asset value of Class A, Class I and the Investor Class of the Fund’s shares. For the period ended April 30, 2021, the Investor Class incurred expenses of $3,536 to the plan. As of April
30, 2021, Class A and Class I shares are not available for purchase.
Payments made under the Shareholder Servicing Plan shall be used to compensate Shareholder Servicing Agents for providing general shareholder liaison services, including, but not limited to: (i) answering inquiries
from shareholders regarding account status and history, the manner in which purchases and redemptions of the Fund shares may be effected, and other matters pertaining to the Fund; (ii) assisting shareholders in designating and changing dividend
options, account designations and addresses; (iii) arranging for wiring of funds and transmitting and receiving funds in connection with orders to purchase or redeem Fund shares; (iv) verifying and guaranteeing shareholder signatures in connection
with orders to purchase or redeem Fund shares; (v) providing such other similar services related to the maintenance of shareholder accounts; and (vi) providing necessary personnel and facilities to conduct the activities described above.
72
WEISS ALTERNATIVE MULTI-STRATEGY FUND
Notes to the Financial Statements (Unaudited) – Continued
April 30, 2021
Distribution and shareholder servicing fees are not subject to the Operating Expenses Limitation Agreement to reduce management fees and/or absorb Fund expenses by the Adviser. Distribution and shareholder servicing
fees will increase the expenses beyond the Operating Expenses Limitation Agreement rate of 1.50% for Class A, Class I and Investor Class.
6. INVESTMENT TRANSACTIONS
The aggregate purchases and sales, excluding short-term investments, by the Fund for the period ended April 30, 2021, were as follows:
|
Purchases
|
Sales
|
||
|
U.S. Government
|
$ —
|
$ —
|
|
|
Other
|
499,353,475
|
462,450,954
|
7. OFFSETTING ASSETS AND LIABILITIES
The Fund is subject to various Master Netting Arrangements, which govern the terms of certain transactions with select counterparties. The Master Netting Arrangements allow the Fund to close out and net its total
exposure to a counterparty in the event of a default with respect to all the transactions governed under a single agreement with a counterparty. The Master Netting Arrangements also specify collateral posting arrangements at pre-arranged exposure
levels. Under the Master Netting Arrangements, collateral is routinely transferred if the total net exposure to certain transactions (net of existing collateral already in place) governed under the relevant Master Netting Arrangement with a
counterparty in a given account exceeds a specified threshold depending on the counterparty and the type of Master Netting Arrangement. Morgan Stanley is the prime broker for exchange traded derivatives and the counterparty for swaps.
|
Gross
|
Net Amounts
|
Gross Amounts not
|
||||||||||||||||||||||
|
Gross
|
Amounts
|
Presented
|
offset in the Statement
|
|||||||||||||||||||||
|
Amounts of
|
Offset in the
|
in the
|
of Assets and Liabilities
|
|||||||||||||||||||||
|
Recognized
|
Statement of
|
Statement
|
Collateral
|
|||||||||||||||||||||
|
Assets/
|
Assets and
|
of Assets
|
Financial
|
Received/
|
Net
|
|||||||||||||||||||
|
Liabilities
|
Liabilities
|
and Liabilities
|
Instruments
|
Pledged*
|
Amount
|
|||||||||||||||||||
|
Assets:
|
||||||||||||||||||||||||
|
Description
|
||||||||||||||||||||||||
|
Swap Contracts
|
$
|
238,993
|
$
|
238,993
|
$
|
—
|
$
|
—
|
$
|
—
|
$
|
—
|
||||||||||||
|
Futures Contracts
|
65,437
|
65,437
|
—
|
—
|
—
|
—
|
||||||||||||||||||
|
$
|
304,430
|
$
|
304,430
|
$
|
—
|
$
|
—
|
$
|
—
|
$
|
—
|
|||||||||||||
|
Liabilities:
|
||||||||||||||||||||||||
|
Description
|
||||||||||||||||||||||||
|
Written Option Contracts
|
$
|
22,496
|
$
|
—
|
$
|
22,496
|
$
|
—
|
$
|
22,496
|
$
|
—
|
||||||||||||
|
Swap Contracts
|
369,985
|
238,993
|
130,992
|
—
|
130,992
|
—
|
||||||||||||||||||
|
Futures Contracts
|
300,570
|
65,438
|
235,132
|
65,437
|
169,695
|
—
|
||||||||||||||||||
|
$
|
693,051
|
$
|
304,431
|
$
|
388,620
|
$
|
65,437
|
$
|
323,183
|
$
|
—
|
|||||||||||||
* In some instances, the actual collateral pledged/received may be more than amount shown.
73
WEISS ALTERNATIVE MULTI-STRATEGY FUND
Notes to the Financial Statements (Unaudited) – Continued
April 30, 2021
8. BENEFICIAL OWNERSHIP
The beneficial ownership, either directly or indirectly, of more than 25% of the voting securities of a fund creates a presumption of control of the fund, under Section 2(a)(9) of the Investment Company Act of 1940. As
of April 30, 2021, National Financial Services, for the benefit of its customers, owned 74.35% of the outstanding shares of the Fund.
9. COVID-19
The global outbreak of COVID-19 (commonly referred to as “coronavirus”) has disrupted economic markets and the prolonged economic impact is uncertain. The ultimate economic fallout from the pandemic, and the long-term
impact on economies, markets, industries and individual issuers, are not known. The operational and financial performance of the issuers of securities in which the Fund invests depends on future developments, including the duration and spread of the
outbreak, and such uncertainty may in turn adversely affect the value and liquidity of the Fund’s investments, impair the Fund’s ability to satisfy redemption requests, and negatively impact the Fund’s performance.
10. LIBOR
The Fund may invest in certain instruments that rely in some fashion upon London Interbank Offered Rate (“LIBOR”). LIBOR is an average interest rate, determined by the ICE Benchmark Administration, that banks charge
one another for the use of short-term money. The United Kingdom’s Financial Conduct Authority, which regulates LIBOR, has announced plans to phase out the use of LIBOR by the end of 2021. There remains uncertainty regarding future utilization of
LIBOR and the nature of any replacement rate, and any potential effects of the transition away for LIBOR on the Fund or on certain instruments in which the Fund invests are not known.
11. SUBSEQUENT EVENTS
As of June 24, 2021, Jeanine M. Bajczyk no longer serves an Interested Trustee of the Trust. As of June 24, 2021, Elaine E. Richards has replaced Ms. Bajczyk as Interested Trustee of the Trust.
Management has evaluated events and transactions for potential recognition or disclosure through the date the financial statements were issued. There are no additional subsequent events to report that would have a
material impact on the Fund’s financial statements and the notes to the financial statements.
74
WEISS ALTERNATIVE MULTI-STRATEGY FUND
Additional Information (Unaudited)
April 30, 2021
AVAILABILITY OF FUND PORTFOLIO INFORMATION
The Fund files complete schedules of portfolio holdings with the SEC for the first and third quarters of each fiscal year on Form N-Q, which is available on the SEC’s website at www.sec.gov. The Fund’s Form N-Q may be
reviewed and copied at the SEC’s Public Reference Room in Washington, D.C. For information on the Public Reference Room call 1-800-SEC-0330. In addition, the Fund’s Form N-Q is available without charge upon request by calling 1-866-530-2690.
AVAILABILITY OF PROXY VOTING INFORMATION
A description of the Fund’s Proxy Voting Policies and Procedures is available without charge, upon request, by calling 1-866-530-2690. Information regarding how the Fund voted proxies relating to portfolio securities
during the most recent period ended June 30, is available (1) without charge, upon request, by calling 1-866-530-2690, or (2) on the SEC’s website at www.sec.gov.
75
WEISS ALTERNATIVE MULTI-STRATEGY FUND
Privacy Notice (Unaudited)
The Fund collects non-public information about you from the following sources:
|
•
|
Information we receive about you on applications or other forms;
|
|
|
•
|
Information you give us orally; and/or
|
|
|
•
|
Information about your transactions with us or others
|
We do not disclose any non-public personal information about our customers or former customers without the customer’s authorization, except as permitted by law. We may share information with affiliated
and unaffiliated third parties with whom we have contracts for servicing the Fund. We will provide unaffiliated third parties with only the information necessary to carry out their assigned responsibilities. We maintain physical, electronic and
procedural safeguards to guard your personal information and require third parties to treat your personal information with the same high degree of confidentiality.
In the event that you hold shares of the Fund through a financial intermediary, including, but not limited to, a broker-dealer, bank, or trust company, the privacy policy of your financial intermediary
would govern how your non-public personal information would be shared with unaffiliated third parties.
76
(This Page Intentionally Left Blank.)
INVESTMENT ADVISER
Weiss Multi-Strategy Advisers LLC
320 Park Avenue, 20th Floor
New York, NY 10022
DISTRIBUTOR
Quasar Distributors, LLC
111 East Kilbourn Avenue, Suite 2200
Milwaukee, WI 53202
CUSTODIAN
U.S. Bank N.A.
1555 North Rivercenter Drive, Suite 302
Milwaukee, WI 53212
ADMINISTRATOR, FUND ACCOUNTANT
AND TRANSFER AGENT
U.S. Bancorp Fund Services, LLC
615 East Michigan Street
Milwaukee, WI 53202
INDEPENDENT REGISTERED PUBLIC ACCOUNTING FIRM
Cohen & Company, Ltd.
342 North Water Street, Suite 830
Milwaukee, WI 53202
LEGAL COUNSEL
Goodwin Procter LLP
1900 N Street, NW
Washington, DC 20001
This report should be accompanied or preceded by a prospectus.
The Fund’s Statement of Additional Information contains additional information about the
Fund’s trustees and is available without charge upon request by calling 1-866-530-2690.
|
(b)
|
Not applicable
|
Item 2. Code of Ethics.
Not applicable for semi-annual reports.
Item 3. Audit Committee Financial Expert.
Not applicable for semi-annual reports.
Item 4. Principal Accountant Fees and Services.
Not applicable for semi-annual reports.
Item 5. Audit Committee of Listed Registrants.
Not applicable for semi-annual reports.
Item 6. Investments.
|
(a)
|
Schedule of Investments is included as part of the report to shareholders filed under Item 1 of this Form.
|
|
(b)
|
Not applicable.
|
Item 7. Disclosure of Proxy Voting Policies and Procedures for Closed-End Management Investment Companies.
Not applicable to open-end investment companies.
Item 8. Portfolio Managers of Closed-End Management Investment Companies.
Not applicable to open-end investment companies.
Item 9. Purchases of Equity Securities by Closed‑End Management Investment Company and Affiliated Purchasers.
Not applicable to open-end investment companies.
Item 10. Submission of Matters to a Vote of Security Holders.
There have been no material changes to the procedures by which shareholders may recommend nominees to the registrant’s board of trustees.
Item 11. Controls and Procedures.
|
(a)
|
The Registrant’s President/Principal Executive Officer and Treasurer/Principal Financial Officer have reviewed the Registrant's disclosure controls and procedures (as defined in Rule 30a-3(c) under the Investment Company Act of 1940
(the “Act”)) as of a date within 90 days of the filing of this report, as required by Rule 30a-3(b) under the Act and Rules 13a-15(b) or 15d 15(b) under the Securities Exchange Act of 1934. Based on their review, such officers have
concluded that the disclosure controls and procedures are effective in ensuring that information required to be disclosed in this report is appropriately recorded, processed, summarized and reported and made known to them by others within
the Registrant and by the Registrant’s service provider.
|
|
(b)
|
There were no changes in the Registrant's internal control over financial reporting (as defined in Rule 30a-3(d) under the Act) that occurred during the period covered by this report that have materially affected, or are reasonably
likely to materially affect, the Registrant's internal control over financial reporting.
|
Item 12. Disclosure of Securities Lending Activities for Closed-End management Investment Companies.
Not applicable to open-end investment companies.
Item 13. Exhibits.
|
(a)
|
(1) Any code of ethics or amendment thereto, that is the subject of the disclosure required by Item 2, to the extent that the registrant intends to satisfy Item 2 requirements through filing an
exhibit. Not applicable for semi-annual reports.
|
(3) Any written solicitation to purchase securities under Rule 23c‑1 under the Act sent or given during the period covered by the report by or on behalf of the registrant to 10 or
more persons. Not applicable to open-end investment companies.
(4) Change in the registrant’s independent public accountant. There was no change in the registrant’s independent public accountant for the period covered by this report.
SIGNATURES
Pursuant to the requirements of the Securities Exchange Act of 1934 and the Investment Company Act of 1940, the registrant has duly caused this report to be signed on its behalf by the undersigned, thereunto duly
authorized.
(Registrant) Series Portfolios Trust
By (Signature and Title) /s/ Ryan Roell
Ryan Roell, President
Date July 2, 2021
Pursuant to the requirements of the Securities Exchange Act of 1934 and the Investment Company Act of 1940, this report has been signed below by the following persons on behalf of the registrant and in the capacities
and on the dates indicated.
By (Signature and Title) ) /s/ Ryan Roell
Ryan Roell, President
Date July 2, 2021
By (Signature and Title) /s/ Cullen Small
Cullen Small, Principal Financial Officer
Date July 2, 2021