UNITED STATES
SECURITIES AND EXCHANGE COMMISSION
Washington, D.C. 20549
FORM 10-K
(Mark One) | ||
ANNUAL REPORT PURSUANT TO SECTION 13 OR 15(d) OF THE SECURITIES EXCHANGE ACT OF 1934 | ||
For the fiscal year ended October 31, 2019
Or
TRANSITION REPORT PURSUANT TO SECTION 13 OR 15(d) OF THE SECURITIES EXCHANGE ACT OF 1934 | ||
For the transition period from to
Commission file number 001-37483
(Exact name of registrant as specified in its charter)
(State or other jurisdiction of incorporation or organization) | (I.R.S. employer identification no.) | |
(Address of principal executive offices) | (Zip code) | |||
Registrant's telephone number, including area code: (650) 687-5817
Securities registered pursuant to Section 12(b) of the Act:
Title of each class | Trading Symbol(s) | Name of each exchange on which registered |
Securities registered pursuant to Section 12(g) of the Act:
None
Indicate by check mark if the registrant is a well-known seasoned issuer as defined in Rule 405 of the Securities Act. Yes x No ¨
Indicate by check mark if the registrant is not required to file reports pursuant to Section 13 or Section 15(d) of the Act. Yes ¨ No x
Indicate by check mark whether the registrant (1) has filed all reports required to be filed by Section 13 or 15(d) of the Securities Exchange Act of 1934 during the preceding 12 months (or for such shorter period that the registrant was required to file such reports), and (2) has been subject to such filing requirements for the past 90 days. Yes x No ¨
Indicate by check mark whether the registrant has submitted electronically every Interactive Data File required to be submitted pursuant to Rule 405 of Regulation S-T (§ 232.405 of this chapter) during the preceding 12 months (or for such shorter period that the registrant was required to submit such files). Yes x No ¨
Indicate by check mark whether the registrant is a large accelerated filer, an accelerated filer, a non-accelerated filer, a smaller reporting company, or an emerging growth company. See the definitions of "large accelerated filer," "accelerated filer", "smaller reporting company" and "emerging growth company" in Rule 12b-2 of the Exchange Act. (Check one):
☒ | Accelerated filer | ☐ | Non-accelerated filer (Do not check if a smaller reporting company) | ☐ | Smaller reporting company | |||||
Emerging growth company | ||||||||||
If an emerging growth company, indicate by check mark if the registrant has elected not to use the extended transition period for complying with any new or revised financial accounting standards provided pursuant to Section 13(a) of the Exchange Act. ¨
Indicate by check mark whether the registrant is a shell company (as defined in Rule 12b-2 of the Act). Yes ☐ No x
The aggregate market value of the registrant's common stock held by non-affiliates was $21,263,421,512 based on the last sale price of common stock on April 30, 2019.
The number of shares of Hewlett Packard Enterprise Company common stock outstanding as of November 30, 2019 was 1,292,925,893 shares.
DOCUMENTS INCORPORATED BY REFERENCE | ||
DOCUMENT DESCRIPTION | 10-K PART | |
III | ||
Hewlett Packard Enterprise Company
Form 10-K
For the Fiscal Year ended October 31, 2019
Table of Contents
Page | ||
Forward-Looking Statements
This Annual Report on Form 10-K, including "Management's Discussion and Analysis of Financial Condition and Results of Operations" in Item 7, contains forward-looking statements that involve risks, uncertainties and assumptions. If the risks or uncertainties ever materialize or the assumptions prove incorrect, the results of Hewlett Packard Enterprise Company and its consolidated subsidiaries ("Hewlett Packard Enterprise") may differ materially from those expressed or implied by such forward-looking statements and assumptions. The words "believe", "expect", "anticipate", "optimistic", "intend", "aim", "will", "should" and similar expressions are intended to identify such forward-looking statements. All statements other than statements of historical fact are statements that could be deemed forward-looking statements, including but not limited to any projections of revenue, margins, expenses, effective tax rates, the impact of the U.S. Tax Cuts and Jobs Act of 2017, earnings, net earnings, net earnings per share, cash flows, benefit plan funding, deferred tax assets, share repurchases, currency exchange rates or other financial items; any projections of the amount, timing or impact of cost savings or restructuring charges; any statements of the plans, strategies and objectives of management for future operations, as well as the execution of corporate transactions or contemplated acquisitions, transformation and restructuring plans and any resulting benefit, cost savings, revenue or profitability improvements; any statements concerning the expected development, performance, market share or competitive performance relating to products or services; any statements regarding current or future macroeconomic trends or events and the impact of those trends and events on Hewlett Packard Enterprise and its financial performance; any statements regarding pending investigations, claims or disputes; any statements of expectation or belief; and any statements or assumptions underlying any of the foregoing. Risks, uncertainties and assumptions include the need to address the many challenges facing Hewlett Packard Enterprise's businesses; the competitive pressures faced by Hewlett Packard Enterprise's businesses; risks associated with executing Hewlett Packard Enterprise's strategy; the impact of macroeconomic and geopolitical trends and events; the need to manage third-party suppliers and the distribution of Hewlett Packard Enterprise's products and the delivery of Hewlett Packard Enterprise's services effectively; the protection of Hewlett Packard Enterprise's intellectual property assets, including intellectual property licensed from third parties and intellectual property shared with its former Parent; risks associated with Hewlett Packard Enterprise's international operations; the development and transition of new products and services and the enhancement of existing products and services to meet customer needs and respond to emerging technological trends; the execution and performance of contracts by Hewlett Packard Enterprise and its suppliers, customers, clients and partners; the hiring and retention of key employees; integration and other risks associated with business combination and investment transactions; the execution, timing and results of any transformation or restructuring plans, including estimates and assumptions related to the costs (including any possible disruption of Hewlett Packard Enterprise's business) and anticipated benefits of implementing the transformation and restructuring plans; the effects of the U.S. Tax Cuts and Jobs Act and related guidance and regulations that may be implemented; the resolution of pending investigations, claims and disputes; and other risks that are described herein, including but not limited to the items discussed in "Risk Factors" in Item 1A of Part I of this report and that are otherwise described or updated from time to time in Hewlett Packard Enterprise's reports filed with the Securities and Exchange Commission. Hewlett Packard Enterprise assumes no obligation and does not intend to update these forward-looking statements.
1
PART I
ITEM 1. Business
We are a global technology leader focused on developing intelligent solutions that allow customers to capture, analyze and act upon data seamlessly from edge to cloud. We enable customers to accelerate business outcomes by driving new business models, creating new customer and employee experiences, and increasing operational efficiency today and into the future. Our legacy dates back to a partnership founded in 1939 by William R. Hewlett and David Packard, and we strive every day to uphold and enhance that legacy through our dedication to providing innovative technological solutions to our customers.
On November 1, 2015, HP Inc. ("former Parent"), formerly known as Hewlett-Packard Company ("HP Co.") spun-off Hewlett Packard Enterprise Company ("we", "us", "our", "Hewlett Packard Enterprise", "HPE", or "the Company") pursuant to a separation agreement (the "Separation and Distribution Agreement") (collectively the "Separation"). To effect the spin-off, HP Inc. distributed all of the shares of Hewlett Packard Enterprise Company ("HPE") common stock owned by HP Inc. to its stockholders on November 1, 2015. Holders of HP Inc. common stock received one share of Hewlett Packard Enterprise Company stock for every share of HP Inc. stock held as of the record date. As a result of the Separation, we now operate as an independent, publicly-traded company.
Separation Transactions
On April 1, 2017, we completed the separation and merger of our Enterprise Services business with Computer Sciences Corporation (“CSC”) (collectively, the “Everett Transaction”). The Everett Transaction was accomplished by a series of transactions among CSC, HPE, Everett SpinCo, Inc. (a wholly-owned subsidiary of HPE) (“Everett”), and New Everett Merger Sub Inc., a wholly-owned subsidiary of Everett (“Merger Sub”). We transferred the Enterprise Services business to Everett and distributed all of the shares of Everett to HPE stockholders. Following the distribution of shares, the Merger Sub merged with and into CSC, which became a wholly-owned subsidiary of Everett. At the time of the merger, Everett changed its name to DXC Technology Company (“DXC”).
On September 1, 2017, we completed the separation and merger of our Software business segment with Micro Focus International plc (“Micro Focus”) (collectively, the “Seattle Transaction”). The Seattle Transaction was accomplished by a series of transactions among HPE, Micro Focus, Seattle SpinCo, Inc. (a wholly-owned subsidiary of HPE) (“Seattle”), and Seattle MergerSub, Inc., an indirect wholly-owned subsidiary of Micro Focus (“Merger Sub”). We transferred the Software business to Seattle and distributed all of the shares of Seattle to HPE stockholders. Following the distribution of shares, the Merger Sub merged with and into Seattle which became an indirect, wholly-owned subsidiary of Micro Focus.
Upon the completion of the Everett and Seattle Transactions, we reclassified the historical financial results of our former Enterprise Services segment ("former ES segment") and our former Software segment to Net loss from discontinued operations in our Consolidated Statements of Earnings, and to assets and liabilities of discontinued operations in our Consolidated Balance Sheets.
HPE Next
During the third quarter of fiscal 2017, we launched an initiative called HPE Next, through which we are in the process of putting in place a purpose-built company designed to compete and win in the markets where we participate. Through this initiative, we are simplifying our operating model and the way we work, streamlining our offerings and business processes to improve our execution. More importantly, we will continue to shift our investments in innovation towards high growth and higher-margin solutions and services.
This initiative includes consolidating our manufacturing and support services locations, streamlining our business systems and reducing the number of countries in which we have a direct sales presence, while simultaneously migrating to a channel-only model in the remaining countries.
The HPE Next initiative is expected to be implemented through fiscal 2020. During the remaining implementation period, we expect to incur expenses for workforce reductions, to upgrade and simplify our IT infrastructure, and for other non-labor actions. These expenses will be partially offset by proceeds received from the remaining real estate sales.
Our Strategy
Digital transformation is creating countless possibilities in a world where billions of users and devices and trillions of things are connected. The applications and data that create and run our enterprises, live everywhere - in the cloud, on- and off-premises, and increasingly at the edge.
2
As the edge-to-cloud platform-as-a-Service company, HPE’s strategy is to help enterprises accelerate outcomes by unlocking value from all of their data, everywhere. Built on decades of re-imagining the future and innovating to advance the way we live and work, HPE delivers unique, open and intelligent technology solutions, with a consistent experience across all clouds and edges, to help customers develop new business models, engage in new ways, and increase operational performance.
No matter what stage of digital transformation, HPE has the expertise, the right tools and solutions with a flexible delivery model to help enterprises harness the power of their data across all their clouds and edges.
• | Through HPE Pointnext Services, we have the expertise to assess, design, implement, optimize and manage our customers’ digital transformation. |
• | We have the right tools to help customers accelerate their business - be it automation, AI, security or predictive analytics. |
• | We have the as-a-Service consumption model to provide flexibility and optimize IT investments. |
• | Through Financial Services, we can help customers manage and monetize their existing assets in new ways and free up capital for innovation. |
At HPE, we help our customers thrive, from every edge to any cloud.
Our Business Segments, Products and Services
We organize our business into the following four segments:
• | Hybrid IT provides a broad portfolio of services-led and software-enabled infrastructure and solutions including secure, software-defined servers, storage and HPE Pointnext services, thereby combining HPE's hardware, software and services capabilities to make Hybrid IT simple for its customers. |
• | Intelligent Edge provides a portfolio of secure Edge-to-Cloud solutions operating under the Aruba brand that include wireless local area network ("LAN"), campus and data center switching, software-defined wide-area-networking, security, and associated services to enable secure connectivity for businesses of any size. |
• | Financial Services ("FS") enables flexible IT consumption models, financial architectures and customized investment solutions for our customers. |
• | Corporate Investments includes Communication and Media Solutions ("CMS"), Hewlett Packard Labs and certain business incubation projects. |
A summary of our net revenue, earnings from operations and assets for our segments can be found in Note 3, "Segment Information", to our Consolidated Financial Statements in Item 8 of Part II. A discussion of certain factors potentially affecting our operations is set forth in Item 1A, "Risk Factors."
Hybrid IT
Hybrid IT provides a broad portfolio of services-led and software-enabled infrastructure and solutions including secure, software-defined servers, storage, and HPE Pointnext services, thereby combining HPE's hardware, software and services capabilities to make Hybrid IT simple for its customers. Described below are the business unit capabilities within Hybrid IT.
• | Hybrid IT Product includes Compute and Storage. |
◦ | Compute. We offer both Industry Standard Servers ("ISS"), which are general purpose servers for multi-workload computing, as well as Mission Critical Servers ("MCS"), which are servers optimized for particular workloads, to address the full array of the customers' computing needs. Our general purpose servers include the HPE ProLiant, secure and versatile rack and tower servers; HPE BladeSystem, a modular infrastructure that converges server, storage and networking; and HPE Synergy, a composable infrastructure for traditional and cloud-native applications. Our workload optimized server portfolio includes the HPE Apollo and products from the acquisition of Cray, for high performance computing and artificial intelligence, HPE Cloudline for cloud data centers, HPE Edgeline for computing at the network edge and HPE Integrity for mission-critical applications. |
◦ | Storage. With storage offerings that are AI-driven and built for cloud environments with as-a-service consumption and flexible investment options, HPE provides the right workload optimized destinations for data. Powered by HPE InfoSight advanced analytics and machine learning and HPE Cloud Volumes data mobility, HPE delivers intelligent storage for hybrid cloud environments so that customers can unlock data’s full potential and derive business insights. Key solutions include HPE SimpliVity, a hyper-converged platform for virtualization, |
3
technology from the Blue Data and MapR acquisitions for expertise in artificial intelligence, machine learning and analytics data management, HPE 3PAR Storage and HPE Nimble Storage all-flash arrays for mission critical workloads and general purpose workloads, respectively, and big data solutions running on HPE Apollo Servers. Storage also provides comprehensive data protection with HPE StoreOnce and HPE Recovery Manager Central, solutions for secondary workloads and traditional tape, storage networking and disk products, such as HPE Modular Storage Arrays ("MSA") and HPE XP.
• | HPE Pointnext Services creates preferred IT experiences that power the digital business. The HPE Pointnext Services team and our extensive partner network provide value across the IT life cycle delivering advice, transformation projects, professional services, support services and operational services for Hybrid IT and the Intelligent Edge. HPE Pointnext Services is also a provider of on-premises flexible consumption models, such as HPE GreenLake, that enable IT agility, simplify operations and align cost to business value. HPE Pointnext Services offerings includes Operational Services and Advisory and Professional Services. |
Intelligent Edge
The Intelligent Edge business is comprised of a portfolio of secure edge-to-cloud solutions operating under the Aruba brand that include wireless LAN, campus and data center switching, software-defined wide-area-networking, security, and associated services to enable secure connectivity for businesses of any size. The primary business drivers for Intelligent Edge solutions are mobility and IoT.
◦ | HPE Aruba Product includes wired and wireless LAN, wide area network ("WAN"), data center networking such as Wi-Fi access points, switches, routers, sensors, and software products that include cloud-based management, network management, network access control, analytics and assurance, and location services. |
◦ | HPE Aruba Services includes professional and support services, as well as as-a-Service ("aaS") and consumption models for the Intelligent Edge portfolio of products. |
Financial Services
Financial Services provides flexible investment solutions, such as leasing, financing, IT consumption, and utility programs and asset management services, for customers that facilitate unique technology deployment models and the acquisition of complete IT solutions, including hardware, software and services from Hewlett Packard Enterprise and others. In order to provide flexible services and capabilities that support the entire IT life cycle, FS partners with customers globally to help build investment strategies that enhance their business agility and support their business transformation. FS offers a wide selection of investment solution capabilities for large enterprise customers and channel partners, along with an array of financial options to SMBs and educational and governmental entities.
Corporate Investments
Corporate Investments includes CMS, Hewlett Packard Labs and certain business incubation projects.
Pending Segment Realignments
In order to align our segment financial reporting more closely with our current business structure, bring more visibility and transparency to Hybrid IT and further align to the evolving market landscape, effective November 1, 2019, we will report the following four new reportable segments: Compute; High Performance Compute ("HPC") & Mission Critical Servers ("MCS"); Storage; and Advisory & Professional Services ("A&PS"). As a result of this change, Operational Services, which was previously reported within HPE Pointnext Services, will be reported within each of the related individual new segments. The Intelligent Edge, Financial Services and Corporate Investments segments will remain largely unchanged.
Our Strengths
We believe that we possess a number of competitive advantages that distinguish us from our competitors, including:
• | Strong solutions portfolio that spans edge to cloud. We combine our software-defined infrastructure and services capabilities to provide what we believe is the strongest portfolio of enterprise solutions in the IT industry. Our ability to deliver a comprehensive IT strategy, and connect our customers’ data from edge to cloud, through our high-quality products and high-value consulting and support services in a single package-is one of our principal differentiators. |
• | Multi-year innovation roadmap. We have been in the technology and innovation business for over 75 years. Our vast intellectual property portfolio and global research and development capabilities are part of a broader innovation roadmap designed to help organizations take advantage of the expanding amount of data available and leverage the latest technology |
4
developments like cloud, artificial intelligence, and cybersecurity to drive business outcomes now and in the future. We also have a strong balance sheet that provides the flexibility and speed to take advantage of acquisition opportunities.
• | Ability to deliver flexible consumption-based IT solutions. We have developed IT consumption models to facilitate the delivery of our products and services to our customers that includes pay-per-use or subscription-based options with a sophisticated set of metering, financial and managed services components. We have a head start over other companies that has allowed us to build capabilities and partnerships that are unique in the industry including the ability to deliver our as-a-Service portfolio in more than 50 countries and with over 500 channel partners that can sell the as-a-Service portfolio. |
• | Global distribution and partner ecosystem. We are experts in delivering innovative technological solutions to our customers in complex multi-country, multi-vendor and/or multi-language environments. We have one of the largest go-to-market capabilities in our industry, including a large ecosystem of channel partners, which enables us to market and deliver our product offerings to customers located virtually anywhere in the world. |
• | Custom financial solutions. Through Financial Services we can help customers manage and monetize their existing assets in new ways and free up capital for innovation. Financial Services is unique in its ability to help customers address the entire product lifecycle to reduce the cost and resource demands of IT, in what we call the “circular economy.” Through Financial Services’ Global Asset Recovery Centers, we are processing more than 4 million assets every year, which also helps our customers achieve their own sustainability goals. |
• | Experienced leadership team with track record of successful performance. Our management team has an extensive track record of performance and execution. We are led by our President and Chief Executive Officer, Antonio Neri, who has proven experience in developing transformative business models, building global brands and driving sustained growth and expansion in the technology industry. Mr. Neri's experience includes over 20 years combined at HPE and HP Co. in various leadership positions. Our senior management team has many years of experience in our industry and possesses extensive knowledge of and experience in the enterprise IT business and the markets in which we compete. Moreover, we have a deep bench of management and technology talent that we believe provides us with an unparalleled pipeline of future leaders and innovators. |
• | Open Platforms. Many of our competitors want to lock customers into one flavor of cloud and cloud stack. We believe that the cloud experience should be open and seamless across all our customers’ clouds - and the best cloud transformation partner is one who is unbiased, offers choice, neutral without an agenda. We are unique in our ability to enable any hybrid cloud strategy and a consistent experience that is open to any cloud and differentiated with our partner integrations. |
Sales, Marketing and Distribution
We manage our business and report our financial results based on the segments described above. Our customers are organized by commercial and large enterprise groups, including business and public sector enterprises, and purchases of our products, solutions and services may be fulfilled directly by us or indirectly through a variety of partners, including:
• | resellers that sell our products and services, frequently with their own value-added products or services, to targeted customer groups; |
• | distribution partners that supply our solutions to resellers; |
• | original equipment manufacturers ("OEMs") that integrate our products and services with their own products and services, and sell the integrated solution; |
• | independent software vendors that provide their clients with specialized software products and often assist us in selling our products and services to clients purchasing their products; |
• | systems integrators that provide expertise in designing and implementing custom IT solutions and often partner with us to extend their expertise or influence the sale of our products and services; and |
• | advisory firms that provide various levels of management and IT consulting, including some systems integration work, and typically partner with us on client solutions that require our unique products and services. |
The mix of our business conducted by direct sales or channel differs substantially by business and region. We believe that customer buying patterns and different regional market conditions require us to tailor our sales, marketing and distribution efforts accordingly. We are focused on driving the depth and breadth of our coverage, in addition to identifying efficiencies and productivity gains, in both our direct and indirect businesses. For example, through our HPE Next initiative, we have reduced the number of countries in which we have a direct sales presence, while simultaneously migrating to a channel-only model in the remaining countries. We typically assign an account manager to manage relationships across our business with large enterprise customers.
5
The account manager is supported by a team of specialists with product and services expertise. For other customers and for consumers, our businesses collaborate to manage relationships with commercial resellers targeting SMBs where appropriate.
Manufacturing and Materials
We utilize a significant number of outsourced and contract manufacturers around the world to manufacture products that we design. The use of outsourced and contract manufacturers is intended to generate cost efficiencies and reduce time to market for our products as well as create manufacturing flexibility in our supply chain and processes. In some circumstances, third-party OEMs produce products that we purchase and resell under our brand. In addition to our use of outsourced and contract manufacturers, we currently manufacture a limited number of finished products from components and subassemblies that we acquire from a wide range of vendors.
Historically, we have utilized two primary methods of fulfilling demand for products: building products to order and configuring products to order. We build products to order to maximize manufacturing and logistics efficiencies by producing high volumes of basic product configurations. Alternatively, configuring products to order enables units to match a customer's particular hardware and software customization requirements. Our inventory management and distribution practices in both building products to order and configuring products to order seek to minimize inventory holding periods by taking delivery of the inventory and manufacturing shortly before the sale or distribution of products to our customers.
We purchase materials, supplies and product subassemblies from a substantial number of vendors. For most of our products, we have existing alternate sources of supply or such alternate sources of supply are readily available. However, we do rely on sole sources for certain customized parts (although some of these sources have operations in multiple locations in the event of a disruption). We are dependent upon Intel and AMD as suppliers of x86 processors; however, we believe that disruptions with these suppliers would result in industry-wide dislocations and therefore would not disproportionately disadvantage us relative to our competitors.
Like other participants in the IT industry, we ordinarily acquire materials and components through a combination of blanket and scheduled purchase orders to support our demand requirements for periods averaging 90 to 120 days. From time to time, we may experience significant price volatility or supply constraints for certain components that are not available from multiple sources due to certain events taking place where our suppliers are geographically concentrated. When necessary, we are often able to obtain scarce components for somewhat higher prices on the open market, which may have an impact on our gross margin, but does not generally disrupt production. We may also acquire component inventory in anticipation of supply constraints, or enter into longer-term pricing commitments with vendors to improve the priority, price and availability of supply. See "Risk Factors—We depend on third-party suppliers, and our financial results could suffer if we fail to manage our suppliers properly."
International
Our products and services are available worldwide. We believe geographic diversity allows us to meet demand on a worldwide basis for our customers, draws on business and technical expertise from a worldwide workforce, provides stability to our operations, provides revenue streams that may offset geographic economic trends, and offers us an opportunity to access new markets for maturing products.
A summary of our domestic and international results is set forth in Note 3, "Segment Information", to our Consolidated Financial Statements in Item 8 of Part II. Approximately 67% of our overall net revenue in fiscal 2019 came from outside the United States.
For a discussion of certain risks attendant to our international operations, see "Risk Factors—Due to the international nature of our business, political or economic changes or other factors could harm our future revenue, costs and expenses, and financial condition," and "—We are exposed to fluctuations in foreign currency exchange rates" in Item 1A, "Quantitative and Qualitative Disclosure about Market Risk" in Item 7A and Note 14, "Financial Instruments", to our Consolidated Financial Statements in Item 8 of Part II, which are incorporated herein by reference.
Research and Development
Innovation is a key element of our culture and critical to our success. Our research and development efforts are focused on designing and developing products, services and solutions that anticipate customers' changing needs and desires and emerging technological trends. Our efforts also are focused on identifying the areas where we believe we can make a unique contribution and where partnering with other leading technology companies will leverage our cost structure and maximize our customers' experiences.
Expenditures for research and development were $1.8 billion in fiscal 2019, $1.7 billion in fiscal 2018 and $1.5 billion in fiscal 2017. We anticipate that we will continue to have significant research and development expenditures in the future to support the design and development of innovative, high-quality products, services and solutions to maintain and enhance our competitive
6
position. For a discussion of risks attendant to our research and development activities, see "Risk Factors—If we cannot successfully execute our go-to-market strategy and continue to develop, manufacture and market innovative products, services and solutions, our business and financial performance may suffer" in Item 1A.
Patents
Our general policy is to seek patent protection for those inventions likely to be incorporated into our products and services or where obtaining such proprietary rights will improve our competitive position. At present, our worldwide patent portfolio includes approximately 15,000 issued and pending patents.
Patents generally have a term of up to 20 years from the date they are filed. As our patent portfolio has been built over time, the remaining terms of the individual patents across our patent portfolio vary. We believe that our patents and patent applications are important for maintaining the competitive differentiation of our products and services, enhancing our freedom of action to sell our products and services in markets in which we choose to participate, and maximizing our return on research and development investments. No single patent is in itself essential to our company as a whole or to any of our business segments.
In addition to developing our patent portfolio, we license intellectual property from third parties as we deem appropriate. We have also granted and continue to grant to others licenses and other rights under our patents when we consider these arrangements to be in our interest. These license arrangements include a number of cross-licenses with third parties.
For a discussion of risks attendant to intellectual property rights, see "Risk Factors—Our financial performance may suffer if we cannot continue to develop, license or enforce the intellectual property rights on which our businesses depend" and "—Our products and services depend in part on intellectual property and technology licensed from third parties" in Item 1A.
Backlog
We believe that our backlog is not a meaningful indicator of our future business prospects due to our diverse product and service portfolio, including the large volume of products delivered from finished goods or channel partner inventories and the shortening of product life cycles. Therefore, we believe that backlog information is not material to an understanding of our overall business.
Seasonality
General economic conditions have an impact on our business and financial results. From time to time, the markets in which we sell our products, services and solutions experience weak economic conditions that may negatively affect sales. We experience some seasonal trends in the sale of our products and services. For example, European sales are often weaker in the summer months. See Item 1A, "Risk Factors—Our uneven sales cycle makes planning and inventory management difficult and future financial results less predictable."
Competition
We have a broad technology portfolio of enterprise IT infrastructure products, solutions and services. We encounter strong competition in all areas of our business. We compete primarily on the basis of technology, innovation, performance, price, quality, reliability, brand, reputation, distribution, range of products and services, ease of use of our products, account relationships, customer training, service and support, security, and the availability of our IT infrastructure offerings.
The markets in which we compete are characterized by strong competition among major corporations with long-established positions and a large number of new and rapidly growing firms. Most product life cycles are relatively short, and to remain competitive we must develop new products and services, continuously enhance our existing products and services and compete effectively on the basis of the factors listed above, among others. In addition, we compete with many of our current and potential partners, including OEMs that design, manufacture and market their products under their own brand names. Our successful management of these competitive partner relationships is critical to our future success. Moreover, we anticipate that we will have to continue to adjust prices on many of our products and services to stay competitive.
7
The competitive environments in which each segment operates are described below:
Hybrid IT operates in the highly competitive data center infrastructure market, which is characterized by rapid and ongoing technological innovation and price competition. Our primary competitors include technology vendors such as Dell Technologies Inc., Cisco Systems, Inc., NetApp, Inc., Lenovo Group Ltd., International Business Machines Corporation, Huawei Technologies Co. Ltd., Amazon.com, Inc., Oracle Corporation, Fujitsu Limited, Juniper Networks, Inc., Inspur Co., Ltd., Hitachi Ltd., Extreme Networks, Inc., Pure Storage, Inc., VMware, Nutanix, Inc., Google Inc., and Rackspace Inc. In certain regions, we also experience competition from local companies and from generically branded or "white-box" manufacturers. Our strategy is to deliver superior products, high-value technology support services and differentiated integrated solutions that combine our infrastructure, software and services capabilities. Our competitive advantages include our broad end-to-end solutions portfolio, supported by our strong intellectual property portfolio and research and development capabilities, coupled with our global reach and partner ecosystem.
Intelligent Edge operates in the highly competitive networking and connectivity infrastructure market, which is characterized by rapid and ongoing technological innovation and price competition. Our primary competitors include technology vendors such as Cisco Systems, Inc., Extreme Networks, Inc., Juniper Networks, Inc., Fortinet, Inc., Ruckus Wireless, Inc., Arista Networks, Inc., Dell Technologies Inc., and Huawei Technologies Co. Ltd. Our strategy is to deliver superior enterprise wired and wireless local-area networking components and software, high-value technology support services and differentiated integrated solutions that combine our infrastructure, software and services capabilities. Our competitive advantages include our broad end-to-end solutions portfolio, supported by our strong intellectual property portfolio and research and development capabilities, coupled with our global reach and partner ecosystem.
Financial Services. In our financing business, our primary competitors are captive financing companies, such as IBM Global Financing, Dell Financial Services, and Cisco Capital, as well as banks and other financial institutions. Our primary IT Asset Disposition (ITAD) competitors are ERI, Ingram Micro, Sage Sustainable Electronics, and Sims Recycling Solutions. We believe our competitive advantage over banks, other financial institutions, and ITAD providers is our ability to bring together our investment solutions with our expertise in managing technology assets. Not only are we able to deliver investment solutions that help customers create unique technology deployments based on specific business needs, but we also help them extract value from existing IT investments while more efficiently managing the retirement of those assets. All of these solutions can help customers accelerate digital transformation, create new budget streams, and meet Circular Economy objectives.
For a discussion of certain risks attendant to these competitive environments, see "Risk Factors—We operate in an intensely competitive industry and competitive pressures could harm our business and financial performance" in Item 1A.
Environment
Our operations are subject to regulation under various federal, state, local, and foreign laws concerning the environment, including laws addressing the discharge of pollutants into the air and water, the management, movement, and disposal of hazardous substances and wastes and the clean-up of contaminated sites. We could incur substantial costs, including clean-up costs, fines and civil or criminal sanctions and third-party damage or personal injury claims, if we were to violate or become liable under environmental laws.
Many of our products are subject to various federal, state, local, and foreign laws governing chemical substances in products and their safe use, including laws restricting the presence of certain substances in electronics products and in some cases, laws regulating the manufacture and distribution of chemical substances. Some of our products and services also are, or may in the future be, subject to requirements applicable to their energy consumption. In addition, we face increasing complexity in our product design, procurement operations, and transportation and shipping infrastructure as we adjust to new and future requirements relating to recycling and reuse of materials as part of the transition to a circular economy, the chemical and materials composition of our products, appropriate product packaging and labeling, their safe use and their energy efficiency, including requirements relating to climate change. We are also subject to legislation in an increasing number of jurisdictions that makes producers of electrical goods, including servers and networking equipment, financially responsible for specified collection, recycling, treatment, and disposal of past and future covered products (sometimes referred to as "product take-back legislation"). In the event our products become non-compliant with these laws, our products could be restricted from entering certain jurisdictions and we could face other sanctions, including fines.
Our operations, services and ultimately our products are expected to become increasingly subject to federal, state, local, and foreign laws, regulations and international treaties relating to climate change. As these laws, regulations, treaties, and similar initiatives and programs are adopted and implemented throughout the world, we will be required to comply or potentially face market access limitations or other sanctions, including fines. However, we believe that technology will be fundamental to finding solutions to achieve compliance with and manage those requirements, and we are collaborating with industry, business groups and governments to find and promote ways that our technology can be used to address climate change and to facilitate compliance
8
with related laws, regulations and treaties. See "Risk Factors-Our business is subject to various federal, state, local and foreign laws and regulations that could result in costs or other sanctions that adversely affect our business and results of operations" in Item 1A.
We are committed to maintaining compliance with all environmental laws applicable to our operations, products and services, and to reducing our environmental impact across all aspects of our business. We meet this commitment with a comprehensive environmental, health and safety policy, strict environmental management of our operations and worldwide environmental programs and services.
Environmental costs and accruals are presently not material to our operations, cash flows or financial position. Although there is no assurance that existing or future environmental laws applicable to our operations, services or products will not have a material adverse effect on our operations, cash flows or financial condition, we do not currently anticipate material capital expenditures for environmental control facilities.
Employees
We had approximately 61,600 employees as of October 31, 2019.
Additional Information
Intel® and Itanium® are trademarks of Intel Corporation in the United States and other countries. AMD is a trademark of Advanced Micro Devices, Inc.
Information about our Executive Officers
The following are our current executive officers:
Name | Age | Position |
Antonio Neri | 52 | President and Chief Executive Officer |
Philip Davis | 52 | President, Hybrid IT |
Kirt P. Karros | 50 | Senior Vice President, Finance and Treasurer |
Alan May | 61 | Executive Vice President and Chief People Officer |
Keerti Melkote | 49 | President, Intelligent Edge |
Jeff T. Ricci | 58 | Senior Vice President, Controller and Principal Accounting Officer |
Tarek Robbiati | 54 | Executive Vice President and Chief Financial Officer |
Irv Rothman | 73 | President and Chief Executive Officer, HPE Financial Services |
John Schultz | 55 | Executive Vice President, Chief Legal and Administrative Officer and Secretary |
Antonio Neri; President and Chief Executive Officer
Mr. Neri has served as our President and Chief Executive Officer since June 2017 and February 2018, respectively. Mr. Neri previously served as Executive Vice President and General Manager of our Enterprise Group from November 2015 to June 2017. Prior to that, Mr. Neri served in a similar role for HP Co.’s Enterprise Group from October 2014 to November 2015. Mr. Neri served as Senior Vice President and General Manager of the HP Servers business unit from September 2013 to October 2014 and concurrently as Senior Vice President and General Manager of the HP Networking business unit from May 2014 to October 2014. Prior to that, Mr. Neri served as Senior Vice President and General Manager of the HP Technology Services business segment from August 2011 to September 2013 and as Vice President, Customer Services for the HP Personal Systems Group from 2007 to August 2011, having first joined HP Co. in 1996. From March 2012 to February 2013, Mr. Neri served as a director of MphasiS Limited, an India-based technology company.
Philip Davis; President, Hybrid IT
Mr. Davis has served as President of our Hybrid IT business segment since August 2018 and concurrently as our Chief Sales Officer from November 2017 to October 2019. Prior to that, Mr. Davis served as Senior Vice President and Regional Managing Director of our Enterprise Group in the Asia Pacific Japan region, from November 2016 to October 2017. Mr. Davis previously served as Vice President and General Manager, Storage of our Enterprise Group in the Asia Pacific Japan region from November 2015 to October 2016. Prior to that, Mr. Davis served in a similar role at HP Co. from September 2014 to November 2015. Before joining HP Co., Mr. Davis served as Vice President and General Manager of Dell’s Enterprise Solutions Group in the Asia Pacific Japan region from January 2008 to September 2014.
9
Kirt P. Karros; Senior Vice President, Finance and Treasurer
Mr. Karros has served as our Senior Vice President, Finance and Treasurer since November 2015. Prior to that, Mr. Karros served in a similar role at HP Co. and led its Investor Relations from May 2015 to October 2015. Mr. Karros previously served as Principal and Managing Director of Research for Relational Investors LLC, an investment fund, from 2001 to May 2015 and concurrently as a director of PMC-Sierra, a semiconductor company, from August 2013 to May 2015.
Alan May; Executive Vice President and Chief People Officer
Mr. May has served as our Executive Vice President, Chief People Officer since June 2015. Before joining Hewlett Packard Enterprise, Mr. May served as Vice President, Human Resources at Boeing Commercial Aircraft, a division of The Boeing Company, from April 2013 to June 2015. Prior to that, Mr. May served as Vice President, Human Resources for Boeing Defense, Space and Security at Boeing from April 2011 to June 2015 and as Vice President, Compensation, Benefits and Strategy at Boeing from August 2007 to April 2011. Mr. May has also served in senior human resources roles at Cerberus Capital Management and PepsiCo.
Keerti Melkote; President, Intelligent Edge
Mr. Melkote has served as President of our Intelligent Edge business segment since January 2017. Mr. Melkote previously served as Chief Technology Officer of Intelligent Edge from May 2015 to December 2016. Prior to that, Mr. Melkote performed a similar role as Chief Technology Officer and Co-Founder of Aruba Networks from February 2009 until our acquisition of Aruba Networks in May 2015. Previously, Mr. Melkote served as Co-Founder and Vice President, Products at Aruba Networks from February 2002 to January 2009.
Jeff T. Ricci; Senior Vice President, Controller and Principal Accounting Officer
Mr. Ricci has served as our Senior Vice President, Controller and Principal Accounting Officer since November 2015. Prior to that, Mr. Ricci performed a similar role at HP Co. from April 2014 to November 2015. Mr. Ricci served as Controller and Principal Accounting Officer at HP Co. on an interim basis from November 2013 to April 2014. Previously, Mr. Ricci served as Vice President, Finance for several of HP Co.'s organizations, including Technology and Operations from May 2012 to November 2013, Global Accounts and HP Financial Services from March 2011 to May 2012, and HP Software from March 2009 to March 2011.
Tarek Robbiati; Executive Vice President and Chief Financial Officer
Mr. Robbiati has served as our Executive Vice President, Chief Financial Officer since September 2018. Before joining Hewlett Packard Enterprise, Mr. Robbiati served as Chief Financial Officer of Sprint Corporation from August 2015 to February 2018. Mr. Robbiati previously served as Chief Executive Officer and Managing Director of FlexiGroup Limited in Australia from January 2013 to August 2015. Prior to that, from December 2009 to December 2012, Mr. Robbiati was Group Managing Director and President of Telstra International Group in Hong Kong and Executive Chairman of Hong Kong CSL Limited (“CSL”), a subsidiary of Telstra Corporation Limited. From July 2007 to May 2010, Mr. Robbiati served as the Chief Executive Officer of CSL in Hong Kong.
Irv Rothman; President and Chief Executive Officer, HPE Financial Services
Mr. Rothman has served as President and Chief Executive Officer of our Financial Services business segment, our IT investment and financing subsidiary, since November 2015. Prior to that, Mr. Rothman served in a similar role at HP Co. from May 2002 to November 2015. Prior to joining HP Co., Mr. Rothman was President and Chief Executive Officer of Compaq Financial Services Corporation from January 1997 to April 2002.
John F. Schultz; Executive Vice President, Chief Legal and Administrative Officer and Secretary
Mr. Schultz has served as our Executive Vice President, Chief Legal and Administrative Officer and Secretary since December 2017. Prior to that, Mr. Schultz served as our Executive Vice President, General Counsel and Secretary from November 2015 to December 2017, performing a similar role at HP Co. from April 2012 to November 2015. Mr. Schultz previously served as Deputy General Counsel for Litigation, Investigations and Global Functions at HP Co. from September 2008 to April 2012. Prior to joining HP Co., Mr. Schultz was a partner in the litigation practice at Morgan, Lewis & Bockius LLP, a law firm, from March 2005 to September 2008, where, among other clients, he supported HP Co. as external counsel on a variety of litigation and regulatory matters.
10
Available Information
Our Annual Report on Form 10-K, Quarterly Reports on Form 10-Q, Current Reports on Form 8-K, and amendments to reports filed or furnished pursuant to Sections 13(a) and 15(d) of the Securities Exchange Act of 1934, as amended, are available on our website at http://investors.hpe.com, as soon as reasonably practicable after we electronically file such reports with, or furnish those reports to, the Securities and Exchange Commission. Hewlett Packard Enterprise's Corporate Governance Guidelines, Board of Directors' committee charters (including the charters of the Audit Committee, Finance and Investment Committee, HR and Compensation Committee, Technology Committee, and Nominating, Governance and Social Responsibility Committee) and code of ethics entitled "Standards of Business Conduct" are also available at that same location on our website. Stockholders may request free printed copies of these documents from:
Hewlett Packard Enterprise Company
Attention: Investor Relations
6280 America Center Dr
San Jose, CA 95002
http://investors.hpe.com/financial/requested-printed-reports
11
ITEM 1A. Risk Factors.
You should carefully consider the following risks and other information in this Form 10-K in evaluating Hewlett Packard Enterprise and its common stock. Any of the following risks could materially and adversely affect our results of operations or financial condition. The following risk factors should be read in conjunction with Part II, Item 7, "Management's Discussion and Analysis of Financial Condition and Results of Operation" and the Consolidated Financial Statements and related notes in Part II, Item 8, "Financial Statements and Supplementary Data" of this Form 10-K.
Risks Related to Our Business
If we cannot successfully execute our go-to-market strategy and continue to develop, manufacture and market innovative products, services and solutions, our business and financial performance may suffer.
Our long-term strategy is focused on leveraging our portfolio of hardware, software and services as we deliver global edge to cloud platform-as-a-service to help customers accelerate outcomes by unlocking value from all of their data, everywhere. HPE delivers unique, open and intelligent technology solutions, with a consistent experience across all clouds and edge computing platforms. To successfully execute this strategy, we must address business model shifts and optimize go-to-market execution by improving cost structure, aligning sales coverage with strategic goals, improving channel execution and strengthening our capabilities in our areas of strategic focus, while continuing to pursue new product innovation that builds on our strategic capabilities in areas such as cloud and data center computing, software-defined networking, converged storage, high-performance compute, and wireless networking. Any failure to successfully execute this strategy, including any failure to invest sufficiently in strategic growth areas, could adversely affect our business, results of operations and financial condition.
The process of developing new high-technology products, software, services and solutions and enhancing existing hardware and software products, services and solutions is complex, costly and uncertain, and any failure by us to anticipate customers' changing needs and emerging technological trends accurately could significantly harm our market share, results of operations and financial condition. For example, as the transition to an environment characterized by cloud-based computing and software being delivered as a service progresses, we must continue to successfully develop and deploy cloud-based solutions for our customers. We must make long-term investments, develop or obtain and protect appropriate intellectual property, and commit significant research and development and other resources before knowing whether our predictions will accurately reflect customer demand for our products, services and solutions. Any failure to accurately predict technological and business trends, control research and development costs or execute our innovation strategy could harm our business and financial performance. Our research and development initiatives may not be successful in whole or in part, including research and development projects which we have prioritized with respect to funding and/or personnel.
After we develop a product, we must be able to manufacture appropriate volumes quickly while also managing costs and preserving margins. To accomplish this, we must accurately forecast volumes, mixes of products and configurations that meet customer requirements, and we may not succeed at doing so within a given product's life cycle or at all. Any delay in the development, production or marketing of a new product, service or solution could result in us not being among the first to market, which could further harm our competitive position.
We operate in an intensely competitive industry and competitive pressures could harm our business and financial performance.
We encounter aggressive competition from numerous and varied competitors in all areas of our business, and our competitors have targeted and are expected to continue targeting our key market segments. We compete primarily on the basis of our technology, innovation, performance, price, quality, reliability, brand, reputation, distribution, product range and ease of use, account relationships, customer training, service and support, and security of our offerings. If our products, services, support and cost structure do not enable us to compete successfully based on any of those criteria, our results of operations and business prospects could be harmed.
We have a large portfolio of products and services and must allocate our financial, personnel and other resources across all of our products and services while competing with companies that have smaller portfolios or specialize in one or more of our product or service lines. As a result, we may invest less in certain areas of our business than our competitors do, and our competitors may have greater financial, technical and marketing resources available to them compared to the resources allocated to our products and services that compete against their products and services. Industry consolidation may also affect competition by creating larger, more homogeneous and potentially stronger competitors in the markets in which we operate. Additionally, our competitors may affect our business by entering into exclusive arrangements with our existing or potential customers or suppliers.
Companies with whom we have alliances in certain areas may be or become our competitors in other areas. In addition, companies with whom we have alliances also may acquire or form alliances with our competitors, which could reduce their business with us. If we are unable to effectively manage these complicated relationships with alliance partners, our business and results of operations could be adversely affected.
12
We face aggressive price competition and may have to continue lowering the prices of many of our products and services to stay competitive, while simultaneously seeking to maintain or improve our revenue and gross margin. In addition, competitors who have a greater presence in some of the lower-cost markets in which we compete, or who can obtain better pricing, more favorable contractual terms and conditions or more favorable allocations of products and components during periods of limited supply may be able to offer lower prices than we are able to offer. Our cash flows, results of operations and financial condition may be adversely affected by these and other industry-wide pricing pressures.
Because our business model is based on providing innovative and high-quality products, we may spend a proportionately greater amount of our revenues on research and development than some of our competitors. If we cannot proportionately decrease our cost structure (apart from research and development expenses) on a timely basis in response to competitive price pressures, our gross margin and, therefore, our profitability could be adversely affected. In addition, if our pricing and other facets of our offerings are not sufficiently competitive, or if there is an adverse reaction to our product decisions, we may lose market share in certain areas, which could adversely affect our financial performance and business prospects.
Even if we are able to maintain or increase market share for a particular product, its financial performance could decline because the product is in a maturing industry or market segment or contains technology that is becoming obsolete. For example, our Storage business unit is experiencing the effects of a market transition towards converged products and solutions, which has led to a decline in demand for our traditional storage products. Financial performance could decline due to increased competition from other types of products. For example, the development of cloud-based solutions has reduced demand for some of our existing hardware products.
If we cannot continue to produce quality products and services, our reputation, business and financial performance may suffer.
In the course of conducting our business, we must adequately address quality issues associated with our products, services and solutions, including defects in our engineering, design and manufacturing processes and unsatisfactory performance under service contracts, as well as defects in third-party components included in our products and unsatisfactory performance or even malicious acts by third-party contractors or subcontractors or their employees. In order to address quality issues, we work extensively with our customers and suppliers and engage in product testing to determine the causes of problems and to develop and implement appropriate solutions. However, the products, services and solutions that we offer are complex, and our regular testing and quality control efforts may not be effective in controlling or detecting all quality issues or errors, particularly with respect to faulty components manufactured by third parties. If we are unable to determine the cause, find an appropriate solution or offer a temporary fix (or "patch") to address quality issues with our products, we may delay shipment to customers, which could delay revenue recognition and receipt of customer payments and could adversely affect our revenue, cash flows and profitability. In addition, after products are delivered, quality issues may require us to repair or replace such products. Addressing quality issues can be expensive and may result in additional warranty, repair, replacement and other costs, adversely affecting our financial performance. If new or existing customers have difficulty operating our products or are dissatisfied with our services or solutions, our results of operations could be adversely affected, and we could face possible claims if we fail to meet our customers' expectations. In addition, quality issues can impair our relationships with new or existing customers and adversely affect our brand and reputation, which could, in turn, adversely affect our results of operations.
If we fail to manage the distribution of our products and services properly, our business and financial performance could suffer.
We use a variety of distribution methods to sell our products and services around the world, including third-party resellers and distributors and both direct and indirect sales to enterprise accounts and consumers. Successfully managing the interaction of our direct and indirect channel efforts to reach various potential customer segments for our products and services is a complex process. Moreover, since each distribution method has distinct risks and gross margins, our failure to implement the most advantageous balance in the delivery model for our products and services could adversely affect our revenue and gross margins and therefore our profitability.
Our financial results could be materially adversely affected due to distribution channel conflicts or if the financial conditions of our channel partners were to weaken. Our results of operations may be adversely affected by any conflicts that might arise between our various distribution channels or the loss or deterioration of any alliance or distribution arrangement. Moreover, some of our wholesale distributors may have insufficient financial resources and may not be able to withstand changes in business conditions, including economic weakness, industry consolidation and market trends. Many of our significant distributors operate on narrow margins and have been negatively affected by business pressures in the past. Considerable trade receivables that are not covered by collateral or credit insurance are outstanding with our distribution channel partners. Revenue from indirect sales could suffer, and we could experience disruptions in distribution, if our distributors' financial conditions, abilities to borrow funds in the credit markets or operations weaken.
Our inventory management is complex, as we continue to sell a significant mix of products through distributors. We must manage both owned and channel inventory effectively, particularly with respect to sales to distributors, which involves forecasting
13
demand and pricing challenges. Distributors may increase orders during periods of product shortages, cancel orders if their inventory is too high or delay orders in anticipation of new products. Distributors also may adjust their orders in response to the supply of our products and the products of our competitors and seasonal fluctuations in end-user demand. Our reliance upon indirect distribution methods may reduce our visibility into demand and pricing trends and issues, and therefore make forecasting more difficult. If we have excess or obsolete inventory, we may have to reduce our prices and write down inventory. Moreover, our use of indirect distribution channels may limit our willingness or ability to adjust prices quickly and otherwise to respond to pricing changes by competitors. We also may have limited ability to estimate future product rebate redemptions in order to price our products effectively.
Our transition to a subscription-based business model may adversely affect our business, operating results and free cash flow.
We are currently transitioning to an as-a-Service company, providing our entire portfolio through a range of subscription-based, pay-per-use and as-a-Service offerings. We will also continue to provide our hardware and software in a capital expenditure and license-based model, ultimately giving our customers choice in consuming HPE products and services in a traditional or as-a-Service offering. Such business model changes entail significant risks and uncertainties, and we may be unable to complete the transition to a subscription-based business model, or manage the transition successfully and in a timely manner; and our ability to accurately forecast our future operating results may be adversely affected. Additionally, we may not realize all of the anticipated benefits of the subscription transition, even if we successfully complete the transition. The transition to a subscription-based business model also means that our historical results, especially those achieved before we began the transition, may not be indicative of our future results. Further, as customer demand for our consumption model offerings increases, we will experience differences in the timing of revenue recognition between our traditional offerings (for which revenue is generally recognized at the time of delivery) and our as-a-Service offerings (for which revenue is generally recognized ratably over the term of the arrangement).
In addition, the transition to an as-a-Service company is expected to require incremental capital requirements, resulting in a negative impact to cash flows in the near term, and may require us to dedicate additional resources, including sales and marketing costs. Furthermore, we anticipate needing to redesign our go-to-market structure, to better align with the subscription-based business model. There is no assurance that we will be able to successfully implement these adjustments in a timely or cost-effective manner, or that we will be able to realize all or any of the expected benefits from such adjustments.
Due to the international nature of our business, political or economic changes or other factors could harm our future revenue, costs and expenses, and financial condition.
Our business and financial performance depend significantly on worldwide economic conditions and the demand for technology hardware, software and services in the markets in which we compete. Economic weakness and uncertainty may adversely affect demand for our products, services and solutions, may result in increased expenses due to higher allowances for doubtful accounts and potential goodwill and asset impairment charges, and may make it more difficult for us to manage inventory and make accurate forecasts of revenue, gross margin, cash flows and expenses.
Economic weakness and uncertainty could cause our expenses to vary materially from our expectations. Any financial turmoil affecting the banking system and financial markets or any significant financial services institution failures could negatively impact our treasury operations, as the financial condition of such parties may deteriorate rapidly and without notice in times of market volatility and disruption. Poor financial performance of asset markets combined with lower interest rates and the adverse effects of fluctuating currency exchange rates could lead to higher pension and post-retirement benefit expenses. Interest and other expenses could vary materially from expectations depending on changes in interest rates, borrowing costs, currency exchange rates, and costs of hedging activities and the fair value of derivative instruments. Economic downturns also may lead to restructuring actions and associated expenses. Further, ongoing U.S. federal government spending priorities may limit demand for our products, services and solutions from organizations that receive funding from the U.S. government, and could negatively affect macroeconomic conditions in the United States, which could further reduce demand for our products, services and solutions.
Sales outside the United States constituted approximately 67% of our net revenue in fiscal 2019. Our future business and financial performance could suffer due to a variety of international factors, including:
• | ongoing instability or changes in a country's or region's economic or political conditions, including inflation, recession, interest rate fluctuations and actual or anticipated military or political conflicts, including uncertainties and instability in economic and market conditions caused by the United Kingdom’s vote to exit the European Union; |
• | longer collection cycles and financial instability among customers; |
• | trade regulations and procedures and actions affecting production, pricing and marketing of products, including policies adopted by countries that may champion or otherwise favor domestic companies and technologies over foreign competitors, or federal and state tax reforms; |
14
• | local labor conditions and regulations, including local labor issues faced by specific suppliers and original equipment manufacturers ("OEMs"), or changes to immigration and labor law policies which may adversely impact our access to technical and professional talent; |
• | managing our geographically dispersed workforce; |
• | changes in the international, national or local regulatory and legal environments; |
• | differing technology standards or customer requirements; |
• | import, export or other business licensing requirements or requirements relating to making foreign direct investments, which could increase our cost of doing business in certain jurisdictions, prevent us from shipping products to particular countries or markets, affect our ability to obtain favorable terms for components, increase our operating costs or lead to penalties or restrictions; |
• | difficulties associated with repatriating earnings in restricted countries, and changes in tax laws; and |
• | fluctuations in freight costs, limitations on shipping and receiving capacity, and other disruptions in the transportation and shipping infrastructure at important geographic points of exit and entry for our products and shipments. |
The factors described above also could disrupt our product and component manufacturing and key suppliers located outside of the United States. For example, we rely on suppliers in Asia for product assembly and manufacture.
In many foreign countries, particularly in those with developing economies, there are companies that engage in business practices prohibited by laws and regulations applicable to us, such as the Foreign Corrupt Practices Act of 1977, as amended (the "FCPA"). Although we implement policies, procedures and training designed to facilitate compliance with these laws, our employees, contractors and agents, as well as those of the companies to which we outsource certain of our business operations, may take actions in violation of our policies. Any such violation, even if prohibited by our policies, could have an adverse effect on our business and reputation.
We are exposed to fluctuations in foreign currency exchange rates.
Currencies other than the U.S. dollar, including the euro, the British pound, Chinese yuan (renminbi) and the Japanese yen, can have an impact on our results as expressed in U.S. dollars. Currency volatility contributes to variations in our sales of products and services in impacted jurisdictions. Fluctuations in foreign currency exchange rates, most notably the strengthening of the U.S. dollar against the euro, could adversely affect our revenue growth in future periods. In addition, currency variations can adversely affect margins on sales of our products in countries outside of the United States and margins on sales of products that include components obtained from suppliers located outside of the United States.
From time to time, we may use forward contracts and options designated as cash flow hedges to protect against foreign currency exchange rate risks. The effectiveness of our hedges depends on our ability to accurately forecast future cash flows, which is particularly difficult during periods of uncertain demand for our products and services and highly volatile exchange rates. We may incur significant losses from our hedging activities due to factors such as demand volatility and currency variations. In addition, certain or all of our hedging activities may be ineffective, may expire and not be renewed or may not offset any or more than a portion of the adverse financial impact resulting from currency variations. Losses associated with hedging activities also may impact our revenue and to a lesser extent our cost of sales and financial condition.
The revenue and profitability of our operations have historically varied, which makes our future financial results less predictable.
Our revenue, gross margin and profit vary among our diverse products and services, customer groups and geographic markets and therefore will likely be different in future periods than our historical results. Our revenue depends on the overall demand for our products and services. Delays or reductions in IT spending by our customers or potential customers could have a material adverse effect on demand for our products and services, which could result in a significant decline in revenue. In addition, revenue declines in some of our businesses may affect revenue in our other businesses as we may lose cross-selling opportunities. Overall gross margins and profitability in any given period are dependent partially on the product, service, customer and geographic mix reflected in that period's net revenue. Competition, lawsuits, investigations, increases in component and manufacturing costs that we are unable to pass on to our customers, component supply disruptions and other risks affecting our businesses may have a significant impact on our overall gross margin and profitability. Variations in fixed cost structure and gross margins across business units and product portfolios may lead to significant operating profit volatility on a quarterly or annual basis. In addition, newer geographic market opportunities may be relatively less profitable due to our investments associated with entering those markets and local pricing pressures, and we may have difficulty establishing and maintaining the operating infrastructure necessary to support the high growth rate associated with some of those markets. Market trends, industry shifts, competitive pressures, commoditization of products, increased component or shipping costs, regulatory impacts and other factors may result in reductions in revenue or pressure on gross margins of certain segments in a given period, which may lead to adjustments to our operations.
15
Moreover, our efforts to address the challenges facing our business could increase the level of variability in our financial results because the rate at which we are able to realize the benefits from those efforts may vary from period to period.
We depend on third-party suppliers, and our financial results could suffer if we fail to manage our suppliers properly.
Our operations depend on our ability to anticipate our needs for components, products and services, as well as our suppliers' ability to deliver sufficient quantities of quality components, products and services at reasonable prices and in time for us to meet critical schedules for the delivery of our own products and services. Given the wide variety of solutions that we offer, the large and diverse distribution of our suppliers and contract manufacturers, and the long lead times required to manufacture, assemble and deliver certain solutions, problems could arise in production, planning and inventory management that could seriously harm our business. In addition, our ongoing efforts to optimize the efficiency of our supply chain could cause supply disruptions and be more expensive, time-consuming and resource-intensive than expected. Furthermore, certain of our suppliers may decide to discontinue conducting business with us. Other supplier problems that we could face include component shortages, excess supply, and contractual, relational and labor risks, each of which is described below.
Component shortages. We may experience a shortage of, or a delay in receiving, certain components as a result of strong demand, capacity constraints, supplier financial weaknesses, the inability of suppliers to borrow funds in the credit markets, disputes with suppliers (some of whom are also our customers), disruptions in the operations of component suppliers, other problems experienced by suppliers or problems faced during the transition to new suppliers. If shortages or delays persist, the price of certain components may increase, we may be exposed to quality issues, or the components may not be available at all. We may not be able to secure enough components at reasonable prices or of acceptable quality to build products or provide services in a timely manner in the quantities needed or according to our specifications. Accordingly, our business and financial performance could suffer if we lose time-sensitive sales, incur additional freight costs or are unable to pass on price increases to our customers. If we cannot adequately address supply issues, we might have to reengineer some product or service offerings, which could result in further costs and delays.
• | Excess supply. In order to secure components for our products or services, at times we may make advance payments to suppliers or enter into non-cancelable commitments with vendors. In addition, we may purchase components strategically in advance of demand to take advantage of favorable pricing or to address concerns about the availability of future components. If we fail to anticipate customer demand properly, a temporary oversupply could result in excess or obsolete components, which could adversely affect our business and financial performance. |
• | Contractual terms. As a result of binding long-term price or purchase commitments with vendors, we may be obligated to purchase components or services at prices that are higher than those available in the current market and be limited in our ability to respond to changing market conditions. If we commit to purchasing components or services for prices in excess of the then-current market price, we may be at a disadvantage to competitors who have access to components or services at lower prices, our gross margin could suffer, and we could incur additional charges relating to inventory obsolescence. Any of these developments could adversely affect our future results of operations and financial condition. |
• | Contingent workers. We also rely on third-party suppliers for the provision of contingent workers, and our failure to manage our use of such workers effectively could adversely affect our results of operations. We have been exposed to various legal claims relating to the status of contingent workers in the past and could face similar claims in the future. We may be subject to shortages, oversupply or fixed contractual terms relating to contingent workers. Our ability to manage the size of, and costs associated with, the contingent workforce may be subject to additional constraints imposed by local laws. |
• | Single-source suppliers. We obtain a significant number of components from single sources due to technology, availability, price, quality, scale or customization needs. Replacing a single-source supplier could delay production of some products as replacement suppliers may be subject to capacity constraints or other output limitations. For some components, such as customized components, alternative sources either may not exist or may be unable to produce the quantities of those components necessary to satisfy our production requirements. In addition, we sometimes purchase components from single-source suppliers under short-term agreements that contain favorable pricing and other terms but that may be unilaterally modified or terminated by the supplier with limited notice and with little or no penalty. The performance of such single-source suppliers under those agreements (and the renewal or extension of those agreements upon similar terms) may affect the quality, quantity and price of our components. The loss of a single-source supplier, the deterioration of our relationship with a single-source supplier or any unilateral modification to the contractual terms under which we are supplied components by a single-source supplier could adversely affect our business and financial performance. |
Business disruptions could seriously harm our future revenue and financial condition and increase our costs and expenses.
Our worldwide operations could be disrupted by natural or human induced disasters including, but not limited to, earthquakes, tsunamis, floods, hurricanes, typhoons, fires, extreme weather conditions, power or water shortages, telecommunications failures, materials scarcity and price volatility, and medical epidemics or pandemics. We are predominantly self-insured to mitigate the
16
impact of most catastrophic events. Climate change serves as a risk multiplier increasing both the frequency and severity of natural disasters that may affect our worldwide business operations. Therefore, forecasting disruptive events and building additional resiliency into our operations accordingly will become an increasing business imperative. The occurrence of business disruptions could result in significant losses, seriously harm our revenue, profitability and financial condition, adversely affect our competitive position, increase our costs and expenses, and require substantial expenditures and recovery time in order to fully resume operations. Our corporate headquarters and a portion of our research and development activities are located in California, which suffers from drought conditions and catastrophic wildfires affecting the health and safety of our employees. To mitigate wildfire risk, electric utilities are deploying public safety power shutoffs (PSPS), which affects electricity reliability to our facilities and our communities. Other critical business operations and some of our suppliers are located in California and Asia, near major earthquake faults known for seismic activity. In 2017, our principal worldwide IT data centers in Houston were flooded due Hurricane Harvey. Since then, HPE has increased its resiliency through site selection and infrastructure investments to mitigate physical risks from climate change. The manufacture of product components, the final assembly of our products and other critical operations are concentrated in certain geographic locations, including the Czech Republic, Mexico, China and Singapore. We also rely on major logistics hubs, which are strategically located near manufacturing facilities in the major regions and in proximity to HPE’s distribution channels and customers. Our operations could be adversely affected if manufacturing, logistics or other operations in these locations are disrupted for any reason, including natural disasters, IT system failures, military actions or economic, business, labor, environmental, public health, regulatory or political issues. The ultimate impact on us, our significant suppliers and our general infrastructure of being located near vulnerable locations is continuing to be assessed.
Our uneven sales cycle makes planning and inventory management difficult and future financial results less predictable.
In some of our businesses, our quarterly sales have periodically reflected a pattern in which a disproportionate percentage of each quarter's total sales occurs towards the end of the quarter. This uneven sales pattern makes predicting revenue, earnings, cash flow from operations and working capital for each financial period difficult, increases the risk of unanticipated variations in our quarterly results and financial condition and places pressure on our inventory management and logistics systems. If predicted demand is substantially greater than orders, there may be excess inventory. Alternatively, if orders substantially exceed predicted demand, we may not be able to fulfill all of the orders received in each quarter and such orders may be canceled. Depending on when they occur in a quarter, developments such as a systems failure, component pricing movements, component shortages or global logistics disruptions, could adversely impact our inventory levels and results of operations in a manner that is disproportionate to the number of days in the quarter affected.
We experience some seasonal trends in the sale of our products that also may produce variations in our quarterly results and financial condition. For example, sales to governments (particularly sales to the U.S. government) are often stronger in the third calendar quarter, and many customers whose fiscal year is the calendar year spend their remaining capital budget authorizations in the fourth calendar quarter prior to new budget constraints in the first calendar quarter of the following year. European sales are often weaker during the summer months. Typically, our third fiscal quarter is our weakest and our fourth fiscal quarter is our strongest. Many of the factors that create and affect seasonal trends are beyond our control.
Changes in U.S. trade policy, including the imposition of tariffs and the resulting consequences, may have a material adverse impact on our business and results of operations.
The U.S. government has adopted a new approach to trade policy and in some cases to renegotiate, or potentially terminate, certain existing bilateral or multi-lateral trade agreements. It has also imposed tariffs on certain foreign goods, including information and communication technology products. These measures may materially increase costs for goods imported into the United States. This in turn could require us to materially increase prices to our customers which may reduce demand, or, if we are unable to increase prices, result in lowering our margin on products sold. Changes in U.S. Trade policy have resulted in, and could result in more, U.S. trading partners adopting responsive trade policy making it more difficult or costly for us to export our products to those countries.
Any failure by us to identify, manage and complete acquisitions, divestitures and other significant transactions successfully could harm our financial results, business and prospects.
As part of our business strategy, we may acquire companies or businesses, divest businesses or assets, enter into strategic alliances and joint ventures and make investments to further our business (collectively, "business combination and investment transactions"). For example, in September 2019, we acquired Cray Inc., a global supercomputer leader. In May 2016, we completed the sale to Tsinghua Holdings Co., Ltd. ("Tsinghua"), the asset management arm of Tsinghua University in China, of a 51% interest in our wholly owned subsidiary that owns and operates H3C Technologies and our China-based server, storage and technology services businesses for approximately $2.6 billion. On April 1, 2017 and September 1, 2017, we spun off our Enterprise Services and Software businesses, respectively. See also the risk factors below under the heading “Risks Related to the Separations of our Former Enterprise Services Business and our Former Software Segment”.
Risks associated with business combination and investment transactions include the following, any of which could adversely affect our revenue, gross margin, profitability and financial results:
17
• | Managing business combination and investment transactions requires varying levels of management resources, which may divert our attention from other business operations. |
• | We may not fully realize all of the anticipated benefits of any particular business combination and investment transaction, and the timeframe for realizing the benefits of a particular business combination and investment transaction may depend partially upon the actions of employees, advisors, suppliers, other third parties or market trends. |
• | Certain previous business combination and investment transactions have resulted, and in the future any such transactions by us may result, in significant costs and expenses, including those related to severance pay, early retirement costs, employee benefit costs, charges from the elimination of duplicative facilities and contracts, inventory adjustments, assumed litigation and other liabilities, legal, accounting and financial advisory fees, and required payments to executive officers and key employees under retention plans. |
• | Any increased or unexpected costs, unanticipated delays or failure to meet contractual obligations could make business combination and investment transactions less profitable or unprofitable. |
• | Our ability to conduct due diligence with respect to business combination and investment transactions, and our ability to evaluate the results of such due diligence, is dependent upon the veracity and completeness of statements and disclosures made or actions taken by third parties or their representatives. |
• | Our due diligence process may fail to identify significant issues with the acquired company's product quality, financial disclosures, accounting practices or internal control deficiencies. |
• | The pricing and other terms of our contracts for business combination and investment transactions require us to make estimates and assumptions at the time we enter into these contracts, and, during the course of our due diligence, we may not identify all of the factors necessary to estimate accurately our costs, timing and other matters or we may incur costs if a business combination is not consummated. |
• | In order to complete a business combination and investment transaction, we may issue common stock, potentially creating dilution for our existing stockholders. |
• | We may borrow to finance business combination and investment transactions, and the amount and terms of any potential future acquisition-related or other borrowings, as well as other factors, could affect our liquidity and financial condition. |
• | Our effective tax rate on an ongoing basis is uncertain, and business combination and investment transactions could adversely impact our effective tax rate. |
• | An announced business combination and investment transaction may not close on the expected timeframe or at all, which may cause our financial results to differ from expectations in a given quarter. |
• | Business combination and investment transactions may lead to litigation, which could impact our financial condition and results of operations. |
• | If we fail to identify and successfully complete and integrate business combination and investment transactions that further our strategic objectives, we may be required to expend resources to develop products, services and technology internally, which may put us at a competitive disadvantage. |
We have incurred and will incur additional depreciation and amortization expense over the useful lives of certain assets acquired in connection with business combination and investment transactions and, to the extent that the value of goodwill or intangible assets acquired in connection with a business combination and investment transaction becomes impaired, we may be required to incur additional material charges relating to the impairment of those assets.
As part of our business strategy, we regularly evaluate the potential disposition of assets and businesses that may no longer help us meet our objectives. When we decide to sell assets or a business, we may encounter difficulty in finding buyers or alternative exit strategies on acceptable terms in a timely manner, which could delay the achievement of our strategic objectives. We may also dispose of a business at a price or on terms that are less desirable than we had anticipated. In addition, we may experience greater dis-synergies than expected, and the impact of the divestiture on our revenue growth may be larger than projected. After reaching an agreement with a buyer or seller for the acquisition or disposition of a business, we are subject to satisfaction of pre-closing conditions as well as to necessary regulatory and governmental approvals on acceptable terms, which, if not satisfied or obtained, may prevent us from completing the transaction. Dispositions may also involve continued financial involvement in the divested business, such as through continuing equity ownership, guarantees, indemnities or other financial obligations. Under these arrangements, performance by the divested businesses or other conditions outside of our control could affect our future financial results.
18
Integrating acquisitions may be difficult and time-consuming. Any failure by us to integrate acquired companies, products or services into our overall business in a timely manner could harm our financial results, business and prospects.
In order to pursue our strategy successfully, we must identify candidates for and successfully complete business combination and investment transactions, some of which may be large or complex, and manage post-closing issues such as the integration of acquired businesses, products, services or employees. Integration issues are often time-consuming and expensive and, without proper planning and implementation, could significantly disrupt our business and the acquired business. The challenges involved in integration include:
• | successfully combining product and service offerings, including under the single Hewlett Packard Enterprise brand, and entering or expanding into markets in which we are not experienced or are developing expertise; |
• | convincing customers and distributors that the transaction will not diminish customer service standards or business focus; |
• | persuading customers and distributors to not defer purchasing decisions or switch to other suppliers (which could result in our incurring additional obligations in order to address customer uncertainty), minimizing sales force attrition and expanding and coordinating sales, marketing and distribution efforts; |
• | consolidating and rationalizing corporate IT infrastructure, which may include multiple legacy systems from various acquisitions and integrating software code and business processes; |
• | minimizing the diversion of management attention from ongoing business concerns; |
• | persuading employees that business cultures are compatible, maintaining employee morale and retaining key employees, engaging with employee works councils representing an acquired company's non-U.S. employees, integrating employees, correctly estimating employee benefit costs and implementing restructuring programs; |
• | coordinating and combining administrative, manufacturing, research and development and other operations, subsidiaries, facilities and relationships with third parties in accordance with local laws and other obligations while maintaining adequate standards, controls and procedures; |
• | achieving savings from supply chain integration; and |
• | managing integration issues shortly after or pending the completion of other independent transactions. |
We may not achieve some or all of the expected benefits of our restructuring plans and our restructuring may adversely affect our business.
We have announced restructuring plans, including the HPE Next initiative and previously announced 2012 Plan and the 2015 Plan (each as defined below), in order to realign our cost structure due to the changing nature of our business and to achieve operating efficiencies that we expect to reduce costs, as well as simplify our organizational structure, upgrade our IT infrastructure and redesign business processes. We may not be able to obtain the cost savings and benefits that were initially anticipated in connection with our restructuring. Additionally, as a result of restructuring initiatives, we may experience a loss of continuity, loss of accumulated knowledge and/or inefficiency during transitional periods. Reorganization and restructuring can require a significant amount of management and other employees' time and focus, which may divert attention from operating and growing our business. If we fail to achieve some or all of the expected benefits of restructuring, it could have a material adverse effect on our competitive position, business, financial condition, results of operations and cash flows. For more information about our restructuring plans, including details regarding the 2012 Plan and the 2015 Plan, and the HPE Next initiative, see Note 4, "Restructuring", and Note 5, “HPE Next”, to the Consolidated Financial Statements.
Our financial performance may suffer if we cannot continue to develop, license or enforce the intellectual property rights on which our businesses depend.
We rely upon patent, copyright, trademark, trade secret and other intellectual property laws in the United States, similar laws in other countries, and agreements with our employees, customers, suppliers and other parties, to establish and maintain intellectual property rights in the products and services we sell, provide or otherwise use in our operations. However, any of our intellectual property rights could be challenged, invalidated, infringed or circumvented, or such intellectual property rights may not be sufficient to permit us to take advantage of current market trends or to otherwise provide competitive advantages. Further, the laws of certain countries do not protect proprietary rights to the same extent as the laws of the United States. Therefore, in certain jurisdictions we may be unable to protect our proprietary technology adequately against unauthorized third-party copying or use; this, too, could adversely affect our ability to sell products or services and our competitive position.
Our products and services depend in part on intellectual property and technology licensed from third parties.
Much of our business and many of our products rely on key technologies developed or licensed by third parties. For example, many of our software offerings are developed using software components or other intellectual property licensed from third parties, including through both proprietary and open source licenses. These third-party software components may become obsolete,
19
defective or incompatible with future versions of our products, or our relationship with the third party may deteriorate, or our agreements with the third party may expire or be terminated. We may face legal or business disputes with licensors that may threaten or lead to the disruption of inbound licensing relationships. In order to remain in compliance with the terms of our licenses, we must carefully monitor and manage our use of third-party software components, including both proprietary and open source license terms that may require the licensing or public disclosure of our intellectual property without compensation or on undesirable terms. Additionally, some of these licenses may not be available to us in the future on terms that are acceptable or that allow our product offerings to remain competitive. Our inability to obtain licenses or rights on favorable terms could have a material effect on our business, including our financial condition and results of operations. In addition, it is possible that as a consequence of a merger or acquisition, third parties may obtain licenses to some of our intellectual property rights or our business may be subject to certain restrictions that were not in place prior to such transaction. Because the availability and cost of licenses from third parties depends upon the willingness of third parties to deal with us on the terms we request, there is a risk that third parties who license to our competitors will either refuse to license us at all, or refuse to license us on terms equally favorable to those granted to our competitors. Consequently, we may lose a competitive advantage with respect to these intellectual property rights or we may be required to enter into costly arrangements in order to terminate or limit these rights.
Third-party claims of intellectual property infringement, including patent infringement, are commonplace in the IT industry and successful third-party claims may limit or disrupt our ability to sell our products and services.
Third parties may claim that we or customers indemnified by us are infringing upon their intellectual property rights. For example, patent assertion entities may purchase intellectual property assets for the purpose of asserting claims of infringement and attempting to extract settlements from companies such as Hewlett Packard Enterprise and its customers. If we cannot or do not license allegedly infringed intellectual property at all or on reasonable terms, or if we are required to substitute similar technology from another source, our operations could be adversely affected. Even if we believe that intellectual property claims are without merit, they can be time-consuming and costly to defend against and may divert management's attention and resources away from our business. Claims of intellectual property infringement also might require us to redesign affected products, discontinue certain product offerings, enter into costly settlement or license agreements, pay costly damage awards or face a temporary or permanent injunction prohibiting us from importing, marketing or selling certain of our products. Even if we have an agreement to indemnify us against such costs, the indemnifying party may be unable or unwilling to uphold its contractual obligations to us.
Failure to comply with our customer contracts or government contracting regulations could adversely affect our business and results of operations.
Our contracts with our customers may include unique and specialized performance requirements. In particular, our contracts with federal, state, provincial and local governmental customers are subject to various procurement regulations, contract provisions and other requirements relating to their formation, administration and performance. Any failure by us to comply with the specific provisions in our customer contracts or any violation of government contracting regulations could result in the imposition of various civil and criminal penalties, which may include termination of contracts, forfeiture of profits, suspension of payments and, in the case of our government contracts, fines and suspension from future government contracting. Such failures could also cause reputational damage to our business. In addition, our former Parent has in the past been, and we may in the future be, subject to qui tam litigation brought by private individuals on behalf of the government relating to our government contracts, which could include claims for treble damages. Further, any negative publicity related to our customer contracts or any proceedings surrounding them, regardless of its accuracy, may damage our business by affecting our ability to compete for new contracts. If our customer contracts are terminated, if we are suspended or disbarred from government work, or if our ability to compete for new contracts is adversely affected, our financial performance could suffer.
We make estimates and assumptions in connection with the preparation of our Consolidated Financial Statements and any changes to those estimates and assumptions could adversely affect our results of operations.
In connection with the preparation of our Consolidated Financial Statements, we use certain estimates and assumptions based on historical experience and other factors. Our most critical accounting estimates are described in the section entitled "Management's Discussion and Analysis of Financial Condition and Results of Operations." In addition, as discussed in Note 18, "Litigation and Contingencies", to our Consolidated Financial Statements, we make certain estimates, including decisions related to provisions for legal proceedings and other contingencies. While we believe that these estimates and assumptions are reasonable under the circumstances, they are subject to significant uncertainties, some of which are beyond our control. Should any of these estimates and assumptions change or prove to have been incorrect, it could adversely affect our results of operations.
20
Unanticipated changes in our tax provisions, the adoption of new tax legislation or exposure to additional tax liabilities could affect our financial performance.
We are subject to income and other taxes in the United States and numerous foreign jurisdictions. Our tax liabilities are affected by the amounts we charge in intercompany transactions for inventory, services, licenses, funding and other items. We are subject to ongoing tax audits in various jurisdictions. Tax authorities may disagree with our intercompany charges, cross-jurisdictional transfer pricing or other matters, and may assess additional taxes as a result. We regularly assess the likely outcomes of these audits in order to determine the appropriateness of our tax provision. However, there can be no assurance that we will accurately predict the outcomes of these audits, and the amounts ultimately paid upon resolution of audits could be materially different from the amounts previously included in our income tax expense and therefore could have a material impact on our tax provision, net income and cash flows. In addition, our effective tax rate in the future could be adversely affected by changes to our operating structure, changes in the mix of earnings in countries with differing statutory tax rates, changes in the valuation of deferred tax assets and liabilities, changes in tax laws and the discovery of new information in the course of our tax return preparation process. The carrying value of our deferred tax assets is dependent on our ability to generate future taxable income.
The Organisation for Economic Co-operation and Development (OECD), an international association of 34 countries including the United States, has proposed changes to numerous long-standing tax principles. These proposals, if finalized and adopted by the associated countries, will likely increase tax uncertainty and may adversely affect our provision for income taxes.
As described in Note 19, “Guarantees, Indemnifications and Warranties,” during fiscal 2019, we executed a Termination and Mutual Release Agreement which terminated our Tax Matters Agreement with HP Inc. Because we now have limited indemnity rights from HP Inc., we potentially bear more economic risk for certain potential unfavorable tax assessments.
Uncertainties in the interpretation and application of the 2017 Tax Cuts and Jobs Act could materially affect our tax obligations and effective tax rate.
On December 22, 2017, the U.S. government enacted comprehensive federal tax legislation commonly referred to as the Tax Cuts and Jobs Act of 2017 (the “Tax Act”). The Tax Act makes changes to the corporate tax rate, business-related deductions and taxation of foreign earnings, among others, that are generally effective for our taxable years beginning after October 31, 2017. The Tax Act requires complex computations to be performed that were not previously required by U.S. tax law, significant judgments to be made in interpretation of the provisions of the Tax Act, significant estimates in calculations, and the preparation and analysis of information not previously relevant or regularly produced. The U.S. Treasury Department and other standard-setting bodies will continue to interpret and issue guidance on how provisions of the Tax Act will be applied and administered. As future guidance is issued, we may make adjustments to amounts that we have previously recorded that may materially impact our financial statements in the period in which the adjustments are made. At this stage, it is unclear how many U.S. states will incorporate these federal law changes, or portions thereof, into their tax codes. The implementation by us of new practices and processes designed to comply with, and benefit from, the Tax Act and its rules and regulations could require us to make substantial changes to our business practices, allocate additional resources, and increase our costs, which could negatively affect our business, results of operations and financial condition.
In order to be successful, we must attract, retain, train, motivate, develop and transition key employees, and failure to do so could seriously harm us.
In order to be successful, we must attract, retain, train, motivate, develop and transition qualified executives and other key employees, including those in managerial, technical, development, sales, marketing and IT support positions. In order to attract and retain executives and other key employees in a competitive marketplace, we must provide a competitive compensation package,
including cash- and equity-based compensation. Our equity-based incentive awards may contain conditions relating to our stock price performance and our long-term financial performance that make the future value of those awards uncertain. If the anticipated value of such equity-based incentive awards does not materialize, if our equity-based compensation otherwise ceases to be viewed as a valuable benefit, if our total compensation package is not viewed as being competitive, or if we do not obtain the stockholder approval needed to continue granting equity-based incentive awards in the amounts we believe are necessary, our ability to attract, retain, and motivate executives and key employees could be weakened.
Our failure to successfully hire executives and key employees or the loss of any executives and key employees could have a significant impact on our operations. Further, changes in our management team may be disruptive to our business, and any failure to successfully transition and assimilate key new hires or promoted employees could adversely affect our business and results of operations.
System security risks, data protection breaches, cyberattacks and systems integration issues could disrupt our internal operations or IT services provided to customers, and any such disruption could reduce our revenue, increase our expenses, damage our reputation and adversely affect our stock price.
As a leading technology firm we are exposed to attacks from criminals, nation state actors and activist hackers (collectively, "malicious parties") who may be able to circumvent or bypass our cyber security measures and misappropriate, maliciously alter or destroy our confidential information or that of third parties, create system disruptions or cause shutdowns. Malicious parties
21
also may be able to develop and deploy viruses, worms, ransomware and other malicious software programs that attack our products or otherwise exploit any security vulnerabilities of our products. Malicious parties may compromise our manufacturing supply chain to embed malicious software or hardware in our products for use in compromising our customers. In addition, sophisticated hardware and operating system software and applications that we produce or procure from third parties may contain defects in design or manufacture, including flaws that could unexpectedly interfere with the operation of the system. The costs to us to eliminate or alleviate cyber or other security problems, including bugs, viruses, worms, malicious software programs and other security vulnerabilities, could be significant, and our efforts to address these problems may not be successful and could result in interruptions, delays, cessation of service and loss of existing or potential customers that may impede our sales, manufacturing, distribution or other critical functions.
We manage and store various proprietary information and sensitive or confidential data relating to our business. In addition, our business may processes, store and transmits our client’s data, including commercially sensitive and personal data, including personal data subject to the General Data Protection Regulation ("GDPR"). Breaches of our cyber or physical security measures or the accidental loss, inadvertent disclosure or unapproved dissemination of proprietary information, sensitive or confidential data or personal data about us, our clients or our customers, including the potential loss or disclosure of such information or data as a result of fraud, trickery or other forms of deception, could expose us, our customers or the individuals affected to a risk of loss or misuse of this information, result in litigation and potential liability for us, damage our brand and reputation or otherwise harm our business. We also could lose existing or potential customers of services or other IT solutions or incur significant expenses in connection with our customers' system failures or any actual or perceived security vulnerabilities in our products and services. In addition, the cost and operational consequences of implementing further data protection measures could be significant.
Portions of our IT infrastructure also may experience interruptions, delays or cessations of service or produce errors in connection with systems integration or migration work that takes place from time to time. We may not be successful in implementing new systems and transitioning data, which could cause business disruptions and be more expensive, time-consuming, disruptive and resource intensive. Such disruptions could adversely impact our ability to fulfill orders and respond to customer requests and interrupt other processes. Delayed sales, lower margins or lost customers resulting from these disruptions could reduce our revenue, increase our expenses, damage our reputation and adversely affect our stock price.
Terrorist acts, conflicts, wars and geopolitical uncertainties may seriously harm our business and revenue, costs and expenses and financial condition and stock price.
Terrorist acts, conflicts or wars (wherever located around the world) may cause damage or disruption to our business, our employees, facilities, partners, suppliers, distributors, resellers or customers or adversely affect our ability to manage logistics, operate our transportation and communication systems or conduct certain other critical business operations. The potential for future attacks, the national and international responses to attacks or perceived threats to national security, and other actual or potential conflicts or wars have created many economic and political uncertainties. In addition, as a major multinational company with headquarters and significant operations located in the United States, actions against or by the United States may impact our business or employees. Although it is impossible to predict the occurrences or consequences of any such events, if they occur, they could result in a decrease in demand for our products, make it difficult or impossible to provide services or deliver products to our customers or to receive components from our suppliers, create delays and inefficiencies in our supply chain and result in the need to impose employee travel restrictions. We are predominantly uninsured for losses and interruptions caused by terrorist acts, conflicts and wars.
Our business is subject to various federal, state, local and foreign laws and regulations that could result in costs or other sanctions that adversely affect our business and results of operations.
We are subject to various federal, state, local and foreign laws and regulations. For example, we are subject to laws and regulations concerning environmental protection, including laws addressing the energy performance of our products and operations, the discharge of pollutants, the management and disposal of hazardous substances and wastes, the clean-up of contaminated sites, the material content of our products and the recycling, as well as treatment and disposal of our products. In particular, we face increasing complexity in our product design and procurement operations as we adjust to new and future requirements relating to the chemical and material composition of our products, their safe use, the energy consumption associated with those products, climate change laws and regulations and product take-back legislation. If we were to violate or become liable under environmental laws or if our products become non-compliant with environmental laws, our customers may refuse to purchase our products and we could incur substantial costs or face other sanctions, which may include restrictions on our products entering certain jurisdictions. Our potential exposure includes fines and civil or criminal sanctions, third-party property damage, personal injury claims and clean-up costs. Further, liability under some environmental laws relating to contaminated sites can be imposed retroactively, on a joint and several basis, and without any finding of noncompliance or fault. The amount and timing of costs to comply with environmental laws are difficult to predict.
In addition, our business is subject to an ever growing number of laws addressing privacy and information security. In particular, we face an increasingly complex regulatory environment as we adjust to new and future requirements relating to the
22
security of our offerings. If we were to violate or become liable under laws or regulations associated with privacy or security, we could incur substantial costs or face other sanctions. Our potential exposure includes regulatory fines and civil or criminal sanctions third-party claims and reputational damage.
Our stock price has fluctuated and may continue to fluctuate, which may make future prices of our stock difficult to predict.
Hewlett Packard Enterprise's stock price, like that of other technology companies, can be volatile. Some of the factors that could affect our stock price are:
• | speculation, coverage or sentiment in the media or the investment community about, or actual changes in, our business, strategic position, market share, organizational structure, operations, financial condition, financial reporting and results, effectiveness of cost-cutting efforts, value or liquidity of our investments, exposure to market volatility, prospects, business combination or investment transactions, future stock price performance, board of directors, executive team, our competitors or our industry in general; |
• | the announcement of new, planned or contemplated products, services, technological innovations, acquisitions, divestitures or other significant transactions by Hewlett Packard Enterprise or its competitors; |
• | quarterly increases or decreases in revenue, gross margin, earnings or cash flows, changes in estimates by the investment community or financial outlook provided by Hewlett Packard Enterprise and variations between actual and estimated financial results; |
• | announcements of actual and anticipated financial results by Hewlett Packard Enterprise's competitors and other companies in the IT industry; |
• | developments relating to pending investigations, claims and disputes; and |
• | the timing and amount of share repurchases by Hewlett Packard Enterprise. |
General or industry specific market conditions or stock market performance or domestic or international macroeconomic and geopolitical factors unrelated to Hewlett Packard Enterprise's performance also may affect the price of Hewlett Packard Enterprise's stock. For these reasons, investors should not rely on recent or historical trends to predict future stock prices, financial condition, results of operations or cash flows. Volatility in the price of our securities could result in the filing of securities class action litigation matters, which could result in substantial costs and the diversion of management time and resources.
Failure to maintain a satisfactory credit rating could adversely affect our liquidity, capital position, borrowing costs and access to capital markets.
We currently maintain investment grade credit ratings with Moody's Investors Service, Standard & Poor's Ratings Services and Fitch Ratings Services. Despite these investment grade credit ratings, any future downgrades could increase the cost of borrowing under any indebtedness we may incur, reduce market capacity for our commercial paper or require the posting of additional collateral under our derivative contracts. Additionally, increased borrowing costs, including those arising from a credit rating downgrade, can potentially reduce the competitiveness of our financing business. There can be no assurance that we will be able to maintain our credit ratings, and any additional actual or anticipated changes or downgrades in our credit ratings, including any announcement that our ratings are under review for a downgrade, may have a negative impact on our liquidity, capital position and access to capital markets.
Our debt obligations may adversely affect our business and our ability to meet our obligations and pay dividends.
In addition to our current total carrying debt, we may also incur additional indebtedness in the future. This collective amount of debt could have important adverse consequences to us and our investors, including:
• | requiring a substantial portion of our cash flow from operations to make principal and interest payments; |
• | making it more difficult to satisfy other obligations; |
• | increasing the risk of a future credit ratings downgrade of our debt, which could increase future debt costs and limit the future availability of debt financing; |
• | increasing our vulnerability to general adverse economic and industry conditions; |
• | reducing the cash flows available to fund capital expenditures and other corporate purposes and to grow our business; |
• | limiting our flexibility in planning for, or reacting to, changes in our business and industry; and |
• | limiting our ability to borrow additional funds as needed or take advantage of business opportunities as they arise, pay cash dividends or repurchase our common stock. |
23
To the extent that we incur additional indebtedness, the risks described above could increase. In addition, our actual cash requirements in the future may be greater than expected. Our cash flow from operations may not be sufficient to service our outstanding debt or to repay our outstanding debt as it becomes due, and we may not be able to borrow money, sell assets or otherwise raise funds on acceptable terms, or at all, to service or refinance our debt.
Certain provisions in our amended and restated certificate of incorporation and amended and restated bylaws, and of Delaware law, may prevent or delay an acquisition of Hewlett Packard Enterprise, which could decrease the trading price of our common stock.
We have provisions in our certificate of incorporation and bylaws, each of which could have the effect of rendering more difficult or discouraging an acquisition of Hewlett Packard Enterprise deemed undesirable by our Board of Directors. These include provisions:
• | authorizing blank check preferred stock, which we could issue with voting, liquidation, dividend and other rights superior to our common stock; |
• | limiting the liability of, and providing indemnification to, our directors and officers; |
• | specifying that our stockholders may take action only at a duly called annual or special meeting of stockholders and otherwise in accordance with our bylaws and limiting the ability of our stockholders to call special meetings; |
• | requiring advance notice of proposals by our stockholders for business to be conducted at stockholder meetings and for nominations of candidates for election to our Board of Directors; and |
• | controlling the procedures for conduct of our Board of Directors and stockholder meetings and election, appointment and removal of our directors. |
These provisions, alone or together, could deter or delay hostile takeovers, proxy contests and changes in control or management of Hewlett Packard Enterprise. As a Delaware corporation, we are also subject to provisions of Delaware law, including Section 203 of the Delaware General Corporation Law, which prevents some stockholders from engaging in certain business combinations without approval of the holders of substantially all of our outstanding common stock.
Any provision of our certificate of incorporation or bylaws or Delaware law that has the effect of delaying or deterring a change in control of Hewlett Packard Enterprise could limit the opportunity for our stockholders to receive a premium for their shares of Hewlett Packard Enterprise stock and also could affect the price that some investors are willing to pay for Hewlett Packard Enterprise stock.
Risks Related to the Separations of our Former Enterprise Services Business and our Former Software Segment
The stock distribution in either or both of the completed separations of our former Enterprise Services business and our former Software segment could result in significant tax liability, and DXC or Micro Focus (as applicable) may in certain cases be obligated to indemnify us for any such tax liability imposed on us.
The completed separations of our former Enterprise Services business and our Software Segment were conditioned upon the receipt of an opinion from outside counsel regarding the qualification of (i) the relevant distribution and related transactions as a “reorganization” within the meaning of Sections 368(a), 361 and 355 of the Internal Revenue Code of 1986 (the “Code”); and (ii) the relevant merger as a “reorganization” within the meaning of Section 368(a) of the Code. While the Software Separation generally qualified for tax-free treatment for us, Seattle SpinCo and Micro Focus, the acquisition of Seattle SpinCo by Micro Focus resulted in the recognition of gain (but not loss) for U.S. persons who received Micro Focus American Depositary Shares in the Software Separation.
Each opinion of outside counsel was based upon and relied on, among other things, certain facts and assumptions, as well as certain representations, statements and undertakings of us, Everett SpinCo and CSC, or us, Seattle SpinCo and Micro Focus, as applicable. If any of these representations, statements or undertakings are, or become, inaccurate or incomplete, or if any party breaches any of its covenants in the relevant separation documents, the relevant opinion of counsel may be invalid and the conclusions reached therein could be jeopardized. Notwithstanding the opinions of counsel, the Internal Revenue Service (the “IRS”) could determine that either or both of the distributions should be treated as a taxable transaction if it determines that any of the facts, assumptions, representations, statements or undertakings upon which the relevant opinion of counsel was based are false or have been violated, or if it disagrees with the conclusions in the opinion of counsel. An opinion of counsel is not binding on the IRS and there can be no assurance that the IRS will not assert a contrary position.
If the distribution of Everett SpinCo or Seattle SpinCo, as applicable, together with certain related transactions, failed to qualify as a transaction that is generally tax-free, for U.S. federal income tax purposes, under Sections 355 and 368(a)(1)(D) of the Code, in general, we would recognize taxable gain as if we had sold the stock of Everett SpinCo or Seattle SpinCo, as applicable, in a taxable sale for its fair market value, and our stockholders who receive Everett SpinCo shares or Seattle SpinCo shares in the
24
relevant distribution would be subject to tax as if they had received a taxable distribution equal to the fair market value of such shares.
We obtained private letter rulings from the IRS regarding certain U.S. federal income tax matters relating to the separation of our Enterprise Services business and Software Segment. Those rulings concluded that certain transactions in those separations are generally tax-free for U.S. federal income tax purposes. The conclusions of the IRS private letter rulings were based, among other things, on various factual assumptions we have authorized and representations we have made to the IRS. If any of these assumptions or representations are, or become, inaccurate or incomplete, the validity of the IRS private letter rulings may be affected. Notwithstanding the foregoing, we incurred certain tax costs in connection with the completed separation of our former Enterprise Services business and Software Segment, including non-U.S. tax expenses resulting from the completed separation of our former Enterprise Services business and Software Segment in multiple non-U.S. jurisdictions that do not legally provide for tax-free separations, which may be material. If the completed separation of our former Enterprise Services business or Software Segment (including certain internal transactions undertaken in anticipation of those separations) are determined to be taxable for U.S. federal income tax purposes, we, our stockholders that are subject to U.S. federal income tax and/or DXC and/or Micro Focus could incur significant U.S. federal income tax liabilities.
Under the tax matters agreements entered into by us with Everett SpinCo and CSC, and with Seattle SpinCo and Micro Focus, Everett SpinCo and Seattle SpinCo generally would be required to indemnify us for any taxes resulting from the relevant separation (and any related costs and other damages) to the extent such amounts resulted from (i) certain actions taken by, or acquisitions of capital stock of, Everett SpinCo or Seattle SpinCo, as applicable (excluding actions required by the documents governing the relevant separation), or (ii) any breach of certain representations and covenants made by Everett SpinCo or Seattle SpinCo, as applicable. Any such indemnity obligations could be material.
Risks Related to the Prior Separation from Former Parent
We continue to face a number of risks related to the Separation from our former Parent, including those associated with ongoing indemnification obligations, which could adversely affect our financial condition and results of operations.
In connection with the Separation, Hewlett Packard Enterprise and HP Inc. entered into several agreements, including, among others, the Separation and Distribution Agreement, an employee matters agreement (the "Employee Matters Agreement") and a real estate matters agreement (the "Real Estate Matters Agreement"). These agreements determine the allocation of assets and liabilities between the companies following the Separation for their respective areas and include any necessary indemnifications related to liabilities and obligations. In these agreements, HP Inc. agreed to indemnify us for certain liabilities, and we agreed to indemnify HP Inc. for certain liabilities, including cross-indemnities that are designed and intended to place financial responsibility for the obligations and liabilities of our business with us, and financial responsibility for the obligations and liabilities of HP Inc.’s business with HP Inc. We are obligated to indemnify HP Inc. against certain liabilities, including those primarily associated with our business activities and for any breaches of the Separation and Distribution Agreement or any of the ancillary agreements. Although HP Inc. has agreed to indemnify us for certain liabilities, third parties could seek to hold us responsible for such liabilities, HP Inc.'s insurers may attempt to deny us coverage for such liabilities and there can be no assurance that any such indemnity by HP Inc. or its insurers will be sufficient to protect us from the full amount of liabilities incurred, and, even if sufficient, it is possible that we will need to temporarily bear the cost of such liability while pursuing judgment. Each of these risks could negatively affect our business, financial position, results of operations and cash flows.
Potential liabilities may arise due to fraudulent transfer considerations, which would adversely affect our financial condition and results of operations.
In connection with the Separation and distribution, our former Parent undertook several corporate reorganization transactions involving its subsidiaries which, along with the Separation and distribution, may be subject to federal and state fraudulent conveyance and transfer laws. If, under these laws, a court were to determine that, at the time of the Separation and distribution, any entity involved in these reorganization transactions or the Separation and distribution:
• | was insolvent; |
• | was rendered insolvent by reason of the Separation and distribution; |
• | had remaining assets constituting unreasonably small capital; or |
• | intended to incur, or believed it would incur, debts beyond its ability to pay these debts as they matured, then the court could void the Separation and distribution, in whole or in part, as a fraudulent conveyance or transfer. The court could then require our stockholders to return to HP Inc. some or all of the shares of Hewlett Packard Enterprise common stock issued in the distribution, or require HP Inc. or Hewlett Packard Enterprise, as the case may be, to fund liabilities of the other company for the benefit of creditors. The measure of insolvency will vary depending upon the jurisdiction whose law is being applied. Generally, however, an entity would be considered insolvent if the fair value of its assets was less than the amount of its liabilities, or if it incurred debt beyond its ability to repay the debt as it matures. |
25
The allocation of intellectual property rights that was made between Hewlett Packard Enterprise and HP Inc. as part of the Separation, and the shared use of certain intellectual property rights following the Separation, could in the future adversely impact our reputation, our ability to enforce certain intellectual property rights that are important to us and our competitive position.
In connection with the Separation, HP Co. allocated to each of Hewlett Packard Enterprise and HP Inc. the intellectual property assets relevant to their respective businesses. The terms of the Separation include cross-licenses and other arrangements to provide for certain ongoing use of intellectual property in the existing operations of both businesses. For example, through a joint brand holding structure, both Hewlett Packard Enterprise and HP Inc. retain the ability to make ongoing use of certain variations of the legacy Hewlett-Packard and HP branding, respectively. As a result of this continuing shared use of the legacy branding there is a risk that conduct or events adversely affecting the reputation of HP Inc. could also adversely affect the reputation of Hewlett Packard Enterprise. In addition, as a result of the allocation of intellectual property as part of the Separation, Hewlett Packard Enterprise no longer has ownership of intellectual property allocated to HP Inc. and our resulting intellectual property ownership position could adversely affect our position and options relating to patent enforcement and patent licensing, our ability to sell our products or services and our competitive position in the industry.
26
ITEM 1B. Unresolved Staff Comments.
None.
ITEM 2. Properties.
As of October 31, 2019, we owned or leased approximately 17 million square feet of space worldwide. A summary of the Company's operationally utilized space is provided below.
As of October 31, 2019 | ||||||||
Owned | Leased | Total | ||||||
(Square feet in millions) | ||||||||
Administration and support | 4 | 7 | 11 | |||||
(Percentage) | 38 | % | 62 | % | 100 | % | ||
Core data centers, manufacturing plants, research and development facilities, and warehouse operations | 1 | 1 | 2 | |||||
(Percentage) | 48 | % | 52 | % | 100 | % | ||
Total | 5 | 8 | 13 | |||||
(Percentage) | 40 | % | 60 | % | 100 | % | ||
We believe that our existing properties are in good condition and are suitable for the conduct of our business. Substantially all of our properties are utilized in whole or in part by our Hybrid IT and Intelligent Edge segments.
In connection with the HPE Next initiative, we continue to anticipate changes in our real estate portfolio over the next year. These changes may include reductions in overall space, and an increase in leased space as a percentage of total space.
Principal Executive Offices
Our principal executive offices, including our global headquarters, are located at 6280 America Center Drive, San Jose, California, 95002, United States of America ("U.S.").
Product Development, Services and Manufacturing
The locations of our major product development, services, manufacturing, and Hewlett Packard Labs facilities are as follows:
Americas Puerto Rico—Aguadilla United States—Alpharetta, Andover, Austin, Carrollton, Chippewa Falls, Colorado Springs, Fremont, Fort Collins, Houston, Milpitas, Palo Alto, Roseville, San Jose, Santa Clara, Sunnyvale | Europe, Middle East, Africa United Kingdom—Bristol, Erskine | |
Asia Pacific China—Beijing, Shanghai India—Bangalore Japan—Tokyo Singapore—Singapore Taiwan—Taipei | ||
ITEM 3. Legal Proceedings.
Information with respect to this item may be found in Note 18, "Litigation and Contingencies", to the Consolidated Financial Statements in Item 8 of Part II, which is incorporated herein by reference.
ITEM 4. Mine Safety Disclosures.
Not applicable.
27
PART II
ITEM 5. Market for Registrant's Common Equity, Related Stockholder Matters and Issuer Purchases of Equity Securities.
The common stock of Hewlett Packard Enterprise is listed on the New York Stock Exchange ("NYSE") with the ticker symbol "HPE". There were 56,291 stockholders of record of Hewlett Packard Enterprise common stock as of November 29, 2019. The high and low common stock sales prices per share for fiscal 2019 and 2018 were as follows:
Market Price Per Share | ||||||||||||||||
2019 | 2018 | |||||||||||||||
Fiscal Quarter | High | Low | High | Low | ||||||||||||
First quarter | $ | 16.52 | $ | 12.09 | $ | 17.07 | $ | 12.82 | ||||||||
Second quarter | $ | 16.97 | $ | 15.05 | $ | 19.48 | $ | 14.66 | ||||||||
Third quarter | $ | 16.07 | $ | 13.55 | $ | 17.82 | $ | 14.46 | ||||||||
Fourth quarter | $ | 16.55 | $ | 12.52 | $ | 17.59 | $ | 14.36 | ||||||||
Dividends declared and paid per share by fiscal quarter in 2019 were as follows:
2019 | ||||||||||||||||
Q1 | Q2 | Q3 | Q4 | |||||||||||||
Dividends declared | $ | 0.1125 | $ | 0.1125 | $ | 0.1125 | $ | 0.1200 | ||||||||
Dividends paid | $ | 0.1125 | $ | 0.1125 | $ | 0.1125 | $ | 0.1125 | ||||||||
Dividends declared and paid per share by fiscal quarter in 2018 were as follows:
2018 | ||||||||||||||||
Q1 | Q2 | Q3 | Q4 | |||||||||||||
Dividends declared | $ | 0.1500 | $ | 0.1125 | $ | 0.1125 | $ | 0.1125 | ||||||||
Dividends paid | $ | 0.0750 | $ | 0.0750 | $ | 0.1125 | $ | 0.1125 | ||||||||
On October 23, 2019, the Company announced an increase to the regular quarterly dividend from $0.1125 per share to $0.1200 per share, which was effective in the fourth quarter of fiscal 2019. The payment of any dividends in the future, and the timing and amount thereof, is within the discretion of our Board of Directors. Our Board of Directors' decisions regarding the payment of dividends will depend on many factors, such as our financial condition, earnings, capital requirements, debt service obligations, restrictive covenants in our debt, industry practice, legal requirements, regulatory constraints, and other factors that our Board of Directors deems relevant. Our ability to pay dividends will depend on our ongoing ability to generate cash from operations and on our access to the capital markets. We cannot guarantee that we will continue to pay a dividend in any future period.
Issuer Purchases of Equity Securities
Fourth Quarter of Fiscal 2019 | Total Number of Shares Purchased | Average Price Paid per Share | Total Number of Shares Purchased as Part of Publicly Announced Plans or Programs | Approximate Dollar Value of Shares that May Yet Be Purchased under the Plans or Programs | ||||||||||
In thousands, except per share amounts | ||||||||||||||
Month 1 (August 2019) | 7,601 | $ | 13.38 | 7,601 | $ | 2,647,056 | ||||||||
Month 2 (September 2019) | 5,805 | $ | 14.57 | 5,805 | $ | 2,562,469 | ||||||||
Month 3 (October 2019) | 6,448 | $ | 15.09 | 6,448 | $ | 2,465,162 | ||||||||
Total | 19,854 | $ | 14.28 | 19,854 | ||||||||||
During the fiscal year ended October 31, 2019, the Company repurchased and settled 150 million shares of the Company's common stock, which included 2.4 million shares that were unsettled open market purchases as of October 31, 2018. Additionally, the Company had unsettled open market repurchases of 0.5 million shares as of October 31, 2019. Shares repurchased during fiscal 2019 were recorded as a $2.2 billion reduction to stockholders' equity. As of October 31, 2019, the Company had a remaining authorization of $2.5 billion for future share repurchases.
28
On October 13, 2015, the Company's Board of Directors approved a share repurchase program with a $3.0 billion authorization, which was refreshed with additional share repurchase authorizations of $3.0 billion, $5.0 billion and $2.5 billion on May 24, 2016, October 16, 2017 and February 21, 2018, respectively. The Company may choose to repurchase shares when sufficient liquidity exists and the shares are trading at a discount relative to estimated intrinsic value. This program, which does not have a specific expiration date, authorizes repurchases in the open market or in private transactions. Share repurchases settled in the fourth quarter of fiscal 2019 were open market repurchases.
Stock Performance Graph and Cumulative Total Return
The graph below shows the cumulative total stockholder return, the S&P 500 Index and the S&P Information Technology Index. This graph covers the period from November 2, 2015 (the first day HPE's common stock began trading "regular-way" on the NYSE) through October 31, 2019. This graph assumes the investment of $100 in the stock or the index on November 2, 2015 (and the reinvestment of dividends thereafter). On April 1, 2017, we completed the separation and merger of our Enterprise Services business with Computer Sciences Corporation (“CSC”) (collectively, the “Everett Transaction”). HPE stockholders received 0.085904 shares of common stock in the new company for every one share of HPE common stock held at the close of business on the record date. On September 1, 2017, we completed the separation and merger of our Software business segment with Micro Focus International plc (“Micro Focus”) (collectively, the “Seattle Transaction”). HPE stockholders received 0.13732611 American Depository Shares (“Micro Focus ADSs”) in the new company, each of which represents one ordinary share of Micro Focus, for every one share of HPE common stock held at the close of business on the record date. The effect of the Everett and Seattle Transactions are reflected in the cumulative total return as reinvested dividends. The comparisons in the graph below are based on historical data and are not indicative of, or intended to forecast, future performance of our common stock.
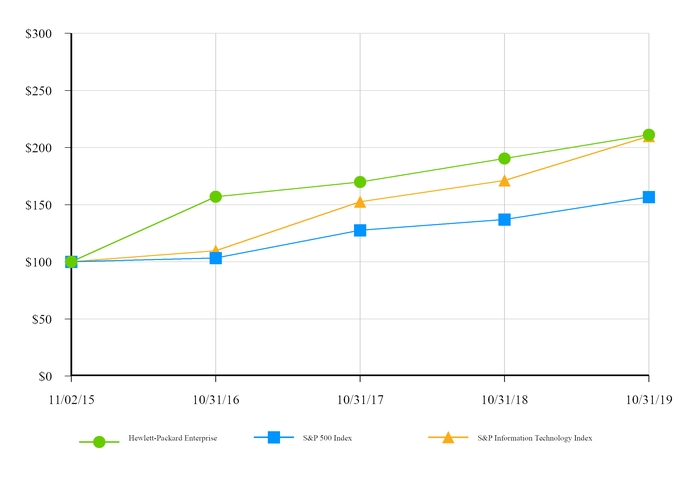
11/2015 | 10/2016 | 10/2017 | 10/2018 | 10/2019 | |||||||||||||||
Hewlett Packard Enterprise | $ | 100.00 | $ | 157.00 | $ | 169.80 | $ | 190.36 | $ | 211.12 | |||||||||
S&P 500 Index | $ | 100.00 | $ | 103.27 | $ | 127.67 | $ | 137.04 | $ | 156.66 | |||||||||
S&P Information Technology Index | $ | 100.00 | $ | 109.74 | $ | 152.49 | $ | 171.25 | $ | 209.93 | |||||||||
29
ITEM 6. Selected Financial Data.
The following table presents selected consolidated and combined financial data, which should be read in conjunction with our Consolidated Financial Statements and accompanying notes and "Management's Discussion and Analysis of Financial Condition and Results of Operations" included elsewhere in this Form 10-K. The Statement of Earnings data for each of the three fiscal years ended October 31, 2019, 2018 and 2017, and the Balance Sheets data as of October 31, 2019 and 2018 set forth below are derived from our audited Consolidated Financial Statements included elsewhere in this Form 10-K. The Statement of Earnings data for fiscal years ended October 31, 2016 and 2015, and the Balance Sheets data as of October 31, 2017, 2016 and 2015 are derived from our audited Consolidated and Combined Financial Statements that are not included in this Form 10-K.
With the completion of the Everett and Seattle Transactions on April 1, 2017 and September 1, 2017, respectively, the Company has reclassified the historical financial results of the former Enterprise Services segment ("former ES segment") and the former Software segment to Net loss from discontinued operations in its Consolidated Statements of Earnings,.
Prior to October 31, 2015, the Combined and Consolidated Statements of Earnings for the Company reflect allocations of general corporate expenses from HP Co. including, but not limited to, executive management, finance, legal, information technology, employee benefits administration, treasury, risk management, procurement, and other shared services. These allocations were made on a direct usage basis when identifiable, with the remainder allocated on the basis of revenue, expenses, headcount, or other relevant measures. Management of the Company and HP Co. consider these allocations to be a reasonable reflection of the utilization of services by, or the benefits provided to, the Company. The allocations may not, however, reflect the expense the Company would have incurred as a standalone company for the periods presented. Actual costs that may have been incurred if the Company had been a standalone company would depend on a number of factors, including the chosen organizational structure, what functions were outsourced or performed by employees and strategic decisions made in areas such as information technology and infrastructure.
The information set forth below is not necessarily indicative of future results of operations and should be read in conjunction with Item 7, "Management's Discussion and Analysis of Financial Condition and Results of Operations," and the Consolidated Financial Statements and notes thereto included in Item 8, "Financial Statements and Supplementary Data," of this Annual Report on Form 10-K, which are incorporated herein by reference, in order to understand further the factors that may affect the comparability of the financial data presented below.
30
HEWLETT PACKARD ENTERPRISE COMPANY AND SUBSIDIARIES
Selected Financial Data
For the fiscal years ended October 31, | |||||||||||||||||||
2019 | 2018 | 2017 | 2016 | 2015 | |||||||||||||||
In millions, except per share amounts | |||||||||||||||||||
Statements of Earnings: | |||||||||||||||||||
Net revenue | $ | 29,135 | $ | 30,852 | $ | 28,871 | $ | 30,280 | $ | 31,077 | |||||||||
Earnings from continuing operations(1) | $ | 1,274 | $ | 1,737 | $ | 564 | $ | 3,741 | $ | 1,903 | |||||||||
Net earnings from continuing operations | $ | 1,049 | $ | 2,012 | $ | 436 | $ | 3,237 | $ | 2,640 | |||||||||
Net loss from discontinued operations | — | (104 | ) | (92 | ) | (76 | ) | (179 | ) | ||||||||||
Net earnings | $ | 1,049 | $ | 1,908 | $ | 344 | $ | 3,161 | $ | 2,461 | |||||||||
Net earnings (loss) per share | |||||||||||||||||||
Basic | |||||||||||||||||||
Continuing operations | $ | 0.78 | $ | 1.32 | $ | 0.26 | $ | 1.89 | $ | 1.46 | |||||||||
Discontinued operations | — | (0.07 | ) | (0.05 | ) | (0.05 | ) | (0.10 | ) | ||||||||||
Total basic net earnings per share | $ | 0.78 | $ | 1.25 | $ | 0.21 | $ | 1.84 | $ | 1.36 | |||||||||
Diluted | |||||||||||||||||||
Continuing operations | $ | 0.77 | $ | 1.30 | $ | 0.26 | $ | 1.86 | $ | 1.44 | |||||||||
Discontinued operations | — | (0.07 | ) | (0.05 | ) | (0.04 | ) | (0.10 | ) | ||||||||||
Total diluted net earnings per share | $ | 0.77 | $ | 1.23 | $ | 0.21 | $ | 1.82 | $ | 1.34 | |||||||||
Cash dividends declared per share | $ | 0.4575 | $ | 0.4875 | $ | 0.2600 | $ | 0.2200 | $ | — | |||||||||
Basic shares outstanding | 1,353 | 1,529 | 1,646 | 1,715 | 1,804 | ||||||||||||||
Diluted shares outstanding | 1,366 | 1,553 | 1,674 | 1,739 | 1,834 | ||||||||||||||
Balance Sheets: | |||||||||||||||||||
At year-end: | |||||||||||||||||||
Total assets | $ | 51,803 | $ | 55,493 | $ | 61,406 | $ | 79,629 | $ | 79,862 | |||||||||
Long-term debt | $ | 9,395 | $ | 10,136 | $ | 10,182 | $ | 12,168 | $ | 14,679 | |||||||||
Total debt | $ | 13,820 | $ | 12,141 | $ | 14,032 | $ | 15,693 | $ | 15,353 | |||||||||
(1) | Effective at the beginning of the first quarter of fiscal 2019, in connection with the adoption of the accounting standards update for retirement benefits (Topic 715), the Company reclassified its non-service net periodic benefit credit from operating expense to other income and expense in its Consolidated Statements of Earnings. The Company reflected these changes retrospectively, by transferring the non-service net periodic benefit credit, a portion of which was previously allocated to the segments, and the remainder of which was reported within Unallocated corporate costs and eliminations, Restructuring charges, Transformation costs, Separation costs and Defined benefit plan remeasurement benefit. |
31
ITEM 7. Management's Discussion and Analysis of Financial Condition and Results of Operations.
HEWLETT PACKARD ENTERPRISE COMPANY AND SUBSIDIARIES
Management's Discussion and Analysis of
Financial Condition and Results of Operations
This Management's Discussion and Analysis of Financial Condition and Results of Operations ("MD&A") is organized as follows:
• | Overview. A discussion of our business and overall analysis of financial and other highlights affecting the Company to provide context for the remainder of MD&A. The overview analysis compares fiscal 2019 to fiscal 2018. |
• | Critical Accounting Policies and Estimates. A discussion of accounting policies and estimates that we believe are important to understanding the assumptions and judgments incorporated in our reported financial results. |
• | Results of Operations. An analysis of our financial results comparing fiscal 2019 and fiscal 2018 to the prior-year periods. A discussion of the results of operations at the consolidated level is followed by a discussion of the results of operations at the segment level. |
• | Liquidity and Capital Resources. An analysis of changes in our cash flows and a discussion of our financial condition and liquidity. |
• | Contractual and Other Obligations. An overview of contractual obligations, retirement and post-retirement benefit plan funding, restructuring plans, uncertain tax positions, off-balance sheet arrangements, cross-indemnifications with HP Inc. (formerly known as "Hewlett-Packard Company" and also referred to in this Annual Report as "former Parent"), and cross-indemnifications with DXC Technology Company ("DXC") and Micro Focus International plc (“Micro Focus”). |
We intend the discussion of our financial condition and results of operations that follows to provide information that will assist the reader in understanding our Consolidated Financial Statements, the changes in certain key items in those financial statements from year to year, and the primary factors that accounted for those changes, as well as how certain accounting principles, policies and estimates affect our Consolidated Financial Statements. This discussion should be read in conjunction with our Consolidated Financial Statements and the related notes that appear elsewhere in this document.
Former Parent Separation Transaction
On November 1, 2015, the Company became an independent publicly-traded company through a pro rata distribution by HP Inc. ("former Parent" or "HPI"), formerly known as Hewlett-Packard Company ("HP Co."), of 100% of the outstanding shares of Hewlett Packard Enterprise Company to HP Inc.'s stockholders (collectively, the "Separation"). Each HP Inc. stockholder of record received one share of Hewlett Packard Enterprise common stock for each share of HP Inc. common stock held on the record date. Following the Separation, the Company became an independent publicly-traded company.
Discontinued Operations
On April 1, 2017, HPE completed the separation and merger of its Enterprise Services business with Computer Sciences Corporation (“CSC”) (collectively, the “Everett Transaction”). HPE transferred its Enterprise Services business to Everett SpinCo, Inc. (a wholly-owned subsidiary of HPE) ("Everett") and distributed all of the shares of Everett to HPE stockholders. Following the distribution, New Everett Merger Sub Inc., a wholly-owned subsidiary of Everett, merged with and into CSC and Everett changed its name to DXC Technology Company ("DXC").
On September 1, 2017, HPE completed the separation and merger of its Software business segment with Micro Focus International plc (“Micro Focus”) (collectively, the “Seattle Transaction”). HPE transferred its Software business segment to Seattle SpinCo, Inc. (a wholly-owned subsidiary of HPE) ("Seattle"), and distributed all of the shares of Seattle to HPE stockholders. Following the share distribution, Seattle MergerSub, Inc., an indirect, wholly-owned subsidiary of Micro Focus, merged with and into Seattle.
The following Overview, Results of Operations and Liquidity discussions and analysis compare fiscal 2019 to fiscal 2018 and fiscal 2018 to fiscal 2017, unless otherwise noted. The Capital Resources and Contractual and Other Obligations discussions present information as of October 31, 2019, unless otherwise noted.
For purposes of this MD&A section, we use the terms "Hewlett Packard Enterprise", "HPE", "the Company", "we", "us", and "our" to refer to Hewlett Packard Enterprise Company. References in this MD&A section to "former Parent" refer to HP Inc.
32
HEWLETT PACKARD ENTERPRISE COMPANY AND SUBSIDIARIES
Management's Discussion and Analysis of
Financial Condition and Results of Operations (Continued)
OVERVIEW
We are a global technology leader focused on developing intelligent solutions that allow customers to capture, analyze and act upon data seamlessly from edge to cloud. We enable customers to accelerate business outcomes by driving new business models, creating new customer and employee experiences, and increasing operational efficiency today and into the future. Our legacy dates back to a partnership founded in 1939 by William R. Hewlett and David Packard, and we strive every day to uphold and enhance that legacy through our dedication to providing innovative technological solutions to our customers.
We organize our business into four segments for financial reporting purposes: Hybrid IT, Intelligent Edge, Financial Services ("FS") and Corporate Investments. The following provides an overview of our key financial metrics by segment for fiscal 2019, as compared to fiscal 2018:
HPE Consolidated | Hybrid IT | Intelligent Edge | Financial Services | Corporate Investments | |||||||||||||||
Dollars in millions, except for per share amounts | |||||||||||||||||||
Net revenue(1) | $ | 29,135 | $ | 22,825 | $ | 2,837 | $ | 3,581 | $ | 507 | |||||||||
Year-over-year change % | (5.6 | ) % | (6.8 | ) % | (2.8 | ) % | (2.5 | ) % | (6.6 | ) % | |||||||||
Earnings (loss) from continuing operations(2) | $ | 1,274 | $ | 2,804 | $ | 95 | $ | 305 | $ | (108 | ) | ||||||||
Earnings (loss) from continuing operations as a % of net revenue | 4.4 | % | 12.3 | % | 3.3 | % | 8.5 | % | (21.3 | ) % | |||||||||
Year-over-year change percentage points | (1.2 | )pts | 2.1 | pts | (6.2 | )pts | 0.7 | pts | (4.5 | )pts | |||||||||
Net earnings from continuing operations | $ | 1,049 | |||||||||||||||||
Net earnings per share | |||||||||||||||||||
Basic net EPS from continuing operations | $ | 0.78 | |||||||||||||||||
Diluted net EPS from continuing operations | $ | 0.77 | |||||||||||||||||
(1) | HPE consolidated net revenue excludes intersegment net revenue. |
(2) | Segment earnings from operations exclude certain unallocated corporate costs and eliminations, stock-based compensation expense related to corporate and certain global functions, transformation costs, amortization of intangible assets, acquisition, dispositions and other related charges, restructuring charges, separation costs, impairment of goodwill and disaster recoveries. |
Net revenue decreased by $1.7 billion, or 5.6% (decreased 4.3% on a constant currency basis), in fiscal 2019 as compared to fiscal 2018 as we continue to execute on our HPE Next transformation initiative, which includes streamlining our offerings and business processes, and shifting investments in innovation to high growth and higher-margin solutions and services. In addition to these planned actions, we experienced uneven demand in fiscal 2019 due to an uncertain macroeconomic environment along with go-to-market execution issues in certain business areas and unfavorable currency fluctuations.
The leading contributors to the net revenue decline was lower revenue of $1.7 billion in Hybrid IT, primarily in Compute, due to a decline in Tier-1 server sales and lower revenue from China as we continue to exit less profitable product categories and certain markets. Also within Hybrid IT, weak demand in the enterprise market led to lower revenue from Industry Standard Server ("ISS") core products within Compute and from HPE Pointnext services. To a lesser extent, we experienced a revenue decline in Intelligent Edge due to lower sales of WLAN and switching products and in Financial Services due to lower rental revenue. The overall net revenue decline was partially offset by revenue growth in HPE Aruba Services within Intelligent Edge.
Gross margin was 32.6% ($9.5 billion) and 29.9% ($9.2 billion) for fiscals 2019 and 2018, respectively. The 2.7 percentage point increase in gross margin was due primarily to Hybrid IT as a result of the year-over-year decrease in commodity costs, cost management initiatives, and a lower mix of revenue from lower-margin Tier-1 server sales along with a higher mix of revenue from higher-margin products. Operating margin decreased 1.2 percentage points in fiscal 2019 as compared to fiscal 2018 due primarily to higher acquisition, disposition and other related charges as a result of a one-time charge associated with an arbitration settlement and increased investments in research and development, these increases were partially offset by the higher gross margin.
As of October 31, 2019, cash, cash equivalents and restricted cash and long-term investments were $4.1 billion, representing a decrease of approximately $1.0 billion from the October 31, 2018 balance of $5.1 billion. The decrease was due primarily to the following: investments in property, plant and equipment, net of sales proceeds of $2.3 billion, cash payments related to share repurchases and dividends of $2.9 billion and business acquisition activity of $1.5 billion, partially offset by cash provided by
33
HEWLETT PACKARD ENTERPRISE COMPANY AND SUBSIDIARIES
Management's Discussion and Analysis of
Financial Condition and Results of Operations (Continued)
operating activities of $4.0 billion, net proceeds from debt issuance net of repayments of $1.3 billion and net cash received through our derivative collateral program from counter parties of $341 million.
Trends and Uncertainties
We are in the process of addressing many challenges facing our business. One set of challenges include dynamic and accelerating market trends, such as the market shift of workloads to cloud-related IT infrastructure business models, emergence of software-defined architectures and converged infrastructure functionality and growth in IT consumption models. Certain of our legacy hardware businesses in Hybrid IT face challenges as customers migrate to cloud-based offerings and reduce their purchases of hardware products. Therefore, the demand environment for traditional server and storage products is challenging and lower traditional compute and storage unit volume is impacting support attach opportunities in HPE Pointnext within the Hybrid IT segment.
Another set of challenges relates to changes in the competitive landscape. Our major competitors are expanding their product and service offerings with integrated products and solutions, our business-specific competitors are exerting increased competitive pressure in targeted areas and are entering new markets, our emerging competitors are introducing new technologies and business models, and our alliance partners in some businesses are increasingly becoming our competitors in others.
A third set of challenges relates to business model changes and our go-to-market execution. We are transitioning to an as-a-Service company, providing our entire portfolio through a range of subscription-based, pay-per-use and as-a-Service offerings. However, we will continue to provide our customers choice in consuming HPE products and services in a traditional or as-a-Service offering.
To be successful in overcoming these challenges, we must address business model shifts and optimize go-to-market execution by successfully transitioning to our as-a-Service model, further improving our cost structure, aligning sales coverage with our strategic goals, improving channel execution, and strengthening our capabilities in our areas of strategic focus, which includes accelerating growth in the Intelligent Edge and delivering profitable growth in Hybrid IT. We need to continue to pursue new product innovation that builds on our existing capabilities in areas such as cloud and data center computing, software-defined networking, converged storage, high-performance compute, and wireless networking, which will keep us aligned with market demand, industry trends and the needs of our customers and partners. In addition, we need to continue to improve our operations, with a particular focus on enhancing our end-to-end processes and efficiencies.
During the third quarter of fiscal 2017, we launched an initiative called HPE Next, through which we are putting in place a purpose-built company designed to compete and win in the markets where we participate. Through this initiative, we are simplifying our operating model and the way we work and streamlining our offerings and business processes to improve our execution. More importantly, we are shifting our investments in innovation towards high growth and higher-margin solutions and services such as an edge-to-cloud data platform, multi-cloud management through OneSphere, consumption-based service models with HPE Greenlake, and the adoption of composable infrastructure. The HPE Next initiative includes consolidating our manufacturing and support services locations, streamlining our business systems and reducing the number of countries in which we have a direct sales presence, while simultaneously migrating to a channel-only model in the remaining countries. For additional details on the HPE Next initiative, see Note 5, "HPE Next", to the Consolidated Financial Statements in Item 8 of Part II, which is incorporated herein by reference.
For a further discussion of trends, uncertainties and other factors that could impact our operating results, see the section entitled "Risk Factors" in Item 1A, which is incorporated herein by reference.
34
HEWLETT PACKARD ENTERPRISE COMPANY AND SUBSIDIARIES
Management's Discussion and Analysis of
Financial Condition and Results of Operations (Continued)
CRITICAL ACCOUNTING POLICIES AND ESTIMATES
General
Our Consolidated Financial Statements are prepared in accordance with U.S. Generally Accepted Accounting Principles ("GAAP"), which requires management to make estimates, judgments and assumptions that affect the reported amounts of assets, liabilities, net revenue and expenses, and the disclosure of contingent liabilities. Management bases its estimates on historical experience and on various other assumptions that it believes to be reasonable under the circumstances, the results of which form the basis for making judgments about the carrying amount of assets and liabilities that are not readily apparent from other sources. Management has discussed the development, selection and disclosure of these estimates with the Audit Committee of HPE's Board of Directors. Management believes that the accounting estimates employed and the resulting amounts are reasonable; however, actual results may differ from these estimates. Making estimates and judgments about future events is inherently unpredictable and is subject to significant uncertainties, some of which are beyond our control. Should any of these estimates and assumptions change or prove to have been incorrect, it could have a material impact on our results of operations, financial position and cash flows.
A summary of significant accounting policies is included in Note 1, "Overview and Summary of Significant Accounting Policies", to the Consolidated Financial Statements in Item 8 of Part II, which is incorporated herein by reference. An accounting policy is deemed to be critical if it requires an accounting estimate to be made based on assumptions about matters that are highly uncertain at the time the estimate is made, if different estimates reasonably could have been used, or if changes in the estimate that are reasonably possible could materially impact the financial statements. Management believes the following critical accounting policies reflect the significant estimates and assumptions used in the preparation of the Consolidated Financial Statements.
Revenue Recognition
General
As a result of adopting the new revenue recognition standard ("ASC 606"), we now account for a contract with a customer when both parties have provided written approval and are committed to perform, each party’s rights including payment terms are identified, the contract has commercial substance, and collection of consideration is probable.
We enter into contracts with customers that may include combinations of products and services, resulting in arrangements containing multiple performance obligations for hardware and software products and/or various services. We determine whether each product or service is distinct in order to identify the performance obligations in the contract and allocate the contract transaction price among the distinct performance obligations. Arrangements are distinct based on whether the customer can benefit from the product or service on its own or together with other resources that are readily available and whether the commitment to transfer the product or service to the customer is separately identifiable from other obligations in the contract. We classify our hardware, perpetual software licenses, and software-as-a-service ("SaaS") as distinct performance obligations. Term software licenses represent multiple obligations, which include software licenses and software maintenance. In transactions where we deliver hardware or software, we are typically the principal and record revenue and costs of goods sold on a gross basis.
The majority of our revenue is derived from sales of product and the associated support and maintenance which is recognized when, or as, control of promised products or services is transferred to the customer, in an amount that reflects the consideration to which we expect to be entitled, in exchange for those products or services. Variable consideration offered in contracts with customers, partners and distributors may include rebates, volume-based discounts, cooperative marketing, price protection, and other incentive programs. Variable consideration is estimated at contract inception and updated at the end of each reporting period as additional information becomes available and recognized only to the extent that it is probable that a significant reversal of revenue will not occur.
Transfer of control occurs once the customer has the contractual right to use the product, generally upon shipment or once delivery and risk of loss has transferred to the customer. Transfer of control can also occur over time for maintenance and services as the customer receives the benefit over the contract term. Our hardware and perpetual software licenses are distinct performance obligations where revenue is recognized upfront upon transfer of control. Term software licenses include multiple performance obligations where the term licenses are recognized upfront upon transfer of control, with the associated software maintenance revenue recognized ratably over the contract term as services and software updates are provided. SaaS arrangements have one distinct performance obligation which is satisfied over time with revenue recognized ratably over the contract term as the customer consumes the services. On our product sales, we record consideration from shipping and handling on a gross basis within net product sales. Revenue is recorded net of any associated sales taxes.
35
HEWLETT PACKARD ENTERPRISE COMPANY AND SUBSIDIARIES
Management's Discussion and Analysis of
Financial Condition and Results of Operations (Continued)
Significant Judgments
We allocate the transaction price for the contract among the performance obligations on a relative standalone selling price basis. The standalone selling price ("SSP") is the price at which an entity would sell a promised product or service separately to a customer. We establish SSP for most of our products and services based on the observable price of the products or services when sold separately in similar circumstances to similar customers. When the SSP is not directly observable, we estimate SSP based on management judgment by considering available data such as internal margin objectives, pricing strategies, market/competitive conditions, historical profitability data, as well as other observable inputs. We establish SSP ranges for our products and services and reassesses them periodically.
Judgment is applied in determining the transaction price as we may be required to estimate variable consideration when determining the amount of revenue to recognize. Variable consideration may include various rebates, volume-based discounts, cooperative marketing, price protection, and other incentive programs that are offered to customers, partners and distributors. When determining the amount of revenue to recognize, we estimate the expected usage of these programs, applying the expected value or most likely estimate and update the estimate at each reporting period as actual utilization becomes available. We also consider the customers' right of return in determining the transaction price, where applicable.
Warranty
We accrue the estimated cost of product warranties at the time we recognize revenue. We evaluate our warranty obligations on a product group basis. Our standard product warranty terms generally include post-sales support and repairs or replacement of a product at no additional charge for a specified period of time. While we engage in extensive product quality programs and processes, including actively monitoring and evaluating the quality of our component suppliers, we base our estimated warranty obligation on contractual warranty terms, repair costs, product call rates, average cost per call, current period product shipments and ongoing product failure rates, as well as specific product class failure outside of our baseline experience. Warranty terms generally range from one to five years for parts and labor, depending upon the product. For certain networking products, we offer a lifetime warranty. Over the last three fiscal years, the annual warranty expense has averaged approximately 1.4% of annual net product revenue.
Restructuring
We have engaged in restructuring actions which require management to estimate the timing and amount of severance and other employee separation costs for workforce reduction and enhanced early retirement programs, the fair value of assets made redundant or obsolete, and the value of lease and contract cancellation and other exit costs. We accrue for severance and other employee separation costs under these actions when it is probable that benefits will be paid and the amount is reasonably estimable. The rates used in determining severance accruals are based on existing plans, historical experiences and negotiated settlements. For a full description of our restructuring actions, refer to our discussions of restructuring in "Results of Operations" below and in Note 4, "Restructuring" and Note 5, "HPE Next", to the Consolidated Financial Statements.
Retirement and Post-Retirement Benefits
Our pension and other post-retirement benefit costs and obligations depend on various assumptions. Our major assumptions relate primarily to discount rates, mortality rates, expected increases in compensation levels and the expected long-term return on plan assets. The discount rate assumption is based on current investment yields of high-quality fixed-income securities with maturities similar to the expected benefits payment period. Mortality rates help predict the expected life of plan participants and are based on a historical demographic study of the plan. The expected increase in the compensation levels assumption reflects our long-term actual experience and future expectations. The expected long-term return on plan assets is determined based on asset allocations, historical portfolio results, historical asset correlations and management's expected returns for each asset class. In any fiscal year, significant differences may arise between the actual return and the expected long-term return on plan assets. Historically, differences between the actual return and expected long-term return on plan assets have resulted from changes in target or actual asset allocation, short-term performance relative to expected long-term performance, and to a lesser extent, differences between target and actual investment allocations, the timing of benefit payments compared to expectations, and the use of derivatives intended to effect asset allocation changes or hedge certain investment or liability exposures.
Our major assumptions vary by plan, and the weighted-average rates used are set forth in Note 6, "Retirement and Post-Retirement Benefit Plans", to the Consolidated Financial Statements, which is incorporated herein by reference. The following table provides the impact changes in the weighted-average assumptions of discount rates, the expected increase in compensation levels and the expected long-term return on plan assets would have had on our net periodic benefit cost for fiscal 2019:
36
HEWLETT PACKARD ENTERPRISE COMPANY AND SUBSIDIARIES
Management's Discussion and Analysis of
Financial Condition and Results of Operations (Continued)
Change in basis points | Change in Net Periodic Benefit Cost | |||||
In millions | ||||||
Assumptions: | ||||||
Discount rate | (25 | ) | $ | 25 | ||
Expected increase in compensation levels | 25 | $ | 4 | |||
Expected long-term return on plan assets | (25 | ) | $ | 31 | ||
Taxes on Earnings
We calculate our current and deferred tax provisions based on estimates and assumptions that could differ from the final positions reflected in our income tax returns. We will adjust our current and deferred tax provisions based on our tax returns which are generally filed in the third or fourth quarters of the subsequent fiscal year.
We recognize deferred tax assets and liabilities for the expected tax consequences of temporary differences between the tax bases of assets and liabilities and their reported amounts using enacted tax rates in effect for the year in which we expect the differences to reverse.
We record a valuation allowance to reduce deferred tax assets to the amount that we are more likely than not to realize. In determining the need for a valuation allowance, we consider future market growth, forecasted earnings, future sources of taxable income, the mix of earnings in the jurisdictions in which we operate, and prudent and feasible tax planning strategies. In the event we were to determine that it is more likely than not that we will be unable to realize all or part of our deferred tax assets in the future, we would increase the valuation allowance and recognize a corresponding charge to earnings or other comprehensive income in the period in which we make such a determination. Likewise, if we later determine that we are more likely than not to realize the deferred tax assets, we would reverse the applicable portion of the previously recognized valuation allowance. In order for us to realize our deferred tax assets, we must be able to generate sufficient taxable income in the jurisdictions in which the deferred tax assets are located.
Our effective tax rate includes the impact of certain undistributed foreign earnings and basis differences for which we have not provided for U.S. federal taxes because we plan to reinvest such earnings and basis differences indefinitely outside the U.S. In connection with the Tax Act, substantially all accumulated undistributed earnings became subject to U.S. tax. In addition, future earnings from non-U.S. operations will largely be subject to U.S. tax. Therefore, the indefinitely reinvested undistributed foreign earnings and basis differences represent amounts that are not currently subject to U.S. tax post-Tax Act and are not expected to be subject to U.S. tax in the foreseeable future.
We are subject to income taxes in the U.S. and approximately 95 other countries, and we are subject to routine corporate income tax audits in many of these jurisdictions. We believe that positions taken on our tax returns are fully supported, but tax authorities may challenge these positions, which may not be fully sustained on examination by the relevant tax authorities. Accordingly, our income tax provision includes amounts intended to satisfy assessments that may result from these challenges. Determining the income tax provision for these potential assessments and recording the related effects requires management judgments and estimates. The amounts ultimately paid on resolution of an audit could be materially different from the amounts previously included in our income tax provision and, therefore, could have a material impact on our income tax provision, net income and cash flows. Our accrual for uncertain tax positions is attributable primarily to uncertainties concerning the tax treatment of our international operations, including the allocation of income among different jurisdictions, intercompany transactions and related interest, uncertain tax positions from acquired companies, as well as pre-Separation state income tax liabilities of HP Inc. for which the Company is jointly and severally liable. For a further discussion on taxes on earnings, refer to Note 8, "Taxes on Earnings", to the Consolidated Financial Statements.
Inventory
We state our inventory at the lower of cost or net realizable value on a first-in, first-out basis. We make adjustments to reduce the cost of inventory to its net realizable value at the product group level for estimated excess or obsolescence. Factors influencing these adjustments include changes in demand, technological changes, product life-cycle and development plans, component cost trends, product pricing, physical deterioration, and quality issues.
37
HEWLETT PACKARD ENTERPRISE COMPANY AND SUBSIDIARIES
Management's Discussion and Analysis of
Financial Condition and Results of Operations (Continued)
Business Combinations
We allocate the fair value of purchase consideration to the assets acquired, including in-process research and development ("IPR&D"), liabilities assumed, and non-controlling interests in the acquiree generally based on their fair values at the acquisition date. IPR&D is initially capitalized at fair value as an intangible asset with an indefinite life and assessed for impairment thereafter. The excess of the fair value of purchase consideration over the fair value of these assets acquired, liabilities assumed and non-controlling interests in the acquiree is recorded as goodwill.
When determining the fair values of assets acquired, liabilities assumed, and non-controlling interests in the acquiree, management makes significant estimates and assumptions, especially with respect to intangible assets. Critical estimates in valuing intangible assets include, but are not limited to, expected future cash flows, which includes consideration of future growth rates and margins, attrition rates, future changes in technology and brand awareness, loyalty and position, and discount rates. Fair value estimates are based on the assumptions management believes a market participant would use in pricing the asset or liability. Amounts recorded in a business combination may change during the measurement period, which is a period not to exceed one year from the date of acquisition, as additional information about conditions existing at the acquisition date becomes available.
Goodwill
We review goodwill for impairment annually and whenever events or changes in circumstances indicate the carrying amount of goodwill may not be recoverable. We are permitted to conduct a qualitative assessment to determine whether it is necessary to perform a quantitative goodwill impairment test. We perform a quantitative test for each of our reporting units as part of our annual goodwill impairment test in the fourth quarter of each fiscal year.
Goodwill is tested for impairment at the reporting unit level. As of October 31, 2019, our reporting units containing goodwill are consistent with the reportable segments identified in Note 3 “Segment Information” to the Consolidated Financial Statements.
In the goodwill impairment test, we compare the fair value of each reporting unit to its carrying amount. We estimate the fair value of our reporting units using a weighting of fair values derived most significantly from the income approach and, to a lesser extent, the market approach. Under the income approach, we estimate the fair value of a reporting unit based on the present value of estimated future cash flows. Cash flow projections are based on management's estimates of revenue growth rates and operating margins, taking into consideration industry and market conditions. The discount rate used is based on the weighted-average cost of capital adjusted for the relevant risk associated with business specific characteristics and the uncertainty related to the reporting unit's ability to execute on the projected cash flows. Under the market approach, we estimate the fair value based on market multiples of revenue and earnings derived from comparable publicly traded companies with operating and investment characteristics similar to the reporting unit. We weight the fair value derived from the market approach depending on the level of comparability of these publicly traded companies to the reporting unit. When market comparables are not meaningful or not available, we estimate the fair value of a reporting unit using only the income approach. A significant and sustained decline in our stock price could provide evidence of a need to record a goodwill impairment charge.
Estimating the fair value of a reporting unit is judgmental in nature and involves the use of significant estimates and assumptions. These estimates and assumptions include revenue growth rates and operating margins used to calculate projected future cash flows, risk adjusted discount rates, future economic and market conditions, and the determination of appropriate comparable publicly traded companies. In addition, we make certain judgments and assumptions in allocating shared assets and liabilities to individual reporting units to determine the carrying amount of each reporting unit.
If the fair value of a reporting unit exceeds the carrying amount of the net assets assigned to that reporting unit, goodwill is not impaired. If the fair value of the reporting unit is less than its carrying amount, goodwill is impaired. The goodwill impairment loss is measured as the excess of the reporting unit's carrying value over its fair value (not to exceed the total goodwill allocated to that reporting unit).
Our annual goodwill impairment analysis, which we performed as of the first day of the fourth quarter of fiscal 2019, did not result in any impairment charges. The excess of fair value over carrying amount for our reporting units ranged from approximately 46% to 52% of the respective carrying amounts. In order to evaluate the sensitivity of the estimated fair value of our reporting units in the goodwill impairment test, we applied a hypothetical 10% decrease to the fair value of each reporting unit. Based on the results of this hypothetical 10% decrease all of the reporting units had an excess of fair value over carrying amount.
38
HEWLETT PACKARD ENTERPRISE COMPANY AND SUBSIDIARIES
Management's Discussion and Analysis of
Financial Condition and Results of Operations (Continued)
Intangible Assets
We review intangible assets with finite lives for impairment whenever events or changes in circumstances indicate the carrying amount of an asset may not be recoverable. Recoverability of our finite-lived intangible assets is assessed based on the estimated undiscounted future cash flows expected to result from the use and eventual disposition of the asset. If the undiscounted future cash flows are less than the carrying amount, the finite-lived intangible assets are considered to be impaired. The amount of the impairment loss, if any, is measured as the difference between the carrying amount of the asset and its fair value. We estimate the fair value of finite-lived intangible assets by using an income approach or, when available and appropriate, using a market approach.
Fair Value of Derivative Instruments
We use derivative instruments to manage a variety of risks, including risks related to foreign currency exchange rates and interest rates. We use forwards, swaps and, at times, options to hedge certain foreign currency and interest rate exposures. We do not use derivative financial instruments for speculative purposes. At October 31, 2019, the gross notional amount of our derivative portfolio was $24.2 billion. Assets and liabilities related to derivative instruments are measured at fair value, and were $468 million and $147 million, respectively, as of October 31, 2019.
Fair value is the price we would receive to sell an asset or pay to transfer a liability in an orderly transaction between market participants at the measurement date. In the absence of active markets for identical assets or liabilities, such measurements involve developing assumptions based on market observable data and, in the absence of such data, internal information that is consistent with what market participants would use in a hypothetical transaction that occurs at the measurement date. The determination of fair value often involves significant judgments about assumptions such as determining an appropriate discount rate that factors in both risk and liquidity premiums, identifying the similarities and differences in market transactions, weighting those differences accordingly and then making the appropriate adjustments to those market transactions to reflect the risks specific to the asset or liability being valued. We generally use industry standard valuation models to measure the fair value of our derivative positions. When prices in active markets are not available for an identical asset or liability, we use industry standard valuation models to measure fair value. Where applicable, these models project future cash flows and discount the future amounts to present value using market based observable inputs, including interest rate curves, Company and counterparty credit risk, foreign currency exchange rates, and forward and spot prices.
For a further discussion of fair value measurements and derivative instruments, refer to Note 13, "Fair Value" and Note 14, "Financial Instruments", respectively, to the Consolidated Financial Statements.
Loss Contingencies
We are involved in various lawsuits, claims, investigations and proceedings including those consisting of IP, commercial, securities, employment, employee benefits, and environmental matters, which arise in the ordinary course of business. We record a liability when we believe that it is both probable that a liability has been incurred and the amount of loss can be reasonably estimated. Significant judgment is required to determine both the probability of having incurred a liability and the estimated amount of the liability. We review these matters at least quarterly and adjust these liabilities to reflect the impact of negotiations, settlements, rulings, advice of legal counsel, and other updated information and events, pertaining to a particular case. Based on our experience, we believe that any damage amounts claimed in the specific litigation and contingency matters further discussed in Note 18, "Litigation and Contingencies", to the Consolidated Financial Statements are not a meaningful indicator of our potential liability. Litigation is inherently unpredictable. However, we believe we have valid defenses with respect to legal matters pending against us. Nevertheless, cash flows or results of operations could be materially affected in any particular period by the resolution of one or more of these contingencies. We believe we have recorded adequate provisions for any such matters and, as of October 31, 2019, it was not reasonably possible that a material loss had been incurred in connection with such matters in excess of the amounts recognized in our financial statements.
ACCOUNTING PRONOUNCEMENTS
For a summary of recent accounting pronouncements applicable to our Consolidated Financial Statements, see Note 1, "Overview and Summary of Significant Accounting Policies", to the Consolidated Financial Statements in Item 8 of Part II, which is incorporated herein by reference.
39
HEWLETT PACKARD ENTERPRISE COMPANY AND SUBSIDIARIES
Management's Discussion and Analysis of
Financial Condition and Results of Operations (Continued)
RESULTS OF OPERATIONS
Revenue from our international operations has historically represented, and we expect will continue to represent, a majority of our overall net revenue. As a result, our revenue growth has been impacted, and we expect will continue to be impacted, by fluctuations in foreign currency exchange rates. In order to provide a framework for assessing performance excluding the impact of foreign currency fluctuations, we present the year-over-year percentage change in revenue on a constant currency basis, which assumes no change in foreign currency exchange rates from the prior-year period and doesn't adjust for any repricing or demand impacts from changes in foreign currency exchange rates. This change in revenue on a constant currency basis is calculated as the quotient of (a) current year revenue converted to U.S. dollars using the prior-year period's foreign currency exchange rates divided by (b) prior-year period revenue. This information is provided so that revenue can be viewed without the effect of fluctuations in foreign currency exchange rates, which is consistent with how management evaluates our revenue results and trends. This constant currency disclosure is provided in addition to, and not as a substitute for, the year-over-year percentage change in revenue on a GAAP basis. Other companies may calculate and define similarly labeled items differently, which may limit the usefulness of this measure for comparative purposes.
Results of operations in dollars and as a percentage of net revenue were as follows:
For the fiscal years ended October 31, | ||||||||||||||||||||
2019 | 2018 | 2017 | ||||||||||||||||||
Dollars | % of Revenue | Dollars | % of Revenue | Dollars | % of Revenue | |||||||||||||||
Dollars in millions | ||||||||||||||||||||
Net revenue | $ | 29,135 | 100.0 | % | $ | 30,852 | 100.0 | % | $ | 28,871 | 100.0 | % | ||||||||
Cost of sales | 19,642 | 67.4 | 21,621 | 70.1 | 20,202 | 70.0 | ||||||||||||||
Gross profit | 9,493 | 32.6 | 9,231 | 29.9 | 8,669 | 30.0 | ||||||||||||||
Research and development | 1,842 | 6.3 | 1,667 | 5.4 | 1,490 | 5.2 | ||||||||||||||
Selling, general and administrative | 4,907 | 16.9 | 4,921 | 15.9 | 5,012 | 17.3 | ||||||||||||||
Amortization of intangible assets | 267 | 0.8 | 294 | 1.0 | 321 | 1.1 | ||||||||||||||
Impairment of goodwill | — | — | 88 | 0.3 | — | — | ||||||||||||||
Restructuring charges | — | — | 19 | 0.1 | 388 | 1.3 | ||||||||||||||
Transformation costs | 453 | 1.6 | 414 | 1.3 | 359 | 1.2 | ||||||||||||||
Disaster (recoveries) charges | (7 | ) | — | — | — | 93 | 0.3 | |||||||||||||
Acquisition, disposition and other related charges | 757 | 2.6 | 82 | 0.3 | 203 | 0.7 | ||||||||||||||
Separation costs | — | — | 9 | — | 248 | 0.9 | ||||||||||||||
Defined benefit plan remeasurement benefit | — | — | — | — | (9 | ) | — | |||||||||||||
Earnings from continuing operations | 1,274 | 4.4 | 1,737 | 5.6 | 564 | 2.0 | ||||||||||||||
Interest and other, net | (177 | ) | (0.6 | ) | (274 | ) | (0.9 | ) | (327 | ) | (1.1 | ) | ||||||||
Tax indemnification adjustments | 377 | 1.3 | (1,354 | ) | (4.3 | ) | (3 | ) | — | |||||||||||
Non-service net periodic benefit credit | 59 | 0.2 | 121 | 0.4 | 61 | 0.2 | ||||||||||||||
Earnings (loss) from equity interests | 20 | — | 38 | 0.1 | (23 | ) | (0.1 | ) | ||||||||||||
Earnings from continuing operations before taxes | 1,553 | 5.3 | 268 | 0.9 | 272 | 1.0 | ||||||||||||||
(Provision) benefit for taxes | (504 | ) | (1.7 | ) | 1,744 | 5.6 | 164 | 0.5 | ||||||||||||
Net earnings from continuing operations | 1,049 | 3.6 | 2,012 | 6.5 | 436 | 1.5 | ||||||||||||||
Net loss from discontinued operations | — | — | (104 | ) | (0.3 | ) | (92 | ) | (0.3 | ) | ||||||||||
Net earnings | $ | 1,049 | 3.6 | % | $ | 1,908 | 6.2 | % | $ | 344 | 1.2 | % | ||||||||
40
HEWLETT PACKARD ENTERPRISE COMPANY AND SUBSIDIARIES
Management's Discussion and Analysis of
Financial Condition and Results of Operations (Continued)
Net revenue
The components of the weighted net revenue change by segment were as follows:
For the fiscal years ended October 31, | ||||
2019 | 2018 | |||
Percentage Points | ||||
Hybrid IT | (5.4 | ) | 5.5 | |
Intelligent Edge | (0.3 | ) | 0.7 | |
Financial Services | (0.3 | ) | 0.2 | |
Corporate Investments/Other(1) | 0.4 | 0.5 | ||
Total HPE | (5.6 | ) | 6.9 | |
(1) Other primarily related to the elimination of intersegment net revenue.
Fiscal 2019 compared with Fiscal 2018
In fiscal 2019, our total net revenue decreased by $1.7 billion or 5.6% (decreased 4.3% on a constant currency basis). U.S. net revenue decreased by $610 million or 6.0% to $9.6 billion, while net revenue from outside of the U.S. decreased by $1.1 billion or 5.4% to $19.5 billion.
From a segment perspective, the primary factors contributing to the change in our total net revenue are summarized as follows:
• | Hybrid IT net revenue decreased, led by Compute, due primarily to a decline in Tier-1 server sales and lower revenue from China as we continue to exit less profitable product categories and certain markets, and unfavorable currency fluctuations. Also, weak demand in the enterprise market led to lower revenue from ISS core products, resulting from longer sales cycles, and lower HPE Pointnext revenue, which also experienced unfavorable currency fluctuations. Storage revenue declined due to the overall weakness in the storage market; |
• | Intelligent Edge net revenue decreased due primarily to lower sales of our WLAN and switching products within HPE Aruba Products driven by sales execution issues, particularly in the North America region, weaker demand and unfavorable foreign currency fluctuations; and |
• | FS net revenue decreased due primarily to a decrease in rental revenue and unfavorable currency fluctuations. |
Fiscal 2018 compared with Fiscal 2017
In fiscal 2018, our total net revenue increased by $2.0 billion or 6.9% (increased 5.0% on a constant currency basis). U.S. net revenue increased by $170 million or 1.7% to $10.2 billion, while net revenue from outside of the U.S. increased by $1.8 billion or 9.6% to $20.7 billion.
From a segment perspective, the primary factors contributing to the change in our total net revenue are summarized as follows:
• | Hybrid IT net revenue increased due to growth in Compute from ISS core products as a result of higher average unit prices ("AUPs"), growth from edge products, increased market demand for IT products, favorable currency fluctuations, and growth in Storage primarily as a result of the Nimble Storage acquistion; |
• | Intelligent Edge net revenue increased due primarily to growth in HPE Aruba Product from campus switching; and |
• | FS net revenue increased due primarily to favorable foreign currency fluctuations and higher asset management revenue. |
41
HEWLETT PACKARD ENTERPRISE COMPANY AND SUBSIDIARIES
Management's Discussion and Analysis of
Financial Condition and Results of Operations (Continued)
Gross margin
Fiscal 2019 compared with Fiscal 2018
Our gross margin increased 2.7 percentage points for fiscal 2019 as compared with fiscal 2018. From a segment perspective, the primary factors impacting gross margin performance are summarized as follows:
• | Hybrid IT gross margin increased due primarily to a combination of factors including the year-over-year decrease in commodity costs, lower costs of services and products due to our cost management initiatives and a lower mix of revenue from lower-margin Tier-1 server sales coupled with a higher mix of revenue from higher-margin products; |
• | Intelligent Edge gross margin increased due primarily to a higher mix of revenue from higher-margin products and HPE Aruba Services, and cost management activities; and |
• | FS gross margin increased due primarily to higher margins from lease extensions and lease buyouts and lower bad debt expense. |
Fiscal 2018 compared with Fiscal 2017
Our gross margin decreased 0.1 percentage points for fiscal 2018 as compared with fiscal 2017. From a segment perspective, the primary factors impacting gross margin performance are summarized as follows:
• | Hybrid IT gross margin decreased due primarily to a higher mix of lower-margin solutions and higher variable compensation expense; |
• | Intelligent Edge gross margin increased due primarily to a higher mix of revenue from higher-margin products; and |
• | FS gross margin increased due primarily to favorable foreign currency fluctuations, higher asset management activity related to lease extensions and higher margins on lease buyouts. |
Operating expenses
Research and development
R&D expense increased by $175 million, or 10%, in fiscal 2019 as compared to fiscal 2018, due primarily to our continued investments in the Intelligent Edge and Hybrid IT segments and on-going expenses from recent business acquisitions, partially offset by favorable currency fluctuations.
R&D expense increased by $177 million, or 12%, in fiscal 2018 as compared to fiscal 2017, due to higher variable compensation expense and as we increase new product development in the Hybrid IT and Intelligent Edge segments.
Selling, general and administrative
SG&A expense decreased by $14 million, or 0.3%, for fiscal 2019 as compared to fiscal 2018, due primarily to favorable currency fluctuations and lower variable compensation expense, partially offset by higher investment in the sales organization.
SG&A expense decreased by $91 million, or 2%, for fiscal 2018 as compared to fiscal 2017, due primarily to lower administrative expenses as a result of the HPE Next initiative, partially offset by higher marketing and field selling costs primarily from higher variable compensation expense and unfavorable currency fluctuations.
Amortization of intangible assets
Amortization expense decreased by $27 million, or 9%, in fiscal 2019 as compared to fiscal 2018, due to certain intangible assets associated with prior acquisitions reaching the end of their amortization periods, partially offset by an increase in the amortization of intangible assets from recent business acquisitions.
Amortization expense decreased by $27 million, or 8%, in fiscal 2018 as compared to fiscal 2017, due to certain intangible assets associated with prior acquisitions reaching the end of their amortization periods, partially offset by higher amortization expense in the current period related to intangible assets from business acquisitions in fiscal 2017.
42
HEWLETT PACKARD ENTERPRISE COMPANY AND SUBSIDIARIES
Management's Discussion and Analysis of
Financial Condition and Results of Operations (Continued)
Impairment of goodwill
During the fourth quarter of fiscal 2018, Hybrid IT segment management changed its evaluation of Hybrid IT to evaluate the previously integrated CMS business separately from the remainder of Hybrid IT, resulting in a reassessment of the reporting units. This change in segment management review triggered an interim goodwill test in the fourth quarter of fiscal 2018 and based on that test, the fair value of CMS was lower than its carrying value, leading to a goodwill impairment charge of $88 million in fiscal 2018.
Restructuring charges
Restructuring charges decreased in fiscal 2018 as compared to fiscal 2017, due to the completion of the restructuring plan we announced in September 2015 (the "2015 Plan") in connection with the Separation and the plan initially announced in May 2012 (the "2012 Plan"). As of October 31, 2018, both the 2015 Plan and the 2012 Plan are complete.
Transformation costs
Transformation costs increased by $39 million in fiscal 2019 as compared to fiscal 2018 due primarily to the current period containing the combination of lower gains from the sale of real estate and impairment charges on real estate assets, the effects of which were partially offset primarily by lower restructuring charges in the current year period.
Transformation costs increased by $55 million in fiscal 2018 as compared to fiscal 2017 due to higher charges in connection with various transformation programs, partially offset by gains from the sale of real estate.
Disaster (recoveries) charges
In fiscal 2019, we recorded $7 million of insurance recoveries and in fiscal 2017, we recorded $93 million of charges, which primarily represented the deductible under the insurance program and an asset impairment charge, in relation to damage to our facilities in Houston, Texas due to Hurricane Harvey in fiscal 2017.
Acquisition, disposition and other related charges
Acquisition, disposition and other related charges increased by $675 million in fiscal 2019 as compared to fiscal 2018, due primarily to a charge related to a one-time arbitration settlement.
Acquisition, disposition and other related charges decreased by $121 million in fiscal 2018 as compared to fiscal 2017, due primarily to reduced costs related to integration activities and retention bonuses.
Separation costs
Separation costs decreased by $239 million in fiscal 2018 as compared to fiscal 2017 due to lower costs from the Separation, Everett and Seattle Transactions along with a tax credit related to the Separation.
Defined benefit plan remeasurement benefit
Defined benefit plan remeasurement benefit in fiscal 2017 represents an adjustment to the service cost component of the net periodic pension benefit cost resulting from the remeasurement of certain Hewlett Packard Enterprise pension plans due to plan separations in connection with the Everett and Seattle Transactions.
Interest and other, net
Interest and other, net expense decreased by $97 million in fiscal 2019 as compared to fiscal 2018, due primarily to the combination of gains from equity investments and currency impacts.
Interest and other, net expense decreased by $53 million in fiscal 2018 as compared to fiscal 2017, due primarily to lower currency transaction losses, a gain on the sale of Internet Protocol addresses and the sale of certain tax assets, partially offset by cumulative translation adjustments resulting from country exits associated with the HPE Next Initiative.
Tax indemnification adjustments
Tax indemnification adjustments, representing $377 million of income, $1.4 billion of expense, and $3 million of expense in fiscal 2019, 2018, and 2017, respectively, resulted primarily from the settlement of certain pre-Separation tax liabilities for
43
HEWLETT PACKARD ENTERPRISE COMPANY AND SUBSIDIARIES
Management's Discussion and Analysis of
Financial Condition and Results of Operations (Continued)
which we share joint and several liability with HP Inc. and for which we were partially indemnified by HP Inc. under the terminated Tax Matters Agreement. Additionally, fiscal 2019 also includes the impact of the termination of the Tax Matters Agreement with HP Inc. In limited circumstances, we continue to be indemnified under the Termination and Mutual Release Agreement which terminated the Tax Matters Agreement.
Non-service net periodic benefit credit
Non-service net periodic benefit credit represents the components of net periodic pension benefit costs, other than service cost, for the Hewlett Packard Enterprise defined benefit pension and post-retirement benefit plans such as interest cost, expected return on plan assets, and the amortization of prior plan amendments and actuarial gains or losses. The credit also includes the impact of any plan settlements, curtailments, or special termination benefits.
Non-service net periodic benefit credit decreased by $62 million in fiscal 2019 as compared to fiscal 2018, due primarily to lower expected returns on pension investments.
Non-service net periodic benefit credit increased by $60 million in fiscal 2018 as compared to fiscal 2017, due primarily to a decrease in the amortization of pension actuarial losses.
Earnings (loss) from equity interests
Earnings (loss) from equity interests primarily represents our 49% interest in H3C and the amortization of our interest in a basis difference. Earnings from equity interests decreased by $18 million in fiscal 2019 as compared to fiscal 2018 due to lower net income earned by H3C.
Earnings from equity interests increased by $61 million in fiscal 2018 as compared to fiscal 2017 due to higher net income earned by H3C.
Provision for taxes
Our effective tax rates were 32.5%, (650.7)% and (60.3)% in fiscal 2019, 2018 and 2017, respectively. In fiscal 2019, our effective tax rate was affected by recording additional valuation allowances on U.S. foreign tax credits as a result of impacts of the Tax Act. Our effective tax rate generally differs from the U.S. federal statutory rate of 21% due to favorable tax rates associated with certain earnings from our operations in lower tax jurisdictions throughout the world but may also be materially impacted by discrete tax adjustments during the fiscal year. The jurisdictions with favorable tax rates that had the most significant impact on our effective tax rate in the periods presented include Puerto Rico and Singapore.
In fiscal 2019, we recorded $152 million of net income tax charges related to items unique to the year. These amounts primarily included $488 million of income tax charges related to changes in U.S. federal and state valuation allowances primarily as a result of impacts of the Tax Act and $40 million of income tax charges related to future withholding costs on potential intercompany distributions of earnings, the effects of which were partially offset by $274 million of income tax benefits related to the change in pre-Separation tax liabilities for which we shared joint and several liability with HP Inc., and $104 million of income tax benefits on transformation costs, and acquisition, disposition and other related charges.
In fiscal 2018, we recorded $2.0 billion of net income tax benefits related to items unique to the year. These amounts primarily included $2.0 billion of income tax benefits related to the settlement of certain pre-Separation tax liabilities for which we shared joint and several liability with HP Inc. and for which we were partially indemnified by HP Inc. under the Tax Matters Agreement, $208 million of income tax benefits related to Everett pre-divestiture tax matters and valuation allowances, $125 million of income tax benefits on restructuring charges, separation costs, transformation costs and acquisition and other related charges, and $65 million of income tax benefits on net excess tax benefits related to stock-based compensation, the effects of which were partially offset by $422 million of income tax charges related to impacts of the Tax Act.
In fiscal 2017, we recorded $554 million of net income tax benefits related to items unique to the year. These amounts primarily included $699 million of income tax benefits in connection with the Everett and Seattle Transactions and $326 million of income tax benefits on restructuring charges, separation costs, transformation costs, and acquisition and other related charges, the effects of which were partially offset by $473 million of income tax charges to record valuation allowances on U.S. state deferred tax assets and $88 million of income tax charges related to pre-Separation tax matters.
On December 22, 2017, the Tax Act was enacted into law, which significantly changed existing U.S. tax law and included numerous provisions that affect our business, such as imposing a one-time Transition Tax on deemed repatriation of deferred
44
HEWLETT PACKARD ENTERPRISE COMPANY AND SUBSIDIARIES
Management's Discussion and Analysis of
Financial Condition and Results of Operations (Continued)
foreign income, reducing the U.S. federal statutory tax rate, and adopting a modified territorial tax system. See Note 8, "Taxes on Earnings", for a full description of the impact of the Tax Act to our operations.
Segment Information
A description of the products and services for each segment, along with other pertinent information related to Segments can be found in Note 3, "Segment Information", to the Consolidated Financial Statements in Item 8 of Part II, which is incorporated herein by reference. Future changes to our organizational structure may result in changes to the segments disclosed.
Hybrid IT
For the fiscal years ended October 31, | |||||||||||
2019 | 2018 | 2017 | |||||||||
Dollars in millions | |||||||||||
Net revenue | $ | 22,825 | $ | 24,498 | $ | 22,939 | |||||
Earnings from operations | $ | 2,804 | $ | 2,503 | $ | 2,183 | |||||
Earnings from operations as a % of net revenue | 12.3 | % | 10.2 | % | 9.5 | % | |||||
The components of net revenue and the weighted net revenue change by business unit were as follows:
For the fiscal years ended October 31, | |||||||||||||||||
Net Revenue | Weighted Net Revenue Change Percentage Points | ||||||||||||||||
2019 | 2018 | 2017 | 2019 | 2018 | |||||||||||||
Dollars in millions | |||||||||||||||||
Compute | $ | 12,879 | $ | 14,057 | $ | 12,913 | (4.8 | ) | 4.9 | ||||||||
Storage | 3,609 | 3,706 | 3,280 | (0.4 | ) | 1.9 | |||||||||||
Hybrid IT Product | $ | 16,488 | $ | 17,763 | $ | 16,193 | (5.2 | ) | 6.8 | ||||||||
HPE Pointnext | 6,337 | 6,735 | 6,746 | (1.6 | ) | — | |||||||||||
Total Hybrid IT | $ | 22,825 | $ | 24,498 | $ | 22,939 | (6.8 | ) | 6.8 | ||||||||
Fiscal 2019 compared with Fiscal 2018
Hybrid IT net revenue decreased by $1.7 billion, or 6.8% (decreased 5.7% on a constant currency basis), in fiscal 2019 as compared to fiscal 2018, as we continue to execute on our HPE Next transformation initiative, which includes streamlining our offerings and business processes, and shifting investments in innovation towards high growth and higher-margin solutions and services. As a result, the decrease in Hybrid IT, led by Compute, due primarily to a decline in Tier-1 server sales and lower revenue from China as we continue to exit less profitable product categories and certain markets, and unfavorable currency fluctuations. Also, weak demand in the enterprise market led to lower revenue from ISS core products, resulting from longer sales cycles, and lower HPE Pointnext revenue, which also experienced unfavorable currency fluctuations. Storage revenue declined due to the overall weakness in the storage market, partially offset by higher revenue from HPE Nimble Storage.
Hybrid IT Product net revenue decreased by $1.3 billion, or 7%, with declines of 8% and 3% in Compute and Storage, respectively.
• | The net revenue decrease in Compute was due primarily to a decline in Tier-1 server sales and a decline in revenue from China. Revenue from ISS core products decreased due to a decline in unit shipments as a result of demand weakness, primarily in the blade, tower and rack product categories, partially offset by higher AUPs in the tower and rack product categories. Mission Critical Servers ("MCS") experienced a net revenue decline driven by lower revenue from Itanium and NonStop products. |
• | The net revenue decrease in Storage was due primarily to a decline in Converged storage, driven by lower revenue in 3PAR and Big Data products, partially offset by growth from HPE Nimble Storage. Traditional storage experienced a revenue decline compared to the prior year period due primarily to lower revenues from Modular Storage Array ("MSA") and tape products. |
45
HEWLETT PACKARD ENTERPRISE COMPANY AND SUBSIDIARIES
Management's Discussion and Analysis of
Financial Condition and Results of Operations (Continued)
HPE Pointnext net revenue decreased by $398 million, or 6%, with revenue declines in Operational Services and Advisory and Professional Services resulting in part from demand weakness. Additionally, Advisory and Professional Services experienced lower revenue as a result of our initiative to streamline our go-to-market approach in certain countries. The impact of unfavorable currency fluctuations contributed to the overall revenue decline in HPE Pointnext.
Hybrid IT earnings from operations as a percentage of net revenue increased 2.1 percentage points for fiscal 2019 as compared to fiscal 2018, due to an increase in gross margin which was partially offset by an increase in operating expenses as a percentage of net revenue. The increase in gross margin was due to a combination of factors including the year-over-year decrease in commodity costs, lower costs of services and products due to our cost management initiatives and a lower mix of revenue from lower-margin Tier-1 server sales coupled with a higher mix of revenue from higher-margin products. These increases to gross margin were partially offset by unfavorable currency fluctuations. The increase in operating expenses as a percentage of net revenue was due primarily to the impact of the net revenue decline, our planned increase to R&D costs in support of investments and on-going expenses from recent businesses acquisitions.
Fiscal 2018 compared with Fiscal 2017
Hybrid IT net revenue increased by $1.6 billion, or 6.8% (increased 5.0% on a constant currency basis), in fiscal 2018 as compared to fiscal 2017. The increase in Hybrid IT net revenue was due primarily to growth in Compute from ISS core products due to higher AUPs, growth from edge compute products, increased market demand for IT products, favorable currency fluctuations, and growth in Storage primarily as a result of the Nimble Storage acquisition.
Hybrid IT Product net revenue increased by $1.6 billion, or 10%, with growth of 9% in Compute and 13% in Storage.
• | The net revenue increase in Compute was due primarily to growth in ISS core products along with favorable currency fluctuations, growth in edge compute products and higher revenue from the MCS business. The increase in Compute net revenue was partially offset by a decline in Tier-1 server sales as we continue to exit less profitable product categories. The growth in core ISS revenue was driven by an increase in AUPs across most core products due to several factors including the cost of certain commodities, Generation 10 servers representing a higher mix of overall ISS core server products and improved server configurations. The increase in AUPs was partially offset by a decline in unit shipments, primarily in the rack, tower and blade categories. MCS revenue increased as a result of higher revenue from NonStop products. |
• | The net revenue increase in Storage was driven by growth in our converged and traditional storage products. Converged storage revenue growth was due primarily to revenue from HPE Nimble Storage and growth in big data products. Traditional storage revenue increased as a result of growth in networking and MSA products. |
HPE Pointnext net revenue decreased by $11 million, or 0.2% compared to the prior-year period, due primarily to a revenue decline in Advisory and Professional Services, partially offset by favorable currency fluctuations and revenue growth in Operational Services. The revenue decline in Advisory and Professional Services was due to our exit from low margin countries in this business. Revenue in Operational Services increased due to growth in HPE Datacenter Care and HPE Proactive Care support solutions, partially offset by a reduction in support for legacy server and storage solutions.
Hybrid IT earnings from operations as a percentage of net revenue increased by 0.7 percentage point, in fiscal 2018 as compared to fiscal 2017. The increase was due to a decrease in operating expenses as a percentage of net revenue partially offset by a decline in gross margin. The gross margin decline was due primarily to a higher mix of lower-margin solutions and higher variable compensation expense, despite being partially offset by a lower mix of revenue from lower-margin Tier-1 server sales. Operating expenses as a percentage of net revenue decreased due to lower expenses as a result of cost reduction and streamlining initiatives partially offset by higher variable compensation expense.
46
HEWLETT PACKARD ENTERPRISE COMPANY AND SUBSIDIARIES
Management's Discussion and Analysis of
Financial Condition and Results of Operations (Continued)
Intelligent Edge
For the fiscal years ended October 31, | |||||||||||
2019 | 2018 | 2017 | |||||||||
Dollars in millions | |||||||||||
Net revenue | $ | 2,837 | $ | 2,920 | $ | 2,722 | |||||
Earnings from operations | $ | 95 | $ | 277 | $ | 291 | |||||
Earnings from operations as a % of net revenue | 3.3 | % | 9.5 | % | 10.7 | % | |||||
The components of the weighted net revenue change by business unit were as follows:
For the fiscal years ended October 31, | ||||||||||||||||
Net Revenue | Weighted Net Revenue Change Percentage Points | |||||||||||||||
2019 | 2018 | 2017 | 2019 | 2018 | ||||||||||||
Dollars in millions | ||||||||||||||||
HPE Aruba Product | $ | 2,462 | $ | 2,599 | $ | 2,435 | (4.6 | ) | 6.1 | |||||||
HPE Aruba Services | 375 | 321 | 287 | 1.8 | 1.2 | |||||||||||
Total Intelligent Edge | $ | 2,837 | $ | 2,920 | $ | 2,722 | (2.8 | ) | 7.3 | |||||||
Fiscal 2019 compared with Fiscal 2018
Intelligent Edge net revenue decreased by $83 million, or 2.8% (decreased 1.8% on a constant currency basis), in fiscal 2019 as compared to fiscal 2018. The decrease in Intelligent Edge net revenue was due to a net decrease in HPE Aruba Product revenue of $137 million, or 5%, partially offset by an increase in HPE Aruba Services revenue of $54 million, or 17%. The decrease in HPE Aruba Product revenue was due to a revenue decline in WLAN and switching products driven by sales execution issues, particularly in the North America region, weaker demand and unfavorable foreign currency fluctuations. The increase in HPE Aruba Services revenue was due primarily to services attach on a growing product installed base and an increase in renewal rates.
Intelligent Edge earnings from operations as a percentage of net revenue decreased by 6.2 percentage points in fiscal 2019 as compared to fiscal 2018, due to an increase in operating expenses as a percentage of net revenue partially offset by an increase in gross margin. The increase in gross margin was due primarily to a higher mix of revenue from higher-margin products and HPE Aruba Services and cost management activities partially offset by pricing pressures on products. The increase in operating expenses as a percentage of net revenue was due primarily to our continued investments in R&D and the sales organization.
Fiscal 2018 compared with Fiscal 2017
Intelligent Edge net revenue increased by $198 million, or 7.3% (increased 5.5% on a constant currency basis), in fiscal 2018 as compared to fiscal 2017. The increase in Intelligent Edge net revenue was due primarily to a net increase in HPE Aruba Product revenue of $164 million, or 7%. The increase in HPE Aruba Product revenue was due primarily to revenue growth in Aruba branded campus switching products partially offset by a decline in revenue from WLAN products. HPE Aruba Services net revenue increased by $34 million, or 12% due primarily to services attach on a growing product installed base.
Intelligent Edge earnings from operations as a percentage of net revenue decreased 1.2 percentage points in fiscal 2018 as compared to fiscal 2017. The decrease was due to an increase in operating expenses as a percentage of net revenue partially offset by an increase in gross margin. The increase in gross margin was due primarily to a higher mix of revenue from higher-margin products. The increase in operating expenses as a percentage of net revenue was due primarily to higher R&D and field selling costs and higher variable compensation expense.
47
HEWLETT PACKARD ENTERPRISE COMPANY AND SUBSIDIARIES
Management's Discussion and Analysis of
Financial Condition and Results of Operations (Continued)
Financial Services
For the fiscal years ended October 31, | |||||||||||
2019 | 2018 | 2017 | |||||||||
Dollars in millions | |||||||||||
Net revenue | $ | 3,581 | $ | 3,671 | $ | 3,602 | |||||
Earnings from operations | $ | 305 | $ | 286 | $ | 301 | |||||
Earnings from operations as a % of net revenue | 8.5 | % | 7.8 | % | 8.4 | % | |||||
Fiscal 2019 compared with Fiscal 2018
FS net revenue decreased by $90 million, or 2.5% (increased 0.2% on a constant currency basis), in fiscal 2019 due primarily to a decrease in rental revenue due to lower average operating leases and unfavorable currency fluctuations, partially offset by higher asset management revenue from lease extensions, end-of-lease monthly rentals, and lease buyouts.
FS earnings from operations as a percentage of net revenue increased 0.7 percentage points due to an increase in gross margin and a decrease in operating expenses as a percentage of net revenue. The increase in gross margin was due primarily to higher margins from lease extensions and lease buyouts and lower bad debt expense, partially offset by lower portfolio margins from increased borrowing costs. Operating expenses as a percentage of net revenue decreased primarily as a result of lower field selling costs.
Fiscal 2018 compared with Fiscal 2017
FS net revenue increased by $69 million, or 1.9% (increased 0.4% on a constant currency basis), in fiscal 2018 due primarily to favorable foreign currency fluctuations and higher asset management revenue from end-of-lease monthly rentals, remarketing sales and lease extensions, partially offset by a decrease in rental revenue due to lower average operating leases and lower lease buyout revenue due primarily to a large customer buyout transaction in the fourth quarter of fiscal 2017.
FS earnings from operations as a percentage of net revenue decreased 0.6 percentage points due to an increase in operating expenses as a percentage of net revenue, partially offset with an increase in gross margin. Operating expenses as a percentage of net revenue increased due primarily to higher marketing, administrative and field selling costs. The increase in gross margin was due primarily to favorable foreign currency fluctuations, higher asset management activity related to lease extensions and higher margins on lease buyouts, which was partially offset by an increase in bad debt expense in the current period.
Financing Volume
For the fiscal years ended October 31, | |||||||||||
2019 | 2018 | 2017 | |||||||||
Dollars in millions | |||||||||||
Total financing volume | $ | 6,200 | $ | 6,521 | $ | 6,085 | |||||
New financing volume, which represents the amount of financing provided to customers for equipment and related software and services, including intercompany activity, decreased by 4.9% in fiscal 2019 and increased 7.2% in fiscal 2018 as compared to the prior-year periods. The decrease in fiscal 2019 was primarily driven by unfavorable currency fluctuations, along with lower financing associated with HPE and third-party product sales and related service offerings. The increase in fiscal 2018 was primarily driven by higher financing associated with third-party product sales and related service offerings, along with favorable currency fluctuations.
Portfolio Assets and Ratios
The FS business model is asset intensive and uses certain internal metrics to measure its performance against other financial services companies, including a segment balance sheet that is derived from our internal management reporting system. The accounting policies used to derive FS amounts are substantially the same as those used by the Company. However, intercompany loans and certain accounts that are reflected in the segment balances are eliminated in our Consolidated Financial Statements.
48
HEWLETT PACKARD ENTERPRISE COMPANY AND SUBSIDIARIES
Management's Discussion and Analysis of
Financial Condition and Results of Operations (Continued)
The portfolio assets and ratios derived from the segment balance sheets for FS were as follows:
As of October 31, | |||||||
2019 | 2018 | ||||||
Dollars in millions | |||||||
Financing receivables, gross | $ | 8,652 | $ | 8,256 | |||
Net equipment under operating leases | 4,084 | 4,212 | |||||
Capitalized profit on intercompany equipment transactions(1) | 382 | 502 | |||||
Intercompany leases(1) | 100 | 125 | |||||
Gross portfolio assets | 13,218 | 13,095 | |||||
Allowance for doubtful accounts(2) | 131 | 120 | |||||
Operating lease equipment reserve | 60 | 63 | |||||
Total reserves | 191 | 183 | |||||
Net portfolio assets | $ | 13,027 | $ | 12,912 | |||
Reserve coverage | 1.4 | % | 1.4 | % | |||
Debt-to-equity ratio(3) | 7.0x | 7.0x | |||||
(1) | Intercompany activity is eliminated in consolidation. |
(2) | Allowance for doubtful accounts for financing receivables includes both the short- and long-term portions. |
(3) | Debt benefiting FS consists of intercompany equity that is treated as debt for segment reporting purposes, intercompany debt, and borrowing- and funding-related activity associated with FS and its subsidiaries. Debt benefiting FS totaled $11.4 billion at October 31, 2019 and 2018, respectively, and was determined by applying an assumed debt-to-equity ratio, which management believes to be comparable to that of other similar financing companies. FS equity at both October 31, 2019 and October 31, 2018 was $1.6 billion. |
At October 31, 2019 and 2018, FS net cash and cash equivalents were $711 million and $813 million, respectively.
Net portfolio assets at October 31, 2019 increased 0.9% from October 31, 2018. The increase generally resulted from new financing volume exceeding portfolio runoff during the period.
FS bad debt expense includes charges to reserves for sales-type, direct-financing and operating leases. FS recorded net bad debt expense of $75 million, $91 million and $45 million in fiscal 2019, 2018 and 2017, respectively.
Corporate Investments
For the fiscal years ended October 31, | |||||||||||
2019 | 2018 | 2017 | |||||||||
Dollars in millions | |||||||||||
Net revenue | $ | 507 | $ | 543 | $ | 553 | |||||
Loss from operations | $ | (108 | ) | $ | (91 | ) | $ | (91 | ) | ||
Loss from operations as a % of net revenue | (21.3 | )% | (16.8 | )% | (16.5 | )% | |||||
Fiscal 2019 compared with Fiscal 2018
Corporate Investments net revenue decreased by $36 million, or 6.6% (decreased 4.4% on a constant currency bases), in fiscal 2019 as compared to fiscal 2018. The decrease in Corporate Investments net revenue was due to lower services revenue from the Communications and Media Solutions ("CMS") business and unfavorable currency fluctuations.
Corporate Investments loss from operations as a percentage of net revenue increased 4.5 percentage points in fiscal 2019 as compared to fiscal 2018, due primarily to higher R&D expenses from Hewlett Packard Labs and a legal settlement expense in the CMS business, partially offset by a higher gross margin from the CMS business.
49
HEWLETT PACKARD ENTERPRISE COMPANY AND SUBSIDIARIES
Management's Discussion and Analysis of
Financial Condition and Results of Operations (Continued)
Fiscal 2018 compared with Fiscal 2017
Corporate Investments net revenue decreased by $10 million, or 1.8% (decreased 4.0% on a constant currency bases), in fiscal 2018 as compared to fiscal 2017. The decrease in Corporate Investments net revenue, was due to lower services revenue from the CMS business.
Corporate Investments loss from operations as a percentage of net revenue increased 0.3 percentage points in fiscal 2018 as compared to fiscal 2017, due primarily to the net revenue decline and a lower gross margin partially offset by lower R&D expenses from Hewlett Packard Labs, lower field selling costs and administrative expense from the CMS business.
LIQUIDITY AND CAPITAL RESOURCES
We use cash generated by operations as our primary source of liquidity. We believe that internally generated cash flows will be generally sufficient to support our operating businesses, capital expenditures, product development initiatives, acquisition and disposal activities including legal settlements, restructuring activities, transformation costs, indemnifications, maturing debt, interest payments, income tax payments, in addition to any future investments and any future share repurchases, and future stockholder dividend payments. We expect to supplement this short-term liquidity, if necessary, by accessing the capital markets, issuing commercial paper, and borrowing under credit facilities made available by various domestic and foreign financial institutions. However, our access to capital markets may be constrained and our cost of borrowing may increase under certain business, market and economic conditions. Our liquidity is subject to various risks including the risks identified in the section entitled "Risk Factors" in Item 1A and market risks identified in the section entitled "Quantitative and Qualitative Disclosures about Market Risk" in Item 7A, each of which is incorporated herein by reference.
Our cash balances are held in numerous locations throughout the world, with a substantial amount held outside of the U.S. We utilize a variety of planning and financing strategies in an effort to ensure that our worldwide cash is available when and where it is needed. Our cash position is strong and we expect that our cash balances, anticipated cash flow generated from operations and access to capital markets will be sufficient to cover our expected near-term cash outlays.
Amounts held outside of the U.S. are generally utilized to support non-U.S. liquidity needs. Due to the enactment of the Tax Act, all of our cash, cash equivalents, restricted cash and investments held by foreign subsidiaries were subject to U.S. taxation under the one-time Transition Tax as further discussed in Note 8, "Taxes on Earnings". Subsequent repatriations generally will not be taxable from a U.S. federal tax perspective but may be subject to state income or foreign withholding tax. Where local restrictions prevent an efficient intercompany transfer of funds, our intent is to keep cash balances outside of the U.S. and to meet liquidity needs through ongoing cash flows, external borrowings, or both. We do not expect restrictions or potential taxes incurred on repatriation of amounts held outside of the U.S. to have a material effect on our overall liquidity, financial condition or results of operations.
On October 13, 2015, our Board of Directors approved a share repurchase program with a $3.0 billion authorization, which was refreshed with additional share repurchase authorizations of $3.0 billion, $5.0 billion and $2.5 billion on May 24, 2016, October 16, 2017 and February 21, 2018, respectively. As of October 31, 2019, we had a remaining authorization of $2.5 billion for future share repurchases. The number of shares that we repurchase under the share repurchase program may vary depending on numerous factors, including share price, liquidity and other market conditions, our ongoing capital allocation planning, levels of cash and debt balances, other demands for cash, such as acquisition activity, general economic or business conditions, and board and management discretion. Additionally, our share repurchase activity, if any, during any particular period may fluctuate. We may commence, accelerate, suspend, delay, or discontinue any share repurchase activity at any time, without notice. This program does not have a specific expiration date.
In fiscal 2019, we repurchased an aggregate of $2.2 billion of our stock as a result of our share repurchase program. For more information on our share repurchase program, refer to Note 16, "Stockholders' Equity", to the Consolidated Financial Statements in Item 8, which is incorporated herein by reference.
50
HEWLETT PACKARD ENTERPRISE COMPANY AND SUBSIDIARIES
Management's Discussion and Analysis of
Financial Condition and Results of Operations (Continued)
Liquidity
Our cash, cash equivalents, restricted cash, total debt and available borrowing resources were as follows:
As of October 31, | |||||||||||
2019 | 2018 | 2017 | |||||||||
In millions | |||||||||||
Cash, cash equivalents and restricted cash | $ | 4,076 | $ | 5,084 | $ | 9,592 | |||||
Total debt | $ | 13,820 | $ | 12,141 | $ | 14,032 | |||||
Available borrowing resources | $ | 10,389 | $ | 9,757 | $ | 9,891 | |||||
Our key cash flow metrics were as follows:
For the fiscal years ended October 31, | |||||||||||
2019 | 2018 | 2017 | |||||||||
In millions | |||||||||||
Net cash provided by operating activities | $ | 3,997 | $ | 2,964 | $ | 1,335 | |||||
Net cash used in investing activities | (3,457 | ) | (1,880 | ) | (5,349 | ) | |||||
Net cash (used in) provided by financing activities | (1,548 | ) | (5,592 | ) | 164 | ||||||
Net (decrease) in cash, cash equivalents and restricted cash | $ | (1,008 | ) | $ | (4,508 | ) | $ | (3,850 | ) | ||
Operating Activities
Net cash provided by operating activities increased by $1.0 billion for fiscal 2019 as compared to fiscal 2018. The increase was driven primarily by higher cash generated from working capital management, lower payments related to our ongoing HPE Next, fiscal 2015 and fiscal 2012 restructuring plans, cash generated as a result of the settlement of the Tax Matters Agreement pursuant to the Termination and Mutual Release Agreement with HP Inc. and higher profitability, the effects of which were partially offset by an arbitration award settlement with DXC. Net cash provided by operating activities increased $1.6 billion for fiscal 2018 as compared to fiscal 2017 due primarily to higher net earnings in fiscal 2018 and a payment of $1.9 billion for pension funding in connection with the Everett Transaction in fiscal 2017, partially offset by higher cash usage for net working capital management in fiscal 2018.
Our key working capital metrics were as follows:
As of October 31, | ||||||||
2019 | 2018 | 2017 | ||||||
Days of sales outstanding in accounts receivable | 37 | 37 | 36 | |||||
Days of supply in inventory | 45 | 40 | 39 | |||||
Days of purchases outstanding in accounts payable | (104 | ) | (100 | ) | (102 | ) | ||
Cash conversion cycle | (22 | ) | (23 | ) | (27 | ) | ||
Days of sales outstanding in accounts receivable ("DSO") measures the average number of days our receivables are outstanding. DSO is calculated by dividing ending accounts receivable, net of allowance for doubtful accounts, by a 90-day average of net revenue. For fiscal 2019, as compared to the prior-year period, DSO remained flat, as a result of the improvements in collections being offset with unfavorable currency fluctuations and extended payment terms. For fiscal 2018, as compared to the prior-year period, the increase in DSO was due primarily to unfavorable billing linearity, partially offset by an increase in early payments and factoring.
Days of supply in inventory ("DOS") measures the average number of days from procurement to sale of our product. DOS is calculated by dividing ending inventory by a 90-day average of cost of goods sold. For fiscal 2019, as compared to the prior-year period, the increase in DOS was due primarily to an increase in inventory resulting from the acquisition of Cray Inc. For fiscal 2018, as compared to the prior-year period, the increase in DOS was due primarily to higher levels of strategic commodities inventory to support customer demand, manage supply risk and component cost increases, and higher inventory of server solutions which have longer time-to-shipment cycles.
51
HEWLETT PACKARD ENTERPRISE COMPANY AND SUBSIDIARIES
Management's Discussion and Analysis of
Financial Condition and Results of Operations (Continued)
Days of purchases outstanding in accounts payable ("DPO") measures the average number of days our accounts payable balances are outstanding. DPO is calculated by dividing ending accounts payable by a 90-day average of cost of goods sold. For fiscal 2019, as compared to the prior-year period, the increase in DPO was primarily the result of increase in lease payables due to slower disbursements, payment term extensions and favorable inventory purchasing linearity. For fiscal 2018, as compared to the prior-year period, the decrease in DPO was primarily the result of a reduction in purchases with original equipment manufacturers ("OEMs") and a shift to internal manufacturing for certain compute products.
The cash conversion cycle is the sum of DSO and DOS, less DPO. Items which may cause the cash conversion cycle in a particular period to differ include, but are not limited to, changes in business mix, changes in payment terms (including extended payment terms from suppliers), the extent of receivables factoring, seasonal trends, the timing of revenue recognition and inventory purchases within the period, the impact of commodity costs and acquisition activity.
Investing Activities
Net cash used in investing activities increased by $1.6 billion in fiscal 2019 as compared to fiscal 2018. The increase was due primarily to an increase of $1.3 billion of cash used for payments made in connection with business acquisitions, an increase of $0.4 billion of cash used for investments in property, plant and equipment, net of proceeds from sales, partially offset by an increase of $0.2 billion of cash received from net financial collateral activities in the current period. Net cash used in investing activities decreased by $3.5 billion in fiscal 2018 as compared to fiscal 2017 due primarily to lower payments by $2.0 billion for business acquisitions, in addition to an increase in cash of $0.8 billion from net financial collateral activities and a decrease of $0.6 billion of cash used for investments in property, plant and equipment, net of proceeds from sales.
Financing Activities
Net cash used in financing activities decreased by $4.0 billion in fiscal 2019 as compared to fiscal 2018. The decrease was due primarily to the impact of a higher debt redemption by $1.9 billion in the prior period, an increase in cash proceeds from the issuance of debt of $1.1 billion and a lower utilization of cash for share repurchase activity by $1.3 billion in the current period. These amounts were partially offset by a net transfer of cash from Seattle of $0.2 billion in the prior period. Net cash used in financing activities increased by $5.8 billion in fiscal 2018 as compared to fiscal 2017 due primarily to cash dividends of $3.0 billion and $2.5 billion from Everett and Seattle, respectively, in fiscal 2017, higher cash used for share repurchase activity by $1.0 billion and higher debt redemption by $0.4 billion in fiscal 2018, partially offset by $1.1 billion of net transfers of cash and cash equivalents to Everett and Seattle.
Capital Resources
Debt Levels
As of October 31, | |||||||||||
2019 | 2018 | 2017 | |||||||||
Dollars in millions | |||||||||||
Short-term debt | $ | 4,425 | $ | 2,005 | $ | 3,850 | |||||
Long-term debt | $ | 9,395 | $ | 10,136 | $ | 10,182 | |||||
Weighted-average interest rate | 4.1 | % | 4.5 | % | 3.8 | % | |||||
We maintain debt levels that we establish through consideration of a number of factors, including cash flow expectations, cash requirements for operations, investment plans (including acquisitions), share repurchase activities, our cost of capital, and targeted capital structure.
On October 4, 2019 we redeemed $1.1 billion of Senior Notes at 2.10% on their maturity date.
On September 20, 2019, we issued $763 million of asset-backed debt securities in six tranches at a discount to par, at a weighted average price of 99.99% and a weighted average interest rate of 2.31%, payable monthly from November 2019.
On September 13, 2019, we completed our offering of $1.0 billion aggregate principal amount of 2.25% notes due in 2023 and $0.5 billion floating rate note at three month USD LIBOR plus 0.68% due in 2021. The net proceeds from this offering were used to fund the repayment of the $1.1 billion outstanding principal amount of the 2.10% registered Notes due in October 2019 and fund the acquisition of Cray Inc.
52
HEWLETT PACKARD ENTERPRISE COMPANY AND SUBSIDIARIES
Management's Discussion and Analysis of
Financial Condition and Results of Operations (Continued)
During fiscal 2019, we issued $0.9 billion and repaid $0.6 billion of commercial paper. For more information on our borrowings, see Note 15, "Borrowings", to the Consolidated Financial Statements in Item 8, which is incorporated herein by reference.
Our weighted-average interest rate reflects the average effective rate on our borrowings prevailing during the period and reflects the impact of interest rate swaps. For more information on our interest rate swaps, see Note 14, "Financial Instruments", to the Consolidated Financial Statements in Item 8, which is incorporated herein by reference.
In December 2017, we filed a shelf registration statement with the Securities and Exchange Commission that allows us to sell, at any time and from time to time, in one or more offerings, debt securities, preferred stock, common stock, warrants, depositary shares, purchase contracts, guarantees or units consisting of any of these securities.
Revolving Credit Facility
On August 16, 2019, we entered into a revolving credit facility (the "Credit Agreement"), together with the lenders named therein, JPMorgan Chase Bank, N.A. ("JPMorgan"), as co-administrative agent and administrative processing agent, and Citibank, N.A., as co-administrative agent, providing for a senior, unsecured revolving credit facility with aggregate lending commitments of $4.75 billion. Loans under the revolving credit facility may be used for general corporate purposes. Commitments under the Credit Agreement are available for a period of five years, which period may be extended, subject to the satisfaction of certain conditions, by up to two, one-year periods. Commitment Fees, interest rates and other terms of borrowing under the credit facility vary based on Hewlett Packard Enterprise's external credit rating. This credit facility replaces our prior credit facility that was entered into on November 1, 2015, which was terminated in connection with us entering into the new credit facility. As of October 31, 2019 and 2018, no borrowings were outstanding under the Credit Agreement.
Available Borrowing Resources
As of October 31, 2019, we had the following resources available to obtain short- or long-term financing if we need additional liquidity:
As of October 31, 2019 | |||
In millions | |||
Commercial paper programs | $ | 4,302 | |
Uncommitted lines of credit | $ | 1,337 | |
Revolving credit facility | $ | 4,750 | |
For more information on our available borrowing resources, see Note 15, "Borrowings", to the Consolidated Financial Statements in Item 8, which is incorporated herein by reference.
CONTRACTUAL AND OTHER OBLIGATIONS
Our contractual and other obligations as of October 31, 2019, were as follows:
Payments Due by Period | |||||||||||||||||||
Total | 1 Year or Less | 1-3 Years | 3-5 Years | More than 5 Years | |||||||||||||||
In millions | |||||||||||||||||||
Principal payments on long-term debt(1) | $ | 12,773 | $ | 3,453 | $ | 3,557 | $ | 1,013 | $ | 4,750 | |||||||||
Interest payments on long-term debt(2) | 4,459 | 538 | 750 | 538 | 2,633 | ||||||||||||||
Operating lease obligations (net of sublease rental income) | 1,243 | 190 | 301 | 241 | 511 | ||||||||||||||
Purchase obligations and other(3) | 296 | 138 | 99 | 18 | 41 | ||||||||||||||
Capital lease obligations (includes interest) | 73 | 6 | 13 | 13 | 41 | ||||||||||||||
Total(4)(5)(6)(7)(8) | $ | 18,844 | $ | 4,325 | $ | 4,720 | $ | 1,823 | $ | 7,976 | |||||||||
53
HEWLETT PACKARD ENTERPRISE COMPANY AND SUBSIDIARIES
Management's Discussion and Analysis of
Financial Condition and Results of Operations (Continued)
(1) | Amounts represent the principal cash payments relating to our long-term debt and do not include fair value adjustments, discounts or premiums and debt issuance costs. As of October 31, 2019, the future principal payments related to asset-backed debt securities were expected to be $390 million in fiscal 2020, $248 million in fiscal 2021 and $125 million in fiscal 2022. For more information on our debt, see Note 15, "Borrowings", to the Consolidated Financial Statements in Item 8, which is incorporated herein by reference. |
(2) | Amounts represent the expected interest payments relating to our long-term debt. We use interest rate swaps to mitigate the exposure of our fixed rate debt to changes in fair value resulting from changes in interest rates, or hedge the variability of cash flows in the interest payments associated with our variable-rate debt. The impact of our outstanding interest rate swaps at October 31, 2019 was factored into the calculation of the future interest payments on long-term debt. |
(3) | Purchase obligations and other include agreements to purchase goods or services that are enforceable and legally binding on us and that specify all significant terms, including fixed or minimum quantities to be purchased; fixed, minimum or variable price provisions; and the approximate timing of the transaction, as well as settlements that we have reached with third parties, requiring us to pay determined amounts over a specific period of time. These purchase obligations are related principally to software maintenance and support services and other items. Purchase obligations exclude agreements that are cancelable without penalty. Purchase obligations also exclude open purchase orders that are routine arrangements entered into in the ordinary course of business as they are difficult to quantify in a meaningful way. Even though open purchase orders are considered enforceable and legally binding, the terms generally allow us the option to cancel, reschedule, and adjust terms based on our business needs prior to the delivery of goods or performance of services. |
(4) | In fiscal 2020, we anticipate making contributions of $182 million to our non-U.S. pension plans. Our policy is to fund pension plans so that we meet at least the minimum contribution requirements, as established by local government, funding and taxing authorities. Expected contributions and payments to our pension and post-retirement benefit plans are excluded from the contractual obligations table because they do not represent contractual cash outflows, as they are dependent on numerous factors which may result in a wide range of outcomes. For more information on our retirement and post-retirement benefit plans, see Note 6, "Retirement and Post-Retirement Benefit Plans", to the Consolidated Financial Statements in Item 8, which is incorporated herein by reference. |
(5) | As of October 31, 2019, we expect future cash payments of approximately $597 million in connection with our approved restructuring plans, which includes $380 million expected to be paid in fiscal 2020 and $217 million expected to be paid through fiscal 2022. Payments for restructuring activities have been excluded from the contractual obligations table, because they do not represent contractual cash outflows and there is uncertainty as to the timing of these payments. For more information on our restructuring activities, see Note 4, "Restructuring", and Note 5, "HPE Next", to the Consolidated Financial Statements in Item 8, which is incorporated herein by reference. |
(6) | As of October 31, 2019, we had approximately $536 million of recorded liabilities and related interest and penalties pertaining to uncertain tax positions. These liabilities and related interest and penalties include $3 million expected to be paid within one year. For the remaining amount, we are unable to make a reasonable estimate as to when cash settlement with the tax authorities might occur due to the uncertainties related to these tax matters. Payments of these obligations would result from settlements with taxing authorities. For more information on our uncertain tax positions, see Note 8, "Taxes on Earnings", to the Consolidated Financial Statements in Item 8, which is incorporated herein by reference. |
(7) | In connection with the Separation, the Company entered into a Separation and Distribution Agreement with HP Inc., effective November 1, 2015, whereby the Company agreed to indemnify HP Inc., each of its subsidiaries and each of their respective directors, officers and employees from and against all liabilities relating to, arising out of or resulting from, among other matters, the liabilities allocated to the Company as part of the Separation. HP Inc. similarly agreed to indemnify the Company, each of its subsidiaries and each of their respective directors, officers and employees from and against all claims and liabilities relating to, arising out of or resulting from, among other matters, the liabilities allocated to HP Inc. as part of the Separation. Additionally, in connection with the Separation, the Company entered into a Tax Matters Agreement (the "Tax Matters Agreement") with HP Inc., effective November 1, 2015, that governs the rights and obligations of the Company and HP Inc. for certain pre-Separation tax liabilities. The Tax Matters Agreement provides that the Company and HP Inc. will share certain pre-Separation income tax liabilities that arise from adjustments made by tax authorities to the Company and HP Inc.'s U.S. and certain non-U.S. income tax returns. On October 30, 2019, the Company and HP Inc. entered into a Termination and Mutual Release Agreement to terminate the Tax Matters Agreement. Under the Termination and Mutual Release Agreement, HP Inc. paid the Company $200 million and agreed to pay $50 million on or before October 31, 2020 and October 31, 2021, each. The Company and HP Inc. also agreed to release each other from certain claims and liabilities related to the Tax Matters Agreement. As of October 31, 2019, we had approximately $231 million of recorded net receivables, pertaining to income tax indemnification with HP Inc., including $131 million related to certain state income tax liabilities for which the Company is joint and severally liable. For the amounts related to the joint and several state tax liabilities, we are unable to make a reasonable estimate as to when cash settlement with HP Inc. might occur due to the uncertainties related to the underlying tax matters. Realization of these obligations would result from payments to taxing authorities and the resulting settlements with HP Inc. under the Termination and Mutual Release Agreement. For more information on our general cross-indemnification, Tax Matters Agreement and other joint and several liability income tax matters with HP Inc., see Note 19, "Guarantees, Indemnifications and Warranties", to the Consolidated Financial Statements in Item 8, which is incorporated herein by reference. |
(8) | In connection with the Everett and Seattle Transactions, the Company entered into a Separation and Distribution Agreement with each of DXC, effective May 24, 2016, and Seattle, effective September 7, 2016, whereby DXC and Seattle, as applicable, agreed to indemnify HPE, each of its subsidiaries and each of their respective directors, officers and employees from and against all losses relating to, arising out of or resulting from, among other matters, the liabilities allocated to DXC and Seattle as part of the Everett Transaction and Seattle Transaction, respectively. HPE similarly agreed to indemnify DXC and Seattle, each of their subsidiaries and each of their respective directors, officers and employees from and against all losses relating to, arising out of or resulting from, among other matters, the liabilities allocated to the Company as part of the Everett Transaction and Seattle Transaction, respectively. Additionally, in connection with the Everett and Seattle Transactions, HPE entered into a Tax Matters Agreement with DXC and affiliates, effective March 31, 2017, (the "DXC Tax Matters |
54
HEWLETT PACKARD ENTERPRISE COMPANY AND SUBSIDIARIES
Management's Discussion and Analysis of
Financial Condition and Results of Operations (Continued)
Agreement"), and Micro Focus and affiliates, effective September 1, 2017, (the "Micro Focus Tax Matters Agreement"), that governs the rights and obligations of HPE and DXC or Micro Focus, as applicable, for certain pre-divestiture tax liabilities and tax receivables. Each of the DXC Tax Matters Agreement and Micro Focus Tax Matters Agreement generally provides that HPE will be responsible for pre-divestiture tax liabilities and will be entitled to pre-divestiture tax receivables that arise from adjustments made by tax authorities to HPE's and DXC's, or Micro Focus’, as applicable, U.S. and certain non-U.S. tax returns. In certain jurisdictions, HPE and DXC, or Micro Focus, as applicable, have joint and several liability for past income tax liabilities and accordingly, HPE could be legally liable under applicable tax law for such liabilities and required to make additional tax payments. As of October 31, 2019, we had approximately $11 million of recorded net receivables and $9 million of recorded net liabilities pertaining to tax indemnification with DXC and Micro Focus, respectively. We are unable to make a reasonable estimate as to when cash settlement with DXC or Micro Focus might occur due to the uncertainties related to the underlying tax matters. Payments or receipts of these obligations would result from settlements under the Tax Matters Agreement with DXC or Micro Focus. For more information on our general cross-indemnification, Tax Matters Agreement and other income tax matters with DXC and Micro Focus, see Note 19, "Guarantees, Indemnifications and Warranties", to the Consolidated Financial Statements in Item 8, which is incorporated herein by reference.
OFF-BALANCE SHEET ARRANGEMENTS
As part of our ongoing business, we have not participated in transactions that generate material relationships with unconsolidated entities or financial partnerships, such as entities often referred to as structured finance or special purpose entities, established for the purpose of facilitating off-balance sheet arrangements or other contractually narrow or limited purposes.
We have third-party revolving short-term financing arrangements intended to facilitate the working capital requirements of certain customers. For more information on our third-party revolving short-term financing arrangements, see Note 9, "Balance Sheet Details", to the Consolidated Financial Statements in Item 8, which is incorporated herein by reference.
55
ITEM 7A. Quantitative and Qualitative Disclosures About Market Risk.
In the normal course of business, we are exposed to foreign currency exchange rate and interest rate risks that could impact our financial position and results of operations. Our risk management strategy with respect to these market risks may include the use of derivative financial instruments. We use derivative contracts only to manage existing underlying exposures. Accordingly, we do not use derivative contracts for speculative purposes. Our risks, risk management strategy and a sensitivity analysis estimating the effects of changes in fair value for each of these exposures is outlined below.
Actual gains and losses in the future may differ materially from the sensitivity analyses based on changes in the timing and amount of foreign currency exchange rate and interest rate movements and our actual exposures and derivatives in place at the time of the change, as well as the effectiveness of the derivative to hedge the related exposure.
Foreign currency exchange rate risk
We are exposed to foreign currency exchange rate risk inherent in our sales commitments, anticipated sales, anticipated purchases, and assets and liabilities denominated in currencies other than the U.S. dollar. We transact business in over 50 currencies worldwide, of which the most significant foreign currencies to our operations for fiscal 2019 were the euro, Japanese yen, British pound, and Chinese yuan (renminbi). For most currencies, we are a net receiver of the foreign currency and therefore benefit from a weaker U.S. dollar and are adversely affected by a stronger U.S. dollar relative to the foreign currency. Even where we are a net receiver of the foreign currency, a weaker U.S. dollar may adversely affect certain expense figures, if taken alone.
We use a combination of forward contracts and, from time to time, options designated as cash flow hedges to protect against the foreign currency exchange rate risks inherent in our forecasted net revenue and, to a lesser extent, cost of sales, operating expenses, and intercompany loans denominated in currencies other than the U.S. dollar. In addition, when debt is denominated in a foreign currency, we may use swaps to exchange the foreign currency principal and interest obligations for U.S. dollar-denominated amounts to manage the exposure to changes in foreign currency exchange rates. We also use other derivatives not designated as hedging instruments, consisting primarily of forward contracts, to hedge foreign currency balance sheet exposures. Alternatively, we may choose not to hedge the risk associated with our foreign currency exposures, primarily if such exposure acts as a natural hedge for offsetting amounts denominated in the same currency or if the currency is too difficult or too expensive to hedge.
We have performed sensitivity analyses as of October 31, 2019 and 2018, using a modeling technique that measures the change in the fair values arising from a hypothetical 10% adverse movement in the levels of foreign currency exchange rates relative to the U.S. dollar, with all other variables held constant. The analyses cover all of our foreign currency derivative contracts offset by underlying exposures. The foreign currency exchange rates we used in performing the sensitivity analysis were based on market rates in effect at October 31, 2019 and 2018. The sensitivity analyses indicated that a hypothetical 10% adverse movement in foreign currency exchange rates would result in a foreign exchange fair value loss of $31 million and $36 million at October 31, 2019 and 2018, respectively.
Interest rate risk
We also are exposed to interest rate risk related to debt we have issued, our investment portfolio and financing receivables. We issue long-term debt in either U.S. dollars or foreign currencies based on market conditions at the time of financing.
We often use interest rate and/or currency swaps to modify the market risk exposures in connection with the debt to achieve U.S. dollar based floating or fixed interest expense. The swap transactions generally involve the exchange of fixed for floating interest payments. However, in circumstances where we believe additional fixed-rate debt would be beneficial, we may choose to terminate a previously executed swap, or swap certain floating interest payments to fixed.
In order to hedge the fair value of certain fixed-rate investments, we may enter into interest rate swaps that convert fixed interest returns into variable interest returns. We may use cash flow hedges to hedge the variability of LIBOR-based interest income received on certain variable-rate investments, by entering into interest rate swaps that convert variable rate interest returns into fixed-rate interest returns.
We have performed sensitivity analyses as of October 31, 2019 and 2018, using a modeling technique that measures the change in the fair values arising from a hypothetical 10% adverse movement in the levels of interest rates across the entire yield curve, with all other variables held constant. The analyses cover our debt, investments, financing receivables, and interest rate swaps. The analyses use actual or approximate maturities for the debt, investments, financing receivables, and interest rate swaps. The discount rates used were based on the market interest rates in effect at October 31, 2019 and 2018. The sensitivity analyses indicated that a hypothetical 10% adverse movement in interest rates would result in a loss in the fair values of our debt, investments and financing receivables, net of interest rate swaps, of $39 million and $29 million at October 31, 2019 and 2018, respectively.
56
ITEM 8. Financial Statements and Supplementary Data.
Table of Contents
Page | |
57
Report of Independent Registered Public Accounting Firm
To the Board of Directors and Stockholders of Hewlett Packard Enterprise Company
Opinion on the Financial Statements
We have audited the accompanying consolidated balance sheets of Hewlett Packard Enterprise Company and subsidiaries (the Company) as of October 31, 2019 and 2018, the related consolidated statements of earnings, comprehensive income, stockholders' equity and cash flows for each of the three years in the period ended October 31, 2019, and the related notes (collectively referred to as the “consolidated financial statements”). In our opinion, the consolidated financial statements present fairly, in all material respects, the financial position of the Company at October 31, 2019 and 2018, and the results of its operations and its cash flows for each of the three years in the period ended October 31, 2019, in conformity with U.S. generally accepted accounting principles.
We also have audited, in accordance with the standards of the Public Company Accounting Oversight Board (United States) (PCAOB), the Company's internal control over financial reporting as of October 31, 2019, based on criteria established in Internal Control-Integrated Framework issued by the Committee of Sponsoring Organizations of the Treadway Commission (2013 framework) and our report dated December 12, 2019 expressed an unqualified opinion thereon.
Basis for Opinion
These financial statements are the responsibility of the Company's management. Our responsibility is to express an opinion on the Company’s financial statements based on our audits. We are a public accounting firm registered with the PCAOB and are required to be independent with respect to the Company in accordance with the U.S. federal securities laws and the applicable rules and regulations of the Securities and Exchange Commission and the PCAOB.
We conducted our audits in accordance with the standards of the PCAOB. Those standards require that we plan and perform the audit to obtain reasonable assurance about whether the financial statements are free of material misstatement, whether due to error or fraud. Our audits included performing procedures to assess the risks of material misstatement of the financial statements, whether due to error or fraud, and performing procedures that respond to those risks. Such procedures included examining, on a test basis, evidence regarding the amounts and disclosures in the financial statements. Our audits also included evaluating the accounting principles used and significant estimates made by management, as well as evaluating the overall presentation of the financial statements. We believe that our audits provide a reasonable basis for our opinion.
Critical Audit Matters
The critical audit matters communicated below are matters arising from the current period audit of the financial statements that were communicated or required to be communicated to the audit committee and that: (1) relate to accounts or disclosures that are material to the financial statements and (2) involved our especially challenging, subjective or complex judgments. The communication of critical audit matters does not alter in any way our opinion on the consolidated financial statements, taken as a whole, and we are not, by communicating the critical audit matters below, providing separate opinions on the critical audit matters or on the accounts or disclosures to which they relate.
58
Deferred Tax Asset Valuation Allowance | ||
Description of the matter | At October 31, 2019, the Company had gross deferred assets relating to deductible temporary differences and loss and credit carryforwards of $10.0 billion with an offsetting valuation allowance of $8.2 billion. As discussed in Note 8, the Company reduces its deferred tax assets by a valuation allowance if, based upon the weight of all available evidence, it is more likely than not that some portion, or all, of the deferred tax assets will not be realized. Auditing management's analysis of the realizability of the deferred tax assets was complex and highly judgmental because the assessment process involves significant judgment and subjective evaluation of assumptions that may be affected by future operations of the Company, market or economic conditions. | |
How we addressed the matter in our audit | We obtained an understanding, evaluated the design and tested the operating effectiveness of controls that address the risks of material misstatement relating to the realizability of deferred tax assets, including controls over management’s evaluation of loss and other carryback attributes, projections of the future reversal of existing taxable temporary differences and future taxable income, and management’s identification and use of available tax planning strategies. We evaluated the Company's assessment of the realizability of deferred tax assets and the resultant valuation allowance. Among other audit procedures performed, we evaluated the assumptions used by the Company to predict reversal of existing taxable temporary differences and to project future taxable income by jurisdiction. For example, we compared the projections of future taxable income with the actual results of prior periods and assessed management's consideration of current industry and economic trends. We also compared the projections of future taxable income with other forecasted financial information prepared by the Company. Further, we tested the completeness and accuracy of the underlying data used in the Company’s projections. We involved our tax professionals to evaluate the application of tax law in the Company’s available tax planning strategies, the Company’s assessment of its ability to carry back losses or other attributes, the scheduling of the reversal of existing temporary taxable differences and carryforward amounts, and the evaluation of the carryforward lives of its deferred tax assets. | |
Estimation of variable consideration | ||
Description of the matter | As described in Note 1 to the consolidated financial statements, the Company recognizes revenue for sales to its customers after deducting management’s estimates of variable consideration which may include various rebates, volume-based discounts, cooperative marketing, price protection, and other incentive programs that are offered to customers, partners and distributors. Estimated variable consideration is presented within other accrued liabilities on the consolidated balance sheet and totaled $1.1 billion at October 31, 2019. Auditing the estimates of variable consideration was complex and judgmental due to the level of uncertainty involved in management’s estimate of expected usage of these programs. | |
How we addressed the matter in our audit | We obtained an understanding, evaluated the design and tested the operating effectiveness of controls over the Company’s process for estimating variable consideration, including controls over management’s review of the significant assumptions described above. To test the Company’s determination of variable consideration we performed audit procedures that included, among others, evaluating the methodologies, testing the significant assumptions discussed above and testing the completeness and accuracy of the underlying data used by the Company in its analyses. We compared the significant assumptions to historical experience of the Company to develop an expectation of the variable consideration associated with product remaining in the distribution channel at October 31, 2019 which we compared to management’s recorded amount. In addition, we inspected the underlying agreements and compared the incentive rates used in the Company’s analyses with contractual rates. We assessed the historical accuracy of management’s estimates by comparing previous estimates of variable consideration to the amount of actual payments in subsequent periods. | |
/s/ Ernst & Young LLP
We have served as the Company’s auditor since 2014.
San Jose, California
December 12, 2019
59
Report of Independent Registered Public Accounting Firm
To the Board of Directors and Stockholders of Hewlett Packard Enterprise Company
Opinion on Internal Control over Financial Reporting
We have audited Hewlett Packard Enterprise Company and subsidiaries’ internal control over financial reporting as of October 31, 2019, based on criteria established in Internal Control-Integrated Framework issued by the Committee of Sponsoring Organizations of the Treadway Commission (2013 framework) (the COSO criteria). In our opinion, Hewlett Packard Enterprise Company and subsidiaries (the Company) maintained, in all material respects, effective internal control over financial reporting as of October 31, 2019, based on the COSO criteria.
As indicated in the accompanying Management’s Report on Internal Control Over Financial Reporting, management’s assessment of and conclusion on the effectiveness of internal control over financial reporting did not include the internal controls of Cray Inc., which is included in the 2019 consolidated financial statements of the Company and constituted less than 1% of total assets as of October 31, 2019 and less than 1% and 2% of net revenue and net earnings, respectively, for the year then ended. Our audit of internal control over financial reporting of the Company also did not include an evaluation of the internal control over financial reporting of Cray Inc.
We also have audited, in accordance with the standards of the Public Company Accounting Oversight Board (United States) (PCAOB), the consolidated balance sheets of the Company as of October 31, 2019 and 2018, the related consolidated statements of earnings, comprehensive income, stockholders' equity and cash flows for each of the three years in the period ended October 31, 2019, and the related notes and our report dated December 12, 2019 expressed an unqualified opinion thereon.
Basis for Opinion
The Company’s management is responsible for maintaining effective internal control over financial reporting and for its assessment of the effectiveness of internal control over financial reporting included in the accompanying Management’s Report on Internal Control Over Financial Reporting. Our responsibility is to express an opinion on the Company’s internal control over financial reporting based on our audit. We are a public accounting firm registered with the PCAOB and are required to be independent with respect to the Company in accordance with the U.S. federal securities laws and the applicable rules and regulations of the Securities and Exchange Commission and the PCAOB.
We conducted our audit in accordance with the standards of the PCAOB. Those standards require that we plan and perform the audit to obtain reasonable assurance about whether effective internal control over financial reporting was maintained in all material respects.
Our audit included obtaining an understanding of internal control over financial reporting, assessing the risk that a material weakness exists, testing and evaluating the design and operating effectiveness of internal control based on the assessed risk, and performing such other procedures as we considered necessary in the circumstances. We believe that our audit provides a reasonable basis for our opinion.
Definition and Limitations of Internal Control Over Financial Reporting
A company’s internal control over financial reporting is a process designed to provide reasonable assurance regarding the reliability of financial reporting and the preparation of financial statements for external purposes in accordance with generally accepted accounting principles. A company’s internal control over financial reporting includes those policies and procedures that (1) pertain to the maintenance of records that, in reasonable detail, accurately and fairly reflect the transactions and dispositions of the assets of the company; (2) provide reasonable assurance that transactions are recorded as necessary to permit preparation of financial statements in accordance with generally accepted accounting principles, and that receipts and expenditures of the company are being made only in accordance with authorizations of management and directors of the company; and (3) provide reasonable assurance regarding prevention or timely detection of unauthorized acquisition, use, or disposition of the company’s assets that could have a material effect on the financial statements.
Because of its inherent limitations, internal control over financial reporting may not prevent or detect misstatements. Also, projections of any evaluation of effectiveness to future periods are subject to the risk that controls may become inadequate because of changes in conditions, or that the degree of compliance with the policies or procedures may deteriorate.
/s/ Ernst & Young LLP
San Jose, California
December 12, 2019
60
Management’s Report on Internal Control Over Financial Reporting
Hewlett Packard Enterprise’s management is responsible for establishing and maintaining adequate internal control over financial reporting for Hewlett Packard Enterprise. Hewlett Packard Enterprise’s internal control over financial reporting is a process designed to provide reasonable assurance regarding the reliability of financial reporting and the preparation of financial statements for external purposes in accordance with U.S. generally accepted accounting principles. Hewlett Packard Enterprise’s internal control over financial reporting includes those policies and procedures that (i) pertain to the maintenance of records that, in reasonable detail, accurately and fairly reflect the transactions and dispositions of the assets of Hewlett Packard Enterprise; (ii) provide reasonable assurance that transactions are recorded as necessary to permit preparation of financial statements in accordance with generally accepted accounting principles, and that receipts and expenditures of Hewlett Packard Enterprise are being made only in accordance with authorizations of management and directors of Hewlett Packard Enterprise; and (iii) provide reasonable assurance regarding prevention or timely detection of unauthorized acquisition, use, or disposition of Hewlett Packard Enterprise’s assets that could have a material effect on the financial statements.
Because of its inherent limitations, internal control over financial reporting may not prevent or detect misstatements. Also, projections of any evaluation of effectiveness to future periods are subject to the risk that controls may become inadequate because of changes in conditions, or that the degree of compliance with the policies or procedures may deteriorate.
Hewlett Packard Enterprise’s management assessed the effectiveness of Hewlett Packard Enterprise’s internal control over financial reporting as of October 31, 2019, utilizing the criteria set forth by the Committee of Sponsoring Organizations of the Treadway Commission (COSO) in Internal Control-Integrated Framework (2013 framework). Management's evaluation of internal control over financial reporting excluded the internal control activities of Cray Inc. which is included in the 2019 consolidated financial statements of Hewlett Packard Enterprise and constituted less than 1% of total assets as of October 31, 2019 and less than 1% and 2% of net revenue and net earnings, respectively, for the year then ended. Based on the assessment by Hewlett Packard Enterprise’s management, we determined that Hewlett Packard Enterprise’s internal control over financial reporting was effective as of October 31, 2019. The effectiveness of Hewlett Packard Enterprise’s internal control over financial reporting as of October 31, 2019 has been audited by Ernst & Young LLP, Hewlett Packard Enterprise’s independent registered public accounting firm, as stated in their report which appears on page 60 of this Annual Report on Form 10-K.
/s/ ANTONIO F. NERI | /s/ TAREK A. ROBBIATI | |
Antonio F. Neri President and Chief Executive Officer | Tarek A. Robbiati Executive Vice President and Chief Financial Officer | |
December 12, 2019 | December 12, 2019 | |
61
HEWLETT PACKARD ENTERPRISE COMPANY AND SUBSIDIARIES
Consolidated Statements of Earnings
For the fiscal years ended October 31, | |||||||||||
2019 | 2018 | 2017 | |||||||||
In millions, except per share amounts | |||||||||||
Net revenue: | |||||||||||
Products | $ | $ | $ | ||||||||
Services | |||||||||||
Financing income | |||||||||||
Total net revenue | |||||||||||
Costs and expenses: | |||||||||||
Cost of products | |||||||||||
Cost of services | |||||||||||
Financing interest | |||||||||||
Research and development | |||||||||||
Selling, general and administrative | |||||||||||
Amortization of intangible assets | |||||||||||
Impairment of goodwill | |||||||||||
Restructuring charges | |||||||||||
Transformation costs | |||||||||||
Disaster (recoveries) charges | ( | ) | |||||||||
Acquisition, disposition and other related charges | |||||||||||
Separation costs | |||||||||||
Defined benefit plan remeasurement benefit | ( | ) | |||||||||
Total costs and expenses | |||||||||||
Earnings from continuing operations | |||||||||||
Interest and other, net | ( | ) | ( | ) | ( | ) | |||||
Tax indemnification adjustments | ( | ) | ( | ) | |||||||
Non-service net periodic benefit credit | |||||||||||
Earnings (loss) from equity interests | ( | ) | |||||||||
Earnings from continuing operations before taxes | |||||||||||
(Provision) benefit for taxes | ( | ) | |||||||||
Net earnings from continuing operations | |||||||||||
Net loss from discontinued operations | ( | ) | ( | ) | |||||||
Net earnings | $ | $ | $ | ||||||||
Net earnings (loss) per share: | |||||||||||
Basic | |||||||||||
Continuing operations | $ | $ | $ | ||||||||
Discontinued operations | ( | ) | ( | ) | |||||||
Total basic net earnings per share | $ | $ | $ | ||||||||
Diluted | |||||||||||
Continuing operations | $ | $ | $ | ||||||||
Discontinued operations | ( | ) | ( | ) | |||||||
Total diluted net earnings per share | $ | $ | $ | ||||||||
Weighted-average shares used to compute net earnings (loss) per share: | |||||||||||
Basic | |||||||||||
Diluted | |||||||||||
The accompanying notes are an integral part of these Consolidated Financial Statements.
62
HEWLETT PACKARD ENTERPRISE COMPANY AND SUBSIDIARIES
Consolidated Statements of Comprehensive Income
For the fiscal years ended October 31, | |||||||||||
2019 | 2018 | 2017 | |||||||||
In millions | |||||||||||
Net earnings | $ | $ | $ | ||||||||
Other comprehensive (loss) income before taxes: | |||||||||||
Change in net unrealized gains (losses) on available-for-sale securities: | |||||||||||
Net unrealized gains (losses) arising during the period | ( | ) | ( | ) | |||||||
Gains reclassified into earnings | ( | ) | ( | ) | ( | ) | |||||
( | ) | ( | ) | ||||||||
Change in net unrealized (losses) gains on cash flow hedges: | |||||||||||
Net unrealized gains arising during the period | |||||||||||
Net (gains) losses reclassified into earnings | ( | ) | ( | ) | |||||||
( | ) | ( | ) | ||||||||
Change in unrealized components of defined benefit plans: | |||||||||||
Net unrealized (losses) gains arising during the period | ( | ) | ( | ) | |||||||
Amortization of net actuarial loss and prior service benefit | |||||||||||
Curtailments, settlements and other | |||||||||||
( | ) | ( | ) | ||||||||
Change in cumulative translation adjustment: | |||||||||||
Cumulative translation adjustment arising during the period | ( | ) | ( | ) | ( | ) | |||||
Release of cumulative translation adjustment as a result of divestitures and country exits | |||||||||||
( | ) | ( | ) | ( | ) | ||||||
Other comprehensive (loss) income before taxes | ( | ) | ( | ) | |||||||
Benefit (provision) for taxes | ( | ) | ( | ) | |||||||
Other comprehensive (loss) income, net of taxes | ( | ) | ( | ) | |||||||
Comprehensive income | $ | $ | $ | ||||||||
The accompanying notes are an integral part of these Consolidated Financial Statements.
63
HEWLETT PACKARD ENTERPRISE COMPANY AND SUBSIDIARIES
Consolidated Balance Sheets
The accompanying notes are an integral part of these Consolidated Financial Statements.
As of October 31, | |||||||
2019 | 2018 | ||||||
In millions, except par value | |||||||
ASSETS | |||||||
Current assets: | |||||||
Cash and cash equivalents | $ | $ | |||||
Accounts receivable, net of allowance for doubtful accounts | |||||||
Financing receivables, net of allowance for doubtful accounts | |||||||
Inventory | |||||||
Assets held for sale | |||||||
Other current assets | |||||||
Total current assets | |||||||
Property, plant and equipment | |||||||
Long-term financing receivables and other assets | |||||||
Investments in equity interests | |||||||
Goodwill | |||||||
Intangible assets | |||||||
Total assets | $ | $ | |||||
LIABILITIES AND EQUITY | |||||||
Current liabilities: | |||||||
Notes payable and short-term borrowings | $ | $ | |||||
Accounts payable | |||||||
Employee compensation and benefits | |||||||
Taxes on earnings | |||||||
Deferred revenue | |||||||
Accrued restructuring | |||||||
Other accrued liabilities | |||||||
Total current liabilities | |||||||
Long-term debt | |||||||
Other non-current liabilities | |||||||
Commitments and contingencies | |||||||
Stockholders' equity | |||||||
HPE stockholders' equity: | |||||||
Preferred stock, $0.01 par value (300 shares authorized; none issued) | |||||||
Common stock, $0.01 par value (9,600 shares authorized; 1,294 and 1,423 issued and outstanding at October 31, 2019 and October 31, 2018, respectively) | |||||||
Additional paid-in capital | |||||||
Accumulated deficit | ( | ) | ( | ) | |||
Accumulated other comprehensive loss | ( | ) | ( | ) | |||
Total HPE stockholders' equity | |||||||
Non-controlling interests | |||||||
Total stockholders' equity | |||||||
Total liabilities and stockholders' equity | $ | $ | |||||
64
HEWLETT PACKARD ENTERPRISE COMPANY AND SUBSIDIARIES
Consolidated Statements of Cash Flows
For the fiscal years ended October 31, | |||||||||||
2019 | 2018 | 2017 | |||||||||
In millions | |||||||||||
Cash flows from operating activities: | |||||||||||
Net earnings | $ | $ | $ | ||||||||
Adjustments to reconcile net earnings to net cash provided by operating activities: | |||||||||||
Depreciation and amortization | |||||||||||
Impairment of goodwill | |||||||||||
Stock-based compensation expense | |||||||||||
Provision for inventory and doubtful accounts | |||||||||||
Restructuring charges | |||||||||||
Deferred taxes on earnings | ( | ) | |||||||||
(Earnings) loss from equity interests | ( | ) | ( | ) | |||||||
Dividends received from equity investee | |||||||||||
Other, net | ( | ) | |||||||||
Changes in operating assets and liabilities, net of acquisitions: | |||||||||||
Accounts receivable | ( | ) | |||||||||
Financing receivables | ( | ) | ( | ) | ( | ) | |||||
Inventory | ( | ) | ( | ) | |||||||
Accounts payable | ( | ) | ( | ) | |||||||
Taxes on earnings | ( | ) | ( | ) | ( | ) | |||||
Restructuring | ( | ) | ( | ) | ( | ) | |||||
Other assets and liabilities(1) | ( | ) | |||||||||
Net cash provided by operating activities | |||||||||||
Cash flows from investing activities: | |||||||||||
Investment in property, plant and equipment | ( | ) | ( | ) | ( | ) | |||||
Proceeds from sale of property, plant and equipment | |||||||||||
Purchases of available-for-sale securities and other investments | ( | ) | ( | ) | ( | ) | |||||
Maturities and sales of available-for-sale securities and other investments | |||||||||||
Financial collateral posted | ( | ) | ( | ) | ( | ) | |||||
Financial collateral received | |||||||||||
Payments made in connection with business acquisitions, net of cash acquired | ( | ) | ( | ) | ( | ) | |||||
Proceeds from business divestitures, net | ( | ) | |||||||||
Net cash used in investing activities | ( | ) | ( | ) | ( | ) | |||||
Cash flows from financing activities: | |||||||||||
Short-term borrowings with original maturities less than 90 days, net | ( | ) | |||||||||
Proceeds from debt, net of issuance costs | |||||||||||
Payment of debt | ( | ) | ( | ) | ( | ) | |||||
Settlement of cash flow hedge | |||||||||||
Net proceeds related to stock-based award activities | |||||||||||
Repurchase of common stock | ( | ) | ( | ) | ( | ) | |||||
Net transfer of cash and cash equivalents to Everett | ( | ) | ( | ) | |||||||
Net transfer of cash and cash equivalents from (to) Seattle | ( | ) | |||||||||
Cash dividend from Everett(2) | |||||||||||
Cash dividend from Seattle(3) | |||||||||||
Restricted cash transfer(4) | ( | ) | |||||||||
Cash dividends paid to non-controlling interests | ( | ) | |||||||||
Cash dividends paid | ( | ) | ( | ) | ( | ) | |||||
Net cash (used in) provided by financing activities | ( | ) | ( | ) | |||||||
(Decrease) in cash, cash equivalents and restricted cash | ( | ) | ( | ) | ( | ) | |||||
Cash, cash equivalents and restricted cash at beginning of period | |||||||||||
Cash, cash equivalents and restricted cash at end of period | $ | $ | $ | ||||||||
Supplemental cash flow disclosures: | |||||||||||
Income taxes paid, net of refunds | $ | $ | $ | ||||||||
Interest expense paid | $ | $ | $ | ||||||||
Supplemental schedule of non-cash investing and financing activities: | |||||||||||
Net assets transferred to Everett and Seattle | $ | $ | $ | ||||||||
(1) | For fiscal 2017, the amount includes $ |
(2) |
(3) In fiscal 2017, represents a $2.5 billion cash dividend payment from Seattle SpinCo, Inc. to HPE, the proceeds of which were funded from the issuance of $2.6 billion of aggregate debt by Seattle SpinCo, Inc. The debt was retained by Seattle SpinCo, Inc.
(4) In fiscal 2017, represents the difference between the net proceeds from the Seattle debt issuance in the third quarter of fiscal 2017 and the amount held in escrow through the close of the transaction. This was settled in the fourth quarter of fiscal 2017 with the net transfer of cash and cash equivalents to Seattle.
The accompanying notes are an integral part of these Consolidated Financial Statements.
65
HEWLETT PACKARD ENTERPRISE COMPANY AND SUBSIDIARIES
Consolidated Statements of Stockholders' Equity
Common Stock | ||||||||||||||||||||||||||||||
Number of Shares | Par Value | Additional Paid-in Capital | (Accumulated Deficit) Retained Earnings | Accumulated Other Comprehensive Loss | Equity Attributable to the Company | Non- controlling Interests | Total Equity | |||||||||||||||||||||||
In millions, except number of shares in thousands | ||||||||||||||||||||||||||||||
Balance at October 31, 2016 | $ | $ | $ | $ | ( | ) | $ | $ | $ | |||||||||||||||||||||
Everett Transaction | ( | ) | ( | ) | ( | ) | ( | ) | ||||||||||||||||||||||
Seattle Transaction | ( | ) | ( | ) | ( | ) | ||||||||||||||||||||||||
Net earnings | ( | ) | ||||||||||||||||||||||||||||
Other comprehensive income | — | |||||||||||||||||||||||||||||
Comprehensive income | ( | ) | ||||||||||||||||||||||||||||
Issuance of common stock in connection with employee stock plans and other | ||||||||||||||||||||||||||||||
Repurchases of common stock | ( | ) | ( | ) | ( | ) | ( | ) | ( | ) | ( | ) | ||||||||||||||||||
Tax benefit from employee stock plans | ||||||||||||||||||||||||||||||
Cash dividends declared ($0.26 per common share) | ( | ) | ( | ) | ( | ) | ||||||||||||||||||||||||
Stock-based compensation expense | ||||||||||||||||||||||||||||||
Balance at October 31, 2017 | $ | $ | $ | ( | ) | $ | ( | ) | $ | $ | $ | |||||||||||||||||||
Activity related to separation and merger transactions | ( | ) | ( | ) | ( | ) | ||||||||||||||||||||||||
Net earnings | ( | ) | ||||||||||||||||||||||||||||
Other comprehensive loss | ( | ) | ( | ) | — | ( | ) | |||||||||||||||||||||||
Comprehensive income | ( | ) | ||||||||||||||||||||||||||||
Issuance of common stock in connection with employee stock plans and other | ||||||||||||||||||||||||||||||
Repurchases of common stock | ( | ) | ( | ) | ( | ) | ( | ) | ( | ) | ||||||||||||||||||||
Cash dividends declared ($0.4875 per common share) | ( | ) | ( | ) | ( | ) | ||||||||||||||||||||||||
Stock-based compensation expense | ||||||||||||||||||||||||||||||
Balance at October 31, 2018 | $ | $ | $ | ( | ) | $ | ( | ) | $ | $ | $ | |||||||||||||||||||
Net earnings | ||||||||||||||||||||||||||||||
Other comprehensive loss | ( | ) | ( | ) | — | ( | ) | |||||||||||||||||||||||
Comprehensive income | ||||||||||||||||||||||||||||||
Issuance of common stock in connection with employee stock plans and other | — | |||||||||||||||||||||||||||||
Repurchases of common stock | ( | ) | ( | ) | ( | ) | — | ( | ) | ( | ) | |||||||||||||||||||
Cash dividends declared ($0.4575 per common share) | ( | ) | ( | ) | ( | ) | ||||||||||||||||||||||||
66
HEWLETT PACKARD ENTERPRISE COMPANY AND SUBSIDIARIES
Effects of adoption of accounting standard updates (1) | ( | ) | ( | ) | ( | ) | ||||||||||||||||||||||||
Stock-based compensation expense | ||||||||||||||||||||||||||||||
Balance at October 31, 2019 | $ | $ | $ | ( | ) | $ | ( | ) | $ | $ | $ | |||||||||||||||||||
(1) For fiscal 2019, includes $2.3 billion related to an addition to accumulated deficit as a result of the adoption of an accounting standard update for Income Taxes and $124 million related to a reduction to accumulated deficit as a result of the adoption of the new revenue accounting standard.
The accompanying notes are an integral part of these Consolidated Financial Statements.
67
HEWLETT PACKARD ENTERPRISE COMPANY AND SUBSIDIARIES
Notes to Consolidated Financial Statements
Note 1: Overview and Summary of Significant Accounting Policies
Background
Hewlett Packard Enterprise Company ("Hewlett Packard Enterprise", "HPE", or "the Company") is a global technology leader focused on developing intelligent solutions that allow customers to capture, analyze and act upon data seamlessly from edge to cloud. Hewlett Packard Enterprise enables customers to accelerate business outcomes by driving new business models, creating new customer and employee experiences, and increasing operational efficiency today and into the future. Hewlett Packard Enterprise's customers range from small- and medium-sized businesses ("SMBs") to large global enterprises.
Former Parent Separation
On November 1, 2015, the Company became an independent publicly-traded company through a pro rata distribution by HP Inc. ("former Parent" or "HPI"), formerly known as Hewlett-Packard Company ("HP Co."), of 100 % of the outstanding shares of Hewlett Packard Enterprise Company to HP Inc.'s stockholders (the "Separation"). Each HP Inc. stockholder of record received one share of Hewlett Packard Enterprise common stock for each share of HP Inc. common stock held on the record date. Following the Separation, the Company became an independent publicly-traded company.
On October 31, 2015 and November 1, 2015, the Company entered into several agreements with former Parent that govern the relationship between the Company and former Parent following the distribution.
• | Separation and Distribution Agreement; |
• | Transition Services Agreement; |
• | Tax Matters Agreement; |
• | Employee Matters Agreement; |
• | Real Estate Matters Agreement; |
• | Master Commercial Agreement; and |
• | Information Technology Service Agreement. |
Discontinued Operations
On April 1, 2017, HPE completed the separation and merger of its Enterprise Services business with Computer Sciences Corporation (“CSC”) (collectively, the “Everett Transaction”). HPE transferred its Enterprise Services business to Everett SpinCo, Inc. (a wholly-owned subsidiary of HPE) ("Everett") and distributed all of the shares of Everett to HPE stockholders. Following the distribution, New Everett Merger Sub Inc., a wholly-owned subsidiary of Everett, merged with and into CSC and Everett changed its name to DXC Technology Company ("DXC").
On September 1, 2017, HPE completed the separation and merger of its Software business segment with Micro Focus International plc (“Micro Focus”) (collectively, the “Seattle Transaction”). HPE transferred its Software business segment to Seattle SpinCo, Inc. (a wholly-owned subsidiary of HPE) ("Seattle"), and distributed all of the shares of Seattle to HPE stockholders. Following the share distribution, Seattle MergerSub, Inc., an indirect, wholly-owned subsidiary of Micro Focus, merged with and into Seattle.
HPE had entered into several agreements with each of DXC and Micro Focus that govern the relationship between the parties, including the following:
• | Separation and Distribution Agreement; |
• | Transition Services Agreement; |
• | Tax Matters Agreement; |
• | Employee Matters Agreement; |
• | Real Estate Matters Agreement; |
HEWLETT PACKARD ENTERPRISE COMPANY AND SUBSIDIARIES
Notes to Consolidated Financial Statements (Continued)
• | Intellectual Property Matters Agreement |
• | Information Technology Service Agreement; and |
• | Preferred Vendor Agreements. |
These agreements provided for the allocation of assets, employees, liabilities and obligations (including its investments, property, employee benefits, litigation, and tax-related assets and liabilities) between HPE and DXC and HPE and Micro Focus, respectively, attributable to periods prior to, at and after the transactions. Obligations under the service and commercial contracts generally extend through five years .
HPE Next
During the third quarter of fiscal 2017, the Company launched an initiative called HPE Next, through which it will simplify the organizational structure and redesign business processes. The HPE Next initiative is expected to be implemented through fiscal 2020. During this time, the Company expects to incur expenses for workforce reductions, to upgrade and simplify its IT infrastructure, and for other non-labor actions. These costs were partially offset by gains from real estate sales. For more details on the HPE Next initiative and Transformation costs, see Note 5, "HPE Next".
Basis of Presentation
The historical results of operations and financial position of both Everett and Seattle are reported as discontinued operations in the Consolidated Statements of Earnings and the Consolidated Balance Sheets. The historical information in the accompanying Notes to the Consolidated Financial Statements has been restated to reflect the effects of the Everett Transaction and the Seattle Transaction. For further information on discontinued operations, see Note 2, "Discontinued Operations".
The accompanying Consolidated Financial Statements include the accounts of the Company and other subsidiaries and affiliates in which the Company has a controlling financial interest or is the primary beneficiary. All intercompany transactions and accounts within the consolidated businesses of the Company have been eliminated.
The Company consolidates a Variable Interest Entity (“VIE”) where it has been determined that the Company is the primary beneficiary of the entity’s operation. The primary beneficiary is the party that has both the power to direct the activities that most significantly impact the VIE’s economic performance and the obligation to absorb losses or the right to receive benefits of the VIE that could potentially be significant to the VIE. In evaluating whether the Company is the primary beneficiary, the Company evaluates its power to direct the most significant activities of the VIE by considering the purpose and design of the entity and the risks the entity was designed to create and pass through to its variable interest holders. The Company also evaluates its economic interests in the VIE.
The Company accounts for investments in companies over which it has the ability to exercise significant influence but does not hold a controlling interest under the equity method of accounting, and the Company records its proportionate share of income or losses in Earnings (loss) from equity interests in the Consolidated Statements of Earnings.
Non-controlling interests are presented as a separate component within Total stockholders' equity in the Consolidated Balance Sheets. Net earnings attributable to non-controlling interests are recorded within Interest and other, net in the Consolidated Statements of Earnings and are not presented separately, as they were not material for any periods presented.
Segment Realignment
During the first quarter of fiscal 2019, the Company completed an organizational change in certain segment and business units in order to align its segment financial reporting more closely with its current business structure. Reclassifications of certain prior year segment and business unit financial information have been made to conform to the current-year presentation. None of the changes impact the Company's previously reported consolidated net revenue, earnings from operations, net earnings, net earnings per share ("EPS") or total assets. See Note 3, "Segment Information", for a further discussion of the Company's segment realignment.
Use of Estimates
The preparation of financial statements in accordance with U.S. Generally Accepted Accounting Principles ("GAAP") requires management to make estimates and assumptions that affect the amounts reported in the Company's Consolidated Financial Statements and accompanying notes. Actual results could differ materially from those estimates.
69
HEWLETT PACKARD ENTERPRISE COMPANY AND SUBSIDIARIES
Notes to Consolidated Financial Statements (Continued)
Foreign Currency Translation
The Company predominately uses the U.S. dollar as its functional currency. Assets and liabilities denominated in non-U.S. currencies are remeasured into U.S. dollars at current exchange rates for monetary assets and liabilities and at historical exchange rates for non-monetary assets and liabilities. Net revenue, costs and expenses denominated in non-U.S. currencies are recorded in U.S. dollars at the average rates of exchange prevailing during the period. The Company includes gains or losses from foreign currency remeasurement in Interest and other, net in the Consolidated Statements of Earnings and gains and losses from cash flow hedges in Net revenue as the hedged revenue is recognized. Certain non-U.S. subsidiaries designate the local currency as their functional currency, and the Company records the translation of their assets and liabilities into U.S. dollars at the balance sheet date as translation adjustments and includes them as a component of Accumulated other comprehensive loss in the Consolidated Balance Sheets. The effect of foreign currency exchange rates on cash and cash equivalents was not material for any of the fiscal years presented.
Revenue Recognition
General
As a result of adopting the new revenue recognition standard ("ASC 606"), the Company now accounts for a contract with a customer when both parties have provided written approval and are committed to perform, each party’s rights including payment terms are identified, the contract has commercial substance, and collection of consideration is probable.
The Company enters into contracts with customers that may include combinations of products and services, resulting in arrangements containing multiple performance obligations for hardware and software products and/or various services. The Company determines whether each product or service is distinct in order to identify the performance obligations in the contract and allocate the contract transaction price among the distinct performance obligations. Arrangements are distinct based on whether the customer can benefit from the product or service on its own or together with other resources that are readily available and whether the commitment to transfer the product or service to the customer is separately identifiable from other obligations in the contract. The Company classifies its hardware, perpetual software licenses, and software-as-a-service ("SaaS") as distinct performance obligations. Term software licenses represent multiple obligations, which include software licenses and software maintenance. In transactions where the Company delivers hardware or software, it is typically the principal and records revenue and costs of goods sold on a gross basis.
The majority of the Company's revenue is derived from sales of product and the associated support and maintenance which is recognized when, or as, control of promised products or services is transferred to the customer, in an amount that reflects the consideration to which the Company expects to be entitled, in exchange for those products or services. Variable consideration offered in contracts with customers, partners and distributors may include rebates, volume-based discounts, cooperative marketing, price protection, and other incentive programs. Variable consideration is estimated at contract inception and updated at the end of each reporting period as additional information becomes available and recognized only to the extent that it is probable that a significant reversal of revenue will not occur.
Transfer of control occurs once the customer has the contractual right to use the product, generally upon shipment or once delivery and risk of loss has transferred to the customer. Transfer of control can also occur over time for maintenance and services as the customer receives the benefit over the contract term. The Company's hardware and perpetual software licenses are distinct performance obligations where revenue is recognized upfront upon transfer of control. Term software licenses include multiple performance obligations where the term licenses are recognized upfront upon transfer of control, with the associated software maintenance revenue recognized ratably over the contract term as services and software updates are provided. SaaS arrangements have one distinct performance obligation which is satisfied over time with revenue recognized ratably over the contract term as the customer consumes the services. On its product sales, the Company records consideration from shipping and handling on a gross basis within net product sales. Revenue is recorded net of any associated sales taxes.
Significant Judgments
The Company allocates the transaction price for the contract among the performance obligations on a relative standalone selling price basis. The standalone selling price ("SSP") is the price at which an entity would sell a promised product or service separately to a customer. The Company establishes SSP for most of its products and services based on the observable price of the products or services when sold separately in similar circumstances to similar customers. When the SSP is not directly observable, the Company estimates SSP based on management judgment by considering available data such as internal margin objectives, pricing strategies, market/competitive conditions, historical profitability data, as well as other observable inputs. The Company establishes SSP ranges for its products and services and reassesses them periodically.
70
HEWLETT PACKARD ENTERPRISE COMPANY AND SUBSIDIARIES
Notes to Consolidated Financial Statements (Continued)
Judgment is applied in determining the transaction price as the Company may be required to estimate variable consideration when determining the amount of revenue to recognize. Variable consideration may include various rebates, volume-based discounts, cooperative marketing, price protection, and other incentive programs that are offered to customers, partners and distributors. When determining the amount of revenue to recognize, the Company estimates the expected usage of these programs, applying the expected value or most likely estimate and updates the estimate at each reporting period as actual utilization becomes available. The Company also considers the customers' right of return in determining the transaction price, where applicable.
Contract Balances
Accounts receivable and contract assets
A receivable is a right to consideration in exchange for products or services the Company has transferred to a customer that is unconditional. A contract asset is a right to consideration in exchange for products or services transferred to a customer that is conditional on something other than the passage of time. A receivable is recorded when the right to consideration becomes unconditional.
The Company’s contract assets include unbilled receivables which are recorded when the Company recognizes revenue in advance of billings. Unbilled receivables generally relate to services contracts where a service has been performed and control has transferred, but invoicing to the customer is subject to future milestone billings or other contractual payment schedules. The Company classifies unbilled receivables as Accounts receivable.
Contract liabilities
A contract liability is an obligation to transfer products or services to a customer for which the Company has received consideration, or the amount is due, from the customer. The Company’s contract liabilities primarily consist of deferred revenue. Deferred revenue is recorded when amounts invoiced to customers are in excess of revenue that can be recognized because performance obligations have not been satisfied and control of the promised products or services has not transferred to the customer. Deferred revenue largely represents amounts invoiced in advance for product (hardware/software) support contracts, consulting projects and product sales where revenue cannot be recognized yet.
Costs to obtain a contract with a customer
The Company capitalizes the incremental costs of obtaining a contract with a customer, primarily sales commissions, if the Company expects to recover those costs. The Company has elected, as a practical expedient, to expense the costs of obtaining a contract as incurred for contracts with terms of one year or less. The typical amortization periods used range from three to six years . The Company periodically reviews the capitalized sales commission costs for possible impairment losses. As of October 31, 2019, the current and non-current portions of the capitalized costs to obtain a contract were $49 million and $74 million, which were included in Other current assets and Long-term financing receivables and other assets, respectively, in the Consolidated Balance Sheet. For fiscal 2019, the Company amortized $48 million of the capitalized costs to obtain a contract which are included in Selling, general and administrative expense.
The Company includes costs related to shipping and handling in Cost of products.
Stock-Based Compensation
Stock-based compensation expense is based on the measurement date fair value of the award and is recognized only for those awards expected to meet the service and performance vesting conditions. Stock-based compensation expense for stock options and restricted stock units with only a service condition is recognized on a straight-line basis over the requisite service period of the award. For stock options and restricted stock units with both a service condition and a performance or market condition, the expense is recognized on a graded vesting basis over the requisite service period of the award. Stock-based compensation expense is determined at the aggregate grant level for service-based awards and at the individual vesting tranche level for awards with performance and/or market conditions. The forfeiture rate is estimated based on historical experience.
The Company has various defined benefit, other contributory and noncontributory, retirement and post-retirement plans. The Company generally amortizes unrecognized actuarial gains and losses on a straight-line basis over the average remaining estimated service life or, in the case of closed plans, life expectancy of participants. In limited cases, actuarial gains and losses are amortized
71
HEWLETT PACKARD ENTERPRISE COMPANY AND SUBSIDIARIES
Notes to Consolidated Financial Statements (Continued)
using the corridor approach. See Note 6, “Retirement and Post-Retirement Benefit Plans” for a full description of these plans and the accounting and funding policies.
Restructuring
The Company records charges associated with approved restructuring plans to reorganize one or more of the Company's business segments, to remove duplicative headcount and infrastructure associated with business acquisitions or to simplify business processes and accelerate innovation. Restructuring charges can include severance costs to eliminate a specified number of employees, infrastructure charges to vacate facilities and consolidate operations, and contract cancellation costs. The Company records restructuring charges based on estimated employee terminations and site closure and consolidation plans. The Company accrues for severance and other employee separation costs under these actions when it is probable that benefits will be paid and the amount is reasonably estimable. The rates used in determining severance accruals are based on existing plans, historical experiences and negotiated settlements.
Taxes on Earnings
The Company recognizes deferred tax assets and liabilities for the expected tax consequences of temporary differences between the tax bases of assets and liabilities and their reported amounts using enacted tax rates in effect for the year the differences are expected to reverse.
The Company records a valuation allowance to reduce deferred tax assets to the amount that is more likely than not to realize. In determining the need for a valuation allowance, the Company considers future market growth, forecasted earnings, future sources of taxable income, the mix of earnings in the jurisdictions in which the Company operates, and prudent and feasible tax planning strategies. In the event the Company were to determine that it is more likely than not that the Company will be unable to realize all or part of its deferred tax assets in the future, the Company would increase the valuation allowance and recognize a corresponding charge to earnings or other comprehensive income in the period in which such a determination was made. Likewise, if the Company later determines that the deferred tax assets are more likely than not to be realized, the Company would reverse the applicable portion of the previously recognized valuation allowance. In order for the Company to realize deferred tax assets, the Company must be able to generate sufficient taxable income in the jurisdictions in which the deferred tax assets are located.
The Company records accruals for uncertain tax positions when the Company believes that it is not more likely than not that the tax position will be sustained on examination by the taxing authorities based on the technical merits of the position. The Company makes adjustments to these accruals when facts and circumstances change, such as the closing of a tax audit or the refinement of an estimate. The provision for income taxes includes the effects of adjustments for uncertain tax positions, effects of settlement of certain pre-Separation Hewlett-Packard Company income tax liabilities, as well as any related interest and penalties.
Accounts Receivable
The Company establishes an allowance for doubtful accounts for accounts receivable. The Company may record a specific reserve for individual accounts when the Company becomes aware of specific customer circumstances, such as in the case of a bankruptcy filing or deterioration in the customer's operating results or financial position. If there are additional changes in circumstances related to the specific customer, the Company further adjusts estimates of the recoverability of receivables. The Company maintains bad debt reserves for all other customers based on a variety of factors, including the use of third-party credit risk models that generate quantitative measures of default probabilities based on market factors, the financial condition of customers, the length of time receivables are past due, trends in the weighted-average risk rating for the portfolio, macroeconomic conditions, information derived from competitive benchmarking, significant one-time events, and historical experience. The past due or delinquency status of a receivable is based on the contractual payment terms of the receivable.
The Company has third-party revolving short-term financing arrangements intended to facilitate the working capital requirements of certain customers. These financing arrangements, which in certain cases provide for partial recourse, result in the transfer of the Company's trade receivables to a third party. The Company reflects amounts transferred to, but not yet collected from, the third party in Accounts receivable in the Consolidated Balance Sheets. When the Company has received payment from the third party for which revenue recognition has been deferred, the Company records the obligation for the amount received in Notes payable and short-term borrowings in its Consolidated Balance Sheets. For arrangements involving an element of recourse,
72
HEWLETT PACKARD ENTERPRISE COMPANY AND SUBSIDIARIES
Notes to Consolidated Financial Statements (Continued)
the fair value of the recourse obligation is measured using market data from similar transactions and reported as a current liability in Other accrued liabilities in the Consolidated Balance Sheets.
Concentrations of Risk
Financial instruments that potentially subject the Company to significant concentrations of credit risk consist principally of cash, cash equivalents and restricted cash, investments, receivables from trade customers and contract manufacturers, financing receivables and derivatives.
The Company maintains cash, cash equivalents and restricted cash, investments, derivatives, and certain other financial instruments with various financial institutions. These financial institutions are located in many different geographic regions, and the Company's policy is designed to limit exposure from any particular institution. As part of its risk management processes, the Company performs periodic evaluations of the relative credit standing of these financial institutions. The Company has not sustained material credit losses from instruments held at these financial institutions. The Company utilizes derivative contracts to protect against the effects of foreign currency and interest rate exposures. Such contracts involve the risk of non-performance by the counterparty, which could result in a material loss.
Credit risk with respect to accounts receivable from trade customers and financing receivables is generally diversified due to the large number of entities comprising the Company's customer base and their dispersion across many different industries and geographic regions. The Company performs ongoing credit evaluations of the financial condition of its customers and may require collateral, such as letters of credit and bank guarantees, in certain circumstances. As of October 31, 2019 and 2018 no single customer accounted for more than 10 % of the Company's gross accounts receivable balance.
The Company utilizes outsourced manufacturers around the world to manufacture company-designed products. The Company may purchase product components from suppliers and sell those components to its outsourced manufacturers thereby creating receivable balances from the outsourced manufacturers. The three largest outsourced manufacturer receivable balances collectively represented 92 % of the Company's manufacturer receivables of $635 million and $684 million at October 31, 2019 and 2018, respectively. The Company includes the manufacturer receivables in Other current assets in the Consolidated Balance Sheets on a gross basis. The Company's credit risk associated with these receivables is mitigated wholly or in part by the amount the Company owes to these outsourced manufacturers, as the Company generally has the legal right to offset its payables to the outsourced manufacturers against these receivables. The Company does not reflect the sale of these components in revenue and does not recognize any profit on these component sales until the manufactured products are sold by the Company, at which time any profit is recognized as a reduction to cost of sales. The Company obtains a significant number of components from single source suppliers due to technology, availability, price, quality or other considerations. The loss of a single source supplier, the deterioration of the Company's relationship with a single source supplier, or any unilateral modification to the contractual terms under which the Company is supplied components by a single source supplier could adversely affect the Company's revenue and gross margins.
Inventory
The Company values inventory at the lower of cost or net realizable value. Cost is computed using standard cost which approximates actual cost on a first-in, first-out basis. Adjustments to reduce the cost of inventory to its net realizable value are made, if required, for estimated excess or obsolescence determined primarily by future demand forecasts.
Property, Plant and Equipment
The Company states property, plant and equipment at cost less accumulated depreciation. The Company capitalizes additions and improvements and expenses maintenance and repairs as incurred. Depreciation expense is recognized on a straight-line basis over the estimated useful lives of the assets. Estimated useful lives are five to 40 years for buildings and improvements and three to 15 years for machinery and equipment. The Company depreciates leasehold improvements over the life of the lease or the asset, whichever is shorter. The Company depreciates equipment held for lease over the initial term of the lease to the equipment's estimated residual value. The estimated useful lives of assets used solely to support a customer services contract generally do not exceed the term of the customer contract. On retirement or disposition, the asset cost and related accumulated depreciation are removed from the Consolidated Balance Sheets with any gain or loss recognized in the Consolidated Statements of Earnings.
The Company capitalizes certain internal and external costs incurred to acquire or create internal use software, principally related to software coding, designing system interfaces and installation and testing of the software. The Company amortizes capitalized internal use software costs using the straight-line method over the estimated useful lives of the software, generally from three to five years .
73
HEWLETT PACKARD ENTERPRISE COMPANY AND SUBSIDIARIES
Notes to Consolidated Financial Statements (Continued)
Business Combinations
The Company includes the results of operations of acquired businesses in the Company's consolidated results prospectively from the date of acquisition. The Company allocates the fair value of purchase consideration to the assets acquired including in-process research and development ("IPR&D"), liabilities assumed, and non-controlling interests in the acquired entity based on their fair values at the acquisition date. IPR&D is initially capitalized at fair value as an intangible asset with an indefinite life and assessed for impairment thereafter. The excess of the fair value of purchase consideration over the fair value of the assets acquired, liabilities assumed and non-controlling interests in the acquired entity is recorded as goodwill. The primary items that generate goodwill include the value of the synergies between the acquired company and the Company and the value of the acquired assembled workforce, neither of which qualifies for recognition as an intangible asset. Acquisition-related expenses and post-acquisition restructuring costs are recognized separately from the business combination and are expensed as incurred.
Goodwill
The Company reviews goodwill for impairment annually and whenever events or changes in circumstances indicate the carrying amount of goodwill may not be recoverable. The Company performs a quantitative test for all of its reporting units as part of its annual goodwill impairment test in the fourth quarter of each fiscal year.
The Company estimates the fair value of its reporting units using a weighting of fair values derived most significantly from the income approach, and to a lesser extent, the market approach. Under the income approach, the Company estimates the fair value of a reporting unit based on the present value of estimated future cash flows. The Company prepares cash flow projections based on management's estimates of revenue growth rates and operating margins, taking into consideration industry and market conditions. The Company bases the discount rate on the weighted-average cost of capital adjusted for the relevant risk associated with business-specific characteristics and the uncertainty related to the reporting unit's ability to execute on the projected cash flows. Under the market approach, the Company estimates fair value based on market multiples of revenue and earnings derived from comparable publicly traded companies with similar operating and investment characteristics as the reporting unit. The Company weights the fair value derived from the market approach depending on the level of comparability of these publicly traded companies to the reporting unit. When market comparables are not meaningful or not available, the Company estimates the fair value of a reporting unit using only the income approach.
If the fair value of a reporting unit exceeds the carrying amount of the net assets assigned to that reporting unit, goodwill is not impaired and no further testing is required. If the fair value of the reporting unit is less than its carrying amount, goodwill is impaired. The goodwill impairment loss is measured as the excess of the reporting unit's carrying value over its fair value (not to exceed the total goodwill allocated to that reporting unit).
Intangible Assets and Long-Lived Assets
The Company reviews intangible assets with finite lives and long-lived assets for impairment whenever events or changes in circumstances indicate the carrying amount of an asset may not be recoverable. The Company assesses the recoverability of assets based on the estimated undiscounted future cash flows expected to result from the use and eventual disposition of the asset. If the undiscounted future cash flows are less than the carrying amount, the asset is impaired. The Company measures the amount of impairment loss, if any, as the difference between the carrying amount of the asset and its fair value using an income approach or, when available and appropriate, using a market approach. The Company amortizes intangible assets with finite lives using the straight-line method over the estimated economic lives of the assets, ranging from one to ten years .
Assets Held for Sale
The Company classifies its long-lived assets to be sold as held for sale in the period (i) it has approved and committed to a plan to sell the asset, (ii) the asset is available for immediate sale in its present condition, (iii) an active program to locate a buyer and other actions required to sell the asset have been initiated, (iv) the sale of the asset is probable, (v) the asset is being actively marketed for sale at a price that is reasonable in relation to its current fair value, and (vi) it is unlikely that significant changes to the plan will be made or that the plan will be withdrawn. The Company initially measures a long-lived asset that is classified as held for sale at the lower of its carrying value or fair value less any costs to sell. Any loss resulting from this measurement is recognized in the period in which the held for sale criteria are met. Conversely, gains are not recognized on the sale of a long-lived asset until the date of sale. Upon designation as an asset held for sale, the Company stops recording depreciation expense on the asset. The Company assesses the fair value of a long-lived asset less any costs to sell at each reporting period and until the asset is no longer classified as held for sale.
74
HEWLETT PACKARD ENTERPRISE COMPANY AND SUBSIDIARIES
Notes to Consolidated Financial Statements (Continued)
Equity Method Investments
Investments and ownership interests are accounted for under equity method accounting if the Company has the ability to exercise significant influence, but does not have a controlling financial interest. The Company records its interest in the net earnings of its equity method investees, along with adjustments for unrealized profits or losses on intra-entity transactions and amortization of basis differences, within earnings or loss from equity interests in the Consolidated Statements of Earnings. Profits or losses related to intra-entity sales with its equity method investees are eliminated until realized by the investor or investee. Basis differences represent differences between the cost of the investment and the underlying equity in net assets of the investment and are generally amortized over the lives of the related assets that gave rise to them. Equity method goodwill is not amortized or tested for impairment; instead the equity method investment is tested for impairment. The Company records its interest in the net earnings of its equity method investments based on the most recently available financial statements of the investees.
The carrying amount of the investment in equity interests is adjusted to reflect the Company's interest in net earnings, dividends received and other-than-temporary impairments. The Company reviews for impairment whenever factors indicate that the carrying amount of the investment might not be recoverable. In such a case, the decrease in value is recognized in the period the impairment occurs in the Consolidated Statement of Earnings.
Equity Securities Investments
Equity securities investments with readily determinable fair values (other than those accounted for under the equity method or those that result in consolidation of the investee) are measured at fair value and any changes in fair value are recognized in Interest and other, net in the Consolidated Statement of Earnings. For equity investments without readily determinable fair values, the Company has elected to apply the measurement alternative, under which investments are measured at cost, less impairment, and adjusted for qualifying observable price changes on a prospective basis. The Company reviews for impairment whenever factors indicate that the carrying amount of the investment might not be recoverable. In such a case, the decrease in value is recognized in the period the impairment occurs in the Consolidated Statement of Earnings.
Debt Securities Investments
Debt securities are generally considered available-for-sale and are reported at fair value with unrealized gains and losses, net of applicable taxes, recorded in Accumulated other comprehensive loss in the Consolidated Balance Sheets. Realized gains and losses for available-for-sale securities are calculated based on the specific identification method and included in Interest and other, net in the Consolidated Statements of Earnings. The Company monitors its investment portfolio for potential impairment on a quarterly basis. When the carrying amount of an investment in debt securities exceeds its fair value and the decline in value is determined to be other-than-temporary, the Company records an impairment charge to Interest and other, net in the amount of the credit loss and the balance, if any, is recorded in Accumulated other comprehensive loss in the Consolidated Balance Sheets.
Derivatives
The Company uses derivative financial instruments, primarily forwards, swaps, and, at times, options, to hedge certain foreign currency and interest rate exposures. The Company also may use other derivative instruments, such as forwards, to hedge foreign currency balance sheet exposures. The Company does not use derivative financial instruments for speculative purposes. See Note 14, "Financial Instruments", for a full description of the Company's derivative financial instrument activities and related accounting policies.
Loss Contingencies
The Company is involved in various lawsuits, claims, investigations, and proceedings that arise in the ordinary course of business. The Company records a liability for contingencies when it believes it is both probable that a liability has been incurred and the amount of the loss can be reasonably estimated. See Note 18, "Litigation and Contingencies", for a full description of the Company's loss contingencies.
Recent Tax Legislation
On December 22, 2017, the Tax Cuts and Jobs Act (the "Tax Act") was enacted into law. The Tax Act includes significant changes to the U.S. corporate income tax structure, including a federal corporate rate reduction from 35% to 21% effective January 1, 2018, limitations on the deductibility of interest expense and executive compensation, creation of new minimum taxes such as the Base Erosion Anti-abuse Tax ("BEAT") and the Global Intangible Low Taxed Income ("GILTI") tax and the transition of U.S. international taxation from a worldwide tax system to a modified territorial tax system, which resulted in a one-time U.S. tax liability on those earnings which have not previously been repatriated to the U.S. (the "Transition Tax").
75
HEWLETT PACKARD ENTERPRISE COMPANY AND SUBSIDIARIES
Notes to Consolidated Financial Statements (Continued)
In December 2017, the U.S. Securities and Exchange Commission ("SEC") issued Staff Accounting Bulletin No. 118, Income Tax Accounting Implications of the Tax Cuts and Jobs Act ("SAB 118"), which allowed the Company to record provisional amounts during a measurement period not to extend beyond one year of the enactment date, which for the Company ended in the first quarter of fiscal 2019. In accordance with SAB 118, the accounting for the tax effects of the Tax Act was completed based on currently available legislative updates relating to the Tax Act. The Company has elected to treat taxes due on future GILTI inclusions in U.S. taxable income as a current period expense when incurred. For further details, see Note 8, "Taxes on Earnings".
Recently Adopted Accounting Pronouncements
In March 2017, the Financial Accounting Standards Board ("FASB") amended the existing accounting standards for retirement benefits. The amendments require the presentation of the service cost component of net periodic benefit cost in the same income statement line items as other employee compensation costs, unless eligible for capitalization. The other components of net periodic benefit costs will be presented separately from the service cost as non-operating costs. Effective at the beginning of the first quarter of fiscal 2019, in connection with the adoption of the accounting standards update for retirement benefits, the Company reflected these changes retrospectively by transferring its non-service net periodic benefit credit (cost) from operating expense to other (income) and expense in its Consolidated Statements of Earnings. The net periodic benefit credit (cost) transferred to other (income) and expense for the fiscal years ended October 31, 2018 and 2017, was as follows. Refer to Note 6, “Retirement and Post-Retirement Benefit Plans” for additional information.
Fiscal year ended October 31, 2018 | Fiscal year ended October 31, 2017 | ||||||
In millions | |||||||
Cost of products and services | $ | $ | |||||
Research and development | |||||||
Selling, general and administrative | |||||||
Restructuring charges and transformation costs | ( | ) | |||||
$ | $ | ||||||
In November 2016, the FASB amended the existing accounting standards for the classification and presentation of restricted cash in the statement of cash flows. The Company adopted the guidance in the first quarter of fiscal 2019, beginning November 1, 2018, using the retrospective method. As a result of adopting this accounting standards update, for the fiscal years ended October 31, 2018 and 2017, the Company included $191 million and $442 million, respectively, of restricted cash movement during the period, which was previously reported within cash used in investing activities, and is now reported within Decrease in cash, cash equivalents and restricted cash in the Company's Consolidated Statement of Cash Flows.
In October 2016, the FASB amended the existing accounting standards for income taxes. The amendments require the recognition of the income tax consequences for intra-entity transfers of assets other than inventory when the transfer occurs. Prior to the amendments, current and deferred income taxes for intra-entity asset transfers were not recognized until the asset was sold to an outside party or amortized over time. The Company adopted the guidance in the first quarter of fiscal 2019, beginning November 1, 2018, using the modified retrospective method. The Company recognized $2.3 billion of income taxes as an adjustment to retained earnings for fiscal 2019, which was previously reported as prepaid income taxes and deferred tax assets.
In August 2016, the FASB amended the existing accounting standards for the statement of cash flows. The amendments provide guidance on eight classification issues related to the statement of cash flows. The Company adopted the guidance in the first quarter of fiscal 2019, beginning November 1, 2018, using the retrospective method. For issues that are impracticable to apply retrospectively, the amendments may be applied prospectively as of the earliest date practicable. The application of this accounting standards update did not have an impact on the Consolidated Statements of Cash Flows.
In January 2016, the FASB issued guidance that requires equity investments with readily determinable fair values (other than those accounted for under the equity method or those that result in consolidation of the investee) to be measured at fair value and recognize any changes in fair value in net income. For equity investments without readily determinable fair values, the Company has elected to apply the measurement alternative, under which investments are measured at cost, less impairment, and adjusted for qualifying observable price changes on a prospective basis. The Company adopted the guidance effective November 1, 2018, and there was no impact on the Consolidated Financial Statements upon adoption.
76
HEWLETT PACKARD ENTERPRISE COMPANY AND SUBSIDIARIES
Notes to Consolidated Financial Statements (Continued)
In May 2014, the FASB amended the existing accounting standards for revenue recognition. The Company adopted the new revenue standard in the first quarter of fiscal 2019 using the modified retrospective method of transition applied to contracts that were not completed as of November 1, 2018. Results and related disclosures for the reporting periods beginning after November 1, 2018 are presented under the new revenue standard, while comparative prior period results and related disclosures are not adjusted and continue to be reported in accordance with the historic accounting standard. Refer to the Revenue Recognition section above for accounting policy updates upon the adoption of the new revenue standard. For disaggregation of revenue, see Note 3, "Segment Information".
The following table summarizes the effects of adopting the new revenue standard at November 1, 2018 on the Consolidated Balance Sheets as an adjustment to the opening balance:
Historical Accounting Method | Effect of Adoption | As Adjusted | |||||||||
In millions | |||||||||||
Assets | |||||||||||
Accounts receivable | $ | $ | $ | ||||||||
Inventory | ( | ||||||||||
Other current assets | |||||||||||
Long-term financing receivables and other assets | |||||||||||
Subtotal assets | $ | $ | $ | ||||||||
Liabilities | |||||||||||
Taxes on earnings | $ | $ | $ | ||||||||
Deferred revenue | ( | ||||||||||
Other accrued liabilities | |||||||||||
Other non-current liabilities | ( | ||||||||||
Subtotal liabilities | $ | $ | ( | ) | $ | ||||||
Stockholders' equity | |||||||||||
Accumulated deficit | $ | ( | ) | $ | $ | ( | ) | ||||
Subtotal stockholders' equity | $ | ( | ) | $ | $ | ( | ) | ||||
Subtotal liabilities and stockholders' equity | $ | $ | $ | ||||||||
Recently Enacted Accounting Pronouncements
In August 2018, the FASB issued guidance on a customer's accounting for implementation costs incurred in cloud-computing arrangements that are hosted by a vendor. Certain types of implementation costs should be capitalized and amortized over the term of the hosting arrangement. The Company is required to adopt the guidance in the first quarter of fiscal 2021. Early adoption is permitted. The Company is currently evaluating the timing and the impact of these amendments on its Consolidated Financial Statements.
In August 2018, the FASB issued guidance which changes the disclosure requirements for fair value measurements and defined benefit plans. The Company is required to adopt the guidance in the first quarter of fiscal 2021. Early adoption is permitted. As the guidance represents a change to disclosure only, the Company does not expect the guidance to have a material impact on its Consolidated Financial Statements.
In February 2018, the FASB issued guidance that allows companies to reclassify stranded tax effects resulting from the Tax Act, from accumulated other comprehensive income to retained earnings. The guidance also requires certain new disclosures regardless of the election. The Company plans to adopt the guidance in the first quarter of fiscal 2020. The Company does not expect the guidance to have a material impact on its Consolidated Financial Statements.
77
HEWLETT PACKARD ENTERPRISE COMPANY AND SUBSIDIARIES
Notes to Consolidated Financial Statements (Continued)
In August 2017, the FASB amended the existing accounting standards for hedge accounting. The amendments expand an entity’s ability to hedge non-financial and financial risk components and reduce complexity in fair value hedges of interest rate risk. The new guidance eliminates the requirement to separately measure and report hedge ineffectiveness and requires the entire change in the fair value of a hedging instrument to be presented in the same income statement line as the hedged item. The guidance also simplifies certain documentation and assessment requirements and modifies the accounting for components excluded from the assessment of hedge effectiveness. In April 2019, the FASB issued certain clarifications to address partial term fair value hedges, fair value hedge basis adjustments and certain transition requirements. The Company is required to adopt the guidance in the first quarter of fiscal 2020. The Company does not expect these amendments to have a material impact on its Consolidated Financial Statements.
In June 2016, the FASB amended the existing accounting standards for the measurement of credit losses. The amendments require an entity to estimate its lifetime expected credit loss for most financial instruments, including trade and lease receivables, and record an allowance for the portion of the amortized cost the entity does not expect to collect. The estimate of expected credit losses should consider historical information, current information, and reasonable and supportable forecasts, including estimates of prepayments. In April 2019, the FASB further clarified the scope of the credit losses standard and addressed issues related to accrued interest receivable balances, recoveries, variable interest rates and prepayment. In May 2019, the FASB issued further guidance to provide entities with an option to irrevocably elect the fair value option applied on an instrument-by-instrument basis for eligible financial instruments. In November 2019, the FASB issued several amendments to the new credit losses standard, including an amendment requiring entities to include certain expected recoveries of the amortized cost basis in the allowance for credit losses for purchased credit deteriorated assets. The Company is required to adopt the guidance in the first quarter of fiscal 2021. Early adoption is permitted beginning in fiscal 2020. The Company is currently evaluating the impact of these amendments on its Consolidated Financial Statements.
The FASB issued guidance in February 2016, with amendments in 2018 and 2019, which changes the accounting standards for leases. The primary objective of this update is to increase transparency and comparability among organizations by requiring lessees to recognize a lease liability for the obligation to make lease payments and a right-of-use asset for the right to use the underlying asset for the lease term. The guidance for lessor accounting is similar to the current model, updated to align with certain changes to the lessee model and the new revenue standard, along with enhanced disclosure requirements. The Company adopted the guidance in the first quarter of fiscal 2020, beginning November 1, 2019, using the transition method whereby prior comparative periods will not be restated in the Consolidated Financial Statements. As permitted under the transition guidance, the Company will carry forward the assessment of whether its contracts contain or are leases, classification of its leases and remaining lease terms. The Company implemented a new IT system and has made significant progress validating the accuracy of new reports generated from the lease accounting system and is in the process of finalizing its disclosures and internal controls. The Company has substantially completed its review of existing vendor and lease arrangements and based on its review, as of October 31, 2019, approximately $1.0 billion of right-of-use assets and $1.1 billion of lease liabilities will be recognized on our balance sheet upon adoption, primarily relating to real estate. For lessor accounting, the Company anticipates that the most significant change will be a reduction in lease origination costs eligible for capitalization; however, the Company does not expect a material impact on its Consolidated Financial Statements.
In April 2019, the FASB amended its standards on recognizing and measuring financial instruments to address the scope of the guidance, the requirement for remeasurement when using the measurement alternative and certain disclosure requirements. The Company is required to adopt the guidance in the first quarter of fiscal 2021. Early adoption is permitted. The Company is currently evaluating the impact of these amendments on its Consolidated Financial Statements.
Note 2: Discontinued Operations
On April 1, 2017 and September 1, 2017, the Company completed the Everett and Seattle Transactions, respectively. As a result, the financial results of Everett and Seattle are presented as Net loss from discontinued operations in the Consolidated Statements of Earnings for fiscal 2017 and 2018. All activities related to discontinued operations were completed in fiscal 2018.
78
HEWLETT PACKARD ENTERPRISE COMPANY AND SUBSIDIARIES
Notes to Consolidated Financial Statements (Continued)
The following table presents the financial results for HPE's discontinued operations.
Fiscal years ended October 31, | |||||||
2018 | 2017 | ||||||
In millions | |||||||
Net revenue | $ | $ | |||||
Cost of revenue(1) | |||||||
Expenses(2) | |||||||
Interest and other, net | |||||||
Loss from discontinued operations before taxes | ( | ) | ( | ) | |||
Benefit for taxes | |||||||
Net loss from discontinued operations | $ | ( | ) | $ | ( | ) | |
(1) | Cost of revenue includes cost of products and services. |
(2) | For the periods following the Everett and Seattle Transactions in fiscal 2017, expenses primarily consist of separation costs, which relate to third-party consulting, contractor fees and other incremental costs arising from the transactions. Prior to the Everett and Seattle Transactions, expenses in fiscal 2017 primarily consist of selling, general and administrative (“SG&A”) expenses, research and development (“R&D”) expenses, restructuring charges, separation costs, amortization of intangible assets, acquisition and other related charges, and defined benefit plan remeasurement benefit. |
For the fiscal year ended October 31, 2017, significant non-cash items of discontinued operations consisted of depreciation and amortization of $526 million. For the fiscal year ended October 31, 2017, purchases of property, plant and equipment of discontinued operations consisted of $158 million.
Note 3: Segment Information
Hewlett Packard Enterprise's operations are organized into four segments for financial reporting purposes: Hybrid IT, Intelligent Edge, Financial Services ("FS") and Corporate Investments. Hewlett Packard Enterprise's organizational structure is based on a number of factors that the Chief Operating Decision Maker ("CODM"), who is the Chief Executive Officer ("CEO"), uses to evaluate, view and run business operations, which include, but are not limited to, customer base and homogeneity of products and technology. The segments are based on this organizational structure and information reviewed by Hewlett Packard Enterprise's management to evaluate segment results.
A summary description of each segment follows.
Hybrid IT provides a broad portfolio of services-led and software-enabled infrastructure and solutions including secure, software-defined servers and storage, and HPE Pointnext services, thereby combining HPE's hardware, software and services capabilities to make Hybrid IT simple for its customers. Described below are the business unit capabilities within Hybrid IT.
• | Hybrid IT Product includes Compute and Storage |
◦ | Compute HPE offers both Industry Standard Servers ("ISS"), which are general purpose servers for multi-workload computing, as well as Mission Critical Servers ("MCS"), which are servers optimized for particular workloads. HPE's general purpose servers include the HPE ProLiant, secure and versatile rack and tower servers; HPE BladeSystem, a modular infrastructure that converges server, storage and networking; and HPE Synergy, a composable infrastructure for traditional and cloud-native applications. The Company's workload optimized server portfolio includes the HPE Apollo, and products from the acquisition of Cray, for high performance computing and artificial intelligence, HPE Cloudline for cloud data centers, HPE Edgeline for computing at the network edge and HPE Integrity for mission-critical applications. |
Storage. With storage offerings that are AI-driven and built for cloud environments with as-a-service consumption and flexible investment options, HPE provides the right workload optimized destinations for data. Powered by HPE InfoSight advanced analytics and machine learning and HPE Cloud Volumes data mobility, HPE delivers intelligent storage for hybrid cloud environments so that customers can unlock data’s full potential and derive business insights. Key solutions include HPE SimpliVity, a hyper-converged platform for virtualization, Blue Data and MapR for expertise in artificial intelligence, machine learning and analytics data management, HPE
79
HEWLETT PACKARD ENTERPRISE COMPANY AND SUBSIDIARIES
Notes to Consolidated Financial Statements (Continued)
3PAR Storage and HPE Nimble Storage all-flash arrays for mission critical workloads and general purpose workloads, respectively, and big data solutions running on HPE Apollo Servers. Storage also provides comprehensive data protection with HPE StoreOnce and HPE Recovery Manager Central, solutions for secondary workloads and traditional tape, storage networking and disk products, such as HPE MSA and HPE XP.
• | HPE Pointnext Services creates preferred IT experiences that power the digital business. The HPE Pointnext Services team and the Company's extensive partner network provide value across the IT life cycle delivering advice, transformation projects, professional services, support services and operational services for Hybrid IT and the Intelligent Edge. HPE Pointnext Services is also a provider of on-premises flexible consumption models, such as HPE GreenLake, that enable IT agility, simplify operations and align cost to business value. HPE Pointnext Service offerings includes Operational Services and Advisory and Professional Services. |
The Intelligent Edge business is comprised of a portfolio of secure Edge-to-Cloud solutions operating under the Aruba brand that include wireless LAN, campus and data center switching, software-defined wide-area-networking, security and associated services to enable secure connectivity for businesses of any size. The primary business drivers for Intelligent Edge solutions are mobility and the Internet of Things ("IoT").
◦ | HPE Aruba Product includes wired and wireless local area network, wide area network, data center networking such as Wi-Fi access points, switches, routers, sensors, and software products that include cloud-based management, network management, network access control, analytics and assurance, and location services. |
◦ | HPE Aruba Services includes professional and support services, as well as as-a-service (aaS) and consumption models for the Intelligent Edge portfolio of products. |
Financial Services provides flexible investment solutions, such as leasing, financing, IT consumption, and utility programs and asset management services, for customers that facilitate unique technology deployment models and the acquisition of complete IT solutions, including hardware, software and services from Hewlett Packard Enterprise and others. In order to provide flexible services and capabilities that support the entire IT life cycle, FS partners with customers globally to help build investment strategies that enhance their business agility and support their business transformation. FS offers a wide selection of investment solution capabilities for large enterprise customers and channel partners, along with an array of financial options to SMBs and educational and governmental entities.
Corporate Investments includes Communications and Media Solutions ("CMS"), Hewlett Packard Labs, and certain business incubation projects.
Segment Policy
Hewlett Packard Enterprise derives the results of its business segments directly from its internal management reporting system. The accounting policies that Hewlett Packard Enterprise uses to derive segment results are substantially the same as those the consolidated company uses. The CODM measures the performance of each segment based on several metrics, including earnings from operations. The CODM uses these results, in part, to evaluate the performance of, and to allocate resources to each of the segments.
Segment revenue includes revenues from sales to external customers and intersegment revenues that reflect transactions between the segments on an arm's-length basis. Intersegment revenues primarily consist of sales of hardware and software that are sourced internally and, in the majority of the cases, are financed as operating leases by FS to our customers. Hewlett Packard Enterprise's consolidated net revenue is derived and reported after the elimination of intersegment revenues from such arrangements.
Financing interest in the Consolidated Statements of Earnings reflects interest expense on borrowing and funding-related activity associated with FS and its subsidiaries, and debt issued by Hewlett Packard Enterprise for which a portion of the proceeds benefited FS.
Hewlett Packard Enterprise does not allocate to its segments certain operating expenses, which it manages at the corporate level. These unallocated costs include certain corporate costs and eliminations, stock-based compensation expense related to corporate and certain global functions, amortization of intangible assets, impairment of goodwill, restructuring charges, transformation costs, disaster (recoveries) charges, acquisition, disposition and other related charges, separation costs, defined benefit plan remeasurement benefit.
80
HEWLETT PACKARD ENTERPRISE COMPANY AND SUBSIDIARIES
Notes to Consolidated Financial Statements (Continued)
Segment Organizational Changes
Effective at the beginning of the first quarter of fiscal 2019, the Company implemented organizational changes to align its segment financial reporting more closely with its current business structure. These organizational changes primarily include: (i) the transfer of the data center networking ("DC Networking") business, which was previously reported within the Hybrid IT Product business unit in the Hybrid IT segment, to the HPE Aruba Product and HPE Aruba Services business units within the Intelligent Edge segment; (ii) the transfer of the edge compute business, which was previously reported within the HPE Aruba Product business unit in the Intelligent Edge segment, to the Hybrid IT Product business unit within the Hybrid IT segment; and (iii) the transfer of the CMS business, which was previously reported within the HPE Pointnext business unit in the Hybrid IT segment, to the Corporate Investments segment.
The Company reflected these changes to its segment information retrospectively to the earliest period presented, which primarily resulted in the transfer of net revenue and operating profit for each of the businesses as described above.
These changes had no impact on Hewlett Packard Enterprise's previously reported consolidated GAAP net earnings or GAAP net earnings per share ("EPS").
Effective November 1, 2019, the Company will report the following four new reportable segments: Compute; High Performance Compute ("HPC") & Mission Critical Servers ("MCS"); Storage, and Advisory & Professional Services ("A&PS"). As a result of this change, Operational Services, which was previously reported within HPE Pointnext Services, will be reported within each of the related individual new segments. The Intelligent Edge, Financial Services and Corporate Investments segments will remain largely unchanged.
Segment Operating Results
Hybrid IT | Intelligent Edge | Financial Services | Corporate Investments | Total | |||||||||||||||
In millions | |||||||||||||||||||
2019 | |||||||||||||||||||
Net revenue | $ | $ | $ | $ | $ | ||||||||||||||
Intersegment net revenue | |||||||||||||||||||
Total segment net revenue | $ | $ | $ | $ | $ | ||||||||||||||
Segment earnings (loss) from operations | $ | $ | $ | $ | ( | ) | $ | ||||||||||||
2018 | |||||||||||||||||||
Net revenue | $ | $ | $ | $ | $ | ||||||||||||||
Intersegment net revenue | |||||||||||||||||||
Total segment net revenue | $ | $ | $ | $ | $ | ||||||||||||||
Segment earnings (loss) from operations | $ | $ | $ | $ | ( | ) | $ | ||||||||||||
2017 | |||||||||||||||||||
Net revenue | $ | $ | $ | $ | $ | ||||||||||||||
Intersegment net revenue(1) | ( | ) | |||||||||||||||||
Total segment net revenue | $ | $ | $ | $ | $ | ||||||||||||||
Segment earnings (loss) from operations | $ | $ | $ | $ | ( | ) | $ | ||||||||||||
(1) | For the periods prior to the Everett and Seattle Transactions presented above, the amounts include the elimination of pre-separation intercompany sales to the former ES and Software segments, which are included within Net loss from discontinued operations in the Consolidated Statements of Earnings. |
81
HEWLETT PACKARD ENTERPRISE COMPANY AND SUBSIDIARIES
Notes to Consolidated Financial Statements (Continued)
The reconciliation of segment operating results to Hewlett Packard Enterprise consolidated results was as follows:
For the fiscal years ended October 31, | |||||||||||
2019 | 2018 | 2017 | |||||||||
In millions | |||||||||||
Net Revenue: | |||||||||||
Total segments | $ | $ | $ | ||||||||
Elimination of intersegment net revenue | ( | ) | ( | ) | ( | ) | |||||
Total Hewlett Packard Enterprise consolidated net revenue | $ | $ | $ | ||||||||
Earnings before taxes:(1) | |||||||||||
Total segment earnings from operations | $ | $ | $ | ||||||||
Unallocated corporate costs and eliminations | ( | ) | ( | ) | ( | ) | |||||
Unallocated stock-based compensation expense | ( | ) | ( | ) | ( | ) | |||||
Amortization of intangible assets | ( | ) | ( | ) | ( | ) | |||||
Impairment of goodwill | ( | ) | |||||||||
Restructuring charges | ( | ) | ( | ) | |||||||
Transformation costs | ( | ) | ( | ) | ( | ) | |||||
Disaster recoveries (charges) | ( | ) | |||||||||
Acquisition, disposition and other related charges(2) | ( | ) | ( | ) | ( | ) | |||||
Separation costs | ( | ) | ( | ) | |||||||
Defined benefit plan remeasurement benefit | |||||||||||
Interest and other, net | ( | ) | ( | ) | ( | ) | |||||
Tax indemnification adjustments | ( | ) | ( | ) | |||||||
Non-service net periodic benefit credit | |||||||||||
Earnings (loss) from equity interests | ( | ) | |||||||||
Total Hewlett Packard Enterprise consolidated earnings from continuing operations before taxes | $ | $ | $ | ||||||||
(1) | Effective at the beginning of the first quarter of fiscal 2019, in connection with the adoption of the accounting standards update for retirement benefits (Topic 715), the Company reclassified its non-service net periodic benefit credit from operating expense to other income and expense in its Consolidated Statements of Earnings. The Company reflected these changes retrospectively, by transferring the non-service net periodic benefit credit, a portion of which was previously allocated to the segments, and the remainder of which was reported within Unallocated corporate costs and eliminations, Restructuring charges, Transformation costs, Separation costs and Defined benefit plan remeasurement benefit. |
(2) | Includes acquisition, disposition and other related charges of $ |
Segment Assets
Hewlett Packard Enterprise allocates assets to its business segments based on the segments primarily benefiting from the assets. Total assets by segment and the reconciliation of segment assets to Hewlett Packard Enterprise consolidated assets were as follows:
82
HEWLETT PACKARD ENTERPRISE COMPANY AND SUBSIDIARIES
Notes to Consolidated Financial Statements (Continued)
As of October 31, | |||||||
2019 | 2018 | ||||||
In millions | |||||||
Hybrid IT | $ | $ | |||||
Intelligent Edge | |||||||
Financial Services | |||||||
Corporate Investments | |||||||
Corporate and unallocated assets | |||||||
Total Hewlett Packard Enterprise consolidated assets | $ | $ | |||||
Major Customers
No single customer represented 10% or more of Hewlett Packard Enterprise's total net revenue in any fiscal year presented.
Geographic Information
Net revenue by country is based upon the sales location that predominately represents the customer location. For each of the fiscal years of 2019, 2018 and 2017, other than the U.S., no country represented more than 10% of Hewlett Packard Enterprise's net revenue.
Net revenue by country in which Hewlett Packard Enterprise operates was as follows:
For the fiscal years ended October 31, | |||||||||||
2019 | 2018 | 2017 | |||||||||
In millions | |||||||||||
Americas | |||||||||||
U.S. | $ | $ | $ | ||||||||
Americas excluding U.S. | |||||||||||
Total Americas | |||||||||||
Europe, Middle East and Africa | |||||||||||
Asia Pacific and Japan | |||||||||||
Total Hewlett Packard Enterprise consolidated net revenue | $ | $ | $ | ||||||||
Net property, plant and equipment by country in which Hewlett Packard Enterprise operates was as follows:
As of October 31, | |||||||
2019 | 2018 | ||||||
In millions | |||||||
U.S. | $ | $ | |||||
Other countries | |||||||
Total net property, plant and equipment | $ | $ | |||||
83
HEWLETT PACKARD ENTERPRISE COMPANY AND SUBSIDIARIES
Notes to Consolidated Financial Statements (Continued)
Net revenue by segment and business unit was as follows:
For the fiscal years ended October 31, | |||||||||||
2019 | 2018 | 2017 | |||||||||
In millions | |||||||||||
Hybrid IT | |||||||||||
Hybrid IT Product | |||||||||||
Compute | $ | $ | $ | ||||||||
Storage | |||||||||||
Total Hybrid IT Product | |||||||||||
HPE Pointnext | |||||||||||
Total Hybrid IT | |||||||||||
Intelligent Edge | |||||||||||
HPE Aruba Product | |||||||||||
HPE Aruba Services | |||||||||||
Total Intelligent Edge | |||||||||||
Financial Services | |||||||||||
Corporate Investments | |||||||||||
Total segment net revenue | |||||||||||
Eliminations of intersegment net revenue | ( | ) | ( | ) | ( | ) | |||||
Total net revenue | $ | $ | $ | ||||||||
Note 4: Restructuring
Summary of Restructuring Plans
Restructuring charges of $19 million and $417 million were recorded by the Company during fiscal 2018 and 2017, respectively, based on restructuring activities impacting the Company's employees and infrastructure. For fiscal 2017, $388 million was recorded within Restructuring charges, and $29 million was recorded within Non-service net periodic benefit credit in the Consolidated Statements of Earnings. Restructuring charges of $251 million for fiscal 2017 are included in Net loss from discontinued operations in the Consolidated Statements of Earnings. For details on restructuring charges related to HPE Next, see Note 5, "HPE Next".
84
HEWLETT PACKARD ENTERPRISE COMPANY AND SUBSIDIARIES
Notes to Consolidated Financial Statements (Continued)
Restructuring activities related to the Company's employees and infrastructure, summarized by plan, are presented in the table below:
Fiscal 2015 Plan | Fiscal 2012 Plan | ||||||||||||||||||
Employee Severance | Infrastructure and other | Employee Severance and EER | Infrastructure and other | Total | |||||||||||||||
In millions | |||||||||||||||||||
Liability as of October 31, 2016 | $ | $ | $ | $ | $ | ||||||||||||||
Charges | |||||||||||||||||||
Cash payments | ( | ) | ( | ) | ( | ) | ( | ) | ( | ) | |||||||||
Non-cash items | ( | ) | ( | ) | ( | ) | ( | ) | |||||||||||
Liability as of October 31, 2017 | $ | $ | $ | $ | $ | ||||||||||||||
Charges | ( | ) | ( | ) | |||||||||||||||
Cash payments | ( | ) | ( | ) | ( | ) | ( | ) | |||||||||||
Non-cash items | ( | ) | ( | ) | ( | ) | |||||||||||||
Liability as of October 31, 2018 | $ | $ | $ | $ | $ | ||||||||||||||
Cash payments | ( | ) | ( | ) | ( | ) | ( | ) | |||||||||||
Non-cash items | ( | ) | ( | ) | ( | ) | |||||||||||||
Liability as of October 31, 2019 | $ | $ | $ | $ | $ | ||||||||||||||
Total costs incurred to date as of October 31, 2019 | $ | $ | $ | $ | $ | ||||||||||||||
Total expected costs to be incurred as of October 31, 2019 | $ | $ | $ | $ | $ | ||||||||||||||
The current restructuring liability related to the plans in the table above, reported in Accrued restructuring in the Consolidated Balance Sheets as of October 31, 2019 and 2018, was $31 million and $53 million, respectively. The non-current restructuring liability related to the plans in the table above, reported in Other non-current liabilities in the Consolidated Balance Sheets as of October 31, 2019 and 2018, was $13 million and $31 million, respectively.
Fiscal 2015 Restructuring Plan
On September 14, 2015, former Parent's Board of Directors approved a restructuring plan (the "2015 Plan") in connection with the Separation. As a result of the Everett and Seattle Transactions, cost amounts and total headcount exits were revised. As such, as of October 31, 2018, the Company had eliminated 8,300 positions as part of the 2015 Plan. As of October 31, 2018, the plan was complete, with no further positions being eliminated. The Company recognized $829 million in total aggregate charges in connection with the 2015 Plan, of which $751 million related to workforce reductions and $78 million primarily related to real estate consolidation and asset impairments. The severance- and infrastructure-related cash payments associated with the 2015 Plan are expected to be paid out through fiscal 2022.
Fiscal 2012 Restructuring Plan
On May 23, 2012, former Parent adopted a multi-year restructuring plan (the "2012 Plan") designed to simplify business processes, accelerate innovation and deliver better results for customers, employees and stockholders. As a result of the Everett and Seattle Transactions, cost amounts and total headcount exits were revised. As such, as of October 31, 2018, the Company had eliminated 10,300 positions, with a portion of those employees exiting the Company as part of voluntary enhanced early retirement ("EER") programs in the U.S. and in certain other countries. As of October 31, 2018, the plan was complete, with no further positions being eliminated. The Company recognized $1.4 billion in total aggregate charges in connection with the 2012 Plan, of which approximately $1.3 billion related to workforce reductions, including the EER programs, and $145 million related to infrastructure, including data center and real estate consolidation and other items. The severance- and infrastructure-related cash payments associated with the 2012 Plan are expected to be paid out through fiscal 2022.
85
HEWLETT PACKARD ENTERPRISE COMPANY AND SUBSIDIARIES
Notes to Consolidated Financial Statements (Continued)
Note 5: HPE Next
Transformation Costs
The HPE Next initiative is expected to be implemented through fiscal 2020, during which time the Company expects to incur expenses for workforce reductions, to upgrade and simplify its IT infrastructure, and for other non-labor actions. These costs will be partially offset by proceeds received from real estate sales.
During fiscal 2019, 2018 and 2017 the Company incurred $462 million, $425 million and $359 million, respectively, in net charges associated with the HPE Next initiative. For fiscal 2019 and 2018, $453 million and $414 million were recorded within Transformation costs, and $9 million and $11 million were recorded within Non-service net periodic benefit credit in the Consolidated Statements of Earnings, respectively. Additionally, in fiscal 2018 the Company incurred $20 million of transformation costs related to cumulative translation adjustments as a result of country exits associated with HPE Next which was recorded within Interest and other, net in the Consolidated Statements of Earnings.
A summary of Transformation Costs was as follows:
Fiscal years ended October 31, | |||||||||||
2019 | 2018 | 2017 | |||||||||
In millions | |||||||||||
Program management | $ | $ | $ | ||||||||
IT costs | |||||||||||
Restructuring charges(1) | |||||||||||
Gains on real estate sales | ( | ) | ( | ) | ( | ) | |||||
Impairment on real estate assets | |||||||||||
Other | |||||||||||
Total Transformation Costs | $ | $ | $ | ||||||||
(1) | For fiscal 2019 and 2018, a portion of these costs were recorded in Non-service net periodic benefit credit in the Consolidated Statements of Earnings as described above. |
On October 16, 2017, the Company's Board of Directors approved a restructuring plan in connection with the HPE Next initiative (the "HPE Next Plan") and on September 20, 2018, the Company's Board of Directors approved a revision to that restructuring plan. As a result of the revision to the plan, cost amounts and total headcount exits were revised and the completion of the workforce reductions was extended to fiscal 2020. The changes to the workforce will vary by country, based on business needs, local legal requirements and consultations with employee work councils and other employee representatives, as appropriate. As of October 31, 2019, the Company estimates that it will incur aggregate pre-tax charges of approximately $1.4 billion through fiscal 2020 in connection with the HPE Next Plan, of which approximately $1.2 billion relates to workforce reductions and approximately $180 million relates to infrastructure, primarily real estate site exits.
HPE Next Plan restructuring activities related to the Company's employees and infrastructure, are presented in the table below:
86
HEWLETT PACKARD ENTERPRISE COMPANY AND SUBSIDIARIES
Notes to Consolidated Financial Statements (Continued)
Employee Severance | Infrastructure and other | ||||||
In millions | |||||||
Liability as of October 31, 2016 | $ | $ | |||||
Charges | |||||||
Liability as of October 31, 2017 | $ | $ | |||||
Charges | |||||||
Cash payments | ( | ) | ( | ) | |||
Non-cash items | ( | ) | ( | ) | |||
Liability as of October 31, 2018 | $ | $ | |||||
Charges | |||||||
Cash payments | ( | ) | ( | ) | |||
Non-cash items | ( | ) | ( | ) | |||
Liability as of October 31, 2019 | $ | $ | |||||
Total costs incurred to date as of October 31, 2019 | $ | $ | |||||
Total expected costs to be incurred as of October 31, 2019 | $ | $ | |||||
The current restructuring liability related to the HPE Next Plan, reported in Accrued restructuring in the Consolidated Balance Sheets at October 31, 2019 and 2018, was $164 million and $241 million, respectively. The non-current restructuring liability related to the HPE Next Plan, reported in Other non-current liabilities in the Consolidated Balance Sheets as of October 31, 2019 and 2018 was $56 million and $83 million, respectively.
Note 6: Retirement and Post-Retirement Benefit Plans
Defined Benefit Plans
The Company sponsors defined benefit pension plans worldwide, the most significant of which are the United Kingdom ("UK") and Germany. The pension plan in the UK is closed to new entrants, however, members continue to earn benefit accruals. This plan provides benefits based on final pay and years of service and generally requires contributions from members. The German pension program that is open to new hires consists of cash balance plans that provide employer credits as a percentage of pay, certain employee pay deferrals and employer matching contributions. There also are previously closed German pension programs that include cash balance and final average pay plans. These previously closed pension programs comprise the majority of the pension obligations in Germany.
Prior to the Everett and Seattle Transactions, the Company went through an analysis to determine which defined benefit plans would be assigned to either the Company or to Everett or Seattle. The Company's plans either transferred in their entirety to Everett or Seattle, remained in their entirety with the Company, or were split, thus resulting in the transfer of plan assets and liabilities between existing and newly created plans. The Everett plans were legally established in the first and second quarter of fiscal 2017 and transferred and reported as discontinued operations in the second quarter of fiscal 2017. The Seattle plans were legally established in the third quarter of fiscal 2017 and transferred and reported as discontinued operations in the fourth quarter of fiscal 2017. In fiscal 2017, as a result of the Everett and Seattle Transactions, the Company transferred out plan assets of $8.3 billion, a benefit obligation of $8.1 billion and an accumulated other comprehensive loss of $1.9 billion.
Post-Retirement Benefit Plans
The Company sponsors retiree health and welfare benefit plans, the most significant of which is in the U.S. Generally, employees hired before August 2008 are eligible for employer credits under the Hewlett Packard Enterprise Retirement Medical Savings Account Plan (“RMSA”) upon attaining age 45. Employer credits to the RMSA available after September 2008 are provided in the form of matching credits on employee contributions made to a voluntary employee beneficiary association. Upon retirement, employees may use these employer credits for the reimbursement of certain eligible medical expenses.
As a result of the Everett and Seattle Transactions, any employees who were involuntarily terminated during fiscal 2017 were fully vested in their RMSA balances and are able to take a distribution out of their plan balances.
87
HEWLETT PACKARD ENTERPRISE COMPANY AND SUBSIDIARIES
Notes to Consolidated Financial Statements (Continued)
Defined Contribution Plans
The Company offers various defined contribution plans for U.S. and non-U.S. employees. The Company's defined contribution expense was approximately $181 million in fiscal 2019, $158 million in fiscal 2018 and $157 million in fiscal 2017. U.S. employees are automatically enrolled in the Hewlett Packard Enterprise Company 401(k) Plan ("HPE 401(k) Plan"), when they meet eligibility requirements, unless they decline participation. Effective January 1, 2018, the HPE 401(k) Plan's quarterly employer matching contributions are 100 % of an employee's contributions, up to a maximum of 4 % of eligible compensation. In calendar year 2017, the annual employer matching contributions in the HPE 401(k) Plan were 50 % of an employee's contributions, up to a maximum of 6 % of eligible compensation.
As a result of the Everett and Seattle Transactions, any plan participants who were involuntarily terminated during fiscal 2017 were fully vested in their Company matching contributions and earnings thereon, and are able to take a distribution out of their plan balances.
Pension Benefit Expense
The Company's net pension and post-retirement benefit costs that were directly attributable to the eligible employees, retirees and other former employees of Hewlett Packard Enterprise and recognized in the Consolidated Statements of Earnings for fiscal 2019, 2018 and 2017 are presented in the table below.
As of October 31, | |||||||||||||||||||||||
2019 | 2018 | 2017 | 2019 | 2018 | 2017 | ||||||||||||||||||
Defined Benefit Plans | Post-Retirement Benefit Plans | ||||||||||||||||||||||
In millions | |||||||||||||||||||||||
Service cost | $ | $ | $ | $ | $ | $ | |||||||||||||||||
Interest cost(1) | |||||||||||||||||||||||
Expected return on plan assets(1) | ( | ) | ( | ) | ( | ) | ( | ) | ( | ) | ( | ) | |||||||||||
Amortization and deferrals(1): | |||||||||||||||||||||||
Actuarial loss (gain) | ( | ) | ( | ) | ( | ) | |||||||||||||||||
Prior service benefit | ( | ) | ( | ) | ( | ) | |||||||||||||||||
Net periodic benefit cost | ( | ) | |||||||||||||||||||||
Curtailment gain(1) | ( | ) | ( | ) | |||||||||||||||||||
Settlement loss(1) | |||||||||||||||||||||||
Special termination benefits(1) | |||||||||||||||||||||||
Plan credit allocation(2) | ( | ) | ( | ) | |||||||||||||||||||
Net benefit (credit) cost from continuing operations(3) | ( | ) | |||||||||||||||||||||
Summary of net benefit (credit) cost: | |||||||||||||||||||||||
Continuing operations | ( | ) | |||||||||||||||||||||
Discontinued operations | |||||||||||||||||||||||
Total net benefit (credit) cost | $ | $ | ( | ) | $ | $ | $ | $ | |||||||||||||||
(1) | These non-service components of net periodic benefit cost were included in Non-service net periodic benefit credit in the Consolidated Statements of Earnings. |
(2) | Plan credit allocation represents the net cost impact of employees of HPE covered under Everett or Seattle plans and employees of Everett or Seattle covered under HPE plans. |
(3) | Net benefit cost from continuing operations for the Company's U.S. defined benefit plans, included in the table above, was not material for fiscal 2019, 2018 and 2017. |
88
HEWLETT PACKARD ENTERPRISE COMPANY AND SUBSIDIARIES
Notes to Consolidated Financial Statements (Continued)
The weighted-average assumptions used to calculate the net benefit (credit) cost from continuing operations in the table above for fiscal 2019, 2018 and 2017 were as follows:
As of October 31, | |||||||||||||||||
2019 | 2018 | 2017 | 2019 | 2018 | 2017 | ||||||||||||
Defined Benefit Plans | Post-Retirement Benefit Plans | ||||||||||||||||
Discount rate used to determine benefit obligation | % | % | % | % | % | % | |||||||||||
Discount rate used to determine service cost | % | % | % | % | % | % | |||||||||||
Discount rate used to determine interest cost | % | % | % | % | % | % | |||||||||||
Expected increase in compensation levels | % | % | % | ||||||||||||||
Expected long-term return on plan assets | % | % | % | % | % | % | |||||||||||
To estimate the service and interest cost components of net periodic benefit cost for defined benefit plans that use the yield curve approach, which represent substantially all of the Company's defined benefit plans, the Company has elected to use a full yield curve approach in the estimation of these components of benefit cost by applying the specific spot rates along the yield curve used in the determination of the benefit obligation to the relevant projected cash flows.
89
HEWLETT PACKARD ENTERPRISE COMPANY AND SUBSIDIARIES
Notes to Consolidated Financial Statements (Continued)
Funded Status
The funded status of the plans was as follows:
As of October 31, | |||||||||||||||
2019 | 2018 | 2019 | 2018 | ||||||||||||
Defined Benefit Plans | Post-Retirement Benefit Plans | ||||||||||||||
In millions | |||||||||||||||
Change in fair value of plan assets: | |||||||||||||||
Fair value—beginning of year | $ | $ | $ | $ | |||||||||||
Transfers | ( | ) | |||||||||||||
Addition/deletion of plans(1) | ( | ) | |||||||||||||
Actual return on plan assets | |||||||||||||||
Employer contributions | |||||||||||||||
Participant contributions | |||||||||||||||
Benefits paid | ( | ) | ( | ) | ( | ) | ( | ) | |||||||
Settlement | ( | ) | ( | ) | |||||||||||
Currency impact | ( | ) | |||||||||||||
Fair value—end of year(2) | $ | $ | $ | $ | |||||||||||
Change in benefit obligation: | |||||||||||||||
Projected benefit obligation—beginning of year | $ | $ | $ | $ | |||||||||||
Transfers | ( | ) | |||||||||||||
Addition/deletion of plans(1) | ( | ) | |||||||||||||
Service cost | |||||||||||||||
Interest cost | |||||||||||||||
Participant contributions | |||||||||||||||
Actuarial (gain) loss | ( | ) | ( | ) | |||||||||||
Benefits paid | ( | ) | ( | ) | ( | ) | ( | ) | |||||||
Plan amendments | |||||||||||||||
Curtailment | ( | ) | |||||||||||||
Settlement | ( | ) | ( | ) | |||||||||||
Special termination benefits | |||||||||||||||
Currency impact | ( | ) | ( | ) | ( | ) | ( | ) | |||||||
Projected benefit obligation—end of year(2) | $ | $ | $ | $ | |||||||||||
Funded status at end of year | $ | ( | ) | $ | ( | ) | $ | ( | ) | $ | ( | ) | |||
Accumulated benefit obligation | $ | $ | $ | $ | |||||||||||
(1) | Includes the addition/deletion of plans resulting from acquisitions. Fiscal 2018 amounts relate primarily to the addition of a Belgium plan. |
(2) | As of October 31, 2019 and 2018, the Company's U.S. defined benefit plans had |
The weighted-average assumptions used to calculate the projected benefit obligations were as follows:
As of October 31, | |||||||||||
2019 | 2018 | 2019 | 2018 | ||||||||
Defined Benefit Plans | Post-Retirement Benefit Plans | ||||||||||
Discount rate | % | % | % | % | |||||||
Expected increase in compensation levels | % | % | |||||||||
90
HEWLETT PACKARD ENTERPRISE COMPANY AND SUBSIDIARIES
Notes to Consolidated Financial Statements (Continued)
The net amounts recognized for defined benefit and post-retirement benefit plans in the Company's Consolidated Balance Sheets were as follows:
As of October 31, | |||||||||||||||
2019 | 2018 | 2019 | 2018 | ||||||||||||
Defined Benefit Plans | Post-Retirement Benefit Plans | ||||||||||||||
In millions | |||||||||||||||
Non-current assets | $ | $ | $ | $ | |||||||||||
Current liabilities | ( | ) | ( | ) | ( | ) | ( | ) | |||||||
Non-current liabilities | ( | ) | ( | ) | ( | ) | ( | ) | |||||||
Funded status at end of year | $ | ( | ) | $ | ( | ) | $ | ( | ) | $ | ( | ) | |||
The following table summarizes the pre-tax net actuarial loss and prior service benefit recognized in Accumulated other comprehensive loss for the defined benefit plans:
As of October 31, 2019 | |||||||
Defined Benefit Plans | Post-Retirement Benefit Plans | ||||||
In millions | |||||||
Net actuarial loss | $ | $ | |||||
Prior service benefit | ( | ) | |||||
Total recognized in accumulated other comprehensive loss | $ | $ | |||||
The following table summarizes the net actuarial loss and prior service benefit for plans that are expected to be amortized from Accumulated other comprehensive loss and recognized as components of net periodic benefit cost (credit) during the next fiscal year.
As of October 31, 2019 | |||||||
Defined Benefit Plans | Post-Retirement Benefit Plans | ||||||
In millions | |||||||
Net actuarial loss (gain) | $ | $ | ( | ) | |||
Prior service benefit | ( | ) | |||||
Total expected to be recognized in net periodic benefit cost (credit) | $ | $ | ( | ) | |||
Defined benefit plans with projected benefit obligations exceeding the fair value of plan assets were as follows:
As of October 31, | |||||||
2019 | 2018 | ||||||
In millions | |||||||
Aggregate fair value of plan assets | $ | $ | |||||
Aggregate projected benefit obligation | $ | $ | |||||
Defined benefit plans with accumulated benefit obligations exceeding the fair value of plan assets were as follows:
As of October 31, | |||||||
2019 | 2018 | ||||||
In millions | |||||||
Aggregate fair value of plan assets | $ | $ | |||||
Aggregate accumulated benefit obligation | $ | $ | |||||
91
HEWLETT PACKARD ENTERPRISE COMPANY AND SUBSIDIARIES
Notes to Consolidated Financial Statements (Continued)
Fair Value of Plan Assets
The Company pays the U.S. defined benefit plan obligations when they come due since these plans are unfunded. The table below sets forth the fair value of non-U.S. defined benefit plan assets by asset category within the fair value hierarchy as of October 31, 2019 and 2018.
As of October 31, 2019 | As of October 31, 2018 | ||||||||||||||||||||||||||||||
Level 1 | Level 2 | Level 3 | Total | Level 1 | Level 2 | Level 3 | Total | ||||||||||||||||||||||||
In millions | |||||||||||||||||||||||||||||||
Asset Category: | |||||||||||||||||||||||||||||||
Equity securities | |||||||||||||||||||||||||||||||
U.S. | $ | $ | $ | $ | $ | $ | $ | $ | |||||||||||||||||||||||
Non-U.S. | |||||||||||||||||||||||||||||||
Non-U.S. at NAV(1) | |||||||||||||||||||||||||||||||
Debt securities | |||||||||||||||||||||||||||||||
Corporate | |||||||||||||||||||||||||||||||
Government(2) | |||||||||||||||||||||||||||||||
Government at NAV(3) | |||||||||||||||||||||||||||||||
Alternative investments | |||||||||||||||||||||||||||||||
Private Equity | |||||||||||||||||||||||||||||||
Hybrids(4) | |||||||||||||||||||||||||||||||
Hybrids at NAV(5) | |||||||||||||||||||||||||||||||
Common Contractual Funds at NAV(6) | |||||||||||||||||||||||||||||||
Equities at NAV | |||||||||||||||||||||||||||||||
Fixed Income at NAV | |||||||||||||||||||||||||||||||
Emerging Markets at NAV | |||||||||||||||||||||||||||||||
Alternative investments at NAV | |||||||||||||||||||||||||||||||
Real Estate Funds | |||||||||||||||||||||||||||||||
Insurance Group Annuity Contracts | |||||||||||||||||||||||||||||||
Cash and Cash Equivalents | |||||||||||||||||||||||||||||||
Other(7) | |||||||||||||||||||||||||||||||
Obligation to return cash received from repurchase agreements(2) | ( | ) | ( | ) | ( | ) | ( | ) | |||||||||||||||||||||||
Total | $ | $ | $ | $ | $ | $ | $ | $ | |||||||||||||||||||||||
(1) | In fiscal 2018, included various worldwide equity index funds with the objective to provide returns that are consistent with the FTSE All World indexes. While the funds were not publicly traded, the custodians stroke a net asset value at least monthly. There were no redemption restrictions or future commitments on these investments. The funds were liquidated during fiscal year 2019. |
(2) | Repurchase agreements, primarily in the UK, represent the plans' short-term borrowing to hedge against interest rate and inflation risks. Investments in approximately $ |
(3) | Includes a fund that invests in various government bonds issued by worldwide governments, interest rate swaps, and cash, to match or slightly outperform the benchmark of the future liabilities of the funds. While the funds are not publicly traded, the custodians strike a net asset value daily. There are no redemption restrictions or future commitments on these investments. |
(4) | Includes funds, primarily in the UK, that invest in both private and public equities, as well as emerging markets across all sectors. The funds also hold fixed income and derivative instruments to hedge interest rate and inflation risk. In addition, the funds include units in transferable securities, collective investment schemes, money market funds, asset-backed income, private debt, cash, and deposits. |
92
HEWLETT PACKARD ENTERPRISE COMPANY AND SUBSIDIARIES
Notes to Consolidated Financial Statements (Continued)
(5) | Includes pooled funds that invest in asset-backed securities awaiting investment into non-liquid secured income opportunities. Units are available for subscription on the first day of each calendar month at net asset value. There are no redemption restrictions or future commitments on these investments. |
(6) | HPE Invest Common Contractual Funds (CCFs) are investment arrangements in which institutional investors pool their assets. Units may be acquired in four different sub-funds focused on equities, fixed income, alternative investments, and emerging markets. Each sub-fund is invested in accordance with the fund’s investment objective and units are issued in relation to each sub-fund. While the sub-funds are not publicly traded, the custodian strikes a net asset value either once or twice a month, depending on the sub-fund. There are no redemption restrictions or future commitments on these investments. |
(7) | Includes international insured contracts, derivative instruments, mortgage backed securities, and unsettled transactions. |
Post-retirement benefit plan assets of $54 million and $52 million as of October 31, 2019 and 2018, respectively, were invested in publicly traded registered investment entities and were classified within Level 1 of the fair value hierarchy.
Changes in fair value measurements of Level 3 investments for the non-U.S. defined benefit plans were as follows:
Fiscal year ended October 31, 2019 | ||||||||||||||||||||||
Alternative Investments | ||||||||||||||||||||||
Private Equity | Hybrids | Real Estate Funds | Insurance Group Annuities | Other | Total | |||||||||||||||||
In millions | ||||||||||||||||||||||
Balance at beginning of year | $ | $ | $ | $ | $ | $ | ||||||||||||||||
Actual return on plan assets: | ||||||||||||||||||||||
Relating to assets held at the reporting date | ||||||||||||||||||||||
Relating to assets sold during the period | ||||||||||||||||||||||
Purchases, sales, and settlements | ( | ) | ||||||||||||||||||||
Transfers in and/or out of Level 3 | ||||||||||||||||||||||
Balance at end of year | $ | $ | $ | $ | $ | $ | ||||||||||||||||
Fiscal year ended October 31, 2018 | ||||||||||||||||||||||
Alternative Investments | ||||||||||||||||||||||
Private Equity | Hybrids | Real Estate Funds | Insurance Group Annuities | Other | Total | |||||||||||||||||
In millions | ||||||||||||||||||||||
Balance at beginning of year | $ | $ | $ | $ | $ | $ | ||||||||||||||||
Actual return on plan assets: | ||||||||||||||||||||||
Relating to assets held at the reporting date | ( | ) | ||||||||||||||||||||
Relating to assets sold during the period | ||||||||||||||||||||||
Purchases, sales, and settlements | ( | ) | ( | ) | ( | ) | ||||||||||||||||
Transfers in and/or out of Level 3 | ||||||||||||||||||||||
Balance at end of year | $ | $ | $ | $ | $ | $ | ||||||||||||||||
The following is a description of the valuation methodologies used to measure plan assets at fair value.
Investments in publicly traded equity securities are valued using the closing price on the measurement date as reported on the stock exchange on which the individual securities are traded. For corporate, government backed debt securities, and some other investments, fair value is based on observable inputs of comparable market transactions. The valuation of certain real estate funds, insurance group annuity contracts and alternative investments, such as limited partnerships and joint ventures, may require significant management judgment. The valuation is generally based on fair value as reported by the asset manager and adjusted for cash flows, if necessary. In making such an assessment, a variety of factors are reviewed by management, including, but are not limited to, the timeliness of fair value as reported by the asset manager and changes in general economic and market conditions subsequent to the last fair value reported by the asset manager. Cash and cash equivalents includes money market funds, which
93
HEWLETT PACKARD ENTERPRISE COMPANY AND SUBSIDIARIES
Notes to Consolidated Financial Statements (Continued)
are valued based on cost, which approximates fair value. Other than those assets that have quoted prices from an active market, investments are generally classified in Level 2 or Level 3 of the fair value hierarchy based on the lowest level input that is significant to the fair value measure in its entirety. Investments measured using net asset value as a practical expedient are not categorized within the fair value hierarchy.
Plan Asset Allocations
The weighted-average target and actual asset allocations across the benefit plans at the respective measurement dates for the non-U.S. defined benefit plans were as follows:
Defined Benefit Plans | ||||||||
Plan Assets | ||||||||
Asset Category | 2019 Target Allocation | 2019 | 2018 | |||||
Public equity securities | % | % | ||||||
Private/hybrid equity securities | % | % | ||||||
Real estate and other | % | % | ||||||
Equity-related investments | % | % | % | |||||
Debt securities | % | % | % | |||||
Cash and cash equivalents | % | % | % | |||||
Total | % | % | % | |||||
For the Company's post-retirement benefit plans, 100 % of the plan assets are invested in cash and cash equivalents.
Investment Policy
The Company's investment strategy is to seek a competitive rate of return relative to an appropriate level of risk depending on the funded status of each plan and the timing of expected benefit payments. The majority of the plans' investment managers employ active investment management strategies with the goal of outperforming the broad markets in which they invest. Risk management practices include diversification across asset classes and investment styles and periodic rebalancing toward asset allocation targets. A number of the plans' investment managers are authorized to utilize derivatives for investment or liability exposures, and the Company may utilize derivatives to effect asset allocation changes or to hedge certain investment or liability exposures.
Asset allocation decisions are typically made by an independent board of trustees for the specific plan. Investment objectives are designed to generate returns that will enable the plan to meet its future obligations. In some countries, local regulations may restrict asset allocations, typically leading to a higher percentage of investment in fixed income securities than would otherwise be deployed. The Company reviews the investment strategy and provides a recommended list of investment managers for each country plan, with final decisions on asset allocation and investment managers made by the board of trustees or investment committees for the specific plan.
Basis for Expected Long-Term Rate of Return on Plan Assets
The expected long-term rate of return on plan assets reflects the expected returns for each major asset class in which the plan invests and the weight of each asset class in the target mix. Expected asset returns reflect the current yield on government bonds, risk premiums for each asset class and expected real returns, which considers each country's specific inflation outlook. Because the Company's investment policy is to employ primarily active investment managers who seek to outperform the broader market, the expected returns are adjusted to reflect the expected additional returns, net of fees.
Employer Contributions and Funding Policy
During fiscal 2019, the Company contributed approximately $166 million to its non-U.S. pension plans and paid $5 million to cover benefit claims under the Company's post-retirement benefit plans.
During fiscal 2020, the Company expects to contribute approximately $182 million to its non-U.S. pension plans. In addition, the Company expects to contribute approximately $2 million to cover benefit payments to U.S. non-qualified plan participants. The Company expects to pay approximately $6 million to cover benefit claims for its post-retirement benefit plans. The Company's
94
HEWLETT PACKARD ENTERPRISE COMPANY AND SUBSIDIARIES
Notes to Consolidated Financial Statements (Continued)
policy is to fund its pension plans so that it makes at least the minimum contribution required by local government, funding and taxing authorities.
Estimated Future Benefits Payments
As of October 31, 2019, estimated future benefits payments for the Company's retirement plans were as follows:
Fiscal year | Defined Benefit Plans | Post-Retirement Benefit Plans | |||||
In millions | |||||||
2020 | $ | $ | |||||
2021 | |||||||
2022 | |||||||
2023 | |||||||
2024 | |||||||
Next five fiscal years to October 31, 2029 | |||||||
Note 7: Stock-Based Compensation
Prior to the Separation, certain of the Company's employees participated in stock-based compensation plans sponsored by former Parent ("former Parent's Plans"). In conjunction with the Separation, the Company adopted the Hewlett Packard Enterprise Company 2015 Stock Incentive Plan (the "Plan"). The Plan became effective on November 1, 2015. The total number of shares of the Company’s common stock authorized under the Plan was 260 million. On January 25, 2017, the Company amended the Plan and reduced the authorized shares of common stock to 210 million shares. In connection with the Everett and Seattle Transactions, the number of shares of the Company's common stock authorized for issuance under the Plan increased by 67 million. The Plan provides for the grant of various types of awards including restricted stock awards, stock options, and performance-based awards. These awards generally vest over three years from the grant date. The Company's stock-based incentive compensation program also includes various equity plans assumed through acquisitions under which stock-based awards are outstanding.
In connection with the Separation, the Company granted one-time retention stock awards, with a total grant date fair value of approximately $137 million, to certain executives in the first quarter of fiscal 2016. These awards generally vest over three years from the grant date.
Stock-Based Compensation Expense
Stock-based compensation expense and the resulting tax benefits were as follows:
Fiscal years ended October 31, | |||||||||||
2019 | 2018 | 2017 | |||||||||
In millions | |||||||||||
Stock-based compensation expense from continuing operations | $ | $ | $ | ||||||||
Income tax benefit | ( | ) | ( | ) | ( | ) | |||||
Stock-based compensation expense from continuing operations, net of tax | $ | $ | $ | ||||||||
Stock-based compensation expense from discontinued operations | $ | $ | $ | ||||||||
95
HEWLETT PACKARD ENTERPRISE COMPANY AND SUBSIDIARIES
Notes to Consolidated Financial Statements (Continued)
Stock-based compensation expense from continuing operations as presented in the table above is recorded within the following cost and expense lines in the Consolidated Statement of Earnings.
For the fiscal years ended October 31, | |||||||||||
2019 | 2018 | 2017 | |||||||||
In millions | |||||||||||
Cost of sales | $ | $ | $ | ||||||||
Research and development | |||||||||||
Selling, general and administrative | |||||||||||
Restructuring charges | |||||||||||
Transformation costs | |||||||||||
Acquisition, disposition and other related charges | |||||||||||
Separation costs | |||||||||||
Stock-based compensation expense from continuing operations | $ | $ | $ | ||||||||
In May 2016, in connection with the announcement of the Everett Transaction, the Company modified its stock-based compensation program such that certain unvested equity awards outstanding on May 24, 2016 would vest upon the earlier of: (i) the termination of an employee’s employment with HPE as a direct result of an announced sale, divestiture or spin-off of a subsidiary, division or other business; (ii) the termination of an employee’s employment with HPE without cause; or (iii) June 1, 2018. This modification also included changes to the performance and market conditions of certain performance-based awards. The incremental expense arising from this modification was not material. Additionally, as a result of the accelerated vesting related to this modification, the Company incurred stock-based compensation expense of $126 million during fiscal 2017, of which $92 million was recorded in Net loss from discontinued operations in the Consolidated Statement of Earnings for the fiscal year ended October 31, 2017. The remaining $34 million arising from the acceleration for fiscal 2017 was recorded within Separation costs in the Consolidated Statement of Earnings. The stock-based compensation expense arising from the acceleration for fiscal 2018 was not material.
Additionally, as permitted by the Plan, in connection with the Everett and Seattle Transactions and in accordance with the respective Employee Matters Agreements, HPE made certain post-spin adjustments to the exercise price and number of stock-based compensation awards with the intention of preserving the intrinsic value of the outstanding awards prior to the close of the transactions. The incremental expense incurred by the Company related to the Everett and Seattle Transactions was not material.
Employee Stock Purchase Plan
Effective November 1, 2015, the Company adopted the Hewlett Packard Enterprise Company 2015 Employee Stock Purchase Plan ("ESPP"). The total number of shares of Company's common stock authorized under the ESPP was 80 million. The ESPP allows eligible employees to contribute up to 10 % of their eligible compensation to purchase Hewlett Packard Enterprise's common stock. The ESPP provides for a discount not to exceed 15 % and an offering period up to 24 months. The Company currently offers 6 -month offering periods during which employees have the ability to purchase shares at 95 % of the closing market price on the purchase date. No stock-based compensation expense was recorded in connection with those purchases, as the criteria of a non-compensatory plan were met.
Restricted Stock Units
Restricted stock units have forfeitable dividend equivalent rights equal to the dividend paid on common stock. Restricted stock units do not have the voting rights of common stock, and the shares underlying restricted stock units are not considered issued and outstanding upon grant. The fair value of the restricted stock units is the closing price of the Company's common stock on the grant date of the award. The Company expenses the fair value of restricted stock units ratably over the period during which the restrictions lapse. The Company also issues performance-adjusted restricted stock units ("PARSU") that vest only on the satisfaction of service, performance and market conditions. The Company estimates the fair value of PARSUs subject to performance-contingent vesting conditions using the Monte Carlo simulation model.
96
HEWLETT PACKARD ENTERPRISE COMPANY AND SUBSIDIARIES
Notes to Consolidated Financial Statements (Continued)
The following table summarizes restricted stock unit activity:
Fiscal years ended October 31, | ||||||||||||||||||||
2019 | 2018 | 2017 | ||||||||||||||||||
Shares | Weighted- Average Grant Date Fair Value Per Share | Shares | Weighted- Average Grant Date Fair Value Per Share | Shares | Weighted- Average Grant Date Fair Value Per Share | |||||||||||||||
In thousands | In thousands | In thousands | ||||||||||||||||||
Outstanding at beginning of year | $ | $ | $ | |||||||||||||||||
Granted and assumed through acquisition(1) | $ | $ | $ | |||||||||||||||||
Additional shares granted due to post-spin adjustments(2) | $ | $ | $ | |||||||||||||||||
Vested(3) | ( | ) | $ | ( | ) | $ | ( | ) | $ | |||||||||||
Forfeited/canceled | ( | ) | $ | ( | ) | $ | ( | ) | $ | |||||||||||
Outstanding at end of year | $ | $ | $ | |||||||||||||||||
(1) | Fiscal 2017 includes approximately |
(2) | Additional shares granted as a result of the post-spin exercise price adjustments made related to the Everett and Seattle Transactions, as permitted by the Plan, in order to preserve the intrinsic value of outstanding awards prior to the close of the transactions. |
(3) | Fiscal 2018 includes approximately |
Stock Options
Stock options granted under the Plan are generally non-qualified stock options, but the Plan permits some options granted to qualify as incentive stock options under the U.S. Internal Revenue Code. The exercise price of a stock option is equal to the closing price of the Company's common stock on the option grant date. The majority of the stock options issued by the Company contain only service vesting conditions. The Company has also issued performance-contingent stock options that vest only on the satisfaction of both service and market conditions. In fiscal 2018 and 2019, the Company did not issue stock options.
Fiscal year ended October 31, 2017 | |||
Weighted-average fair value(1) | $ | ||
Expected volatility(2) | % | ||
Risk-free interest rate(3) | % | ||
Expected dividend yield(4) | % | ||
Expected term in years(5) | |||
(1) | The weighted-average fair value was based on the fair value of stock options granted under the Plan during the respective periods. |
(2) | Expected volatility was estimated using the average historical volatility of selected peer companies. |
(3) | The risk-free interest rate was estimated based on the yield on U.S. Treasury zero-coupon issues. |
97
HEWLETT PACKARD ENTERPRISE COMPANY AND SUBSIDIARIES
Notes to Consolidated Financial Statements (Continued)
(4) | The expected dividend yield represents a constant dividend yield applied for the duration of the expected term of the option. |
(5) | For options granted subject to service-based vesting, the expected term was estimated using the simplified method detailed in SEC Staff Accounting Bulletin No. 110. |
The following table summarizes stock option activity:
Fiscal years ended October 31, | ||||||||||||||||||||||||||||||||||||||
2019 | 2018 | 2017 | ||||||||||||||||||||||||||||||||||||
Shares | Weighted- Average Exercise Price | Weighted- Average Remaining Contractual Term | Aggregate Intrinsic Value | Shares | Weighted- Average Exercise Price | Weighted- Average Remaining Contractual Term | Aggregate Intrinsic Value | Shares | Weighted- Average Exercise Price | Weighted- Average Remaining Contractual Term | Aggregate Intrinsic Value | |||||||||||||||||||||||||||
In thousands | In years | In millions | In thousands | In years | In millions | In thousands | In years | In millions | ||||||||||||||||||||||||||||||
Outstanding at beginning of year | $ | $ | $ | |||||||||||||||||||||||||||||||||||
Granted and assumed through acquisition | $ | $ | $ | |||||||||||||||||||||||||||||||||||
Additional shares granted due to post-spin adjustments(1) | $ | $ | $ | |||||||||||||||||||||||||||||||||||
Exercised | ( | ) | $ | ( | ) | $ | ( | ) | $ | |||||||||||||||||||||||||||||
Forfeited/canceled/expired(2) | ( | ) | $ | ( | ) | $ | ( | ) | $ | |||||||||||||||||||||||||||||
Outstanding at end of year(3) | $ | $ | $ | $ | $ | $ | ||||||||||||||||||||||||||||||||
Vested and expected to vest at end of year(3) | $ | $ | $ | $ | $ | $ | ||||||||||||||||||||||||||||||||
Exercisable at end of year(3) | $ | $ | $ | $ | $ | $ | ||||||||||||||||||||||||||||||||
(1) | Additional shares granted as a result of the post-spin exercise price adjustments made related to the Everett and Seattle Transactions, as permitted by the Plan, in order to preserve the intrinsic value of the awards prior to the close of the transaction. |
(2) | Fiscal 2017 includes approximately |
(3) | The weighted average exercise price reflects the impact of the post-spin adjustments to the exercise price related to the Everett and Seattle Transactions. |
The aggregate intrinsic value in the table above represents the total pre-tax intrinsic value that option holders would have realized had all option holders exercised their options on the last trading day of fiscal 2019, 2018 and 2017, respectively. The aggregate intrinsic value is the difference between the Company's closing common stock price on the last trading day of the respective fiscal year and the exercise price, multiplied by the number of in-the-money options. The total intrinsic value of options exercised in fiscal 2019, 2018 and 2017 was $49 million, $200 million and $218 million, respectively.
98
HEWLETT PACKARD ENTERPRISE COMPANY AND SUBSIDIARIES
Notes to Consolidated Financial Statements (Continued)
Note 8: Taxes on Earnings
Provision for Taxes
The domestic and foreign components of earnings (loss) from continuing operations before taxes were as follows:
For the fiscal years ended October 31, | |||||||||||
2019 | 2018 | 2017 | |||||||||
In millions | |||||||||||
U.S.(1) | $ | ( | ) | $ | ( | ) | $ | ( | ) | ||
Non-U.S.(1) | |||||||||||
$ | $ | $ | |||||||||
(1) | Fiscal 2017 amount has been reclassified to conform with the current period presentation. |
The provision (benefit) for taxes on earnings from continuing operations were as follows:
For the fiscal years ended October 31, | |||||||||||
2019 | 2018 | 2017 | |||||||||
In millions | |||||||||||
U.S. federal taxes: | |||||||||||
Current | $ | ( | ) | $ | ( | ) | $ | ||||
Deferred | ( | ) | |||||||||
Non-U.S. taxes: | |||||||||||
Current | |||||||||||
Deferred | ( | ) | |||||||||
State taxes: | |||||||||||
Current | ( | ) | ( | ) | |||||||
Deferred | ( | ) | |||||||||
$ | $ | ( | ) | $ | ( | ) | |||||
The differences between the U.S. federal statutory income tax rate and the Company's effective tax rate were as follows:
For the fiscal years ended October 31, | ||||||||
2019 | 2018 | 2017 | ||||||
U.S. federal statutory income tax rate | % | % | % | |||||
State income taxes, net of federal tax benefit | ( | )% | % | % | ||||
Lower rates in other jurisdictions, net | ( | )% | ( | )% | ( | )% | ||
Valuation allowance | % | ( | )% | % | ||||
U.S. permanent differences | % | % | % | |||||
Uncertain tax positions | ( | )% | ( | )% | ( | )% | ||
Impacts of the Tax Act(1) | % | % | % | |||||
Other, net | ( | )% | % | ( | )% | |||
% | ( | )% | ( | )% | ||||
(1) | Impacts of the Tax Act is inclusive of valuation allowances recorded as a result of the U.S. law change under SAB 118. |
In fiscal 2019, the Company recorded $152 million of net income tax charges related to items unique to the year. These amounts primarily included $488 million of net income tax charges related to changes in U.S. federal and state valuation allowances
99
HEWLETT PACKARD ENTERPRISE COMPANY AND SUBSIDIARIES
Notes to Consolidated Financial Statements (Continued)
primarily as a result of impacts of the Tax Act and $40 million of income tax charges related to future withholding costs on potential intercompany distributions of earnings, the effects of which were partially offset by $274 million of income tax benefits related to the change in pre-Separation tax liabilities for which the Company shared joint and several liability with HP Inc., and $104 million of income tax benefits on transformation costs, and acquisition, disposition and other related charges.
In fiscal 2018, the Company recorded $2.0 billion of net income tax benefits related to items unique to the year. These amounts primarily included $2.0 billion of income tax benefits related to the settlement of certain pre-Separation tax liabilities for which the Company shared joint and several liability with HP Inc. and for which the Company was partially indemnified by HP Inc. under the Tax Matters Agreement, $208 million of income tax benefits related to Everett pre-divestiture tax matters and valuation allowances, $125 million of income tax benefits on restructuring charges, separation costs, transformation costs and acquisition and other related charges and $65 million of net excess tax benefits related to stock-based compensation, the effects of which were partially offset by $422 million of income tax charges related to impacts of the Tax Act. In addition, the Company recorded $5.0 billion of certain foreign loss carryforwards and U.S. domestic capital losses carryforwards against which a full valuation allowance was recorded; the effective tax rate above reflects this activity on a net basis.
In fiscal 2017, the Company recorded $554 million of net income tax benefits related to items unique to the year. These amounts primarily included $699 million of income tax benefits in connection with the Everett and Seattle Transactions and $326 million of income tax benefits on restructuring charges, separation costs, transformation costs and acquisition and other related charges, the effects of which were partially offset by $473 million of income tax charges to record valuation allowances on U.S. state deferred tax assets, and $88 million of income tax charges related to pre-Separation tax matters.
As a result of certain employment actions and capital investments the Company has undertaken, income from manufacturing and services in certain countries is subject to reduced tax rates through 2024. The gross income tax benefits attributable to these actions and investments were $837 million ($0.61 diluted net EPS) in fiscal 2019, $792 million ($0.51 diluted net EPS) in fiscal 2018 and $378 million ($0.23 diluted net EPS) in fiscal 2017. Refer to Note 17, "Net Earnings Per Share" for details on shares used to compute diluted net EPS.
Recent Tax Legislation
The Tax Act required the Company to incur a one-time Transition Tax on deferred foreign income not previously subject to U.S. income tax at a rate of 15.5% for foreign cash and certain other net current assets and 8.0% on the remaining income. No cash payment was required for Transition Tax due to the availability of sufficient tax credits to offset the liability. The GILTI and BEAT provisions of the Tax Act became effective for the Company beginning November 1, 2018.
The Company has an October 31 fiscal year end; therefore, the lower corporate tax rate enacted by the Tax Act was phased in, resulting in a U.S. statutory federal rate of 23.3 % for the fiscal year ending October 31, 2018 and 21.0 % for the current and subsequent fiscal years.
The Company completed its accounting for the tax effects of the Tax Act based on currently available legislative and regulatory updates in the first quarter of fiscal 2019, resulting in an additional tax charge of $426 million. This amount includes $438 million of income tax charges relating to additional valuation allowances against certain U.S. federal deferred tax assets, $56 million of income tax benefits resulting from the release of valuation allowances against certain U.S. state deferred tax assets, an additional $7 million of Transition Tax charges and $37 million of income tax charges related to future withholding tax costs on potential intercompany distributions of earnings. The Company has elected to treat taxes due on future GILTI inclusions in U.S. taxable income as a current period expense when incurred.
100
HEWLETT PACKARD ENTERPRISE COMPANY AND SUBSIDIARIES
Notes to Consolidated Financial Statements (Continued)
Uncertain Tax Positions
A reconciliation of unrecognized tax benefits is as follows:
As of October 31, | |||||||||||
2019 | 2018 | 2017 | |||||||||
In millions | |||||||||||
Balance at beginning of year | $ | $ | $ | ||||||||
Increases: | |||||||||||
For current year's tax positions | |||||||||||
For prior years' tax positions | |||||||||||
Decreases: | |||||||||||
For prior years' tax positions | ( | ) | ( | ) | ( | ) | |||||
Statute of limitations expiration | ( | ) | ( | ) | ( | ) | |||||
Settlements with taxing authorities | ( | ) | ( | ) | ( | ) | |||||
Settlements related to joint and several positions of former Parent | ( | ) | ( | ) | |||||||
Balance at end of year | $ | $ | $ | ||||||||
Up to $772 million, $1.1 billion and $3.0 billion of Hewlett Packard Enterprise's unrecognized tax benefits at October 31, 2019, 2018 and 2017, respectively, would affect the Company's effective tax rate if realized. The $6.6 billion decrease in the amount of unrecognized tax benefits for the year ended October 31, 2019, is primarily related to the settlement of certain pre-Separation tax liabilities of HP Inc. for which the Company shared joint and several liability and for which the Company was partially indemnified by HP Inc. The Company continues to record $131 million of pre-Separation unrecognized state tax positions, inclusive of interest and penalties, for which it is joint and severally liable and continues to be indemnified under the Termination and Mutual Release Agreement. The $274 million of joint and several income tax benefits recognized in the Company's effective tax rate includes interest, penalties, and offsetting benefits not included in the table above.
The $2.4 billion decrease in the amount of unrecognized tax benefits for the year ended October 31, 2018, is primarily related to the settlement of certain pre-Separation tax liabilities for which the Company shared joint and several liability with HP Inc. and for which the Company was partially indemnified by HP Inc. under the Tax Matters Agreement. The $2.0 billion of income tax benefits recognized in the Company's effective tax rate includes interest, penalties, and offsetting benefits not included in the table above.
Hewlett Packard Enterprise recognizes interest income from favorable settlements and interest expense and penalties accrued on unrecognized tax benefits in (Provision) benefit for taxes in the Consolidated Statements of Earnings. The Company recognized interest and penalties related to uncertain tax positions of $13 million, $161 million, and $89 million in fiscal 2019, 2018, and 2017, respectively. As of October 31, 2019 and 2018, the Company had accrued $129 million and $142 million, respectively, for interest and penalties in the Consolidated Balance Sheets.
Hewlett Packard Enterprise engages in continuous discussion and negotiation with taxing authorities regarding tax matters in various jurisdictions. Hewlett Packard Enterprise does not expect complete resolution of any U.S. Internal Revenue Service ("IRS") audit cycle within the next 12 months. However, it is reasonably possible that certain federal, foreign and state tax issues may be concluded in the next 12 months, including issues involving resolution of certain intercompany transactions, joint and several tax liabilities and other matters. Accordingly, Hewlett Packard Enterprise believes it is reasonably possible that its existing unrecognized tax benefits may be reduced by an amount up to $56 million within the next 12 months.
Hewlett Packard Enterprise is subject to income tax in the U.S. and approximately 95 other countries and is subject to routine corporate income tax audits in many of these jurisdictions.
With the resolution of the 2013 through 2015 IRS tax audits of its former parent in fiscal 2019, Hewlett Packard Enterprise is no longer subject to U.S. federal tax audits for years prior to 2016. With respect to major state and foreign tax jurisdictions, HPE is no longer subject to tax authority examinations for years prior to 2005.
Hewlett Packard Enterprise is joint and severally liable for certain pre-Separation state tax liabilities of HP Inc. HP Inc. is subject to numerous ongoing audits by state tax authorities.
101
HEWLETT PACKARD ENTERPRISE COMPANY AND SUBSIDIARIES
Notes to Consolidated Financial Statements (Continued)
Hewlett Packard Enterprise believes it has provided adequate reserves for all tax deficiencies or reductions in tax benefits that could result from federal, state and foreign tax audits. The Company regularly assesses the likely outcomes of these audits in order to determine the appropriateness of the Company's tax provision. The Company adjusts its uncertain tax positions to reflect the impact of negotiations, settlements, rulings, advice of legal counsel, and other information and events pertaining to a particular audit. However, income tax audits are inherently unpredictable and there can be no assurance that the Company will accurately predict the outcome of these audits. The amounts ultimately paid on resolution of an audit could be materially different from the amounts previously included in the provision for taxes and therefore the resolution of one or more of these uncertainties in any particular period could have a material impact on net earnings or cash flows.
Hewlett Packard Enterprise has not provided for U.S. federal and state income and foreign withholding taxes on $10.2 billion of undistributed earnings and basis differences from non-U.S. operations as of October 31, 2019 because the Company intends to reinvest such earnings indefinitely outside of the U.S. Determination of the amount of unrecognized deferred tax liability related to these earnings and basis differences is not practicable. The Company will remit non-indefinitely reinvested earnings of its non-U.S. subsidiaries for which deferred U.S. state income and foreign withholding taxes have been provided where excess cash has accumulated and the Company determines that it is advantageous for business operations, tax or cash management reasons.
Deferred Income Taxes
Deferred income taxes result from temporary differences between the amount of assets and liabilities recognized for financial reporting and tax purposes.
The significant components of deferred tax assets and deferred tax liabilities were as follows:
As of October 31, | |||||||
2019 | 2018 | ||||||
In millions | |||||||
Deferred tax assets: | |||||||
Loss and credit carry-forwards | $ | $ | |||||
Inventory valuation | |||||||
Intercompany prepayments | |||||||
Other intercompany transactions | |||||||
Warranty | |||||||
Employee and retiree benefits | |||||||
Restructuring | |||||||
Deferred revenue | |||||||
Intangible assets | |||||||
Other | |||||||
Total deferred tax assets | |||||||
Valuation allowance | ( | ) | ( | ) | |||
Total deferred tax assets net of valuation allowance | |||||||
Deferred tax liabilities: | |||||||
Unremitted earnings of foreign subsidiaries | ( | ) | ( | ) | |||
Fixed assets | ( | ) | ( | ) | |||
Total deferred tax liabilities | ( | ) | ( | ) | |||
Net deferred tax assets and liabilities | $ | $ | |||||
102
HEWLETT PACKARD ENTERPRISE COMPANY AND SUBSIDIARIES
Notes to Consolidated Financial Statements (Continued)
As of October 31, | |||||||
2019 | 2018 | ||||||
In millions | |||||||
Long-term deferred tax assets | $ | $ | |||||
Long-term deferred tax liabilities | ( | ) | ( | ) | |||
Net deferred tax assets net of deferred tax liabilities | $ | $ | |||||
As of October 31, 2019, the Company had $783 million, $3.0 billion and $21.8 billion of federal, state and foreign net operating loss carryforwards, respectively. Amounts included in federal, state and foreign net operating loss carryforwards will begin to expire in years 2030, 2020, and 2021, respectively. Hewlett Packard Enterprise has provided a valuation allowance of $154 million and $4.6 billion for deferred tax assets related to state and foreign net operating losses carryforwards, respectively. As of October 31, 2019, the Company also had $6.0 billion, $5.6 billion, and $34 million of federal, state, and foreign capital loss carryforwards, respectively. Amounts included in federal and state capital loss carryforwards will begin to expire in 2023; foreign capital losses can carry forward indefinitely. Hewlett Packard Enterprise has provided a valuation allowance of $1.3 billion, $189 million, and $9 million for deferred tax assets related to federal, state, and foreign capital loss carryforwards, respectively.
As of October 31, 2019, Hewlett Packard Enterprise had recorded deferred tax assets for various tax credit carryforwards as follows:
Carryforward | Valuation Allowance | Initial Year of Expiration | |||||||
In millions | |||||||||
U.S. foreign tax credits | $ | $ | ( | ) | 2026 | ||||
U.S. research and development and other credits | ( | ) | 2021 | ||||||
Tax credits in state and foreign jurisdictions | ( | ) | 2022 | ||||||
Balance at end of year | $ | $ | ( | ) | |||||
Deferred Tax Asset Valuation Allowance
The deferred tax asset valuation allowance and changes were as follows:
As of October 31, | |||||||||||
2019 | 2018 | 2017 | |||||||||
In millions | |||||||||||
Balance at beginning of year | $ | $ | $ | ||||||||
Income tax expense | ( | ) | ( | ) | |||||||
Income tax expense related to the Tax Act | |||||||||||
Valuation allowance offsetting current activity | ( | ) | |||||||||
Other comprehensive income, currency translation and charges to other accounts | ( | ) | ( | ) | |||||||
Balance at end of year | $ | $ | $ | ||||||||
Total valuation allowances increased by $16 million in fiscal 2019, due primarily to the increases in valuation allowance recorded against U.S. foreign tax credit carryforwards as a result of the Tax Act. These were offset by partial state valuation allowance releases as a result of newly enacted state legislation and decreases as a result of remeasurement of the deferred tax assets on certain foreign loss carryforwards against which valuation allowances are required.
Total valuation allowances increased by $5.4 billion in fiscal 2018 due primarily to the increases in certain foreign loss carryforwards recognized in the current year and increases in U.S. domestic capital loss carryforwards recognized in the current year against which valuation allowances were required, and a partial valuation allowance recorded against U.S. foreign tax credit carryforwards as a result of the Tax Act. These were offset by partial valuation allowance releases against loss carryforwards in certain foreign jurisdictions due to law changes.
103
HEWLETT PACKARD ENTERPRISE COMPANY AND SUBSIDIARIES
Notes to Consolidated Financial Statements (Continued)
Tax Matters Agreement and Other Income Tax Matters
In connection with the Separation, the Company entered into a Tax Matters Agreement with HP Inc., which was terminated with the Termination and Mutual Release Agreement in fiscal 2019. In connection with the Everett and Seattle Transactions, the Company entered into a DXC Tax Matters Agreement with DXC and a Micro Focus Tax Matters Agreement with Micro Focus, respectively. See Note 19, "Guarantees, Indemnifications and Warranties", for a description of the Tax Matters Agreement, DXC Tax Matters Agreement and Micro Focus Tax Matters Agreement.
Note 9: Balance Sheet Details
Balance sheet details were as follows:
Cash, Cash Equivalents and Restricted Cash
As of October 31, | |||||||
2019 | 2018 | ||||||
In millions | |||||||
Cash and cash equivalents | $ | $ | |||||
Restricted cash | |||||||
Cash, cash equivalents and restricted cash | $ | $ | |||||
Accounts Receivable, Net
As of October 31, | |||||||
2019 | 2018 | ||||||
In millions | |||||||
Unbilled receivable | $ | $ | |||||
Accounts receivable | |||||||
Allowance for doubtful accounts | ( | ) | ( | ) | |||
Total | $ | $ | |||||
The allowance for doubtful accounts related to accounts receivable and changes therein were as follows:
As of October 31, | |||||||||||
2019 | 2018 | 2017 | |||||||||
In millions | |||||||||||
Balance at beginning of year | $ | $ | $ | ||||||||
Provision for doubtful accounts | |||||||||||
Deductions, net of recoveries | ( | ) | ( | ) | ( | ) | |||||
Balance at end of year | $ | $ | $ | ||||||||
The Company has third-party revolving short-term financing arrangements intended to facilitate the working capital requirements of certain customers. The recourse obligations associated with these short-term financing arrangements as of October 31, 2019 and 2018 were not material.
104
HEWLETT PACKARD ENTERPRISE COMPANY AND SUBSIDIARIES
Notes to Consolidated Financial Statements (Continued)
The activity related to Hewlett Packard Enterprise's revolving short-term financing arrangements was as follows:
As of October 31, | |||||||||||
2019 | 2018 | 2017 | |||||||||
In millions | |||||||||||
Balance at beginning of period(1) | $ | $ | $ | ||||||||
Trade receivables sold | |||||||||||
Cash receipts | ( | ) | ( | ) | ( | ) | |||||
Foreign currency and other | ( | ) | |||||||||
Balance at end of period(1) | $ | ( | ) | $ | $ | ||||||
(1) |
Inventory
As of October 31, | |||||||
2019 | 2018 | ||||||
In millions | |||||||
Finished goods | $ | $ | |||||
Purchased parts and fabricated assemblies | |||||||
Total | $ | $ | |||||
Other Current Assets
As of October 31, | |||||||
2019 | 2018 | ||||||
In millions | |||||||
Value-added taxes receivable | $ | $ | |||||
Short-term tax receivables and prepaid taxes | |||||||
Manufacturer and other receivables | |||||||
Prepaid and other current assets | |||||||
Restricted cash | |||||||
Total | $ | $ | |||||
Property, Plant and Equipment
As of October 31, | |||||||
2019 | 2018 | ||||||
In millions | |||||||
Land | $ | $ | |||||
Buildings and leasehold improvements | |||||||
Machinery and equipment, including equipment held for lease | |||||||
Accumulated depreciation | ( | ) | ( | ) | |||
Total | $ | $ | |||||
Depreciation expense was $2.3 billion, $2.3 billion and $2.2 billion in fiscal 2019, 2018 and 2017, respectively.
105
HEWLETT PACKARD ENTERPRISE COMPANY AND SUBSIDIARIES
Notes to Consolidated Financial Statements (Continued)
Long-Term Financing Receivables and Other Assets
As of October 31, | |||||||
2019 | 2018 | ||||||
In millions | |||||||
Financing receivables, net | $ | $ | |||||
Deferred tax assets | |||||||
Indemnification receivables | |||||||
Prepaid taxes (1) | |||||||
Prepaid pension assets | |||||||
Other | |||||||
Total | $ | $ | |||||
(1) | For the fiscal year ended October 31, 2019, the decrease in prepaid taxes was primarily a result of the adoption of the accounting standard for the recognition of income tax consequences for intra-entity transfers of assets other than inventory. |
Other Accrued Liabilities
As of October 31, | |||||||
2019 | 2018 | ||||||
In millions | |||||||
Accrued taxes - other | $ | $ | |||||
Warranty | |||||||
Sales and marketing programs | |||||||
Other | |||||||
Total | $ | $ | |||||
Other Non-Current Liabilities
As of October 31, | |||||||
2019 | 2018 | ||||||
In millions | |||||||
Pension, post-retirement, and post-employment liabilities | $ | $ | |||||
Deferred revenue | |||||||
Tax liability | |||||||
Other long-term liabilities | |||||||
Total | $ | $ | |||||
Contract Liabilities and Remaining Performance Obligations
Contract liabilities consist of deferred revenue. The aggregate balance of current and non-current deferred revenue was $6.0 billion and $5.8 billion as of October 31, 2019 and October 31, 2018, respectively, which included $113 million and $82 million of deferred revenue related to FS, respectively. Of the deferred revenue balance as of October 31, 2018, approximately $3.1 billion was recognized as revenue during fiscal 2019.
Revenue allocated to remaining performance obligations represents contract work that has not yet been performed and does not include contracts where the customer is not committed. Remaining performance obligations estimates are subject to change and are affected by several factors, including contract terminations, changes in the scope of contracts, adjustments for revenue that has not materialized and adjustments for currency.
106
HEWLETT PACKARD ENTERPRISE COMPANY AND SUBSIDIARIES
Notes to Consolidated Financial Statements (Continued)
Remaining performance obligations consist of deferred revenue. As of October 31, 2019, the aggregate amount of remaining performance obligations was $6.0 billion, approximately 54 % of which we expect to recognize as revenues over the next twelve months with the remainder to be recognized thereafter.
Note 10: Financing Receivables and Operating Leases
Financing receivables represent sales-type and direct-financing leases of the Company and third-party products. These receivables typically have terms ranging from two to five years and are usually collateralized by a security interest in the underlying assets. Financing receivables also include billed receivables from operating leases. The components of financing receivables were as follows:
As of October 31, | |||||||
2019 | 2018 | ||||||
In millions | |||||||
Minimum lease payments receivable | $ | $ | |||||
Unguaranteed residual value | |||||||
Unearned income | ( | ) | ( | ) | |||
Financing receivables, gross | |||||||
Allowance for doubtful accounts | ( | ) | ( | ) | |||
Financing receivables, net | |||||||
Less: current portion(1) | ( | ) | ( | ) | |||
Amounts due after one year, net(1) | $ | $ | |||||
(1) | The Company includes the current portion in Financing receivables, and amounts due after one year, net, in Long-term financing receivables and other assets in the accompanying Consolidated Balance Sheets. |
As of October 31, 2019, scheduled maturities of the Company's minimum lease payments receivable were as follows:
2020 | 2021 | 2022 | 2023 | 2024 | Thereafter | Total | |||||||||||||||||||||
In millions | |||||||||||||||||||||||||||
Scheduled maturities of minimum lease payments receivable | $ | $ | $ | $ | $ | $ | $ | ||||||||||||||||||||
Sale of Financing Receivables
During the fiscal years ended October 31, 2019 and 2018, the Company entered into arrangements to transfer the contractual payments due under certain financing receivables to third party financial institutions, which are accounted for as sales in accordance with Accounting Standards Codification ("ASC") 860 - Transfers and Servicing. The Company derecognizes the carrying value of the receivable transferred and recognizes a net gain or loss on the sale. During the fiscal years ended October 31, 2019 and 2018, the Company sold $185 million and $174 million, respectively, of financing receivables. The gains recognized on the sales of financing receivables were not material for the periods presented.
Credit Quality Indicators
Due to the homogeneous nature of its leasing transactions, the Company manages its financing receivables on an aggregate basis when assessing and monitoring credit risk. Credit risk is generally diversified due to the large number of entities comprising the Company's customer base and their dispersion across many different industries and geographic regions. The Company evaluates the credit quality of an obligor at lease inception and monitors that credit quality over the term of a transaction. The Company assigns risk ratings to each lease based on the creditworthiness of the obligor and other variables that augment or mitigate the inherent credit risk of a particular transaction. Such variables include the underlying value and liquidity of the collateral, the essential use of the equipment, the term of the lease, and the inclusion of credit enhancements, such as guarantees, letters of credit or security deposits.
107
HEWLETT PACKARD ENTERPRISE COMPANY AND SUBSIDIARIES
Notes to Consolidated Financial Statements (Continued)
The credit risk profile of gross financing receivables, based on internal risk ratings, was as follows:
As of October 31, | |||||||
2019 | 2018 | ||||||
In millions | |||||||
Risk Rating: | |||||||
Low | $ | $ | |||||
Moderate | |||||||
High | |||||||
Total | $ | $ | |||||
Accounts rated low risk typically have the equivalent of a Standard & Poor's rating of BBB– or higher, while accounts rated moderate risk generally have the equivalent of BB+ or lower. The Company classifies accounts as high risk when it considers the financing receivable to be impaired or when management believes there is a significant near-term risk of impairment.
Allowance for Doubtful Accounts
The allowance for doubtful accounts for financing receivables is comprised of a general reserve and a specific reserve. The Company maintains general reserve percentages on a regional basis and bases such percentages on several factors, including consideration of historical credit losses and portfolio delinquencies, trends in the overall weighted-average risk rating of the portfolio, current economic conditions and information derived from competitive benchmarking. The Company excludes accounts evaluated as part of the specific reserve from the general reserve analysis. The Company establishes a specific reserve for financing receivables with identified exposures, such as customer defaults, bankruptcy or other events, that make it unlikely the Company will recover its investment. For individually evaluated receivables, the Company determines the expected cash flow for the receivable, which includes consideration of estimated proceeds from disposition of the collateral, and calculates an estimate of the potential loss and the probability of loss. For those accounts where a loss is considered probable, the Company records a specific reserve. The Company generally writes off a receivable or records a specific reserve when a receivable becomes 180 days past due, or sooner if the Company determines that the receivable is not collectible.
The allowance for doubtful accounts related to financing receivables and changes therein were as follows:
As of October 31, | |||||||||||
2019 | 2018 | 2017 | |||||||||
In millions | |||||||||||
Balance at beginning of year | $ | $ | $ | ||||||||
Provision for doubtful accounts | |||||||||||
Write-offs | ( | ) | ( | ) | ( | ) | |||||
Balance at end of year | $ | $ | $ | ||||||||
The gross financing receivables and related allowance evaluated for loss were as follows:
As of October 31, | |||||||
2019 | 2018 | ||||||
In millions | |||||||
Gross financing receivables collectively evaluated for loss | $ | $ | |||||
Gross financing receivables individually evaluated for loss(1) | |||||||
Total | $ | $ | |||||
Allowance for financing receivables collectively evaluated for loss | $ | $ | |||||
Allowance for financing receivables individually evaluated for loss | |||||||
Total | $ | $ | |||||
(1) | Includes billed operating lease receivables and billed and unbilled sales-type and direct-financing lease receivables. |
108
HEWLETT PACKARD ENTERPRISE COMPANY AND SUBSIDIARIES
Notes to Consolidated Financial Statements (Continued)
Non-Accrual and Past-Due Financing Receivables
The Company considers a financing receivable to be past due when the minimum payment is not received by the contractually specified due date. The Company generally places financing receivables on non-accrual status, which is the suspension of interest accrual, and considers such receivables to be non-performing at the earlier of the time at which full payment of principal and interest becomes doubtful or the receivable becomes 90 days past due. Subsequently, the Company may recognize revenue on non-accrual financing receivables as payments are received, which is on a cash basis, if the Company deems the recorded financing receivable to be fully collectible; however, if there is doubt regarding the ultimate collectability of the recorded financing receivable, all cash receipts are applied to the carrying amount of the financing receivable, which is the cost recovery method. In certain circumstances, such as when the Company deems a delinquency to be of an administrative nature, financing receivables may accrue interest after becoming 90 days past due. The non-accrual status of a financing receivable may not impact a customer's risk rating. After all of a customer's delinquent principal and interest balances are settled, the Company may return the related financing receivable to accrual status.
The following table summarizes the aging and non-accrual status of gross financing receivables:
As of October 31, | |||||||
2019 | 2018 | ||||||
In millions | |||||||
Billed:(1) | |||||||
Current 1-30 days | $ | $ | |||||
Past due 31-60 days | |||||||
Past due 61-90 days | |||||||
Past due >90 days | |||||||
Unbilled sales-type and direct-financing lease receivables | |||||||
Total gross financing receivables | $ | $ | |||||
Gross financing receivables on non-accrual status(2) | $ | $ | |||||
Gross financing receivables 90 days past due and still accruing interest(2) | $ | $ | |||||
(1) | Includes billed operating lease receivables and billed sales-type and direct-financing lease receivables. |
(2) | Includes billed operating lease receivables and billed and unbilled sales-type and direct-financing lease receivables. |
Variable Interest Entities
In September 2019, the Company issued asset-backed debt securities under a fixed-term securitization program to private investors. The asset-backed debt securities are collateralized by the U.S. fixed-term financing receivables and leased equipment in the offering, which is held by a Special Purpose Entity (“SPE”). The SPE meets the definition of a Variable Interest Entity and is consolidated, along with the associated debt, into the Consolidated Financial Statements as the Company is the primary beneficiary of the VIE. The SPE is a bankruptcy-remote legal entity with separate assets and liabilities. The purpose of the SPE is to facilitate the funding of customer receivables and leased equipment in the capital markets.
The Company’s risk of loss related to securitized receivables and leased equipment is limited to the amount by which the Company’s right to receive collections for assets securitized exceeds the amount required to pay interest, principal, and fees and expenses related to the asset-backed securities.
109
HEWLETT PACKARD ENTERPRISE COMPANY AND SUBSIDIARIES
Notes to Consolidated Financial Statements (Continued)
The following table presents the assets and liabilities held by the consolidated VIE as of October 31, 2019, which are included in the Consolidated Balance Sheets. The assets in the table below includes those that can be used to settle the obligations of the VIE. Additionally, general Creditors do not have recourse to the assets of the VIE.
As of October 31, 2019 | |||
Assets held by VIE | In millions | ||
Other current assets | $ | ||
Financing receivables | |||
Short-term | $ | ||
Long-term | $ | ||
Property, plant and equipment | $ | ||
Liabilities held by VIE | |||
Notes payable and short-term borrowings, net of unamortized debt issuance costs | $ | ||
Long-term debt, net of unamortized debt issuance costs | $ | ||
Financing receivables transferred via securitization through the SPE was $465 million for the fiscal year ended October 31, 2019. Leased equipment transferred via securitization through the SPE was $327 million for the fiscal year ended October 31, 2019.
Operating Leases
Operating lease assets included in Property, plant and equipment in the Consolidated Balance Sheets were as follows:
As of October 31, | |||||||
2019 | 2018 | ||||||
In millions | |||||||
Equipment leased to customers | $ | $ | |||||
Accumulated depreciation | ( | ) | ( | ) | |||
Total | $ | $ | |||||
As of October 31, 2019, minimum future rentals on non-cancelable operating leases related to leased equipment were as follows:
2020 | 2021 | 2022 | 2023 | 2024 | Thereafter | Total | |||||||||||||||||||||
In millions | |||||||||||||||||||||||||||
Minimum future rentals on non-cancelable operating leases | $ | $ | $ | $ | $ | $ | $ | ||||||||||||||||||||
Note 11: Acquisitions
The purchase price allocations for the acquisitions described below reflect various preliminary fair value estimates and analysis, including preliminary work performed by third-party valuation specialists, of certain tangible assets and liabilities acquired, the valuation of intangible assets acquired, certain legal matters, income and non-income based taxes, and residual goodwill, which are subject to change within the measurement period as valuations are finalized. Measurement period adjustments are recorded in the reporting period in which the estimates are finalized and adjustment amounts are determined.
Pro forma results of operations for these acquisitions have not been presented because they are not material to the Company's consolidated results of operations, either individually or in the aggregate. Goodwill, which represents the excess of the purchase price over the net tangible and intangible assets acquired, is not deductible for tax purposes.
Acquisitions in Fiscal 2019
110
HEWLETT PACKARD ENTERPRISE COMPANY AND SUBSIDIARIES
Notes to Consolidated Financial Statements (Continued)
During fiscal 2019, the Company completed three acquisitions. The following table presents the aggregate purchase price allocation, including those items that were preliminary allocations and subject to change, for the Company's acquisitions for the fiscal year ended October 31, 2019:
In millions | |||
Goodwill | $ | ||
Amortizable intangible assets | |||
In-process research and development | |||
Net tangible assets assumed | |||
Total fair value consideration | $ | ||
On September 25, 2019, the Company completed the acquisition of Cray Inc. ("Cray"), a global supercomputer leader. Cray's results of operations are included within the Hybrid IT segment. The acquisition date fair value consideration of $1.5 billion consisted of cash paid for outstanding common stock, vested in-the-money stock awards and the estimated fair value of earned unvested stock awards assumed by the Company. In connection with this acquisition, the Company recorded approximately $699 million of goodwill, $425 million of intangible assets and $141 million of in-process research and development. The Company is amortizing the intangible assets on a straight-line basis over an estimated weighted-average useful life of four years .
Acquisitions in Fiscal 2018
During fiscal 2018, the Company completed three acquisitions, none of which were material, both individually and in the aggregate, to the Company's Consolidated Financial Statements.
Acquisitions in Fiscal 2017
During fiscal 2017, the Company completed six acquisitions. The following table presents the aggregate purchase price allocation for the Company's acquisitions for the fiscal year ended October 31, 2017:
In millions | |||
Goodwill | $ | ||
Amortizable intangible assets | |||
In-process research and development | |||
Net tangible assets assumed | |||
Total fair value consideration | $ | ||
On April 17, 2017, the Company completed the acquisition of Nimble Storage, a provider of predictive all-flash and hybrid-flash storage solutions. Nimble Storage's results of operations are included within the Hybrid IT segment. The acquisition date fair value consideration of $1.2 billion primarily consisted of cash paid for outstanding common stock, vested in-the-money stock awards, and the estimated fair value of earned unvested stock awards assumed by the Company. In connection with this acquisition, the Company recorded approximately $760 million of goodwill, $291 million of intangible assets, and $31 million of in-process research and development. The Company is amortizing the intangible assets on a straight-line basis over an estimated weighted-average useful life of five years .
On February 17, 2017, the Company completed the acquisition of SimpliVity, a provider of software-defined, hyperconverged infrastructure. SimpliVity's results of operations are included within the Hybrid IT segment. The acquisition date fair value consideration of $651 million primarily consisted of cash paid for outstanding common stock, debt, and the estimated fair value of earned unvested stock awards assumed by the Company. In connection with this acquisition, the Company recorded approximately $443 million of goodwill, $118 million of intangible assets, and $24 million of in-process research and development. The Company is amortizing the intangible assets on a straight-line basis over an estimated weighted-average useful life of five years .
On November 1, 2016, the Company completed the acquisition of SGI, a provider of high-performance solutions for computer data analytics and data management. SGI's results of operations are included within the Hybrid IT segment. The acquisition date
111
HEWLETT PACKARD ENTERPRISE COMPANY AND SUBSIDIARIES
Notes to Consolidated Financial Statements (Continued)
fair value consideration of $349 million consisted of cash paid for outstanding common stock, debt, and the estimated fair value of earned unvested stock awards assumed by the Company. In connection with this acquisition, the Company recorded approximately $75 million of goodwill, $150 million of intangible assets, and $30 million of in-process research and development. The Company is amortizing the intangible assets on a straight-line basis over an estimated weighted-average useful life of five years .
Note 12: Goodwill and Intangible Assets
Goodwill
Goodwill and related changes in the carrying amount by reportable segment were as follows:
Hybrid IT(1) | Intelligent Edge(1) | Financial Services | Corporate Investments(1) | Total | |||||||||||||||
In millions | |||||||||||||||||||
Balance at October 31, 2017 | $ | $ | $ | $ | $ | ||||||||||||||
Goodwill acquired during the period | |||||||||||||||||||
Impairment of goodwill | — | — | ( | ) | ( | ) | |||||||||||||
Changes due to foreign currency | ( | ) | ( | ) | |||||||||||||||
Goodwill adjustments | |||||||||||||||||||
Balance at October 31, 2018 | |||||||||||||||||||
Goodwill acquired during the period | |||||||||||||||||||
Goodwill adjustments | |||||||||||||||||||
Balance at October 31, 2019 | $ | $ | $ | $ | $ | ||||||||||||||
(1) | Effective at the beginning of the first quarter of fiscal 2019, the Company implemented organizational changes to align its segment financial reporting more closely with its current business structure, which are described in detail in Note 3, "Segment Information". Goodwill was reclassified to the respective segments using a relative fair value approach. |
Goodwill Impairments
Goodwill is tested for impairment at the reporting unit level. The Company's reporting units containing goodwill are consistent with the reportable segments identified in Note 3, "Segment Information".
Based on the results of the Company's annual impairment tests in fiscal 2019, 2018 and 2017, the Company determined that no impairment of goodwill existed.
Based on the results of the Company's interim impairment tests in fiscal 2018 it was concluded that the fair value of CMS was less than its carrying amount. Prior to calculating the goodwill impairment loss, the Company analyzed the recoverability of CMS long-lived assets other than goodwill and concluded that those assets were not impaired. As a result, the Company recorded a goodwill impairment charge of $88 million. There is no remaining goodwill in the CMS reporting unit as of October 31, 2018.
112
HEWLETT PACKARD ENTERPRISE COMPANY AND SUBSIDIARIES
Notes to Consolidated Financial Statements (Continued)
Intangible Assets
Intangible assets comprise:
As of October 31, 2019 | As of October 31, 2018 | ||||||||||||||||||||||
Gross | Accumulated Amortization | Net | Gross | Accumulated Amortization | Net | ||||||||||||||||||
In millions | |||||||||||||||||||||||
Customer contracts, customer lists and distribution agreements | $ | $ | ( | ) | $ | $ | $ | ( | ) | $ | |||||||||||||
Developed and core technology and patents | ( | ) | ( | ) | |||||||||||||||||||
Trade name and trade marks | ( | ) | ( | ) | |||||||||||||||||||
In-process research and development | — | — | |||||||||||||||||||||
Total intangible assets | $ | $ | ( | ) | $ | $ | $ | ( | ) | $ | |||||||||||||
For fiscal 2019, the increase in gross intangible assets was due primarily to $606 million of purchases related to acquisitions, partially offset by $117 million of intangible assets which became fully amortized and were eliminated from gross intangible assets and accumulated amortization.
For fiscal 2018, the decrease in gross intangible assets was due primarily to $106 million of intangible assets which became fully amortized and were eliminated from gross intangible assets and accumulated amortization, partially offset by $41 million of purchases related to acquisitions.
The Company reclassified in-process research and development assets acquired of $18 million and $57 million to developed and core technology and patents as the projects were completed, and began amortization during fiscal 2019 and fiscal 2018, respectively.
As of October 31, 2019, the weighted-average remaining useful lives of the Company's finite-lived intangible assets were as follows:
Finite-Lived Intangible Assets | Weighted-Average Remaining Useful Lives |
In years | |
Customer contracts, customer lists and distribution agreements | |
Developed and core technology and patents | |
Trade name and trade marks | |
As of October 31, 2019, estimated future amortization expense related to finite-lived intangible assets was as follows:
Fiscal year | In millions | ||
2020 | $ | ||
2021 | |||
2022 | |||
2023 | |||
2024 | |||
Thereafter | |||
Total | $ | ||
Note 13: Fair Value
Fair value is defined as the price that would be received to sell an asset or paid to transfer a liability (an exit price) in an orderly transaction between market participants at the measurement date.
113
HEWLETT PACKARD ENTERPRISE COMPANY AND SUBSIDIARIES
Notes to Consolidated Financial Statements (Continued)
Fair Value Hierarchy
The Company uses valuation techniques that are based upon observable and unobservable inputs. Observable inputs are developed using market data such as publicly available information and reflect the assumptions market participants would use, while unobservable inputs are developed using the best information available about the assumptions market participants would use. Assets and liabilities are classified in the fair value hierarchy based on the lowest level input that is significant to the fair value measurement:
Level 1—Quoted prices (unadjusted) in active markets for identical assets or liabilities.
Level 2—Quoted prices for similar assets or liabilities in active markets, quoted prices for identical or similar assets or liabilities in markets that are not active, inputs other than quoted prices that are observable for the asset or liability and market-corroborated inputs.
Level 3—Unobservable inputs for the asset or liability.
The fair value hierarchy gives the highest priority to observable inputs and lowest priority to unobservable inputs.
The following table presents the Company's assets and liabilities that are measured at fair value on a recurring basis:
As of October 31, 2019 | As of October 31, 2018 | ||||||||||||||||||||||||||||||
Fair Value Measured Using | Fair Value Measured Using | ||||||||||||||||||||||||||||||
Level 1 | Level 2 | Level 3 | Total | Level 1 | Level 2 | Level 3 | Total | ||||||||||||||||||||||||
In millions | |||||||||||||||||||||||||||||||
Assets | |||||||||||||||||||||||||||||||
Cash Equivalents and Investments: | |||||||||||||||||||||||||||||||
Time deposits | $ | — | $ | $ | — | $ | $ | — | $ | $ | — | $ | |||||||||||||||||||
Money market funds | — | — | — | — | |||||||||||||||||||||||||||
Foreign bonds | — | — | |||||||||||||||||||||||||||||
Other debt securities | — | — | — | — | |||||||||||||||||||||||||||
Derivative Instruments: | |||||||||||||||||||||||||||||||
Interest rate contracts | — | — | — | — | — | — | |||||||||||||||||||||||||
Foreign exchange contracts | — | — | — | — | |||||||||||||||||||||||||||
Other derivatives | — | — | — | — | |||||||||||||||||||||||||||
Total assets | $ | $ | $ | $ | $ | $ | $ | $ | |||||||||||||||||||||||
Liabilities | |||||||||||||||||||||||||||||||
Derivative Instruments: | |||||||||||||||||||||||||||||||
Interest rate contracts | $ | — | $ | $ | — | $ | $ | — | $ | $ | — | $ | |||||||||||||||||||
Foreign exchange contracts | — | — | — | — | |||||||||||||||||||||||||||
Other derivatives | — | — | — | — | |||||||||||||||||||||||||||
Total liabilities | $ | — | $ | $ | — | $ | $ | — | $ | $ | — | $ | |||||||||||||||||||
For the fiscal years ended October 31, 2019 and 2018, there were no transfers between levels within the fair value hierarchy.
Valuation Techniques
Cash Equivalents and Investments: The Company holds time deposits, money market funds, debt securities primarily consisting of corporate and foreign government notes and bonds. The Company values cash equivalents using quoted market prices, alternative pricing sources, including net asset value, or models utilizing market observable inputs. The fair value of debt investments was based on quoted market prices or model-driven valuations using inputs primarily derived from or corroborated by observable market data, and, in certain instances, valuation models that utilize assumptions which cannot be corroborated with observable market data.
114
HEWLETT PACKARD ENTERPRISE COMPANY AND SUBSIDIARIES
Notes to Consolidated Financial Statements (Continued)
Derivative Instruments: The Company uses forward contracts, interest rate and total return swaps to hedge certain foreign currency and interest rate exposures. The Company uses industry standard valuation models to measure fair value. Where applicable, these models project future cash flows and discount the future amounts to present value using market-based observable inputs, including interest rate curves, the Company and counterparties' credit risk, foreign currency exchange rates, and forward and spot prices for currencies and interest rates. See Note 14, "Financial Instruments", for a further discussion of the Company's use of derivative instruments.
Other Fair Value Disclosures
Short- and Long-Term Debt: The Company estimates the fair value of its debt primarily using an expected present value technique, which is based on observable market inputs using interest rates currently available to companies of similar credit standing for similar terms and remaining maturities, and considering its own credit risk. The portion of the Company's debt that is hedged is reflected in the Consolidated Balance Sheets as an amount equal to the debt's carrying amount and a fair value adjustment representing changes in the fair value of the hedged debt obligations arising from movements in benchmark interest rates. At October 31, 2019, the estimated fair value of the Company's short-term and long-term debt was $14.6 billion and the carrying value was $13.8 billion. As of October 31, 2018, the estimated fair value of the Company's short-term and long-term debt was $12.2 billion and the carrying value was $12.1 billion. If measured at fair value in the Consolidated Balance Sheets, short-term and long-term debt would be classified in Level 2 of the fair value hierarchy.
Other Financial Instruments: For the balance of the Company's financial instruments, primarily accounts receivable, accounts payable and financial liabilities included in other accrued liabilities, the carrying amounts approximate fair value due to their short maturities. If measured at fair value in the Consolidated Balance Sheets, these other financial instruments would be classified in Level 2 or Level 3 of the fair value hierarchy.
115
HEWLETT PACKARD ENTERPRISE COMPANY AND SUBSIDIARIES
Notes to Consolidated Financial Statements (Continued)
Note 14: Financial Instruments
Cash Equivalents and Available-for-Sale Investments
Cash equivalents and available-for-sale investments were as follows:
As of October 31, 2019 | As of October 31, 2018 | ||||||||||||||||||||||||||||||
Cost | Gross Unrealized Gains | Gross Unrealized Losses | Fair Value | Cost | Gross Unrealized Gains | Gross Unrealized Losses | Fair Value | ||||||||||||||||||||||||
In millions | |||||||||||||||||||||||||||||||
Cash Equivalents: | |||||||||||||||||||||||||||||||
Time deposits | $ | $ | — | $ | — | $ | $ | $ | — | $ | — | $ | |||||||||||||||||||
Money market funds | — | — | — | — | |||||||||||||||||||||||||||
Total cash equivalents | — | — | — | — | |||||||||||||||||||||||||||
Available-for-Sale Investments: | |||||||||||||||||||||||||||||||
Foreign bonds | — | — | |||||||||||||||||||||||||||||
Other debt securities | — | — | ( | ) | |||||||||||||||||||||||||||
Total available-for-sale investments | ( | ) | |||||||||||||||||||||||||||||
Total cash equivalents and available-for-sale investments | $ | $ | $ | $ | $ | $ | $ | ( | ) | $ | |||||||||||||||||||||
All highly liquid investments with original maturities of three months or less at the date of acquisition are considered cash equivalents. As of October 31, 2019 and 2018, the carrying amount of cash equivalents approximated fair value due to the short period of time to maturity. Interest income related to cash, cash equivalents and debt securities was approximately $64 million in fiscal 2019 and $104 million in fiscal 2018 and 2017. Time deposits were primarily issued by institutions outside the U.S. as of October 31, 2019 and 2018. The estimated fair value of the available-for-sale investments may not be representative of values that will be realized in the future.
Contractual maturities of investments in available-for-sale debt securities were as follows:
As of October 31, 2019 | |||||||
Amortized Cost | Fair Value | ||||||
In millions | |||||||
Due in one to five years | $ | $ | |||||
Due in more than five years | |||||||
$ | $ | ||||||
Equity securities investments in privately held companies are included in Long-term financing receivables and other assets in the Consolidated Balance Sheets. The carrying amount of these without readily determinable fair values amounted to $190 million and $162 million at October 31, 2019 and 2018, respectively.
Investments in equity securities that are accounted for using the equity method are included in Investments in equity interests in the Consolidated Balance Sheets. These amounted to $2.3 billion and $2.4 billion at October 31, 2019 and 2018, respectively. For additional information, see Note 21, "Equity Method Investments".
Derivative Instruments
The Company is a global company exposed to foreign currency exchange rate fluctuations and interest rate changes in the normal course of its business. As part of its risk management strategy, the Company uses derivative instruments, primarily forward contracts, interest rate swaps and total return swaps to hedge certain foreign currency, interest rate and, to a lesser extent, equity exposures. The Company's objective is to offset gains and losses resulting from these exposures with losses and gains on the
116
HEWLETT PACKARD ENTERPRISE COMPANY AND SUBSIDIARIES
Notes to Consolidated Financial Statements (Continued)
derivative contracts used to hedge them, thereby reducing volatility of earnings or protecting the fair value of assets and liabilities. The Company does not have any leveraged derivatives and does not use derivative contracts for speculative purposes. The Company may designate its derivative contracts as fair value hedges, cash flow hedges or hedges of the foreign currency exposure of a net investment in a foreign operation ("net investment hedges"). Additionally, for derivatives not designated as hedging instruments, the Company categorizes those economic hedges as other derivatives. Derivative instruments are recognized at fair value in the Consolidated Balance Sheets. The change in fair value of the derivative instruments is recognized in the Consolidated Statements of Earnings or Consolidated Statements of Comprehensive Income depending upon the type of hedge as further discussed below. The Company classifies cash flows from its derivative programs with the activities that correspond to the underlying hedged items in the Consolidated Statements of Cash Flows.
As a result of its use of derivative instruments, the Company is exposed to the risk that its counterparties will fail to meet their contractual obligations. To mitigate counterparty credit risk, the Company has a policy of only entering into derivative contracts with carefully selected major financial institutions based on their credit ratings and other factors, and the Company maintains dollar risk limits that correspond to each financial institution's credit rating and other factors. The Company's established policies and procedures for mitigating credit risk include reviewing and establishing limits for credit exposure and periodically reassessing the creditworthiness of its counterparties. Master netting agreements also mitigate credit exposure to counterparties by permitting the Company to net amounts due from the Company to a counterparty against amounts due to the Company from the same counterparty under certain conditions.
To further mitigate credit exposure to counterparties, the Company has collateral security agreements, which allows the Company to hold collateral from, or require the Company to post collateral to counterparties when aggregate derivative fair values exceed contractually established thresholds which are generally based on the credit ratings of the Company and its counterparties. If the Company's credit rating falls below a specified credit rating, the counterparty has the right to request full collateralization of the derivatives' net liability position. Conversely, if the counterparty's credit rating falls below a specified credit rating, the Company has the right to request full collateralization of the derivatives' net liability position. Collateral is generally posted within two business days. The fair value of the Company's derivatives with credit contingent features in a net liability position was $18 million and $290 million at October 31, 2019 and 2018, respectively, all of which were fully collateralized within two business days.
Under the Company's derivative contracts, the counterparty can terminate all outstanding trades following a covered change of control event affecting the Company that results in the surviving entity being rated below a specified credit rating. This credit contingent provision did not affect the Company's financial position or cash flows as of October 31, 2019 and 2018.
Fair Value Hedges
The Company issues long-term debt in U.S. dollars based on market conditions at the time of financing. The Company may enter into fair value hedges, such as interest rate swaps, to reduce the exposure of its debt portfolio to changes in fair value resulting from changes in interest rates by achieving a primarily U.S. dollar LIBOR-based floating interest rate. The swap transactions generally involve principal and interest obligations for U.S. dollar-denominated amounts. Alternatively, the Company may choose not to swap fixed for floating interest payments or may terminate a previously executed swap if it believes a larger proportion of fixed-rate debt would be beneficial. When investing in fixed-rate instruments, the Company may enter into interest rate swaps that convert the fixed interest payments into variable interest payments and may designate these swaps as fair value hedges.
For derivative instruments that are designated and qualify as fair value hedges, the Company recognizes the change in fair value of the derivative instrument, as well as the offsetting change in the fair value of the hedged item, in Interest and other, net in the Consolidated Statements of Earnings in the period of change.
Cash Flow Hedges
The Company uses forward contracts designated as cash flow hedges to protect against the foreign currency exchange rate risks inherent in its forecasted net revenue and, to a lesser extent, cost of sales, operating expenses, and intercompany loans denominated in currencies other than the U.S. dollar. The Company's foreign currency cash flow hedges mature generally within twelve months ; however, forward contracts associated with sales-type and direct-financing leases and intercompany loans extend for the duration of the lease or loan term, which can extend up to five years .
The Company uses interest rate contracts designated as cash flow hedges to hedge the variability of cash flows in the interest payments associated with its variable-rate debt due to changes in the U.S. dollar LIBOR-based floating interest rate. The swap transactions generally involve principal and interest obligations for U.S. dollar-denominated amounts.
117
HEWLETT PACKARD ENTERPRISE COMPANY AND SUBSIDIARIES
Notes to Consolidated Financial Statements (Continued)
For derivative instruments that are designated and qualify as cash flow hedges, the Company initially records changes in fair value for the effective portion of the derivative instrument in Accumulated other comprehensive loss as a separate component of equity in the Consolidated Balance Sheets and subsequently reclassifies these amounts into earnings in the period during which the hedged transaction is recognized in earnings. The Company reports the effective portion of its cash flow hedges in the same financial statement line item as changes in the fair value of the hedged item.
Net Investment Hedges
The Company uses forward contracts designated as net investment hedges to hedge net investments in certain foreign subsidiaries whose functional currency is the local currency. The Company records the effective portion of such derivative instruments together with changes in the fair value of the hedged items in cumulative translation adjustment as a separate component of Equity in the Consolidated Balance Sheets.
Other Derivatives
Other derivatives not designated as hedging instruments consist primarily of forward contracts used to hedge foreign currency-denominated balance sheet exposures. The Company also uses total return swaps and, to a lesser extent, interest rate swaps, based on equity or fixed income indices, to hedge its executive deferred compensation plan liability.
For derivative instruments not designated as hedging instruments, the Company recognizes changes in fair value of the derivative instrument, as well as the offsetting change in the fair value of the hedged item, in Interest and other, net in the Consolidated Statements of Earnings in the period of change.
Hedge Effectiveness
For interest rate swaps designated as fair value hedges, the Company measures hedge effectiveness by offsetting the change in fair value of the hedged items with the change in fair value of the derivative. For forward contracts designated as cash flow or net investment hedges, the Company measures hedge effectiveness by comparing the cumulative change in fair value of the hedge contract with the cumulative change in fair value of the hedged item, both of which are based on forward rates. The Company recognizes any ineffective portion of the hedge in the Consolidated Statements of Earnings in the same period in which ineffectiveness occurs. Amounts excluded from the assessment of effectiveness are recognized in the Consolidated Statements of Earnings in the period they arise.
118
HEWLETT PACKARD ENTERPRISE COMPANY AND SUBSIDIARIES
Notes to Consolidated Financial Statements (Continued)
Fair Value of Derivative Instruments in the Consolidated Balance Sheets
The gross notional and fair value of derivative instruments in the Consolidated Balance Sheets was as follows:
As of October 31, 2019 | As of October 31, 2018 | ||||||||||||||||||||||||||||||||||||||
Fair Value | Fair Value | ||||||||||||||||||||||||||||||||||||||
Outstanding Gross Notional | Other Current Assets | Long-Term Financing Receivables and Other Assets | Other Accrued Liabilities | Long-Term Other Liabilities | Outstanding Gross Notional | Other Current Assets | Long-Term Financing Receivables and Other Assets | Other Accrued Liabilities | Long-Term Other Liabilities | ||||||||||||||||||||||||||||||
In millions | |||||||||||||||||||||||||||||||||||||||
Derivatives designated as hedging instruments | |||||||||||||||||||||||||||||||||||||||
Fair value hedges: | |||||||||||||||||||||||||||||||||||||||
Interest rate contracts | $ | $ | — | $ | $ | $ | $ | $ | — | $ | $ | $ | |||||||||||||||||||||||||||
Cash flow hedges: | |||||||||||||||||||||||||||||||||||||||
Foreign currency contracts | |||||||||||||||||||||||||||||||||||||||
Interest rate contracts | |||||||||||||||||||||||||||||||||||||||
Net investment hedges: | |||||||||||||||||||||||||||||||||||||||
Foreign currency contracts | |||||||||||||||||||||||||||||||||||||||
Total derivatives designated as hedging instruments | |||||||||||||||||||||||||||||||||||||||
Derivatives not designated as hedging instruments | |||||||||||||||||||||||||||||||||||||||
Foreign currency contracts | |||||||||||||||||||||||||||||||||||||||
Other derivatives | — | — | |||||||||||||||||||||||||||||||||||||
Total derivatives not designated as hedging instruments | |||||||||||||||||||||||||||||||||||||||
Total derivatives | $ | $ | $ | $ | $ | $ | $ | $ | $ | $ | |||||||||||||||||||||||||||||
119
HEWLETT PACKARD ENTERPRISE COMPANY AND SUBSIDIARIES
Notes to Consolidated Financial Statements (Continued)
Offsetting of Derivative Instruments
The Company recognizes all derivative instruments on a gross basis in the Consolidated Balance Sheets. The Company's derivative instruments are subject to master netting arrangements and collateral security arrangements. The Company does not offset the fair value of its derivative instruments against the fair value of cash collateral posted under collateral security agreements. As of October 31, 2019 and 2018, information related to the potential effect of the Company's use of the master netting agreements and collateral security agreements was as follows:
As of October 31, 2019 | |||||||||||||||||||||||||
In the Consolidated Balance Sheets | |||||||||||||||||||||||||
(i) | (ii) | (iii) = (i)–(ii) | (iv) | (v) | (vi) = (iii)–(iv)–(v) | ||||||||||||||||||||
Gross Amounts Not Offset | |||||||||||||||||||||||||
Gross Amount Recognized | Gross Amount Offset | Net Amount Presented | Derivatives | Financial Collateral | Net Amount | ||||||||||||||||||||
In millions | |||||||||||||||||||||||||
Derivative assets | $ | $ | — | $ | $ | $ | (1) | $ | |||||||||||||||||
Derivative liabilities | $ | $ | — | $ | $ | $ | (2) | $ | |||||||||||||||||
As of October 31, 2018 | |||||||||||||||||||||||||
In the Consolidated Balance Sheets | |||||||||||||||||||||||||
(i) | (ii) | (iii) = (i)–(ii) | (iv) | (v) | (vi) = (iii)–(iv)–(v) | ||||||||||||||||||||
Gross Amounts Not Offset | |||||||||||||||||||||||||
Gross Amount Recognized | Gross Amount Offset | Net Amount Presented | Derivatives | Financial Collateral | Net Amount | ||||||||||||||||||||
In millions | |||||||||||||||||||||||||
Derivative assets | $ | $ | — | $ | $ | $ | (1) | $ | |||||||||||||||||
Derivative liabilities | $ | $ | — | $ | $ | $ | (2) | $ | ( | ) | |||||||||||||||
(1) | Represents the cash collateral posted by counterparties as of the respective reporting date for the Company's asset position, net of derivative amounts that could be offset, as of, generally, two business days prior to the respective reporting date. |
(2) | Represents the collateral posted by the Company in cash or through re-use of counterparty cash collateral as of the respective reporting date for the Company's liability position, net of derivative amounts that could be offset, as of, generally, two business days prior to the respective reporting date. As of Oct 31, 2019, $ |
The pre-tax effect of derivative instruments and related hedged items in a fair value hedging relationship for the fiscal years ended October 31, 2019, 2018 and 2017 was as follows:
Gains (Losses) Recognized in Income on Derivative and Related Hedged Item | |||||||||||||||||||||||||||||
Derivative Instrument | Location | 2019 | 2018 | 2017 | Hedged Item | Location | 2019 | 2018 | 2017 | ||||||||||||||||||||
In millions | In millions | ||||||||||||||||||||||||||||
Interest rate contracts | Interest and other, net | $ | $ | ( | ) | $ | ( | ) | Fixed-rate debt | Interest and other, net | $ | ( | ) | $ | $ | ||||||||||||||
120
HEWLETT PACKARD ENTERPRISE COMPANY AND SUBSIDIARIES
Notes to Consolidated Financial Statements (Continued)
The pre-tax effect of derivative instruments in cash flow and net investment hedging relationships for the fiscal years ended October 31, 2019, 2018 and 2017 was as follows:
Gains (Losses) Recognized in OCI on Derivatives (Effective Portion) | Gains (Losses) Reclassified from Accumulated OCI Into Earnings (Effective Portion) | ||||||||||||||||||||||||
2019 | 2018 | 2017 | Location | 2019 | 2018 | 2017 | |||||||||||||||||||
In millions | In millions | ||||||||||||||||||||||||
Cash flow hedges: | |||||||||||||||||||||||||
Foreign currency contracts | $ | $ | $ | ( | ) | Net revenue | $ | $ | ( | ) | $ | ( | ) | ||||||||||||
Foreign currency contracts | ( | ) | Cost of products | ||||||||||||||||||||||
Foreign currency contracts | Interest and other, net | ||||||||||||||||||||||||
Interest rate contracts | Interest and other, net | ||||||||||||||||||||||||
Subtotal | Net earnings from continuing operations | ( | ) | ||||||||||||||||||||||
Foreign currency contracts | Net loss from discontinued operations | ||||||||||||||||||||||||
Total cash flow hedges | $ | $ | $ | Net earnings | $ | $ | ( | ) | $ | ||||||||||||||||
Net investment hedges: | |||||||||||||||||||||||||
Foreign currency contracts | $ | $ | $ | ( | ) | Interest and other, net | $ | $ | $ | ||||||||||||||||
As of October 31, 2019, 2018 and 2017, no portion of the hedging instruments' gain or loss was excluded from the assessment of effectiveness for fair value, cash flow or net investment hedges. Hedge ineffectiveness for fair value, cash flow and net investment hedges was not material for fiscal 2019, 2018 and 2017.
As of October 31, 2019, the Company expects to reclassify an estimated net accumulated other comprehensive gain of approximately $40 million, net of taxes, to earnings in the next twelve months along with the earnings effects of the related forecasted transactions associated with cash flow hedges.
The pre-tax effect of derivative instruments not designated as hedging instruments on the Consolidated Statements of Earnings for the fiscal years ended October 31, 2019, 2018 and 2017 was as follows:
Gains (Losses) Recognized in Income on Derivatives | |||||||||||||
Location | 2019 | 2018 | 2017 | ||||||||||
In millions | |||||||||||||
Foreign currency contracts | Interest and other, net | $ | ( | ) | $ | $ | ( | ) | |||||
Other derivatives | Interest and other, net | ( | ) | ||||||||||
Total | $ | ( | ) | $ | $ | ( | ) | ||||||
Note 15: Borrowings
Notes Payable and Short-Term Borrowings
Notes payable and short-term borrowings, including the current portion of long-term debt, were as follows:
As of October 31, | |||||||||||||
2019 | 2018 | ||||||||||||
Amount Outstanding | Weighted-Average Interest Rate | Amount Outstanding | Weighted-Average Interest Rate | ||||||||||
Dollars in millions | |||||||||||||
Current portion of long-term debt(1) | $ | % | $ | % | |||||||||
FS Commercial paper | ( | )% | ( | )% | |||||||||
Notes payable to banks, lines of credit and other(2) | % | % | |||||||||||
Total notes payable and short-term borrowings | $ | $ | |||||||||||
(1) | As of October 31, 2019, Current portion of long-term debt includes $ |
(2) | Notes payable to banks, lines of credit and other includes $ |
121
HEWLETT PACKARD ENTERPRISE COMPANY AND SUBSIDIARIES
Notes to Consolidated Financial Statements (Continued)
Long-Term Debt
As of October 31, | |||||||
2019 | 2018 | ||||||
In millions | |||||||
Hewlett Packard Enterprise Senior Notes | |||||||
$1,100 issued at discount to par at a price of 99.994% in September 2017 at 2.10%, paid October 4, 2019, interest payable semi-annually on April 4 and October 4 of each year | $ | $ | |||||
$3,000 issued at discount to par at a price of 99.972% in October 2015 at 3.6%, due October 15, 2020, interest payable semi-annually on April 15 and October 15 of each year | |||||||
$500 issued at par in September 2019 at three-month USD LIBOR plus 0.68% due March 12, 2021, interest payable quarterly on March 12, June 12, September 12 and December 12 of each year | |||||||
$500 issued at discount to par at a price of 99.861% in September 2018 at 3.5%, due October 5, 2021, interest payable semi-annually on April 5 and October 5 of each year | |||||||
$800 issued at par in September 2018 at three-month USD LIBOR plus 0.72% due October 5, 2021, interest payable semi-annually on April 5 and October 5 of each year | |||||||
$1,350 issued at discount to par at a price of 99.802% in October 2015 at 4.4%, due October 15, 2022, interest payable semi-annually on April 15 and October 15 of each year | |||||||
$1,000 issued at discount to par at a price of 99.979% in September 2019 at 2.25%, due April 1, 2023, interest payable semi-annually on April 1 and October 1 of each year | |||||||
$2,500 issued at discount to par at a price of 99.725% in October 2015 at 4.9%, due October 15, 2025, interest payable semi-annually on April 15 and October 15 of each year | |||||||
$750 issued at discount to par at a price of 99.942% in October 2015 at 6.2%, due October 15, 2035, interest payable semi-annually on April 15 and October 15 of each year | |||||||
$1,500 issued at discount to par at a price of 99.932% in October 2015 at 6.35%, due October 15, 2045, interest payable semi-annually on April 15 and October 15 of each year | |||||||
Other, including capital lease obligations, at 0.00%-5.52%, due in calendar years 2019-2030(1) | |||||||
Asset backed securities(2) | |||||||
Fair value adjustment related to hedged debt | ( | ) | |||||
Unamortized debt issuance costs | ( | ) | ( | ) | |||
Less: current portion | ( | ) | ( | ) | |||
Total long-term debt | $ | $ | |||||
(1) | Other, including capital lease obligations includes $ |
(2) | In September 2019, the Company issued $ |
Fiscal years ended October 31, | |||||||||||||
Expense | Location | 2019 | 2018 | 2017 | |||||||||
In millions | |||||||||||||
Financing interest | Financing interest | $ | $ | $ | |||||||||
Interest expense | Interest and other, net | ||||||||||||
Total interest expense | $ | $ | $ | ||||||||||
Hewlett Packard Enterprise Senior Notes
On September 13, 2019, the Company completed its offering of $1.0 billion of 2.25 % Senior Notes due April 1, 2023 and $500 million floating rate Note at three month USD LIBOR plus 0.68 % due March 12, 2021. The net proceeds from this offering were used to fund the repayment of the $1.1 billion outstanding principal amount of the 2.10 % registered Notes due in October 2019 and to fund the Company's acquisition of Cray Inc.
122
HEWLETT PACKARD ENTERPRISE COMPANY AND SUBSIDIARIES
Notes to Consolidated Financial Statements (Continued)
On September 19, 2018, the Company completed its offering of $1.3 billion of Senior Notes due October 5, 2021. The issuance consisted of $800 million floating rate Notes at three month USD LIBOR plus 0.72 %, and $500 million fixed rate Notes at 3.50 %. The net proceeds from this offering were used to fund the repayment of the $1.05 billion outstanding principal amount of the 2.85 % Notes and the $250 million outstanding principal amount of the floating rate Notes that both were due in October 2018, and for general corporate purposes.
On June 29, 2018, the Company redeemed $1.6 billion of its $2.65 billion Senior Notes with an original maturity date of October 5, 2018. These notes were fully hedged with interest rate swaps. As part of the transaction, HPE terminated and settled a proportional amount of the hedges, as well as allocated a proportional amount of unamortized discount and debt issuance costs to the retired debt. These costs, along with the redemption price of $1.6 billion resulted in an immaterial loss.
On September 20, 2017, Hewlett Packard Enterprise completed its offering of $1.1 billion of new 2.10 % registered Notes due October 4, 2019. The Company used the net proceeds to fund the repayment of the remaining $750 million outstanding principal amount of its 2.45 % Notes due October 5, 2017 and the repayment of the $350 million outstanding principal amount of its floating rate Notes due October 5, 2017.
On April 28, 2017, the Company used a portion of the $3.0 billion cash dividend received from Everett to redeem $1.5 billion face value of the 2.45 % Senior Notes with an original maturity date of October 5, 2017. A proportional amount of unamortized discount and debt issuance costs were allocated to the retired debt. These costs, along with the redemption price of $1.5 billion resulted in an immaterial loss.
As disclosed in Note 14, "Financial Instruments", the Company uses interest rate swaps to mitigate the exposure of its fixed rate debt to changes in fair value resulting from changes in interest rates, or hedge the variability of cash flows in the interest payments associated with its variable-rate debt. Interest rates on long-term debt in the table above have not been adjusted to reflect the impact of any interest rate swaps.
Commercial Paper
Hewlett Packard Enterprise's Board of Directors has authorized the issuance of up to $4.0 billion in aggregate principal amount of commercial paper by Hewlett Packard Enterprise. Hewlett Packard Enterprise's subsidiaries are authorized to issue up to an additional $1.0 billion in aggregate principal amount of commercial paper. Hewlett Packard Enterprise maintains two commercial paper programs, and a wholly-owned subsidiary maintains a third program. Hewlett Packard Enterprise's U.S. program provides for the issuance of U.S. dollar-denominated commercial paper up to a maximum aggregate principal amount of $4.0 billion. Hewlett Packard Enterprise's euro commercial paper program provides for the issuance of commercial paper outside of the U.S. denominated in U.S. dollars, euros or British pounds up to a maximum aggregate principal amount of $3.0 billion or the equivalent in those alternative currencies. The combined aggregate principal amount of commercial paper outstanding under those programs at any one time cannot exceed the $4.0 billion as authorized by Hewlett Packard Enterprise's Board of Directors. The Hewlett Packard Enterprise subsidiary's euro Commercial Paper/Certificate of Deposit Program provides for the issuance of commercial paper in various currencies of up to a maximum aggregate principal amount of $1.0 billion, which was increased from $500 million, by way of an amendment in April 2019. As of October 31, 2019 and 2018, no borrowings were outstanding under Hewlett Packard Enterprise’s two commercial paper programs, and $698 million and $392 million, respectively, were outstanding under the subsidiary’s program.
Revolving Credit Facility
On August 16, 2019, the Company entered into a revolving credit facility (the "Credit Agreement"), together with the lenders named therein, JPMorgan Chase Bank, N.A. ("JPMorgan"), as co-administrative agent and administrative processing agent, and Citibank, N.A., as co-administrative agent, providing for a senior, unsecured revolving credit facility with aggregate lending commitments of $4.75 billion. Loans under the revolving credit facility may be used for general corporate purposes. Commitments under the Credit Agreement are available for a period of five years , which period may be extended, subject to satisfaction of certain conditions, by up to two one-year periods. Commitment Fees, interest rates and other terms of borrowing under the credit facility vary based on Hewlett Packard Enterprise's external credit rating. This credit facility replaces the Company's prior credit facility that was entered into on November 1, 2015, which was terminated in connection with its entering into the new credit facility. As of October 31, 2019 and 2018, no borrowings were outstanding under the Credit Agreement.
123
HEWLETT PACKARD ENTERPRISE COMPANY AND SUBSIDIARIES
Notes to Consolidated Financial Statements (Continued)
Future Maturities of Long-term Debt
As of October 31, 2019, aggregate future maturities of the Company's long-term debt at face value (excluding a fair value adjustment related to hedged debt of $61 million and a net discount on debt issuance of $7 million), including capital lease obligations were as follows:
Fiscal year | In millions | ||
2020 | $ | ||
2021 | |||
2022 | |||
2023 | |||
2024 | |||
Thereafter | |||
Total | $ | ||
Note 16: Stockholders' Equity
Taxes related to Other Comprehensive (Loss) Income
Fiscal years ended October 31, | |||||||||||
2019 | 2018 | 2017 | |||||||||
In millions | |||||||||||
Taxes on net unrealized gain (losses) on available-for-sale securities: | |||||||||||
Tax provision on net unrealized gains (losses) arising during the period | $ | $ | $ | ( | ) | ||||||
Tax provision on gains reclassified into earnings | |||||||||||
( | ) | ||||||||||
Taxes on change in net unrealized (losses) gains on cash flow hedges: | |||||||||||
Tax (provision) benefit on net unrealized gains arising during the period | ( | ) | ( | ) | |||||||
Tax provision (benefit) on net (gains) losses reclassified into earnings | ( | ) | |||||||||
( | ) | ||||||||||
Taxes on change in unrealized components of defined benefit plans: | |||||||||||
Tax benefit (provision) on net unrealized (losses) gains arising during the period | ( | ) | |||||||||
Tax provision on amortization of net actuarial loss and prior service benefit | ( | ) | ( | ) | ( | ) | |||||
Tax provision on curtailments, settlements and other | ( | ) | ( | ) | ( | ) | |||||
( | ) | ( | ) | ||||||||
Taxes on change in cumulative translation adjustment: | |||||||||||
Tax benefit (provision) on cumulative translation adjustment arising during the period | ( | ) | |||||||||
( | ) | ||||||||||
Tax benefit (provision) on other comprehensive (loss) income | $ | $ | ( | ) | $ | ( | ) | ||||
124
HEWLETT PACKARD ENTERPRISE COMPANY AND SUBSIDIARIES
Notes to Consolidated Financial Statements (Continued)
Changes and reclassifications related to Other Comprehensive (Loss) Income, net of taxes
Fiscal years ended October 31, | |||||||||||
2019 | 2018 | 2017 | |||||||||
In millions | |||||||||||
Other comprehensive (loss) income, net of taxes: | |||||||||||
Change in net unrealized gains (losses) on available-for-sale securities: | |||||||||||
Net unrealized gains (losses) arising during the period | $ | $ | ( | ) | $ | ( | ) | ||||
Gains reclassified into earnings | ( | ) | ( | ) | ( | ) | |||||
( | ) | ( | ) | ||||||||
Change in net unrealized (losses) gains on cash flow hedges: | |||||||||||
Net unrealized gains arising during the period | |||||||||||
Net (gains) losses reclassified into earnings(1) | ( | ) | ( | ) | |||||||
( | ) | ( | ) | ||||||||
Change in unrealized components of defined benefit plans: | |||||||||||
Net unrealized (losses) gains arising during the period | ( | ) | ( | ) | |||||||
Amortization of net actuarial loss and prior service benefit(2) | |||||||||||
Curtailments, settlements and other | ( | ) | |||||||||
( | ) | ( | ) | ||||||||
Change in cumulative translation adjustment: | |||||||||||
Cumulative translation adjustment arising during the period | ( | ) | ( | ) | ( | ) | |||||
Release of cumulative translation adjustment as a result of divestitures and country exits | |||||||||||
( | ) | ( | ) | ( | ) | ||||||
Other comprehensive (loss) income, net of taxes | $ | ( | ) | $ | ( | ) | $ | ||||
(1) | For more details on reclassification of pre-tax (gains) losses on cash flow hedges into the Consolidated Statements of Earnings, see Note 14, "Financial Instruments". |
(2) | These components are included in the computation of net pension and post-retirement benefit (credit) cost in Note 6, "Retirement and Post-Retirement Benefit Plans". |
The components of accumulated other comprehensive loss, net of taxes as of October 31, 2019 and changes during fiscal 2019 were as follows:
Net unrealized gains (losses) on available-for-sale securities | Net unrealized gains (losses) on cash flow hedges | Unrealized components of defined benefit plans | Cumulative translation adjustment | Accumulated other comprehensive loss | |||||||||||||||
In millions | |||||||||||||||||||
Balance at beginning of period | $ | $ | $ | ( | ) | $ | ( | ) | $ | ( | ) | ||||||||
Other comprehensive income (loss) before reclassifications | ( | ) | ( | ) | ( | ) | |||||||||||||
Reclassifications of (gains) losses into earnings | ( | ) | ( | ) | ( | ) | |||||||||||||
Balance at end of period | $ | $ | $ | ( | ) | $ | ( | ) | $ | ( | ) | ||||||||
Dividends
The stockholders of HPE common stock are entitled to receive dividends when and as declared by HPE's Board of Directors. On February 23, 2019, the Company announced an increase to the regular quarterly dividend from $0.1125 per share to $0.12 per share, which was effective in the fourth quarter of fiscal 2019. Dividends declared were $0.4575 per common share in fiscal 2019 and $0.4875 per common share in fiscal 2018.
125
HEWLETT PACKARD ENTERPRISE COMPANY AND SUBSIDIARIES
Notes to Consolidated Financial Statements (Continued)
Share Repurchase Program
On October 13, 2015, the Company's Board of Directors approved a share repurchase program with a $3.0 billion authorization, which was refreshed with additional share repurchase authorizations of $3.0 billion, $5.0 billion and $2.5 billion on May 24, 2016, October 16, 2017 and February 21, 2018, respectively. The Company may choose to repurchase shares when sufficient liquidity exists and the shares are trading at a discount relative to estimated intrinsic value. This program, which does not have a specific expiration date, authorizes repurchases in the open market or in private transactions.
For fiscal 2019, the Company repurchased and settled a total of 150 million shares under its share repurchase program through open market repurchases, which included 2.4 million shares that were unsettled open market purchase as of October 31, 2018. Additionally, the Company had unsettled open market repurchases of 0.5 million shares as of October 31, 2019. Shares repurchased during fiscal 2019 were recorded as a $2.2 billion reduction to stockholders' equity. As of October 31, 2019, the Company had a remaining authorization of $2.5 billion for future share repurchases.
Note 17: Net Earnings Per Share
The Company calculates basic net EPS using net earnings and the weighted-average number of shares outstanding during the reporting period. Diluted net EPS includes the weighted-average dilutive effect of restricted stock units, stock options, and performance-based awards.
The reconciliations of the numerators and denominators of each of the basic and diluted net EPS calculations were as follows:
Fiscal years ended October 31, | |||||||||||
2019 | 2018 | 2017 | |||||||||
In millions, except per share amounts | |||||||||||
Numerator: | |||||||||||
Net earnings from continuing operations | $ | $ | $ | ||||||||
Net loss from discontinued operations | ( | ) | ( | ) | |||||||
Net earnings | $ | $ | $ | ||||||||
Denominator: | |||||||||||
Weighted-average shares used to compute basic net EPS | |||||||||||
Dilutive effect of employee stock plans | |||||||||||
Weighted-average shares used to compute diluted net EPS | |||||||||||
Basic net earnings (loss) per share: | |||||||||||
Continuing operations | $ | $ | $ | ||||||||
Discontinued operations | ( | ) | ( | ) | |||||||
Basic net earnings per share | $ | $ | $ | ||||||||
Diluted net earnings (loss) per share: | |||||||||||
Continuing operations | $ | $ | $ | ||||||||
Discontinued operations(1) | ( | ) | ( | ) | |||||||
Diluted net earnings per share | $ | $ | $ | ||||||||
Anti-dilutive weighted-average stock awards(2) | |||||||||||
(1) | U.S. GAAP requires the denominator used in the diluted net EPS calculation for discontinued operations to be the same as that of continuing operations, regardless of net earnings (loss) from continuing operations. |
(2) |
126
HEWLETT PACKARD ENTERPRISE COMPANY AND SUBSIDIARIES
Notes to Consolidated Financial Statements (Continued)
Note 18: Litigation and Contingencies
Hewlett Packard Enterprise is involved in various lawsuits, claims, investigations and proceedings including those consisting of intellectual property, commercial, securities, employment, employee benefits and environmental matters, which arise in the ordinary course of business. In addition, as part of the Separation and Distribution Agreement, Hewlett Packard Enterprise and HP Inc. (formerly known as "Hewlett-Packard Company") agreed to cooperate with each other in managing certain existing litigation related to both parties' businesses. The Separation and Distribution Agreement included provisions that allocate liability and financial responsibility for pending litigation involving the parties, as well as provide for cross-indemnification of the parties against liabilities to one party arising out of liabilities allocated to the other party. The Separation and Distribution Agreement also included provisions that assign to the parties responsibility for managing pending and future litigation related to the general corporate matters of HP Inc. arising prior to the Separation. Hewlett Packard Enterprise records a liability when it believes that it is both probable that a liability has been incurred and the amount of loss can be reasonably estimated. Significant judgment is required to determine both the probability of having incurred a liability and the estimated amount of the liability. Hewlett Packard Enterprise reviews these matters at least quarterly and adjusts these liabilities to reflect the impact of negotiations, settlements, rulings, advice of legal counsel and other updated information and events pertaining to a particular matter. Litigation is inherently unpredictable. However, Hewlett Packard Enterprise believes it has valid defenses with respect to legal matters pending against us. Nevertheless, cash flows or results of operations could be materially affected in any particular period by the resolution of one or more of these contingencies. Hewlett Packard Enterprise believes it has recorded adequate provisions for any such matters and, as of October 31, 2019, it was not reasonably possible that a material loss had been incurred in connection with such matters in excess of the amounts recognized in its financial statements.
Litigation, Proceedings and Investigations
DXC Technology Indemnification Demand. On March 27, 2018, DXC Technology (“DXC”) served an arbitration demand on HPE under the Separation and Distribution Agreement by and between HPE and DXC (f/k/a Everett SpinCo, Inc.) dated May 24, 2016, relating to the separation of HPE’s Enterprise Services business (the “ES Business”). The arbitration demand asserts that HPE is required to indemnify DXC for any transferred long-term capitalized lease obligations of the ES Business that exceed the threshold amount of $250 million. DXC contends that this $250 million threshold was exceeded by approximately $1.0 billion because the valuation of the assets underlying certain leases did not justify their classification as operating leases based on the terms of such leases, thereby rendering them long-term capitalized lease obligations. The arbitration demand follows DXC's November 8, 2017 request for indemnification on this same issue. On August 15, 2019, the arbitration panel ruled in DXC’s favor, issuing DXC an award in the amount of $632 million. The arbitration panel also awarded pre-judgment and post-judgment interest of $36 million. On August 26, 2019, DXC moved to confirm the arbitration panel’s award in the United States District Court of the Southern District of New York. That motion was withdrawn following HPE’s payment to DXC of $668 million on September 17, 2019. This matter is now closed.
Ross and Rogus v. Hewlett Packard Enterprise Company. On November 8, 2018, a putative class action complaint was filed in the Superior Court of California, County of Santa Clara alleging that HPE pays its California-based female employees “systemically lower compensation” than HPE pays male employees performing substantially similar work. The complaint alleges various California state law claims, including California’s Equal Pay Act, Fair Employment and Housing Act, and Unfair Competition Law, and seeks certification of a California-only class of female employees employed in certain “Covered Positions.” The complaint seeks damages, statutory and civil penalties, attorneys’ fees and costs. On April 2, 2019, HPE filed a demurrer to all causes of action and an alternative motion to strike portions of the complaint. On July 2, 2019, the court denied HPE’s demurrer as to the claims of the putative class and granted HPE’s demurrer as to the claims of the individual plaintiffs.
India Directorate of Revenue Intelligence Proceedings. On April 30 and May 10, 2010, the India Directorate of Revenue Intelligence (the "DRI") issued show cause notices to Hewlett-Packard India Sales Private Ltd ("HP India"), a subsidiary of HP Inc., seven HP India employees and one former HP India employee alleging that HP India underpaid customs duties while importing products and spare parts into India and seeking to recover an aggregate of approximately $370 million, plus penalties. Prior to the issuance of the show cause notices, HP India deposited approximately $16 million with the DRI and agreed to post a provisional bond in exchange for the DRI's agreement to not seize HP India products and spare parts and to not interrupt the transaction of business by HP India.
On April 11, 2012, the Bangalore Commissioner of Customs issued an order on the products-related show cause notice affirming certain duties and penalties against HP India and the named individuals of approximately $386 million, of which HP India had already deposited $9 million. On December 11, 2012, HP India voluntarily deposited an additional $10 million in connection with the products-related show cause notice. On April 20, 2012, the Commissioner issued an order on the parts-related show cause notice affirming certain duties and penalties against HP India and certain of the named individuals of approximately
127
HEWLETT PACKARD ENTERPRISE COMPANY AND SUBSIDIARIES
Notes to Consolidated Financial Statements (Continued)
$17 million, of which HP India had already deposited $7 million. After the order, HP India deposited an additional $3 million in connection with the parts-related show cause notice so as to avoid certain penalties.
HP India filed appeals of the Commissioner's orders before the Customs Tribunal along with applications for waiver of the pre-deposit of remaining demand amounts as a condition for hearing the appeals. The Customs Department has also filed cross-appeals before the Customs Tribunal. On January 24, 2013, the Customs Tribunal ordered HP India to deposit an additional $24 million against the products order, which HP India deposited in March 2013. The Customs Tribunal did not order any additional deposit to be made under the parts order. In December 2013, HP India filed applications before the Customs Tribunal seeking early hearing of the appeals as well as an extension of the stay of deposit as to HP India and the individuals already granted until final disposition of the appeals. On February 7, 2014, the application for extension of the stay of deposit was granted by the Customs Tribunal until disposal of the appeals. On October 27, 2014, the Customs Tribunal commenced hearings on the cross-appeals of the Commissioner's orders. The Customs Tribunal rejected HP India's request to remand the matter to the Commissioner on procedural grounds. The hearings were scheduled to reconvene on April 6, 2015, and again on November 3, 2015 and April 11, 2016, but were canceled at the request of the Customs Tribunal. The hearing was rescheduled for January 15, 2019 but was postponed and has not yet been rescheduled.
ECT Proceedings. In January 2011, the postal service of Brazil, Empresa Brasileira de Correios e Telégrafos ("ECT"), notified a former subsidiary of HP Inc. in Brazil ("HP Brazil") that it had initiated administrative proceedings to consider whether to suspend HP Brazil's right to bid and contract with ECT related to alleged improprieties in the bidding and contracting processes whereby employees of HP Brazil and employees of several other companies allegedly coordinated their bids and fixed results for three ECT contracts in 2007 and 2008. In late July 2011, ECT notified HP Brazil it had decided to apply the penalties against HP Brazil and suspend HP Brazil's right to bid and contract with ECT for five years, based upon the evidence before it. In August 2011, HP Brazil appealed ECT's decision. In April 2013, ECT rejected HP Brazil's appeal, and the administrative proceedings were closed with the penalties against HP Brazil remaining in place. In parallel, in September 2011, HP Brazil filed a civil action against ECT seeking to have ECT's decision revoked. HP Brazil also requested an injunction suspending the application of the penalties until a final ruling on the merits of the case. The court of first instance has not issued a decision on the merits of the case, but it has denied HP Brazil's request for injunctive relief. HP Brazil appealed the denial of its request for injunctive relief to the intermediate appellate court, which issued a preliminary ruling denying the request for injunctive relief but reducing the length of the sanctions from five to two years . HP Brazil appealed that decision and, in December 2011, obtained a ruling staying enforcement of ECT's sanctions until a final ruling on the merits of the case. HP Brazil expects the decision to be issued in 2020 and any subsequent appeal on the merits to last several years.
Forsyth, et al. vs. HP Inc. and Hewlett Packard Enterprise. This purported class and collective action was filed on August 18, 2016 and an amended complaint was filed on December 19, 2016 in the United States District Court for the Northern District of California, against HP Inc. and Hewlett Packard Enterprise alleging defendants violated the Federal Age Discrimination in Employment Act ("ADEA"), the California Fair Employment and Housing Act, California public policy and the California Business and Professions Code by terminating older workers and replacing them with younger workers. Plaintiffs seek to certify a nationwide collective action under the ADEA comprised of all individuals aged 40 and older who had their employment terminated by an HP entity pursuant to a work force reduction ("WFR") plan on or after December 9, 2014 for individuals terminated in deferral states and on or after April 8, 2015 in non-deferral states. Plaintiffs also seek to certify a Rule 23 class under California law comprised of all persons 40 years or older employed by defendants in the state of California and terminated pursuant to a WFR plan on or after August 18, 2012. On September 20, 2017, the court granted the defendants' motion to compel arbitration and administratively closed the case pending resolution of the arbitration proceedings. On November 30, 2017, three named plaintiffs filed a single arbitration demand. Thirteen additional plaintiffs later joined the arbitration. On December 22, 2017, defendants filed a motion to (1) stay the case pending arbitrations and (2) enjoin the demanded arbitration and require each plaintiff to file a separate arbitration demand. On February 6, 2018, the court granted the motion to stay and denied the motion to enjoin. The claims of these sixteen arbitration named plaintiffs have been resolved. Additional opt-in plaintiffs have since been added to the litigation and the parties are engaged in the arbitration process for those claims. The Forsyth class action remains stayed.
Wall v. Hewlett Packard Enterprise Company and HP Inc. This certified California class action and Private Attorney General Act action was filed against Hewlett-Packard Company on January 17, 2012 and the fifth amended (and operative) complaint was filed against HP Inc. and Hewlett Packard Enterprise on June 28, 2016 in the Superior Court of California, County of Orange. The complaint alleges that the defendants paid earned incentive compensation late and failed to timely pay final wages in violation of the California Labor Code. On August 9, 2016, the court ordered the class certified without prejudice to a future motion to amend or modify the class certification order or to decertify. The scheduled January 22, 2018 trial date was vacated following the parties’ notification to the court that they had reached a preliminary agreement to resolve the dispute. The parties subsequently finalized and executed a settlement agreement and, on May 9, 2018, plaintiff filed a motion seeking preliminary approval of the settlement.
128
HEWLETT PACKARD ENTERPRISE COMPANY AND SUBSIDIARIES
Notes to Consolidated Financial Statements (Continued)
On July 2, 2018, the court issued an order granting preliminary approval of the settlement. On December 21, 2018, the court issued an order granting final approval. A Qualified Settlement Fund has been fully funded. Upon confirmation that the settlement distributions have been made, the matter will be closed.
Jackson, et al. v. HP Inc. and Hewlett Packard Enterprise. This putative nationwide class action was filed on July 24, 2017 in the United States District Court for the Northern District of California, San Jose Division. Plaintiffs purport to bring the lawsuit on behalf of themselves and other similarly situated African-Americans and individuals over the age of forty. Plaintiffs allege that defendants engaged in a pattern and practice of racial and age discrimination in lay-offs and promotions. Plaintiffs filed an amended complaint on September 29, 2017. Plaintiffs seek damages, attorneys’ fees and costs, and declaratory and injunctive relief. On January 12, 2018, defendants moved to transfer the matter to the federal district court in the Northern District of Georgia. Defendants also moved to dismiss the claims on various grounds and to strike certain aspects of the proposed class definition. On July 11, 2018, the court granted defendants' motion to dismiss this action for improper venue, and also partially dismissed and struck certain claims without prejudice to re-filing in the appropriate venue. On July 23, 2018, plaintiffs re-filed their lawsuit in the United States District Court for the Northern District of Georgia. On August 9, 2018, Plaintiffs filed a notice of appeal of the dismissal of the Northern District of California action with the Ninth Circuit Court of Appeals. On August 15, 2018, Plaintiffs filed a motion to stay their lawsuit in the Northern District of Georgia, which was granted by the court.
Hewlett-Packard Company v. Oracle (Itanium). On June 15, 2011, HP Inc. filed suit against Oracle in the Superior Court of California, County of Santa Clara in connection with Oracle's March 2011 announcement that it was discontinuing software support for HP Inc.’s Itanium-based line of mission critical servers. HP Inc. asserted, among other things, that Oracle’s actions breached the contract that was signed by the parties as part of the settlement of the litigation relating to Oracle’s hiring of Mark Hurd. The matter eventually progressed to trial, which was bifurcated into two phases. HP Inc. prevailed in the first phase of the trial, in which the court ruled that the contract at issue required Oracle to continue to offer its software products on HP Inc.'s Itanium-based servers for as long as HP Inc. decided to sell such servers. Phase 2 of the trial was then postponed by Oracle’s appeal of the trial court’s denial of Oracle’s “anti-SLAPP” motion, in which Oracle argued that HP Inc.’s damages claim infringed on Oracle’s First Amendment rights. On August 27, 2015, the California Court of Appeal rejected Oracle’s appeal. The matter was remanded to the trial court for Phase 2 of the trial, which began on May 23, 2016, and was submitted to the jury on June 29, 2016. On June 30, 2016, the jury returned a verdict in favor of HP Inc., awarding HP Inc. approximately $3.0 billion in damages: $1.7 billion for past lost profits and $1.3 billion for future lost profits. On October 20, 2016, the court entered judgment for this amount with interest accruing until the judgment is paid. Oracle’s motion for a new trial was denied on December 19, 2016, and Oracle filed its notice of appeal from the trial court’s judgment on January 17, 2017. On February 2, 2017, HP Inc. filed a notice of cross-appeal challenging the trial court’s denial of prejudgment interest. On May 16, 2019, HP Inc. filed its application to renew the judgment. As of May 16, 2019, the renewed judgment is approximately $3.8 billion. Daily interest on the renewed judgment is now accruing at $1 million and will be recorded upon receipt. The parties have completed appellate briefing in the California Court of Appeal and are awaiting the scheduling of oral argument. Pursuant to the terms of the Separation and Distribution Agreement, HP Inc. and Hewlett Packard Enterprise will share equally in any recovery from Oracle once Hewlett Packard Enterprise has been reimbursed for all costs incurred in the prosecution of the action prior to the HP Inc. /Hewlett Packard Enterprise separation on November 1, 2015.
Oracle America, Inc., et al. v. Hewlett Packard Enterprise Company (Terix copyright matter). On March 22, 2016, Oracle filed a complaint against HPE in the United States District Court for the Northern District of California, alleging copyright infringement, interference with contract, intentional interference with prospective economic relations, and unfair competition. Oracle’s claims arise out of HPE’s prior use of a third-party maintenance provider named Terix Computer Company, Inc. (“Terix”). Oracle contends that in connection with HPE’s use of Terix as a subcontractor for certain customers of HPE’s multivendor support business, Oracle’s copyrights were infringed, and HPE is liable for vicarious and contributory infringement and related claims. The lawsuit against HPE follows a prior lawsuit brought by Oracle against Terix in 2013 relating to Terix’s alleged unauthorized provision of Solaris patches to customers on Oracle hardware. On June 14, 2018, the court heard oral argument on HPE's and Oracle's cross-motions for summary judgment. The court has not yet ruled on the parties' motions. On January 29, 2019, the court granted HPE’s Motion for Summary Judgment as to all of Oracle’s claims and vacated the trial date. On February 20, 2019, the court entered judgment in favor of HPE, dismissing Oracle’s claims in their entirety. Oracle has appealed the trial court’s ruling to the United States Court of Appeals for the Ninth Circuit. Oracle’s opening brief was filed on July 29, 2019. HPE’s responsive brief was filed on September 27, 2019. Oracle’s reply brief was filed November 18, 2019.
Network-1 Technologies, Inc. v. Alcatel-Lucent USA Inc., et al. This patent infringement action was filed on September 15, 2011 in the United States District Court for the Eastern District of Texas, alleging that various Hewlett Packard Enterprise switches and access points infringe Network-1’s patent relating to the 802.3af and 802.3at “Power over Ethernet” standards. Network-1
129
HEWLETT PACKARD ENTERPRISE COMPANY AND SUBSIDIARIES
Notes to Consolidated Financial Statements (Continued)
seeks damages, attorneys’ fees and costs, and declaratory and injunctive relief. The Network-1 patent at issue expires in 2020. A jury trial was conducted beginning on November 6, 2017. On November 13, 2017, the jury returned a verdict in favor of HPE, finding that HPE did not infringe Network-1’s patent and that the patent was invalid. On August 29 2018, the court denied Network-1's motion for a new trial on infringement and entered the jury's verdict finding that HPE does not infringe the relevant Network-1 patent. The court also granted Network-1's motion for Judgment as a Matter of Law on validity. Network-1 has appealed the jury verdict of non-infringement to the United States Court of Appeals for the Federal Circuit. HPE has cross-appealed the court’s decision to grant Network-1's motion for Judgment as a Matter of Law on validity. Appellate briefing has been completed. The Federal Circuit Court of Appeal held oral argument on November 4, 2019.
Shared Litigation with HP Inc., DXC and Micro Focus
As part of the Separation and Distribution Agreements between Hewlett Packard Enterprise and HP Inc., Hewlett Packard Enterprise and DXC, and Hewlett Packard Enterprise and Seattle SpinCo, the parties to each agreement agreed to cooperate with each other in managing certain existing litigation related to both parties' businesses. The Separation and Distribution Agreements also included provisions that assign to the parties responsibility for managing pending and future litigation related to the general corporate matters of HP Inc. (in the case of the separation of Hewlett Packard Enterprise from HP Inc.) or of Hewlett Packard Enterprise (in the case of the separation of DXC from Hewlett Packard Enterprise and the separation of Seattle SpinCo from Hewlett Packard Enterprise), in each case arising prior to the applicable separation.
Environmental
The Company's operations and products are or may in the future become subject to various federal, state, local and foreign laws and regulations concerning environmental protection, including laws addressing the discharge of pollutants into the air and water, the management and disposal of hazardous substances and wastes, the clean-up of contaminated sites, the substances and materials used in the Company's products, the energy consumption of products, services and operations and the operational or financial responsibility for recycling, treatment and disposal of those products. This includes legislation that makes producers of electrical goods, including servers and networking equipment, financially responsible for specified collection, recycling, treatment and disposal of past and future covered products (sometimes referred to as "product take-back legislation"). The Company could incur substantial costs, its products could be restricted from entering certain jurisdictions, and it could face other sanctions, if it were to violate or become liable under environmental laws or if its products become non-compliant with environmental laws. The Company's potential exposure includes impacts on revenue, fines and civil or criminal sanctions, third-party property damage or personal injury claims and clean-up costs. The amount and timing of costs to comply with environmental laws are difficult to predict.
In particular, the Company may become a party to, or otherwise involved in, proceedings brought by U.S. or state environmental agencies under the Comprehensive Environmental Response, Compensation and Liability Act ("CERCLA"), known as "Superfund," or other federal, state or foreign laws and regulations addressing the clean-up of contaminated sites, and may become a party to, or otherwise involved in, proceedings brought by private parties for contribution towards clean-up costs. The Company is also contractually obligated to make financial contributions to address actions related to certain environmental liabilities, both ongoing and arising in the future, pursuant to its Separation and Distribution Agreement with HP Inc.
Note 19: Guarantees, Indemnifications and Warranties
Guarantees
In the ordinary course of business, the Company may issue performance guarantees to certain of its clients, customers and other parties pursuant to which the Company has guaranteed the performance obligations of third parties. Some of those guarantees may be backed by standby letters of credit or surety bonds. In general, the Company would be obligated to perform over the term of the guarantee in the event a specified triggering event occurs as defined by the guarantee. The Company believes the likelihood of having to perform under a material guarantee is remote.
The Company has entered into service contracts with certain of its clients that are supported by financing arrangements. If a service contract is terminated as a result of the Company's non-performance under the contract or failure to comply with the terms of the financing arrangement, the Company could, under certain circumstances, be required to acquire certain assets related to the service contract. The Company believes the likelihood of having to acquire a material amount of assets under these arrangements is remote.
130
HEWLETT PACKARD ENTERPRISE COMPANY AND SUBSIDIARIES
Notes to Consolidated Financial Statements (Continued)
Indemnifications
In the ordinary course of business, the Company enters into contractual arrangements under which the Company may agree to indemnify a third party to such arrangement from any losses incurred relating to the services they perform on behalf of the Company or for losses arising from certain events as defined within the particular contract, which may include, for example, litigation or claims relating to past performance. The Company also provides indemnifications to certain vendors and customers against claims of IP infringement made by third parties arising from the use by such vendors and customers of the Company's software products and support services and certain other matters. Some indemnifications may not be subject to maximum loss clauses. Historically, payments made related to these indemnifications have been immaterial.
General Cross-indemnification
In connection with the Separation, the Company entered into a Separation and Distribution Agreement with HP Inc. effective November 1, 2015 where the Company agreed to indemnify HP Inc., each of its subsidiaries and each of their respective directors, officers and employees from and against all liabilities relating to, arising out of or resulting from, among other matters, the liabilities allocated to the Company as part of the Separation. HP Inc. similarly agreed to indemnify the Company, each of its subsidiaries and each of their respective directors, officers and employees from and against all claims and liabilities relating to, arising out of or resulting from, among other matters, the liabilities allocated to HP Inc. as part of the Separation.
In connection with the Everett and Seattle Transactions, the Company entered into a Separation and Distribution Agreement with DXC and Micro Focus, effective March 31, 2017 and September 1, 2017, respectively, where DXC and Micro Focus agreed to indemnify HPE, each of its subsidiaries and each of their respective directors, officers and employees from and against all liabilities relating to, arising out of or resulting from, among other matters, the liabilities allocated to DXC and Micro Focus as part of the Everett and Seattle Transactions. HPE similarly agreed to indemnify DXC and Micro Focus, each of its subsidiaries and each of their respective directors, officers and employees from and against all claims and liabilities relating to, arising out of or resulting from, among other matters, the liabilities allocated to the Company as part of the Everett and Seattle Transactions.
Tax Matters Agreement with HP Inc., and Other Income Tax Matters
In connection with the Separation, the Company entered into a Tax Matters Agreement (the "Tax Matters Agreement") with HP Inc. effective November 1, 2015 that governed the rights and obligations of the Company and HP Inc. for certain pre-Separation tax liabilities. The Tax Matters Agreement provided that the Company and HP Inc. would share certain pre-Separation income tax liabilities that arose from adjustments made by tax authorities to the Company and HP Inc.'s U.S. and certain non-U.S. income tax returns. In certain jurisdictions, the Company and HP Inc. have joint and several liability for past income tax liabilities and accordingly, the Company could be legally liable under applicable tax law for such liabilities and required to make additional tax payments. In these cases, the Company recorded the entire liability, which was partially offset by the indemnification receivable from HP Inc., thereby reflecting the Company's net exposure in its Consolidated Balance Sheets.
On October 30, 2019, the Company and HP Inc. entered into a Termination and Mutual Release Agreement and terminated the Tax Matters Agreement. Under the Termination and Mutual Release Agreement, HP Inc. paid the Company $200 million in fiscal 2019, and agreed to pay $50 million in both fiscal 2020 and fiscal 2021. In addition, HP Inc. has agreed to indemnify the Company for uncertain tax positions related to pre-Separation state tax liabilities for which the Company is joint and severally liable, currently totaling $131 million. The Company and HP Inc. also agreed to release each other from certain claims and liabilities related to the Tax Matters Agreement.
Tax Matters Agreement with DXC and Other Income Tax Matters
In connection with the Everett Transaction, the Company entered into a Tax Matters Agreement (the "DXC Tax Matters Agreement") with DXC effective on April 1, 2017 that governs the rights and obligations of the Company and DXC for certain pre-divestiture tax liabilities and tax receivables. The DXC Tax Matters Agreement generally provides that the Company will be responsible for pre-divestiture tax liabilities and will be entitled to pre-divestiture tax receivables that arise from adjustments made by tax authorities to the Company and DXC's U.S. and certain non-U.S. tax returns. In certain jurisdictions the Company and DXC have joint and several liability for past tax liabilities and accordingly, the Company could be legally liable under applicable tax law for such liabilities and required to make additional tax payments.
In addition, if the distribution of Everett's common shares to Hewlett Packard Enterprise's stockholders is determined to be taxable, the Company would generally bear the tax liability, unless the taxability of the distribution is the direct result of actions taken by DXC, in which case DXC would be responsible for any taxes imposed on the distribution.
131
HEWLETT PACKARD ENTERPRISE COMPANY AND SUBSIDIARIES
Notes to Consolidated Financial Statements (Continued)
Tax Matters Agreement with Seattle and Other Income Tax Matters
In connection with the Seattle Transaction, the Company entered into a Tax Matters Agreement (the "Micro Focus Tax Matters Agreement") with Micro Focus effective on September 1, 2017 that governs the rights and obligations of the Company and Micro Focus for certain pre-divestiture tax liabilities and tax receivables. The Micro Focus Tax Matters Agreement generally provides that the Company will be responsible for pre-divestiture tax liabilities and will be entitled to pre-divestiture tax receivables that arise from adjustments made by tax authorities to the Company and Micro Focus's U.S. and certain non-U.S. tax returns. In certain jurisdictions the Company and Micro Focus have joint and several liability for past tax liabilities and accordingly, the Company could be legally liable under applicable tax law for such liabilities and required to make additional tax payments.
In addition, if the distribution of Seattle's common shares to Hewlett Packard Enterprise's stockholders is determined to be taxable, the Company would generally bear the tax liability, unless the taxability of the distribution is the direct result of actions taken by Micro Focus, in which case Micro Focus would be responsible for any taxes imposed on the distribution.
As of October 31, 2019 and 2018, the Company’s receivable and payable balances related to indemnified litigation matters and other contingencies, and income tax-related indemnification covered by these agreements were as follows:
As of October 31, | |||||||
2019 | 2018 | ||||||
In millions | |||||||
Litigation matters and other contingencies | |||||||
Receivable | $ | $ | |||||
Payable | $ | $ | |||||
Income tax-related indemnification(1) | |||||||
Net indemnification receivable - long-term(2) | $ | $ | |||||
Net indemnification receivable - short-term(2) | $ | $ | |||||
Net indemnification payable - long-term | $ | $ | |||||
Net indemnification payable - short-term(2) | $ | $ | |||||
(1) | The actual amount that the Company may receive or pay could vary depending upon the outcome of certain unresolved tax matters, which may not be resolved for several years. |
(2) | The change in the income tax related indemnification accounts is primarily related to the termination of the Tax Matters Agreement with HP Inc., as well as the impact of the settlement of the U.S. federal income tax audit of fiscal years 2013 through 2015 for HP Inc. |
The Company accrues the estimated cost of product warranties at the time it recognizes revenue. The Company engages in extensive product quality programs and processes, including actively monitoring and evaluating the quality of its component suppliers; however, contractual warranty terms, repair costs, product call rates, average cost per call, current period product shipments and ongoing product failure rates, as well as specific product class failures outside of the Company's baseline experience, affect the estimated warranty obligation.
132
HEWLETT PACKARD ENTERPRISE COMPANY AND SUBSIDIARIES
Notes to Consolidated Financial Statements (Continued)
The Company's aggregate product warranty liabilities and changes therein were as follows:
Fiscal years ended October 31, | |||||||
2019 | 2018 | ||||||
In millions | |||||||
Balance at beginning of year | $ | $ | |||||
Accruals for warranties issued | |||||||
Adjustments related to pre-existing warranties | ( | ) | |||||
Settlements made | ( | ) | ( | ) | |||
Balance at end of year(1) | $ | $ | |||||
(1) | The Company includes the current portion in Other accrued liabilities, and amounts due after one year in Other non-current liabilities in the accompanying Consolidated Balance Sheets. |
Note 20: Commitments
Lease Commitments
The Company leases certain real and personal property under non-cancelable operating leases. Certain leases require the Company to pay property taxes, insurance and routine maintenance, and include renewal options and escalation clauses. Rent expense on operating leases was approximately $283 million, $289 million and $290 million for fiscal 2019, 2018 and 2017, respectively.
Property under capital leases is comprised primarily of building, equipment and furniture. Capital lease assets included in Property, plant and equipment in the Consolidated Balance Sheets were $61 million as of both October 31, 2019 and 2018. Accumulated depreciation on the property under capital lease was $13 million and $8 million as of October 31, 2019 and 2018, respectively.
As of October 31, 2019, future minimum lease commitments on the Company's operating leases were as follows:
Fiscal Year | In millions | ||
2020 | $ | ||
2021 | |||
2022 | |||
2023 | |||
2024 | |||
Thereafter | |||
Less: Sublease rental income | ( | ) | |
Total | $ | ||
Unconditional Purchase Obligations
At October 31, 2019, the Company had unconditional purchase obligations of approximately $296 million. These unconditional purchase obligations include agreements to purchase goods or services that are enforceable and legally binding on the Company and that specify all significant terms, including fixed or minimum quantities to be purchased, fixed, minimum or variable price provisions and the approximate timing of the transaction, as well as settlements that the Company has reached with third parties, requiring it to pay determined amounts over a specified period of time. These unconditional purchase obligations are related principally to software maintenance and support services and other items. Unconditional purchase obligations exclude agreements that are cancelable without penalty.
133
HEWLETT PACKARD ENTERPRISE COMPANY AND SUBSIDIARIES
Notes to Consolidated Financial Statements (Continued)
As of October 31, 2019, future unconditional purchase obligations were as follows:
Fiscal Year | In millions | ||
2020 | $ | ||
2021 | |||
2022 | |||
2023 | |||
2024 | |||
Thereafter | |||
Total | $ | ||
Note 21: Equity Method Investments
The Company includes investments which are accounted for using the equity method, under Investments in equity interests on the Company's Consolidated Balance Sheets. As of October 31, 2019 and October 31, 2018, the Company's Investments in equity interests were $2.3 billion and $2.4 billion, respectively, primarily related to a 49 % equity interest in H3C Technologies ("H3C").
Investment in H3C
In the periods presented, the Company recorded its interest in the net earnings of H3C along with an adjustment to eliminate unrealized profits on intra-entity sales, and the amortization of basis difference, within Earnings (loss) from equity interests in the Consolidated Statements of Earnings.
During fiscals 2019 and 2018, the Company received a cash dividend of $156 million and $164 million, respectively, from H3C. This amount was accounted for as a return on investment and reflected as a reduction in the carrying balance of the Company's Investments in equity interests in its Consolidated Balance Sheets.
The difference between the sale date carrying value of the Company's investment in H3C and its proportionate share of the net assets fair value of H3C, created a basis difference of $2.5 billion, which was allocated as follows:
In millions | |||
Equity method goodwill | $ | ||
Intangible assets | |||
In-process research and development | |||
Deferred tax liabilities | ( | ) | |
Other | |||
Basis difference | $ | ||
The Company recorded earnings from equity interests of $20 million and $38 million in fiscal 2019 and 2018, respectively, and loss from equity interests of $23 million in fiscals 2017 in the Consolidated Statements of Earnings, the components of which are as follows:
Fiscal years ended October 31, | |||||||||||
2019 | 2018 | 2017 | |||||||||
In millions | |||||||||||
Earnings from equity interests, net of taxes | $ | $ | $ | ||||||||
Basis difference amortization | ( | ) | ( | ) | ( | ) | |||||
Elimination of profit on intra-entity sales adjustment | ( | ) | |||||||||
Earnings (loss) from equity interests | $ | $ | $ | ( | ) | ||||||
134
HEWLETT PACKARD ENTERPRISE COMPANY AND SUBSIDIARIES
Notes to Consolidated Financial Statements (Continued)
The Company amortizes the basis difference over the estimated useful lives of the assets that gave rise to this difference. The weighted-average life of the H3C intangible assets is five years and is being amortized using the straight-line method. As of October 31, 2019 and 2018, the Company determined that no impairment of its equity method investments existed.
The Company also has commercial arrangements with H3C to buy and sell HPE branded servers, storage and networking products and HPE Pointnext services. During fiscals 2019, 2018 and 2017, HPE recorded approximately $897 million, $1.3 billion and $1.2 billion of sales to H3C and $202 million, $273 million and $331 million of purchases from H3C, respectively. Payables due to H3C as of October 31, 2019 and 2018 were approximately $39 million and $43 million, respectively. Receivables due from H3C as of October 31, 2019 and 2018 were approximately $32 million and $10 million, respectively.
Quarterly Summary
(Unaudited)
(In millions, except per share amounts)
For the three-month periods ended in fiscal 2019 | |||||||||||||||
January 31 | April 30 | July 31 | October 31 | ||||||||||||
Net revenue | $ | $ | $ | $ | |||||||||||
Cost of sales | $ | $ | $ | $ | |||||||||||
Earnings (loss) from operations | $ | $ | $ | ( | ) | $ | |||||||||
Net earnings (loss) | $ | $ | $ | ( | ) | $ | |||||||||
Net earnings (loss) per share - basic | $ | $ | $ | ( | ) | $ | |||||||||
Net earnings (loss) per share - diluted | $ | $ | $ | ( | ) | $ | |||||||||
For the three-month periods ended in fiscal 2018 | |||||||||||||||
January 31 | April 30 | July 31 | October 31 | ||||||||||||
Net revenue | $ | $ | $ | $ | |||||||||||
Cost of sales | $ | $ | $ | $ | |||||||||||
Earnings from continuing operations | $ | $ | $ | $ | |||||||||||
Net earnings (loss) from continuing operations | $ | $ | $ | $ | ( | ) | |||||||||
Net earnings (loss) per share: | |||||||||||||||
Continuing operations - basic | $ | $ | $ | $ | ( | ) | |||||||||
Continuing operations - diluted | $ | $ | $ | $ | ( | ) | |||||||||
135
ITEM 9. Changes in and Disagreements with Accountants on Accounting and Financial Disclosure.
None.
ITEM 9A. Controls and Procedures.
Evaluation of Disclosure Controls and Procedures
Under the supervision and with the participation of our management, including our principal executive officer and principal financial officer, we conducted an evaluation of the effectiveness of the design and operation of our disclosure controls and procedures, as defined in Rules 13a-15(e) and 15d-15(e) under the Exchange Act as of the end of the period covered by this report (the "Evaluation Date"). Based on this evaluation, our principal executive officer and principal financial officer concluded as of the Evaluation Date that our disclosure controls and procedures were effective such that the information relating to Hewlett Packard Enterprise, including our consolidated subsidiaries, required to be disclosed in our SEC reports (i) is recorded, processed, summarized and reported within the time periods specified in SEC rules and forms, and (ii) is accumulated and communicated to Hewlett Packard Enterprise's management, including our principal executive officer and principal financial officer, as appropriate to allow timely decisions regarding required disclosure.
Management's Report on Internal Control Over Financial Reporting
See Management’s Report of Internal Control Over Financial Reporting and the Report of Independent Registered Public Accounting Firm on our internal control over financial reporting in Item 8, which are incorporated herein by reference.
Changes in Internal Control Over Financial Reporting
Under the supervision and with the participation of our management, including our principal executive officer and principal financial officer, we conducted an evaluation of any changes in our internal control over financial reporting (as such term is defined in Rules 13a-15(f) and 15d-15(f) under the Exchange Act) that occurred during our most recently completed fiscal quarter. Based on that evaluation, our principal executive officer and principal financial officer concluded that there has not been any change in our internal control over financial reporting during that quarter that has materially affected, or is reasonably likely to materially affect, our internal control over financial reporting.
ITEM 9B. Other Information.
None.
136
PART III
ITEM 10. Directors, Executive Officers and Corporate Governance.
The names of the executive officers of Hewlett Packard Enterprise and their ages, titles and biographies as of the date hereof are incorporated by reference from Part I, Item 1, above.
The following information is included in Hewlett Packard Enterprise's Proxy Statement related to its 2020 Annual Meeting of Stockholders to be filed within 120 days after Hewlett Packard Enterprise's fiscal year end of October 31, 2019 (the "Proxy Statement") and is incorporated herein by reference:
• | Information regarding directors of Hewlett Packard Enterprise including those who are standing for reelection and any persons nominated to become directors of Hewlett Packard Enterprise is set forth under "Corporate Governance—Board Leadership Structure" and/or "Proposals to be Voted On—Proposal No. 1—Election of Directors". |
• | Information regarding Hewlett Packard Enterprise's Audit Committee and designated "audit committee financial experts" is set forth under "Board Structure and Committee Composition—Audit Committee". |
• | Information on Hewlett Packard Enterprise's code of business conduct and ethics for directors, officers and employees, also known as the "Standards of Business Conduct," and on Hewlett Packard Enterprise's Corporate Governance Guidelines is set forth under "Corporate Governance Principles and Board Matters". |
ITEM 11. Executive Compensation.
The following information is included in the Proxy Statement and is incorporated herein by reference:
• | Information regarding Hewlett Packard Enterprise's compensation of its named executive officers is set forth under "Executive Compensation". |
• | Information regarding Hewlett Packard Enterprise's compensation of its directors is set forth under "Director Compensation and Stock Ownership Guidelines". |
• | The report of Hewlett Packard Enterprise's HR and Compensation Committee is set forth under "HR and Compensation Committee Report on Executive Compensation". |
ITEM 12. Security Ownership of Certain Beneficial Owners and Management and Related Stockholder Matters.
The following information is included in the Proxy Statement and is incorporated herein by reference:
• | Information regarding security ownership of certain beneficial owners, directors and executive officers is set forth under "Common Stock Ownership of Certain Beneficial Owners and Management". |
• | Information regarding Hewlett Packard Enterprise's equity compensation plans, including both stockholder approved plans and non-stockholder approved plans, is set forth in the section entitled "Equity Compensation Plan Information". |
ITEM 13. Certain Relationships and Related Transactions, and Director Independence.
The following information is included in the Proxy Statement and is incorporated herein by reference:
• | Information regarding transactions with related persons is set forth under "Transactions with Related Persons". |
• | Information regarding director independence is set forth under "Corporate Governance Principles and Board Matters—Director Independence". |
ITEM 14. Principal Accounting Fees and Services.
Information regarding principal accounting fees and services is set forth under "Principal Accounting Fees and Services" in the Proxy Statement, which information is incorporated herein by reference.
137
PART IV
ITEM 15. Exhibits, Financial Statement Schedules.
(a) | The following documents are filed as part of this report: |
1. All Financial Statements:
The following financial statements are filed as part of this report under Item 8—"Financial Statements and Supplementary Data."
2. Financial Statement Schedules:
All schedules are omitted as the required information is not applicable or the information is presented in the Consolidated Financial Statements and notes thereto in Item 8 above.
3. Exhibits:
A list of exhibits filed or furnished with this Annual Report on Form 10-K (or incorporated by reference to exhibits previously filed or furnished by Hewlett Packard Enterprise) is provided in the accompanying Exhibit Index. Hewlett Packard Enterprise will furnish copies of exhibits for a reasonable fee (covering the expense of furnishing copies) upon request. Stockholders may request exhibits copies by contacting:
Hewlett Packard Enterprise Company
Attn: Investor Relations
6280 America Center Drive
San Jose, CA 95002
138
HEWLETT PACKARD ENTERPRISE COMPANY AND SUBSIDIARIES
EXHIBIT INDEX
Incorporated by Reference | |||||||||||
Exhibit Number | Exhibit Description | Form | File No. | Exhibit(s) | Filing Date | ||||||
2.1 | 8-K | 001-37483 | 2.1 | November 5, 2015 | |||||||
2.2 | 8-K | 001-37483 | 2.2 | November 5, 2015 | |||||||
2.3 | 8-K | 001-37483 | 2.4 | November 5, 2015 | |||||||
2.4 | 8-K | 001-37483 | 2.5 | November 5, 2015 | |||||||
2.5 | 8-K | 001-37483 | 2.6 | November 5, 2015 | |||||||
2.6 | 8-K | 001-37483 | 2.7 | November 5, 2015 | |||||||
2.7 | 8-K | 001-37483 | 2.1 | May 26, 2016 | |||||||
2.8 | 8-K | 001-37483 | 2.2 | May 26, 2016 | |||||||
2.9 | 8-K | 001-37483 | 2.1 | September 7, 2016 | |||||||
2.10 | 8-K | 001-37483 | 2.2 | September 7, 2016 | |||||||
2.11 | 8-K | 001-37483 | 2.3 | September 7, 2016 | |||||||
2.12 | 8-K | 001-37483 | 2.1 | November 2, 2016 | |||||||
2.13 | 8-K | 001-37483 | 2.2 | November 2, 2016 | |||||||
2.14 | 8-K | 001-37483 | 99.1 | March 7, 2017 | |||||||
139
HEWLETT PACKARD ENTERPRISE COMPANY AND SUBSIDIARIES
Incorporated by Reference | |||||||||||
Exhibit Number | Exhibit Description | Form | File No. | Exhibit(s) | Filing Date | ||||||
2.15 | 8-K | 001-37483 | 99.2 | March 7, 2017 | |||||||
2.16 | 8-K | 001-38033 | 2.1 | April 6, 2017 | |||||||
2.17 | 8-K | 001-38033 | 2.2 | April 6, 2017 | |||||||
2.18 | 8-K | 001-38033 | 2.3 | April 6, 2017 | |||||||
2.19 | 8-K | 001-38033 | 2.4 | April 6, 2017 | |||||||
2.20 | 8-K | 001-38033 | 2.5 | April 6, 2017 | |||||||
2.21 | 8-K | 001-38033 | 2.6 | April 6, 2017 | |||||||
2.22 | 8-K | 001-37483 | 2.1 | September 1, 2017 | |||||||
2.23 | 8-K | 001-37483 | 2.2 | September 1, 2017 | |||||||
2.24 | 8-K | 001-37483 | 2.3 | September 1, 2017 | |||||||
2.25 | 8-K | 001-37483 | 2.4 | September 1, 2017 | |||||||
2.26 | 8-K | 001-37483 | 2.1 | May 17, 2019 | |||||||
3.1 | 8-K | 001-37483 | 3.1 | November 5, 2015 | |||||||
3.2 | 8-K | 001-37483 | 3.2 | November 5, 2015 | |||||||
3.3 | 8-K | 001-37483 | 3.1 | March 20, 2017 | |||||||
140
HEWLETT PACKARD ENTERPRISE COMPANY AND SUBSIDIARIES
Incorporated by Reference | |||||||||||
Exhibit Number | Exhibit Description | Form | File No. | Exhibit(s) | Filing Date | ||||||
3.4 | 8-K | 001-37483 | 3.2 | March 20, 2017 | |||||||
4.1 | 8-K | 001-37483 | 4.1 | October 13, 2015 | |||||||
4.2 | 8-K | 001-37483 | 4.4 | October 13, 2015 | |||||||
4.3 | 8-K | 001-37483 | 4.5 | October 13, 2015 | |||||||
4.4 | 8-K | 001-37483 | 4.6 | October 13, 2015 | |||||||
4.5 | 8-K | 001-37483 | 4.7 | October 13, 2015 | |||||||
4.6 | 8-K | 001-37483 | 4.8 | October 13, 2015 | |||||||
4.7 | 8-K | 001-37483 | 4.2 | September 19, 2018 | |||||||
4.8 | 8-K | 001-37483 | 4.3 | September 19, 2018 | |||||||
4.9 | 8-K | 001-37483 | 4.20 | September 13, 2019 | |||||||
4.10 | 8-K | 001-37483 | 4.30 | September 13, 2019 | |||||||
4.11 | 8-K | 001-37483 | 4.12 | October 13, 2015 | |||||||
141
HEWLETT PACKARD ENTERPRISE COMPANY AND SUBSIDIARIES
Incorporated by Reference | |||||||||||
Exhibit Number | Exhibit Description | Form | File No. | Exhibit(s) | Filing Date | ||||||
4.12 | S-3ASR | 333-222102 | 4.5 | December 15, 2017 | |||||||
10.1 | 8-K | 001-37483 | 10.1 | January 30, 2017 | |||||||
10.2 | 10 | 001-37483 | 10.4 | September 28, 2015 | |||||||
10.3 | S-8 | 333-207679 | 4.3 | October 30, 2015 | |||||||
10.4 | S-8 | 333-207679 | 4.4 | October 30, 2015 | |||||||
10.5 | 8-K | 001-37483 | 10.4 | November 5, 2015 | |||||||
10.6 | 8-K | 001-37483 | 10.7 | November 5, 2015 | |||||||
10.7 | 8-K | 001-37483 | 10.8 | November 5, 2015 | |||||||
10.8 | 8-K | 001-37483 | 10.9 | November 5, 2015 | |||||||
10.9 | 8-K | 001-37483 | 10.10 | November 5, 2015 | |||||||
10.10 | 10-Q | 001-37483 | 10.14 | March 10, 2016 | |||||||
10.11 | 10-Q | 001-37483 | 10.15 | March 10, 2016 | |||||||
10.12 | 8-K | 001-37483 | 10.1 | May 26, 2016 | |||||||
10.13 | S-8 | 333-216481 | 4.3 | March 6, 2017 | |||||||
10.14 | S-8 | 333-217349 | 4.3 | April 18, 2017 | |||||||
10.15 | S-8 | 333-217349 | 4.4 | April 18, 2017 | |||||||
10.16 | S-8 | 333-217438 | 4.3 | April 24, 2017 | |||||||
10.17 | 10-Q | 000-51333 | 10.1 | January 29, 2016 | |||||||
10.18 | 10-K | 000-51333 | 10.48 | February 28, 2007 | |||||||
10.19 | 10-K | 000-51333 | 10.3 | September 10, 2012 | |||||||
10.20 | S-1 | 000-51333 | 10.10 | February 4, 2005 | |||||||
10.21 | S-8 | 333-221254 | 4.3 | October, 31 2017 | |||||||
10.22 | S-8 | 333-221254 | 4.4 | October 21, 2017 | |||||||
10.23 | S-8 | 333-226181 | 4.3 | July 16, 2018 | |||||||
10.24 | 10-Q | 001-37483 | 10.29 | September, 4, 2018 | |||||||
10.25 | 10-Q | 001-37483 | 10.30 | September, 4, 2018 | |||||||
142
HEWLETT PACKARD ENTERPRISE COMPANY AND SUBSIDIARIES
Incorporated by Reference | |||||||||||
Exhibit Number | Exhibit Description | Form | File No. | Exhibit(s) | Filing Date | ||||||
10.26 | 10-K | 001-37483 | 10.27 | December 12, 2018 | |||||||
10.27 | 10-K | 001-37483 | 10.29 | December 12, 2018 | |||||||
10.28 | S-8 | 333-229449 | 4.3 | January 31, 2019 | |||||||
10.29 | 8-K | 001-37483 | 10.1 | August 20, 2019 | |||||||
10.30 | S-8 | 333-234033 | 4.3 | October 1, 2019 | |||||||
10.31 | |||||||||||
21 | |||||||||||
23.1 | |||||||||||
24 | |||||||||||
31.1 | |||||||||||
31.2 | |||||||||||
32 | |||||||||||
101.INS | XBRL Instance Document‡ | ||||||||||
101.SCH | XBRL Taxonomy Extension Schema Document‡ | ||||||||||
101.CAL | XBRL Taxonomy Extension Calculation Linkbase Document‡ | ||||||||||
101.DEF | XBRL Taxonomy Extension Definition Linkbase Document‡ | ||||||||||
101.LAB | XBRL Taxonomy Extension Label Linkbase Document‡ | ||||||||||
101.PRE | XBRL Taxonomy Extension Presentation Linkbase Document‡ | ||||||||||
* Indicates management contract or compensation plan, contract or arrangement
‡ Filed herewith
† Furnished herewith
The registrant agrees to furnish to the Commission supplementally upon request a copy of (1) any instrument with respect to long-term debt not filed herewith as to which the total amount of securities authorized thereunder does not exceed 10% of the total assets of the registrant and its subsidiaries on a consolidated basis and (ii) schedules or exhibits omitted pursuant to Item 601(b)(2) of Regulation S-K of any material plan of acquisition, disposition or reorganization set forth above.
143
SIGNATURES
Pursuant to the requirements of Section 13 or 15(d) of the Securities Exchange Act of 1934, the registrant has duly caused this report to be signed on its behalf by the undersigned, thereunto duly authorized.
Date: | December 12, 2019 | HEWLETT PACKARD ENTERPRISE COMPANY | ||
By: | /s/ Tarek A. Robbiati | |||
Tarek A. Robbiati Executive Vice President and Chief Financial Officer | ||||
POWER OF ATTORNEY
KNOW ALL PERSONS BY THESE PRESENTS, that each person whose signature appears below constitutes and appoints Tarek A. Robbiati, John F. Schultz and Rishi Varma, or any of them, his or her attorneys-in-fact, for such person in any and all capacities, to sign any amendments to this report and to file the same, with exhibits thereto, and other documents in connection therewith, with the Securities and Exchange Commission, hereby ratifying and confirming all that either of said attorneys-in-fact, or substitute or substitutes, may do or cause to be done by virtue hereof.
Pursuant to the requirements of the Securities Exchange Act of 1934, this report has been signed below by the following persons on behalf of the registrant and in the capacities and on the dates indicated
144
Signature | Title(s) | Date | ||
/s/ Antonio F. Neri | President and Chief Executive Officer (Principal Executive Officer) | December 12, 2019 | ||
Antonio F. Neri | ||||
/s/ Tarek A. Robbiati | Executive Vice President and Chief Financial Officer (Principal Financial Officer) | December 12, 2019 | ||
Tarek A. Robbiati | ||||
/s/ Jeff T. Ricci | Senior Vice President and Controller (Principal Accounting Officer) | December 12, 2019 | ||
Jeff T. Ricci | ||||
/s/ Patricia F. Russo | Chairman | December 12, 2019 | ||
Patricia F. Russo | ||||
/s/ Daniel L. Ammann | Director | December 12, 2019 | ||
Daniel L. Ammann | ||||
/s/ Michael J. Angelakis | Director | December 12, 2019 | ||
Michael J. Angelakis | ||||
/s/ Pamela L. Carter | Director | December 12, 2019 | ||
Pamela L. Carter | ||||
/s/ Jean M. Hobby | Director | December 12, 2019 | ||
Jean M. Hobby | ||||
/s/ George R. Kurtz | Director | December 12, 2019 | ||
George R. Kurtz | ||||
/s/ Raymond J. Lane | Director | December 12, 2019 | ||
Raymond J. Lane | ||||
/s/ Ann M. Livermore | Director | December 12, 2019 | ||
Ann M. Livermore | ||||
/s/ Raymond E. Ozzie | Director | December 12, 2019 | ||
Raymond E. Ozzie | ||||
/s/ Gary M. Reiner | Director | December 12, 2019 | ||
Gary M. Reiner | ||||
/s/ Lip-Bu Tan | Director | December 12, 2019 | ||
Lip-Bu Tan | ||||
/s/ Mary Agnes Wilderotter | Director | December 12, 2019 | ||
Mary Agnes Wilderotter | ||||
145