UNITED STATES
SECURITIES AND EXCHANGE COMMISSION
Washington, D.C. 20549
FORM
(Mark One)
|
|
ANNUAL REPORT PURSUANT TO SECTION 13 OR 15(d) OF THE SECURITIES EXCHANGE ACT OF 1934 |
For the fiscal year ended
OR
|
|
TRANSITION REPORT PURSUANT TO SECTION 13 OR 15(d) OF THE SECURITIES EXCHANGE ACT OF 1934 FOR THE TRANSITION PERIOD FROM TO . |
Commission File Number
(Exact name of Registrant as specified in its Charter)
|
Bailiwick of |
|
Not Applicable |
|
(State or other jurisdiction of incorporation or organization) |
|
(I.R.S. Employer Identification No.) |
|
|
|
|
|
(Address of principal executive offices) |
|
(Zip Code) |
Registrant’s telephone number, including area code: (
Securities registered pursuant to Section 12(b) of the Act:
|
(Title of each class) |
(Trading Symbol) |
(Name of each exchange on which registered) |
|
|
|
|
Securities registered pursuant to Section 12(g) of the Act:
None
(Title of class)
Indicate by check mark if the registrant is a well-known seasoned issuer, as defined in Rule 405 of the Securities Act.
Indicate by check mark if the registrant is not required to file reports pursuant to Section 13 or 15(d) of the Act. Yes ☐
Indicate by check mark whether the registrant: (1) has filed all reports required to be filed by Section 13 or 15(d) of the Securities Exchange Act of 1934 during the preceding 12 months (or for such shorter period that the registrant was required to file such reports), and (2) has been subject to such filing requirements for the past 90 days.
Indicate by check mark whether the registrant has submitted electronically every Interactive Data File required to be submitted pursuant to Rule 405 of Regulation S-T (§232.405 of this chapter) during the preceding 12 months (or for such shorter period that the registrant was required to submit such files).
Indicate by check mark whether the registrant is a large accelerated filer, an accelerated filer, a non-accelerated filer, smaller reporting company, or an emerging growth company. See the definitions of “large accelerated filer,” “accelerated filer,” “smaller reporting company,” and “emerging growth company” in Rule 12b-2 of the Exchange Act.
|
|
☒ |
|
|
Accelerated filer |
|
☐ |
|
Non-accelerated filer |
☐ |
|
|
Smaller reporting company |
|
|
|
|
|
|
|
Emerging growth company |
|
|
If an emerging growth company, indicate by check mark if the registrant has elected not to use the extended transition period for complying with any new or revised financial accounting standards provided pursuant to Section 13(a) of the Exchange Act. ☐
Indicate by check mark whether the registrant has filed a report on and attestation to its management’s assessment of the effectiveness of its internal control over financial reporting under Section 404(b) of the Sarbanes-Oxley Act (15 U.S.C.7262(b)) by the registered public accounting firm that prepared or issued its audit report.
Indicate by check mark whether the registrant is a shell company (as defined in Rule 12b-2 of the Exchange Act). Yes
The aggregate market value of the voting and non-voting common equity held by non-affiliates of the registrant, based on the closing price of our ordinary shares on the Nasdaq Global Select Market on September 30, 2020, the last business day of the registrant’s second fiscal quarter, was approximately $
The number of registrant’s ordinary shares outstanding as of May 20, 2021 was
DOCUMENTS INCORPORATED BY REFERENCE
Portions of the registrant’s Definitive Proxy Statement relating to the 2021 Annual General Meeting of Shareholders of Mimecast Limited, expected to be held on October 6, 2021, are incorporated by reference into Part III of this Annual Report on Form 10-K. The Definitive Proxy Statement will be filed with the Securities and Exchange Commission within 120 days of the registrant’s fiscal year ended March 31, 2021. Except with respect to information specifically incorporated by reference into this Annual Report on Form 10-K, the Definitive Proxy Statement is not deemed to be filed as part of this Annual Report on Form 10-K.
Table of Contents
|
|
|
Page |
|
PART I |
|
|
|
|
1 |
|
|
|
Summary of the Material and Other Risks Associated with Our Business |
1 |
|
Item 1. |
4 |
|
|
Item 1A. |
19 |
|
|
Item 1B. |
39 |
|
|
Item 2. |
39 |
|
|
Item 3. |
39 |
|
|
Item 4. |
39 |
|
|
|
|
|
|
PART II |
|
|
|
Item 5. |
40 |
|
|
Item 6. |
41 |
|
|
Item 7. |
Management’s Discussion and Analysis of Financial Condition and Results of Operations |
42 |
|
Item 7A. |
64 |
|
|
Item 8. |
66 |
|
|
Item 9. |
Changes in and Disagreements With Accountants on Accounting and Financial Disclosure |
101 |
|
Item 9A. |
101 |
|
|
Item 9B. |
103 |
|
|
|
|
|
|
PART III |
|
|
|
Item 10. |
104 |
|
|
Item 11. |
104 |
|
|
Item 12. |
Security Ownership of Certain Beneficial Owners and Management and Related Stockholder Matters |
104 |
|
Item 13. |
Certain Relationships and Related Transactions, and Director Independence |
104 |
|
Item 14. |
104 |
|
|
|
|
|
|
PART IV |
|
|
|
Item 15. |
105 |
|
|
Item 16. |
110 |
|
|
|
111 |
SPECIAL NOTE REGARDING FORWARD-LOOKING STATEMENTS
This Annual Report on Form 10-K contains forward-looking statements within the meaning of the Private Securities Litigation Reform Act of 1995. All statements contained in this Annual Report on Form 10-K other than statements of historical fact, including but not limited to statements regarding our future results of operations and financial position, our business strategy and plans, our objectives for future operations, the impact the global COVID-19 pandemic may have on our business, and the impact of our recent security incident, are forward-looking statements. These statements involve known and unknown risks, uncertainties and other important factors that may cause our actual results and performance to be materially different from any future results or performance expressed or implied by the forward-looking statements. The words “believe,” “may,” “will,” “estimate,” “guidance,” “continue,” “anticipate,” “intend,” “expect,” “predict,” “probable,” “potential,” “can,” “could,” “should,” “contemplate,” “would,” “project,” “seek,” “target,” “might,” “explore,” “plan,” “strategy,” and similar expressions or variations that are not statements of historical fact are intended to identify forward-looking statements, although not all forward-looking statements contain these identifying words.
You should not rely on forward-looking statements as predictions of future events. We have based the forward-looking statements contained in this Annual Report on Form 10-K primarily on our current expectations and projections about future events and trends that we believe may affect our business, financial condition, operating results and prospects. The outcome of the events described in these forward-looking statements are subject to risks, uncertainties and other factors described below in the “Summary of the Material and Other Risks Associated with Our Business” and in Part I, Item 1A, “Risk Factors” in this Annual Report on Form 10-K. Moreover, we operate in a very competitive and rapidly changing environment. New risks and uncertainties emerge from time to time, and it is not possible for us to predict all risks and uncertainties that could have an impact on the forward-looking statements contained in this Annual Report on Form 10-K. We cannot assure you that the results, events and circumstances reflected in the forward-looking statements will be achieved or occur, and actual results, events or circumstances could differ materially from those described in the forward-looking statements.
The forward-looking statements made in this Annual Report on Form 10-K relate only to events as of the date on which the statements are made. We undertake no obligation to update any forward-looking statements made in this Annual Report on Form 10-K to reflect events or circumstances after the date of this Annual Report on Form 10-K or to reflect new information or the occurrence of unanticipated events, except as required by law. We may not actually achieve the plans, intentions, or expectations disclosed in our forward-looking statements and you should not place undue reliance on our forward-looking statements.
***********************
Summary of the Material and Other Risks Associated with Our Business
Business and Operational Risks
|
|
• |
Data security and integrity are critically important to our business, and breaches of our information and technology networks and unauthorized access to a customer’s data, including our recent security incident, could harm our business and operating results. |
|
|
• |
The global COVID-19 pandemic has had, and will likely continue to have, certain negative impacts on our business, financial results and operations. |
|
|
• |
If we are unable to attract new customers, sell additional services, features and products to our existing customers, and retain customers, our business and results of operations will be affected adversely. |
|
|
• |
The markets in which we participate are highly competitive, and our failure to compete successfully would make it difficult for us to add and retain customers and would reduce or impede the growth of our business. |
|
|
• |
If we are unable to effectively increase sales to large enterprises, our business, financial position and results of operations may suffer. |
|
|
• |
Our business and results of operations may be negatively impacted by the United Kingdom’s withdrawal from the European Union. |
|
|
• |
We must maintain successful relationships with our channel partners. |
|
|
• |
Any serious disruptions in our services may cause us to lose revenue and market acceptance and may affect the service level commitments under our subscription agreements, which could obligate us to provide refunds. |
1
|
|
• |
We have acquired, and may acquire in the future, other businesses, products or technologies, which could require significant management attention, disrupt our business, dilute shareholder value and adversely affect our results of operations. |
|
|
• |
If we are not able to provide successful updates, enhancements and features to our technology to, among other things, keep up with emerging cyber threats and customer needs, our business could be adversely affected. |
|
|
• |
We are subject to a number of risks associated with global sales and operations. |
|
|
• |
Our research and development efforts may not produce new services or enhancements to existing services. |
|
|
• |
We employ third-party licensed software for use in or with our services, and the inability to maintain these licenses or errors or vulnerabilities in the software we license could result in increased costs, reduced service levels or security risks, which would adversely affect our business. |
|
|
• |
Interruptions or performance problems associated with our information and technology infrastructure could impair the delivery of our services and harm our business. |
Legal and Regulatory Risks
|
|
• |
Data privacy concerns, evolving regulations of cloud computing, cross-border data transfer restrictions and other domestic or foreign laws and regulations may limit the use and adoption of, or require modifications to, our products and services, and violations such laws and regulations could materially adversely impact our business. |
|
|
• |
We are subject to governmental export controls and funds dealings restrictions that could impair our ability to compete in certain international markets and subject us to liability if we are not in full compliance with applicable laws. |
|
|
• |
We may become involved in litigation that may materially adversely affect us. |
Human Capital Risks
|
|
• |
We are dependent on the continued services and performance of our key employees, including our co-founder. |
|
|
• |
If we are unable to hire, retain and motivate qualified personnel, our business may be adversely impacted. |
|
|
• |
Our recent workforce reduction may adversely affect our business. |
Risks Related to Intellectual Property
|
|
• |
Third parties have sued us for alleged infringement of their proprietary rights. |
|
|
• |
Failure to protect our intellectual property rights could impair our ability to protect our technology and our brand. |
|
|
• |
Our employees may disclose our trade secrets and other proprietary information. |
|
|
• |
Our employees or contractors may wrongfully use alleged trade secrets or confidential information of their former employers or other parties. |
|
|
• |
The use of open source software in our offerings may expose us to additional risks, including security risks, and harm our intellectual property. |
Financial Risks
|
|
• |
Because we recognize revenue from subscriptions for our services over the term of the agreement, downturns or upturns in new business may not be immediately reflected in our operating results and may be difficult to discern. |
|
|
• |
We have incurred net losses in the past, and we may not be able to sustain profitability. |
|
|
• |
Fluctuations in currency exchange rates could adversely affect our business. |
|
|
• |
Financial covenants and other restrictions under our credit facility create default risks and reduce our flexibility. |
|
|
• |
We must maintain the adequacy of internal controls over financial reporting. |
2
Tax Risks
|
|
• |
We are a multinational organization faced with increasingly complex tax issues in many jurisdictions, including issues related to our tax residence, allocations of our taxable income among our subsidiaries, and limitations on our use of net operating losses or tax credit carryforwards. |
Risks Related to Owning Our Ordinary Shares and Our Organization in Jersey, Channel Islands
|
|
• |
Our share price has been and may continue to be volatile based on many factors, many of which are not within our control. |
|
|
• |
If securities or industry analysts cease to publish research or publish inaccurate or unfavorable research about our business, our share price and trading volume could decline. |
|
|
• |
We do not expect to pay dividends and investors should not buy our ordinary shares expecting to receive dividends. |
|
|
• |
The rights afforded to our shareholders are governed by Jersey law. Not all rights available to shareholders under English law or U.S. law will be available to shareholders, potentially including the ability to enforce civil liabilities against us. |
The summary described above should be read together with the text of the full risk factors below and in the other information set forth in this Annual Report on Form 10-K, including our consolidated financial statements and the related notes, as well as in other documents that we file with the Securities and Exchange Commission. If any such risks and uncertainties actually occur, our business, prospects, financial condition and results of operations could be materially and adversely affected. The risks summarized above or described in full below are not the only risks that we face. Additional risks and uncertainties not currently known to us, or that we currently deem to be immaterial may also materially adversely affect our business, prospects, financial condition and results of operations. For more information on these risk factors, see Part I, Item 1A, “Risk Factors” included in this Annual Report on Form 10-K.
***********************
As used in this Annual Report on Form 10-K, the terms “Mimecast,” “Company,” “Registrant,” “we,” “us,” and “our” mean Mimecast Limited and its subsidiaries, unless the context indicates otherwise.
Certain amounts and percentages that appear in this Annual Report on Form 10-K have been subject to rounding adjustments. As a result, certain numerical figures shown as totals, including in tables, may not be exact arithmetic aggregations of the figures that precede or follow them.
3
PART I
Item 1. Business.
Overview
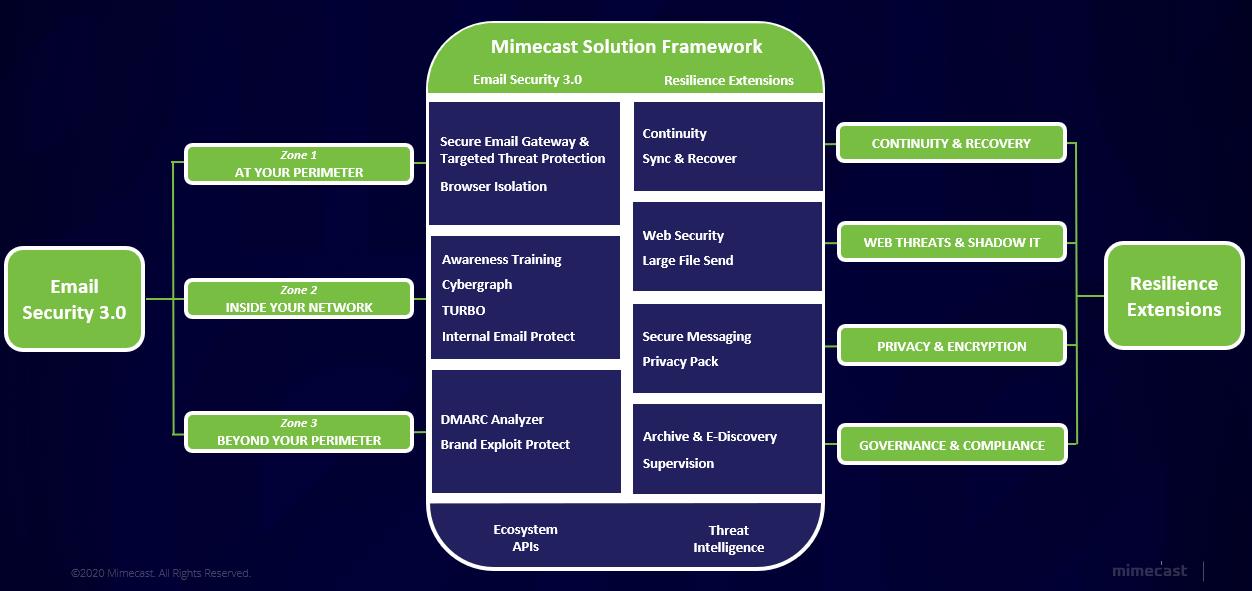
We are a leading global provider of next generation cloud security and risk management services for email and corporate information. Our integrated suite of proprietary cloud services protects customers of all sizes from the significant business and data security risks they are exposed to through their email and other corporate systems. Our Email Security 3.0 and Cyber Resilience Extension offerings are designed to protect customers from today’s rapidly changing security environment.
The threat landscape and the resulting opportunity for disruption have evolved significantly over the last several years. Organizations of all sizes are increasingly dependent on digital technology and corporate systems that often extend beyond the perimeter of their organization. These systems typically do not operate in a stand-alone environment but instead are connected with and rely upon other systems, many of which are outside the organization’s control. Finally, an everchanging and increasingly complex regulatory environment places significant compliance burdens on organizations and subjects them to harsh penalties in the event of failure. These evolving trends, dependencies, interdependencies and regulatory burdens, have increased the potential impact of disruption caused by perennial risks, such as malicious action, human error and technological failure.
We developed our proprietary cloud architecture to offer customers a comprehensive cyber resilience strategy. Our Email Security 3.0 strategy addresses threats in three distinct zones: at the email perimeter (Zone 1); inside the network and the organization (Zone 2); and beyond the perimeter (Zone 3). Additionally, our Cyber Resilience Extensions expand resilience to other critical elements of an organization’s digital infrastructure.
Our primary offerings include the following features and functionality:
|
|
• |
Email security, which provides a critical defense against hackers seeking to capture and exploit valuable organizational information and disrupt business operations. Email is a powerful attack vector and data leak concern. |
|
|
• |
Continuity and sync & recover, which ensure employees can continue using email during unexpected and planned outages and restore their data should it become compromised or corrupted by a threat actor or through other causes of disruption. |
|
|
• |
Archiving, which unifies email data to support e-discovery, forensic analysis, and compliance initiatives, while also giving employees fast access to their personal archive, which improves productivity. |
|
|
• |
Awareness training, which addresses organizational risk by engaging employees as part of the security solution by combining effective, modern, and engaging training videos and techniques while also providing advanced analytics on user and organizational risk based on behavior and other relevant inputs. Employee errors are one of the leading causes of cybersecurity incidents. |
|
|
• |
Web security, which protects against malicious web activity and enables customers to block access to inappropriate websites and track employee engagement in shadow information technology, or IT, solutions that can also create security risks. |
|
|
• |
DMARC analyzer, which allows our customers to more effectively implement and manage complex domain-based message authentication reporting and conformance, or DMARC, deployments by providing greater visibility and improved governance across all email channels. |
|
|
• |
Brand exploit protection, which provides continuous, proactive monitoring for fake websites being used to launch phishing attacks exploiting an organization’s brand credibility and trusted relationship with its customers or other stakeholders in the supply chain. Our functionality detects and intercepts these attacks in their early stages, blocking them before they can launch, and quickly remediating them if they have gone live to minimize damage they can cause. |
|
|
• |
Threat intelligence and our application programming interfaces, or API, ecosystem, which enable organizations to monitor activity throughout their organization and remediate in the event an attack occurs. Our integrations with major cybersecurity providers enable a more integrated, automated and effective approach to monitoring, detecting and remediating threats while managing user and organizational risk more proactively. Additionally, customers are able to integrate their own threat intelligence data from third-party systems into our platform to augment their layers of defense. |
Historically, our focus has been email security given the critical role of email for organizations of all sizes. Protecting and managing email has become more complicated due to expanding security and compliance requirements and the rapid increase in both the volume and the importance of the information transmitted via email. Organizations are increasingly at risk from security breaches of sensitive data as sophisticated email-based attacks or data leaks have become far more common than in the past. Additionally,
4
organizations are not using email only for communication. Email archives are used as an active repository of vital corporate information needed to meet compliance and regulatory requirements and ensure employee productivity. As a result, email represents one of the highest concentrations of business risk that organizations face.
Traditional approaches to addressing risks arising from email and other corporate data leave customers managing disparate point solutions from multiple vendors that are often difficult to use, costly to manage, and difficult to scale. These siloed solutions running on disparate technology platforms are by themselves unable to fully address advanced threats, which have become significantly more sophisticated by leveraging multiple vectors or communication channels that might include traditional email combined with websites or other vehicles. These blended attacks have made it more difficult to see all activity across the organization and remediate quickly should an attack occur. The resulting infrastructure complexity caused by disparate products and legacy architectures also makes it difficult to move more IT workloads to the cloud, which continues to be an increasing priority for organizations of all sizes.
Our offerings, except DMARC Analyzer, Brand Exploit Protect and Cyber Graph, are delivered from one, easy-to-use platform, and our integrated services simplify ongoing management and service deployment. As a result, our customers can decommission the often costly and complex point solutions and on-premises technology they have traditionally used to address these risks and address their business needs in a way that is more automated and cost effective.
We serve approximately 39,900 customers and protect millions of their employees around the world. Our services scale effectively to meet the needs of customers of all sizes. We sell our services through direct sales efforts and through our channel partners. Our sales model is designed to meet the needs of organizations of all sizes across a wide range of industries, and we currently serve customers in approximately 100 countries. For the fiscal years ended March 31, 2021, 2020 and 2019, our revenue was $501.4 million, $427.0 million and $340.4 million, respectively.
Our Growth Strategy
Our growth strategy is focused on acquiring new customers, particularly in the enterprise segment of our market; driving revenue growth from our existing customer base; developing our technology and releasing new services, including ensuring that our technology and solutions are scalable and easy-to-use and deploy; actively investing in our channel partner network; strategically expanding our geographic presence; and pursuing growth, technology and talent through acquisitions.
Our Solutions
Our integrated suite of cloud services is designed to offer true cyber resilience for email, web and corporate data. We protect customers and their data from the growing threat of email attacks through malware, spam, data leaks, and advanced threats such as phishing and impersonation attacks. Our continuity services ensure email and corporate information remain available in the event of a primary system failure or scheduled maintenance downtime and our sync & recover offering provides backup and restore functionality in the event that data has been compromised. We also help organizations securely and cost effectively archive their growing email and file repositories to support employee productivity, compliance, and e-discovery.
Our customers benefit from:
|
|
• |
Comprehensive Solutions in a Single, Unified Cloud Service. Our services integrate a range of technologies into a comprehensive service that would otherwise require an array of individual devices or services from multiple vendors. We believe that customers should not have to compromise the quality of these solutions in order to benefit from integration. |
|
|
• |
Flexible Scale for Organizations of All Sizes. Our cloud service is built to address the most demanding scale, performance, and availability requirements of large enterprises through a subscription-based cloud service that also puts these capabilities within reach of small and mid-market organizations. We meet demanding continuity service commitments with data centers that are replicated in each of our primary geographies and operate in active-active mode, enabling fast failover and fail-back as required. |
|
|
• |
Simplified Deployment and Operation. Our service is designed to be easy to deploy and operate. Customers simply route their email traffic through our cloud and can be up and running in a fast and efficient manner. We then enable our customers to add or delete new services and manage all security and other policies centrally via a single web-based administration console that significantly simplifies the ongoing management of their email and data environment. |
|
|
• |
Highly Agile and Adaptable Service with Continuous Innovation. Our common code base and multi-tenant cloud architecture enables us to perform maintenance updates and add new features or products without interruption to our customers. Continuous service development and multi-tenant rapid deployment also allows us to keep pace with emerging |
5
|
|
threats to protect customers and respond quickly to changing needs. Additionally, we seek to continually improve our cloud architecture and services and add new capabilities into existing solutions. |
|
|
• |
Facilitate the Movement of Additional Critical Workloads to the Cloud. For those customers that want to put more workloads into the cloud, our technology facilitates the migration of email by removing the complexity that has stalled many customers to date. Our interoperability with cloud-based email services, such as Microsoft® Office® 365®, makes this easier to achieve and helps mitigate remaining concerns about the reliance of single-vendor security, data integrity, and continuity. Our data ingestion offering also allows customers to more easily migrate legacy data from email and other systems into our cloud archive to ensure it is a complete record of current and historic data. |
|
|
• |
Efficacy Powered by Global Community Defense and Intelligence. Our global customer base encompassing multiple industries and large, mid-market and small organizations provides significant threat intelligence across our environment, which enables us to more quickly remediate malicious activity. Additionally, our Email Security 3.0 platform enables us to monitor and act across all three zones, fortifying the core email defense system with additional threat data from our web security, DMARC Analyzer and Brand Exploit Protect solutions. Our scale enables us to benchmark organizations against their peers, providing insight into their risk posture based on a geography, industry and size that informs actions that can help customers proactively improve their security posture. |
|
|
• |
Streamlined Cost and Complexity Resulting in Compelling Return on Investment. Our unified, cloud-based services enable our customers to decommission a range of legacy and disparate technologies that support their email server and data environment and recover these costs. We utilize hardware efficiently and share a single instance of operating software, as well as storage and processing hardware, securely across the whole customer base within each data center, allowing us to deliver cloud-scale economic and performance benefits to our customers. |
|
|
• |
Support and Service Model. Our services and support offering model is repeatedly recognized as an industry leading approach. While this is important in all technology categories, it is particularly critical in cybersecurity due to the significant complexity and risk imposed on organizations struggling to keep pace and respond to threats and regulatory demands. |
Our Technology
We have developed a native cloud architecture, including our own proprietary software-as-a-service, or SaaS, operating system, known as Mime | OS™, and customer-facing services to help organizations achieve cyber resilience and compliance as part of a broader risk management strategy. We continuously augment and expand the core capabilities of Mime | OS™ and integrate acquired technology.
We have a proven record of performing successfully at considerable scale and addressing rapidly growing customer demands. We process approximately 766 million emails per day and manage approximately 498 billion emails in total with our service. We archive approximately 109 petabytes of customer data and add approximately 107 terabytes of customer data per month.
Our Proprietary Native Cloud Architecture— Mime | OS™
We developed Mime | OS™ for native cloud services. Mime | OS™ enables secure multi-tenancy and takes advantage of the cost and performance benefits of using industry-standard hardware and resource sharing specifically for the secure management of email and data. This enables us to provision efficiently and securely across our customer base, minimizing the impact of spare or over-provisioned processing and storage capacity and reducing the cost of providing our services.
Mime | OS™ comprises 20+ microservices that control the hardware, storage, indexing, processing, services, administrator, and user interface layers of our cloud environment. We designed it to enable us to scale our storage, processing, and services to meet large enterprise-level email and data demands, while retaining the cost and performance benefits of a native cloud environment.
Mime | OS™ also streamlines our customer application development and enables strong integration across our services. All of our customer applications and services, except DMARC Analyzer, Brand Exploit Protect, and Cyber Graph, use Mime | OS™ to interact with our data stores and processing technology, as well as interoperate effectively with each other.
6
Continuous Development Methodology and Multi-Tenancy Advantage
As we enhance and expand our technology, we can update services centrally with little or no intervention required by the customer, as each customer shares the same core operating and application software. Improvements, upgrades, new products or patches are applied once and are available immediately across our service to all customers. That means we have only one up-to-date version of our primary service to maintain and support, as well as a common data store for all customers that simplifies management, support, and product development.
Our commitment to continual improvement in Mime | OS™, our customer applications, and our hardware infrastructure means we are constantly strengthening the performance of our service as we scale. We roll out upgrades and enhancements centrally that benefit our customers without the need for additional infrastructure investment on their part.
Our Global Data Center Grid and Points of Presence
We operate nine highly available grids in sixteen locations around the world to deliver our services. This gives customers geographic and jurisdictional control over data location, which enables them to address data privacy concerns. Each grid is exclusive to a region and comprises two identical data centers that function in active-active mode in different locations and are built with N+1 resiliency to meet our continuity of service commitments. Because of this redundancy, we can switch operations from one data center to another to maintain our customers’ email and data services in the event of downtime or maintenance for one of the data centers. We have developed a modular approach to provisioning a new data center and can transition among data centers as needed in existing or new geographies.
Each of the above sixteen locations, along with an additional dedicated seventeenth location, also operates as an individual point of presence, or PoP, to deliver our Web Security services. These services are delivered to customers from the geographically closest PoP within their region. In the event of a PoP outage, customers are served from next closest PoP within their region to maintain continuity of service.
We use other third-party cloud hosting providers to support certain of our services, including DMARC Analyzer, Brand Exploit Protect, and Cyber Graph.
Our Services
The offerings within the Mimecast Solution Framework, include Email Security 3.0, which offers three zones of protection, including at the email perimeter (Zone 1); inside the network and the organization (Zone 2); and beyond the email perimeter (Zone 3). Additionally, our Solution Framework includes Cyber Resilience Extensions, which include continuity and synch & recover, web security, and archiving. Our solutions are designed to protect customer data and provide organizations with comprehensive risk management in a single, cloud-based, integrated service, which is licensed on a subscription basis.
7
Our primary offerings include:
|
|
• |
Mimecast Email Security 3.0 service protects against the delivery of malware, malicious URLs and attachments, spam, viruses, impersonation attacks, phishing, and spear-phishing attacks, including business email compromise, identity theft, extortion, fraud, and other emerging attacks, while also preventing data leaks and other internal threats. Our Email Security 3.0 offerings also include awareness training, which addresses security risks associated with the activities of employees by combining effective and engaging training techniques with predictive analytics that generate an individual user and organizational risk score, DMARC Analyzer, which allows our customers to more effectively implement and manage complex DMARC deployments, and Brand Exploit Protect, which provides integrated brand exploitation protection. |
|
|
• |
Mimecast Mailbox Continuity and Sync & Recover services ensure employees can continue using email during unexpected and planned outages such as system maintenance, whether their email is managed in the cloud or on-premises. In the event that data has been compromised the backup and restore service ensures the integrity and availability of critical corporate information. |
|
|
• |
Mimecast Enterprise Information Archiving unifies email data to support e-discovery, forensic analysis, and compliance initiatives, and gives employees fast access to their personal archive via PC, Mac® and mobile apps. |
|
|
• |
Mimecast Web Security service protects against malicious web activity initiated by user action or malware and blocks access to inappropriate websites based on acceptable use policies. The service also provides proactive visibility into shadow IT, which can impose significant risk and cost on organizations. |
Mimecast Email Security 3.0
Our Email Security 3.0 offering provides a comprehensive form of protection against email attacks by helping customers advance from perimeter email security to a comprehensive, more pervasive discipline. Our approach addresses threats in three distinct zones: at the email perimeter (Zone 1); inside the network and the organization (Zone 2); and beyond the email perimeter (Zone 3).
Zone 1: At the Email Perimeter
Mimecast Secure Email Gateway provides a critical defense against hackers seeking to capture and exploit valuable organizational information and disrupt business operations. Our Mimecast Email Security services block spam, malware, malicious URLs, spear-phishing, and defined content from entering or exiting the organization. Further, these services provide administrators granular security and content policy control for inbound and outbound email traffic to help protect against cyber threats and data leaks. Integration into Microsoft Outlook® and via mobile apps provides employees the freedom to be self-sufficient and to manage their quarantines, personal blacklists, and many other aspects of their email security and management. Through our advanced data leak protection and content controls, organizations can prevent the inadvertent or malicious loss of sensitive corporate data. Policies using keywords, pattern matching, file hashes, and dictionaries actively scan all email communications, including file attachments, to stop data leakage and support compliance. Suspect emails can be blocked, quarantined for review by administrators, or sent securely.
We protect inbound and outbound email from malware, spam, advanced persistent threats, email denial of service and distributed denial of service, or DDoS, data leaks, and other security threats.
Inbound email is directed through Mimecast Email Security, which performs comprehensive security checks before the email is delivered to the customer’s email infrastructure. This prevents unwanted email from reaching the customer in the first place and cluttering their infrastructure, unlike on-premises services from competitors. Each day, we monitor approximately 1.2 billion messages and deliver, on average, less than 36% of those messages to the customer.
Outbound email sent from the customer also passes through our service and is checked before being sent on to prevent it from presenting a security threat to the recipient. Outbound email can also be encrypted and scanned by our comprehensive content controls to prevent confidential documents or data leaving the business. Data leak prevention is a key consideration for all organizations, particularly in highly regulated industries such as healthcare.
8
Customers can benefit from the following Mimecast Email Security services:
|
|
• |
Targeted Threat Protection: Highly sophisticated targeted attacks, including spear-phishing, are using email to successfully infiltrate organizations, exploit users, and steal valuable intellectual property, customer data, and money. |
|
|
• |
URL Protect addresses the threat from emails containing malicious links. It automatically checks hyperlinks each time they are clicked, preventing employees from visiting malicious websites regardless of what email client or device they are using. It also includes innovative user awareness capabilities so IT teams can raise the security awareness of employees as part of their daily email activities. |
|
|
• |
Attachment Protect reduces the threat from weaponized or malware-laden attachments used in spear-phishing and other advanced attacks. It includes pre-emptive sandboxing to automatically security check email attachments before they are delivered to employees. It also includes the option of an innovative safe file conversion capability that automatically converts attachments into a safe file format, neutralizing any chance of malware. |
|
|
• |
Impersonation Protect gives instant and comprehensive protection from malware-less social engineering attacks, often called CEO fraud, whaling, impersonation, or business email compromise. Impersonation Protect detects and prevents these types of attacks by identifying combinations of key indicators in an email to determine if the content is likely to be suspicious, even in the absence of a URL or attachment. Impersonation Protect blocks or flags suspicious email by using advanced scanning techniques to identify elements commonly used by criminals, including employee, domain, or reply-to names, and other keywords such as ‘wire transfer,’ ‘tax form’, or ‘urgent.’ |
Zone 2: Inside the Network and the Organization
Internal Email Protect, or IEP, allows customers to monitor, detect, and remediate security threats that originate from within their internal email systems. This capability provides for the scanning of attachments, URLs, and content in internally generated email. In addition, IEP includes the ability to automatically remediate infected email from a user’s inbox.
Mimecast Awareness Training allows our customers to address security risks associated with the activities of their employees. By combining effective and engaging training techniques with predictive analytics, Mimecast Awareness Training addresses a customer’s vulnerability to human error. Through leveraging advanced risk scoring, customers can deliver personalized training regimens or tailor system permissions and access for individual employees based on risky behavior and the likelihood of being targeted for attack. The risk scoring also helps organizations better understand their overall risk environment and potential exposure.
Cyber Graph stops intended targets inadvertently disclosing critical information that could be used in a social engineering attack. It detects sophisticated, highly targeted email threats using machine learning and identity graph technology to identify anomalies in sender and recipient behaviors that could be indicative of a malicious email. Users are engaged with contextual, dynamic warning banners embedded in suspicious emails.
Zone 3: Beyond the Email Perimeter
DMARC Analyzer allows our customers to more effectively implement and manage complex DMARC deployments, providing greater visibility and improved governance across all email channels.
Brand Exploit Protect provides customers with an integrated brand exploitation protection solution that helps prevent attackers from tricking customers and partners with fake websites by detecting brand attacks in their early stages, blocking them before they can launch, and quickly remediating them if they have gone live.
Cyber Resilience Extensions
Mimecast Enterprise Information Archiving
Our cloud archive consolidates into one store all inbound, outbound, and internal email, including attachments, in a perpetual, indexed, and secure archive. Using our Mimecast Enterprise Information Archiving service, customers can also incorporate legacy data from additional archives into the same searchable store.
All data is encrypted and preserved within a Write Once Read Many, or WORM, state. Proprietary indexing and retrieval solutions allow customers to search individual mailboxes or the entire corporate archive. Our mobile, tablet, desktop, and web applications ensure that employees can search and make the best use of their entire corporate archive in a fast, reliable, and informative way. Intensive logging services cover the use of the archive, and roles and permissions govern what employees can see in the archive based on their role. Our purpose-built ingestion and export services support rapid high-volume extraction, scrubbing, and loading of significant quantities of data. Our archive solution retains metadata that arises from gateway and continuity operations and
9
we preserve both received and altered variants of emails that pass through our secure email gateway. Retention options for customers range from individual retentions to data retained for a customer’s entire email infrastructure on a perpetual basis.
Customers can also purchase the following additional services as part of our Mimecast Enterprise Information Archiving offering:
|
|
• |
Archive Power Tools: This is a series of advanced archiving tools including: |
|
|
• |
Mimecast Storage Management for Exchange: This enables active mailbox size management, so administrators can optimize email system performance, control costs, and support archive policy enforcement. |
|
|
• |
Mailbox and Folder Tools for Exchange: In an email continuity event or when searching for archived content, access to folder structures and shared mailbox content is key to productivity. This tool makes it easy to replicate individual and shared mailbox folders. |
|
|
• |
Granular Retention Management: Mimecast Granular Retention Management enables IT teams to centrally apply policies to manage the retention of email content and related metadata. |
|
|
• |
Mimecast Compliance Protect: This feature helps customers in highly regulated industries comply with the significant record retention requirements of various regulatory agencies, such as the Securities and Exchange Commission, or the SEC, and the Financial Industry Regulatory Authority, Inc. |
|
|
• |
Supervision: Provides a monitoring tool to comply with regulations that require oversight and regular review. The feature provides a queue control system that will capture specific emails based on keyword(s) or random samples that can be reviewed by compliance or legal departments to capture or prevent inappropriate communications. |
Our Mimecast Enterprise Information Archiving service also empowers IT and legal teams with self-service search, case review and legal hold tools to quickly and defensibly perform early case assessments and set case strategy earlier in the litigation process.
As email, file attachments, and associated critical metadata that identifies activity are sent or received, they can be saved in a secure, tamper-proof archive in the Mimecast cloud automatically and indefinitely. Our employee mobile and desktop search tools and administration console then allow for detailed investigation of the archive. Our Mimecast Enterprise Information Archiving service offers secure lifetime storage of email, files, and instant messaging conversations paid for on a per-employee basis and not on a data usage basis. Our search tools make it easy for legal and compliance staff and employees to quickly find data without the need to turn to the IT team. Finally, our archive can also include legacy data that would otherwise be held in additional storage. Using our Legacy Data Migration service, this data can be ingested over-the-wire or via encrypted physical drives sent from the customer to us.
Mimecast Business Continuity and Sync & Recover
Email continuity protects email and data against the threat of downtime as a result of system failure, natural disasters, planned maintenance, system upgrades, and migrations. Mimecast Mailbox Continuity significantly reduces the cost and complexity of mitigating these risks and provides uninterrupted access to live and historic email and calendar information. During an outage, our service provides real-time inbound, outbound, and internal email delivery. The continuity service can be activated and deactivated directly and instantly from the Mimecast console by administrators for the complete organization or for specific groups affected by limited outages. All outage events are fully logged. We also support email top-up services for customers who have to recover their Microsoft Exchange® environments from backups. The continuity service is capable of reliably and securely supporting customers during short or long-term continuity events. Integration with Microsoft Outlook®, a native app for Mac® users, and a full suite of mobile apps means employees have seamless access to their email in the event of a disruption or outage.
As all customer outbound and inbound email is directed to our servers, if a customer’s primary email service fails, Mimecast Mailbox Continuity takes over the delivery and sending of email in real time or at the request of the administrator, offering immediate fail-over and fail-back. When the primary service is re-established, the customer is reassured that there has been no loss of data and that the archive is maintained.
Mimecast Sync & Recover, which works with Microsoft Exchange® and Microsoft Office® 365®, offers three key capabilities on top of the built-in tools provided by Mimecast Archiving, including Sync & Recover, Granular Retention Management, and Mailbox Storage, or Stubbing, Management. Sync & Recover delivers rapid and granular recovery of mailboxes, calendar items, and contacts lost through inadvertent or malicious deletion or corruption.
10
Mimecast Web Security
As the workplace has changed and the how, when, and where of the way employees work has become increasingly flexible, users want to work anytime, anywhere, and on any device. The global COVID-19 pandemic has only increased the requirement that organizations accommodate a remote work force. As a result, the landscape for how our customers manage risk, from cloud applications and the use of unsanctioned IT systems to guest or public Wi-Fi networks, has become increasingly challenging. Email and the web are the sources of nearly all data security incidents and breaches that occur. Most organizations do not monitor domain name system, or DNS, activity, leaving them vulnerable to this communications path. The Mimecast Web Security service protects against malicious web activity initiated by user action or malware, ransomware and other malicious software, and blocks access to inappropriate websites, based on business polices. Our Mimecast Web Security Service adds strong security at the DNS layer of the web and is easy to implement and manage. When combined with the Mimecast Secure Email Gateway, organizations can use a single, cloud-based service that protects against the two dominant cyberattack vectors: email and the web. The combined solution is also built to leverage each customer’s existing configurations for directory synchronization, branding, role-based access control, and other core platform features to help reduce both set-up time and maintenance.
When a user makes a request for a web-based resource (typically in a browser) by clicking a link or typing in an address, that request is then forwarded to the service for resolution and inspection or filtering. The service applies the customer’s acceptable use controls, as well as any bypass exceptions, and evaluates the site’s classification to determine if the site is safe or unsafe. Access to unsafe web resources is blocked, and the user is notified via a block page. Access to safe web resources is immediately allowed, with the IP address of the requested site being returned to the user’s browser so the content can be accessed. Access logs and associated reports generated by the service are available for review by a system administrator with the appropriate privileges.
Mimecast Browser Isolation is offered on a standalone basis and allows users to safely click URLs embedded in emails and access any website by opening new, unclassified web pages in remote browsers in the Mimecast cloud.
Mimecast Secure Messaging
Email containing sensitive or confidential information requires appropriate security and control to prevent inadvertent or deliberate data leaks and to protect the information while in transit. Mimecast Secure Messaging is a secure and private channel to share sensitive information with external contacts via email without the need for additional client or desktop software. Sensitive information is kept within our cloud service, strengthening information security, data governance, and compliance without the added IT overhead and complexity of traditional email secure messaging or encryption solutions.
Mimecast Health Care Pack
Mimecast’s Health Care Pack and Data Loss Prevention, or DLP, capabilities allow customers to set DLP policies at the gateway to help prevent breaches and protect against data exfiltration transmissions, while also applying policies inside an organization to help prevent careless, compromised, or malicious employees from sending information to people who should not receive it. Customers can also better support compliance efforts and enforce policies with our managed DLP dictionaries that identify key words related to such topics as protected health information under the Health Insurance Portability and Accountability Act of 1996, personally identifiable information, Payment Card Industry data security standards, and profanity.
Mimecast Large File Send
Employees can create security and compliance risks when they turn to file sharing services to overcome email size limits imposed by their email infrastructure. Mimecast Large File Send enables PC and Mac® users to send and receive large files directly from Microsoft Outlook® or a native Mac® app. It protects attachments in line with customer security and content policies by (i) using encryption, optional access keys, and custom expiration dates; (ii) supporting audit, e-discovery, and compliance by archiving all files and notifications according to email retention policies; and (iii) protecting email system performance from the burden of large file traffic.
Threat Intelligence and the Mimecast API Ecosystem
Our Threat Intelligence Dashboard displays cyber threat data specific to an organization by identifying users who pose the greatest cyber risk, providing recently observed indicators of exploitation, and showing detailed information about detected malware, including origins by region. This threat intelligence data is used to enhance our Email Security 3.0 protections across all three zones.
Our API integrations with major cybersecurity providers enable a more integrated, automated and effective approach to monitoring, detecting and remediating threats while managing user and organizational risk more proactively. Additionally, customers
11
are able to integrate their own threat intelligence data from third-party systems into our platform to augment their layers of defense. The Threat Intelligence Dashboard combines both internal and external cyber threat information to enhance an organization’s threat awareness.
Service Bundles
Many of our customers take advantage of the ability to combine our services and capabilities into a unified service managed from a single administration console. Most customers purchase bundles from the outset, but some prefer to start with specific packages, then upgrade to additional products over time. Our service range continues to respond to the changing threat landscape and reflect customers’ requests for combinations of services across advanced security. Service bundles offer different combinations of core email and web security, continuity, archiving, awareness training and brand protection beyond the traditional security perimeter.
Mimecast Mobile and Desktop Apps
Mobile, PC and Mac® users get self-service access to security features, including spam reporting and managed sender lists, the ability to send and receive email during a primary email system outage, and access to their personal email archive to run searches on its content. Administrators can use granular permissions to activate functions for individual employees or groups of users, while centralized security and policy management means IT teams can retain control over default settings.
Sales and Marketing
Our sales and marketing teams work together to build a strong sales pipeline, cultivate and retain customers, and drive market awareness of our current and future products and services.
Sales
We sell our services through direct sales efforts and through our channel partners to customers in approximately 100 countries. Our sales model is designed to meet the needs of organizations of all sizes across a wide range of industries. We have sales teams in offices in Boston, Chicago, Dallas, and San Francisco, United States; London, United Kingdom; Johannesburg and Cape Town, South Africa; Melbourne and Sydney, Australia; Amsterdam, the Netherlands; Dubai, UAE; Canada; and Munich, Germany. We maintain a highly-trained sales force of approximately 490 employees as of March 31, 2021, which is responsible for acquiring and developing new business.
We also have an experienced sales team focused on developing and strengthening our channel partner relationships. Many organizations work with third-party IT channel partners to meet their security, IT, and cloud service needs, so we have formed relationships with a variety of the leading partners to target large enterprises, mid-market, and small organizations. For large enterprises, we work with international partners including CDW Corporation and Dimension Data. In the mid-market, we work with leading national partners, including Softchoice, SHI International Corp., CDW Corporation, and Softcat Plc. The small business market is primarily served by the reseller community and by managed service providers, which typically provide or host email services.
Sales to our channel partners are generally subject to our standard, non-exclusive channel partner agreement, meaning our channel partners may offer customers the products of several different companies. These agreements are generally for a term of one year with a one-year renewal term and can be terminated by us or the channel partner. Payment to us from the channel partner is typically due within 30 calendar days of the date we issue an invoice for such sales. In our fiscal year ended March 31, 2021, channel partners accounted for 75% of our revenue in aggregate, but no individual channel partner accounted for 10% or more of our revenue. We expect that sales to channel partners will continue to account for a substantial portion of our revenue for the foreseeable future.
Our sales cycle varies by size and sophistication of customer, the number of products purchased and the complexity of the project, ranging from several days for incremental sales to existing customers, to many months for sales to new customers or for large deployments with enterprise customers.
We plan to continue to invest in our sales organization to take advantage of a large market opportunity through both the growth of our direct sales organization and investment in our channel partners and the technology that serves those partners.
12
Marketing
Our marketing strategy is designed to meet the specific needs of each of our customer segments. We are focused on building the Mimecast brand and product awareness, increasing customer adoption of our products, communicating the advantages of our solution and its benefit to organizations, and generating leads for our channel partners and direct sales force. We execute our marketing strategy by using a combination of internal marketing professionals and a network of global channel partners. We invest in field, channel, product and brand marketing, digital marketing, public relations, security analyst relations, virtual conferences, and web-based seminar campaigns targeting key decision makers within our target customers. We additionally offer free trials and email security risk assessments, which provide prospective customers the ability to identify and understand the gaps in their existing email security strategy.
Customer Service and Support
We maintain our strong customer retention rate through the efficacy and quality of our products, our commitment to our customers’ success, and our award-winning global Customer Success and Support teams, which consisted of 392 employees as of March 31, 2021 dedicated to ensuring a superior experience for our customers. For each of the fiscal years ended March 31, 2021, 2020 and 2019, our customer retention rate has been consistently greater than 90%. We calculate our annual customer retention rate as the percentage of paying customers on the last day of the prior year who remain paying customers on the last day of the current year. We have designed a comprehensive monitoring methodology that measures and evaluates the interactions we have with our customers, from sales and on-boarding to support and renewal.
Our data migration service helps solve the problems customers face when extracting data and getting it into the right format for importing to the cloud, which can be expensive, time-consuming, and require interactions with multiple vendors. In addition, we offer a full range of support services to our global customer base. These services include a comprehensive online portal, email support and follow-the-sun- telephone support. We do not outsource support or account management to third parties. Our comprehensive education and consultancy offerings include administrator training and certification, end-user training, and e-discovery training for compliance teams, all of which are available in-person and online. Beyond customer support and training, we also provide a range of professional services that are designed to provide additional enablement to customers who require it, especially larger enterprises with more complex email infrastructure and legacy data transfer needs.
We offer a service level agreement as part of our standard contract that contains commitments regarding the delivery of email messages to and from our servers, the speed at which our archive can produce search results, and our ability to correctly identify and isolate spam and viruses. If we do not achieve these levels, the customer can request a credit. Payment of the credit will be made subject to verification of the problem. These credits are tiered according to the extent of the service issued. The amount of credits provided to customers to date has been immaterial in all historical periods.
Customers
As of March 31, 2021, we had approximately 39,900 customers and protected millions of their employees in approximately 100 countries. Our diverse global footprint is evidenced by the fact that in the fiscal year ended March 31, 2021, we generated 51% of our revenue from the United States, 29% from the United Kingdom, 10% from South Africa, and 10% from the rest of the world. Our customers range from large enterprises with over 500,000 employees to small organizations with less than 50 employees and represent a diverse set of industries. For example, in the fiscal year ended March 31, 2021, we generated 16% of our revenue from customers in the professional, scientific and technical services industry, 15% from customers in the finance and insurance industry, 12% from customers in the manufacturing industry, and 9% from customers in the legal services industry. Our business is not dependent on any single customer. No single customer represented more than 1% of our annual revenue in the fiscal years ended March 31, 2021, 2020 or 2019. See Item 7, “Management’s Discussion and Analysis of Financial Condition and Results of Operations” in this Annual Report on Form 10-K for our definition of “customer.”
Research and Development
Our engineering, operations, product, and development teams work together to enhance our existing products, technology infrastructure, and the underlying Mime | OS™ cloud architecture, as well as develop our new product pipeline. Our research and development and product management teams interact with our customers and partners to address emerging market needs, counter developing threats, and drive innovation in risk management and data protection. We operate a continuous delivery model for improvements to our infrastructure and products to ensure customers benefit from regular updates in protection and functionality without the need for significant intervention on their part. Our research and development and product management efforts give prominence to services that enhance our unification commitment and allow customers to displace point solutions or on-premises products. As of March 31, 2021, we had approximately 433 employees focused on our research and development efforts.
13
Intellectual Property
Our success is dependent, in part, on our ability to protect our proprietary technologies and other intellectual property rights. We primarily rely on a combination of trade secrets, copyrights, and trademarks, as well as contractual protections, to establish and protect our intellectual property rights. As of March 31, 2021, we had 31 patents issued and 21 patent applications pending in the United States. We also have one patent issued in the United Kingdom. We intend to pursue additional patent protection to the extent that we believe it would be beneficial and cost effective.
We have registered “Mimecast” and certain other marks as trademarks in the United States and several other jurisdictions. We also have a number of registered and unregistered trademarks in the United States and certain other jurisdictions and will pursue additional trademark registrations to the extent we believe it would be beneficial and cost effective. We are the registered holder of a variety of domestic and international domain names that include “mimecast.com,” “mimecast.co.uk,” “mimecast.co.za,” and similar variations.
In addition to the protection provided by our intellectual property rights, as part of our confidentiality procedures, all of our employees and independent contractors are required to sign agreements acknowledging that all inventions, trade secrets, works of authorship, developments, and other processes generated by them on our behalf are our property, and they assign to us any ownership that they may claim in those works. We also generally enter into confidentiality agreements with our employees, consultants, partners, vendors, and customers, and generally limit access to and distribution of our proprietary information.
Despite our precautions, it may be possible for unauthorized third parties to copy our products and use information that we regard as proprietary to create products and services that compete with ours. Some contractual restrictions protecting against unauthorized use, copying, transfer, and disclosures of our products may be unenforceable under the laws of certain jurisdictions and foreign countries. In addition, the laws of some countries do not protect proprietary rights to as great of an extent as the laws of the United States, and many foreign countries do not enforce these laws as diligently as government agencies and private parties in the United States. Our exposure to unauthorized copying and use of our products and misappropriation of our proprietary information may increase as a result of our foreign operations.
We expect that software and other solutions in our industry may be increasingly subject to third-party infringement claims as the number of competitors grow and the functionality of products in different industry segments overlaps. Moreover, many of our competitors and other industry participants have been issued patents, or filed patent applications, and have asserted claims and related litigation regarding patent and other intellectual property rights. Third parties, including non-practicing patent entities, have from time to time claimed, are claiming, and could claim in the future, that our technologies infringe patents they now hold or might obtain or be issued in the future. See Part I, Item 1A, “Risk Factors — We are currently being sued, have been sued in the past, and may in the future be sued by third parties for alleged infringement of their proprietary rights” and Part I, Item 3, “Legal Proceedings” in this Annual Report on Form 10-K.
Competition
Our market is large, highly competitive, fragmented, and subject to rapidly evolving technology and security threats, shifting customer needs, and frequent introductions of new products and services. We do not believe that any specific competitor offers the fully unified service and integrated technology that we do. However, we do compete with companies that offer products that target email, web and data security, awareness training, continuity, archiving, DMARC reporting, and digital brand protection, as well as large providers such as Google Inc. and Microsoft Corporation, who offer functions and tools as part of their core mailbox services that may be, or be perceived to be, similar to our offerings.
Our current and potential future competitors include:
|
|
• |
Email Security: Barracuda Networks, Inc., Google, Microsoft Exchange Online Protection, Proofpoint, Inc., Symantec Corporation, Agari Data, Inc., Cisco Systems Inc., Avanan, Inc., GreatHorn, Inc., IronScales, Ltd., INKY Technology Company, and Abnormal Security Corporation; |
|
|
• |
Archiving: Dell EMC, Microsoft Office® 365®, Proofpoint, Inc., Veritas Technologies LLC, Smarsh Inc., Barracuda Networks, Inc., and Global Relay Communications, Inc.; |
|
|
• |
Awareness Training: KnowBe4, Inc., Cofense Inc., and Wombat Security, a division of Proofpoint, Inc.; |
|
|
• |
Web security: Cisco Systems, Inc., Webroot Inc., TitanHQ’s Webtitan, SafeDNS, Inc., Akamai Technologies, Inc, Infoblox Inc., Forcepoint LLC, Trustwave Holdings, Inc., and Zscaler, Inc.; |
14
|
|
• |
DMARC reporting: Agari Data, Inc., Valimail Inc., dmarcian, Inc., Ondemarc by Redsift Limited, and ReturnPath’s email fraud protection, a division of Proofpoint, Inc.; and |
|
|
• |
Digital brand protection: RSA Security LLC, a division of Dell EMC, RiskIQ, Inc., and MarkMonitor Inc. |
Some of our current and future competitors may have certain competitive advantages such as greater name recognition, longer operating history, larger market share, larger existing user base, and greater financial, technical, and other resources. Some competitors may be able to devote greater resources to the development, promotion, and sale of their products than we can to ours, which could allow them to respond more quickly than we can to new technologies, threats, and changes in customer needs. We cannot provide any assurance that our competitors will not offer or develop products or services that are superior to ours or achieve greater market acceptance.
We believe principal competitive factors in our market include, but are not limited to:
|
|
• |
reliability and effectiveness in protecting, detecting, and responding to cyberattacks; |
|
|
• |
scalability and multi-tenancy of our system; |
|
|
• |
breadth and unification of our services; |
|
|
• |
cloud-only delivery; |
|
|
• |
total cost of ownership; |
|
|
• |
speed, availability, and reliability; |
|
|
• |
integration into office productivity, desktop, and mobile tools; |
|
|
• |
speed at which our services can be deployed; |
|
|
• |
ease of user experience for IT administrators and employees; and |
|
|
• |
superior customer service and commitment to customer success. |
We believe that we compete favorably based on these factors. Our ability to remain competitive will depend to a great extent upon our ongoing performance in the areas of product and cloud architecture development, core technical innovation, channel management, and customer support.
Environmental, Social, and Governance
We plan to leverage the United Nations Sustainable Development Goals as a guide to furthering our commitment to community and environmental resilience through a robust Environmental, Social and Governance, or ESG, strategy in fiscal 2022 and beyond. We recently launched our ESG Council with executive sponsorship to guide our immediate and long-term ESG strategy, targets, and implementation plan. We have engaged with a third party to conduct a full ESG materiality assessment in fiscal 2022, which we believe is a crucial step to reporting in accordance with key ESG frameworks including the Global Reporting Initiative, or GRI, and Sustainability Accounting Standards Board, or SASB.
Environmental Sustainability
We have already made strides to operate with greater environmental efficiency, minimizing single-use plastic utensils in all office kitchen environments, fitting office space with efficient lighting and water fixtures, and partnering with data centers that prioritize the use of renewable energy. Starting in fiscal 2022, we plan to match 100% of our entire operational footprint (Scope 1 and 2 emissions) with third-party certified renewable energy certificates and carbon offsets. As we grow, we will continue to explore opportunities to participate in new renewable energy and emission abatement projects beyond our operational footprint as we look to become a fully net zero emissions (Scopes 1, 2, and 3) company by 2030. Mimecast employees are also encouraged to be an active part of our sustainability commitment through our partnership with One Tree Planted, environmental matching gift campaigns, and internal environmental fundraising challenges.
Human Capital
Summary
As we have grown and expanded geographically, we have continued to invest in the expansion and scaling of our investments in human capital strategies. Our belief is that these investments will result in an organization where employees feel they can do their best work, experience their best teamwork, and achieve their greatest learning. Our human capital strategy is a full organization
15
commitment with leaders creating the right culture and environment, employees being empowered and exposed to programs that will support them, and a human resources function that proactively creates programs that enable us to attract, develop, engage, and retain talent.
As of March 31, 2021, we had 1,765 employees and subcontractors, including 665 in sales and marketing, 433 in research and development, 392 in services and support and 275 in general and administrative. While we operate in the United Kingdom, the United States, South Africa, Australia, Germany, Canada, the Netherlands, United Arab Emirates, and Israel, most of our employees are based in the United Kingdom and the United States. None of our employees are represented by a labor union or covered by a collective bargaining agreement. We have never experienced a strike or similar work stoppage, and we consider our relations with our employees to be good.
Attracting Talent
We leverage an internal sourcing and recruiting team to fill over 300 roles per year with an average time to fill well within industry standards. Our recruiting team leverages the following core strategies to source talent:
|
|
• |
Strong employee referral program filling approximately 30% of all roles; |
|
|
• |
Strong commitment to a values-driven culture and strong employee value proposition; |
|
|
• |
Strong intern and graduate programs with 100% graduate placement to full-time positions in South Africa and implementation of Year Up® internship program; |
|
|
• |
In fiscal years 2021 and 2022, we established defined partnerships with organizations committed to attracting and recruiting diverse talent, including WomenTech and Black Young Professionals; and |
|
|
• |
We invest in our employees through competitive pay and benefits programs globally. Salary, incentive, and share-based compensation are benchmarked and reviewed annually to industry comparators and are assessed each year against pay equity frameworks. We offer core protections and benefits to our employees and promote an employee share purchase plan to encourage all employees to participate in share ownership. |
Developing Talent
Over the past two years, we have invested extensively in building the capabilities of our senior leaders and in the creation of a robust internal development strategy that empowers employees to grow internally within Mimecast. This growth strategy is especially important as we believe internal movement enables strong retention and the ability for culture to scale as we grow.
|
|
• |
Senior Leadership Development Program. Based on a multifaceted model of lead, manage and coach, this program includes formal summit learning and cohort peer-to-peer learning. |
|
|
• |
People Management Program. Our module-based programming ensures management principles and skills are consistent across all people managers. |
|
|
• |
Employee Career Coaching. In fiscal year 2021, we introduced a virtual coaching platform, BetterUP, Inc. This unique program supports employees below the manager level to gain further insights into strengths, development opportunities and creates an individual plan for growth. |
Engaging and Retaining Talent
Our ability as an organization to create and maintain a positive culture is critical to execution and our ability to scale with growth. We have supported this strategy by investing in strong leadership, focusing on cross collaboration teamwork, career development, and overall employee engagement programs. The success of these programs are measured by voluntary turnover, which is currently approximately 11% to 14% across our global regions, and overall engagement scores measured via an annual company-wide employee satisfaction survey, which as of the latest survey conducted in June 2020 had 93% employee participation, with a 78 engagement score versus the technology industry benchmark of 73.
Our recent initiatives included:
|
|
• |
We invested significantly in our commitment to a global diversity, equity, and inclusion, or DEI, strategy with defined goals and accountability measures to facilitate ongoing action. We hired a DEI global lead, launched an executive-led DEI Council, scaled support and scaled our Employee Resource Groups, or ERGs, continued our investment in Black |
16
|
|
Economic Empowerment, or BEE, programs in South Africa and introduced a range DEI education and awareness programs. |
|
|
• |
In response to the global COVID-19 pandemic, we introduced a Mimecaster Resilience Fund, or MRF, to provide support to families of our employees that have been substantially impacted by the pandemic financially. To date, the MRF has supported approximately 40 families within our Mimecast community. |
|
|
• |
Our corporate social responsibility, or CSR, program supports community organizations across all regions in which we operate, contributing approximately $400,000 dollars to our global partners in fiscal year 2021. Mimecast empowers our employees to give back to the community through our generous matching gift program and provides all employees with five paid days off to volunteer in the community. |
|
|
• |
In fiscal year 2021, we invested in additional mental health support for employees and their families by partnering with Talkspace Network LLC, providing virtual counselling and individual mental health professional support to all employees and their dependents at no cost. |
We are proud to accept external recognition for our commitment to employees and our culture through the following awards received in fiscal year 2021:
|
|
• |
Great Place to Work Certification™ in the United Kingdom, Australia, and South Africa; and |
|
|
• |
2021 Top Workplaces USA Award. |
Government Regulation
We are subject to various laws and regulations across all the countries in which we do business. In particular, we are significantly impacted by laws and regulations relating to data privacy, data security and data protection. We are also impacted by laws and regulations relating to U.S. and international securities laws, anti-bribery laws, export control legislation, employment and taxation.
Almost every jurisdiction in which we operate has established its own data security, data protection and data privacy legal frameworks with which we, or our customers, must comply, including the European Union General Data Protection Regulation, or the GDPR. The GDPR applies to any company established in the European Union as well as to those outside the European Union if they collect and use personal data in connection with the offering of goods or services to individuals in the European Union or the monitoring of their behavior. The GDPR has enhanced data protection obligations for controllers of personal data, including, for example, increased rights for data subjects including, but not limited to, expanded disclosures about how personal data is to be used, limitations on retention of personal data, and mandatory personal data breach notification requirements. The GDPR has created onerous obligations and liabilities on service providers or data processors as well. Under the GDPR, fines of up to 20 million Euros or up to 4% of the total worldwide annual turnover of the preceding financial year, whichever is higher, may be imposed for non-compliance. Moreover, data subjects can claim damages resulting from violations of the GDPR. The United Kingdom has adopted its own version of the GDPR, or the UK GDPR, which went into effect following the United Kingdom’s withdrawal from the European Union. Similarly, in the United States, the federal government and many state governments have adopted, or are considering adopting, laws and regulations regarding the collection, use, and disclosure of personal information. California enacted the California Consumer Privacy Act of 2018, or the CCPA, that among other things, requires covered entities to provide new disclosures to California consumers and gives such consumers and others a private right of action to enforce data breaches resulting from the covered entity's violation of its duty to implement and maintain reasonable security measures. In November 2020, California residents voted to approve a ballot proposition that creates the California Privacy Rights Act, or CPRA, that amends and expand the CCPA to further enhance privacy protections for California residents. In addition, to the GDPR, the UK GDPR, CCPA and CPRA, we are subject to a number of additional laws governing data privacy and data protection, including but not limited to the Health Insurance Portability and Accountability Act of 1996, as amended, in the United States, The Protection of Personal Information Act 4 of 2013 in South Africa, the federal Privacy Act 1988 (Cth) in Australia, and the Personal Information Protection and Electronic Documents Act in Canada.
Our policy is to abide by all applicable laws and regulations, and we have internal programs in place to manage global compliance with these various requirements. We monitor each of these areas for new or changed regulatory requirements and we report regularly to our Board of Directors on compliance matters.
17
The legal and regulatory environment for cloud service providers continues to evolve. It is not possible to predict how such evolution and changes will affect our business or the cybersecurity industry generally. If we do not comply with current or future laws or regulations that apply to our business, we could be subject to substantial fines and penalties and we may have to restructure our service offerings, limit our service offerings in certain markets, or raise the price of our services, any of which could harm our business and results of operations. For a discussion of risks related to government regulation, see Part I, Item 1A, “Risk Factors” in this Annual Report on Form 10-K.
Corporate Information
Mimecast Limited was incorporated under the laws of the Bailiwick of Jersey with company number 119119 on July 28, 2015 as a public company limited by shares. On November 4, 2015, Mimecast Limited became the holding company of Mimecast UK Limited, a private limited company incorporated in 2003 under the laws of England and Wales and its subsidiaries by way of a share-for-share exchange in which the shareholders of Mimecast UK Limited exchanged their shares in Mimecast UK Limited for an identical number of shares of the same class in Mimecast Limited. Following the exchange, the historical consolidated financial statements of Mimecast UK Limited became the historical consolidated financial statements of Mimecast Limited. Mimecast Limited has 13 subsidiaries. Our principal operating companies are Mimecast UK Limited, a company organized under the laws of England and Wales; Mimecast Services Ltd., a company organized under the laws of England and Wales; Mimecast North America, Inc., a Delaware, United States corporation; Mimecast South Africa (Pty) Ltd., a South African corporation; Mimecast Australia Pty. Ltd., an Australian corporation; Mimecast Germany GmbH, a German corporation; and Mimecast Canada Limited, a Canadian corporation, each of which is a wholly-owned subsidiary of Mimecast Limited. Our principal executive office is located at 1 Finsbury Avenue, London, EC2M 2PF, United Kingdom.
Our ordinary shares are traded on The Nasdaq Global Select Market under the symbol “MIME.”
Geographic Information
For financial reporting purposes, total revenue, and property and equipment, net attributable to geographic areas are presented in Note 16, “Segment and Geographic Information”, to the consolidated financial statements, included elsewhere in this Annual Report on Form 10-K.
Available Information
We maintain an internet website at www.mimecast.com. The information on, or that can be accessed through, our website is not incorporated by reference into this Annual Report on Form 10-K and should not be considered to be a part of this Annual Report on Form 10-K. Our website address is included in this Annual Report on Form 10-K as inactive textual reference only. Our reports filed or furnished pursuant to Section 13(a) or 15(d) of the Securities Exchange Act of 1934, as amended, or the Exchange Act, including our Annual Reports on Form 10-K, our Quarterly Reports on Form 10-Q and our Current Reports on Form 8-K, and amendments to those reports, are accessible through our website, free of charge, as soon as reasonably practicable after these reports are filed electronically with, or otherwise furnished to, the SEC. The SEC maintains an internet site that contains reports, proxy and information statements, and other information regarding issuers that file electronically with the SEC, including us, at http://www.sec.gov. We also make available on our website the charters of our audit committee, compensation committee and nominating and corporate governance committee, as well as our corporate governance guidelines and our code of business conduct and ethics. You may request copies of our reports and the other documents referenced above, at no cost, by writing to or telephoning us as follows:
Mimecast Limited
Attention: Investor Relations
191 Spring Street
Lexington, Massachusetts 02421
Telephone: 617-393-7050
18
Item 1A. Risk Factors.
Our business, financial condition, results of operations and future growth prospects could be materially and adversely affected by the following risks or uncertainties. The risks and uncertainties described below are those that we have identified as material, but they are not the only risks and uncertainties we face. Our business is also subject to general risks and uncertainties that affect many other companies, including overall economic and industry conditions, as well as other risks not currently known to us or that we currently consider immaterial. If any of such risks and uncertainties actually occurs, our business, financial condition, results of operations and prospects could differ materially from the plans, projections and other forward-looking statements included in the section titled “Management’s Discussion and Analysis of Financial Condition and Results of Operations” and elsewhere in this Annual Report on Form 10-K and in our other public filings.
Business and Operational Risks
Data security and integrity are critically important to our business, and breaches of our information and technology networks and unauthorized access to a customer’s data, including our recent security incident, could harm our business and operating results.
We have experienced, and will continue to experience, cyberattacks and other malicious internet-based activity, which continue to increase in sophistication, frequency and magnitude. Because our services involve the storage of large amounts of our customers’ sensitive and proprietary information, solutions to protect that information from cyberattacks and other threats, data security and integrity are critically important to our business. Also, as more of our customers have moved to working remotely, and continue to work remotely, during the global COVID-19 pandemic, we expect there will be an increased amount of sensitive and proprietary information that is stored in our solutions, which increases the exposure and risk of cyberattacks and other malicious internet-based activity. Despite all of our efforts to protect this information, we cannot provide assurance that our services and databases will not be compromised or disrupted, whether as a result of criminal conduct, DDoS attacks, or other advanced persistent attacks by malicious actors, including hackers, state-backed hackers and cybercriminals, breaches due to employee negligence, error and/or malfeasance, or other disruptions during the process of upgrading or replacing computer software or hardware, power outages, computer viruses, hardware and software errors, including so-called supply chain attacks involving the vendors we rely upon, telecommunication or utility failures or natural disasters or other catastrophic events. Moreover, the techniques used to obtain unauthorized access, disable or degrade service, or sabotage systems change frequently or may be designed to remain dormant until a predetermined event and often are not recognized until launched against a target. As a result, there can be no guarantees that we will be able to anticipate these techniques or implement adequate preventative measures.
In January 2021, we became aware of a security incident later determined to be conducted by the same sophisticated threat actor responsible for the SolarWinds supply chain attack. We immediately launched an internal forensic investigation. Our investigation was supported by leading third-party forensics and cyber incident response experts at Mandiant, a division of FireEye, Inc., and was conducted in coordination with law enforcement to aid their investigation into this threat actor. During our investigation, we learned that the threat actor used the SolarWinds supply chain compromise to gain access to part of our production grid environment. Using this entry point, the threat actor accessed certain Mimecast-issued certificates and related customer server connection information. The threat actor also accessed a subset of email addresses and other contact information, as well as encrypted and/or hashed and salted credentials. In addition, the threat actor accessed and downloaded a limited number of our source code repositories, but we found no evidence of any modifications to our source code nor do we believe there was any impact on our products. As the investigation progressed, we issued a series of advisories to affected customers, including recommended precautionary steps to mitigate risk and, in some cases, to address regulatory requirements. Our forensic investigation was completed in March 2021 and we have eliminated the threat actor’s access to our environment. We have taken a number of actions designed to prevent future access to our environment and we will continue to monitor for threats and take precautionary steps as needed. We are subject to additional risks and uncertainties as a result of these events, including those described in the bullets below. While our forensic investigation is complete, there can be no assurance that we will be able to detect the existence or extent of the attacks on us or our customers or that our isolation and remediation efforts will be effective. As a result, we are unable to predict the overall impact of these events. Any perception by prospective or existing customers that the confidential information we maintain on their behalf is not secure could result in a material loss of business and revenue and damage our reputation and competitiveness. Furthermore, as described in the bullets below, these types of events often have cascading impacts that unfold over a lengthy period of time and may result in a loss of revenue, a diminution of our business prospects and incremental costs, including costs associated with litigation or investigations by regulatory authorities, any of which may adversely impact our financial results. It is also expected that we will continue to incur costs related to our response, remediation, and investigatory efforts relating to this security incident. While we have cyber insurance coverage, the amount of such insurance may be insufficient to compensate us for any expenses or losses that may result from the security incident.
Due to frequently changing attack techniques, along with an increased volume and sophistication of the attacks, we must continually monitor and develop our information technology networks and infrastructure to prevent, detect, address and mitigate the risk of unauthorized access and we expend significant resources to respond to threats to security. To defend against threats to our systems and our customers’ confidential information, we must continuously invest in the development of more secure solutions and improve the security features of our solutions and the deployment of updates to address any security vulnerabilities. However, despite
19
our efforts, we may fail to identify these new and complex methods of attack or fail to invest sufficient resources in security measures. In addition, as we increase our customer base and our brand becomes more widely known and recognized, we may become a more attractive target for malicious third parties. Furthermore, our solutions connect to, operate in conjunction with and are dependent on products and components across a broad ecosystem of third parties. If there is a security vulnerability in one of these third-party components, and a threat actor is successful in breaching that vulnerability, we could face increased costs, liability claims, reduced revenue, or harm to our reputation or competitive position for reasons beyond our control. Any breach of our security measures or disruption in our service as a result of third-party action, including criminal conduct by state actors and others, employee negligence, error, and/or malfeasance, defects or otherwise that compromises the confidentiality, integrity or availability of our data or our customers’ data, including as a result of our recent security incident, could result in:
|
|
• |
material loss of business and revenue; |
|
|
• |
severe harm to our reputation, our brand or our competitiveness; |
|
|
• |
a material degradation in the overall market perception of the security and reliability of our services; |
|
|
• |
individual customer and/or class action lawsuits, which would cause us to incur significant legal fees and costs and could result in financial judgments against us; |
|
|
• |
legal or regulatory enforcement action by state and federal authorities or non-U.S. authorities, which would cause us to incur legal fees and costs and could result in fines and/or penalties; |
|
|
• |
mandatory regulatory disclosures regarding a security breach, unauthorized access to or disclosure of confidential information, which could lead to widespread negative publicity, which may cause our customers or prospects to lose confidence in the effectiveness of our data security measures; |
|
|
• |
increased cybersecurity protection costs and insurance premiums; and/or |
|
|
• |
additional costs associated with responding to the service interruption or security breach, such as investigative and remediation costs, the costs of providing individuals and/or data owners with notice of the breach, legal fees, the costs of any additional fraud detection activities, or the costs of prolonged system disruptions or shutdowns. |
Any of these events could materially adversely impact our business and results of operations.
We seek to cap the liability to which we are exposed in the event of losses or harm to our customers, including those resulting from security incidents, but we cannot be certain that we will obtain these caps or that these caps, if obtained, will be enforced in all instances. Furthermore, the cybersecurity insurance we maintain may be inadequate or may not be available in the future on acceptable terms, or at all. In addition, our policy may not cover our remediation expenses or any claim against us for loss of data or other indirect or consequential damages. Defending any suit based on or related to any data loss or system disruption, regardless of its merit and available insurance coverage, could be costly and divert management’s attention.
The global COVID-19 pandemic, including the related containment efforts, has had, and will likely continue to have, certain negative impacts on our business and operations, and we are unable to predict with certainty the extent to which it may continue to adversely affect our business, results of operations and financial condition.
In December 2019, a novel strain of coronavirus, or COVID-19, was reported to have surfaced in Wuhan, China, and since then has spread to Europe, the United States and most other countries. In March 2020, the COVID-19 outbreak was declared a pandemic by the World Health Organization. The COVID-19 pandemic continues to evolve, and to date has led to the implementation of various responses, including global government-imposed quarantines, stay-at-home orders, travel restrictions, mandated non-essential business closures, work stoppages, slowdowns and delays, work-from-home policies, supply chain disruption, and other public health safety measures, as well as volatility in stock prices, among other effects. COVID-19 infection rates declined somewhat during the late spring and summer of 2020 but increased dramatically in the fall and early winter of 2020 in many locations, which caused governments to reinstate, or consider reinstating, some restrictions. More recently, as a result of the widespread distribution of vaccines and continued containment efforts, infection rates have stabilized or trended downward in many of the countries in which we operate.
The containment efforts imposed by many governments caused significant societal and economic disruption worldwide, including in all of the regions in which we operate our business and sell our products and services. Additionally, the COVID-19 pandemic and the governmental response and the resulting economic effect, impacted some industries, such as travel, hospitality and retail, more significantly than others. In response to the COVID-19 pandemic, we took a number of actions. These actions included, among others: (i) a decision to close all of our global offices, including our global headquarters in London, United Kingdom, and the resulting shift to a virtual work environment where all of our employees, including our global sales and customer support staff, are
20
working remotely; (ii) a decision to limit and then ultimately ban all non-essential travel, including international travel; (iii) a decision to cancel or shift to virtual-only certain customer, industry and employee events; and (iv) the establishment of an employee support fund, funded in part by executive and employee donations, to offset the impact of the pandemic on our more vulnerable employees. The expected duration of these actions is uncertain. More recently, we have opened some of our smaller global offices on a limited basis in accordance with government requirements and plan to do the same at our two primary offices located in London, United Kingdom and Lexington, Massachusetts in the summer of 2021. We expect, however, that the transition back to normal operations will take significant time, perhaps several months. We believe that the COVID-19 pandemic has negatively impacted and will continue to negatively impact our business and results of operations in a number of ways, including (i) an impact on the demand for our products and services caused by a decline in the rate of IT and security spending, a delay in purchasing decisions as IT and security staff focus on addressing the disruption to their businesses, and hiring freezes and reductions in workforce impacting our customers, which will impact sales to prospects and existing customers and increase customer attrition, especially since we offer our solutions on a per seat basis, (ii) restrictions on our global sales and marketing operations, including eliminating in-person sales activities, (iii) an impact on our employees’ ability to perform necessary business functions, including as a result of illness, family illness and general economic hardship, or as a result of restrictions on movement, including the necessity of working from home for an extended period, (iv) customers seeking extended payment terms or declaring bankruptcy or seeking to liquidate making collectability of accounts receivables difficult or impossible, (v) a disruption to our supply chain, particularly as it relates to hardware needed to expand existing data centers and planned data centers, (vi) continued currency volatility, and (vii) an increased risk of information or cybersecurity incidents and a failure to maintain the uninterrupted operation of our information systems due to, among other things, an increase in remote work. In addition, governmental authorities both in the United States and in Europe have adopted measures to provide economic assistance to businesses, to stabilize the markets and to support economic stability, and many governments are considering adopting additional measures to support their economies. The future success of these measures is unknown, and they may not be sufficient to mitigate the negative impact of the global COVID-19 pandemic. We have been closely monitoring the impact of the COVID-19 pandemic on all aspects of our business, including how it will impact our operations and the operations of our customers, suppliers, vendors and business partners and the impact it has on the safety and well-being of our employees, and may take further precautionary and preemptive actions as may be prudent or as required by government authorities.
Any of the negative impacts of the global COVID-19 pandemic, including those described above, alone or in combination with others, may have a material adverse effect on our results of operations and financial condition. The extent to which the global COVID-19 pandemic will continue to adversely affect our business and results of operations will depend on numerous evolving factors and future developments that we are not able to predict, including the duration, spread and severity of the outbreak, including the potential that there could be recurring outbreaks in the future, the spread of new variants of the original virus, the nature and effectiveness of containment measures, the availability of treatments, the effectiveness and safety of available vaccines and the speed at which such vaccines are distributed and accepted by the public, the effect on the economy, unemployment, and IT and security spending in particular, and how quickly and to what extent normal economic and business operations can resume. Because our services are offered on a subscription basis, the effect of the pandemic may not be fully reflected in our operating results until future periods. If the global COVID-19 pandemic is prolonged, it could amplify the negative impacts on our business and results of operations, and may also heighten many of the other risks, including risk factors, described in this section and elsewhere in this Annual Report on Form 10-K. It is also possible that any adverse impacts of the pandemic and containment measures may continue once the pandemic is controlled and the containment measures are lifted.
If we are unable to attract new customers and retain existing customers, our business and results of operations will be affected adversely.
To succeed, we must continue to attract new customers and retain existing customers who desire to use our existing security, continuity and archiving offerings and new products we introduce from time to time. Acquiring new customers is a key element of our continued success, growth opportunity and future revenue. We will continue to invest in a direct sales force combined with a focused channel strategy designed to serve the various requirements of our target customer base and to bring new customers onto our cloud architecture. Any failures by us to execute in these areas will negatively impact our business. The rate at which new and existing customers purchase our products depends on a number of factors, including potential concerns related to our recent security incident and other factors outside of our control. For example, a deterioration in macroeconomic conditions in the markets we operate in as a result of the continuation of the global COVID-19 pandemic, a slower than expected recovery from the pandemic, or for other reasons could have a negative impact on our customers, which could adversely impact our ability to attract new customers and retain existing customers. In the past, negative macroeconomic conditions resulted in reductions in demand for IT-related capital spending generally and security solutions specifically, particularly in the financial services, legal and other industries that we target. Our future success also depends on retaining our current customers at acceptable retention levels. Our retention rates may decline or fluctuate as a result of a number of factors, including potential concerns related to our recently disclosed security incident. Our retention rates may also fluctuate as a result of factors outside our control, including competition, customers’ budgeting and spending priorities, and overall general economic conditions in the geographic regions in which we operate. For example, the impact of the COVID-19 pandemic on the current economic environment has caused, and may in the future cause, customers to request concessions including extended payment terms or better pricing. Customers may delay or cancel IT projects or seek to lower their costs by renegotiating existing
21
vendor contracts. If our customers do not renew their subscriptions for our products and services, our revenue would decline and our business would suffer. In future periods, our total customers and revenue could decline or grow more slowly than we expect.
If we are unable to sell additional services, features and products to our existing customers, our future revenue and operating results will be harmed.
A significant portion of our revenue growth is generated from sales of additional services, features and products to existing customers. Our future success depends, in part, on our ability to continue to sell such additional services, features and products to our existing customers. We devote significant efforts to developing, marketing and selling additional services, features and products and associated support services to existing customers and rely on these efforts for a portion of our revenue. These efforts require a significant investment in building and maintaining customer relationships, as well as significant research and development efforts in order to provide upgrades and launch new services, features and products. The rate at which our existing customers purchase additional services, features and products depends on a number of factors, including the perceived need for additional security continuity and archiving services, the efficacy of our current services, the perceived utility and efficacy of our new offerings, potential concerns related to our recent security incident, our customers’ IT budgets and general economic conditions in the geographic regions in which we operate, which may be impacted by the economic uncertainty resulting from the global COVID-19 pandemic. If our efforts to sell additional services, features and products to our customers are not successful, our future revenue and operating results will be harmed.
Our business depends substantially on customers renewing their subscriptions with us and a decline in our customer renewals would harm our future operating results.
In order for us to maintain or improve our operating results, it is important that our customers renew their subscriptions with us when the existing subscription term expires. Although the majority of our customer contracts include auto-renew provisions, our customers have no obligation to renew their subscriptions upon expiration, and we cannot provide assurance that customers will renew subscriptions at the same or higher level of service, if at all, particularly given the economic uncertainty resulting from the global COVID-19 pandemic. For each of the fiscal years ended March 31, 2021, 2020 and 2019, our customer retention rate has been consistently greater than 90%. We calculate customer retention rate as the percentage of paying customers on the last day of the relevant period in the prior year who remain paying customers on the last day of the relevant period in the current year. The rate of customer renewals may decline or fluctuate as a result of a number of factors, including our customers’ satisfaction or dissatisfaction with our solutions, potential concerns related to our recent security incident, outages impacting our service, the effectiveness of our customer support services, our pricing, the prices of competing products or services, mergers and acquisitions affecting our customer base, or reductions in our customers’ spending levels or general economic conditions in the geographic regions in which we operate, which may be impacted by the economic uncertainty resulting from the global COVID-19 pandemic. If our customers do not renew their subscriptions, or renew on less favorable terms, our revenue may decline, and we may not realize improved operating results from our customer base.
The markets in which we participate are highly competitive, with several large established competitors, and our failure to compete successfully would make it difficult for us to add and retain customers and would reduce or impede the growth of our business.
Our market is large, highly competitive, fragmented and subject to rapidly evolving technology, shifting customer needs and frequent introductions of new products and services. We currently compete with companies that offer products that target email, web and data security, awareness training, continuity, archiving, DMARC reporting, and digital brand protection, as well as large providers such as Google Inc. and Microsoft Corporation, which offer functions and tools as part of their core mailbox services that may be, or be perceived to be, similar to ours.
Our current and potential future competitors include:
|
|
• |
Email Security: Barracuda Networks, Inc., Google, Microsoft Exchange Online Protection, Proofpoint, Inc., Symantec Corporation, Agari Data, Inc., Cisco Systems Inc., Avanan, Inc., GreatHorn, Inc., IronScales, Ltd., INKY Technology Company, and Abnormal Security Corporation; |
|
|
• |
Archiving: Dell EMC, Microsoft Office® 365®, Proofpoint, Inc., Veritas Technologies LLC, Smarsh Inc., Barracuda Networks, Inc., and Global Relay Communication, Inc.; |
|
|
• |
Awareness training: KnowBe4, Inc., Cofense Inc., and Wombat Security, a division of Proofpoint, Inc.; |
|
|
• |
Web security: Cisco Systems, Inc., Webroot Inc., TitanHQ’s Webtitan, SafeDNS, Inc., Akamai Technologies, Inc, Infoblox Inc., Forcepoint LLC, Trustwave Holdings, Inc., and Zscaler, Inc.; |
22
|
|
• |
DMARC reporting: Agari Data, Inc., Valimail Inc., dmarcian, Inc., Ondemarc by Redsift Limited, and ReturnPath’s email fraud protection, a division of Proofpoint, Inc.; and |
|
|
• |
Digital brand protection: RSA Security LLC, a division of Dell EMC, RiskIQ, Inc., and MarkMonitor Inc. |
In addition, as we launch new products and services, we will face competition from new and existing competitors. We expect competition to increase in the future from both existing competitors and new companies that may enter our markets. Additionally, some potential customers, particularly large enterprises, may elect to develop their own internal products. If two or more of our competitors were to merge or partner with one another, the change in the competitive landscape could reduce our ability to compete effectively. Our continued success and growth depends on our ability to out-perform our competitors at the individual service level as well as increasing demand for a unified service infrastructure. We cannot guarantee that we will out-perform our competitors at the product level or that the demand for a unified service technology will increase.
Some of our current competitors have, and our future competitors may have, certain competitive advantages such as greater brand and name recognition, longer operating history, larger market share, larger existing user base and greater financial, technical and other resources. Some competitors may be able to devote greater resources to the development, promotion and sale of their products and services than we can to ours, which could allow them to respond more quickly than we can to new technologies and changes in customer needs. We cannot assure you that our competitors will not offer or develop products or services that are superior to ours or achieve greater market acceptance.
If we are unable to effectively increase sales of our services to large enterprises while mitigating the risks associated with serving such customers, our business, financial position and results of operations may suffer.
As we seek to increase our sales to large enterprise customers, we may face longer sales cycles, more complex customer requirements, unfavorable contractual terms, substantial upfront sales costs and less predictability in completing some of our sales than we do with smaller customers. In addition, our ability to successfully sell our services to large enterprises is dependent on us attracting and retaining sales personnel, including sales engineers, with experience in selling to large organizations. Also, because security breaches and disruptions of larger, more high-profile enterprises are likely to be heavily publicized, there is increased reputational risk associated with serving such customers. If we are unable to increase sales of our services to large enterprise customers while mitigating the risks associated with serving such customers, our business, financial position and results of operations may suffer.
Failure to effectively expand our sales and marketing capabilities could harm our ability to acquire new customers and achieve broader market acceptance of our services.
Acquiring new customers and expanding sales to existing customers will depend to a significant extent on our ability to expand our sales and marketing operations. We generate approximately one-fourth of our revenue from direct sales and we expect to continue to rely on our sales force to obtain new customers and grow revenue from our existing customer base. We expect to expand our global sales force, and we face a number of challenges in achieving our hiring goals. For instance, there is significant competition for sales personnel, including sales engineers, with the sales skills and technical knowledge that we require, including experience selling to large enterprise customers. In addition, training and integrating a large number of sales and marketing personnel in a short period of time requires the allocation of significant internal resources. Our ability to achieve projected growth in revenue in the future will depend, in large part, on our success in recruiting, training and retaining sufficient numbers of sales personnel, all of which may be negatively impacted by the continuing global COVID-19 pandemic. We invest significant time and resources in training new sales personnel to understand our solutions. In general, new hires require significant training and substantial experience before becoming productive. Our recent hires and planned hires may not become as productive as we require, and we may be unable to hire or retain sufficient numbers of qualified individuals in the future in the markets where we currently operate or where we seek to conduct business. Our growth may be materially and adversely impacted if the efforts to expand our sales and marketing capabilities are not successful or if they do not generate a sufficient increase in revenue.
Our business and results of operations may be negatively impacted by the United Kingdom’s withdrawal from the European Union.
The United Kingdom’s withdrawal from the European Union, or Brexit, became effective on January 31, 2020, and the transition period, or the Brexit transition period, during which time the United Kingdom and the European Union negotiated the terms of trade and other matters, ended on December 31, 2020. The United Kingdom and European Union have signed a European Union-United Kingdom Trade and Cooperation Agreement, or the TCA, which became provisionally applicable on January 1, 2021 and will become formally applicable once ratified by both the United Kingdom and the European Union. Negotiations between the United Kingdom and the European Union are expected to continue in relation to certain elements of the trading relationship between the United Kingdom and the European Union. The ultimate effects of Brexit will depend, in part, on how the terms of the TCA take effect in practice and on any other agreements the United Kingdom may make with the European Union and many of the regulations that now apply in the United Kingdom following the Brexit transition period (including financial laws and regulations, tax, intellectual
23
property rights, data protection laws, immigration laws and employment laws), will likely be amended in future as the United Kingdom determines its new approach, which may result in significant divergence from European Union regulations. This lack of clarity on future United Kingdom laws and regulations and their interaction with the European Union laws and regulations increases our burden of operating in and doing business in the United Kingdom and the European Union and may affect our results of operations in a number of ways, including increasing currency exchange risk and disruptions in trade and the free movement of goods and services to and from the United Kingdom, generating instability in the global financial markets or negatively impacting the economies of the United Kingdom and Europe. In addition, because of our significant presence in the United Kingdom, it is possible that Brexit may impact some or all of our current operations, including transfers of our personal data and our customers’ personal data between our operations in the United Kingdom and our operations in the European Union. As a result, some of our European customers that are not based in the United Kingdom are requiring that we move their data from our United Kingdom data centers to our data centers based in Germany. Brexit may also impact our ability to freely move employees from our London headquarters to our other locations in Europe. The long-term effects of Brexit will depend in part on how the TCA, and any future agreements signed by the United Kingdom and the European Union, take effect in practice. We expect that Brexit could lead to legal uncertainty and potentially divergent national laws and regulations as the United Kingdom determines which European Union laws to replicate or replace. Any of these effects of Brexit, and others we cannot anticipate, could negatively impact our business and results of operations.
If we are unable to maintain successful relationships with our channel partners, our ability to acquire new customers could be adversely affected.
In order to grow our business, we anticipate that we will continue to depend on our relationships with our channel partners who we rely on, in addition to our direct sales force, to sell and support our services. In our fiscal year ended March 31, 2021, while no individual channel partner accounted for 10% or more of our revenue, in the aggregate, our channel partners accounted for 75% of our revenue. We expect that sales to channel partners will continue to account for a substantial portion of our revenue for the foreseeable future. We utilize channel partners to efficiently increase the scale of our marketing and sales efforts, increasing our market penetration to customers which we otherwise might not reach on our own. Our ability to achieve revenue growth in the future will depend, in part, on our success in maintaining successful relationships with our channel partners, which includes ensuring that we make our service as easy to use by these channel partners as possible.
Our agreements with our channel partners are generally non-exclusive, meaning our channel partners may offer customers competitive services from different companies. If our channel partners do not effectively market and sell our services, choose to use greater efforts to market and sell their own products or services or those of others, or fail to meet the needs of our customers, our ability to grow our business, sell our services and maintain our reputation may be adversely affected. Our agreements with our channel partners generally allow them to terminate their agreements for any reason upon 90 days’ notice. The loss of key channel partners, our possible inability to replace them, or the failure to recruit additional channel partners could materially adversely affect our results of operations. If we are unable to maintain our relationships with these channel partners, our business, results of operations, financial condition or cash flows could be adversely affected.
Any serious disruptions in our services caused by defects in our software or otherwise may cause us to lose revenue and market acceptance.
Our customers use our services for the most critical aspects of their business, and any disruptions to our services or other performance problems with our services, however caused, could hurt our brand and reputation and may damage our customers’ businesses. We provide regular updates, which may contain undetected errors when first introduced or released. In the past, we have discovered software errors, failures, vulnerabilities and bugs in our services after they have been released and new errors in our existing services may be detected in the future. Real or perceived errors, failures, system delays, interruptions, disruptions, vulnerabilities, or bugs could result in negative publicity, loss of or delay in market acceptance of our services, loss of competitive position, delay of payment to us, lower renewal rates, or claims by customers for losses sustained by them. In such an event, we may be required, or may choose, for customer relations or other reasons, to expend additional resources in order to mitigate or correct the problem. We seek to cap the liability to which we are exposed in the event of losses or harm to our customers, but we cannot be certain that we will obtain these caps or that these caps, if obtained, will be enforced in all instances. We carry insurance; however, the amount of such insurance may be insufficient to compensate us for any losses that may result from claims arising from defects or disruptions in our services. As a result, we could lose future sales and our reputation and our brand could be harmed.
24
We provide service level commitments under our subscription agreements and service disruptions, including any related to our recent security incident, could obligate us to provide refunds and we could face subscription terminations, which could adversely affect our revenue.
Our subscription agreements with customers provide certain service level commitments. If we are unable to meet the stated service level commitments or suffer extended periods of downtime that exceed the periods allowed under our customer agreements, including as a result of our recently disclosed security incident or DDoS attacks, we could be required to pay refunds or face subscription terminations, either of which could significantly impact our revenue. We have suffered significant service disruptions in the past and we cannot guarantee that future attacks or service disruptions will not occur. Any future attacks or significant service disruptions could adversely affect our reputation, our relationships with our existing customers and our ability to attract new customers, all of which would impact our future revenue and operating results.
We have acquired, and may acquire in the future, other businesses, products or technologies, which could require significant management attention, disrupt our business, dilute shareholder value and adversely affect our results of operations.
As part of our growth strategy and in order to remain competitive, we may acquire, or make investments in, complementary companies, products or technologies. Since fiscal 2017, we have completed several acquisitions. Notwithstanding these acquisitions, our acquisition experience to date remains relatively limited, and as a result, our ability as an organization to acquire and integrate other companies, products or technologies, particularly when the acquired entities are located in geographies where we have not previously done business, in a successful manner is unproven. We may not be able to find suitable acquisition targets, and we may not be able to complete such acquisitions on favorable terms, if at all. If we do complete acquisitions, we may not ultimately strengthen our competitive position or achieve our goals, and any acquisitions we complete could be viewed negatively by our customers, analysts and investors. In addition, if we are unsuccessful at integrating such acquisitions or the technologies associated with such acquisitions, our revenue and results of operations could be adversely affected. We may only be able to conduct limited due diligence on an acquired company’s technology, products and operations. Following an acquisition, we may be subject to liabilities arising from an acquired company’s past or present technology, product and operations, including liabilities related to data security and privacy of customer data and infringement of the intellectual property rights of others, and these liabilities may be greater than the warranty and indemnity limitations that we negotiate. Any liability that is greater than these warranty and indemnity limitations could have a negative impact on our financial condition. Any integration process may require significant time and resources, and we may not be able to manage the process successfully. We may not successfully evaluate or utilize the acquired technology or personnel, or accurately forecast the financial impact of an acquired business, including accounting charges. We may have to pay cash, incur additional debt, or issue equity securities to pay for any such acquisitions, each of which could adversely affect our financial condition or the value of our ordinary shares. The sale of equity or issuance of debt to finance any such acquisitions could result in dilution to our shareholders. The incurrence of additional indebtedness would result in increased fixed obligations and could also include covenants or other restrictions that would impede our ability to manage our operations. See “The terms of our Credit Agreement require us to comply with certain financial covenants and impose restrictions on our business and operations, which creates default risks and reduces our flexibility” below.
In addition, as of March 31, 2021, we had $217.1 million in goodwill and intangible assets, net of accumulated amortization, recorded on our balance sheet as a result of our recent acquisitions. We will incur expenses related to the amortization of intangible assets and we may in the future need to incur charges with respect to the impairment of goodwill or intangible assets, which could adversely affect our operating results.
If we are not able to provide successful updates, enhancements and features to our technology to, among other things, keep up with emerging cyber threats and customer needs, our business could be adversely affected.
Our industry is marked by rapid technological developments and demand for new and enhanced services and features to meet the evolving IT needs of organizations. In particular, cyber threats are becoming increasingly sophisticated and responsive to the new security measures designed to thwart them. If we fail to identify and respond to new and increasingly complex methods of attack and update our products to detect or prevent such threats, our business and reputation will suffer. The success of any new enhancements, features or services that we introduce depends on several factors, including the timely completion, introduction and market acceptance of such enhancements, features or services. We may not be successful in either developing these modifications and enhancements or in bringing them to market in a timely fashion. Furthermore, modifications to existing technologies will increase our research and development expenses. If we are unable to successfully enhance our existing services to meet customer requirements, increase adoption and usage of our services, or develop new services, enhancements, features and products, our business and operating results will be harmed.
25
Our quarterly results may fluctuate for a variety of reasons and may not fully reflect the underlying performance of our business.
Our quarterly operating results, including the levels of our revenue, gross margin, profitability, cash flow and deferred revenue, may vary significantly in the future, and period-to-period comparisons of our operating results may not be meaningful. Accordingly, the results of any one quarter should not be relied upon as an indication of future performance. Our quarterly financial results may fluctuate as a result of a variety of factors, many of which are outside of our control and, as a result, may not fully reflect the underlying performance of our business. Fluctuations in quarterly results may negatively impact the value of our ordinary shares. Factors that may cause fluctuations in our quarterly financial results include, but are not limited to:
|
|
• |
foreign currency exchange rates; |
|
|
• |
our ability to attract new customers; |
|
|
• |
our revenue retention rate; |
|
|
• |
the amount and timing of operating expenses related to the maintenance and expansion of our business, operations and infrastructure; |
|
|
• |
network outages or security breaches, including our recent security incident; |
|
|
• |
general economic, industry and market conditions, including the continuing impact of the global COVID-19 pandemic, Brexit and economic conditions in South Africa; |
|
|
• |
expenses related to litigation or regulatory matters; |
|
|
• |
increases or decreases in the number of features in our services or pricing changes upon any renewals of customer agreements; |
|
|
• |
changes in our pricing policies or those of our competitors; |
|
|
• |
new variations in sales of our services, which has historically been highest in the fourth quarter of a given fiscal year; |
|
|
• |
the timing and success of new services and service introductions by us and our competitors or any other change in the competitive dynamics of our industry, including consolidation among competitors, customers or strategic partners; |
|
|
• |
restructuring expenses; |
|
|
• |
the impact of acquisitions; and |
|
|
• |
changes in our income tax rate. |
We are subject to a number of risks associated with global sales and operations.
We operate a global business with offices located in the United States, the United Kingdom, South Africa, Australia and Germany, as well as several other locations. In the fiscal year ended March 31, 2021, we generated 51% of our revenue from the United States, 29% from the United Kingdom, 10% from South Africa and 10% from the rest of the world. As a result, our sales and operations are subject to a number of risks and additional costs, including the following:
|
|
• |
fluctuations in exchange rates between currencies in the markets where we do business, which impacts our reportable revenue and expenses; |
|
|
• |
the disparate impact that the global COVID-19 pandemic is having on different countries and their economies; |
|
|
• |
risks associated with trade restrictions and additional legal requirements, including those related to the exportation of our technology; |
|
|
• |
the need to adapt our solutions for specific countries; |
|
|
• |
greater risk of unexpected changes in regulatory rules, regulations and practices, tariffs and tax laws and treaties; |
|
|
• |
compliance with multiple anti-bribery laws, including the United States Foreign Corrupt Practices Act and the U.K. Anti-Bribery Act; |
|
|
• |
heightened risk of unfair or corrupt business practices in certain geographies, and of improper or fraudulent sales arrangements that may impact financial results and result in restatements of, or irregularities in, financial statements; |
|
|
• |
limited or uncertain protection of intellectual property rights in some countries and the risks and costs associated with monitoring and enforcing intellectual property rights abroad; |
26
|
|
• |
greater difficulty in enforcing contracts and managing collections in certain jurisdictions, as well as longer collection periods; |
|
|
• |
potential changes in trade relations arising from policy initiatives or other political factors that could negatively impact our purchases of technology among other things; |
|
|
• |
management communication and integration problems resulting from cultural and geographic dispersion; |
|
|
• |
social, economic and political instability, particularly in South Africa where the current economic environment is very challenging; |
|
|
• |
terrorist attacks and security concerns in general; and |
|
|
• |
complex and potentially adverse tax consequences. |
All of the factors described above, including the previously described risks related to Brexit, and other factors could harm our ability to generate future global revenue and, consequently, materially impact our business, results of operations and financial condition.
If the prices we charge for our services are unacceptable to our customers, our operating results will be harmed.
As the market for our services matures, or as new or existing competitors introduce new products or services that compete with ours, we may experience pricing pressure and be unable to renew our agreements with existing customers or attract new customers at prices that are consistent with our pricing model and operating budget. If this were to occur, it is possible that we would have to change our pricing model or reduce our prices, which could harm our revenue, gross margin and operating results. Pricing decisions may also impact the mix of adoption among our subscription plans and negatively impact our overall revenue. Moreover, large enterprises, which may account for a larger portion of our business in the future, may demand substantial price concessions. Finally, the economic impact of the global COVID-19 pandemic may cause our prospects and existing customers to request price concessions to enable them to purchase our services or renew existing services. If we are, for any reason, required to reduce our prices, our revenue, gross margin, profitability, financial position and cash flow may be adversely affected.
Our research and development efforts may not produce new services or enhancements to existing services that result in significant revenue or other benefits in the near future, if at all.
We invested 19%, 19% and 17% of our revenue in research and development in our fiscal years ended March 31, 2021, 2020 and 2019, respectively. We expect to continue to dedicate significant financial and other resources to our research and development efforts in order to maintain our competitive position. However, investing in research and development personnel, developing new services and enhancing existing services is expensive and time-consuming, and there is no assurance that such activities will result in significant new marketable services, enhancements to existing services, design improvements, cost savings, revenue or other expected benefits. If we spend significant time and effort on research and development and are unable to generate an adequate return on our investment, our business and results of operations may be materially and adversely affected.
We employ third-party licensed software for use in or with our services, and the inability to maintain these licenses or errors or vulnerabilities in the software we license could result in increased costs, reduced service levels, or security risk, which would adversely affect our business.
Our services incorporate and rely on certain third-party software obtained under licenses from other companies. We anticipate that we will continue to rely on such third-party software and development tools in the future. Although we believe that there are commercially reasonable alternatives to the third-party software we currently license, this may not always be the case, or it may be difficult or costly to replace. In addition, integration of the software used in our services with new third-party software may require significant work and require substantial investment of our time and resources and delays in the release of our services until equivalent technology is either developed by us, or, if available, is identified, obtained and integrated, which could harm our business. A licensor may have difficulties keeping up with technological changes or may stop supporting the software or other intellectual property that it licensed to us. Also, to the extent that our services depend upon the successful operation of third-party software in conjunction with our software, any undetected errors, defects or security vulnerabilities in this third-party software could prevent the deployment or impair the functionality of our services, delay new services introductions, result in a failure of our services, result in security breaches, and injure our reputation. Third-party software could also be used to launch an attack, also known as a supply chain attack, on our corporate and customer systems resulting in service disruptions and security breaches. Our use of additional or alternative third-party software would require us to enter into additional license agreements with third parties on terms that may not be favorable to us.
27
Natural disasters, power loss, telecommunications failures and similar events could cause interruptions or performance problems associated with our information and technology infrastructure that could impair the delivery of our services and harm our business.
We currently store our customers’ information within third-party data center hosting facilities. As part of our current disaster recovery plans and arrangements, our production environment and all of our customers’ data is currently replicated in near real-time to a facility located in a different location. We cannot provide assurance that the measures we have taken to eliminate single points of failure will be effective to prevent or minimize interruptions to our operations. Our facilities are vulnerable to interruption or damage from a number of sources, many of which are beyond our control, including floods, fires, power loss, telecommunications failures, global pandemics such as COVID-19, the effects of climate change (such as drought, wildfires, increased storm severity and sea level rise), and similar events. They may also be subject to break-ins, sabotage, intentional acts of vandalism and similar misconduct. Any damage to, or failure of, our systems generally could result in interruptions to our service, which may reduce our revenue, cause customers to terminate their subscriptions and adversely affect our renewal rate and our ability to attract new customers. Our business and reputation will also be harmed if our existing and potential customers believe our service is unreliable. The occurrence of a natural disaster, an act of terrorism, a decision to close the facilities without adequate notice or other unanticipated problems at these facilities could result in lengthy interruptions in our service. Even with the disaster recovery arrangements, our service could be interrupted. As we continue to add data centers and add capacity in our existing data centers, we may move or transfer our data and our customers’ data. Any unsuccessful data transfers may impair the delivery of our service. Further, as we continue to grow and scale our business to meet the needs of our customers, additional burdens may be placed on our hosting facilities.
Actions we have taken to restructure our business to better align our resources with our strategy were costly and may not be as effective as anticipated.
In February 2021, we announced a restructuring plan designed to align our resources with our strategy. The restructuring plan, which included a reduction of our workforce by approximately 4%, was designed to permit us to increase investment in strategic growth areas. In connection with the restructuring, we recognized pre-tax charges to our financial results for the year ended March 31, 2021 of approximately $3.3 million, consisting of $3.7 million of severance and other one-time termination benefits, and other restructuring related costs, partially offset by $0.4 million of other adjustments. These charges were primarily cash-based. The actions associated with the restructuring plan are now largely complete.
This type of restructuring activity may result in business disruptions and may not produce the full efficiency and cost reduction benefits anticipated. Furthermore, the benefits may be realized later than expected and the cost of implementing these measures may be greater than anticipated. If these measures are not successful, we may need to undertake additional cost reduction efforts, which could result in future charges. Moreover, the restructuring plan may cause business disruptions with customers and elsewhere if our cost reduction efforts prove ineffective, and our business may not be more efficient or effective than prior to the implementation of the plan. Our restructuring activities, including the related charges and the impact of the related workforce reduction, which may include potential legal claims by impacted employees, could have a material adverse effect on our business, operating results and financial condition.
Legal and Regulatory Risks
Data privacy concerns, evolving regulations of cloud computing, cross-border data transfer restrictions and other domestic or foreign laws and regulations may limit the use and adoption of, or require modifications to, our products and services, which could limit our ability to attract new customers or support existing customers thus reducing our revenue, harming our operating results and adversely affecting our business.
Laws and regulations related to the provision of services on the internet are increasing, as federal, state and foreign governments continue to adopt new laws and regulations addressing data privacy and data security regarding the collection, processing, storage and use of personal information. For example, in the United States, these include laws and regulations promulgated under the authority of the Federal Trade Commission, the Electronic Communications Privacy Act, the Computer Fraud and Abuse Act, the Health Insurance Portability and Accountability Act of 1996, or HIPAA, the Graham-Leach-Bliley Act of 1999, and state breach notification and data privacy laws, as well as regulator enforcement positions and expectations reflected in federal and state regulatory actions, settlements, consent decrees and guidance documents. In January 2020, the California Consumer Privacy Act of 2018, or CCPA, became effective. The CCPA governs the collection, sale and use of California consumers’ (i.e., California residents’) personal information (as that term is broadly defined by the CCPA), and it has significant impacts on businesses’ handling of personal information and existing privacy policies and procedures. The CCPA gives California consumers expanded rights to access and delete their personal information, opt out of certain personal information sharing, and receive detailed information about how their personal information is used by requiring covered entities to provide new disclosures to California consumers and provide such consumers new ways to opt-out of certain sales of personal information. The CCPA provides for civil penalties for violations, as well as a private right
28
of action for data breaches that is expected to increase data breach litigation. In November 2020, California residents voted to approve a ballot proposition that creates the California Privacy Rights Act, or CPRA, that amends and expands the CCPA to further enhance privacy protections for California residents. The CCPA may subject us to regulatory fines by the State of California, individual claims, and increased commercial liabilities. In addition, the CCPA, as well as data privacy laws that have been proposed or enacted in other U.S. states, may limit our or our customers’ ability to use, process and store certain data, which may decrease adoption of our services, increase our costs for compliance, and harm our business, financial condition, cash flows and results of operations.
Internationally, almost every jurisdiction in which we operate has established its own data security, data protection and data privacy legal frameworks with which we, or our customers, must comply, including the European Union General Data Protection Regulation, or the GDPR. The GDPR applies to any company established in the European Union as well as to those outside the European Union if they collect and use personal data in connection with the offering of goods or services to individuals in the European Union or the monitoring of their behavior. The GDPR has enhanced data protection obligations for data controllers of personal data, including, for example, expanded disclosures about how personal information is to be used, limitations on retention of personal data, and mandatory personal data breach notification requirements. The GDPR also imposes onerous obligations and liabilities on service providers or data processors. Under GDPR, regulatory fines of up to 20 million Euros or up to 4% of the total worldwide annual turnover of the preceding financial year, whichever is higher, may be imposed. In addition, data subjects can claim damages resulting from violations of the GDPR. The GDPR further grants non-profit organizations the right to bring claims on behalf of data subjects. Following the end of the Brexit transition period on December 31, 2020, the GDPR was adopted under United Kingdom and is referred to as the ‘UK GDPR’, but there may be further developments about the regulation that may impact data protection and data privacy considerations in the United Kingdom. Moreover, while the European Union Commission has not yet made an adequacy decision regarding the United Kingdom’s data protection regime, under the trade agreement negotiated between the United Kingdom and the European Union during the Brexit transition period, transfers of personal data from the European Union to the United Kingdom are not treated as transfers to a "third country" until the earlier of (a) the date on which the European Union Commission issues an adequacy decision regarding the UK, or (b) July 1, 2021. There remains uncertainty whether or not the European Union Commission will make such a decision and any negative decision could adversely impact the way we conduct business in the United Kingdom and the European Union.
Given the breadth and depth of changes in data protection regulations, complying with the various requirements has caused us to expend significant resources and such expenditures are likely to continue into the future as we respond to new interpretations and enforcement actions and as we continue to negotiate data processing agreements with our customers and business partners. In addition, our recent security incident implicated the regulatory notification requirements applicable to us. As a result, our actions with respect to such notifications could be subject to regulatory fines and reputational damage, either of which could harm our operating results and adversely affect our business.
To facilitate and legitimize the transfer of both customer and personal data from the European Union and the United Kingdom to the United States, in the past we have relied on the EU-U.S. Safe Harbor Framework, which required companies based in the United States to provide assurance that they were adhering to relevant European standards for personal data protection. In October 2015, the Court of Justice of the European Union (the “CJEU”) invalidated the EU-U.S. Safe Harbor Framework. In February 2016, the U.S. and European Union announced agreement on a new framework for transatlantic data flows entitled the EU-U.S. Privacy Shield Framework and on July 12, 2016, the European Commission deemed the EU-U.S. Privacy Shield Framework an adequate mechanism to enable data transfers outside of the European Economic Area (the “EEA”) to the United States under European Union law. On January 12, 2017, the Swiss Government approved the Swiss-U.S. Privacy Shield Framework as a valid legal mechanism to comply with Swiss data protection requirements when transferring personal data from Switzerland to the United States. We are currently certified under the EU-US and the Swiss-US Privacy Shield frameworks. In July 2020, however, the CJEU ruled that the EU-US Privacy Shield Framework is invalid for the transfer of personal data outside of the EEA to the United States. In its decision, the CJEU affirmed that personal data transfers from the EEA to the United States pursuant to standard contractual clauses, or SCCs, remain a valid transfer mechanism, subject to a requirement that the supervisory authorities in member states continue to review the adequacy of the protection afforded by the SCCs. Because of the CJEU affirmation and the position of the authorities in the United Kingdom to align with European data privacy regulations, we believe that personal data transfers among our global affiliates in accordance with the SCCs comply with applicable European and United Kingdom personal data transfer requirements. If SCCs are ultimately determined to provide inadequate protection for personal data transfers between the European Union, the United Kingdom and the United States, however, we will be required to identify and implement alternative solutions to ensure that we comply with European and United Kingdom personal data transfer requirements. As noted above, following the end of the Brexit transition period, there remains considerable uncertainty regarding the future status of data transfers between the United Kingdom and the EEA. If we fail to comply fully with privacy laws in Europe and the United Kingdom, the data protection authorities might impose upon us a number of different sanctions, including fines and restrictions on international personal data transfers.
Given the nature and global reach of our business, including our operations in the United States, our corporate headquarters in London, United Kingdom, our operations in Germany and elsewhere, as well as the types of information our customers store on our
29
systems, evolving data privacy and data protection laws and regulations around the world that impose requirements on us as well as our customers will continue to significantly impact our business.
Data privacy and data protection laws and regulations are subject to new and differing interpretations and there may be significant inconsistency in laws and regulations throughout the jurisdictions in which we operate or offer our services. Legal and other regulatory requirements could restrict our ability to store and process personal data as part of our services, or, in some cases, impact our ability to offer our services in certain jurisdictions. Such laws and regulations may also impact our customers' ability to deploy certain of our services globally, to the extent they utilize our services for processing personal data. In addition, in many cases these data privacy and data protection laws and regulations apply not only to transfers of personal data to third parties, but also within an enterprise, including our company or our customers. Additionally, if third parties that we engage for the provision of certain functions of our services violate applicable data privacy and data protection laws or regulations or our policies or requirements, such violations may also put our customers’ information at risk which could in turn have an adverse effect on our business. The costs of compliance with, and other burdens imposed by, data privacy and data protection laws and regulations may require resources to create new services or modify existing services, the failure of which could lead to us being subject to significant fines, penalties or liabilities for noncompliance, and may slow the pace at which we close sales transactions, any of which could harm our business.
Our strategy in gaining insights from the data we collect as part of our services, particularly threat data, is becoming important to the value of the services we deliver to our customers and to our operational efficiency. Our use of data in this way may be constrained by contractual restrictions or regulatory developments. Compliance with applicable laws and regulations regarding personal data may require changes in our services that result in increased costs and reduced efficiency. Regulations governing personal data might limit our ability to offer certain features and functionality in certain jurisdictions. Failure to comply with existing or new data privacy and data protection laws and regulations may result in significant fines or orders to stop the alleged noncompliant activity, as well as negative publicity.
We are subject to governmental export controls and funds dealings restrictions that could impair our ability to compete in certain international markets and subject us to liability if we are not in full compliance with applicable laws.
Our software and services may be subject to export controls and we may also be subject to restrictions or prohibitions on transactions with, or on dealing in funds transfers to/from, certain embargoed jurisdictions and sanctioned persons and entities, pursuant to the U.K. Export Control Organisation’s restrictions, the U.K. Treasury’s restrictions, the European Union Council Regulations, the United States Department of Commerce’s Export Administration Regulations, the economic and trade sanctions regulations administered by the United States Treasury Department’s Office of Foreign Assets Controls and United States Department of State, and similar laws that may apply in other jurisdictions in which we operate or sell or distribute our services. Export control and economic sanctions laws include prohibitions on the sale or supply of certain products and services to certain embargoed or sanctioned countries, regions, governments, persons and entities, as well as restrictions or prohibitions on dealing in funds to/from those countries, regions, governments, persons and entities. In addition, various countries regulate the import of certain encryption items and technology through import permitting and licensing requirements and have enacted laws that could limit our ability to distribute our services or could limit our customers’ ability to implement our services in those countries.
The exportation, re-exportation, and importation of our software and services, including by our channel partners, must comply with applicable laws or else we may be adversely affected, through reputational harm, government investigations, penalties, and/or a denial or curtailment of our ability to export our services. Although we take precautions to prevent our services from being provided in violation of such laws, our services may have been in the past, and could in the future be, provided in violation of such laws.
If we are found to be in violation of United States sanctions or export control laws, it could result in substantial fines and penalties for us and for the individuals working for us, including civil penalties over $300,000, or twice the value of the transaction, whichever is greater, per violation, and in the event of conviction for a criminal violation, fines of up to $1 million and possible incarceration for responsible employees and managers for willful and knowing violations. Under the terms of applicable regulations, each instance in which a company provides goods or services, or otherwise acts in violation of export control and sanctions laws, may be considered a separate violation. If we are found to be in violation of U.K. sanctions or export controls, it could also result in unlimited fines for us and responsible employees and managers, as well as imprisonment of up to two years for responsible employees and managers.
Changes in our software or services, or changes in export, sanctions or import laws, may delay the introduction and sale of our services in certain markets, prevent our customers with global operations from deploying our software or services or, in some cases, prevent the export or import of our software or services to certain countries, regions, governments, persons or entities altogether, which could adversely affect our business, financial condition and operating results.
30
We may become involved in other litigation that may materially adversely affect us.
From time to time, we may become involved in various legal proceedings relating to matters incidental to the ordinary course of our business, including patent, commercial, product liability, data security, contract disputes, employment, class action, whistleblower and other litigation and claims, and governmental and other regulatory investigations and proceedings. Such matters can be time-consuming, divert management’s attention and resources, cause us to incur significant expenses or liability and/or require us to change our business practices. In addition, the expense of litigation and the timing of this expense from period to period are difficult to estimate, subject to change and could adversely affect our results of operations. Because of the potential risks, expenses and uncertainties of litigation, we may, from time to time, settle disputes, even where we have meritorious claims or defenses, by agreeing to settlement agreements. Because litigation is inherently unpredictable, we cannot assure you that the results of any of these actions will not have a material adverse effect on our business, financial condition, results of operations and prospects.
Human Capital Risks
We are dependent on the continued services and performance of our key employees, including our co-founder, the loss of whom could adversely affect our business.
Our future performance depends upon contributions from our senior management team and, in particular, our co-founder, Peter Bauer, our Chairman and Chief Executive Officer. If our senior management team, including any new hires that we may make, fails to work together effectively and to execute on our plans and strategies on a timely basis, our business could be harmed. The loss of one or more of our executive officers or key employees could have an adverse effect on our business. The loss of services of Mr. Bauer could significantly delay or prevent the achievement of our strategic objectives.
We depend on highly skilled personnel to grow and operate our business, and if we are unable to hire, retain and motivate qualified personnel, our business may be adversely impacted.
Our success depends largely upon our continued ability to identify, hire, develop, motivate and retain highly skilled personnel, including senior management, engineers, software developers, sales representatives and customer support representatives. Our growth strategy also depends, in part, on our ability to continue to attract and retain highly skilled personnel. Identifying, recruiting, training and integrating qualified individuals requires significant time, expense and attention of management. Competition for these personnel is intense, especially for engineers experienced in designing and developing software and software as a service applications, and for experienced enterprise sales professionals. In addition, the global COVID-19 pandemic has made hiring more difficult, particularly when the hiring process, from sourcing to interviewing to onboarding to training, must be done remotely. We have, from time to time experienced, and we expect to continue to experience, difficulty in hiring and retaining employees with appropriate qualifications. Many of the companies with which we compete for experienced personnel have greater resources than we have. If we hire employees from competitors or other companies, their former employers may assert that these employees or we have breached their legal obligations, resulting in a diversion of our time and resources. In addition, prospective and existing employees often consider the value of the equity awards they receive in connection with their employment. If the actual or perceived value of our equity awards declines, or experiences significant volatility, it may adversely affect our ability to recruit and retain key employees. If we are not able to effectively recruit and retain qualified employees, our ability to achieve our strategic objectives will be adversely impacted, and our business will be harmed.
Our recent workforce reduction could negatively impact our future hiring plans and employees who are not impacted, which may adversely affect our business.
The workforce reductions made in connection with the restructuring we announced in February 2021 may adversely affect our ability to attract and retain highly skilled employees. Even if our key employees were not directly affected by these reductions, the termination of others may have a negative impact on morale and our culture and our ability to retain current employees, as well as our ability to attract qualified new employees in the future.
Risks Related to Intellectual Property
We are currently being sued, have been sued in the past, and may in the future be sued by third parties for alleged infringement of their proprietary rights.
There is considerable patent and other intellectual property development activity in our industry. Our success depends, in part, on our not infringing upon the intellectual property rights of others. Our competitors, as well as a number of other entities, including non-practicing patent entities, or NPEs, which are entities that have no operating business but exist purely as collectors of patents, and individuals, may own or claim to own intellectual property relating to our industry. Patent and other intellectual property disputes are common and third parties are currently claiming, have claimed, and may in the future claim that we are infringing upon their intellectual property rights or send us letters proposing that we license certain of their patents. In particular, there are a number of
31
NPEs in the security industry that are particularly aggressive about pursuing alleged infringement of their patents. Given this and the proliferation of lawsuits in our industry and other similar industries by both NPEs and operating entities, we have been sued for patent infringement and expect that we may be sued by others at some point in the future, regardless of the merits of any such lawsuits. See Part I, Item 3 “Legal Proceedings” in this Annual Report on Form 10-K. We closely monitor all such claims and respond as appropriate. We may also be unaware of the intellectual property rights that others may claim cover some or all of our technology or services. Any claims or litigation could cause us to incur significant expenses and, if successfully asserted against us, could require that we pay substantial damages or ongoing royalty payments, prevent us from offering our services, or require that we comply with other unfavorable terms. Under all of our sales contracts, we are obligated to indemnify our customers and channel partners against third-party infringement claims, and we may also be obligated to pay substantial settlement costs, including royalty payments, in connection with any such claim or litigation and to obtain licenses, modify services or refund fees, any of which could be costly. Even if we were to prevail in any such dispute, litigation regarding intellectual property is very costly and time-consuming and diverts the attention of our management and key personnel from our business operations.
Any failure to protect our intellectual property rights could impair our ability to protect our proprietary technology and our brand.
Our success and ability to compete depend in part on our intellectual property. We primarily rely on copyright, trade secret and trademark laws, trade secret protection and confidentiality or license agreements with our employees, customers, partners and others to protect our intellectual property rights. However, the steps we take to protect our intellectual property rights may be inadequate. As of March 31, 2021, we had 31 patents issued and 21 patent applications pending in the United States. We also had one patent issued in the United Kingdom. We may not be able to obtain any further patents, and our pending applications may not result in the issuance of patents. We have issued patents and pending patent applications outside the United States, and we may have to expend significant resources to obtain additional patents as we expand our international operations due to the cost of monitoring and protecting our rights across multiple jurisdictions.
In order to protect our intellectual property rights, we may be required to spend significant resources to monitor and protect these rights. Litigation brought to protect and enforce our intellectual property rights could be costly, time-consuming and distracting to management and could result in the impairment or loss of portions of our intellectual property. Failure to adequately enforce our intellectual property rights could also result in the impairment or loss of those rights. Furthermore, our efforts to enforce our intellectual property rights may be met with defenses, counterclaims and countersuits attacking the validity and enforceability of our intellectual property rights. Patent, copyright, trademark and trade secret laws offer us only limited protection and the laws of many of the countries in which we sell our services do not protect proprietary rights to the same extent as the United States and Europe. Accordingly, defense of our trademarks and proprietary technology may become an increasingly important issue as we continue to expand our operations and solution development into countries that provide a lower level of intellectual property protection than the United States or Europe. Policing unauthorized use of our intellectual property and technology is difficult and the steps we take may not prevent misappropriation of the intellectual property or technology on which we rely. For example, in the event of inadvertent or malicious disclosure of our proprietary technology, trade secret laws may no longer afford protection to our intellectual property rights in the areas not otherwise covered by patents or copyrights. Accordingly, we may not be able to prevent third parties from infringing upon or misappropriating our intellectual property. Our failure to secure, protect and enforce our intellectual property rights could materially adversely affect our brand and our business.
We may elect to initiate litigation in the future to enforce or protect our proprietary rights or to determine the validity and scope of the rights of others. That litigation may not be ultimately successful and could result in substantial costs to us, the reduction or loss in intellectual property protection for our technology, the diversion of our management’s attention and harm to our reputation, any of which could materially and adversely affect our business and results of operations.
Confidentiality arrangements with employees and others may not adequately prevent disclosure of trade secrets and other proprietary information.
We have devoted substantial resources to the development of our technology, business operations and business plans. In order to protect our trade secrets and proprietary information, we rely in significant part on confidentiality arrangements with our employees, licensees, independent contractors, advisers, channel partners, resellers and customers. These arrangements may not be effective to prevent disclosure of confidential information, including trade secrets, and may not provide an adequate remedy in the event of unauthorized disclosure of confidential information. In addition, if others independently discover trade secrets and proprietary information, we would not be able to assert trade secret rights against such parties. Effective trade secret protection may not be available in every country in which our services are available or where we have employees or independent contractors. The loss of trade secret protection could make it easier for third parties to compete with our solutions by copying functionality. In addition, any changes in, or unexpected interpretations of, the trade secret and employment laws in any country in which we operate may compromise our ability to enforce our trade secret and intellectual property rights. Costly and time-consuming litigation could be necessary to enforce and determine the scope of our proprietary rights, and failure to obtain or maintain trade secret protection could adversely affect our competitive business position.
32
We may be subject to damages resulting from claims that our employees or contractors have wrongfully used or disclosed alleged trade secrets or confidential information of their former employers or other parties.
We could in the future be subject to claims that employees or contractors, or we, have inadvertently or otherwise used or disclosed trade secrets or other proprietary information of our competitors or other parties. Litigation may be necessary to defend against these claims. If we fail in defending against such claims, a court could order us to pay substantial damages and prohibit us from using technologies or features that are essential to our solutions, if such technologies or features are found to incorporate or be derived from the trade secrets or other proprietary information of these parties. In addition, we may lose valuable intellectual property rights or personnel. A loss of key personnel or their work product could hamper or prevent our ability to develop, market and support potential solutions or enhancements, which could severely harm our business. Even if we are successful in defending against these claims, such litigation could result in substantial costs and be a distraction to management.
The use of open source software in our offerings may expose us to additional risks, including security risks, and harm our intellectual property.
Open source software is typically freely accessible, usable and modifiable. Certain open source software licenses require a user who intends to distribute the open source software as a component of the user’s software to disclose publicly part or all of the source code to the user’s software. In addition, certain open source software licenses require the user of such software to make any derivative works of the open source code available to others on unfavorable terms or at no cost. This can subject previously proprietary software to open source license terms.
We monitor and control our use of open source software in an effort to avoid unanticipated conditions or restrictions on our ability to successfully commercialize our products and solutions and believe that our compliance with the obligations under the various applicable licenses has mitigated the risks that we have triggered any such conditions or restrictions. However, such use may have inadvertently occurred in the development and offering of our products and solutions, particularly in situations where we acquired technology from third parties through acquisitions. Additionally, if a third-party software provider has incorporated certain types of open source software into software that we have licensed from such third-party, we could be subject to the obligations and requirements of the applicable open source software licenses. This could harm our intellectual property position and have a material adverse effect on our business, results of operations and financial condition.
The terms of many open source software licenses have not been interpreted by United States or foreign courts, and there is a risk that those licenses could be construed in a manner that imposes unanticipated conditions or restrictions on our ability to successfully commercialize our products and solutions. For example, certain open source software licenses may be interpreted to require that we offer our products or solutions that use the open source software for no cost; that we make available the source code for modifications or derivative works we create based upon, incorporating or using the open source software (or that we grant third parties the right to decompile, disassemble, reverse engineer, or otherwise derive such source code); that we license such modifications or derivative works under the terms of the particular open source license; or that otherwise impose limitations, restrictions or conditions on our ability to use, license, host, or distribute our products and solutions in a manner that limits our ability to successfully commercialize our products.
We could, therefore, be subject to claims alleging that we have not complied with the restrictions or limitations of the applicable open source software license terms or that our use of open source software infringes the intellectual property rights of a third party. In that event, we could incur significant legal expenses, be subject to significant damages, be enjoined from further sale and distribution of our products or solutions that use the open source software, be required to pay a license fee, be forced to reengineer our products and solutions, or be required to comply with the foregoing conditions of the open source software licenses (including the release of the source code to our proprietary software), any of which could adversely affect our business. Even if these claims do not result in litigation or are resolved in our favor or without significant cash settlements, the time and resources necessary to resolve them could harm our business, results of operations, financial condition and reputation.
Additionally, the use of open source software can lead to greater risks than the use of third-party commercial software, as open source software does not come with warranties or other contractual protections regarding indemnification, infringement claims or the quality of the code. Open source software may also include malicious code or security vulnerabilities.
Financial Risks
Because we recognize revenue from subscriptions for our services over the term of the agreement, downturns or upturns in new business may not be immediately reflected in our operating results and may be difficult to discern.
We generally recognize subscription revenue from customers ratably on a straight-line basis over the terms of their subscription agreements, which are typically one year in duration. As a result, most of the revenue we report in each quarter is derived from the recognition of deferred revenue relating to subscription agreements entered into during the previous fiscal year or quarter. Consequently, a decline in new or renewed subscriptions with yearly terms in any one quarter may have a small impact on our
33
operating revenue results for that quarter. However, such decline will negatively affect our revenue in future quarters. Accordingly, the effect of significant downturns in sales and market acceptance of our services, resulting from the impact of the global COVID-19 pandemic, our recent security incident, or otherwise, and potential changes in our pricing and packaging policies or retention rate may not be fully reflected in our operating results until future periods. Shifts in the mix of annual versus monthly subscription billings may also make it difficult to assess our business. We may also be unable to reduce our cost structure in line with a significant deterioration in sales. In addition, a significant majority of our costs are expensed as incurred, while revenue is recognized over the life of the agreement with our customer. As a result, increased growth in the number of our customers could continue to result in our recognition of more costs than revenue in the earlier periods of the terms of our agreements. Our subscription model also makes it difficult for us to rapidly increase our revenue through additional sales in any period, as revenue from new customers is recognized over the applicable subscription term.
We have incurred net losses in the past, and we may not be able to sustain profitability for the foreseeable future.
We have incurred net losses in each of our fiscal years since our inception in 2003 up through our fiscal year ended March 31, 2020, with the exception of our fiscal year ended March 31, 2015, in which we generated net income of $0.3 million. In our fiscal year ended March 31, 2021, we generated net income of $29.7 million. In our fiscal years ended March 31, 2020 and 2019, we incurred a net loss of $2.2 million and $7.0 million, respectively. As of March 31, 2021, we had an accumulated deficit of $53.9 million. We have been growing rapidly, and, as we do so, we incur significant sales and marketing, support, research and development and other related expenses. Our ability to sustain profitability will depend in significant part on our obtaining new customers, expanding our existing customer relationships and ensuring that our expenses, including our sales and marketing expenses and the cost of supporting new customers, does not exceed our revenue. We also expect to make significant expenditures and investments in research and development to expand and improve our services and technical infrastructure. In addition, as a public company, we expect to continue to incur significant legal, accounting and other expenses. These increased expenditures may make it harder for us to maintain profitability and we cannot predict when we will achieve sustained profitability, if at all. We also may incur net losses in the future for a number of other unforeseen reasons. Accordingly, we may not be able to maintain profitability, and we may incur losses in the foreseeable future.
Fluctuations in currency exchange rates could adversely affect our business.
The functional currency of our operating subsidiaries is generally the local currency of each entity and our reporting currency is the U.S. dollar. In our fiscal year ended March 31, 2021, 54% of our revenue was denominated in U.S. dollars, 26% in British pounds, 10% in South African rand and 9% in other currencies. Given that the functional currency of our subsidiaries is generally the local currency of each entity, but our reporting currency is the U.S. dollar, fluctuations in currency exchange rates between the U.S. dollar and each of the British pound, the South African rand and the Australian dollar could materially and adversely affect our business. There may be instances in which costs and revenue will not be matched with respect to currency denomination. We estimate that a 10% increase or decrease in the value of the British pound against the U.S. dollar would have decreased or increased our income from operations by approximately $1.9 million in our fiscal year ended March 31, 2021 and that a 10% increase or decrease in the value of the South African rand against the U.S. dollar would have increased or decreased our income from operations by approximately $3.1 million in our fiscal year ended March 31, 2021. To date, we have not entered into any currency hedging contracts. As a result, to the extent we continue our expansion on a global basis, we expect that increasing portions of our revenue, cost of revenue, assets and liabilities will be subject to fluctuations in currency valuations. We may experience economic loss and a negative impact on earnings or net assets solely as a result of currency exchange rate fluctuations.
The global COVID-19 pandemic has had and may continue to have an impact on currency exchange rate volatility, which could impact our results of operations and make our internal financial forecasting difficult. In addition, Brexit may continue to have a significant impact on currency exchange rates and the global and European economy generally. The outcome of the referendum and the resulting uncertainty regarding the status of the United Kingdom’s withdrawal from the European Union caused volatility in global stock markets and foreign currency exchange rate fluctuations, including the strengthening of the U.S. dollar against the British pound and the Euro, which may continue or worsen now that the withdrawal has occurred and the Brexit transition period ended on December 31, 2020. Finally, the South African economy faces a number of challenges, including slow economic growth and high unemployment. These challenges combined with the continuing impact of the global COVID-19 pandemic have made the South African rand highly volatile over the past year. As described above, significant fluctuations in currency exchange rates between the South African rand and the U.S. dollar will impact our results of operations.
34
The terms of our Credit Agreement require us to comply with certain financial covenants and impose restrictions on our business and operations, which creates default risks and reduces our flexibility.
In July 2018, we entered into a Credit Agreement, or, as amended, the Credit Agreement, by and among us, certain of our subsidiaries party thereto, as guarantors, certain financial institutions party thereto from time to time, as lenders, and JPMorgan Chase Bank, N.A., as administrative agent, or the Administrative Agent. The Credit Agreement provided us with a $100.0 million senior secured term loan, or the Term Loan, and a $50.0 million senior secured revolving credit facility, or the Revolving Facility, and together with the Term Loan, the Credit Facility. The Credit Agreement requires compliance with significant financial and non-financial covenants, including affirmative covenants relating to the provision of annual and quarterly financial statements and compliance certificates, maintenance of property, insurance, compliance with laws and environmental matters and negative covenants, including, among others, restrictions on the incurrence of certain indebtedness, granting of liens, making investments and acquisitions, mergers and consolidations, paying dividends, entering into affiliate transactions and asset sales. The Credit Agreement also provides for a number of events of default, including, among others, payment, bankruptcy, covenant, representation and warranty, default under material indebtedness (other than the Credit Agreement), change of control and judgment defaults.
As a result of the negative covenants, we may be restricted from engaging in business or operating activities that may otherwise improve our business or from financing future operations or capital needs. Failure to comply with the covenants, including the financial covenants, if not cured or waived, will result in an event of default that could trigger acceleration of our indebtedness, which would require us to repay all amounts owing under our Credit Agreement and could have a material adverse impact on our business. Overdue amounts under the Credit Agreement accrue interest at a default rate. We cannot be certain that our future operating results will be sufficient to ensure compliance with the financial covenants in our Credit Agreement or to remedy any defaults. In addition, in the event of any event of default and related acceleration, we may not have or be able to obtain sufficient funds to make the accelerated payments required under the Credit Agreement.
If we need to raise additional capital to expand our operations and invest in new technologies in the future and cannot raise it on acceptable terms or at all, our ability to compete successfully may be harmed.
We believe that our existing cash and cash equivalents together with available capacity under our Credit Facility will be sufficient to meet our anticipated cash requirements for at least the next twelve months. However, unforeseen circumstances may arise which may mean that we may need to raise additional funds, and we may not be able to obtain additional debt or equity financing on favorable terms, if at all, or because of restrictions in our Credit Agreement. If we raise additional equity financing, our security holders may experience significant dilution of their ownership interests and the value of our ordinary shares could decline. If we engage in additional debt financing, we may be required to obtain the Administrative Agent’s consent and/or accept terms that are more restrictive than the terms currently applicable to us under the Credit Agreement. If we need additional capital and cannot raise it on acceptable terms, if at all, we may not be able to, among other things:
|
|
• |
develop and enhance our services; |
|
|
• |
continue to expand our research and development, and sales and marketing organizations; |
|
|
• |
hire, train and retain key employees; |
|
|
• |
respond to competitive pressures or unanticipated working capital requirements; or |
|
|
• |
pursue acquisition opportunities. |
Our inability to do any of the foregoing could reduce our ability to compete successfully and harm our results of operations.
We must maintain proper and effective internal controls over financial reporting and any failure to maintain the adequacy of these internal controls may adversely affect investor confidence in our company and, as a result, the value of our ordinary shares.
We are required, pursuant to Section 404 of the Sarbanes-Oxley Act of 2002, or Section 404, and the related rules adopted by the SEC, to furnish a report by management on, among other things, the effectiveness of our internal control over financial reporting on an annual basis. This assessment includes disclosure of any material weaknesses identified by our management in our internal control over financial reporting. During the evaluation and testing process, if we identify one or more material weaknesses in our internal control over financial reporting, we will be unable to assert that our internal controls are effective.
In addition, our independent registered public accounting firm must attest to the effectiveness of our internal control over financial reporting under Section 404. Our independent registered public accounting firm may issue a report that is adverse in the event it is not satisfied with the level at which our controls are documented, designed or operating. We may not be able to remediate any future material weaknesses, or to complete our evaluation, testing and any required remediation in a timely fashion. We are also
35
required to disclose significant changes made in our internal control procedures on a quarterly basis. Our compliance with Section 404 requires that we incur substantial accounting expense and expend significant management efforts.
Any failure to maintain internal control over financial reporting could severely inhibit our ability to accurately report our financial condition or results of operations. If we are unable to assert that our internal control over financial reporting is effective or our independent registered public accounting firm is unable to express an opinion on the effectiveness of our internal controls when it is required to issue such opinion, we could lose investor confidence in the accuracy and completeness of our financial reports, the market price of our ordinary shares could decline, and we could be subject to sanctions or investigations by the Nasdaq Global Select Market, the SEC or other regulatory authorities.
Tax Risks
We are a multinational organization faced with increasingly complex tax issues in many jurisdictions, and we could be obligated to pay additional taxes in various jurisdictions.
As a multinational organization, we may be subject to taxation in several jurisdictions around the world with increasingly complex tax laws, the application of which can be uncertain. The amount of taxes we pay in these jurisdictions could increase substantially as a result of changes in the applicable tax principles, including increased tax rates, new tax laws or revised interpretations of existing tax laws and precedents, which could have a material adverse effect on our liquidity and results of operations. In addition, the authorities in these jurisdictions could review or audit our tax returns and general tax compliance and impose additional tax, interest and penalties, and the authorities could claim that various withholding requirements apply to us or our subsidiaries or assert that benefits of tax treaties are not available to us or our subsidiaries. Furthermore, one or more jurisdictions in which we do not believe we are currently subject to tax payment, withholding, or filing requirements, could assert that we are subject to such requirements. Any of these claims or assertions could have a material impact on us and the results of our operations, including our cash flow. In addition, as a result of efforts by governments to address the continuing global COVID-19 pandemic, among other considerations, we believe that there will be legislation to increase corporate tax rates in many of the jurisdiction in which we conduct business, including in the United Kingdom and in the United States. Such legislation, if enacted, could negatively impact our financial results.
A change in our tax residence could have a negative effect on our future profitability.
Although we are organized under the laws of the Bailiwick of Jersey, our affairs are, and are intended to continue to be, managed and controlled in the United Kingdom for tax purposes and therefore we are resident in the United Kingdom for U.K. and Jersey tax purposes. It is possible that in the future, whether as a result of a change in law or the practice of any relevant tax authority or as a result of any change in the conduct of our affairs or for any other reason, we could become, or be regarded as having become, a resident in a jurisdiction other than the United Kingdom. If we cease to be a U.K. tax resident, we may be subject to a charge to U.K. corporation tax on chargeable gains on our assets and to unexpected tax charges in other jurisdictions on our income. Similarly, if the tax residency of any of our subsidiaries were to change from their current jurisdiction for any of the reasons listed above, we may be subject to a charge to local capital gains tax on the assets.
Taxing authorities could reallocate our taxable income among our subsidiaries, which could increase our consolidated tax liability.
We conduct operations world-wide through subsidiaries in various tax jurisdictions pursuant to transfer pricing arrangements between us and our subsidiaries. If two or more affiliated companies are located in different countries, the tax laws or regulations of each country generally will require that transfer prices be the same as those between unrelated companies dealing at arm’s length and that appropriate documentation is maintained to support the transfer pricing. While we believe that we operate in compliance with applicable transfer pricing laws and intend to continue to do so, our transfer pricing procedures are not binding on applicable tax authorities. If tax authorities in any of these countries were to successfully challenge our transfer prices as not reflecting arms’ length transactions, they could require us to adjust our transfer prices and thereby reallocate our income to reflect these revised transfer prices, which could result in a higher tax liability to us. In addition, if the country from which the income is reallocated does not agree with the reallocation, both countries could tax the same income, resulting in double taxation. If tax authorities were to allocate income to a higher tax jurisdiction, subject our income to double taxation or assess interest and penalties, it would increase our consolidated tax liability, which could adversely affect our financial condition, results of operations and cash flows. Double taxation should be mitigated in these circumstances where the affiliated parties that are subject to the transfer pricing adjustments are able to benefit from any applicable double taxation agreement.
36
Our ability to use our net operating loss or tax credit carry forwards may be subject to limitation.
As of March 31, 2021, we had net operating loss carryforwards in the U.K., U.S. federal and state, Australia, Germany, Israel, and Canada. U.S. federal net operating losses generated through the fiscal year ending March 31, 2018 expire at various dates through 2038 while U.S. federal net operating losses generated after March 31, 2018 do not expire. Substantially all U.S. state net operating loss carryforwards expire at various dates through 2041. Net operating losses in Canada expire in 2041. Net operating loss carryforwards in the U.K., Australia, Germany and Israel do not expire. As of March 31, 2021, we had U.K. income tax credit carryforwards that do not expire. As of March 31, 2021, we had Israel income tax credit carryforwards that expire at various dates from 2024 through 2026.
Each jurisdiction in which we operate may have its own limitations on our ability to utilize net operating loss or tax credit carryforwards generated in that jurisdiction that may increase our U.K. and/or foreign income tax liability.
Under Section 382 of the U.S. Internal Revenue Code of 1986, if a corporation undergoes an ownership change, the corporation’s ability to use its pre-change net operating loss carryforwards to offset its post-change income and taxes may be limited. In general, an ownership change occurs if there is a 50 percent cumulative change in ownership of the company over a rolling three-year period. Similar rules may apply under U.S. state tax laws. We believe that we have experienced an ownership change in the past and may experience ownership changes in the future resulting from future transactions in our share capital, some of which may be outside our control. Based on the most recent analysis, we do not anticipate a material limitation on the utilization of our tax attributes. However, our ability to utilize net operating loss carryforwards or other tax attributes to offset U.S. federal and state taxable income in the future may be subject to future limitations.
U.S. holders of our ordinary shares could be subject to material adverse tax consequences if we are considered a Passive Foreign Investment Company, or PFIC, for U.S. federal income tax purposes.
We do not believe that we were a PFIC for U.S. federal income tax purposes during the tax year ending March 31, 2021 and do not expect to be a PFIC for U.S. federal income tax purposes in the current tax year. We also do not expect to become a PFIC in the foreseeable future, but the possible status as a PFIC must be determined annually and therefore may be subject to change. If we are at any time treated as a PFIC, such treatment could result in a reduction in the after-tax return to U.S. holders of our ordinary shares and may cause a reduction in the value of such shares. Furthermore, if we are at any time treated as a PFIC, U.S. holders of our ordinary shares could be subject to greater U.S. income tax liability than might otherwise apply, imposition of U.S. income tax in advance of when tax would otherwise apply and detailed tax filing requirements that would not otherwise apply. For U.S. federal income tax purposes, “U.S. holders” include individuals and various entities. A corporation is classified as a PFIC for any taxable year in which (i) at least 75% of its gross income is passive income or (ii) at least 50% of the average quarterly value of all its total gross assets is attributable to assets that produce or are held for the production of passive income. For this purpose, passive income includes certain dividends, interest, royalties and rents that are not derived in the active conduct of a trade or business. The PFIC rules are complex and a U.S. holder of our ordinary shares is urged to consult its own tax advisors regarding the possible application of the PFIC rules to it in its particular circumstances.
Risks Related to Owning Our Ordinary Shares and Our Organization in Jersey, Channel Islands
Our share price has been and may continue to be volatile.
The market price of our ordinary shares may decline. In addition, the market price of our ordinary shares could be highly volatile and may fluctuate substantially as a result of many factors, many of which we cannot control, including:
|
|
• |
the ongoing global impact of the continuing COVID-19 pandemic and the impact on our business; |
|
|
• |
actual or anticipated fluctuations in our results of operations; |
|
|
• |
variance in our financial performance from the expectations of market analysts; |
|
|
• |
announcements by us or our competitors of significant business developments, changes in service provider relationships, acquisitions or expansion plans; |
|
|
• |
changes in the prices of our services or those of our competitors; |
|
|
• |
our involvement in litigation, including patent litigation; |
|
|
• |
security breaches, including our recent security incident, and regulatory investigations resulting from such breaches; |
|
|
• |
our sale of ordinary shares or other securities in the future; |
|
|
• |
market conditions in our industry; |
37
|
|
• |
changes in key personnel; |
|
|
• |
the trading volume of our ordinary shares; |
|
|
• |
changes in the estimation of the future size and growth rate of our markets; and |
|
|
• |
general economic and market conditions, both in the United States and internationally. |
In addition, the stock markets have recently experienced extreme price and volume fluctuations, both as a result of the global COVID-19 pandemic and for other reasons. Broad market and industry factors may materially harm the market price of our ordinary shares, regardless of our operating performance. In the past, following periods of volatility in the market price of a company’s securities, securities class action litigation has often been instituted against that company. If we were involved in any similar litigation, we could incur substantial costs and our management’s attention and resources could be diverted.
If securities or industry analysts cease to publish research or publish inaccurate or unfavorable research about our business, our share price and trading volume could decline.
The trading market for our ordinary shares depends in part on the research and reports that securities or industry analysts publish about us or our business. If one or more of the analysts who covers us downgrades our shares or publishes inaccurate or unfavorable research about our business, our share price would likely decline. If one or more of these analysts ceases coverage of us or fails to publish reports on us regularly, demand for our shares could decrease, which could cause our share price and trading volume to decline.
We do not expect to pay dividends and investors should not buy our ordinary shares expecting to receive dividends.
We do not anticipate that we will declare or pay any dividends in the foreseeable future, and our ability to do so may be constrained by restrictions in our Credit Agreement or future debt arrangements, if any, and by Jersey law. Consequently, investors will only realize an economic gain on their investment in our ordinary shares if the price appreciates. Investors should not purchase our ordinary shares expecting to receive cash dividends. Since we do not pay dividends, and if we are not successful in sustaining an orderly trading market for our shares, then investors may not have any manner to liquidate or receive any payment on their investment. Therefore, our failure to pay dividends may cause investors to not see any return on their investment even if we are successful in our business operations.
U.S. shareholders may not be able to enforce civil liabilities against us.
Certain of our directors and executive officers are not residents of the United States, and all or a substantial portion of the assets of such persons are located outside the United States. As a result, it may not be possible for investors to effect service of process within the United States upon such persons or to enforce against them judgments obtained in U.S. courts predicated upon the civil liability provisions of the federal securities laws of the United States.
There is also a doubt as to the enforceability in England and Wales and Jersey, whether by original actions or by seeking to enforce judgments of U.S. courts, of claims based on the federal securities laws of the United States. In addition, punitive damages in actions brought in the United States or elsewhere may be unenforceable in England and Wales and Jersey.
The rights afforded to shareholders are governed by Jersey law. Not all rights available to shareholders under English law or U.S. law will be available to shareholders.
The rights afforded to shareholders will be governed by Jersey law and by our Articles of Association, and these rights differ in certain respects from the rights of shareholders in typical English companies and U.S. corporations. In particular, Jersey law significantly limits the circumstances under which shareholders of companies may bring derivative actions and, in most cases, only the corporation may be the proper claimant or plaintiff for the purposes of maintaining proceedings in respect of any wrongful act committed against it. Neither an individual nor any group of shareholders has any right of action in such circumstances. In addition, Jersey law does not afford appraisal rights to dissenting shareholders in the form typically available to shareholders of a U.S. corporation.
38
Item 1B. Unresolved Staff Comments.
None.
Item 2. Properties.
Principal Office Locations
The table below describes our existing principal office facilities, all of which are leased.
|
Location |
Purpose |
Square Footage |
Expiration |
|
London, United Kingdom |
Global Headquarters |
113,056 |
3/3/2029 |
|
Lexington, Massachusetts USA |
North American Headquarters |
99,993 |
1/31/2028 |
We maintain additional leased office facilities in Johannesburg and Cape Town, South Africa, Melbourne and Sydney, Australia, Munich, Germany, Amsterdam, the Netherlands, Torun, Poland, Dubai, UAE, Tel Aviv, Israel, as well as in Chicago, Dallas and San Francisco in the United States.
We believe that the total space available to us in the facilities under our current leases, or obtainable by us on commercially reasonable terms, will meet our needs for the foreseeable future.
Data Centers
We utilize two data centers in each of the United Kingdom, South Africa, Australia, Jersey, Channel Islands, Canada and Germany, and five data centers in the United States. Our data center leases expire between fiscal years 2022 and 2026. We have excess capacity built into our primary data center leases to accommodate infrastructure growth within the lease periods should we need to add more space or power to our existing footprint.
For more information about our lease and data center commitments, see also Note 9, Leases, of the notes to our consolidated financial statements, included elsewhere in this Annual Report on Form 10-K.
Item 3. Legal Proceedings.
For information on legal proceedings, see Note 14, Commitments and Contingencies - Litigation, of the notes to our consolidated financial statements, included elsewhere in this Annual Report on Form 10-K, which information is incorporated herein by reference.
From time to time and in the ordinary course of business, we are subject to various claims, charges and litigation. The outcome of litigation cannot be predicted with certainty and some lawsuits, claims or proceedings may be disposed of unfavorably to us, which could materially affect our financial condition or results of operations.
Item 4. Mine Safety Disclosures.
Not applicable.
39
PART II
Item 5. Market for Registrant’s Common Equity, Related Stockholder Matters and Issuer Purchases of Equity Securities.
Market Information
Our ordinary shares are listed on The Nasdaq Global Select Market under the symbol “MIME.”
Shareholders
As of March 31, 2021, there were 51 holders of record of our ordinary shares, including Cede & Co., a nominee for The Depository Trust Company, or DTC, which holds our ordinary shares on behalf of an indeterminate number of beneficial owners. All of the ordinary shares held by brokerage firms, banks and other financial institutions as nominees for beneficial owners are deposited into participant accounts at DTC and are considered to be held of record by Cede & Co. as one shareholder. Because most of our shares are held by brokers and other institutions on behalf of shareholders, we are unable to estimate the total number of shareholders represented by these record holders.
Dividends
We have never declared or paid, and do not anticipate declaring or paying in the foreseeable future, any cash dividends on our ordinary shares. Any future determination as to the declaration and payment of dividends, if any, will be at the discretion of our board of directors, subject to applicable laws, including the laws of the Bailiwick of Jersey, and will depend on then existing conditions, including our financial condition, operating results, contractual restrictions, including restrictions in our Credit Agreement, capital requirements, business prospects and other factors our board of directors may deem relevant.
Recent Sales of Unregistered Securities
None.
Purchase of Equity Securities by the Issuer and Affiliated Purchasers
None.
Securities Authorized for Issuance Under Equity Compensation Plans
Information about securities authorized for issuance under our equity compensation plans is incorporated herein by reference to Item 12 of Part III of this Annual Report on Form 10-K.
Stock Performance Graph
The graph below compares the cumulative total return to shareholders on our ordinary shares for the five-year period from March 31, 2016 through March 31, 2021, against the cumulative total return of the Russell 2000® Index and the Nasdaq Computer Index. The comparison assumes $100 was invested on March 31, 2016 in our ordinary shares and each of the indices and the reinvestment of dividends, if any.
40
The performance shown on the graph below is based on historical results and is not indicative of, nor intended to forecast, future performance of our ordinary shares.
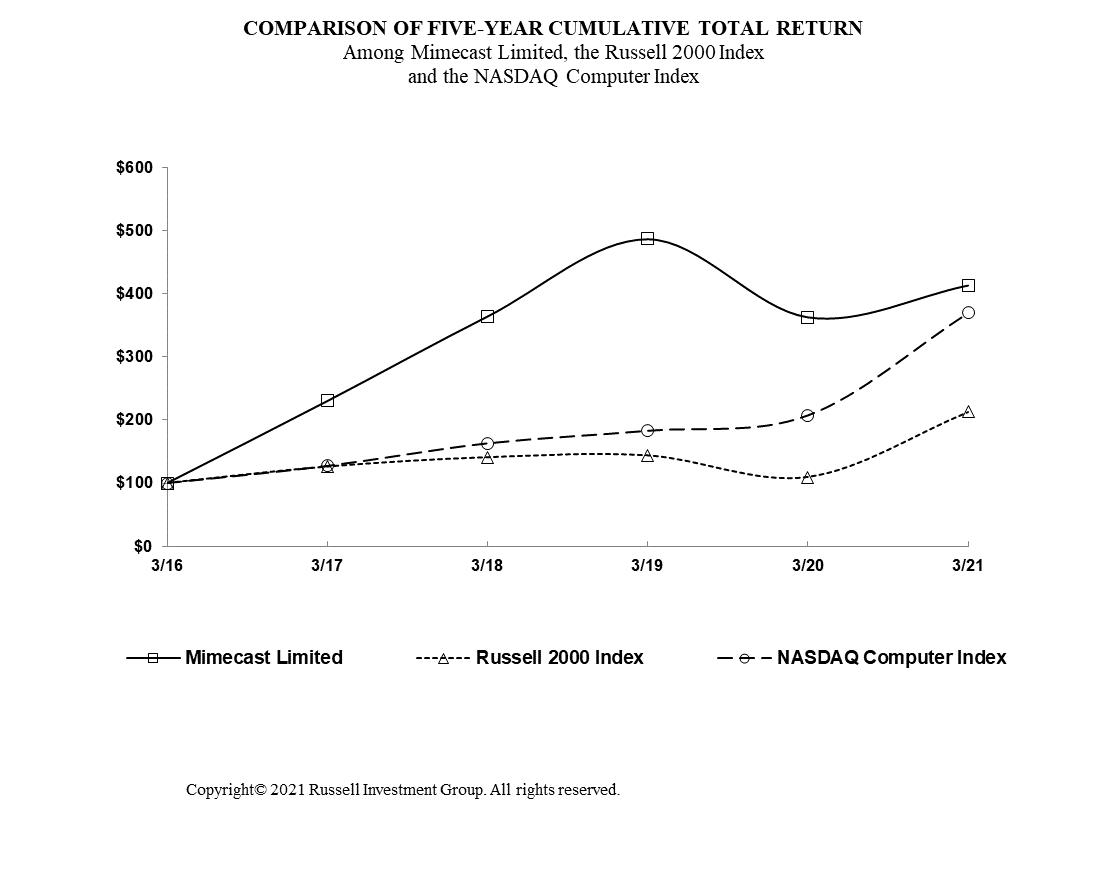
|
|
|
3/31/2016 |
|
3/31/2017 |
|
3/31/2018 |
|
3/31/2019 |
|
3/31/2020 |
|
3/31/2021 |
|
||||||
|
Mimecast Limited |
|
$ |
100.00 |
|
$ |
230.11 |
|
$ |
364.13 |
|
$ |
486.64 |
|
$ |
362.80 |
|
$ |
413.26 |
|
|
Russell 2000 Index |
|
$ |
100.00 |
|
$ |
126.22 |
|
$ |
141.10 |
|
$ |
143.99 |
|
$ |
109.45 |
|
$ |
213.26 |
|
|
NASDAQ Computer Index |
|
$ |
100.00 |
|
$ |
127.40 |
|
$ |
163.17 |
|
$ |
183.16 |
|
$ |
207.57 |
|
$ |
370.12 |
|
This performance graph and related information shall not be deemed to be “soliciting material” or “filed” for purposes of Section 18 of the Exchange Act, nor shall such information be incorporated by reference into any filing of Mimecast Limited under the Exchange Act or the Securities Act of 1933, as amended, or the Securities Act, except to the extent that we specifically incorporate it by reference in such filing.
Item 6. Selected Financial Data
We have elected to omit Selected Financial Data pursuant to guidance included in Securities and Exchange Commission Release No. 33-10890 (November 20, 2020).
41
Item 7. Management’s Discussion and Analysis of Financial Condition and Results of Operations.
The following discussion and analysis of our financial condition and results of our operations should be read in conjunction with our audited consolidated financial statements and related notes and other financial information included elsewhere in this Annual Report on Form 10-K. In addition to historical consolidated financial information, this discussion contains forward-looking statements that involve risks and uncertainties. Our actual results could differ materially from those anticipated in the forward-looking statements as a result of numerous factors, including, but not limited to, the risks discussed in Item 1A, “Risk Factors.” Our audited consolidated financial statements included elsewhere in this Annual Report on Form 10-K are prepared in accordance with accounting principles generally accepted in the United States.
Overview
We are a leading global provider of next generation cloud security and risk management services for email and corporate information. Our integrated suite of proprietary cloud services protects customers of all sizes from the significant business and data security risks they are exposed to through their email and other corporate systems. Our Email Security 3.0 and Cyber Resilience Extension offerings are designed to protect customers from today’s rapidly changing security environment.
We developed our proprietary cloud architecture to offer customers a comprehensive cyber resilience strategy. Our Email Security 3.0 strategy addresses threats in three distinct zones: at the email perimeter (Zone 1); inside the network and the organization (Zone 2); and beyond the perimeter (Zone 3). Additionally, our Cyber Resilience Extensions expand resilience to other critical elements of an organization’s digital infrastructure. Our primary offerings include: email security; email continuity and sync & recover; email archiving; awareness training; web security; DMARC analyzer; brand exploit protection; and threat intelligence and our API ecosystem.
We operate our business as a software-as-a-service, or SaaS, model with renewable annual subscriptions. Customers enter into annual and multi-year contracts to utilize various components of our services. Our subscription fee includes the use of the selected service and technical support. We believe our technology, subscription-based model, and customer support have led to our high revenue retention rate, which has helped us drive our strong revenue growth. We have historically experienced significant revenue growth from our existing customer base as they renew our services and purchase additional products.
We market and sell our services to organizations of all sizes across a broad range of industries. As of March 31, 2021, we provided our services to approximately 39,900 customers and protected millions of their employees across the world. We generate sales through our network of channel partners as well as through our direct sales force. Our growth and future success depend on our ability to expand our customer base, sell additional services to our existing customers, and retain our customers.
In the fiscal year ended March 31, 2021, we generated 49% of our revenue outside of the United States, with 29% generated from the United Kingdom, 10% from South Africa and 10% from the rest of the world. In the fiscal year ended March 31, 2020, we generated 49% of our revenue outside of the United States, with 29% generated from the United Kingdom, 12% from South Africa and 8% from the rest of the world. In the fiscal year ended March 31, 2019, we generated 50% of our revenue outside of the United States, with 31% generated from the United Kingdom, 14% from South Africa and 5% from the rest of the world. Our most significant growth market is the United States. We also believe that there is a large opportunity in our other existing markets. We intend to make significant investments in sales and marketing to continue expanding our customer base in our target markets.
We were founded in 2003 in the United Kingdom with a mission to make email safer and better, and to transform the way organizations protect, store and access their email and corporate information. Our Mimecast Email Security 3.0 offerings include Mimecast Email Security, Mimecast Targeted Threat Protection, Awareness Training, Internal Email Protect, DMARC Analyzer, and Brand Exploit Protect. Our DMARC Analyzer and Brand Exploit Protect offerings were launched in fiscal 2020. Our Cyber Resilience Extensions include Mimecast Enterprise Information Archiving, Mimecast Email Continuity, including Sync & Recover, Mimecast Web Security that provides a Domain Name System, or DNS, solution alongside our core email offerings, Mimecast Secure Messaging, Mimecast Privacy Pack, and Mimecast Large File Send. In July 2020, we acquired eTorch Inc., or MessageControl, a messaging security provider with solutions designed to help stop social engineering and human identity attacks with the use of machine learning technology.
42
Recent Developments
Global Covid-19 Pandemic. The global COVID-19 pandemic continues to evolve, and to date has led to the implementation of various responses, including global government-imposed quarantines, stay-at-home orders, travel restrictions, mandated business closures and other public health safety measures. These efforts have caused significant societal and economic disruption worldwide, including in all of the regions in which we operate our business and sell our products and services. COVID-19 infection rates declined somewhat during the late spring and summer of 2020 but increased dramatically in the fall and early winter of 2020 in many locations, which caused governments to reinstate, or consider reinstating, some restrictions. More recently, as a result of the widespread distribution of vaccines and continued containment efforts, infection rates appear to have stabilized or trended downward in many of the countries in which we operate.
We remain committed to supporting our employees, customers and partners, and their communities during the pandemic. As a result of the COVID-19 pandemic we took a number of actions, which included: (i) instituting a closure of all of our global offices, including our global headquarters in London, United Kingdom and our offices in the United States, and shifting to a remote working environment for all of our employees; (ii) implementing a travel ban, (iii) cancelling or shifting to virtual-only customer, industry and employee events; and (iv) establishing an employee support fund to offset the impact of the pandemic on our more vulnerable employees. The expected duration of these actions is uncertain. More recently, we have opened some of our smaller global offices on a significantly limited basis and in accordance with government requirements and plan to do the same at our two primary offices located in London, United Kingdom and Lexington, Massachusetts in the summer of 2021. We expect, however, that the transition back to normal operations will in any event take significant time, perhaps several months.
We believe that the global COVID-19 pandemic and the resulting societal and economic disruption has negatively impacted and will continue to negatively impact our business and results of operations in a number of ways. Demand for our products and services has been and may continue to be negatively impacted by a decline in the rate of IT spending and a delay in purchasing decisions as IT and security staff focus on addressing the disruption to their businesses, which may impact sales to prospects and existing customers and increase customer attrition. Additionally, the global COVID-19 pandemic and the governmental and economic responses have impacted some industries, such as travel, hospitality and retail, more significantly than others. Our global sales and marketing operations have been disrupted as we have moved to a remote working environment and canceled many customer and industry events. Some customers have requested extended payment terms, have reduced the number of seats that they purchase, or have not increased the number of seats as they historically have, and we expect that these trends will continue, or potentially accelerate if the economy worsens. The economic disruption may also negatively impact the collectability of our accounts receivables as customers experience extreme distress. We have been closely monitoring the impact of the global COVID-19 pandemic on all aspects of our business, including how it will impact our operations, and we may take further precautionary and preemptive actions as may be required by the evolving circumstances. At the current time, the extent to which the global COVID-19 pandemic may affect our business, results of operations and financial condition is uncertain. See Item 1A, “Risk Factors - The global COVID-19 pandemic, including the related containment efforts, has had, and will likely continue to have, certain negative impacts on our business and operations, and we are unable to predict with certainty the extent to which it may continue to adversely affect our business, results of operations and financial condition.”
Security Incident. In January 2021, we became aware of a security incident later determined to be conducted by the same sophisticated threat actor responsible for the SolarWinds supply chain attack. We immediately launched an internal forensic investigation. Our investigation was supported by leading third-party forensics and cyber incident response experts at Mandiant, a division of FireEye, Inc., and in coordination with law enforcement to aid their investigation into this threat actor. During our investigation, we learned that the threat actor used the SolarWinds supply-chain compromise to gain access to part of our production grid environment. Using this entry point, the threat actor accessed certain Mimecast-issued certificates and related customer server connection information. The threat actor also accessed a subset of email addresses and other contact information, as well as encrypted and/or hashed and salted credentials. In addition, the threat actor accessed and downloaded a limited number of our source code repositories, but we found no evidence of any modifications to our source code nor do we believe there was any impact on our products. As the investigation progressed, we issued a series of advisories to affected customers, including recommended precautionary steps to mitigate risk and, in some cases, to address regulatory requirements. Our forensic investigation was completed in March 2021 and we have eliminated the threat actor’s access to our environment. We have taken a number of actions to prevent future access to our environment and we will continue to monitor for threats and take precautionary steps as needed.
We are subject to risk and significant uncertainties as a result of this security incident, including those described in the section entitled “Risk Factors” above. While our investigation is complete, there can be no assurance as to what the overall impact of these events will be. These types of events often have cascading impacts that unfold over time and may result in a loss of revenue, a diminution of our business prospects and incremental costs, including costs associated with litigation or investigations by regulatory authorities, any of which may adversely impact our financial results.
43
We have incurred and expect to incur significant costs related to the security incident. For the period ended March 31, 2021, we recorded $0.8 million of pre-tax expenses related to the security incident, net of anticipated insurance recoveries. Expenses include costs of the forensic investigation, remediation costs, and legal and other professional services. It is also expected that we will continue to incur costs related to our response, remediation, and investigatory efforts relating to this security incident. While we have cyber insurance coverage, the amount of such insurance may be insufficient to compensate us for any expenses or losses that may result from the security incident or the insurance carrier may refuse to reimburse us for certain costs under the terms of the policy. The full scope of the costs and related impacts of the security incident, including the availability of insurance to offset some of these costs, cannot be estimated at this time.
Restructuring. On January 28, 2021, our Board of Directors approved a restructuring plan designed to align our resources with our strategy. The restructuring plan, which included a reduction of our workforce by approximately 4%, permitted us to increase investment in strategic growth areas. During the year ended March 31, 2021, we recognized total pre-tax restructuring charges of $3.3 million, consisting of $3.7 million of severance and other one-time termination benefits, and other restructuring related costs, partially offset by $0.4 million of other adjustments. These charges were primarily cash-based and were recognized in the fourth quarter of fiscal 2021. The actions associated with the restructuring plan are expected to be completed by the end of the first quarter of fiscal 2022 and we do not expect any material costs to be incurred in fiscal 2022.
Key Factors Affecting Our Performance
We believe that the growth of our business and our future success are dependent upon a number of key factors, including the following:
Acquisition of new customers. We employ a sales strategy that focuses on acquiring new customers, through our direct sales force and network of channel partners, and selling additional products to existing customers. Acquiring new customers, particularly large, enterprise customers, is a key element of our continued success, growth opportunity and future revenue. We have invested in and intend to continue to invest in our direct sales force and channel partners. During the year ended March 31, 2021, our customer base increased by approximately 1,900 organizations.
Selling of additional services to existing customers. Our direct sales force, together with our channel partners and dedicated customer experience team, seek to generate additional revenue from our existing customers by adding more of their employees to our services and selling additional services. We continue to believe a significant opportunity exists for us to sell additional services to current customers as they experience the benefits of our services and we address additional business use cases.
Investment in growth. We have invested in and intend to continue to invest in the expansion of our operations, headcount and software development to both enhance our current offerings and build new features and products. We expect our total operating expenses to increase, particularly as we continue to expand our sales operations, marketing activities and research and development team. We intend to continue to invest in our sales, marketing and customer experience organizations to drive additional revenue and support the growth of our customer base. Investments we make in our sales and marketing and research and development organizations will occur in advance of experiencing the full benefit from such investments. For the year ending March 31, 2022, we plan to continue increasing the size of our sales force, investing in the development of additional marketing content and increasing the size of our research and development team.
Currency fluctuations. We conduct business in the United States and in other countries in North America, the United Kingdom and in other countries in Europe, South Africa and in other countries in Africa, Australia and the UAE. As a result, we are exposed to risks associated with fluctuations in currency exchange rates, particularly between the U.S. dollar, the British pound and the South African rand. In the year ended March 31, 2021, 54% of our revenue was denominated in U.S. dollars, 26% in British pounds, 10% in South African rand and 9% in other currencies. Given that the functional currency of our subsidiaries is generally the local currency of each entity, but our reporting currency is the U.S. dollar, devaluations of the British pound, South African rand and other currencies relative to the U.S. dollar impacts our profitability.
We believe that the global COVID-19 pandemic could impact some or all of these key factors. See Item 1A, “Risk Factors - The global COVID-19 pandemic, including the related containment efforts, has had, and will likely continue to have, certain negative impacts on our business and operations, and we are unable to predict with certainty the extent to which it may continue to adversely affect our business, results of operations and financial condition.”
44
Key Performance Indicators
In addition to traditional financial metrics, such as revenue and revenue growth trends, we monitor several other key performance indicators to help us evaluate growth trends, establish budgets, measure the effectiveness of our sales and marketing efforts and assess operational efficiencies. The key performance indicators that we monitor are as follows:
|
|
|
Year Ended March 31, |
|
|||||||||
|
|
|
2021 |
|
|
2020 |
|
|
2019 |
|
|||
|
|
|
(dollars in thousands) |
|
|||||||||
|
Revenue constant currency growth rate (1) |
|
|
17 |
% |
|
|
28 |
% |
|
|
32 |
% |
|
Gross profit percentage |
|
|
76 |
% |
|
|
74 |
% |
|
|
73 |
% |
|
Free cash flow (1) |
|
$ |
88,437 |
|
|
$ |
37,304 |
|
|
$ |
37,440 |
|
|
Adjusted EBITDA (1) |
|
$ |
127,187 |
|
|
$ |
78,088 |
|
|
$ |
54,008 |
|
|
|
|
As of March 31, |
|
|||||||||
|
|
|
2021 |
|
|
2020 |
|
|
2019 |
|
|||
|
|
|
(dollars in thousands) |
|
|||||||||
|
Revenue retention rate |
|
|
104 |
% |
|
|
107 |
% |
|
|
111 |
% |
|
Total customers (2) |
|
|
39,900 |
|
|
|
38,100 |
|
|
|
34,400 |
|
|
(1) |
Adjusted EBITDA, free cash flow, and revenue constant currency growth rates are non-GAAP financial measures. For a reconciliation of Adjusted EBITDA, free cash flow and revenue constant currency growth rates to the nearest comparable GAAP measures, see “Reconciliations of Non-GAAP Financial Measures” below. |
|
(2) |
Reflects the customer count on the last day of the period rounded to the nearest hundred customers. We define a customer as an entity with an active subscription contract as of the measurement date. A customer is typically a parent company or, in a few cases, a significant subsidiary that works with us directly. In determining the number of customers, we do not include customers we acquired as a result of our acquisition of DMARC Analyzer B.V., or DMARC Analyzer, which transact with us on a credit card basis. |
Revenue constant currency growth rate. We believe revenue constant currency growth rate is a key indicator of our performance as it measures how we are executing on our strategy exclusive of currency fluctuations, which are beyond our control. We calculate revenue constant currency growth rate by translating revenue from entities reporting in foreign currencies into U.S. dollars using the comparable foreign currency exchange rates from the prior fiscal period. For further explanation of the uses and limitations of this non-GAAP measure and a reconciliation of our revenue constant currency growth rate to revenue, as reported, the most directly comparable GAAP measure, “Reconciliations of Non-GAAP Financial Measures” below. We expect our constant currency growth rate will decline in the fiscal year ended March 31, 2022 as compared to the prior fiscal year.
Gross profit percentage. We believe gross profit percentage is a key indicator of our efficiency in offering our services to our customers. Gross profit percentage is calculated as gross profit divided by revenue. Our gross profit percentage has seen growth over the past three years and we expect it to remain relatively consistent for the year ending March 31, 2022; however, it has fluctuated and will continue to fluctuate on a quarterly basis due to timing of the addition of hardware and employees to serve our growing customer base. Gross profit also includes amortization of intangible assets related to acquired businesses. We provide our services in each of the regions in which we operate. Costs related to supporting and hosting our product offerings and delivering our services are incurred in the region in which the related revenue is recognized. As a result, our gross profit percentage in actual terms is consistent with gross profit on a constant currency basis.
Free cash flow. We believe free cash flow is a liquidity measure that provides useful information to management and investors about the amount of cash generated by the business that, after the acquisition of property, equipment and capitalized software, can be used for strategic opportunities, including investing in our business, and strengthening the balance sheet. Analysis of free cash flow facilitates management’s comparisons of our operating results to competitors’ operating results. We define free cash flow as net cash provided by operating activities minus purchases of property, equipment and capitalized software. For further explanation of the uses and limitations of this non-GAAP measure and a reconciliation of our free cash flow to the most directly comparable GAAP measure, net cash provided by operating activities, see “Reconciliations of Non-GAAP Financial Measures” below.
Adjusted EBITDA. We believe that Adjusted EBITDA is a key indicator of our operating results. We define Adjusted EBITDA as net income (loss), adjusted to exclude: depreciation, amortization, disposals and impairment of long-lived assets, acquisition-related gains and expenses, litigation-related expenses, share-based compensation expense, restructuring expense, interest income and interest expense, the benefit from (provision for) income taxes and foreign exchange income (expense). Prior to the adoption of ASU No. 2016-02, Leases (Topic 842), or ASC 842, on April 1, 2019, Adjusted EBITDA also included rent paid in the period related to locations which had been accounted for as build-to-suit facilities. For further explanation of the uses and limitations of this non-GAAP measure and a reconciliation of our Adjusted EBITDA to the most directly comparable GAAP measure, net income (loss), see
45
“Reconciliations of Non-GAAP Financial Measures” below. We expect that our Adjusted EBITDA will continue to increase compared to the prior fiscal year; however, we expect that our operating expenses will also increase in absolute dollars as we focus on expanding our sales and marketing teams and growing our research and development capabilities.
Revenue retention rate. We believe that our ability to retain customers is an indicator of the stability of our revenue base and the long-term value of our customer relationships. Our revenue retention rate is driven by our customer renewals and upsells. We calculate our revenue retention rate by annualizing constant currency revenue recorded on the last day of the measurement period for only those customers in place throughout the entire measurement period. This revenue includes renewed revenue contracts as well as additional revenue derived from the sale of additional seat licenses as well as additional services sold to these existing customers. We divide the result by revenue on a constant currency basis on the first day of the measurement period for all customers in place at the beginning of the measurement period. The measurement period is the trailing twelve months. The revenue on a constant currency basis is based on the average exchange rates in effect during the respective period.
Total customers. We believe the total number of customers is a key indicator of our financial success and future revenue potential. We define a customer as an entity with an active subscription contract as of the measurement date. A customer is typically a parent company or, in a few cases, a significant subsidiary that works with us directly. In determining the number of customers, we do not include customers we acquired from DMARC Analyzer that transact with us on a credit card basis. We expect to continue to grow our customer base through the addition of new customers in each of our markets.
Reconciliations of Non-GAAP Financial Measures
Revenue constant currency growth rate
In order to determine how our business performed exclusive of the effect of foreign currency fluctuations, we compare the percentage change in our revenue from one period to another using a constant currency. To determine the revenue constant currency growth rate for each period, revenue from entities reporting in foreign currencies was translated into U.S. dollars using the comparable prior period’s foreign currency exchange rates. For example, the average rates in effect for the fiscal year ended March 31, 2020 were used to convert revenue for the year ended March 31, 2021 and the revenue for the comparable prior period ended March 31, 2020, rather than the actual exchange rates in effect during the respective period. Revenue constant currency growth rate is a non-GAAP financial measure. A reconciliation of this non-GAAP measure to its most directly comparable GAAP measure for the respective periods can be found in the table below.
|
|
|
Year Ended March 31, |
|
|||||||||
|
|
|
2021 |
|
|
2020 |
|
|
2019 |
|
|||
|
|
|
(dollars in thousands) |
|
|||||||||
|
Reconciliation of Revenue Constant Currency Growth Rate: |
|
|
|
|
|
|
|
|
|
|
|
|
|
Revenue, as reported |
|
$ |
501,399 |
|
|
$ |
426,963 |
|
|
$ |
340,377 |
|
|
Revenue year-over-year growth rate, as reported |
|
|
17 |
% |
|
|
25 |
% |
|
|
30 |
% |
|
Estimated impact of foreign currency fluctuations |
|
|
— |
% |
|
|
3 |
% |
|
|
2 |
% |
|
Revenue constant currency growth rate |
|
|
17 |
% |
|
|
28 |
% |
|
|
32 |
% |
The impact of foreign exchange rates is highly variable and difficult to predict. We use revenue constant currency growth rate to show the impact from foreign exchange rates on the current period revenue growth rate compared to the prior period revenue growth rate using the prior period’s foreign exchange rates. In order to properly understand the underlying business trends and performance of our ongoing operations, we believe that investors may find it useful to consider the impact of excluding changes in foreign exchange rates from our revenue growth rate.
We believe that presenting this non-GAAP financial measure in this Annual Report on Form 10-K provides investors greater transparency to the information used by our management for financial and operational decision-making and allows investors to see our results “through the eyes” of management. We also believe that providing this information better enables our investors to understand our operating performance and evaluate the methodology used by management to evaluate and measure such performance.
However, this non-GAAP measure should not be considered in isolation or as a substitute for our financial results prepared in accordance with GAAP. For example, revenue constant currency growth rates, by their nature, exclude the impact of foreign exchange, which may have a material impact on GAAP revenue. Non-GAAP financial measures are not based on any comprehensive set of accounting rules or principles and therefore other companies may calculate similarly titled non-GAAP financial measures differently than we do, limiting the usefulness of those measures for comparative purposes.
46
Free cash flow
Free cash flow is a non-GAAP financial measure that we define as net cash provided by operating activities minus purchases of property, equipment and capitalized software. We believe free cash flow provides investors and other users of our financial information useful information about the amount of cash generated by the business that, after the acquisition of property, equipment and capitalized software, can be used for strategic opportunities, including investing in our business, and strengthening the balance sheet. Analysis of free cash flow facilitates management’s comparisons of our operating results to competitors’ operating results. A limitation of using free cash flow versus the GAAP measure of net cash provided by operating activities as a means for evaluating our company is that free cash flow does not represent the total increase or decrease in the cash balance from operations for the period because it excludes cash used for capital expenditures during the period. Management compensates for this limitation by providing information about our capital expenditures on the face of the cash flow statement and in the “Liquidity and Capital Resources” section below.
We do not place undue reliance on free cash flow as a measure of operating performance. This non-GAAP measure should not be considered as a substitute for other measures of financial performance reported in accordance with GAAP. There are limitations to using a non-GAAP financial measure, including that other companies may calculate this measure differently than we do, limiting the usefulness of those measures for comparative purposes.
The following table presents a reconciliation of net cash provided by operating activities to free cash flow:
|
|
|
Year Ended March 31, |
|
|||||||||
|
|
|
2021 |
|
|
2020 |
|
|
2019 |
|
|||
|
|
|
(in thousands) |
|
|||||||||
|
Reconciliation of Free Cash Flow: |
|
|
|
|
|
|
|
|
|
|
|
|
|
Net cash provided by operating activities |
|
$ |
127,034 |
|
|
$ |
90,538 |
|
|
$ |
66,235 |
|
|
Purchases of property, equipment and capitalized software |
|
|
(38,597 |
) |
|
|
(53,234 |
) |
|
|
(28,795 |
) |
|
Free cash flow |
|
$ |
88,437 |
|
|
$ |
37,304 |
|
|
$ |
37,440 |
|
Adjusted EBITDA
Adjusted EBITDA is a non-GAAP financial measure that we define as net income (loss), adjusted to exclude: depreciation, amortization, disposals and impairment of long-lived assets, acquisition-related gains and expenses, litigation-related expenses, share-based compensation expense, restructuring expense, interest income and interest expense, the benefit from (provision for) income taxes and foreign exchange income (expense). Prior to the adoption of ASC 842 on April 1, 2019, Adjusted EBITDA also included rent paid in the period related to locations which had been accounted for as build-to-suit facilities.
We believe that Adjusted EBITDA provides investors and other users of our financial information consistency and comparability with our past financial performance, facilitates period-to-period comparisons of operations and facilitates comparisons with our peer companies, many of which use a similar non-GAAP financial measure to supplement their GAAP results.
We use Adjusted EBITDA in conjunction with traditional GAAP operating performance measures as part of our overall assessment of our performance, for planning purposes, including the preparation of our annual operating budget, to evaluate the effectiveness of our business strategies, to communicate with our board of directors concerning our financial performance, and for establishing incentive compensation metrics for executives and other senior employees.
We do not place undue reliance on Adjusted EBITDA as a measure of operating performance. This non-GAAP measure should not be considered as a substitute for other measures of financial performance reported in accordance with GAAP. There are limitations to using a non-GAAP financial measure, including that other companies may calculate this measure differently than we do, that it does not reflect our capital expenditures or future requirements for capital expenditures and that it does not reflect changes in, or cash requirements for, our working capital.
47
The following table presents a reconciliation of net income (loss) to Adjusted EBITDA:
|
|
|
Year Ended March 31, |
|
|||||||||
|
|
|
2021 |
|
|
2020 |
|
|
2019 |
|
|||
|
|
|
(in thousands) |
|
|||||||||
|
Reconciliation of Adjusted EBITDA: |
|
|
|
|
|
|
|
|
|
|
|
|
|
Net income (loss) |
|
$ |
29,745 |
|
|
$ |
(2,200 |
) |
|
$ |
(7,001 |
) |
|
Depreciation, amortization and disposals of long-lived assets |
|
|
38,112 |
|
|
|
32,278 |
|
|
|
29,960 |
|
|
Rent expense related to build-to-suit facilities |
|
|
— |
|
|
|
— |
|
|
|
(4,482 |
) |
|
Interest expense (income), net |
|
|
2,044 |
|
|
|
1,061 |
|
|
|
3,425 |
|
|
Provision for income taxes |
|
|
1,696 |
|
|
|
2,359 |
|
|
|
2,001 |
|
|
Share-based compensation expense |
|
|
53,648 |
|
|
|
39,544 |
|
|
|
25,954 |
|
|
Restructuring |
|
|
3,264 |
|
|
|
— |
|
|
|
(170 |
) |
|
Foreign exchange (income) expense |
|
|
(1,989 |
) |
|
|
1,577 |
|
|
|
1,647 |
|
|
Acquisition-related expenses (1) |
|
|
667 |
|
|
|
769 |
|
|
|
2,012 |
|
|
Litigation-related expenses (2) |
|
|
— |
|
|
|
2,700 |
|
|
|
1,000 |
|
|
Gain on previously held asset (3) |
|
|
— |
|
|
|
— |
|
|
|
(338 |
) |
|
Adjusted EBITDA |
|
$ |
127,187 |
|
|
$ |
78,088 |
|
|
$ |
54,008 |
|
|
(1) |
Acquisition-related expenses relate primarily to legal and other professional fees incurred for acquisition activity in each respective year. See Note 6 of the notes to our consolidated financial statements, included elsewhere in this Annual Report on Form 10-K for further information. |
|
(2) |
Litigation-related expenses relate to amounts incurred for litigation settlement. See Note 14 of the notes to our consolidated financial statements, included elsewhere in this Annual Report on Form 10-K for further details. |
|
(3) |
Gain on previously held asset relates to our acquisition of Solebit LABS Ltd. See Note 6 of the notes to our consolidated financial statements, included elsewhere in this Annual Report on Form 10-K for further information. |
Components of Consolidated Statements of Operations
Revenue
We generate substantially all of our revenue from subscription fees paid by customers accessing our cloud services and by customers purchasing additional support beyond the standard support that is included in our basic subscription fees. A small portion of our revenue consists of related professional services and other revenue, which consists primarily of performance obligations related to set-up, ingestion, and training fees.
We generally license our services on a price per employee basis under annual contracts. In some instances, we receive upfront payments, which are determined to be material rights to a discount upon renewal. In these instances, we recognize revenue related to the upfront payment over the estimated customer benefit period, which has been determined to be six years.
Amounts that have been invoiced are recorded in accounts receivable and in deferred revenue or revenue, depending on whether the revenue recognition criteria have been met.
We recognize revenue ratably on a straight-line basis over the subscription term, which begins when we have given the customer access to our SaaS solutions. Our subscription contracts are typically one year in duration and do not contain refund-type provisions.
Our professional services contracts are recognized based on out-put measures of performance.
We serve approximately 39,900 customers in multiple industries, and our revenue is not concentrated with any single customer or industry. For each of the years ended March 31, 2021, 2020 and 2019, no single customer accounted for more than 1% of our revenue, and our largest ten customers accounted for less than 10% of our revenue in aggregate.
48
Cost of revenue
Cost of revenue primarily consists of expenses related to supporting and hosting our product offerings and delivering our professional services. These costs consist primarily of personnel and related costs including salaries, benefits, bonuses and share-based compensation expense related to the management of our data centers, our customer support team and our professional services team. In addition to these expenses, we incur third-party service provider costs such as data center and networking expenses, allocated overhead costs, depreciation expense and amortization expense related to capitalized software and acquired intangible assets. We allocate overhead costs, such as rent and facility costs, information technology costs and employee benefit costs to all departments based on headcount. As such, general overhead expenses are reflected in cost of revenue and each operating expense category.
We expect our cost of revenue to increase in absolute dollars due to expenditures related to the purchase of hardware, expansion and support of our data center operations and customer support teams. We also expect that cost of revenue as a percentage of revenue will remain relatively consistent for the year ending March 31, 2022 and will decrease over time as we are able to achieve economies of scale in our business, although it may fluctuate from period to period depending on the timing of significant expenditures. To the extent that our customer base grows, we intend to continue to invest additional resources in expanding the delivery capability of our products and other services. The timing of these additional expenses could affect our cost of revenue, both in terms of absolute dollars and as a percentage of revenue in any particular quarterly or annual period.
Research and development expenses
Research and development expenses consist primarily of personnel and related costs, including salaries, benefits, bonuses, share-based compensation expense, costs of server usage by our developers and allocated overhead costs. We expense all research and development costs as they are incurred. We have focused our efforts on developing new versions of our SaaS technology with expanded features. Our technology is constantly being refined and, as such, we do not capitalize development costs. We believe that continued investment in our technology is important for our future growth. As a result, we expect research and development expenses to increase in absolute dollars as we make further investments in developing our Mime | OS™ platform, improving our existing services and creating new features and products. Research and development expenses as a percentage of total revenue may fluctuate on a quarterly basis but we expect it to remain relatively consistent in the coming fiscal year as a result of the expected investments noted above. The full scope of the costs and related impacts of our recent security incident, including the availability of insurance to offset some of these costs, cannot be estimated at this time.
Sales and marketing expenses
Sales and marketing expenses consist primarily of personnel and related costs, including salaries, benefits, bonuses, commissions and share-based compensation expense. In addition to these expenses, we incur costs related to marketing and promotional events, online marketing, product marketing and allocated overhead costs. We expense all costs as they are incurred, excluding sales commissions identified as incremental costs to obtain a contract, which are capitalized and amortized over the life of our customers, which we estimate to be six years. Sales and marketing expenses increased in fiscal 2021 as we continued to expand our sales and marketing efforts globally, particularly in the United States. We expect that our sales and marketing expenses will continue to increase in absolute dollars in the year ending March 31, 2022, but remain relatively consistent as a percentage of revenue as compared to fiscal 2021. New sales personnel require training and may take several months or more to achieve productivity; as such, the costs we incur in connection with the hiring of new sales personnel in a given period are not typically offset by increased revenue in that period and may not result in new revenue if these sales personnel fail to become productive. We expect to increase our investment in sales and marketing as we add new services, and as we continue to focus on sales to large, enterprise prospects, which will increase these expenses in absolute dollars. Over the longer term, we believe that sales and marketing expenses as a percentage of revenue will vary depending upon the mix of revenue from new and existing customers, as well as changes in the productivity of our sales and marketing programs. The full scope of the costs and related impacts of our recent security incident, including the availability of insurance to offset some of these costs, cannot be estimated at this time.
General and administrative expenses
General and administrative expenses consist primarily of personnel and related expenses for executive, legal, finance, information technology and human resources functions, including salaries, benefits, incentive compensation and share-based compensation expense, in addition to the costs associated with professional fees, litigation-related expenses, insurance premiums, other corporate expenses and allocated overhead costs. We expect general and administrative expenses to increase in absolute dollars as we continue to incur additional personnel and professional services costs in order to support business growth, costs associated with acquisitions, legal fees and litigation-related expenses, funding transactions, and others. Over the longer term, we believe that general and administrative expenses as a percentage of revenue will decrease. The full scope of the costs and related impacts of our recent security incident, including the availability of insurance to offset some of these costs, cannot be estimated at this time.
49
Restructuring
On January 28, 2021, our Board of Directors approved a restructuring plan designed to align our resources with our strategy. The restructuring plan, which included a reduction of our workforce by approximately 4%, permitted us to increase investment in strategic growth areas. During the year ended March 31, 2021, we recognized total pre-tax restructuring charges of $3.3 million, consisting of $3.7 million of severance and other one-time termination benefits, and other restructuring related costs, partially offset by $0.4 million of other adjustments. These charges were primarily cash-based and were recognized in the fourth quarter of fiscal 2021 in “Restructuring” in the consolidated statements of operations. The actions associated with the restructuring plan are expected to be completed by the end of the first quarter of fiscal 2022 and we do not expect any material costs to be incurred in fiscal 2022.
Other income (expense)
Other income (expense) is comprised of the following items:
Interest income
Interest income includes interest income earned on our cash, cash equivalents and investments balances. We expect interest income to vary each reporting period depending on our average cash, cash equivalents and investments balances during the period and market interest rates.
Interest expense
Interest expense consists primarily of interest expense associated with our long-term debt and our finance leases. In fiscal 2019, interest expense also included amounts related to our finance lease obligation in connection with the construction of our Lexington, MA – U.S. headquarters. In April 2019, we derecognized the U.S. build-to-suit facility upon adoption of ASC 842. We expect interest expense in fiscal 2022 associated with our long-term debt to decrease compared to fiscal 2021 primarily due to lower principal balances associated with our long-term debt and the current interest rate environment.
Foreign exchange income (expense) and other, net
Foreign exchange income (expense) and other, net consists primarily of foreign exchange fluctuations related to short-term intercompany accounts, foreign currency exchange gains and losses related to transactions denominated in currencies other than the functional currency for each of our subsidiaries and other non-operating items including sublease income and other income. We expect our foreign currency exchange gains and losses to continue to fluctuate in the future as foreign currency exchange rates change.
Provision for income taxes
We operate in several tax jurisdictions and are subject to tax in each country or jurisdiction in which we conduct business. We account for income taxes in accordance with the asset and liability method. Under this method, deferred tax assets and liabilities are recognized based on temporary differences between the financial reporting and income tax bases for assets and liabilities using statutory rates. In addition, this method requires a valuation allowance against net deferred tax assets if, based upon the available evidence, it is more likely than not that some or all of the deferred tax assets will not be realized.
Our provision for income taxes for the fiscal year ended March 31, 2021 was primarily attributable to the tax provision recorded on the earnings of our profitable entities, partially offset by the tax benefit for the release of a portion of our pre-existing U.S. valuation allowance as a result of the MessageControl acquisition.
Our provision for income taxes for the fiscal year ended March 31, 2020 was primarily attributable to the tax provision recorded on the earnings of our South African entity. This was partially offset by the tax benefit attributable to the operating loss of our Israeli entities.
Our provision for income taxes for the fiscal year ended March 31, 2019 primarily relates to the tax provision recorded on the earnings of our South African entity. This was partially offset by the tax benefit attributable to the operating loss on our Israeli entity, and the tax benefit for the release of a portion of our pre-existing U.S. and U.K. valuation allowances as a result of the acquisitions of Ataata Inc. and Simply Migrate Ltd.
50
Operating Results
The following table sets forth selected consolidated statements of operations data for each of the periods indicated:
|
|
|
Year Ended March 31, |
|
|||||||||
|
|
|
2021 |
|
|
2020 |
|
|
2019 |
|
|||
|
|
|
(in thousands) |
|
|||||||||
|
Revenue |
|
$ |
501,399 |
|
|
$ |
426,963 |
|
|
$ |
340,377 |
|
|
Cost of revenue |
|
|
121,709 |
|
|
|
109,382 |
|
|
|
90,874 |
|
|
Gross profit |
|
|
379,690 |
|
|
|
317,581 |
|
|
|
249,503 |
|
|
Operating expenses |
|
|
|
|
|
|
|
|
|
|
|
|
|
Research and development |
|
|
97,498 |
|
|
|
80,790 |
|
|
|
57,939 |
|
|
Sales and marketing |
|
|
179,315 |
|
|
|
169,179 |
|
|
|
139,194 |
|
|
General and administrative |
|
|
68,354 |
|
|
|
65,314 |
|
|
|
53,759 |
|
|
Restructuring |
|
|
3,264 |
|
|
|
— |
|
|
|
(170 |
) |
|
Total operating expenses |
|
|
348,431 |
|
|
|
315,283 |
|
|
|
250,722 |
|
|
Income (loss) from operations |
|
|
31,259 |
|
|
|
2,298 |
|
|
|
(1,219 |
) |
|
Other income (expense) |
|
|
|
|
|
|
|
|
|
|
|
|
|
Interest income |
|
|
760 |
|
|
|
3,446 |
|
|
|
2,515 |
|
|
Interest expense |
|
|
(2,804 |
) |
|
|
(4,507 |
) |
|
|
(5,940 |
) |
|
Foreign exchange income (expense) and other, net |
|
|
2,226 |
|
|
|
(1,078 |
) |
|
|
(356 |
) |
|
Total other income (expense), net |
|
|
182 |
|
|
|
(2,139 |
) |
|
|
(3,781 |
) |
|
Income (loss) before income taxes |
|
|
31,441 |
|
|
|
159 |
|
|
|
(5,000 |
) |
|
Provision for income taxes |
|
|
1,696 |
|
|
|
2,359 |
|
|
|
2,001 |
|
|
Net income (loss) |
|
$ |
29,745 |
|
|
$ |
(2,200 |
) |
|
$ |
(7,001 |
) |
The following table sets forth our consolidated statements of operations data as a percentage of revenue for each of the periods indicated:
|
|
|
Year Ended March 31, |
|
|||||||||
|
|
|
2021 |
|
|
2020 |
|
|
2019 |
|
|||
|
Revenue |
|
|
100 |
% |
|
|
100 |
% |
|
|
100 |
% |
|
Cost of revenue |
|
|
24 |
% |
|
|
26 |
% |
|
|
27 |
% |
|
Gross profit |
|
|
76 |
% |
|
|
74 |
% |
|
|
73 |
% |
|
Operating expenses |
|
|
|
|
|
|
|
|
|
|
|
|
|
Research and development |
|
|
19 |
% |
|
|
19 |
% |
|
|
17 |
% |
|
Sales and marketing |
|
|
36 |
% |
|
|
40 |
% |
|
|
41 |
% |
|
General and administrative |
|
|
14 |
% |
|
|
15 |
% |
|
|
16 |
% |
|
Restructuring |
|
|
1 |
% |
|
|
— |
% |
|
|
— |
% |
|
Total operating expenses |
|
|
69 |
% |
|
|
74 |
% |
|
|
74 |
% |
|
Income (loss) from operations |
|
|
6 |
% |
|
|
1 |
% |
|
|
— |
% |
|
Other income (expense) |
|
|
|
|
|
|
|
|
|
|
|
|
|
Interest income |
|
|
— |
% |
|
|
1 |
% |
|
|
1 |
% |
|
Interest expense |
|
|
(1 |
)% |
|
|
(1 |
)% |
|
|
(2 |
)% |
|
Foreign exchange income (expense) and other, net |
|
|
— |
% |
|
|
— |
% |
|
|
— |
% |
|
Total other income (expense), net |
|
|
— |
% |
|
|
(1 |
)% |
|
|
(1 |
)% |
|
Income (loss) before income taxes |
|
|
6 |
% |
|
|
(— |
)% |
|
|
(1 |
)% |
|
Provision for income taxes |
|
|
— |
% |
|
|
1 |
% |
|
|
1 |
% |
|
Net income (loss) |
|
|
6 |
% |
|
|
(1 |
)% |
|
|
(2 |
)% |
51
We have operations in jurisdictions other than the United States and generate revenue and incur expenditures in currencies other than the U.S. dollar. The following information shows the effect on certain components of our consolidated statements of operations data for each of the periods indicated below based on a 10% increase or decrease in foreign currency exchange rates assuming that all foreign currency exchange rates move in the same direction at the same time:
|
|
|
Year ended March 31, |
|
|||||||||
|
|
|
2021 |
|
|
2020 |
|
|
2019 |
|
|||
|
|
|
(in millions) |
|
|||||||||
|
Revenue |
|
$ |
23.1 |
|
|
$ |
19.7 |
|
|
$ |
16.5 |
|
|
Cost of Revenue |
|
|
7.2 |
|
|
|
6.2 |
|
|
|
5.0 |
|
|
Research and development |
|
|
6.6 |
|
|
|
5.6 |
|
|
|
4.0 |
|
|
Sales and marketing |
|
|
7.5 |
|
|
|
7.2 |
|
|
|
5.4 |
|
|
General and administrative |
|
|
2.0 |
|
|
|
1.9 |
|
|
|
1.5 |
|
Comparison of Years Ended March 31, 2021 and 2020
Revenue
|
|
|
Year ended March 31, |
|
|
Period-to-period change |
|
||||||||||
|
|
|
2021 |
|
|
2020 |
|
|
Amount |
|
|
% Change |
|
||||
|
|
|
(dollars in thousands) |
|
|||||||||||||
|
Revenue |
|
$ |
501,399 |
|
|
$ |
426,963 |
|
|
$ |
74,436 |
|
|
|
17 |
% |
Revenue increased $74.4 million in the year ended March 31, 2021 compared to the year ended March 31, 2020. The increase in revenue was primarily attributable to increases in new customers, including the 1,900 new customers added since March 31, 2020, a full year of revenue related to new customers added during fiscal 2020 and additional revenue from customers that existed as of March 31, 2020. Revenue for the year ended March 31, 2021 compared to the year ended March 31, 2020 was positively impacted by approximately $0.7 million primarily as a result of the weakening of the U.S. dollar relative to the British pound and to a lesser extent the Australian dollar, partially offset by the strengthening of the U.S. dollar relative to the South African rand.
Cost of revenue
|
|
|
Year ended March 31, |
|
|
Period-to-period change |
|
||||||||||
|
|
|
2021 |
|
|
2020 |
|
|
Amount |
|
|
% Change |
|
||||
|
|
|
(dollars in thousands) |
|
|||||||||||||
|
Cost of revenue |
|
$ |
121,709 |
|
|
$ |
109,382 |
|
|
$ |
12,327 |
|
|
|
11 |
% |
Cost of revenue increased $12.3 million in the year ended March 31, 2021 compared to the year ended March 31, 2020, which was primarily attributable to increases in data center costs of $4.9 million, personnel-related costs of $3.4 million, depreciation expense of $2.7 million, amortization of acquisition-related intangible assets of $1.3 million, and share-based compensation expense of $1.1 million, partially offset by decreases in travel and other costs of $1.1 million. Cost of revenue for the year ended March 31, 2021 compared to the year ended March 31, 2020 was negatively impacted by approximately $0.9 million primarily as a result of the weakening of the U.S. dollar relative to the British pound, partially offset by the strengthening of the U.S. dollar relative to the South African rand. Data center costs increased as a result of the increase in our customer base and expanding infrastructure, personnel-related cost increased primarily as a result of salaries and benefits associated with increased headcount, depreciation expense increased primarily as a result of increased capital expenditures in support of our expanding infrastructure, the amortization of acquisition-related intangible assets increased primarily as a result of our recent acquisitions, and share-based compensation expense increased primarily as a result of equity grants since the prior year. Travel and other costs decreased primarily as a result of the impact of the global COVID-19 pandemic and the travel and gathering restrictions in place during the year ended March 31, 2021.
As a result of changes in foreign currency exchange rates, gross profit decreased in absolute dollars by approximately $0.2 million for the year ended March 31, 2021 as compared to the year ended March 31, 2020. Excluding the impact of changes in foreign currency exchange rates, gross profit as a percentage of revenue remained consistent as costs related to supporting and hosting our product offerings and delivering our services are primarily incurred in the region in which the related revenue is recognized.
52
Operating expenses
|
|
|
Year ended March 31, |
|
|
Period-to-period change |
|
||||||||||
|
|
|
2021 |
|
|
2020 |
|
|
Amount |
|
|
% Change |
|
||||
|
|
|
(dollars in thousands) |
|
|||||||||||||
|
Operating expenses: |
|
|
|
|
|
|
|
|
|
|
|
|
|
|
|
|
|
Research and development |
|
$ |
97,498 |
|
|
$ |
80,790 |
|
|
$ |
16,708 |
|
|
|
21 |
% |
|
Sales and marketing |
|
|
179,315 |
|
|
|
169,179 |
|
|
|
10,136 |
|
|
|
6 |
% |
|
General and administrative |
|
|
68,354 |
|
|
|
65,314 |
|
|
|
3,040 |
|
|
|
5 |
% |
|
Restructuring |
|
|
3,264 |
|
|
|
— |
|
|
|
3,264 |
|
|
nm |
|
|
|
Total operating expenses |
|
$ |
348,431 |
|
|
$ |
315,283 |
|
|
$ |
33,148 |
|
|
|
11 |
% |
nm—not meaningful
Research and development expenses
Research and development expenses increased $16.7 million in the year ended March 31, 2021 compared to the year ended March 31, 2020, which was primarily attributable to increases in personnel-related costs of $9.4 million, professional services costs of $4.4 million, and share-based compensation expense of $4.3 million, partially offset by decreases in travel and other costs of $1.9 million. Research and development expenses for the year ended March 31, 2021 as compared to the year ended March 31, 2020, were negatively impacted by approximately $2.0 million primarily as a result of the weakening of the U.S. dollar relative to the British pound. Personnel-related costs increased primarily as a result of salaries and benefits associated with increased headcount. Professional services costs increased primarily due to increased consulting fees. Share-based compensation expense increased primarily as a result of equity grants issued to employees since the prior year. Travel and other costs decreased primarily as a result of the impact of the global COVID-19 pandemic and the travel and gathering restrictions in place during the year ended March 31, 2021.
Sales and marketing expenses
Sales and marketing expenses increased $10.1 million in the year ended March 31, 2021 compared to the year ended March 31, 2020, which was primarily attributable to increases in personnel-related costs of $13.7 million, share-based compensation expense of $4.1 million, and marketing costs of $2.6 million, partially offset by decreases in travel and other costs of $9.0 million and decreases in professional services of $1.9 million. Sales and marketing expenses for the year ended March 31, 2021 as compared to the year ended March 31, 2020, were negatively impacted by approximately $1.5 million primarily as a result of the weakening of the U.S. dollar relative to the British pound. Personnel-related costs increased primarily as a result of salaries and benefits associated with increased headcount and commissions. Share-based compensation expense increased primarily as a result of equity grants issued to employees since the prior year. Marketing costs increased primarily as a result of increased advertising spend. Travel and other costs decreased primarily as a result of the impact of the global COVID-19 pandemic and the travel and gathering restrictions in place during the year ended March 31, 2021. Professional services decreased primarily as a result of decreased consulting fees related to software implementations.
General and administrative expenses
General and administrative expenses increased $3.0 million in the year ended March 31, 2021 compared to the year ended March 31, 2020, which was primarily attributable to increases in share-based compensation expense of $4.1 million, personnel-related costs of $1.6 million, and insurance costs primarily related to our director and officer liability insurance of $1.2 million, partially offset by decreases in professional services costs of $2.4 million and travel and other costs of $1.4 million. Share-based compensation expense increased primarily as a result of equity grants issued to employees since the prior year. Personnel-related costs increased primarily as a result of salaries and benefits associated with increased headcount. Professional services costs decreased primarily as a result of a litigation-related settlement with a non-practicing entity that occurred in the fiscal year ended March 31, 2020. Travel and other costs decreased primarily as a result of the impact of the global COVID-19 pandemic and the travel and gathering restrictions in place during the year ended March 31, 2021.
Restructuring
On January 28, 2021, our Board of Directors approved a restructuring plan designed to align our resources with our strategy. The restructuring plan, which included a reduction of our workforce by approximately 4%, permitted us to increase investment in strategic growth areas. During the year ended March 31, 2021, we recognized total pre-tax restructuring charges of $3.3 million, consisting of $3.7 million of severance and other one-time termination benefits, and other restructuring related costs, partially offset by $0.4 million of other adjustments. These charges were primarily cash-based and were recognized in the fourth quarter of fiscal
53
2021. The actions associated with the restructuring plan are expected to be completed by the end of the first quarter of fiscal 2022 and we do not expect any material costs to be incurred in fiscal 2022.
Other income (expense)
|
|
|
Year ended March 31, |
|
|
Period-to-period change |
|
||||||||||
|
|
|
2021 |
|
|
2020 |
|
|
Amount |
|
|
% Change |
|
||||
|
|
|
(dollars in thousands) |
|
|||||||||||||
|
Other income (expense): |
|
|
|
|
|
|
|
|
|
|
|
|
|
|
|
|
|
Interest income |
|
$ |
760 |
|
|
$ |
3,446 |
|
|
$ |
(2,686 |
) |
|
|
(78 |
)% |
|
Interest expense |
|
|
(2,804 |
) |
|
|
(4,507 |
) |
|
|
1,703 |
|
|
|
(38 |
)% |
|
Foreign exchange income (expense) and other, net |
|
|
2,226 |
|
|
|
(1,078 |
) |
|
|
3,304 |
|
|
nm |
|
|
|
Total other income (expense), net |
|
$ |
182 |
|
|
$ |
(2,139 |
) |
|
$ |
2,321 |
|
|
nm |
|
|
nm—not meaningful
Interest income decreased $2.7 million primarily as a result of lower yields on cash, cash equivalents and investments.
Interest expense decreased $1.7 million primarily as a result of the reduced LIBOR interest rates associated with our long-term debt.
Foreign exchange income (expense) and other, net changed by $3.3 million primarily as a result of an increase in foreign exchange income of $3.6 million on intercompany balances.
Provision for income taxes
|
|
|
Year ended March 31, |
|
|
Period-to-period change |
|
||||||||||
|
|
|
2021 |
|
|
2020 |
|
|
Amount |
|
|
% Change |
|
||||
|
|
|
(dollars in thousands) |
|
|||||||||||||
|
Provision for income taxes |
|
$ |
1,696 |
|
|
$ |
2,359 |
|
|
$ |
(663 |
) |
|
|
(28 |
)% |
Provision for income taxes decreased $0.7 million in the year ended March 31, 2021 compared to the year ended March 31, 2020. The change in provision for income taxes is primarily attributable to changes in the geographical mix of earnings, partially offset by the tax benefit for the release of a portion of our pre-existing U.S. valuation allowance as a result of the MessageControl acquisition.
Comparison of Years Ended March 31, 2020 and 2019
Revenue
|
|
|
Year ended March 31, |
|
|
Period-to-period change |
|
||||||||||
|
|
|
2020 |
|
|
2019 |
|
|
Amount |
|
|
% Change |
|
||||
|
|
|
(dollars in thousands) |
|
|||||||||||||
|
Revenue |
|
$ |
426,963 |
|
|
$ |
340,377 |
|
|
$ |
86,586 |
|
|
|
25 |
% |
Revenue increased $86.6 million in the year ended March 31, 2020 compared to the year ended March 31, 2019. The increase in revenue was primarily attributable to increases in new customers, including the 3,700 new customers added since March 31, 2019, a full year of revenue related to new customers added during fiscal 2019 and additional revenue from customers that existed as of March 31, 2019. Revenue for the year ended March 31, 2020 compared to the year ended March 31, 2019 was negatively impacted by approximately $9.5 million primarily as a result of the strengthening of the U.S. dollar relative to the South African rand and British pound and to a lesser extent the Australian dollar.
54
Cost of revenue
|
|
|
Year ended March 31, |
|
|
Period-to-period change |
|
||||||||||
|
|
|
2020 |
|
|
2019 |
|
|
Amount |
|
|
% Change |
|
||||
|
|
|
(dollars in thousands) |
|
|||||||||||||
|
Cost of revenue |
|
$ |
109,382 |
|
|
$ |
90,874 |
|
|
$ |
18,508 |
|
|
|
20 |
% |
Cost of revenue increased $18.5 million in the year ended March 31, 2020 compared to the year ended March 31, 2019, which was primarily attributable to increases in personnel-related costs of $5.6 million, data center costs of $4.2 million, information technology and facilities costs of $3.3 million, share-based compensation expense of $1.8 million and depreciation expense and amortization of acquisition-related intangible assets of $1.4 million each. Cost of revenue for the year ended March 31, 2020 compared to the year ended March 31, 2019 was positively impacted by approximately $2.6 million primarily as a result of the strengthening of the U.S. dollar relative to the British pound, South African rand, and Australian dollar. Personnel-related cost increased primarily as a result of salaries and benefits associated with increased headcount, data center costs increased as a result of the increase in our customer base, information technology and facility costs increased primarily as a result of increased headcount, share-based compensation expense increased primarily as a result of equity grants since the prior year, depreciation expense increased primarily as a result of increased capital expenditures in support of our expanding infrastructure, and the amortization of acquisition-related intangible assets increased primarily as a result of our fiscal 2019 and 2020 acquisitions.
As a result of changes in foreign currency exchange rates, gross profit decreased in absolute dollars by approximately $6.9 million for the year ended March 31, 2020 as compared to the year ended March 31, 2019. Excluding the impact of changes in foreign currency exchange rates, gross profit as a percentage of revenue remained consistent as costs related to supporting and hosting our product offerings and delivering our services are primarily incurred in the region in which the related revenue is recognized.
Operating expenses
|
|
|
Year ended March 31, |
|
|
Period-to-period change |
|
||||||||||
|
|
|
2020 |
|
|
2019 |
|
|
Amount |
|
|
% Change |
|
||||
|
|
|
(dollars in thousands) |
|
|||||||||||||
|
Operating expenses: |
|
|
|
|
|
|
|
|
|
|
|
|
|
|
|
|
|
Research and development |
|
$ |
80,790 |
|
|
$ |
57,939 |
|
|
$ |
22,851 |
|
|
|
39 |
% |
|
Sales and marketing |
|
|
169,179 |
|
|
|
139,194 |
|
|
|
29,985 |
|
|
|
22 |
% |
|
General and administrative |
|
|
65,314 |
|
|
|
53,759 |
|
|
|
11,555 |
|
|
|
21 |
% |
|
Restructuring |
|
|
— |
|
|
|
(170 |
) |
|
|
170 |
|
|
nm |
|
|
|
Total operating expenses |
|
$ |
315,283 |
|
|
$ |
250,722 |
|
|
$ |
64,561 |
|
|
|
26 |
% |
nm—not meaningful
Research and development expenses
Research and development expenses increased $22.9 million in the year ended March 31, 2020 compared to the year ended March 31, 2019, which was primarily attributable to increases in personnel-related costs of $11.6 million, information technology and facility costs of $4.6 million, and share-based compensation expense of $4.7 million. Research and development expenses for the year ended March 31, 2020 as compared to the year ended March 31, 2019, were positively impacted by approximately $1.5 million primarily as a result of the strengthening of the U.S. dollar relative to the British pound. Personnel-related cost increased primarily as a result of salaries and benefits associated with increased headcount throughout the year, information technology and facility costs increased primarily as a result of increased headcount, and share-based compensation expense increased primarily as a result of equity grants since the prior year.
Sales and marketing expenses
Sales and marketing expenses increased $30.0 million in the year ended March 31, 2020 compared to the year ended March 31, 2019, which was primarily attributable to increases in personnel-related costs of $16.3 million, share-based compensation expense of $5.3 million, information technology and facilities costs of $5.6 million, and marketing costs of $2.0 million. Sales and marketing expenses for the year ended March 31, 2020 as compared to the year ended March 31, 2019, were positively impacted by approximately $3.1 million primarily as a result of the strengthening of the U.S. dollar relative to the British pound, Australian dollar, and South African rand. Personnel-related costs increased primarily as a result of salaries and benefits associated with increased headcount and commissions. Share-based compensation expense increased primarily as a result of equity grants since the prior year. Information technology and facilities costs and travel and other costs increased primarily as a result of increased headcount. Marketing costs increased primarily as a result of our inaugural Mimecast Cyber Resilience Summit held in October 2019.
55
General and administrative expenses
General and administrative expenses increased $11.6 million in the year ended March 31, 2020 compared to the year ended March 31, 2019, which was primarily attributable to increases in personnel-related costs of $4.2 million, information technology and facilities costs of $2.5 million, share-based compensation expense of $1.8 million and professional services costs of $2.2 million. Personnel-related costs increased primarily as a result of salaries and benefits associated with increased headcount. Information technology and facility costs increased primarily as a result of increased headcount. Share-based compensation expense increased primarily as a result of equity grants since the prior year, partially offset by the impact of share option forfeitures. Professional services costs increased primarily as a result of a litigation-related settlement with a non-practicing patent entity.
Restructuring
In the second quarter of fiscal 2019, we recorded a revision to restructuring expense of $0.2 million related to the exit of our Watertown, Massachusetts corporate office space, which was initially recorded in the fourth quarter of fiscal 2018, upon the exit of our Watertown, Massachusetts corporate office space for the remaining non-cancelable rent and estimated operating expenses for the vacated premises, net of sublease rentals.
Other income (expense)
|
|
|
Year ended March 31, |
|
|
Period-to-period change |
|
||||||||||
|
|
|
2020 |
|
|
2019 |
|
|
Amount |
|
|
% Change |
|
||||
|
|
|
(dollars in thousands) |
|
|||||||||||||
|
Other income (expense): |
|
|
|
|
|
|
|
|
|
|
|
|
|
|
|
|
|
Interest income |
|
$ |
3,446 |
|
|
$ |
2,515 |
|
|
$ |
931 |
|
|
|
37 |
% |
|
Interest expense |
|
|
(4,507 |
) |
|
|
(5,940 |
) |
|
|
1,433 |
|
|
|
(24 |
)% |
|
Foreign exchange (expense) income and other, net |
|
|
(1,078 |
) |
|
|
(356 |
) |
|
|
(722 |
) |
|
nm |
|
|
|
Total other income (expense), net |
|
$ |
(2,139 |
) |
|
$ |
(3,781 |
) |
|
$ |
1,642 |
|
|
nm |
|
|
nm—not meaningful
Interest expense decreased $1.4 million primarily as a result of the derecognition of the U.S. build-to-suit facility in April 2019 upon adoption of ASU 2016-02, partially offset by increased interest expense associated with our long-term debt.
Provision for income taxes
|
|
|
Year ended March 31, |
|
|
Period-to-period change |
|
||||||||||
|
|
|
2020 |
|
|
2019 |
|
|
Amount |
|
|
% Change |
|
||||
|
|
|
(dollars in thousands) |
|
|||||||||||||
|
Provision for income taxes |
|
$ |
2,359 |
|
|
$ |
2,001 |
|
|
$ |
358 |
|
|
|
18 |
% |
Provision for income taxes increased $0.4 million in the year ended March 31, 2020 compared to the year ended March 31, 2019. Provision for income taxes in the year ending March 31, 2019 included a benefit for the release of a portion of pre-existing U.S. and U.K. valuation allowances as a result of the Ataata and Simply Migrate business combinations, which did not recur for the year ending March 31, 2020. This is offset partially by a decrease in tax expense resulting from changes in the geographical mix of earnings.
56
Liquidity and Capital Resources
Our principal sources of liquidity are cash and cash equivalents, investments, accounts receivable and our Revolving Facility (as defined below). The following table shows net cash provided by operating activities, net cash used in investing activities, and net cash provided by financing activities for the years ended March 31, 2021, 2020 and 2019:
|
|
|
Year ended March 31, |
|
|||||||||
|
|
|
2021 |
|
|
2020 |
|
|
2019 |
|
|||
|
|
|
(in thousands) |
|
|||||||||
|
Net cash provided by operating activities |
|
$ |
127,034 |
|
|
$ |
90,538 |
|
|
$ |
66,235 |
|
|
Net cash used in investing activities |
|
|
(55,567 |
) |
|
|
(65,539 |
) |
|
|
(121,324 |
) |
|
Net cash provided by financing activities |
|
|
38,281 |
|
|
|
17,733 |
|
|
|
116,985 |
|
As of March 31, 2021 and 2020, we had cash and cash equivalents of $292.9 million and $174.0 million, respectively. Net cash provided by operating activities was $127.0 million for the year ended March 31, 2021. In the year ending March 31, 2022, we expect net cash provided by operating activities to increase as compared to the year ended March 31, 2021. In the year ending March 31, 2022, we plan to continue to invest in the development and expansion of our Mime | OS™ platform to improve on our existing solutions and develop new services in order to provide more capabilities to our customers. Investments in capital expenditures in the year ended March 31, 2021 were $38.6 million, of which $36.6 million related to the expansion of our grid architecture. We expect fiscal year 2022 capital expenditures to remain relatively consistent with fiscal year 2021.
Based on our current operating plan, we believe that our current cash and cash equivalents, Revolving Facility (as defined below) and operating cash flows will be sufficient to fund our operations for at least the next twelve months from the date of filing of this Annual Report on Form 10-K. Our future capital requirements may vary materially from those planned and will depend on certain factors, such as, our growth and our operating results. If we require additional capital resources to grow our business or to acquire complementary technologies and businesses in the future, we may seek to sell additional equity or raise funds through debt financing or other sources. We cannot provide assurance that additional financing will be available at all or on terms favorable to us. We had commitments for capital expenditures of approximately $7.6 million as of March 31, 2021, primarily related to the expansion of our grid architecture.
Borrowings and Credit Facility
In July 2018, we entered into a Credit Agreement, or the Credit Agreement, by and among us, certain of our subsidiaries party thereto, as guarantors, certain financial institutions party thereto from time to time, as lenders, and JPMorgan Chase Bank, N.A., as administrative agent, or the Administrative Agent. The Credit Agreement provided the Company with a $100.0 million senior secured term loan, or the Term Loan, and a $50.0 million senior secured revolving credit facility, or the Revolving Facility, and together with the Term Loan, the Credit Facility, which is available to fund working capital and for other corporate purposes, including to finance permitted acquisitions and investments. In June 2020, the Credit Agreement was amended to permit us to issue letters of credit in certain additional foreign currencies beyond the U.S. dollar and the British pound (as amended, the Credit Agreement, the Term Loan and the Revolving Facility are referred to herein as the Credit Facility). Total availability under the Revolving Facility is reduced by outstanding letters of credit of $2.2 million. As of March 31, 2021 and 2020, total availability under the Revolving Facility was $30.3 million and $48.0 million, respectively. In July 2020, we drew down $17.5 million under the Revolving Facility. See Note 10 to the condensed consolidated financial statements of this Annual Report on Form 10-K for further information. Interest under the Credit Facility accrues at a rate between LIBOR plus 1.375% and LIBOR plus 1.875%, based on our ratio of indebtedness to earnings before interest, taxes, depreciation, amortization and certain other adjustments, or Consolidated EBITDA. Based on this ratio, the current interest rate as of March 31, 2021 under the Credit Facility is LIBOR plus 1.375%. The InterContinental Exchange Benchmark Administration has announced that it will no longer publish certain tenors of the LIBOR rate starting in 2021. See Item 7A, “Quantitative and Qualitative Disclosures About Market Risk” below for further information. The term of the Credit Facility is five years, maturing on July 23, 2023. At the time we entered into the Credit Agreement, we had no existing debt.
The Credit Facility has financial covenants that require us to maintain a Consolidated Secured Leverage Ratio (as described below), which commenced on September 30, 2018, of not more than 3.00 to 1.00 for the four consecutive fiscal quarter period ending on the last day of each fiscal quarter, or the Reference Period, with a step-up to 3.50 to 1.00 for any four-quarter period in which we consummate a permitted acquisition having an aggregate purchase price in excess of $25.0 million. We must also maintain a Consolidated Interest Expense Ratio of 3.00 to 1.00 which commenced on September 30, 2018 and for each Reference Period thereafter. For purposes of the covenants, “Consolidated Secured Leverage Ratio” generally refers to the ratio of Consolidated Funded Debt that is secured by a lien on assets of us or our subsidiaries to Consolidated EBITDA. “Consolidated Funded Debt” generally refers to borrowed money, debt instruments, finance leases, deferred purchase price of property or services (excluding accounts payable in the ordinary course of business) and earn outs that are due and payable. “Consolidated Interest Expense Ratio” generally
57
refers to the ratio of Consolidated EBITDA to cash interest expense with respect to indebtedness, with certain exclusions. The Company was in compliance with all covenants as of March 31, 2021 and management reasonably believes it will be in compliance with such covenants over the next 12 months.
All obligations under the Credit Agreement are unconditionally guaranteed by all of our material direct and indirect subsidiaries organized under the laws of the United States, the United Kingdom, the Bailiwick of Jersey, and other jurisdictions agreed to by us and the Administrative Agent, with certain exceptions. These guarantees are secured by substantially all of the present and future property and assets of the guarantors, with certain exclusions.
The foregoing summary (and any reference to the Credit Facility contained in this Annual Report on Form 10-K) does not purport to be complete and is qualified in its entirety by reference to the Credit Agreement and the related agreements, which are filed as Exhibits 10.12, 10.13, 10.14, 10.15, 10.16, 10.17, 10.18, 10.19, 10.20 and 10.37 to this Annual Report on Form 10-K and incorporated herein by reference.
Operating activities
For the year ended March 31, 2021, cash provided by operating activities was $127.0 million. The primary factors affecting our operating cash flows during the period were our net income of $29.7 million, adjusted for non-cash items of $53.6 million of share-based compensation expense, $38.1 million for depreciation and amortization of our property, equipment and intangible assets, $30.4 million of amortization of operating lease right-of-use assets, and $13.3 million in amortization of deferred contract costs, partially offset by unrealized currency gains on foreign denominated transactions of $2.4 million. The drivers of the changes in operating assets and liabilities were a $33.3 million decrease in operating lease liabilities, $28.7 million increase in deferred contract costs, $10.5 million increase in accounts receivable, $3.7 million decrease in accounts payable, and a $2.6 million increase in prepaid expenses and other current assets, partially offset by a $30.7 million increase in deferred revenue, and a $12.1 million increase in accrued expenses and other current liabilities.
For the year ended March 31, 2020, cash provided by operating activities was $90.5 million. The primary factors affecting our operating cash flows during the period were our net loss of $2.2 million, adjusted for non-cash items of $39.5 million of share-based compensation expense, $32.2 million for depreciation and amortization of our property, equipment and intangible assets, $31.9 million of amortization of operating lease right-of-use assets, and $9.6 million in amortization of deferred contract costs, partially offset by a deferred income tax benefit of $0.6 million. The drivers of the changes in operating assets and liabilities were a $25.9 million decrease in operating lease liabilities, $22.8 million increase in deferred contract costs, $20.5 million increase in accounts receivable, a $3.2 million decrease in accrued expenses and other current liabilities, and a $1.1 million increase in other assets, partially offset by a $38.5 million increase in deferred revenue, $8.8 million decrease in prepaid expenses and other current assets primarily due to the receipt of a lease incentive from our U.K. landlord, and $4.2 million increase in accounts payable.
For the year ended March 31, 2019, cash provided by operating activities was $66.2 million. The primary factors affecting our operating cash flows during the period were our net loss of $7.0 million, adjusted for non-cash items of $30.0 million for depreciation and amortization of our property, equipment and intangible assets, $26.0 million of share-based compensation expense, and $6.4 million in amortization of deferred contract costs, partially offset by a deferred income tax benefit of $1.5 million. The drivers of the changes in operating assets and liabilities were a $45.9 million increase in deferred revenue, a $5.7 million increase in accrued expenses and other current liabilities and a $2.1 million increase in accounts payable, partially offset by a $20.2 million increase in deferred contract costs, $18.8 million increase in accounts receivable, $2.0 million increase in prepaid expenses and other current assets and a $1.1 million increase in other assets.
Investing activities
Cash used in investing activities of $55.6 million for the year ended March 31, 2021 consisted primarily of $38.6 million in purchases of property, equipment and capitalized software and $17.0 million in payment for the acquisition of MessageControl in July 2020.
Cash used in investing activities of $65.5 million for the year ended March 31, 2020 consisted primarily of $53.2 million in purchases of property, equipment and capitalized software, $45.3 million in payments for the Segasec Labs Ltd. and DMARC Analyzer acquisitions, and $3.0 million in purchases of strategic investments, partially offset by $36.0 million in maturities of investments.
Cash used in investing activities of $121.3 million for the year ended March 31, 2019 consisted primarily of $115.7 million in payments for the Solebit LABS Ltd., Ataata Inc. and Simply Migrate Ltd. acquisitions, $28.8 million in purchases of property,
58
equipment and capitalized software and $42.9 million in purchases of investments, partially offset by $66.0 million in maturities of investments.
Our capital expenditures in each period were primarily associated with computer equipment and software purchased in support of our expanding infrastructure. Additionally, in the years ended March 31, 2021, 2020 and 2019 we had purchases of $2.0 million, $22.0 million, and $3.0 million, respectively, related to our office facilities.
Financing activities
Cash provided by financing activities of $38.3 million for the year ended March 31, 2021 was primarily due to proceeds from issuance of ordinary shares under our equity plans of $34.0 million and proceeds from the draw down on our revolving credit facility of $17.5 million, partially offset by withholding taxes related to net share settlement of employee stock purchase plan purchases and vesting of restricted share units of $5.3 million, payments on debt of $6.9 million, and payments on finance lease obligations of $1.1 million.
Cash provided by financing activities of $17.7 million for the year ended March 31, 2020 was primarily due to proceeds from issuance of ordinary shares under our equity plans of $25.4 million, partially offset by payments on debt of $4.4 million and withholding taxes related to net share settlement of employee stock purchase plan purchases and vesting of restricted share units of $2.5 million.
Cash provided by financing activities of $117.0 million for the year ended March 31, 2019 was primarily due to proceeds from issuance of debt, net of issuance costs, of $97.7 million and proceeds from issuance of ordinary shares under our equity plans of $25.0 million, partially offset by payments on construction financing lease obligations of $2.3 million, payments on debt of $1.9 million and payments on capital lease obligations of $1.3 million.
Net operating loss carryforwards and income tax credits
As of March 31, 2021, we had U.K. net operating loss carryforwards of approximately $68.6 million that do not expire. As of March 31, 2021, we had U.S. federal net operating loss carryforwards of approximately $63.3 million. U.S. federal net operating loss carryforwards generated through March 31, 2018 of approximately $39.2 million expire at various dates through 2038, and U.S. federal net operating loss carryforwards generated in tax years beginning after March 31, 2018 of approximately $24.1 million do not expire. As of March 31, 2021, we had U.S. state net operating loss carryforwards of approximately $34.3 million, substantially all of which expire at various dates through 2041. As of March 31, 2021, we had Australian net operating loss carryforwards of approximately $26.6 million that do not expire. As of March 31, 2021, we had German net operating loss carryforwards of approximately $10.3 million that do not expire. As of March 31, 2021, we had Israeli net operating loss carryforwards of approximately $8.0 million that do not expire. As of March 31, 2021, we had Canadian net operating loss carryforwards of approximately $2.2 million that expire in 2041. As of March 31, 2021, we had U.K. income tax credit carryforwards of $2.1 million that do not expire. As of March 31, 2021, we had an Israeli income tax credit carryforward of $0.5 million that expires at various dates from 2024 through 2026.
In assessing our ability to realize our net deferred tax assets, we considered various factors including future reversals of existing taxable temporary differences, projected future taxable income, tax planning strategies and recent financial operations, to determine whether it is more likely than not that some portion or all of our net deferred tax assets will not be realized. Based upon these factors, we have determined that the uncertainty regarding the realization of these assets is sufficient to warrant the need for a full valuation allowance against our net deferred tax assets.
Contractual obligations and commitments
Our principal commitments consist of obligations under debt facilities, leases for office space, leases for data center facilities, non-lease data center obligations and intangible asset obligations. For more information regarding our debt obligations, see Note 10 to the consolidated financial statements of this Annual Report on Form 10-K. For more information regarding our lease obligations, see Note 9 to the condensed consolidated financial statements of this Annual Report on Form 10-K. As of March 31, 2021, our other contractual commitments associated with agreements that are enforceable and legally binding and that specify all significant terms were payments of $4.6 million due in the next 12 months and $4.6 million due thereafter. We expect to fund these obligations with cash flows from operations and cash on our balance sheet.
59
Recently issued and adopted accounting pronouncements
For information on recent accounting pronouncements, see Note 2. “Summary of Significant Accounting Policies” in the notes to the consolidated financial statements appearing elsewhere in this Annual Report on Form 10-K.
Critical Accounting Policies and Estimates
Our consolidated financial statements and the related notes included elsewhere in this Annual Report on Form 10-K are prepared in accordance with accounting principles generally accepted in the United States. The preparation of these consolidated financial statements requires us to make estimates and assumptions that affect the reported amounts of assets and liabilities and disclosure of contingent assets and liabilities at the date of the financial statements and the reported amounts of revenues and expenses during the reporting periods. We base our estimates on historical experience and on various other assumptions, including uncertainty in the current economic environment due to the global COVID-19 pandemic, that we believe to be reasonable, the results of which form the basis for making judgments about the carrying values of assets and liabilities that are not readily apparent from other sources. Changes in accounting estimates are reasonably likely to occur from period to period. Accordingly, actual results could differ significantly from our estimates. We evaluate our estimates and assumptions on an ongoing basis. To the extent that there are material differences between our estimates and our actual results, our future financial statement presentation, financial condition, results of operations and cash flows will be affected.
We believe that of our significant accounting policies, which are described in Note 2 to the notes to our consolidated financial statements included elsewhere in this Annual Report on Form 10-K, the following accounting policies involve a greater degree of judgment and complexity. Accordingly, these are the policies we believe are the most critical to aid in fully understanding and evaluating our consolidated financial condition and results of our operations.
Revenue Recognition
Revenue Recognition Policy
We recognize revenue upon transfer of control of promised products or services to customers in an amount that reflects the consideration we expect to receive in exchange for those products or services. To achieve the core principle of ASC 606, we perform the following steps:
|
|
1) |
Identify the contract(s) with a customer; |
|
|
2) |
Identify the performance obligations in the contract; |
|
|
3) |
Determine the transaction price; |
|
|
4) |
Allocate the transaction price to the performance obligations in the contract; and |
|
|
5) |
Recognize revenue when (or as) we satisfy a performance obligation. |
We derive our revenue from two sources: (1) subscription revenues, which are comprised of subscription fees from customers accessing our cloud services and from customers purchasing additional support beyond the standard support that is included in the basic subscription fees; and (2) related professional services and other revenue, which consists primarily of certain performance obligations related to set-up, ingestion, consulting and training fees.
In the years ended March 31, 2021, 2020 and 2019, subscription revenue made up the substantial majority of our revenue and professional services and other revenue made up less than 5% of our revenue.
Our subscription arrangements provide customers the right to access our hosted software applications. Customers do not have the right to take possession of our software during the hosting arrangement.
We sell our products and services directly through our sales force and also indirectly through third-party resellers. In accordance with the provisions of ASU No. 2014-09, Revenue from Contracts with Customers: Topic 606, or ASC 606, we have considered certain factors in determining whether the end-user or the third-party reseller is the customer in arrangements involving resellers. We concluded that in the majority of transactions with resellers, the reseller is the customer. In these arrangements, we consider that it is the reseller, and not us, that has the relationship with the end-user. Specifically, the reseller has the ability to set pricing with the end-user and the credit risk with the end-user is borne by the reseller. Further, the reseller is not obligated to report its transaction price with the end-user to us, and in the majority of transactions, we are unable to determine the amount paid by the end-user customer to the reseller in these transactions. As a result of such considerations, revenue for these transactions is presented in the accompanying consolidated statements of operations based upon the amount billed to the reseller. For transactions where we have determined that the
60
end-user is the ultimate customer, revenue is presented in the accompanying consolidated statements of operations based on the transaction price with the end-user.
We recognize subscription and support revenue ratably over the term of the contract, typically one year in duration, beginning on the date the customer is provided access to our service. For performance obligations related to set-up and ingestion, including implementation assistance and data migration services, respectively, we recognize revenue using output measures of performance that reflect the transfer of promised services to the customer consistent with progress to completion. We consider training, consulting, and other professional services contracts as separate performance obligations and recognize revenue using output measures of performance as services are completed.
Amounts that have been invoiced are recorded in accounts receivable and in deferred revenue or revenue, depending on whether the revenue recognition criteria have been met. We primarily bill and collect payments from customers for our services in advance on a monthly and annual basis.
In some instances, we receive non-refundable upfront payments for activities that do not constitute a promise to transfer a service and therefore are considered administrative tasks, not separate performance obligations. The upfront payments are evaluated to determine whether a material right to a discount upon renewal of the subscription exists. When we conclude a material right does not exist, we recognize revenue related to the upfront payment over the initial contract term. When we conclude a material right does exist, we recognize revenue related to the upfront payment, under the look-through method, over the estimated customer benefit period, which has been determined to be six years.
All of our performance obligations, and associated revenue, are generally transferred to customers over time, with the exception of training, consulting and other professional services, which are generally transferred to the customer at a point in time.
Revenue is presented net of any taxes collected from customers.
Some of our contracts with customers contain multiple performance obligations. For these contracts, we account for individual performance obligations separately if they are distinct. The transaction price is allocated to the separate performance obligations on a relative standalone selling price basis. We determine the standalone selling prices based on our overall pricing objectives, taking into consideration market conditions and other factors, including the value of our contracts, the products sold, customer demographics, our sales channel, and the number and size of users within our contracts.
Deferred revenue primarily consists of billings or payments received in advance of revenue recognition from subscription and other services described above and is recognized as the revenue recognition criteria are met. Deferred revenue that is expected to be recognized during the succeeding twelve-month period is recorded as current deferred revenue and the remaining portion is recorded as non-current in the accompanying consolidated balance sheets.
Deferred Cost Policy
We capitalize incremental costs of obtaining revenue contracts, which primarily consist of commissions paid to our sales representatives. We amortize these commissions over six years on a systematic basis, consistent with the pattern of transfer of the goods or services to which the asset relates. Six years represents the estimated benefit period of the customer relationship taking into account factors such as peer estimates of technology lives and customer lives as well as our own historical data. The current and noncurrent portions of deferred commissions are included in deferred contract costs, net, and deferred contract costs, net of current portion, respectively, in the accompanying consolidated balance sheets. Amortization of capitalized costs to obtain revenue contracts is included in sales and marketing expense in the accompanying consolidated statements of operations. See Note 2 of the notes to our consolidated financial statements, included elsewhere in this Annual Report on Form 10-K for costs capitalized as of March 31, 2021.
Goodwill and long-lived asset impairment assessments
Goodwill is not amortized, but is evaluated for impairment annually, or whenever events or changes in circumstances indicate that the carrying value may not be recoverable. We have determined that there is a single reporting unit for the purpose of conducting this goodwill impairment assessment. For purposes of assessing potential impairment, we estimate the fair value of the reporting unit, based on our market capitalization, and compare this amount to the carrying value of the reporting unit. If we determine that the carrying value of the reporting unit exceeds its fair value, an impairment charge would be required. The annual goodwill impairment test is performed as of January 1st of each year. To date, we have not identified any impairment to goodwill.
61
Intangible assets acquired in a business combination are recorded at their estimated fair values at the date of acquisition. We amortize acquired definite-lived intangible assets over their estimated useful lives based on the pattern of consumption of the economic benefits or, if that pattern cannot be readily determined, on a straight-line basis.
We review long-lived assets, including property and equipment, right-of-use assets, and definite-lived intangible assets, for impairment whenever events or changes in circumstances indicate that the carrying value of an asset may not be recoverable. During this review, we re-evaluate the significant assumptions used in determining the original cost and estimated lives of long-lived assets. Although the assumptions may vary from asset to asset, they generally include operating results, changes in the use of the asset, cash flows, and other indicators of value. We then determine whether the remaining useful life continues to be appropriate, or whether there has been an impairment of long-lived assets based primarily upon whether expected future undiscounted cash flows are sufficient to support the recoverability of these assets. Recoverability of these assets is measured by comparison of the carrying amount of the asset to the future undiscounted cash flows the asset is expected to generate. If the asset is considered to be impaired, the amount of any impairment is measured as the difference between the carrying value and the fair value of the impaired asset.
Income taxes
We are subject to income tax in the United Kingdom, the United States and other international jurisdictions, and we use estimates in determining our provision for income taxes. We account for income taxes in accordance with ASC 740, Income Taxes, or ASC 740. ASC 740 is an asset and liability approach that requires recognition of deferred tax assets and liabilities for the expected future tax consequences attributable to differences between the carrying amounts of assets and liabilities for financial reporting purposes and their respective tax basis, and for net operating loss and tax credit carryforwards. ASC 740 requires a valuation allowance against net deferred tax assets if, based upon the available evidence, it is more likely than not that some or all of the deferred tax assets will not be realized. In making such determination, we consider all available positive and negative evidence, including future reversals of existing taxable temporary differences, projected future taxable income, tax planning strategies and recent financial operations. Realization of deferred tax assets is dependent upon future earnings, if any, the timing and amount of which are uncertain. Accordingly, the net deferred tax assets have been fully offset by a valuation allowance.
We recognize the tax benefit from an uncertain tax position only if it is more likely than not the tax position will be sustained on examination by the tax authorities, based on the technical merits of the position. The tax benefits recognized in the consolidated financial statements from such position are then measured based on the largest benefit that has a greater than 50% likelihood of being realized upon settlement. As of March 31, 2021 and 2020, the Company did not have any material uncertain tax positions that would impact the Company’s tax provision if recognized.
Share-based compensation
We account for share-based compensation awards in accordance with the provisions of ASC 718, Compensation—Stock Compensation, which requires the recognition of expense related to the fair value of share-based compensation awards in the statements of operations. For service-based awards, we recognize share-based compensation expense on a straight-line basis over the requisite service period of the award with actual forfeitures recognized as they occur.
Share Options
We estimate the fair value of employee share options on the date of grant using the Black-Scholes option-pricing model, which requires the use of highly subjective estimates and assumptions. We estimate the expected term of share options for service-based awards utilizing the “Simplified Method,” as we do not have sufficient historical share option exercise information on which to base our estimate. The Simplified Method is based on the average of the vesting tranches and the contractual life of each grant. The risk-free interest rate is based on a treasury instrument whose term is consistent with the expected life of the share option. Since there was no public market for our ordinary shares prior to our initial public offering in 2015 and as our shares have been publicly traded for a limited time, we determined the expected volatility for options granted based on an analysis of reported data for a peer group of companies that issue options with substantially similar terms. The expected volatility of options granted has been determined using an average of the historical volatility measures of this peer group of companies and the Company’s historical volatility. We use an expected dividend rate of zero as we currently have no history or expectation of paying dividends on our ordinary shares. The grant date fair value of our ordinary shares at the time of each share option grant is based on the closing market value of our ordinary shares on the grant date.
Employee Share Purchase Plan
We estimate the fair value of Employee Share Purchase Plan, or ESPP, share options on the date of grant using the Black-Scholes option-pricing model, which requires the use of highly subjective estimates and assumptions. We estimate the expected term
62
of ESPP share options based on the length of each offering period, which is six months. The risk-free interest rate is based on a treasury instrument whose term is consistent with the expected life of the ESPP share option. Expected volatility is based on an average of the historical volatility measures of the peer group of companies noted above and the Company’s historical volatility. We use an expected dividend rate of zero as we currently have no history or expectation of paying dividends on our ordinary shares. The grant date fair value per ordinary share is based on the closing market value of our ordinary shares on the first day of each ESPP offering period. The first authorized offering period under the ESPP commenced on July 1, 2017.
Restricted Share Units
For restricted shares units, or RSUs, issued under our share-based compensation plans, the fair value of each grant is calculated based on the closing market value of our ordinary shares on the grant date.
63
Item 7A. Quantitative and Qualitative Disclosures About Market Risk.
Market risk represents the risk of loss that may impact our financial position due to adverse changes in financial market prices and rates. Our market risk exposure is primarily a result of fluctuations in foreign currency rates, although we also have some exposure due to potential changes in inflation or interest rates. We do not hold financial instruments for trading purposes.
Foreign Currency Risk
Our results of operations and cash flows are subject to fluctuations due to changes in foreign currency exchange rates, particularly changes in the British pound and South African rand. Percentage of revenues and expenses in foreign currency were as follows:
|
|
|
Year ended March 31, |
|
|||||
|
|
|
2021 |
|
|
2020 |
|
||
|
Revenues generated in locations outside the United States |
|
|
49 |
% |
|
|
49 |
% |
|
Revenues in currencies other than the United States dollar |
|
|
45 |
% |
|
|
46 |
% |
|
Expenses in currencies other than the United States dollar |
|
|
50 |
% |
|
|
49 |
% |
Percentage of revenues and expenses denominated in foreign currency were as follows:
|
|
|
Year ended March 31, 2021 |
|
|||||
|
|
|
Revenues |
|
|
Expenses |
|
||
|
British pound |
|
|
26 |
% |
|
|
32 |
% |
|
South African Rand |
|
|
10 |
% |
|
|
4 |
% |
|
Other currencies |
|
|
9 |
% |
|
|
14 |
% |
|
Total |
|
|
45 |
% |
|
|
50 |
% |
|
|
|
Year ended March 31, 2020 |
|
|||||
|
|
|
Revenues |
|
|
Expenses |
|
||
|
British pound |
|
|
27 |
% |
|
|
33 |
% |
|
South African Rand |
|
|
12 |
% |
|
|
5 |
% |
|
Other currencies |
|
|
7 |
% |
|
|
11 |
% |
|
Total |
|
|
46 |
% |
|
|
49 |
% |
As of March 31, 2021 and 2020, we had $58.8 million and $48.8 million, respectively, of receivables denominated in currencies other than the U.S. dollar. We also maintain cash accounts denominated in currencies other than the local currency, which exposes us to foreign exchange rate movements. As of March 31, 2021 and 2020, we had $81.5 million and $44.2 million, respectively, of cash denominated in currencies other than the U.S. dollar. As of March 31, 2021, cash denominated in British pounds and South African rand was $36.6 million and $27.8 million, respectively. As of March 31, 2020, cash denominated in British pounds and South African rand was $14.1 million and $20.1 million, respectively.
In addition, although our foreign subsidiaries have intercompany accounts that are eliminated upon consolidation, these accounts expose us to foreign currency exchange rate fluctuations. Exchange rate fluctuations on short-term intercompany accounts are recorded in our consolidated statements of operations under foreign exchange income (expense) and other, net.
Currently, our largest foreign currency exposures are to the British pound and South African rand. From time to time certain macroeconomic events have resulted in volatility in exchange rates including the global COVID-19 pandemic and the United Kingdom’s exit from the European Union. See Item 1A, “Risk Factors – Fluctuations in currency exchange rates could adversely affect our business.” Relative to foreign currency exposures existing as of March 31, 2021, significant movements in foreign currency exchange rates may expose us to significant losses in earnings or cash flows or significantly diminish the fair value of our foreign currency financial instruments. For the year ended March 31, 2021, we estimate that a 10% unfavorable movement in foreign currency exchange rates against the U.S. dollar would have decreased revenue by $23.1 million, decreased expenses by $23.3 million and had a positive impact on our operating results of $0.2 million. For the year ended March 31, 2020, we estimate that a 10% unfavorable movement in foreign currency exchange rates against the U.S. dollar would have decreased revenue by $19.7 million, decreased expenses by $20.9 million and had a positive impact on our operating results of $1.2 million. The estimates used assume that all currencies move in the same direction at the same time and the ratio of non-U.S. dollar denominated revenue and expenses to U.S. dollar denominated revenue and expenses does not change from current levels. Since a portion of our revenue is deferred revenue that is recorded at different foreign currency exchange rates, the impact to revenue of a change in foreign currency exchange rates is recognized over time, and the impact to expenses is more immediate, as expenses are recognized at the current foreign currency exchange rate in effect at the time the expense is incurred. All of the potential changes noted above are based on sensitivity analyses performed on our financial results as of March 31, 2021 and 2020.
64
Inflation Risk
Inflationary factors, such as increases in our operating expenses, may adversely affect our results of operations, as our customers typically purchase services from us on a subscription basis over a period of time. Although we do not believe that inflation has had a material impact on our financial position or results of operations to date, an increase in the rate of inflation in the future may have an adverse effect on our levels of operating expenses as a percentage of revenue if we are unable to increase the prices for our subscription-based services to keep pace with these increased expenses.
Interest Rate Risk
We are exposed to market risk related to changes in interest rates. Our investments primarily consist of money market funds. As of March 31, 2021 and 2020, we had cash and cash equivalents of $292.9 million and $174.0 million, respectively. The carrying amount of our cash equivalents reasonably approximates fair value, due to the short maturities of these investments. The primary objectives of our investment activities are the preservation of capital, the fulfillment of liquidity needs and the fiduciary control of cash and investments. We do not enter into investments for trading or speculative purposes. Our investments are exposed to market risk due to a fluctuation in interest rates, which may affect our interest income and the fair market value of our investments. Due to the short-term nature of our investment portfolio, we believe only dramatic fluctuations in interest rates would have a material effect on our investments. We do not believe that an immediate 10% increase in interest rates would have a material effect on the fair market value of our portfolio. As such we do not expect our operating results or cash flows to be materially affected by a sudden change in market interest rates.
We entered into the Credit Agreement in July 2018. The Credit Agreement provides us with a $100.0 million senior secured term loan, and a $50.0 million senior secured revolving credit facility. Interest under the Credit Facility accrues at a rate between LIBOR plus 1.375% and LIBOR plus 1.875%. We estimate that a 100 basis point increase in the LIBOR rate would result in approximately $1.0 million of additional interest expense over the ensuing twelve-month period under the Credit Facility. The InterContinental Exchange Benchmark Administration has announced that it will no longer publish the one week and two month tenor LIBOR rates starting in 2021 with remaining tenors to be quoted through June 2023. Our Credit Facility provides that, under certain circumstances set forth in the Credit Facility, we and the Administrative Agent may amend the applicable Credit Facility to replace LIBOR with an alternate benchmark rate, giving due consideration to any evolving or then existing convention for similar syndicated credit facilities in the U.S. market for alternative benchmarks. Such alternative benchmark rate could include the secured overnight financing rate, also known as SOFR, published by the Federal Reserve Bank of New York. We do not expect the change to an alternative rate to have a material impact on our financial results.
65
Item 8. Financial Statements and Supplementary Data.
MIMECAST LIMITED
INDEX TO CONSOLIDATED FINANCIAL STATEMENTS
66
Report of Independent Registered Public Accounting Firm
To the Shareholders and the Board of Directors of Mimecast Limited
Opinion on the Financial Statements
We have audited the accompanying consolidated balance sheets of Mimecast Limited (the Company) as of March 31, 2021 and 2020, the related consolidated statements of operations, comprehensive income (loss), shareholders’ equity and cash flows for each of the three years in the period ended March 31, 2021, and the related notes (collectively referred to as the “consolidated financial statements”). In our opinion, the consolidated financial statements present fairly, in all material respects, the financial position of the Company at March 31, 2021 and 2020, and the results of its operations and its cash flows for each of the three years in the period ended March 31, 2021, in conformity with U.S. generally accepted accounting principles.
We also have audited, in accordance with the standards of the Public Company Accounting Oversight Board (United States) (PCAOB), the Company’s internal control over financial reporting as of March 31, 2021, based on criteria established in Internal Control-Integrated Framework issued by the Committee of Sponsoring Organizations of the Treadway Commission (2013 framework), and our report dated May 27, 2021 expressed an unqualified opinion thereon.
Adoption of ASU No. 2016-02
As discussed in Note 2 to the consolidated financial statements, the Company changed its method of accounting for leases in 2020 due to the adoption of Accounting Standards Update (ASU) No. 2016-02, Leases (Topic 842), and the related amendments.
Basis for Opinion
These financial statements are the responsibility of the Company’s management. Our responsibility is to express an opinion on the Company’s financial statements based on our audits. We are a public accounting firm registered with the PCAOB and are required to be independent with respect to the Company in accordance with the U.S. federal securities laws and the applicable rules and regulations of the Securities and Exchange Commission and the PCAOB.
We conducted our audits in accordance with the standards of the PCAOB. Those standards require that we plan and perform the audit to obtain reasonable assurance about whether the financial statements are free of material misstatement, whether due to error or fraud. Our audits included performing procedures to assess the risks of material misstatement of the financial statements, whether due to error or fraud, and performing procedures that respond to those risks. Such procedures included examining, on a test basis, evidence regarding the amounts and disclosures in the financial statements. Our audits also included evaluating the accounting principles used and significant estimates made by management, as well as evaluating the overall presentation of the financial statements. We believe that our audits provide a reasonable basis for our opinion.
Critical Audit Matters
The critical audit matters communicated below are matters arising from the current period audit of the financial statements that were communicated or required to be communicated to the audit committee and that: (1) relate to accounts or disclosures that are material to the financial statements and (2) involved our especially challenging, subjective or complex judgments. The communication of critical audit matters does not alter in any way our opinion on the consolidated financial statements, taken as a whole, and we are not, by communicating the critical audit matters below, providing separate opinions on the critical audit matters or on the accounts or disclosures to which they relate.
67
|
|
|
Uncertain Tax Positions |
|
Description of the Matter |
|
As discussed in Note 2 and Note 17 to the consolidated financial statements, the Company operates in a multinational tax environment and is subject to tax laws, regulations and transfer pricing guidelines for intercompany transactions. Uncertainty in a tax position may arise because tax laws are subject to interpretation. The Company uses significant judgment to (1) determine whether, based on the technical merits, a tax position is more likely than not to be sustained and (2) measure the amount of tax benefit that qualifies for recognition. As of March 31, 2021, the Company accrued liabilities of approximately $12.4 million for uncertain tax positions. Auditing management’s estimate of the amount of tax benefit that qualifies for recognition involved especially challenging auditor judgment because management’s estimate is complex, highly judgmental and based on interpretations of tax laws, legal rulings and determination of arm’s length pricing. |
|
How We Addressed the Matter in Our Audit |
|
We obtained an understanding, evaluated the design, and tested the operating effectiveness of controls over the Company’s accounting process for uncertain tax positions. For example, this included controls over the Company’s assessment of the technical merits of tax positions related to certain intercompany transactions and management’s process to measure the benefit of those tax positions. Among the audit procedures we performed, we involved our tax professionals to assess the technical merits of the Company’s tax positions. This included assessing the Company’s correspondence with the relevant tax authorities and evaluating income tax opinions or other third-party advice obtained by the Company. In addition, we evaluated the appropriateness of the Company’s accounting for its tax positions taking into consideration relevant international and local income tax laws. We analyzed the Company’s assumptions and data used to determine the amount of tax benefit to recognize and tested the accuracy of the calculations. For certain tax positions related to intercompany transactions, we assessed the assumptions and pricing method used in setting arm’s length prices and the documentation to support the pricing. We also evaluated the adequacy of the Company’s financial statement disclosures related to these tax matters. |
|
|
|
Business Combinations – Valuation of Acquired Intangible Assets (Developed Technology) |
|
Description of the Matter |
|
As discussed in Note 6 to the consolidated financial statements, during the year ended March 31, 2021, the Company completed its acquisition of MessageControl for net consideration of $17.0 million. The transaction was accounted for as a business combination. Auditing the Company's accounting for its acquisition of MessageControl required significant auditor judgment due to the estimation uncertainty in determining the fair value of identified intangible assets, which primarily consisted of developed technology of $3.5 million. The estimation uncertainty was primarily due to the complexity of the excess-earnings and distributor valuation models prepared by management to measure the fair value of the intangible assets and the sensitivity of the respective fair values to the significant underlying assumptions. The significant assumptions used to estimate the value of the intangible assets included the discount rates, revenue growth rates and technology migration curves. These significant assumptions are especially challenging to audit as they are forward looking and could be affected by future economic and market conditions. |
68
|
How We Addressed the Matter in Our Audit |
|
We obtained an understanding, evaluated the design, and tested the operating effectiveness of controls over the Company’s valuation of acquired intangible assets. This included testing controls over management’s review of the valuation models and significant assumptions used to develop the estimates of fair value for developed technology and other intangible assets as well as controls over the completeness and accuracy of the data used in the valuation models and assumptions. To test the estimated fair value of the developed technology intangible assets, our audit procedures included, among others, evaluating the Company’s selection of the valuation methodology, evaluating the methods and significant assumptions described above, and evaluating the completeness and accuracy of the underlying data supporting the significant assumptions and estimates. We involved our valuation specialists to assist with our evaluation of the methodology used by the Company and significant assumptions included in the fair value estimates. For example, our valuation specialists performed independent comparative calculations to estimate the discount rate. Additionally, we compared the Company’s revenue growth rates and technology migration curves to historical results and current industry, market and economic trends. We also performed a sensitivity analysis on the significant assumptions to evaluate the change in the fair values of the intangible assets that would result from the changes in assumptions. |
/s/ Ernst & Young LLP
We have served as the Company’s auditor since 2015.
Boston, Massachusetts
May 27, 2021
69
MIMECAST LIMITED
CONSOLIDATED BALANCE SHEETS
(in thousands, except share and per share amounts)
|
|
|
As of March 31, |
|
|||||
|
|
|
2021 |
|
|
2020 |
|
||
|
Assets |
|
|
|
|
|
|
|
|
|
Current assets |
|
|
|
|
|
|
|
|
|
Cash and cash equivalents |
|
$ |
|
|
|
$ |
|
|
|
Accounts receivable, net |
|
|
|
|
|
|
|
|
|
Deferred contract costs, net |
|
|
|
|
|
|
|
|
|
Prepaid expenses and other current assets |
|
|
|
|
|
|
|
|
|
Total current assets |
|
|
|
|
|
|
|
|
|
|
|
|
|
|
|
|
|
|
|
Property and equipment, net |
|
|
|
|
|
|
|
|
|
Operating lease right-of-use assets |
|
|
|
|
|
|
|
|
|
Intangible assets, net |
|
|
|
|
|
|
|
|
|
Goodwill |
|
|
|
|
|
|
|
|
|
Deferred contract costs, net of current portion |
|
|
|
|
|
|
|
|
|
Other assets |
|
|
|
|
|
|
|
|
|
Total assets |
|
$ |
|
|
|
$ |
|
|
|
|
|
|
|
|
|
|
|
|
|
Liabilities and shareholders' equity |
|
|
|
|
|
|
|
|
|
Current liabilities |
|
|
|
|
|
|
|
|
|
Accounts payable |
|
$ |
|
|
|
$ |
|
|
|
Accrued expenses and other current liabilities |
|
|
|
|
|
|
|
|
|
Deferred revenue |
|
|
|
|
|
|
|
|
|
Current portion of finance lease obligations |
|
|
|
|
|
|
|
|
|
Current portion of operating lease liabilities |
|
|
|
|
|
|
|
|
|
Current portion of long-term debt |
|
|
|
|
|
|
|
|
|
Total current liabilities |
|
|
|
|
|
|
|
|
|
|
|
|
|
|
|
|
|
|
|
Deferred revenue, net of current portion |
|
|
|
|
|
|
|
|
|
Long-term finance lease obligations |
|
|
— |
|
|
|
|
|
|
Operating lease liabilities |
|
|
|
|
|
|
|
|
|
Long-term debt |
|
|
|
|
|
|
|
|
|
Other non-current liabilities |
|
|
|
|
|
|
|
|
|
Total liabilities |
|
|
|
|
|
|
|
|
|
|
|
|
|
|
|
|
|
|
|
Commitments and contingencies (Note 14) |
|
|
|
|
|
|
|
|
|
|
|
|
|
|
|
|
|
|
|
Shareholders' equity |
|
|
|
|
|
|
|
|
|
Ordinary shares, $ March 31, 2021 and 2020, respectively |
|
|
|
|
|
|
|
|
|
Additional paid-in capital |
|
|
|
|
|
|
|
|
|
Accumulated deficit |
|
|
( |
) |
|
|
( |
) |
|
Accumulated other comprehensive income (loss) |
|
|
|
|
|
|
( |
) |
|
Total shareholders' equity |
|
|
|
|
|
|
|
|
|
Total liabilities and shareholders' equity |
|
$ |
|
|
|
$ |
|
|
The accompanying notes are an integral part of these consolidated financial statements.
70
MIMECAST LIMITED
CONSOLIDATED STATEMENTS OF OPERATIONS
(in thousands, except per share amounts)
|
|
|
Year Ended March 31, |
|
|||||||||
|
|
|
2021 |
|
|
2020 |
|
|
2019 |
|
|||
|
Revenue |
|
$ |
|
|
|
$ |
|
|
|
$ |
|
|
|
Cost of revenue |
|
|
|
|
|
|
|
|
|
|
|
|
|
Gross profit |
|
|
|
|
|
|
|
|
|
|
|
|
|
Operating expenses |
|
|
|
|
|
|
|
|
|
|
|
|
|
Research and development |
|
|
|
|
|
|
|
|
|
|
|
|
|
Sales and marketing |
|
|
|
|
|
|
|
|
|
|
|
|
|
General and administrative |
|
|
|
|
|
|
|
|
|
|
|
|
|
Restructuring |
|
|
|
|
|
|
— |
|
|
|
( |
) |
|
Total operating expenses |
|
|
|
|
|
|
|
|
|
|
|
|
|
Income (loss) from operations |
|
|
|
|
|
|
|
|
|
|
( |
) |
|
Other income (expense) |
|
|
|
|
|
|
|
|
|
|
|
|
|
Interest income |
|
|
|
|
|
|
|
|
|
|
|
|
|
Interest expense |
|
|
( |
) |
|
|
( |
) |
|
|
( |
) |
|
Foreign exchange income (expense) and other, net |
|
|
|
|
|
|
( |
) |
|
|
( |
) |
|
Total other income (expense), net |
|
|
|
|
|
|
( |
) |
|
|
( |
) |
|
Income (loss) before income taxes |
|
|
|
|
|
|
|
|
|
|
( |
) |
|
Provision for income taxes |
|
|
|
|
|
|
|
|
|
|
|
|
|
Net income (loss) |
|
$ |
|
|
|
$ |
( |
) |
|
$ |
( |
) |
|
|
|
|
|
|
|
|
|
|
|
|
|
|
|
Net income (loss) per ordinary share |
|
|
|
|
|
|
|
|
|
|
|
|
|
Basic |
|
$ |
|
|
|
$ |
( |
) |
|
$ |
( |
) |
|
Diluted |
|
$ |
|
|
|
$ |
( |
) |
|
$ |
( |
) |
|
Weighted-average number of ordinary shares outstanding |
|
|
|
|
|
|
|
|
|
|
|
|
|
Basic |
|
|
|
|
|
|
|
|
|
|
|
|
|
Diluted |
|
|
|
|
|
|
|
|
|
|
|
|
The accompanying notes are an integral part of these consolidated financial statements.
71
MIMECAST LIMITED
CONSOLIDATED STATEMENTS OF COMPREHENSIVE INCOME (LOSS)
(in thousands)
|
|
|
Year ended March 31, |
|
|||||||||
|
|
|
2021 |
|
|
2020 |
|
|
2019 |
|
|||
|
Net income (loss) |
|
$ |
|
|
|
$ |
( |
) |
|
$ |
( |
) |
|
Other comprehensive income (loss): |
|
|
|
|
|
|
|
|
|
|
|
|
|
Net unrealized (losses) gains on investments, net of tax |
|
|
— |
|
|
|
( |
) |
|
|
|
|
|
Change in foreign currency translation adjustment |
|
|
|
|
|
|
( |
) |
|
|
( |
) |
|
Total other comprehensive income (loss) |
|
|
|
|
|
|
( |
) |
|
|
( |
) |
|
Comprehensive income (loss) |
|
$ |
|
|
|
$ |
( |
) |
|
$ |
( |
) |
The accompanying notes are an integral part of these consolidated financial statements.
72
MIMECAST LIMITED
CONSOLIDATED STATEMENTS OF SHAREHOLDERS’ EQUITY
(in thousands)
|
|
|
|
|
|
|
|
|
|
|
|
|
|
|
|
|
|
|
Accumulated |
|
|
|
|
|
|
|
|
|
Ordinary Shares |
|
|
Additional |
|
|
|
|
|
|
Other |
|
|
Total |
|
||||||||
|
|
|
Number of |
|
|
|
|
|
|
Paid-in |
|
|
Accumulated |
|
|
Comprehensive |
|
|
Shareholders' |
|
|||||
|
|
|
Shares |
|
|
Amount |
|
|
Capital |
|
|
Deficit |
|
|
Income (Loss) |
|
|
Equity |
|
||||||
|
Balance as of March 31, 2018 |
|
|
|
|
|
$ |
|
|
|
$ |
|
|
|
$ |
( |
) |
|
$ |
( |
) |
|
$ |
|
|
|
Cumulative effect adjustment ASU 2014-09 (1) |
|
|
— |
|
|
|
— |
|
|
|
— |
|
|
|
|
|
|
|
— |
|
|
|
|
|
|
Net loss |
|
|
— |
|
|
|
— |
|
|
|
— |
|
|
|
( |
) |
|
|
— |
|
|
|
( |
) |
|
Foreign currency translation adjustment |
|
|
— |
|
|
|
— |
|
|
|
— |
|
|
|
— |
|
|
|
( |
) |
|
|
( |
) |
|
Unrealized gains on investments |
|
|
— |
|
|
|
— |
|
|
|
— |
|
|
|
— |
|
|
|
|
|
|
|
|
|
|
Issuance of ordinary shares upon exercise of share options |
|
|
|
|
|
|
|
|
|
|
|
|
|
|
— |
|
|
|
— |
|
|
|
|
|
|
Share-based compensation |
|
|
— |
|
|
|
— |
|
|
|
|
|
|
|
— |
|
|
|
— |
|
|
|
|
|
|
Employee share purchase plan (ESPP) purchases |
|
|
|
|
|
|
|
|
|
|
|
|
|
|
— |
|
|
|
— |
|
|
|
|
|
|
Tax withholding on ESPP purchases and vesting of RSUs |
|
|
( |
) |
|
|
— |
|
|
|
( |
) |
|
|
— |
|
|
|
— |
|
|
|
( |
) |
|
Vesting of restricted share units (RSUs) |
|
|
|
|
|
|
— |
|
|
|
— |
|
|
|
— |
|
|
|
— |
|
|
|
— |
|
|
Balance as of March 31, 2019 |
|
|
|
|
|
|
|
|
|
|
|
|
|
|
( |
) |
|
|
( |
) |
|
|
|
|
|
Cumulative effect adjustment ASU 2016-02 (2) |
|
|
— |
|
|
|
— |
|
|
|
— |
|
|
|
|
|
|
|
— |
|
|
|
|
|
|
Net loss |
|
|
— |
|
|
|
— |
|
|
|
— |
|
|
|
( |
) |
|
|
— |
|
|
|
( |
) |
|
Foreign currency translation adjustment |
|
|
— |
|
|
|
— |
|
|
|
— |
|
|
|
— |
|
|
|
( |
) |
|
|
( |
) |
|
Unrealized losses on investments |
|
|
— |
|
|
|
— |
|
|
|
— |
|
|
|
— |
|
|
|
( |
) |
|
|
( |
) |
|
Issuance of ordinary shares upon exercise of share options |
|
|
|
|
|
|
|
|
|
|
|
|
|
|
— |
|
|
|
— |
|
|
|
|
|
|
Share-based compensation |
|
|
— |
|
|
|
— |
|
|
|
|
|
|
|
— |
|
|
|
— |
|
|
|
|
|
|
ESPP purchases |
|
|
|
|
|
|
|
|
|
|
|
|
|
|
— |
|
|
|
— |
|
|
|
|
|
|
Tax withholding on ESPP purchases and vesting of RSUs |
|
|
( |
) |
|
|
— |
|
|
|
( |
) |
|
|
— |
|
|
|
— |
|
|
|
( |
) |
|
Vesting of RSUs |
|
|
|
|
|
|
|
|
|
|
( |
) |
|
|
— |
|
|
|
— |
|
|
|
— |
|
|
Balance as of March 31, 2020 |
|
|
|
|
|
|
|
|
|
|
|
|
|
|
( |
) |
|
|
( |
) |
|
|
|
|
|
Net income |
|
|
— |
|
|
|
— |
|
|
|
— |
|
|
|
|
|
|
|
— |
|
|
|
|
|
|
Foreign currency translation adjustment |
|
|
— |
|
|
|
— |
|
|
|
— |
|
|
|
— |
|
|
|
|
|
|
|
|
|
|
Issuance of ordinary shares upon exercise of share options |
|
|
|
|
|
|
|
|
|
|
|
|
|
|
— |
|
|
|
— |
|
|
|
|
|
|
Share-based compensation |
|
|
— |
|
|
|
— |
|
|
|
|
|
|
|
— |
|
|
|
— |
|
|
|
|
|
|
ESPP purchases |
|
|
|
|
|
|
|
|
|
|
|
|
|
|
— |
|
|
|
— |
|
|
|
|
|
|
Tax withholding on ESPP purchases and vesting of RSUs |
|
|
( |
) |
|
|
( |
) |
|
|
( |
) |
|
|
— |
|
|
|
— |
|
|
|
( |
) |
|
Vesting of RSUs |
|
|
|
|
|
|
|
|
|
|
( |
) |
|
|
— |
|
|
|
— |
|
|
|
— |
|
|
Balance as of March 31, 2021 |
|
|
|
|
|
$ |
|
|
|
$ |
|
|
|
$ |
( |
) |
|
$ |
|
|
|
$ |
|
|
|
(1) |
|
|
(2) |
|
The accompanying notes are an integral part of these consolidated financial statements.
73
MIMECAST LIMITED
CONSOLIDATED STATEMENTS OF CASH FLOWS
(in thousands)
|
|
|
Year ended March 31, |
|
|||||||||
|
|
|
2021 |
|
|
2020 |
|
|
2019 |
|
|||
|
Operating activities |
|
|
|
|
|
|
|
|
|
|
|
|
|
Net income (loss) |
|
$ |
|
|
|
$ |
( |
) |
|
$ |
( |
) |
|
Adjustments to reconcile net income (loss) to net cash provided by operating activities: |
|
|
|
|
|
|
|
|
|
|
|
|
|
Depreciation and amortization |
|
|
|
|
|
|
|
|
|
|
|
|
|
Share-based compensation expense |
|
|
|
|
|
|
|
|
|
|
|
|
|
Amortization of deferred contract costs |
|
|
|
|
|
|
|
|
|
|
|
|
|
Amortization of debt issuance costs |
|
|
|
|
|
|
|
|
|
|
|
|
|
Amortization of operating lease right-of-use assets |
|
|
|
|
|
|
|
|
|
|
— |
|
|
Deferred income tax benefit |
|
|
( |
) |
|
|
( |
) |
|
|
( |
) |
|
Other non-cash items |
|
|
|
|
|
|
( |
) |
|
|
( |
) |
|
Unrealized currency (gains) losses on foreign denominated transactions |
|
|
( |
) |
|
|
|
|
|
|
|
|
|
Changes in assets and liabilities: |
|
|
|
|
|
|
|
|
|
|
|
|
|
Accounts receivable |
|
|
( |
) |
|
|
( |
) |
|
|
( |
) |
|
Prepaid expenses and other current assets |
|
|
( |
) |
|
|
|
|
|
|
( |
) |
|
Deferred contract costs |
|
|
( |
) |
|
|
( |
) |
|
|
( |
) |
|
Other assets |
|
|
|
|
|
|
( |
) |
|
|
( |
) |
|
Accounts payable |
|
|
( |
) |
|
|
|
|
|
|
|
|
|
Deferred revenue |
|
|
|
|
|
|
|
|
|
|
|
|
|
Operating lease liabilities |
|
|
( |
) |
|
|
( |
) |
|
|
— |
|
|
Accrued expenses and other liabilities |
|
|
|
|
|
|
( |
) |
|
|
|
|
|
Net cash provided by operating activities |
|
|
|
|
|
|
|
|
|
|
|
|
|
Investing activities |
|
|
|
|
|
|
|
|
|
|
|
|
|
Purchases of property, equipment and capitalized software |
|
|
( |
) |
|
|
( |
) |
|
|
( |
) |
|
Purchases of strategic investments |
|
|
— |
|
|
|
( |
) |
|
|
— |
|
|
Purchases of investments |
|
|
— |
|
|
|
— |
|
|
|
( |
) |
|
Maturities of investments |
|
|
— |
|
|
|
|
|
|
|
|
|
|
Payments for acquisitions, net of cash acquired |
|
|
( |
) |
|
|
( |
) |
|
|
( |
) |
|
Net cash used in investing activities |
|
|
( |
) |
|
|
( |
) |
|
|
( |
) |
|
Financing activities |
|
|
|
|
|
|
|
|
|
|
|
|
|
Proceeds from issuance of ordinary shares |
|
|
|
|
|
|
|
|
|
|
|
|
|
Withholding taxes related to net share settlement of ESPP purchases and vesting of RSUs |
|
|
( |
) |
|
|
( |
) |
|
|
( |
) |
|
Payments on debt |
|
|
( |
) |
|
|
( |
) |
|
|
( |
) |
|
Payments on finance lease obligations |
|
|
( |
) |
|
|
( |
) |
|
|
( |
) |
|
Payments on construction financing lease obligations |
|
|
— |
|
|
|
— |
|
|
|
( |
) |
|
Proceeds from long-term debt including revolving credit facilities |
|
|
|
|
|
|
— |
|
|
|
|
|
|
Net cash provided by financing activities |
|
|
|
|
|
|
|
|
|
|
|
|
|
Effect of foreign exchange rates on cash |
|
|
|
|
|
|
( |
) |
|
|
( |
) |
|
Net increase in cash and cash equivalents |
|
|
|
|
|
|
|
|
|
|
|
|
|
Cash and cash equivalents at beginning of period |
|
|
|
|
|
|
|
|
|
|
|
|
|
Cash and cash equivalents at end of period |
|
$ |
|
|
|
$ |
|
|
|
$ |
|
|
|
Supplemental disclosure of cash flow information |
|
|
|
|
|
|
|
|
|
|
|
|
|
Cash paid during the period for interest |
|
$ |
|
|
|
$ |
|
|
|
$ |
|
|
|
Cash paid during the period for income taxes |
|
$ |
|
|
|
$ |
|
|
|
$ |
|
|
|
Supplemental disclosure of non-cash investing and financing activities |
|
|
|
|
|
|
|
|
|
|
|
|
|
Unpaid purchases of property, equipment and capitalized software |
|
$ |
|
|
|
$ |
|
|
|
$ |
|
|
|
Operating lease right-of-use assets exchanged for lease obligations |
|
$ |
|
|
|
$ |
|
|
|
$ |
— |
|
|
Construction costs capitalized under financing lease obligations |
|
$ |
— |
|
|
$ |
— |
|
|
$ |
|
|
|
Derecognition of building upon completion of construction period |
|
$ |
— |
|
|
$ |
— |
|
|
$ |
( |
) |
|
Withholding taxes payable upon RSU vesting |
|
$ |
— |
|
|
$ |
— |
|
|
$ |
|
|
The accompanying notes are an integral part of these consolidated financial statements.
74
MIMECAST LIMITED
NOTES TO CONSOLIDATED FINANCIAL STATEMENTS
Years ended March 31, 2021, 2020 and 2019
(in thousands, except share and per share data, unless otherwise noted)
1. Organization and Description of Business
Mimecast Limited (Mimecast Jersey) is a public limited company organized under the laws of the Bailiwick of Jersey on July 28, 2015. On November 4, 2015, Mimecast Jersey changed its corporate structure whereby it became the holding company of Mimecast Limited (Mimecast UK), a private limited company incorporated in 2003 under the laws of England and Wales, and its wholly-owned subsidiaries by way of a share-for-share exchange in which the shareholders of Mimecast UK exchanged their shares in Mimecast UK for an identical number of shares of the same class in Mimecast Jersey. Upon the exchange, the historical consolidated financial statements of Mimecast UK became the historical consolidated financial statements of Mimecast Jersey.
Mimecast Jersey and its subsidiaries (together, the Group, the Company, or Mimecast) is headquartered in London, England. The principal activity of the Group is the provision of cloud security and risk management services for email and corporate information. Delivered as a software-as-a-service (SaaS), Mimecast’s Email Security 3.0 offerings and Cyber Resilience Extension offerings include email security; email continuity and sync & recover; email archiving; awareness training; web security; DMARC analyzer; brand exploit protection; and threat intelligence and our API ecosystem. By unifying disparate and fragmented email environments into one holistic solution from the cloud, Mimecast minimizes risk and reduces cost and complexity while providing total end-to-end control of email. Mimecast’s proprietary software platform provides a single system to address key email management issues. Mimecast operates principally in Europe, North America, Africa and Australia.
The Company is subject to a number of risks and uncertainties common to companies in similar industries and stages of development including, but not limited to, rapid technological changes, competition from substitute products and services from larger companies, customer concentration, management of international activities, protection of proprietary rights, patent litigation, and dependence on key individuals.
2. Summary of Significant Accounting Policies
The accompanying consolidated financial statements reflect the application of certain significant accounting policies as described below and elsewhere in these notes to the consolidated financial statements. The Company believes that a significant accounting policy is one that is both important to the portrayal of the Company’s financial condition and results, and requires management’s most difficult, subjective, or complex judgments, often as the result of the need to make estimates about the effect of matters that are inherently uncertain.
Basis of Presentation
The accompanying consolidated financial statements have been prepared in conformity with accounting principles generally accepted in the United States of America (GAAP). Any reference in these notes to applicable guidance is meant to refer to the authoritative United States generally accepted accounting principles as found in the Accounting Standards Codification (ASC) and Accounting Standards Update (ASU) of the Financial Accounting Standards Board (FASB).
The Company reclassified certain amounts within its consolidated statements of cash flows to conform to current period presentation. The reclassifications include $
Principles of Consolidation
The consolidated financial statements include the accounts of the Company and its subsidiaries. All intercompany transactions and balances have been eliminated in consolidation.
Use of Estimates
The preparation of financial statements in conformity with GAAP requires management to make estimates and assumptions that affect the reported amounts of assets and liabilities and the disclosure of contingent assets and liabilities at the date of the consolidated financial statements and the reported amounts of income and expenses during the reporting period.
75
Significant estimates relied upon in preparing these consolidated financial statements include revenue recognition, variable consideration, valuation at fair value of assets acquired or sold, including intangible assets, goodwill, tangible assets, and liabilities assumed, amortization periods, expected future cash flows used to evaluate the recoverability of long-lived assets, contingent liabilities, determination of incremental borrowing rates, restructuring liabilities, expensing and capitalization of research and development costs for internal-use software, the determination of the fair value of share-based awards issued, the average period of benefit associated with costs capitalized to obtain revenue contracts and the recoverability of the Company’s net deferred tax assets and related valuation allowance.
Due to the global COVID-19 pandemic, there has been uncertainty and disruption in the global economy and financial markets. The Company is not aware of any specific event or circumstance that would require an update to its estimates or judgments or a revision of the carrying value of its assets or liabilities as of March 31, 2021. Although the Company regularly assesses these estimates, actual results could differ materially from these estimates. The Company bases its estimates on historical experience and various other assumptions that it believes to be reasonable under the circumstances. Actual results may differ from management’s estimates if these results differ from historical experience, or other assumptions do not turn out to be substantially accurate, even if such assumptions are reasonable when made. Changes in estimates are recorded in the period in which they become known.
Subsequent Events Considerations
The Company considers events or transactions that occur after the balance sheet date but prior to the issuance of the financial statements to provide additional evidence for certain estimates or to identify matters that require additional disclosure. Subsequent events have been evaluated as required. See Note 18.
Cash, Cash Equivalents and Investments
The Company considers all highly liquid instruments purchased with an original maturity date of 90 days or less from the date of purchase to be cash equivalents. Cash and cash equivalents consist of cash on deposit with banks, amounts held in interest-bearing money market funds and investments with maturities of 90 days or less from the date of purchase. Cash equivalents are carried at cost, which approximates their fair market value. Investments not classified as cash equivalents are presented as either short-term or long-term investments based on both their stated maturities as well as the time period the Company intends to hold such securities. The Company determines the appropriate classification of investments at the time of purchase and reevaluates such designation at each balance sheet date. The Company adjusts the cost of investments for amortization of premiums and accretion of discounts to maturity. The Company includes such amortization and accretion in interest income in the consolidated statements of operations. As of March 31, 2021 and 2020, cash and cash equivalents of $
The Company did not hold any debt investments as of March 31, 2021 or 2020. When the Company holds debt investments classified as available-for-sale pursuant to ASC 320, Investments – Debt Securities, it records available-for-sale securities at fair value, with unrealized gains and losses included in accumulated other comprehensive loss in shareholders’ equity. The Company includes interest and dividends on securities classified as available-for-sale in interest income in the consolidated statements of operations. Realized gains and losses are recorded in the consolidated statements of operations and comprehensive loss based on the specific-identification method. There were
76
On April 1, 2020, the Company adopted ASU 2016-13, Financial Instruments - Credit Losses (Topic 326) and ASU 2019-04, Codification Improvements to Topic 326, Financial Instruments - Credit Losses, Topic 815 Derivatives and Hedging and Topic 825, Financial Instruments. Under these standards, the Company reviews available-for-sale securities for impairment whenever the fair value of the security is less than its amortized cost. If impairment exists and the Company intends to sell the security or it is more likely than not that the Company will be required to sell the security before recovery of the amortized cost basis, the Company will write down the amortized cost basis to its fair value at the reporting date, recognizing the difference as a loss within foreign exchange (expense) income and other, net in the consolidated statements of operations. If the Company does not intend to sell the security nor is it more likely than not that the Company will be required to sell the security before recovery of the amortized cost basis, the Company will determine if any portion of the unrealized loss on the security is due to credit loss. If the impairment is entirely or partially due to credit loss, the Company will measure the credit loss up to the amount of the difference between fair value and amortized cost, and recognize an allowance for credit losses along with the related charge against earnings within foreign exchange income (expense) and other, net in the consolidated statements of operations. The remaining impairment amount due to all other factors is recognized in accumulated other comprehensive income (loss) in the consolidated balance sheets. Subsequent changes to the Company’s estimate of credit loss will be recorded as adjustments to the allowance for credit losses and net income. As of March 31, 2021 and 2020, the Company did
Revenue Recognition
Revenue Recognition Policy
The Company recognizes revenue upon transfer of control of promised products or services to customers in an amount that reflects the consideration the Company expects to receive in exchange for those products or services. To achieve the core principle of ASC 606, the Company performs the following steps:
|
|
1) |
Identify the contract(s) with a customer; |
|
|
2) |
Identify the performance obligations in the contract; |
|
|
3) |
Determine the transaction price; |
|
|
4) |
Allocate the transaction price to the performance obligations in the contract; and |
|
|
5) |
Recognize revenue when (or as) the Company satisfies a performance obligation. |
The Company derives its revenue from two sources: (1) subscription revenue, which are comprised of subscription fees from customers accessing the Company’s cloud services and from customers purchasing additional support beyond the standard support that is included in the basic subscription fees; and (2) related professional services and other revenue, which consists primarily of certain performance obligations related to set-up, ingestion, consulting and training fees.
In the years ended March 31, 2021, 2020 and 2019, subscription revenue made up the substantial majority of the Company’s revenue and professional services and other revenue made up less than
The Company’s subscription arrangements provide customers the right to access the Company’s hosted software applications. Customers do not have the right to take possession of the Company’s software during the hosting arrangement.
The Company sells its products and services directly through the Company’s sales force and also indirectly through third-party resellers. In accordance with the provisions of ASC 606, the Company has considered certain factors in determining whether the end-user or the third-party reseller is the customer in arrangements involving resellers. The Company concluded that in the majority of transactions with resellers, the reseller is the customer. In these arrangements, the Company considered that it is the reseller, and not the Company, that has the relationship with the end-user. Specifically, the reseller has the ability to set pricing with the end-user and the credit risk with the end-user is borne by the reseller. Further, the reseller is not obligated to report its transaction price with the end-user to the Company, and in the majority of transactions, the Company is unable to determine the amount paid by the end-user customer to the reseller in these transactions. As a result of such considerations, revenue for these transactions is presented in the accompanying consolidated statements of operations based upon the amount billed to the reseller. For transactions where the Company has determined that the end-user is the ultimate customer, revenue is presented in the accompanying consolidated statements of operations based on the transaction price with the end-user.
The Company recognizes subscription and support revenue ratably over the term of the contract, typically one year in duration, beginning on the date the customer is provided access to the Company’s service. For performance obligations related to set-up and ingestion, including implementation assistance and data migration services, respectively, the Company recognizes revenue using output measures of performance that reflect the transfer of promised services to the customer consistent with progress to completion. The Company considers training, consulting, and other professional services contracts as separate performance obligations and recognizes revenue using output measures of performance as services are completed.
Amounts that have been invoiced are recorded in accounts receivable and in deferred revenue or revenue, depending on whether the revenue recognition criteria have been met. The Company primarily bills and collects payments from customers for its services in advance on a monthly and annual basis.
In some instances, the Company receives non-refundable upfront payments for activities that do not constitute a promise to transfer a service and therefore are considered administrative tasks, not separate performance obligations. The upfront payments are evaluated to determine whether a material right to a discount upon renewal of the subscription exists. When the Company concludes a material right does not exist, the Company recognizes revenue related to the upfront payment over the initial contract term. When the Company concludes a material right does exist, the Company recognizes revenue related to the upfront payment, under the look-through method, over the estimated customer benefit period, which has been determined to be
All of the Company’s performance obligations, and associated revenue, are generally transferred to customers over time, with the exception of training, consulting and other professional services, which are generally transferred to the customer at a point in time.
Revenue is presented net of any taxes collected from customers.
77
Some of the Company’s contracts with customers contain multiple performance obligations. For these contracts, the Company accounts for individual performance obligations separately if they are distinct. The transaction price is allocated to the separate performance obligations on a relative standalone selling price basis. The Company determines the standalone selling prices based on the Company’s overall pricing objectives, taking into consideration market conditions and other factors, including the value of the Company’s contracts, the products sold, customer demographics, the Company’s sales channel, and the number and size of users within the Company’s contracts.
Deferred revenue primarily consists of billings or payments received in advance of revenue recognition from subscription and other services described above and is recognized as the revenue recognition criteria are met. Deferred revenue that is expected to be recognized during the succeeding twelve-month period is recorded as current deferred revenue and the remaining portion is recorded as non-current in the accompanying consolidated balance sheets.
Deferred Cost Policy
The Company capitalizes incremental costs of obtaining revenue contracts, which primarily consist of commissions paid to its sales representatives. The Company amortizes these commissions over
Cost of Revenue
Cost of revenue primarily consists of expenses related to supporting and hosting the Company’s product offerings and delivering professional services. These costs include salaries, benefits, incentive compensation and share-based compensation expense related to the management of the Company’s data centers, customer support team and the Company’s professional services team. In addition to these costs, the Company incurs third-party service provider costs such as data center and networking expenses, allocated overhead, amortization of capitalized software and acquired intangible assets and depreciation expense.
Concentration of Credit Risk and Off-Balance Sheet Risk
The Company has no off-balance sheet risk, such as foreign exchange contracts, option contracts, or other foreign hedging arrangements. Financial instruments, which potentially subject the Company to concentrations of credit risk, consist primarily of cash and cash equivalents, investments and accounts receivable. The Company maintains its cash, cash equivalents and investments with major financial institutions of high-credit quality. Although the Company deposits its cash with multiple financial institutions, its deposits, at times, may exceed federally insured limits.
Credit risk with respect to accounts receivable is dispersed due to the Company’s large number of customers. The Company’s accounts receivable are derived from revenue earned from customers primarily located in the United States, the United Kingdom, and South Africa. The Company generally does not require its customers to provide collateral or other security to support accounts receivable. The Company maintains an allowance for its doubtful accounts receivable due to estimated credit losses. Credit losses historically have not been significant and the Company generally has not experienced any material losses related to receivables from individual customers, or groups of customers. Due to these factors, no additional credit risk beyond amounts provided for collection losses is believed by management to be probable in the Company’s accounts receivable. The Company will continue to actively monitor the impact of the global COVID-19 pandemic on expected credit losses. As of March 31, 2021 and 2020,
The Company diversifies its investment portfolio by investing in multiple types of investment-grade securities and attempts to mitigate a risk of loss by using a third-party investment manager. As of March 31, 2021 and 2020, the Company did
Allowance for Doubtful Accounts
The Company maintains an allowance for its doubtful accounts receivable due to estimated credit losses. The Company makes judgments as to its ability to collect outstanding receivables and provide allowances for the portion of receivables when a loss is reasonably expected to occur. The Company estimates credit losses at the reporting date resulting from the inability of its customers to
78
make required payments, including its historical experience of actual losses and the aging of such receivables. These receivables have been pooled by shared risk characteristics. Based on known information the Company may also establish specific allowances for customers in an adverse financial condition or adjust its expectations of changes in conditions that may impact the collectability of outstanding receivables.
The Company considers current economic trends when evaluating the adequacy of the allowance for doubtful accounts. If circumstances relating to specific customers change or unanticipated changes occur in the general business environment, the Company’s estimates of the recoverability of receivables could be further adjusted. For the years ended March 31, 2021, 2020 and 2019, credit loss expense was $
Property and Equipment
Property and equipment are stated at cost and are depreciated using the straight-line method over the estimated useful life of the assets. Leasehold improvements are amortized over the shorter of the lease term or the estimated useful life of the related asset. Property and equipment acquired under finance leases is amortized over the lease term or, in circumstances where ownership is transferred by the end of the lease or there is a bargain purchase option, over the useful life that would be assigned if the asset were owned. Upon retirement or sale, the cost of assets disposed of, and the related accumulated depreciation, are removed from the accounts, and any resulting gain or loss is included in the determination of net loss in the period of retirement or sale.
|
|
|
Estimated Useful Life |
|
Computer equipment |
|
3 to 5 |
|
Leasehold improvements |
|
|
|
Furniture and fixtures |
|
|
|
Office equipment |
|
|
Expenditures for maintenance and repairs are charged to expense as incurred, whereas major betterments are capitalized as additions to property and equipment.
Business Combinations
In accordance with ASC 805, Business Combinations (ASC 805), the Company recognizes the tangible and intangible assets acquired and liabilities assumed based on their estimated fair values. Determining these fair values requires management to make significant estimates and assumptions, especially with respect to intangible assets.
The Company recognizes identifiable assets acquired and liabilities assumed at their acquisition date fair value. Goodwill as of the acquisition date is measured as the excess of consideration transferred over the net of the acquisition date fair value of the assets acquired and the liabilities assumed and represents the expected future economic benefits arising from other assets acquired that are not individually identified and separately recognized. While the Company uses its best estimates and assumptions as part of the purchase price allocation process to accurately value assets acquired and liabilities assumed at the acquisition date, its estimates are inherently uncertain and subject to refinement. Assumptions may be incomplete or inaccurate, and unanticipated events or circumstances may occur, which may affect the accuracy or validity of such assumptions, estimates or actual results. As a result, during the measurement period, which may be up to one year from the acquisition date, the Company records adjustments to the assets acquired and liabilities assumed with the corresponding offset to goodwill to the extent that it identifies adjustments to the preliminary purchase price allocation. Upon the conclusion of the measurement period or final determination of the values of assets acquired or liabilities assumed, whichever comes first, any subsequent adjustments are recorded to the consolidated statements of operations.
Goodwill and acquired intangible assets
Goodwill is not amortized, but is evaluated for impairment annually, or whenever events or changes in circumstances indicate that the carrying value may not be recoverable. The Company has determined that there is a single reporting unit for the purpose of conducting this goodwill impairment assessment. For purposes of assessing potential impairment, the Company estimates the fair value of the reporting unit, based on the Company’s market capitalization, and compares this amount to the carrying value of the reporting unit. If the Company determines that the carrying value of the reporting unit exceeds its fair value, an impairment charge would be required. The annual goodwill impairment test is performed as of
79
Intangible assets acquired in a business combination are recorded at their estimated fair values at the date of acquisition. The Company amortizes acquired definite-lived intangible assets over their estimated useful lives based on the pattern of consumption of the economic benefits or, if that pattern cannot be readily determined, on a straight-line basis.
Impairment of Long-Lived Assets
The Company reviews long-lived assets, including property and equipment, right-of-use assets, and definite-lived intangible assets, for impairment whenever events or changes in circumstances indicate that the carrying value of an asset may not be recoverable. During this review, the Company re-evaluates the significant assumptions used in determining the original cost and estimated lives of long-lived assets. Although the assumptions may vary from asset to asset, they generally include operating results, changes in the use of the asset, cash flows, and other indicators of value. Management then determines whether the remaining useful life continues to be appropriate, or whether there has been an impairment of long-lived assets based primarily upon whether expected future undiscounted cash flows are sufficient to support the recoverability of these assets. Recoverability of these assets is measured by comparison of the carrying amount of the asset to the future undiscounted cash flows the asset is expected to generate. If the asset is considered to be impaired, the amount of any impairment is measured as the difference between the carrying value and the fair value of the impaired asset.
For the years ended March 31, 2021, 2020 and 2019, the Company did
Fair Value Measurements
ASC 820, Fair Value Measurements and Disclosures (ASC 820), establishes a three-level valuation hierarchy for instruments measured at fair value that distinguishes between assumptions based on market data (observable inputs) and the Company’s own assumptions (unobservable inputs). Observable inputs are inputs that market participants would use in pricing the asset or liability based on market data obtained from sources independent of the Company. Unobservable inputs are inputs that reflect the Company’s assumptions about the inputs that market participants would use in pricing the asset or liability and are developed based on the best information available in the circumstances.
ASC 820 identifies fair value as the exchange price, or exit price, representing the amount that would be received to sell an asset or paid to transfer a liability in an orderly transaction between market participants based on the highest and best use of the asset or liability. As such, fair value is a market-based measurement that should be determined based on assumptions that market participants would use in pricing an asset or liability. The Company uses valuation techniques to measure fair value that maximize the use of observable inputs and minimize the use of unobservable inputs. These inputs are prioritized as follows:
|
|
• |
Level 1 inputs—Unadjusted observable quoted prices in active markets for identical assets or liabilities that the reporting entity has the ability to access at the measurement date. |
|
|
• |
Level 2 inputs—Inputs other than quoted prices included in Level 1 that are observable for the asset or liability, either directly or indirectly. |
|
|
• |
Level 3 inputs—Unobservable inputs for determining the fair values of assets or liabilities that reflect an entity’s own assumptions about the assumptions that market participants would use in pricing the assets or liabilities. |
To the extent that the valuation is based on models or inputs that are less observable or unobservable in the market, the determination of fair value requires more judgment. Accordingly, the degree of judgment exercised by the Company in determining fair value is greatest for instruments categorized in Level 3. A financial instrument’s level within the fair value hierarchy is based on the lowest level of any input that is significant to the fair value measurement.
The Company evaluates assets and liabilities subject to fair value measurements on a recurring and nonrecurring basis to determine the appropriate level to classify them for each reporting period.
The Company measures eligible assets and liabilities at fair value, with changes in value recognized in earnings. Fair value treatment may be elected either upon initial recognition of an eligible asset or liability or, for an existing asset or liability, if an event triggers a new basis of accounting. The Company did not elect to remeasure any of its existing financial assets or liabilities and did not elect the fair value option for any financial assets and liabilities transacted in the years ended March 31, 2021, 2020 and 2019.
Software Development Costs
Costs incurred to develop software applications used in the Company’s SaaS platform consist of certain direct costs of materials and services incurred in developing or obtaining internal-use computer software, and payroll and payroll-related costs for employees
80
who are directly associated with, and who devote time to, the project. These costs generally consist of internal labor during configuration, coding, and testing activities. Research and development costs incurred during the preliminary project stage or costs incurred for data conversion activities, training, maintenance and general and administrative or overhead costs are expensed as incurred. Once an application has reached the development stage, internal and external costs, if direct and incremental, are capitalized until the application is substantially complete and ready for its intended use. Qualified costs incurred during the operating stage of the Company’s software applications relating to upgrades and enhancements are capitalized to the extent it is probable that they will result in added functionality, while costs incurred for maintenance of, and minor upgrades and enhancements to, internal-use software are expensed as incurred. During the years ended March 31, 2021, 2020 and 2019, the Company believes the substantial majority of its development efforts were either in the preliminary project stage of development or in the operation stage (post-implementation), and accordingly,
Capitalized software and Cloud-computing Arrangements (CCA)
The Company accounts for acquired internal-use software licenses and certain costs related to video content production related to its awareness training offering within the scope of ASC 350-40, Intangibles – Goodwill and Other – Internal-Use Software (ASC 350-40) as intangible assets (Capitalized Software). Acquired internal-use software licenses are amortized over the term of the arrangement to the line item within the consolidated statements of operations that reflects the nature of the license. Video production costs are amortized to cost of revenue over their expected useful life of
Additionally, the Company evaluates its accounting for fees paid in a CCA to determine whether the CCA includes a license to internal-use software. If the CCA includes a software license, the Company accounts for the software license as an intangible asset. Acquired software licenses are recognized and measured at cost, which includes the present value of the license obligation if the license is to be paid for over time. If the CCA does not include a software license, the Company accounts for the arrangement as a service contract (hosting arrangement) and hosting costs are generally expensed as incurred.
Since the adoption of ASU 2018-15, Intangibles – Goodwill and Other – Internal-Use Software (Subtopic 350-24): Customer’s Accounting for Implementation Costs Incurred in a Cloud Computing Arrangement that is a Service Contract (ASU 2018-15), on July 1, 2018, the Company evaluates upfront costs including implementation, set-up or other costs (collectively, implementation costs) for hosting arrangements under the internal-use software framework. Costs related to preliminary project activities and post implementation activities are expensed as incurred, whereas costs incurred in the development stage are generally capitalized. Capitalized implementation costs are amortized on a straight-line basis over the expected term of the hosting arrangement, which includes consideration of the non-cancellable contractual term and reasonably certain renewals. As of March 31, 2021 and 2020, the net carrying value of capitalized implementation costs related to hosting arrangements that were incurred during the application development stage were $
Foreign Currency Translation
The reporting currency of the Company is the U.S. dollar. The Company determines the functional currency for its non-U.S. subsidiaries by reviewing the currencies in which its respective operating activities occur. The functional currency of the Company’s non-U.S. subsidiaries is generally the local currency of each subsidiary. All assets and liabilities in the balance sheets of entities whose functional currency is a currency other than the U.S. dollar are translated into U.S. dollar equivalents at exchange rates as follows: (i) asset and liability accounts at period-end rates, (ii) income statement accounts at weighted-average exchange rates for the period, and (iii) shareholders’ equity accounts at historical exchange rates. Foreign exchange transaction gains and losses are included in foreign exchange income (expense) and other, net in the accompanying consolidated statements of operations. The effects of foreign currency translation adjustments are included as a component of accumulated other comprehensive income (loss) in the accompanying consolidated balance sheets.
Net Income (Loss) Per Ordinary Share
The Company calculates basic and diluted net income (loss) per ordinary share by dividing net income (loss) by the weighted-average number of ordinary shares outstanding during the period. For periods that net losses are incurred, the Company has excluded other potentially dilutive shares, which include share options outstanding, unvested restricted share units (RSUs) and estimated employee share purchase plan (ESPP) shares, from the weighted-average number of ordinary shares outstanding as their inclusion in the computation would be anti-dilutive due to net losses incurred.
81
The following table presents the calculation of basic and diluted net income (loss) per share for the periods presented (in thousands, except per share data):
|
|
|
Year Ended March 31, |
|
|||||||||
|
|
|
2021 |
|
|
2020 |
|
|
2019 |
|
|||
|
Numerator: |
|
|
|
|
|
|
|
|
|
|
|
|
|
Net income (loss) |
|
$ |
|
|
|
$ |
( |
) |
|
$ |
( |
) |
|
Denominator: |
|
|
|
|
|
|
|
|
|
|
|
|
|
Weighted-average number of ordinary shares used in computing net income (loss) per share applicable to ordinary shareholders – basic |
|
|
|
|
|
|
|
|
|
|
|
|
|
Dilutive effect of share equivalents resulting from share options, RSUs and ESPP shares |
|
|
|
|
|
|
— |
|
|
|
— |
|
|
Weighted average number of ordinary shares used in computing net income (loss) per share – diluted |
|
|
|
|
|
|
|
|
|
|
|
|
|
Net income (loss) per share applicable to ordinary shareholders: |
|
|
|
|
|
|
|
|
|
|
|
|
|
Basic |
|
$ |
|
|
|
$ |
( |
) |
|
$ |
( |
) |
|
Diluted |
|
$ |
|
|
|
$ |
( |
) |
|
$ |
( |
) |
The following potentially dilutive ordinary share equivalents have been excluded from the calculation of diluted weighted-average shares outstanding as their effect would have been anti-dilutive for the periods presented (in thousands):
|
|
|
Year Ended March 31, |
|
|||||||||
|
|
|
2021 |
|
|
2020 |
|
|
2019 |
|
|||
|
Share options outstanding |
|
|
|
|
|
|
|
|
|
|
|
|
|
Unvested RSUs |
|
|
|
|
|
|
|
|
|
|
|
|
|
ESPP Shares |
|
|
|
|
|
|
|
|
|
|
|
|
Advertising and Promotion Costs
Expenses related to advertising and promotion of solutions is charged to sales and marketing expense as incurred. The Company incurred advertising expenses of $
Income Taxes
The Company is subject to income tax in the United Kingdom, the United States and other international jurisdictions, and uses estimates in determining its provision for income taxes. The Company accounts for income taxes in accordance with ASC 740, Income Taxes (ASC 740). ASC 740 is an asset and liability approach that requires recognition of deferred tax assets and liabilities for the expected future tax consequences attributable to differences between the carrying amounts of assets and liabilities for financial reporting purposes and their respective tax basis, and for net operating loss and tax credit carryforwards. ASC 740 requires a valuation allowance against net deferred tax assets if, based upon the available evidence, it is more likely than not that some or all of the deferred tax assets will not be realized. In making such determination, the Company considers all available positive and negative evidence, including future reversals of existing taxable temporary differences, projected future taxable income, tax planning strategies and recent financial operations. Realization of deferred tax assets is dependent upon future earnings, if any, the timing and amount of which are uncertain. Accordingly, the net deferred tax assets have been fully offset by a valuation allowance.
The Company recognizes the tax benefit from an uncertain tax position only if it is more likely than not the tax position will be sustained on examination by the tax authorities, based on the technical merits of the position. The tax benefits recognized in the consolidated financial statements from such position are then measured based on the largest benefit that has a greater than 50% likelihood of being realized upon settlement. As of March 31, 2021 and 2020, the Company did
Share-Based Compensation
The Company accounts for share-based compensation awards in accordance with the provisions of ASC 718, Compensation—Stock Compensation, which requires the recognition of expense related to the fair value of share-based compensation awards in the
82
statements of operations. For service-based awards, the Company recognizes share-based compensation expense on a straight-line basis over the requisite service period of the award with actual forfeitures recognized as they occur.
See Note 13 for further description of the Company’s share-based compensation plans and a summary of the share-based award activity for the year ended March 31, 2021.
Share Options
The Company estimates the fair value of employee share options on the date of grant using the Black-Scholes option-pricing model, which requires the use of highly subjective estimates and assumptions. The Company estimates the expected term of share options for service-based awards utilizing the “Simplified Method,” as it does not have sufficient historical share option exercise information on which to base its estimate. The Simplified Method is based on the average of the vesting tranches and the contractual life of each grant. The risk-free interest rate is based on a treasury instrument whose term is consistent with the expected life of the share option. Since there was no public market for the Company’s ordinary shares prior to the Company’s initial public offering and as its ordinary shares have been publicly traded for a limited time, the Company determined the expected volatility for options granted based on an analysis of reported data for a peer group of companies that issue options with substantially similar terms. The expected volatility of options granted has been determined using an average of the historical volatility measures of this peer group of companies and the Company’s historical volatility. The Company uses an expected dividend rate of
The fair value of each share option issued under the 2015 Plan was estimated using the Black-Scholes option-pricing model that used the following weighted-average assumptions:
|
|
|
Year ended March 31, |
|
|||||||||
|
|
|
2021 |
|
|
2020 |
|
|
2019 |
|
|||
|
Expected term (in years) |
|
|
|
|
|
|
|
|
|
|
|
|
|
Risk-free interest rate |
|
|
|
% |
|
|
|
% |
|
|
|
% |
|
Expected volatility |
|
|
|
% |
|
|
|
% |
|
|
|
% |
|
Expected dividend yield |
|
|
— |
% |
|
|
— |
% |
|
|
— |
% |
|
Grant date fair value per ordinary share |
|
$ |
|
|
|
$ |
|
|
|
$ |
|
|
The weighted-average per share fair value of share options granted to employees during the years ended March 31, 2021, 2020 and 2019 was $
Employee Share Purchase Plan
The Company estimates the fair value of its ESPP share options on the date of grant using the Black-Scholes option-pricing model, which requires the use of highly subjective estimates and assumptions. The Company estimates the expected term of ESPP share options based on the length of each offering period, which is six months. The risk-free interest rate is based on a treasury instrument whose term is consistent with the expected life of the ESPP share option. Expected volatility is based on an average of the historical volatility measures of the peer group of companies noted above and the Company’s historical volatility. The Company uses an expected dividend rate of
The fair value of each ESPP option grant was estimated using the Black-Scholes option-pricing model that used the following weighted-average assumptions:
|
|
|
Year ended March 31, |
|
|||||||||
|
|
|
2021 |
|
|
2020 |
|
|
2019 |
|
|||
|
Expected term (in years) |
|
|
|
|
|
|
|
|
|
|
|
|
|
Risk-free interest rate |
|
|
|
% |
|
|
|
% |
|
|
|
% |
|
Expected volatility |
|
|
|
% |
|
|
|
% |
|
|
|
% |
|
Expected dividend yield |
|
|
— |
% |
|
|
— |
% |
|
|
— |
% |
|
Grant date fair value per ordinary share |
|
$ |
|
|
|
$ |
|
|
|
$ |
|
|
The weighted-average per share fair value of ESPP share options granted to employees during the years ended March 31, 2021, 2020 and 2019, was $
83
RSUs
For RSUs issued under the Company’s share-based compensation plans, the fair value of each grant is calculated based on the closing market value of its ordinary shares on the date of grant.
Leases
In accordance with ASU 2016-02, effective April 1, 2019, the Company classifies leases at the lease commencement date. At the commencement date, the Company will recognize a right-of-use asset (ROUA) and a lease liability on the balance sheet for all leases with the exception of facilities leases with a lease term of 12 months or less. A contract is or contains a lease if the contract conveys the right to control the use of an identified asset for a period of time in exchange for consideration.
The Company has elected to account for lease and non-lease components as a single lease component.
Lease liabilities and their corresponding ROUAs are recorded based on the present value of lease payments over the expected lease term. The implicit rate within the Company’s leases are generally not determinable and therefore the Company uses the incremental borrowing rate at the lease commencement date to determine the present value of lease payments. The Company determines its incremental borrowing rate for each lease based on the rate of interest that the Company would have to pay to borrow an amount equal to the lease payments on a collateralized basis over a similar term. Certain of the Company’s leases include options to extend or terminate the lease. An option to extend the lease is considered in connection with determining the ROUA and lease liability when it is reasonably certain the Company will exercise that option. An option to terminate is considered unless it is reasonably certain the Company will not exercise the option.
Refer to Note 9 for further information.
Comprehensive Income (Loss)
Comprehensive income (loss) is defined as the change in equity of a business enterprise during a period from transactions, other events, and circumstances from non-owner sources. Comprehensive income (loss) consists of net income (loss) and other comprehensive income (loss), which includes certain changes in equity that are excluded from net income (loss). As of March 31, 2021 and 2020, accumulated other comprehensive income (loss) is presented separately on the consolidated balance sheets and consists of cumulative foreign currency translation adjustments.
Recently Issued and Adopted Accounting Pronouncements
From time to time, new accounting pronouncements are issued by the FASB or other standard setting bodies and adopted by the Company as of the specified effective date.
Recently Adopted Accounting Pronouncements
On
On
On
84
3. Revenue and Deferred Revenue
Revenue recognized during the years ended March 31, 2021 and 2020 from amounts included in deferred revenue at the beginning of the period was approximately $
4. Balance Sheet Components
Prepaid expenses and other current assets consisted of the following:
|
|
|
As of March 31, |
|
|||||
|
|
|
2021 |
|
|
2020 |
|
||
|
Prepaid expenses |
|
$ |
|
|
|
$ |
|
|
|
Research and development investment tax credits |
|
|
|
|
|
|
|
|
|
Other current assets |
|
|
|
|
|
|
|
|
|
Total prepaid expenses and other current assets |
|
$ |
|
|
|
$ |
|
|
Property and equipment, net, consisted of the following:
|
|
|
As of March 31, |
|
|||||
|
|
|
2021 |
|
|
2020 |
|
||
|
Computer equipment (1) |
|
$ |
|
|
|
$ |
|
|
|
Leasehold improvements |
|
|
|
|
|
|
|
|
|
Furniture and fixtures |
|
|
|
|
|
|
|
|
|
Office equipment |
|
|
|
|
|
|
|
|
|
|
|
|
|
|
|
|
|
|
|
Less: Accumulated depreciation and amortization (1) |
|
|
( |
) |
|
|
( |
) |
|
Property and equipment, net |
|
$ |
|
|
|
$ |
|
|
|
(1) |
Includes property and equipment acquired under finance leases: |
|
|
|
As of March 31, |
|
|||||
|
|
|
2021 |
|
|
2020 |
|
||
|
Computer equipment |
|
$ |
|
|
|
$ |
|
|
|
Less: Accumulated amortization |
|
|
( |
) |
|
|
( |
) |
|
|
|
$ |
|
|
|
$ |
|
|
Depreciation and amortization expense was $
Accrued expenses and other current liabilities consisted of the following:
|
|
|
As of March 31, |
|
|||||
|
|
|
2021 |
|
|
2020 |
|
||
|
Accrued payroll and related benefits |
|
$ |
|
|
|
$ |
|
|
|
Accrued taxes payable |
|
|
|
|
|
|
|
|
|
Restructuring liability |
|
|
|
|
|
|
— |
|
|
Other accrued expenses |
|
|
|
|
|
|
|
|
|
Total accrued expenses and other current liabilities |
|
$ |
|
|
|
$ |
|
|
85
5. Restructuring
Fiscal 2021 Restructuring
On January 28, 2021, the Board of Directors of the Company approved a restructuring plan designed to align the Company’s resources with its strategy. The restructuring plan, which included a reduction of the Company’s workforce by approximately
The following is a rollforward of the Company’s restructuring liability balance:
|
|
|
Severance and related costs |
|
|
|
Balance as of March 31, 2020 |
|
$ |
— |
|
|
Restructuring charges |
|
|
|
|
|
Cash payments |
|
|
( |
) |
|
Other adjustments |
|
|
( |
) |
|
Balance as of March 31, 2021 |
|
$ |
|
|
6. Acquisitions
The following acquisitions have been accounted for as business combinations in accordance with ASC 805. The Company has recorded the assets acquired and liabilities assumed at their respective fair values as of the acquisition dates.
Fiscal 2021 Acquisition
eTorch Inc.
On
The preliminary purchase price allocation primarily consisted of $
The significant intangible assets identified in the preliminary purchase price allocation discussed above include developed technology and customer relationships, which are amortized over their respective useful lives on a straight-line basis when the pattern in which their economic benefits will be consumed cannot be reliably determined. To value the developed technology asset, the Company utilized the income approach, specifically a discounted cash-flow method known as the multi-period excess earnings method. Customer relationships represent the underlying relationships with certain customers to provide ongoing services for products sold. The Company utilized the income approach, specifically the distributor method, a subset of the excess-earnings method to value the customer relationships. The significant assumptions used to estimate the value of the intangible assets included the discount rate, revenue growth rates, and technology migration curves.
The Company has not presented pro forma results of operations for the MessageControl acquisition because it is not material to the Company's condensed consolidated results of operations, financial position, or cash flows.
86
Fiscal 2020 Acquisitions
Segasec Labs Ltd.
On
Prior to the closing of the acquisition, the Company held an ownership interest of approximately
The purchase price allocation primarily consisted of $
The Company has not presented pro forma results of operations for the Segasec acquisition because it is not material to the Company's consolidated results of operations, financial position, or cash flows.
DMARC Analyzer B.V.
On
The purchase price allocation primarily consisted of $
The Company has not presented pro forma results of operations for the DMARC Analyzer acquisition because it is not material to the Company's consolidated results of operations, financial position, or cash flows.
Fiscal 2019 Acquisitions
Solebit LABS Ltd.
On
The total purchase price of $
|
Purchase consideration: |
|
|
|
|
|
Total cash paid, net of acquired cash |
|
$ |
|
|
|
Cash and cash equivalents acquired |
|
|
|
|
|
Fair value of previously held asset |
|
|
|
|
|
Total purchase price consideration |
|
$ |
|
|
87
|
Fair value of assets acquired and liabilities assumed: |
|
|
|
|
|
Cash and cash equivalents |
|
$ |
|
|
|
Prepaid expenses and other current assets |
|
|
|
|
|
Intangible assets |
|
|
|
|
|
Goodwill |
|
|
|
|
|
Total assets acquired |
|
|
|
|
|
Accounts payable |
|
|
( |
) |
|
Accrued expenses and other current liabilities |
|
|
( |
) |
|
Deferred revenue |
|
|
( |
) |
|
Other non-current liabilities |
|
|
( |
) |
|
Total fair value of assets acquired and liabilities assumed |
|
$ |
|
|
The fair value of the assets acquired and liabilities assumed reflected in the tables above is less than the purchase price, resulting in the recognition of goodwill. The goodwill is not deductible for tax purposes and reflects the value of the synergies the Company expects to realize and the assembled workforce.
The following table presents the estimated fair values and useful lives of the identifiable intangible assets acquired:
|
|
|
Amount |
|
|
Estimated Useful Life (in years) |
|
||
|
Developed technology |
|
$ |
|
|
|
|
|
|
|
Customer relationships |
|
|
|
|
|
|
|
|
|
Trade names |
|
|
|
|
|
|
|
|
|
Total identifiable intangible assets |
|
$ |
|
|
|
|
|
|
Pro Forma Financial Information (unaudited)
The following unaudited pro forma information presents the combined results of operations of the Company and Solebit for the years ended March 31, 2019 and 2018 as if the acquisition of Solebit had been completed on April 1, 2017. These pro forma financial results have been prepared for comparative purposes only and include certain adjustments that reflect pro forma results of operations such as fair value adjustments (step-downs) for deferred revenue, increased amortization for the fair value of acquired intangible assets and adjustments to eliminate transaction costs incurred by the Company and Solebit.
The unaudited pro forma results do not reflect any operating efficiencies or potential cost savings which may result from the consolidation of the operations of the Company and Solebit.
|
|
|
Year ended March 31, |
|
|
|
|
|
2019 |
|
|
|
Revenue |
|
$ |
|
|
|
Net loss |
|
|
( |
) |
|
Basic and diluted net loss per share |
|
$ |
( |
) |
|
Weighted average number of ordinary shares outstanding |
|
|
|
|
|
Basic and diluted |
|
|
|
|
88
ATAATA, Inc.
On
The purchase price allocation primarily consisted of $
The Company has not presented pro forma results of operations for the Ataata acquisition because it is not material to the Company's consolidated results of operations, financial position, or cash flows.
Simply Migrate Ltd.
On
The purchase price allocation primarily consisted of $
The Company has not presented pro forma results of operations for the Simply Migrate acquisition because it is not material to the Company's consolidated results of operations, financial position, or cash flows.
7. Goodwill and Intangible Assets
The following is a rollforward of the Company’s goodwill balance for each of the periods presented:
|
|
|
Year ended March 31, |
|
|||||
|
|
|
2021 |
|
|
2020 |
|
||
|
Beginning balance |
|
$ |
|
|
|
$ |
|
|
|
Goodwill acquired |
|
|
|
|
|
|
|
|
|
Effect of foreign exchange rates |
|
|
|
|
|
|
|
|
|
Ending balance |
|
$ |
|
|
|
$ |
|
|
Purchased intangible assets consisted of the following:
|
|
|
Weighted- |
|
|
|
|
|
|
|
|
|
|
|
|
|
|
|
|
|
Average |
|
|
March 31, 2021 |
|
||||||||||
|
|
|
Remaining |
|
|
Gross |
|
|
|
|
|
|
Net |
|
|||
|
|
|
Useful Life |
|
|
Carrying |
|
|
Accumulated |
|
|
Carrying |
|
||||
|
|
|
(in years) |
|
|
Value |
|
|
Amortization |
|
|
Value |
|
||||
|
Developed technology |
|
|
|
|
|
$ |
|
|
|
$ |
( |
) |
|
$ |
|
|
|
Customer relationships |
|
|
|
|
|
|
|
|
|
|
( |
) |
|
|
|
|
|
Capitalized software and other (1) (2) |
|
|
|
|
|
|
|
|
|
|
( |
) |
|
|
|
|
|
|
|
|
|
|
|
$ |
|
|
|
$ |
( |
) |
|
$ |
|
|
89
|
|
|
Weighted- |
|
|
|
|
|
|
|
|
|
|
|
|
|
|
|
|
|
Average |
|
|
March 31, 2020 |
|
||||||||||
|
|
|
Remaining |
|
|
Gross |
|
|
|
|
|
|
Net |
|
|||
|
|
|
Useful Life |
|
|
Carrying |
|
|
Accumulated |
|
|
Carrying |
|
||||
|
|
|
(in years) |
|
|
Value |
|
|
Amortization |
|
|
Value |
|
||||
|
Developed technology |
|
|
|
|
|
$ |
|
|
|
$ |
( |
) |
|
$ |
|
|
|
Customer relationships |
|
|
|
|
|
|
|
|
|
|
( |
) |
|
|
|
|
|
Trade names |
|
N/A |
|
|
|
|
|
|
|
( |
) |
|
|
— |
|
|
|
Capitalized software and other (1) (2) |
|
|
|
|
|
|
|
|
|
|
( |
) |
|
|
|
|
|
|
|
|
|
|
|
$ |
|
|
|
$ |
( |
) |
|
$ |
|
|
|
(1) |
As of March 31, 2021 and 2020, the net carrying value of capitalized software and other includes $ |
|
(2) |
As of March 31, 2021 and 2020, the net carrying value of capitalized software and other includes $ |
The Company recorded amortization expense of $
Future estimated amortization expense of intangible assets as of March 31, 2021 was as follows:
|
|
|
Purchased |
|
|
|
|
|
|
|
|
|
Intangible |
|
|
Capitalized |
|
||
|
|
|
Assets |
|
|
Software |
|
||
|
2022 |
|
$ |
|
|
|
$ |
|
|
|
2023 |
|
|
|
|
|
|
|
|
|
2024 |
|
|
|
|
|
|
|
|
|
2025 |
|
|
|
|
|
|
|
|
|
2026 |
|
|
|
|
|
|
|
|
|
Thereafter |
|
|
|
|
|
|
|
|
|
Total |
|
$ |
|
|
|
$ |
|
|
8. Fair Value Measurement
The Company’s financial instruments include cash, cash equivalents, investments, accounts receivable, accounts payable, accrued expenses and borrowings under the Company’s long-term debt arrangements. The carrying amount of the Company’s long-term debt arrangements approximates its fair values due to the interest rates the Company believes it could obtain for arrangements with similar terms. The carrying amount of the remainder of the Company’s financial instruments approximated their fair values as of March 31, 2021 and 2020, due to the short-term nature of those instruments (see Note 2).
Strategic investments consist of non-controlling equity investments in privately held companies. As of March 31, 2021 and 2020, the Company did not hold any strategic investments. During the year ended March 31, 2020, the Company held strategic investments of $
The Company has evaluated the estimated fair value of financial instruments using available market information. The use of different market assumptions and/or estimation methodologies could have a significant effect on the estimated fair value amounts.
Fair values determined using “Level 1 inputs” utilize unadjusted quoted prices in active markets for identical assets or liabilities that the Company has the ability to access. Fair values determined using "Level 2 inputs" utilize quoted prices that are directly or indirectly observable. Fair values determined using “Level 3 inputs” utilize unobservable inputs for determining fair values of assets or liabilities that reflect an entity's own assumptions in pricing assets or liabilities. As of March 31, 2021 and 2020, the Company did
90
The following table summarizes financial assets measured and recorded at fair value on a recurring basis in the accompanying consolidated balance sheets as of March 31, 2021 and 2020, segregated by the level of the valuation inputs within the fair value hierarchy utilized to measure fair value:
|
|
|
March 31, 2021 |
|
|||||||||
|
|
|
Quoted Prices in Active Markets for Identical Assets (Level 1 Inputs) |
|
|
Significant Other Observable Inputs (Level 2 Inputs) |
|
|
Total |
|
|||
|
Assets: |
|
|
|
|
|
|
|
|
|
|
|
|
|
Money market funds |
|
$ |
|
|
|
$ |
— |
|
|
$ |
|
|
|
|
|
March 31, 2020 |
|
|||||||||
|
|
|
Quoted Prices in Active Markets for Identical Assets (Level 1 Inputs) |
|
|
Significant Other Observable Inputs (Level 2 Inputs) |
|
|
Total |
|
|||
|
Assets: |
|
|
|
|
|
|
|
|
|
|
|
|
|
Money market funds |
|
$ |
|
|
|
$ |
— |
|
|
$ |
|
|
9. Leases
The Company has operating leases for data centers and facilities and finance leases for certain equipment. The leases have remaining lease terms of less than
The components of lease expense were as follows:
|
|
Year ended March 31, |
|
|||||
|
|
2021 |
|
|
2020 |
|
||
|
Short-term lease cost |
$ |
|
|
|
$ |
|
|
|
Variable lease cost |
|
|
|
|
|
|
|
|
Operating lease cost |
|
|
|
|
|
|
|
|
Finance lease cost: |
|
|
|
|
|
|
|
|
Amortization of lease assets |
|
|
|
|
|
|
|
|
Interest on lease liabilities |
|
|
|
|
|
|
|
|
Total finance lease cost |
$ |
|
|
|
$ |
|
|
Supplemental cash flow information related to leases was as follows:
|
|
Year ended March 31, |
|
|||||
|
|
2021 |
|
|
2020 |
|
||
|
Cash paid for amounts included in the measurement of lease liabilities: |
|
|
|
|
|
|
|
|
Operating cash outflows from operating leases |
$ |
|
|
|
$ |
|
|
|
Operating cash outflows from finance leases |
$ |
|
|
|
$ |
|
|
|
Financing cash outflows from finance leases |
$ |
|
|
|
$ |
|
|
91
Weighted-average remaining lease term and discount rate:
|
|
|
As of March 31, |
|
|
As of March 31, |
|
||
|
|
|
2021 |
|
|
2020 |
|
||
|
Weighted-average remaining lease term (in years) |
|
|
|
|
|
|
|
|
|
Operating leases |
|
|
|
|
|
|
|
|
|
Finance leases |
|
|
|
|
|
|
|
|
|
Weighted-average discount rate |
|
|
|
|
|
|
|
|
|
Operating leases |
|
|
|
% |
|
|
|
% |
|
Finance leases |
|
|
|
% |
|
|
|
% |
Maturities of lease liabilities as of March 31, 2021 were as follows:
|
Year Ending March 31, |
|
Operating Leases |
|
|
Finance Leases |
|
||
|
2022 |
|
$ |
|
|
|
$ |
|
|
|
2023 |
|
|
|
|
|
|
— |
|
|
2024 |
|
|
|
|
|
|
— |
|
|
2025 |
|
|
|
|
|
|
— |
|
|
2026 |
|
|
|
|
|
|
— |
|
|
Thereafter |
|
|
|
|
|
|
— |
|
|
Total lease payments |
|
|
|
|
|
|
|
|
|
Less: imputed interest |
|
|
( |
) |
|
|
( |
) |
|
Total lease liabilities |
|
$ |
|
|
|
$ |
|
|
As of March 31, 2021,
Rent expense related to the Company’s office facilities was $
10. Debt
In July 2018, the Company entered into that certain credit agreement (the Credit Agreement), dated as of July 23, 2018 by and among the Company, certain of the Company’s subsidiaries party thereto, as guarantors, certain financial institutions party thereto from time to time, as lenders, and JPMorgan Chase Bank, N.A., as administrative agent (the Administrative Agent). The Credit Agreement provided the Company with a $
The Company was in compliance with all covenants as of March 31, 2021 and 2020.
The Company allocated debt issuance costs for the Credit Facility on a pro-rata basis between the Term Loan and Revolving Facility. The debt issuance costs on the Term Loan are recorded as a reduction of debt and are amortized and recognized as additional interest expense over the life of the debt instrument using the effective interest method. The debt issuance costs on the Revolving Facility are recorded in other assets and are amortized and recognized as additional interest expense over the life of the Revolving Facility on a straight-line basis. As of March 31, 2021 and 2020, the balance of debt issuance costs recorded as a reduction of debt was $
All obligations under the Credit Agreement are unconditionally guaranteed by all of the Company’s material direct and indirect subsidiaries organized under the laws of the United States, the United Kingdom, the Bailiwick of Jersey, and other jurisdictions agreed to by the Company and the Administrative Agent, with certain exceptions. These guarantees are secured by substantially all of the present and future property and assets of the guarantors, with certain exclusions.
92
As of March 31, 2021 and 2020, the Company had $
|
Fiscal Year Ending March 31, |
|
Debt |
|
|
|
2022 |
|
$ |
|
|
|
2023 |
|
|
|
|
|
2024 |
|
|
|
|
|
Total minimum debt payments |
|
|
|
|
|
Less: Debt issuance costs |
|
|
( |
) |
|
Less: Current portion of long-term debt |
|
|
( |
) |
|
Long-term debt |
|
$ |
|
|
11. Related Party Transactions
Certain of the Company’s shareholders and certain companies affiliated with our directors and executive officers were also customers of the Company during the periods included in the consolidated financial statements. Revenue recognized during the years ended March 31, 2021, 2020 and 2019 and accounts receivable outstanding as of March 31, 2021 and 2020 related to these transactions were not material.
12. Shareholders’ Equity
The following ordinary shares were reserved for future issuance under the 2015 Plan, Historical Plans and ESPP (as defined below in Note 13):
|
|
|
As of March 31, |
|
|
|
|
|
2021 |
|
|
|
Options outstanding under share option plans |
|
|
|
|
|
Unvested RSUs |
|
|
|
|
|
Options and awards available for future grant under the 2015 Plan |
|
|
|
|
|
Shares reserved for issuance under ESPP |
|
|
|
|
|
Total authorized ordinary shares reserved for future issuance |
|
|
|
|
13. Share-Based Compensation
For the years ended March 31, 2021, 2020 and 2019, all grants of share-based awards have been made under the Mimecast Limited 2015 Share Option and Incentive Plan (the 2015 Plan) and the 2015 Employee Share Purchase Plan (the ESPP). Additionally, the Company has
The 2015 Plan allows the compensation committee of the board of directors to make equity-based incentive awards to the Company’s officers, employees, non-employee directors and consultants. Initially, a total of
Under the 2015 Plan, the share option price may not be less than the fair market value of the ordinary shares on the date of grant and the term of each share option may not exceed
93
Initially, a total of
The ESPP permits eligible employees to purchase shares by authorizing payroll deductions from
Share-based compensation expense recognized under the 2015 Plan, Historical Plans and ESPP in the accompanying consolidated statements of operations was as follows:
|
|
|
Year ended March 31, |
|
|||||||||
|
|
|
2021 |
|
|
2020 |
|
|
2019 |
|
|||
|
Cost of revenue |
|
$ |
|
|
|
$ |
|
|
|
$ |
|
|
|
Research and development |
|
|
|
|
|
|
|
|
|
|
|
|
|
Sales and marketing |
|
|
|
|
|
|
|
|
|
|
|
|
|
General and administrative |
|
|
|
|
|
|
|
|
|
|
|
|
|
Total share-based compensation expense |
|
$ |
|
|
|
$ |
|
|
|
$ |
|
|
In certain situations, the board of directors has approved modifications to employee share option agreements, including acceleration of vesting or the removal of exercise restrictions for share options for which the service-based vesting has been satisfied, which resulted in additional share-based compensation expense. There was no material modification expense recognized in the years ended March 31, 2021 and 2020. The total modification expense recognized in the year ended March 31, 2019 was $
Share Options
Share option activity under the 2015 Plan and Historical Plans for the year ended March 31, 2021 was as follows:
|
|
|
Number of Awards |
|
|
Weighted Average Exercise Price |
|
|
Weighted Average Remaining Contractual Term (in years) |
|
|
Aggregate Intrinsic Value |
|
||||
|
Outstanding as of March 31, 2020 |
|
|
|
|
|
$ |
|
|
|
|
|
|
|
$ |
|
|
|
Options granted |
|
|
|
|
|
$ |
|
|
|
|
|
|
|
|
|
|
|
Options exercised |
|
|
( |
) |
|
$ |
|
|
|
|
|
|
|
|
|
|
|
Options forfeited and cancelled |
|
|
( |
) |
|
$ |
|
|
|
|
|
|
|
|
|
|
|
Outstanding as of March 31, 2021 |
|
|
|
|
|
$ |
|
|
|
|
|
|
|
$ |
|
|
|
Exercisable as of March 31, 2021 |
|
|
|
|
|
$ |
|
|
|
|
|
|
|
$ |
|
|
For the years ended March 31, 2021, 2020 and 2019, the total intrinsic value of options exercised was $
As of March 31, 2021, there was approximately $
ESPP
In the years ended March 31, 2021, 2020 and 2019, the Company issued
94
RSUs
The Company grants RSUs to its non-employee directors and its employees. Non-employee directors receive an initial RSU grant upon joining the board of directors that vests over
RSU activity under the 2015 Plan for the year ended March 31, 2021 was as follows:
|
|
|
Number of Awards |
|
|
Weighted Average Grant Date Fair Value |
|
|
Intrinsic Value (in thousands) |
|
|||
|
Unvested RSUs as of March 31, 2020 |
|
|
|
|
|
$ |
|
|
|
$ |
|
|
|
RSUs granted |
|
|
|
|
|
$ |
|
|
|
|
|
|
|
RSUs vested |
|
|
( |
) |
|
$ |
|
|
|
|
|
|
|
RSUs forfeited |
|
|
( |
) |
|
$ |
|
|
|
|
|
|
|
Unvested RSUs as of March 31, 2021 |
|
|
|
|
|
$ |
|
|
|
$ |
|
|
As of March 31, 2021, there was approximately $
14. Commitments and Contingencies
Litigation
On September 10, 2019, ZapFraud, Inc. (ZapFraud), filed a complaint in the U.S. District Court for the District of Delaware against the Company’s wholly owned subsidiaries, Mimecast North America, Inc., Mimecast Services Limited and Mimecast UK Limited. The complaint alleges that certain elements of the Company’s email security technology infringe a patent held by ZapFraud. ZapFraud seeks an award for damages in an unspecified amount, attorney’s fees and injunctive relief. On November 22, 2019, the Company filed a Motion to Dismiss for Failure to State a Claim. On April 24, 2020, ZapFraud amended its complaint by alleging that the Company’s email security technology infringes an additional patent that was recently issued to ZapFraud. On May 22, 2020, the Company filed a revised Motion to Dismiss for Failure to State a Claim that responds to ZapFraud’s amended complaint. On September 18, 2020, the court held a hearing on the motion and on November 20, 2020 the magistrate judge issued a recommendation that the court grant the Company’s motion. On December 11, 2020, ZapFraud filed objections to the magistrate judge’s recommendation and the Company responded to those objections on January 4, 2021. On March 25, 2021, the court adopted the recommendation of the magistrate judge, and granted the Company’s motion to dismiss. There are no pending motions and no appeal has been filed. Regardless of the outcome, litigation can have an adverse impact on the Company because of defense and potential settlement costs, diversion of management resources and other factors.
During fiscal 2019 and 2020, the Company engaged in discussions with a non-practicing patent entity (NPE) regarding the entity’s patented technology and allegations regarding the Company’s past infringement of that technology. On September 30, 2019, the Company entered into confidential global patent license agreements with the NPE and certain of its affiliates that provided patent licenses to the Company related to the NPE’s global patent portfolio, resolved all claims of past infringement and provided mutual covenants not to sue for a certain number of years. Under the terms of the patent license agreements, the Company made an aggregate payment of $
From time to time, the Company may be involved in legal proceedings and subject to claims in the ordinary course of business. Although the results of these proceedings and claims cannot be predicted with certainty, the Company does not believe the ultimate cost to resolve these matters would individually, or taken together, have a material adverse effect on the Company’s business, operating results, cash flows or financial condition. Regardless of the outcome, such proceedings can have an adverse impact on the Company because of defense and settlement costs, diversion of resources and other factors, and there can be no assurances that favorable outcomes will be obtained.
95
Except as described above, the Company was not subject to any material legal proceedings during the years ended March 31, 2021, 2020 and 2019, and, to the best of its knowledge, except as described above, no material legal proceedings are currently pending or threatened.
Indemnification
In the ordinary course of business, the Company provides indemnifications of varying scope and terms to customers, business partners, vendors, lessors, directors, officers, employees, and other parties with respect to certain matters. Indemnification may include losses from intellectual property infringement claims made by third parties, the Company’s breach of certain agreements, and other liabilities relating to or arising from the Company’s acts or omissions. These indemnification provisions may survive termination of the underlying agreement and the maximum potential amount of future indemnification payments may not be subject to a cap. It is not possible to determine the maximum potential loss under these indemnification provisions due to the Company’s limited history of prior indemnification claims and the unique facts and circumstances involved in each particular indemnification. Based on historical experience and information known as of March 31, 2021, the Company has not incurred any costs for the above indemnities.
In certain circumstances, the Company warrants that its services will perform in all material respects in accordance with its standard published specification documentation in effect at the time of delivery of the services to the customer for the term of the agreement. To date, the Company has not incurred significant expense under its warranties and, as a result, the Company believes the estimated fair value of these agreements is immaterial.
Security Incident
In January 2021, the Company became aware of a security incident later determined to be conducted by the same sophisticated threat actor responsible for the SolarWinds supply chain attack. The Company immediately launched an internal forensic investigation. The investigation was supported by leading third-party forensics and cyber incident response experts at Mandiant, a division of FireEye, Inc., and in coordination with law enforcement to aid their investigation into this threat actor. During the investigation, the Company learned that the threat actor used the SolarWinds supply-chain compromise to gain access to part of its production grid environment. Using this entry point, the threat actor accessed certain Mimecast-issued certificates and related customer server connection information. The threat actor also accessed a subset of email addresses and other contact information, as well as encrypted and/or hashed and salted credentials. In addition, the threat actor accessed and downloaded a limited number of the Company’s source code repositories, but the Company found no evidence of any modifications to its source code nor does it believe there was any impact on its products. As the investigation progressed, the Company issued a series of advisories to affected customers, including recommended precautionary steps to mitigate risk and, in some cases, to address regulatory requirements. The forensic investigation was completed in March 2021 and the Company has eliminated the threat actor’s access to its environment. The Company has taken a number of actions to prevent future access to its environment and will continue to monitor for threats and take precautionary steps as needed.
The Company is subject to risk and significant uncertainties as a result of this security incident, including those described in Part I, Item 1A, “Risk Factors” in this Annual Report on Form 10-K. While the investigation is complete, there can be no assurance as to what the overall impact of these events will be. These types of events often have cascading impacts that unfold over time and may result in a loss of revenue, a diminution of the Company’s business prospects and incremental costs, including costs associated with litigation or investigations by regulatory authorities, any of which may adversely impact the Company’s financial results.
The Company has incurred and expects to incur significant costs related to the security incident. For the period ended March 31, 2021, the Company recorded $
15. Employee Benefit Plans
The Company maintains a defined contribution savings plan under Section 401(k) of the U.S. Internal Revenue Code of 1986 (the 401(k) Plan), covering all U.S. employees who satisfy certain eligibility requirements. The 401(k) Plan allows each participant to contribute a percentage of their eligible compensation subject to applicable annual limits pursuant to the limits established by the Internal Revenue Service. The Company’s matching contributions were $
96
The Company contributes to a defined contribution savings plan for its employees in the United Kingdom who satisfy certain eligibility requirements. The plan allows each participant to contribute a percentage of their compensation and the Company contributes an additional
Beginning in fiscal year 2020, the Company contributes to defined contribution savings plans for its employees in South Africa, Germany, and the Netherlands, who satisfy certain eligibility requirements. The plans allow each participant to contribute a percentage of their compensation and the Company contributes an additional
Beginning in fiscal year 2021, the Company contributes to a defined contribution savings plan for its employees in Canada who satisfy certain eligibility requirements. The plan allows each participant to contribute a percentage of their compensation and the Company contributes up to an additional
16. Segment and Geographic Information
Disclosure requirements about segments of an enterprise and related information establishes standards for reporting information regarding operating segments in annual financial statements and requires selected information of those segments to be presented in interim financial reports issued to shareholders. Operating segments are defined as components of an enterprise about which separate discrete financial information is available that is evaluated regularly by the chief operating decision maker, or decision-making group, in deciding how to allocate resources and in assessing performance. The Company’s chief operating decision maker is the chief executive officer. The Company and the chief executive officer view the Company’s operations and manage its business as
Geographic Data
The Company allocates, for the purpose of geographic data reporting, its revenue based upon the location of the contracting subsidiary. Total revenue by geographic area was as follows:
|
|
|
Year ended March 31, |
|
|||||||||
|
|
|
2021 |
|
|
2020 |
|
|
2019 |
|
|||
|
United States |
|
$ |
|
|
|
$ |
|
|
|
$ |
|
|
|
United Kingdom |
|
|
|
|
|
|
|
|
|
|
|
|
|
South Africa |
|
|
|
|
|
|
|
|
|
|
|
|
|
Other |
|
|
|
|
|
|
|
|
|
|
|
|
|
Total revenue |
|
$ |
|
|
|
$ |
|
|
|
$ |
|
|
Property and equipment, net by geographic location consisted of the following:
|
|
|
As of March 31, |
|
|||||
|
|
|
2021 |
|
|
2020 |
|
||
|
United States |
|
$ |
|
|
|
$ |
|
|
|
United Kingdom |
|
|
|
|
|
|
|
|
|
South Africa |
|
|
|
|
|
|
|
|
|
Other |
|
|
|
|
|
|
|
|
|
Total |
|
$ |
|
|
|
$ |
|
|
17. Income Taxes
Income (loss) before income taxes consisted of the following:
|
|
|
Year ended March 31, |
|
|||||||||
|
|
|
2021 |
|
|
2020 |
|
|
2019 |
|
|||
|
United Kingdom |
|
$ |
|
|
|
$ |
( |
) |
|
$ |
( |
) |
|
Foreign |
|
|
|
|
|
|
|
|
|
|
( |
) |
|
Income (loss) before income taxes |
|
$ |
|
|
|
$ |
|
|
|
$ |
( |
) |
97
The provision for income taxes in the accompanying consolidated financial statements is comprised of the following:
|
|
|
As of March 31, |
|
|||||||||
|
|
|
2021 |
|
|
2020 |
|
|
2019 |
|
|||
|
Current tax expense: |
|
|
|
|
|
|
|
|
|
|
|
|
|
Foreign |
|
$ |
|
|
|
$ |
|
|
|
$ |
|
|
|
Total current tax expense |
|
|
|
|
|
|
|
|
|
|
|
|
|
Deferred tax expense (benefit): |
|
|
|
|
|
|
|
|
|
|
|
|
|
Domestic |
|
|
|
|
|
|
|
|
|
|
( |
) |
|
Foreign |
|
|
( |
) |
|
|
( |
) |
|
|
( |
) |
|
Total deferred tax benefit |
|
|
( |
) |
|
|
( |
) |
|
|
( |
) |
|
Total provision for income taxes |
|
$ |
|
|
|
$ |
|
|
|
$ |
|
|
The reconciliation of the United Kingdom statutory tax rate to the Company’s effective tax rate included in the accompanying consolidated statements of operations is as follows:
|
|
|
Year ended March 31, |
|
|||||||||
|
|
|
2021 |
|
|
2020 |
|
|
2019 |
|
|||
|
Tax at statutory rate |
|
|
|
% |
|
|
|
% |
|
|
|
% |
|
U.S. state taxes, net of federal |
|
|
( |
) |
|
|
|
|
|
|
|
|
|
Foreign rate differential |
|
|
|
|
|
|
|
|
|
|
|
|
|
Meals and entertainment |
|
|
|
|
|
|
|
|
|
|
( |
) |
|
Branch income |
|
|
|
|
|
|
( |
) |
|
|
( |
) |
|
Share-based compensation |
|
|
( |
) |
|
|
( |
) |
|
|
|
|
|
Tax credits |
|
|
( |
) |
|
|
( |
) |
|
|
|
|
|
Unremitted earnings |
|
|
|
|
|
|
|
|
|
|
( |
) |
|
Change in valuation allowance |
|
|
( |
) |
|
|
( |
) |
|
|
( |
) |
|
Deferred tax true-ups |
|
|
|
|
|
|
|
|
|
|
( |
) |
|
Tax reserves |
|
|
|
|
|
|
|
|
|
|
( |
) |
|
Provision to return |
|
|
|
|
|
|
|
|
|
|
( |
) |
|
Withholding taxes |
|
|
|
|
|
|
|
|
|
|
( |
) |
|
Non-deductible expenses |
|
|
|
|
|
|
|
|
|
|
( |
) |
|
Deferred tax rate change |
|
|
( |
) |
|
|
|
|
|
|
( |
) |
|
Acquisition-related costs |
|
|
|
|
|
|
|
|
|
|
( |
) |
|
Foreign exchange |
|
|
— |
|
|
|
( |
) |
|
|
— |
|
|
Other |
|
|
— |
|
|
|
( |
) |
|
|
( |
) |
|
Effective Tax Rate |
|
|
|
% |
|
|
|
% |
|
|
( |
)% |
Although the Company’s parent entity is organized under Jersey law, our affairs are, and are intended to be, managed and controlled in the United Kingdom for tax purposes. Therefore, the Company is resident in the United Kingdom for tax purposes. The Group’s parent entity is domiciled in the United Kingdom and its earnings are subject to
98
Deferred tax assets and liabilities reflect the net tax effects of net operating loss carryovers and the temporary differences between the assets and liabilities carrying value for financial reporting and the amounts used for income tax purposes. The Company’s significant deferred tax assets (liabilities) components are as follows:
|
|
|
As of March 31, |
|
|||||
|
|
|
2021 |
|
|
2020 |
|
||
|
Deferred tax assets: |
|
|
|
|||||
|
Net operating loss carryforwards |
|
$ |
|
|
|
$ |
|
|
|
Share-based compensation |
|
|
|
|
|
|
|
|
|
Deferred revenue |
|
|
|
|
|
|
|
|
|
Fixed assets |
|
|
|
|
|
|
|
|
|
Lease liability |
|
|
|
|
|
|
|
|
|
Accrued compensation |
|
|
|
|
|
|
|
|
|
Income tax credits |
|
|
|
|
|
|
|
|
|
Other |
|
|
|
|
|
|
|
|
|
Gross deferred tax assets |
|
|
|
|
|
|
|
|
|
Deferred tax liabilities: |
|
|
|
|
|
|
|
|
|
Fixed assets |
|
|
( |
) |
|
|
( |
) |
|
Unremitted earnings |
|
|
( |
) |
|
|
( |
) |
|
Intangible assets |
|
|
( |
) |
|
|
( |
) |
|
Capitalized commissions |
|
|
( |
) |
|
|
( |
) |
|
Right-of-use asset |
|
|
( |
) |
|
|
( |
) |
|
Other |
|
|
( |
) |
|
|
( |
) |
|
Gross deferred tax liabilities |
|
|
( |
) |
|
|
( |
) |
|
Valuation allowance |
|
|
( |
) |
|
|
( |
) |
|
Deferred tax liabilities, net |
|
$ |
( |
) |
|
$ |
( |
) |
In assessing the ability to realize the Company’s net deferred tax assets, management considers various factors including taxable income in carryback years, future reversals of existing taxable temporary differences, tax planning strategies, and future taxable income projections to determine whether it is more likely than not that some portion or all of the net deferred tax assets will not be realized. Based on the negative evidence, the Company has determined that the uncertainty regarding realizing its deferred tax assets is sufficient to warrant the need for a full valuation allowance against its worldwide net deferred tax assets. The $
As of March 31, 2021, the Company had U.K. net operating loss carryforwards of approximately $
99
Under Section 382 of the U.S. Internal Revenue Code of 1986, if a corporation undergoes an ownership change, the corporation’s ability to use its pre-change net operating loss carryforwards to offset its post-change income and taxes may be limited. In general, an ownership change occurs if there is a 50 percent cumulative change in ownership of the Company over a rolling three-year period. Similar rules may apply under U.S. state tax laws. The Company believes that it has experienced an ownership change in the past and may experience ownership changes in the future resulting from future transactions in our share capital, some of which may be outside the Company’s control. The Company’s ability to utilize its net operating loss carryforwards or other tax attributes to offset U.S. federal and state taxable income in the future may be subject to future limitations. The most recent analysis of the Company’s historical ownership changes was completed through March 31, 2021. Based on the analysis, the Company does not anticipate a significant limitation on the utilization of the Company’s tax attributes.
As of March 31, 2021 and 2020, the Company had liabilities for uncertain tax positions of $
A reconciliation of the beginning and ending amount of unrecognized tax benefits is as follows:
|
|
|
Year ended March 31, |
|
|||||
|
|
|
2021 |
|
|
2020 |
|
||
|
Beginning balance |
|
$ |
|
|
|
$ |
|
|
|
Additions based on tax positions related to current year |
|
|
|
|
|
|
|
|
|
Additions for tax positions of prior years |
|
|
|
|
|
|
|
|
|
Additions (reductions) due to change in foreign exchange rate |
|
|
|
|
|
|
( |
) |
|
Expiration of statutes of limitation |
|
|
( |
) |
|
|
— |
|
|
Reductions due to tax positions of prior years |
|
|
( |
) |
|
|
— |
|
|
Ending balance |
|
$ |
|
|
|
$ |
|
|
Interest and penalty charges, if any, related to uncertain tax positions are classified as income tax expense in the accompanying consolidated statements of operations. As of March 31, 2021 and 2020, the Company had immaterial accrued interest or penalties related to uncertain tax positions.
The Company is subject to taxation in the United Kingdom and several foreign jurisdictions. As of March 31, 2021, the Company is no longer subject to examination by taxing authorities in the United Kingdom for years prior to March 31, 2019. The significant foreign jurisdictions in which the Company operates are no longer subject to examination by taxing authorities for years prior to March 31, 2017. In addition, net operating loss carryforwards in certain jurisdictions may be subject to adjustments by taxing authorities in future years when they are utilized.
The Company had approximately $
18. Subsequent Events
Share Option and RSU Grants
On April 1, 2021, the Company granted approximately
100
Item 9. Changes in and Disagreements With Accountants on Accounting and Financial Disclosure.
None.
Item 9A. Controls and Procedures.
Evaluation of Disclosure Controls and Procedures
Our management, with the participation of our principal executive officer and principal financial officer, has evaluated the effectiveness of our disclosure controls and procedures (as defined in Rules 13a-15(e) and 15d-15(e)) under the Exchange Act, as of the end of the period covered by this Annual Report on Form 10-K. Based on such evaluation, our principal executive officer and principal financial officer have concluded that as of such date, our disclosure controls and procedures were effective.
Management’s Annual Report on Internal Control Over Financial Reporting
Our management is responsible for establishing and maintaining adequate internal control over financial reporting as defined in Rule 13a-15(f) or 15d-15(f) of the Exchange Act. Internal control over financial reporting is a process designed to provide reasonable assurance regarding the reliability of financial reporting and the preparation of financial statements for external purposes in accordance with generally accepted accounting principles, and includes those policies and procedures that: (i) pertain to the maintenance of records that, in reasonable detail, accurately and fairly reflect the transactions and dispositions of our assets; (ii) provide reasonable assurance that transactions are recorded as necessary to permit preparation of financial statements in accordance with generally accepted accounting principles, and that our receipts and expenditures are being made only in accordance with authorizations of our management and directors; and (iii) provide reasonable assurance regarding prevention or timely detection of unauthorized acquisition, use or disposition of our assets that could have a material effect on our financial statements.
Because of its inherent limitations, internal control over financial reporting may not prevent or detect misstatements. Also, projections of any evaluation of effectiveness to future periods are subject to the risk that controls may become inadequate because of changes in conditions, or that the degree of compliance with the policies or procedures may deteriorate.
Our management assessed the effectiveness of our internal control over financial reporting as of March 31, 2021 using the criteria set forth by the Committee of Sponsoring Organizations of the Treadway Commission (COSO) in its Internal Control-Integrated Framework (2013). Based on this assessment and those criteria, management concluded that our internal control over financial reporting was effective as of March 31, 2021.
The effectiveness of our internal control over financial reporting as of March 31, 2021 has been audited by Ernst & Young LLP, an independent registered public accounting firm, as stated in their report which is included herein.
Changes in Internal Control Over Financial Reporting
There were no changes in our internal control over financial reporting during our most recent fiscal quarter that have materially affected, or are reasonably likely to materially affect, our internal control over financial reporting. We have not experienced any material impact to our internal controls over financial reporting despite the fact that our employees are working remotely due to the global COVID-19 pandemic. We are continually monitoring and assessing the global COVID-19 situation to determine any potential impacts on the design and operating effectiveness of our internal controls over financial reporting.
101
Report of Independent Registered Public Accounting Firm
To the Shareholders and the Board of Directors of Mimecast Limited
Opinion on Internal Control over Financial Reporting
We have audited Mimecast Limited’s internal control over financial reporting as of March 31, 2021, based on criteria established in Internal Control-Integrated Framework issued by the Committee of Sponsoring Organizations of the Treadway Commission (2013 framework), (the COSO criteria). In our opinion, Mimecast Limited (the Company) maintained, in all material respects, effective internal control over financial reporting as of March 31, 2021, based on the COSO criteria.
We also have audited, in accordance with the standards of the Public Company Accounting Oversight Board (United States) (PCAOB), the consolidated balance sheets of the Company as of March 31, 2021 and 2020, the related consolidated statements of operations, comprehensive income (loss), shareholders’ equity and cash flows for each of the three years in the period ended March 31, 2021, and the related notes and our report dated May 27, 2021 expressed an unqualified opinion thereon.
Basis for Opinion
The Company’s management is responsible for maintaining effective internal control over financial reporting and for its assessment of the effectiveness of internal control over financial reporting included in the accompanying Management’s Annual Report on Internal Control Over Financial Reporting. Our responsibility is to express an opinion on the Company’s internal control over financial reporting based on our audit. We are a public accounting firm registered with the PCAOB and are required to be independent with respect to the Company in accordance with the U.S. federal securities laws and the applicable rules and regulations of the Securities and Exchange Commission and the PCAOB.
We conducted our audit in accordance with the standards of the PCAOB. Those standards require that we plan and perform the audit to obtain reasonable assurance about whether effective internal control over financial reporting was maintained in all material respects.
Our audit included obtaining an understanding of internal control over financial reporting, assessing the risk that a material weakness exists, testing and evaluating the design and operating effectiveness of internal control based on the assessed risk, and performing such other procedures as we considered necessary in the circumstances. We believe that our audit provides a reasonable basis for our opinion.
Definition and Limitations of Internal Control Over Financial Reporting
A company’s internal control over financial reporting is a process designed to provide reasonable assurance regarding the reliability of financial reporting and the preparation of financial statements for external purposes in accordance with generally accepted accounting principles. A company’s internal control over financial reporting includes those policies and procedures that (1) pertain to the maintenance of records that, in reasonable detail, accurately and fairly reflect the transactions and dispositions of the assets of the company; (2) provide reasonable assurance that transactions are recorded as necessary to permit preparation of financial statements in accordance with generally accepted accounting principles, and that receipts and expenditures of the company are being made only in accordance with authorizations of management and directors of the company; and (3) provide reasonable assurance regarding prevention or timely detection of unauthorized acquisition, use, or disposition of the company’s assets that could have a material effect on the financial statements.
Because of its inherent limitations, internal control over financial reporting may not prevent or detect misstatements. Also, projections of any evaluation of effectiveness to future periods are subject to the risk that controls may become inadequate because of changes in conditions, or that the degree of compliance with the policies or procedures may deteriorate.
/s/ Ernst & Young LLP
Boston, Massachusetts
May 27, 2021
102
Item 9B. Other Information.
On May 25, 2021, the Compensation Committee of the Board of Directors of the Company, approved the Mimecast Limited Executive Severance and Change in Control Plan, or the Severance Plan, pursuant to which certain senior management employees, including the Company’s named executive officers other than the Company’s Chief Executive Officer, may be eligible for certain payments and benefits. The Severance Plan replaces the severance provisions in the offer letters with each eligible participant in the Severance Plan, each, an Eligible Participant. The Severance Plan was adopted following a review of the severance provisions applicable to members of the Company’s senior management team and in consultation with the Compensation Committee’s independent compensation consultant with the goal of standardizing severance payments and benefits for Eligible Participants while generally preserving existing contractual severance and equity acceleration provisions applicable to the Eligible Participants.
Pursuant to the Severance Plan, in the event that an Eligible Participant’s employment is terminated by the Company without “cause” or an Eligible Participant resigns for “good reason” (as each such term is defined in the Severance Plan) and subject to the execution and effectiveness of a separation agreement including, among other things, a general release of claims in favor of the Company and related persons and entities, Eligible Participants are eligible to receive the following severance payments and benefits:
|
|
• |
cash severance equal to the sum of (i) 75% of the Eligible Participant’s base salary and (ii) an amount equal to 75% of the Eligible Participant’s target bonus, payable in substantially equal installments in accordance with the Company’s payroll practice over nine months; and |
|
|
• |
subject to the Eligible Participant’s copayment of premium amounts at the applicable active employees’ rate and proper election to continue COBRA health coverage, continued payment of the monthly employer contribution that the Company would have paid to provide health insurance to the Eligible Participant if the Eligible Participant had remained employed until the earliest of (i) nine months following termination, (ii) the Eligible Participant’s eligibility for group medical plan benefits under any other employer’s group medical plan or (iii) the end of the Eligible Participant’s COBRA health continuation period. |
The Severance Plan also provides that, in the event of a “change in control” (as defined in the Severance Plan), 50% of the unvested portion of all share options, restricted share units and other share-based awards held by an Eligible Participant that are subject solely to time-based vesting, or Time-Based Equity Awards, shall immediately accelerate and become fully vested and exercisable or nonforfeitable as of immediately prior to the change in control. In addition, if an Eligible Participant’s employment is terminated by the Company (or its successor) without cause or an Eligible Participant resigns for good reason upon a change in control or within one year following a change in control, then all Time-Based Equity Awards shall immediately accelerate and become fully vested and exercisable or nonforfeitable as of the date of termination.
The foregoing description of the Severance Plan is summary in nature and is qualified in its entirety by the text of the Severance Plan, which is attached hereto as Exhibit 10.42, and which is incorporated herein by reference.
103
PART III
Item 10. Directors, Executive Officers and Corporate Governance.
The information required by this Item 10 will be set forth in the Definitive Proxy Statement for our 2021 Annual General Meeting of Shareholders of Mimecast Limited, or the Proxy Statement, which will be filed with the SEC pursuant to Regulation 14A not later than 120 days after March 31, 2021, and such information is incorporated into this Annual Report on Form 10-K by reference.
We have adopted a Code of Business Conduct and Ethics that applies to our principal executive officer, principal financial officer, principal accounting officer or controller, or persons performing similar functions. The text of our Code of Business Conduct and Ethics is posted under Corporate Governance in the Investor Relations section of our website, www.mimecast.com. We intend to disclose on our website any amendments to, or waivers from, our Code of Business Conduct and Ethics that are required to be disclosed pursuant to the disclosure requirements of Current Report on Form 8-K, Item 5.05.
Item 11. Executive Compensation.
The information required by this Item 11 will be set forth in the Proxy Statement and is incorporated into this Annual Report on Form 10-K by reference.
Item 12. Security Ownership of Certain Beneficial Owners and Management and Related Stockholder Matters.
The information required by this Item 12, including the information required by Item 5, “Market for Registrant’s Common Equity, Related Stockholder Matters and Issuer Purchases of Equity Securities” related to our equity plans, will be set forth in the Proxy Statement and is incorporated into this Annual Report on Form 10-K by reference.
Item 13. Certain Relationships and Related Transactions, and Director Independence.
The information required by this Item 13 will be set forth in the Proxy Statement and is incorporated into this Annual Report on Form 10-K by reference.
Item 14. Principal Accountant Fees and Services.
The information required by this Item 14 will be set forth in the Proxy Statement and is incorporated into this Annual Report on Form 10-K by reference.
104
PART IV
Item 15. Exhibits, Financial Statement Schedules.
|
(a) |
Documents Filed as Part of this Annual Report on Form 10-K |
|
|
(1) |
Financial Statements (included in Item 8 of this Annual Report on Form 10-K): |
|
|
(2) |
Financial Statement Schedules |
Financial statement schedules are omitted as they are either not required or the information is otherwise included in the consolidated financial statements.
|
|
(3) |
Exhibits |
The exhibits required by Item 601 of Regulation S-K and Item 15(b) of this Annual Report on Form 10-K are listed in the Exhibit Index on the following page.
105
EXHIBIT INDEX
|
|
|
|
|
Incorporated by Reference |
||||||
|
Exhibit Number |
|
Description |
|
Schedule/ Form |
|
File Number |
|
Exhibit Number |
|
File Date (mm/dd/yyyy) |
|
|
|
|
|
|
|
|
|
|
|
|
|
3.1 |
|
|
F-1/A |
|
333-207454 |
|
3.2 |
|
11/06/2015 |
|
|
|
|
|
|
|
|
|
|
|
|
|
|
4.1 |
|
Specimen certificate evidencing ordinary shares of the Registrant |
|
F-1/A |
|
333-207454 |
|
4.1 |
|
11/06/2015 |
|
4.2 |
|
|
10-K |
|
333-207454 |
|
4.2 |
|
05/22/2020 |
|
|
|
|
|
|
|
|
|
|
|
|
|
|
10.1# |
|
Mimecast UK 2007 Key Employee Share Option Plan and Form of Share Option Agreement |
|
F-1 |
|
333-207454 |
|
10.6 |
|
10/16/2015 |
|
|
|
|
|
|
|
|
|
|
|
|
|
10.2# |
|
|
F-1 |
|
333-207454 |
|
10.7 |
|
10/16/2015 |
|
|
|
|
|
|
|
|
|
|
|
|
|
|
10.3# |
|
Mimecast UK Approved Share Option Plan and Form of Share Option Certificate |
|
F-1 |
|
333-207454 |
|
10.8 |
|
10/16/2015 |
|
|
|
|
|
|
|
|
|
|
|
|
|
10.4# |
|
|
F-1/A |
|
333-207454 |
|
10.9 |
|
11/06/2015 |
|
|
|
|
|
|
|
|
|
|
|
|
|
|
10.5# |
|
German Sub-Plan to the Mimecast Limited 2015 Share Option and Incentive Plan |
|
10-K |
|
001-37637 |
|
10.6 |
|
05/29/2018 |
|
|
|
|
|
|
|
|
|
|
|
|
|
10.6# |
|
Form of Agreements under the Mimecast Limited 2015 Share Option and Incentive Plan |
|
10-K |
|
001-37637 |
|
10.7 |
|
05/29/2018 |
|
|
|
|
|
|
|
|
|
|
|
|
|
10.7# |
|
|
10-K |
|
001-37637 |
|
10.8 |
|
05/22/2020 |
|
|
|
|
|
|
|
|
|
|
|
|
|
|
10.8# |
|
German Sub-Plan to the Mimecast Limited 2015 Employee Share Purchase Plan |
|
10-K |
|
001-37637 |
|
10.9 |
|
05/29/2018 |
|
|
|
|
|
|
|
|
|
|
|
|
|
10.9 |
|
|
20-F |
|
001-37637 |
|
4.11 |
|
05/26/2017 |
|
|
|
|
|
|
|
|
|
|
|
|
|
|
10.10 |
|
|
10-K |
|
001-37637 |
|
10.20 |
|
05/29/2018 |
|
|
|
|
|
|
|
|
|
|
|
|
|
|
10.11# |
|
|
10-K |
|
001-37637 |
|
10.21 |
|
05/29/2018 |
|
|
|
|
|
|
|
|
|
|
|
|
|
|
10.12 |
|
|
8-K |
|
001-37637 |
|
10.1 |
|
07/24/2018 |
|
|
|
|
|
|
|
|
|
|
|
|
|
|
10.13 |
|
|
8-K |
|
001-37637 |
|
10.2 |
|
07/24/2018 |
|
106
|
|
|
|
|
Incorporated by Reference |
||||||
|
Exhibit Number |
|
Description |
|
Schedule/ Form |
|
File Number |
|
Exhibit Number |
|
File Date (mm/dd/yyyy) |
|
|
|
|
|
|
|
|
|
|
|
|
|
10.14 |
|
|
8-K |
|
001-37637 |
|
10.3 |
|
07/24/2018 |
|
|
|
|
|
|
|
|
|
|
|
|
|
|
10.15 |
|
|
8-K |
|
001-37637 |
|
10.4 |
|
07/24/2018 |
|
|
|
|
|
|
|
|
|
|
|
|
|
|
10.16 |
|
|
8-K |
|
001-37637 |
|
10.5 |
|
07/24/2018 |
|
|
|
|
|
|
|
|
|
|
|
|
|
|
10.17 |
|
|
8-K |
|
001-37637 |
|
10.6 |
|
07/24/2018 |
|
|
|
|
|
|
|
|
|
|
|
|
|
|
10.18 |
|
|
8-K |
|
001-37637 |
|
10.7 |
|
07/24/2018 |
|
|
|
|
|
|
|
|
|
|
|
|
|
|
10.19 |
|
|
8-K |
|
001-37637 |
|
10.8 |
|
07/24/2018 |
|
|
|
|
|
|
|
|
|
|
|
|
|
|
10.20 |
|
|
8-K |
|
001-37637 |
|
10.9 |
|
07/24/2018 |
|
|
|
|
|
|
|
|
|
|
|
|
|
|
10.21# |
|
Israeli Sub-Plan to the Mimecast Limited 2015 Share Option and Incentive Plan |
|
10-Q |
|
001-37637 |
|
10.39 |
|
11/08/2018 |
|
|
|
|
|
|
|
|
|
|
|
|
|
10.22# |
|
Israeli Form of Agreements under the Mimecast Limited 2015 Share Option and Incentive Plan |
|
10-Q |
|
001-37637 |
|
10.40 |
|
11/08/2018 |
|
|
|
|
|
|
|
|
|
|
|
|
|
10.23 |
|
|
10-Q |
|
001-37637 |
|
10.41 |
|
11/08/2018 |
|
|
|
|
|
|
|
|
|
|
|
|
|
|
10.24 |
|
|
10-Q |
|
001-37637 |
|
10.43 |
|
02/11/2019 |
|
|
|
|
|
|
|
|
|
|
|
|
|
|
10.25# |
|
Offer Letter between Mimecast Limited and Rafe Brown, dated February 7, 2019 |
|
8-K |
|
001-37637 |
|
10.1 |
|
02/11/2019 |
|
|
|
|
|
|
|
|
|
|
|
|
|
10.26# |
|
Offer Letter between Mimecast Limited and Christina Van Houten, dated March 7, 2018 |
|
10-K |
|
001-37637 |
|
10.38 |
|
05/29/2019 |
107
|
|
|
|
|
Incorporated by Reference |
||||||
|
Exhibit Number |
|
Description |
|
Schedule/ Form |
|
File Number |
|
Exhibit Number |
|
File Date (mm/dd/yyyy) |
|
|
|
|
|
|
|
|
|
|
|
|
|
10.27 |
|
|
10-K |
|
001-37637 |
|
10.40 |
|
05/29/2019 |
|
|
|
|
|
|
|
|
|
|
|
|
|
|
10.28 |
|
|
10-K |
|
001-37637 |
|
10.41 |
|
05/29/2019 |
|
|
|
|
|
|
|
|
|
|
|
|
|
|
10.29 |
|
|
10-K |
|
001-37637 |
|
10.42 |
|
05/29/2019 |
|
|
|
|
|
|
|
|
|
|
|
|
|
|
10.30 |
|
|
10-K |
|
001-37637 |
|
10.43 |
|
05/29/2019 |
|
|
|
|
|
|
|
|
|
|
|
|
|
|
10.31# |
|
|
10-K |
|
001-37637 |
|
10.40 |
|
05/22/2020 |
|
|
|
|
|
|
|
|
|
|
|
|
|
|
10.32# |
|
|
10-K |
|
001-37637 |
|
10.41 |
|
05/22/2020 |
|
|
|
|
|
|
|
|
|
|
|
|
|
|
10.33# |
|
|
10-K |
|
001-37637 |
|
10.42 |
|
05/22/2020 |
|
|
|
|
|
|
|
|
|
|
|
|
|
|
10.34# |
|
Offer Letter between Mimecast Limited and Dino DiMarino, dated June 23, 2016 |
|
10-K |
|
001-37637 |
|
10.44 |
|
05/22/2020 |
|
|
|
|
|
|
|
|
|
|
|
|
|
10.35# |
|
Offer Letter between Mimecast Services Limited and Heather Bentley, dated October 13, 2019 |
|
10-K |
|
001-37637 |
|
10.45 |
|
05/22/2020 |
|
|
|
|
|
|
|
|
|
|
|
|
|
10.36# |
|
Employment Contract between Mimecast Services Limited and Heather Bentley dated 25 November 2019 |
|
10-K |
|
001-37637 |
|
10.46 |
|
05/22/2020 |
|
|
|
|
|
|
|
|
|
|
|
|
|
10.37 |
|
|
10-Q |
|
001-37637 |
|
10.45 |
|
08/03/2020 |
|
|
|
|
|
|
|
|
|
|
|
|
|
|
10.38 |
|
|
8-K |
|
001-37637 |
|
10.1 |
|
10/08/2020 |
|
|
|
|
|
|
|
|
|
|
|
|
|
|
10.39 |
|
|
8-K |
|
001-37637 |
|
10.2 |
|
10/08/2020 |
|
|
|
|
|
|
|
|
|
|
|
|
|
|
10.40# |
|
|
8-K |
|
001-37637 |
|
10.1 |
|
05/11/2021 |
|
|
|
|
|
|
|
|
|
|
|
|
|
|
10.41# |
|
|
8-K |
|
001-37637 |
|
10.2 |
|
05/11/2021 |
|
|
|
|
|
|
|
|
|
|
|
|
|
108
|
|
|
|
|
Incorporated by Reference |
||||||
|
Exhibit Number |
|
Description |
|
Schedule/ Form |
|
File Number |
|
Exhibit Number |
|
File Date (mm/dd/yyyy) |
|
10.42*# |
|
Mimecast Limited Executive Severance and Change in Control Plan |
|
|
|
|
|
|
|
|
|
|
|
|
|
|
|
|
|
|
|
|
|
21.1* |
|
|
|
|
|
|
|
|
|
|
|
|
|
|
|
|
|
|
|
|
|
|
|
23.1* |
|
Consent of Ernst & Young LLP, Registered Public Accounting Firm |
|
|
|
|
|
|
|
|
|
|
|
|
|
|
|
|
|
|
|
|
|
31.1* |
|
|
|
|
|
|
|
|
|
|
|
|
|
|
|
|
|
|
|
|
|
|
|
31.2* |
|
|
|
|
|
|
|
|
|
|
|
|
|
|
|
|
|
|
|
|
|
|
|
32.1@ |
|
|
|
|
|
|
|
|
|
|
|
|
|
|
|
|
|
|
|
|
|
|
|
32.2@ |
|
|
|
|
|
|
|
|
|
|
|
|
|
|
|
|
|
|
|
|
|
|
|
101.INS* |
|
Inline XBRL Instance Document – the instance document does not appear in the Interactive Data File because its XBRL tags are embedded within the Inline XBRL document |
|
|
|
|
|
|
|
|
|
|
|
|
|
|
|
|
|
|
|
|
|
101.SCH* |
|
Inline XBRL Taxonomy Extension Schema Document |
|
|
|
|
|
|
|
|
|
|
|
|
|
|
|
|
|
|
|
|
|
101.CAL* |
|
Inline XBRL Taxonomy Extension Calculation Linkbase Document |
|
|
|
|
|
|
|
|
|
|
|
|
|
|
|
|
|
|
|
|
|
101.DEF* |
|
Inline XBRL Taxonomy Extension Definition Linkbase Document |
|
|
|
|
|
|
|
|
|
|
|
|
|
|
|
|
|
|
|
|
|
101.LAB* |
|
Inline XBRL Taxonomy Extension Label Linkbase Document |
|
|
|
|
|
|
|
|
|
|
|
|
|
|
|
|
|
|
|
|
|
101.PRE* |
|
Inline XBRL Taxonomy Extension Presentation Linkbase Document |
|
|
|
|
|
|
|
|
|
|
|
|
||||||||
|
104* |
|
Cover Page Interactive Data File (formatted as inline XBRL with applicable taxonomy extension information contained in Exhibits 101.*) |
||||||||
|
* |
Filed herewith. |
|
@ |
Furnished herewith. The certifications furnished in Exhibits 32.1 and 32.2 hereto are deemed to accompany this Annual Report on Form 10-K and will not be deemed “filed” for purposes of Section 18 of the Exchange Act. Such certifications will not be deemed to be incorporated by reference into any filings under the Securities Act or the Exchange Act, except to the extent that the Registrant specifically incorporates it by reference. |
|
# |
Management contract or compensatory plan or arrangement. |
109
Item 16. Form 10-K Summary.
Not applicable.
110
SIGNATURES
Pursuant to the requirements of Section 13 or 15(d) of the Securities Exchange Act of 1934, as amended, the Registrant has duly caused this Report to be signed on its behalf by the undersigned, thereunto duly authorized.
|
|
|
Mimecast Limited |
|
|
|
|
|
|
|
Date: May 27, 2021 |
|
By: |
/s/ Peter Bauer |
|
|
|
|
Peter Bauer |
|
|
|
|
Chief Executive Officer |
Pursuant to the requirements of the Securities Exchange Act of 1934, as amended, this Report has been signed below by the following persons on behalf of the Registrant in the capacities and on the dates indicated.
|
Name |
|
Title |
|
Date |
|
|
|
|
|
|
|
/s/ Peter Bauer |
|
Chairman and Chief Executive Officer (Principal Executive Officer) |
|
May 27, 2021 |
|
Peter Bauer |
|
|
|
|
|
|
|
|
|
|
|
/s/ Rafeal Brown |
|
Chief Financial Officer (Principal Financial and Accounting Officer) |
|
May 27, 2021 |
|
Rafeal Brown |
|
|
|
|
|
|
|
|
|
|
|
/s/ Aron Ain |
|
Director |
|
May 27, 2021 |
|
Aron Ain |
|
|
|
|
|
|
|
|
|
|
|
/s/ Alpna J. Doshi |
|
Director |
|
May 27, 2021 |
|
Alpna J. Doshi |
|
|
|
|
|
|
|
|
|
|
|
/s/ Christopher FitzGerald |
|
Director |
|
May 27, 2021 |
|
Christopher FitzGerald |
|
|
|
|
|
|
|
|
|
|
|
/s/ Neil Murray |
|
Director |
|
May 27, 2021 |
|
Neil Murray |
|
|
|
|
|
|
|
|
|
|
|
/s/ Helene Auriol Potier |
|
Director |
|
May 27, 2021 |
|
Helene Auriol Potier |
|
|
|
|
|
|
|
|
|
|
|
/s/ Robert P. Schechter |
|
Director |
|
May 27, 2021 |
|
Robert P. Schechter |
|
|
|
|
|
|
|
|
|
|
|
/s/ Hagi Schwartz |
|
Director |
|
May 27, 2021 |
|
Hagi Schwartz |
|
|
|
|
|
|
|
|
|
|
|
/s/ Stephen M. Ward |
|
Director |
|
May 27, 2021 |
|
Stephen M. Ward |
|
|
|
|
111
