| Anchor Tactical Credit Strategies Fund | ||||||||||||||||||||||||||||||||||||
| <p style="margin: 0px; font-size: 14pt"><b>FUND SUMMARY - ANCHOR TACTICAL CREDIT STRATEGIES FUND</b></p> | ||||||||||||||||||||||||||||||||||||
| <p style="margin: 0px"><b>Investment Objective:</b></p> | ||||||||||||||||||||||||||||||||||||
The Fund seeks to provide total return from income and capital appreciation | ||||||||||||||||||||||||||||||||||||
with a secondary objective of limiting risk during unfavorable market conditions. | ||||||||||||||||||||||||||||||||||||
| <p style="margin: 0px"><b>Fees and Expenses of the Fund:</b></p> | ||||||||||||||||||||||||||||||||||||
This table describes the fees and expenses that you may pay if you buy and hold shares of the Fund. | ||||||||||||||||||||||||||||||||||||
| <p style="margin: 0px"><b>Shareholder Fees</b></p> <p style="margin: 0px">(fees paid directly from your investment)</p> | ||||||||||||||||||||||||||||||||||||
| ||||||||||||||||||||||||||||||||||||
| <p style="margin: 0px"><b>Annual Fund Operating Expenses</b></p> <p style="margin: 0px">(expenses that you pay each year as a percentage of the value of your investment)</p> | ||||||||||||||||||||||||||||||||||||
| ||||||||||||||||||||||||||||||||||||
| <p style="margin: 0px"><b><i>Example:</i></b></p> | ||||||||||||||||||||||||||||||||||||
This Example is intended to help you compare the cost of investing in the Fund with the cost of investing in other mutual funds. | ||||||||||||||||||||||||||||||||||||
| <p style="margin: 0px">The Example assumes that you invest $10,000 in the Fund for the time periods indicated and then redeem all of your shares at the end of those periods. The Example also assumes that your investment has a 5% return each year and that the Fund’s operating expenses remain the same. Although your actual costs may be higher or lower, based upon these assumptions your costs would be:</p> | ||||||||||||||||||||||||||||||||||||
| ||||||||||||||||||||||||||||||||||||
| <p style="margin: 0px"><b><i>Portfolio Turnover:</i></b></p> | ||||||||||||||||||||||||||||||||||||
The Fund pays transaction costs, such as commissions, when it buys and sells securities (or "turns over" its portfolio). A higher portfolio turnover rate may indicate higher transaction costs and may result in higher taxes when Fund shares are held in a taxable account. These costs, which are not reflected in annual fund operating expenses or in the Example, affect the Fund’s performance. During the most recent fiscal year, the Fund’s portfolio turnover rate was 1,409%. | ||||||||||||||||||||||||||||||||||||
| <p style="margin: 0px"><b>Principal Investment Strategies</b>:</p> | ||||||||||||||||||||||||||||||||||||
The Fund seeks to achieve its investment objective, utilizing a fund of funds structure, by allocating assets among various strategies based on the adviser’s research and analysis regarding market trends. A market trend is the movement of a financial market in a particular direction over time. Under normal market conditions, the Fund invests, directly or indirectly through unaffiliated fixed income exchange traded funds (“ETFs”) and fixed income mutual funds (together with ETFs, “Underlying Funds”), at least 80% of its net assets (plus the amount of borrowings, if any) in long and short positions in fixed income securities. The adviser defines “fixed income securities” to include bonds, municipal funds, ETFs and other debt instruments. The Fund primarily takes long and short positions in securities that provide returns similar to high yield corporate bonds (also known as “junk bonds”) based on long, intermediate, and short term trends. Long term trends are those that are observed over two years or more; intermediate trends nine to 24 months; and short term trends up to nine months. The Fund takes a long position, or purchases shares of a security, when the adviser believes a security will increase in value, and a short position, or sells shares of borrowed stock, when the adviser believes the value of a security will decrease.
At least 80% of the Fund will be invested in:
(1) Underlying Funds that primarily invest in or are otherwise exposed to domestic and foreign high-yield (“junk”) debt instruments;
(2) derivative instruments: total return swaps or credit default swaps designed to replicate some or all of the features of an underlying portfolio of high yield bonds; and
(3) other U.S. or foreign fixed-income securities instruments without restriction as to issuer capitalization or the maturity or duration of an issue.
The Fund may also invest in U.S. or foreign cash equivalents.
The Fund defines high yield debt instruments as corporate bonds or other bonds or debt instruments that are generally rated lower than Baa3 by Moody's Investors Service, Inc. ("Moody's") or lower than BBB- by S&P (below investment grade). Up to 100% of the Fund's assets may be invested in instruments generally rated below Caa3 by Moody's or CCC- by S&P or derivatives of such instruments. The Fund may invest in high yield bonds directly or indirectly through derivative instruments.
The adviser seeks to achieve the Fund's secondary objective by hedging the Fund's investment portfolio when it believes security prices will decline. The adviser will hedge by:
(i) increasing allocations to cash equivalents or U.S. Treasury securities
(ii) purchasing inverse mutual funds or inverse ETFs
(iii) selling short ETFs or securities the adviser believes have demonstrated a high correlation to high yield bonds.
The Fund may invest in inverse funds linked to U.S. Treasury securities when the adviser believes this strategy will provide an effective hedge for interest rate risk.
Generally, the adviser does not attempt to evaluate individual securities. The adviser uses technical analysis, including monitoring price movements and price trends, of high-yield bond markets in an effort to identify the proper weighting of the Fund's portfolio. The adviser's decision to buy or sell a Fund holding will be made based on adviser developed trend and risk models that evaluate current market conditions and this analysis will guide the adviser's determination of the appropriate exposure level to the high-yield bond market. The adviser buys and sells securities and derivatives to increase or decrease the Fund's exposure to the high-yield bond market. The Fund's adviser may engage in active and frequent trading of the Fund's portfolio securities and derivatives to achieve the Fund's investment objective. | ||||||||||||||||||||||||||||||||||||
| <p style="margin: 0px"><b>Principal Investment Risks:</b></p> | ||||||||||||||||||||||||||||||||||||
As with all mutual funds, there is the risk that you could lose money through your investment in the Fund. Many factors affect the Fund’s net asset value and performance.
The following describes the risks the Fund bears directly or indirectly through investments in Underlying Funds. As with any mutual fund, there is no guarantee that the Fund will achieve its goal.
Counterparty Risk. A counterparty (the other party to a transaction or an agreement or the party with whom the Fund executes transactions) to a transaction with the Fund may be unable or unwilling to make timely principal, interest or settlement payments, or otherwise honor its obligations.
Credit Risk. The Fund could lose money if the issuer or guarantor of a fixed income security, or the counterparty of a derivatives contract, is unable or unwilling (or is perceived to be unable or unwilling) to make timely payment of principal and/or interest, or to otherwise honor its obligations.
Credit Default Swap Risk. The use of credit default swaps (“CDS”) may not always be successful and payments made by the Fund pursuant to a CDS will tend to lower returns if the reference asset’s credit quality remains steady or improves. Additionally, the CDS counterparty may default and CDS values may not correlate perfectly with the underlying asset.
Debt Securities Risk. The issuer of a debt security may fail to pay interest or principal when due, and that changes in market interest rates may reduce the value of debt securities or reduce the Fund’s returns. The Fund may be subject to a greater risk of rising interests than normally would be the case due to the current period of historically low rates and the effect of potential government fiscal policy initiatives and resulting market reaction to those initiatives.
Derivatives Risk. The use of derivative instruments involves risks different from, or possibly greater than, the risks associated with investing directly in securities and other traditional investments. These risks include (i) the risk that the counterparty to a derivative transaction may not fulfill its contractual obligations; (ii) risk of mispricing or improper valuation; and (iii) the risk that changes in the value of the derivative may not correlate perfectly with the underlying asset, rate or index. Derivative prices are highly volatile and may fluctuate substantially during a short period of time. Such prices are influenced by numerous factors that affect the markets, including, but not limited to: changing supply and demand relationships; government programs and policies; national and international political and economic events, changes in interest rates, inflation and deflation and changes in supply and demand relationships. Trading derivative instruments involves risks different from, or possibly greater than, the risks associated with investing directly in securities.
Exchange-Traded Funds Risk. ETFs may be actively or passively managed. The ETFs in which the Fund invests will not be able to replicate exactly the performance of the indices they track and may result in a loss. The market price of an ETF may deviate from the price of the underlying assets in various situations, including markets stress which will result in the Fund paying significantly more or receiving significantly less than the net asset value. An active trading market may not develop or be maintained at times of market stress, and market makers and authorized participants may step away from their respective roles in making a market for shares and executing purchase or redemption orders. To the extent all or a portion of an ETF’s underlying holdings are traded on foreign markets that are closed when the market on which the ETF is traded is open, there may be a change in last close price on the foreign market and the price of the ETF which is traded daily domestically. In addition, shareholders bear both their proportionate share of the Fund’s expenses and similar expenses of the underlying investment company when the Fund invests in shares of another investment company.
Foreign Investment Risk. The risk that investing in foreign (non-U.S.) securities either directly or indirectly may result in the Fund experiencing more rapid and extreme changes in value than the Fund that invests exclusively in securities of U.S. companies, due to smaller markets, differing reporting, accounting and auditing standards, nationalization, expropriation or confiscatory taxation, currency blockages and political changes or diplomatic developments. The costs of investing in many foreign markets are higher than the U.S. and investments may be less liquid. Foreign markets may be closed when U.S. markets are open which may impact Fund pricing.
Fund of Funds Risk. The ability of the Fund to meet its investment objective is directly related to the ability of the Underlying Funds in which it invests and their respective investment managers, to meet their investment objectives. Certain investment managers may be dependent upon a single individual or small group of individuals, the loss of which could adversely affect their success. There can be no assurance that any Underlying Fund will achieve its investment objectives.
Hedging Risk. Although intended to limit or reduce investment risk, hedging strategies may also limit or reduce the potential for profit. There is no assurance that hedging strategies will be successful.
High Yield Securities Risk. High yield securities or unrated securities of similar credit quality (commonly known as “junk bonds”) are more likely to default than higher rated securities. High yield securities are regarded as speculative with respect to the issuer’s capacity to pay interest and to repay principal. The market value of these securities is more sensitive to corporate developments and economic conditions and can be volatile. Market conditions can diminish liquidity and make accurate valuations difficult to obtain.
Interest Rate Risk. Fixed income securities may decline in value because of changes in interest rates. The Fund with a longer average portfolio duration will be more sensitive to changes in interest rates than the Fund with a shorter average portfolio duration.
Inverse ETF Risk. Inverse ETFs seek to provide investment results that will match a certain percentage of the inverse of the performance of a specific benchmark on a daily basis. Because they reset daily there may be significant volatility associated with inverse ETFs. The inverse ETFs in which the Fund invests may not be able to replicate exactly the inverse of the performance of the indices they track. Inverse ETFs fall in price when stock prices are rising. Additionally, inverse ETFs may employ leverage which magnifies the changes in the underlying stock index upon which they are based. Investments in inverse ETFs will prevent the Fund from participating in market-wide or sector-wide gains and may not prove to be an effective hedge. During periods of increased volatility, inverse ETFs may not perform in the manner they are designed. Investments in inverse ETFs are intended to be short term in nature and may, therefore, lead to increased turnover and transaction costs to the Fund.
Inverse Funds Risk. Inverse funds typically lose value as the index or security tracked by the fund increases in value; a result that is the opposite from traditional funds. Because they reset daily there may be significant volatility associated with inverse funds. The inverse funds in which the Fund invests may not be able to replicate exactly the inverse of the performance of the benchmark they track. Inverse funds fall in price when its benchmark prices are rising. Additionally, inverse funds may employ leverage which magnifies the changes in the underlying benchmark upon which they are based. Investments in inverse funds will prevent the Fund from participating in market-wide or sector-wide gains and may not prove to be an effective hedge. During periods of increased volatility, inverse funds may not perform in the manner they are designed. Investments in inverse funds are intended to be short term in nature and may, therefore, lead to increased turnover and transaction costs to the Fund.
Management Risk. The Adviser may be incorrect in its assessment of the intrinsic value of the securities the Fund holds which may result in a decline in the value of Fund shares and failure to achieve its investment objective. The Fund’s portfolio managers use qualitative analyses and/or models. Any imperfections or limitations in such analyses and models could affect the ability of the portfolio managers to implement strategies.
Portfolio Turnover Risk. The Fund’s high portfolio turnover will increase its transaction costs and may result in increased realization of net short-term capital gains (which are taxable to shareholders as ordinary income when distributed to them), higher taxable distributions and lower after-tax performance.
Securities Market Risk. The value of securities owned by the Fund may go up or down, sometimes rapidly or unpredictably, due to factors affecting particular companies or the securities markets generally. A general downturn in the securities market may cause multiple asset classes to decline in value simultaneously.
Short Sales Risk. Short sales risk is the risk of loss associated with any appreciation on the price of a security borrowed in connection with a short sale. The Fund may engage in short sales that are not made “against-the-box,” which means that the Fund may sell short securities even when they are not actually owned or otherwise covered at all times during the period the short position is open. Short sales that are not made “against-the-box” theoretically involve unlimited loss potential since the market price of securities sold short may continuously increase.
Swaps Risk. An investment in swaps may not correlate completely to the performance of the underlying securities or index and may be volatile, and may result in a loss greater than the principal amount invested. Swap counterparties may default. | ||||||||||||||||||||||||||||||||||||
| <p style="margin: 0px"><b>Performance:</b></p> | ||||||||||||||||||||||||||||||||||||
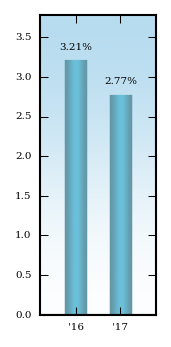
The bar chart and performance table below show the variability of the Fund’s returns, which is some indication of the risks of investing in the Fund by showing changes in the Fund’s performance from year to year and by showing the Fund’s one-year and since inception performance compared with those of a broad measure of market performance. The bar chart shows performance of the Fund’s Institutional Class shares for each calendar year since the Fund's inception. The performance table compares the performance of the Fund over time to the performance of a broad-based securities market index. You should be aware that the Fund’s past performance (before and after taxes) is not necessarily an indication of how the Fund will perform in the future. Updated performance information will be available at no cost by visiting www.anchorcapitalfunds.com or by calling 1-844-594-1226. | ||||||||||||||||||||||||||||||||||||
| <p style="margin-top: 0px; text-align: center; margin-bottom: 0px">Institutional Class Performance Bar Chart For Calendar Years Ended December 31</p> | ||||||||||||||||||||||||||||||||||||
| ||||||||||||||||||||||||||||||||||||
The Fund's Institutional Class year-to-date return as of September 30, 2018 was (2.82)%. | ||||||||||||||||||||||||||||||||||||
| <p style="margin-top: 0px; text-align: center; margin-bottom: 0px"><b>Performance Table<b></p> <p style="margin-top: 0px; text-align: center; margin-bottom: 0px"><b>Average Annual Total Returns<b></p> <p style="margin-top: 0px; text-align: center; margin-bottom: 0px"><b>(For periods ended December 31, 2017)<b></p> | ||||||||||||||||||||||||||||||||||||
| ||||||||||||||||||||||||||||||||||||
| Anchor Tactical Equity Strategies Fund | ||||||||||||||||||||||||||||||||||||
| <p style="margin: 0px; font-size: 14pt"><b>FUND SUMMARY - ANCHOR TACTICAL EQUITY STRATEGIES FUND</b></p> | ||||||||||||||||||||||||||||||||||||
| <p style="margin: 0px"><b>Investment Objective:</b></p> | ||||||||||||||||||||||||||||||||||||
The Fund seeks to provide total return from income and capital appreciation | ||||||||||||||||||||||||||||||||||||
with a secondary objective of limiting risk during unfavorable market conditions. | ||||||||||||||||||||||||||||||||||||
| <p style="margin: 0px"><b>Fees and Expenses of the Fund:</b></p> | ||||||||||||||||||||||||||||||||||||
This table describes the fees and expenses that you may pay if you buy and hold shares of the Fund. | ||||||||||||||||||||||||||||||||||||
| <p style="margin: 0px"><b>Shareholder Fees</b></p> <p style="margin: 0px">(fees paid directly from your investment)</p> | ||||||||||||||||||||||||||||||||||||
| ||||||||||||||||||||||||||||||||||||
| <p style="margin: 0px"><b>Annual Fund Operating Expenses</b></p> <p style="margin: 0px">(expenses that you pay each year as a percentage of the value of your investment)</p> | ||||||||||||||||||||||||||||||||||||
| ||||||||||||||||||||||||||||||||||||
| <p style="margin: 0px"><b><i>Example:</i></b></p> | ||||||||||||||||||||||||||||||||||||
This Example is intended to help you compare the cost of investing in the Fund with the cost of investing in other mutual funds. | ||||||||||||||||||||||||||||||||||||
| <p style="margin: 0px">The Example assumes that you invest $10,000 in the Fund for the time periods indicated and then redeem all of your shares at the end of those periods. The Example also assumes that your investment has a 5% return each year and that the Fund’s operating expenses remain the same. Although your actual costs may be higher or lower, based upon these assumptions your costs would be:</p> | ||||||||||||||||||||||||||||||||||||
| ||||||||||||||||||||||||||||||||||||
| <p style="margin: 0px"><b><i>Portfolio Turnover:</i></b></p> | ||||||||||||||||||||||||||||||||||||
The Fund pays transaction costs, such as commissions, when it buys and sells securities (or “turns over” its portfolio). A higher portfolio turnover rate may indicate higher transaction costs and may result in higher taxes when Fund shares are held in a taxable account. These costs, which are not reflected in annual fund operating expenses or in the Example, affect the Fund’s performance. During the most recent fiscal year the Fund’s portfolio turnover rate was 1,091%. | ||||||||||||||||||||||||||||||||||||
| <p style="margin: 0px"><b>Principal Investment Strategies</b>:</p> | ||||||||||||||||||||||||||||||||||||
The Fund seeks to achieve its investment objective, utilizing a “fund of funds” structure, by allocating assets among various strategies based on the adviser’s research and analysis regarding market trends. A market trend is the movement of a financial market in a particular direction over time. Under normal market conditions, the Fund invests, directly or indirectly through unaffiliated exchange traded funds (“ETFs”) and mutual funds (together with ETFs, “Underlying Funds”), at least 80% of its net assets (plus the amount of borrowings, if any) in long and short positions in equity securities. The Fund takes a long position, or purchases shares of a security, when the adviser believes a security will increase in value, and a short position, or sells shares of borrowed stock, when the adviser believes the value of a security will decrease. The Fund takes long and short positions in securities that are highly correlated to major US equity indices based on long, intermediate, and short term trends. The adviser considers a long term trend to be those that are observed over two years or more; intermediate trends nine to 24 months; and short term trends up to nine months.
At least 80% of the Fund’s assets will be invested in:
(1) U.S. or foreign equity securities of any market capitalization including Underlying Funds that primarily invest in or are otherwise exposed to domestic and foreign equity securities; and
(2) derivative instruments, including options, futures, and total return swaps, designed to replicate some or all of the features of an underlying portfolio of equity securities.
The Fund may also invest in U.S. or foreign cash equivalents including money market funds and treasuries.
The adviser seeks to achieve the Fund’s secondary objective by hedging the Fund’s investment portfolio when it believes security prices will decline. The adviser will hedge by:
(I) increasing allocations to cash equivalents or U.S. Treasury securities;
(II) purchasing inverse mutual funds or inverse ETFs; and
(III) selling short ETFs or securities the adviser believes have demonstrated a high correlation to the broader equity indices.
The Fund may invest in inverse funds linked to equity securities or indices when the adviser believes this strategy will provide an effective hedge for the Fund’s equity investments.
Generally, the adviser does not attempt to evaluate individual securities. The adviser uses technical analysis, including monitoring price movements and price trends, of equity markets in an effort to achieve the Fund’s objective through proper allocation of the Fund’s portfolio securities. The adviser’s decision to buy or sell a Fund holding will be made based on adviser developed trend and risk models that evaluate current market conditions, and this analysis will guide the adviser’s determination of the appropriate exposure level to the equity market. The adviser buys and sells securities and derivatives to increase or decrease the Fund’s exposure to the equity market. The Fund’s adviser may engage in active and frequent trading of the Fund’s portfolio securities and derivatives to achieve the Fund’s investment objective. | ||||||||||||||||||||||||||||||||||||
| <p style="margin: 0px"><b>Principal Investment Risks:</b></p> | ||||||||||||||||||||||||||||||||||||
As with all mutual funds, there is the risk that you could lose money through your investment in the Fund.
The following describes the risks the Fund bears directly or indirectly through investments in Underlying Funds. As with any mutual fund, there is no guarantee that the Fund will achieve its goal.
Counterparty Risk: A counterparty (the other party to a transaction or an agreement or the party with whom the Fund executes transactions) to a transaction with the Fund may be unable or unwilling to make timely principal, interest or settlement payments, or otherwise honor its obligations.
Derivatives Risk: The use of derivative instruments involves risks different from, or possibly greater than, the risks associated with investing directly in securities and other traditional investments. These risks include (i) the risk that the counterparty to a derivative transaction may not fulfill its contractual obligations; (ii) risk of mispricing or improper valuation; and (iii) the risk that changes in the value of the derivative may not correlate perfectly with the underlying asset, rate or index. Derivative prices are highly volatile and may fluctuate substantially during a short period of time. Such prices are influenced by numerous factors that affect the markets, including, but not limited to: changing supply and demand relationships; government programs and policies; national and international political and economic events, changes in interest rates, inflation and deflation and changes in supply and demand relationships. Trading derivative instruments involves risks different from, or possibly greater than, the risks associated with investing directly in securities.
Exchange-Traded Funds Risk: The ETFs in which the Fund invests will not be able to replicate exactly the performance of the indices they track and may result in a loss. When the Fund invests in another investment company, including an ETF, it will indirectly bear its proportionate share of any fees and expenses payable directly by the other investment company. Therefore, the Fund will incur higher expenses, many of which may be duplicative. In addition, the Fund may be affected by losses of the Underlying Funds and the level of risk arising from the investment practices of the Underlying Funds (such as the use of leverage by the funds). The Fund has no control over the investments and related risks taken by the Underlying Funds in which it invests. Investments in ETFs are also subject to the following risks: (i) the market price of an ETF’s shares may trade above or below their net asset value; (ii) an active trading market for an ETF’s shares may not develop or be maintained; or (iii) trading of an ETF’s shares may be halted for a number of reasons.
Foreign Investment Risk: The risk that investing in foreign (non-U.S.) securities either directly or indirectly may result in the Fund experiencing more rapid and extreme changes in value than the Fund that invests exclusively in securities of U.S. companies, due to smaller markets, differing reporting, accounting and auditing standards, nationalization, expropriation or confiscatory taxation, currency blockages and political changes or diplomatic developments. The costs of investing in many foreign markets are higher than the U.S. and investments may be less liquid.
Fund of Funds Risk: The ability of the Fund to meet its investment objective is directly related to the ability of the ETFs in which it invests and their respective investment managers, to meet their investment objectives. Certain investment managers may be dependent upon a single individual or small group of individuals, the loss of which could adversely affect their success. There can be no assurance that any underlying investment vehicle will achieve its investment objectives.
Hedging Risk: Although intended to limit or reduce investment risk, hedging strategies may also limit or reduce the potential for profit. There is no assurance that hedging strategies will be successful.
Inverse ETF Risk: Inverse ETFs seek to provide investment results that will match a certain percentage of the inverse of the performance of a specific benchmark on a daily basis. Because they reset daily there may be significant volatility associated with inverse ETFs. The inverse ETFs in which the Fund invests may not be able to replicate exactly the inverse of the performance of the indices they track. Inverse ETFs fall in price when stock prices are rising. Additionally, inverse ETFs may employ leverage which magnifies the changes in the underlying stock index upon which they are based. Investments in inverse ETFs will prevent the Fund from participating in market-wide or sector-wide gains and may not prove to be an effective hedge. During periods of increased volatility, inverse ETFs may not perform in the manner they are designed.
Inverse Funds Risk: Inverse funds typically lose value as the index or security tracked by the fund increases in value; a result that is the opposite from traditional funds. Because they reset daily there may be significant volatility associated with inverse funds. The inverse funds in which the Fund invests may not be able to replicate exactly the inverse of the performance of the benchmark they track. Inverse funds fall in price when its benchmark prices are rising. Additionally, inverse funds may employ leverage which magnifies the changes in the underlying benchmark upon which they are based. Investments in inverse funds will prevent the Fund from participating in market-wide or sector-wide gains and may not prove to be an effective hedge. During periods of increased volatility, inverse funds may not perform in the manner they are designed.
Management Risk: The Adviser may be incorrect in its assessment of the intrinsic value of the securities the Fund holds which may result in a decline in the value of Fund shares and failure to achieve its investment objective. The Fund’s portfolio managers use qualitative analyses and/or models. Any imperfections or limitations in such analyses and models could affect the ability of the portfolio managers to implement strategies.
Portfolio Turnover Risk: The Fund’s high portfolio turnover will increase its transaction costs and may result in increased realization of net short-term capital gains (which are taxable to shareholders as ordinary income when distributed to them), higher taxable distributions and lower after-tax performance.
Securities Market Risk: The value of securities owned by the Fund may go up or down, sometimes rapidly or unpredictably, due to factors affecting particular companies or the securities markets generally. A general downturn in the securities market may cause multiple asset classes to decline in value simultaneously.
Short Sales Risk: Short sales risk is the risk of loss associated with any appreciation on the price of a security borrowed in connection with a short sale. The Fund may engage in short sales that are not made “against-the-box,” which means that the Fund may sell short securities even when they are not actually owned or otherwise covered at all times during the period the short position is open. Short sales that are not made “against-the-box” theoretically involve unlimited loss potential since the market price of securities sold short may continuously increase.
Small and Medium Capitalization Companies: The earnings and prospects of small and medium sized companies are more volatile than larger companies and may experience higher failure rates than larger companies. Small and medium sized companies normally have a lower trading volume than larger companies, which may tend to make their market price fall more disproportionately than larger companies in response to selling pressures and may have limited markets, product lines, or financial resources and lack management experience. | ||||||||||||||||||||||||||||||||||||
| <p style="margin: 0px"><b>Performance:</b></p> | ||||||||||||||||||||||||||||||||||||
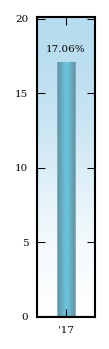
The bar chart and performance table below show the variability of the Fund’s returns, which is some indication of the risks of investing in the Fund by showing changes in the Fund’s performance from year to year and by showing the Fund’s one-year and since inception performance compared with those of a broad measure of market performance. The bar chart shows performance of the Fund’s Institutional Class shares for each calendar year since the Fund's inception. The performance table compares the performance of the Fund over time to the performance of a broad-based securities market index. You should be aware that the Fund’s past performance (before and after taxes) is not necessarily an indication of how the Fund will perform in the future. Updated performance information will be available at no cost by visiting www.anchorcapitalfunds.com or by calling 1-844-594-1226. | ||||||||||||||||||||||||||||||||||||
| <p style="margin-top: 0px; text-align: center; margin-bottom: 0px">Institutional Class Performance Bar Chart For Calendar Years Ended December 31</p> | ||||||||||||||||||||||||||||||||||||
| ||||||||||||||||||||||||||||||||||||
The Fund's Institutional Class year-to-date return as of September 30, 2018 was 9.47%. | ||||||||||||||||||||||||||||||||||||
| <p style="margin-top: 0px; text-align: center; margin-bottom: 0px"><b>Performance Table<b></p> <p style="margin-top: 0px; text-align: center; margin-bottom: 0px"><b>Average Annual Total Returns<b></p> <p style="margin-top: 0px; text-align: center; margin-bottom: 0px"><b>(For periods ended December 31, 2017)<b></p> | ||||||||||||||||||||||||||||||||||||
| ||||||||||||||||||||||||||||||||||||
| Anchor Tactical Municipal Strategies Fund | ||||||||||||||||||||||||||||||||||||
| <p style="margin: 0px; font-size: 14pt"><b>FUND SUMMARY - ANCHOR TACTICAL MUNICIPAL STRATEGIES FUND</b></p> | ||||||||||||||||||||||||||||||||||||
| <p style="margin: 0px"><b>Investment Objective:</b></p> | ||||||||||||||||||||||||||||||||||||
The Fund seeks to provide total return from income and capital appreciation | ||||||||||||||||||||||||||||||||||||
with a secondary objective of limiting risk during unfavorable market conditions. | ||||||||||||||||||||||||||||||||||||
| <p style="margin: 0px"><b>Fees and Expenses of the Fund:</b></p> | ||||||||||||||||||||||||||||||||||||
This table describes the fees and expenses that you may pay if you buy and hold shares of the Fund. | ||||||||||||||||||||||||||||||||||||
| <p style="margin: 0px"><b>Shareholder Fees</b></p> <p style="margin: 0px">(fees paid directly from your investment)</p> | ||||||||||||||||||||||||||||||||||||
| ||||||||||||||||||||||||||||||||||||
| <p style="margin: 0px"><b>Annual Fund Operating Expenses</b></p> <p style="margin: 0px">(expenses that you pay each year as a percentage of the value of your investment)</p> | ||||||||||||||||||||||||||||||||||||
| ||||||||||||||||||||||||||||||||||||
| <p style="margin: 0px"><b><i>Example:</i></b></p> | ||||||||||||||||||||||||||||||||||||
This Example is intended to help you compare the cost of investing in the Fund with the cost of investing in other mutual funds. | ||||||||||||||||||||||||||||||||||||
| <p style="margin: 0px">The Example assumes that you invest $10,000 in the Fund for the time periods indicated and then redeem all of your shares at the end of those periods. The Example also assumes that your investment has a 5% return each year and that the Fund’s operating expenses remain the same. Although your actual costs may be higher or lower, based upon these assumptions your costs would be:</p> | ||||||||||||||||||||||||||||||||||||
| ||||||||||||||||||||||||||||||||||||
| <p style="margin: 0px"><b><i>Portfolio Turnover:</i></b></p> | ||||||||||||||||||||||||||||||||||||
The Fund pays transaction costs, such as commissions, when it buys and sells securities (or “turns over” its portfolio). A higher portfolio turnover rate may indicate higher transaction costs and may result in higher taxes when Fund shares are held in a taxable account. These costs, which are not reflected in annual fund operating expenses or in the Example, affect the Fund’s performance. During the most recent fiscal year the Fund’s portfolio turnover rate was 298%. | ||||||||||||||||||||||||||||||||||||
| <p style="margin: 0px"><b>Principal Investment Strategies</b>:</p> | ||||||||||||||||||||||||||||||||||||
The Fund seeks to achieve its investment objective, utilizing a “fund of funds” structure, by allocating assets among various strategies based on the adviser’s research and analysis regarding market trends. A market trend is the movement of a financial market in a particular direction over time. Under normal market conditions, the Fund invests, directly or indirectly through unaffiliated exchange traded funds (“ETFs”) and mutual funds (together with ETFs, “Underlying Funds”), at least 80% of its net assets (plus the amount of borrowings, if any) in long and short positions in municipal debt instruments. The Fund takes a long position, or purchases shares of a security, when the adviser believes a security will increase in value, and a short position, or sells shares of borrowed stock, when the adviser believes the value of a security will decrease. The Fund takes long and short positions in securities that provide returns similar to municipal bonds based on long, intermediate, and short term trends. The adviser considers a long term trend to be those that are observed over two years or more; intermediate trends nine to 24 months; and short term trends up to nine months.
At least 80% of the Fund’s assets will be invested in:
(1) Underlying Funds that primarily invest in or are otherwise exposed to domestic municipal debt instruments;
(2) derivative instruments, including options, futures, total return swaps, or credit default swaps designed to replicate some or all of the features of an underlying portfolio of municipal bonds; and
(3) other U.S. or foreign fixed-income securities of any rating (including “junk” bonds).
The Fund may also invest in U.S. or foreign cash equivalents including money market funds and treasuries.
The adviser seeks to achieve the Fund’s secondary objective by hedging the Fund’s investment portfolio when it believes security prices will decline. The adviser will hedge by:
(i) increasing allocations to cash equivalents or U.S. Treasury securities;
(ii) purchasing inverse mutual funds or inverse ETFs; and
(iii) selling short ETFs or securities the adviser believes have demonstrated a high correlation to municipal bonds.
The Fund may invest in inverse funds linked to U.S. Treasury securities when the adviser believes this strategy will provide an effective hedge for interest rate risk.
Generally, the adviser does not attempt to evaluate individual securities. The adviser uses technical analysis, including monitoring price movements and price trends, of municipal bond markets in an effort to identify the proper weighting of the Fund’s portfolio. The adviser’s decision to buy or sell a Fund holding will be made based on adviser developed trend and risk models that evaluate current market conditions, and this analysis will guide the adviser’s determination of the appropriate exposure level to the municipal bond market. The adviser buys and sells securities and derivatives to increase or decrease the Fund’s exposure to the municipal bond market.
The Fund will invest its assets such that at least 80% of the income distributed by the Fund will be tax-exempt.
The Fund’s adviser may engage in active and frequent trading of the Fund’s portfolio securities and derivatives to achieve the Fund’s investment objective. | ||||||||||||||||||||||||||||||||||||
| <p style="margin: 0px"><b>Principal Investment Risks:</b></p> | ||||||||||||||||||||||||||||||||||||
As with all mutual funds, there is the risk that you could lose money through your investment in the Fund.
The following describes the risks the Fund bears directly or indirectly through investments in Underlying Funds. As with any mutual fund, there is no guarantee that the Fund will achieve its goal.
Counterparty Risk: A counterparty (the other party to a transaction or an agreement or the party with whom the Fund executes transactions) to a transaction with the Fund may be unable or unwilling to make timely principal, interest or settlement payments, or otherwise honor its obligations.
Credit Risk: The Fund could lose money if the issuer or guarantor of a fixed income security, or the counterparty of a derivatives contract, is unable or unwilling (or is perceived to be unable or unwilling) to make timely payment of principal and/or interest, or to otherwise honor its obligations.
Credit Default Swap Risk: The use of credit default swaps (“CDS”) may not always be successful and payments made by the Fund pursuant to a CDS will tend to lower returns if the reference asset’s credit quality remains steady or improves. Additionally, the CDS counterparty may default and CDS values may not correlate perfectly with the underlying asset.
Debt Securities Risk: The issuer of a debt security may fail to pay interest or principal when due, and that changes in market interest rates may reduce the value of debt securities or reduce the Fund’s returns. The Fund may be subject to a greater risk of rising interests than normally would be the case due to the current period of historically low rates and the effect of potential government fiscal policy initiatives and resulting market reaction to those initiatives.
Derivatives Risk: The use of derivative instruments involves risks different from, or possibly greater than, the risks associated with investing directly in securities and other traditional investments. These risks include (i) the risk that the counterparty to a derivative transaction may not fulfill its contractual obligations; (ii) risk of mispricing or improper valuation; and (iii) the risk that changes in the value of the derivative may not correlate perfectly with the underlying asset, rate or index. Derivative prices are highly volatile and may fluctuate substantially during a short period of time. Such prices are influenced by numerous factors that affect the markets, including, but not limited to: changing supply and demand relationships; government programs and policies; national and international political and economic events, changes in interest rates, inflation and deflation and changes in supply and demand relationships. Trading derivative instruments involves risks different from, or possibly greater than, the risks associated with investing directly in securities.
Exchange-Traded Funds Risk: The ETFs in which the Fund invests will not be able to replicate exactly the performance of the indices they track and may result in a loss. When the Fund invests in another investment company, including an ETF, it will indirectly bear its proportionate share of any fees and expenses payable directly by the other investment company. Therefore, the Fund will incur higher expenses, many of which may be duplicative. In addition, the Fund may be affected by losses of the underlying funds and the level of risk arising from the investment practices of the underlying funds (such as the use of leverage by the funds). The Fund has no control over the investments and related risks taken by the underlying funds in which it invests. Investments in ETFs are also subject to the following risks: (i) the market price of an ETF’s shares may trade above or below their net asset value; (ii) an active trading market for an ETF’s shares may not develop or be maintained; or (iii) trading of an ETF’s shares may be halted for a number of reasons.
Foreign Investment Risk: The risk that investing in foreign (non-U.S.) securities either directly or indirectly may result in the Fund experiencing more rapid and extreme changes in value than the Fund that invests exclusively in securities of U.S. companies, due to smaller markets, differing reporting, accounting and auditing standards, nationalization, expropriation or confiscatory taxation, currency blockages and political changes or diplomatic developments. The costs of investing in many foreign markets are higher than the U.S. and investments may be less liquid.
Fund of Funds Risk: The ability of the Fund to meet its investment objective is directly related to the ability of the ETFs in which it invests and their respective investment managers, to meet their investment objectives. Certain investment managers may be dependent upon a single individual or small group of individuals, the loss of which could adversely affect their success. There can be no assurance that any underlying investment vehicle will achieve its investment objectives.
Hedging Risk: Although intended to limit or reduce investment risk, hedging strategies may also limit or reduce the potential for profit. There is no assurance that hedging strategies will be successful.
High Yield Securities Risk: High yield securities or unrated securities of similar credit quality (commonly known as “junk bonds”) are more likely to default than higher rated securities. High yield securities are regarded as speculative with respect to the issuer’s capacity to pay interest and to repay principal. The market value of these securities is more sensitive to corporate developments and economic conditions and can be volatile. Market conditions can diminish liquidity and make accurate valuations difficult to obtain.
Interest Rate Risk: Fixed income securities may decline in value because of changes in interest rates. The Fund with a longer average portfolio duration will be more sensitive to changes in interest rates than the Fund with a shorter average portfolio duration.
Inverse ETF Risk: Inverse ETFs seek to provide investment results that will match a certain percentage of the inverse of the performance of a specific benchmark on a daily basis. Because they reset daily there may be significant volatility associated with inverse ETFs. The inverse ETFs in which the Fund invests may not be able to replicate exactly the inverse of the performance of the indices they track. Inverse ETFs fall in price when stock prices are rising. Additionally, inverse ETFs may employ leverage which magnifies the changes in the underlying stock index upon which they are based. Investments in inverse ETFs will prevent the Fund from participating in market-wide or sector-wide gains and may not prove to be an effective hedge. During periods of increased volatility, inverse ETFs may not perform in the manner they are designed.
Inverse Funds Risk: Inverse funds typically lose value as the index or security tracked by the fund increases in value; a result that is the opposite from traditional funds. Because they reset daily there may be significant volatility associated with inverse funds. The inverse funds in which the Fund invests may not be able to replicate exactly the inverse of the performance of the benchmark they track. Inverse funds fall in price when its benchmark prices are rising. Additionally, inverse funds may employ leverage which magnifies the changes in the underlying benchmark upon which they are based. Investments in inverse funds will prevent the Fund from participating in market-wide or sector-wide gains and may not prove to be an effective hedge. During periods of increased volatility, inverse funds may not perform in the manner they are designed.
Management Risk: The Adviser may be incorrect in its assessment of the intrinsic value of the securities the Fund holds which may result in a decline in the value of Fund shares and failure to achieve its investment objective. The Fund’s portfolio managers use qualitative analyses and/or models. Any imperfections or limitations in such analyses and models could affect the ability of the portfolio managers to implement strategies.
Municipal Bond Risk: The value of municipal bonds that depend on a specific revenue source or general revenue source to fund their payment obligations may fluctuate as a result of changes in the cash flows generated by the revenue source(s) or changes in the priority of the municipal obligation to receive the cash flows generated by the revenue source(s). In addition, changes in federal tax laws or the activity of an issuer may adversely affect the tax-exempt status of municipal bonds. Investments in inverse floating rate securities typically involve greater risk than investments in municipal bonds of comparable maturity and credit quality and their values are more volatile than municipal bonds due to the leverage they entail.
Portfolio Turnover Risk: The Fund’s high portfolio turnover will increase its transaction costs and may result in increased realization of net short-term capital gains (which are taxable to shareholders as ordinary income when distributed to them), higher taxable distributions and lower after-tax performance.
Securities Market Risk: The value of securities owned by the Fund may go up or down, sometimes rapidly or unpredictably, due to factors affecting particular companies or the securities markets generally. A general downturn in the securities market may cause multiple asset classes to decline in value simultaneously.
Short Sales Risk: Short sales risk is the risk of loss associated with any appreciation on the price of a security borrowed in connection with a short sale. The Fund may engage in short sales that are not made “against-the-box,” which means that the Fund may sell short securities even when they are not actually owned or otherwise covered at all times during the period the short position is open. Short sales that are not made “against-the-box” theoretically involve unlimited loss potential since the market price of securities sold short may continuously increase. | ||||||||||||||||||||||||||||||||||||
| <p style="margin: 0px"><b>Performance:</b></p> | ||||||||||||||||||||||||||||||||||||
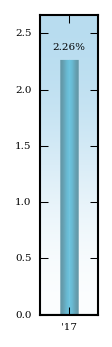
The bar chart and performance table below show the variability of the Fund’s returns, which is some indication of the risks of investing in the Fund by showing changes in the Fund’s performance from year to year and by showing the Fund’s one-year and since inception performance compared with those of a broad measure of market performance. The bar chart shows performance of the Fund’s Institutional Class shares for each calendar year since the Fund's inception. The performance table compares the performance of the Fund over time to the performance of a broad-based securities market index. You should be aware that the Fund’s past performance (before and after taxes) is not necessarily an indication of how the Fund will perform in the future. Updated performance information will be available at no cost by visiting www.anchorcapitalfunds.com or by calling 1-844-594-1226. | ||||||||||||||||||||||||||||||||||||
| <p style="margin-top: 0px; text-align: center; margin-bottom: 0px">Institutional Class Performance Bar Chart For Calendar Years Ended December 31</p> | ||||||||||||||||||||||||||||||||||||
| ||||||||||||||||||||||||||||||||||||
The Fund's Institutional Class year-to-date return as of September 30, 2018 was (2.07)%. | ||||||||||||||||||||||||||||||||||||
| <p style="margin-top: 0px; text-align: center; margin-bottom: 0px"><b>Performance Table<b></p> <p style="margin-top: 0px; text-align: center; margin-bottom: 0px"><b>Average Annual Total Returns<b></p> <p style="margin-top: 0px; text-align: center; margin-bottom: 0px"><b>(For periods ended December 31, 2017)<b></p> | ||||||||||||||||||||||||||||||||||||
| ||||||||||||||||||||||||||||||||||||