Exhibit 99.2 Investor Presentation November 2020 Proprietary Information Proprietary Information 1Exhibit 99.2 Investor Presentation November 2020 Proprietary Information Proprietary Information 1
Disclaimer This presentation contains forward-looking statements. All statements other than statements of historical facts contained in this presentation, including statements regarding possible or assumed future results of operations, business strategies, development plans, regulatory activities, competitive position, potential growth opportunities, & the effects of competition are forward-looking statements. These statements involve known & unknown risks, uncertainties & other important factors that may cause actual results, performance or achievements of EverQuote, Inc. (“the Company”) to be materially different from any future results, performance or achievements expressed or implied by the forward-looking statements. In some cases, you can identify forward- looking statements by terms such as “may,” “should,” “expect,” “plan,” “project,” “estimate,” “guidance,” or “potential” or the negative of these terms or other similar expressions. The forward-looking statements in this presentation are only predictions. The Company has based these forward-looking statements largely on its current expectations & projections about future events & financial trends that it believes may affect the Company’s business, financial condition & results of operations. These forward-looking statements speak only as of the date of this presentation & are subject to a number of risks, uncertainties & assumptions, some of which cannot be predicted or quantified & some of which are beyond the Company’s control. The events & circumstances reflected in the Company’s forward-looking statements may not be achieved or occur, & actual results could differ materially from those projected in the forward-looking statements, including as a result of: (1) the Company’s ability to attract and retain consumers and insurance providers using the Company’s marketplace; (2) the Company’s ability to maintain or increase the amount providers spend per quote request; (3) the effectiveness of the Company’s growth strategies and its ability to effectively manage growth; (4) the Company’s ability to maintain and build its brand; (5) the Company’s reliance on its third-party service providers; (6) the Company’s ability to develop new and enhanced products and services to attract and retain consumers and insurance providers, and the Company’s ability to successfully monetize them; (7) the impact of competition in the Company’s industry and innovation by the Company’s competitors; (8) the Company’s expected use of proceeds from its initial public offering; and (9) developments regarding the insurance industry and the transition to online marketing; (10) the effects of the COVID-19 pandemic; and (11) as a result of the risks described in the “Risk Factors” section of the Company’s most recent Annual Report on Form 10-K, Quarterly Report on Form 10-Q & the other filings that the Company makes with the Securities & Exchange Commission from time to time. Moreover, new risk factors & uncertainties may emerge from time to time, & it is not possible for management to predict all risk factors & uncertainties that the Company may face. Except as required by applicable law, the Company does not plan to publicly update or revise any forward-looking statements contained herein, whether as a result of any new information, future events, changed circumstances or otherwise. The Company’s presentation also contains estimates, projections, & other information concerning the Company’s industry, the Company’s business & the markets for certain of the Company’s products & services, including data regarding the estimated size of those markets. Information that is based on estimates, forecasts, projections, market research, or similar methodologies is inherently subject to uncertainties & actual events or circumstances may differ materially from events & circumstances reflected in this information. Unless otherwise expressly stated, the Company obtained this industry, business, market & other data from reports, research surveys, studies & similar data prepared by market research firms & other third parties, from industry, general publications, & from government data & similar sources. The Company presents Adjusted EBITDA as a non-GAAP measure, which is not a substitute for or superior to, other measures of financial performance prepared in accordance with U.S. GAAP. A reconciliation of Adjusted EBITDA to the most directly comparable GAAP measure is included in the Appendix to these slides. Proprietary Information 2Disclaimer This presentation contains forward-looking statements. All statements other than statements of historical facts contained in this presentation, including statements regarding possible or assumed future results of operations, business strategies, development plans, regulatory activities, competitive position, potential growth opportunities, & the effects of competition are forward-looking statements. These statements involve known & unknown risks, uncertainties & other important factors that may cause actual results, performance or achievements of EverQuote, Inc. (“the Company”) to be materially different from any future results, performance or achievements expressed or implied by the forward-looking statements. In some cases, you can identify forward- looking statements by terms such as “may,” “should,” “expect,” “plan,” “project,” “estimate,” “guidance,” or “potential” or the negative of these terms or other similar expressions. The forward-looking statements in this presentation are only predictions. The Company has based these forward-looking statements largely on its current expectations & projections about future events & financial trends that it believes may affect the Company’s business, financial condition & results of operations. These forward-looking statements speak only as of the date of this presentation & are subject to a number of risks, uncertainties & assumptions, some of which cannot be predicted or quantified & some of which are beyond the Company’s control. The events & circumstances reflected in the Company’s forward-looking statements may not be achieved or occur, & actual results could differ materially from those projected in the forward-looking statements, including as a result of: (1) the Company’s ability to attract and retain consumers and insurance providers using the Company’s marketplace; (2) the Company’s ability to maintain or increase the amount providers spend per quote request; (3) the effectiveness of the Company’s growth strategies and its ability to effectively manage growth; (4) the Company’s ability to maintain and build its brand; (5) the Company’s reliance on its third-party service providers; (6) the Company’s ability to develop new and enhanced products and services to attract and retain consumers and insurance providers, and the Company’s ability to successfully monetize them; (7) the impact of competition in the Company’s industry and innovation by the Company’s competitors; (8) the Company’s expected use of proceeds from its initial public offering; and (9) developments regarding the insurance industry and the transition to online marketing; (10) the effects of the COVID-19 pandemic; and (11) as a result of the risks described in the “Risk Factors” section of the Company’s most recent Annual Report on Form 10-K, Quarterly Report on Form 10-Q & the other filings that the Company makes with the Securities & Exchange Commission from time to time. Moreover, new risk factors & uncertainties may emerge from time to time, & it is not possible for management to predict all risk factors & uncertainties that the Company may face. Except as required by applicable law, the Company does not plan to publicly update or revise any forward-looking statements contained herein, whether as a result of any new information, future events, changed circumstances or otherwise. The Company’s presentation also contains estimates, projections, & other information concerning the Company’s industry, the Company’s business & the markets for certain of the Company’s products & services, including data regarding the estimated size of those markets. Information that is based on estimates, forecasts, projections, market research, or similar methodologies is inherently subject to uncertainties & actual events or circumstances may differ materially from events & circumstances reflected in this information. Unless otherwise expressly stated, the Company obtained this industry, business, market & other data from reports, research surveys, studies & similar data prepared by market research firms & other third parties, from industry, general publications, & from government data & similar sources. The Company presents Adjusted EBITDA as a non-GAAP measure, which is not a substitute for or superior to, other measures of financial performance prepared in accordance with U.S. GAAP. A reconciliation of Adjusted EBITDA to the most directly comparable GAAP measure is included in the Appendix to these slides. Proprietary Information 2

Our mission Empower insurance shoppers to better protect life's most important assets—their family, property, and future. Proprietary Information 3Our mission Empower insurance shoppers to better protect life's most important assets—their family, property, and future. Proprietary Information 3
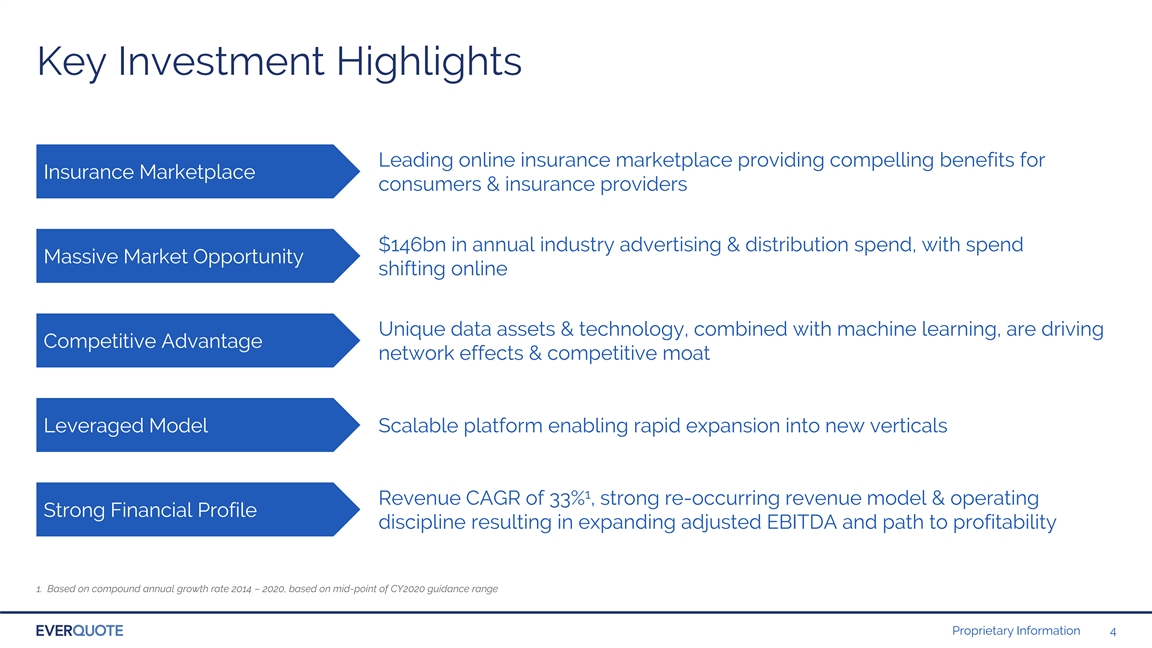
Key Investment Highlights Leading online insurance marketplace providing compelling benefits for Insurance Marketplace consumers & insurance providers $146bn in annual industry advertising & distribution spend, with spend Massive Market Opportunity shifting online Unique data assets & technology, combined with machine learning, are driving Competitive Advantage network effects & competitive moat Leveraged Model Scalable platform enabling rapid expansion into new verticals 1 Revenue CAGR of 33% , strong re-occurring revenue model & operating Strong Financial Profile discipline resulting in expanding adjusted EBITDA and path to profitability 1. Based on compound annual growth rate 2014 – 2020, based on mid-point of CY2020 guidance range Proprietary Information 4Key Investment Highlights Leading online insurance marketplace providing compelling benefits for Insurance Marketplace consumers & insurance providers $146bn in annual industry advertising & distribution spend, with spend Massive Market Opportunity shifting online Unique data assets & technology, combined with machine learning, are driving Competitive Advantage network effects & competitive moat Leveraged Model Scalable platform enabling rapid expansion into new verticals 1 Revenue CAGR of 33% , strong re-occurring revenue model & operating Strong Financial Profile discipline resulting in expanding adjusted EBITDA and path to profitability 1. Based on compound annual growth rate 2014 – 2020, based on mid-point of CY2020 guidance range Proprietary Information 4
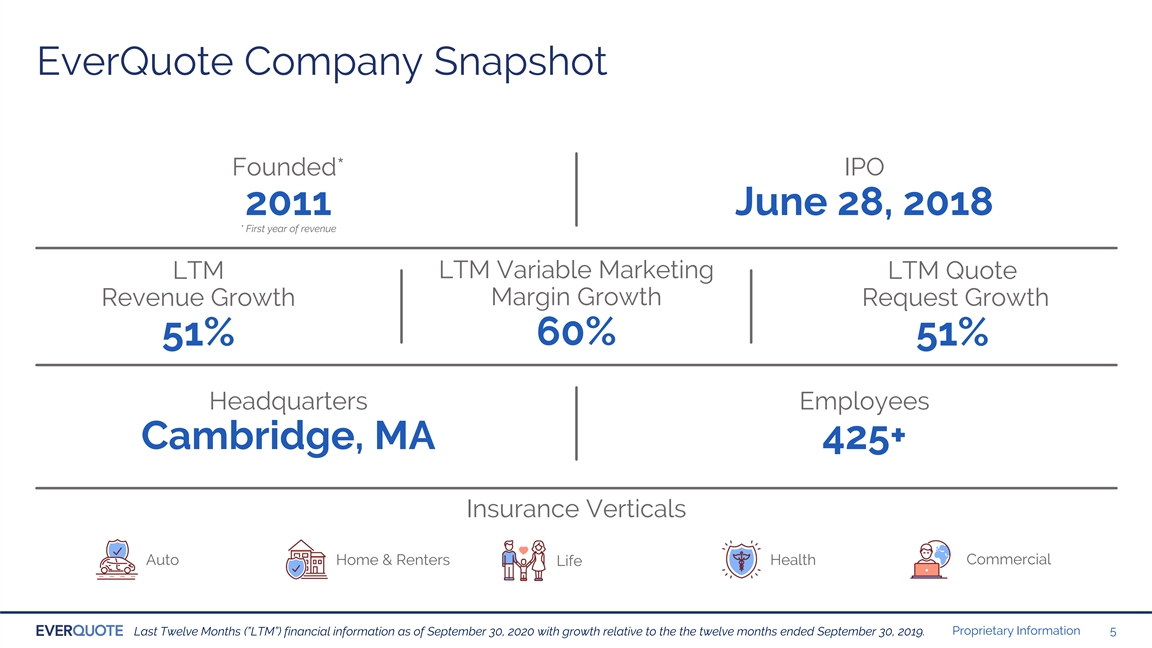
EverQuote Company Snapshot Founded* IPO 2011 June 28, 2018 * First year of revenue LTM Variable Marketing LTM LTM Quote Margin Growth Revenue Growth Request Growth 60% 51% 51% Headquarters Employees Cambridge, MA 425+ Insurance Verticals Commercial Auto Home & Renters Health Life Proprietary Information 5 Last Twelve Months (”LTM”) financial information as of September 30, 2020 with growth relative to the the twelve months ended September 30, 2019.EverQuote Company Snapshot Founded* IPO 2011 June 28, 2018 * First year of revenue LTM Variable Marketing LTM LTM Quote Margin Growth Revenue Growth Request Growth 60% 51% 51% Headquarters Employees Cambridge, MA 425+ Insurance Verticals Commercial Auto Home & Renters Health Life Proprietary Information 5 Last Twelve Months (”LTM”) financial information as of September 30, 2020 with growth relative to the the twelve months ended September 30, 2019.
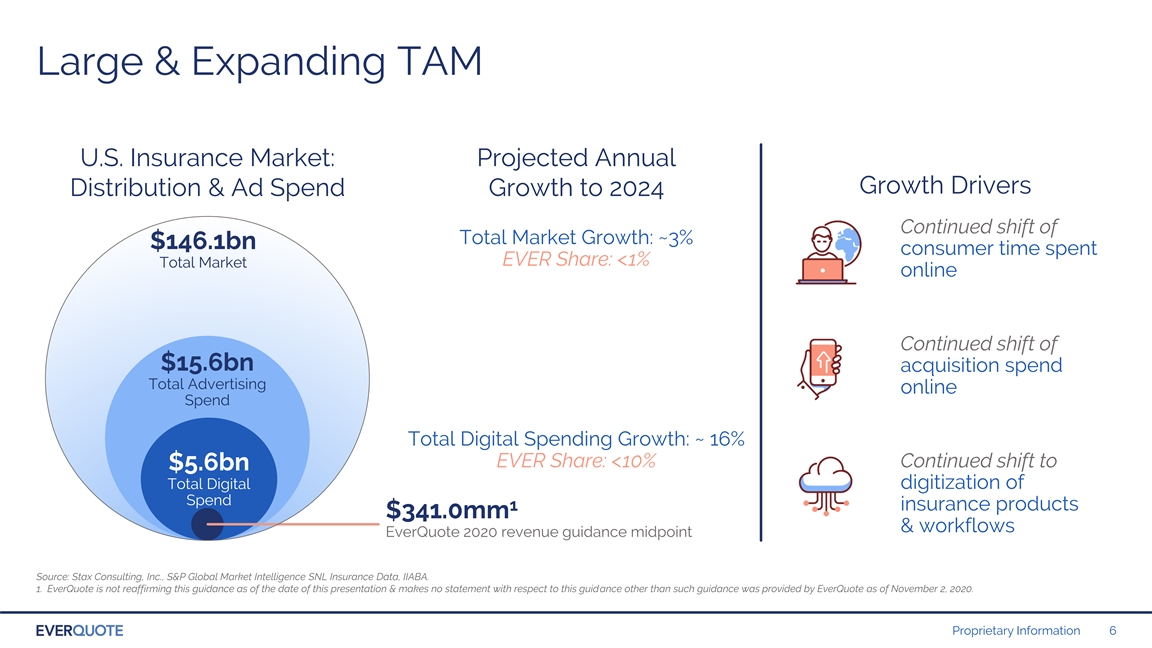
Large & Expanding TAM U.S. Insurance Market: Projected Annual Growth Drivers Distribution & Ad Spend Growth to 2024 Continued shift of Total Market Growth: ~3% $146.1bn consumer time spent EVER Share: <1% Total Market online Continued shift of $15.6bn acquisition spend Total Advertising online Spend Total Digital Spending Growth: ~ 16% EVER Share: <10% Continued shift to $5.6bn Total Digital digitization of Spend 1 insurance products $341.0mm & workflows EverQuote 2020 revenue guidance midpoint Source: Stax Consulting, Inc., S&P Global Market Intelligence SNL Insurance Data, IIABA. 1. EverQuote is not reaffirming this guidance as of the date of this presentation & makes no statement with respect to this guidance other than such guidance was provided by EverQuote as of November 2, 2020. Proprietary Information 6Large & Expanding TAM U.S. Insurance Market: Projected Annual Growth Drivers Distribution & Ad Spend Growth to 2024 Continued shift of Total Market Growth: ~3% $146.1bn consumer time spent EVER Share: <1% Total Market online Continued shift of $15.6bn acquisition spend Total Advertising online Spend Total Digital Spending Growth: ~ 16% EVER Share: <10% Continued shift to $5.6bn Total Digital digitization of Spend 1 insurance products $341.0mm & workflows EverQuote 2020 revenue guidance midpoint Source: Stax Consulting, Inc., S&P Global Market Intelligence SNL Insurance Data, IIABA. 1. EverQuote is not reaffirming this guidance as of the date of this presentation & makes no statement with respect to this guidance other than such guidance was provided by EverQuote as of November 2, 2020. Proprietary Information 6
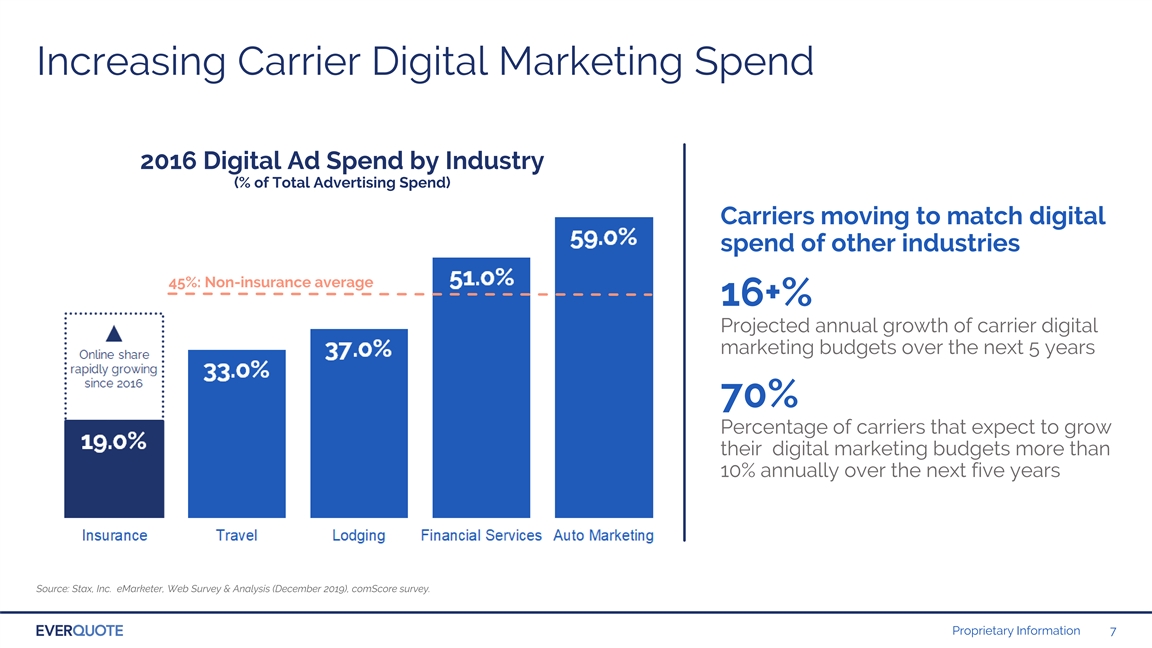
Increasing Carrier Digital Marketing Spend 2016 Digital Ad Spend by Industry (% of Total Advertising Spend) Carriers moving to match digital spend of other industries 45%: Non-insurance average 16+% Projected annual growth of carrier digital marketing budgets over the next 5 years 70% Percentage of carriers that expect to grow their digital marketing budgets more than 10% annually over the next five years Source: Stax, Inc. eMarketer, Web Survey & Analysis (December 2019), comScore survey. Proprietary Information 7Increasing Carrier Digital Marketing Spend 2016 Digital Ad Spend by Industry (% of Total Advertising Spend) Carriers moving to match digital spend of other industries 45%: Non-insurance average 16+% Projected annual growth of carrier digital marketing budgets over the next 5 years 70% Percentage of carriers that expect to grow their digital marketing budgets more than 10% annually over the next five years Source: Stax, Inc. eMarketer, Web Survey & Analysis (December 2019), comScore survey. Proprietary Information 7
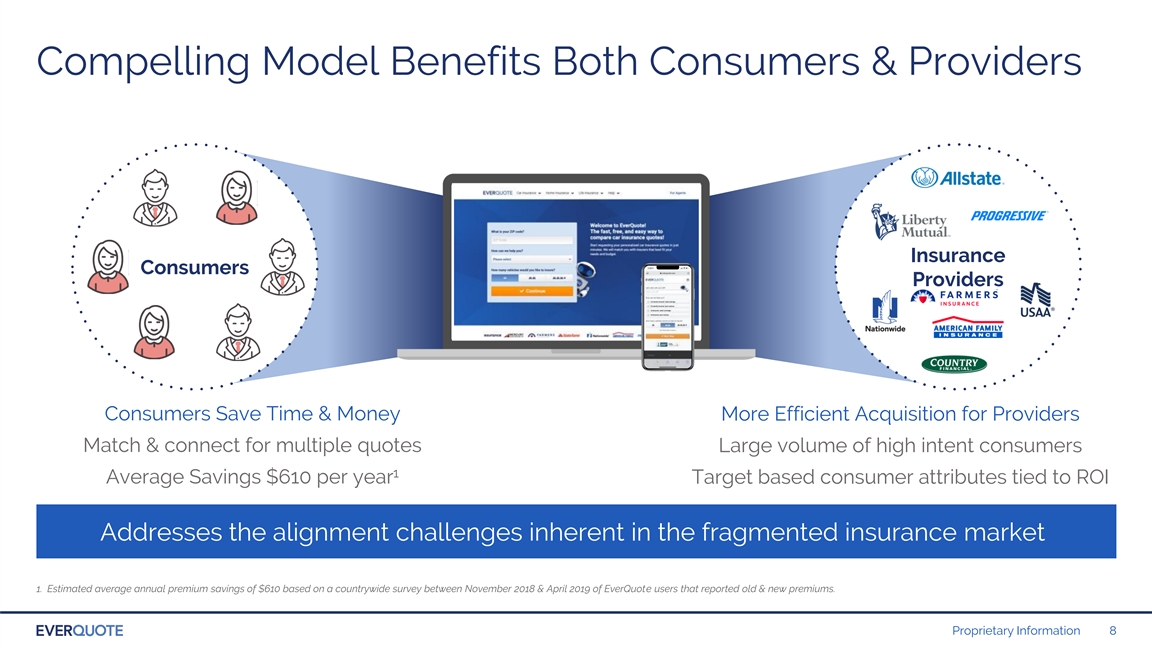
Compelling Model Benefits Both Consumers & Providers Insurance Consumers Providers Consumers Save Time & Money More Efficient Acquisition for Providers Match & connect for multiple quotes Large volume of high intent consumers 1 Average Savings $610 per year Target based consumer attributes tied to ROI Addresses the alignment challenges inherent in the fragmented insurance market 1. Estimated average annual premium savings of $610 based on a countrywide survey between November 2018 & April 2019 of EverQuote users that reported old & new premiums. Proprietary Information 8Compelling Model Benefits Both Consumers & Providers Insurance Consumers Providers Consumers Save Time & Money More Efficient Acquisition for Providers Match & connect for multiple quotes Large volume of high intent consumers 1 Average Savings $610 per year Target based consumer attributes tied to ROI Addresses the alignment challenges inherent in the fragmented insurance market 1. Estimated average annual premium savings of $610 based on a countrywide survey between November 2018 & April 2019 of EverQuote users that reported old & new premiums. Proprietary Information 8
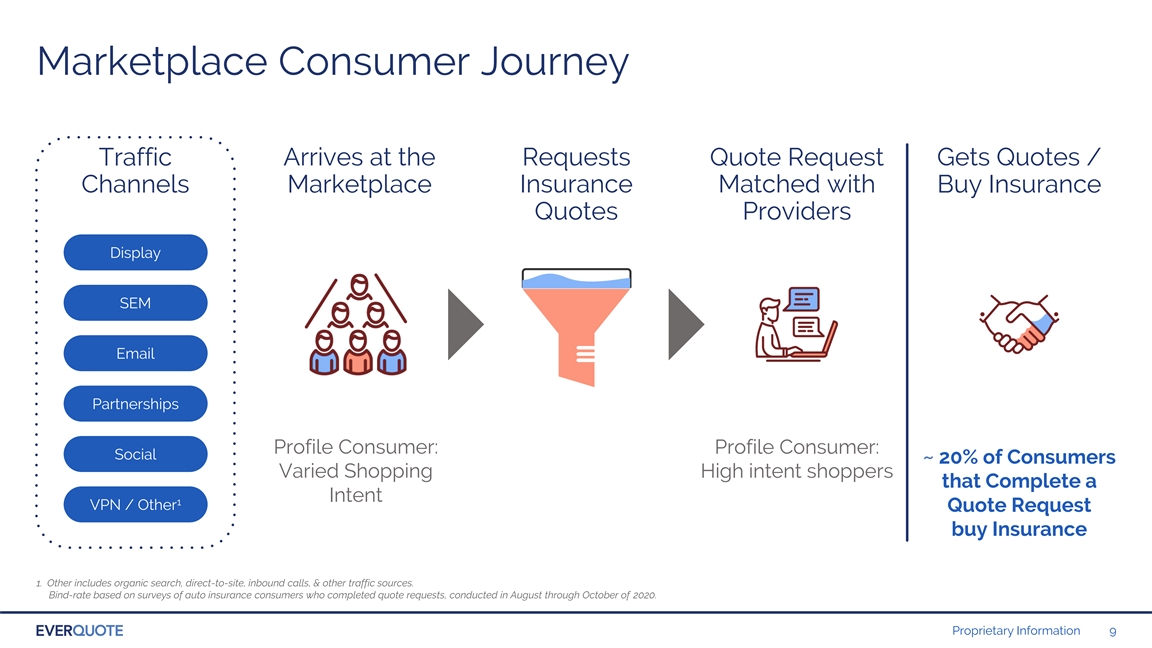
Marketplace Consumer Journey Traffic Arrives at the Requests Quote Request Gets Quotes / Channels Marketplace Insurance Matched with Buy Insurance Quotes Providers Display SEM Email Partnerships Profile Consumer: Profile Consumer: Social ~ 20% of Consumers Varied Shopping High intent shoppers that Complete a Intent 1 VPN / Other Quote Request buy Insurance 1. Other includes organic search, direct-to-site, inbound calls, & other traffic sources. Bind-rate based on surveys of auto insurance consumers who completed quote requests, conducted in August through October of 2020. Proprietary Information 9Marketplace Consumer Journey Traffic Arrives at the Requests Quote Request Gets Quotes / Channels Marketplace Insurance Matched with Buy Insurance Quotes Providers Display SEM Email Partnerships Profile Consumer: Profile Consumer: Social ~ 20% of Consumers Varied Shopping High intent shoppers that Complete a Intent 1 VPN / Other Quote Request buy Insurance 1. Other includes organic search, direct-to-site, inbound calls, & other traffic sources. Bind-rate based on surveys of auto insurance consumers who completed quote requests, conducted in August through October of 2020. Proprietary Information 9
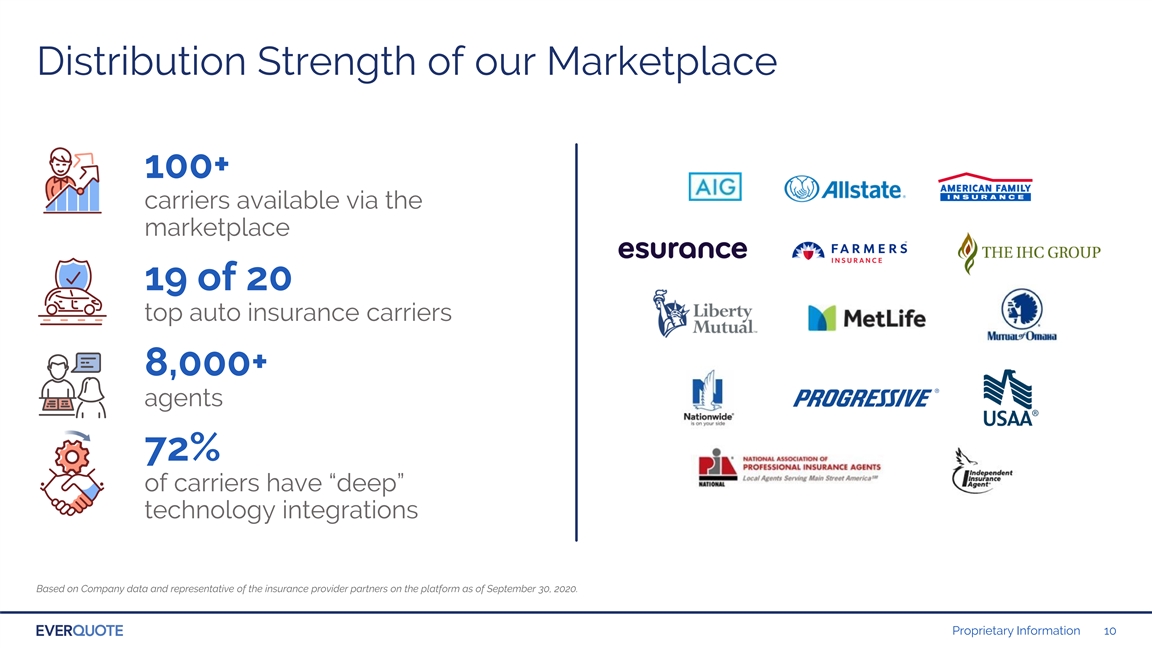
Distribution Strength of our Marketplace 100+ carriers available via the marketplace 19 of 20 top auto insurance carriers 8,000+ agents 72% of carriers have “deep” technology integrations Based on Company data and representative of the insurance provider partners on the platform as of September 30, 2020. Proprietary Information 10Distribution Strength of our Marketplace 100+ carriers available via the marketplace 19 of 20 top auto insurance carriers 8,000+ agents 72% of carriers have “deep” technology integrations Based on Company data and representative of the insurance provider partners on the platform as of September 30, 2020. Proprietary Information 10
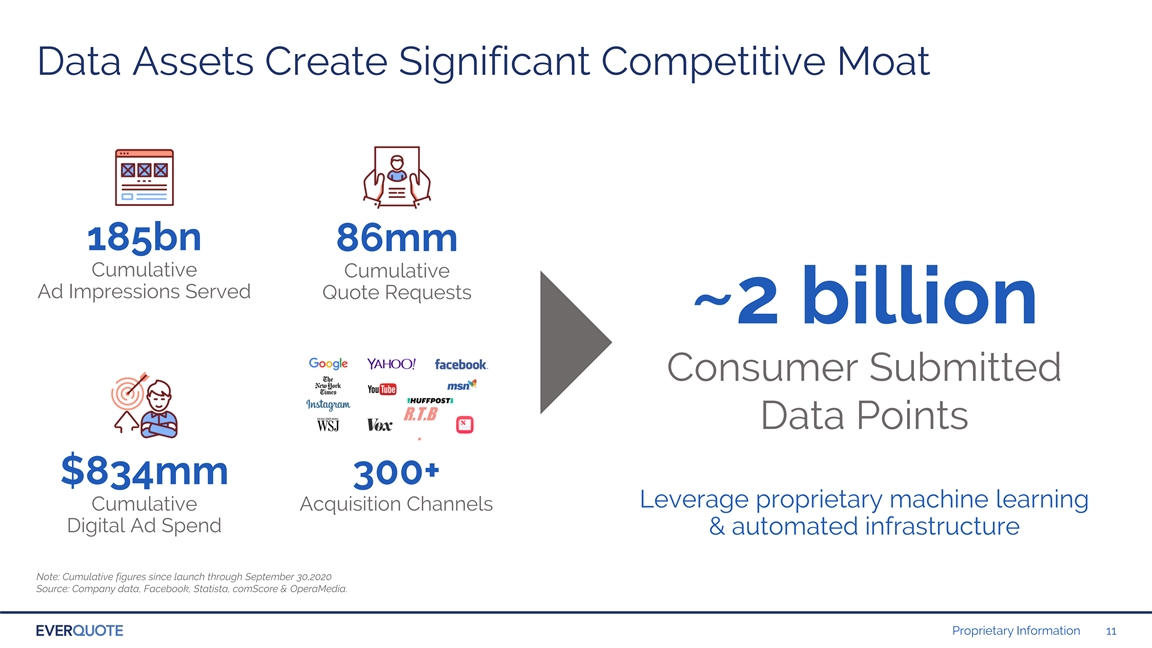
Data Assets Create Significant Competitive Moat 185bn 86mm Cumulative Cumulative Ad Impressions Served Quote Requests ~2 billion Consumer Submitted R.T.B Data Points . $834mm 300+ Leverage proprietary machine learning Cumulative Acquisition Channels Digital Ad Spend & automated infrastructure Note: Cumulative figures since launch through September 30,2020 Source: Company data, Facebook, Statista, comScore & OperaMedia. Proprietary Information 11Data Assets Create Significant Competitive Moat 185bn 86mm Cumulative Cumulative Ad Impressions Served Quote Requests ~2 billion Consumer Submitted R.T.B Data Points . $834mm 300+ Leverage proprietary machine learning Cumulative Acquisition Channels Digital Ad Spend & automated infrastructure Note: Cumulative figures since launch through September 30,2020 Source: Company data, Facebook, Statista, comScore & OperaMedia. Proprietary Information 11
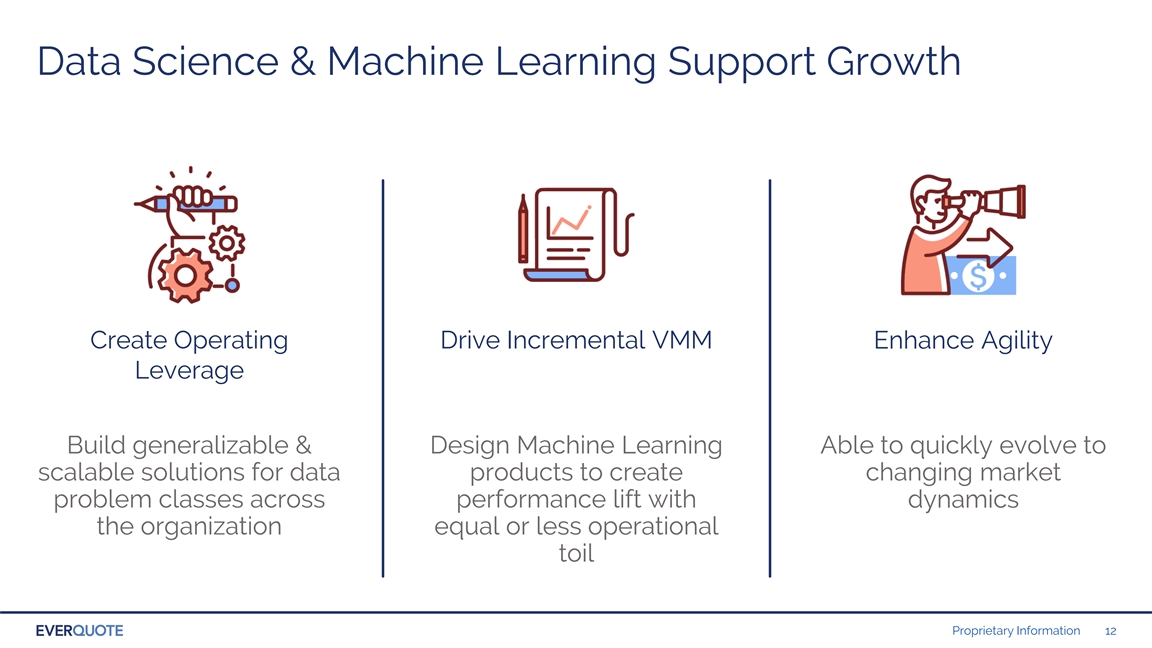
Data Science & Machine Learning Support Growth Create Operating Drive Incremental VMM Enhance Agility Leverage Build generalizable & Design Machine Learning Able to quickly evolve to scalable solutions for data products to create changing market problem classes across performance lift with dynamics the organization equal or less operational toil Proprietary Information 12Data Science & Machine Learning Support Growth Create Operating Drive Incremental VMM Enhance Agility Leverage Build generalizable & Design Machine Learning Able to quickly evolve to scalable solutions for data products to create changing market problem classes across performance lift with dynamics the organization equal or less operational toil Proprietary Information 12
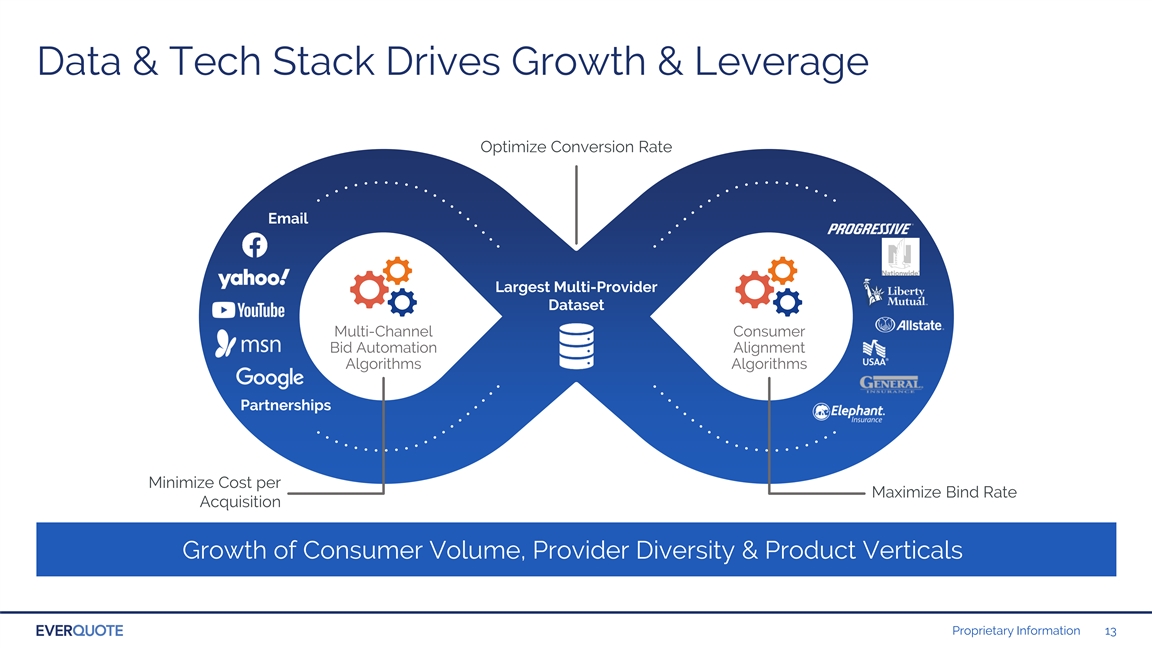
Data & Tech Stack Drives Growth & Leverage Optimize Conversion Rate Email Largest Multi-Provider Dataset Multi-Channel Consumer Bid Automation Alignment Algorithms Algorithms Partnerships Minimize Cost per Maximize Bind Rate Acquisition Growth of Consumer Volume, Provider Diversity & Product Verticals Proprietary Information 13Data & Tech Stack Drives Growth & Leverage Optimize Conversion Rate Email Largest Multi-Provider Dataset Multi-Channel Consumer Bid Automation Alignment Algorithms Algorithms Partnerships Minimize Cost per Maximize Bind Rate Acquisition Growth of Consumer Volume, Provider Diversity & Product Verticals Proprietary Information 13
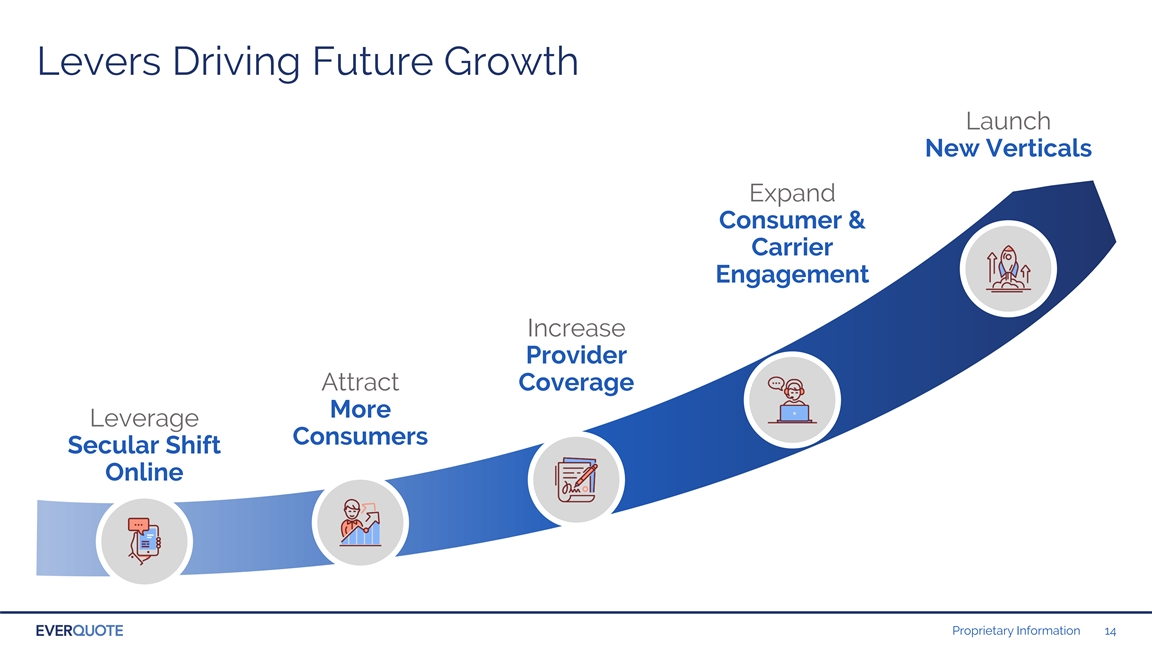
Levers Driving Future Growth Launch New Verticals Expand Consumer & Carrier Engagement Increase Provider Attract Coverage More Leverage Consumers Secular Shift Online Proprietary Information 14Levers Driving Future Growth Launch New Verticals Expand Consumer & Carrier Engagement Increase Provider Attract Coverage More Leverage Consumers Secular Shift Online Proprietary Information 14
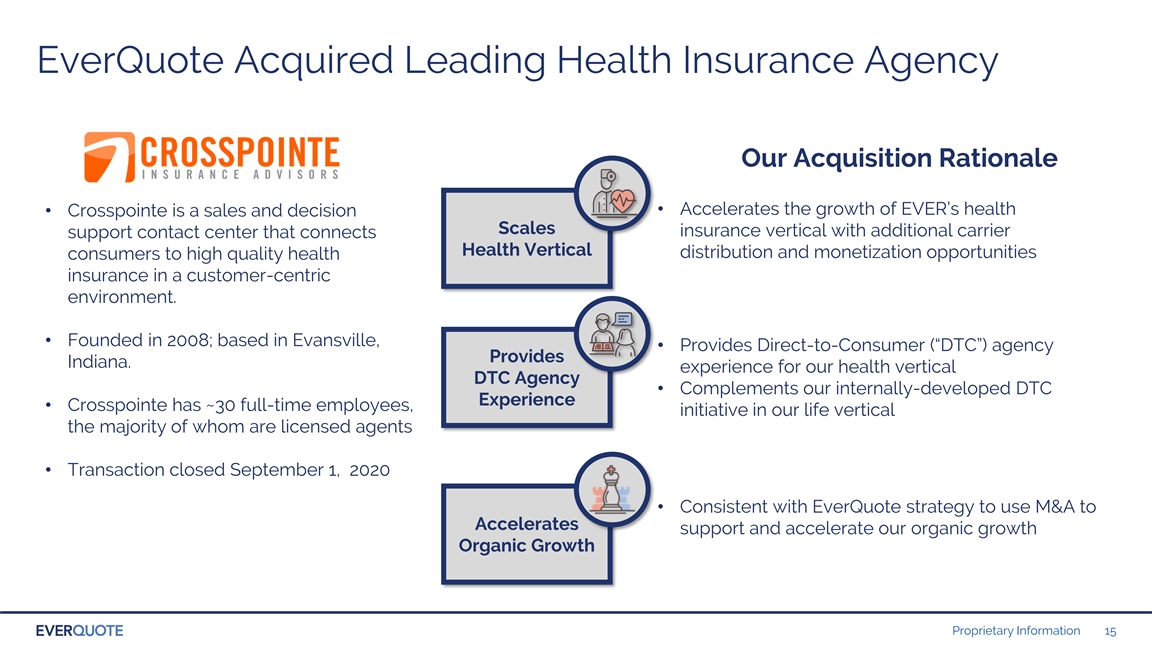
EverQuote Acquired Leading Health Insurance Agency Our Acquisition Rationale • Accelerates the growth of EVER’s health • Crosspointe is a sales and decision Scales insurance vertical with additional carrier support contact center that connects Health Vertical distribution and monetization opportunities consumers to high quality health insurance in a customer-centric environment. • Founded in 2008; based in Evansville, • Provides Direct-to-Consumer (“DTC”) agency Provides Indiana. experience for our health vertical DTC Agency • Complements our internally-developed DTC Experience • Crosspointe has ~30 full-time employees, initiative in our life vertical the majority of whom are licensed agents • Transaction closed September 1, 2020 • Consistent with EverQuote strategy to use M&A to Accelerates support and accelerate our organic growth Organic Growth Proprietary Information 15EverQuote Acquired Leading Health Insurance Agency Our Acquisition Rationale • Accelerates the growth of EVER’s health • Crosspointe is a sales and decision Scales insurance vertical with additional carrier support contact center that connects Health Vertical distribution and monetization opportunities consumers to high quality health insurance in a customer-centric environment. • Founded in 2008; based in Evansville, • Provides Direct-to-Consumer (“DTC”) agency Provides Indiana. experience for our health vertical DTC Agency • Complements our internally-developed DTC Experience • Crosspointe has ~30 full-time employees, initiative in our life vertical the majority of whom are licensed agents • Transaction closed September 1, 2020 • Consistent with EverQuote strategy to use M&A to Accelerates support and accelerate our organic growth Organic Growth Proprietary Information 15
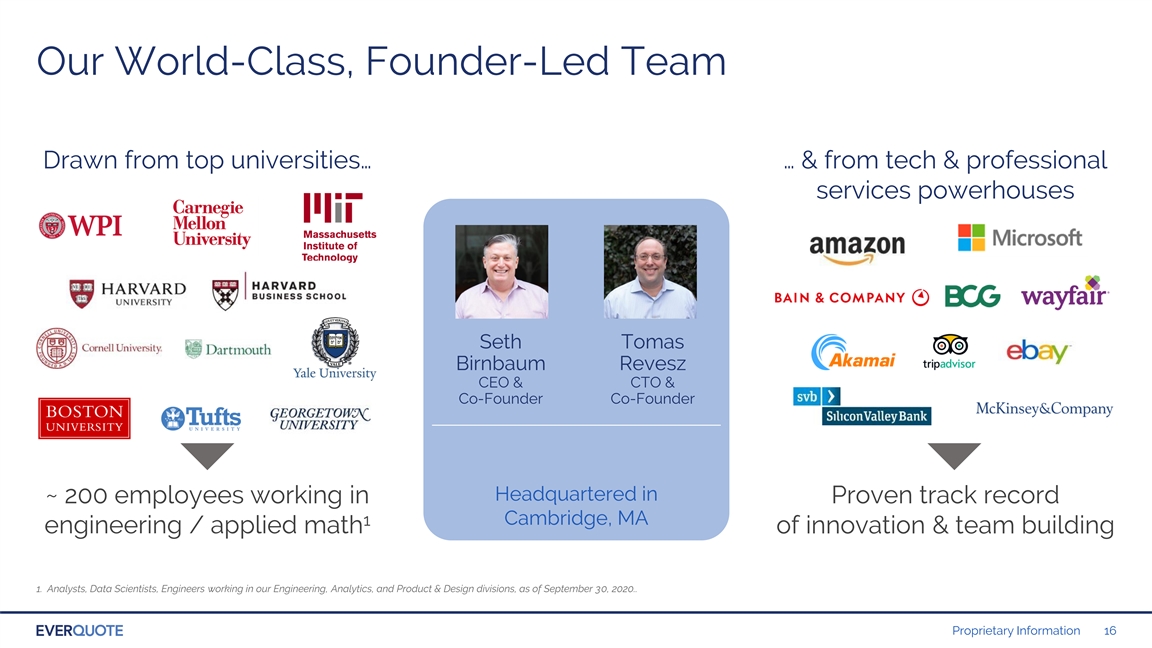
Our World-Class, Founder-Led Team Drawn from top universities… … & from tech & professional services powerhouses Seth Tomas Birnbaum Revesz CEO & CTO & Co-Founder Co-Founder Headquartered in ~ 200 employees working in Proven track record Cambridge, MA 1 engineering / applied math of innovation & team building 1. Analysts, Data Scientists, Engineers working in our Engineering, Analytics, and Product & Design divisions, as of September 30, 2020.. Proprietary Information 16Our World-Class, Founder-Led Team Drawn from top universities… … & from tech & professional services powerhouses Seth Tomas Birnbaum Revesz CEO & CTO & Co-Founder Co-Founder Headquartered in ~ 200 employees working in Proven track record Cambridge, MA 1 engineering / applied math of innovation & team building 1. Analysts, Data Scientists, Engineers working in our Engineering, Analytics, and Product & Design divisions, as of September 30, 2020.. Proprietary Information 16
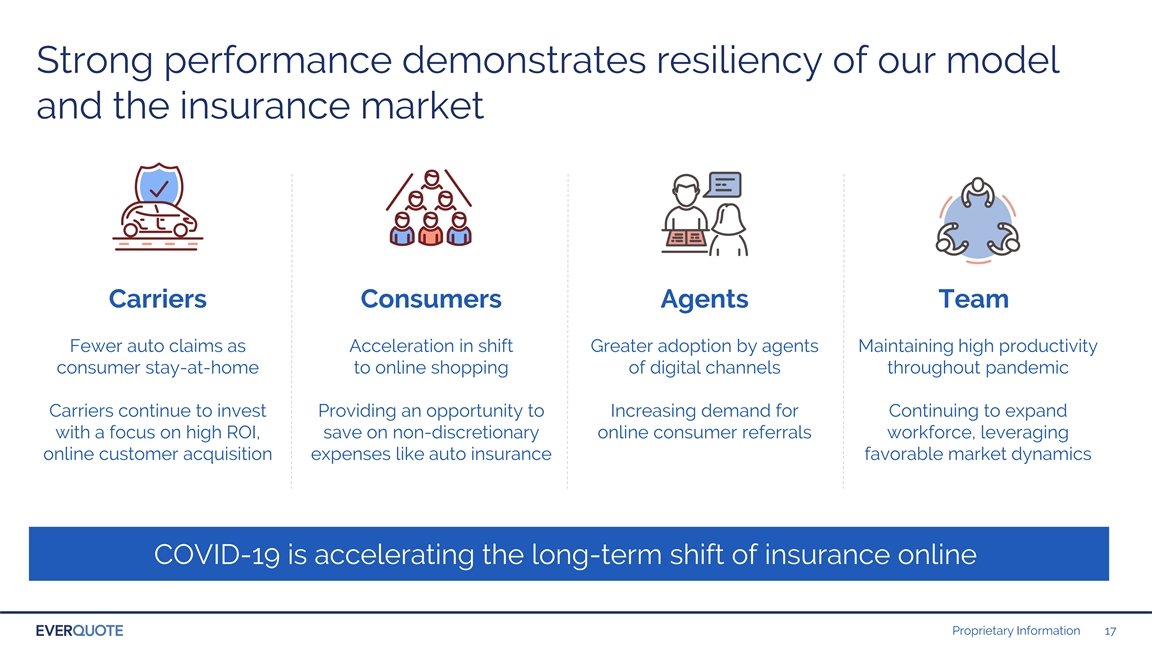
Strong performance demonstrates resiliency of our model and the insurance market Carriers Consumers Agents Team Fewer auto claims as Acceleration in shift Greater adoption by agents Maintaining high productivity consumer stay-at-home to online shopping of digital channels throughout pandemic Carriers continue to invest Providing an opportunity to Increasing demand for Continuing to expand with a focus on high ROI, save on non-discretionary online consumer referrals workforce, leveraging online customer acquisition expenses like auto insurance favorable market dynamics COVID-19 is accelerating the long-term shift of insurance online Proprietary Information 17Strong performance demonstrates resiliency of our model and the insurance market Carriers Consumers Agents Team Fewer auto claims as Acceleration in shift Greater adoption by agents Maintaining high productivity consumer stay-at-home to online shopping of digital channels throughout pandemic Carriers continue to invest Providing an opportunity to Increasing demand for Continuing to expand with a focus on high ROI, save on non-discretionary online consumer referrals workforce, leveraging online customer acquisition expenses like auto insurance favorable market dynamics COVID-19 is accelerating the long-term shift of insurance online Proprietary Information 17
Financial Overview Proprietary Information 18Financial Overview Proprietary Information 18
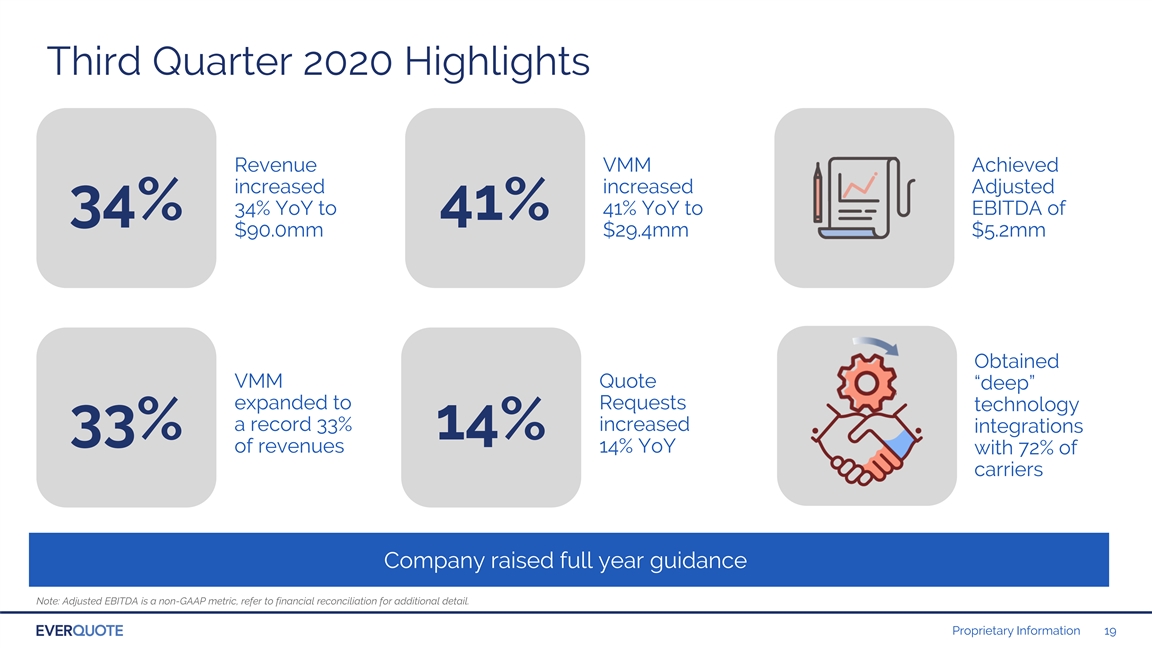
Third Quarter 2020 Highlights Revenue VMM Achieved increased increased Adjusted 34% YoY to 41% YoY to EBITDA of 34% 41% $90.0mm $29.4mm $5.2mm Obtained VMM Quote “deep” expanded to Requests technology a record 33% increased integrations 33% 14% of revenues 14% YoY with 72% of carriers Company raised full year guidance Note: Adjusted EBITDA is a non-GAAP metric, refer to financial reconciliation for additional detail. Proprietary Information 19Third Quarter 2020 Highlights Revenue VMM Achieved increased increased Adjusted 34% YoY to 41% YoY to EBITDA of 34% 41% $90.0mm $29.4mm $5.2mm Obtained VMM Quote “deep” expanded to Requests technology a record 33% increased integrations 33% 14% of revenues 14% YoY with 72% of carriers Company raised full year guidance Note: Adjusted EBITDA is a non-GAAP metric, refer to financial reconciliation for additional detail. Proprietary Information 19
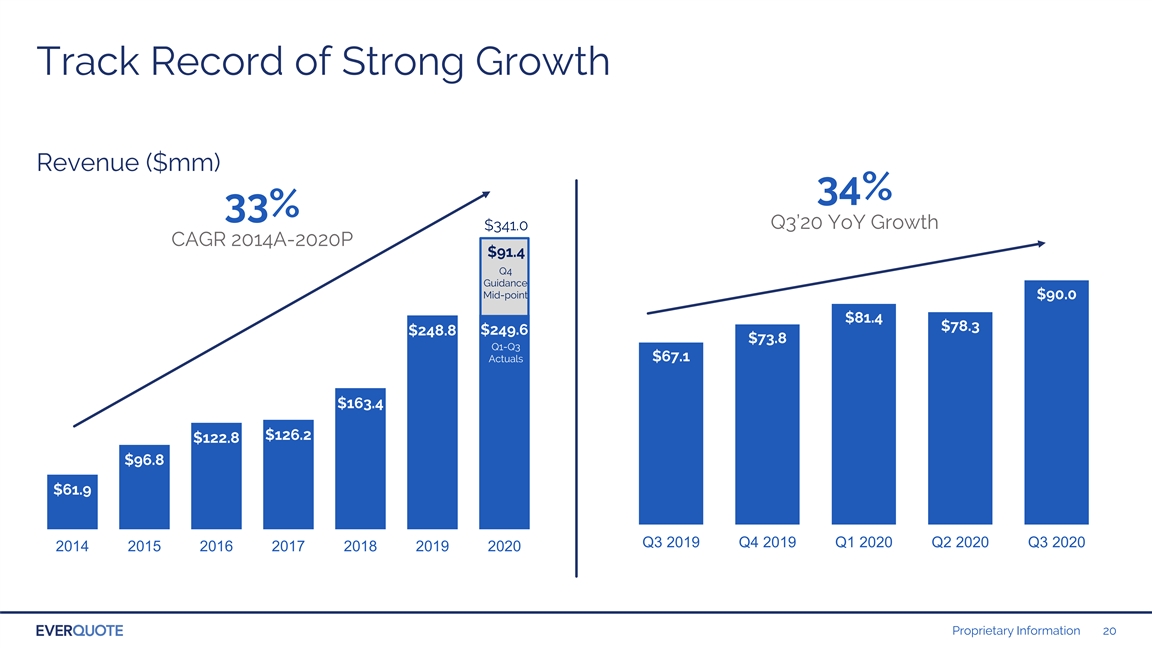
Track Record of Strong Growth Track Record of Strong Growth Revenue ($mm) 34% 33% Q3’20 YoY Growth $341.0 CAGR 2014A-2020P $91.4 Q4 Guidance Mid-point $90.0 $81.4 $78.3 $249.6 $248.8 $73.8 Q1-Q3 $67.1 Actuals $163.4 $126.2 $122.8 $96.8 $61.9 Q3 2019 Q4 2019 Q1 2020 Q2 2020 Q3 2020 2014 2015 2016 2017 2018 2019 2020 Proprietary Information 20Track Record of Strong Growth Track Record of Strong Growth Revenue ($mm) 34% 33% Q3’20 YoY Growth $341.0 CAGR 2014A-2020P $91.4 Q4 Guidance Mid-point $90.0 $81.4 $78.3 $249.6 $248.8 $73.8 Q1-Q3 $67.1 Actuals $163.4 $126.2 $122.8 $96.8 $61.9 Q3 2019 Q4 2019 Q1 2020 Q2 2020 Q3 2020 2014 2015 2016 2017 2018 2019 2020 Proprietary Information 20
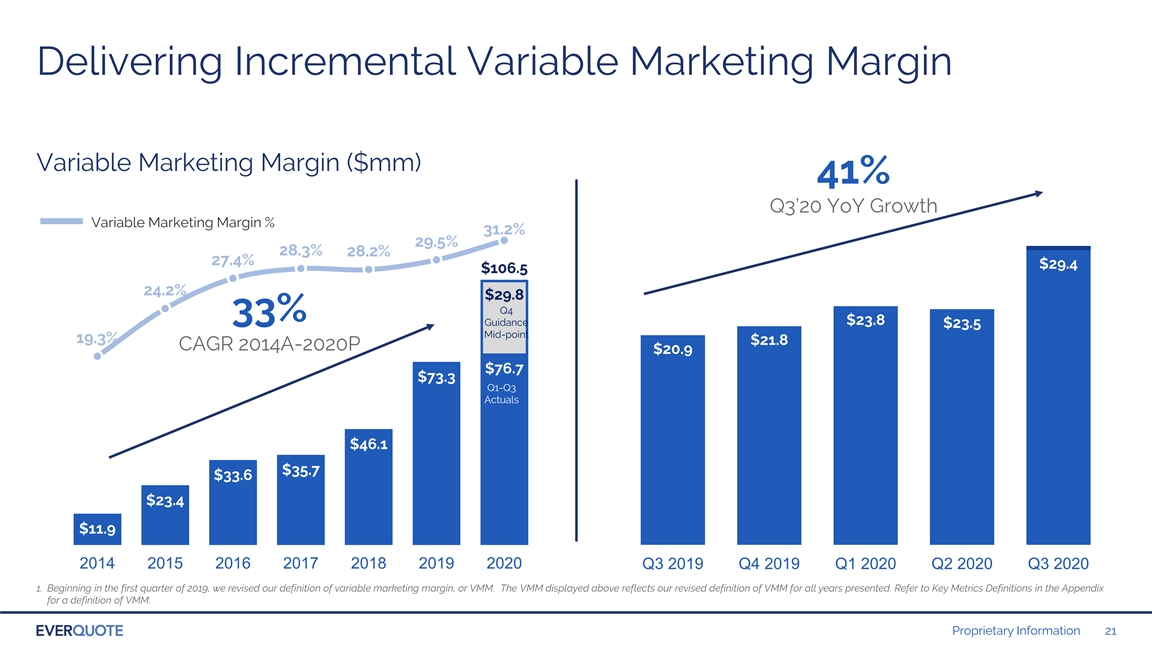
Delivering Incremental Variable Marketing Margin Variable Marketing Margin ($mm) 41% Q3’20 YoY Growth Variable Marketing Margin % 31.2% 29.5% $120 28.3% 28.2% 27.4% $29.4 $106.5 24.2% $100 $29.8 Q4 33% $23.8 Guidance $23.5 Mid-point 19.3% $21.8 $80 CAGR 2014A-2020P $20.9 $76.7 $73.3 Q1-Q3 $60 Actuals $40 $46.1 $35.7 $33.6 $20 $23.4 $11.9 $0 2014 2015 2016 2017 2018 2019 2020 Q3 2019 Q4 2019 Q1 2020 Q2 2020 Q3 2020 1. Beginning in the first quarter of 2019, we revised our definition of variable marketing margin, or VMM. The VMM displayed above reflects our revised definition of VMM for all years presented. Refer to Key Metrics Definitions in the Appendix for a definition of VMM. Proprietary Information 21Delivering Incremental Variable Marketing Margin Variable Marketing Margin ($mm) 41% Q3’20 YoY Growth Variable Marketing Margin % 31.2% 29.5% $120 28.3% 28.2% 27.4% $29.4 $106.5 24.2% $100 $29.8 Q4 33% $23.8 Guidance $23.5 Mid-point 19.3% $21.8 $80 CAGR 2014A-2020P $20.9 $76.7 $73.3 Q1-Q3 $60 Actuals $40 $46.1 $35.7 $33.6 $20 $23.4 $11.9 $0 2014 2015 2016 2017 2018 2019 2020 Q3 2019 Q4 2019 Q1 2020 Q2 2020 Q3 2020 1. Beginning in the first quarter of 2019, we revised our definition of variable marketing margin, or VMM. The VMM displayed above reflects our revised definition of VMM for all years presented. Refer to Key Metrics Definitions in the Appendix for a definition of VMM. Proprietary Information 21
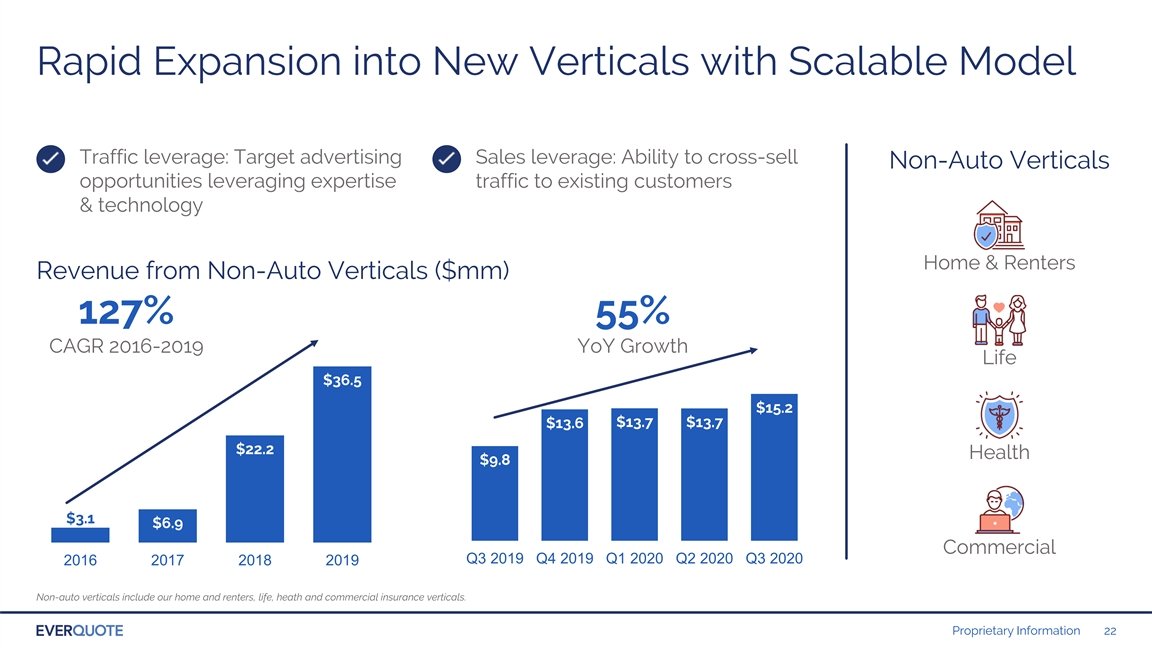
Rapid Expansion into New Verticals with Scalable Model Traffic leverage: Target advertising Sales leverage: Ability to cross-sell Non-Auto Verticals opportunities leveraging expertise traffic to existing customers & technology Home & Renters Revenue from Non-Auto Verticals ($mm) 127% 55% CAGR 2016-2019 YoY Growth Life $36.5 $15.2 $13.7 $13.7 $13.6 $22.2 Health $9.8 $3.1 $6.9 Commercial Q3 2019 Q4 2019 Q1 2020 Q2 2020 Q3 2020 2016 2017 2018 2019 Non-auto verticals include our home and renters, life, heath and commercial insurance verticals. Proprietary Information 22Rapid Expansion into New Verticals with Scalable Model Traffic leverage: Target advertising Sales leverage: Ability to cross-sell Non-Auto Verticals opportunities leveraging expertise traffic to existing customers & technology Home & Renters Revenue from Non-Auto Verticals ($mm) 127% 55% CAGR 2016-2019 YoY Growth Life $36.5 $15.2 $13.7 $13.7 $13.6 $22.2 Health $9.8 $3.1 $6.9 Commercial Q3 2019 Q4 2019 Q1 2020 Q2 2020 Q3 2020 2016 2017 2018 2019 Non-auto verticals include our home and renters, life, heath and commercial insurance verticals. Proprietary Information 22
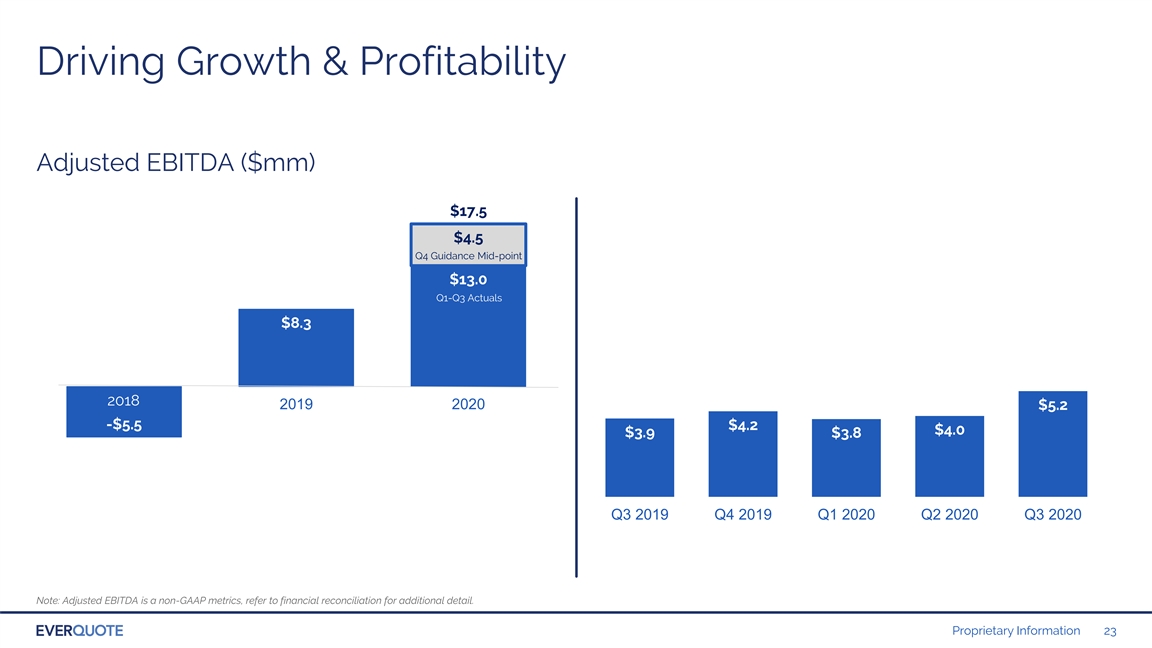
Driving Growth & Profitability Adjusted EBITDA ($mm) $17.5 $4.5 Q4 Guidance Mid-point $13.0 Q1-Q3 Actuals $8.3 2018 2018 2019 2020 $5.2 -$5.5 $4.2 $4.0 $3.9 $3.8 Q3 2019 Q4 2019 Q1 2020 Q2 2020 Q3 2020 Note: Adjusted EBITDA is a non-GAAP metrics, refer to financial reconciliation for additional detail. Proprietary Information 23Driving Growth & Profitability Adjusted EBITDA ($mm) $17.5 $4.5 Q4 Guidance Mid-point $13.0 Q1-Q3 Actuals $8.3 2018 2018 2019 2020 $5.2 -$5.5 $4.2 $4.0 $3.9 $3.8 Q3 2019 Q4 2019 Q1 2020 Q2 2020 Q3 2020 Note: Adjusted EBITDA is a non-GAAP metrics, refer to financial reconciliation for additional detail. Proprietary Information 23

NASDAQ: EVER Proprietary Information 24NASDAQ: EVER Proprietary Information 24
Appendix Proprietary Information 25Appendix Proprietary Information 25
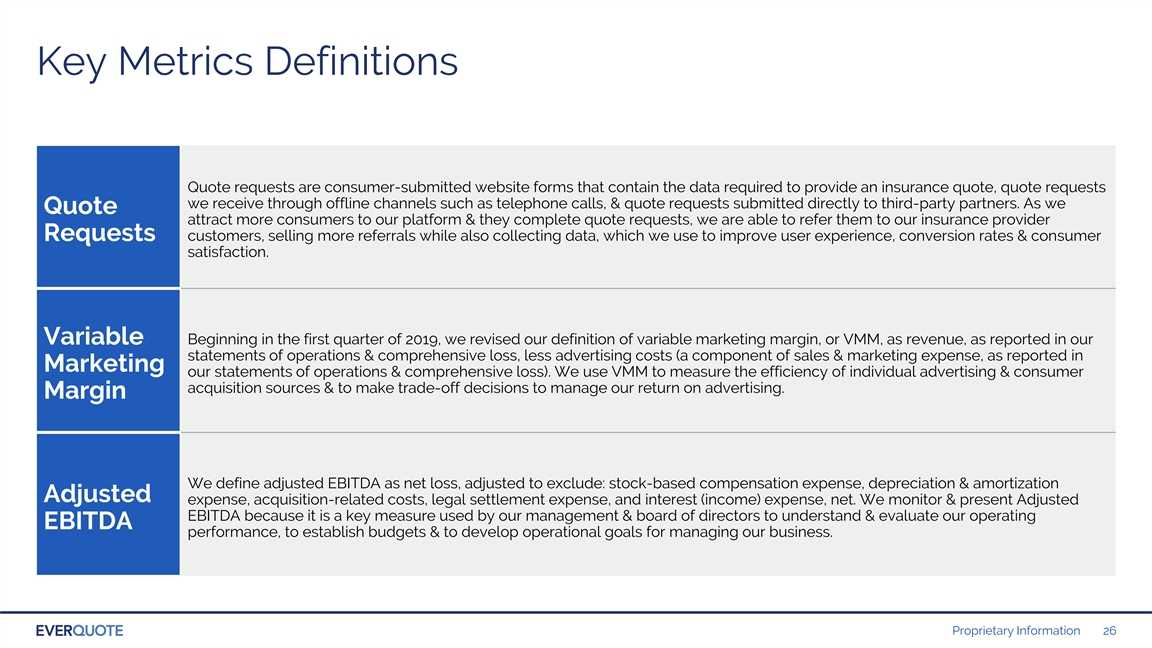
Key Metrics Definitions Quote requests are consumer-submitted website forms that contain the data required to provide an insurance quote, quote requests we receive through offline channels such as telephone calls, & quote requests submitted directly to third-party partners. As we Quote attract more consumers to our platform & they complete quote requests, we are able to refer them to our insurance provider Requests customers, selling more referrals while also collecting data, which we use to improve user experience, conversion rates & consumer satisfaction. Beginning in the first quarter of 2019, we revised our definition of variable marketing margin, or VMM, as revenue, as reported in our Variable statements of operations & comprehensive loss, less advertising costs (a component of sales & marketing expense, as reported in Marketing our statements of operations & comprehensive loss). We use VMM to measure the efficiency of individual advertising & consumer acquisition sources & to make trade-off decisions to manage our return on advertising. Margin We define adjusted EBITDA as net loss, adjusted to exclude: stock-based compensation expense, depreciation & amortization Adjusted expense, acquisition-related costs, legal settlement expense, and interest (income) expense, net. We monitor & present Adjusted EBITDA because it is a key measure used by our management & board of directors to understand & evaluate our operating EBITDA performance, to establish budgets & to develop operational goals for managing our business. Proprietary Information 26Key Metrics Definitions Quote requests are consumer-submitted website forms that contain the data required to provide an insurance quote, quote requests we receive through offline channels such as telephone calls, & quote requests submitted directly to third-party partners. As we Quote attract more consumers to our platform & they complete quote requests, we are able to refer them to our insurance provider Requests customers, selling more referrals while also collecting data, which we use to improve user experience, conversion rates & consumer satisfaction. Beginning in the first quarter of 2019, we revised our definition of variable marketing margin, or VMM, as revenue, as reported in our Variable statements of operations & comprehensive loss, less advertising costs (a component of sales & marketing expense, as reported in Marketing our statements of operations & comprehensive loss). We use VMM to measure the efficiency of individual advertising & consumer acquisition sources & to make trade-off decisions to manage our return on advertising. Margin We define adjusted EBITDA as net loss, adjusted to exclude: stock-based compensation expense, depreciation & amortization Adjusted expense, acquisition-related costs, legal settlement expense, and interest (income) expense, net. We monitor & present Adjusted EBITDA because it is a key measure used by our management & board of directors to understand & evaluate our operating EBITDA performance, to establish budgets & to develop operational goals for managing our business. Proprietary Information 26
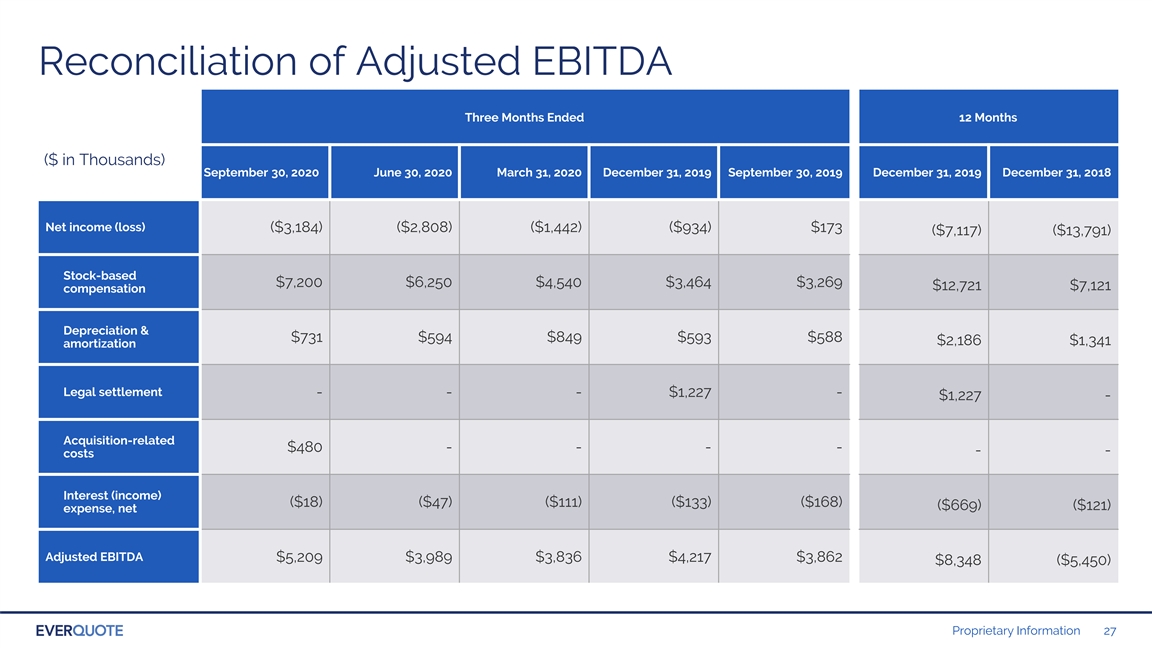
Reconciliation of Adjusted EBITDA Three Months Ended 12 Months ($ in Thousands) September 30, 2020 June 30, 2020 March 31, 2020 December 31, 2019 September 30, 2019 December 31, 2019 December 31, 2018 Net income (loss) ($3,184) ($2,808) ($1,442) ($934) $173 ($7,117) ($13,791) Stock-based $7,200 $6,250 $4,540 $3,464 $3,269 $12,721 $7,121 compensation Depreciation & $731 $594 $849 $593 $588 $2,186 $1,341 amortization Legal settlement - - - $1,227 - $1,227 - Acquisition-related $480 - - - - - - costs Interest (income) ($18) ($47) ($111) ($133) ($168) ($669) ($121) expense, net Adjusted EBITDA $5,209 $3,989 $3,836 $4,217 $3,862 $8,348 ($5,450) Proprietary Information 27Reconciliation of Adjusted EBITDA Three Months Ended 12 Months ($ in Thousands) September 30, 2020 June 30, 2020 March 31, 2020 December 31, 2019 September 30, 2019 December 31, 2019 December 31, 2018 Net income (loss) ($3,184) ($2,808) ($1,442) ($934) $173 ($7,117) ($13,791) Stock-based $7,200 $6,250 $4,540 $3,464 $3,269 $12,721 $7,121 compensation Depreciation & $731 $594 $849 $593 $588 $2,186 $1,341 amortization Legal settlement - - - $1,227 - $1,227 - Acquisition-related $480 - - - - - - costs Interest (income) ($18) ($47) ($111) ($133) ($168) ($669) ($121) expense, net Adjusted EBITDA $5,209 $3,989 $3,836 $4,217 $3,862 $8,348 ($5,450) Proprietary Information 27