UNITED STATES
SECURITIES AND EXCHANGE COMMISSION
Washington, D.C. 20549
FORM
CURRENT REPORT
Pursuant to Section 13 or 15 (d)
of the Securities Exchange Act of 1934
Date of Report (Date of earliest event reported):
(Exact name of registrant as specified in its charter) |
(State or other jurisdiction of incorporation) | (Commission File Number) | (IRS Employer Identification No.) |
(Address of Principal Executive Offices) | (Zip Code) |
Registrant’s Telephone Number, including
Area Code: (
Check the appropriate box below if the Form 8-K filing is intended to simultaneously satisfy the filing obligation of the registrant under any of the following provisions:
Written communications pursuant to Rule 425 under the Securities Act (17 CFR 230.425) | ||
Soliciting material pursuant to Rule 14a-12 under the Exchange Act (17 CFR 240.14a-12) | ||
Pre-commencement communications pursuant to Rule 14d-2(b) under the Exchange Act (17 CFR 240.14d-2(b)) | ||
Pre-commencement communications pursuant to Rule 13e-4(c) under the Exchange Act (17 CFR 240.13e-4(c)) |
Securities registered pursuant to Section 12(b) of the Act:
Title of Each Class | Trading Symbol | Name of Each Exchange on which Registered |
Indicate by check mark whether the registrant is an emerging growth company as defined in Rule 405 of the Securities Act of 1933 (17 CFR §230.405) or Rule 12b-2 of the Securities Exchange Act of 1934 (17 CFR §240.12b-2).
Emerging growth company
If an emerging growth company, indicate by check mark if the registrant has elected not to use the extended transition period for complying with any new or revised financial accounting standards provided pursuant to Section 13(a) of the Exchange Act. ¨
Item 2.02 Results of Operations and Financial Condition
On May 10, 2023, the Company issued a press release announcing our financial results for the quarter ended March 31, 2023. A copy of the press release is attached as Exhibit 99.1, and the information contained in Exhibit 99.1 is incorporated herein by reference.
The information furnished pursuant to this Item 2.02, including Exhibit 99.1, shall not be deemed to be “filed” for the purposes of Section 18 of the Securities Exchange Act of 1934, as amended (the “Exchange Act”), or otherwise subject to the liabilities of that section, nor shall such information be deemed incorporated by reference in any filing under the Securities Act of 1933, as amended (the “Securities Act”), or the Exchange Act, except as shall be expressly set forth by specific reference in such filing.
Item 7.01 Regulation FD Disclosure
On May 10, 2023, the Company posted an investor presentation on the investor relations section of its website at babcock.com. A copy of the presentation is attached as Exhibit 99.2, and the information contained in Exhibit 99.2 is incorporated herein by reference.
The information furnished pursuant to this Item 7.01, including Exhibit 99.2, shall not be deemed “filed” for purposes of Section 18 of the Exchange Act or incorporated by reference in any filing under the Securities Act or the Exchange Act, except as shall be expressly set forth by specific reference in such filing.
Item 9.01 Financial Statements and Exhibits
(d) Exhibits
Exhibit No. | Description | |
99.1 | Press Release dated May 10, 2023 | |
99.2 | Investor Presentation | |
104 | Cover Page Interactive Data File (formatted as Inline XBRL and contained in Exhibit 101) |
Signatures
Pursuant to the requirements of the Securities Exchange Act of 1934, the registrant has duly caused this report to be signed on its behalf by the undersigned thereunto duly authorized.
BABCOCK & WILCOX ENTERPRISES, INC. | ||
May 10, 2023 | By: | /s/ Louis Salamone |
Louis Salamone | ||
Executive Vice President, Chief Financial Officer and Chief Accounting Officer (Principal Accounting Officer and Duly Authorized Representative) |
Exhibit 99.1
News Release
Babcock & Wilcox Enterprises Reports First Quarter 2023 Results
· | Revenues, bookings, backlog, and Adjusted EBITDA significantly improved compared to the first quarter of 2022 and exceeded Company expectations |
Q1 2023 Highlights and Outlook:
– | Revenues of $257.2 million, a 26% improvement compared to the first quarter of 2022 |
– | Net loss of $12.5 million, compared to a net loss of $8.7 million in the first quarter of 2022 |
– | Loss per share of $0.18, compared to a loss per share of $0.14 in the first quarter of 2022 |
– | Consolidated adjusted EBITDA of $14.2 million, compared to $12.5 million in the first quarter of 2022 |
– | Bookings of $266 million, an 11% improvement compared to first quarter bookings in 2022 |
– | Ending backlog of $663 million, over a 15% increase compared to backlog at the end of the first quarter of 2022 |
– | Reiterates Full Year 2023 Adjusted EBITDA target of $100 million to $120 million |
(AKRON, Ohio – May 10, 2023) – Babcock & Wilcox Enterprises, Inc. ("B&W" or the "Company") (NYSE: BW) announced results for the first quarter of 2023.
"We exceeded our first quarter expectations delivering strong results highlighted by increased volumes across our Renewable and Environmental segments, which helped drive consolidated revenue and adjusted EBITDA above expectations,” said Kenneth Young, B&W's Chairman and Chief Executive Officer. “Our parts and services bookings within all our segments was the highest since 2016. We also realized double digit revenue growth across all our segments. Our progress through the first quarter further supports the advancement of our strategic growth initiatives and positions us well to achieve our previously stated full-year adjusted EBITDA targets.”
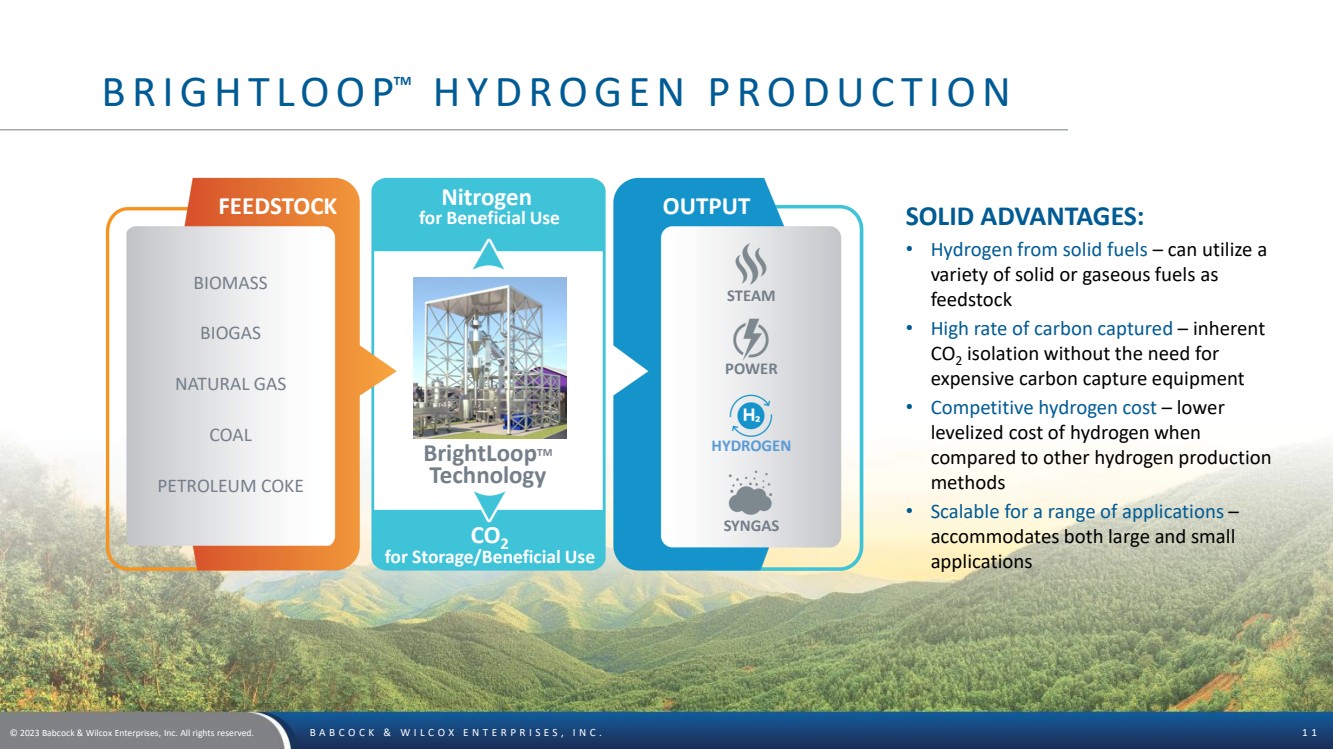
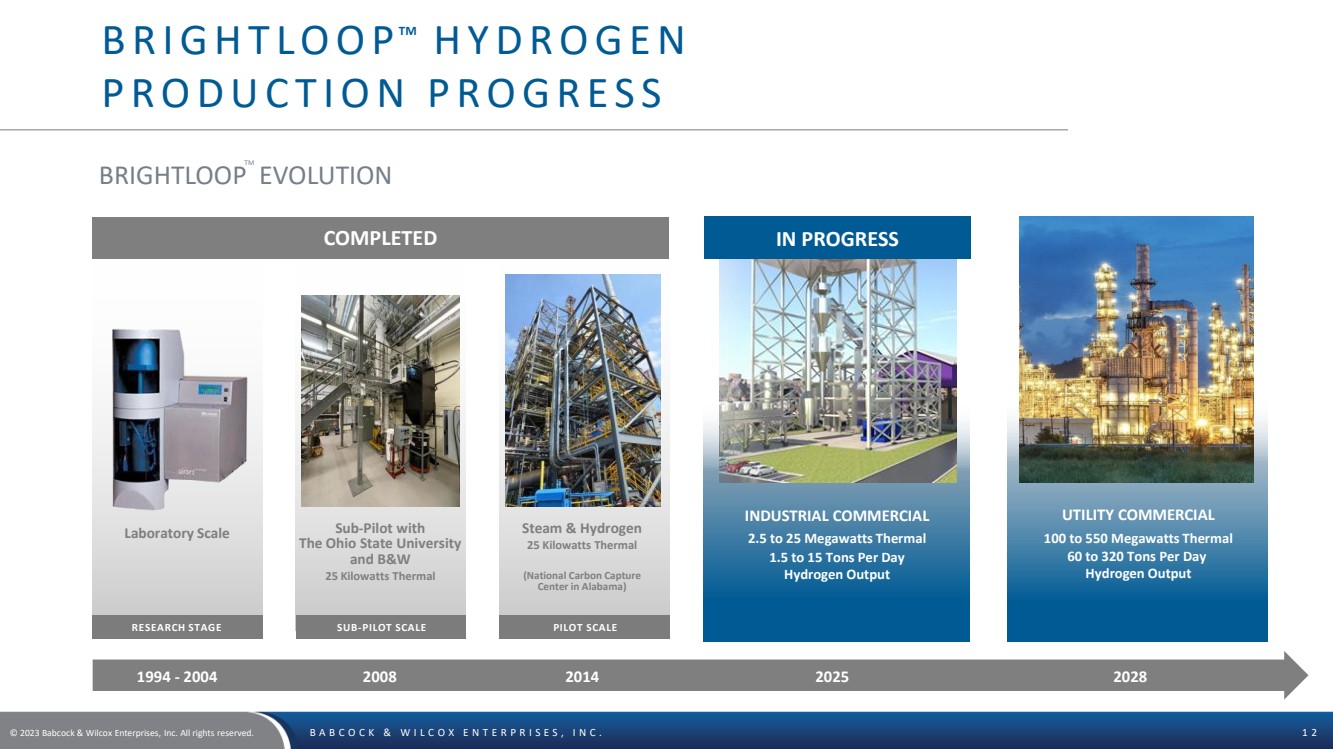
“As we continue to execute our long-term strategic plans within our Renewable and Environmental businesses, we are pleased with the significant traction our BrightLoop™ technology has received to date. Most notably, we recently announced a commercial project with Black Hills Energy (BHE) in which B&W’s BrightLoop™ hydrogen generation technology was selected for a proposed project to produce hydrogen gas from coal and capture carbon dioxide emissions,” added Kenneth Young. “This project not only highlights the transformational technology we possess but also demonstrates utility market interest in our clean power production and carbon capture capabilities. We look forward to scaling this product offering and working in tandem with our customers to provide the solutions they need to enhance energy security and deliver efficient energy to their customers, while also significantly reducing green-house gas emissions.”
“While supply chain pressures continue, our success in qualifying additional suppliers has enabled us to capitalize on growing customer demand across all of our business segments and reinforces our expectations for an improved full-year performance. We remain committed to being a leader in the global clean energy transition and energy security and see continued opportunities for growth as we pursue our expanded pipeline of $8 billion in identified global project opportunities.”
Q1 2023 Financial Summary
Consolidated revenues in the first quarter of 2023 were $257.2 million, a 26% improvement compared to the first quarter of 2022, primarily attributable to higher volumes in our Renewable segment due to B&W Renewable parts and services and our project-based business, higher overall volume in our Environmental segment, increased Thermal segment volume and a higher level of construction activity. Net loss in the first quarter of 2023 was $12.5 million, compared to net loss of $8.7 million in the first quarter of 2022, primarily related to foreign exchange losses in the current period and non-cash expense related to pensions. Loss per share in the first quarter of 2023 was $0.18 compared to a loss per share of $0.14 in the first quarter of 2022. GAAP operating income in the first quarter of 2023 was $1.4 million compared to operating loss of $6.8 million in the first quarter of 2022. Adjusted EBITDA was $14.2 million compared to $12.5 million in the first quarter of 2022. Bookings in the first quarter of 2023 were $266 million, an 11% increase compared to first quarter bookings in 2022. Ending backlog was $663 million, over a 15% increase compared to backlog at the end of the first quarter of 2022. All amounts referred to in this release are on a continuing operations basis, unless otherwise noted. Reconciliations of net income, the most directly comparable GAAP measure, to adjusted EBITDA for the Company's segments, are provided in the exhibits to this release.
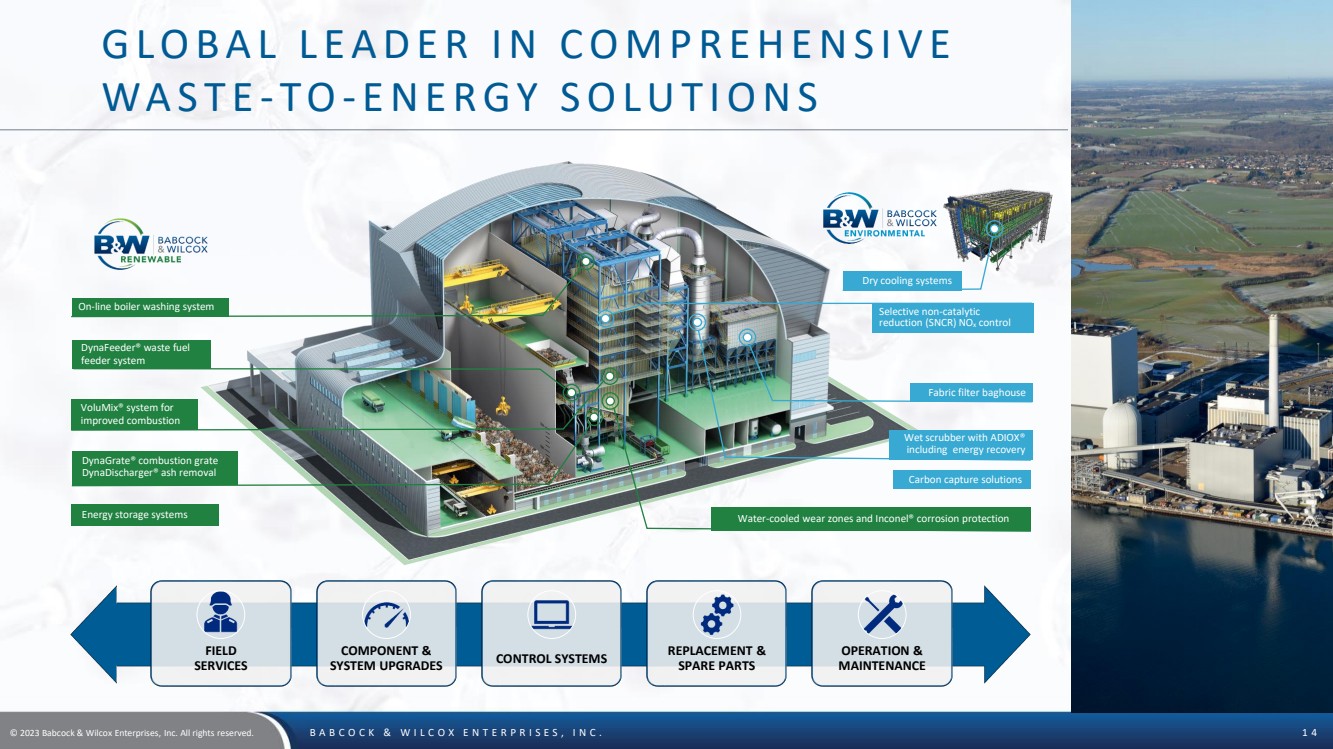
Babcock & Wilcox Renewable segment revenues were $100.1 million for the first quarter of 2023, an increase of 47% compared to $68.0 million in the first quarter of 2022. The increase in revenue is primarily due to higher volume of new-build projects and the increase in revenues associated with our Renewable parts and services business. Adjusted EBITDA in the first quarter of 2023 was $4.9 million compared to $2.0 million in the first quarter of 2022, primarily due to a higher volume of revenue as described above offset somewhat by an increase in expenses, to support the growth in the business. The higher revenue levels also increased shared overhead and SG&A allocations to the segment which are based on revenue.
Babcock & Wilcox Environmental segment revenues were $39.4 million in the first quarter of 2023, an increase of 13% compared to $34.9 million in the first quarter of 2022. The increase is primarily driven by higher overall volume of dry cooling technology projects across the Environmental segment. Adjusted EBITDA in the first quarter of 2023 was $1.9 million, compared to $1.4 million in the first quarter of 2022, primarily driven by higher revenue volume described above offset with higher levels of shared overhead and SG&A allocated to the segment.
Babcock & Wilcox Thermal segment revenues were $119.2 million in the first quarter of 2023, an increase of 17% compared to $102.2 million in the first quarter of 2022. The revenue increase is attributable to higher level of volume in our construction project business and Optimus Industries. Adjusted EBITDA in the first quarter of 2023 was $13.7 million, a decrease of 3% compared to $14.2 million in the first quarter of 2022, primarily attributable higher expenses related to business growth.
Liquidity and Balance Sheet
At March 31, 2023, the Company had total debt of $351.7 million and a cash, cash equivalents and restricted cash balance of $91.1 million.
Impacts of Market Conditions
Management continues to adapt to macroeconomic conditions, including rising inflation, higher interest rates, foreign exchange rate fluctuations and the impact of the ongoing conflict in Ukraine and the COVID-19 pandemic, all of which impacted the Company during the first three months of 2023. The COVID-19 pandemic has continued to create challenges for us in countries that have outbreak mitigation strategies, namely, countries in our Asia-Pacific region, which led to temporary project postponements or limited on-site activities and has continued to impact results in this region. Additionally, the Company has experienced negative impacts to its global supply chains as a result of COVID-19, the war in Ukraine, Russia-related supply chain shortages and other factors, including disruptions to the manufacturing, supply, distribution, transportation and delivery of its products. The Company has also observed delays and disruptions of its service providers and negative impacts to pricing of certain of its products. These delays and disruptions have had, and could continue to have, an adverse impact on the Company’s ability to meet customers’ demands. We are continuing to actively monitor the impact of these market conditions on current and future periods and actively manage costs and our liquidity position to provide additional flexibility while still supporting our customers and their specific needs. The duration and scope of these conditions cannot be predicted, and therefore, any anticipated negative financial impact to the Company’s operating results cannot be reasonably estimated.
Earnings Call Information
B&W plans to host a conference call and webcast on Wednesday, May 10, 2023 at 8 a.m. ET to discuss the Company’s first quarter 2023 results. The listen-only audio of the conference call will be broadcast live via the Internet on B&W’s Investor Relations site. The dial-in number for participants in the U.S. is (833) 470-1428; the dial-in number for participants in Canada is (833) 950-0062; the dial-in number for participants in all other locations is (929) 526-1599. The conference ID for all participants is 504866. A replay of this conference call will remain accessible in the investor relations section of the Company’s website for a limited time.
Non-GAAP Financial Measures
The Company uses non-GAAP financial measures internally to evaluate its performance and in making financial and operational decisions. When viewed in conjunction with GAAP results and the accompanying reconciliation, the Company believes that its presentation of these measures provides investors with greater transparency and a greater understanding of factors affecting its financial condition and results of operations than GAAP measures alone. Additionally, the Company redefined its definition of adjusted EBITDA to eliminate the effects of certain items including the loss from a non-strategic business, interest on letters of credit included in cost of operations and loss on business held for sale. Prior period results have been revised to conform with the revised definition and present separate reconciling items in our reconciliation, including business transition costs. The presentation of non-GAAP financial measures should not be considered in isolation or as a substitute for the Company’s related financial results prepared in accordance with GAAP.
This release presents adjusted EBITDA for each business segment, which are non-GAAP financial measures. Adjusted EBITDA on a consolidated basis is defined as the sum of the Adjusted EBITDA for each of the segments, further adjusted for corporate allocations and research and development costs. At a segment level, the adjusted EBITDA presented is consistent with the way the Company's chief operating decision maker reviews the results of operations and makes strategic decisions about the business and is calculated as earnings before interest expense, tax, depreciation and amortization adjusted for items such as gains or losses arising from the sale of non-income producing assets, net pension benefits, restructuring costs, impairments, gains and losses on debt extinguishment, costs related to financial consulting, research and development costs and other costs that may not be directly controllable by segment management and are not allocated to the segment. The Company presented consolidated Adjusted EBITDA because it believes it is useful to investors to help facilitate comparisons of the ongoing, operating performance before corporate overhead and other expenses not attributable to the operating performance of the Company's revenue generating segments. This release also presents certain targets for our Adjusted EBITDA in the future; these targets are not intended as guidance regarding how the Company believes the business will perform. The Company is unable to reconcile these targets to their GAAP counterparts without unreasonable effort and expense.
Bookings and Backlog
Bookings and backlog are our measure of remaining performance obligations under our sales contracts. It is possible that our methodology for determining bookings and backlog may not be comparable to methods used by other companies.
We generally include expected revenue from contracts in our backlog when we receive written confirmation from our customers authorizing the performance of work and committing the customers to payment for work performed. Backlog may not be indicative of future operating results, and contracts in our backlog may be canceled, modified or otherwise altered by customers. Backlog can vary significantly from period to period, particularly when large new build projects or operations and maintenance contracts are booked because they may be fulfilled over multiple years. Because we operate globally, our backlog is also affected by changes in foreign currencies each period. We do not include orders of our unconsolidated joint ventures in backlog. The Company is in the process of exiting its only remaining fixed fee Operational and Maintenance Contract in our Renewable segment. A similar contract was exited as of December 31, 2022. The company believes it is useful to exclude the impact of this contract on our operating results as well as our backlog in order to highlight the performance of the business.
Bookings represent changes to the backlog. Bookings include additions from booking new business, subtractions from customer cancellations or modifications, changes in estimates of liquidated damages that affect selling price and revaluation of backlog denominated in foreign currency. We believe comparing bookings on a quarterly basis or for periods less than one year is less meaningful than for longer periods, and that shorter-term changes in bookings may not necessarily indicate a material trend.
Forward-Looking Statements
This press release contains forward-looking statements within the meaning of the Private Securities Litigation Reform Act of 1995. All statements other than statements of historical or current fact included in this release are forward-looking statements. You should not place undue reliance on these statements. Forward-looking statements include words such as “expect,” “intend,” “plan,” “likely,” “seek,” “believe,” “project,” “forecast,” “target,” “goal,” “potential,” “estimate,” “may,” “might,” “will,” “would,” “should,” “could,” “can,” “have,” “due,” “anticipate,” “assume,” “contemplate,” “continue” and other words and terms of similar meaning in connection with any discussion of the timing or nature of future operational performance or other events.
These forward-looking statements are based on management’s current expectations and involve a number of risks and uncertainties, including, among other things, the impact of global macroeconomic conditions, including inflation and volatility in the capital markets; the impact of the ongoing conflict in Ukraine; our ability to integrate acquired businesses and the impact of those acquired businesses on our cash flows, results of operations and financial condition, including our recent acquisitions of Babcock & Wilcox Solar Energy, Inc., Babcock & Wilcox Renewable Service A/S, Fossil Power Systems, Inc., Optimus Industries, LLC and certain assets of Hamon Research-Cottrell, Inc.; our recognition of any asset impairments as a result of any decline in the value of our assets or our efforts to dispose of any assets in the future; our ability to obtain and maintain sufficient financing to provide liquidity to meet our business objectives, surety bonds, letters of credit and similar financing; our ability to comply with the requirements of, and to service the indebtedness under, our debt facility agreements; our ability to pay dividends on our 7.75% Series A Cumulative Perpetual Preferred Stock; our ability to make interest payments on our 8.125% senior notes due 2026 and our 6.50% notes due 2026; the highly competitive nature of our businesses and our ability to win work, including identified project opportunities in our pipeline; general economic and business conditions, including changes in interest rates and currency exchange rates; cancellations of and adjustments to backlog and the resulting impact from using backlog as an indicator of future earnings; our ability to perform contracts on time and on budget, in accordance with the schedules and terms established by the applicable contracts with customers; failure by third-party subcontractors, partners or suppliers to perform their obligations on time and as specified; delays initiated by our customers; our ability to successfully resolve claims by vendors for goods and services provided and claims by customers for items under warranty; our ability to realize anticipated savings and operational benefits from our restructuring plans, and other cost savings initiatives; our ability to successfully address productivity and schedule issues in our B&W Renewable, B&W Environmental and B&W Thermal segments; our ability to successfully partner with third parties to win and execute contracts within our B&W Environmental, B&W Renewable and B&W Thermal segments; changes in our effective tax rate and tax positions, including any limitation on our ability to use our net operating loss carryforwards and other tax assets; our ability to successfully manage research and development projects and costs, including our efforts to successfully develop and commercialize new technologies and products; the operating risks normally incident to our lines of business, including professional liability, product liability, warranty and other claims against us; difficulties we may encounter in obtaining regulatory or other necessary permits or approvals; changes in actuarial assumptions and market fluctuations that affect our net pension liabilities and income; our ability to successfully compete with current and future competitors; our ability to negotiate and maintain good relationships with labor unions; changes in pension and medical expenses associated with our retirement benefit programs; social, political, competitive and economic situations in foreign countries where we do business or seek new business; the impact of COVID-19 or other similar global health crises, and the other factors specified and set forth under "Risk Factors" in our periodic reports filed with the Securities and Exchange Commission, including our most recent annual report on Form 10-K filed on March 16, 2023.
These forward-looking statements are made based upon detailed assumptions and reflect management’s current expectations and beliefs. While we believe that these assumptions underlying the forward-looking statements are reasonable, we caution that it is very difficult to predict the impact of known factors, and it is impossible for us to anticipate all factors that could affect actual results. The forward-looking statements included herein are made only as of the date hereof. We undertake no obligation to publicly update or revise any forward-looking statement as a result of new information, future events, or otherwise, except as required by law.
About B&W Enterprises, Inc.
Headquartered in Akron, Ohio, Babcock & Wilcox Enterprises, Inc. is a leader in energy and environmental products and services for power and industrial markets worldwide. Follow us on LinkedIn and learn more at babcock.com.
# # #
Investor Contact: | Media Contact: |
Lou Salamone, CFO | Ryan Cornell |
Babcock & Wilcox Enterprises, Inc. | Public Relations |
704.625.4944 | investors@babcock.com | Babcock & Wilcox Enterprises, Inc. |
330.860.1345 | rscornell@babcock.com |
Exhibit 1
Babcock & Wilcox Enterprises, Inc.
Condensed Consolidated Statements of Operations(1)
(In millions, except per share amounts)
Three Months Ended March 31, | ||||||||
2023 | 2022 | |||||||
Revenues | $ | 257.2 | $ | 204.0 | ||||
Costs and expenses: | ||||||||
Cost of operations | 203.8 | 163.1 | ||||||
Selling, general and administrative expenses | 51.9 | 43.0 | ||||||
Advisory fees and settlement costs | (2.5 | ) | 3.9 | |||||
Restructuring activities | 0.4 | 0.1 | ||||||
Research and development costs | 1.3 | 0.7 | ||||||
Loss on asset disposals, net | 0.9 | — | ||||||
Total costs and expenses | 255.9 | 210.8 | ||||||
Operating income (loss) | 1.4 | (6.8 | ) | |||||
Other (expense) income: | ||||||||
Interest expense | (12.7 | ) | (11.3 | ) | ||||
Interest income | 0.1 | 0.1 | ||||||
Benefit plans, net | (0.1 | ) | 7.5 | |||||
Foreign exchange | (0.5 | ) | 3.1 | |||||
Other expense - net | (0.2 | ) | (0.1 | ) | ||||
Total other expense | (13.3 | ) | (0.7 | ) | ||||
Loss before income tax expense | (12.0 | ) | (7.5 | ) | ||||
Income tax expense | 0.5 | 1.2 | ||||||
Net loss | (12.5 | ) | (8.7 | ) | ||||
Net (income) loss attributable to non-controlling interest | — | 0.4 | ||||||
Net loss attributable to stockholders | (12.5 | ) | (8.3 | ) | ||||
Less: Dividend on Series A preferred stock | 3.7 | 3.7 | ||||||
Net loss attributable to stockholders of common stock | $ | (16.2 | ) | $ | (12.0 | ) | ||
Basic loss per share | $ | (0.18 | ) | $ | (0.14 | ) | ||
Diluted loss per share | $ | (0.18 | ) | $ | (0.14 | ) | ||
Shares used in the computation of loss per share: | ||||||||
Basic | 88.7 | 88.0 | ||||||
Diluted | 88.7 | 88.0 |
(1) Figures may not be clerically accurate due to rounding
Exhibit 2
Babcock & Wilcox Enterprises, Inc.
Condensed Consolidated Balance Sheets(1)
(In millions, except per share amount) | March 31, 2023 | December 31, 2022 | ||||||
Cash and cash equivalents | $ | 62.8 | $ | 76.7 | ||||
Current restricted cash and cash equivalents | 6.9 | 15.3 | ||||||
Accounts receivable – trade, net | 173.8 | 162.5 | ||||||
Accounts receivable – other | 38.0 | 38.5 | ||||||
Contracts in progress | 163.9 | 134.9 | ||||||
Inventories, net | 109.7 | 102.6 | ||||||
Other current assets | 30.4 | 27.0 | ||||||
Total current assets | 585.5 | 557.6 | ||||||
Net property, plant and equipment, and finance lease | 84.4 | 86.4 | ||||||
Goodwill | 157.3 | 157.0 | ||||||
Intangible assets, net | 58.8 | 60.3 | ||||||
Right-of-use assets | 28.2 | 29.4 | ||||||
Long-term restricted cash | 21.4 | 21.4 | ||||||
Other assets | 32.9 | 30.6 | ||||||
Total assets | $ | 968.4 | $ | 942.7 | ||||
Accounts payable | $ | 169.2 | $ | 139.2 | ||||
Accrued employee benefits | 12.3 | 12.5 | ||||||
Advance billings on contracts | 137.2 | 133.4 | ||||||
Accrued warranty expense | 9.9 | 9.6 | ||||||
Financing lease liabilities | 1.2 | 1.2 | ||||||
Operating lease liabilities | 3.8 | 3.6 | ||||||
Other accrued liabilities | 72.5 | 68.2 | ||||||
Loans payable | 4.3 | 4.3 | ||||||
Total current liabilities | 410.4 | 372.0 | ||||||
Senior notes | 336.0 | 335.5 | ||||||
Long term loans payable | 11.4 | 13.2 | ||||||
Pension and other postretirement benefit liabilities | 135.6 | 136.2 | ||||||
Non-current finance lease liabilities | 27.2 | 27.5 | ||||||
Non-current operating lease liabilities | 25.7 | 26.6 | ||||||
Deferred tax liability | 9.8 | 10.1 | ||||||
Other non-current liabilities | 22.6 | 23.8 | ||||||
Total liabilities | 978.6 | 944.7 | ||||||
Commitments and contingencies | ||||||||
Stockholders' deficit: | ||||||||
Preferred stock, par value $0.01 per share, authorized shares of 20,000; issued and outstanding shares of 7,669 at both March 31, 2023 and December 31, 2022 | 0.1 | 0.1 | ||||||
Common stock, par value $0.01 per share, authorized shares of 500,000; issued and outstanding shares of 88,745 and 88,700 at March 31, 2023 and December 31, 2022, respectively | 5.1 | 5.1 | ||||||
Capital in excess of par value | 1,541.0 | 1,537.6 | ||||||
Treasury stock at cost, 1,880 and 1,868 shares at March 31, 2023 and December 31, 2022, respectively | (113.8 | ) | (113.8 | ) | ||||
Accumulated deficit | (1,375.1 | ) | (1,358.9 | ) | ||||
Accumulated other comprehensive loss | (68.0 | ) | (72.8 | ) | ||||
Stockholders' deficit attributable to shareholders | (10.7 | ) | (2.6 | ) | ||||
Non-controlling interest | 0.5 | 0.5 | ||||||
Total stockholders' deficit | (10.2 | ) | (2.1 | ) | ||||
Total liabilities and stockholders' deficit | $ | 968.4 | $ | 942.7 |
(1) Figures may not be clerically accurate due to rounding.
Exhibit 3
Babcock & Wilcox Enterprises, Inc.
Condensed Consolidated Statements of Cash Flows(1)
(In millions) | Three Months Ended March 31, | |||||||
2023 | 2022 | |||||||
Cash flows from operating activities: | ||||||||
Net loss | $ | (12.5 | ) | $ | (8.7 | ) | ||
Adjustments to reconcile net loss to net cash used in operating activities: | ||||||||
Depreciation and amortization of long-lived assets | 5.4 | 6.2 | ||||||
Amortization of deferred financing costs and debt discount | 1.4 | 0.8 | ||||||
Amortization of guaranty fee | 0.2 | 0.2 | ||||||
Non-cash operating lease expense | 0.6 | 1.2 | ||||||
Loss on asset disposals | 0.9 | — | ||||||
Benefit from deferred income taxes | (1.9 | ) | (0.7 | ) | ||||
Prior service cost amortization for pension and postretirement plans | 0.2 | 0.6 | ||||||
Stock-based compensation | 3.4 | 1.8 | ||||||
Foreign exchange | 0.5 | (3.1 | ) | |||||
Changes in operating assets and liabilities: | ||||||||
Accounts receivable - trade, net and other | (5.5 | ) | (28.7 | ) | ||||
Contracts in progress | (29.0 | ) | (13.3 | ) | ||||
Advance billings on contracts | 3.6 | 27.5 | ||||||
Inventories, net | (7.6 | ) | (3.0 | ) | ||||
Income taxes | 2.1 | (7.0 | ) | |||||
Accounts payable | 29.6 | 11.3 | ||||||
Accrued and other current liabilities | 2.7 | (11.3 | ) | |||||
Accrued contract loss | (0.7 | ) | 4.3 | |||||
Pension liabilities, accrued postretirement benefits and employee benefits | (4.3 | ) | (10.0 | ) | ||||
Other, net | (1.9 | ) | (10.1 | ) | ||||
Net cash used in operating activities: | (12.9 | ) | (42.0 | ) | ||||
Cash flows from investing activities: | ||||||||
Purchase of property, plant and equipment | (2.2 | ) | (1.0 | ) | ||||
Acquisition of business, net of cash acquired | — | (64.9 | ) | |||||
Purchases of available-for-sale securities | (2.0 | ) | (1.1 | ) | ||||
Sales and maturities of available-for-sale securities | 2.1 | 1.7 | ||||||
Net cash used in investing activities | (2.2 | ) | (65.4 | ) | ||||
Cash flows from financing activities: | ||||||||
Issuance of senior notes | — | 2.0 | ||||||
Borrowings on loan payable | — | 1.3 | ||||||
Repayments on loan payable | (1.7 | ) | — | |||||
Finance lease payments | (0.3 | ) | (0.7 | ) | ||||
Payment of preferred stock dividends | (3.7 | ) | (3.7 | ) | ||||
Shares of common stock returned to treasury stock | (0.1 | ) | (0.2 | ) | ||||
Debt issuance costs | (0.1 | ) | (0.1 | ) | ||||
Other, net | (0.1 | ) | ||||||
Net cash used in financing activities | (5.9 | ) | (1.6 | ) | ||||
Effects of exchange rate changes on cash | (1.5 | ) | (0.8 | ) | ||||
Net decrease in cash, cash equivalents and restricted cash | (22.4 | ) | (109.7 | ) | ||||
Cash, cash equivalents and restricted cash at beginning of period | 113.5 | 226.7 | ||||||
Cash, cash equivalents and restricted cash at end of period | $ | 91.1 | $ | 117.0 |
(1) Figures may not be clerically accurate due to rounding.
Exhibit 4
Babcock & Wilcox Enterprises, Inc.
Segment Information(1)
(In millions)
SEGMENT RESULTS | Three Months Ended March 31, | |||||||
2023 | 2022 | |||||||
REVENUES: | ||||||||
Babcock & Wilcox Renewable | $ | 100.1 | $ | 68.0 | ||||
Babcock & Wilcox Environmental | 39.4 | 34.9 | ||||||
Babcock & Wilcox Thermal | 119.2 | 102.2 | ||||||
Other | (1.5 | ) | (1.1 | ) | ||||
$ | 257.2 | $ | 204.0 | |||||
ADJUSTED EBITDA: | ||||||||
Babcock & Wilcox Renewable | $ | 4.9 | $ | 2.0 | ||||
Babcock & Wilcox Environmental | 1.9 | 1.4 | ||||||
Babcock & Wilcox Thermal | 13.7 | 14.2 | ||||||
Corporate | (5.1 | ) | (4.4 | ) | ||||
Research and development costs | (1.3 | ) | (0.7 | ) | ||||
$ | 14.2 | $ | 12.5 | |||||
AMORTIZATION EXPENSE: | ||||||||
Babcock & Wilcox Renewable | $ | 0.5 | $ | 2.1 | ||||
Babcock & Wilcox Environmental | 0.8 | 0.7 | ||||||
Babcock & Wilcox Thermal | 1.1 | 1.2 | ||||||
$ | 2.4 | $ | 4.0 | |||||
DEPRECIATION EXPENSE: | ||||||||
Babcock & Wilcox Renewable | $ | 1.0 | $ | 0.6 | ||||
Babcock & Wilcox Environmental | 0.2 | 0.2 | ||||||
Babcock & Wilcox Thermal | 1.8 | 1.4 | ||||||
$ | 3.0 | $ | 2.2 | |||||
As of March 31, | ||||||||
2023 | 2022 | |||||||
BACKLOG: | ||||||||
Babcock & Wilcox Renewable (2) | $ | 231 | $ | 293 | ||||
Babcock & Wilcox Environmental | 173 | 126 | ||||||
Babcock & Wilcox Thermal | 252 | 158 | ||||||
Other/Eliminations | 7 | (3 | ) | |||||
$ | 663 | $ | 574 |
(1) | Figures may not be clerically accurate due to rounding. |
(2) | B&W Renewable backlog has been adjusted downward $53 million and $147 million as of March 31, 2023 and March 31, 2022 respectively to remove O&M contracts that are recognized as disposed. |
Exhibit 5
Babcock & Wilcox Enterprises, Inc.
Reconciliation of Adjusted EBITDA
(In millions)
Three Months Ended March 31, | ||||||||
2023 | 2022 | |||||||
Net loss | $ | (12.5 | ) | $ | (8.7 | ) | ||
Interest expense | 14.4 | 12.3 | ||||||
Income tax expense | 0.5 | 1.2 | ||||||
Depreciation & amortization | 5.4 | 6.2 | ||||||
EBITDA | 7.8 | 11.1 | ||||||
Benefit plans, net | 0.1 | (7.5 | ) | |||||
Loss on sales, net | 0.9 | — | ||||||
Stock compensation | 3.2 | 1.3 | ||||||
Restructuring activities and business services transition costs | 1.0 | 2.7 | ||||||
Settlement and related legal costs | (3.0 | ) | 2.5 | |||||
Advisory fees for settlement costs and liquidity planning | 0.5 | 1.0 | ||||||
Acquisition pursuit and related costs | 0.1 | 0.8 | ||||||
Product development (1) | 1.4 | 0.9 | ||||||
Foreign exchange | 0.5 | (3.1 | ) | |||||
Contract disposal (2) | 1.4 | 0.9 | ||||||
Contract step-up purchase price adjustment | — | 1.7 | ||||||
Other - net | 0.3 | 0.1 | ||||||
Adjusted EBITDA(3) | $ | 14.2 | $ | 12.5 |
(1) Costs associated with development of commercially viable products that are ready to go to market.
(2) Impacts of the disposal of our O&M contracts has been adjusted in the prior period to ensure uniform presentation with the current period
(3) Figures may not be clerically accurate due to rounding.
© 2023 Babcock & Wilcox Enterprises, Inc. All rights reserved. M A Y 1 0 , 2 0 2 3 COMPANY OVERVIEW |
© 2023 Babcock & Wilcox Enterprises, Inc. All rights reserved. B A B C O C K & W I L C O X E N T E R P R I S E S , I N C . 2 S A F E H A R B O R S TAT E M E N T B&W Enterprises cautions that this presentation contains forward-looking statements within the meaning of federal securities laws. All statements other than statements of historical or current fact included in this presentation are forward-looking statements, including, without limitation, statements relating to the company's business outlook and expected financial performance, including adjusted EBITDA and sales targets, expectations regarding future growth, expansion and profitability, as well as statements about B&W’s future pipeline of new projects and business within its Renewable, Environmental and Thermal operating segments and their impact on future shareholder value. These forward-looking statements are based on management’s current expectations and involve a number of risks and uncertainties, including, among other things, the impact of global macroeconomic conditions, including inflation and volatility in the capital markets; the impact of the ongoing conflict in Ukraine; our ability to integrate acquired businesses and the impact of those acquired businesses on our cash flows, results of operations and financial condition, including our recent acquisitions of Babcock & Wilcox Solar Energy, Inc. ("Babcock & Wilcox Solar"), formerly known as Fosler Construction Company Inc. and/or Fosler, Babcock & Wilcox Renewable Service A/S, formerly known as VODA A/S ("VODA"), Fossil Power Systems, Inc. ("FPS"), Optimus Industries, LLC ("Optimus") and certain assets of Hamon Holdings Corporation ("Hamon"); our recognition of any asset impairments as a result of any decline in the value of our assets or our efforts to dispose of any assets in the future; our ability to obtain and maintain sufficient financing to provide liquidity to meet our business objectives, surety bonds, letters of credit and similar financing; our ability to comply with the requirements of, and to service the indebtedness under, our debt facility agreements; our ability to pay dividends on our 7.75% Series A Cumulative Perpetual Preferred Stock; our ability to make interest payments on our 8.125% senior notes due 2026 and our 6.50% notes due 2026; the highly competitive nature of our businesses and our ability to win work, including identified project opportunities in our pipeline; general economic and business conditions, including changes in interest rates and currency exchange rates; cancellations of and adjustments to backlog and the resulting impact from using backlog as an indicator of future earnings; our ability to perform contracts on time and on budget, in accordance with the schedules and terms established by the applicable contracts with customers; failure by third-party subcontractors, partners or suppliers to perform their obligations on time and as specified; delays initiated by our customers; our ability to successfully resolve claims by vendors for goods and services provided and claims by customers for items under warranty; our ability to realize anticipated savings and operational benefits from our restructuring plans, and other cost-savings initiatives; our ability to successfully address productivity and schedule issues in our B&W Renewable, B&W Environmental and B&W Thermal segments; our ability to successfully partner with third parties to win and execute contracts within our B&W Environmental, B&W Renewable and B&W Thermal segments; changes in our effective tax rate and tax positions, including any limitation on our ability to use our net operating loss carryforwards and other tax assets; our ability to successfully manage research and development projects and costs, including our efforts to successfully develop and commercialize new technologies and products; the operating risks normally incident to our lines of business, including professional liability, product liability, warranty and other claims against us; difficulties we may encounter in obtaining regulatory or other necessary permits or approvals; changes in actuarial assumptions and market fluctuations that affect our net pension liabilities and income; our ability to successfully compete with current and future competitors; our ability to negotiate and maintain good relationships with labor unions; changes in pension and medical expenses associated with our retirement benefit programs; social, political, competitive and economic situations in foreign countries where we do business or seek new business; the impact of COVID-19 or other similar global health crises, and the other factors specified and set forth under "Risk Factors" in our periodic reports filed with the Securities and Exchange Commission, including, without limitation, the risks described in the Company's Annual Report on Form 10-K for the year ended December 31, 2022 under the caption "Risk Factors" and "Management's Discussion and Analysis of Financial Condition and Results of Operations" (as applicable). These factors should be considered carefully, and B&W Enterprises cautions you not to place undue reliance on these forward-looking statements, which speak only as of the date of this presentation, and undertakes no obligation to update or revise any forward-looking statement, except to the extent required by applicable law. Non-GAAP Financial Measures This presentation contains information regarding our adjusted EBITDA, which is a non-GAAP financial measure. Adjusted EBITDA on a consolidated basis is defined as the sum of the adjusted EBITDA for each of the segments, further adjusted for corporate allocations and research and development costs. At a segment level, adjusted EBITDA presented is consistent with the way our chief operating decision maker reviews the results of operations and makes strategic decisions about the business and is calculated as earnings before interest expense, tax, depreciation and amortization adjusted for items such as gains or losses arising from the sale of non-income producing assets, net pension benefits, restructuring costs, impairments, gains and losses on debt extinguishment, costs related to financial consulting, research and development costs and other costs that may not be directly controllable by segment management and are not allocated to the segment. We present consolidated Adjusted EBITDA because we believe it is useful to investors to help facilitate comparisons of our ongoing, operating performance before corporate overhead and other expenses not attributable to the operating performance of our revenue generating segments. In this presentation, we also present certain targets for our adjusted EBITDA in the future; these targets are not intended as guidance regarding how we believe the business will perform. We are unable to reconcile these targets to their GAAP counterparts without unreasonable effort and expense due to the aspirational nature of these targets. |
© 2023 Babcock & Wilcox Enterprises, Inc. All rights reserved. B A B C O C K & W I L C O X E N T E R P R I S E S , I N C . 3 W E ’ R E A G L O B A L E N E R G Y L E A D E R C R E AT I N G A B R I G H T E R F U T U R E OUR PROVEN, BEST-IN-CLASS POWER PRODUCTION TECHNOLOGIES SUPPORT THE CREATION OF A NET-ZERO FUTURE. • From our first patent for a more efficient boiler to more than 17,000 patents since, we continue to drive innovation and change • Today, we are a globally recognized technology leader and innovator at the forefront of the energy transition • Helping utility and industrial customers with the technical challenges of moving from current to future energy sources • Delivering systems, parts and field services to help utility and industrial plants operate more effectively and efficiently • Our waste- and biomass-to-energy, carbon capture, hydrogen production and environmental technologies support the reduction of greenhouse gases, including CO2 and methane, in an environmentally friendly way Ensuring energy security for customers and the world Making net-zero ambitions a reality today Providing high quality and innovative technologies since 1867 |
© 2023 Babcock & Wilcox Enterprises, Inc. All rights reserved. B A B C O C K & W I L C O X E N T E R P R I S E S , I N C . 4 W E ’ R E H E L P I N G C U S TO M E R S C R E AT E C L E A N A N D R E L I A B L E E N E R G Y SUPPORTING A CIRCULAR ECONOMY Ecologically sound ways of using and recycling resources like biomass, municipal waste, and solar energy to create clean, renewable baseload power while reducing greenhouse gas emissions. REDUCING THE IMPACT OF GREENHOUSE GAS EMISSIONS Hydrogen production, carbon capture, ash handling, cooling systems, energy recovery and storage, and advanced emissions control solutions to help preserve the world’s natural resources. CREATING RELIABLE AND EFFICIENT STEAM GENERATION Providing boilers and related equipment, aftermarket parts, service and upgrades to help utilities and industries generate reliable thermal energy from a wide range of fuels and bridge the gap during the global transition to new energy sources. CLEAN ENERGY SOLUTIONS TRADITIONAL DELIVERING VALUE THROUGH TECHNOLOGY-DRIVEN PRODUCTS AND SERVICES, WITH CONTINUAL PRODUCT IMPROVEMENT AND ROBUST R&D EFFORTS TO SUPPORT FUTURE ENERGY NEEDS |
© 2023 Babcock & Wilcox Enterprises, Inc. All rights reserved. B A B C O C K & W I L C O X E N T E R P R I S E S , I N C . 5 T H E F O U N D AT I O N O F O U R C O M PA N Y Our Vision: Advancing energy and environmental solutions that bring power and progress to our world. Our Mission: B&W delivers environmentally conscious, technology-driven solutions and services to energy and industrial customers worldwide – safely, ethically and as promised. Our Core Values: Safety • Integrity • Quality • Respect • Agility |
© 2023 Babcock & Wilcox Enterprises, Inc. All rights reserved. B A B C O C K & W I L C O X E N T E R P R I S E S , I N C . 6 W E ’ R E L EA D I N G A N D D R I V I N G C L EA N P OW E R S O LU T I O N S B&W SUPPORTS GLOBAL TRENDS DRIVING THE NEED FOR SUSTAINABLE ENERGY CONVERSION SOLUTIONS U.S. Inflation Reduction Act increases the investment into low carbon intensity solutions and hydrogen production Energy trade disruptions around the world require increased use of available natural resources and reliable energy Global drive toward renewable and reusable energy sources to limit carbon and methane emissions E.U. Net-Zero Industry Act accelerating investment in solar, energy storage and carbon capture A strong utility and industrial boiler installed base creates stable aftermarket in the U.S. and continued growth in international power generation Water scarcity and environmental regulations drive need for custom cooling solutions |
© 2023 Babcock & Wilcox Enterprises, Inc. All rights reserved. B A B C O C K & W I L C O X E N T E R P R I S E S , I N C . 7 W E ’ R E D R I V I N G G R O W T H , I N N O VAT I O N A N D E X PA N S I O N CORE GROWTH STRATEGIES FOCUSED ON DRIVING INNOVATIVE ENVIRONMENTAL, RENEWABLE AND ENERGY TRANSITION TECHNOLOGIES, GROWING AFTERMARKET SALES BY LEVERAGING THE INSTALLED BASE, AND EXPANDING INTERNATIONALLY IN KEY REGIONS OPPORTUNITY Meet the global need for carbon reduction and greenhouse gas reduction with patented renewable waste-to-energy, biomass, hydrogen production, solar and carbon-capture solutions INNOVATION Provide best-in-class environmental technologies across a broad array of markets to meet growing environmental regulations and climate goals GROWTH Leverage tailwinds created by government tax incentives and global climate investment strategies to drive sales of innovative energy transition technologies and services EXPANSION Utilize experienced sales, service and business development teams in key international regions to serve the growing renewable, environmental and thermal markets |
© 2023 Babcock & Wilcox Enterprises, Inc. All rights reserved. B A B C O C K & W I L C O X E N T E R P R I S E S , I N C . 8 W E ' R E L E V E R A G I N G A VA S T I N S TA L L E D B A S E A N D P R O V E N T E C H N O L O G I E S More than 500 waste-to-energy and biomass-to-energy units at 300+ facilities globally Serving utility, waste management, municipality and investment firm customers Extensive expertise in managing and executing both utility-scale and community solar projects Large worldwide installed base of wet and dry scrubbers for SOx reduction, particulate control equipment, NOx reduction technologies, and mercury control systems to meet environmental regulations Flue gas pre-treatment technologies for use with CO2 capture Nearly 2,000 wet, dry and hybrid cooling system units (10,000+ cells) installed globally More than 300 operating utility and industrial boiler units in the U.S. and nearly 200 operating utility and industrial boiler units across 38 countries outside of North America (excluding waste-to-energy and biomass) More than 5,000 industrial water-tube package boilers and other waste heat recovery products installed in a variety of facilities, including refining, petrochemical, food processing, metals and mining, carbon black and wood products A VAST GLOBAL INSTALLATION OF B&W’S CORE TECHNOLOGIES AT UTILITY AND INDUSTRIAL PLANTS, RENEWABLE PLANTS AND PULP & PAPER FACILITIES CREATE A LARGE GROWTH OPPORTUNITY FOR PARTS, SERVICES AND RETROFITS |
© 2023 Babcock & Wilcox Enterprises, Inc. All rights reserved. B A B C O C K & W I L C O X E N T E R P R I S E S , I N C . 9 CORPORATE SNAPSHOT B A B C O C K & W I L C OX P R O F I L E Notes: All charts based on LTM March 31, 2023 revenues, unless otherwise noted. 1. Backlog does not include shorter lead-time parts and services. 2. The most comparable GAAP target is not available without unreasonable effort. Disclaimer: B&W Enterprises cautions not to place undue reliance on any forward-looking statements, which speak only as of the date of this presentation and may be impacted by the risks described in our SEC reports including, without limitation, the impact of COVID-19 on us and the capital markets and global economic climate generally. We undertake no obligation to update or revise any forward-looking statement, except to the extent required by applicable law. Headquarters: Akron OH, USA Founded: 1867 Ownership: Public (NYSE:BW) Employees: ~2300 LTM Revenue March 2023: LTM Adjusted EBITDA: ~$943M $74.5M 2023 EBITDA Target: $100M to $120M2 B&W RENEWABLE Power Generation 72% Industrial 28% Aftermarket & Upgrades 12% Parts & Services 48% North America 32% Europe 54% Asia & Other 14% New Build 40% B&W THERMAL Industrial 34% Power Generation 66% Aftermarket & Upgrades 45% Parts & Services 45% North America 86% Europe 2% Asia & Other 12% New Build 10% B&W ENVIRONMENTAL Industrial 38% Power Generation 62% Aftermarket & Upgrades 31% Parts & Services 31% North America 45% Europe 17% New Build 38% Asia & Other 38% CONSOLIDATED 37% 17% 46% 35% 26% 39% Industrial 32% Power Generation 68% Aftermarket & Upgrades 31% Parts & Services 44% New Build 25% North America 60% Europe 23% Asia & Other 17% Backlog1 as of March 31, 2023 B&W Renewable LTM Revenue B&W Environmental B&W Thermal |
© 2023 Babcock & Wilcox Enterprises, Inc. All rights reserved. B A B C O C K & W I L C O X E N T E R P R I S E S , I N C . 1 0 60-70% 10-15% 15-25% PIPELINE REVENUE SPLIT 2023-2025 A S O L I D P I P E L I N E O F G L O B A L O P P O R T U N I T I E S Manufacturing Service Facilities Construction Sales/Support Future Sales/Support Sales Reps Future Sales Reps Future Service Facilities Americas APAC Europe ME/A $2,113 $1,112 $1,277 $761 $ MILLIONS B&W RENEWABLE Americas APAC Europe ME/A $998 $175 $668 $ MILLIONS $125 B&W ENVIRONMENTAL Americas APAC Europe ME/A $618 $149 $12 $275 $ MILLIONS B&W THERMAL 3-YEAR PIPELINE Total pipeline more than $8 billion over the next 3 years excluding parts and services Disclaimer: B&W Enterprises cautions not to place undue reliance on any forward-looking statements, which speak only as of the date of this presentation and may be impacted by the risks described in our SEC reports including, without limitation, the impact of COVID-19 on us and the capital markets and global economic climate generally. We undertake no obligation to update or revise any forward-looking statement, except to the extent required by applicable law. 2023-2025 Addressable Market Europe More than $8B 2023-2025 Addressable Market Americas Solar: More than $27B Other: More than $8B 2023-2025 Addressable Market Asia-Pacific More than $8B A WIDE FOOTPRINT AND ONGOING EXPANSION POSITIONS B&W TO LEVERAGE MARKET TRENDS AROUND THE WORLD 2023-2025 Addressable Market Middle East & Africa More than $4B |
© 2023 Babcock & Wilcox Enterprises, Inc. All rights reserved. B A B C O C K & W I L C O X E N T E R P R I S E S , I N C . 1 1 B R I G H T L O O P H Y D R O G E N P R O D U C T I O N SOLID ADVANTAGES: • Hydrogen from solid fuels – can utilize a variety of solid or gaseous fuels as feedstock • High rate of carbon captured – inherent CO2 isolation without the need for expensive carbon capture equipment • Competitive hydrogen cost – lower levelized cost of hydrogen when compared to other hydrogen production methods • Scalable for a range of applications – accommodates both large and small applications TM FEEDSTOCK OUTPUT BrightLoopTM Technology BIOMASS BIOGAS NATURAL GAS COAL PETROLEUM COKE CO2 for Storage/Beneficial Use STEAM HYDROGEN POWER SYNGAS Nitrogen for Beneficial Use |
© 2023 Babcock & Wilcox Enterprises, Inc. All rights reserved. B A B C O C K & W I L C O X E N T E R P R I S E S , I N C . 1 2 B R I G H T L O O P H Y D R O G E N P R O D U C T I O N P R O G R E S S BRIGHTLOOP EVOLUTION 1994 - 2004 2008 2014 2025 2028 TM Sub-Pilot with The Ohio State University and B&W 25 Kilowatts Thermal INDUSTRIAL COMMERCIAL 2.5 to 25 Megawatts Thermal 1.5 to 15 Tons Per Day Hydrogen Output UTILITY COMMERCIAL 100 to 550 Megawatts Thermal 60 to 320 Tons Per Day Hydrogen Output COMPLETED RESEARCH STAGE SUB-PILOT SCALE PILOT SCALE Laboratory Scale Steam & Hydrogen 25 Kilowatts Thermal (National Carbon Capture Center in Alabama) TM IN PROGRESS |
© 2023 Babcock & Wilcox Enterprises, Inc. All rights reserved. B A B C O C K & W I L C O X E N T E R P R I S E S , I N C . 1 3 G L O B A L L E A D E R I N C L E A N P O W E R P R O D U C T I O N T E C H N O L O G I E S — O U R C L I M AT E B R I G H T ™ S U I T E • B&W is at the forefront of developing CO2 capturing technologies • Multiple technologies ready for commercial demonstration • 93 active patents related to carbon capture technology • Positioned to provide critical solutions to meet global climate goals BrightLoop™ HYDROGEN PRODUCTION OxyBright™ OXYGEN-FUEL COMBUSTION SolveBright™ POST-COMBUSTION CARBON CAPTURE BrightGen™ HYDROGEN COMBUSTION Long Duration Energy Storage Green Steam Direct Air Capture HOT SAND SILO COLD SAND SILO EMERGING TECHNOLOGIES B&W’S PORTFOLIO OF CLEAN POWER PRODUCTION SOLUTIONS CONTINUES TO EVOLVE TO REACH CUSTOMERS AT ALL STAGES OF THEIR ENERGY TRANSITION. |
© 2023 Babcock & Wilcox Enterprises, Inc. All rights reserved. B A B C O C K & W I L C O X E N T E R P R I S E S , I N C . 1 4 G L O B A L L E A D E R I N C O M P R E H E N S I V E WA S T E - TO- E N E R G Y S O L U T I O N S FIELD SERVICES COMPONENT & SYSTEM UPGRADES CONTROL SYSTEMS REPLACEMENT & SPARE PARTS OPERATION & MAINTENANCE DynaGrate® combustion grate DynaDischarger® ash removal Water-cooled wear zones and Inconel® corrosion protection VoluMix® system for improved combustion Fabric filter baghouse Wet scrubber with ADIOX® including energy recovery On-line boiler washing system Selective non-catalytic reduction (SNCR) NOx control DynaFeeder® waste fuel feeder system Energy storage systems Carbon capture solutions Dry cooling systems |
© 2023 Babcock & Wilcox Enterprises, Inc. All rights reserved. B A B C O C K & W I L C O X E N T E R P R I S E S , I N C . 1 5 B I O E N E R G Y W I T H C A R B O N C A P T U R E A N D S E Q U E S T R AT I O N ( B E C C S ) OxyBright with B&W’s biomass-fired BFB boiler produces carbon negative electricity with a -2,500gCO2e/kWh carbon intensity OxyBright with B&W’s WtE solution could produce carbon negative electricity with a -1,000 gCO2e/kWh carbon intensity Our negative carbon intensity (-2500 gCO2e/kWh) is nearly seven times more negative than the US grid is positive (+373 gCO2e/kWh) |
© 2023 Babcock & Wilcox Enterprises, Inc. All rights reserved. B A B C O C K & W I L C O X E N T E R P R I S E S , I N C . 1 6 B & W ’ S WA S T E - TO- E N E R G Y T E C H N O L O G Y R E D U C E S M E T H A N E E M I S S I O N S • Methane has 84 times the Global Warming Potential (GWP) of CO2 i • Annual additions to landfills in the U.S.ii produce emissions equivalent to 10 million cars • Landfills in the U.S.iii emit more than 330 million tons of 20- year basis GWP each year, roughly equal to 70 million carsiv • Waste-to-Energy (WTE) avoids landfilling while producing baseload clean energy WTE TECHNOLOGIES • Boiler/steam generation island • DynaGrate® combustion grate • Fuel handling systems • Emissions control equipment • B&W’s state-of-the-art technology has been installed in more than 500 units in more than 30 countries, including: • The most recent WTE facility in the U.S. (Palm Beach Renewable Energy Facility, Florida) • One of the world’s largest waste treatment facilities in the world (Shenzhen East, China) i Anthropogenic and Natural Radiative Forcing. In: Climate Change 2013: The Physical Science Basis. Contribution of Working Group I to the Fifth Assessment Report of the Intergovernmental Panel on Climate Change [Stocker, T.F., D. Qin, G.-K. Plattner, M. Tignor, S.K. Allen, J. Boschung, A. Nauels, Y. Xia, V. Bex and P.M. Midgley (eds.)]. Cambridge University Press, Cambridge, United Kingdom and New York, NY, USA. https://www.ipcc.ch/site/assets/uploads/2018/02/WG1AR5_Chapter08_FINAL.pdf; 20-year basis ii EIA Biomass Explained: Waste-to-energy (Municipal Solid Waste), November 29, 2020 https://www.eia.gov/energyexplained/biomass/waste-to-energy.php iii EPA Landfill Methane Outreach Program: Project and Landfill Data by State; https://www.epa.gov/lmop/project-and-landfill-data-state#:~:text=The%20LMOP%20Landfill%20and%20Landfill,more%20than%202%2C600%20MSW%20landfills and EPA U.S. Greenhouse Gas Inventory 2020, Chapter 7: Waste, Section 7.1 Landfills (CRF Source Category 5A1) iv Equivalent car emissions calculated using EPA metric of 4.6 metric tons of CO2 per year per passenger car B&W IS ACTIVELY DEPLOYING TECHNOLOGY THAT CURBS THE GLOBAL WARMING IMPACT OF METHANE |
© 2023 Babcock & Wilcox Enterprises, Inc. All rights reserved. B A B C O C K & W I L C O X E N T E R P R I S E S , I N C . 1 7 F I N A N C I A L I N F O R M AT I O N |
© 2023 Babcock & Wilcox Enterprises, Inc. All rights reserved. B A B C O C K & W I L C O X E N T E R P R I S E S , I N C . 1 8 C O N S O L I D AT E D F I N A N C I A L S U M M A R Y ($ in millions) Twelve Months Ended March 31, 2023 Twelve Months Ended December 31, 2022 Twelve Months Ended December 31, 2021 Revenue $ 942.8 $ 889.8 $ 723.4 Operating Income (loss) $ 3.9 $ (4.2) $ 20.8 Net Income (loss) $ (30.3) $ (26.6) $ 31.5 Net income (loss) attributable to stockholders of common stock $ (42) $ (37.7) $ 21.8 Adjusted EBITDA $ 74.5 $ 72.4 $ 70.6 Adjusted EBITDA Margin % 7.9% 8.1% 9.8% Note: 2020 Reported results include the recognition in Q3 2020 of a $26.0 million non-recurring loss recovery settlement related to certain historical EPC loss contracts; figures may not be clerically accurate due to rounding; see SEC financial filings and/or slides in Appendix for reconciliation of non-GAAP measures; COVID-19 adversely impacted all segments in 2020 and 2021. |
© 2023 Babcock & Wilcox Enterprises, Inc. All rights reserved. B A B C O C K & W I L C O X E N T E R P R I S E S , I N C . 1 9 C A P I TA L S T R U C T U R E ($ in millions) As of March 31, 2023 CAPITALIZATION: Total Debt $ 351.7 Cash, cash equivalents and restricted cash 91.1 Net Debt $ 260.6 TOTAL DEBT LEVERAGE: LTM 3/31/2023 Adjusted EBITDA(1) 74.5 Net Leverage(2) 3.5x Note: Figures may not be clerically accurate due to rounding. (1) See SEC financial filings and/or slides in Appendix for reconciliation of non-GAAP measures. (2) Net Debt compared to LTM 3/31/2023 Adjusted EBITDA. |
© 2023 Babcock & Wilcox Enterprises, Inc. All rights reserved. B A B C O C K & W I L C O X E N T E R P R I S E S , I N C . 2 0 A P P E N D I X |
© 2023 Babcock & Wilcox Enterprises, Inc. All rights reserved. B A B C O C K & W I L C O X E N T E R P R I S E S , I N C . 2 1 L E A D E R S H I P T E A M Chairman and Chief Executive Officer Kenny Young Executive Vice President and Chief Financial Officer Lou Salamone Executive Vice President and Chief Operating Officer Jimmy B. Morgan Executive Vice President, General Counsel and Corporate Secretary John J. Dziewisz Chief Strategy and Technology Officer Brandy Johnson Vice President, Corporate Operations Gillianne Hetrick Senior Vice President, Clean Energy Joe Buckler Senior Vice President, Thermal Chris Riker Vice President, Corporate Development Sarah Serafin |
© 2023 Babcock & Wilcox Enterprises, Inc. All rights reserved. B A B C O C K & W I L C O X E N T E R P R I S E S , I N C . 2 2 C O R P O R AT E G O V E R N A N C E Joseph Tato Rebecca Stahl Chairman and Chief Executive Officer Kenny Young Henry Bartoli B O A R D O F D I R E C T O R S Alan Howe Philip Moeller Peter O’Keefe Phillip Piddington Homaira Akbari Rod O’Connor A D V I S O R Y B O A R D Eric Powell |
© 2023 Babcock & Wilcox Enterprises, Inc. All rights reserved. B A B C O C K & W I L C O X E N T E R P R I S E S , I N C . 2 3 A D J U S T E D E B I T D A R E C O N C I L I AT I O N (1) ($ in millions) Twelve Months Ended March 31, 2023 (4) Twelve Months Ended December 31, 2022 (3) Twelve Months Ended Dec 31, 2021 Net income (loss) $ (30.4) $ (26.6) $31.5 Interest expense 52.9 50.8 41.4 Income tax (benefit) expense 10.3 11.0 (2.2) Depreciation & amortization 23.2 24.0 18.3 EBITDA 56.0 59.2 89.0 Goodwill impairment 7.2 7.2 — Benefit plans, net (30.0) (37.5) (48.1) Gain on sales, net (1.6) (2.6) (14.0) (Gain) loss on debt extinguishment — — (6.5) Stock compensation 10.6 8.7 10.5 Restructuring activities and business services transition costs 6.7 8.5 10.7 Advisory fees for settlement costs and liquidity planning 1.0 1.5 5.5 Litigation legal costs 5.2 10.7 4.9 Acquisition pursuit and related costs 4.8 5.5 4.8 Contract Disposal (O&M) 4.0 3.0 — Product development (2) 4.6 4.1 4.7 Foreign exchange 4.1 0.6 4.3 Financial advisory services 1.4 1.4 2.7 Contract step-up purchase price adjustment — 1.7 — Loss from business held for sale — — 0.5 Other – net 0.5 0.4 1.6 Income from discontinued operations — — — Adjusted EBITDA $74.5 $72.4 $70.6 1) Adjusted EBITDA is a non-GAAP Measure; figures may not be clerically accurate due to rounding. 2) Cost associated with development of commercially viable products that are ready to go to market. 3) 4) Adjusted EBITDA for the twelve months ended December 31, 2022 include a $7.0 million non-recurring gain on sale related to development rights of a future solar project that was sold. Adjusted EBITDA for the twelve months ended March 31, 2023 include a $7.0 million non-recurring gain on sale related to development rights of a future solar project that was sold. |
© 2023 Babcock & Wilcox Enterprises, Inc. All rights reserved. B A B C O C K & W I L C O X E N T E R P R I S E S , I N C . 2 4 K E Y T E C H N O LO G I E S A N D C A PA B I L I T I E S |
© 2023 Babcock & Wilcox Enterprises, Inc. All rights reserved. B A B C O C K & W I L C O X E N T E R P R I S E S , I N C . 2 5 K E Y T E C H N O L O G I E S : S T E A M G E N E R AT I O N Utility Boilers High pressure, high efficiency, high capacity, low emissions Fuel: Coal, oil, natural gas, multi-fuel Natural Gas-Fired and Other Industrial Water-Tube and Fire-Tube Boilers Bottom- or top-supported, shop- or field-assembled Fuel: Natural gas, oil, CO, waste heat and gases Heat Recovery Steam Generator Components Pressure parts, casing, ducting, drums, housing and frames Fuel: Waste heat and gases Waste-to-Energy Boilers Reduces dependency on landfills and reduces methane gas emissions Fuel: MSW, RDF Biomass-Fired Boilers Carbon-neutral technology Fuel: Wood, wood waste, straw, sludge Process Recovery Boilers Single-drum, industry-standard unit for improved mill operation Fuel: Black liquor |
© 2023 Babcock & Wilcox Enterprises, Inc. All rights reserved. B A B C O C K & W I L C O X E N T E R P R I S E S , I N C . 2 6 K E Y T E C H N O L O G I E S : R E N E WA B L E C O M B U S T I O N G R AT E S • Large installed base with diverse set of customers • Grate design allows for high availability and long operational time, leading to reduced O&M cost • High thermal efficiency and low emissions • Fuel flexibility • Factory assembled modules reduce field construction D Y N A G R A T E ® C O M B U S T I O N G R A T E A MARKET LEADER WITH DIFFERENTIATING TECHNOLOGY IN WASTE-TO-ENERGY SOLUTIONS |
© 2023 Babcock & Wilcox Enterprises, Inc. All rights reserved. B A B C O C K & W I L C O X E N T E R P R I S E S , I N C . 2 7 K E Y T E C H N O L O G I E S : E M I S S I O N S C O N T R O L S • Wet ESPs • Dry Sorbent Injection (DSI) SO3 / Acid Mist Control PURPOSE TECHNOLOGY SOLUTION Particulate Control • Pulse Jet Fabric Filters (PJFF) / Baghouses • Wet and Dry Electrostatic Precipitators (ESPs) • Wet Particulate Scrubbers • Multiclone® Dust Collectors • Selective Catalytic and Non-catalytic Reduction (SCR/SNCR) • Low NOX Burners and Combustion Systems NOx Control • Wet or Seawater Flue Gas Desulfurization (FGD) Systems • Semi-dry FGDs (Spray Dry Absorbers, Circulating Dry Scrubbers) • Wet ESPs and Dry Sorbent Injection (DSI) SO2 / Acid Gas Control PURPOSE TECHNOLOGY SOLUTION • Powdered Activated Carbon Injection • Absorption Plus™, MercPlus™, Mitagent™ Additives • GMAB™ ADIOX® and MERCOX™ technologies Mercury, Dioxins, Furans • Wastewater Evaporation System (WES) via Spray Drying • Air-Cooled Condensers Wastewater Elimination Pre-treatment for Post-Combustion Carbon Capture • Wet and Dry Scrubbers, Sorbent Injection, ESP Fabric Filters, SCRs • Complements SolveBright process, other post-combustion technologies |
© 2023 Babcock & Wilcox Enterprises, Inc. All rights reserved. B A B C O C K & W I L C O X E N T E R P R I S E S , I N C . 2 8 K E Y T E C H N O L O G I E S : F L U E G A S T R E AT M E N T F O R C A R B O N C A P T U R E • To optimize carbon capture on solvent-based scrubbing technologies, reductions in various pollutants found in the incoming flue gas are required • Our solutions include technologies for acid gases, particulate and acid mist, NOx , mercury, and flue gas moisture THE WORLDWIDE LEADER IN FLUE GAS PRE-TREATMENT TECHNOLOGIES FOR POST-COMBUSTION CARBON CAPTURE |
© 2023 Babcock & Wilcox Enterprises, Inc. All rights reserved. B A B C O C K & W I L C O X E N T E R P R I S E S , I N C . 2 9 K E Y T E C H N O L O G I E S : S U B M E R G E D G R I N D C O N V E YO R A S H H A N D L I N G • Lower equipment cost • Lower installation cost • Ability to utilize existing hoppers and gate valves • No hopper modifications • Short outage time • Short lead time • Available redundancy under the boiler • Lower O&M costs Designated to meet current and future U.S. regulatory requirements for ash handling with: AN INNOVATIVE SOLUTION TO ELIMINATE ASH PONDS |
© 2023 Babcock & Wilcox Enterprises, Inc. All rights reserved. B A B C O C K & W I L C O X E N T E R P R I S E S , I N C . 3 0 K E Y T E C H N O L O G I E S : C O O L I N G S Y S T E M S MATERIAL OPTIONS: WOOD | CONCRETE | FIBER-REINFORCED POLYMER (FRP) NATURAL DRAFT/HYPERBOLIC Fanless design provides low power, noise and maintenance, as well as long operating lifecycle MECHANICAL DRAFT Counterflow for cost-effective thermal performance; crossflow for low energy consumption and operating costs WET AIR-COOLED CONDENERS Water preservation technology customized for high-performance, long-life, low noise, corrosion-resistant applications AIR FIN COOLERS Cost-effective designs using embedded or wrapped tubes to meet required thermal, mechanical, noise, and space requirements DRY OPTIMIZATION SERVICES Specialized services to maximize plant performance and minimize costs and maintenance |
© 2023 Babcock & Wilcox Enterprises, Inc. All rights reserved. B A B C O C K & W I L C O X E N T E R P R I S E S , I N C . 3 1 K E Y C A PA B I L I T I E S : G L O B A L PA R T S & S E R V I C E Adding value through constructability: Safe execution of new installation, retrofits, system maintenance/repair, plant modifications CONSTRUCTION OPTIMIZATION SYSTEMS Enhancing efficiency with proven technology: Diagnostic, monitoring, tuning and control systems for combustion, cleaning and cooling equipment UPGRADES & RETROFITS Maintaining/improving plant operation: Projects for extending the life of power, process and environmental equipment ENGINEERING SERVICES Evaluating options for improved performance: Expert people, tools and processes to measure, model, design, deliver, train, and project manage REPLACEMENT PARTS Supplying components for system reliability: High-quality standard or custom-engineered pressure and non-pressure parts |
© 2023 Babcock & Wilcox Enterprises, Inc. All rights reserved. B A B C O C K & W I L C O X E N T E R P R I S E S , I N C . 3 2 K E Y T E C H N O L O G I E S : I G N I TO R S , F L A M E S C A N N E R S A N D C O N T R O L S • Natural gas conversions from oil- or coal-firing • Alternative energy fuels such as hydrogen, bio-diesel, methanol, and bio-gas • Burner management and controls for complete turnkey system capability • Flame scanning capability can be effectively implemented on any industrial application • Technologies can be utilized for new construction or retrofit projects • Safety standards conforming to National Fire Protection Association (NFPA) classes Designed for safety, reliability and fuel flexibility PROVEN TECHNOLOGIES WITH INSTALLATIONS IN MORE THAN 70 COUNTRIES, INCLUDING MORE THAN 11,000 IGNITORS |
© 2023 Babcock & Wilcox Enterprises, Inc. All rights reserved. B A B C O C K & W I L C O X E N T E R P R I S E S , I N C . 3 3 K E Y C A PA B I L I T I E S : S O L A R I N S TA L L AT I O N ENGINEERING AND PROCUREMENT • Project Cost Analysis • Grid Integration and Interconnection • Technical Evaluation • Push-Pull Testing • AC and DC Engineering • Permitting and AHJ Permissions • Logistics • Strategic Procurement of Structural Components and Electrical BOE CONSTRUCTION • Subcontractor Management • On-Site Construction Management • Coordination and Supervision of Projects • Utility Interconnections • Quality and Commissioning Control • Electrical and Structural QA/QC • BOE BENEFITS OF A SOLAR ADDITION: 1. Powering up/down operations 2. Supplemental/plant energy source 3. Additional MW/GW output INDUSTRY-LEADING EPC SERVICES High efficiency. Low emissions. Integrated solutions for clean power production. |
@/7 R#
M_P!]"N;=]7\.Z9#%;R2?;-3C_ WODTU;MM+4K*D$R)$
M9&P-[/EAM &2&'4"LOQ#IRS2(+A&D%J-IC8\#JP^<=3C!_"L^)M,F18TLGFU
M,[0 HR57@[<]3@#'/&":XL/4A52]HA2OL=Q=:-<7NGW<:Z7))-=Q+)8W'D?N
MY$7&^9@W.S W8'7.>:YT_#?3M&U9FUK1I9+>"*$M96[*[O(9%/(W8PP)S@'
M.:YS4M:O?%?E6BO)A3$GD+/^Z1E0 DY(YP#T' 'TKK=&\&QW6J20Q)'YZ@RE
MK)O,90HY0NQPQ8,,$\<5U3Q&'P\>2FFV3 XA\ $I//Y9,5F3V9/O2NJX^4#W)KYVG6Q"44E=W]1Q
MY)?$>5_MHZS9ZMK^B)!-8O);6QC:"Q8'8,#)8= 2=W'7CGDU\GWJEH <\+R<
M'.!_6OI_]I73-)@T_P .O8QW%Q>HTBWFHRH2EU(_S$[CC/.1T[<<5\O:O/\
MZ0T:J4C;CBOT' U:E6G>H]?0]JDHJ"Y3&=6E)55)/8XI$AE5@TC;0HQCUJR\
MH8@*"A'I3)Y]P1>ISBO53[&U@QQG.>*ZKX>W]W97TRV437$SH"8E7G:$)'AMY([^
M6#RX@AV!R?E! 'OS^%8_AWP5?17MKJ5[=)=7C*L,QC3]U;0XPJ1@].>3ZFO!
M:5*7++1WZ'.H1:YV><7'AFY9CK-]=QW.I3OYVZ0D+'P,QA2.,$CGVR:Q[S1'
MM;![Y;D+*\QDB@:+8R\<_/CKP*]6U?1GB\6:E$VGP&.[8*]PDS*J*?O,4[,>
M.!67J.G6+K.6@WNF $!!<@# Z<@]^]>?/%RI5>2;NV3*-UH
-PSR
M.1P$SU;OGI3K_P"'\TME%>:G/(T2/(L>GQ3%EB!4,@8\;FRN.>.F*^(PN(=2
MG4=6-_M*_P"ATSCKS'*^'/%$VF:S?ZJWF75[(_[O3]/A^)?"EI?7U
M_*DL\ *+"')7G&P@#!)/?FO/KS67^).D^ ?"%O-:3SQV)!D6-E:U4,QV.#P3
M\K,6'4,/2OH3]EB'3?&?PYBT.VWKJVG7AMS!),L8+DAP03T7((YKRL7"K4ER
MT=UKZKL>'5ARPYI=S0\*:'X;T#1_!EC=:CID4>M7ODWT)F#DJ%;:DDC$A/;!
MW!C7H?P]\%'PQX@\NUL+L7"W"1.D:MY4\1D^?S#SG"],=\=Z\V\9ZGX3T76V
M\/ZWX
8>'[.'5_$%EI5A;?:HHHR)@VBO+/J=Z%
M5Y'(B5C@>6/N_AG)_&M);:/421-&L<;<;NCN/;VHL[53':QSGYHAM5%&?Q-.
MU69+"/>[C@%F8^@[#_"NM64;L&[O0Q?%=Y'X>\/WTGG+&J(549[=!^M?,OB+
MQH;B9HU
75Y
M#(3=1".0-E#&/E;WK0O8CX?T^VPVZ&",*RH
]\<
M">RU=[=/#%G 4AB;&9$=1(1+@C;AF"J ,$*.F*\)UCP]IWA[QU