Exhibit 99.1

Press Release
Information for Investors: | | Information for Media: |
| | |
Steve Eagerton | | Michelle Kersch |
Black Knight | | Black Knight |
904.854.3683 | | 904.854.5043 |
steven.eagerton@bkfs.com | | michelle.kersch@bkfs.com |
Black Knight Reports Fourth Quarter and Full Year 2022 Financial Results
JACKSONVILLE, Fla. –February 28, 2023 - Black Knight, Inc. (NYSE: BKI), a leading provider of software, data and analytics solutions to the mortgage and consumer loan, real estate and capital markets verticals, today announced unaudited financial results for the fourth quarter and year ended December 31, 2022, as compared to the prior year periods.
Commentary:
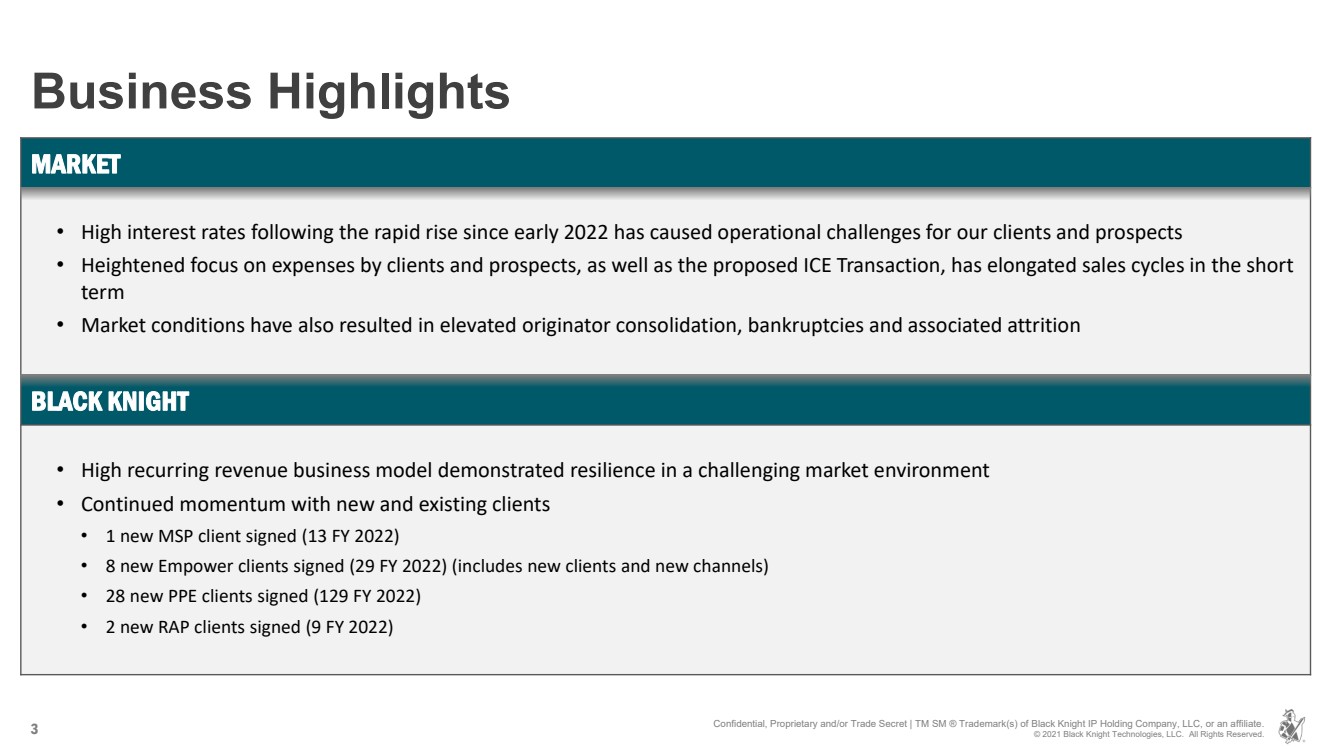
Black Knight Executive Chairman Anthony Jabbour said, “I am pleased with our performance during the fourth quarter and for the full year. Despite a very challenging time for the markets we serve, coupled with our proposed transaction with Intercontinental Exchange, our team remained focused and continued to execute against our strategic initiatives to deliver profitable growth over the long term. While the challenging operating environment has created some near-term headwinds to our financial performance, we remain positive about our long-term growth opportunities and are committed to creating value for all of our stakeholders.”
Black Knight Chief Executive Officer Joe Nackashi added, “We delivered Organic revenue growth of 4% for the year, which demonstrates the durability of our business model. We remain focused on winning new clients, expanding and extending our relationships with existing clients through cross sales and contract renewals and delivering innovative new solutions. I want to thank my Black Knight colleagues for their focus and contributions and our clients for the trust they place in us to help them achieve their strategic goals.”
Full Year 2022 Highlights:
| ● | Revenues of $1,551.9 million, an increase of 5%; Organic revenue growth of 4% |
| ● | Operating income of $278.2 million, a decrease of 8%; Operating margin of 17.9% compared to 20.5% |
| ● | Net earnings attributable to Black Knight of $452.5 million compared to $207.9 million; Diluted EPS of $2.91 compared to $1.33; Net earnings margin of 29.0% compared to 12.2%; the effect of our investment in Dun & Bradstreet Holdings, Inc. (“DNB”) was an increase in Net earnings attributable to Black Knight of $306.7 million, or $1.97 per diluted share, including a gain of $305.4 million, net of tax, or $1.96 per diluted share, recognized in the first quarter of 2022 as a result of the exchange of shares of DNB common stock as part of the consideration for acquiring the remaining 40% interest in Optimal Blue Holdco, LLC (“Optimal Blue”) in February 2022 |
| ● | Adjusted EBITDA of $735.3 million, an increase of 2%; Adjusted EBITDA margin was 47.4% compared to 49.1% |
| ● | Adjusted operating income of $573.2 million, a decrease of 1%; Adjusted operating margin of 36.9% compared to 39.2% |
1
| ● | Adjusted net earnings of $364.9 million, a decrease of 2%; Adjusted EPS of $2.35, a decrease of 1% |
Full Year 2022 Segment Highlights:
Software Solutions
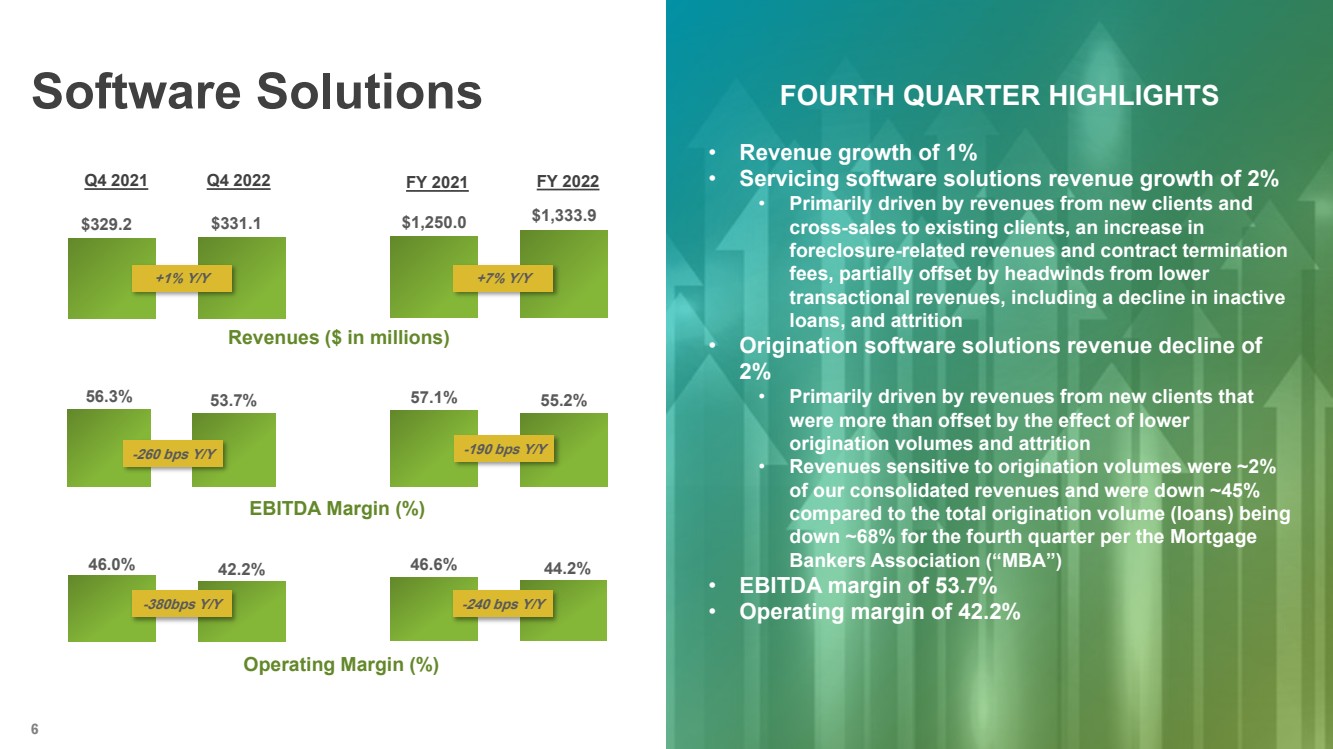
| ● | Revenues of $1,333.9 million, an increase of 7%; Organic revenue growth of 6% |
| ● | EBITDA of $736.5 million, an increase of 3%; EBITDA margin of 55.2% compared to 57.1% |
| ● | Operating income of $589.9 million, an increase of 1%; Operating margin of 44.2% compared to 46.6% |
Data and Analytics
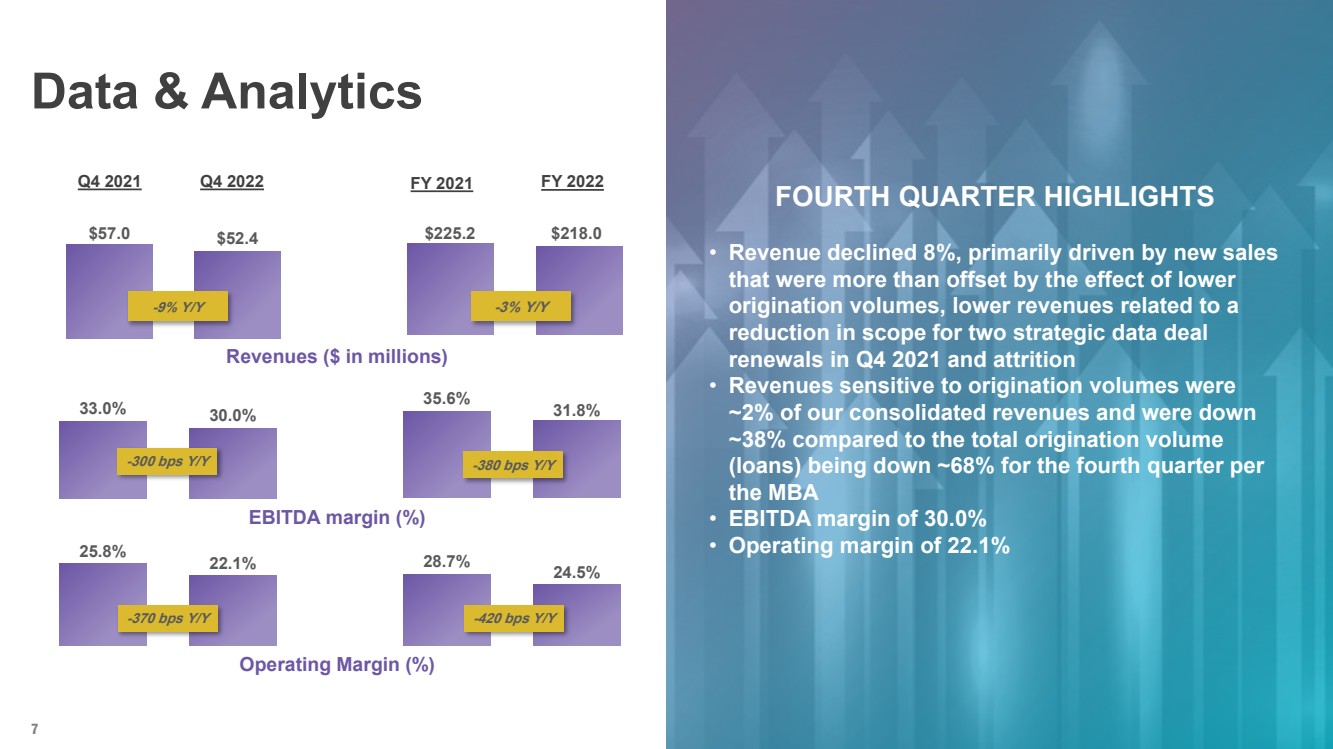
| ● | Revenues of $218.0 million, a decrease of 3%; Organic revenue decrease of 4% |
| ● | EBITDA of $69.3 million, a decrease of 14%; EBITDA margin of 31.8% compared to 35.6% |
| ● | Operating income of $53.5 million, a decrease of 17%; Operating margin of 24.5% compared to 28.7% |
Fourth Quarter 2022 Highlights:
| ● | Revenues of $383.5 million, a decrease of 1% |
| ● | Operating income of $52.8 million, a decrease of 36%; Operating margin of 13.8% compared to 21.5% |
| ● | Net earnings attributable to Black Knight of $17.6 million compared to $60.7 million; Diluted EPS of $0.11 compared to $0.39; Net earnings margin of 4.6% compared to 14.5% |
| ● | Adjusted EBITDA of $174.7 million, a decrease of 7%; Adjusted EBITDA margin was 45.6% compared to 48.7% |
| ● | Adjusted operating income of $132.5 million, a decrease of 12%; Adjusted operating margin of 34.6% compared to 38.8% |
| ● | Adjusted net earnings of $80.5 million, a decrease of 21%; Adjusted EPS of $0.52, a decrease of 21% |
Fourth Quarter 2022 Segment Highlights:
Software Solutions
| ● | Revenues of $331.1 million, an increase of 1% |
| ● | EBITDA of $177.9 million, a decrease of 4%; EBITDA margin of 53.7% compared to 56.3% |
| ● | Operating income of $139.7 million, a decrease of 8%; Operating margin of 42.2% compared to 46.0% |
Data and Analytics
| ● | Revenues of $52.4 million, a decrease of 8% |
| ● | EBITDA of $15.7 million, a decrease of 16%; EBITDA margin of 30.0% compared to 33.0% |
| ● | Operating income of $11.6 million, a decrease of 21%; Operating margin of 22.1% compared to 25.8% |
Other Highlights:
| ● | On November 18, 2022, we entered into a definitive agreement to sell our TitlePoint line of business to an affiliate of Fidelity National Financial, Inc. for $225 million in cash, subject to a customary working capital adjustment (the “TitlePoint Transaction”). The TitlePoint Transaction closed on January 1, 2023. |
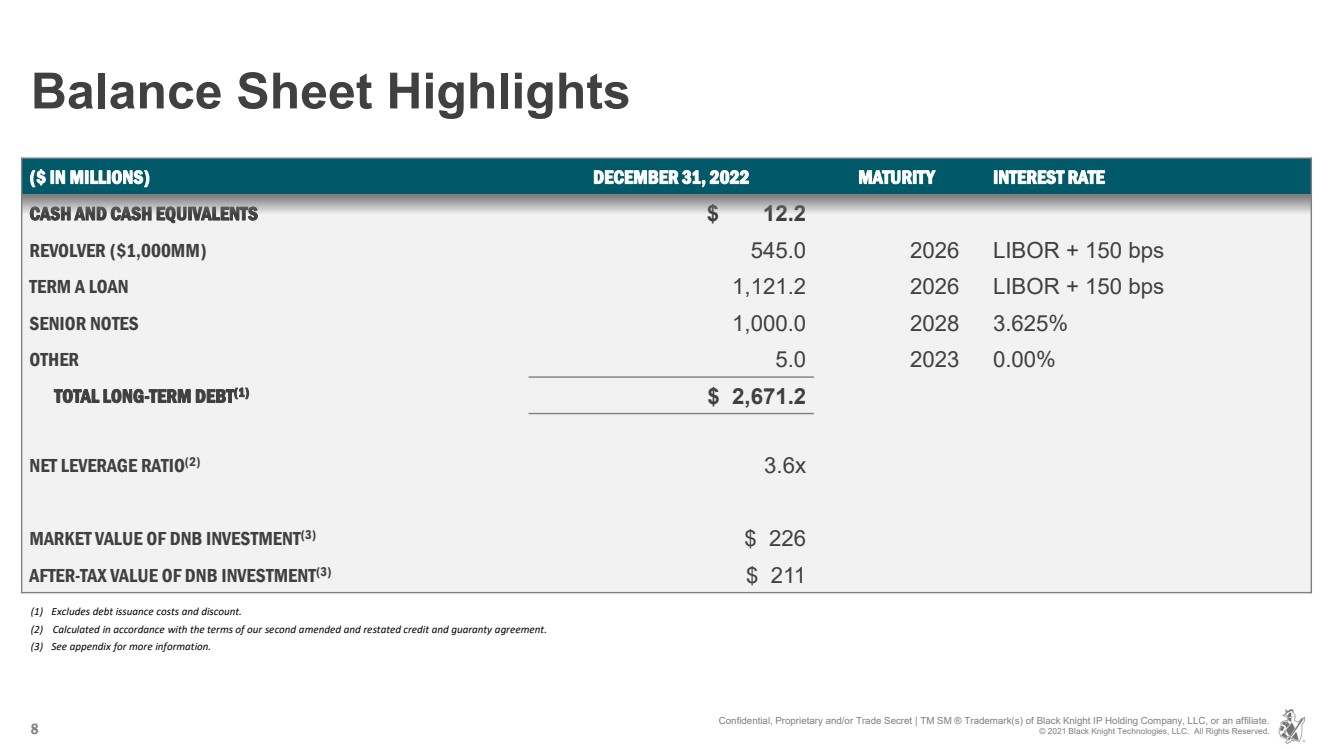
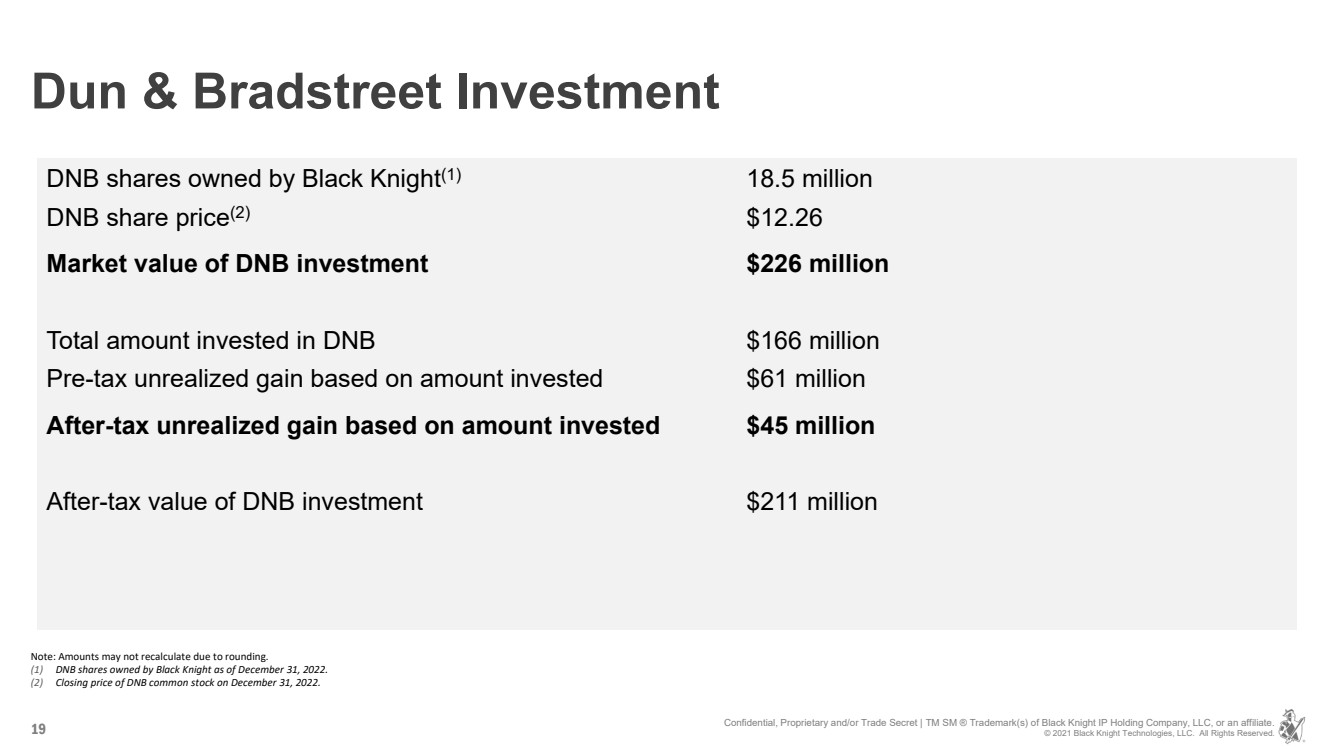
| ● | As of December 31, 2022, we owned 18.5 million shares of DNB common stock, which had a fair value of $226.5 million before tax based on DNB’s closing price of $12.26 as of December 31, 2022. |
| ● | As of December 31, 2022, we had cash and cash equivalents of $12.2 million, debt of $2,655.3 million and available capacity of $455.0 million on our revolving credit facility. |
| ● | For the year ended December 31, 2022, net cash provided by operations includes the effect of higher income tax payments primarily related to the gain on DNB common stock recognized as part of the February 2022 Optimal |
2
| Blue transaction, the effect of the change in timing of deducting certain software development costs under Internal Revenue Code Section 174 and payments made in connection with certain tax-planning actions to mitigate the potential impact of Internal Revenue Code Section 280G related to the proposed transaction with Intercontinental Exchange, Inc. (“ICE”) that was announced on May 4, 2022 (the “ICE Transaction”). |
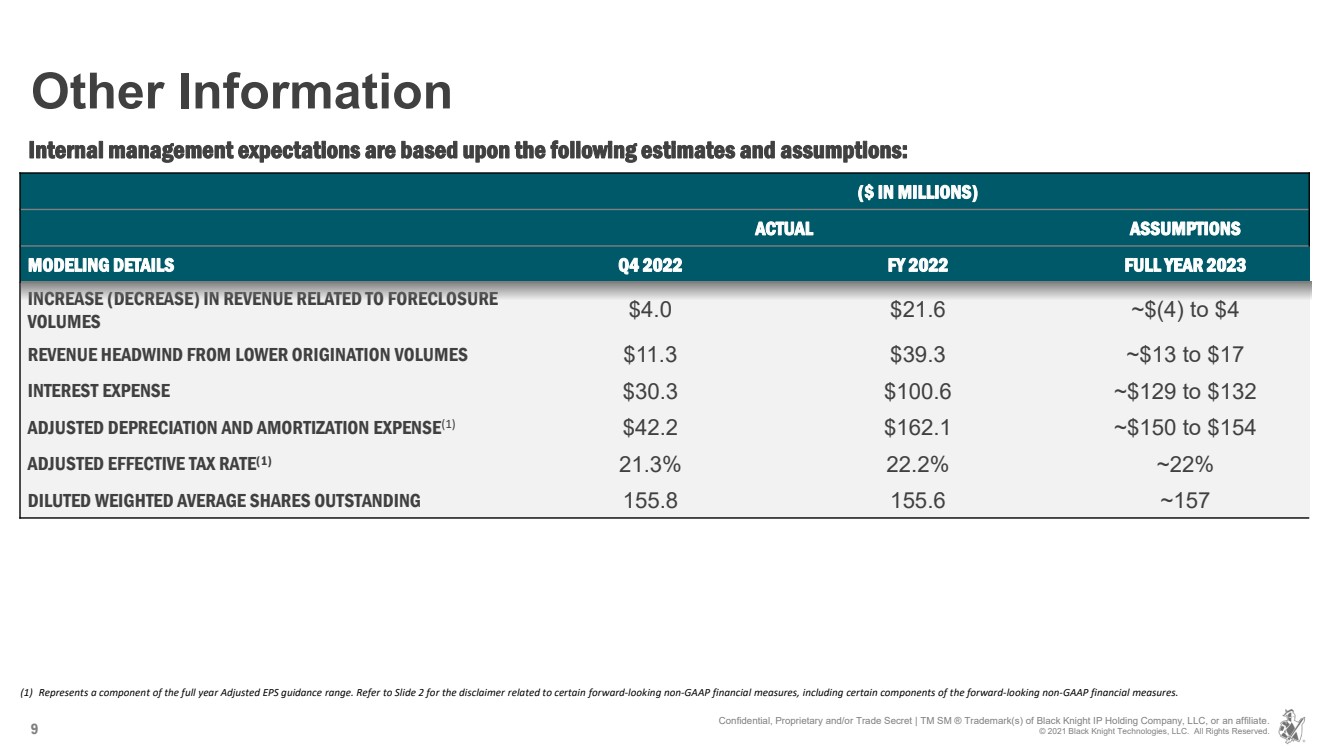
Business Outlook
As a result of the proposed ICE Transaction, Black Knight has suspended the practice of providing forward-looking guidance. In addition, Black Knight will not be hosting a conference call related to its fourth quarter and full year 2022 financial results.
Definitions of non-GAAP financial measures and the reconciliations to the most directly comparable GAAP measures are provided in subsequent sections of the press release narrative and supplemental schedules.
About Black Knight
Black Knight, Inc. (NYSE:BKI) is an award-winning software, data and analytics company that drives innovation in the mortgage lending and servicing and real estate industries, as well as the capital and secondary markets. Businesses leverage our robust, integrated solutions across the entire homeownership life cycle to help retain existing customers, gain new customers, mitigate risk and operate more effectively.
Our clients rely on our proven, comprehensive, scalable products and our unwavering commitment to delivering superior client support to achieve their strategic goals and better serve their customers. For more information on Black Knight, please visit www.blackknightinc.com.
Non-GAAP Financial Measures
This earnings release contains non-GAAP financial measures, including Organic revenue growth, Adjusted EBITDA, Adjusted EBITDA margin, Adjusted operating income, Adjusted operating margin, Adjusted net earnings and Adjusted EPS. These are important financial measures for us but are not financial measures as defined by generally accepted accounting principles ("GAAP"). The presentation of this financial information is not intended to be considered in isolation of or as a substitute for, or superior to, the financial information prepared and presented in accordance with GAAP.
We use these non-GAAP financial measures for financial and operational decision making and as a means to evaluate period-to-period comparisons. We believe these measures provide useful information about operating results, enhance the overall understanding of past financial performance and future prospects and allow for greater transparency with respect to key metrics used by management in its financial and operational decision making, including determining a portion of executive compensation. We also present these non-GAAP financial measures because we believe investors, analysts and rating agencies consider them useful in measuring our ability to meet our debt service obligations. By disclosing these non-GAAP financial measures, we believe we offer investors a greater understanding of, and an enhanced level of transparency into, the means by which our management operates the company.
These non-GAAP financial measures are not measures presented in accordance with GAAP, and our use of these terms may vary from that of others in our industry. These non-GAAP financial measures should not be considered as an alternative to revenues, operating income, operating margin, net earnings, net earnings per share, net earnings margin or any other measures derived in accordance with GAAP as measures of operating performance or liquidity. Reconciliations of these non-GAAP financial measures to the most directly comparable GAAP financial measures are presented in the attached schedules.
Revenues, EBITDA, EBITDA margin, Operating income and Operating margin for the Software Solutions and Data and Analytics segments are presented in conformity with Accounting Standards Codification Topic 280, Segment Reporting. These measures are reported to the chief operating decision maker for purposes of making decisions about allocating resources to the segments and assessing their performance. For these reasons, these measures are excluded from the
3
definition of non-GAAP financial measures under the Securities and Exchange Commission’s ("SEC") Regulation G and Item 10(e) of Regulation S-K.
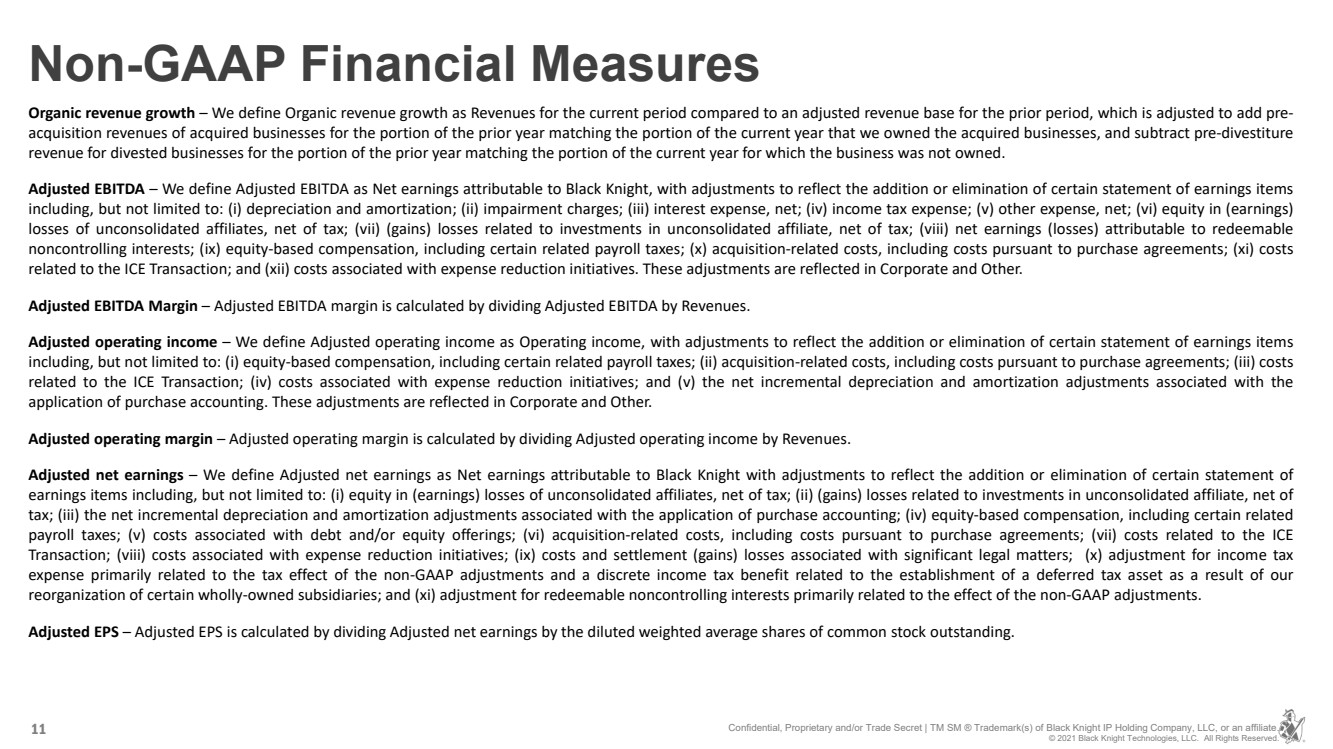
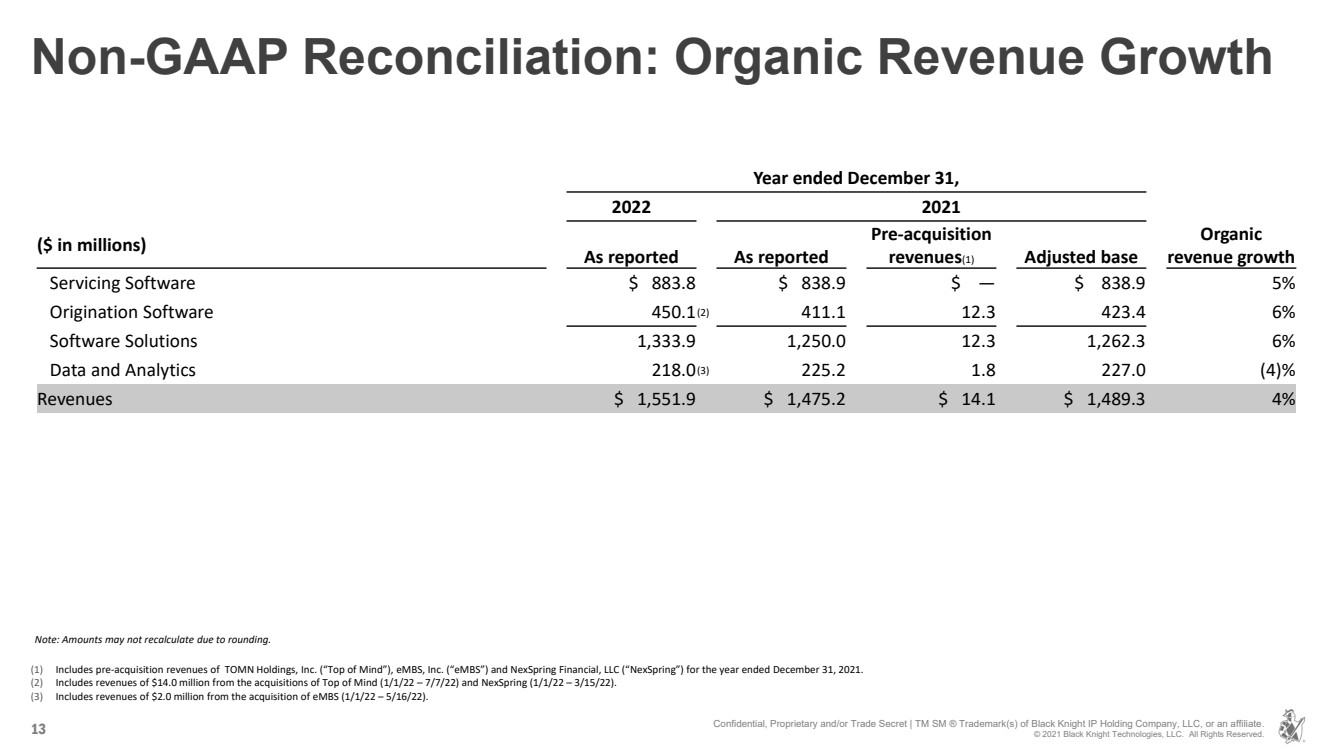
Organic revenue growth - We define Organic revenue growth as Revenues for the current period compared to an adjusted revenue base for the prior period, which is adjusted to add pre-acquisition revenues of acquired businesses for the portion of the prior year matching the portion of the current year that we owned the acquired businesses, and subtract pre-divestiture revenue for divested businesses for the portion of the prior year matching the portion of the current year for which the business was not owned.
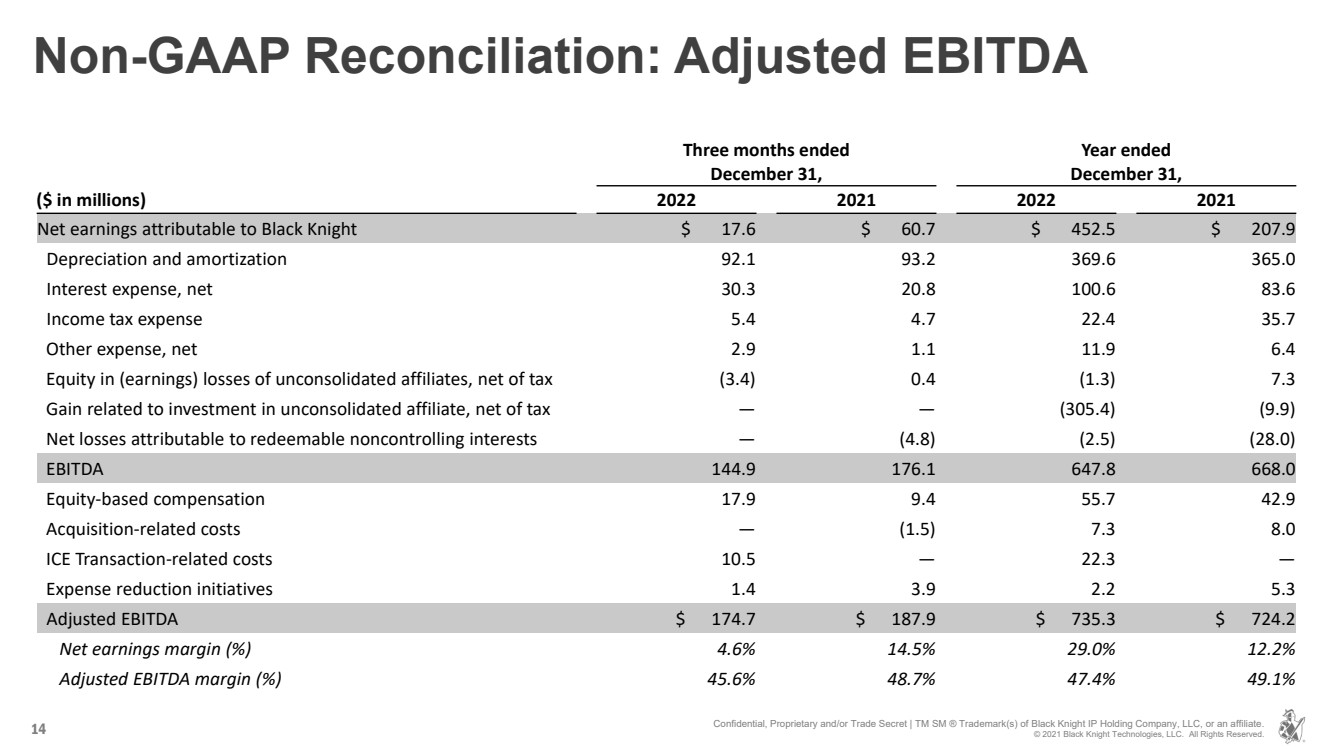
Adjusted EBITDA - We define Adjusted EBITDA as Net earnings attributable to Black Knight, with adjustments to reflect the addition or elimination of certain statement of earnings items including, but not limited to:
| ● | Depreciation and amortization; |
| ● | Impairment charges; |
| ● | Interest expense, net; |
| ● | Income tax expense; |
| ● | Other expense, net; |
| ● | Equity in (earnings) losses of unconsolidated affiliates, net of tax; |
| ● | (Gains) losses related to investments in unconsolidated affiliate, net of tax; |
| ● | Net earnings (losses) attributable to redeemable noncontrolling interests; |
| ● | equity-based compensation, including certain related payroll taxes; |
| ● | acquisition-related costs, including costs pursuant to purchase agreements; |
| ● | costs related to the ICE Transaction; and |
| ● | costs associated with expense reduction initiatives. |
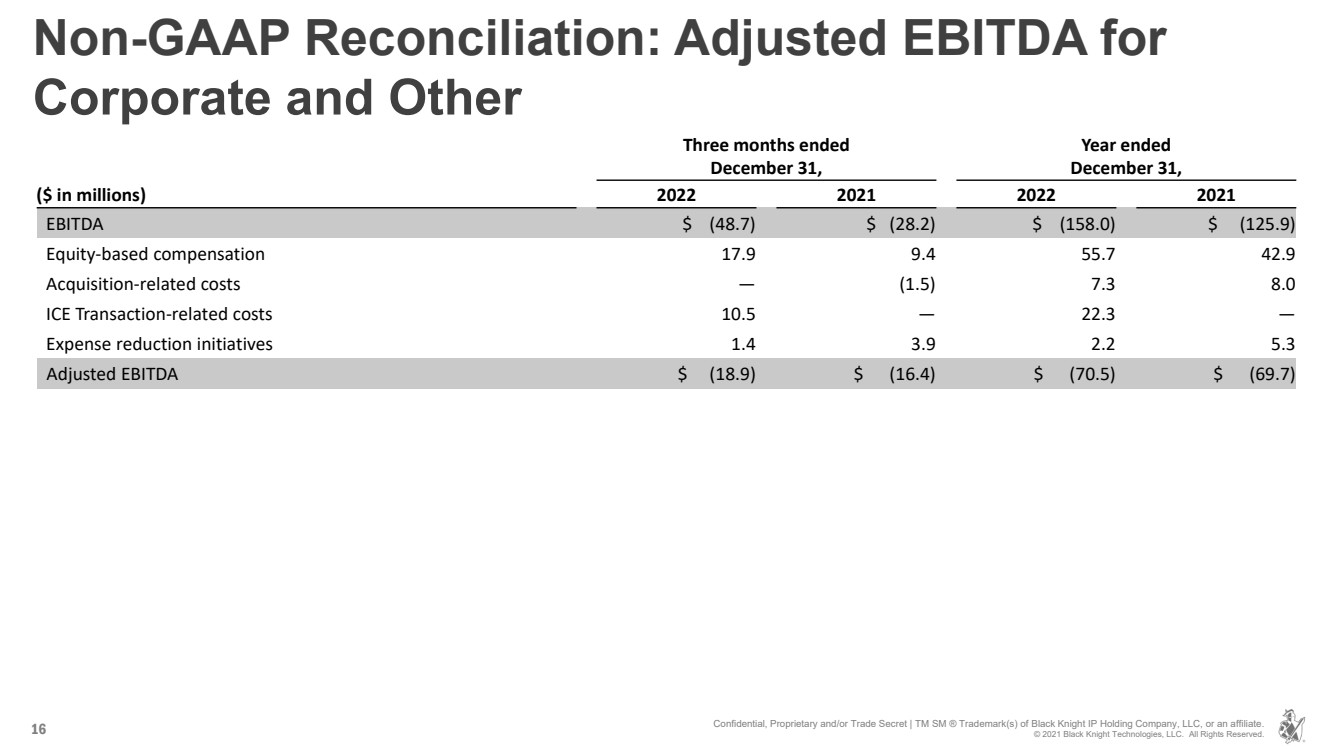
These adjustments are reflected in Corporate and Other.
Adjusted EBITDA margin - Adjusted EBITDA margin is calculated by dividing Adjusted EBITDA by Revenues.
Adjusted operating income – We define Adjusted operating income as Operating income, with adjustments to reflect the addition or elimination of certain statement of earnings items including, but not limited to:
| ● | equity-based compensation, including certain related payroll taxes; |
| ● | acquisition-related costs, including costs pursuant to purchase agreements; |
| ● | costs related to the ICE Transaction; |
| ● | costs associated with expense reduction initiatives; and |
| ● | the net incremental depreciation and amortization adjustments associated with the application of purchase accounting. |
These adjustments are reflected in Corporate and Other.
Adjusted operating margin - Adjusted operating margin is calculated by dividing Adjusted operating income by Revenues.
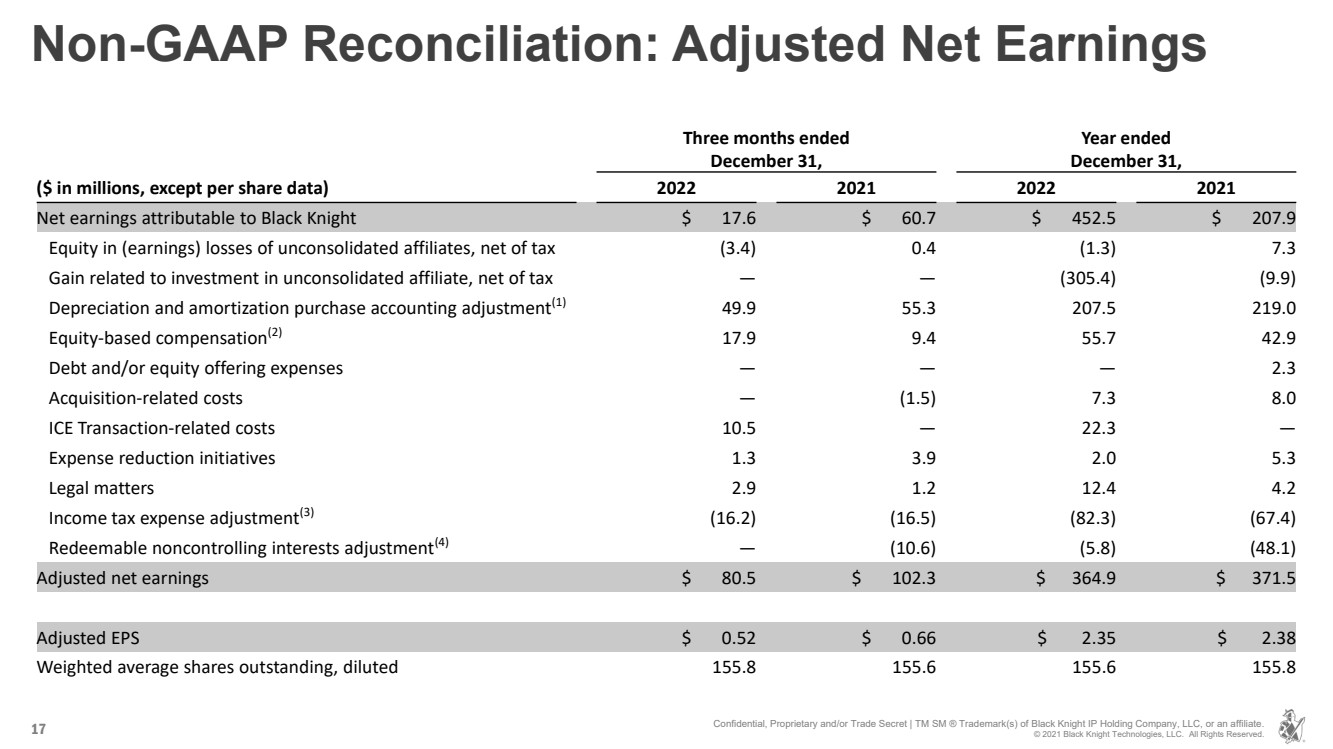
Adjusted net earnings - We define Adjusted net earnings as Net earnings attributable to Black Knight with adjustments to reflect the addition or elimination of certain statement of earnings items including, but not limited to:
| ● | equity in (earnings) losses of unconsolidated affiliates, net of tax; |
| ● | (gains) losses related to investments in unconsolidated affiliate, net of tax; |
| ● | (gain) related to the TitlePoint Transaction; |
| ● | the net incremental depreciation and amortization adjustments associated with the application of purchase accounting; |
4
| ● | equity-based compensation, including certain related payroll taxes; |
| ● | costs associated with debt and/or equity offerings; |
| ● | acquisition-related costs, including costs pursuant to purchase agreements; |
| ● | costs related to the ICE Transaction; |
| ● | costs associated with expense reduction initiatives; |
| ● | costs and settlement (gains) losses associated with significant legal matters; |
| ● | adjustment for income tax expense primarily related to the tax effect of the non-GAAP adjustments and a discrete income tax benefit related to the establishment of a deferred tax asset as a result of our reorganization of certain wholly-owned subsidiaries; and |
| ● | adjustment for redeemable noncontrolling interests primarily related to the effect of the non-GAAP adjustments. |
Adjusted EPS - Adjusted EPS is calculated by dividing Adjusted net earnings by the diluted weighted average shares of common stock outstanding.
Forward-Looking Statements
This press release contains forward-looking statements that involve a number of risks and uncertainties. Statements that are not historical facts, including statements regarding expectations, hopes, intentions or strategies regarding the future are forward-looking statements. Forward-looking statements are based on Black Knight management’s beliefs, as well as assumptions made by, and information currently available to, them. Because such statements are based on expectations as to future financial and operating results and are not statements of fact, actual results may differ materially from those projected. Black Knight undertakes no obligation to update any forward-looking statements, whether as a result of new information, future events or otherwise.
The risks and uncertainties that forward-looking statements are subject to include, but are not limited to:
| ● | the occurrence of any event, change, or other circumstance that could give rise to a right in favor of ICE or us to terminate the definitive merger agreement governing the terms and conditions of the ICE Transaction; |
| ● | the possibility that the ICE Transaction does not close when expected or at all because required regulatory or other approvals and other conditions to closing are not received or satisfied on a timely basis or at all (and the risk that such approvals may result in the imposition of conditions that could adversely affect ICE or us or the expected benefits of the ICE Transaction); |
| ● | business uncertainties and contractual restrictions while the ICE Transaction is pending, which could adversely affect our business and operations; |
| ● | the diversion of management’s attention and time from ongoing business operations and opportunities on merger-related matters; |
| ● | the outcome of any legal proceedings that may be instituted against us or ICE; |
| ● | changes to our relationships with our top clients, whom we rely on for a significant portion of our revenues and profit; |
| ● | our ability to comply with or changes to the laws, rules and regulations that affect our and our clients’ businesses; |
| ● | our ability to adapt our solutions to technological changes or evolving industry standards or to achieve our growth strategies; |
| ● | increase in the availability of free or relatively inexpensive information; |
| ● | our ability to protect our proprietary software and information rights; |
| ● | our dependence on our ability to access data from external sources; |
| ● | delays or difficulty in developing or implementing new, enhanced or existing software, data or hosting solutions; |
| ● | changes in general economic, business, regulatory and political conditions, particularly as they affect the mortgage industry; |
| ● | risks associated with the recruitment and retention of our skilled workforce; |
| ● | impacts to our business operations caused by the occurrence of a catastrophe or global crisis; |
| ● | our investment in DNB; |
5
| ● | security breaches against our information systems or breaches involving our third-party vendors; |
| ● | our ability to successfully consummate, integrate and achieve the intended benefits of acquisitions; and |
| ● | other risks and uncertainties to be detailed in the “Statement Regarding Forward-Looking Information”, “Risk Factors” and other sections of our Annual Report on Form 10-K for the year ended December 31, 2022 and other filings with the SEC. |
6
BLACK KNIGHT, INC.
Consolidated Balance Sheets
(In millions)
(Unaudited)
|
| December 31, | ||||
|
| 2022 |
| 2021 | ||
ASSETS | | |
|
| |
|
Current assets: | | |
|
| |
|
Cash and cash equivalents | | $ | 12.2 | | $ | 77.1 |
Trade receivables, net | |
| 193.5 | |
| 191.8 |
Prepaid expenses and other current assets | |
| 132.1 | |
| 83.0 |
Receivables from related parties | |
| 0.1 | |
| 0.2 |
Current assets held for sale | | | 5.8 | |
| — |
Total current assets | |
| 343.7 | |
| 352.1 |
Property and equipment, net | |
| 143.0 | |
| 154.5 |
Software, net | |
| 443.7 | |
| 497.0 |
Other intangible assets, net | |
| 470.1 | |
| 613.2 |
Goodwill | |
| 3,747.8 | |
| 3,817.3 |
Investments in unconsolidated affiliates | |
| 171.0 | |
| 490.5 |
Deferred contract costs, net | |
| 192.6 | |
| 196.0 |
Other non-current assets | |
| 246.2 | |
| 230.3 |
Non-current assets held for sale | | | 73.5 | |
| — |
Total assets | | $ | 5,831.6 | | $ | 6,350.9 |
LIABILITIES AND EQUITY | |
|
| |
|
|
Current liabilities: | |
|
| |
|
|
Trade accounts payable and other accrued liabilities | | $ | 66.5 | | $ | 64.5 |
Income taxes payable | | | 28.4 | |
| 11.8 |
Accrued compensation and benefits | |
| 82.8 | |
| 91.4 |
Current portion of debt | |
| 33.6 | |
| 32.5 |
Deferred revenues | |
| 59.9 | |
| 64.6 |
Total current liabilities | |
| 271.2 | |
| 264.8 |
Deferred revenues | |
| 42.4 | |
| 81.5 |
Deferred income taxes | |
| 227.5 | |
| 284.1 |
Long-term debt, net of current portion | |
| 2,621.7 | |
| 2,362.6 |
Other non-current liabilities | |
| 47.9 | |
| 78.7 |
Total liabilities | |
| 3,210.7 | |
| 3,071.7 |
| | | | | | |
Redeemable noncontrolling interests | |
| 47.6 | |
| 1,188.8 |
| | | | | | |
Equity: | |
|
| |
|
|
Additional paid-in capital | |
| 1,398.2 | |
| 1,410.9 |
Retained earnings | |
| 1,417.1 | |
| 968.2 |
Accumulated other comprehensive loss | |
| (6.3) | |
| (17.5) |
Treasury stock, at cost | |
| (235.7) | |
| (271.2) |
Total shareholders' equity | |
| 2,573.3 | |
| 2,090.4 |
Total liabilities, redeemable noncontrolling interests and shareholders' equity | | $ | 5,831.6 | | $ | 6,350.9 |
7
BLACK KNIGHT, INC.
Consolidated Statements of Earnings
(In millions, except per share data)
(Unaudited)
|
| Three months ended December 31, | | Year ended December 31, | ||||||||
|
| 2022 |
| 2021 |
| 2022 |
| 2021 | ||||
Revenues | | $ | 383.5 | | $ | 386.2 | | $ | 1,551.9 | | $ | 1,475.2 |
Expenses: | |
|
| |
|
| |
|
| |
|
|
Operating expenses | |
| 226.7 | |
| 207.7 | |
| 872.3 | |
| 793.9 |
Depreciation and amortization | |
| 92.1 | |
| 93.2 | |
| 369.6 | |
| 365.0 |
Transition and integration costs | |
| 11.9 | |
| 2.4 | |
| 31.8 | |
| 13.3 |
Total expenses | |
| 330.7 | |
| 303.3 | |
| 1,273.7 | |
| 1,172.2 |
Operating income | |
| 52.8 | |
| 82.9 | |
| 278.2 | |
| 303.0 |
Other income and expense: | |
|
| |
|
| |
|
| |
|
|
Interest expense, net | |
| (30.3) | |
| (20.8) | |
| (100.6) | |
| (83.6) |
Other expense, net | |
| (2.9) | |
| (1.1) | |
| (11.9) | |
| (6.4) |
Total other expense, net | |
| (33.2) | |
| (21.9) | |
| (112.5) | |
| (90.0) |
Earnings before income taxes and equity in earnings (losses) of unconsolidated affiliates | |
| 19.6 | |
| 61.0 | |
| 165.7 | |
| 213.0 |
Income tax expense | |
| 5.4 | |
| 4.7 | |
| 22.4 | |
| 35.7 |
Earnings before equity in earnings (losses) of unconsolidated affiliates | |
| 14.2 | |
| 56.3 | |
| 143.3 | |
| 177.3 |
Equity in earnings (losses) of unconsolidated affiliates, net of tax | |
| 3.4 | |
| (0.4) | |
| 306.7 | |
| 2.6 |
Net earnings | |
| 17.6 | |
| 55.9 | |
| 450.0 | |
| 179.9 |
Net losses attributable to redeemable noncontrolling interests | |
| — | |
| 4.8 | |
| 2.5 | |
| 28.0 |
Net earnings attributable to Black Knight | | $ | 17.6 | | $ | 60.7 | | $ | 452.5 | | $ | 207.9 |
| | | | | | | | | | | | |
Net earnings per share attributable to Black Knight shareholders: | |
|
| |
|
| |
|
| |
|
|
Basic | | $ | 0.11 | | $ | 0.39 | | $ | 2.93 | | $ | 1.34 |
Diluted | | $ | 0.11 | | $ | 0.39 | | $ | 2.91 | | $ | 1.33 |
Weighted average shares of common stock outstanding: | |
|
| |
|
| |
|
| |
|
|
Basic | |
| 154.5 | |
| 154.1 | |
| 154.4 | |
| 155.1 |
Diluted | |
| 155.8 | |
| 155.6 | |
| 155.6 | |
| 155.8 |
8
BLACK KNIGHT, INC.
Consolidated Statements of Cash Flows
(In millions)
(Unaudited)
|
| Year ended December 31, | ||||
|
| 2022 |
| 2021 | ||
Cash flows from operating activities: | | |
|
| |
|
Net earnings | | $ | 450.0 | | $ | 179.9 |
Adjustments to reconcile net earnings to net cash provided by operating activities: | |
|
| |
|
|
Depreciation and amortization | |
| 369.6 | |
| 365.0 |
Amortization of debt issuance costs and original issue discount | |
| 3.8 | |
| 3.9 |
Loss on extinguishment of debt | | | — | | | 2.5 |
Deferred income taxes, net | |
| (160.0) | |
| (17.0) |
Equity in earnings of unconsolidated affiliates, net of tax | |
| (306.7) | |
| (2.6) |
Equity-based compensation | |
| 54.9 | |
| 41.7 |
Changes in assets and liabilities, net of acquired assets and liabilities: | |
| | |
| |
Trade receivables, including receivables from related parties | |
| (7.6) | |
| (5.9) |
Prepaid expenses and other assets | |
| (64.0) | |
| (42.5) |
Deferred contract costs | |
| (42.3) | |
| (57.9) |
Deferred revenues | |
| (43.8) | |
| (3.9) |
Trade accounts payable and other liabilities | |
| (2.2) | |
| (13.3) |
Net cash provided by operating activities | |
| 251.7 | |
| 449.9 |
Cash flows from investing activities: | |
|
| |
|
|
Additions to property and equipment | |
| (27.2) | |
| (28.5) |
Additions to software | |
| (93.1) | |
| (85.1) |
Business acquisitions, net of cash acquired | |
| — | |
| (302.6) |
Asset acquisitions | |
| — | |
| (10.0) |
Other investing activities | |
| (4.0) | |
| (3.6) |
Net cash used in investing activities | |
| (124.3) | |
| (429.8) |
Cash flows from financing activities: | |
|
| |
|
|
Revolver borrowings | |
| 750.6 | |
| 660.4 |
Revolver payments | |
| (461.6) | |
| (452.1) |
Term loan borrowings | | | — | | | 1.6 |
Term loan payments | |
| (28.8) | |
| — |
Payments made for redeemable noncontrolling interests | |
| (433.5) | |
| — |
Purchases of treasury stock | |
| — | |
| (146.7) |
Tax withholding payments for restricted share vesting | |
| (17.8) | |
| (25.6) |
Finance lease payments | |
| (0.8) | |
| (3.6) |
Debt issuance costs paid | |
| — | |
| (7.7) |
Other financing activities | |
| (0.4) | |
| (4.0) |
Net cash (used in) provided by financing activities | |
| (192.3) | |
| 22.3 |
Net (decrease) increase in cash and cash equivalents | |
| (64.9) | |
| 42.4 |
Cash and cash equivalents, beginning of period | |
| 77.1 | |
| 34.7 |
Cash and cash equivalents, end of period | | $ | 12.2 | | $ | 77.1 |
Supplemental cash flow information: | |
|
| |
|
|
Interest paid, net | | $ | (97.0) | | $ | (80.4) |
Income taxes paid, net | | $ | (165.1) | | $ | (52.7) |
9
BLACK KNIGHT, INC.
Segment Information
(In millions)
(Unaudited)
| | Three months ended December 31, 2022 | ||||||||||
| | Software | | Data and | | Corporate and | | | | |||
|
| Solutions |
| Analytics |
| Other |
| Total | ||||
Revenues | | $ | 331.1 |
| $ | 52.4 | | $ | — | | $ | 383.5 |
Expenses: | |
|
| |
|
| |
|
|
|
|
|
Operating expenses | |
| 153.2 | |
| 36.7 | |
| 36.8 | (1) |
| 226.7 |
Transition and integration costs | |
| — | |
| — | |
| 11.9 | (2) |
| 11.9 |
EBITDA | |
| 177.9 | |
| 15.7 | |
| (48.7) |
|
| 144.9 |
Depreciation and amortization | |
| 38.2 | |
| 4.1 | |
| 49.8 | (3) |
| 92.1 |
Operating income (loss) | |
| 139.7 | |
| 11.6 | |
| (98.5) |
|
| 52.8 |
Interest expense, net | |
|
| |
|
| |
|
|
|
| (30.3) |
Other expense, net | |
|
| |
|
| |
|
|
|
| (2.9) |
Earnings before income taxes and equity in earnings of unconsolidated affiliates | |
|
| |
|
| |
|
|
|
| 19.6 |
Income tax expense | |
|
| |
|
| |
|
|
|
| 5.4 |
Earnings before equity in earnings of unconsolidated affiliates | |
|
| |
|
| |
|
|
|
| 14.2 |
Equity in earnings of unconsolidated affiliates, net of tax | |
|
| |
|
| |
|
|
|
| 3.4 |
Net earnings | |
|
| |
|
| |
|
|
| $ | 17.6 |
| | Three months ended December 31, 2021 | ||||||||||
| | Software |
| Data and | | Corporate and | | | | |||
|
| Solutions | | Analytics | | Other | | Total | ||||
Revenues | | $ | 329.2 | | $ | 57.0 | | $ | — | | $ | 386.2 |
Expenses: | |
|
| |
|
| |
|
|
|
|
|
Operating expenses | |
| 143.7 | |
| 38.2 | |
| 25.8 | (1) |
| 207.7 |
Transition and integration costs | |
| — | | | — | |
| 2.4 | (2) |
| 2.4 |
EBITDA | |
| 185.5 | |
| 18.8 | |
| (28.2) |
|
| 176.1 |
Depreciation and amortization | |
| 34.2 | |
| 4.1 | |
| 54.9 | (3) |
| 93.2 |
Operating income (loss) | |
| 151.3 | |
| 14.7 | |
| (83.1) |
|
| 82.9 |
Interest expense, net | |
|
| |
|
| |
|
|
|
| (20.8) |
Other expense, net | |
|
| |
|
| |
|
|
|
| (1.1) |
Earnings before income taxes and equity in losses of unconsolidated affiliates | |
|
| |
|
| |
|
|
|
| 61.0 |
Income tax expense | |
|
| |
|
| |
|
|
|
| 4.7 |
Earnings before equity in losses of unconsolidated affiliates | |
|
| |
|
| |
|
|
|
| 56.3 |
Equity in losses of unconsolidated affiliates, net of tax | |
|
| |
|
| |
|
|
|
| (0.4) |
Net earnings | | | | | | | | | | | | 55.9 |
Net losses attributable to redeemable noncontrolling interests | | | | | | | | | | | | 4.8 |
Net earnings attributable to Black Knight | |
|
| |
|
| |
|
|
| $ | 60.7 |
10
BLACK KNIGHT, INC.
Segment Information (Continued)
(In millions)
(Unaudited)
| | Year ended December 31, 2022 | ||||||||||
| | Software |
| Data and | | Corporate and | | | | |||
|
| Solutions | | Analytics |
| Other |
| Total | ||||
Revenues | | $ | 1,333.9 |
| $ | 218.0 | | $ | — | | $ | 1,551.9 |
Expenses: | |
|
|
|
|
| |
|
|
|
|
|
Operating expenses | |
| 597.4 |
|
| 148.7 | |
| 126.2 | (1) |
| 872.3 |
Transition and integration costs | |
| — |
|
| — | |
| 31.8 | (2) |
| 31.8 |
EBITDA | |
| 736.5 | |
| 69.3 | |
| (158.0) |
|
| 647.8 |
Depreciation and amortization | |
| 146.6 |
|
| 15.8 | |
| 207.2 | (3) |
| 369.6 |
Operating income (loss) | |
| 589.9 | |
| 53.5 | |
| (365.2) |
|
| 278.2 |
Interest expense, net | |
|
|
|
|
| |
|
|
|
| (100.6) |
Other expense, net | |
|
|
|
|
| |
|
|
|
| (11.9) |
Earnings before income taxes and equity in earnings of unconsolidated affiliates | |
|
|
|
|
| |
|
|
|
| 165.7 |
Income tax expense | |
|
|
|
|
| |
|
|
|
| 22.4 |
Earnings before equity in earnings of unconsolidated affiliates | |
|
|
|
|
| |
|
|
|
| 143.3 |
Equity in earnings of unconsolidated affiliates, net of tax | |
|
|
|
|
| |
|
|
|
| 306.7 |
Net earnings | |
|
|
|
|
| |
|
|
|
| 450.0 |
Net losses attributable to redeemable noncontrolling interests | |
|
|
|
|
| |
|
|
|
| 2.5 |
Net earnings attributable to Black Knight | |
|
|
|
|
| |
|
|
| $ | 452.5 |
| | Year ended December 31, 2021 | ||||||||||
| | Software | | Data and | | Corporate and |
| | | |||
|
| Solutions |
| Analytics |
| Other |
| Total | ||||
Revenues | | $ | 1,250.0 | | $ | 225.2 | | $ | — | | $ | 1,475.2 |
Expenses: | |
|
| |
|
| |
|
|
|
|
|
Operating expenses | |
| 536.3 | |
| 145.0 | |
| 112.6 | (1) |
| 793.9 |
Transition and integration costs | |
| — | |
| — | |
| 13.3 | (2) |
| 13.3 |
EBITDA | |
| 713.7 | |
| 80.2 | |
| (125.9) |
|
| 668.0 |
Depreciation and amortization | |
| 131.1 | |
| 15.5 | |
| 218.4 | (3) |
| 365.0 |
Operating income (loss) | |
| 582.6 | |
| 64.7 | |
| (344.3) |
|
| 303.0 |
Interest expense, net | |
|
| |
|
| |
|
|
|
| (83.6) |
Other expense, net | |
|
| |
|
| |
|
|
|
| (6.4) |
Earnings before income taxes and equity in earnings of unconsolidated affiliates | |
|
| |
|
| |
|
|
|
| 213.0 |
Income tax expense | |
|
| |
|
| |
|
|
|
| 35.7 |
Earnings before equity in earnings of unconsolidated affiliates | |
|
| |
|
| |
|
|
|
| 177.3 |
Equity in earnings of unconsolidated affiliates, net of tax | |
|
| |
|
| |
|
|
|
| 2.6 |
Net earnings | | | | | | | | | | | | 179.9 |
Net losses attributable to redeemable noncontrolling interests | | | | | | | | | | | | 28.0 |
Net earnings attributable to Black Knight | |
|
| |
|
| |
|
|
| $ | 207.9 |
| (1) | Operating expenses for Corporate and Other includes equity-based compensation, including certain related payroll taxes, of $17.9 million and $9.4 million for the three months ended December 31, 2022 and 2021, respectively, and $55.7 million and $42.9 million for the year ended December 31, 2022 and 2021, respectively. |
| (2) | Transition and integration costs primarily consists of costs related to the ICE Transaction and costs associated with acquisitions. |
| (3) | Depreciation and amortization for Corporate and Other primarily represents net incremental depreciation and amortization adjustments associated with the application of purchase accounting recorded in accordance with GAAP. |
11
BLACK KNIGHT, INC.
Reconciliation of GAAP to Non-GAAP Financial Measures
(In millions)
(Unaudited)
Reconciliation of Revenues to Organic Revenue Growth
| | Three months ended December 31, | | |
| ||||||||||
| | 2022 | | 2021 | | Organic |
| ||||||||
| | | | | | | | Pre-acquisition | | Adjusted | | revenue |
| ||
|
| As reported |
| As reported |
| revenues(1) |
| base |
| growth |
| ||||
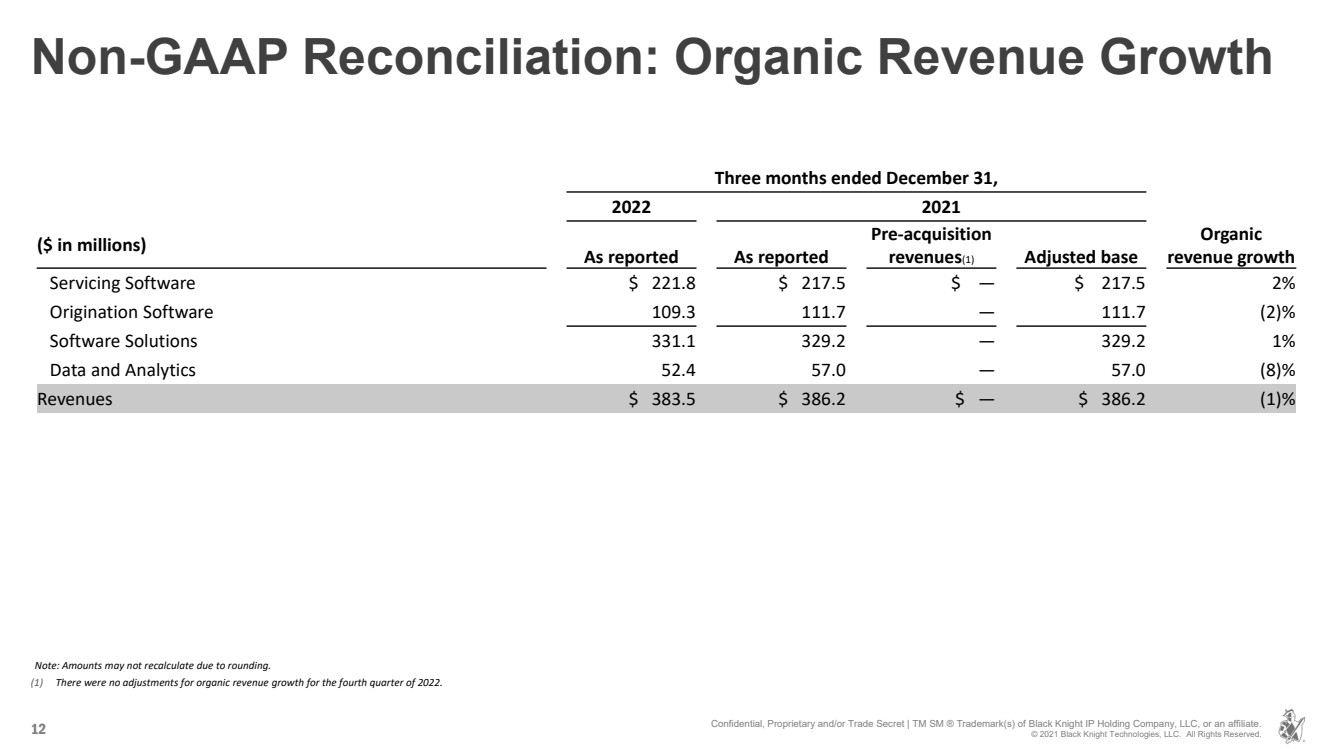
Servicing Software | | $ | 221.8 | | $ | 217.5 | | $ | — | | $ | 217.5 | | 2 | % |
Origination Software | | | 109.3 | | | 111.7 | | | — | | | 111.7 | | (2) | % |
Software Solutions | | | 331.1 | | | 329.2 | | | — | | | 329.2 | | 1 | % |
Data and Analytics | | | 52.4 | | | 57.0 | | | — | | | 57.0 | | (8) | % |
Revenues | | $ | 383.5 | | $ | 386.2 |
| $ | — | | $ | 386.2 |
| (1) | % |
Note: Amounts may not recalculate due to rounding.
| (1) | There were no adjustments for organic revenue growth for the fourth quarter of 2022. |
| | Year ended December 31, | | |
| ||||||||||
|
| 2022 |
| 2021 | | Organic |
| ||||||||
| | As | | As | | Pre-acquisition | | Adjusted | | revenue |
| ||||
|
| reported |
| reported |
| revenues(1) |
| base |
| growth |
| ||||
Servicing Software | | $ | 883.8 | | $ | 838.9 | | $ | — | | $ | 838.9 | | 5 | % |
Origination Software | | | 450.1 | (2) | | 411.1 | | | 12.3 | | | 423.4 | | 6 | % |
Software Solutions | | | 1,333.9 | | | 1,250.0 | | | 12.3 | | | 1,262.3 | | 6 | % |
Data and Analytics | | | 218.0 | (3) | | 225.2 | | | 1.8 | | | 227.0 | | (4) | % |
Revenues | | $ | 1,551.9 | | $ | 1,475.2 | | $ | 14.1 | | $ | 1,489.3 |
| 4 | % |
Note: Amounts may not recalculate due to rounding.
| (1) | Includes pre-acquisition revenues of TOMN Holdings, Inc. (“Top of Mind”), eMBS, Inc. (“eMBS”) and NexSpring Financial, LLC (“NexSpring”) for the year ended December 31, 2021. |
| (2) | Includes revenues of $14.0 million from the acquisitions of Top of Mind (1/1/22 – 7/7/22) and NexSpring (1/1/22 - 3/15/22). |
| (3) | Includes revenues of $2.0 million from the acquisition of eMBS (1/1/22 - 5/16/22). |
12
BLACK KNIGHT, INC.
Reconciliation of GAAP to Non-GAAP Financial Measures
(In millions)
(Unaudited)
Reconciliation of Net Earnings to Adjusted EBITDA
| | Three months ended December 31, | | Year ended December 31, |
| ||||||||
|
| 2022 |
| 2021 |
| 2022 |
| 2021 |
| ||||
Net earnings attributable to Black Knight | | $ | 17.6 | | $ | 60.7 | | $ | 452.5 | | $ | 207.9 | |
Depreciation and amortization | |
| 92.1 | |
| 93.2 | |
| 369.6 | |
| 365.0 | |
Interest expense, net | |
| 30.3 | |
| 20.8 | |
| 100.6 | |
| 83.6 | |
Income tax expense | |
| 5.4 | |
| 4.7 | |
| 22.4 | |
| 35.7 | |
Other expense, net | |
| 2.9 | |
| 1.1 | |
| 11.9 | |
| 6.4 | |
Equity in (earnings) losses of unconsolidated affiliates, net of tax | |
| (3.4) | |
| 0.4 | |
| (1.3) | |
| 7.3 | |
Gain related to investment in unconsolidated affiliate, net of tax | |
| — | |
| — | |
| (305.4) | |
| (9.9) | |
Net losses attributable to redeemable noncontrolling interests | |
| — | |
| (4.8) | |
| (2.5) | |
| (28.0) | |
EBITDA | |
| 144.9 | |
| 176.1 | |
| 647.8 | |
| 668.0 | |
Equity-based compensation | |
| 17.9 | |
| 9.4 | |
| 55.7 | |
| 42.9 | |
Acquisition-related costs | |
| — | |
| (1.5) | |
| 7.3 | |
| 8.0 | |
ICE Transaction-related costs | |
| 10.5 | |
| — | |
| 22.3 | |
| — | |
Expense reduction initiatives | |
| 1.4 | |
| 3.9 | |
| 2.2 | |
| 5.3 | |
Adjusted EBITDA | | $ | 174.7 | | $ | 187.9 | | $ | 735.3 | | $ | 724.2 | |
Net earnings margin | |
| 4.6 | % | | 14.5 | % | | 29.0 | % | | 12.2 | % |
Adjusted EBITDA margin | |
| 45.6 | % | | 48.7 | % | | 47.4 | % | | 49.1 | % |
Reconciliation of Operating Income to Adjusted Operating Income
| | Three months ended December 31, | | Year ended December 31, | | ||||||||
|
| 2022 | | 2021 | | 2022 | | 2021 | | ||||
Operating income | | $ | 52.8 | | $ | 82.9 | | $ | 278.2 | | $ | 303.0 | |
Equity-based compensation | |
| 17.9 | |
| 9.4 | |
| 55.7 | |
| 42.9 | |
Acquisition-related costs | |
| — | |
| (1.5) | |
| 7.3 | |
| 8.0 | |
ICE Transaction-related costs | |
| 10.5 | |
| — | |
| 22.3 | |
| — | |
Expense reduction initiatives | |
| 1.4 | |
| 3.9 | |
| 2.2 | |
| 5.3 | |
Depreciation and amortization purchase accounting adjustment | |
| 49.9 | |
| 55.3 | |
| 207.5 | |
| 219.0 | |
Adjusted operating income | | $ | 132.5 | | $ | 150.0 | | $ | 573.2 | | $ | 578.2 | |
Operating margin | | | 13.8 | % | | 21.5 | % | | 17.9 | % | | 20.5 | % |
Adjusted operating margin | | | 34.6 | % | | 38.8 | % | | 36.9 | % | | 39.2 | % |
13
BLACK KNIGHT, INC.
Reconciliation of GAAP to Non-GAAP Financial Measures (Continued)
(In millions, except per share data)
(Unaudited)
Reconciliation of Net Earnings to Adjusted Net Earnings
|
| Three months ended December 31, | | Year ended December 31, | ||||||||
|
| 2022 |
| 2021 |
| 2022 |
| 2021 | ||||
Net earnings attributable to Black Knight | | $ | 17.6 | | $ | 60.7 | | $ | 452.5 | | $ | 207.9 |
Equity in (earnings) losses of unconsolidated affiliates, net of tax | |
| (3.4) | |
| 0.4 | |
| (1.3) | |
| 7.3 |
Gain related to investment in unconsolidated affiliate, net of tax | |
| — | |
| — | |
| (305.4) | |
| (9.9) |
Depreciation and amortization purchase accounting adjustment (1) | |
| 49.9 | | | 55.3 | | | 207.5 | | | 219.0 |
Equity-based compensation (2) | |
| 17.9 | | | 9.4 | | | 55.7 | | | 42.9 |
Debt and/or equity offering expenses | |
| — | | | — | | | — | | | 2.3 |
Acquisition-related costs | |
| — | | | (1.5) | | | 7.3 | | | 8.0 |
ICE Transaction-related costs | |
| 10.5 | | | — | | | 22.3 | | | — |
Expense reduction initiatives | |
| 1.3 | | | 3.9 | | | 2.0 | | | 5.3 |
Legal matters | |
| 2.9 | | | 1.2 | | | 12.4 | | | 4.2 |
Income tax expense adjustment (3) | |
| (16.2) | | | (16.5) | | | (82.3) | | | (67.4) |
Redeemable noncontrolling interests adjustment (4) | |
| — | | | (10.6) | | | (5.8) | | | (48.1) |
Adjusted net earnings | | $ | 80.5 | | $ | 102.3 | | $ | 364.9 | | $ | 371.5 |
| | | | | | | | | | | | |
Adjusted EPS | | $ | 0.52 | | $ | 0.66 | | $ | 2.35 | | $ | 2.38 |
Weighted average shares outstanding, diluted | |
| 155.8 | |
| 155.6 | |
| 155.6 | |
| 155.8 |
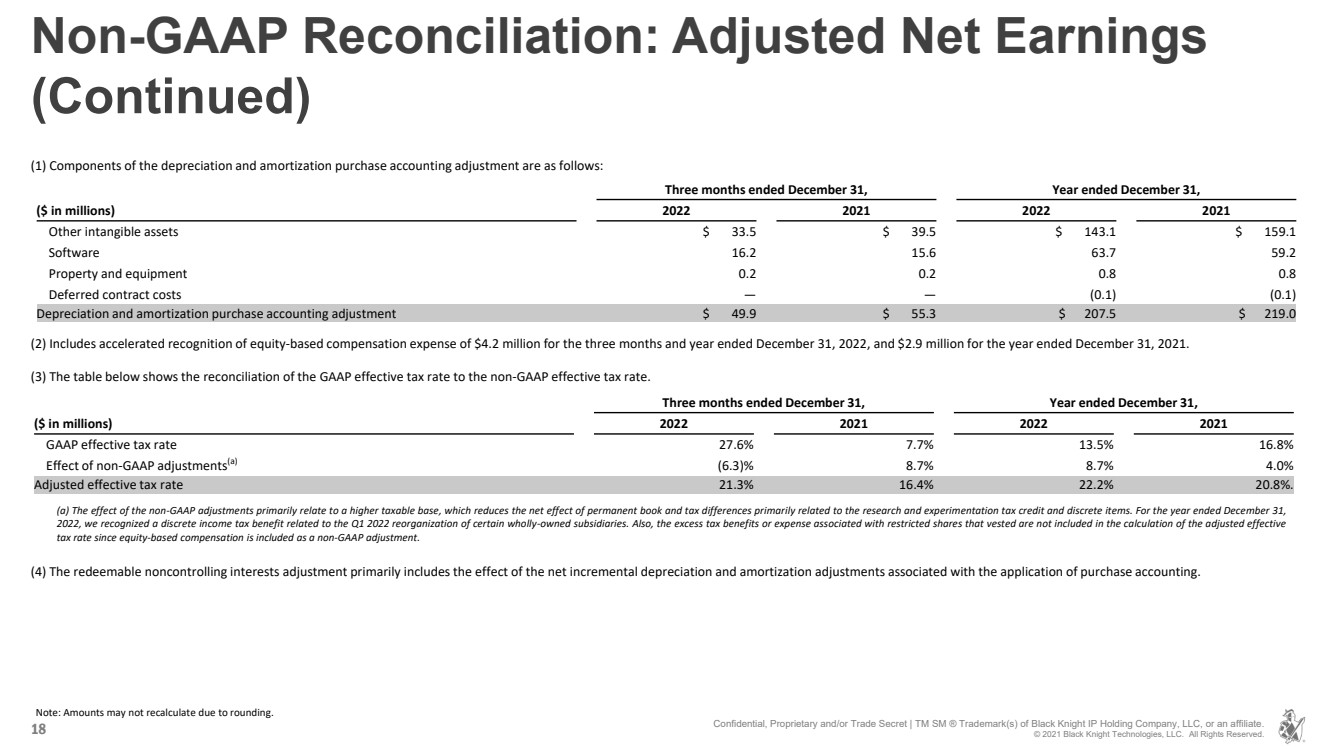
| (1) | Components of the depreciation and amortization purchase accounting adjustment are as follows: |
|
| Three months ended December 31, |
| Year ended December 31, | ||||||||
|
| 2022 |
| 2021 |
| 2022 |
| 2021 | ||||
Other intangible assets | | $ | 33.5 | | $ | 39.5 | | $ | 143.1 | | $ | 159.1 |
Software | |
| 16.2 | | | 15.6 | | | 63.7 | | | 59.2 |
Property and equipment | |
| 0.2 | | | 0.2 | | | 0.8 | | | 0.8 |
Deferred contract costs | |
| — | | | — | | | (0.1) | | | (0.1) |
Depreciation and amortization purchase accounting adjustment | | $ | 49.9 | | $ | 55.3 | | $ | 207.5 | | $ | 219.0 |
| (2) | Includes accelerated recognition of equity-based compensation expense of $4.2 million for the three months and year ended December 31, 2022, and $2.9 million for the year ended December 31, 2021. |
| (3) | Includes a discrete income tax benefit of $14.1 million recognized in the first quarter of 2022 related to the establishment of a deferred tax asset as a result of our reorganization of certain wholly-owned subsidiaries within the Optimal Blue partnership investment structure during the year ended December 31, 2022. |
| (4) | The redeemable noncontrolling interests adjustment primarily includes the effect of the net incremental depreciation and amortization adjustments associated with the application of purchase accounting. |
14