00http://fasb.org/us-gaap/2021-01-31#OtherAssetsNoncurrenthttp://fasb.org/us-gaap/2021-01-31#AccountsPayableAndOtherAccruedLiabilitiesCurrenthttp://fasb.org/us-gaap/2021-01-31#OtherLiabilitiesNoncurrenthttp://fasb.org/us-gaap/2021-01-31#OperatingLeaseLiability00016270142022FYfalsetruehttp://fasb.org/us-gaap/2021-01-31#AccountingStandardsUpdate201802MemberP3YP3YP3YP5Yhttp://fasb.org/us-gaap/2021-01-31#OtherAssetsNoncurrenthttp://fasb.org/us-gaap/2021-01-31#AccountsPayableAndOtherAccruedLiabilitiesCurrenthttp://fasb.org/us-gaap/2021-01-31#OtherLiabilitiesNoncurrenthttp://fasb.org/us-gaap/2021-01-31#OperatingLeaseLiabilityP1YP2YP2YP12M0001627014bki:RepurchaseProgram2020Member2022-12-310001627014bki:RepurchaseProgram2020Member2020-02-122020-02-120001627014bki:RepurchaseProgram2020Member2020-02-120001627014bki:RepurchaseProgram2020Member2021-01-012021-12-310001627014bki:DBInvestmentMemberbki:BisnodeBusinessInformationGroupABMember2021-01-082021-01-080001627014us-gaap:CommonStockMember2020-06-192020-06-190001627014us-gaap:RetainedEarningsMember2022-12-310001627014us-gaap:NoncontrollingInterestMember2022-12-310001627014us-gaap:AdditionalPaidInCapitalMember2022-12-310001627014us-gaap:AccumulatedOtherComprehensiveIncomeMember2022-12-310001627014us-gaap:RetainedEarningsMember2021-12-310001627014us-gaap:NoncontrollingInterestMember2021-12-310001627014us-gaap:AdditionalPaidInCapitalMember2021-12-310001627014us-gaap:AccumulatedOtherComprehensiveIncomeMember2021-12-310001627014srt:CumulativeEffectPeriodOfAdoptionAdjustmentMemberus-gaap:RetainedEarningsMember2020-12-310001627014srt:CumulativeEffectPeriodOfAdoptionAdjustedBalanceMemberus-gaap:RetainedEarningsMember2020-12-310001627014srt:CumulativeEffectPeriodOfAdoptionAdjustedBalanceMemberus-gaap:AdditionalPaidInCapitalMember2020-12-310001627014srt:CumulativeEffectPeriodOfAdoptionAdjustedBalanceMemberus-gaap:AccumulatedOtherComprehensiveIncomeMember2020-12-310001627014us-gaap:RetainedEarningsMember2020-12-310001627014us-gaap:NoncontrollingInterestMember2020-12-310001627014us-gaap:AdditionalPaidInCapitalMember2020-12-310001627014us-gaap:AccumulatedOtherComprehensiveIncomeMember2020-12-310001627014srt:CumulativeEffectPeriodOfAdoptionAdjustmentMember2020-12-310001627014srt:CumulativeEffectPeriodOfAdoptionAdjustedBalanceMember2020-12-310001627014us-gaap:RetainedEarningsMember2019-12-310001627014us-gaap:AdditionalPaidInCapitalMember2019-12-310001627014us-gaap:AccumulatedOtherComprehensiveIncomeMember2019-12-310001627014us-gaap:CommonStockMember2021-01-012021-12-310001627014us-gaap:CommonStockMember2020-01-012020-12-310001627014us-gaap:TreasuryStockMember2022-12-310001627014us-gaap:CommonStockMember2022-12-310001627014us-gaap:TreasuryStockMember2021-12-310001627014us-gaap:CommonStockMember2021-12-310001627014srt:CumulativeEffectPeriodOfAdoptionAdjustedBalanceMemberus-gaap:TreasuryStockMember2020-12-310001627014srt:CumulativeEffectPeriodOfAdoptionAdjustedBalanceMemberus-gaap:CommonStockMember2020-12-310001627014us-gaap:TreasuryStockMember2020-12-310001627014us-gaap:CommonStockMember2020-12-310001627014us-gaap:TreasuryStockMember2019-12-310001627014us-gaap:CommonStockMember2019-12-310001627014us-gaap:TreasuryStockMember2022-01-012022-12-310001627014us-gaap:TreasuryStockMember2021-01-012021-12-310001627014us-gaap:RestrictedStockMember2022-12-310001627014us-gaap:RestrictedStockMember2021-12-310001627014bki:ProfitInterestsUnitsMember2021-12-310001627014us-gaap:RestrictedStockMember2020-12-310001627014bki:ProfitInterestsUnitsMember2020-12-310001627014us-gaap:RestrictedStockMember2019-12-310001627014us-gaap:RestrictedStockMemberus-gaap:ShareBasedCompensationAwardTrancheOneMember2020-05-062020-05-060001627014srt:MinimumMemberus-gaap:RestrictedStockMemberbki:VariousGrantsMemberus-gaap:ShareBasedCompensationAwardTrancheTwoMember2020-01-012020-12-310001627014srt:MaximumMemberus-gaap:RestrictedStockMemberbki:VariousGrantsMemberus-gaap:ShareBasedCompensationAwardTrancheTwoMember2020-01-012020-12-310001627014us-gaap:RestrictedStockMemberbki:VariousGrantsMemberus-gaap:ShareBasedCompensationAwardTrancheOneMember2022-03-102022-03-100001627014us-gaap:RestrictedStockMemberus-gaap:ShareBasedCompensationAwardTrancheTwoMember2022-01-012022-12-310001627014us-gaap:RestrictedStockMemberus-gaap:ShareBasedCompensationAwardTrancheTwoMember2021-01-012021-12-310001627014us-gaap:RestrictedStockMemberbki:VariousGrantsMemberus-gaap:ShareBasedCompensationAwardTrancheTwoMember2020-01-012020-12-310001627014us-gaap:RestrictedStockMember2022-01-012022-12-310001627014us-gaap:RestrictedStockMember2021-01-012021-12-310001627014us-gaap:RestrictedStockMember2020-01-012020-12-310001627014bki:ProfitInterestsUnitsMemberus-gaap:ShareBasedCompensationAwardTrancheThreeMember2020-11-242020-11-240001627014us-gaap:RestrictedStockMemberus-gaap:ShareBasedCompensationAwardTrancheOneMember2022-03-102022-03-100001627014srt:MinimumMemberus-gaap:RestrictedStockMemberbki:VariousGrantsMemberus-gaap:ShareBasedCompensationAwardTrancheTwoMember2022-01-012022-12-310001627014srt:MaximumMemberus-gaap:RestrictedStockMemberbki:VariousGrantsMemberus-gaap:ShareBasedCompensationAwardTrancheTwoMember2022-01-012022-12-310001627014us-gaap:RestrictedStockMemberus-gaap:ShareBasedCompensationAwardTrancheOneMember2021-03-102021-03-100001627014srt:MinimumMemberus-gaap:RestrictedStockMemberbki:VariousGrantsMemberus-gaap:ShareBasedCompensationAwardTrancheTwoMember2021-01-012021-12-310001627014srt:MaximumMemberus-gaap:RestrictedStockMemberbki:VariousGrantsMemberus-gaap:ShareBasedCompensationAwardTrancheTwoMember2021-01-012021-12-310001627014us-gaap:RestrictedStockMemberbki:VariousGrantsMemberus-gaap:ShareBasedCompensationAwardTrancheOneMember2020-05-062020-05-060001627014us-gaap:RestrictedStockMemberus-gaap:ShareBasedCompensationAwardTrancheOneMember2020-02-182020-02-180001627014srt:MinimumMemberbki:VariousGrantsMemberus-gaap:ShareBasedCompensationAwardTrancheTwoMember2020-01-012020-12-310001627014srt:MaximumMemberbki:VariousGrantsMemberus-gaap:ShareBasedCompensationAwardTrancheTwoMember2020-01-012020-12-3100016270142027-01-012022-12-3100016270142025-01-012022-12-3100016270142023-01-012022-12-310001627014us-gaap:OperatingSegmentsMemberbki:SoftwareAndHostingSolutionsMemberbki:SoftwareSolutionsMember2022-01-012022-12-310001627014us-gaap:OperatingSegmentsMemberbki:SoftwareAndHostingSolutionsMemberbki:DataAndAnalyticsSegmentMember2022-01-012022-12-310001627014us-gaap:OperatingSegmentsMemberbki:ProfessionalServicesMemberbki:SoftwareSolutionsMember2022-01-012022-12-310001627014us-gaap:OperatingSegmentsMemberbki:ProfessionalServicesMemberbki:DataAndAnalyticsSegmentMember2022-01-012022-12-310001627014us-gaap:OperatingSegmentsMemberbki:OtherServicesMemberbki:SoftwareSolutionsMember2022-01-012022-12-310001627014us-gaap:OperatingSegmentsMemberbki:OtherServicesMemberbki:DataAndAnalyticsSegmentMember2022-01-012022-12-310001627014us-gaap:OperatingSegmentsMemberbki:DataSolutionsMemberbki:SoftwareSolutionsMember2022-01-012022-12-310001627014us-gaap:OperatingSegmentsMemberbki:DataSolutionsMemberbki:DataAndAnalyticsSegmentMember2022-01-012022-12-310001627014srt:ReportableLegalEntitiesMemberbki:SoftwareAndHostingSolutionsMemberbki:ServicingSoftwareMember2022-01-012022-12-310001627014srt:ReportableLegalEntitiesMemberbki:SoftwareAndHostingSolutionsMemberbki:OriginationSoftwareMember2022-01-012022-12-310001627014srt:ReportableLegalEntitiesMemberbki:ProfessionalServicesMemberbki:ServicingSoftwareMember2022-01-012022-12-310001627014srt:ReportableLegalEntitiesMemberbki:ProfessionalServicesMemberbki:OriginationSoftwareMember2022-01-012022-12-310001627014srt:ReportableLegalEntitiesMemberbki:OtherServicesMemberbki:ServicingSoftwareMember2022-01-012022-12-310001627014srt:ReportableLegalEntitiesMemberbki:OtherServicesMemberbki:OriginationSoftwareMember2022-01-012022-12-310001627014srt:ReportableLegalEntitiesMemberbki:DataSolutionsMemberbki:OriginationSoftwareMember2022-01-012022-12-310001627014srt:ReportableLegalEntitiesMemberbki:ServicingSoftwareMember2022-01-012022-12-310001627014srt:ReportableLegalEntitiesMemberbki:OriginationSoftwareMember2022-01-012022-12-310001627014bki:TerminationFeesMember2022-01-012022-12-310001627014bki:SoftwareAndHostingSolutionsMember2022-01-012022-12-310001627014bki:ProfessionalServicesMember2022-01-012022-12-310001627014bki:OtherServicesMember2022-01-012022-12-310001627014bki:DataSolutionsMember2022-01-012022-12-310001627014us-gaap:OperatingSegmentsMemberbki:SoftwareAndHostingSolutionsMemberbki:SoftwareSolutionsMember2021-01-012021-12-310001627014us-gaap:OperatingSegmentsMemberbki:SoftwareAndHostingSolutionsMemberbki:DataAndAnalyticsSegmentMember2021-01-012021-12-310001627014us-gaap:OperatingSegmentsMemberbki:ProfessionalServicesMemberbki:SoftwareSolutionsMember2021-01-012021-12-310001627014us-gaap:OperatingSegmentsMemberbki:ProfessionalServicesMemberbki:DataAndAnalyticsSegmentMember2021-01-012021-12-310001627014us-gaap:OperatingSegmentsMemberbki:OtherServicesMemberbki:SoftwareSolutionsMember2021-01-012021-12-310001627014us-gaap:OperatingSegmentsMemberbki:OtherServicesMemberbki:DataAndAnalyticsSegmentMember2021-01-012021-12-310001627014us-gaap:OperatingSegmentsMemberbki:DataSolutionsMemberbki:SoftwareSolutionsMember2021-01-012021-12-310001627014us-gaap:OperatingSegmentsMemberbki:DataSolutionsMemberbki:DataAndAnalyticsSegmentMember2021-01-012021-12-310001627014srt:ReportableLegalEntitiesMemberbki:SoftwareAndHostingSolutionsMemberbki:ServicingSoftwareMember2021-01-012021-12-310001627014srt:ReportableLegalEntitiesMemberbki:SoftwareAndHostingSolutionsMemberbki:OriginationSoftwareMember2021-01-012021-12-310001627014srt:ReportableLegalEntitiesMemberbki:ProfessionalServicesMemberbki:ServicingSoftwareMember2021-01-012021-12-310001627014srt:ReportableLegalEntitiesMemberbki:ProfessionalServicesMemberbki:OriginationSoftwareMember2021-01-012021-12-310001627014srt:ReportableLegalEntitiesMemberbki:OtherServicesMemberbki:OriginationSoftwareMember2021-01-012021-12-310001627014srt:ReportableLegalEntitiesMemberbki:DataSolutionsMemberbki:OriginationSoftwareMember2021-01-012021-12-310001627014srt:ReportableLegalEntitiesMemberbki:ServicingSoftwareMember2021-01-012021-12-310001627014srt:ReportableLegalEntitiesMemberbki:OriginationSoftwareMember2021-01-012021-12-310001627014bki:SoftwareAndHostingSolutionsMember2021-01-012021-12-310001627014bki:ProfessionalServicesMember2021-01-012021-12-310001627014bki:OtherServicesMember2021-01-012021-12-310001627014bki:DataSolutionsMember2021-01-012021-12-310001627014us-gaap:OperatingSegmentsMemberbki:SoftwareAndHostingSolutionsMemberbki:SoftwareSolutionsMember2020-01-012020-12-310001627014us-gaap:OperatingSegmentsMemberbki:SoftwareAndHostingSolutionsMemberbki:DataAndAnalyticsSegmentMember2020-01-012020-12-310001627014us-gaap:OperatingSegmentsMemberbki:ProfessionalServicesMemberbki:SoftwareSolutionsMember2020-01-012020-12-310001627014us-gaap:OperatingSegmentsMemberbki:ProfessionalServicesMemberbki:DataAndAnalyticsSegmentMember2020-01-012020-12-310001627014us-gaap:OperatingSegmentsMemberbki:OtherServicesMemberbki:SoftwareSolutionsMember2020-01-012020-12-310001627014us-gaap:OperatingSegmentsMemberbki:OtherServicesMemberbki:DataAndAnalyticsSegmentMember2020-01-012020-12-310001627014us-gaap:OperatingSegmentsMemberbki:DataSolutionsMemberbki:SoftwareSolutionsMember2020-01-012020-12-310001627014us-gaap:OperatingSegmentsMemberbki:DataSolutionsMemberbki:DataAndAnalyticsSegmentMember2020-01-012020-12-310001627014srt:ReportableLegalEntitiesMemberbki:SoftwareAndHostingSolutionsMemberbki:ServicingSoftwareMember2020-01-012020-12-310001627014srt:ReportableLegalEntitiesMemberbki:SoftwareAndHostingSolutionsMemberbki:OriginationSoftwareMember2020-01-012020-12-310001627014srt:ReportableLegalEntitiesMemberbki:ProfessionalServicesMemberbki:ServicingSoftwareMember2020-01-012020-12-310001627014srt:ReportableLegalEntitiesMemberbki:ProfessionalServicesMemberbki:OriginationSoftwareMember2020-01-012020-12-310001627014srt:ReportableLegalEntitiesMemberbki:OtherServicesMemberbki:OriginationSoftwareMember2020-01-012020-12-310001627014srt:ReportableLegalEntitiesMemberbki:DataSolutionsMemberbki:OriginationSoftwareMember2020-01-012020-12-310001627014us-gaap:CorporateNonSegmentMemberbki:ProfessionalServicesMember2020-01-012020-12-310001627014srt:ReportableLegalEntitiesMemberbki:ServicingSoftwareMember2020-01-012020-12-310001627014srt:ReportableLegalEntitiesMemberbki:OriginationSoftwareMember2020-01-012020-12-310001627014bki:SoftwareAndHostingSolutionsMember2020-01-012020-12-310001627014bki:ProfessionalServicesMember2020-01-012020-12-310001627014bki:OtherServicesMember2020-01-012020-12-310001627014bki:DataSolutionsMember2020-01-012020-12-310001627014srt:CumulativeEffectPeriodOfAdoptionAdjustmentMemberus-gaap:AccountingStandardsUpdate201613Member2019-12-310001627014bki:ProductsAndDataMemberbki:DunAndBradstreetHoldingsIncMember2021-06-012021-06-300001627014bki:AccessToCertainDataAssetsMemberbki:DunAndBradstreetHoldingsIncMember2021-06-012021-06-300001627014srt:MinimumMemberus-gaap:SubsequentEventMember2023-01-012023-01-310001627014srt:MaximumMemberus-gaap:SubsequentEventMember2023-01-012023-01-310001627014srt:MinimumMemberus-gaap:SoftwareDevelopmentMember2022-01-012022-12-310001627014srt:MinimumMemberbki:PurchasedSoftwareMember2022-01-012022-12-310001627014srt:MinimumMemberbki:FurnitureFixturesandEquipmentMember2022-01-012022-12-310001627014srt:MaximumMemberus-gaap:SoftwareDevelopmentMember2022-01-012022-12-310001627014srt:MaximumMemberbki:PurchasedSoftwareMember2022-01-012022-12-310001627014srt:MaximumMemberbki:FurnitureFixturesandEquipmentMember2022-01-012022-12-310001627014us-gaap:BuildingMember2022-01-012022-12-310001627014us-gaap:LeaseholdImprovementsMember2022-12-310001627014us-gaap:LandMember2022-12-310001627014us-gaap:ComputerEquipmentMember2022-12-310001627014us-gaap:BuildingMember2022-12-310001627014bki:FurnitureFixturesandEquipmentMember2022-12-310001627014us-gaap:LeaseholdImprovementsMember2021-12-310001627014us-gaap:LandMember2021-12-310001627014us-gaap:ComputerEquipmentMember2021-12-310001627014us-gaap:BuildingMember2021-12-310001627014bki:FurnitureFixturesandEquipmentMember2021-12-310001627014bki:DunAndBradstreetHoldingsIncMember2020-01-012020-12-310001627014bki:OptimalBlueHoldcoLLCMemberbki:CannaeHoldingsLLCMember2020-07-262020-07-260001627014bki:OptimalBlueHoldcoLLCMember2020-09-152020-09-150001627014us-gaap:InterestRateSwapMemberus-gaap:AccumulatedGainLossNetCashFlowHedgeParentMember2022-01-012022-12-310001627014us-gaap:InterestRateSwapMemberus-gaap:AccumulatedGainLossNetCashFlowHedgeParentMember2021-01-012021-12-310001627014us-gaap:InterestRateSwapMemberus-gaap:AccumulatedGainLossNetCashFlowHedgeParentMember2020-01-012020-12-310001627014bki:DunAndBradstreetHoldingsIncMember2022-01-012022-12-310001627014bki:DunAndBradstreetHoldingsIncMember2021-01-012021-12-310001627014bki:OptimalBlueHoldcoLLCMember2021-12-310001627014bki:OptimalBlueHoldcoLLCMemberbki:CannaeHoldingsLLCAndThomasHLeePartnersLPMember2022-12-310001627014bki:OptimalBlueHoldcoLLCMember2022-12-310001627014bki:OptimalBlueHoldcoLLCMemberbki:CannaeHoldingsLLCMember2020-07-260001627014srt:MinimumMemberbki:AmendedAndRestatedCreditAgreementMemberbki:TermLoanAndRevolvingCreditFacilityMember2022-01-012022-12-310001627014srt:MaximumMemberbki:AmendedAndRestatedCreditAgreementMemberbki:TermLoanAndRevolvingCreditFacilityMember2022-01-012022-12-310001627014bki:AmendedAndRestatedCreditAgreementMemberbki:TermLoanAndRevolvingCreditFacilityMember2022-01-012022-12-310001627014us-gaap:RevolvingCreditFacilityMember2022-12-310001627014us-gaap:RevolvingCreditFacilityMemberbki:AmendedAndRestatedCreditAgreementMember2021-03-100001627014bki:TermLoanAMemberbki:AmendedAndRestatedCreditAgreementMember2021-03-100001627014bki:CreditFacility2018Memberus-gaap:LineOfCreditMember2021-03-100001627014bki:CreditFacility2018Memberbki:TermLoanAMember2021-03-100001627014bki:DBInvestmentMember2022-12-3100016270142022-01-012022-03-310001627014us-gaap:VariableInterestEntityNotPrimaryBeneficiaryMember2022-01-012022-12-310001627014us-gaap:VariableInterestEntityNotPrimaryBeneficiaryMember2021-01-012021-12-310001627014us-gaap:VariableInterestEntityNotPrimaryBeneficiaryMember2020-01-012020-12-310001627014us-gaap:DisposalGroupHeldforsaleNotDiscontinuedOperationsMemberbki:TitlePointLineOfBusinessMember2022-01-012022-12-310001627014us-gaap:OperatingSegmentsMemberbki:TopOfMindMemberbki:TechnologySegmentMember2022-01-012022-12-310001627014us-gaap:OperatingSegmentsMemberbki:TitlePointLineOfBusinessMemberbki:DataAndAnalyticsSegmentMember2022-01-012022-12-310001627014bki:TopOfMindMember2022-01-012022-12-310001627014bki:TitlePointLineOfBusinessMember2022-01-012022-12-310001627014us-gaap:OperatingSegmentsMemberbki:OptimalBlueHoldcoLLCMemberbki:TechnologySegmentMember2021-01-012021-12-310001627014us-gaap:OperatingSegmentsMemberbki:A2021AcquisitionMemberbki:TechnologySegmentMember2021-01-012021-12-310001627014us-gaap:OperatingSegmentsMemberbki:A2021AcquisitionMemberbki:DataAndAnalyticsSegmentMember2021-01-012021-12-310001627014bki:A2021AcquisitionMember2021-01-012021-12-310001627014us-gaap:OperatingSegmentsMemberbki:TechnologySegmentMember2022-12-310001627014us-gaap:OperatingSegmentsMemberbki:DataAndAnalyticsSegmentMember2022-12-310001627014us-gaap:OperatingSegmentsMemberbki:TechnologySegmentMember2021-12-310001627014us-gaap:OperatingSegmentsMemberbki:DataAndAnalyticsSegmentMember2021-12-310001627014us-gaap:OperatingSegmentsMemberbki:TechnologySegmentMember2020-12-310001627014us-gaap:OperatingSegmentsMemberbki:DataAndAnalyticsSegmentMember2020-12-310001627014srt:MaximumMemberus-gaap:CustomerRelationshipsMember2022-01-012022-12-310001627014bki:TotalOtherIntangibleAssetsMember2022-12-310001627014bki:SoftwareDevelopmentSoftwareAndSoftwareDevelopmentCostsMember2022-12-310001627014us-gaap:SoftwareAndSoftwareDevelopmentCostsMember2020-01-012020-12-310001627014us-gaap:OtherIntangibleAssetsMember2022-12-310001627014us-gaap:CustomerRelationshipsMember2022-12-310001627014us-gaap:OtherIntangibleAssetsMember2021-12-310001627014us-gaap:CustomerRelationshipsMember2021-12-310001627014us-gaap:FairValueInputsLevel3Member2022-01-012022-12-310001627014bki:OptimalBlueHoldcoLLCMember2022-02-140001627014bki:DBInvestmentMemberbki:BisnodeBusinessInformationGroupABMember2021-01-080001627014srt:MaximumMemberbki:DBInvestmentMember2020-07-060001627014bki:DBInvestmentMember2020-07-060001627014bki:ProfitInterestsUnitsMember2022-12-310001627014bki:DBInvestmentMember2022-01-012022-12-310001627014us-gaap:DisposalGroupHeldforsaleNotDiscontinuedOperationsMemberbki:TitlePointLineOfBusinessMember2022-11-180001627014us-gaap:FairValueInputsLevel2Member2021-12-310001627014us-gaap:InterestRateSwapMember2022-01-012022-12-310001627014us-gaap:InterestRateSwapMember2021-01-012021-12-310001627014us-gaap:InterestRateSwapMember2019-01-310001627014us-gaap:InterestRateSwapMember2018-04-300001627014us-gaap:OtherNoncurrentLiabilitiesMemberus-gaap:InterestRateSwapMemberus-gaap:DesignatedAsHedgingInstrumentMember2021-12-310001627014us-gaap:OtherCurrentLiabilitiesMemberus-gaap:InterestRateSwapMemberus-gaap:DesignatedAsHedgingInstrumentMember2021-12-310001627014us-gaap:InterestRateSwapMemberus-gaap:LondonInterbankOfferedRateLIBORMember2022-12-310001627014us-gaap:OtherCurrentAssetsMemberus-gaap:InterestRateSwapMemberus-gaap:DesignatedAsHedgingInstrumentMember2022-12-310001627014us-gaap:FairValueInputsLevel2Member2022-12-310001627014us-gaap:OtherCurrentAssetsMemberus-gaap:InterestRateSwapMemberus-gaap:DesignatedAsHedgingInstrumentMember2021-12-310001627014us-gaap:PropertyPlantAndEquipmentMember2022-01-012022-12-310001627014us-gaap:OtherIntangibleAssetsMember2022-01-012022-12-310001627014us-gaap:ComputerSoftwareIntangibleAssetMember2022-01-012022-12-310001627014us-gaap:PropertyPlantAndEquipmentMember2021-01-012021-12-310001627014us-gaap:OtherIntangibleAssetsMember2021-01-012021-12-310001627014us-gaap:ComputerSoftwareIntangibleAssetMember2021-01-012021-12-310001627014us-gaap:PropertyPlantAndEquipmentMember2020-01-012020-12-310001627014us-gaap:OtherIntangibleAssetsMember2020-01-012020-12-310001627014us-gaap:ComputerSoftwareIntangibleAssetMember2020-01-012020-12-310001627014bki:RedemptionUsingProceedsOfCertainEquityOfferingsBeforeSeptember12023Memberus-gaap:SeniorNotesMember2020-08-262020-08-260001627014us-gaap:SeniorNotesMember2020-08-260001627014us-gaap:RevolvingCreditFacilityMemberus-gaap:LineOfCreditMember2022-12-310001627014bki:TermLoanAMemberus-gaap:MediumTermNotesMember2022-12-310001627014us-gaap:SeniorNotesMember2022-12-310001627014bki:OtherDebtMember2022-12-310001627014us-gaap:RevolvingCreditFacilityMemberus-gaap:LineOfCreditMember2021-12-310001627014bki:TermLoanAMemberus-gaap:MediumTermNotesMember2021-12-310001627014us-gaap:SeniorNotesMember2021-12-310001627014bki:OtherDebtMember2021-12-310001627014srt:MinimumMemberbki:AmendedAndRestatedCreditAgreementMemberbki:TermLoanAndRevolvingCreditFacilityMemberus-gaap:EurodollarMember2022-01-012022-12-310001627014srt:MinimumMemberbki:AmendedAndRestatedCreditAgreementMemberbki:TermLoanAndRevolvingCreditFacilityMemberus-gaap:BaseRateMember2022-01-012022-12-310001627014srt:MaximumMemberbki:AmendedAndRestatedCreditAgreementMemberbki:TermLoanAndRevolvingCreditFacilityMemberus-gaap:EurodollarMember2022-01-012022-12-310001627014srt:MaximumMemberbki:AmendedAndRestatedCreditAgreementMemberbki:TermLoanAndRevolvingCreditFacilityMemberus-gaap:BaseRateMember2022-01-012022-12-310001627014bki:AmendedAndRestatedCreditAgreementMemberbki:TermLoanAndRevolvingCreditFacilityMemberus-gaap:EurodollarMember2022-01-012022-12-310001627014bki:TheOmnibusPlanMember2022-12-310001627014us-gaap:FairValueInputsLevel1Member2022-12-310001627014us-gaap:FairValueInputsLevel1Member2021-12-310001627014us-gaap:SoftwareDevelopmentMember2022-12-310001627014us-gaap:SoftwareAndSoftwareDevelopmentCostsMember2022-12-310001627014us-gaap:SoftwareDevelopmentMember2021-12-310001627014us-gaap:SoftwareAndSoftwareDevelopmentCostsMember2021-12-310001627014bki:AcquisitionsMemberus-gaap:CustomerRelationshipsMember2021-12-310001627014bki:OptimalBlueHoldcoLLCMember2020-09-162020-12-310001627014us-gaap:FairValueInputsLevel3Member2022-12-310001627014us-gaap:FairValueInputsLevel3Member2021-12-310001627014bki:OptimalBlueHoldcoLLCMemberus-gaap:FairValueInputsLevel3Member2022-01-012022-12-310001627014bki:CompassAnalyticsMemberus-gaap:FairValueInputsLevel3Member2022-01-012022-12-310001627014bki:IntercontinentalExchangeIncMemberbki:BlackKnightIncMember2022-05-042022-05-040001627014bki:AcquisitionsMember2021-01-012021-12-310001627014bki:TrasimeneCapitalManagementLLCMember2021-01-012021-12-310001627014bki:TrasimeneCapitalManagementLLCMember2020-01-012020-12-310001627014bki:OptimalBlueHoldcoLLCMember2020-01-012020-12-310001627014bki:OptimalBlueHoldcoLLCMember2022-01-012022-12-310001627014bki:OptimalBlueHoldcoLLCMember2022-02-150001627014bki:TopOfMindMember2021-07-070001627014bki:EmbsIncMember2021-05-170001627014us-gaap:VariableInterestEntityNotPrimaryBeneficiaryMember2022-12-310001627014us-gaap:VariableInterestEntityNotPrimaryBeneficiaryMember2021-12-310001627014srt:CumulativeEffectPeriodOfAdoptionAdjustmentMember2019-12-3100016270142019-12-310001627014us-gaap:EmployeeStockMember2022-01-012022-12-310001627014bki:ProfitInterestsUnitsMember2022-01-012022-12-310001627014us-gaap:EmployeeStockMember2021-01-012021-12-310001627014bki:ProfitInterestsUnitsMember2021-01-012021-12-310001627014us-gaap:EmployeeStockMember2020-01-012020-12-310001627014bki:ProfitInterestsUnitsMember2020-01-012020-12-310001627014us-gaap:TreasuryStockMember2020-01-012020-12-310001627014bki:DunAndBradstreetHoldingsIncMember2022-12-310001627014bki:DunAndBradstreetHoldingsIncMember2021-12-310001627014us-gaap:UnbilledRevenuesMember2022-12-310001627014us-gaap:BilledRevenuesMember2022-12-310001627014us-gaap:UnbilledRevenuesMember2021-12-310001627014us-gaap:BilledRevenuesMember2021-12-3100016270142022-06-3000016270142023-02-240001627014us-gaap:RestrictedStockMember2020-05-062020-05-060001627014us-gaap:RestrictedStockMember2020-02-182020-02-180001627014bki:ProfitInterestsUnitsMember2020-11-242020-11-240001627014us-gaap:RestrictedStockMember2021-03-102021-03-100001627014bki:DunAndBradstreetHoldingsIncMember2021-06-012021-06-3000016270142021-06-3000016270142020-12-3100016270142020-06-190001627014us-gaap:AccumulatedOtherComprehensiveIncomeMember2022-01-012022-12-310001627014us-gaap:AccumulatedOtherComprehensiveIncomeMember2021-01-012021-12-310001627014us-gaap:AccumulatedOtherComprehensiveIncomeMember2020-01-012020-12-310001627014bki:OptimalBlueHoldcoLLCMembersrt:SubsidiariesMember2020-09-150001627014bki:OptimalBlueHoldcoLLCMember2022-02-152022-02-150001627014bki:DBInvestmentMember2022-02-152022-02-150001627014bki:DBInvestmentMember2022-12-310001627014bki:DBInvestmentMember2022-02-152022-02-150001627014bki:DBInvestmentMemberus-gaap:SubsequentEventMember2023-02-092023-02-090001627014bki:BlackKnightESPPPlanMember2020-01-012020-01-010001627014srt:MinimumMemberbki:BlackKnightESPPPlanMember2019-12-050001627014srt:MaximumMemberbki:BlackKnightESPPPlanMember2019-12-050001627014us-gaap:OperatingSegmentsMemberbki:SoftwareSolutionsMember2020-01-012020-12-310001627014us-gaap:OperatingSegmentsMemberbki:DataAndAnalyticsSegmentMember2020-01-012020-12-310001627014us-gaap:DisposalGroupHeldforsaleNotDiscontinuedOperationsMember2022-12-310001627014us-gaap:InterestRateSwapMemberus-gaap:LondonInterbankOfferedRateLIBORMember2019-01-310001627014us-gaap:InterestRateSwapMemberus-gaap:LondonInterbankOfferedRateLIBORMember2018-04-300001627014us-gaap:InterestRateSwapMember2017-09-290001627014us-gaap:InterestRateSwapMemberus-gaap:LondonInterbankOfferedRateLIBORMember2017-03-310001627014srt:MinimumMember2022-01-012022-12-310001627014srt:MaximumMember2022-01-012022-12-310001627014bki:RedemptionIncludingMakeWholePaymentBeforeSeptember12023Memberus-gaap:SeniorNotesMember2020-08-262020-08-260001627014bki:TermLoanAMemberus-gaap:DebtInstrumentRedemptionPeriodTwoMemberus-gaap:MediumTermNotesMember2022-01-012022-12-310001627014bki:TermLoanAMemberus-gaap:DebtInstrumentRedemptionPeriodOneMemberus-gaap:MediumTermNotesMember2022-01-012022-12-310001627014bki:AcquisitionsMember2021-12-310001627014bki:OptimalBlueHoldcoLLCMember2021-01-012021-12-310001627014us-gaap:OperatingSegmentsMemberbki:SoftwareSolutionsMember2022-01-012022-12-310001627014us-gaap:OperatingSegmentsMemberbki:DataAndAnalyticsSegmentMember2022-01-012022-12-310001627014us-gaap:CorporateNonSegmentMember2022-01-012022-12-310001627014us-gaap:OperatingSegmentsMemberbki:SoftwareSolutionsMember2021-01-012021-12-310001627014us-gaap:OperatingSegmentsMemberbki:DataAndAnalyticsSegmentMember2021-01-012021-12-310001627014us-gaap:CorporateNonSegmentMember2021-01-012021-12-310001627014us-gaap:CorporateNonSegmentMember2020-01-012020-12-310001627014bki:IntercontinentalExchangeIncMemberbki:BlackKnightIncMember2022-05-040001627014us-gaap:RetainedEarningsMember2022-01-012022-12-310001627014us-gaap:RetainedEarningsMember2021-01-012021-12-310001627014us-gaap:RetainedEarningsMember2020-01-012020-12-310001627014us-gaap:NoncontrollingInterestMember2022-01-012022-12-310001627014us-gaap:AdditionalPaidInCapitalMember2022-01-012022-12-310001627014us-gaap:NoncontrollingInterestMember2021-01-012021-12-310001627014us-gaap:AdditionalPaidInCapitalMember2021-01-012021-12-310001627014us-gaap:NoncontrollingInterestMember2020-01-012020-12-310001627014us-gaap:AdditionalPaidInCapitalMember2020-01-012020-12-3100016270142022-12-3100016270142021-12-3100016270142022-01-012022-12-3100016270142021-01-012021-12-3100016270142020-01-012020-12-31iso4217:USDiso4217:USDxbrli:sharesxbrli:purexbrli:sharesbki:periodbki:segment

UNITED STATES SECURITIES AND EXCHANGE COMMISSION

Washington, D.C. 20549

Form 10-K

(Mark One)

ANNUAL REPORT PURSUANT TO SECTION 13 OR 15(d) OF THE SECURITIES EXCHANGE ACT OF 1934

For the Fiscal Year Ended December 31, 2022

or

TRANSITION REPORT PURSUANT TO SECTION 13 OR 15(d) OF THE SECURITIES EXCHANGE ACT OF 1934

Commission File No. 001-37394

Black Knight, Inc.

(Exact name of registrant as specified in its charter)

Delaware


81-5265638

(State or other jurisdiction of incorporation or organization)

(I.R.S. Employer Identification Number)

601 Riverside Avenue, Jacksonville, Florida

32204

(Address of principal executive offices)

(Zip Code)

(904) 854-5100

(Registrant’s telephone number, including area code)

Securities registered pursuant to Section 12(b) of the Act:

Title of each class

Trading Symbol

Name of each exchange on which registered

Common Stock, $0.0001 par value

BKI

New York Stock Exchange

Securities registered pursuant to Section 12(g) of the Act: None

Indicate by check mark if the registrant is a well-known seasoned issuer, as defined in Rule 405 of the Securities Act. Yes      No 

Indicate by check mark if the registrant is not required to file reports pursuant to Section 13 or Section 15(d) of the Act. Yes      No 

Indicate by check mark whether the registrant (1) has filed all reports required to be filed by Section 13 or 15(d) of the Securities Exchange Act of 1934 during the preceding 12 months (or for such shorter period that the registrant was required to file such reports), and (2) has been subject to such filing requirements for the past 90 days. Yes      No 

Indicate by check mark whether the registrant has submitted electronically every Interactive Data File required to be submitted pursuant to Rule 405 of Regulation S-T (§ 232.405 of this chapter) during the preceding 12 months (or for such shorter period that the registrant was required to submit such files). Yes     No 

Indicate by check mark whether the registrant is a large accelerated filer, an accelerated filer, a non-accelerated filer, a smaller reporting company, or an emerging growth company. See the definitions of "large accelerated filer," "accelerated filer," "smaller reporting company," and "emerging growth company" in Rule 12b-2 of the Exchange Act.

Large accelerated filer

Accelerated filer

Non-accelerated filer

Smaller reporting company

Emerging growth company

If an emerging growth company, indicate by check mark if the registrant has elected not to use the extended transition period for complying with any new or revised financial accounting standards provided pursuant to Section 13(a) of the Exchange Act.

Indicate by check mark whether the registrant has filed a report on and attestation to its management’s assessment of the effectiveness of its internal control over financial reporting under Section 404(b) of the Sarbanes-Oxley Act (15 U.S.C. 7262(b)) by the registered public accounting firm that prepared or issued its audit report.

If securities are registered pursuant to Section 12(b) of the Act, indicate by check mark whether the financial statements of the registrant included in the filing reflect the correction of an error to previously issued financial statements.

Indicate by check mark whether any of those error corrections are restatements that required a recovery analysis of incentive-based compensation received by any of the registrant’s executive officers during the relevant recovery period pursuant to §240.10D-1(b).

Indicate by check mark whether the registrant is a shell company (as defined in Rule 12b-2 of the Exchange Act). Yes      No 

The aggregate market value of the shares of Black Knight, Inc. common stock held by non-affiliates of the registrant as of June 30, 2022 was $9,847,744,920 based on the closing price of $65.39 as reported by the New York Stock Exchange.

As of February 24, 2023, there were 155,923,950 shares of Black Knight, Inc. common stock outstanding.

The information in Part III hereof is incorporated by reference to certain information from the registrant’s definitive proxy statement for the 2022 annual meeting of shareholders. The registrant intends to file the proxy statement within 120 days after the close of the fiscal year that is the subject of this Report.

Table of Contents

BLACK KNIGHT, INC.

FORM 10-K

TABLE OF CONTENTS

Page
Number

PART I

Item 1.

Business

3

Item 1A.

Risk Factors

15

Item 1B.

Unresolved Staff Comments

34

Item 2.

Properties

34

Item 3.

Legal Proceedings

34

Item 4.

Mine Safety Disclosures

34

PART II

Item 5.

Market for Registrant’s Common Equity, Related Shareholder Matters and Issuer Purchases of Equity Securities

35

Item 6.

[Reserved]

36

Item 7.

Management’s Discussion and Analysis of Financial Condition and Results of Operations

36

Item 7A.

Quantitative and Qualitative Disclosure About Market Risk

49

Item 8.

Financial Statements and Supplementary Data

51

Item 9.

Changes in and Disagreements with Accountants on Accounting and Financial Disclosure

96

Item 9A.

Controls and Procedures

96

Item 9B.

Other Information

97

Item 9C.

Disclosures Regarding Foreign Jurisdictions that Prevent Inspections

97

PART III

Item 10.

Directors, Executive Officers and Corporate Governance of the Registrant

97

Item 11.

Executive Compensation

97

Item 12.

Security Ownership of Certain Beneficial Owners and Management and Related Shareholder Matters

97

Item 13.

Certain Relationships, Related Transactions and Director Independence

97

Item 14.

Principal Accountant Fees and Services

97

PART IV

Item 15.

Exhibits and Financial Statement Schedules

98

Item 16.

Form 10-K Summary

102

i

Table of Contents

Statement Regarding Forward-Looking Information

The statements contained in this Annual Report on Form 10-K or in our other documents or in oral presentations or other statements made by our management that are not purely historical are forward-looking statements within the meaning of Section 27A of the Securities Act of 1933, as amended, and Section 21E of the Securities Exchange Act of 1934, as amended (the "Exchange Act"), including statements regarding our expectations, hopes, intentions or strategies regarding the future. These statements relate to, among other things, future financial and operating results of Black Knight. In many cases, you can identify forward-looking statements by terminology such as "may," "will," "should," "expect," "plan," "anticipate," "believe," "estimate," "predict," "could," "potential" or "continue," or the negative of these terms and other comparable terminology. Actual results could differ materially from those anticipated in these statements as a result of a number of factors, including, but not limited to the following:

the occurrence of any event, change, or other circumstances that could give rise to a right in favor of Intercontinental Exchange, Inc. (“ICE”) or us to terminate the definitive merger agreement governing the terms and conditions of the proposed acquisition by ICE of Black Knight (the “ICE Transaction”);
the possibility that the proposed ICE Transaction does not close when expected or at all because required regulatory or other approvals and other conditions to closing are not received or satisfied on a timely basis or at all (and the risk that such approvals may result in the imposition of conditions that could adversely affect ICE or us or the expected benefits of the proposed ICE Transaction);
business uncertainties and contractual restrictions while the ICE Transaction is pending, which could adversely affect our business and operations;
the diversion of management’s attention and time from ongoing business operations and opportunities on merger-related matters;
the outcome of any legal proceedings that may be instituted against us or ICE;
changes to our relationships with our top clients, whom we rely on for a significant portion of our revenues and profit;
limitation of our growth due to the time and expense associated with switching from competitors’ software and services;
our ability to meet our contractual commitments and to offer high-quality technical support services;
our ability to comply with or changes in laws, rules and regulations that affect our and our clients’ businesses;
consolidation in our end client market;
efforts by the government to address the mortgage market and economic environment;
our clients’ relationships with government-sponsored enterprises;
our ability to adapt our solutions to technological changes or evolving industry standards or to achieve our growth strategies;
our ability to compete effectively;
increase in the availability of free or relatively inexpensive information;
our ability to protect our proprietary software and information rights;
infringement on the proprietary rights of others by our applications or services;
our dependence on our ability to access data from external sources;
our international operations and third-party service providers;
system failures or service interruptions;
delays or difficulty in developing or implementing new, enhanced or existing software, data or hosting solutions;
changes in general economic, business, regulatory and political conditions, particularly as they affect the mortgage industry;
risks associated with the recruitment and retention of our skilled workforce;
impacts to our business operations caused by the occurrence of a catastrophe or global crisis;
our investment in Dun & Bradstreet Holdings, Inc. ("DNB");
security breaches against our information systems or breaches involving our third-party vendors;
the adequacy of our policies and procedures;
regulatory developments with respect to use of consumer data and public records;
our reliance on third parties;

1

Table of Contents

restrictions on our ability to pursue potential business opportunities under a non-competition agreement with Fidelity National Financial, Inc. and its subsidiaries ("FNF") that we entered in connection with the spin-off from FNF (the "Distribution");
our ability to successfully consummate, integrate and achieve the intended benefits of acquisitions;
our existing indebtedness and any additional significant debt we incur;
change in London Interbank Offered Rate (“LIBOR”) reporting practices and the replacement of LIBOR with an alternative reference rate;
litigation, investigations or other actions against us;
our charter and bylaws and provisions of Delaware law may discourage or prevent strategic transactions;
changes in the strength of the economy and housing market generally;
the market price of our common stock may be volatile; and
our intention not to pay dividends on our common stock for the foreseeable future.

See "Risk Factors" for a further description of these and other factors. For the reasons described above, we caution you against relying on any forward-looking statements, which should also be read in conjunction with the other cautionary statements that are included elsewhere in this Annual Report on Form 10-K. Any forward-looking statement made by us in this Annual Report on Form 10-K speaks only as of the date on which we make it. Factors or events that could cause our actual results to differ may emerge from time to time, and it is not possible for us to predict all of them. We are not under any obligation (and expressly disclaim any such obligation) to update or alter our forward-looking statements, whether as a result of new information, future events or otherwise. You should carefully consider the possibility that actual results may differ materially from our forward-looking statements.

2

Table of Contents

Part I

Item 1.           Business

Except as otherwise indicated or unless the context otherwise requires, all references to "Black Knight," the "Company," "we," "us" or "our" are to Black Knight, Inc., a Delaware corporation, and its subsidiaries ("BKI").

Overview

Black Knight is a premier provider of integrated, innovative, mission-critical, high-performance software solutions, data and analytics to the U.S. mortgage and real estate markets. Our mission is to transform the markets we serve by delivering innovative solutions that are integrated across the homeownership lifecycle and that result in realized efficiencies, reduced risk and new opportunities for our clients to help them achieve greater levels of success.

We believe our clients leverage our robust, integrated solutions across the entire homeownership lifecycle to help retain existing customers, gain new customers, mitigate risk and operate more efficiently. Our clients rely on our proven, comprehensive and scalable solutions and our unwavering commitment to delivering exceptional client support to achieve their strategic goals and better serve their customers.

We have a focused strategy of continuous innovation across our business, which is supported by acquisitions, and even more importantly, the integration of those acquisitions and our innovations into our broader ecosystem. Our ability to effectively manage our business and maintain a strong client base allows us to continually invest in our business, both to meet ever-changing industry requirements and to maintain our position as a leading provider of platforms for the mortgage and real estate markets.

Deep business and regulatory expertise along with a holistic view of the markets we serve allow us the privilege of being a trusted advisor to our clients, who range from the nation’s largest lenders and mortgage servicers to institutional portfolio managers and government entities, to individual real estate agents and mortgage brokers. Clients leverage our software ecosystem across a range of real estate and housing finance verticals through multiple digital channels, using our offerings to drive more business, reduce risk and deliver a best-in-class customer experience, all while operating more efficiently and cost-effectively.

We have long-standing relationships with our clients, a majority of whom enter into long-term contracts that include multiple, integrated products embedded into mission-critical processes. This speaks to the confidence our clients have in our solutions and our commitment to serve them. The contractual nature of our revenues and our client relationships make our revenues both highly visible and recurring in nature. Our scale and integrated ecosystem of solutions drive significant operating leverage and cross-sell opportunities, enabling our clients to continually benefit from new and greater operational efficiencies.

Overview of the Markets We Serve

The Black Knight ecosystem stretches across four core “pillar” verticals: mortgage loan servicing, mortgage loan origination, real estate and capital markets; with our data and analytics flowing throughout the interconnected ecosystem of solutions. As we integrate our innovations and acquired technologies, we are committed to continually improving the end consumer experience, driving further efficiencies for our clients and helping them to win new customers and retain existing customers.

Mortgage Loan Servicing

Once mortgage loans have been originated, the loans are onboarded to a servicing platform where servicers manage the loan and can provide borrowers and investors with information about those loans. Mortgage servicers (and sub-servicers) operate within a highly regulated industry segment and are responsible for overseeing the ongoing loan maintenance, payment collection, application process, escrow management, investor management, tax and insurance payments, etc. for approximately 66 million active first and second lien mortgage loans and lines of credit in the U.S.

3

Table of Contents

Mortgage servicing is typically a long-term relationship between the customer and the servicer; and, the customer’s servicing experience can have a direct impact on the servicer’s ability to retain loans in its portfolios.

The number of first lien mortgage loans being serviced in the U.S. remains relatively consistent even through housing and economic downturns and changes in interest rates. The number of second lien mortgage loans being serviced can fluctuate according to factors such as available, or “tappable,” equity levels, interest rates and individual portfolio appetite for such loans. Refer to the Business Trends and Conditions section of Item 7 - Management’s Discussion and Analysis of Financial Condition and Results of Operations for market data estimates for active first and second lien mortgage loans.

In times of economic stress, a servicer’s ability to manage their workload is often tested by distressed mortgages, defaults, foreclosure and bankruptcy actions. In such periods, loss mitigation, default processing, bankruptcy and more must be contended with, along with an ever-changing slate of regulatory requirements. The mortgage default process is long and complex and involves multiple parties, a significant exchange of data and documentation and extensive regulatory requirements. Innovative and trusted technology is essential in navigating this process efficiently and effectively.

Mortgage Origination

Mortgage origination is a complex process with multiple stages involving various parties, all of which are under high levels of regulatory scrutiny. Historically, many aspects of this process have been managed manually by lenders and other parties involved in the process, increasing the cost and complexity to originate a loan. The shift of consumer expectations and demands in recent years, which was accelerated by the pandemic, has created an increased demand for innovative solutions and the acceptance of digital technologies to meet the needs of market participants.

The U.S. mortgage origination market consists of both purchase and refinance loans, including cash-out refinances, and, to a lesser extent, second lien, equity-centric products such as home equity lines of credit (“HELOCs”). Participants in this market range from the largest U.S. banks, nonbanks and credit-union lenders; to independent and mid-sized banks; to wholesale and correspondent lenders; to mortgage brokerages and even the individual mortgage broker. Refer to the Business Trends and Conditions section of Item 7 - Management’s Discussion and Analysis of Financial Condition and Results of Operations for market data estimates for the number of mortgage loans originated.

Real Estate

The consumer journey to homeownership starts with identifying a property to purchase. The marketing, sales and purchase of real estate in the U.S. involves many participants. Needs exist for digital workflow, seamless data transfer between multiple sources and parties, and marketing and communication tools at the agent, broker and multiple listing service (“MLS”) levels.

Black Knight supports all participants in this process with technology to increase efficiencies, create new opportunities and manage complex workflows for all involved.

Capital Markets

The mortgage capital markets, both primary and secondary, play a critical role as providers of funding and liquidity that enable lenders to make home loans to borrowers. Mortgage loans are made possible in large part by market participants buying, selling or holding mortgage-backed securities (“MBS”) and loan portfolios.

Preeminent among capital market participants are the government-sponsored enterprises (“GSEs”), the Federal National Mortgage Association (“Fannie Mae”) and the Federal Home Loan Mortgage Corporation (“Freddie Mac”), who, along with the Government National Mortgage Association (“GNMA” or “Ginnie Mae”), the Federal Housing Administration (“FHA”) and the Veterans Administration (“VA”), provide back-stop guarantees to support market stability and help minimize systemic risk.

Market oversight is performed by federal and state regulators with the Federal Reserve, the Securities and Exchange Commission (“SEC”), the Federal Finance Housing Agency (“FHFA”), the Office of the Comptroller of the Currency

4

Table of Contents

(“OCC”) and the Consumer Financial Protection Board (“CFPB”) all playing major roles in ensuring market transparency, financial institution safety and soundness and consumer protection.

The informed investment in and trading of mortgage loans and MBS is dependent upon reliable, quality data at both the pool and loan level, plus robust analytics and the tools to use them effectively. An incredible amount of information gathering and assessing goes into making these investment decisions. Dealing with pools or portfolios of real estate or mortgage-related assets requires even more information. Loan-level mortgage performance, real estate price trends and credit-risk data are valuable and necessary insights needed by capital market participants to make informed decisions.

In the age of “big data,” this level of detailed information equates to many terabytes of data points, which can be an overwhelming amount of data to sift through and analyze without the right tools and solutions; however, that data can provide critical insights for those who can effectively decipher it.

Market Trends

Market trends that have spurred lenders and servicers to seek software, data and analytics solutions are as follows:

Lenders increasingly focused on core operations. As a result of a decline in origination volumes and the increasing cost to originate a mortgage loan, we believe lenders have become more focused on their core operations, including ways to reduce or eliminate certain costs. According to the MBA Quarterly Performance Report as of November 21, 2022, the cost to originate a loan has more than doubled since 2008 and increased 22% in 2022 compared to 2021. We believe lenders are increasingly shifting from in-house solutions to third-party solutions that provide a more comprehensive and efficient solution. Lenders require these providers to deliver best-in-class solutions and deep domain expertise and to assist them in maintaining regulatory compliance.

Integral role of technology in the U.S. mortgage market. Over the past decade, homebuyers’ processes have become more digital, and banks and other lenders and servicers have become increasingly focused on automation and workflow management to operate more efficiently and meet their regulatory requirements as well as using technology to enhance the consumer experience during the mortgage loan origination, closing, and servicing processes. Technology providers must be able to support the complexity and dynamic nature of the market, display extensive industry knowledge and possess the financial resources to make the necessary investments in technology and software to support lenders and servicers. This includes an enhanced digital experience along with the application of artificial intelligence, robotic process automation and adaptive learning.

Heightened demand for enhanced transparency and analytic insight. As the U.S. mortgage loan market participants work to minimize risk in lending, servicing and capital markets, they rely on the integration of data and analytics with solutions that enhance the decision-making process. These industry participants are eager for timely data and insights to help them plan and react to the changing environment.

Regulatory changes and oversight. Most U.S. mortgage loan market participants are subject to a high level of regulatory oversight and regulatory requirements as federal and state governments have enacted various new laws, rules and regulations. It is our experience that mortgage lenders and servicers have become more focused on minimizing the risk of non-compliance with regulatory requirements and look for solutions that assist them in complying with their regulatory requirements. We expect this trend to continue as additional governmental programs and regulations have been enacted to address the economic concerns resulting from the pandemic, and our clients have had to adapt their systems and processes in record time to the shifting landscape. In addition, our clients and our clients’ regulators have elevated their focus on privacy and data security in light of an increased level of cybersecurity incidents. We expect the industry focus on privacy and data security to continue to increase.

Solutions for the Markets We Serve

Our business is organized into two segments: Software Solutions and Data and Analytics. Together they represent an integrated ecosystem that spans the entirety of the real estate and mortgage continuum, from homebuying and selling to loan origination, through loan servicing and capital markets and back again.

5

Table of Contents

The Black Knight ecosystem lets clients access a comprehensive, integrated software and workflow management solution set via multiple segment-specific digital channels. Enhanced by large mortgage-specific datasets and robust proprietary analytics, our ecosystem helps our clients achieve greater levels of success from a trusted provider that continually delivers innovative technologies across our ecosystem.

Graphic

Software Solutions

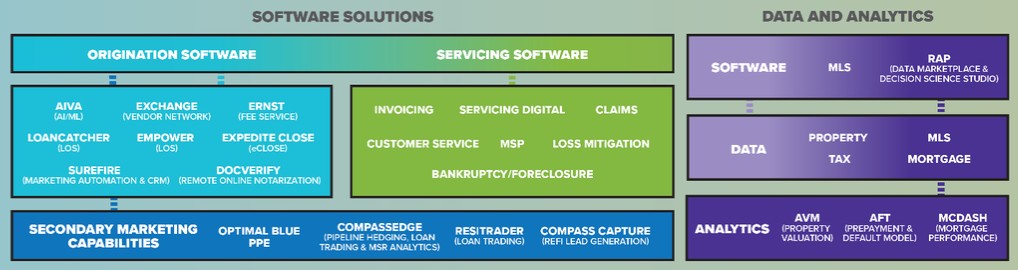
Our Software Solutions segment includes proven and trusted platforms that facilitate, automate and enhance many mission-critical business processes across the mortgage loan lifecycle continuum. Our offerings help clients in this segment, primarily mortgage lenders, servicers and investors, reduce costs, improve operations and provide an exceptional customer experience. Our software solutions are developed to meet the current and future needs of the markets we serve. In developing and delivering our products and solutions, we leverage a combination of private cloud, public cloud, application programming interfaces (“APIs”) and a host of other technology-forward approaches to best meet the needs of our vast and strong client base.

As a result of our leadership, combined with our extensive knowledge of the mortgage industry and technology, we are uniquely positioned to drive innovation in this space and bring the digital revolution to mortgage servicing for both borrowers and servicers alike. While we relentlessly pursue the enhancement of the consumer experience throughout the real estate and mortgage continuum, we are equally focused on innovating on the back end for servicers as well.

Servicing Software Solutions

MSP® is a SaaS solution that supports first lien mortgages and home equity loans and lines of credit, on a single platform. This complete, scalable, end-to-end system is used by servicers and sub-servicers to manage all servicing processes, including loan setup and maintenance, escrow administration, investor reporting, regulatory requirements and more. MSP® helps servicers increase efficiency, reduce operating costs and improve risk mitigation for approximately 36 million active loans currently serviced on the system.

MSP® serves as the core system of record and is enhanced with innovative digital solutions, all of which were developed using the most appropriate, forward-leaning technologies and are seamlessly integrated into the system of record. Servicing DigitalSM has seen tremendous adoption since its launch in 2018, with the majority of MSP® clients now offering the white-labeled, consumer facing application to their customers.

Servicing DigitalSM is an interactive, user-friendly web and mobile solution for consumers that provides easy access to customized, timely information about their mortgages. This powerful application supports deeper customer relationships for our clients and engagement by enabling their customers to make mortgage payments and explore opportunities for refinancing and more, all from the convenience of the web or a mobile device. By providing value-added services and information to borrowers, Servicing DigitalSM helps improve customer retention and serves as a direct communication channel between servicer and borrower.

6

Table of Contents

Servicing DigitalSM is integrated with our Customer ServiceSM solution, which allows our clients’ customer service representatives to have access to the same information and layout a customer sees to better facilitate successful interactions and outcomes, which is key to increasing borrower retention. We launched Developer PortalSM in January 2023, which provides clients, third-party providers and their developers access to our growing catalog of APIs across the mortgage life cycle. APIs expose business functionality and data that are packaged into reusable services that follow industry standard protocols and conventions to allow ease of integration. Clients can use our APIs to rapidly embed additional functionality within their applications, driving intuitive and frictionless experiences.

Our default servicing solutions help simplify the complex process for loans that move into default, while supporting servicers with their compliance requirements. As part of this suite, we offer an advanced Loss MitigationSM solution to facilitate more efficient loss mitigation processes. This feature-rich, web-based solution supports industry-standard retention and liquidation workouts to streamline the loss mitigation process and reduce risk. It is also available to consumers through Servicing DigitalSM and uses advanced rules and logic to guide users through processes step-by-step, including validation points throughout the workflow, to reduce missed steps and overlooked information. When loans move through the loss-mitigation process and become non-performing loans, our suite of innovative default servicing solutions help servicers reduce cycle times, decrease operating costs and improve efficiencies throughout the bankruptcy, foreclosure and claims stages.

We also offer advanced technology to support the bankruptcy and foreclosure process, and more efficiently manage claims related to properties in foreclosure, as well as tools to support loss analysis, helping servicers make the right decisions at the right time.

Origination Software Solutions

Our Empower® loan origination system (“LOS”) was developed to be hosted in a public or private cloud. The platform’s advanced automation capabilities, lights-out processing and seamless integrations with our other and third-party services help fulfill, streamline and improve upon the many pieces of the origination process. Integrated pipeline analytics, AI-powered underwriter efficiency tools, fee services, settlement services fulfillment, an advanced eClosing platform and more all combine to create a frictionless process that benefits both borrower and lender alike. In recognition of the dynamic nature of mortgage markets, Empower® offers maximum flexibility by giving lenders the ability to originate first lien mortgages, second lien mortgage loans and home equity lines of credit, and supporting retail, consumer‐direct, home equity, correspondent, wholesale and assumption channels on a single, unified platform.

We also offer product, pricing and eligibility (PPE) engines for brokers and lenders that allow lenders and brokers to provide borrowers with loan product and pricing options to meet the consumer’s needs. Our Optimal Blue PPE serves the retail market by providing lenders with access to hundreds of investors and the mortgage products they offer.

Our Borrower DigitalSM solution enables lenders to offer our AI-enhanced digital point of sale to walk their loan applicants through a friendly and intuitive prequalification/qualification Q&A, with seamless data transfer to lender systems. Customer engagement is active, immediate and targeted, and presents a smooth front end to a process that will carry the loan applicant, and a single source/repository of their data, all the way through to closing and beyond. We also drive the full origination and underwriting workflow for lenders of all sizes via our Empower® LOS.

Additionally, our digital loan officer technology makes the day-to-day lives of loan officers more productive through vastly simplified workflows while also helping them provide an exceptional level of service to loan applicants. With the same anytime, anywhere convenience provided by all of our consumer-facing digital products, Loan Officer DigitalSM facilitates seamless interaction between the loan officer and loan applicant throughout the entire process, from application to close. With the loan applicant engaged via the Borrower DigitalSM interface, Loan Officer DigitalSM enables loan officers to remain connected with their customers, providing timely updates and assistance when needed. Again, all data is captured and can be shared with our Empower® LOS.

After loan approval, loan applicants can view their loan status, review their closing package and eSign documents using our Expedite® Close solution. Loan applicants can also leverage our DocVerify® remote online notarization solution, making fully digital closings possible where legally permissible, with all activity tracked and logged for audit purposes.

7

Table of Contents

Recent trends show that consumers have been turning to mortgage brokers more often than before. Our LoanCatcher® cloud-based LOS, designed specifically for the needs of brokers, is both innovative and easy-to-use. It gives brokers affordable access to a robust software solution, integrated with the data and customer support solutions they need to provide exceptional levels of service to their customers.

In support of our focus on integration, LoanCatcher® is integrated with our LoanSifter® PPE and is also designed to meet the very specific needs of the broker community by providing access to hundreds of investors and thousands of loan products. All of this combined with system-agnostic delivery to whatever LOS their wholesale lender partners are using provides brokers with a truly end-to-end solution to manage and grow their businesses.

Generating and fostering new leads is critical to growing a lender’s business. Creating customers for life is equally as important and becomes increasingly more important as interest rates rise. To help create long-term customers and earn repeat business, we offer lenders the SurefireSM solution, which helps lenders close more loans by providing communications the lenders can send through an automated system to their customers throughout the mortgage process. The SurefireSM system distributes leads, nurtures them to application, educates and informs borrowers throughout the application and funding process, and provides omni-channel outreach post-close designed to capture repeat business. We believe the key to cultivating lifelong clients is keeping in touch, and SurefireSM’s milestone tracking allows users to reach customers with personalized, relevant content.

Our CompassEdge hedging and trading platform supports originators of every size by providing sophisticated pipeline risk management tools and analytics, as well as dynamic loan sale and mortgage servicing rights valuation functionality.

Data and Analytics

Our Data and Analytics segment is comprised of our extensive data offerings, proven credit and prepayment models, custom and proprietary analytics, valuation and MLS solutions and much more. In addition, the integration of data and insights from solutions in this segment informs, supports and enhances our other software solutions to help lenders and servicers make more informed decisions, improve performance, identify and predict risk and generate more qualified leads.

We have aggregated one of the largest residential real estate data sets currently available in the U.S. This data set is derived from both proprietary and public record sources. From nationwide MLS listings to our industry-leading McDash® loan-level mortgage loan performance data, to public property records covering more than 99.9% of the U.S. population, our datasets are indispensable for those working with housing assets.

Leveraging this data, subject to any applicable restrictions, alongside our long history and deep understanding of the housing market, we have created detailed data solutions that assist in portfolio management, valuations, property records, lead generation and improved risk analysis for all aspects of servicing, origination, real estate and capital markets. In addition, we deliver data and analytics to clients in real estate, title insurance, MLS and other verticals that rely on property data-centric solutions to make informed decisions and run their businesses.

We also offer a highly accurate behavioral model built on our datasets and other third-party sources that forecasts prepayments, default, delinquencies and losses on residential mortgage loans and securities. Used for portfolio analysis, our AFTSM solution can serve as a powerful risk mitigation tool as well as a key component of any data-driven retention efforts.

Accurate valuations are critical to any real-estate transaction. Our automated valuation models (“AVMs”) are built on the foundation of our property data, proprietary information, proven methodologies and advanced user and performance testing and deliver exceptionally reliable automated property valuations.

To better understand the housing market, we also leverage MLS and property data to provide near-real-time daily data views of the housing market, looking at home prices, inventory levels, days on market and other key indicators at the state, core based statistical areas and zip code levels.

8

Table of Contents

We also provide data solutions that enable our clients to analyze big data sets through the synergistic convenience of a single data science workspace. Our cloud-based enterprise data and analytics solution, RAP®, is an interactive data science platform that allows clients to quickly aggregate data from our extensive mortgage and housing data marketplace with their own data sources to execute both custom and proprietary queries.

Our real estate focused clients leverage our market-leading software solution for regional MLS associations to manage property listings. The platform also enables membership management, provides tools for collaboration with loan officers and other affiliates and marketing tools to effectively meet dynamic market challenges.

Focus on Value-Driven Innovation

The value our clients place on innovation can be seen in the adoption rates of the next-gen products we have delivered. When developing and delivering our products, we leverage a combination of private cloud, public cloud, APIs and a host of other technology-forward options that allow us to deliver innovative solutions to market quickly in response to address our clients’ biggest challenges.

Our solutions are designed to be scalable, secure, flexible, standards-based and web-connected for easy use. Further, we have a proven history of bringing solutions to market quickly due to investments we have made in integrating and streamlining our software and development processes.

Our Competitive Strengths

We believe our competitive strengths include the following:

Market leadership with comprehensive and integrated solutions. We are a leading provider of comprehensive and integrated solutions for the markets we serve. This leadership position is the result of strong client relationships, our knowledgeable employees who are focused on delivering superior solutions and support and delivering innovative solutions.

We have used this insight to develop a comprehensive, integrated ecosystem of proprietary software, data and analytics solutions to automate many of the mortgage and real estate markets’ mission-critical business processes. These integrated solutions reduce manual processes, help improve organizational compliance and mitigate risk, and ultimately deliver significant cost savings to our clients.

Broad and deep client relationships with significant recurring revenues. We have long-standing, relationships with many of our clients. We frequently enter into long-term contracts with our software solutions clients that contain a base subscription fee with additional fees that are activity-based. Our products are typically embedded within our clients’ mission-critical workflow and decision-making processes across various parts of their organizations.

Extensive data assets and analytics capabilities. We develop and maintain large, accurate and comprehensive data sets on the real estate and mortgage markets that we believe are competitively differentiated. Our unique data sets provide a combination of public and proprietary data, and each of our data records features many attributes. Our data scientists bring comprehensive analytical capabilities to bear against these data sets, subject to any applicable use restrictions, to create highly customized reports. These reports include models of customer behavior for originators and servicers, portfolio analytics for capital markets and government agencies and proprietary market insights for real estate market participants. As mentioned, our data and analytics capabilities are also embedded into our software solutions and workflow products to provide actionable insights.

Scalable and cost-effective operating model. Our market position, hosted software solutions and large client base have allowed us to develop a highly attractive and scalable operating model that provides us with significant benefits. Our scale and operating leverage allow us to add clients to our existing platforms with limited incremental cost. By leveraging our scale and market position, we can make cost-effective investments in our software solutions to assist with complex regulatory and compliance requirements, which we believe increases our value proposition to clients.

9

Table of Contents

Our Strategy

Our comprehensive integrated solutions ecosystem; unique, robust data and analytic capabilities; differentiated business model; broad and deep client relationships; and other competitive strengths put us in a very strong position to pursue multiple avenues for growth opportunities. We intend to continue to expand and grow our business through the following key strategies:

Win new clients. We intend to attract new clients by demonstrating the value proposition provided by our software and comprehensive solutions offering. In addition to top tier mortgage loan originators and servicers, where we have had and continue to have success, we believe there continues to be a significant opportunity to penetrate the mid-tier mortgage loan originators and servicers, as well as mortgage broker, markets. We believe these institutions can benefit from our proven solutions suite to address complex regulatory requirements and compete more effectively in the evolving mortgage loan market. We intend to continue to pursue all of these channels and benefit from the low incremental cost of adding new clients to our scalable applications and infrastructure.

Cross-sell existing products. The Black Knight ecosystem offers a wide variety of opportunities for existing clients to reap further benefits when they increase their use of our solutions across the real estate and mortgage continuum through integrations and seamless data sharing. It therefore also represents a substantial opportunity for growth as we seek to assist our clients in realizing the value of additional offerings and the benefits they provide. We intend to broaden and deepen existing client relationships through cross sales of solutions, data and analytics that reveal opportunity for client-side improvement of one form or another. We aim to help our clients see the true benefit of our fully integrated solutions ecosystem and the compound value of leveraging multiple solutions simultaneously. Helping our clients better focus on their core businesses and customers will put us in a better position to expand those existing relationships while adding value.

Solution development and innovation. Our long-term vision is to continue to lead through innovation and to maintain our leadership role in providing software, data and analytics to the mortgage and real estate markets. We intend to continue to innovate with urgency and integrate new solutions with our platforms in ways that bring the most value to our clients and their customers. We have a strong track record of introducing and developing new solutions that are tailored to specific industry trends and enhance our clients’ core operating functions. By working in partnership with key clients, we have been able to develop and market new and advanced solutions that meet the evolving demands of the mortgage and consumer loan, real estate and capital markets verticals. In addition, we will continue to develop and leverage insights from our large public and proprietary data assets to further improve our client value proposition.

Selectively pursue acquisitions. The core focus of our strategy is to grow organically. However, we may selectively evaluate acquisition opportunities that would allow us to expand our footprint, broaden our client base and deepen our product and service offerings. We believe there are meaningful benefits that result from acquiring companies that provide best-in-class single point solutions. Integrating and cross selling these point solutions into our broader client base and integrating acquisitions into our efficient operating environment would potentially result in revenues and cost synergies. Additionally, new directions for product development often materialize when acquired companies are integrated into the wider ecosystem.

Our Clients

We provide solutions to financial institutions, mortgage lenders and servicers, mortgage brokers, investors, attorneys, trustees and real estate professionals.

The U.S. mortgage loan industry is concentrated among the top 25 institutions, and our most significant and long-term relationships tend to follow the industry landscape. The number of solutions being used by each client in this category continues to grow, as the compounded value of multiple of our products becomes clearer over time. Because of the depth of these relationships, we derive a significant portion of our revenues from our largest clients.

For the year ended December 31, 2022, our five largest clients accounted for approximately 23% of our consolidated revenues and approximately 25% of our Software Solutions segment revenues. However, the revenues in each case are

10

Table of Contents

spread across a range of services and are subject to multiple, separate contracts. Although the diversity of the services we provide to each of these clients reduces the risk that we would lose all of the revenues associated with any of these clients, a significant deterioration in our relationships with or the loss of any one or more of these clients could have a material effect on our results of operations or financial condition. See Item 1A. Risk Factors of Part I of this Report.

Sales and Marketing

Our sales and marketing efforts are focused on generating new leads to both securing new clients in our target markets, as well as cross sell our integrated solutions ecosystem to existing clients.

Regardless of the market we are serving, our sales and marketing strategy remains the same: communicate how our solutions address the challenges facing a specific market and deliver those messages where the companies we serve are engaging. We establish relationships, deliver proven solutions and continually build trust. Our experienced sales personnel are subject matter experts in our services, the needs of our clients and the markets we serve.

We are able to effectively communicate the value of our ecosystem by developing and delivering solutions that move the needle by helping our clients achieve greater levels of success. We know that references from colleagues in the industry are one of the top reasons a provider is selected, so we remain committed to delivering powerful solutions that cultivate those references.

Our relationships with so many different companies across the real estate and mortgage sectors provide us with a unique opportunity to gain insight into trends and challenges facing the industry. We couple that with thoughtful analysis of our vast data assets to develop solutions and provide industry insights others cannot. We are also focused on sharing that thought leadership with our clients, the media, the public and our entire industry.

To understand what will help our various and disparate market segments succeed, we also conduct market research through conversations with clients and prospects, market surveys, industry reports and discussions with other industry leaders. Likewise, we also host client user groups and participate in user forums to understand the needs and concerns of the everyday users of our solutions.

We deliver our messages where the companies we serve are congregating, through tradeshows, events, publications, digital channels, etc., and engage them in conversations that highlight the many differentiators/competitive advantages we provide through our continual innovations. We engage with existing clients on a regular basis and continually focus on engaging with prospective clients. Given the broad range of solutions we offer, we have significant opportunity to expand our sales to our existing client base through cross-selling efforts.

We have a core team of account managers who cross-sell solutions to existing clients at the top-tier and mid-tier U.S. mortgage loan originators and servicers, as well as a number of other financial institutions, investors and real estate professionals. We engage in strategic account reviews, during which our executives share their knowledge of clients and the market to determine the best sales approach on a client-by-client basis. As a result, we believe we have created an effective cross-selling culture within our organization.

Research and Development

Our research and development activities are core to our corporate mission of transforming the industry through innovation. As such, they relate to the design, development, integration and enhancement of the software applications that make up our solution ecosystem. We expect to continue our practice of investing an appropriate level of resources to maintain, enhance and extend the functionality of our existing proprietary systems and software applications; to develop new and innovative systems and software applications in response to the needs of our clients as well as market and regulatory conditions and to enhance the capabilities of the ecosystem infrastructure. We work with our clients to determine the appropriate timing and approach to introducing technology or infrastructure changes to our applications and services.

11

Table of Contents

Patents, Trademarks and Other Intellectual Property

We rely on a combination of contractual restrictions, internal security practices and copyright and trade secret laws to establish and protect our software, technology, data and expertise. Further, we have developed strong brand recognition, which has helped us accumulate goodwill in the marketplace, and we rely on the above to protect our rights in that area. We intend to continue our policy of taking all measures we deem necessary to protect our copyright, trade secret and trademark rights.

Competition

The multiple business verticals in which we engage are highly competitive. We believe that compounded benefits of our integrated ecosystem of software and data and analytics solutions represent a value proposition that is strong and wholly unique to us. Our economies of scale in the mortgage loan origination and servicing markets also provide us with a distinct competitive advantage in each of these categories. Based on our knowledge of the industry and competitors, we believe that no single competitor is capable of delivering the depth and breadth of solutions we are able to offer.

Competitive factors in processing businesses include the quality of the technology-based application or service, application features and functions, ease of delivery and integration, ability of the provider to maintain, enhance and support the applications or services and pricing.

Software Solutions. Our Software Solutions segment competes with our clients’ internal technology departments and other third-party providers of similar systems. Competitive factors include the quality of the technology-based application or service, application features and functions, ease of delivery and integration, ability of the provider to maintain, enhance and support the applications or services, client support and pricing. We believe that our ability to deliver proven and integrated software solutions, the adoption rate of our solutions, our focus on supporting our clients on a daily basis and the economies of scale we offer in the mortgage loan processing business provide us with a competitive advantage in each of these categories.

Data and Analytics. In our Data and Analytics segment, we compete primarily with third-party providers of similar data assets, including certain niche providers, and in-house capabilities. We compete based on the breadth and depth of our data; the exclusive nature of some of our key data sets; robust proprietary analytics and the capabilities to produce highly customized reports. We believe that the quality of the data we offer is distinguished by the broad range of our data sources, including non-public sources; the volume of records we maintain; our ability to integrate our data and analytics across our ecosystem; and the ability to leverage our market leading position in the mortgage loan origination and servicing industries.

Government Regulations

Various aspects of our businesses are subject to federal and state regulations. Our failure to comply with any applicable laws and regulations could result in restrictions on our ability to provide certain services, as well as the possible imposition of civil fines and criminal penalties.

As a provider of electronic data processing to financial institutions, such as banks and credit unions, we are subject to regulatory oversight and examination by the Federal Financial Institutions Examination Council ("FFIEC"), an interagency body of the Federal Reserve Board ("FRB"), the CFPB, the federal banking agencies and various other federal and state regulatory authorities. We also may be subject to possible review by state agencies that regulate banks in each state in which we conduct our electronic processing activities.

Our financial institution clients are required to comply with various privacy laws and regulations under state and federal law, including the Gramm-Leach-Bliley Act. These laws and regulations place restrictions on the use of non-public personal information. All financial institutions must disclose detailed privacy policies to their customers and offer them the opportunity to direct the financial institution not to share information with third parties. The regulations, however, permit financial institutions to share information with non-affiliated parties who perform services for the financial institutions. As a provider of services to financial institutions, we are required to comply with the same privacy regulations

12

Table of Contents

and are generally bound by the same limitations on disclosure of the information received from our clients as those that apply to the financial institutions themselves.

Many consumer advocates, privacy advocates and government regulators believe that existing laws and regulations do not adequately protect privacy or ensure the accuracy of consumer-related data. As a result, multiple consumer privacy laws have been implemented at the state level which regulate the acquisition, dissemination, and commercial use of personal information. These consumer privacy laws include the California Consumer Privacy Act (“CCPA”), as modified by the California Privacy Rights Act (“CPRA”) which was effective January 1, 2023; the Virginia Consumer Data Protection Act (“VCDPA”) which was effective January 1, 2023; the Colorado Privacy Act (“CPA”) which will be effective July 1, 2023; the Connecticut Data Privacy Act (“CTDPA”) which will be effective July 1, 2023; and the Utah Consumer Privacy Act (“UCPA”) which will be effective December 31, 2023. Generally, these laws seek to implement further restrictions on the acquisition, dissemination, and commercial use of personal information and also contemplate requirements relative to data accuracy, the ability of consumers to opt out of certain processing of personal information, the right to access personal information and to obtain a copy, and the right to delete personal information in certain circumstances. These laws are directly applicable to our clients as well as to us in certain circumstances and are applicable to us in a reduced capacity when we act as service providers to our clients.  

Laws such as the Vermont Act Relating to Data Brokers and Consumer Protection (the “Vermont Data Broker Law”) also place restrictions and requirements on the use of publicly available data, and laws such as the New York Department of Financial Services Cybersecurity Requirements for Financial Services Companies (“NY DFS Cybersecurity Regulation”) provide for certain security requirements surrounding the collection and maintenance of certain business and consumer nonpublic personal information.

Increased scrutiny of all parties involved in the mortgage loan industry by governmental authorities has included federal and state government review of all aspects of the mortgage lending business, including an increased legislative and regulatory focus on consumer protection practices. Future legislative or regulatory changes are difficult to predict and new laws or regulations that may be implemented by the CFPB or other regulatory bodies may require us to change our business practices or cause us to incur increased costs to comply.

Information Technology and Security

We are highly dependent on information technology networks and systems to securely process, transmit and store electronic information. Attacks on information technology systems continue to grow in frequency, complexity and sophistication and we expect this trend to continue. Such attacks have become a point of focus for individuals, businesses and governmental entities. These attacks can create system disruptions, shutdowns or unauthorized disclosure of confidential information, including non-public personal information of consumers and proprietary business information. Refer to the "Risks Related to Information Security" section of Item 1A. Risk Factors for additional information.

We protect our data assets by providing centralized security solutions and enforcing a defense-in-depth, centralized model that includes deterring, detecting, preventing, analyzing and containing security incidents. We focus on all areas of cybersecurity including threat and vulnerability management, security monitoring, identity and access management, phishing awareness, risk oversight, third-party risk management, disaster recovery and continuity management. We make strategic investments in information security to protect our clients and our information systems. This includes both capital expenditures and operating expenses for hardware, software, personnel and consulting services.

As our primary solutions and services evolve, we apply a comprehensive approach to the mitigation of identified security risks. We have established policies, including those related to privacy, information security and cybersecurity, and we employ a broad and diversified set of risk monitoring and risk mitigation techniques.

Enterprise Risk Management: We maintain a comprehensive Enterprise Risk Management ("ERM") program that provides the framework to align our risk appetite and strategy to enhance management of enterprise risks, including information security risks. Through our ERM program, we analyze risks inherent to our products, services and businesses, and develop appropriate plans to mitigate those risks. Our executive-level Enterprise Risk and Compliance Committee convenes regularly to discuss matters relating to our enterprise risk position and

13

Table of Contents

risk management, such as third-party risk, phishing, security incident response, application resiliency, environmental, social and governance responsibilities and external and internal vulnerabilities. The Risk Committee of our Board of Directors oversees the ERM and Compliance programs through regular reports from our Chief Risk Officer, Chief Information Security Officer and Chief Compliance Officer, and reports on these matters to our board of directors.
Compliance: Our Compliance function provides the standards and policies to mitigate identified risks, as well as training for our employees on applicable privacy, security, legal and regulatory requirements that provide ongoing enhancement of our security and risk culture.
Internal Audit: Our Internal Audit function provides independent and objective assurance services designed to improve the Company’s operations. Internal Audit focuses a significant portion of their time and resources to the audit of information technology and security. The Internal Audit department is established by the Audit Committee of the Board of Directors, and it directly oversees its results and operations.

Human Capital Management

We power the markets we serve by delivering innovative, mission-critical solutions. Our employees are a key factor in our success. Our most important priorities are the health and safety of our employees and helping the communities where we work and live.

We are passionate about giving our employees the tools to equip them for success in their careers, providing the health and wellness benefits and other online resources needed for physical, mental and social well-being, and delivering on diversity and inclusion initiatives to let every employee know they are valued and respected.

We realize our individual differences are what strengthen us collectively. We are committed to supporting a culture that is representative of the unique values, opinions, cultures and needs of our employees, clients and communities. Through internal programs, including employee training and leadership development, affinity groups, comprehensive benefits and a hands-on leadership team, we support our employees throughout their career.

We strive to attract and retain the most talented employees in the industry by offering competitive compensation and investing in our employees to help them achieve goals inside and outside of the office.

As of December 31, 2022, we had approximately 6,100 employees. None of our workforce is unionized. We have not experienced any work stoppages, and we consider our relations with employees to be good.

Recent Developments

Refer to the Recent Developments section in Item 7 - Management’s Discussion and Analysis of Financial Condition and Results of Operations for additional information on the proposed ICE Transaction as well as the February 2022 Optimal Blue transaction and the January 2023 TitlePoint transaction.

Additional Information

Our website address is www.blackknightinc.com. We make available free of charge on or through our website our Annual Report on Form 10-K, Quarterly Reports on Form 10-Q, Current Reports on Form 8-K and all amendments to those reports filed or furnished pursuant to Section 13(a) or 15(d) of the Exchange Act as soon as reasonably practicable after such material is electronically filed with or furnished to the Securities and Exchange Commission ("SEC"). However, the information found on our website is not part of this or any other report.

14

Table of Contents

Item 1A.           Risk Factors

In addition to the normal risks of business, we are subject to significant risks and uncertainties, including those listed below and others described elsewhere in this Annual Report on Form 10-K. Any of the risks described herein could result in a significant or material adverse effect on our results of operations or financial condition.

Summary

The following summarizes some of the key risks and uncertainties that could materially adversely affect us. You should read this summary together with the more detailed description of each risk factor contained below.

Risk Related to the Proposed Merger with Intercontinental Exchange, Inc. (“ICE”)

Holders of our common stock cannot be certain of the market value of the consideration they will receive in the Merger.
The Merger will not be completed unless important conditions are satisfied or waived.
Regulatory approvals may not be received, may take longer than expected or may impose conditions that are not presently anticipated.
The Merger Agreement limits our ability to pursue alternatives to the Merger.
The Merger Agreement may be terminated in accordance with its terms.
We are subject to business uncertainties and contractual restrictions while the Merger is pending.
Uncertainties associated with the Merger may cause a loss of our management personnel and other key employees.
Litigation related to the Merger could prevent or delay completion of the Merger or otherwise negatively affect ICE’s and our businesses and operations.
ICE and we are expected to incur significant costs related to the Merger.

Business and Industry

We rely on our top clients for a significant portion of our revenues and profits.
The time and expense associated with switching from our competitors’ software and services to ours may limit our growth.
We may fail to meet contractual commitments.
Our clients and we are subject to various governmental regulations.
There may be consolidation in our end-client market.
Participants in the mortgage loan industry are subject to efforts by the government to regulate the mortgage loan industry.
Our clients’ relationships with government-sponsored enterprises ("GSEs") are subject to change.
We may fail to adapt our solutions to technological changes or evolving industry standards and regulations.
We operate in a competitive business environment.
If the availability of free or relatively inexpensive information increases, the demand for some of our data and information solutions may decrease.
We rely upon proprietary technology and information rights.
Our applications, solutions, or services may be found to infringe the proprietary rights of others.
We depend on our ability to access data from external sources.
We have international operations and third-party service providers.
We may experience system failures or service interruptions.
We may experience delays or difficulty in developing or implementing new, enhanced or existing software, data or hosting solutions.
Our revenues are subject to changes in the mortgage lending industry affected by the strength of the economy and the housing market.

15

Table of Contents

We may fail to attract and retain enough qualified employees, including those with client relationships or support our technology and operations.
The extent to which health epidemics affect our business, results of operations, liquidity and financial conditions are highly uncertain and are difficult to predict.

Risks Related to Our Investment in DNB

Our investment in DNB may expose us to certain risks.

Risks Related to Cybersecurity and Data Privacy

We may be unable to protect our information systems against data corruption, cyber-based attacks or network security breaches, including breaches involving third-party vendors, or we may be unable to provide adequate security in the electronic transmission of sensitive data.
Our cybersecurity policies and procedures may not be adequate.
We are subject to regulatory developments with respect to use of consumer data and public records.
We rely on third parties for our operations.

Risk Related to Our Structure

Certain executive officers and members of our Board of Directors have interests and positions that could present potential conflicts.
We are restricted from pursuing certain potential business opportunities under a non-competition agreement.

General Risk Factors

We may be unable to successfully consummate acquisitions or experience delays in integrating acquisitions.
We have substantial investments in recorded goodwill and other intangible assets.
Our indebtedness could have a negative effect on our financing options and liquidity position and could impose restrictions to us.
Our senior leadership team is critical to our continued success.
We are subject to current and future litigation, investigations or other actions against us.
Our charter and bylaws and provisions of Delaware law may discourage or prevent strategic transactions.
The market price of our common stock may be volatile.
We do not intend to pay dividends for the foreseeable future.

Risks Related to the Proposed Merger with ICE

Because the market price of ICE common stock may fluctuate, holders of our common stock cannot be certain of the market value of the consideration they will receive in the Merger.

Pursuant to and subject to the terms of the Agreement and Plan of Merger dated as of May 4, 2022 (the “Merger Agreement”) with ICE, a wholly-owned subsidiary of ICE (“Sub”) will merge with and into Black Knight with Black Knight surviving as a wholly-owned subsidiary of ICE (the “Merger”). At the effective time of the Merger (the “Effective Time”), each share of our common stock issued and outstanding immediately prior to the Effective Time (other than shares of our common stock held by us as treasury stock, any of our subsidiaries (other than with respect to the Black Knight Employee Stock Purchase Plan), by ICE or any of ICE’s subsidiaries (including Sub), or by any holder who has properly exercised and perfected such holder’s demand for appraisal rights under Section 262 of the General Corporation Law of the State of Delaware and not effectively withdrawn or lost such holder’s rights to appraisal (collectively, “Excluded Shares”)) will be converted into the right to receive, at the election of the holder thereof, the following consideration (the “Merger Consideration”):

16

Table of Contents

an amount in cash equal to the sum, rounded to the nearest one tenth of a cent, of (x) $68.00 plus (y) the product, rounded to the nearest one tenth of a cent, of 0.1440 (the “Share Ratio”) multiplied by the average of the volume weighted averages of the trading prices of ICE common stock on the New York Stock Exchange on each of the ten consecutive trading days ending on (and including) the trading day that is three trading days prior to the date on which the Effective Time occurs (the “Average ICE Stock Price”) (such amount, the “Per Share Cash Consideration”);
a number of validly issued, fully paid and nonassessable shares of ICE common stock as is equal to the quotient, rounded to the nearest one ten thousandth, of (x) the Per Share Cash Consideration divided by (y) the Average ICE Stock Price (such number of shares, the “Per Share Stock Consideration”); or
if no election is made by such holder, such Per Share Stock Consideration or Per Share Cash Consideration as is determined in accordance with the proration mechanism described below.

The election right for the holders of shares of our common stock will be subject to proration in accordance with the terms of the Merger Agreement such that (a) the total number of shares of our common stock to be converted into the right to receive the Per Share Cash Consideration will be equal to the quotient, rounded down to the nearest whole share, of $10,505,000,000 divided by the Per Share Cash Consideration and (b) all shares of our common stock not receiving the Per Share Cash Consideration (other than Excluded Shares) will be converted into the right to receive the Per Share Stock Consideration.

This Share Ratio is fixed and will not be adjusted for changes in the market price of either ICE common stock or our common stock. Changes in the price of ICE common stock prior to the Merger will affect the value that holders of our common stock will receive in the Merger. We and ICE are not permitted to terminate the Merger Agreement as a result, in and of itself, of any increase or decrease in the market price of ICE common stock or our common stock.

There is a time lapse between the date on which our stockholders voted to approve the Merger Agreement at the special meeting and the date on which our stockholders entitled to receive the Merger Consideration actually receive such consideration. The market value of ICE common stock may fluctuate during this period as a result of a variety of factors, including general market and economic conditions, regulatory considerations, including changes in U.S. monetary policy and its effect on global financial markets and on interest rates, changes in ICE’s or our business, operations and prospects, the global coronavirus pandemic and the related disruption to local, regional and global economic activity and financial markets, and the impact that any of the foregoing may have on ICE, us or the customers or other constituencies of ICE or us, many of which factors are beyond ICE’s or our control. Therefore, at the time our stockholders approved the Merger Agreement at the special meeting, they did not know the market value of the consideration to be received by holders of our common stock at the Effective Time of the Merger.

The Merger will not be completed unless important conditions are satisfied or waived.

Specified conditions set forth in the Merger Agreement must be satisfied or waived to complete the Merger. If the conditions are not satisfied or, to the extent permitted by law, waived, the Merger will not occur or will be delayed, and we and ICE may lose some or all of the intended benefits of the Merger. The following conditions must be satisfied or, to the extent permitted by law, waived before we and ICE are obligated to complete the Merger: (i) the adoption of the Merger Agreement by the affirmative vote of holders of a majority of the outstanding shares of our common stock entitled to vote thereon at the special meeting (this vote was obtained at the special meeting on September 21, 2022), (ii) the expiration or early termination of the waiting period applicable to the consummation of the Merger under the Hart-Scott-Rodino Antitrust Improvements Act of 1976 (“HSR Act”), (iii) the absence of any law, injunction, order or other judgment, in each case whether temporary, preliminary or permanent, that is in effect and restrains, enjoins or otherwise prohibits the consummation of the Merger, (iv) the effectiveness of the registration statement on Form S-4 filed by ICE to register the shares of ICE common stock to be issued in the Merger (the registration statement was declared effective by the SEC on August 19, 2022), (v) approval for listing on the NYSE of the shares of ICE common stock to be issued in the Merger, (vi) compliance by ICE and us in all material respects with their respective obligations under the Merger Agreement that are required to be performed or complied with by the time of the closing and (vii) subject in most cases to exceptions that do not rise to the level of a Material Adverse Effect or a Parent Material Adverse Effect (each as defined in the Merger

17

Table of Contents

Agreement), the accuracy of representations and warranties made by us, respectively, in the Merger Agreement. The respective obligations of ICE and us to consummate the Merger are also subject to there not having occurred since the date of the Merger Agreement an event that has had or would reasonably be expected to have, individually or in the aggregate, a Parent Material Adverse Effect or a Material Adverse Effect, respectively.

If the Merger is not completed, each of ICE’s and our ongoing businesses, financial condition, financial results and stock price may be materially and adversely affected and, without realizing any of the benefits of having completed the Merger, ICE and we will be subject to a number of risks, including the following:

the market price of our common stock or ICE common stock could decline to the extent the current market price reflects an assumption that the Merger will be completed;
ICE or we could owe a termination fee to the other party under certain circumstances;
if our Board of Directors seeks another business combination, our stockholders cannot be certain that we will be able to find a party willing to enter into a transaction on terms equivalent to or more attractive than the terms that ICE has agreed to in the Merger Agreement;
time and financial and other resources committed by ours and ICE’s management to matters relating to the Merger could otherwise have been devoted to pursing other beneficial opportunities;
ICE or we may experience negative reactions from the financial markets or from their customers, suppliers or employees;
ICE or our current and prospective employees may experience uncertainty about their roles following the completion of the Merger, which may have an adverse effect on ICE’s or our ability to attract or retain key management and other key personnel;
ICE and we will be required to pay costs relating to the Merger, such as legal, accounting, financial advisory, financing (including the redemption by ICE of $5 billion of its bonds at 101% of par value) and printing fees, whether or not the Merger is completed; and
ICE or we could be subject to litigation related to any failure to complete the Merger or related to any enforcement proceeding commenced against ICE or us to perform our respective obligations under the Merger Agreement.

Regulatory approvals may not be received, may take longer than expected or may impose conditions that are not presently anticipated, that could have an adverse effect on ICE following the Merger or that are otherwise unacceptable to ICE.

Completion of the Merger is conditioned on, among other things, the expiration or early termination of the waiting period applicable to the consummation of the Merger under the HSR Act. There can be no assurance that this condition to the completion of the Merger will be satisfied on a timely basis or at all and there can be no assurance that, if regulatory approvals are granted, they will not result in the imposition of conditions, limitations, obligations or restrictions that have the effect of preventing the completion of any of the transactions contemplated by the Merger Agreement, imposing additional material costs on or materially limiting the revenues of ICE following the Merger or otherwise reducing the anticipated benefits of the Merger, or result in the delay or abandonment of the Merger.

Under the Merger Agreement, ICE and we have agreed to use our respective reasonable best efforts to cause the transactions contemplated by the Merger Agreement to be consummated as soon as practicable and to obtain all approvals from any governmental entity or third party that are necessary, proper or advisable to consummate the Merger. In particular, each party has agreed to use its reasonable best efforts to take promptly any and all steps necessary to avoid, eliminate or resolve each and every impediment and obtain all clearances, consents, approvals and waivers under U.S. antitrust laws so as to enable the parties to close the Merger as soon as practicable.

18

Table of Contents

 The Merger Agreement limits our ability to pursue alternatives to the Merger and may discourage other companies from trying to acquire us.

The Merger Agreement contains covenants that restrict our ability to, directly or indirectly, solicit, initiate, knowingly facilitate, knowingly encourage or knowingly induce any acquisition proposal, engage in any discussions or negotiations with any person relating to any takeover proposal, or provide any confidential or nonpublic information or data to any person relating to any takeover proposal, subject to certain exceptions. In addition, subject to certain exceptions, our Board of Directors was required to recommend that our stockholders adopt the Merger Agreement.

If the Merger Agreement is terminated under certain circumstances, we may be required to pay a termination fee of $398 million to ICE.

These provisions could discourage a potential third-party acquiror or merger partner that might have an interest in acquiring all or a significant portion of us or pursuing an alternative transaction from considering or proposing such a transaction.

If the Merger Agreement is terminated and we determine to seek another business combination, we may not be able to negotiate a transaction with another party on terms comparable to, or better than, the terms of the Merger Agreement.

The Merger Agreement may be terminated in accordance with its terms and the Merger may not be completed, which could negatively affect us.

The Merger Agreement is subject to a number of conditions that must be satisfied or waived in order to complete the Merger. These conditions to the closing of the Merger may not be satisfied in a timely manner or at all, and, accordingly, the Merger may be delayed or may not be completed. In addition, if the Merger is not completed by the outside date, either ICE or we may choose not to proceed with the Merger, and the parties can mutually decide to terminate the Merger Agreement at any time. In addition, ICE or we may elect to terminate the Merger Agreement in certain other circumstances as set forth in the Merger Agreement.

If the Merger Agreement is terminated, there may be various consequences. For example, our business may have been impacted adversely by the failure to pursue other beneficial opportunities due to the focus of management on the Merger, without realizing any of the anticipated benefits of completing the Merger. Additionally, if the Merger Agreement is terminated, the market price of our common stock could decline to the extent that the current market prices reflect a market assumption that the Merger will be completed. If the Merger Agreement is terminated under certain circumstances, we may be required to pay a termination fee of $398 million to ICE.

We are subject to business uncertainties and contractual restrictions while the Merger is pending, which could adversely affect our business and operations.

In connection with the pendency of the Merger, we have seen that some customers, suppliers and other persons with whom we and/or ICE have a business relationship have delayed or deferred certain business decisions or may decide to seek to terminate, change or renegotiate their relationships with ICE or us, as the case may be, as a result of the pending Merger or otherwise, which could negatively affect ICE’s or our respective revenues, earnings and/or cash flows, as well as the market price of ICE’s or our common stock, regardless of whether the Merger is completed.

Under the terms of the Merger Agreement, we are subject to certain restrictions on the conduct of our business prior to completing the Merger which may adversely affect our ability to execute certain of our business strategies, including the ability in certain cases to enter into or amend contracts, acquire or dispose of assets, incur indebtedness or incur capital expenditures. Such limitations could adversely affect our business and operations and our ability to respond to changes in our business, the mortgage industry or broader economic conditions prior to the completion of the Merger.

Each of the risks described above may be exacerbated by delays or other adverse developments with respect to the completion of the Merger.

19

Table of Contents

In addition, subject to certain exceptions, we have agreed to use reasonable best efforts to carry on our business in the ordinary course and, to the extent consistent therewith, to use reasonable best efforts to preserve substantially intact our current business organizations, to keep available the services of our current officers and employees and to preserve our relationships with significant customers, suppliers, licensors, licensees, distributors, lessors and others having significant business dealings with us, in each case, during the period between the date of the Merger Agreement and the closing of the Merger.

Uncertainties associated with the Merger may cause a loss of our management personnel and other key employees, which could adversely affect our business and operations.

ICE and we are dependent on the experience and industry knowledge of our officers and other key employees to execute our business plans. Prior to completion of the Merger, current and prospective employees of ours and ICE may experience uncertainty about their roles within ICE following the completion of the Merger, which may have an adverse effect on ICE’s and our ability to attract or retain key management and other key personnel and could adversely affect our business and operations.

Litigation related to the Merger could prevent or delay completion of the Merger or otherwise negatively affect ICE’s and our businesses and operations.

ICE and we may incur costs in connection with the defense or settlement of any stockholder or other lawsuits filed in connection with the Merger. Such litigation could have an adverse effect on ICE’s and our financial condition and results of operations and could prevent or delay the completion of the Merger.

ICE and we are expected to incur significant costs related to the Merger and integration.

ICE and we have incurred and expect to incur substantial expenses in connection with the completion of the Merger. The substantial majority of these costs will be non-recurring expenses related to the Merger, including investment banking fees, legal fees and costs associated with financing the Merger, accounting, consulting and other advisory fees, severance/employee benefit-related costs, and other regulatory fees. ICE and we will also incur transaction fees and costs related to formulating integration plans for our combined mortgage services businesses. Some of these costs are payable regardless of whether the Merger is completed.

Risks Related to Our Business

We rely on our top clients for a significant portion of our revenues and profits, which makes us susceptible to the same macro-economic and regulatory factors that affect our clients. If these clients are negatively affected by economic or regulatory conditions or otherwise experience financial hardship or stress, or if we are unable to renew existing agreements or the terms of our relationships with these clients change, it could have a material adverse effect on us.

Our clients are in a relatively consolidated industry and, as a result, a small number of our clients have accounted for a significant portion of our revenues. We expect that a limited number of our clients will continue to represent a significant portion of our revenues for the foreseeable future. The significant portion of our revenues that a limited number of our clients currently represent may increase in the future. During the year ended December 31, 2022, our five largest clients accounted for approximately 23% of our consolidated revenues.

Many of our relationships with these clients are long-standing and are important to our business and results of operations, but there is no guarantee that we will be able to retain or renew existing agreements or maintain our relationships on acceptable terms or at all. Additionally, we rely on cross-selling our products and services to our existing clients as a source of growth. The deterioration in or termination of any of these relationships could significantly reduce our revenues and could have a material adverse effect on our business, financial condition and results of operations. As a result, we may be disproportionately affected by declining revenues from, or loss of, a significant client. In addition, by virtue of their significant relationships with us, these clients may be able to exert pressure on us with respect to the pricing of our services.

20

Table of Contents

The time and expense associated with switching from our competitors’ software and services to ours may limit our growth.

The costs for a mortgage lender or servicer to switch providers of software, data and analytics solutions and services can be significant and the process can take 12 to 18 months, or longer, to complete. As a result, potential clients may decide that it is not worth the time and expense to begin using our solutions and services, even if we offer competitive and economic advantages. If we are unable to convince these prospective clients to switch to our software and services, our ability to increase market share will be limited, which could have a material adverse effect on our growth.

We typically provide service level commitments under our client contracts, including commitments to provide high-quality technical support services. If we fail to meet these contractual commitments, it may adversely affect our reputation and relationship with our clients or we could face contract terminations, which could have a material adverse effect on us.

Our client agreements typically provide service level commitments measured on a daily and monthly basis. If we are unable to meet the stated service level commitments or suffer extended periods of unavailability for our applications, we may be contractually obligated to provide these clients with service credits or refunds or we could face contract terminations. If we suffer unscheduled downtime that exceeds the allowed downtimes under our agreements with our clients or if we experience any extended service outages, it could have a material adverse effect on our business, financial condition and results of operations.

In addition, our sales process is highly dependent on our applications and business reputation and on positive recommendations from our existing clients. Any failure to maintain high-quality technical support, or a market perception that we do not maintain high-quality support, could adversely affect our reputation and our ability to sell our applications to existing and prospective clients, any of which could have a material adverse effect on our business, financial condition and results of operations.

Our clients and we are subject to various governmental regulations, and a failure to comply with governmental regulations or changes in these regulations, including changes that may result from changes in the political landscape, could result in penalties, restrict or limit our or our clients’ operations or make it more burdensome to conduct such operations.

Many of our clients’ and our businesses are subject to various federal, state, local and foreign laws and regulations. Our failure to comply with applicable laws and regulations could restrict our ability to provide certain services or result in imposition of civil fines and criminal penalties, substantial regulatory and compliance costs, litigation expense, adverse publicity and loss of revenues.

As a provider of electronic data processing to financial institutions, such as banks and credit unions, we are subject to regulatory oversight and examination by the FFIEC, the CFPB, the federal banking agencies and various other federal and state regulatory authorities. We also may be subject to possible review by state agencies that regulate banks in each state in which we conduct our electronic processing activities.

In addition, our businesses are subject to an increased degree of compliance oversight by regulators and by our clients. Specifically, the CFPB has authority to write rules affecting the business of, supervise, conduct examinations of and enforce compliance with federal consumer financial laws and regulations with respect to certain "non-depository covered persons" determined by the CFPB to be "larger participants" that offer consumer financial products and services. The CFPB and the prudential financial institution regulators, such as the OCC, also have the authority to examine us in our role as a service provider to large financial institutions. In addition, we believe some of our largest bank clients’ regulators are requiring the banks to exercise greater oversight and perform more rigorous audits of their key service providers such as us.

The Real Estate Settlement Procedures Act ("RESPA") and related regulations generally prohibit the payment or receipt of fees or any other item of value for the referral of real estate-related settlement services. RESPA also prohibits fee shares or splits or unearned fees in connection with the provision of residential real estate settlement services, such as

21

Table of Contents

mortgage brokerage and real estate brokerage. Notwithstanding these prohibitions, RESPA permits payments for goods furnished or for services actually performed, so long as those payments bear a reasonable relationship to the market value of the goods or services provided. RESPA and related regulations may to some extent restrict our real estate-related businesses from entering into certain preferred alliance arrangements. The CFPB is responsible for enforcing RESPA.

Changes to laws and regulations and regulatory oversight of our clients and us, including those that may result from changes in the political landscape, may cause us to increase our prices in certain situations or decrease our prices in other situations, may restrict our ability to implement price increases or otherwise limit the manner in which we conduct our business. We may also incur additional expense in keeping our software solutions services up to date as laws and regulations change, and we may not be able to pass those additional costs on to our clients. In addition, in response to increased regulatory oversight, participants in the mortgage lending industry may develop policies pursuant to which they limit the extent to which they can rely on any one vendor or service provider. Conversely, in an environment with less stringent regulatory oversight, prospective clients may choose to retain their in-house platforms, or current service providers, or seek alternative service providers who provide services that are less compliance and quality oriented at a lower price point. If we are unable to adapt our products and services to conform to increased or evolving laws and regulations, or if these laws and regulations have a negative effect on our clients, we may experience client losses or increased operating costs, which could have a material adverse effect on our business, financial condition and results of operations.

There may be consolidation in our end client market, which could reduce the use of our services by our clients.

Consolidation among existing or potential clients could reduce the number of our clients and potential clients. If our clients merge with, are acquired by or sell their servicing portfolios to other entities that are not our clients, or that use fewer of our services, they may discontinue or reduce their use of our services. In addition, if potential clients merge, our ability to increase our client base may be adversely affected and the ability of our clients to exert pressure on our pricing may increase. Any of these developments could have a material adverse effect on our business, financial condition and results of operations.

Participants in the mortgage loan industry are subject to efforts by the government to regulate the mortgage loan industry or address the mortgage loan market and current economic environment.

The mortgage loan industry is heavily regulated and continues to be subject to review by governmental authorities. Inquiries may include federal and state governmental review of all aspects of the mortgage lending business. Such efforts may include actions to address the housing market and the economy in general and to maintain rigorous mortgage loan servicing standards.

Additional state and federal government actions directed at housing and the mortgage loan industry may occur and could have a material adverse effect on our business, financial condition and results of operations.

Our clients’ relationships with government-sponsored enterprises ("GSEs") are subject to change.

Our clients have significant relationships with Fannie Mae and Freddie Mac, which are GSEs tasked with working with financial institutions to provide liquidity to the mortgage loan market. The GSEs do this by purchasing loans from the lenders either for cash or in exchange for mortgage-backed securities that are backed by those loans and that, for a fee, carry the GSEs’ guarantee of timely payment of interest and principal to investors of those mortgage-backed securities. Because our clients service the loans owned by GSEs, we provide solutions and services for many of those loans. As a result of these relationships, GSEs have been able to implement changes to our pricing structure on certain products and services we provide. GSEs or other governmental agencies may be able to exert similar pressure on the pricing of our solutions and services in the future, which could have a material adverse effect on our business, financial condition and results of operations.

If we fail to adapt our solutions to technological changes or evolving industry standards and regulations, or if our ongoing efforts to upgrade, modernize or innovate our technology are not successful, we may not be able to achieve our growth strategies and we could lose clients and have difficulty attracting new clients for our solutions.

22

Table of Contents

The markets for our solutions are characterized by constant technological changes, frequent introductions of new products and services and evolving industry standards and regulations. Our growth strategies and future success will be significantly affected by our ability to successfully enhance our current solutions, and to develop and introduce new solutions and services that address the increasingly sophisticated needs of our clients and their customers. These initiatives carry the risks associated with any new product or service development effort, including cost overruns, delays in delivery and performance issues. There can be no assurance that we will be successful in developing, marketing and selling new solutions and services that meet these changing demands, that we will not experience difficulties that could delay or prevent the successful development, introduction and marketing of these solutions and services or that our new solutions and services and their enhancements will adequately meet the demands of the marketplace and achieve market acceptance. If our efforts are unsuccessful, it could have a material adverse effect on our business, financial condition and results of operations.

We operate in a competitive business environment and, if we are unable to compete effectively, it could have a material adverse effect on us.

The markets for our solutions are intensely competitive. Our competitors vary in size and in the scope and breadth of the services they offer. Some of our competitors have substantial resources. In addition, we expect that the markets in which we compete will continue to attract new competitors and new technologies. There can be no assurance that we will be able to compete successfully against current or future competitors or that competitive pressures we face in the markets in which we operate will not have a material adverse effect on our business, financial condition and results of operations.

Further, because many of our larger existing or potential clients have historically developed their key processing applications in-house, and therefore, view their system requirements from a make-versus-buy perspective, we often compete against our existing or potential clients’ in-house capabilities. As a result, gaining new clients in our servicing and origination software businesses can be difficult. For banks and other potential clients, switching from an internally-designed system to an outside vendor, or from one vendor of servicing and origination software services to a new vendor, is a significant undertaking. These potential clients worry about possible disadvantages such as loss of custom functionality, increased costs and business disruption. As a result, these potential clients often resist change. There can be no assurance that our strategies for overcoming potential clients’ reluctance to change will be successful, and if we are unsuccessful, it could have a material adverse effect on our business, financial condition and results of operations.

To the extent the availability of free or relatively inexpensive information increases, the demand for some of our data and information solutions may decrease.

Public sources of free or relatively inexpensive information have become increasingly available, particularly through the Internet, and this trend is expected to continue. Governmental agencies in particular have increased the amount of information to which they provide free public access. Public sources of free or relatively inexpensive information may reduce demand for, or the price that clients are willing to pay for, our data and information solutions. To the extent that clients choose not to obtain data and information from us and instead rely on information obtained at little or no cost from these public sources, it could have a material adverse effect on our business, financial condition and results of operations.

We rely upon proprietary technology and information rights, and if we are unable to protect our rights, it could have a material adverse effect on us.

Our success depends, in part, upon our intellectual property rights. We rely primarily on a combination of patents, copyrights, trade secrets, trademark laws, nondisclosure and other contractual restrictions on copying, distribution and creation of derivative products to protect our proprietary technology and information. This protection is limited, and our intellectual property could be used by others without our consent. In addition, patents may not be issued with respect to our pending or future patent applications, and our patents may not be upheld as valid or may not prevent the development of competitive products. Any infringement, disclosure, loss, invalidity of or failure to protect our intellectual property could have a material adverse effect on our business, financial condition and results of operations. Moreover, litigation may be necessary to enforce or protect our intellectual property rights, to protect our trade secrets or to determine the validity and scope of the proprietary rights of others. Such litigation could be time-consuming, result in substantial costs

23

Table of Contents

and diversion of resources and could have a material adverse effect on our business, financial condition and results of operations.

If our applications, solutions, including those that contain "open source" software, or services are found to infringe the proprietary rights of others or fail to comply with the terms of one or more of these open source licenses, we may be required to change our business practices and may also become subject to significant costs and monetary penalties.

We use a limited amount of software licensed by its authors or other third parties under so-called “open source” licenses and may continue to use such software in the future. Some of these licenses contain requirements that we make available source code for modifications or derivative works we create based upon the open source software, and that we license such modifications or derivative works under the terms of a particular open source license or other license granting third parties certain rights of further use. By the terms of certain open source licenses, we could be required to release the source code of our proprietary software if we combine our proprietary software with open source software in a certain manner. Additionally, the terms of many open source licenses have not been interpreted by the United States or other courts, and there is a risk that these licenses could be construed in a manner that could impose unanticipated conditions or restrictions on our ability to commercialize our solutions. In addition to risks related to license requirements, usage of open source software can lead to greater risks than use of third-party commercial software, as open source licensors generally do not provide warranties or controls on origin of the software. We cannot be sure that all open source software is submitted for approval prior to use in our solutions. In addition, many of the risks associated with using open source software cannot be eliminated, and could, if not properly addressed, have a material adverse effect on our business, financial condition and results of operations.

As our information technology applications and services develop, we may become increasingly subject to infringement claims. Any such claims, whether with or without merit, could:

be expensive and time-consuming to defend;
cause us to cease providing solutions that incorporate the challenged intellectual property;
require us to redesign our solutions, if feasible;
divert management’s attention and resources; and
require us to enter into royalty or licensing agreements in order to obtain the right to use necessary technologies.

Any one or more of the foregoing outcomes could have a material adverse effect on our business, financial condition and results of operations. Additionally, we may be liable for damages for past infringement if a court determines that our software or technologies infringe upon a third party’s patent or other proprietary rights.

We depend on our ability to access data from external sources to maintain and grow our businesses. If we are unable to access needed data from these sources or if the prices charged for these services increase, the quality, pricing and availability of our solutions may be adversely affected.

We rely extensively upon data from a variety of external sources to maintain our proprietary and non-proprietary databases, including data from third-party suppliers, various government and public record sources and data contributed by our clients. Our data sources could cease providing or reduce the availability of their data to us, increase the price we pay for their data or limit our use of their data for a variety of reasons, including legislatively or judicially imposed restrictions on use. If a number of suppliers are no longer able or are unwilling to provide us with certain data, or if our public record sources of data become unavailable or too expensive, we may need to find alternative sources. If we are unable to identify and contract with suitable alternative data suppliers and efficiently and effectively integrate these data sources into our service offerings, we could experience service disruptions, increased costs and reduced quality of our services. Moreover, some of our data suppliers compete with us in certain product offerings, which may make us vulnerable to unpredictable price increases from them. Significant price increases could require us to seek other sources of data on more favorable economic terms, which may not be available at all. Loss of such access or the availability of data in the future on commercially reasonable terms or at all may reduce the quality and availability of our services and solutions, which could have a material adverse effect on our business, financial condition and results of operations.

24

Table of Contents

Our international operations and third-party service providers subject us to additional risks.

We have sought to reduce our costs by utilizing lower-cost labor outside the United States. Our international operations are based solely in India with approximately 1,800 employees. In addition, we have limited engagements with off-shore third-party service providers. Other countries may be subject to higher degrees of political and social instability than the United States and may lack the infrastructure to withstand political unrest, natural disasters or pandemics. Such disruptions, including supply chain disruptions, can affect our ability to deliver our solutions on a timely basis, if at all, and to a lesser extent can decrease efficiency and increase our costs. Weakness of the U.S. dollar in relation to the currency used and higher inflation rates experienced in other countries may also reduce anticipated savings. Furthermore, the practice of utilizing labor based in foreign countries has come under increased scrutiny in the United States and, as a result, many of our clients may require us to use labor based in the United States. We may not be able to pass on the increased costs of higher-priced United States-based labor to our clients, which could have a material adverse effect on our business, financial condition and results of operations.

In addition, other countries could adopt new legislation or regulations that could make it difficult, more costly or impossible for us to continue our foreign activities as currently being conducted. In addition, in many foreign countries, particularly in those with developing economies, it is common to engage in business practices that are prohibited by laws and regulations applicable to us, such as the Foreign Corrupt Practices Act ("FCPA") or other local anti-corruption laws. Any violations of FCPA or local anti-corruption laws by us or our subsidiaries, could result in substantial financial and other penalties, which could have a material adverse effect on our business, financial condition and results of operations.

We may experience system failures or service interruptions that could harm our business and reputation and expose us to potential liability.

We depend heavily upon the computer systems and our existing technology infrastructure located in our data centers. Certain system interruptions or events beyond our control could interrupt or terminate the delivery of our solutions and services to our clients and may interfere with our suppliers’ ability to provide necessary data to us and our employees’ ability to perform their responsibilities.

These potential interruptions include, but are not limited to, damage or interruption from hurricanes, floods, fires, power losses, telecommunications outages, cyber-based attacks, ransomware attacks, terrorist attacks, acts of war, human errors and similar events. Our corporate offices and one of our data centers are located in Jacksonville, Florida, which is an area that is at high risk of hurricane and flood damage. Climate change is believed to be linked to severe weather events across the country and the potential for increases in the frequency or intensity of such events. In addition, acts of terrorism, which may be targeted at metropolitan areas that have higher population density than rural areas, could cause disruptions in our business or the economy as a whole. The servers that we use through various third-party service providers may also be vulnerable to similar disruptions, which could lead to interruptions, delays and loss of critical data. Such service providers may not have sufficient protection or recovery plans in certain circumstances, and our insurance may not be sufficient to compensate us for losses that may occur.

Defects in our software solutions, errors or delays in the processing of electronic transactions, or other difficulties could result in:

interruption of business operations;
delay in market acceptance;
us, or our clients, missing a regulatory deadline;
additional development and remediation costs;
diversion of technical and other resources;
loss of clients;
negative publicity; or
exposure to liability claims.

25

Table of Contents

Any one or more of the foregoing occurrences could have a material adverse effect on our business, financial condition and results of operations. Although we attempt to limit our potential liability through disclaimers and limitation-of-liability provisions in our client agreements, we cannot be certain that these measures will be successful in limiting our liability.

We may experience delays or difficulty in developing or implementing new, enhanced or existing software, data or hosting solutions, which may negatively affect our relationships with existing and potential clients, reduce or delay the generation of revenues or increase development and implementation costs.

Our future financial performance depends upon the successful development, implementation and client acceptance of new, existing and enhanced versions of our software and hosting solutions. We continually seek to develop enhancements to our solutions, including updates in response to changes in applicable laws, as well as new offerings to supplement our existing solutions. As a result, we are subject to the risks inherent in the development and integration of new technologies, including defects or undetected errors in our software solutions, difficulties in installing or integrating our technologies on platforms used by our clients or other unanticipated performance, stability and compatibility problems. Any of these problems could result in material delays in the introduction or acceptance of our solutions, increased costs, decreased client satisfaction, breach of contract claims, harm to our industry reputation and reduced or delayed revenues. If we are unable to implement existing solutions or deliver new solutions or upgrades or other enhancements to our existing solutions on a timely and cost-effective basis, it could have a material adverse effect on our business, financial condition and results of operations.

In addition, as a significant focus of our sales efforts is on the top U.S. mortgage loan originators and servicers, larger clients may demand more complex integration, implementation services and features, which may result in implementations that take longer than we forecast or delays in these clients using our solutions. Furthermore, if implementations take longer than planned or these clients delay their use of our solutions, we may be required to delay revenue recognition on some of these transactions until the technical or implementation requirements have been met, and we may not generate revenues from these clients as quickly as we had forecast.

Because our revenues from clients in the mortgage lending industry are affected by the strength of the economy and the housing market generally, including the effect of interest rates, levels of inflation and the volume of real estate transactions, a change in any of these conditions could have a material adverse effect on us.

Our revenues are primarily generated from software and hosting solutions, professional services and data solutions we provide to the mortgage loan industry and, as a result, a weak economy or housing market may have a material adverse effect on our business, financial condition and results of operations. The volume of mortgage loan origination and residential real estate transactions is highly variable and reductions in these transaction volumes could have a direct effect on the revenues we generate from our software solutions business and some of our data and analytics businesses.

The revenues we generate from our servicing software solutions primarily depend upon the total number of mortgage loans processed on MSP®, which tends to be comparatively consistent regardless of economic conditions. However, in the event that a difficult economy or other factors lead to a decline in levels of home ownership and a reduction in the number of mortgage loans outstanding and we are not able to counter the effect of those events with increased market share or higher fees, our MSP® revenues could be adversely affected.

In addition, some of our origination software solutions are exposed to variances in origination volumes, primarily related to refinance volumes due to the nature of the services provided. Our data and analytics solutions that are more sensitive to fluctuations in home buying activity and origination volumes primarily relate to services where we provide data necessary for tax data and other settlement service activities. Given the current interest rate environment and high levels of inflation, we have seen lower origination volumes as well as certain adverse effects on the performance and financial condition of some of our clients, which have had an adverse effect on our business and results of operations. The recent sharp decline in origination volumes has led some clients to reduce the size of their mortgage loan workforce, exit certain mortgage operations or go out of business. Such conditions may continue and result in increased negative economic conditions, increased unemployment or a prolonged downturn in other general economic factors, which could have a material adverse effect on our business, financial condition or results of operations.

26

Table of Contents

A weaker economy and housing market tend to increase the volume of consumer mortgage loan defaults, which can increase revenues from our applications focused on supporting default management functions. However, government regulation of the mortgage loan industry in general, and the default and foreclosure process in particular, has greatly slowed the processing of defaulted mortgage loans and has changed the way many of our clients address mortgage loans in default. A downturn in the origination market and a concurrent slowdown or change in the way mortgage loans in default are addressed could have a material adverse effect on our business, financial condition and results of operations.

We may fail to attract and retain enough qualified employees, including those with client relationships or support our technology and operations, which could have an adverse effect on our ability to expand our business and service our clients.

Our business relies on large numbers of skilled employees, and our success depends on our ability to attract, train and retain a sufficient number of qualified employees. There has been more competition for talent, wage inflation, benefit offerings and higher levels of workforce mobility. If our attrition rate increases, our operating efficiency and productivity may decrease. We will need to increase our hiring and will incur additional expenses related to retention if we are not able to maintain our attrition rate through our current recruiting and retention policies. We compete for employees not only with other companies in our industry but also with companies in other industries, such as software services, engineering services and financial services companies, and there is a limited pool of employees who have the client relationships, skills and training needed to do our work. If our business continues to grow, the number of people we will need to hire may increase. Increased competition for employees could have a material adverse effect on our ability to expand our business and service our clients, as well as cause us to incur greater personnel expenses and training costs.

The extent to which health epidemics affect our business, results of operations, liquidity and financial condition will depend on future developments, which are highly uncertain and are difficult to predict.

Our business and operations could be adversely affected by health epidemics impacting the industries and communities in which we and our clients, suppliers and business partners operate. Such epidemics may result in authorities taking various steps to mitigate anticipated health and/or economic effects, but there can be no assurance that such steps will be effective or achieve their desired results in a timely fashion. We may experience financial impacts that are difficult to foresee or measure.

The spread of epidemics may cause us to modify our business practices, including restricting employee travel, developing social distancing plans for our employees and limiting physical participation in meetings, events and conferences, and we may take further actions as may be required by government authorities or as we determine are in the best interests of our employees, clients and business partners. We will be unable to predict the extent to which we will need to continue these practices or further modify our business practices to address future surges and variants. There is no certainty that such measures will be sufficient to mitigate the risks posed by the epidemic or will otherwise be satisfactory to government authorities. The effects could have a material adverse effect on our business, financial condition and results of operations even after the epidemic has subsided.

Risks Related to Our Investment in DNB

Our investment in DNB may expose us to certain risks, which could have a material adverse effect on our financial condition and results of operations.

As of December 31, 2022, we owned approximately 18.5 million shares of DNB common stock for an ownership interest of approximately 4% of DNB’s common stock and the after-tax fair value of our investment was $211.0 million based on DNB’s closing stock price of $12.26 on December 31, 2022 and assuming a statutory tax rate of 25.5%. Market volatility or further decline in DNB’s stock price may result in us not realizing our expected return on investment, or a negative return on investment. Refer to Note 4 to the Notes to Consolidated Financial Statements for additional information about our investment in DNB.

27

Table of Contents

Risks Related to Cybersecurity and Data Privacy

If we are unable to protect our information systems against data corruption, cyber-based attacks or network security breaches, including breaches involving third-party vendors, or if we are unable to provide adequate security in the electronic transmission of sensitive data, it could have a material adverse effect on us.

We are highly dependent on information technology networks and systems, including the Internet, to securely process, transmit and store electronic information. Security breaches of this infrastructure, including physical or electronic break-ins, computer viruses, attacks by hackers and similar breaches, and the evolving threat landscape can create system disruptions, shutdowns or unauthorized disclosure of confidential information, including non-public personal information, consumer data and proprietary business information. Cyber-based attacks, including ransomware attacks to extort payment in return for the release of sensitive information, are increasing in frequency and sophistication. Unauthorized access, including through use of fraudulent schemes such as "phishing" schemes, could jeopardize the security of information stored in our systems. In addition, malware or viruses could jeopardize the security of information stored or used in a user’s computer and other personal devices. If we are unable to prevent or detect such security or privacy breaches or our third-party vendors are unable to prevent or detect such breaches, our operations could be disrupted, or we may suffer loss of reputation, financial loss, lawsuits and regulatory-imposed restrictions and penalties because of lost or misappropriated information, including sensitive consumer data, which could have a material adverse effect on our business, financial condition and results of operations. Likewise, our clients are increasingly imposing more stringent contractual obligations on us relating to our information security protections. If we are unable to maintain protections and processes at a level commensurate with that required by our large clients, it could negatively affect our relationships with those clients, increase our operating or litigation costs or subject us to liability under those contractual obligations, which could have a material adverse effect on our business, financial condition and results of operations.

Our policies and procedures, including those related to cybersecurity, may prove inadequate for the risks we face.

We have devoted significant resources to develop our policies and procedures, including those related to cybersecurity, and expect to continue to do so in the future. Nonetheless, our strategies may not be fully effective in mitigating our risk exposure in all market environments or against all types of risk, including risks that are unidentified or unanticipated. If our solutions change and as the markets in which we operate evolve, our strategies may not always adapt to such changes. Some of our methods of managing risk are based upon our use of observed historical market behavior and management’s judgment. Other of our methods of managing risk depend on the evaluation of information regarding markets, customers, catastrophe occurrence or other matters that are publicly available or otherwise accessible to us. This information may not always be accurate, complete, up-to-date or properly evaluated. As a result, these methods may not predict future risk exposures, which could be significantly greater than the historical measures or available information indicate. In addition, management of operational, legal and regulatory risks requires, among other things, policies and procedures to record and verify large numbers of transactions and events, which may not be fully effective. While we employ a broad and diversified set of risk monitoring and risk mitigation techniques, those techniques and the judgments that accompany their application cannot anticipate every economic and financial outcome or the timing of such outcomes. If our efforts are ineffective, we could suffer losses that could have a material adverse effect on our business, financial condition and results of operations. In addition, we could be subject to litigation, particularly from our clients, and sanctions or fines from regulators.

Regulatory developments with respect to use of consumer data and public records could have a material adverse effect on us.

Because our databases include certain public and non-public personal information concerning consumers, we are subject to government regulation and potential adverse publicity concerning our use of consumer data. We acquire, store, use and provide many types of consumer data and related services that are subject to regulation under the Fair Credit Reporting Act, the Gramm-Leach-Bliley Act, the Driver’s Privacy Protection Act and, to a lesser extent, various other federal, state and local laws and regulations. These laws and regulations are designed to protect the privacy of consumers and to prevent security breaches, cyber-based attacks, other unauthorized access and misuse of personal information in the marketplace. Our failure to comply with these laws, or any future laws or regulations of a similar nature, could result in

28

Table of Contents

substantial regulatory penalties, litigation expense and loss of revenues, which could have a material adverse effect on our business, financial condition and results of operations.

In addition, some of our data suppliers face similar regulatory requirements and, consequently, they may cease to be able to provide data to us or may substantially increase the fees they charge us for this data, which may make it financially burdensome or impossible for us to acquire data that is necessary to offer our products and services. Further, many consumer advocates, privacy advocates and government regulators believe that existing laws and regulations do not adequately protect privacy or ensure the accuracy of consumer-related data.

As a result, multiple consumer privacy laws have been implemented at the state level which regulate the acquisition, dissemination, and commercial use of personal information. These consumer privacy laws include the CCPA, as modified by the CPRA; the VCDPA; the CPA; the CTDPA; and the UCPA.  Generally, these laws seek to implement further regulations on the acquisition, dissemination, and commercial use of personal information and also contemplate requirements relative to data accuracy, the ability of consumers to opt out of certain processing of personal information, the right to access personal information and to obtain a copy, and the right to delete personal information in certain circumstances. These laws are directly applicable to our clients as well as to us in certain circumstances and are applicable to us in a reduced capacity when we act as service providers to our clients.  

Laws such as the Vermont Data Broker Law also place restrictions and requirements on the use of publicly available data, and laws such as the NY DFS Cybersecurity Regulation provide for certain security requirements surrounding the collection and maintenance of certain business and consumer nonpublic personal information. Complying with varying jurisdictional requirements could increase the cost and complexity of compliance. Any future laws, regulations or other restrictions limiting the dissemination or use of personal information may reduce the quality and availability of our solutions and services, which could have a material adverse effect on our business, financial condition and results of operations. Further, violations of privacy laws can result in significant penalties and damage to our brand and business.

Our reliance on third parties subjects us to risk and may disrupt or adversely affect our operations. In addition, we may not realize the full benefit of our third-party arrangements, which may result in increased costs, or may adversely affect the service levels we are able to provide our clients.

We rely upon third parties for various business process and technology-related products and services, including cloud providers and cloud hosted software solutions. Although we have contractual provisions with our providers that specify performance requirements, we do not ultimately control their performance, which may make our operations vulnerable to their performance failures and supply chain constraints. In addition, our failure to adequately monitor and regulate the performance of our third-party vendors could subject us to additional risk. Reliance on third parties also makes us vulnerable to changes in our vendors’ businesses, including price increases related to the current levels of inflation, financial condition and other matters outside of our control, including their violations of laws or regulations, which could increase our exposure to liability or otherwise increase the costs associated with the operation of our business. If for any reason our relationship with any of these third parties, including cloud-based providers, were to end unexpectedly, it could require a significant amount of cost and time to transition to new third-party service providers. The failure of our providers to perform as expected or as contractually required could result in significant disruptions and costs to our operations and to the services we provide to our clients, or could result in loss of revenues, which could have a material adverse effect on our business, financial condition and results of operations.

Risk Related to Our Structure

Certain executive officers and members of our Board of Directors have interests and positions that could present potential conflicts.

Certain executive officers and members of our Board of Directors serve on the Board of Directors of other entities or are employed by other entities. As a result of the foregoing, there may be circumstances where such persons may be subject to conflicts of interest with respect to matters potentially or actually involving or affecting us.

29

Table of Contents

We have in place a code of business conduct and ethics prescribing procedures for managing conflicts of interest and our chief compliance officer and audit committee are responsible for the review, approval or ratification of any potential conflicts of interest transactions. Additionally, we expect that interested directors will abstain from decisions with respect to conflicts of interest as a matter of practice. However, there can be no assurance that such measures will be effective, that we will be able to resolve all potential conflicts or that the resolution of any such conflicts will be no less favorable to us than if we were dealing with an unaffiliated third party.

Refer to Note 6 to the Notes to Consolidated Financial Statements for more information related to our related party relationships and transactions.

We are restricted from pursuing certain potential business opportunities under a non-competition agreement.

In connection with the Distribution, we entered into a non-competition agreement with FNF pursuant to which we agreed to certain restrictions on the scope of the business that we may conduct for the 10-year period following the Distribution, including that we are prohibited from (i) engaging in title generation/escrow services, appraisal or default and field services work (other than technology solutions for such settlement services) without the prior written consent of FNF (subject to an exception allowing us to acquire a business engaged in such restricted services if at least 90% of such business’ revenues is contributed by activities other than such restricted services) and (ii) engaging in certain transactions, such as a merger, sale of assets or sale of greater than 5% of its equity interests, with a buyer that derives 10% or more of its revenues from such restricted services. Although we do not presently engage in any of these restricted services and our current business is not restricted, as a result of these restrictions, we may have to forgo certain transactions that might have otherwise been advantageous in compliance with our obligations under the non-competition agreement.

In particular, the restriction on engaging in a merger, sale of assets or sale of greater than 5% of its equity interests with a buyer that derives 10% or more of its revenues from restricted services may discourage a third party engaged in such restricted services from pursuing such a transaction with us during the 10-year period following the Distribution.

General Risk Factors

If we are unable to successfully consummate acquisitions or experience delays in integrating acquisitions, it could have a material adverse effect on us.

One of our strategies to grow our business is to opportunistically acquire complementary businesses, technologies and services. This strategy will depend on our ability to find suitable acquisitions and may depend on financing them on acceptable terms. We may require additional debt or equity financing for future acquisitions and doing so may be made more difficult by our indebtedness. Raising additional capital for acquisitions through debt financing could result in increased interest expense and may involve agreements that include covenants limiting or restricting our ability to take certain actions, such as incurring additional debt, making capital expenditures or declaring dividends. If we raise additional capital for acquisitions through equity financing, the ownership interests of existing shareholders will be diluted.

If we are unable to acquire suitable acquisition candidates, we may experience slower growth. Further, we may face challenges in integrating any acquired business. These challenges may include eliminating redundant operations, facilities and systems, coordinating management and personnel, retaining key employees, managing different corporate cultures, integrating relationships with clients, vendors and business partners while achieving revenue synergies, cost reductions and cross-selling opportunities. Acquisitions involve numerous operational, strategic, financial, accounting, legal, tax and other risks, including potential liabilities associated with acquired businesses. Difficulties in integrating acquisitions and our ability to manage the combined company may result in the combined company performing differently than expected, in operational challenges or in the delay or failure to realize anticipated revenue synergies and cost-related efficiencies and could have an adverse effect on our financial condition, results of operations or cash flows.

Additionally, the acquisition and integration processes may disrupt our business and divert management attention and our resources. If we fail to successfully integrate acquired businesses, products, technologies and personnel, it could impair relationships with employees, clients and strategic partners, distract management attention from our core businesses, result in control failures and otherwise disrupt our ongoing business, any of which could have a material adverse effect on our

30

Table of Contents

business, financial condition and results of operations. The anticipated benefits and cost savings of an acquisition may not be realized fully or at all, may take longer to realize than expected or could have other adverse effects that we do not currently foresee. In addition, we may be required to record future charges for impairment of goodwill and other intangible assets resulting from such acquisitions.

We have substantial investments in recorded goodwill and other intangible assets, and an extended economic downturn or troubled mortgage market could cause these investments to become impaired.

Goodwill and other intangible assets are assessed for impairment annually or whenever changes in circumstances indicate that the carrying amount may not be recoverable. Factors that may indicate the carrying value of our intangible assets, including goodwill, may not be recoverable include, but are not limited to, significant underperformance relative to historical or projected future results of operations, a significant decline in our stock price and market capitalization, and negative industry or economic trends. However, if there is an extended economic downturn in the future, the carrying amount of our goodwill or other intangible assets may no longer be recoverable, and we may be required to record an impairment charge, which could have a material adverse effect on our results of operations.

Our indebtedness could have a negative effect on our financing options and liquidity position, and certain of our financing arrangements subject us to various restrictions that could limit our operating flexibility.

As of December 31, 2022, we had approximately $2.7 billion of total debt outstanding.

Our indebtedness could have important consequences to us, including:

requiring us to use a portion of the money we earn to pay principal and interest on our debt, which could reduce the amount of money available to finance operations, acquisitions and other business activities;
exposing us to costs and risks associated with agreements limiting our exposure to higher interest rates, as such agreements may not offer complete protection from these risks, and subjecting us to the risk that one or more of the counterparties to these agreements may fail to satisfy their obligations under such agreements;
limiting our flexibility in planning for or responding to changing business and economic conditions, including increased competition, by causing us to have difficulty borrowing money in the future for working capital, capital expenditures, acquisitions or other purposes and possibly limiting our ability to pursue other business opportunities and implement certain business strategies;
imposing operating and financial restrictions on our activities, including compliance with, or maintenance of, certain financial tests and ratios, including a minimum interest coverage ratio and maximum leverage ratio, and limit or prohibit our ability to, among other things, take advantage of financing, mergers and acquisitions and other corporate opportunities; and
exposing us to possible losses in connection with our interest rate swaps that are indexed in LIBOR as result of proposed changes to LIBOR reporting practices or the pending replacement of LIBOR with an alternative reference rate.

Our ability to make scheduled payments on or refinance our debt obligations depends on our financial condition and results of operations, which are subject to prevailing economic and competitive conditions and to certain financial, business, legislative, regulatory and other factors beyond our control. Our inability to generate sufficient cash flows to satisfy our debt obligations, or to refinance our indebtedness on commercially reasonable terms or at all, could have a material adverse effect on our business, financial condition and results of operations. If we cannot make scheduled payments on our debt, we will be in default and holders of our outstanding debt could declare all outstanding principal and interest to be due and payable, and we could be forced into bankruptcy or liquidation. Risks associated with our indebtedness could have a material adverse effect on our business, financial condition and results of operations.

31

Table of Contents

Our senior leadership team is critical to our continued success, and the loss of such personnel could have a material adverse effect on us.

Our future success substantially depends on the continued service and performance of the members of our senior leadership team. These personnel possess business and technical capabilities that are difficult to replace. We have attempted to mitigate this risk by entering into long-term (two to three year) employment contracts with the members of our senior leadership team and providing long-term incentive compensation with multi-year vesting provisions. If we lose key members of our senior leadership team, we may not be able to effectively manage our current operations or meet ongoing and future business challenges, and this could have a material adverse effect on our business, financial condition and results of operations.

Current and future litigation, investigations or other actions against us could be costly and time consuming to defend.

We are from time to time subject to legal proceedings and claims that arise in the ordinary course of business, such as claims brought by our clients in connection with commercial disputes and employment claims made by our current or former employees.

On November 5, 2019, Black Knight Servicing Technologies, LLC (“BKST”), a wholly-owned indirect subsidiary of Black Knight, filed a Complaint and Demand for Jury Trial (the “Black Knight Complaint”) against PennyMac Loan Services, LLC (“PennyMac”). Shortly after the filing of the Black Knight Complaint, on November 6, 2019, PennyMac filed an Antitrust Complaint (the “PennyMac Complaint”) against Black Knight. Refer to Note 13 to the Notes to Consolidated Financial Statements for more information related to the PennyMac litigation matter.

Litigation can result in substantial costs and may divert management’s attention and resources, which may seriously harm our business, financial condition and results of operations. From time to time, we also receive requests for information from various state and federal regulatory authorities, some of which take the form of civil investigative demands or subpoenas. Some of these regulatory inquiries may result in the assessment of fines for violations of regulations or settlements with such authorities requiring a variety of remedies.

There can be no assurance that we will not incur additional material costs and expenses in connection with any potential future investigations or claims, including but not limited to fines or penalties and legal costs, or be subject to other remedies, any of which could have a material adverse effect on our business, financial condition and results of operations. Insurance may not cover or be sufficient for such investigations and claims and may not continue to be available on terms acceptable to us. An investigation or claim brought against us that is uninsured or underinsured could result in unanticipated costs, management distraction or reputational harm, which could have a material adverse effect on our business, financial condition and results of operations.

Our charter and bylaws and provisions of Delaware law may discourage or prevent strategic transactions, including a takeover of our company, even if such a transaction would be beneficial to our shareholders.

Provisions contained in our charter and bylaws and provisions of the Delaware General Corporation Law ("DGCL") could delay or prevent us from entering into a strategic transaction with a third party, as applicable, even if such a transaction would benefit our shareholders. For example, our charter and bylaws:

authorize the issuance of "blank check" preferred stock that could be issued by us upon approval of our Board of Directors to increase the number of outstanding shares of capital stock, making a takeover more difficult and expensive;
provide that directors elected prior to 2020 may be removed from office only for cause and that any vacancy on our Board of Directors may only be filled by a majority of our directors then in office, which may make it difficult for other shareholders to reconstitute our Board of Directors;
provide that special meetings of the shareholders may be called only upon the request of a majority of our Board of Directors or by the chairman of the Board of Directors or our chief executive officer; and
require advance notice to be given by shareholders for any shareholder proposals or director nominees.

32

Table of Contents

By virtue of not opting out of Section 203 of the DGCL in our amended and restated certificate of incorporation, we are subject to Section 203 of the DGCL, which prohibits a publicly held Delaware corporation from engaging in a "business combination" with an "interested stockholder" for a period of three years after the time the shareholder became an interested stockholder, subject to certain exceptions, including if, prior to such time, the board of directors approved the business combination or the transaction which resulted in the shareholder becoming an interested stockholder. "Business combinations" include mergers, asset sales and other transactions resulting in a financial benefit to the "interested stockholder." Subject to various exceptions, an "interested stockholder" is a person who, together with his or her affiliates and associates, owns or within three years did own 15% or more of the corporation’s outstanding voting stock. These restrictions generally prohibit or delay the accomplishment of mergers or other takeover or change of control attempts that are not approved by a company’s Board of Directors.

These restrictions and provisions could keep us from pursuing relationships with strategic partners and from raising additional capital, which could impede our ability to expand our business and strengthen our competitive position. These restrictions could also limit shareholder value by impeding a sale of us.

The market price of our common stock may be volatile, and you may lose all or part of your investment.

The market price of our common stock could fluctuate significantly, and you may not be able to resell your shares at or above the price at which your shares were acquired. Those fluctuations could be based on various factors, including those described above and the following:

the Merger Agreement may be terminated, the ICE Transaction may not be completed or regulatory approvals may not be received, may take longer than expected or may impose conditions that are not presently anticipated;
fluctuations in the market price of ICE’s common stock;
our operating performance and the performance of our competitors and fluctuations in our operating results;
the public’s reaction to our press releases, our other public announcements and our filings with the SEC;
changes in earnings estimates or recommendations by research analysts who follow us or other companies in our industry;
global, national or local economic, legal and regulatory factors unrelated to our performance;
announcements of positive news by us or our competitors, such as announcements of new products, services, strategic investments or acquisitions;
announcements of negative news by us or our competitors, such as announcements of poorer than expected results of operations, data breaches or significant litigation;
actual or anticipated variations in our or our competitors’ operating results, and our and our competitors’ growth rates;
failure by us or our competitors to meet analysts’ projections or guidance we or our competitors may give the market;
changes in laws or regulations, or new interpretations or applications of laws and regulations, that are applicable to our business;
the arrival or departure of key personnel;
the number of shares publicly traded;
future sales or issuances of our common stock, including sales, distributions or issuances by us, our officers or directors and our significant shareholders; and
other developments affecting us, our industry or our competitors.

In addition, in recent years the stock market has experienced significant price and volume fluctuations that have affected and continue to affect the market prices of equity securities of many companies. These fluctuations have often been unrelated or disproportionate to the operating performance of those companies. These broad market fluctuations, as well as general economic, political and market conditions such as recessions or interest rate changes, may cause declines in the market price of our common stock, and you may not realize any return on your investment in us and may lose some or all of your investment.

33

Table of Contents

As we primarily operate in a single industry, we are especially vulnerable to these factors to the extent that they affect our industry or our products. In the past, securities class action litigation has often been initiated against companies following periods of volatility in their stock price. This type of litigation could result in substantial costs and divert our management’s attention and resources and could also require us to make substantial payments to satisfy judgments or to settle litigation.

We do not intend to pay dividends for the foreseeable future.

We may retain future earnings, if any, for future operations, expansion and debt repayment. We have not paid cash dividends to date and have no current plans to pay any cash dividends for the foreseeable future. As a result of our current dividend policy, you may not receive any return on an investment in our common stock unless you sell our common stock for a price greater than that which you paid for it. Any future determination to declare and pay cash dividends will be at the discretion of our Board of Directors and will depend on, among other things, our financial condition, results of operations, cash requirements, contractual restrictions and such other factors as our Board of Directors deems relevant.

Item 1B.           Unresolved Staff Comments

None.

Item 2.           Properties

Our corporate headquarters is located in Jacksonville, Florida in an office building that we own. In addition, we own or lease other office space, data centers and other facilities in the United States and India.

Item 3.           Legal Proceedings

For a description of our legal proceedings, see Note 13 to the Notes to Consolidated Financial Statements included in Part II Item 8 of this Report, which is incorporated by reference into this Part I, Item 3.

Item 4.           Mine Safety Disclosures

Not applicable.

34

Table of Contents

PART II

Item 5.           Market for Registrant’s Common Equity, Related Shareholder Matters and Issuer Purchases of Equity Securities

Shares of our common stock are listed on the New York Stock Exchange ("NYSE") and trade under the symbol "BKI".

On January 31, 2023, the closing price of our common stock on the NYSE was $60.59 per share. We had 5,877 holders of record of our common stock as of January 31, 2023. The actual number of shareholders is greater than this number of record holders, and includes shareholders who are beneficial owners but whose shares are held in street name by brokers and other nominees.

There were no unregistered sales of equity securities during the years ended December 31, 2022, 2021 and 2020.

Within 120 days after the close of our fiscal year, we intend to file with the SEC a definitive proxy statement pursuant to Regulation 14A of the Exchange Act, which will include information concerning securities authorized for issuance under our equity compensation plans and other matters required by Items 10 through 14 of Part III of this Report.

Performance Graph

The following graph shows a comparison of the cumulative total return for our common stock, the S&P 500 Index and the S&P North American Technology Sector Index from December 31, 2017 through December 31, 2022. The data for the S&P 500 Index and the S&P North American Technology Sector Index assumes reinvestment of dividends. The graph assumes an initial investment of $100, and the cumulative returns are based on the market price as of each year-end. Note that historic stock price performance is not necessarily indicative of future stock price performance.

Graphic

*$100 invested on December 31, 2017 in Black Knight or each respective index, including reinvestment of dividends.

Copyright© 2022 Standard & Poor’s, a division of S&P Global. All rights reserved.

December 31,


2018


2019


2020


2021


2022

Black Knight

$

102

$

146

$

200

$

188

$

140

S&P 500 Index

$

96

$

126

$

149

$

192

$

157

S&P North American Technology Sector Index

$

103

$

147

$

213

$

269

$

174

35

Table of Contents

Item 6.            [Reserved]

Item 7.            Management’s Discussion and Analysis of Financial Condition and Results of Operations

The statements in the discussion and analysis regarding industry outlook, our expectations regarding the performance of our business, our liquidity and capital resources and the other non-historical statements are forward-looking statements. These forward-looking statements are subject to numerous risks and uncertainties, including, but not limited to, the risks and uncertainties described in "Risk Factors" and "Statement Regarding Forward-Looking Information." Our actual results may differ materially from those contained in or implied by the forward-looking statements. You should read the following discussion together with the sections entitled "Risk Factors," "Selected Historical Financial Data," "Liquidity and Capital Resources" and the consolidated financial statements and the related notes thereto included elsewhere in this Annual Report on Form 10-K.

Except as otherwise indicated or unless the context otherwise requires, all references to "Black Knight," the "Company," "we," "us" or "our" are to Black Knight, Inc., a Delaware corporation, and its subsidiaries ("BKI").

Overview

Black Knight is a premier provider of integrated, innovative, mission-critical, high-performance software solutions, data and analytics to the U.S. mortgage and real estate markets. Our mission is to transform the markets we serve by delivering innovative solutions that are integrated across the homeownership lifecycle and that result in realized efficiencies, reduced risk and new opportunities for our clients to help them achieve greater levels of success.

We believe our clients leverage our robust, integrated solutions across the entire homeownership lifecycle to help retain existing customers, gain new customers, mitigate risk and operate more efficiently. Our clients rely on our proven, comprehensive and scalable solutions and our unwavering commitment to delivering exceptional client support to achieve their strategic goals and better serve their customers.

We have a focused strategy of continuous innovation across our business, which is supported by acquisitions, and even more importantly, the integration of those acquisitions and our innovations into our broader ecosystem. Our ability to effectively manage our business and maintain a strong client base allows us to continually invest in our business, both to meet ever-changing industry requirements and to maintain our position as a leading provider of platforms for the mortgage and real estate markets.

Deep business and regulatory expertise along with a holistic view of the markets we serve allow us the privilege of being a trusted advisor to our clients, who range from the nation’s largest lenders and mortgage servicers to institutional portfolio managers and government entities, to individual real estate agents and mortgage brokers. Clients leverage our software ecosystem across a range of real estate and housing finance verticals through multiple digital channels, using our offerings to drive more business, reduce risk and deliver a best-in-class customer experience, all while operating more efficiently and cost-effectively.

We have long-standing relationships with our clients, a majority of whom enter into long-term contracts that include multiple, integrated products embedded into mission-critical processes. This speaks to the confidence our clients have in our solutions and our commitment to serve them. The contractual nature of our revenues and our client relationships make our revenues both highly visible and recurring in nature. Our scale and integrated ecosystem of solutions drive significant operating leverage and cross-sell opportunities, enabling our clients to continually benefit from new and greater operational efficiencies.

Our Markets

The Black Knight ecosystem stretches across four core “pillar” verticals: mortgage loan servicing, mortgage loan origination, real estate and capital markets; with our data and analytics flowing throughout the interconnected ecosystem of solutions. As we integrate our innovations and acquired technologies, we are committed to continually improving the

36

Table of Contents

end consumer experience, driving further efficiencies for our clients and helping them to win new customers and retain existing customers.

Recent Developments

Optimal Blue Transaction

On February 15, 2022, we entered into a purchase agreement with Cannae Holdings, LLC (“Cannae”) and Thomas H. Lee Partners, L.P. (“THL”) and acquired all of their Class A units of Optimal Blue Holdco, LLC (“Optimal Blue Holdco”), in exchange for aggregate consideration of 36.4 million shares of Dun & Bradstreet Holdings, Inc. (“DNB”) common stock valued at $722.5 million and $433.5 million in cash. The cash portion of the consideration was funded with borrowings under our revolving credit facility. The aggregate consideration of $1.156 billion and number of shares of DNB common stock paid to Cannae and THL was based on the 20-day volume-weighted average trading price of DNB for the period ended on February 14, 2022. Since February 15, 2022, we own 100% of the Class A units of Optimal Blue Holdco. Refer to Note 2 to the Notes to Consolidated Financial Statements for additional information.

Merger Agreement

On May 4, 2022, we entered into a definitive agreement to be acquired by Intercontinental Exchange, Inc. (“ICE”), a leading global provider of data, technology, and market infrastructure, in a transaction valued at approximately $13.1 billion, or $85 per share, with consideration in the form of a mix of cash (80%) and stock (20%) (the “ICE Transaction”). The aggregate cash consideration in the ICE Transaction consists of approximately $10.5 billion and the aggregate stock consideration was valued at approximately $2.6 billion based on ICE’s 10-day volume weighted average price as of May 2, 2022 of $118.09. The ICE Transaction is expected to close in the first half of 2023, subject to the receipt of regulatory approvals and the satisfaction of customary closing conditions. The ICE Transaction has been approved by the Boards of Directors of Black Knight and ICE, and Black Knight shareholders. Refer to Note 1 to the Notes to Consolidated Financial Statements for additional information.

TitlePoint Transaction

On November 18, 2022, we entered into a definitive agreement to sell our TitlePoint line of business (“TitlePoint”) within our Data and Analytics reporting segment to an affiliate of Fidelity National Financial, Inc. (“FNF”) for $225 million in cash, subject to a customary working capital adjustment. The TitlePoint transaction closed on January 1, 2023. Refer to Note 2 to the Notes of Consolidated Financial Statements for additional information.

For the year ended December 31, 2022, Revenues, Earnings before interest, tax, depreciation and amortization (“EBITDA”) and Operating income related to our TitlePoint line of business before intercompany allocated revenue and expenses were approximately $39 million, $24 million and $22 million, respectively.

Business Trends and Conditions

Market Trends

Market trends that have spurred lenders and servicers to seek software, data and analytics solutions are as follows:

Lenders increasingly focused on core operations. As a result of a decline in origination volumes and the increasing cost to originate a mortgage loan, we believe lenders have become more focused on their core operations, including ways to reduce or eliminate certain costs. According to the MBA Quarterly Performance Report as of November 21, 2022, the cost to originate a loan has more than doubled since 2008 and increased 22% in 2022 compared to 2021. We believe lenders are increasingly shifting from in-house solutions to third-party solutions that provide a more comprehensive and efficient solution. Lenders require these providers to deliver best-in-class solutions and deep domain expertise and to assist them in maintaining regulatory compliance.

37

Table of Contents

Integral role of technology in the U.S. mortgage market. Over the past decade, homebuyers’ processes have become more digital, and banks and other lenders and servicers have become increasingly focused on automation and workflow management to operate more efficiently and meet their regulatory requirements as well as using technology to enhance the consumer experience during the mortgage loan origination, closing, and servicing processes. Technology providers must be able to support the complexity and dynamic nature of the market, display extensive industry knowledge and possess the financial resources to make the necessary investments in technology and software to support lenders and servicers. This includes an enhanced digital experience along with the application of artificial intelligence, robotic process automation and adaptive learning.

Heightened demand for enhanced transparency and analytic insight. As the U.S. mortgage loan market participants work to minimize risk in lending, servicing and capital markets, they rely on the integration of data and analytics with solutions that enhance the decision-making process. These industry participants are eager for timely data and insights to help them plan and react to the changing environment.

Regulatory changes and oversight. Most U.S. mortgage loan market participants are subject to a high level of regulatory oversight and regulatory requirements as federal and state governments have enacted various new laws, rules and regulations. It is our experience that mortgage lenders and servicers have become more focused on minimizing the risk of non-compliance with regulatory requirements and look for solutions that assist them in complying with their regulatory requirements. We expect this trend to continue as additional governmental programs and regulations have been enacted to address the economic concerns resulting from the pandemic, and our clients have had to adapt their systems and processes in record time to the shifting landscape. In addition, our clients and our clients’ regulators have elevated their focus on privacy and data security in light of an increased level of cybersecurity incidents. We expect the industry focus on privacy and data security to continue to increase.

Our Business Segments

Our business is organized into two segments: Software Solutions and Data and Analytics.

Software Solutions

Our Software Solutions segment offers software solutions that support loan servicing, loan origination and settlement services. Our software solutions revenues were 86%, 85% and 84% of our consolidated revenues for the years ended December 31, 2022, 2021 and 2020, respectively.

The following table summarizes our software solutions revenues (in millions):


Year ended December 31, 

% of Segment Revenues

2022


2021


2020


2022

2021

2020

Servicing software solutions

$

883.8

$

838.9

$

777.7


66

%  

67

%

75

%

Origination software solutions


450.1


411.1


262.5


34

%  

33

%

25

%

Software Solutions

$

1,333.9

$

1,250.0

$

1,040.2


100

%  

100

%

100

%

Our servicing software solutions primarily include our core servicing software solution that automates loan servicing, including loan setup and ongoing processing, customer service, accounting, reporting to the secondary mortgage market and investors and web-based workflow information systems. Our servicing software solutions primarily generate revenues based on the number of active loans outstanding on our system, which has been very stable; however, we also generate revenues from foreclosure and bankruptcy volumes, which can fluctuate based on economic cycles and other factors.

38

Table of Contents

The table below summarizes active first and second lien mortgage loans on our mortgage loan servicing software solution and the related market data, reflecting our leadership in the mortgage loan servicing software solutions market (in millions):

First lien

Second lien

Total first and second lien

as of December 31, 

as of December 31, 

as of December 31, 


2022


2021


2020


2022


2021


2020


2022


2021

2020

Active loans


32.8


33.4


32.4


3.1


3.2


3.5


35.9


36.6


35.9

Market size


52.5

(1)

51.8

(1)

51.7

(1)

13.0

(2)

12.2

(2)

12.6

(2)

65.5


64.0


64.3

Market share


63

%  

64

%  

63

%  

24

%  

26

%  

28

%  

55

%  

57

%  

56

%

Note: Amounts above may not recalculate due to rounding.

(1)Estimates according to the Black Knight First Look press release dated February 24, 2023 for U.S. first lien mortgage loans. These estimates are subject to change.
(2)Estimates according to the January 2023, 2022 and 2021 Equifax National Consumer Credit Trends Report: Portfolio for U.S. second lien mortgage loans. These estimates are subject to revision.

As a result of the effects of the broad-based response to the COVID-19 pandemic, we have seen lower foreclosure-related transactional revenues due to the mortgage loan foreclosure moratorium and other measures that were in effect from 2020 through 2021. Additionally, low unemployment and historically low interest rates drove high home price appreciation, which also contributed to historically low foreclosure starts. In 2022, we had higher foreclosure-related transactional revenues compared to 2021 as a result of the expiration of the federal foreclosure moratorium.

Although foreclosure starts were higher in 2022 compared to 2021, they were still below levels prior to the pandemic. The table below shows pre-pandemic to post-pandemic industry volumes for foreclosure starts according to the Black Knight First Look press release dated February 24, 2023 (in thousands):

2022


355.0

2021


84.0

2020


191.0

2019


538.0

2018


593.0

In addition to lower foreclosure-related transactional revenues, we also have seen increases in inactive loans in the prior year period due to the higher mortgage loan origination volumes, particularly refinance volumes. Elevated origination refinance volumes in prior years increased the number of inactive loans above historical levels. A mortgage loan becomes inactive on MSP® once it is paid off and a servicer continues to keep the loan on MSP® for reporting purposes. In 2022, the number of inactive loans declined due to prior year originations, which resulted in lower usage-based revenues related to inactive loans on MSP®. Our origination software solutions primarily include our solutions that automate and facilitate the origination of mortgage loans and provide an interconnected network allowing the various parties and systems associated with lending transactions to exchange data quickly and efficiently.

39

Table of Contents

The table below summarizes the estimates of the number of loans in mortgage origination market (in millions):


2022


2021


2020


2019

Mortgage loan originations (# of loans):


Purchase

3.9

5.2

4.9

4.4

Refinance

2.0

8.3

8.8

3.4

Total - MBA(1)

5.9

13.5

13.7

7.8

Purchase

4.4

5.0

4.7

4.3

Refinance

2.4

8.6

8.7

3.6

Total - Black Knight(2)

6.8

13.6

13.4

7.9

Equifax(3)

14.1

13.9

8.2

Note: Amounts may not recalculate due to rounding.

(1)The U.S. mortgage loan origination market for purchase and refinance originations is estimated by the February 2023 MBA Mortgage Finance Forecast. These estimates are subject to future revisions.
(2)The U.S. mortgage loan origination market for purchase and refinance originations is estimated by the Black Knight First Look press release dated February 24, 2023. These estimates are subject to future revisions.
(3)The U.S. mortgage loan origination market for total originations is estimated by the January 2023 Equifax U.S. National Consumer Credit Trends Report: Originations. The 2022 number of loans is not included as the full year information is not yet available. The year-to-date October 2022 estimate is 6.1 million. These estimates are subject to future revisions.

Our direct exposure to origination volumes is limited as our loan origination system revenues are based on closed loan volumes subject to minimum base software subscription fees that are contractually obligated. Although we have revenues that are driven primarily from refinance loan applications, these revenues were approximately 2% of our consolidated revenues for the year ended December 31, 2022. Most of our secondary marketing technologies’ revenues are primarily subscription-based; however, some platforms are based on the number of loan officer seats. In 2022, we have seen a reduction in loan officer seats due to cost reduction actions from clients, including clients downsizing their mortgage origination workforce or exiting the origination market due to the current interest rate environment. According to the Q3 2022 Nationwide Multistate Licensing System (“NMLS”) Mortgage Industry Report, the number of active individual licensed mortgage loan officers has decreased from 123,622 as of December 31, 2021 to 102,251 as of September 30, 2022. The reduction in seat counts during 2022 caused a reduction in usage-based revenues for our clients with licenses that are seat-based and were previously above their contractual minimums.

Some of our origination software solutions are directly exposed to variances in origination volumes, primarily related to refinance volumes, due to the nature of the services provided. We have seen lower origination volumes in 2022 due to higher interest rates and record volumes in prior years. According to the February 2023 Mortgage Bankers Association Mortgage Finance Forecast, mortgage loan originations have declined 56% for the year ended December 31, 2022 compared to 2021. The portion of our origination software solutions revenues that are more sensitive to origination volumes were approximately 3% of our consolidated revenues for the year ended December 31, 2022, and revenues related to these origination software solutions declined approximately 34% compared to 2021, representing a headwind of approximately $22.7 million.

Data and Analytics

Our Data and Analytics segment offers data and analytics solutions to the mortgage, real estate and capital markets verticals. These solutions include property ownership data, lien data, servicing data, automated valuation models, collateral risk scores, behavioral models, a multiple listing service software solution and other data solutions. Our data and analytics business is primarily based on longer-term strategic data licenses, other data licenses and subscription-based revenues. Our data and analytics revenues were 14%, 15% and 16% of our consolidated revenues for the years ended December 31, 2022, 2021 and 2020, respectively. The portion of our data and analytics solutions revenues that are more sensitive to fluctuations in home buying activity and origination volumes primarily relate to services where we provide software and data necessary for tax data and other settlement service activities. Revenues from these solutions were approximately 2% of our consolidated revenues for the year ended December 31, 2022 and declined approximately 31% compared to 2021,

40

Table of Contents

representing a headwind of approximately $16.5 million. TitlePoint revenues that were more sensitive to fluctuations in home buying and origination volumes were approximately 1.8% of our consolidated revenues for the year ended December 31, 2022 and declined 22% compared to 2021, representing approximately $7.8 million of the headwind.

Regulatory Requirements

There continues to be a high level of legislative and regulatory focus on consumer protection practices. As a result, federal and state governments have enacted various new laws, rules and regulations. This has led banks and other lenders to seek software solutions that assist them in satisfying their regulatory compliance obligations in the face of a changing regulatory environment. We have developed solutions that target this need, which has resulted in additional revenues.

The CFPB has issued guidance that applies to "supervised service providers," which the CFPB has defined to include service providers, like us, to CFPB-supervised banks and non-banks. In addition, the Dodd-Frank Wall Street Reform and Consumer Protection Act of 2010 (the "Dodd-Frank Act") contains the Mortgage Reform and Anti-Predatory Lending Act that imposes additional requirements on lenders and servicers of residential mortgage loans. Future legislative or regulatory changes are difficult to predict, and new laws or regulations that may be implemented by the CFPB or other regulatory bodies may require us to change our business practices or incur increased costs to comply.

Critical Accounting Policies and Estimates

Our discussion and analysis of our financial condition and results of operations is based upon audited consolidated financial statements, which have been prepared in accordance with U.S. generally accepted accounting principles ("GAAP"). The preparation of these consolidated financial statements requires management to make estimates, judgments and assumptions that affect the reported amounts of assets and liabilities and disclosures with respect to contingent liabilities and assets at the date of the consolidated financial statements and the reported amounts of revenues and expenses during the reporting periods. Certain of our accounting policies and estimates require the application of significant judgment by management in selecting the appropriate assumptions for calculating financial estimates. By their nature, these judgments are subject to an inherent degree of uncertainty. Our actual results may differ from those estimates. See Note 2 to the Notes to Consolidated Financial Statements for additional description of the significant accounting policies that have been followed in preparing our consolidated financial statements.

The accounting policies described below are those we consider to be the most critical to an understanding of our financial condition and results of operations and that require the most complex and subjective management judgment.

Revenue Recognition

At times, revenue recognition requires significant judgment, especially for our complex arrangements that include multiple performance obligations, or deliverables, such as arrangements that include the implementation of several software solutions over a period of time as well as post-implementation subscription fees and support for those solutions. The amount of revenues we recognize in a particular period depends on the value we allocate to the products and services delivered during that period. Our critical judgments for revenue recognition relate to (i) identifying performance obligations within the arrangement, including whether those obligations are distinct or should be combined; (ii) determining the standalone selling price ("SSP") for each performance obligation; and (iii) determining the effect of contract modifications.  

Delivery of our primary software solutions is often considered a distinct performance obligation; however, certain agreements that include complex, proprietary implementation-related professional services require judgment to determine if the software solution and related implementation professional services should be combined into one performance obligation.

The SSP for many of our solutions and services is based on observable selling prices. However, when observable selling prices are not available, judgment and analysis is required to establish an estimated SSP through consideration of all reasonably available information, including market conditions, demands, trends, our specific factors and information

41

Table of Contents

about the client or class of client. The adjusted market approach is generally used when observable inputs are not available or limited.

Contract modifications require judgment to determine if the modification should be accounted for as (i) a separate contract, (ii) the termination of the original contract and creation of a new contract or (iii) a cumulative catch-up adjustment to the original contract. When evaluating contract modifications, we must identify the performance obligations of the modified contract and determine both the allocation of revenues to the remaining performance obligations and the period of recognition for each identified performance obligation.

Purchase Accounting

We are required to allocate the purchase price of acquired businesses to the tangible and intangible assets acquired and the liabilities assumed based on their estimated fair values, with the excess recorded as goodwill. We generally engage third-party valuation specialists to assist us in making fair value determinations. The third-party valuation specialists generally use discounted cash flow models, which require internally-developed assumptions, to determine the acquisition fair value of client relationship intangible assets and developed technology software assets. Assumptions for client relationship asset valuations generally include forecasted revenue attributable to existing customer contracts and relationships, estimated annual attrition, forecasted earnings before interest, taxes, depreciation and amortization margin and estimated weighted average cost of capital and discount rates. Assumptions for software asset valuations generally include forecasted revenue attributable to the software assets, obsolescence rates, estimated royalty rates and estimated weighted average cost of capital and discount rates. The forecasted financial performance used in the discounted cash flow models are critical accounting estimates in determining the fair value of customer relationships and software asset valuations as these estimates are influenced by many factors, including historical financial information and management’s expectation for future operating results as a combined company.

If the initial accounting for a business combination is incomplete by the end of the reporting period during which the combination took place, we are required to record provisional amounts in our consolidated financial statements for items for which the accounting has not been completed. Measurement period adjustments to provisional purchase price allocations are recognized in the period in which they are determined, with the effect on earnings of changes in depreciation, amortization or other income resulting from such changes calculated as if the accounting had been completed on the acquisition date. Any new assets or liabilities identified during the measurement period are recognized as of the acquisition date. The measurement period ends the sooner of one year from the acquisition date or when we receive the information we were seeking about facts and circumstances that existed as of the acquisition date or learn that more information is not obtainable.

Goodwill

Goodwill is tested for impairment annually or more frequently if circumstances indicate potential impairment, through a comparison of a reporting unit’s fair value to its carrying value. Goodwill impairment assessments require a significant amount of management judgement, and a meaningful change in one or more of the underlying forecasts, estimates or assumptions used in testing goodwill for impairment could have a material impact on our results of operations and financial position. Our impairment test may first consider qualitative factors to determine whether it is more likely than not that a reporting unit's carrying amount exceeds its fair value. Qualitative factors include macroeconomic conditions, industry and market changes, our overall financial performance, changes in share price and other events or changes in circumstances that could negatively affect us. If the results of a qualitative assessment indicate a potential for impairment, a quantitative goodwill impairment test is performed. The quantitative process of determining whether or not an asset, such as goodwill, is impaired or recoverable relies on a weighted average of multiple valuation methods, primarily a combination of an income approach and a market approach. The income approach includes the present value of estimated future cash flows, while the market approach uses earnings multiples of similar guideline public companies or of similar guideline transactions. The income approach used to assess goodwill for impairment is a critical estimate because the forecasted growth rate assumptions underlying the estimated future cash flows is subject to management's judgement based upon the best available market information, internal forecasts and operating plans. A deterioration in this assumption could adversely impact our results of operations and financial position.

42

Table of Contents

For the years ended December 31, 2022, 2021 and 2020, we performed a qualitative assessment for our annual goodwill impairment test, and we concluded that it is more likely than not that the fair value of each of our reporting units continued to exceed its respective carrying values.

Results of Operations

See Part II, Item 7. Management’s Discussion and Analysis of Financial Condition and Results of Operations in our Annual Report on Form 10-K for the year ended December 31, 2021, filed with the Securities and Exchange Commission ("SEC") on February 25, 2022, for a discussion of our consolidated and segment results of operations for 2021 compared to 2020.

Key Performance Metrics

Revenues, EBITDA and EBITDA Margin for the Software Solutions and Data and Analytics segments are presented in conformity with ASC Topic 280, Segment Reporting. These measures are reported to the chief operating decision maker for purposes of making decisions about allocating resources to the segments and assessing their performance. For these reasons, these measures are excluded from the definition of non-GAAP financial measures under the SEC’s Regulation G and Item 10(e) of Regulation S-K.

Consolidated Results of Operations

The following tables present certain financial data for the periods indicated (dollars in millions):

Year ended December 31, 


2022


2021


2020


Revenues

$

1,551.9

$

1,475.2

$

1,238.5

Expenses:


Operating expenses


872.3


793.9


669.6

Depreciation and amortization


369.6


365.0


270.7

Transition and integration costs


31.8


13.3


31.4

Total expenses


1,273.7


1,172.2


971.7

Operating income


278.2


303.0


266.8

Operating margin


17.9

%


20.5

%


21.5

%

Interest expense, net


(100.6)


(83.6)


(62.9)

Other (expense) income, net


(11.9)


(6.4)


16.4

Earnings before income taxes and equity in earnings of unconsolidated affiliates


165.7


213.0


220.3

Income tax expense


22.4


35.7


41.6

Earnings before equity in earnings of unconsolidated affiliates


143.3


177.3


178.7

Equity in earnings of unconsolidated affiliates, net of tax


306.7


2.6


67.1

Net earnings


450.0


179.9


245.8

Net losses attributable to redeemable noncontrolling interests


2.5


28.0


18.3

Net earnings attributable to Black Knight

$

452.5

$

207.9

$

264.1

Net earnings per share attributable to Black Knight common shareholders:


Diluted

$

2.91

$

1.33

$

1.73

Weighted average shares of common stock outstanding:


Diluted


155.6


155.8


152.9

43

Table of Contents

Segment Financial Results

Revenues

We generate revenues through contractual arrangements we enter into with our clients to provide products or services either individually or in combination with one another as part of an integrated offering of multiple services. These arrangements occasionally include offerings from more than one segment to the same client.

The following table sets forth revenues by segment for the periods presented (in millions):


Year ended December 31, 

Variance


2022


2021


$

%

Software Solutions

$

1,333.9

$

1,250.0

$

83.9

7

%

Data and Analytics


218.0


225.2


(7.2)

(3)

%

Total

$

1,551.9

$

1,475.2

$

76.7

5

%

Software Solutions

Our Software Solutions segment revenues are primarily derived from software solutions and professional services. Revenues from software solutions are typically volume-based agreements driven by factors such as the number of accounts processed, transactions processed and system resources utilized. The agreements typically have minimum volumes that results in high levels of recurring revenue. Professional services consist of pre-implementation and post-implementation support and services and are primarily billed on a time and materials basis. Professional services may also include dedicated teams provided as part of agreements with software solutions clients.

Revenues were $1,333.9 million in 2022 compared to $1,250.0 million in 2021, an increase of $83.9 million, or 7%. Our servicing software solutions revenues increased $44.9 million, or 5%, primarily driven by incremental revenues from new and existing clients, an increase of $21.6 million in foreclosure-related revenues and contract termination fees of $3.9 million, partially offset by headwinds from lower transactional revenues, including a decline in inactive loans, and attrition. Our origination software solutions revenues increased $39.0 million, or 9%, primarily driven by revenues from new and existing clients, revenues of $14.0 million related to an acquired business, an increase of $9.1 million in contract termination fees and an increase of $5.3 million in license fees, partially offset by a decrease of $22.7 million in revenues due to lower origination volumes and attrition.

Data and Analytics

Our Data and Analytics segment revenues are primarily derived from property ownership data, lien data, servicing data, automated valuation models, collateral risk scores, behavioral models, a multiple listing service software solution and other data solutions.

Revenues were $218.0 million in 2022 compared to $225.2 million in 2021, a decrease of $7.2 million, or 3%. The decrease was primarily driven by new sales that were more than offset by a decrease of $16.5 million related to the effect of lower origination volumes, lower revenues related to a reduction in scope for two long-term strategic data deal renewals and attrition.

44

Table of Contents

EBITDA and EBITDA margin

The following tables set forth EBITDA (in millions) and EBITDA margin by segment for the periods presented:


Year ended December 31, 

Variance


2022


2021


$

%

Software Solutions

$

736.5

$

713.7

$

22.8

3

%

Data and Analytics


69.3


80.2


(10.9)

(14)

%

Year ended December 31, 

Variance


2022

2021

Basis points

Software Solutions


55.2

%  

57.1

%  

(190)

Data and Analytics


31.8

%  

35.6

%  

(380)

Software Solutions

EBITDA was $736.5 million in 2022 compared to $713.7 million in 2021, an increase of $22.8 million, or 3%, with an EBITDA margin of 55.2% compared to 57.1% in 2021. The EBITDA margin decrease was driven by revenue mix along with higher personnel costs, technology-related costs, including cloud costs and other software subscriptions, an increase in client credit loss expense primarily related to a client that is no longer in business, and sales and marketing costs.

Data and Analytics

EBITDA was $69.3 million in 2022 compared to $80.2 million in 2021, a decrease of $10.9 million, or 14%, with an EBITDA margin of 31.8% compared to 35.6% in 2021. The EBITDA margin decrease was primarily driven by revenue mix along with higher personnel costs, technology-related costs and sales and marketing costs.

Consolidated Financial Results

Operating Expenses

Operating expenses primarily include compensation costs, including equity-based compensation and benefits, hardware and software maintenance costs, software subscription costs, cloud computing costs, occupancy costs and professional services.

The following table sets forth operating expenses by segment for the periods presented (in millions):


Year ended December 31, 

Variance


2022


2021


$

%

Software Solutions

$

597.4

$

536.3

$

61.1

11

%

Data and Analytics


148.7


145.0


3.7

3

%

Corporate and Other(1)


126.2


112.6


13.6

12

%

Total

$

872.3

$

793.9

$

78.4

10

%

(1)Operating expenses for Corporate and Other include equity-based compensation, including certain related payroll taxes, of $55.7 million and $42.9 million in 2022 and 2021, respectively.

The increase in Operating Expenses in 2022 compared to 2021 was primarily driven by $37.5 million in higher net personnel expenses, including the effect of wage inflation above our typical annual increases, $13.7 million in higher technology-related costs, $8.4 million in higher sales and marketing costs, including higher costs related to travel, and an increase of $8.2 million in client credit loss expense primarily related to a client that is no longer in business.

45

Table of Contents

Depreciation and Amortization

Depreciation and amortization expense consists of our depreciation related to investments in property and equipment, including hardware, as well as amortization of purchased and developed software and other intangible assets, primarily client relationship assets recorded in connection with acquisitions. It also includes the amortization of deferred contract costs.

The following table sets forth Depreciation and amortization by segment for the periods presented (in millions):


Year ended December 31, 

Variance


2022


2021


$

%

Software Solutions

$

146.6

$

131.1

$

15.5

12

%

Data and Analytics


15.8


15.5


0.3

2

%

Corporate and Other(1)


207.2


218.4


(11.2)

(5)

%

Total

$

369.6

$

365.0

$

4.6

1

%

(1)Depreciation and amortization for Corporate and Other primarily represents net incremental depreciation and amortization adjustments associated with the application of purchase accounting recorded in accordance with GAAP.

The increase in Depreciation and amortization in 2022 compared to 2021 is primarily related to higher software amortization of $11.8 million related to investments in internally developed software, primarily related to our origination software solutions, higher deferred contract costs amortization of $10.8 million, including $5.9 million of accelerated amortization, partially offset by lower other intangibles assets amortization of $16.0 million, primarily related to acquired client relationship assets that are amortized using an accelerated method.

Transition and Integration Costs

Transition and integration costs were $31.8 million in 2022 compared to $13.3 million in 2021. Transition and integration costs in 2022 primarily consisted of costs related to the ICE Transaction. Transition and integration costs in 2022 and 2021 also consisted of costs associated with acquisitions, including costs pursuant to purchase agreements and expense reduction initiatives.

Interest Expense, Net

Interest expense, net consists primarily of interest expense on our borrowings, payments on our interest rate swaps, amortization of our debt issuance costs and original issue discount, commitment fees on our revolving credit facility and administrative agent fees net of capitalized interest and interest income.

Interest expense, net was $100.6 million in 2022 compared to $83.6 million in 2021, an increase of $17.0 million, or 20%. The increase was driven by higher interest rates and higher average outstanding debt balances.

Other Expense, Net

Other expense, net was $11.9 million in 2022 compared to $6.4 million in 2021. The 2022 amount is primarily related to legal fees. The 2021 amount is primarily related to legal fees and the debt refinancing.

Income Tax Expense

Income tax expense was $22.4 million in 2022 compared to $35.7 million in 2021. Our effective tax rate was 13.5% in 2022 compared to 16.8% in 2021. Refer to Note 18 to the Notes to Consolidated Financial Statements for additional information.

46

Table of Contents

Equity in Earnings of Unconsolidated Affiliates, Net of Tax

Equity in earnings of unconsolidated affiliates, net of tax primarily represents the effect of our investment in DNB, which is accounted for as an equity-method investment. Equity in earnings of unconsolidated affiliates, net of tax consists of the following (in millions):

Year ended December 31, 


2022


2021

Equity in earnings (losses) of unconsolidated affiliates, net of tax

$

1.3

$

(7.3)

Gain related to DNB investment, net of tax

305.4

Non-cash gain related to DNB's issuance of common stock, net of tax


9.9

Equity in earnings of unconsolidated affiliates, net of tax

$

306.7

$

2.6

Refer to Note 4 to the Notes to Consolidated Financial Statements for more information related to our investment in DNB.

Liquidity and Capital Resources

Cash Requirements

Our primary sources of liquidity are our existing cash balances, cash flows from operations and borrowings on our revolving credit facility. As of December 31, 2022, we had cash and cash equivalents of $12.2 million, outstanding debt principal of $2,671.2 million and available capacity of $455.0 million on our revolving credit facility.

As of December 31, 2022, we owned 18.5 million shares of DNB common stock for an ownership interest in DNB of approximately 4% of DNB’s outstanding common stock. As of December 31, 2022, DNB’s closing share price was $12.26 and the fair value of our investment in DNB was $226.5 million before tax. Assuming a statutory tax rate of 25.5%, the estimated after-tax value of our investment in DNB was $211.0 million. Refer to Note 4 to the Notes to Consolidated Financial Statements for additional information.

Our primary cash requirements include operating expenses, debt service payments (principal and interest), capital expenditures (including software development, equipment and property related expenditures) and tax-related payments and may include business acquisitions and share repurchases.

We believe that our cash flows from operations and available cash and cash equivalents are sufficient to meet our liquidity needs, including the repayment of our outstanding debt, for at least the next 12 months. We anticipate that to the extent that we require additional liquidity, it will be funded through borrowings on our revolving credit facility, the incurrence of other indebtedness, the sale of DNB common stock, equity issuance or a combination thereof. The loss of the largest lender on our revolving credit facility would reduce our borrowing capacity by $90.0 million. Additionally, our liquidity and our ability to meet our obligations and fund our capital requirements are also dependent on our future financial performance, which is subject to general economic, financial and other factors that are beyond our control. Accordingly, we cannot be assured that our business will generate sufficient cash flows from operations or that future borrowings will be available from additional indebtedness or otherwise to meet our liquidity needs. Although we have no specific current plans to do so, if we decide to pursue one or more significant acquisitions, we may incur additional debt or sell additional equity to finance such acquisitions.

47

Table of Contents

Cash Flows

The following table provides a summary of cash flows from operating, investing and financing activities (in millions):

Year ended December 31, 


2022


2021


Variance

Cash flows provided by operating activities

$

251.7

$

449.9

$

(198.2)

Cash flows used in investing activities


(124.3)


(429.8)


305.5

Cash flows (used in) provided by financing activities


(192.3)


22.3


(214.6)

Net (decrease) increase in cash and cash equivalents

$

(64.9)

$

42.4

$

(107.3)

Operating Activities

The $198.2 million decrease in cash provided by operating activities in 2022 compared to 2021 is primarily related to higher income tax payments of $112.4 million, including approximately $75 million of income tax payments related to the DNB gain we recognized as part of the February 2022 Optimal Blue transaction and approximately $32 million related to the effect of the change in timing of deducting certain software development costs under Internal Revenue Code Section 174, as well as payments of approximately $43 million made in connection with certain tax-planning actions to mitigate the potential impact of Internal Revenue Code Section 280G related to the proposed ICE Transaction.

Investing Activities

The $305.5 million decrease in cash used in investing activities in 2022 compared to 2021 is primarily related to business acquisitions in 2021.

Financing Activities

The $214.6 million increase in cash used in financing activities in 2022 compared to 2021 is primarily related to the cash paid in February 2022 as part of the aggregate purchase consideration for acquiring the remaining outstanding Class A Units of Optimal Blue from Cannae and THL, partially offset by share repurchases in 2021.

Financing

For a description of our financing arrangements, see Note 11 to the Notes to Consolidated Financial Statements.

Contractual Obligations

Our long-term contractual obligations generally include our debt and related interest payments, software subscription, cloud computing and hardware and software maintenance commitments and operating and finance lease payments for our offices, data centers, property and equipment. These long-term contractual obligations extend through 2028.

48

Table of Contents

Payments due by period


Total


2023


2024


2025


2026


2027


Thereafter

Debt

$

2,671.2

$

33.7

$

57.5

$

57.5

$

1,522.5

$

$

1,000.0

Interest on debt(1)


521.3


133.0


132.9


129.2


53.6


36.3


36.3

Software subscription, cloud computing and hardware and software maintenance agreements

86.7

61.7

17.7

3.9

3.4

Operating lease payments

27.2

8.8

7.8

3.0

2.8

2.6

2.2

Other(2)

4.8

1.3

1.3

1.3

0.5

0.3

0.1

Total

$

3,311.2

$

238.5

$

217.2

$

194.9

$

1,582.8

$

39.2

$

1,038.6

(1)These calculations include the effect of our interest rate swaps that expire in 2023 and assume that (a) applicable margins remain constant; (b) our term A loan and revolving credit facility variable rate debt is priced at the one-month LIBOR in effect as of December 31, 2022; (c) only mandatory debt repayments are made; and (d) no refinancing occurs at debt maturity.
(2)Other includes commitment fees on our revolving credit facility and rating agencies fees.

Our interest rate swaps represent our material off-balance sheet arrangements. Refer to Note 11 to Consolidated Financial Statements for additional information.

Indemnifications and Warranties

We often agree to indemnify our clients against damages and costs resulting from claims of patent, copyright, trademark infringement or breaches of confidentiality associated with use of our software through software licensing agreements. Historically, we have not made any payments under such indemnifications, but continue to monitor the conditions that are subject to the indemnifications to identify whether a loss has occurred that is both probable and estimable that would require recognition. In addition, we warrant to clients that our software operates substantially in accordance with the software specifications. Historically, no costs have been incurred related to software warranties and none are expected in the future, and as such, no accruals for warranty costs have been made.

Recent Accounting Pronouncements

See Note 2 to the Notes to Consolidated Financial Statements for a description of recent accounting pronouncements.

Item 7A.           Quantitative and Qualitative Disclosure about Market Risk

In the normal course of business, we are routinely subject to a variety of risks, as described in Item 1A. Risk Factors of Part I of this Report and in our other filings with the SEC.

The risks related to our business also include certain market risks that may affect our debt and other financial instruments. At present, we face the market risks primarily associated with interest rate movements on our outstanding debt.

Market Risk

We regularly assess market risks and have established policies and business practices designed to protect against the adverse effects of these exposures. We are exposed to market risks primarily from changes in interest rates. We use interest rate swaps to manage interest rate risk. We do not use interest rate swaps for trading purposes, to generate income or to engage in speculative activity.

Interest Rate Risk

In addition to existing cash balances and cash provided by operating activities, we use fixed and variable rate debt to finance our operations.

49

Table of Contents

Our Senior Notes represent our fixed-rate long-term debt. Refer to Note 11 to the Notes to Consolidated Financial Statements. The carrying value of our Senior Notes was $991.1 million, net of original issue discount and debt issuance costs, as of December 31, 2022. The fair value of our Senior Notes was approximately $870.0 million as of December 31, 2022. The potential reduction in fair value of the Senior Notes from a hypothetical 10 percent increase in market interest rates would not be material to the overall fair value of debt.

We enter into interest rate swap agreements to hedge forecasted monthly interest rate payments on our variable rate debt. We are exposed to interest rate risk on our debt obligations and related interest rate swaps. As of December 31, 2022, we had $1,666.2 million in long-term debt principal outstanding from our Facilities, all of which is variable rate debt, as described in Note 11 to the Notes to Consolidated Financial Statements.

As of December 31, 2022, the Facilities represent our long-term debt obligations exposed to interest rate risk. We performed a sensitivity analysis based on the principal amount of debt as of December 31, 2022, as well as the effect of our interest rate swaps. Further, in this sensitivity analysis, the change in interest rates is assumed to be applicable for an entire year. An increase or decrease of 100 basis points in the applicable interest rate would cause an increase or decrease in interest expense of $16.7 million on an annual basis ($15.6 million including the effect of our current interest rate swaps) as the 1-week and 1-month LIBOR were approximately 4.32% and 4.38%, respectively, as of December 31, 2022.

As of December 31, 2022, we have the following interest rate swaps agreements (collectively, the "Swap Agreements") (in millions):

Effective dates


Notional amount


Fixed rates

April 30, 2018 through April 30, 2023

$

250.0


2.61

%

January 31, 2019 through January 31, 2023

$

300.0


2.65

%

Under the terms of the Swap Agreements, we receive payments based on the 1-month LIBOR (approximately 4.38% as of December 31, 2022).

During the year ended December 31, 2022, the following interest rate swap agreement expired (in millions):

Effective dates


Notional amount


Fixed rate

March 31, 2017 through March 31, 2022

$

200.0


2.08

%

The Swap Agreements were designated as cash flow hedging instruments. A portion of the amount included in Accumulated other comprehensive loss is reclassified into Interest expense, net as a yield adjustment as interest payments are made on the hedged debt. The inputs used to determine the estimated fair value of our interest rate swaps are Level 2 inputs. We considered our own credit risk and the credit risk of the counterparties when determining the fair value of our Swap Agreements.

50

Table of Contents

Item 8.          Financial Statements and Supplementary Data

BLACK KNIGHT, INC. AND SUBSIDIARIES

INDEX TO FINANCIAL STATEMENTS

Page
Number

Reports of Independent Registered Public Accounting Firm (KPMG LLP, Jacksonville, FL, Auditor Firm ID: 185)

52

Consolidated Balance Sheets as of December 31, 2022 and 2021

55

Consolidated Statements of Earnings and Comprehensive Earnings for the years ended December 31, 2022, 2021 and 2020

56

Consolidated Statements of Equity for the years ended December 31, 2022, 2021 and 2020

57

Consolidated Statements of Cash Flows for the years ended December 31, 2022, 2021 and 2020

59

Notes to Consolidated Financial Statements

60

51

Table of Contents

Report of Independent Registered Public Accounting Firm

To the Shareholders and Board of Directors
Black Knight, Inc.:

Opinion on Internal Control Over Financial Reporting

We have audited Black Knight, Inc. and subsidiaries' (the Company) internal control over financial reporting as of December 31, 2022, based on criteria established in Internal Control – Integrated Framework (2013) issued by the Committee of Sponsoring Organizations of the Treadway Commission. In our opinion, the Company maintained, in all material respects, effective internal control over financial reporting as of December 31, 2022, based on criteria established in Internal Control – Integrated Framework (2013) issued by the Committee of Sponsoring Organizations of the Treadway Commission.

We also have audited, in accordance with the standards of the Public Company Accounting Oversight Board (United States) (PCAOB), the consolidated balance sheets of the Company as of December 31, 2022 and 2021, the related consolidated statements of earnings and comprehensive earnings, equity, and cash flows for each of the years in the three-year period ended December 31, 2022, and the related notes (collectively, the consolidated financial statements), and our report dated February 28, 2023 expressed an unqualified opinion on those consolidated financial statements.

Basis for Opinion

The Company’s management is responsible for maintaining effective internal control over financial reporting and for its assessment of the effectiveness of internal control over financial reporting, included in the accompanying Management’s Report on Internal Control Over Financial Reporting. Our responsibility is to express an opinion on the Company’s internal control over financial reporting based on our audit. We are a public accounting firm registered with the PCAOB and are required to be independent with respect to the Company in accordance with the U.S. federal securities laws and the applicable rules and regulations of the Securities and Exchange Commission and the PCAOB.

We conducted our audit in accordance with the standards of the PCAOB. Those standards require that we plan and perform the audit to obtain reasonable assurance about whether effective internal control over financial reporting was maintained in all material respects. Our audit of internal control over financial reporting included obtaining an understanding of internal control over financial reporting, assessing the risk that a material weakness exists, and testing and evaluating the design and operating effectiveness of internal control based on the assessed risk. Our audit also included performing such other procedures as we considered necessary in the circumstances. We believe that our audit provides a reasonable basis for our opinion.

Definition and Limitations of Internal Control Over Financial Reporting

A company’s internal control over financial reporting is a process designed to provide reasonable assurance regarding the reliability of financial reporting and the preparation of financial statements for external purposes in accordance with generally accepted accounting principles. A company’s internal control over financial reporting includes those policies and procedures that (1) pertain to the maintenance of records that, in reasonable detail, accurately and fairly reflect the transactions and dispositions of the assets of the company; (2) provide reasonable assurance that transactions are recorded as necessary to permit preparation of financial statements in accordance with generally accepted accounting principles, and that receipts and expenditures of the company are being made only in accordance with authorizations of management and directors of the company; and (3) provide reasonable assurance regarding prevention or timely detection of unauthorized acquisition, use, or disposition of the company’s assets that could have a material effect on the financial statements.

Because of its inherent limitations, internal control over financial reporting may not prevent or detect misstatements. Also, projections of any evaluation of effectiveness to future periods are subject to the risk that controls may become inadequate because of changes in conditions, or that the degree of compliance with the policies or procedures may deteriorate.

/s/ KPMG LLP

Jacksonville, Florida
February 28, 2023

52

Table of Contents

Report of Independent Registered Public Accounting Firm

To the Shareholders and Board of Directors
Black Knight, Inc.:

Opinion on the Consolidated Financial Statements

We have audited the accompanying consolidated balance sheets of Black Knight, Inc. and subsidiaries (the Company) as of December 31, 2022 and 2021, the related consolidated statements of earnings and comprehensive earnings, equity, and cash flows for each of the years in the three-year period ended December 31, 2022, and the related notes (collectively, the consolidated financial statements). In our opinion, the consolidated financial statements present fairly, in all material respects, the financial position of the Company as of December 31, 2022 and 2021, and the results of its operations and its cash flows for each of the years in the three-year period ended December 31, 2022, in conformity with U.S. generally accepted accounting principles.

We also have audited, in accordance with the standards of the Public Company Accounting Oversight Board (United States) (PCAOB), the Company’s internal control over financial reporting as of December 31, 2022, based on criteria established in Internal Control – Integrated Framework (2013) issued by the Committee of Sponsoring Organizations of the Treadway Commission, and our report dated February 28, 2023 expressed an unqualified opinion on the effectiveness of the Company’s internal control over financial reporting.

Acquisition of Optimal Blue, LLC

As discussed in Note 3 to the consolidated financial statements, the Company acquired Optimal Blue, LLC on September 15, 2020.

Basis for Opinion

These consolidated financial statements are the responsibility of the Company’s management. Our responsibility is to express an opinion on these consolidated financial statements based on our audits. We are a public accounting firm registered with the PCAOB and are required to be independent with respect to the Company in accordance with the U.S. federal securities laws and the applicable rules and regulations of the Securities and Exchange Commission and the PCAOB.

We conducted our audits in accordance with the standards of the PCAOB. Those standards require that we plan and perform the audit to obtain reasonable assurance about whether the consolidated financial statements are free of material misstatement, whether due to error or fraud. Our audits included performing procedures to assess the risks of material misstatement of the consolidated financial statements, whether due to error or fraud, and performing procedures that respond to those risks. Such procedures included examining, on a test basis, evidence regarding the amounts and disclosures in the consolidated financial statements. Our audits also included evaluating the accounting principles used and significant estimates made by management, as well as evaluating the overall presentation of the consolidated financial statements. We believe that our audits provide a reasonable basis for our opinion.

Critical Audit Matter

The critical audit matter communicated below is a matter arising from the current period audit of the consolidated financial statements that was communicated or required to be communicated to the audit committee and that: (1) relates to accounts or disclosures that are material to the consolidated financial statements and (2) involved our especially challenging, subjective, or complex judgments. The communication of a critical audit matter does not alter in any way our opinion on the consolidated financial statements, taken as a whole, and we are not, by communicating the critical audit matter below, providing a separate opinion on the critical audit matter or on the accounts or disclosures to which it relates.

Assessment of revenue recognition for contracts with multiple performance obligations

As discussed in Notes 2 and 15 to the consolidated financial statements, the Company is often party to multiple concurrent contracts or contracts in which a customer may purchase a combination of products and services. For contracts with customers that contain various combinations of products and services, the Company must evaluate

53

Table of Contents

whether the promises within the contract are capable of being distinct and are distinct in the context of the contract. Distinct products or services are accounted for as separate performance obligations, while non-distinct products or services are combined with others to form a single performance obligation. Given the nature of the Company’s product and service offerings, there is complexity in determining whether the promises are separate performance obligations or a combined performance obligation. The identification of performance obligations, specifically for revenue contracts with professional services, influence the amount and timing of revenue recognition.

We identified the assessment of revenue recognition for contracts with multiple performance obligations as a critical audit matter. Specifically, the critical audit matter related to the Company’s identification of performance obligations for revenue contracts with professional services and the resulting accounting treatment. This was due to the extensive audit effort and complex auditor judgment required to evaluate the Company’s contracts in these circumstances.

The following are the primary procedures we performed to address this critical audit matter. We evaluated the design and tested the operating effectiveness of certain internal controls over the revenue recognition process. This included controls over the Company’s review of customer contracts for the identification of performance obligations. For selected new and modified revenue arrangements, we assessed the Company’s identification of performance obligations by evaluating the Company’s analysis of the revenue arrangements as compared to the revenue recognition standard and the underlying contracts and/or statements of work. In addition, for a sample of professional services revenue transactions, we assessed the Company’s identification of distinct and non-distinct performance obligations by evaluating the Company’s analysis through comparison to contract source documents and correspondence or through involvement of information technology professionals with specialized skills and knowledge in discussions with the Company’s product and service technicians.

/s/ KPMG LLP

We have served as the Company’s auditor since 2007.

Jacksonville, Florida

February 28, 2023

54

Table of Contents

BLACK KNIGHT, INC.

Consolidated Balance Sheets

(In millions, except share data)


December 31, 

2022

2021

ASSETS

Current assets:


Cash and cash equivalents

$

12.2

$

77.1

Trade receivables, net


193.5


191.8

Prepaid expenses and other current assets


132.1


83.0

Receivables from related parties


0.1


0.2

Current assets held for sale

5.8


Total current assets


343.7


352.1

Property and equipment, net


143.0


154.5

Software, net


443.7


497.0

Other intangible assets, net


470.1


613.2

Goodwill


3,747.8


3,817.3

Investments in unconsolidated affiliates


171.0


490.5

Deferred contract costs, net


192.6


196.0

Other non-current assets


246.2


230.3

Non-current assets held for sale

73.5

Total assets

$

5,831.6

$

6,350.9

LIABILITIES AND EQUITY


Current liabilities:


Trade accounts payable and other accrued liabilities

$

66.5

$

64.5

Income taxes payable

28.4

11.8

Accrued compensation and benefits


82.8


91.4

Current portion of debt


33.6


32.5

Deferred revenues


59.9


64.6

Total current liabilities


271.2


264.8

Deferred revenues


42.4


81.5

Deferred income taxes


227.5


284.1

Long-term debt, net of current portion


2,621.7


2,362.6

Other non-current liabilities


47.9


78.7

Total liabilities


3,210.7


3,071.7

Commitments and contingencies (Note 13)


Redeemable noncontrolling interests


47.6


1,188.8

Equity:


Common stock; $0.0001 par value; 550,000,000 shares authorized; 160,040,598 shares issued and 155,930,399 shares outstanding as of December 31, 2022, and 160,040,598 shares issued and 155,357,705 shares outstanding as of December 31, 2021


Preferred stock; $0.0001 par value; 25,000,000 shares authorized; issued and outstanding, none as of December 31, 2022 and December 31, 2021


Additional paid-in capital


1,398.2


1,410.9

Retained earnings


1,417.1


968.2

Accumulated other comprehensive loss


(6.3)


(17.5)

Treasury stock, at cost, 4,110,199 shares as of December 31, 2022 and 4,682,893 shares as of December 31, 2021


(235.7)


(271.2)

Total shareholders’ equity


2,573.3


2,090.4

Total liabilities, redeemable noncontrolling interests and shareholders’ equity

$

5,831.6

$

6,350.9

See Notes to Consolidated Financial Statements.

55

Table of Contents

BLACK KNIGHT, INC.

Consolidated Statements of Earnings and Comprehensive Earnings

(In millions, except per share data)

Year ended December 31, 

2022

2021


2020

Revenues

$

1,551.9

$

1,475.2

$

1,238.5

Expenses:


Operating expenses


872.3


793.9


669.6

Depreciation and amortization


369.6


365.0


270.7

Transition and integration costs


31.8


13.3


31.4

Total expenses


1,273.7


1,172.2


971.7

Operating income


278.2


303.0


266.8

Other income and expense:


Interest expense, net


(100.6)


(83.6)


(62.9)

Other (expense) income, net


(11.9)


(6.4)


16.4

Total other expense, net


(112.5)


(90.0)


(46.5)

Earnings before income taxes and equity in earnings of unconsolidated affiliates


165.7


213.0


220.3

Income tax expense


22.4


35.7


41.6

Earnings before equity in earnings of unconsolidated affiliates


143.3


177.3


178.7

Equity in earnings of unconsolidated affiliates, net of tax


306.7


2.6


67.1

Net earnings


450.0


179.9


245.8

Net losses attributable to redeemable noncontrolling interests


2.5


28.0


18.3

Net earnings attributable to Black Knight

$

452.5

$

207.9

$

264.1

Other comprehensive earnings (losses):


Unrealized holding gains (losses), net of tax(1)


8.2


1.7


(23.9)

Reclassification adjustments for losses included in net earnings, net of tax(2)


4.5


15.3


12.2

Total unrealized gains (losses) on interest rate swaps, net of tax


12.7


17.0


(11.7)

Foreign currency translation adjustment, net of tax (3)


(1.2)


(0.4)


(0.1)

Unrealized (losses) gains on investments in unconsolidated affiliates, net of tax(4)


(0.3)


4.7


(6.8)

Other comprehensive earnings (loss)


11.2


21.3


(18.6)

Comprehensive earnings


461.2


201.2


227.2

Net losses attributable to redeemable noncontrolling interests


2.5


28.0


18.3

Comprehensive earnings attributable to Black Knight

$

463.7

$

229.2

$

245.5

Net earnings per share attributable to Black Knight common shareholders:


Basic

$

2.93

$

1.34

$

1.74

Diluted

$

2.91

$

1.33

$

1.73

Weighted average shares of common stock outstanding (see Note 5):


Basic


154.4


155.1


152.0

Diluted


155.6


155.8


152.9

(1)Net of income tax expense of $2.8 million and $0.6 million and income tax benefit of $8.1 million for the years ended December 31, 2022, 2021 and 2020, respectively.
(2)Amounts reclassified to net earnings relate to losses on interest rate swaps and are included in Interest expense, net above. Amounts are net of income tax benefit of $1.6 million, $5.2 million and $4.1 million for the years ended December 31, 2022, 2021 and 2020, respectively.
(3)Net of income tax benefit of $0.4 million for the year ended December 31, 2022 and less than $0.1 million for the years ended December 31, 2021 and 2020.
(4)Net of income tax benefit of $0.1 million, income tax expense of $1.6 million and income tax benefit of $2.3 million for the years ended December 31, 2022, 2021 and 2020, respectively.

See Notes to Consolidated Financial Statements.

56

Table of Contents

BLACK KNIGHT, INC.

Consolidated Statements of Equity

(In millions)

Accumulated

Additional

other

Total

Redeemable

Common stock

paid-in

Retained

comprehensive

Treasury stock

Shareholders'

noncontrolling


Shares


$


capital


earnings


loss


Shares


$


equity


interests

Balance, December 31, 2019


153.1

$

$

1,586.8

$

490.6

$

(20.2)

3.4

$

(158.7)

$

1,898.5

$

Effect of ASU 2016-13 adoption (Note 2)


(1.1)


(1.1)


Adjusted balance, January 1, 2020


153.1


1,586.8


489.5


(20.2)


3.4


(158.7)


1,897.4


Issuance of common stock, net of underwriters' discount and issuance costs


7.1

484.2

484.2

Grant of restricted shares of common stock


(24.9)


(0.5)


24.9


Forfeitures of restricted shares of common stock


0.6


(0.6)


Tax withholding payments for restricted share vesting


(0.1)


(22.4)


(22.4)


Vesting of restricted shares granted from treasury stock


10.2


0.2


(10.2)


Equity-based compensation expense


39.4


39.4


Contributions received for redeemable noncontrolling interests in Optimal Blue Holdco, LLC


578.0

Fair value adjustment to redeemable noncontrolling interests in Optimal Blue Holdco, LLC


(18.3)

(18.3)

18.3

Deferred income taxes recognized related to the contribution of Compass Analytics to Optimal Blue Holdco, LLC

(1.9)

(1.9)

Net earnings (loss)


264.1


264.1


(18.3)

Equity-based compensation expense of unconsolidated affiliates


3.8

3.8

Foreign currency translation adjustment


(0.1)


(0.1)


Unrealized losses on interest rate swaps, net


(11.7)


(11.7)


Other comprehensive loss on investments in unconsolidated affiliates


(6.8)


(6.8)


Balance, December 31, 2020

160.1

2,053.7

757.4

(38.8)


3.1

(144.6)

2,627.7

578.0

Fair value adjustment to redeemable noncontrolling interests in Optimal Blue Holdco, LLC


(638.8)


(638.8)


638.8

Grant of restricted shares of common stock


(35.3)


(0.7)


35.3


Forfeitures of restricted shares of common stock


3.0


(3.0)


Tax withholding payments for restricted share vesting


(0.1)


(25.6)


(25.6)


Vesting of restricted shares granted from treasury stock


12.2


0.3


(12.2)


Equity-based compensation expense


41.7


41.7


Net earnings (loss)


207.9


207.9


(28.0)

Equity-based compensation expense of unconsolidated affiliates


2.9


2.9


Purchases of treasury stock


2.0

(146.7)

(146.7)

Foreign currency translation adjustment


(0.4)


(0.4)


Unrealized gains on interest rate swaps, net


17.0


17.0


Other comprehensive gains on investments in unconsolidated affiliates


4.7


4.7


Balance, December 31, 2021


160.0

$

$

1,410.9

$

968.2

$

(17.5)


4.7

$

(271.2)

$

2,090.4

$

1,188.8

57

Table of Contents

BLACK KNIGHT, INC.

Consolidated Statements of Equity - (Continued)

(In millions)

Accumulated

Additional

other

Total

Redeemable

Common stock

paid-in

Retained

comprehensive

Treasury stock

shareholders'

noncontrolling


Shares


$


capital


earnings


loss


Shares


$


equity


interests

Balance, December 31, 2021


160.0

$

$

1,410.9

$

968.2

$

(17.5)


4.7

$

(271.2)

$

2,090.4

$

1,188.8

Fair value adjustment to redeemable noncontrolling interests in Optimal Blue Holdco, LLC


(17.3)


(17.3)


17.3

Acquisition of remaining redeemable noncontrolling interests in Optimal Blue Holdco, LLC


(1,156.0)

Grant of restricted shares of common stock


(52.1)


(0.9)


52.1


Forfeitures of restricted shares of common stock


2.4


(2.4)


Tax withholding payments for restricted share vesting


(17.8)


(17.8)


Vesting of restricted shares granted from treasury stock


14.2


0.3


(14.2)


Equity-based compensation expense


54.9


54.9


Net earnings (loss)


452.5


452.5


(2.5)

Equity-based compensation expense of unconsolidated affiliates


(3.6)


(3.6)


Foreign currency translation adjustment


(1.2)


(1.2)


Unrealized gains on interest rate swaps, net


12.7


12.7


Other comprehensive loss on investments in unconsolidated affiliates


(0.3)


(0.3)


Other


3.0


3.0


Balance, December 31, 2022


160.0

$

$

1,398.2

$

1,417.1

$

(6.3)


4.1

$

(235.7)

$

2,573.3

$

47.6

See Notes to Consolidated Financial Statements.

58

Table of Contents

BLACK KNIGHT, INC.

Consolidated Statements of Cash Flows

(In millions)


Year ended December 31, 

2022

2021

2020

Cash flows from operating activities:


Net earnings

$

450.0

$

179.9

$

245.8

Adjustments to reconcile net earnings to net cash provided by operating activities:


Depreciation and amortization


369.6

365.0


270.7

Amortization of debt issuance costs and original issue discount


3.8

3.9


3.4

Loss on extinguishment of debt

2.5

Deferred income taxes, net


(160.0)

(17.0)


(20.6)

Equity in earnings of unconsolidated affiliates, net of tax


(306.7)

(2.6)


(67.1)

Equity-based compensation


54.9

41.7


39.4

Changes in assets and liabilities, net of acquired assets and liabilities:


Trade receivables, including receivables from related parties


(7.6)

(5.9)


6.0

Prepaid expenses and other assets


(64.0)

(42.5)


(3.6)

Deferred contract costs


(42.3)

(57.9)


(46.9)

Deferred revenues


(43.8)

(3.9)


(20.7)

Trade accounts payable and other liabilities


(2.2)

(13.3)


9.0

Net cash provided by operating activities


251.7

449.9


415.4

Cash flows from investing activities:


Additions to property and equipment


(27.2)

(28.5)


(23.9)

Additions to software


(93.1)

(85.1)


(89.3)

Business acquisitions, net of cash acquired


(302.6)


(1,869.4)

Investment in Dun & Bradstreet Holdings, Inc. ("DNB")


(100.0)

Asset acquisitions


(10.0)


(15.0)

Other investing activities

(4.0)

(3.6)

8.4

Net cash used in investing activities


(124.3)

(429.8)


(2,089.2)

Cash flows from financing activities:


Net proceeds from issuance of common stock, before offering expenses

484.6

Costs directly associated with issuance of common stock

(0.4)

Issuance of senior unsecured notes, net of original issue discount

990.0

Revolver borrowings


750.6

660.4


600.6

Revolver payments


(461.6)

(452.1)


(862.9)

Term loan borrowings

1.6

Term loan payments


(28.8)


(54.7)

(Payments made) contributions received for redeemable noncontrolling interests


(433.5)


578.0

Purchases of treasury stock


(146.7)


Tax withholding payments for restricted share vesting


(17.8)

(25.6)


(22.4)

Finance lease payments


(0.8)

(3.6)


(13.0)

Debt issuance costs paid


(7.7)

(2.4)

Other financing activities


(0.4)

(4.0)


(4.3)

Net cash (used in) provided by financing activities


(192.3)

22.3


1,693.1

Net (decrease) increase in cash and cash equivalents


(64.9)

42.4


19.3

Cash and cash equivalents, beginning of period


77.1

34.7


15.4

Cash and cash equivalents, end of period

$

12.2

$

77.1

$

34.7

Supplemental cash flow information:


Interest paid, net

$

(97.0)

$

(80.4)

$

(46.8)

Income taxes paid, net

$

(165.1)

$

(52.7)

$

(52.5)

See Notes to Consolidated Financial Statements.

59

BLACK KNIGHT, INC. AND SUBSIDIARIES

NOTES TO CONSOLIDATED FINANCIAL STATEMENTS

Except as otherwise indicated or unless the context otherwise requires, all references to "Black Knight," the "Company”, "we," "us" or "our" are to Black Knight, Inc., a Delaware corporation ("BKI"), and its subsidiaries.

(1)Basis of Presentation

The accompanying audited consolidated financial statements were prepared in accordance with U.S. generally accepted accounting principles ("GAAP"), and all adjustments considered necessary for a fair presentation have been included. All significant intercompany accounts and transactions have been eliminated.

Description of Business

We are a premier provider of integrated, innovative, mission-critical, high-performance software solutions, data and analytics to the U.S. mortgage and real estate markets. Our mission is to transform the markets we serve by delivering innovative solutions that are integrated across the homeownership lifecycle and that result in realized efficiencies, reduced risk and new opportunities for our clients to help them achieve greater levels of success.

Reporting Segments

We conduct our operations through two reporting segments, (1) Software Solutions and (2) Data and Analytics. See further discussion in Note 19 — Segment Information.

Merger Agreement

On May 4, 2022, we entered into a definitive agreement to be acquired by Intercontinental Exchange, Inc. (“ICE”), a leading global provider of data, technology, and market infrastructure, in a transaction valued at approximately $13.1 billion, or $85 per share, with consideration in the form of a mix of cash (80%) and stock (20%) (the “ICE Transaction”). The aggregate cash consideration in the ICE Transaction consists of approximately $10.5 billion and the aggregate stock consideration is valued at approximately $2.6 billion based on ICE’s 10-day volume weighted average price as of May 2, 2022 of $118.09. Black Knight shareholders can elect to receive either cash or stock, subject to proration, with the value of the cash election and the stock election equalized at closing. The ICE Transaction is expected to close in the first half of 2023, subject to the receipt of regulatory approvals and the satisfaction of customary closing conditions. The ICE Transaction has been approved by the Boards of Directors of Black Knight and ICE. On September 21, 2022, we held a special meeting of our shareholders and the ICE Transaction was approved by our shareholders.

Under the Hart-Scott-Rodino Antitrust Improvements Act of 1976 (the “HSR Act’) and related rules, the ICE Transaction may not be completed until notifications have been given and information furnished to the Antitrust Division of the United States Department of Justice (the “Antitrust Division”) and the United States Federal Trade Commission, (the “FTC”) and all statutory waiting period requirements have been satisfied. Completion of the ICE Transaction is subject to the expiration or earlier termination of the applicable waiting period under the HSR Act. ICE and Black Knight each filed their respective HSR Act notification forms on May 18, 2022. On June 17, 2022, the parties each received a Request for Additional Information and Documentary Material (the “Second Request”) from the FTC with respect to the ICE Transaction. Accordingly, the HSR waiting period will expire 30 days after ICE and Black Knight each certify their substantial compliance with the Second Request, unless earlier terminated by the FTC or extended by agreement of the parties or court order.

TitlePoint Transaction

On November 18, 2022, we entered into a definitive agreement to sell our TitlePoint line of business (“TitlePoint”) within our Data and Analytics reporting segment to an affiliate of Fidelity National Financial, Inc. (“FNF”) for $225 million in cash, subject to a customary working capital adjustment. In connection with the contribution of Property Insight, LLC, which included TitlePoint, by affiliates of FNF to an affiliate of Black Knight in 2014, FNF had the right to repurchase TitlePoint in the event of a change in control of Black Knight. In connection with the proposed ICE Transaction, FNF notified us of its desire to repurchase TitlePoint. The TitlePoint transaction closed on January 1, 2023. Assets sold as part of the transaction are classified as assets held for sale on the Consolidated Balance Sheets as of December 31, 2022. Refer to Note 2 — Significant Accounting Policies for additional information.

60

Table of Contents

BLACK KNIGHT, INC. AND SUBSIDIARIES

NOTES TO CONSOLIDATED FINANCIAL STATEMENTS - (Continued)

(2)Significant Accounting Policies

The following describes our significant accounting policies that have been followed in preparing the accompanying consolidated financial statements.

Principles of Consolidation

The consolidated financial statements include the accounts of BKI, its wholly-owned subsidiaries and non-wholly owned subsidiaries in which we have a controlling financial interest either through voting rights or means other than voting rights. Intercompany transactions and balances have been eliminated in consolidation. Where our ownership interest in a consolidated subsidiary is less than 100%, the noncontrolling interests’ share of these non-wholly owned subsidiaries is reported in our consolidated balance sheets as a separate component of equity or within temporary equity. The noncontrolling interests’ share of the net earnings (loss) of these non-wholly owned subsidiaries is reported in our Consolidated Statements of Earnings and Comprehensive Earnings as an adjustment to our net earnings to arrive at Net earnings attributable to Black Knight.

We consolidate variable interest entities (“VIEs”) if we are considered the primary beneficiary because we have (a) the power to direct matters that most significantly impact the VIE’s economic performance and (b) the obligation to absorb losses or the right to receive benefits of the VIE that could potentially be significant to the VIE. For VIEs where we are not the primary beneficiary and do not control the VIE, but have the ability to exercise significant influence over the VIE, we use the equity method of accounting to report their results. The determination of the primary beneficiary involves judgment. Refer to the “Investments in Unconsolidated Affiliates” section below for additional information related to our equity method investments. Refer to the “Redeemable Noncontrolling Interests” section below and Note 3 — Business Acquisitions for additional information related to our acquisition of Optimal Blue Holdco, LLC (“Optimal Blue Holdco”).

Management Estimates

The preparation of these consolidated financial statements in conformity with GAAP requires management to make estimates and assumptions that affect the reported amounts of assets and liabilities and the reported amounts of revenues and expenses during the reporting periods. Actual results could differ from our estimates.

Cash and Cash Equivalents

Highly liquid instruments purchased with original maturities of three months or less are considered cash equivalents. Cash equivalents are invested with high credit quality financial institutions and consist of short-term investments, such as demand deposit accounts, money market accounts, money market funds and time deposits. The carrying amounts of these instruments reported in the Consolidated Balance Sheets approximate their fair value because of their immediate or short-term maturities.

Cash and cash equivalents are unrestricted and consist of the following (in millions):

December 31, 

2022


2021

Cash

$

4.3

$

24.0

Cash equivalents


7.9


53.1

Cash and cash equivalents

$

12.2

$

77.1

61

Table of Contents

BLACK KNIGHT, INC. AND SUBSIDIARIES

NOTES TO CONSOLIDATED FINANCIAL STATEMENTS - (Continued)

Trade Receivables, Net

A summary of Trade receivables, net of allowance for credit losses is as follows (in millions):

December 31, 

2022


2021

Trade receivables — billed

$

150.4

$

147.4

Trade receivables — unbilled


48.0


47.1

Trade receivables


198.4


194.5

Allowance for credit losses


(4.9)


(2.7)

Trade receivables, net

$

193.5

$

191.8

Allowance for Credit Losses

We record our billed and unbilled trade receivables and contract assets at their amortized cost less an allowance for estimated credit losses that are not expected to be recovered over the assets’ remaining lifetime based on management’s expectation of collectibility. We base our estimate on multiple factors including historical experience with bad debts, our relationship with our clients and their credit quality, the aging of respective asset balances, current macroeconomic conditions and management’s expectations of conditions in the future. Our allowance for expected credit losses is based on management’s assessment of the collectibility of assets with similar risk characteristics. We pool our respective asset balances based on risk characteristics primarily related to financial asset type, extent of client relationship, product/solution, business division and delinquency status.

Subsequent changes in the allowance are recorded in Operating expenses. We write off trade receivables in the period when the likelihood of collection of a trade receivable balance is considered remote.

The rollforward of allowance for credit losses for Trade receivables, net is as follows (in millions):

Year ended December 31, 


2022


2021


2020

Beginning balance

$

(2.7)

$

(2.1)

$

(1.3)

Effect of ASU 2016-13 adoption(1)


(0.5)

Bad debt expense


(3.8)


(1.2)


(1.2)

Write-offs, net of recoveries


0.9


0.6


0.9

Assets held for sale reclassification(2)

0.7

Ending balance

$

(4.9)

$

(2.7)

$

(2.1)

(1)On January 1, 2020, we adopted ASU 2016-13, Financial Instruments — Credit Losses, as well as several other related updates. Refer to section "Recent Accounting Pronouncements" below for details.
(2)Trade receivables and the related allowance for credit losses related to TitlePoint were reclassified to Assets held for sale in our Consolidated Balance Sheets as of December 31, 2022. Refer to the Assets held for sale section below.

62

Table of Contents

BLACK KNIGHT, INC. AND SUBSIDIARIES

NOTES TO CONSOLIDATED FINANCIAL STATEMENTS - (Continued)

Prepaid Expenses and Other Current Assets

Prepaid expenses and other current assets consist of the following (in millions):

December 31, 

2022


2021

Prepaid expenses

$

83.0

$

44.7

Contract assets, net


24.8


23.0

Income tax receivables

12.5

6.5

Other current assets


11.8


8.8

Prepaid expenses and other current assets

$

132.1

$

83.0

Contract Assets

A contract asset represents our expectation of receiving consideration in exchange for products or services that we have provided to our client but invoicing is contingent on our completion of other performance obligations or contractual milestones, primarily related to our loan origination system solutions. Contract assets and liabilities, or deferred revenues, are determined and presented on a net basis at the contract level since the rights and obligations in a contract with a client are interdependent. In contrast, a receivable is our right to consideration that is unconditional except for the passage of time required before payment of that consideration is due. The difference in timing of revenue recognition, billings and cash collections results in billed accounts receivable, unbilled receivables, contract assets and deferred revenues from client advances and deposits. We assess contract assets for impairment. Our short-term contract assets are included in Prepaid expenses and other current assets in our Consolidated Balance Sheets and includes an allowance for estimated credit losses of $0.3 million and $0.2 million as of December 31, 2022 and 2021, respectively. Our long-term contract assets are included in Other non-current assets in our Consolidated Balance Sheets. Refer to the section titled “Other Non-Current Assets” section below.

Assets Held for Sale

As noted in Note 1 – Basis of Presentation, on November 18, 2022 we entered into a definitive agreement to sell our TitlePoint line of business within our Data and Analytics reporting segment to an affiliate of FNF and the transaction was completed on January 1, 2023. The assets sold as part of the transaction meet the criteria to be classified as assets held for sale in the Consolidated Balance Sheets as of December 31, 2022 and were measured at the lower of carrying value or fair value less costs to sell. There were no impairment charges for the assets held for sale. The sale does not represent a strategic shift for us and does not qualify for reporting as a discontinued operation for financial statement purposes.

The major classes of assets included in Assets held for sale consist of the following (in millions):

December 31, 2022

Trade receivables, net

$

5.7

Software, net

3.2

Goodwill


69.4

Other current and non-current assets


1.0

Total assets held for sale

$

79.3

Property and Equipment, Net

Property and equipment, net is recorded at cost, less accumulated depreciation and amortization. Depreciation and amortization are computed using the straight-line method based on the following estimated useful lives of the related assets: 30 years for buildings and 3 to 7 years for furniture, fixtures and computer equipment. Leasehold improvements

63

Table of Contents

BLACK KNIGHT, INC. AND SUBSIDIARIES

NOTES TO CONSOLIDATED FINANCIAL STATEMENTS - (Continued)

are amortized using the straight-line method over the lesser of the initial term of the respective lease or the estimated useful life of such asset.

Software, Net

Software, net includes internally developed software, purchased software, software acquired in business combinations and asset acquisitions, less accumulated amortization. Software acquired in business combinations is recorded at its fair value and amortized using the straight-line method over its remaining estimated useful life. Purchased software is recorded at cost and amortized using the straight-line method over its estimated useful life. The useful life of software acquired in business combinations and purchased software ranges from 3 to 10 years.

Internal development costs are accounted for in accordance with ASC Topic 985, Software, Subtopic 20, Costs of Software to Be Sold, Leased, or Marketed, or ASC Topic 350, Intangibles - Goodwill and Other, Subtopic 40, Internal-Use Software. Judgment is required in determining the classification of our development costs under these two topics, especially for development of new software products in which marketing strategies may still be in development. We may rely on past practice in cases where that provides the best evidence.

For software products to be sold, leased or marketed, all costs incurred to establish technological feasibility are research and development costs and are expensed as they are incurred. Costs incurred subsequent to establishing technological feasibility, such as developers’ salaries, related payroll costs and costs of independent contractors, are capitalized and amortized on a product-by-product basis commencing on the date of general release to clients. We do not capitalize any costs once the product is available for general release to clients. Judgment is required in determining when technological feasibility of a product is established. The timing of when various research and development projects become technologically feasible or ready for release can cause fluctuations in the amount of research and development costs that are expensed or capitalized in any given period. Generally, we amortize capitalized costs on a straight-line basis. However, we use an accelerated amortization method equal to the ratio of revenues generated by the software solution in the current year as a percentage of the estimated current and future revenues over its estimated useful life if that ratio is greater than the percentage to be amortized using the straight-line method.

For internal-use software products, internal and external costs incurred during the preliminary project stage are expensed as they are incurred. Internal and external costs incurred during the application development stage are capitalized and amortized commencing on the date the product is ready for its intended use. We do not capitalize any costs once the software is ready for its intended use.

Amortization expense for software is recorded using the straight-line method over the software’s estimated useful life, generally ranging from 5 to 10 years. In January 2023, we completed an assessment of the useful lives of certain origination software solutions. Due to investments in the software and changes in technology, we determined we should increase the estimated useful lives of certain origination software solutions from 5 years to 7 years. This change in accounting estimate will be effective as of January 1, 2023.

Other Intangible Assets, Net

Other intangible assets, net consist primarily of client relationships that are recorded in connection with acquisitions at their fair value based on the results of a valuation analysis, less accumulated amortization. Intangible assets, other than those with indefinite lives, are amortized over their estimated useful lives ranging from 3 to 10 years from the acquisition date using either a straight-line or accelerated method. Client relationships are amortized using an accelerated method that takes into consideration expected client attrition rates over a period of up to 10 years from the acquisition date.

Our property records database, which is an intangible asset not subject to amortization, is reviewed for impairment at least annually and is included in Other non-current assets in our Consolidated Balance Sheets. Refer to section “Other Non-Current Assets” below.

64

Table of Contents

BLACK KNIGHT, INC. AND SUBSIDIARIES

NOTES TO CONSOLIDATED FINANCIAL STATEMENTS - (Continued)

Impairment Testing

Long-lived assets, including property and equipment, software and other intangible assets with definite useful lives are reviewed for impairment whenever events or changes in circumstances indicate that the carrying amount of an asset may not be recoverable. Recoverability of assets to be held and used is measured by comparison of the carrying amount of an asset to estimated undiscounted future cash flows expected to be generated by the asset. If the carrying amount of an asset exceeds its estimated future cash flows, an impairment charge is recognized in the amount by which the carrying amount of the asset exceeds the fair value of the asset. We did not have any events or circumstances indicating impairment of our long-lived assets for the years presented.

Goodwill

Goodwill represents the excess of cost over the fair value of identifiable assets acquired and liabilities assumed in business combinations. Goodwill is not amortized and is tested for impairment annually, or more frequently if circumstances indicate potential impairment, through a comparison of fair value to the carrying amount. Goodwill is tested for impairment at the reporting unit level. In evaluating the recoverability of goodwill, we consider the amount of excess fair value over the carrying value of each reporting unit, the period of time since a reporting unit’s last quantitative test, and other factors to determine whether to perform a qualitative test. When performing an annual goodwill impairment analysis based on a review of qualitative factors, we evaluate if events and circumstances exist that lead to a determination that the fair value of each reporting unit is more likely than not greater than its carrying amount. If we conclude that it is more likely than not that the fair value of a reporting unit is less than its carrying value, we perform a quantitative impairment test. The quantitative test includes determining the fair value of a reporting unit based on a weighted average of multiple valuation methods, primarily a combination of an income approach and a market approach, which are Level 3 and Level 2 inputs, respectively. The income approach includes the present value of estimated future cash flows, while the market approach uses earnings multiples of similar guideline public companies or of similar guideline industry transactions. If the fair value of a reporting unit exceeds its carrying amount, goodwill is not impaired and further testing is not required. We did not have any events or circumstances indicating impairment of our goodwill during the years presented.

Investments in Unconsolidated Affiliates

Investments in entities that we have the ability to exercise significant influence over, but not control, are accounted for using the equity method of accounting. Under the equity method of accounting, investments are recorded at the initial cost and are adjusted for subsequent additional investments and our share of earnings or losses and distributions. We record our share of equity-based compensation expense of unconsolidated affiliates as an adjustment to our investment with a related adjustment to our equity. We determined that cash dividends received from our equity method investment represent a return on investment and are recorded as a reduction in the carrying value of our investment and classified as cash flows from operating activities on our Consolidated Statements of Cash flows.

On July 6, 2020, our investment in Star Parent, L.P. (“Star Parent”), a former non-wholly owned subsidiary (and former parent of Dun & Bradstreet Holdings, Inc. (“DNB”)) was exchanged for an investment in DNB in conjunction with their initial public offering (“DNB IPO”). We own less than 20% of DNB but are considered to have the ability to exercise significant influence, but not control, primarily through our investment in DNB and an agreement with certain other DNB investors pursuant to which we agreed to collectively vote together on matters related to the election of DNB directors for a period of three years following the DNB IPO. For these reasons, we continue to account for our investment using the equity method of accounting. Our investment in DNB is recorded within Investments in unconsolidated affiliates on our Consolidated Balance Sheets, and related earnings and losses, including the related earnings and losses of our investment in Star Parent for the year ended December 31, 2020, are recorded in Equity in earnings of unconsolidated affiliates, net of tax in our Consolidated Statements of Earnings and Comprehensive Earnings. Refer to Note 4 – Investments in Unconsolidated Affiliates for additional information.

65

Table of Contents

BLACK KNIGHT, INC. AND SUBSIDIARIES

NOTES TO CONSOLIDATED FINANCIAL STATEMENTS - (Continued)

Deferred Contract Costs, Net

We capitalize incremental contract acquisition costs that relate directly to an existing contract or a specific anticipated contract and are expected to be recovered. Costs that would have been incurred regardless of whether the contract was obtained are expensed as incurred. As a practical expedient, we expense incremental costs of obtaining a contract if the amortization period of the asset would be one year or less.

We also consider whether to capitalize costs to fulfill a contract that may be incurred before we commence performance on an obligation. These costs represent incremental, recoverable external costs and certain internal costs that are directly related to the contract and are primarily associated with costs of resources involved in installation of systems, processes and data conversion.

Deferred contract costs are amortized on a systematic basis consistent with the transfer to the client of the solutions or services to which the asset relates. We consider the explicit term of the contract with the client, expected renewals and the rate of change related to our solutions in determining the amortization period, which ranges from 5 to 10 years.

In the event indications exist that a deferred contract cost asset related to a particular contract may not be recoverable, undiscounted estimated cash flows of the total period over which economic benefits for providing the related products or services are expected to be received are projected and compared to the unamortized deferred contract cost balance. If the projected cash flows and any unrecognized revenues are not adequate to recover the unamortized cost, an impairment charge would be recorded to reduce the carrying amount to the contract’s net realizable value, including any termination fees provided for under the contract, in the period such a determination is made.

Amortization expense for deferred contract costs is included in Depreciation and amortization in our Consolidated Statements of Earnings and Comprehensive Earnings. Refer to the "Depreciation and Amortization" section below.

Leases

We determine if an arrangement is a lease at contract inception. Right-of-use assets represent our right to use an underlying asset for the lease term, and lease liabilities represent our obligation to make lease payments according to the arrangement. Operating and finance lease right-of-use assets and lease liabilities are recognized as of the lease commencement date based on the present value of the lease payments over the lease term. We use the implicit rate when it is readily determinable. Otherwise, we use our incremental borrowing rate based on the information available as of the lease commencement date in determining the present value of lease payments. The lease term we use for the valuation of our right-of-use assets and lease liabilities may include options to extend or terminate the lease when it is reasonably certain that we will exercise those options. Lease expense is recognized on a straight-line basis over the expected lease term. From time to time, we may abandon one or more of our leased assets. Upon abandonment, we accelerate the amortization of right-of-use assets within lease expense.

Right-of-use assets for our operating leases are included in Other non-current assets in our Consolidated Balance Sheets. Refer to the “Other Non-Current Assets” section below. Right-of-use assets for our finance leases are included in Property and equipment, net in our Consolidated Balance Sheets. Refer to Note 7 — Property and Equipment. For discussion of our operating and finance lease liabilities refer to Note 11 — Long-Term Debt and Note 14 — Leases.

66

Table of Contents

BLACK KNIGHT, INC. AND SUBSIDIARIES

NOTES TO CONSOLIDATED FINANCIAL STATEMENTS - (Continued)

Other Non-Current Assets

Other non-current assets consist of the following (in millions):

December 31, 

2022


2021

Contract assets, net

$

107.9

$

80.2

Property records database

60.5

60.6

Right-of-use assets


24.8


32.9

Deferred compensation plan related assets


23.4


25.2

Contract credits


23.2


23.6

Prepaid expenses


4.4


4.5

Other


2.0


3.3

Other non-current assets

$

246.2

$

230.3

Non-current contract assets, net includes an allowance for estimated credit losses of $6.6 million and $1.2 million as of December 31, 2022 and 2021, respectively.

Trade Accounts Payable and Other Accrued Liabilities

Trade accounts payable and other accrued liabilities consist of the following (in millions):

December 31, 

2022


2021

Trade accounts payable

$

11.0

$

7.9

Lease liabilities, current

8.7

10.8

Other taxes payable and accrued


6.1


4.8

Accrued interest


12.6


12.3

Accrued client liabilities

2.6

3.8

Other


25.5


24.9

Trade accounts payable and accrued liabilities

$

66.5

$

64.5

Deferred Revenues

Deferred revenues, or contract liabilities, represent our obligation to transfer products or services to our clients for which we have received consideration, or an amount of consideration is due, from the client. During the years ended December 31, 2022, 2021 and 2020, revenues recognized related to the amount included in the Deferred revenues balance at the beginning of each year were $78.4 million, $48.9 million and $49.5 million, respectively.

Other Non-Current Liabilities

Other non-current liabilities consist of the following (in millions):

December 31, 

2022


2021

Lease liabilities, non-current (Note 14)

$

17.4

$

26.4

Deferred compensation plan

21.4

24.4

Unrealized losses on interest rate swaps (Note 11)

13.9

Other

9.1

14.0

Other non-current liabilities

$

47.9

$

78.7

67

Table of Contents

BLACK KNIGHT, INC. AND SUBSIDIARIES

NOTES TO CONSOLIDATED FINANCIAL STATEMENTS - (Continued)

Loss Contingencies

ASC Topic 450, Contingencies, requires that we accrue for loss contingencies associated with outstanding litigation, claims and assessments, as well as unasserted claims for which management has determined it is probable that a loss contingency exists and the amount of loss can be reasonably estimated. Refer to Note 13 — Commitments and Contingencies. Legal fees are expensed as incurred.

Redeemable Noncontrolling Interests

Prior to February 15, 2022, Optimal Blue Holdco was a non-wholly owned subsidiary and considered a VIE. We were the primary beneficiary of Optimal Blue Holdco through our controlling interest and our rights under the Second Amended and Restated Limited Liability Company Agreement of Optimal Blue Holdco dated November 24, 2020 (the “OB Holdco LLC Agreement”). As such, we controlled Optimal Blue Holdco and its subsidiaries, and we consolidated its financial position and results of operations. Prior to February 15, 2022, we owned 60% of Optimal Blue Holdco. Redeemable noncontrolling interests primarily represented the collective 40% equity interest in Optimal Blue Holdco owned by Cannae Holdings, LLC ("Cannae") and affiliates of Thomas H. Lee Partners, L.P. ("THL"). As these redeemable noncontrolling interests provided for redemption features not solely within our control, they were presented outside of shareholders' equity.

On February 15, 2022, we entered into a purchase agreement with Cannae and THL and acquired all of their issued and outstanding Class A units of Optimal Blue Holdco through Optimal Blue I, LLC (“Optimal Blue I”), a Delaware limited liability company and our wholly-owned subsidiary, in exchange for aggregate consideration of 36.4 million shares of DNB common stock valued at $722.5 million and $433.5 million in cash. The cash portion of the consideration is included as a financing cash outflow on the Consolidated Statements of Cash Flows and was funded with borrowings under our revolving credit facility. The aggregate consideration of $1.156 billion and number of shares of DNB common stock paid to Cannae and THL was based on the 20-day volume-weighted average trading price of DNB for the period ended on February 14, 2022. Since February 15, 2022, we own 100% of the Class A units of Optimal Blue Holdco.

Treasury Shares

Shares held in treasury are at cost. We charge the cost in excess of par value to Retained earnings when we cancel or retire treasury shares.

Revenues

We recognize revenues primarily relating to software and hosting solutions, professional services and data solutions. We are often party to multiple concurrent contracts or contracts that combine multiple solutions and services. These situations require judgment to determine if multiple contracts should be combined and accounted for as a single arrangement. In making this determination, we consider (i) the economics of each individual contract and whether or not it was negotiated on a standalone basis and (ii) if multiple promises represent a single performance obligation. Many times these arrangements include offerings from more than one segment to the same client.

At contract inception, we assess the performance obligations, or deliverables, we have agreed to provide in the contract and determine if they are individually distinct or if they should be combined with other performance obligations. We combine performance obligations when an individual performance obligation does not have standalone value to our client. For example, we typically combine the delivery of complex, proprietary implementation-related professional services with the delivery of the related software solution.

Contract modifications require judgment to determine if the modification should be accounted for as (i) a separate contract, (ii) the termination of the original contract and creation of a new contract or (iii) a cumulative catch-up adjustment to the original contract. When evaluating contract modifications, we must identify the performance obligations of the

68

Table of Contents

BLACK KNIGHT, INC. AND SUBSIDIARIES

NOTES TO CONSOLIDATED FINANCIAL STATEMENTS - (Continued)

modified contract and determine both the allocation of revenues to the remaining performance obligations and the period of recognition for each identified performance obligation.

We include any fixed consideration within our contracts as part of the total transaction price. Generally, we include an estimate of the variable amount within the total transaction price and update our assumptions over the duration of the contract. We do not include taxes collected from clients and remitted to governmental authorities. The transaction price is allocated to our performance obligations in proportion to their relative standalone selling prices (“SSP”). SSP is the price for which we would sell a distinct solution or service separately to a client and is determined at contract inception. For a majority of our revenues, we have observable selling prices for our related solutions and services. However, if observable selling prices are not available, establishing SSP requires significant judgment. The estimated SSP considers all reasonably available information, including market conditions, demands, trends, our specific factors and information about the client or class of client. The adjusted market approach is generally used for new solutions and services or when observable inputs are limited or not available.

The following describes the nature of our primary sources of revenue and the related revenue recognition policies:

Software Solutions Revenues

Software solutions revenues are primarily comprised of software as a service (“SaaS”) offerings for various platforms that perform processing and workflow management as well as provide data and analytics. To a lesser extent, we sell software licenses where hosting services may or may not be included in the arrangement. Contracts for software and hosting solutions typically span five to seven years.

For our SaaS offerings, we promise our clients to stand ready to provide continuous access to our processing platforms and perform an unspecified quantity of processing services for a specified term. For this reason, processing services are generally viewed as a stand-ready performance obligation comprised of a series of distinct daily services. We typically satisfy these performance obligations over time as the services are provided. A time-elapsed output method is used to measure progress because our efforts are expended evenly throughout the period given the nature of the promise is a stand-ready service. We evaluate our variable payment terms related to these revenues, and they generally meet the criteria for allocating variable consideration entirely to one or more, but not all, performance obligations in a contract. Accordingly, when the criteria are met, variable amounts based on the number and type of services performed during a period are allocated to and recognized on the day in which we perform the related services. Fixed fees for processing services are generally recognized ratably over the contract period.

Our software licenses generally have significant standalone functionality to our clients upon delivery. Our software licenses are generally considered distinct performance obligations, and revenue allocated to the software license is typically recognized at a point in time upon delivery of the license.

In conjunction with software licenses, we commonly provide our clients with additional services such as maintenance as well as associated implementation and other professional services related to the software license. Maintenance is typically comprised of technical support and unspecified updates and upgrades. We generally satisfy these performance obligations evenly using a time-elapsed output method over the contract term given there is no discernible pattern of performance. When a software license contract also includes professional services that provide significant modification or customization of the software license, we combine the software license and professional services into a single performance obligation, and revenues for the combined performance obligation are recognized as the professional services are provided consistent with the methods described below for professional services revenues.

We have contracts where the licensed software is offered in conjunction with hosting services. The licensed software may be considered a separate performance obligation from the hosting services if the client can take possession of the software during the contractual term without incurring a significant penalty and if it is feasible for the client to run the software on its own infrastructure or hire a third party to host the software. If the licensed software and hosting services are separately identifiable, license revenue is recognized when the hosting services commence and it is within the client’s

69

Table of Contents

BLACK KNIGHT, INC. AND SUBSIDIARIES

NOTES TO CONSOLIDATED FINANCIAL STATEMENTS - (Continued)

control to obtain a copy of the software, and hosting revenue is recognized using the time-elapsed output method as the service is provided. If the software license is not separately identifiable from the hosting service, then the related revenues for the combined performance obligation is recognized ratably over the hosting period.

Professional Services Revenues

Professional services revenues are generally comprised of implementation, conversion, programming, training and consulting services associated with our SaaS and licensed software agreements. Professional services such as training, dedicated teams and consulting services are generally distinct. Distinct professional services revenues are primarily billed on a time and materials basis, and revenues are recognized over time as the services are performed. A portion of our professional services revenues are derived from contracts for dedicated personnel resources who are often working full-time at a client site and under the client’s direction. These revenues generally recur as contracts are renewed.

In assessing whether implementation services provided on SaaS or licensed software agreements are a distinct performance obligation, we consider whether the services are both capable of being distinct (i.e., the client can benefit from the services alone or in combination with other resources that are readily available to the client) and distinct within the context of the contract (i.e., separately identifiable from the other performance obligations in the contract). Professional services that are not distinct from an associated solution or offering are recognized over the common measure of progress for the overall performance obligation (typically a time-elapsed output measure that corresponds to the period over which the solution or offering is made available to the client).

Data Solutions Revenues

Revenues from data solutions are primarily from licenses for new and historical property ownership data and valuation-related analytical services and are generally distinct. License fees are recognized at a point in time upon delivery. Revenues allocated to data updates are recognized ratably over the period the updates are provided. In addition, to the extent that we provide continuous access to data through a hosted software platform, we recognize revenues ratably over the contract term.

Operating Expenses

Operating expenses include all costs, excluding depreciation and amortization, incurred by us to produce revenues. Operating expenses primarily include compensation costs, including equity-based compensation and benefits, software and hardware maintenance costs, professional services fees, rent-related costs, software subscription costs and cloud computing costs. Equity-based compensation is included within Corporate and Other in Note 19 — Segment Information.

General and administrative expenses, which are primarily included in Operating expenses within Corporate and Other in Note 19 — Segment Information, include compensation costs, including benefits and equity-based compensation, professional services fees, insurance, rent-related costs, software subscription costs and other costs associated with the enterprise risk, finance, human resources, marketing, legal and other support functions.

Equity-Based Compensation

We expense employee equity-based payments under ASC Topic 718, Compensation—Stock Compensation, which requires compensation cost, measured using the grant date fair value of equity-based payments, to be recognized over the requisite service period, which generally equals the vesting period. For awards with a performance condition, we recognize compensation cost under the graded vesting method over the requisite service period of the award, which at times results in accelerated recognition of the cost. We do not recognize compensation cost if the performance condition is not considered probable of achievement. If at any point we determine that the performance condition is improbable of achievement, we reverse any previously recognized compensation cost for that award.

70

Table of Contents

BLACK KNIGHT, INC. AND SUBSIDIARIES

NOTES TO CONSOLIDATED FINANCIAL STATEMENTS - (Continued)

The fair value of our restricted stock awards is measured based on the closing market price of our stock on the grant date. The fair value of the Optimal Blue Holdco profit interest units (“OB PIUs”) is measured using the Black-Scholes model. Income tax effects of awards are recorded in our Consolidated Statements of Earnings and Comprehensive Earnings when the awards vest or are settled. We account for forfeitures as they occur.

Depreciation and Amortization

Depreciation and amortization includes the following (in millions):

Year ended December 31, 

2022

2021


2020

Other intangible assets

$

143.1

$

159.1

$

86.6

Software

143.1

131.3

110.4

Property and equipment


38.4


40.4


39.8

Deferred contract costs


45.0


34.2


33.9

Total

$

369.6

$

365.0

$

270.7

Deferred contract costs amortization for the years ended December 31, 2022, 2021 and 2020 includes accelerated amortization of $5.9 million, $0.5 million and $0.1 million, respectively.

Transition and Integration Costs

Transition and integration costs primarily consists of costs related to the ICE Transaction, costs associated with acquisitions including costs pursuant to purchase agreements and expense reduction initiatives.

Interest Expense, Net

Interest expense, net consists primarily of interest expense on our borrowings, amortization of our debt issuance costs and original issue discount, payments on our interest rate swaps, commitment fees on our revolving credit facility and administrative agent fees net of capitalized interest and interest income. Debt issuance costs are amortized using the effective interest method over the expected repayment period of the debt.

Income Taxes

Black Knight is treated as a corporation under applicable federal and state income tax laws. We are subject to income tax in the U.S. and certain state jurisdictions in which we operate and record the tax effects as a part of the tax accounting process of preparing the consolidated financial statements. Our India subsidiary is subject to income tax in India.

The tax accounting process involves calculating current tax expense together with assessing basis differences resulting from differing recognition of items for income tax and GAAP accounting purposes. These differences result in current and deferred income tax assets and liabilities, which are included within the Consolidated Balance Sheets. Deferred tax assets and liabilities are measured using enacted tax rates expected to apply to taxable earnings in the years in which those temporary differences are expected to be recovered or settled. The effect on deferred taxes of changes in tax rates and laws in future periods, if any, is reflected in the consolidated financial statements in the period enacted. We must then assess the likelihood that deferred income tax assets will be recovered from future taxable earnings and, to the extent we believe that recovery is not likely, establish a valuation allowance. We believe that based on our historical pattern of taxable earnings, projections of future earnings, tax planning strategies, reversing taxable timing differences and other relevant evidence, we will produce sufficient earnings in the future to realize recorded deferred income tax assets. To the extent we establish a valuation allowance or increase an allowance in a period, we would reflect the increase as expense within Income tax expense in the Consolidated Statements of Earnings and Comprehensive Earnings.

71

Table of Contents

BLACK KNIGHT, INC. AND SUBSIDIARIES

NOTES TO CONSOLIDATED FINANCIAL STATEMENTS - (Continued)

Determination of income tax expense requires estimates and can involve complex issues that may require an extended period to resolve. Further, the estimated level of annual earnings before income tax can cause the overall effective income tax rate to vary from period to period. We believe our tax positions comply with applicable tax law, and we adequately provide for any known tax contingencies. Final determination of prior-year tax liabilities, either by settlement with tax authorities or expiration of statutes of limitations, could be materially different than estimates reflected in assets and liabilities and historical income tax expense. The outcome of these final determinations could have a material effect on our income tax expense, net earnings or cash flows in the period that determination is made.

We record interest and penalties related to income taxes, if any, as a component of Income tax expense on the Consolidated Statements of Earnings and Comprehensive Earnings. Refer to Note 18 — Income Taxes for additional information.

Earnings Per Share

Basic net earnings per share is computed by dividing Net earnings attributable to Black Knight by the weighted-average number of shares of common stock outstanding during the period. Diluted net earnings per share includes the effect of unvested restricted stock awards, restricted stock unit awards (“RSUs”) and OB PIUs. Refer to Note 5 — Earnings Per Share for more information.

Business Acquisitions

We include the results of operations of acquired businesses beginning on the respective acquisition dates. The purchase price is allocated to the tangible and intangible assets acquired and the liabilities assumed based on their estimated fair values at the acquisition date, with the excess recorded as goodwill. Measurement period adjustments to provisional purchase price allocations are recognized in the period in which they are determined, with the effect on earnings of changes in depreciation, amortization or other income resulting from such changes calculated as if the accounting had been completed on the acquisition date. Acquisition-related costs are expensed as incurred.

The fair value of the acquired Software and Other intangible assets are primarily determined using a third-party valuation based on significant estimates and assumptions, including Level 3 inputs, which are judgmental in nature. These estimates and assumptions include the projected timing and amount of future cash flows and discount rates reflecting the risk inherent in the future cash flows.

Recent Accounting Pronouncements

Recently Adopted Pronouncements

In June 2016, the Financial Accounting Standards Board ("FASB") issued Accounting Standards Update ("ASU") 2016-13, Financial InstrumentsCredit Losses, as well as several other related updates, which were codified as ASC Topic 326, Financial Instruments - Credit Losses ("ASC 326"). The new standard requires companies to immediately recognize an estimate of credit losses expected to occur over the remaining life of the financial assets included in the scope of this standard. Our financial assets that are included in the scope of these updates are primarily trade receivables and contract assets. The primary effect of adopting the new standard relates to the changes in our estimated credit losses and providing additional disclosures about our financial assets that are included in the scope of this new standard. We adopted ASC 326 on January 1, 2020 using a modified retrospective approach. The effect of this adoption was an adjustment of $1.1 million, net of tax, to our opening Retained earnings on our Consolidated Statements of Equity.

In October 2021, the FASB issued ASU 2021-08, Business Combinations (Topic 805): Accounting for Contract Assets and Contract Liabilities from Contracts with Customers. This update requires contract assets and contract liabilities acquired in business combinations to be recognized and measured in accordance with ASC Topic 606, Revenues from Contracts with Customers. It is expected that an acquirer will generally recognize and measure acquired contract assets and contract liabilities in a manner consistent with how the acquiree recognized and measured them in its pre-acquisition

72

Table of Contents

BLACK KNIGHT, INC. AND SUBSIDIARIES

NOTES TO CONSOLIDATED FINANCIAL STATEMENTS - (Continued)

financial statements. This update is effective for fiscal years, and interim periods within those fiscal years, beginning after December 15, 2022 with early adoption permitted, including in an interim period. We early adopted this update in the fourth quarter of 2021 and applied its amendments to each of our 2021 acquisitions. This update did not have a material effect on our consolidated financial statements and related disclosures.

(3)Business Acquisitions

2021 Acquisitions

On March 16, 2021, we completed the acquisition of the technology assets and business of NexSpring Financial, LLC (“NexSpring”), which is reported within our Software Solutions segment, to broaden our ability to serve mortgage brokers.

On May 17, 2021, we completed the acquisition of 100% of the equity interests in eMBS, Inc. (“eMBS”), a leading data and analytics aggregator for residential mortgage-backed securities, which is reported within our Data & Analytics segment, to solidify and further expand our market leadership in solutions and data for agency-backed securities.

On July 7, 2021, we completed the acquisition of 100% of the equity interests in TOMN Holdings, Inc. and its subsidiaries (“Top of Mind”), which is reported within our Software Solutions segment. Top of Mind is the developer of SurefireSM, a leading customer relationship management and marketing automation system for the mortgage industry.

2020 Acquisitions

On March 3, 2020, we completed the acquisition of Collateral Analytics, LLC (“Collateral Analytics”), which is reported within our Data and Analytics segment because it enhances our real estate solutions and automated valuation model offerings.

On August 27, 2020, we completed the acquisition of DocVerify®, which is reported within our Software Solutions segment and helps accelerate Black Knight’s goal of digitizing the entirety of the real estate and mortgage continuum as DocVerify®’s trusted and proven digital document verification capabilities are integrated with Expedite®Close, our digital closing platform.

On July 26, 2020, we entered into a definitive equity purchase agreement with affiliates of private equity firm GTCR, LLC, to purchase Optimal Blue, a leading provider of secondary market solutions and actionable data services. We also entered into forward purchase agreements with Cannae and affiliates of THL (collectively, the "FPAs"), whereby Cannae and affiliates of THL agreed to each acquire 20% of the equity interests of a newly formed entity, Optimal Blue Holdco, for a purchase price of $289.0 million. Optimal Blue Holdco was formed for the purpose of acquiring Optimal Blue.

On September 15, 2020, we completed a series of transactions and completed the acquisition of Optimal Blue. In connection with the acquisition of Optimal Blue, we contributed $762.0 million in cash and Compass Analytics, LLC ("Compass Analytics") to Optimal Blue Holdco. In addition, Black Knight InfoServ, LLC ("BKIS"), our indirect, wholly-owned subsidiary, provided $500.0 million in cash in exchange for a note with Optimal Blue Holdco (the "OB Holdco Note"). The OB Holdco Note bears interest at a rate of 6.125%, which is payable on a semi-annual basis beginning March 1, 2021, and matures on September 1, 2028. Immediately prior to the closing of the Optimal Blue acquisition, we, together with BKT, our indirect, wholly-owned subsidiary, Optimal Blue Holdco, Cannae and THL, entered into the initial OB Holdco LLC Agreement. As of December 31, 2021, we owned 60% of Optimal Blue Holdco.

Optimal Blue is reported within our Software Solutions segment because it enhances our robust set of software solutions and includes additional product, pricing and eligibility capabilities. During the year ended December 31, 2021, we recorded a measurement period adjustment of $8.1 million primarily reducing deferred income taxes for certain book and tax basis differences as we completed the tax return filings for the pre-acquisition period. On February 15, 2022, we acquired the remaining outstanding Class A units in Optimal Blue Holdco. Refer to Note 2 — Significant Accounting Policies for additional information.

73

Table of Contents

BLACK KNIGHT, INC. AND SUBSIDIARIES

NOTES TO CONSOLIDATED FINANCIAL STATEMENTS - (Continued)

Total cash paid net of cash acquired for our 2020 acquisitions was $1,869.4 million.

Allocation of purchase price

The following table summarizes the total purchase price consideration and the fair value amounts recognized for the assets acquired and liabilities assumed, including the effect of measurement period adjustments (in millions):

2021

Acquisitions(1)

Cash paid

$

307.6

Contingent consideration(2)

4.4

Less: cash acquired


(5.0)

Total consideration, net

$

307.0

Software

$

34.9

Other intangible assets(3)


80.0

Goodwill


211.9

Other current and non-current assets


4.2

Total assets acquired


331.0

Deferred income taxes


15.6

Current and other non-current liabilities


8.4

Total liabilities assumed


24.0

Net assets acquired

$

307.0

(1)During the year ended December 31, 2022, we recorded a measurement period adjustment of $0.1 million primarily related to deferred income taxes for certain book and tax basis differences as we completed the tax return filings for the pre-acquisition period.
(2)The NexSpring purchase agreement requires us to pay additional cash consideration based on NexSpring revenues recognized over the three-year period subsequent to the acquisition.
(3)Other intangible assets primarily consist of client relationships assets of $76.3 million.

For the years ended December 31, 2021 and 2020, we incurred direct transaction costs of $3.8 million and $15.0 million in connection with our 2021 acquisitions and the acquisition of Optimal Blue in 2020, respectively. Transaction costs are included in Transition and integration costs on the Consolidated Statements of Earnings and Comprehensive Earnings.

For the period September 15, 2020 through December 31, 2020, Optimal Blue’s revenues of $37.6 million and pre-tax loss of $19.0 million are included in our Consolidated Statements of Earnings and Comprehensive Earnings.

Unaudited Pro Forma Results

Our 2021 and 2020 acquisitions, excluding Optimal Blue, were not material individually or in the aggregate to our consolidated financial statements.

Unaudited pro forma results of operations for the year ended December 31, 2020, assuming the Optimal Blue acquisition had occurred as of January 1, 2020, are presented below (in millions, except per share amounts):


December 31, 2020

Revenues

$

1,320.0

Net earnings

$

200.6

74

Table of Contents

BLACK KNIGHT, INC. AND SUBSIDIARIES

NOTES TO CONSOLIDATED FINANCIAL STATEMENTS - (Continued)

The unaudited pro forma results include certain pro forma adjustments that were directly attributable to the acquisition, assuming the acquisition had occurred on January 1, 2020, including the following:

additional amortization expense that would have been recognized relating to the acquired intangible assets;
adjustments to interest expense to reflect the additional debt we incurred related to partially finance the acquisition; and
a reduction of expenses for acquisition-related transaction costs of $15.0 million for the year ended December 31, 2020.

(4)Investments in Unconsolidated Affiliates

DNB Investment

DNB is a leading global provider of business decisioning data and analytics. On July 6, 2020, our investment in Star Parent was exchanged for an investment in DNB in conjunction with the DNB IPO. As of July 6, 2020, our ownership interest in DNB outstanding common stock was 13.0%.

On January 8, 2021, DNB completed its acquisition of Bisnode Business Information Group AB (the “Bisnode acquisition”). In connection with the Bisnode acquisition, DNB issued 6.2 million shares of common stock, which resulted in a decrease in our ownership interest in DNB to 12.8% at that time.

On February 15, 2022, we exchanged approximately 36.4 million shares of DNB common stock in connection with our acquisition of the remaining Class A units in Optimal Blue Holdco from Cannae and THL. The number of shares of DNB common stock was valued at $722.5 million based on the 20-day volume-weighted average trading price of DNB for the period ended February 14, 2022. We recognized a gain of $305.4 million, net of tax of $102.6 million, related to this transaction. As of December 31, 2022, we owned 18.5 million shares of DNB common stock for an ownership interest of approximately 4% of DNB’s outstanding common stock.

During the year ended December 31, 2022, we received quarterly cash dividends for a total of $1.8 million related to our ownership in DNB common stock. On February 9, 2023 DNB declared a quarterly cash dividend of $0.05 per share payable on March 16, 2023 to DNB’s shareholders of record as of March 2, 2023.

As of December 31, 2022, DNB’s closing share price was $12.26, and the fair value of our investment in DNB was $226.5 million before tax. Assuming a statutory tax rate of 25.5%, the estimated after-tax value of our investment in DNB was $211.0 million.

Summarized consolidated financial information for DNB is presented below (in millions):

December 31, 

2022

2021

Current assets

$

703.9

$

718.0

Non-current assets


8,768.0


9,279.2

Total assets

$

9,471.9

$

9,997.2

Current liabilities, including short-term debt

$

1,102.6

$

1,004.9

Non-current liabilities


4,860.9


5,247.0

Total liabilities


5,963.5


6,251.9

Total equity


3,508.4


3,745.3

Total liabilities and shareholders' equity

$

9,471.9

$

9,997.2

75

Table of Contents

BLACK KNIGHT, INC. AND SUBSIDIARIES

NOTES TO CONSOLIDATED FINANCIAL STATEMENTS - (Continued)

Year ended December 31, 

2022

2021


2020

Revenue

$

2,224.6

$

2,165.6

$

1,738.7

Loss before provision (benefit) for income taxes and equity in net income of affiliates

$

(27.2)

$

(45.2)

$

(226.4)

Net income (loss)

$

4.1

$

(65.9)

$

(111.6)

Net loss attributable to DNB

$

(2.3)

$

(71.7)

$

(180.6)

The summarized consolidated financial information above was derived from DNB’s audited consolidated financial statements as of and for the years ended December 31, 2022, 2021 and 2020. Effective January 1, 2021, DNB eliminated the one-month reporting lag for its subsidiaries outside North America and aligned the fiscal year-end for all its subsidiaries to December 31. DNB applied this change in their accounting policy retrospectively. The effect of this change in accounting policy did not have a material impact to our results of operations or financial condition and is included in our accounting for our investment in DNB for the year ended December 31, 2021.

Equity in earnings (losses) of unconsolidated affiliates, net of tax consists of the following (in millions):

Year ended December 31,


2022


2021


2020

Equity in earnings (losses) of unconsolidated affiliates, net of tax

$

1.3

$

(7.3)

$

(26.1)

Gain related to DNB investment, net of tax

305.4

Non-cash gain related to DNB's issuance of common stock, net of tax


9.9


88.2

Sale of an equity method investment, net of tax(1)

5.0

Equity in earnings of unconsolidated affiliates, net of tax

$

306.7

$

2.6

$

67.1

(1)On May 15, 2020, we sold our interest in an equity method investment and recognized a gain of $5.0 million, net of tax, which is included in Equity in earnings of unconsolidated affiliates, net of tax in our Consolidated Statements of Earnings and Comprehensive Earnings for the year ended December 31, 2020. In connection with the sale, we received $8.4 million in cash at closing and recorded a receivable of $1.8 million. In June 2021, we received the remaining $1.8 million. The original investment was not material to Black Knight.

(5)Earnings Per Share

Diluted net earnings per share include the effect of unvested restricted stock awards, restricted stock unit awards (“RSUs”) and OB PIUs. In 2020, the outstanding OB PIUs were excluded from the diluted earnings per share calculations because the effect of their inclusion was antidilutive. The following table sets forth the computation of basic and diluted earnings per share (in millions, except per share amounts):

Year ended December 31, 

2022

2021


2020

Basic:


Net earnings attributable to Black Knight

$

452.5

$

207.9

$

264.1

Shares used for basic net earnings per share:


Weighted average shares of common stock outstanding


154.4


155.1


152.0

Basic net earnings per share

$

2.93

$

1.34

$

1.74

Diluted:


Net earnings attributable to Black Knight

$

452.5

$

207.9

$

264.1

Shares used for diluted net earnings per share:


Weighted average shares of common stock outstanding


154.4


155.1


152.0

Dilutive effect of unvested restricted shares of common stock and OB PIUs


1.2


0.7


0.9

Weighted average shares of common stock, diluted


155.6


155.8


152.9

Diluted net earnings per share

$

2.91

$

1.33

$

1.73

76

Table of Contents

BLACK KNIGHT, INC. AND SUBSIDIARIES

NOTES TO CONSOLIDATED FINANCIAL STATEMENTS - (Continued)

(6)Related Party Transactions

Our service arrangements with related parties are priced within the range of prices we offer to third parties. We believe the amounts earned from or charged by us under each of the following arrangements are fair and reasonable. However, the amounts we earned or that were charged under these arrangements were not negotiated at arm’s length and may not represent the terms that we might have obtained from an unrelated third party.

DNB

DNB is considered to be a related party primarily due to the combination of our investment in DNB and our Executive Chairman, who is also the Chief Executive Officer of DNB. Refer to Note 4 — Investments in Unconsolidated Affiliates for additional details.

In June 2021, we entered into a five-year agreement with DNB to provide certain products and data over the term of the agreement, as well as professional services, for an aggregate fee of approximately $34 million over the term of the agreement. During the same period, we also entered into an agreement with DNB for access to certain of their data assets for an aggregate fee of approximately $24 million over the term of the agreement. In addition, we jointly market certain solutions and data.

In 2020, we entered into a services agreement with DNB. The agreement is cancellable upon mutual agreement. Pursuant to the agreement, we provide DNB certain support services in exchange for fees in an amount of our cost plus a 10% markup.

The following is a summary of amounts related to agreements with DNB included in our Consolidated Balance Sheets (in millions):


December 31, 

2022

2021

Receivables from related parties

$

0.1

$

0.2

Prepaid expenses and other current assets


2.3


2.3

Deferred revenues (current)

6.2

6.2

Deferred revenues (non-current)


1.4

The following is a summary of amounts related to agreements with DNB included in our Consolidated Statements of Earnings and Comprehensive Earnings (in millions):

Year ended December 31, 

2022

2021

Revenues

$

7.4

$

2.9

Operating expenses


4.7


2.3

For the year ended December 31, 2020, the amounts related to agreements with DNB included in our Consolidated Statements of Earnings and Comprehensive Earnings were less than $0.1 million.

During the year ended December 31, 2022, we received quarterly cash dividends totaling $1.8 million from DNB. Refer to Note 4 – Investments in Unconsolidated Affiliates for additional details.

Trasimene

During the year ended December 31, 2020, we entered into a non-exclusive advisory services agreement with Trasimene Capital Management, LLC ("Trasimene") for services that may include evaluating, negotiating and closing

77

Table of Contents

BLACK KNIGHT, INC. AND SUBSIDIARIES

NOTES TO CONSOLIDATED FINANCIAL STATEMENTS - (Continued)

various acquisition, financing and strategic corporate transactions. Transaction fees for services provided are primarily based on the size of the transaction and do not exceed market rates.

Prior to June 16, 2021, Trasimene was considered a related party because the former Chairman of our Board of Directors (the “Board”) owns a controlling interest in Trasimene. As of June 16, 2021, our former Chairman retired from the Board and became our Chairman Emeritus, and Trasimene is no longer considered a related party.

During the period January 1, 2021 through June 16, 2021 and the year ended December 31, 2020, we recognized $0.5 million and $8.3 million in fees to Trasimene, respectively, for assistance with acquisitions, which are included in Transition and integration costs in our Consolidated Statements of Earnings and Comprehensive Earnings.

(7)Property and Equipment

Property and equipment, net consist of the following (in millions):

December 31, 


2022


2021

Computer equipment

$

227.6

$

256.6

Buildings and improvements


93.4


90.5

Furniture, fixtures and other equipment


12.1


12.1

Land

11.9

11.9

Leasehold improvements


9.9


9.8

Property and equipment


354.9


380.9

Accumulated depreciation and amortization


(211.9)


(226.4)

Property and equipment, net

$

143.0

$

154.5

(8)Software

Software, net consists of the following (in millions):


December 31, 

2022

2021

Internally developed software

$

1,182.9

$

1,123.6

Purchased software


96.3


94.3

Software


1,279.2


1,217.9

Accumulated amortization


(835.5)


(720.9)

Software, net

$

443.7

$

497.0

During the year ended December 31, 2020, software valued at $25.5 million was received related to agreements previously entered into in 2019 to acquire software in exchange for a combination of cash consideration and certain of our products and services. The transaction resulted in non-cash investing activity of $10.5 million for the year ended December 31, 2020.

78

Table of Contents

BLACK KNIGHT, INC. AND SUBSIDIARIES

NOTES TO CONSOLIDATED FINANCIAL STATEMENTS - (Continued)

Estimated amortization expense on software for the next five fiscal years is as follows (in millions):

2023(1)


$

136.9

2024


95.0

2025


79.1

2026


55.2

2027


40.9

(1)Assumes assets not in service as of December 31, 2022 are placed in service equally throughout the year.

(9)Other Intangible Assets

Other intangible assets consist of the following (in millions):


December 31, 2022


December 31, 2021

Gross carrying 


Accumulated 


Net carrying 


Gross carrying 


Accumulated 


Net carrying 

amount

amortization

amount

amount

amortization

amount

Client relationships

$

1,282.2

$

(819.1)

$

463.1

$

1,282.2

$

(680.6)

$

601.6

Other


22.5


(15.5)


7.0


22.5


(10.9)


11.6

Total intangible assets

$

1,304.7

$

(834.6)

$

470.1

$

1,304.7

$

(691.5)

$

613.2

Estimated amortization expense on other intangible assets for the next five fiscal years is as follows (in millions):

2023


$

118.5

2024


92.4

2025


77.8

2026


63.0

2027


49.2

(10)Goodwill

Goodwill consists of the following (in millions):


Software 


Data and 


Solutions

Analytics

Total

Balance, December 31, 2020

$

3,415.8

$

197.6

$

3,613.4

2021 acquisitions

194.7

17.3

212.0

2020 Optimal Blue acquisition

(8.1)

(8.1)

Balance, December 31, 2021

3,602.4

214.9

3,817.3

2021 Top of Mind acquisition

(0.1)

(0.1)

Assets held for sale

(69.4)

(69.4)

Balance, December 31, 2022

$

3,602.3

$

145.5

$

3,747.8

The decrease in goodwill during the year ended December 31, 2022 primarily relates to the assets held for sale for the TitlePoint transaction. Refer to Note 1 – Basis of Presentation and Note 2 – Significant Accounting Policies. The decrease in goodwill during the year ended December 31, 2021 related to a measurement period adjustment primarily related to deferred income taxes related to the acquisition of Optimal Blue. Refer to Note 3 – Business Acquisitions.

79

Table of Contents

BLACK KNIGHT, INC. AND SUBSIDIARIES

NOTES TO CONSOLIDATED FINANCIAL STATEMENTS - (Continued)

(11)Long-Term Debt

Long-term debt consists of the following (in millions):


December 31, 

2022

2021

Term A Loan

$

1,121.2

$

1,150.0

Revolving Credit Facility


545.0


256.0

Senior Notes


1,000.0


1,000.0

Other


5.0


8.9

Total long-term debt principal


2,671.2


2,414.9

Less: current portion of long-term debt


(33.6)


(32.5)

Long-term debt before debt issuance costs and discount


2,637.6


2,382.4

Less: debt issuance costs and discount


(15.9)


(19.8)

Long-term debt, net of current portion

$

2,621.7

$

2,362.6

Principal Maturities of Debt

As of December 31, 2022, principal maturities are as follows (in millions):

2023


$

33.7

2024

57.5

2025


57.5

2026


1,522.5

Thereafter


1,000.0

Total

$

2,671.2

2021 Credit Agreement

On March 10, 2021, our indirect subsidiary BKIS entered into a second amended and restated credit and guaranty agreement (the “2021 Credit Agreement”) with JPMorgan Chase Bank, N.A., as administrative agent, the guarantors party thereto, the other agents party thereto and the lenders party thereto. The 2021 Credit Agreement replaced the previous 2018 amended and restated credit and guaranty agreement that provided for (i) a $1,250.0 million term loan A facility and (ii) a $750.0 million revolving credit facility.

The 2021 Credit Agreement provides for (i) a $1,150.0 million term loan A facility (the “Term A Loan”) and (ii) a $1,000.0 million revolving credit facility (the “Revolving Credit Facility” and, together with the Term A Loan, collectively, the “Facilities”), the proceeds of which were used to repay in full the indebtedness outstanding under the prior BKIS credit agreement. As a result of the refinancing, we recognized $2.5 million of expense during the year ended December 31, 2021 in Other expense, net on the Consolidated Statement of Earnings and Comprehensive Earnings.

The Facilities bear interest at rates based upon, at the option of BKIS, either (i) the base rate plus a margin of between 25 and 50 basis points depending on the total net leverage ratio of Black Knight Financial Services, LLC (“BKFS”), a Delaware limited liability company and the direct parent company of BKIS, and its restricted subsidiaries on a consolidated basis (the “Consolidated Leverage Ratio”) and (ii) the Eurodollar rate plus a margin of between 125 and 150 basis points depending on the Consolidated Leverage Ratio. In addition, BKIS pays an unused commitment fee of between 15 and 20 basis points on the undrawn commitments under the Revolving Credit Facility, also depending on the Consolidated Leverage Ratio. The 2021 Credit Agreement also provides us with an option to choose an alternative rate of interest on or before the cessation of the London Interbank Offered Rate (“LIBOR”) at our election.

80

Table of Contents

BLACK KNIGHT, INC. AND SUBSIDIARIES

NOTES TO CONSOLIDATED FINANCIAL STATEMENTS - (Continued)

As of December 31, 2022, the interest rate for the Facilities was based on the Eurodollar rate plus a margin of 150 basis points. We had $455.0 million capacity on the Revolving Credit Facility, and the unused commitment fee was 20 basis points. The interest rates on the Term A Loan and the Revolving Credit Facility were 5.9% and 5.8%, respectively.

The Facilities are guaranteed by BKIS’s wholly-owned domestic restricted subsidiaries, as defined by the 2021 Credit Agreement, and BKFS, and are secured by associated collateral agreements that pledge a lien on the majority of BKIS’s assets and the assets of the guarantors, in each case, subject to customary exceptions.

The Term A Loan is subject to amortization of principal, payable in quarterly installments on the last day of each fiscal quarter equal to the percentage set forth below of the initial aggregate principal amount of the term loans for such fiscal quarter:

Payment Dates


Percentage

Commencing on March 31, 2022 through and including December 31, 2023


0.625

%

Commencing on March 31, 2024 through and including December 31, 2025


1.250

%

The remaining principal balance of the Term A Loan and any outstanding loans under the Revolving Credit Facility are due upon maturity on March 10, 2026.

Senior Notes

On August 26, 2020, BKIS completed the issuance and sale of $1.0 billion aggregate principal amount of 3.625% senior unsecured notes (the "Senior Notes"). The Senior Notes have a coupon rate of 3.625% and mature on September 1, 2028. Interest is paid semi-annually in arrears on September 1 and March 1 of each year, commencing March 1, 2021. The obligations under the Senior Notes are fully and unconditionally guaranteed, jointly and severally, on an unsecured basis by the same guarantors that guarantee the 2021 Credit Agreement (collectively, the “Guarantors”). The Senior Notes are effectively subordinated to any obligations that are secured, including obligations under the 2021 Credit Agreement, to the extent of the value of the assets securing those obligations. The Senior Notes are structurally subordinated to all liabilities of BKIS’ subsidiaries that do not guarantee the Senior Notes. The net proceeds of the offering, along with cash on hand and contributions from Cannae and THL, were used to partially finance the acquisition of Optimal Blue Holdco.

The Senior Notes were issued pursuant to an indenture (the “Indenture”), dated as of August 26, 2020, between BKIS, the Guarantors and Wells Fargo Bank, National Association, as trustee. BKIS may redeem up to 40% of the Senior Notes using the proceeds of certain equity offerings completed before September 1, 2023 at a redemption price equal to 103.625% of their principal amount plus accrued and unpaid interest, if any, up to, but not including the redemption date. In addition, at any time prior to September 1, 2023, BKIS may redeem some or all of the Senior Notes at a price equal to 100% of their principal amount, plus accrued and unpaid interest, if any, up to, but not including, the redemption date, plus the “make-whole” premium. Thereafter, BKIS may redeem the Senior Notes, in whole or in part, at the redemption prices set forth in the Indenture, plus accrued and unpaid interest, if any, up to, but not including, the redemption date. Upon the occurrence of certain events constituting a change of control, BKIS may be required to make an offer to repurchase the Senior Notes at a price equal to 101% of their principal amount, plus accrued and unpaid interest, if any, up to, but not including, the date of purchase.

The Senior Notes are subject to customary covenants, including among others, customary events of default.

Fair Value of Long-Term Debt

The fair values of our Facilities and Senior Notes are based upon established market prices for the securities using Level 2 inputs. The fair value of our Facilities approximates their carrying value on December 31, 2022. The fair value of our Senior Notes as of December 31, 2022 was $870.0 million compared to its carrying value of $991.1 million, net of original issue discount and debt issuance costs.

81

Table of Contents

BLACK KNIGHT, INC. AND SUBSIDIARIES

NOTES TO CONSOLIDATED FINANCIAL STATEMENTS - (Continued)

Interest Rate Swaps

We enter into interest rate swap agreements to hedge forecasted monthly interest rate payments on our floating rate debt. As of December 31, 2022, we had the following interest rate swap agreements (collectively, the "Swap Agreements") (in millions):

Effective dates


Notional amount


Fixed rates

April 30, 2018 through April 30, 2023

$

250.0


2.61

%

January 31, 2019 through January 31, 2023

$

300.0


2.65

%

Under the terms of the Swap Agreements, we receive payments based on the 1-month LIBOR (approximately 4.38% as of December 31, 2022). During the years ended December 31, 2022 and 2021, the following interest rate swap agreements expired (in millions):

Effective dates


Notional amount


Fixed rates

September 29, 2017 through September 30, 2021

$

200.0

1.69

%

March 31, 2017 through March 31, 2022

$

200.0


2.08

%

We entered into the Swap Agreements to convert a portion of the interest rate exposure on our floating rate debt from variable to fixed. We designated these Swap Agreements as cash flow hedges. A portion of the amount included in Accumulated other comprehensive loss will be reclassified into Interest expense, net as a yield adjustment as interest is either paid or received on the hedged debt. The fair value of our Swap Agreements is based upon Level 2 inputs. We have considered our own credit risk and the credit risk of the counterparties when determining the fair value of our Swap Agreements.

It is our policy to execute such instruments with creditworthy banks and not to enter into derivative financial instruments for speculative purposes. We believe our interest rate swap counterparties will be able to fulfill their obligations under our agreements, and we believe we will have debt outstanding through the various expiration dates of the swaps such that the occurrence of future cash flow hedges remains probable.

The estimated fair values of our Swap Agreements are as follows (in millions):


December 31, 

Balance sheet accounts

2022

2021

Other current assets

$

2.2

$

Other current liabilities

$

$

1.0

Other non-current liabilities

$

$

13.9

A cumulative gain of $2.2 million ($1.6 million net of tax) and cumulative loss of $14.9 million ($11.1 million net of tax) is reflected in Accumulated other comprehensive loss as of December 31, 2022 and December 31, 2021, respectively.

82

Table of Contents

BLACK KNIGHT, INC. AND SUBSIDIARIES

NOTES TO CONSOLIDATED FINANCIAL STATEMENTS - (Continued)

Below is a summary of the effect of derivative instruments on amounts recognized in Other comprehensive loss ("OCE") on the accompanying Consolidated Statements of Earnings and Comprehensive Earnings (in millions):

Year ended December 31, 

2022

2021

2020


Amount of loss 


Amount of loss 


Amount of loss

Amount of gain 

reclassified from 

Amount of gain 

reclassified from 

Amount of loss 

reclassified from 

recognized  

Accumulated OCE  

recognized  

Accumulated OCE  

recognized  

Accumulated OCE 

in OCE

into Net earnings

in OCE

into Net earnings

in OCE

 into Net earnings

Swap agreements

$

8.2

$

4.5

$

1.7

$

15.3

$

(23.9)

$

12.2

As of December 31, 2022, the remaining balance in Accumulated other comprehensive loss is expected to be reclassified into Interest expense, net over the remaining term (less than 1 year).

(12)Fair Value Measurements

Fair Value of Financial Assets and Liabilities

Fair value represents the amount that would be received from selling an asset or paid to transfer a liability in an orderly transaction between market participants at the measurement date. The fair values of financial assets and liabilities are determined using the following fair value hierarchy:

Level 1 inputs to the valuation methodology are unadjusted quoted prices for identical assets or liabilities in active markets that we have the ability to access.
Level 2 inputs to the valuation methodology include:

quoted prices for similar assets or liabilities in active markets;

quoted prices for identical or similar assets or liabilities in inactive markets;

inputs other than quoted prices that are observable for the asset or liability; and

inputs that are derived principally from or corroborated by observable market data by correlation or other means.

Level 3 inputs to the valuation methodology are unobservable and significant to the fair value measurement.

Assets are classified in their entirety based on the lowest level of input that is significant to the fair value measurement. We believe our valuation methods are appropriate and consistent with other market participants. The use of different methodologies or assumptions to determine the fair value of certain financial instruments could result in a different fair value measurement at the reporting date.

83

Table of Contents

BLACK KNIGHT, INC. AND SUBSIDIARIES

NOTES TO CONSOLIDATED FINANCIAL STATEMENTS - (Continued)

The following table presents our fair value hierarchy for those assets and liabilities measured at fair value on a recurring basis (in millions):


December 31, 2022


December 31, 2021


Carrying 


Fair value


Carrying 


Fair value

amount

Level 1

Level 2

Level 3

amount

Level 1

Level 2

Level 3

Assets:


Cash and cash equivalents (Note 2)

$

12.2

$

12.2

$

$

$

77.1

$

77.1

$

$

Interest rate swaps (Note 11)

2.2

2.2

Liabilities:


Interest rate swaps (Note 11)


14.9


14.9


Contingent consideration


0.7


0.7


4.9


4.9

Redeemable noncontrolling interests


47.6


47.6


1,188.8


1,188.8

The fair value of redeemable noncontrolling interests and contingent consideration was primarily determined based on significant estimates and assumptions, including Level 3 inputs. The estimates and assumptions include the projected timing and amount of future cash flows and discount rates reflecting the rate inherent in the future cash flows. Refer to Note 2 — Significant Accounting Policies and Note 3 — Business Acquisitions for additional information.

The following table presents a summary of the change in fair value of our Level 3 fair value measurements (in millions):

Beginning balance, December 31, 2021


$

1,193.7

Contingent consideration adjustments related to prior year acquisition(1)

(4.2)

Acquisition of remaining outstanding Class A redeemable noncontrolling interests in Optimal Blue Holdco (Note 2)

(1,156.0)

Fair value adjustment to redeemable noncontrolling interests in Optimal Blue Holdco

14.8

Ending balance, December 31, 2022

$

48.3

(1)The adjustments to contingent consideration for prior year acquisitions are included in Transition and integration costs in the Consolidated Statements of Earnings and Comprehensive Earnings.

(13)Commitments and Contingencies

Legal and Regulatory Matters

In the ordinary course of business, we are involved in various pending and threatened litigation and regulatory matters related to our operations, some of which include claims for punitive or exemplary damages. Our ordinary course litigation may include class action lawsuits, which make allegations related to various aspects of our business. From time to time, we also receive requests for information from various state and federal regulatory authorities, some of which take the form of civil investigative demands or subpoenas. Some of these regulatory inquiries may result in the assessment of fines for violations of regulations or settlements with such authorities requiring a variety of remedies. We believe that none of these actions depart from customary litigation or regulatory inquiries incidental to our business.

We review lawsuits and other legal and regulatory matters (collectively "legal proceedings") on an ongoing basis when making accrual and disclosure decisions. When assessing reasonably possible and probable outcomes, management bases its decision on its assessment of the ultimate outcome assuming all appeals have been exhausted. For legal proceedings where it has been determined that a loss is both probable and reasonably estimable, a liability based on known facts and which represents our best estimate has been recorded. Actual losses may materially differ from the amounts recorded, and the ultimate outcome of our pending cases is generally not yet determinable. While some of these matters could be material to our operating results or cash flows for any particular period if an unfavorable outcome results, at

84

Table of Contents

BLACK KNIGHT, INC. AND SUBSIDIARIES

NOTES TO CONSOLIDATED FINANCIAL STATEMENTS - (Continued)

present, we do not believe the ultimate resolution of currently pending legal proceedings, either individually or in the aggregate, will have a material adverse effect on our financial condition.

PennyMac Litigation

On November 5, 2019, Black Knight Servicing Technologies, LLC (“BKST”), an indirect, wholly-owned subsidiary of Black Knight, filed a Complaint and Demand for Jury Trial (the “Black Knight Complaint”) against PennyMac Loan Services, LLC (“PennyMac”) in the Circuit Court for the Fourth Judicial Circuit in and for Duval County, Florida. The Black Knight Complaint includes causes of action for breach of contract and misappropriation of MSP® System trade secrets in order to develop an imitation mortgage processing system intended to replace the MSP® System. The Black Knight Complaint seeks damages for breach of contract and misappropriation of trade secrets, injunctive relief under the Florida Uniform Trade Secrets Act and declaratory judgment that BKST owns all intellectual property and software developed by or on behalf of PennyMac as a result of its wrongful use of and access to the MSP® System and related trade secret and confidential information. PennyMac filed a motion to compel arbitration of the action, and the trial court granted the motion on April 6, 2020. The trial court’s order compelling arbitration was confirmed by the Florida First District Court of Appeal on January 6, 2021.

Shortly after the filing of the Black Knight Complaint, on November 6, 2019, PennyMac filed an Antitrust Complaint (the “PennyMac Complaint”) against Black Knight in the United States District Court for the Central District of California. The PennyMac Complaint included causes of action for alleged monopolization and attempted monopolization under Section 2 of the Sherman Antitrust Act, violation of California’s Cartwright Act, violation of California’s Unfair Competition Law and common law unfair competition under California law. The PennyMac Complaint sought equitable remedies, damages and other monetary relief, including treble and punitive damages. Generally, PennyMac alleged that Black Knight relies on various anticompetitive, unfair and discriminatory practices to maintain and to enhance its dominance in the mortgage servicing platform market and in an attempt to monopolize the platform software applications market. Black Knight moved to dismiss the PennyMac Complaint or have the action transferred to Florida based upon a forum selection clause in the agreement with BKST. On February 13, 2020, the judge granted Black Knight's motion to transfer the case to Florida and denied as moot the motion to dismiss. On April 17, 2020, PennyMac filed a notice of dismissal of this action without prejudice and indicated that they intended to bring the claims raised in the dismissed PennyMac Complaint as defenses, third party claims and/or counterclaims in arbitration. On April 23, 2020, the court entered an order dismissing the action without prejudice and directing that the clerk close the case. On April 28, 2020, PennyMac submitted this matter to the American Arbitration Association ("AAA") for arbitration. The arbitrator was confirmed by the AAA on July 21, 2020. On February 17, 2022, PennyMac filed an amended arbitration demand and Black Knight filed an answering statement on March 2, 2022.

The final arbitration hearing on both Black Knight’s trade secret case and PennyMac’s antitrust case is now scheduled to begin on March 13, 2023.

As these cases continue to evolve, it is not possible to reasonably estimate the probability that we will ultimately prevail on our lawsuit or be held liable for the violations alleged in the PennyMac Complaint, nor is it possible to reasonably estimate the ultimate gain or loss, if any, or range of gain or loss that could result from these cases.

Other Legal Matter

During the year ended December 31, 2020, we recognized a one-time gain of $18.5 million related to the resolution of a legacy legal matter of Lender Processing Services, Inc. ("LPS") in Other (expense) income, net in our Consolidated Statements of Earnings and Comprehensive Earnings.

Indemnifications and Warranties

We often agree to indemnify our clients against damages and costs resulting from claims of patent, copyright, trademark infringement or breaches of confidentiality associated with use of our software through software licensing

85

Table of Contents

BLACK KNIGHT, INC. AND SUBSIDIARIES

NOTES TO CONSOLIDATED FINANCIAL STATEMENTS - (Continued)

agreements. Historically, we have not made any payments under such indemnifications, but continue to monitor the conditions that are subject to the indemnifications to identify whether a loss has occurred that is both probable and estimable that would require recognition. In addition, we warrant to clients that our software operates substantially in accordance with the software specifications. Historically, no costs have been incurred related to software warranties and none are expected in the future, and as such, no accruals for warranty costs have been made.

Indemnification Agreement

We are party to a cross-indemnity agreement dated December 22, 2014 with ServiceLink Holdings, LLC ("ServiceLink"). Pursuant to this agreement, ServiceLink indemnifies us from liabilities relating to, arising out of or resulting from the conduct of ServiceLink’s business or any action, suit or proceeding in which we or any of our subsidiaries are named by reason of being a successor to the business of LPS and the cause of such action, suit or proceeding relates to the business of ServiceLink. In return, we indemnify ServiceLink for liabilities relating to, arising out of, or resulting from the conduct of our business.

Software Subscription, Cloud Computing and Hardware and Software Maintenance Services Agreements

We have various software subscription, cloud computing and hardware and software maintenance services agreements with vendors, which are in effect through 2026. As of December 31, 2022, payment obligations for these agreements with initial or remaining terms greater than one year are as follows (in millions):

2023


$

61.7

2024


17.7

2025


3.9

2026


3.4

Total

$

86.7

Actual amounts could be more or less depending on various factors such as the introduction of significant new technologies or changes in our business needs.

Off-Balance Sheet Arrangements

We do not have any material off-balance sheet arrangements other than interest rate swaps. Refer to Note 11 – Long-Term Debt.

(14)Leases

Operating Leases

We have operating leases for corporate offices, data centers and certain equipment. Our leases have remaining lease terms of up to six years, some of which include escalation clauses, renewal options for up to five years or termination options within one year.

86

Table of Contents

BLACK KNIGHT, INC. AND SUBSIDIARIES

NOTES TO CONSOLIDATED FINANCIAL STATEMENTS - (Continued)

Right-of-use assets are included in Other non-current assets in our Consolidated Balance Sheets. Refer to Note 2 - Significant Accounting Policies. Operating lease liabilities are included in the Consolidated Balance Sheets as follows (in millions):

December 31, 


2022


2021

Operating lease liabilities:


Trade accounts payable and other accrued liabilities

$

8.7

$

10.7

Other non-current liabilities


17.4


26.4

Total operating lease liabilities

$

26.1

$

37.1

As of December 31, 2022, maturities of operating lease liabilities were as follows (in millions):

2023


$

8.8

2024


7.8

2025


3.0

2026


2.8

2027


2.6

Thereafter


2.2

Total


27.2

Less: imputed interest


(1.1)

Total

$

26.1

Supplemental information related to operating leases is as follows (in millions, except lease term and discount rate):

Year ended December 31, 


2022


2021


2020

Operating lease cost (1)

$

11.3

$

18.5

$

18.1

Operating cash outflows related to lease liabilities


10.9


13.7


12.4

Non-cash additions for right-of-use assets, net of modifications


0.9


6.4


21.5

December 31, 


2022

2021

Weighted average remaining lease term (in years)


4.2


4.7

Weighted average discount rate


2.17

%  

2.25

%

(1)Operating lease cost includes right-of-use asset amortization as well as short-term and variable lease costs. Accelerated right-of-use asset amortization included in operating lease cost was $0.5 million, $4.0 million and $2.8 million for the years ended December 31, 2022, 2021 and 2020, respectively.

87

Table of Contents

BLACK KNIGHT, INC. AND SUBSIDIARIES

NOTES TO CONSOLIDATED FINANCIAL STATEMENTS - (Continued)

(15)Revenues

Disaggregation of Revenues

The following tables summarize revenues from contracts with clients (in millions):


Year ended December 31, 2022

Servicing 


Origination 


Software 


Data and 


Software

Software

Solutions

Analytics

Total

Software solutions

$

810.4

$

377.4

$

1,187.8

$

39.3

$

1,227.1

Professional services


72.0

52.5


124.5


3.7


128.2

Data solutions


5.2


5.2


172.4


177.6

Other(1)


1.4

15.0


16.4


2.6


19.0

Revenues

$

883.8

$

450.1

$

1,333.9

$

218.0

$

1,551.9


Year ended December 31, 2021

Servicing 


Origination 


Software 


Data and


Software

Software

Solutions

 Analytics

Total

Software solutions

$

760.0

$

347.2

$

1,107.2

$

37.0

$

1,144.2

Professional services


78.9

51.9


130.8


1.5


132.3

Data solutions


2.7


2.7


184.2


186.9

Other


9.3


9.3


2.5


11.8

Revenues

$

838.9

$

411.1

$

1,250.0

$

225.2

$

1,475.2


Year ended December 31, 2020

Servicing 


Origination 


Software 


Data and


Corporate 


Software

Software

Solutions

 Analytics

and Other

Total

Software solutions

$

700.1

$

202.6

$

902.7

$

34.1

$

$

936.8

Professional services


77.6

45.8


123.4


0.7


(0.4)

(2)


123.7

Data solutions


1.2


1.2


161.4


162.6

Other


12.9


12.9


2.5


15.4

Revenues

$

777.7

$

262.5

$

1,040.2

$

198.7

$

(0.4)

$

1,238.5

(1)Other revenues includes termination fees of $6.2 million recognized during the year ended December 31, 2022.
(2)Revenues for Corporate and Other represents deferred revenue purchase accounting adjustments recorded in accordance with GAAP.

Our Software Solutions segment offers leading software and hosting solutions that facilitate and automate many of the mission-critical business processes across the homeownership lifecycle. These solutions primarily consist of processing and workflow management software applications. Our servicing software solutions primarily include our core servicing software solution that automates loan servicing, including loan setup and ongoing processing, customer service, accounting, reporting to the secondary mortgage market and investors and web-based workflow information systems. Our origination software solutions primarily include our solutions that automate and facilitate the origination of mortgage loans, offer product, pricing and eligibility capabilities, and provide an interconnected network allowing the various parties and systems associated with lending transactions to exchange data quickly and efficiently. Professional services consists of pre-implementation and post-implementation support and services and are primarily billed on a time and materials basis. Professional services may also include dedicated teams provided as part of agreements with software and hosting solutions clients.

Our Data and Analytics segment offers data and analytics solutions to the mortgage, real estate and capital markets verticals. These solutions include property ownership data, lien data, servicing data, automated valuation models, collateral risk scores, behavioral models, a multiple listing service software solution and other data solutions.

88

Table of Contents

BLACK KNIGHT, INC. AND SUBSIDIARIES

NOTES TO CONSOLIDATED FINANCIAL STATEMENTS - (Continued)

Transaction Price Allocated to Future Performance Obligations

Our disclosure of transaction price allocated to these future performance obligations excludes the following:

Volume-based fees in excess of contractual minimums and other usage-based fees to the extent they are part of a single performance obligation and meet certain variable allocation criteria;
Performance obligations that are part of a contract with an original expected duration of one year or less; and
Transactional fees based on a fixed fee per transaction when we have the right to invoice once we have completed the performance obligation.

As of December 31, 2022, the aggregate amount of the transaction price that is allocated to our future performance obligations was approximately $2.8 billion and is expected to be recognized as follows: 25% by December 31, 2023, 63% by December 31, 2025, 86% by December 31, 2027 and the rest thereafter.

(16)Equity

Share Repurchase Program

On February 12, 2020, our Board of Directors approved a three-year share repurchase program (“2020 Repurchase Program”) authorizing us to repurchase up to 10.0 million shares of our outstanding common stock through February 12, 2023, through open market purchases, negotiated transactions or other means, in accordance with applicable securities laws and other restrictions.

In 2021, we repurchased 2.0 million shares of our common stock under the 2020 Repurchase Program for an aggregate of $146.7 million, at an average price per share of $73.91. We did not repurchase any shares under the 2020 Repurchase Program during the years ended December 31, 2022 and 2020. There were 8.0 million shares remaining under the 2020 Repurchase Program when it expired on February 12, 2023.

Common Stock Offering

On June 19, 2020, we issued and sold 7,130,000 shares of our common stock in an underwritten public offering pursuant to a registration statement filed with the SEC. We received net proceeds of approximately $484.6 million after deducting the underwriters’ discount of $16.3 million. We also incurred costs directly related to the offering of $0.4 million.

Omnibus Incentive Plan

The Black Knight, Inc. Amended and Restated 2015 Omnibus Incentive Plan (the "Black Knight Omnibus Plan") provides for the grant of stock options, stock appreciation rights, restricted stock, restricted stock units, performance shares, performance units, other cash and stock-based awards and dividend equivalents. The Black Knight Omnibus Plan is authorized to issue up to 18.5 million shares. As of December 31, 2022, 6.1 million shares were available for future issuances. Awards granted are approved by the Compensation Committee of the Board of Directors.

89

Table of Contents

BLACK KNIGHT, INC. AND SUBSIDIARIES

NOTES TO CONSOLIDATED FINANCIAL STATEMENTS - (Continued)

A summary of restricted shares granted for the periods presented is as follows:

Number of shares

Grant date fair 

Vesting period

Dates


granted


value per share


(in years)


Vesting criteria

February 18, 2020(1)

487,096

$

74.91

3.0

Service and Performance

May 6, 2020(1)

3,101

72.57

3.0

Service and Performance

Various other 2020 dates

37,481

59.45 - 91.64

1.0 - 3.0

Service

March 10, 2021(2)

518,219

76.00

3.0

Service and Performance

Various other 2021 dates

188,499

69.84 - 78.44

1.0 - 5.0

Service

March 10, 2022(2)

809,166

57.18

3.0

Service and Performance

Various other 2022 dates

110,604

55.05 - 70.91

1.0 - 4.0

Service

(1)Performance condition for this award has been satisfied as of December 31, 2022.
(2)This award is subject to an independent performance target for each of the three consecutive 12-month measurement periods. Vesting of each tranche is independent of the satisfaction of the annual performance target for other tranches.

Activity related to restricted stock and RSUs for the periods presented are as follows:

Weighted average 

grant date


Shares


fair value

Balance December 31, 2019

2,014,983


$

46.99

Granted


527,678

74.62

Forfeited


(11,811)

63.12

Vested


(981,752)

44.50

Balance, December 31, 2020


1,549,098

57.86

Granted


706,718

76.12

Forfeited


(61,900)

72.72

Vested


(924,127)

53.06

Balance, December 31, 2021

1,269,789


70.79

Granted


919,770

58.43

Forfeited


(45,807)

70.56

Vested


(833,234)

66.88

Balance, December 31, 2022


1,310,518

64.61

Equity-based compensation expense related to restricted shares and RSUs was $46.3 million, $33.0 million and $38.5 million for the years ended December 31, 2022, 2021 and 2020, respectively. Equity-based compensation includes accelerated recognition of $4.2 million, $2.9 million and $0.5 million for the years ended December 31, 2022, 2021 and 2020, respectively. These expenses are included in Operating expenses in the Consolidated Statements of Earnings and Comprehensive Earnings.

As of December 31, 2022, the total unrecognized compensation cost related to non-vested restricted shares of our common stock is $57.0 million, which is expected to be recognized over a weighted average period of approximately 1.6 years.

Profits Interests Units

On November 24, 2020, there were 6,292 OB PIUs granted to certain members of management, directors, and certain employees, which vest over 3 years, with 100% cliff vesting after the third year. The terms of the OB PIUs provide for the grantees to participate in the excess of Optimal Blue Holdco’s fair value over the initial hurdle amount, which was the fair value of the Optimal Blue Holdco’s Class A members’ initial contributions.

90

Table of Contents

BLACK KNIGHT, INC. AND SUBSIDIARIES

NOTES TO CONSOLIDATED FINANCIAL STATEMENTS - (Continued)

If no public offering has been consummated as of the third anniversary of the acquisition of Optimal Blue, holders of the OB PIUs have an option to put their profit interests to us once per quarter for the twelve months that begins six months after the OB PIU holder’s vesting date, and once per year thereafter. In accordance with the third amended and restated limited liability company agreement of Optimal Blue Holdco, a change in control of Black Knight does not accelerate vesting of the OB PIUs, but triggers certain redemption rights and gives each holder of OB PIUs the right to elect that Optimal Blue Holdco redeem all of the holder’s vested and unvested OB PIUs for a redemption price determined based on fair value as determined by an appraisal process.

The units may be settled in cash or Black Knight common stock or a combination of both at our election and will be settled at the current fair value at the time we receive notice of the put election. As the OB PIUs provide for redemption features not solely within our control, we classify the redemption value outside of permanent equity in redeemable noncontrolling interests. The redemption value is equal to the difference in the per unit fair value of the underlying member units and the hurdle amount, based upon the proportionate required service period rendered to date.

The hurdle rate as of the grant date was used to determine the per unit strike price for the calculation. The risk free interest rates used in the calculation of the fair value of the OB PIUs are the rates that correspond to the weighted average expected life of the OB PIUs. The volatility was estimated based on the historical volatility of the comparable public companies’ stock prices over a term equal to the weighted average expected life of the OB PIUs. We used a weighted average risk free interest rate of 0.31%, a volatility assumption of 37.0% and an expected life of 4 years, resulting in a grant date fair value of $4,233 per profits interests unit. The grant date fair value of the OB PIUs granted on November 24, 2020 was $26.6 million.

Activity related to OB PIUs for the periods presented are as follows:

Weighted average 

grant date


Shares


fair value

Balance, December 31, 2019


$

Granted


6,292

4,233

Forfeited


Vested


Balance, December 31, 2020


6,292

4,233

Granted


70

4,233

Forfeited


(155)

4,233

Vested


Balance, December 31, 2021

6,207


4,233

Granted


Forfeited


(38)

4,233

Vested


Balance, December 31, 2022


6,169

4,233

Equity-based compensation expense related to the OB PIUs was $8.6 million, $8.7 million and $0.9 million for the years ended December 31, 2022, 2021 and 2020, respectively. As of December 31, 2022, the total unrecognized compensation cost related to non-vested OB PIUs is $7.8 million, which is expected to be recognized over a weighted average period of approximately 0.9 years.

(17)Employee Stock Purchase Plan and 401(k) Plan

Employee Stock Purchase Plan ("ESPP")

The Black Knight, Inc. Employee Stock Purchase Plan (the "Black Knight ESPP") allows our eligible employees to voluntarily make after-tax contributions ranging from 3% to 15% of eligible earnings. We contribute varying matching

91

Table of Contents

BLACK KNIGHT, INC. AND SUBSIDIARIES

NOTES TO CONSOLIDATED FINANCIAL STATEMENTS - (Continued)

amounts as specified in the Black Knight ESPP. There is a one-year holding period for contributions to the Black Knight ESPP. During the holding period, ESPP purchased shares are not eligible for sale or broker transfer.

We recorded expense of $8.2 million, $8.7 million and $7.1 million for the years ended December 31, 2022, 2021, and 2020, respectively, relating to the participation of our employees in the Black Knight ESPP.

401(k) Profit Sharing Plan

Our employees participate in the Black Knight 401(k) Profit Sharing Plan (the “Black Knight 401(k) Plan”), a qualified 401(k) plan sponsored by our indirect subsidiary BKIS. Under the terms of the plan, as amended, eligible employees may contribute up to 40% of their pretax annual compensation, up to the amount allowed pursuant to the Internal Revenue Code ("IRC"). We generally match 37.5% of each dollar of employee contribution up to 6% of the employee’s total eligible compensation.

We recorded expense of $9.8 million, $8.4 million and $7.2 million for the years ended December 31, 2022, 2021 and 2020, respectively, relating to the participation of our employees in the 401(k) plans.

(18)Income Taxes

Income tax expense consists of the following (in millions):

Year ended December 31, 


2022


2021


2020

Current:


Federal

$

61.4

$

37.1

$

41.5

State


18.9


13.1


11.6

Foreign


1.1


1.0


1.0

Total current


81.4


51.2


54.1

Deferred:


Federal


(47.0)


(11.5)


(10.6)

State


(12.0)


(4.0)


(1.9)

Total deferred


(59.0)


(15.5)


(12.5)

Total income tax expense

$

22.4

$

35.7

$

41.6

A reconciliation of our federal statutory income tax rate to our effective income tax rate is as follows:


Year ended December 31, 


2022


2021


2020


Federal statutory rate

21.0

%  

21.0

%  

21.0

%

State income taxes, net of federal benefit

5.2


3.7


4.2

Non-deductible executive compensation

3.0


1.2


1.2

Effect of Optimal Blue acquisition and related transactions (1)

(7.9)

1.4

Redeemable noncontrolling interests

0.4


1.4


1.3

Tax credits

(9.4)


(6.2)


(4.6)

Restricted share vesting

(0.3)


(2.7)


(2.6)

Prior year return to provision adjustments

(2.8)

(5.0)

Unrecognized tax benefit

1.9

Other

1.5


1.2


0.1

Effective tax rate

13.5

%  

16.8

%  

18.9

%

(1)Includes the effect of a first quarter 2022 discrete income tax benefit of $14.1 million related to the establishment of a deferred tax asset as a result of our reorganization of certain wholly owned subsidiaries within the Optimal Blue partnership investment structure during the year ended December 31, 2022.

92

Table of Contents

BLACK KNIGHT, INC. AND SUBSIDIARIES

NOTES TO CONSOLIDATED FINANCIAL STATEMENTS - (Continued)

The components of deferred tax assets and liabilities consist of the following (in millions):

December 31, 


2022


2021

Deferred tax assets:


Equity method investments

$

0.9

$

2.6

Equity-based compensation


17.5


4.6

Deferred revenues


11.0


20.5

Interest rate swaps


3.8

Other


12.0


25.3

Total deferred tax assets


41.4


56.8

Deferred tax liabilities:


Goodwill and other intangible assets


(134.8)


(183.4)

Deferred contract costs


(43.1)


(44.1)

Property, equipment and software


(24.9)


(30.2)

Partnership basis


(58.6)


(80.1)

Interest rate swaps

(0.6)

Other


(6.9)


(3.1)

Total deferred tax liabilities


(268.9)


(340.9)

Net deferred tax liability

$

(227.5)

$

(284.1)

In assessing the realizability of deferred tax assets, management considers whether it is more likely than not that any portion of deferred tax assets will be utilized. In making this assessment, management considers the projected future earnings, tax planning strategies, and reversal of deferred tax liabilities that will give rise to future taxable income. Based on this assessment, and the overall deferred tax liability position, management concluded that only an immaterial deferred tax asset related to certain state credits is subject to a valuation allowance. All other deferred tax assets are more likely than not to be utilized in future years, and therefore are not subject to valuation allowance.

Through acquisition, we have immaterial state net operating losses subject to various limitations and carryforward periods. The average carryforward period is approximately 20 years, with certain states having an indefinite carryforward period.

A reserve for uncertain tax positions is recorded as a result of certain items claimed in current and prior periods. We expect $2.3 million of the reserve to reverse in the following year due to the lapse in statute of limitations. If we were to prevail on our uncertain tax positions, the reversal of this reserve would also be a benefit to our effective tax rate. A reconciliation of the beginning and ending amount of unrecognized tax benefits is as follows:

December 31, 


2022


2021

Balance, January 1

$

9.7


$

4.1

Additions based on tax positions of prior years


3.3

Additions based on tax positions of current year


2.9


2.3

Decreases based on tax positions of prior years


(1.7)


Balance, December 31

$

10.9

$

9.7

Our open tax years are 2019, 2020 and 2021 for federal income tax purposes. We have open tax years for state income tax purposes for up to six years based on each state’s laws.

(19)Segment Information

ASC Topic 280, Segment Reporting ("ASC 280"), establishes standards for reporting information about segments and requires that a public business enterprise reports financial and descriptive information about its segments. Segments are

93

Table of Contents

BLACK KNIGHT, INC. AND SUBSIDIARIES

NOTES TO CONSOLIDATED FINANCIAL STATEMENTS - (Continued)

components of an enterprise for which separate financial information is available and are evaluated regularly by the chief operating decision maker ("CODM") in deciding how to allocate resources and in assessing performance. Our chief executive officer is identified as the CODM as defined by ASC 280. To align with the internal management of our business operations based on service offerings, our business is organized into two segments. Refer to Note 15 — Revenues for a description of our Software Solutions and Data and Analytics segments.

Separate discrete financial information is available for these two segments and the operating results of each segment are regularly evaluated by the CODM in order to assess performance and allocate resources. We use EBITDA as the primary profitability measure for making decisions regarding ongoing operations. EBITDA is earnings before Interest expense, net, Other (expense) income, net, Income tax expense and Depreciation and amortization. It also excludes Equity in earnings of unconsolidated affiliates. We do not allocate Interest expense, net, Other (expense) income, net, Income tax expense, equity-based compensation and certain other items, such as purchase accounting adjustments and acquisition-related costs to the segments, since these items are not considered in evaluating the segments’ overall operating performance.

Segment asset information is not included below because we do not use it to evaluate performance or allocate resources. Summarized financial information concerning our segments is shown in the tables below (in millions):

Year ended December 31, 2022

Software 


Data and 

Corporate and 


Solutions

Analytics


Other


Total

Revenues

$

1,333.9


$

218.0

$

$

1,551.9

Expenses:


Operating expenses


597.4


148.7


126.2

(2)


872.3

Transition and integration costs


31.8

(3)


31.8

EBITDA


736.5


69.3


(158.0)


647.8

Depreciation and amortization


146.6


15.8


207.2

(4)


369.6

Operating income (loss)


589.9


53.5


(365.2)


278.2

Interest expense, net


(100.6)

Other expense, net


(11.9)

Earnings before income taxes and equity in earnings of unconsolidated affiliates


165.7

Income tax expense


22.4

Earnings before equity in earnings of unconsolidated affiliates


143.3

Equity in earnings of unconsolidated affiliates, net of tax


306.7

Net earnings


450.0

Net losses attributable to redeemable noncontrolling interests


2.5

Net earnings attributable to Black Knight


$

452.5

94

Table of Contents

BLACK KNIGHT, INC. AND SUBSIDIARIES

NOTES TO CONSOLIDATED FINANCIAL STATEMENTS - (Continued)

Year ended December 31, 2021

Software 

Data and 

Corporate and 


Solutions


Analytics


Other


Total

Revenues

$

1,250.0

$

225.2

$

$

1,475.2

Expenses:


Operating expenses


536.3


145.0


112.6

(2)


793.9

Transition and integration costs


13.3

(3)


13.3

EBITDA


713.7


80.2


(125.9)


668.0

Depreciation and amortization


131.1


15.5


218.4

(4)


365.0

Operating income (loss)


582.6


64.7


(344.3)


303.0

Interest expense, net


(83.6)

Other expense, net


(6.4)

Earnings before income taxes and equity in earnings of unconsolidated affiliates


213.0

Income tax expense


35.7

Earnings before equity in earnings of unconsolidated affiliates


177.3

Equity in earnings of unconsolidated affiliates, net of tax


2.6

Net earnings

179.9

Net losses attributable to redeemable noncontrolling interests

28.0

Net earnings attributable to Black Knight


$

207.9

Year ended December 31, 2020

Software 

Data and 

Corporate and 


Solutions


Analytics


Other


Total

Revenues

$

1,040.2

$

198.7

$

(0.4)

(1)

$

1,238.5

Expenses:


Operating expenses


435.6

133.9

100.1

(2)


669.6

Transition and integration costs


31.4

(3)


31.4

EBITDA


604.6


64.8


(131.9)


537.5

Depreciation and amortization


120.9

15.1

134.7

(4)


270.7

Operating income (loss)


483.7


49.7


(266.6)


266.8

Interest expense, net


(62.9)

Other income, net


16.4

Earnings before income taxes and equity in earnings of unconsolidated affiliates


220.3

Income tax expense


41.6

Earnings before equity in earnings of unconsolidated affiliates


178.7

Equity in earnings of unconsolidated affiliates, net of tax


67.1

Net earnings


245.8

Net losses attributable to redeemable noncontrolling interests


18.3

Net earnings attributable to Black Knight


$

264.1

(1)Revenues for Corporate and Other represents deferred revenue purchase accounting adjustments recorded in accordance with GAAP.
(2)Operating expenses for Corporate and Other includes equity-based compensation, including certain related payroll taxes, of $55.7 million, $42.9 million and $40.6 million for the years ended December 31, 2022, 2021 and 2020, respectively.
(3)Transition and integration costs primarily consists of costs related to the ICE Transaction and costs associated with acquisitions.
(4)Depreciation and amortization for Corporate and Other primarily represents net incremental depreciation and amortization adjustments associated with the application of purchase accounting recorded in accordance with GAAP.

95

Table of Contents

Item 9.Changes in and Disagreements with Accountants on Accounting and Financial Disclosure

None.

Item 9A.Controls and Procedures

As of the end of the year covered by this report, we carried out an evaluation, under the supervision and with the participation of our Chief Executive Officer ("CEO") and President and Chief Financial Officer ("CFO"), of the effectiveness of the design and operation of our disclosure controls and procedures as such term is defined in Rule 13a-15(e) or 15d-15(e) under the Exchange Act. Based on this evaluation, our CEO and CFO concluded that our disclosure controls and procedures are effective to ensure that information required to be disclosed by the Company in the reports that we file or submit under the Act is: (a) recorded, processed, summarized and reported, within the time periods specified in the Commission’s rules and forms; and (b) accumulated and communicated to management, including our principal executive and principal financial officers, as appropriate to allow timely decisions regarding required disclosure.

There were no changes in our internal control over financial reporting that occurred during the quarter ended December 31, 2022 that have materially affected, or are reasonably likely to materially affect, our internal control over financial reporting.

Management’s Report on Internal Control Over Financial Reporting

Management is responsible for establishing and maintaining adequate internal control over financial reporting, as such term is defined in Exchange Act Rule 13a-15(f) or 15d-15(f). Under the supervision and with the participation of our management, including our CEO and CFO, we conducted an evaluation of the effectiveness of our internal control over financial reporting. Management has adopted the framework in Internal Control-Integrated Framework (2013) issued by the Committee of Sponsoring Organizations of the Treadway Commission ("COSO"). Based on our evaluation under this framework, our management concluded that our internal control over financial reporting was effective as of December 31, 2022.

The effectiveness of our internal control over financial reporting as of December 31, 2022 has been audited by KPMG LLP, an independent registered public accounting firm, as stated in their report which is included herein.

96

Table of Contents

Item 9B.Other Information

None.

Item 9C.Disclosures Regarding Foreign Jurisdictions that Prevent Inspections

None.

Part III

Items 10-14.

Within 120 days after the close of our fiscal year, we intend to file with the SEC a definitive proxy statement pursuant to Regulation 14A of the Exchange Act, which will include the matters required by these items.

97

Table of Contents

PART IV

Item 15.           Exhibits and Financial Statement Schedules

(a)(1) Financial Statements. The following is a list of the consolidated financial statements of Black Knight, Inc. and its subsidiaries included in Part II Item 8:

Page
Number

Reports of Independent Registered Public Accounting Firm (KPMG LLP, Jacksonville, FL, Auditor Firm ID: 185)

52

Consolidated Balance Sheets as of December 31, 2022 and 2021

55

Consolidated Statements of Earnings and Comprehensive Earnings for the years ended December 31, 2022, 2021 and 2020

56

Consolidated Statements of Equity for the years ended December 31, 2022, 2021 and 2020

57

Consolidated Statements of Cash Flows for the years ended December 31, 2022, 2021 and 2020

59

Notes to Consolidated Financial Statements

60

(a)(2) Financial Statement Schedules. All financial statement schedules have been omitted because they are not applicable or the required information is presented in the consolidated financial statements or the notes thereto.
(a)(3) Exhibits. Exhibits required to be filed by Item 601of Regulation S-K, and by Item 15(b) are included below:

98

Table of Contents

HIDDEN_ROW

Exhibit
Number


Description

2.1

Agreement and Plan of Merger, dated as of June 8, 2017, by and among New BKH Corp., Black Knight Financial Services, Inc., Black Knight Holdco Corp., New BKH Merger Sub, Inc., BKFS Merger Sub, Inc. and Fidelity National Financial, Inc. (incorporated by reference to Exhibit 2.1 to the Form 8-K filed by Black Knight Financial Services, Inc. on June 9, 2017 (No. 001-37394))

2.2*

Equity Purchase Agreement, dated July 26, 2020, by and among Black Knight, Inc., GTCR Fund XI/C LP, GTCR/OB Blocker Corp., GTCR/OB Splitter LP, OB Holdings I, LLC, OB Acquisition, LLC, and OB Holdings I, LLC, in its capacity as the Seller Representative (incorporated by reference to Exhibit 2.1 to the Form 8-K filed by Black Knight, Inc. on July 28, 2020 (No. 001-37394))

2.3

Purchase Agreement, dated as of February 15, 2022, by and among Black Knight, Optimal Blue I, Cannae, THL, Optimal Blue Holdco and Black Knight Technologies (incorporated by reference to Exhibit 2.1 to the Form 8-K filed by Black Knight, Inc. on February 15, 2022 (No. 001-37394))

2.4*

Agreement and Plan of Merger, dated as of May 4, 2022, among Intercontinental Exchange, Inc., Sand Merger Sub Corporation and Black Knight, Inc. (incorporated by reference to Exhibit 2.1 to the Form 8-K filed by Black Knight, Inc. on May 5, 2022 (No. 001-37394)

3.1

Second Amended and Restated Certificate of Incorporation of Black Knight, Inc. (incorporated by reference to Exhibit 3.1 to the Form 8-K filed by Black Knight, Inc. on June 13, 2019 (No. 000-37394))

3.2

Amended and Restated Bylaws of Black Knight, Inc. as adopted on February 8, 2023 (incorporated by reference to Exhibit 3.1 to the Form 8-K filed by Black Knight, Inc. on February 14, 2023 (No. 001-37494))

4.1

Description of Common Stock (incorporated by reference to Exhibit 4.2 to the Form 10-K filed by Black Knight, Inc. on February 28, 2020 (No. 001-37394))

4.2

Indenture among Black Knight InfoServ, LLC, the Guarantors party thereto and Wells Fargo Bank, National Association, dated August 26, 2020 (incorporated by reference to Exhibit 4.1 to the Form 8-K filed by Black Knight, Inc. on August 26, 2020 (No. 001-37394))

4.3

Form of 3.625% Senior Note due 2028 of Black Knight InfoServ, LLC.(incorporated by reference to Exhibit 4.2 to the Form 8-K filed by Black Knight, Inc. on August 26, 2020 (No. 001-37394), which is included as Exhibit A to Exhibit 4.1 to the Form 8-K filed by Black Knight, Inc. on August 26, 2020 (No. 001-37394))

10.1

Amended and Restated Employment Agreement by and between Kirk T. Larsen and BKFS I Management, Inc. dated April 23, 2015 (incorporated by reference to Exhibit 10.11 to Amendment No. 4 to the Form S-1 Registration Statement filed by Black Knight Financial Services, Inc. on May 4, 2015 (No. 333-201241)) (1)

10.2

Employment Agreement by and between BKFS I Management, Inc. and Michael L. Gravelle, effective as of March 1, 2015 (incorporated by reference to Exhibit 10.16 to Amendment No. 3 to the Form S-1 Registration Statement filed by Black Knight Financial Services, Inc. on April 20, 2015 (No. 333-201241)) (1)

10.3

Black Knight, Inc. Deferred Compensation Plan, effective September 15, 2017 (incorporated by reference to Exhibit 10.12 to the Form 10-K filed by Black Knight, Inc. on February 23, 2018 (No. 001-37394)) (1)

10.4

Cross-Indemnity Agreement by and between Black Knight Financial Services, LLC and ServiceLink Holdings, LLC dated as of December 22, 2014 (incorporated by reference to Exhibit 10.20 to Amendment No. 2 to the Form S-1 Registration Statement filed by Black Knight Financial Services, Inc. on March 30, 2015 (No. 333-201241))

99

Table of Contents

10.5

First Amendment to Amended and Restated Employment Agreement by and between Kirk T. Larsen and BKFS I Management, Inc. dated March 17, 2016 (incorporated by reference to Exhibit 10.1 to the Form 10-Q filed by Black Knight Financial Services, Inc. on April 29, 2016 (No. 001-37394)) (1)

10.6

Second Amendment to Employment Agreement by and between BKFS I Management, Inc. and Kirk Larsen effective April 30, 2016 (incorporated by reference to Exhibit 10.1 to the Form 10-Q filed by Black Knight Financial Services, Inc. on August 9, 2016 (No. 001-37394)) (1)

10.7

First Amendment to Employment Agreement by and between BKFS I Management, Inc. and Michael L. Gravelle effective April 30, 2016 (incorporated by reference to Exhibit 10.4 to the Form 10-Q filed by Black Knight Financial Services, Inc. on August 9, 2016 (No. 001-37394)) (1)

10.8

Amended and Restated Employment Agreement by and between Joseph M. Nackashi and BKFS I Management, Inc. effective July 17, 2017 (incorporated by reference to Exhibit 10.2 to the Form 10-Q filed by Black Knight Financial Services, Inc. on July 28, 2017 (No. 001-37394)) (1)

10.9

Employment Agreement by and between BKFS I Services, LLC and Anthony M. Jabbour, effective as of April 1, 2018 (incorporated by reference to Exhibit 10.21 to the Form 10-K filed by Black Knight, Inc. on February 23, 2018 (No. 001-36394)) (1)

10.10

Second Amendment to Employment Agreement by and between BKFS I Services, LLC and Michael L. Gravelle effective as of November 1, 2019 (incorporated by reference to Exhibit 10.1 to the Form 10-Q filed by Black Knight, Inc. on November 7, 2019 (No. 001-37394)) (1)

10.11

Form of Notice of Restricted Stock Grant and Restricted Stock Award Agreement (2019) under Black Knight, Inc. Amended and Restated 2015 Omnibus Incentive Plan (incorporated by reference to Exhibit 10.24 to the Form 10-K filed by Black Knight, Inc. on February 22, 2019 (No. 001-373394)) (1)

10.12

Form of Notice of Restricted Stock and Restricted Stock Award Agreement (Directors) (2020) under Black Knight, Inc. Amended and Restated 2015 Omnibus Incentive Plan (incorporated by reference to Exhibit 10.1 to the Form 10-Q filed by Black Knight, Inc. on May 5, 2020 (No. 001-37394)) (1)

10.13

Form of Notice of Restricted Stock Grant and Restricted Stock Award Amendment (2020) under Black Knight, Inc. Amended and Restated 2015 Omnibus Incentive Plan (incorporated by reference to Exhibit 10.2 to the Form 10-Q filed by Black Knight, Inc. on May 5, 2020 (No. 001-37394)) (1)

10.14

Form of Notice of Restricted Stock and Restricted Stock Award Amendment (2021) under Black Knight, Inc. Amended and Restated 2015 Omnibus Incentive Plan (incorporated by reference to Exhibit 10.2 to the Form 10-Q filed by Black Knight, Inc. on May 6, 2021 (No. 001-37394)) (1)

10.15

Form of Notice of Restricted Stock and Restricted Stock Award Agreement (Directors) (2021) under Black Knight, Inc. Amended and Restated 2015 Omnibus Incentive Plan (incorporated by reference to Exhibit 10.1 to the Form 10-Q filed by Black Knight, Inc. on August 5, 2021 (No. 001-37394)) (1)

10.16

Form of Notice of Restricted Stock Unit and Restricted Stock Unit Award Agreement (Directors) (2021) under Black Knight, Inc. Amended and Restated 2015 Omnibus Incentive Plan (incorporated by reference to Exhibit 10.2 to the Form 10-Q filed by Black Knight, Inc. on August 5, 2021 (No. 001-37394)) (1)

10.17

Black Knight, Inc. Amended and Restated 2015 Omnibus Incentive Plan (incorporated by reference to Exhibit 99.1 to the Form 8-K filed by Black Knight, Inc. on October 2, 2017 (No. 001-37394)) (1)

100

Table of Contents

10.18

Black Knight, Inc. Employee Stock Purchase Plan, amended and restated effective as of December 5, 2019 (incorporated by reference to Exhibit 10.19 to the Form 10-K filed by Black Knight, Inc. on February 28, 2020 (No. 001-37394)) (1)

10.19

Dun & Bradstreet Holdings, Inc. Common Stock Purchase Agreement, dated June 23, 2020, among Dun & Bradstreet Holdings, Inc. and Black Knight InfoServ, LLC (incorporated by reference to Exhibit 10.1 to the Form 8-K filed by Black Knight, Inc. on June 29, 2020 (No. 001-37394))

10.20

Amended and Restated Credit and Guaranty Agreement, dated as of March 10, 2021, by and among Black Knight InfoServ, LLC, a Delaware limited liability company, as the borrower, JPMorgan Chase Bank, N.A., as Administrative Agent, and the other parties thereto (incorporated by reference to Exhibit 10.1 to the Form 8-K filed by Black Knight, Inc. on March 12, 2021 (No. 001-37394))

10.21

Optimal Blue Holdco, LLC 2020 Incentive Plan (incorporated by reference to Exhibit 10.31 to the Form 10-K filed by Black Knight, Inc. on February 26, 2021 (No. 001-37394)) (1)

10.22

Optimal Blue Holdco, LLC Unit Grant Agreement (2020) (incorporated by reference to Exhibit 10.32 to the Form 10-K filed by Black Knight, Inc. on February 26, 2021 (No. 001-37394)) (1)

10.23

First Amendment to Employment Agreement of Anthony M. Jabbour dated May 16, 2022 (incorporated by reference to Exhibit 10.1 to the Form 8-K filed by Black Knight, Inc. on May 18, 2022 (No. 001-37394)) (1)

10.24

First Amendment to Employment Agreement of Joseph M. Nackashi dated May 16, 2022 (incorporated by reference to Exhibit 10.2 to the Form 8-K filed by Black Knight, Inc. on May 18, 2022 (No. 001-37394)) (1)

10.25

Third Amendment to Employment Agreement of Kirk T. Larsen dated May 16, 2022 (incorporated by reference to Exhibit 10.3 to the Form 8-K filed by Black Knight, Inc. on May 18, 2022 (No. 001-37394)) (1)

10.26

Third Amendment to Employment Agreement of Michael L. Gravelle dated May 16, 2022 (incorporated by reference to Exhibit 10.4 to the Form 8-K filed by Black Knight, Inc. on May 18, 2022 (No. 001-37394)) (1)

10.27

Letter Agreement, dated as of December 19, 2022, by and between Anthony M. Jabbour and Black Knight, Inc. (incorporated by reference to Exhibit 10.1 to the Form 8-K filed by Black Knight, Inc. on December 23, 2022 (No. 001-37394)) (1)

10.28

Form of Notice of Restricted Stock and Restricted Stock Award Agreement (2022) under Black Knight, Inc. Amended and Restated 2015 Omnibus Incentive Plan (incorporated by reference to Exhibit 10.1 to the Form 10-Q filed by Black Knight, Inc. on May 9, 2022 (No. 001-37394)) (1)

10.29

Form of Notice of Restricted Stock and Restricted Stock Award Agreement (May 2022) under Black Knight, Inc. Amended and Restated 2015 Omnibus Incentive Plan (incorporated by reference to Exhibit 10.1 to the Form 10-Q filed by Black Knight, Inc. on August 4, 2022 (No. 001-37394)) (1)

10.30

Form of Notice of Restricted Stock and Restricted Stock Award Agreement (Directors) (2022) under Black Knight, Inc. Amended and Restated 2015 Omnibus Incentive Plan (incorporated by reference to Exhibit 10.2 to the Form 10-Q filed by Black Knight, Inc. on August 4, 2022 (No. 001-37394)) (1)

10.31

Form of Notice of Restricted Stock Unit and Restricted Stock Unit Award Agreement (Directors) (2022) under Black Knight, Inc. Amended and Restated 2015 Omnibus Incentive Plan (incorporated by reference to Exhibit 10.3 to the Form 10-Q filed by Black Knight, Inc. on August 4, 2022 (No. 001-37394)) (1)

21.1

Subsidiaries of the Registrant

23.1

Consent of KPMG LLP, Independent Registered Public Accounting Firm

101

Table of Contents

31.1

Certification of Chief Executive Officer pursuant to Section 302 of the Sarbanes-Oxley Act of 2002

31.2

Certification of Chief Financial Officer pursuant to Section 302 of the Sarbanes-Oxley Act of 2002

32.1

Certification by Chief Executive Officer of Periodic Financial Reports pursuant to Section 906 of the Sarbanes-Oxley Act of 2002, 18 U.S.C. Section 1350

32.2

Certification by Chief Financial Officer of Periodic Financial Reports pursuant to Section 906 of the Sarbanes-Oxley Act of 2002, 18 U.S.C. 18 U.S.C. Section 1350

101.INS

Inline XBRL Instance Document**

101.SCH

Inline XBRL Taxonomy Extension Schema Document

101.CAL

Inline XBRL Taxonomy Extension Calculation Linkbase Document

101.DEF

Inline XBRL Taxonomy Extension Definition Linkbase Document

101.PRE

Inline XBRL Taxonomy Extension Presentation Linkbase Document

101.LAB

Inline XBRL Taxonomy Extension Label Linkbase Document

104

Cover Page Interactive Data File formatted in Inline XBRL and contained in Exhibit 101

(1)A management or compensatory plan or arrangement required to be filed as an exhibit to this report pursuant to Item 15(b) of Form 10-K.

*

Schedules omitted pursuant to Item 601(a)(5) of Regulation S-K. We agree to furnish supplementally a copy of any omitted schedule to the SEC upon request; provided, however, that we may request confidential treatment pursuant to Rule 24b-2 of the Securities Exchange Act of 1934, as amended, for any schedules or exhibits so furnished.

**

The instance document does not appear in the interactive data file because its XBRL tags are embedded within the inline XBRL document.

Item 16.           Form 10-K Summary

None.

102

Table of Contents

SIGNATURES

Pursuant to the requirements of Section 13 or 15(d) of the Securities Exchange Act of 1934, the Registrant has duly caused this report to be signed on its behalf by the undersigned, thereunto duly authorized.

Black Knight, Inc.

By:

/s/ Joseph M Nackashi

Joseph M. Nackashi

Chief Executive Officer

Date: February 28, 2023

Pursuant to the requirements of the Securities Exchange Act of 1934, this report has been signed below by the following persons on behalf of the Registrant and in the capacities and on the dates indicated.

Signature


Title


Date

/s/ Joseph M. Nackashi

Chief Executive Officer

February 28, 2023

Joseph M. Nackashi

(Principal Executive Officer)

/s/ Kirk T. Larsen

President and Chief Financial Officer

February 28, 2023

Kirk T. Larsen

(Principal Financial and Accounting Officer)

/s/ Anthony M. Jabbour

Executive Chairman of the Board of Directors

February 28, 2023

Anthony M. Jabbour

/s/ Catherine L. Burke

Director

February 28, 2023

Catherine L. Burke

/s/ Thomas M. Hagerty

Director

February 28, 2023

Thomas M. Hagerty

/s/ David K. Hunt

Director

February 28, 2023

David K. Hunt

/s/ Joseph M. Otting

Director

February 28, 2023

Joseph M. Otting

/s/ Ganesh B. Rao

Director

February 28, 2023

Ganesh B. Rao

/s/ John D. Rood

Director

February 28, 2023

John D. Rood

/s/ Nancy L. Shanik

Director

February 28, 2023

Nancy L. Shanik

103