UNITED STATES
SECURITIES AND EXCHANGE COMMISSION
Washington, D.C. 20549
FORM
ANNUAL REPORT PURSUANT TO SECTION 13 OR 15(d) OF THE SECURITIES EXCHANGE ACT OF 1934 |
For the fiscal year ended September 30 , 2022
or
TRANSITION REPORT PURSUANT TO SECTION 13 OR 15(d) OF THE SECURITIES EXCHANGE ACT OF 1934 |
Commission File Number
SPONSORED BY WGC USA ASSET MANAGEMENT COMPANY, LLC
(Exact name of registrant as specified in its charter)
(State or other jurisdiction of incorporation or organization) |
(I.R.S. Employer Identification No.) |
c/o WGC USA Asset Management Company, LLC
(212 ) 317-3800
(Address of principal executive offices, telephone number, including area code)
Securities registered pursuant to Section 12(b) of the Act:
Title of each class |
Trading Symbol(s) Name |
Name of each exchange on which registered | ||
Securities registered pursuant to Section 12(g) of the Act: None
Indicate by check mark if the registrant is a well-known seasoned issuer, as defined in Rule 405 of the Securities Act. Yes ☒ No ☐
Indicate by check mark if the registrant is not required to file reports pursuant to Section 13 or Section 15(d) of the Act. Yes ☐ No ☒
Indicate by check mark whether the registrant (1) has filed all reports required to be filed by Section 13 or 15(d) of the Securities Exchange Act of 1934 during the preceding 12 months (or for such shorter period that the registrant was required to file such reports), and (2) has been subject to such filing requirements for the past 90 days. Yes ☒ No ☐
Indicate by check mark whether the registrant has submitted electronically every Interactive Data File required to be submitted pursuant to Rule 405 of Regulation Yes ☒ No ☐
S-T
during the preceding 12 months (or for such shorter period that the registrant was required to submit such files). Indicate by check mark whether the registrant is a large accelerated filer, an accelerated filer, a
non-accelerated
filer, or a smaller reporting company. See the definitions of “large accelerated filer,” “accelerated filer,” “smaller reporting company” and “emerging growth company” in Rule 12b-2
of the Exchange Act. Accelerated filer ☐ |
Non-Accelerated filer ☐ |
Smaller reporting company | ||||
Emerging growth company | ||||||
If an emerging growth company, indicate by check mark if the registrant has elected not to use the extended transition period for complying with any new or revised financial accounting standards provided pursuant to Section 13(a) of the Exchange Act. ☐
Indicate by check mark whether the registrant has filed a report on and attestation to its management’s assessment of the effectiveness of its internal control over financial reporting under Section 404(b) of the Sarbanes-Oxley Act (15 U.S.C. 7262(b)) by the registered public accounting firm that prepared or issued its audit report. ☒
Indicate by check mark whether the registrant is a shell company (as defined in ☒
Rule 12b-2
of the Exchange Act). Yes ☐ No Aggregate market value of SPDR® Gold MiniShares® Trust’s Shares held by non-affiliates of the registrant, based upon the closing price of a share of the registrant’s common stock on March 31, 202
$2
as reported by the NYSE Arca, Inc. on that date:As of November
had 2
, 2022, SPDR® Gold MiniShares® Trust2
shares outstanding.
DOCUMENTS INCORPORATED BY REFERENCE: None
FORWARD LOOKING STATEMENTS
This Annual Report on
Form 10-K
contains various “forward-looking statements” within the meaning of Section 27A of the Securities Act of 1933, as amended, and Section 21E of the Securities Exchange Act of 1934, as amended, and within the Private Securities Litigation Reform Act of 1995, as amended. Forward-looking statements usually include the words “anticipates,” “believes,” “estimates,” “expects,” “intends,” “plans,” “projects,” “understands,” “may,” “can,” “could,” and other words or terms of similar meaning or import suggesting uncertainty. We remind readers that forward-looking statements are merely predictions and therefore inherently subject to uncertainties and other factors and involve known and unknown risks that could cause the actual results, performance, levels of activity, or our achievements, or industry results, to be materially different from any future results, performance, levels of activity, or our achievements expressed or implied by such forward-looking statements. Readers are cautioned not to place undue reliance on these forward-looking statements, which speak only as of the date hereof. The Trust undertakes no obligation to publicly release any revisions to these forward-looking statements to reflect events or circumstances after the date hereof or to reflect the occurrence of unanticipated events except as required by applicable securities laws. Additional significant uncertainties and other factors affecting forward-looking statements are presented in Item 1A. Risk Factors.
“SPDR” is a product of S&P Dow Jones Indices LLC (“SPDJI”), and has been licensed for use by State Street Corporation. Standard & Poor’s and S&P are registered trademarks of Standard & Poor’s Financial Services LLC (“S&P”); Dow Jones is a registered trademark of Dow Jones Trademark Holdings LLC (“Dow Jones”); “SPDR” is a trademark of SPDJI; and these trademarks have been licensed for use by SPDJI and sublicensed for certain purposes by State Street Corporation. State Street Corporation’s financial products are not sponsored, endorsed, sold or promoted by SPDJI, Dow Jones, S&P, their respective affiliates, and none of such parties make any representation regarding the advisability of investing in such product(s) nor do they have any liability for any errors, omissions or interruptions of SPDR®. Further limitations that could affect investors’ rights may be found in this Annual Report.
WITHOUT LIMITING ANY OF THE FOREGOING, IN NO EVENT SHALL S&P HAVE ANY LIABILITY FOR ANY SPECIAL, PUNITIVE, INDIRECT, OR CONSEQUENTIAL DAMAGES (INCLUDING, BUT NOT LIMITED TO LOST PROFITS), EVEN IF NOTIFIED OF THE POSSIBILITY OF SUCH DAMAGES.
THE LBMA GOLD PRICE, WHICH IS ADMINISTERED AND PUBLISHED BY ICE BENCHMARK ADMINISTRATION LIMITED (“IBA”), SERVES AS, OR AS PART OF, AN INPUT OR UNDERLYING REFERENCE FOR SPDR® GOLD MINISHARES
SM
. THE LBMA GOLD PRICE IS A TRADEMARK OF PRECIOUS METALS PRICES LIMITED, AND IS LICENSED TO IBA AS THE ADMINISTRATOR OF THE LBMA GOLD PRICE. ICE BENCHMARK ADMINSTRATION IS A TRADEMARK OF IBA AND/OR ITS AFFILIATES. THE LBMA GOLD PRICE PM, AND THE TRADEMARKS LBMA GOLD PRICE AND ICE BENCHMARK ADMINISTRATION, ARE USED BY SPDR® GOLD MINISHARES
SM
WITH PERMISSION UNDER LICENCE BY IBA. IBA AND ITS AFFILIATES MAKE NO CLAIM, PREDICATION, WARRANTY OR REPRESENTATION WHATSOEVER, EXPRESS OR IMPLIED, AS TO THE RESULTS TO BE OBTAINED FROM ANY USE OF THE LBMA GOLD PRICE, OR THE APPROPRIATENESS OR SUITABILITY OF THE LBMA GOLD PRICE FOR ANY PARTICULAR PURPOSE TO WHICH IT MIGHT BE PUT, INCLUDING WITH RESPECT TO SPDR® GOLD MINISHARES
SM
. TO THE FULLEST EXTENT PERMITTED BY APPLICABLE LAW, ALL IMPLIED TERMS, CONDITIONS AND WARRANTIES, INCLUDING, WITHOUT LIMITATION, AS TO QUALITY, i
MERCHANTABILITY, FITNESS FOR PURPOSE, TITLE OR
NON-INFRINGEMENT,
IN RELATION TO THE LBMA GOLD PRICE, ARE HEREBY EXCLUDED AND NONE OF IBA OR ANY OF ITS AFFILIATES WILL BE LIABLE IN CONTRACT OR TORT (INCLUDING NEGLIGENCE), FOR BREACH OF STATUTORY DUTY OR NUISANCE, FOR MISREPRESENTATION, OR UNDER ANTITRUST LAWS OR OTHERWISE, IN RESPECT OF ANY INACCURACIES, ERRORS, OMISSIONS, DELAYS, FAILURES, CESSATIONS OR CHANGES (MATERIAL OR OTHERWISE) IN THE LBMA GOLD PRICE, OR FOR ANY DAMAGE, EXPENSE OR OTHER LOSS (WHETHER DIRECT OR INDIRECT) YOU MAY SUFFER ARISING OUT OF OR IN CONNECTION WITH THE LBMA GOLD PRICE OR ANY RELIANCE YOU MAY PLACE UPON IT. ii
TABLE OF CONTENTS
Page |
||||||
| 1 | ||||||
| Item 1. | 1 | |||||
| 1 | ||||||
| 2 | ||||||
| 3 | ||||||
| 4 | ||||||
| 7 | ||||||
| 10 | ||||||
| 10 | ||||||
| 14 | ||||||
| 19 | ||||||
| Item 1A. | 19 | |||||
| Item 1B. | 29 | |||||
| Item 2. | 29 | |||||
| Item 3. | 29 | |||||
| Item 4. | 29 | |||||
| PART II | 30 | |||||
| Item 5. | 30 | |||||
| Item 6. | 30 | |||||
| Item 7. | 30 | |||||
| Item 7A. | 34 | |||||
| Item 8. | 34 | |||||
| Item 9. | 35 | |||||
| Item 9A. | 35 | |||||
| Item 9B. | 38 | |||||
| Item 9C. | 38 | |||||
| PART III | 39 | |||||
| Item 10. | 39 | |||||
| Item 11. | 42 | |||||
| Item 12. | 42 | |||||
| Item 13. | 42 | |||||
| Item 14. | 42 | |||||
| PART IV | 43 | |||||
| Item 15. | 43 | |||||
| Item 16. | 45 | |||||
iii
PART I
Item 1. Business
STRUCTURE
The Trust
The World Gold Trust (the “Trust”) was formed as a Delaware statutory trust on August 27, 2014. The Trust consists of multiple series (each, a “Fund” and collectively, the “Funds”). Each Fund issues common units of beneficial interest that represent units of fractional undivided beneficial interest in and ownership of such Fund. The term of the Trust and each Fund is perpetual (unless terminated earlier in certain circumstances). The Trust was organized in separate series as a Delaware statutory trust rather than as separate statutory trusts to achieve certain administrative and other efficiencies. The Trust is sponsored by WGC USA Asset Management Company, LLC (“WGC AM” or the “Sponsor”).
The Funds
The Trust has established six separate Funds of which one is operational at September 30, 2022. The accompanying financial statements relate to the Trust and SPDR® Gold MiniShares® Trust (“GLDM”).
GLDM commenced operations on June 26, 2018. GLDM’s investment objective is for its shares (the “Shares”) to reflect the performance of the price of gold bullion, less GLDM’s expenses. GLDM issues and redeems Shares from time to time in Creation Units to institutional investors referred to as “Authorized Participants.” Creation Units are offered continuously at the net asset value (the “NAV”) for 100,000 Shares on the day that an order to create a Creation Unit is accepted by GLDM. Shares trade under the ticker symbol GLDM on the NYSE Arca, Inc. (the “NYSE Arca”). Authorized Participants and other investors may buy and sell Shares in the secondary market. Authorized share capital is unlimited, and the par value of Shares is $0.00.
The principal offices of the Trust and the Funds are at c/o WGC USA Asset Management Company, LLC, 685 Third Avenue, 27th Floor, New York, New York 10017.
The Sponsor
The Sponsor is a Delaware limited liability company and was formed on August 1, 2014. WGC AM is wholly owned by WGC (US) Holdings, Inc. (“WGCUS”), a Delaware corporation. Under the Delaware Limited Liability Company Act and the governing documents of the Sponsor, WGCUS is not responsible for the debts, obligations and liabilities of the Sponsor solely by reason of being the sole member of the Sponsor.
The Sponsor is responsible for establishing the Funds and for the registration of the shares of each Fund. The Sponsor generally oversees the performance of the Funds’ principal service providers but does not exercise oversight over such service providers. The Sponsor maintains a public website on behalf of the Funds, containing information about each of the Funds and their respective shares. The Internet address of the Sponsor’s website is http://www.spdrgoldshares.com. This Internet address is only provided here as a convenience to you, and the information contained on or connected to the Sponsor’s website is not considered part of this filing.
day-to-day
The Trust’s annual reports on
Form 10-K,
quarterly reports on Form 10-Q,
current reports on Form 8-K,
and any amendments to those reports filed or furnished pursuant to Section 13(a) or 15(d) of the Exchange Act are made available free of charge on the Sponsor’s website after they have been filed with or furnished to the Securities and Exchange Commission (the “SEC”). Additional information regarding the Trust may also be found on the SEC’s EDGAR database at www.sec.gov. 1
The Trustee
Delaware Trust Company, a Delaware trust company with trust powers, serves as the sole trustee of the Trust (the “Trustee”). The Trustee’s duties and liabilities with respect to the offering of shares and the management of the Trust and GLDM are limited to its express obligations under the Fourth Amended and Restated Agreement and Declaration of Trust (“Declaration of Trust”), dated as of April 16, 2018 and amended on February 6, 2020, between the Sponsor and the Trustee.
The Administrator
The Administrator of GLDM is BNY Mellon Asset Servicing, a division of The Bank of New York Mellon (“BNYM” or the “Administrator”). The Administrator is generally responsible for the administration and operation of the Funds, including the calculation of the Funds’ NAV and NAV per share.
day-to-day
The Transfer Agent
BNYM serves also as GLDM’s Transfer Agent in connection with Creation and Redemption transactions of the Shares and acts as the Funds’ distribution disbursing agent. The Transfer Agent receives and processes orders from Authorized Participants to create and redeem Shares and coordinates the processing of such orders with the Custodian and The Depository Trust Company (“DTC”).
The Custodian
The Custodian on behalf of GLDM is ICBC Standard Bank Plc (“ICBC” or the “Custodian”). The Custodian is responsible for the safekeeping of the gold bullion held by GLDM, which includes the gold bullion bars delivered to GLDM by Authorized Participants in connection with the creation of Creation Units. The Custodian also facilitates the transfer of gold bullion into and out of GLDM through gold bullion accounts maintained for Authorized Participants. The Custodian is a market maker, clearer and approved weigher under the rules of the London Bullion Market Association (“LBMA”). The Custodian maintains insurance in support of its custodial obligations under the Allocated Bullion Account Agreement to help protect against the risk of loss for gold deposits. There can be no guarantee such insurance will be sufficient to cover all potential loss of gold deposits.
The Marketing Agent
The Marketing Agent is State Street Global Advisors Funds Distributors, LLC (the “Marketing Agent”). The Sponsor has entered into the Marketing Agent Agreement with the Marketing Agent to assist the Sponsor in marketing the Funds’ shares. The Marketing Agent is a registered broker-dealer with the SEC and is a member of FINRA.
INVESTMENT OBJECTIVE
The investment objective of GLDM is for the Shares to reflect the performance of the price of gold bullion, less GLDM’s expenses. The Shares trade on the NYSE Arca and provide institutional and retail investors with indirect access to the gold bullion market. The Shares may be bought and sold on the NYSE Arca like any other exchange-listed securities. The Sponsor expects that, for many investors, costs associated with buying and selling the Shares in the secondary market and the payment of GLDM’s ongoing expenses will be lower than the costs associated with buying and selling gold bullion and storing and insuring gold bullion in a traditional allocated gold bullion account. The Shares are also listed on the Mexican Stock Exchange (Bolsa Mexicana de Valores).
GLDM’s NAV is the aggregate value of GLDM’s assets less its liabilities (which include estimated accrued but unpaid fees and expenses). The NAV is calculated based on the price of gold per ounce times the number of ounces of gold owned by GLDM. For purposes of calculating NAV, the number of
2
ounces of gold owned by GLDM reflects the amount of gold delivered into (or out of) GLDM on a daily basis by Authorized Participants creating and redeeming Shares. Except as otherwise described herein, in determining the NAV, the Administrator will value the gold bullion held by GLDM on the basis of the price of an ounce of gold determined by the IBA 3:00 PM auction process (“LBMA Gold Price PM”). If no LBMA Gold Price PM is made on a particular evaluation day or if the LBMA Gold Price PM has not been announced by 12:00 p.m. New York time on a particular evaluation day, the next most recent LBMA Gold Price (AM or PM) will be used to determine the NAV, unless the Sponsor determines that such price is inappropriate to use as the basis for such determination. If the Sponsor determines that such price is inappropriate to use, it shall identify an alternate basis for evaluation of the gold bullion held by GLDM.
OVERVIEW
GLDM is a passive investment vehicle designed for the Shares to reflect the performance of the price of gold bullion, less GLDM’s expenses. GLDM’s gold bullion holdings are not managed and GLDM does not have any investment discretion.
GLDM is not registered as an investment company under the Investment Company Act of 1940 and is not required to register under such act. GLDM will not hold or trade in commodity futures contracts regulated by the Commodity Exchange Act of 1936 (the “CEA”) as administered by the Commodity Futures Trading Commission (the “CFTC”). GLDM is not a commodity pool for purposes of the CEA, and none of the Sponsor, the Trustee or the Marketing Agent is subject to regulation as a commodity pool operator or a commodity trading advisor in connection with the Shares.
GLDM holds only gold bullion. As such, the gold bullion held by GLDM will only be sold (1) on an
as-needed
basis to pay GLDM’s expenses, (2) in the event GLDM terminates and liquidates its assets, or (3) as otherwise required by law or regulation. The sale of gold bullion by GLDM is a taxable event to shareholders. Sales of Gold
The Administrator sells GLDM’s gold as necessary to pay its expenses. As a result, the amount of gold sold will vary from time to time depending on the level of expenses and the market price of gold. Unless otherwise directed by the Sponsor, the Administrator sells gold to the Custodian at the next LBMA Gold Price PM, following the sale order. Neither the Administrator nor the Sponsor is liable for depreciation or loss incurred by reason of any sale. Any cash held by the Administrator on behalf of the Funds does not bear any interest.
The Administrator may also sell GLDM’s gold if the Sponsor notifies the Administrator that the sale of gold is required by applicable law or regulation or in connection with the termination and liquidation of GLDM. The Administrator will not be liable or responsible in any way for depreciation or loss incurred by reason of any sale of gold directed by the Sponsor. Any property received by GLDM other than gold, cash or an amount receivable in cash (such as, for example, an insurance claim) will be promptly sold or otherwise disposed of by the Administrator.
Gold Price Information
Investors may obtain gold pricing information on a
24-hour
basis based on the spot price for an ounce of gold from various financial information service providers. Current spot prices are also generally available with bid/ask spreads from gold bullion dealers. In addition, the Sponsor’s website provides ongoing pricing information for gold spot prices and the Shares. Market prices for the Shares are available from a variety of sources including brokerage firms, information websites and other information service providers. The NAV of GLDM is published by the Sponsor on each day that the NYSE Arca is open for regular trading and is posted on the Sponsor’s website at www.spdrgoldshares.com. 3
THE GOLD INDUSTRY
Gold Supply and Demand
Gold is a physical asset that is accumulated rather than consumed. As a result, virtually all the gold that has ever been mined still exists today in one form or another. The following table is a summary of the world gold supply and demand for the past 5 years. It is based on information reported in
Gold Focus 2022
1
.
World Gold Supply and Demand (2017-2021)
| Tonnes |
2017 |
2018 |
2019 |
2020 |
2021 |
|||||||||||||||
| SUPPLY |
||||||||||||||||||||
| Mine Production |
3,573 | 3,655 | 3,595 | 3,476 | 3,581 | |||||||||||||||
| Recycling |
1,112 | 1,132 | 1,276 | 1,293 | 1,136 | |||||||||||||||
| Net Hedging Supply |
— | — | 6 | — | — | |||||||||||||||
| Total Supply |
4,685 |
4,787 |
4,877 |
4,769 |
4,717 |
|||||||||||||||
| DEMAND |
||||||||||||||||||||
| Jewelry Fabrication |
2,257 | 2,290 | 2,152 | 1,324 | 2,229 | |||||||||||||||
| Industrial Demand |
333 | 335 | 326 | 303 | 330 | |||||||||||||||
| Net Physical Investment |
1,035 | 1,067 | 844 | 890 | 1,168 | |||||||||||||||
| Net Hedging Demand |
21 | 12 | — | 39 | 23 | |||||||||||||||
| Net Official Sector Buying |
379 | 656 | 605 | 255 | 454 | |||||||||||||||
| Total Demand |
4,024 |
4,360 |
3,927 |
2,811 |
4,204 |
|||||||||||||||
| Market Balance |
661 | 427 | 950 | 1,958 | 513 | |||||||||||||||
| Net Investment in ETPs |
271 | 71 | 398 | 888 | 193 | |||||||||||||||
| Market Balance less ETPs |
390 | 356 | 552 | 1,069 | 705 | |||||||||||||||
| Gold Price (US$/oz, London) |
1,257 | 1,268 | 1,393 | 1,770 | 1,799 | |||||||||||||||
Source: Gold Focus 2022
Sources of Gold Supply
Based on data from , gold supply averaged 4,767 tonnes per year between 2017 and 2021. Sources of gold supply include both mine production and recycled above-ground stocks and, to a lesser extent, producer net hedging. The largest portion of gold supplied to the market is from mine production, which averaged approximately 3,576 tonnes per year from 2017 through 2021. The second largest source of annual gold supply is recycling gold, which is gold that has been recovered from jewelry and other fabricated products and converted back into marketable gold. Recycled gold averaged approximately 1,190 tonnes annually between 2017 through 2021.
Gold Focus 2022
Sources of Gold Demand
Based on data from , gold demand averaged 3,865 tonnes per year between 2017 and 2021. Gold demand generally comes from four sources: jewelry, industry (including medical applications), investment and the official sector (including central banks and supranational organizations). The largest source of demand comes from jewelry fabrication, which accounted for approximately 53% of the identifiable demand from 2017 through 2021 followed by net physical investment, which represents identifiable investment demand, which accounted for approximately 26%.
Gold Focus 2022
1 |
Gold Focus 2022 |
4
Gold demand is widely dispersed throughout the world with significant contributions from India and China. In many countries there are seasonal fluctuations in the levels of demand for gold—especially jewelry. However, as a result of variations in the timing of seasons throughout the world, seasonal fluctuations in demand do not appear to have a significant impact on the global gold price.
Between 2017 and 2021, according to , central bank purchases averaged 470 tonnes. The prominence given by market commentators to this activity coupled with the total amount of gold held by the official sector has resulted in this area being one of the more visible shifts in the gold market.
Gold Focus 2022
Operation of the Gold Bullion Market
The global trade in gold consists of (“OTC”) transactions in spot, forwards, and options and other derivatives, together with exchange-traded futures and options.
over-the-counter
Global Market
Over-the-Counter
The OTC market trades on a continuous basis and accounts for most global gold trading. Market makers and participants in the OTC market trade with each other and their clients on a basis. All risks and issues of credit are between the parties directly involved in the transaction. The three products relevant to LBMA market making are Spot (S), Forwards (F) and Options (O). There are twelve LBMA Market Makers who provide the service in one, two or all three products.
principal-to-principal
| Member |
Membership Type |
Spot (S) |
Forwards (F) |
Options (O) | ||||
| Citibank N A |
Full Market Makers | x | x | x | ||||
| Credit Suisse AG Zurich |
Full Market Makers | x | x | x | ||||
| Goldman Sachs International |
Full Market Makers | x | x | x | ||||
| HSBC |
Full Market Makers | x | x | x | ||||
| JP Morgan Chase Bank |
Full Market Makers | x | x | x | ||||
| Morgan Stanley & Co International Ltd |
Full Market Makers | x | x | x | ||||
| UBS AG |
Full Market Makers | x | x | x | ||||
| BNP Paribas SA |
Market Makers | x | ||||||
| ICBC Standard Bank Plc |
Market Makers | x | ||||||
| Merrill Lynch International |
Market Makers | x | x | |||||
| Standard Chartered Bank |
Market Makers | x | x | |||||
| Toronto-Dominion Bank |
Market Makers | x | ||||||
The OTC market provides a relatively flexible market in term of quotes, price, size, destinations for delivery and other factors. Bullion dealers customize transactions to meet their clients’ requirements. The OTC market has no formal structure and no open-outcry meeting place.
The main centers of the OTC market are London, New York and Zurich. Mining companies, central banks, manufacturers of jewelry and industrial products, together with investors and speculators, tend to transact their business through one of these centers. Centers such as Dubai and several cities in the Far East also transact substantial OTC market business. Bullion dealers have offices around the world and most of the world’s major bullion dealers are either members or associate members of the LBMA.
In the OTC market, the standard size of gold trades ranges between 5,000 and 10,000 ounces.
Bid-offer
spreads are typically $0.50 per ounce. Transaction costs in the OTC market are negotiable between the parties and therefore vary widely, with some dealers willing to offer clients competitive prices for larger volumes, although this will vary according to the dealer, the client and market conditions. Cost indicators can be obtained from various information service providers as well as dealers. 5
Liquidity in the OTC market can vary from time to time during the course of the
24-hour
trading day. Fluctuations in liquidity are reflected in adjustments to dealing spreads—the difference between a dealer’s “buy” and “sell” prices. The period of greatest liquidity in the gold market generally occurs at the time of day when trading in the European time zones overlaps with trading in the United States, which is when OTC market trading in London, New York and other centers coincides with futures and options trading on the Commodity Exchange Inc. (the “COMEX”). The London Bullion Market
Although the market for physical gold is global, most OTC market trades are cleared through London. In addition to coordinating market activities, the LBMA acts as the principal point of contact between the market and its regulators. A primary function of the LBMA is its involvement in the promotion of refining standards by maintenance of the “London Good Delivery Lists,” which are the lists of LBMA accredited melters and assayers of gold. The LBMA also coordinates market clearing and vaulting, promotes good trading practices and develops standard documentation.
The term “loco London” refers to gold bars physically held in London that meet the specifications for weight, dimensions, fineness (or purity), identifying marks (including the assay stamp of an LBMA acceptable refiner) and appearance set forth in “The Good Delivery Rules for Gold and Silver Bars” published by the LBMA. Gold bars meeting these requirements are known as “London Good Delivery Bars.” The unit of trade in London is the troy ounce, whose conversion between grams is: 1,000 grams = 32.1507465 troy ounces and 1 troy ounce = 31.1034768 grams. A London Good Delivery Bar is acceptable for delivery in settlement of a transaction on the OTC market. Typically referred to as
400-
ounce bars, a London Good Delivery Bar must contain between 350 and 430 fine troy ounces of gold, with a minimum fineness (or purity) of 995 parts per 1,000 (99.5%), be of good appearance and be easy to handle and stack. The fine gold content of a gold bar is calculated by multiplying the gross weight of the bar (expressed in units of 0.025 troy ounces) by the fineness of the bar. LBMA Gold Price
The LBMA Gold Price is determined twice daily during London trading hours through an auction which provides reference gold prices for that day’s trading. The LBMA Gold Price was initiated on March 20, 2015 and replaced the London PM Gold Fix. The auction that determines the LBMA Gold Price is a physically settled, electronic and tradeable auction, with the ability to settle trades in U.S. dollars, euros or British pounds. The IBA provides the auction platform and methodology as well as the overall administration and governance for the LBMA Gold Price. Many long-term contracts are expected to be priced on the basis of either the morning (AM) or afternoon (PM) LBMA Gold Price, and many market participants are expected to refer to one or the other of these prices when looking for a basis for valuations.
Participants in the IBA auction process submit anonymous bids and offers which are published on screen and in real-time. Throughout the auction process, aggregated gold bids and offers are updated in real-time with the imbalance calculated and the price updated every 45 seconds until the buy and sell orders are matched. When the net volume of all participants falls within a
pre-determined
tolerance, the auction is deemed complete and the applicable LBMA Gold Price is published. Information about the auction process (such as aggregated bid and offer volumes) will be immediately available after the auction on the IBA’s website. The Financial Conduct Authority (the “FCA”) in the U.K. regulates the LBMA Gold Price.
Futures Exchanges
Although GLDM does not invest in gold futures, information about the gold futures market is relevant as such markets are a source of liquidity for the overall market for gold and impact the price of gold.
6
The most significant gold futures exchange is the COMEX, part of the CME Group. It began to offer trading in gold futures contracts in 1974, and for most of the period since that date, it has been the largest exchange in the world for trading precious metals futures and options. The Tokyo Commodity Exchange (the “TOCOM”) is another significant futures exchange and has been trading gold since 1982. Trading on these exchanges is based on fixed delivery dates and transaction sizes for the futures and options contracts traded. Trading costs are negotiable. As a matter of practice, only a small percentage of the futures market turnover ever comes to physical delivery of the gold represented by the contracts traded. Both exchanges permit trading on margin. Margin trading can add to the speculative risk involved given the potential for margin calls if the price moves against the contract holder. Both the COMEX and the TOCOM operate through a central clearance system, and in each case, the exchange acts as a counterparty for each member for clearing purposes. Other commodity exchanges include, the Multi Commodity Exchange of India (“MCX”), the Shanghai Futures Exchange, the Shanghai Gold Exchange, ICE Futures US (the “ICE”), and the Dubai Gold & Commodities Exchange. The ICE and CME Group are members of the Intermarket Surveillance Group (“ISG”).
Market Regulation
The global gold markets are overseen and regulated by both governmental and self-regulatory organizations. In addition, certain trade associations have established rules and protocols for market practices and participants.
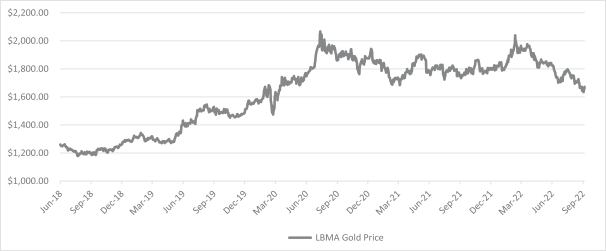
Movements in the Price of Gold
The following chart provides historical background on the price of gold. The chart illustrates movements in the price of gold in U.S. dollars per ounce over the period from the day the Shares began trading on the NYSE on June 26, 2018 to September 30, 2022, and is based on the LBMA Gold Price PM.
Daily Gold Price – June 26, 2018 – September 30, 2022
LBMA Gold Price PM USD
CREATION AND REDEMPTION OF SHARES
GLDM creates and redeems Shares from time to time, but only in one or more Creation Units (a Creation Unit equals a block of 100,000 Shares). The creation and redemption of Creation Units is only made in exchange for the delivery to GLDM or the distribution by GLDM of the amount of gold bullion represented by the Creation Units being created or redeemed. The amount of gold bullion required to be delivered to GLDM in connection with any creation, or paid out upon redemption, is based on the combined NAV of the number of Shares included in the Creation Units being created or redeemed as
7
determined on the day the order to create or redeem Creation Units is properly received and accepted. The standard settlement cycle for most broker-dealer securities transactions is two business days, T+2 (the trade date plus two business days).
Authorized Participants are the only persons that may place orders to create and redeem Creation Units. To become an Authorized Participant, a person must enter into a Participant Agreement with the Administrator. The Participant Agreement and the related procedures attached thereto may be amended by the Administrator and the Sponsor without the consent of any shareholder or Authorized Participant. Authorized Participants who make deposits with GLDM in exchange for Creation Units receive no fees, commissions or other form of compensation or inducement of any kind from either the Sponsor or GLDM, and no such person has any obligation or responsibility to the Sponsor or GLDM to effect any sale or resale of Shares.
Authorized Participants may act for their own accounts or as agents for broker-dealers, custodians and other securities market participants that wish to create or redeem Creation Units. An order for one or more Creation Units may be placed by an Authorized Participant on behalf of multiple clients. Persons interested in purchasing Creation Units should contact the Sponsor or the Administrator to obtain the contact information for the Authorized Participants. Shareholders who are not Authorized Participants’ will only be able to redeem their Shares through an Authorized Participant.
As of the date of this annual report, the Authorized Participants are Goldman Sachs & Co., J.P. Morgan Securities LLC, Merrill Lynch Professional Clearing Corp., Morgan Stanley & Co. LLC, UBS Securities LLC, Virtu Americas LLC and HSBC Securities (USA) Inc. An updated list of Authorized Participants can be obtained from the Administrator or the Sponsor.
All gold bullion must be delivered by Authorized Participants to GLDM and distributed by GLDM in unallocated form through credits and debits between Authorized Participants’ Unallocated Accounts and the GLDM Unallocated Account.
All gold bullion must be of at least a minimum fineness (or purity) of 995 parts per 1,000 (99.5%) and otherwise conform to the rules, regulations, practices and customs of the LBMA, including the specifications for a London Good Delivery Bar.
Delivery of Required Deposits
An Authorized Participant who places a purchase order is responsible for transferring the required gold bullion deposit amount to the GLDM Unallocated Account on the second business day in London following the purchase order date. Upon receipt of the gold bullion deposit amount, the Administrator will direct DTC to credit the number of Creation Units ordered to the Authorized Participant’s DTC account. The expense and risk of delivery, ownership and safekeeping of gold bullion until such gold bullion has been received by GLDM will be borne solely by the Authorized Participant. If gold bullion is to be delivered other than as described above, the Sponsor is authorized to establish such procedures and to appoint such custodians and establish such custody accounts as the Sponsor determines to be desirable.
Acting on standing instructions given by the Administrator, the Custodian will transfer the gold bullion deposit amount from the GLDM Unallocated Account to the GLDM Allocated Account by allocating to the GLDM Allocated Account specific bars of gold bullion which the Custodian holds or instructing a subcustodian to allocate specific bars of gold bullion held by or for the subcustodian. The gold bullion bars in an allocated gold bullion account are specific to that account and are identified by a list which shows, for each gold bullion bar, the refiner, assay or fineness, serial number and gross and fine weight. Gold bullion held in GLDM’s allocated account is the property of GLDM and is not traded, leased or loaned under any circumstances.
The Custodian will use commercially reasonable efforts to complete the transfer of gold bullion to the GLDM Allocated Account prior to the time by which the Administrator is to credit the Creation Unit to
8
the Authorized Participant’s DTC account; if, however, such transfers have not been completed by such time, the number of Creation Units ordered will be delivered against receipt of the gold bullion deposit amount in the GLDM Unallocated Account, and all shareholders will be exposed to the risks of unallocated gold bullion to the extent of that gold bullion deposit amount until the Custodian completes the allocation process. See “Risk Factors—Risks Related to the Custody of Gold—Gold bullion held in GLDM’s unallocated gold bullion account and any Authorized Participant’s unallocated gold bullion account is not segregated from the Custodian’s assets.”
Rejection of Purchase Orders
GLDM has the right, but not the obligation, to reject a purchase order if (i) the order is not in proper form as described in the Participant Agreement, (ii) the fulfillment of the order, in the opinion of its counsel, might be unlawful, (iii) it determines that acceptance of the order from an Authorized Participant would expose GLDM to credit risk, or (iv) circumstances outside the control of the Administrator, the Sponsor or the Custodian make the purchase, for all practical purposes, not feasible to process.
Redemption Procedures
The procedures by which an Authorized Participant can redeem one or more Creation Units mirror the procedures for the creation of Creation Units. On any business day, an Authorized Participant may place an order with the Administrator to redeem one or more Creation Units. Redemption orders must be placed with the Administrator no later than 3:59:59 p.m. New York time. A redemption order so received is effective on the date it is received in satisfactory form by the Administrator. The day on which the Administrator receives a valid redemption order is the redemption order date.
Trading of Shares
The Shares are listed on NYSE Arca under the ticker symbol GLDM. The Shares may be bought and sold in the secondary market throughout the trading day like other publicly traded securities. While the Shares are issued in Creation Units at NAV, the Shares traded in the secondary market may trade at prices that are lower or higher than their NAV per Share. The amount of the discount or premium in the trading price relative to the NAV per Share is a function of supply and demand, among other things, and may be influenced by
non-concurrent
trading hours between NYSE Arca and the COMEX, London, Zurich and Singapore. While the Shares trade on NYSE Arca until 4:00 p.m. New York time, liquidity in the global gold market is reduced after the close of the COMEX at 1:30 p.m. New York time. As a result, after 1:30 p.m. New York time, trading spreads, and the resulting premium or discount, on the Shares may widen. Most retail investors purchase and sell the Shares through traditional brokerage or other intermediary accounts. Purchases or sales of the Shares in the secondary market, which will not involve the Funds, may be subject to customary brokerage commissions.
Determination of Redemption Distribution
The redemption distribution from GLDM consists of a credit to the redeeming Authorized Participant’s Unallocated Account in the amount of the Creation Unit Gold Delivery Amount. The Creation Unit Gold Delivery Amount for redemptions is the number of ounces of gold bullion held by GLDM to be paid out upon redemption of a Creation Unit. There will be no cash distributions made to Authorized Participants upon redemption.
Delivery of Redemption Distribution
The redemption distribution due from GLDM is delivered to the Authorized Participant on the second business day following the redemption order date if, by 10:00 a.m. New York time on such second business day, the Administrator’s DTC account has been credited with the Creation Units to be
9
redeemed. The Custodian transfers the redemption gold bullion amount from the GLDM Allocated Account to the GLDM Unallocated Account and, thereafter, to the redeeming Authorized Participant’s unallocated account. The Authorized Participant and GLDM are each at risk in respect of gold bullion credited to their respective unallocated accounts in the event of the Custodian’s insolvency. See “Risk Factors—Risks Related to the Custody of Gold—Gold bullion held in GLDM’s unallocated gold bullion account and any Authorized Participant’s unallocated gold bullion account is not segregated from the Custodian’s assets.”
Suspension or Rejection of Redemption Orders
GLDM may, in its discretion, and will when directed by the Sponsor, suspend the right of redemption, or postpone the redemption settlement date for: (1) any period during which NYSE Arca is closed other than customary weekend or holiday closings, or trading on NYSE Arca is suspended or restricted, (2) any period during which an emergency exists as a result of which delivery, disposal or evaluation of gold bullion is not reasonably practicable, or (3) such other period as the Sponsor determines to be necessary for the protection of the shareholders.
GLDM has the right, but not the obligation, to reject a redemption order if (i) the order is not in proper form as described in the Participant Agreement, (ii) the fulfillment of the order, in the opinion of its counsel, might be unlawful, (iii) it determines that acceptance of the order from an Authorized Participant would expose GLDM to credit risk, or (iv) circumstances outside the control of the Administrator, the Sponsor or the Custodian make the redemption, for all practical purposes, not feasible to process.
The Sponsor will not be liable to any person or liable in any way for any loss or damages that may result from any such suspension, postponement or rejection.
Creation and Redemption Transaction Fee
An Authorized Participant is required to pay a transaction fee to the Administrator of $500 per order to create or redeem Creation Units of GLDM. An order may include multiple Creation Units. The transaction fee may be changed from time to time at the sole discretion of the Sponsor and upon written notice to the Authorized Participant, which notice may be provided by disclosure in GLDM’s prospectus. In addition, the Sponsor may waive the transaction fee on the creation or redemption of Creation Units for one or more Authorized Participants from time to time in its sole discretion.
LIABILITY
No shareholder of GLDM shall be subject in such capacity to any personal liability whatsoever to any person in connection with GLDM’s property or the acts, obligations or affairs of GLDM. Shareholders shall have the same limitation of personal liability as is extended to stockholders of a private corporation for profit incorporated under the Delaware General Corporation Law.
CUSTODY OF GLDM’S GOLD
The Custodian and its affiliates may from time to time purchase or sell gold bullion or Shares for their own accounts, as agents for their customers and for accounts over which they exercise investment discretion. Unless otherwise agreed by GLDM, the Custodian will hold the gold bullion deposited with and held for the account of GLDM at its London, England vault, except when the gold bullion has been allocated in the vault of a subcustodian solely for temporary custody and safekeeping. If held by a subcustodian, the Custodian has agreed that it will use commercially reasonable efforts promptly to transport the gold bullion from the subcustodian’s vault to the Custodian’s vault, at the Custodian’s cost and risk. The Custodian is a market maker, clearer and approved weigher of gold under the rules of the LBMA.
10
The Custodian, as instructed by the Sponsor or GLDM, is authorized to accept, on behalf of GLDM, deposits of gold bullion in unallocated form. Acting on standing instructions given by the Sponsor or GLDM, the Custodian allocates gold bullion deposited in unallocated form with GLDM by selecting bars of gold bullion for deposit to the GLDM Allocated Account from unallocated bars that the Custodian holds or by instructing a subcustodian to allocate bars from unallocated bars held by the subcustodian. All gold bullion allocated to GLDM must conform to the rules, regulations, practices and customs of the LBMA, and the Custodian must replace any nonconforming gold bullion with conforming gold bullion as soon as practical.
The gold bullion bars in an allocated gold bullion account are specific to that account and are identified by a list which shows, for each gold bullion bar, the refiner, assay or fineness, serial number and gross and fine weight. Gold bullion held in GLDM’s allocated account is the property of GLDM and is not traded, leased or loaned under any circumstances.
The gold bullion bars held in an unallocated account are not segregated from the Custodian’s assets. The account holder therefore has no ownership interest in any specific bars of gold bullion that the unallocated account’s bullion dealer holds or owns. The account holder is an unsecured creditor of the bullion dealer, and credits to an unallocated account are at risk of the bullion dealer’s insolvency, in which event it may not be possible for a liquidator to identify any gold bullion held in an unallocated account as belonging to the account holder rather than to the bullion dealer.
The Trust, on behalf of GLDM, and the Custodian have entered into Custody Agreements that establish the GLDM Unallocated Account and the GLDM Allocated Account. The GLDM Unallocated Account is used for several purposes including to facilitate the transfer of gold bullion deposits and gold bullion redemption distributions between Authorized Participants and GLDM in connection with the creation and redemption of Creation Units. It is also used for sales of gold bullion to pay GLDM’s expenses, and when gold bullion is transferred into and out of GLDM. The Custodian is instructed to allocate all gold bullion deposited with GLDM to the GLDM Allocated Account by the close of business on each Business Day.
The Custodian is authorized to appoint from time to time one or more subcustodians to hold GLDM’s gold bullion until it can be transported to the Custodian’s vault. The Custodian has not utilized any subcustodians to date. In accordance with LBMA practices and customs, the Custodian does not have written custody agreements with the subcustodians it selects. This could affect the recourse of GLDM and the Custodian against any subcustodian in the event a subcustodian does not use due care in the safekeeping of GLDM’s gold bullion. See “Risk Factors—Risks Related to the Custody of Gold—The ability of the Administrator and the Custodian to take legal action against subcustodians may be limited.” The Custodian is required to use reasonable care in selecting subcustodians and will monitor the conduct of each subcustodian, and, where it is legally permissible to do so, promptly advise the Trust of any difficulties or problems existing with respect to such subcustodian of which the Custodian is aware. The Custodian is obliged under the Allocated Gold Account Agreement to use commercially reasonable efforts to obtain delivery of gold bullion from those subcustodians appointed by it. Under the Allocated Gold Account Agreement, except for an obligation on the part of the Custodian to use commercially reasonable efforts to obtain delivery of GLDM’s gold bullion bars from any subcustodians appointed by the Custodian, the Custodian is not liable for the acts or omissions, or for the solvency, of its subcustodians unless the selection of such subcustodians was made by the Custodian fraudulently, negligently or in bad faith. Under the customs and practices of the London bullion market, allocated gold bullion is held by custodians and, on their behalf, by subcustodians under arrangements that permit each entity for which gold bullion is being held: (1) to request from the entity’s custodian (and a custodian or subcustodian to request from its subcustodian) a list identifying each gold bullion bar being held and the identity of the particular custodian or subcustodian holding the gold bullion bar and (2) to request the entity’s custodian to release the entity’s gold within two business days following demand for release. Each custodian or subcustodian is obligated under the customs and practices of the London bullion market to provide the bar list and the identification of custodians and subcustodians referred to in
11
(1) above, and each custodian is obligated to release gold as requested. Under English law, unless otherwise provided in any applicable custody agreement, a custodian generally is liable to its customer for failing to take reasonable care of the customer’s gold and for failing to release the customer’s gold upon demand.
The Custodian does not require any subcustodians to be insured or bonded with respect to their custodial activities. The Custodian has agreed to maintain insurance in connection with the storage of GLDM’s precious metal under the Custody Agreements, including covering any loss of gold, on such terms and conditions as it considers appropriate, which may not cover the full amount of gold. The Sponsor (so long as the Sponsor is WGC AM) and GLDM may, subject to confidentiality restrictions, review this insurance coverage, and the Custodian will provide the Trust with evidence of the Custodian’s insurance at GLDM’s request within 10 business days following the end of the calendar year. GLDM will not be a beneficiary of any such insurance and does not have the ability to dictate the nature or amount of the coverage. Therefore, shareholders cannot be assured that the Custodian maintains adequate insurance or any insurance with respect to the gold bullion held by the Custodian on behalf of GLDM.
Description of the GLDM Custody Agreements
The Allocated Gold Account Agreement and the Unallocated Gold Account Agreement between the Trust, on behalf of GLDM, and the Custodian establishes the GLDM Allocated Account and the GLDM Unallocated Account, respectively. These agreements are sometimes referred to together as the “Custody Agreements.” The following is a description of the material terms of the Custody Agreements. As the Custody Agreements are similar in form, they are discussed together, with material distinctions between the agreements noted.
Transfers into the GLDM Unallocated Account
The Custodian credits to the GLDM Unallocated Account the amount of gold bullion it receives from the GLDM Allocated Account, an Authorized Participant’s unallocated gold account, or from other third-party unallocated accounts representing the right to receive gold bullion. Unless otherwise agreed by the Custodian in writing, the only gold bullion the Custodian will accept in physical form for credit to the GLDM Unallocated Account is gold bullion transferred from the GLDM Allocated Account. No interest will be paid by the Custodian on any credit balance to the GLDM Unallocated Account.
Transfers from the GLDM Unallocated Account
The Custodian transfers gold bullion from the GLDM Unallocated Account only in accordance with the instructions to the Custodian. A transfer of gold bullion from the GLDM Unallocated Account may only be made (1) by transferring gold bullion to an Authorized Participant’s unallocated account, (2) by transferring gold bullion to the GLDM Allocated Account, (3) by making gold bullion available for collection at the Custodian’s vault premises or at such other location as the Custodian may specify, (4) by delivering the gold bullion to such location as the Trust directs at GLDM’s expense and risk, or (5) by transferring to an account maintained by the Custodian or by a third party on an unallocated basis in connection with the sale of Gold or other permitted transfers. Any gold bullion made available in physical form will be in a form which complies with the rules, regulations, practices and customs of the LBMA, the Bank of England or any applicable regulatory body, or Custody Rules, or in such other form as may be agreed between the Administrator and the Custodian, and in all cases will comprise one or more whole gold bullion bars selected by the Custodian.
The Custody Agreements provide for the full allocation of all gold bullion received from the Authorized Participants or other third parties and credited to the GLDM Unallocated Account at the end of each business day. The Sponsor established an overdraft facility with the Custodian under which the Custodian makes available to the GLDM Unallocated Account up to 430 fine ounces of gold bullion in
12
order to allow the Custodian to fully allocate all gold bullion credited to the GLDM Unallocated Account to the GLDM Allocated Account at the end of each business day.
Transfers into the GLDM Allocated Account
With respect to gold bullion delivered by Authorized Participants, the Custodian receives transfers of gold bullion into the GLDM Allocated Account only at the Trust’s instructions by debiting gold bullion from the GLDM Unallocated Account and crediting such gold bullion to the GLDM Allocated Account.
Transfers from the GLDM Allocated Account
The Custodian transfers gold bullion from the GLDM Allocated Account only in accordance with the Trust’s instructions. Generally, the Custodian transfers gold bullion from the GLDM Allocated Account only by debiting gold bullion from the GLDM Allocated Account and crediting the gold bullion to the GLDM Unallocated Account.
Withdrawals of Gold Directly from the GLDM Allocated Account
Upon the Trust’s instruction, the Custodian debits gold bullion from the GLDM Allocated Account and makes the gold bullion available for collection by the Trust or, if separately agreed, for delivery by the Custodian in accordance with its usual practices at GLDM’s expense and risk. The Trust and the Custodian expect that the Trust will withdraw gold bullion physically from the GLDM Allocated Account (rather than by crediting it to the GLDM Unallocated Account and instructing a further transfer from that account) only in exceptional circumstances, such as if, for some unforeseen reason, it was not possible to transfer gold bullion in unallocated form. The Custodian is not obliged to effect any requested delivery if, in its reasonable opinion, (1) this would cause the Custodian or its agents to be in breach of the Custody Rules or other applicable law, court order or regulation, (2) the costs incurred would be excessive or (3) delivery is impracticable for any reason. When gold bullion is physically withdrawn from the GLDM Allocated Account pursuant to the Trust’s instruction, all right, title, risk and interest in and to the gold bullion withdrawn shall pass to the person to whom or for whose account such gold bullion is transferred, delivered or collected at the time the recipient or its agent acknowledges in writing its receipt of gold bullion. Unless the Trust specifies the bars of gold bullion to be debited from the GLDM Allocated Account, the Custodian is entitled to select the gold bullion bars.
Exclusion of Liability
The Custodian will use reasonable care in the performance of its duties under the Custody Agreements and is only responsible for any loss or damage suffered by GLDM as a direct result of any negligence, fraud, or willful default on the part of the Custodian in the performance of the duties under the Custody Agreements. The Custodian’s liability is further limited to the market value of the gold bullion held in the GLDM Allocated Account and the amount of the gold bullion credited to the GLDM Unallocated Account at the time such negligence, fraud, or willful default is either discovered by or notified to the Custodian, provided that the Custodian notifies the Sponsor and the Trust promptly after any discovery. Furthermore, the Custodian has no duty to make or take or to require any subcustodian selected by it to make or take any special arrangements or precautions beyond those required by the Custody Rules or as specifically set forth in the Custody Agreements.
In the event of a loss caused by the failure of the Custodian or a subcustodian to exercise reasonable care, the Trust, on behalf of GLDM, has the right to seek recovery from the Custodian in breach. The Custodian is not liable for any delay in performance or any
non-performance
of any of its obligations under the Custody Agreements by reason of any cause beyond the Custodian’s reasonable control, including any act of God or war or terrorism, any breakdown, malfunction or failure of, or in connection with, any communication, computer, transmission, clearing or settlement facilities, industrial action, acts, rules and regulations of any governmental or supra national bodies or authorities or relevant regulatory or self-regulatory organizations. 13
Indemnity
Solely out of GLDM’s assets, GLDM will indemnify the Custodian against all costs and expenses, damages, liabilities and losses (other than Value Added Tax and the expenses assumed by the Sponsor under its Agreement with the Custodian) which the Custodian may suffer or incur, directly or indirectly, in connection with services provided to GLDM under the Custody Agreements, except to the extent that such sums are due directly to the Custodian’s negligence, willful default or fraud.
Termination
GLDM and the Custodian may each terminate any Custody Agreement upon 90 business days’ prior written notice. GLDM and the Custodian each may terminate any Custody Agreement immediately by written notice in the event it becomes unlawful for the Custodian or the Trust to be a party to the Agreement or for the Custodian to offer its services to the Trust or for the Trust to receive such services. GLDM and the Custodian each may terminate any Custody Agreement immediately by written notice in the event either party determines in its commercially reasonable opinion the existence of the presentation of a
winding-up
order, bankruptcy or analogous event in relation to the other party. If either the Allocated Gold Account Agreement or the Unallocated Gold Account Agreement is terminated, the other agreement automatically terminates. Governing Law
The GLDM Custody Agreements are governed by English law. The Administrator and the Custodian both consent to the
non-exclusive
jurisdiction of the courts of the State of New York and the federal courts located in the borough of Manhattan in New York City. Such consent is not required for any person to assert a claim of New York jurisdiction over the Trustee or the Custodian. UNITED STATES FEDERAL TAX CONSEQUENCES
The following discussion of the material U.S. federal income tax consequences that generally apply to the purchase, ownership and disposition of Shares by a U.S. Shareholder (as defined below), and certain U.S. federal gift and estate tax consequences that generally apply to an investment in Shares by a
Non-U.S.
Shareholder (as defined below), represents, insofar as it describes conclusions as to U.S. federal tax law and subject to the limitations and qualifications described therein, the opinion of Carter Ledyard & Milburn LLP, special U.S. federal tax counsel to the Sponsor. The discussion below is based on the U.S. Internal Revenue Code of 1986, as amended, (the “Code”), Treasury Regulations promulgated under the Code and judicial and administrative interpretations of the Code, all as in effect on the date of this annual report and all of which are subject to changes either prospectively or retroactively. The tax treatment of Shareholders may vary depending upon their own particular circumstances. Certain Shareholders (including broker-dealers, traders or other investors with special circumstances) may be subject to special rules not discussed herein. In addition, the following discussion applies only to investors who hold Shares as “capital assets” within the meaning of Code section 1221. Moreover, the discussion herein does not address the effect of any state, local or foreign tax law on the disposition of Shares. Purchasers of Shares are urged to consult their own tax advisors with respect to all U.S. federal, state, local and foreign tax law considerations potentially applicable to their investment in Shares. For purposes of this discussion, a “U.S. Shareholder” is a Shareholder that is:
| • | An individual who is a U.S. citizen or resident of the United States for U.S. federal income tax purposes; |
| • | An entity treated as a corporation for U.S. federal income tax purposes that is created or organized in or under the laws of the United States or any political subdivision thereof; |
| • | An estate, the income of which is includible in gross income for U.S. federal income tax purposes regardless of its source; or |
14
| • | A trust, if (1) a court within the United States is able to exercise primary supervision over the administration of the trust and one or more U.S. persons have the authority to control all substantial decisions of the trust; or (2) the trust has a valid election in effect under applicable U.S. Treasury regulations to be treated as a U.S. person. |
A Shareholder (other than a partnership or other entity subject to tax as a partnership) that is not a U.S. Shareholder as defined above is generally considered a
“Non-U.S.
Shareholder” for purposes of this discussion. For U.S. federal income tax purposes, the treatment of any beneficial owner of an interest in a partnership, including any entity treated as a partnership for U.S. federal income tax purposes, will generally depend upon the status of the partner and upon the activities of the partnership. Partnerships and partners in partnerships should consult their tax advisors about the U.S. federal income tax consequences of purchasing, owning and disposing of Shares. Taxation of GLDM
GLDM is treated as a “grantor trust” for U.S. federal income tax purposes. There can be no assurance that the Internal Revenue Service (“IRS”) will agree with that treatment, and it is possible that the IRS or another tax authority could assert a position contrary thereto and that a court could sustain that contrary position. If GLDM were found not to be taxable as a “grantor trust,” the Sponsor would likely terminate and liquidate GLDM. The balance of this disclosure assumes that GLDM will be treated as a “grantor trust” for U.S. federal income tax purposes.
As a “grantor trust” for U.S. federal income tax purposes, neither the Trust nor GLDM itself will pay U.S. federal income tax. Instead, the income and expenses of GLDM “flow through” to the Shareholders, and the Administrator will report GLDM’s income, gains, losses and deductions to the IRS on that basis.
Taxation of U.S. Shareholders
U.S. Shareholders generally will be treated, for U.S. federal income tax purposes, as if they directly owned a pro rata share of the underlying assets held in GLDM. U.S. Shareholders also will be treated as if they directly derived their respective pro rata shares of the GLDM’s income, if any, regardless of whether they receive any distributions from GLDM. Shareholders will also be treated as if they directly incurred their respective pro rata shares of GLDM’s expenses. In the case of Shareholders that purchase Shares for cash, their initial tax basis in their pro rata share of the assets held in GLDM at the time they acquire their Shares will be equal to their cost of acquiring the Shares. In the case of a Shareholder that acquires his, her or its Shares by delivering gold bullion to GLDM, the delivery of gold bullion to GLDM in exchange for the underlying gold bullion represented by the Shares will not be a taxable event to the Shareholder, and the Shareholder’s tax basis and holding period for the Shareholder’s pro rata share of the gold bullion held in GLDM will be the same as the Shareholder’s tax basis and holding period for the gold bullion delivered in exchange therefor. For purposes of this discussion, it is assumed that all of a Shareholder’s Shares are acquired on the same date, at the same price per Share and, except where otherwise noted, that GLDM’s sole asset is gold bullion.
When GLDM sells gold bullion, for example to pay expenses, a Shareholder generally will recognize gain or loss in an amount equal to the difference between (1) the Shareholder’s pro rata share of the amount realized by GLDM upon the sale; and (2) the Shareholder’s tax basis for his, her or its pro rata share of the gold bullion that was sold, which gain or loss will generally be long-term or short-term capital gain or loss, depending upon whether the Shareholder is treated as having held his, her or its share of the gold bullion that was sold for more than one year. A Shareholder’s tax basis for his, her or its share of any gold bullion sold by GLDM generally will be determined by multiplying the Shareholder’s total tax basis for his, her or its share of all of the gold bullion held in GLDM immediately prior to the sale by a fraction, the numerator of which is the amount of gold bullion sold and the denominator of which is the total amount of the gold bullion held in GLDM immediately prior to the
15
sale. After any such sale, a Shareholder’s tax basis for his, her or its pro rata share of the gold bullion remaining in GLDM will be equal to the Shareholder’s tax basis for his, her or its share of the total amount of the gold bullion held in GLDM immediately prior to the sale, less the portion of such tax basis allocable to the Shareholder’s share of the gold bullion that was sold.
Upon a Shareholder’s sale of some or all of his, her or its Shares, the Shareholder will be treated as having sold the portion of his, her or its pro rata share of the gold bullion held in GLDM at the time of the sale that is attributable to the Shares sold. Accordingly, the Shareholder generally will recognize gain or loss on the sale in an amount equal to the difference between (1) the amount realized pursuant to the sale of the Shares, and (2) the Shareholder’s tax basis for the portion of its pro rata share of the gold bullion held in GLDM at the time of sale that is attributable to the Shares sold, as determined in the manner described in the preceding paragraph.
A redemption of some or all of a Shareholder’s Shares in exchange for the underlying gold bullion represented by the Shares redeemed generally will not be a taxable event to the Shareholder. The Shareholder’s tax basis for the gold bullion received in the redemption generally will be the same as the Shareholder’s tax basis for the portion of his, her or its pro rata share of the gold bullion held in GLDM immediately prior to the redemption that is attributable to the Shares redeemed. The Shareholder’s holding period with respect to the gold bullion received should include the period during which the Shareholder held the Shares redeemed. A subsequent sale of the gold bullion received by the Shareholder will be a taxable event for U.S. federal income tax purposes, unless a nonrecognition provision of the Code applies to such sale.
After any sale or redemption of less than all of a Shareholder’s Shares, the Shareholder’s tax basis for his, her or its pro rata share of the gold bullion held in GLDM immediately after such sale or redemption generally will be equal to the Shareholder’s tax basis for his, her or its share of the total amount of the gold bullion held in GLDM immediately prior to the sale or redemption, less the portion of such basis which is taken into account in determining the amount of gain or loss recognized by the Shareholder upon such sale or, in the case of a redemption, which is treated as the basis of the gold bullion received by the Shareholder in the redemption.
As noted above, the foregoing discussion assumes that all of a Shareholder’s Shares were acquired on the same date and at the same price per Share. If a Shareholder owns multiple lots of Shares (, Shares acquired on different dates and/or at different prices), it is uncertain whether the Shareholder may use the “specific identification” rules that apply under Treasury Regulations
i.e.
Section 1.1012-1(c)
in the case of sales of shares of stock, in determining the amount, and the long-term or short-term character, of any gain or loss recognized by the Shareholder upon GLDM’s sale of gold bullion, upon the Shareholder’s sale of any Shares, or upon the Shareholder’s sale of any gold bullion received by the Shareholder upon the redemption of any of the Shareholder’s Shares. The IRS could take the position that a Shareholder has a blended tax basis and holding period for his, her or its pro rata share of the underlying gold bullion in GLDM. Shareholders who or that hold multiple lots of Shares, or who or that are contemplating acquiring multiple lots of Shares, are urged to consult their own tax advisors as to the determination of the tax basis and holding period for the underlying gold bullion related to such Shares. Maximum 28% Long-Term Capital Gains Tax Rate for U.S. Shareholders Who are Individuals
Under current U.S. federal income tax law, gains recognized by
non-corporate
U.S. Shareholders from the sale of “collectibles,” including gold bullion, held for more than one year are taxed at a maximum rate of 28%, rather than the 20% rate applicable to most other long-term capital gains. However, if an individual U.S. Shareholder is otherwise subject to a rate lower than 28% if the gain was ordinary income due to being in a lower tax bracket, the 28% rate does not apply and the lower rate applies. For these purposes, gain recognized by a non-corporate
U.S. Shareholder upon the sale of an interest in a trust that holds collectibles is treated as gain recognized on the sale of collectibles, to the extent that the gain is attributable to unrealized appreciation in value of the collectibles held by the trust. Therefore, 16
any gain recognized by a
non-corporate
U.S. Shareholder attributable to a sale of Shares held for more than one year, or attributable to GLDM’s sale of any gold bullion which the Shareholder is treated (through his, her or its ownership of Shares) as having held for more than one year, generally will be taxed at a maximum U.S. federal income tax rate of 28%; if the Shares or gold bullion sold is held (or treated as held) for one year or less, then any such gain so recognized would be taxed for U.S. federal income tax purposes at the same rate at which ordinary income is taxed. 3.8% Tax on Net Investment Income
Certain U.S. Shareholders who are individuals are required to pay a 3.8% tax on the lesser of the excess of their modified adjusted gross income over a threshold amount ($250,000 for married persons filing jointly and $200,000 for single taxpayers) or their “net investment income,” which generally includes dividends, interest, and net gains from the disposition of investment property. This tax is in addition to any regular U.S. federal income tax due on such investment income. A similar tax will apply to certain shareholders that are estates or trusts. U.S. Shareholders are urged to consult their tax advisors regarding the effect, if any, this law may have on an investment in the Shares.
Brokerage Fees and Trust Expenses
Any brokerage or other transaction fee incurred by a Shareholder in purchasing Shares will be treated as part of the Shareholder’s tax basis in the underlying assets of GLDM. Similarly, any brokerage fee incurred by a Shareholder in selling Shares will reduce the amount realized by the Shareholder with respect to the sale.
Shareholders will be required to recognize gain or loss upon a sale of gold bullion by GLDM (as discussed above), even though some or all of the proceeds of such sale are used by the Administrator to pay GLDM’s expenses. Shareholders may deduct their respective pro rata shares of each expense incurred by GLDM to the same extent as if they directly incurred the expense. Shareholders who or that are individuals, estates or trusts, however, may be required to treat some or all of the expenses of GLDM as miscellaneous itemized deductions. Individuals may not deduct miscellaneous itemized deductions for tax years beginning after December 31, 2017 and before January 1, 2026. For tax years beginning before January 1, 2018 and after December 31, 2025, individuals may deduct certain miscellaneous itemized deductions only to the extent they exceed 2% of adjusted gross income. In addition, such deductions may be subject to phase-outs and other limitations under applicable
Investment by
Tax-Exempt
U.S. Shareholders Tax-Exempt
U.S. Shareholders are subject to United States federal income tax only on their unrelated business taxable income (“UBTI”). Unless they incur debt in order to purchase Shares, it is expected that U.S. Tax-Exempt
Shareholders should not realize UBTI in respect of income or gains from the Shares. U.S. Tax-Exempt
Shareholders are urged to consult their own independent tax advisors regarding the United States federal income tax consequences of holding Shares in light of their particular circumstances. Investment by Regulated Investment Companies
Mutual funds and other investment vehicles which are taxed as “regulated investment companies” within the meaning of section 851 of the Code are strongly urged to consult with their tax advisors concerning th likelihood that an investment in Shares will affect their qualification as a “regulated investment company.”
Investment by Certain Retirement Plans
Code Section 408(m) provides that the acquisition of a “collectible by an IRA, or a participant-directed account maintained under any plan that is
tax-qualified
under Code section 401(a), is treated as a taxable 17
distribution from the account to the owner of the IRA, or to the participant for whom the plan account is maintained, of an amount equal to the cost to the account of acquiring the collectible. The IRS has issued private letter rulings to taxpayers, including an affiliate of the Sponsor, concluding that the purchase of shares in trusts similar to GLDM by an IRA owner or plan participant will not constitute the acquisition of a collectible or be treated as resulting in a taxable distribution to the IRA owner or plan participant under Code section 408(m). However, if any of the shares so purchased are distributed from an IRA or plan account to the IRA owner or plan participant, or if any gold received by such IRA or plan account upon the redemption of any of shares purchased by it is distributed (or treated as distributed under Code section 408(m)) to the IRA owner or plan participant, the shares or gold so distributed will be subject to U.S. federal income tax in the year of distribution, to the extent provided under the applicable provisions of Code section 408(d), 408(m) or 402. Private letter rulings are only binding on the IRS with respect to the taxpayer to which they are issued. GLDM has neither requested nor obtained, nor intends to request or obtain, such a private letter ruling. Accordingly, IRA owners and plan participants are strongly urged to consult with their tax advisors before directing any such accounts to invest in the Shares. See also “ERISA and Related Considerations.”
U.S. Information Reporting and Backup Withholding for U.S. and
Non-U.S.
Shareholders The Administrator will file certain information returns with the IRS, and provide certain
tax-related
information to Shareholders, in connection with GLDM. The Administrator will make information available that will enable brokers and custodians through which investors hold Shares to prepare and, if required, file certain information returns (e.g., Form 1099) with the IRS. To the extent required by applicable regulations, each Shareholder will be provided with information regarding its allocable portion of GLDM’s annual income, expenses, gains and losses (if any). A Shareholder may be subject to U.S. backup withholding tax in certain circumstances unless the Shareholder provides his, her or its taxpayer identification number and complies with certain certification procedures.
Non-U.S.
Shareholders may have to comply with certification procedures to establish that they are not U.S. persons, and some Non-U.S.
Shareholders will be required to meet certain information reporting or certification requirements imposed by the Foreign Account Tax Compliance Act (“FATCA”), in order to avoid certain information reporting and backup withholding tax requirements. The amount of any backup withholding will be allowed as a credit against a Shareholder’s U.S. federal income tax liability and may entitle such a Shareholder to a refund, provided that the required information is furnished to the IRS.
Estate and Gift Tax Considerations for
Non-U.S.
Shareholders Under the U.S. federal tax law, individuals who are neither citizens nor residents (as determined for U.S. federal estate and gift tax purposes) of the United States are subject to estate tax on all property that has a U.S. “situs.” Shares may well be considered to have a U.S. situs for these purposes. If they are, then Shares would be includible in the U.S. federal gross estate of an individual
Non-U.S.
Shareholder. Currently, U.S. federal estate tax is imposed at rates of up to 40% of the fair market value of the taxable estate. The U.S. federal estate tax rate is subject to change in future years. In addition, the U.S. federal “generation-skipping transfer tax” may apply in certain circumstances. The estate of an individual Non-U.S.
Shareholder who is resident in a country that has an estate tax treaty with the United States may be entitled to benefit from such treaty. For individual
Non-U.S.
Shareholders, the U.S. federal gift tax generally applies only to gifts of tangible personal property or real property having a U.S. situs. Tangible personal property (including gold) has a U.S. situs if it is physically located in the United States. Although the matter is not settled, it appears that ownership of Shares should not be considered ownership of the underlying gold for this purpose, even to the extent that gold was held in custody in the United States. Instead, Shares should be considered 18
intangible property, and therefore they should not be subject to U.S. federal gift tax if transferred during the holder’s lifetime. Individual
Non-U.S.
Shareholders are urged to consult their tax advisors regarding the possible application of U.S. federal estate, gift and generation-skipping transfer taxes in their particular circumstances. Taxation in Jurisdictions Other than the United States
Purchasers of Shares that are based in or acting out of a jurisdiction other than the United States are advised to consult his, her or its tax advisor as to the tax consequences under the laws of such jurisdiction (or any other jurisdiction not being the United States to which they are subject), of their purchase, holding, sale and redemption of or any other dealing in Shares and, in particular, as to whether any value added tax, other consumption tax or transfer tax is payable in relation to such purchase, holding, sale, redemption or other dealing.
ERISA AND RELATED CONSIDERATIONS
The Employee Retirement Income Security Act of 1974, as amended (“ERISA”), and Code section 4975 impose certain requirements on employee benefit plans and certain other plans and arrangements that are subject to ERISA or the Code section 4975, including IRAs and annuities, retirement plans for self-employed individuals
(so-called
“Keogh plans”), and certain collective investment funds and insurance company general or separate accounts in which such plans or arrangements are invested (collectively, the “Plans”), and on persons who are fiduciaries with respect to the investment of assets treated as “plan assets” of a Plan. Non-U.S.
plans, government plans and some church plans are not subject to the fiduciary responsibility provisions of ERISA or the provisions of Code section 4975, but may be subject to substantially similar rules under state, federal or other law (“Similar Law”). In contemplating an investment of a portion of Plan assets in Shares, the Plan fiduciary responsible for making such investment should carefully consider, taking into account the facts and circumstances of the Plan, the “Risk Factors” discussed below and whether such investment is consistent with its fiduciary responsibilities, including, but not limited to (1) whether the fiduciary has the authority to make the investment under the appropriate governing plan instrument; (2) whether the investment would constitute a direct or indirect
non-exempt
“prohibited transaction” with a “party in interest” or “disqualified person,” as described in ERISA section 406 or Code section 4975, as applicable; (3) the Plan’s funding objectives; and (4) whether under the general fiduciary standards of investment prudence and diversification such investment is appropriate for the Plan, taking into account the overall investment policy of the Plan, the composition of the Plan’s investment portfolio, and the Plan’s need for sufficient liquidity to pay benefits when due.” Item 1A.
Risk Factors
You should consider carefully the risks described below before making an investment decision. You should also refer to the other information included in this report, including the Trust’s and GLDM’s financial statements and the related notes.
RISKS RELATED TO GOLD
The sale of GLDM’s gold bullion to pay expenses at a time of low gold prices could adversely affect the value of the Shares.
The Sponsor will sell gold bullion held by GLDM to pay GLDM expenses on an then-current gold prices. GLDM is not actively managed and no attempt will be made to buy or sell gold bullion to protect against or to take advantage of fluctuations in the price of gold. Consequently, GLDM’s gold bullion may be sold at a time when the gold price is low, resulting in a negative effect on the value of the Shares.
as-needed
basis irrespective of19
An adverse development may lead to a decrease in gold bullion trading prices.
An adverse development with respect to one or more factors such as global gold supply and demand, investors’ inflation expectations, exchange rate volatility and interest rate volatility may lead to a decrease in gold bullion trading prices. A decline in prices of gold would have a negative impact on the GLDM’s NAV and the Shares.
Substantial sales of gold by the official sector could adversely affect an investment in the Shares.
The official sector consists of central banks, other governmental agencies and multi-lateral institutions that buy, sell and hold gold as part of their reserve assets. The official sector holds a significant amount of gold, most of which is static, meaning that it is held in vaults and is not bought, sold, leased or swapped or otherwise mobilized in the open market. In the event that future economic, political or social conditions or pressures require members of the official sector to liquidate their gold assets all at once or in an uncoordinated manner, the demand for gold might not be sufficient to accommodate the sudden increase in the supply of gold to the market. Consequently, the price of gold could decline significantly, which would adversely affect an investment in the Shares.
Crises may motivate large-scale sales of gold, which could decrease the price of gold and adversely affect an investment in the Shares.
The possibility of large-scale distress sales of gold in times of crisis may have a negative impact on the price of gold and adversely affect an investment in the Shares. For example, the 2008 financial crisis resulted in significantly depressed prices of gold largely due to forced sales and deleveraging by institutional investors such as hedge funds and pension funds. Crises in the future may impair gold’s price performance, which would, in turn, adversely affect an investment in the Shares.
Purchasing activity in the gold market associated with the delivery of gold bullion to GLDM in exchange for Creation Units may cause a temporary increase in the price of gold, which may adversely affect an investment in the Shares.
Purchasing activity associated with acquiring the gold bullion required for deposit into GLDM in connection with the creation of Creation Units may temporarily increase the market price of gold, which would likely result in higher prices for the Shares. Temporary increases in the market price of gold may also occur as a result of the purchasing activity of other market participants. Other market participants may attempt to benefit from an increase in the market price of gold that may result from increased purchasing activity of gold connected with the issuance of Creation Units. Consequently, the market price of gold may decline immediately after Creation Units are created. If the price of gold declines, it will have a negative impact on the value of the Shares.
The price of gold may be affected by the sale of gold by exchange-traded funds (“ETFs”) or other exchange-traded vehicles tracking gold markets.
To the extent existing ETFs or other exchange-traded vehicles tracking gold markets represent a significant proportion of demand for physical gold bullion, large redemptions of the securities of these ETFs or other exchange traded vehicles could negatively affect physical gold bullion prices and the price and NAV of the Shares.
The value of the gold bullion held by GLDM is determined using the LBMA Gold Price PM. Potential discrepancies in the calculation of the LBMA Gold Price, as well as any future changes to the LBMA Gold Price, could offset the value of the gold bullion held by GLDM and could have an adverse effect on the methodology used to calculate the investment in the Shares.
The LBMA Gold Price is determined twice each Business Day (10:30 a.m. and 3:00 p.m. London time) by the participants in a physically settled, electronic and tradable auction administered by the IBA. The IBA oversees a bidding process that determines the price of gold by matching buy and sell orders submitted by the participants for the applicable auction time. GLDM’s NAV is determined each day that
20
the NYSE Arca is open for regular trading, based on the price of gold per ounce applied against the number of ounces of gold owned by GLDM. In determining the NAV, the Administrator generally will value the gold bullion held by GLDM using the LBMA Gold Price PM.
In the event that the LBMA Gold Price does not prove to be an accurate benchmark and the LBMA Gold Price varies materially from the price determined by other mechanisms, the NAV of GLDM and the value of an investment in the Shares could be adversely affected. Any future developments in the benchmark, to the extent they have a material impact on the LBMA Gold Price, could adversely affect the NAV of GLDM and the value of an investment in the Shares.
Further, the calculation of the LBMA Gold Price is not an exact process. Rather, it is based upon a procedure of matching orders from participants in the auction process and their customers to sell gold with orders from participants in the auction process and their customers to buy gold at particular prices. The LBMA Gold Price does not therefore purport to reflect each buyer or seller of gold in the market, nor does it purport to set a definitive price for gold at which all orders for sale or purchase will take place on that particular day or time. All orders placed into the auction process by the participants will be executed on the basis of the price determined pursuant to the LBMA Gold Price auction process (provided that orders may be cancelled, increased or decreased while the auction is in progress). It is possible that electronic failures or other unanticipated events may occur that could result in delays in the announcement of, or the inability of the system to produce, an LBMA Gold Price on any given date.
If concerns about the integrity or reliability of the LBMA Gold Price arise, even if eventually shown to be without merit, such concerns could adversely affect investor interest in gold and therefore adversely affect the price of gold and the value of an investment in the Shares. Because the NAV of GLDM is determined using the LBMA Gold Price, discrepancies in or manipulation of the calculation of the LBMA Gold Price could have an adverse impact on the value of an investment in the Shares. Furthermore, any concern about the integrity or reliability of the pricing mechanism could disrupt trading in gold and products using the LBMA Gold Price, such as the Shares. In addition, these concerns could potentially lead to both changes in the manner in which the LBMA Gold Price is calculated and/or the discontinuance of the LBMA Gold Price altogether. Each of these factors could lead to less liquidity or greater price volatility for gold and products using the LBMA Gold Price, such as the Shares, or otherwise could have an adverse impact on the trading price of the Shares.
Because GLDM invests only in gold, an investment in GLDM may be more volatile than an investment in a more broadly diversified portfolio.
GLDM invests only in gold. As a result, GLDM’s holdings are not diversified. Accordingly, the GLDM’s NAV may be more volatile than another investment vehicle with a more broadly diversified portfolio and may fluctuate substantially over short or long periods of time. The price of gold can be volatile because gold is comparatively less liquid than other commodities. Fluctuations in the price of gold are expected to have a direct impact on the value of the Shares.
An investment in GLDM may be deemed speculative and is not intended as a complete investment program. An investment in the Shares should be considered only by persons financially able to maintain their investment and who can bear the risk of loss associated with an investment in GLDM. Investors should review closely the objective and strategy and redemption provisions of GLDM, as discussed herein, and familiarize themselves with the risks associated with an investment in GLDM.
RISKS RELATED TO THE CUSTODY OF GOLD
GLDM relies on the Custodian for the safekeeping of its gold bullion. Failure by the Custodian to exercise due care in the safekeeping of GLDM’s gold bullion could result in a loss to GLDM.
GLDM relies on the Custodian for the safekeeping of essentially all of its gold bullion. The Administrator is not liable for the acts or omissions of the Custodian. The Administrator has no obligation to monitor the activities of the Custodian other than to receive and review reports prepared
21
by the Custodian pursuant to the Custody Agreements. In addition, the ability to monitor the performance of the Custodian may be limited because under the Custody Agreements, the Trust and the Sponsor and any accountants or other inspectors selected by the Sponsor have only limited rights to visit the premises of the Custodian for the purpose of examining the GLDM’s gold bullion and certain related records maintained by the Custodian. As a result of the above, any failure by the Custodian to exercise due care in the safekeeping of GLDM’s gold bullion may not be detectable or controllable by the Administrator and could result in a loss to GLDM.
Failure by a subcustodian to exercise due care in the safekeeping of GLDM’s gold bullion bars could result in a loss to GLDM.
Under the Allocated Bullion Account Agreement, the Custodian agreed that it will hold all of GLDM’s gold bullion bars in its own vault premises except when the gold bullion bars have been allocated in a vault other than the Custodian’s vault premises, and in such cases the Custodian agreed that it will use commercially reasonable efforts promptly to transport the gold bullion bars to the Custodian’s vault, at the Custodian’s cost and risk. Nevertheless, there will be periods of time when some portion of GLDM’s gold bullion bars will be held by one or more subcustodians appointed by the Custodian.
The Custodian is required under the Allocated Bullion Account Agreement to use reasonable care in appointing their subcustodians and will monitor the conduct of each of their subcustodians, and promptly advise the Trust of any difficulties or problems existing with respect to such subcustodian. However, the gold bullion held by a subcustodian is held in the name of the Custodian, and not in the name of GLDM, and the account with each subcustodian is only subject to the Custodian’s instructions. In the event a subcustodian fails to exercise due care in the safekeeping of GLDM’s gold bullion, there could be a resulting loss, and GLDM may have limited or no ability to pursue any action against the subcustodian. See “Description of the GLDM Custody Agreements” for more information about subcustodians that may hold GLDM’s gold bullion.
The ability of the Administrator and the Custodian to take legal action against subcustodians may be limited, which increases the possibility that GLDM may suffer a loss if a subcustodian does not use due care in the safekeeping of GLDM’s gold bullion bars.
If any subcustodian that holds gold bullion on a temporary basis does not exercise due care in the safekeeping of GLDM’s gold bullion bars, the ability of the Trust or the Custodian to recover damages against such subcustodian may be limited to only such recourse, if any, as may be available under applicable English law or, if the subcustodian is not located in England, under other applicable law. This is because there are expected to be no written contractual arrangements between subcustodians who may hold GLDM’s gold bullion bars and the Trust or the Custodian, as the case may be. If the Trust’s or the Custodian’s recourse against the subcustodian is so limited, GLDM may not be adequately compensated for the loss. For more information on the Trust’s and the Custodian’ ability to seek recovery against subcustodians and the subcustodian’s duty to safekeep GLDM’s gold bullion bars, see “Description of the GLDM Custody Agreements.”
Gold bullion held in GLDM’s unallocated gold bullion account and any Authorized Participant’s unallocated gold bullion account is not segregated from the Custodian’s assets. If the Custodian becomes insolvent, its assets may not be adequate to satisfy a claim by GLDM or any Authorized Participant. In addition, in the event of the Custodian’s insolvency, there may be a delay and costs incurred in identifying the gold bullion bars held in GLDM’s allocated gold bullion account.
Gold bullion that is part of a deposit for a purchase order or part of a redemption distribution, or which is transferred into or out of GLDM pursuant to the Gold Delivery Agreement, is held for a time in the Unallocated Account and in the case of creations and redemptions, previously or subsequently, in the Authorized Participant Unallocated Account of the purchasing or redeeming Authorized Participant. During those times, GLDM and the Authorized Participant, as the case may be, will have no proprietary rights to any specific bars of gold bullion held by the Custodian and will each be an unsecured creditor of
22
the Custodian with respect to the amount of gold bullion held in such unallocated accounts. In addition, if the Custodian fails to allocate GLDM’s gold bullion in a timely manner, in the proper amounts or otherwise in accordance with the terms of the Unallocated Bullion Account Agreement, or if a subcustodian fails to so segregate gold bullion held by it on behalf of GLDM, unallocated gold bullion will not be segregated from the Custodian’s assets, and GLDM will be an unsecured creditor of the Custodian with respect to the amount so held in the event of the insolvency of the Custodian. In the event the Custodian becomes insolvent, the Custodian’s assets might not be adequate to satisfy a claim by GLDM or the Authorized Participant for the amount of gold bullion held in their respective unallocated gold bullion accounts.
In the event of the insolvency of the Custodian, a liquidator may seek to freeze access to the gold bullion held in all of the accounts held by the Custodian, including the Allocated Account. Although GLDM would retain legal title to the allocated gold bullion bars, it could incur expenses in connection with obtaining control of the allocated gold bullion bars, and the assertion of a claim by such liquidator for unpaid fees due to the Custodian could delay creations and redemptions of Creation Units.
The lack of diversification of vault premises for the physical gold bullion held by the Custodian could result in significant losses to GLDM if the gold bullion held at such premises is lost, damaged, stolen or inaccessible.
Unless otherwise agreed between GLDM and the Custodian, custody of the gold bullion deposited with and held for the account of GLDM is provided by the Custodian at its London, England vaults or, when gold bullion has been allocated in a vault other than the Custodian’s London vault premises, by or for any subcustodian employed by the Custodian for the temporary custody and safekeeping of gold bullion until it can be transported to the Custodian’s London vault premises. The lack of diversification of vault premises could result in significant losses to GLDM if its gold bullion bars held by the Custodian or any subcustodian on behalf of GLDM at any single location are lost, damaged, or stolen. The lack of diversification of vault premises could also result in significant losses if the gold bullion held at a single location becomes inaccessible for a substantial period of time due to natural events (such as an earthquake) or human actions (such as a terrorist attack).
The Custodian is authorized to appoint from time to time one or more subcustodians to hold GLDM’s gold bullion until it can be transported to the Custodian’s vaults.
The gold bullion custody operations of the Custodian are not subject to specific governmental regulatory supervision.
The Custodian is responsible for the safekeeping of GLDM’s gold bullion and also facilitates the transfer of gold bullion into and out of GLDM. Although the Custodian is a market maker, clearer and approved weigher under the rules of the LBMA (which sets out good practices for participants in the bullion market), the LBMA is not an official or governmental regulatory body. Furthermore, although the Custodian is generally regulated in the UK by the Prudential Regulatory Authority and the FCA, such regulations do not directly cover the Custodian’s gold bullion custody operations in the UK. Accordingly, GLDM is dependent on the Custodian to comply with the best practices of the LBMA and to implement satisfactory internal controls for their gold bullion custody operations to keep GLDM’s gold bullion secure.
RISKS RELATED TO TAXES
If a U.S. investor who or that is an individual, estate or trust (each referred to in this paragraph and the next paragraph as an “individual”) sells or exchanges the Shares held for more than a year, any gain recognized on the sale or exchange generally will be subject to federal income tax at a maximum rate of 28% rather than the lower maximum rates applicable to most other long-term capital gains an individual recognizes.
Gains recognized by an individual from the sale of “collectibles,” which term includes gold held for more than one year, are subject to federal income tax at a maximum rate of 28% rather than the lower
23
maximum rates applicable to most other long-term capital gains individuals recognize (currently a maximum of 20% for individuals). For these purposes, a gain that an individual recognizes on the sale of an interest in a “grantor trust” that holds collectibles (such as the Trust) is treated as a gain recognized on the sale of the collectibles, to the extent the gain is attributable to unrealized appreciation in value of the collectibles. Therefore, any gain recognized by an individual U.S. investor attributable to a sale or exchange of shares held for more than one year, or attributable to the sale of any gold that the investor is treated (through its ownership of shares) as having held for more than one year, generally will be subject to federal income tax at a maximum rate of 28%. The tax rates for capital gains recognized on the sale of assets held by an individual U.S. investor for one year or less, or by a taxpayer other than an individual, are generally the same as those at which ordinary income is taxed.
U.S. shareholders will be required to recognize a gain or loss upon a sale of gold by GLDM, even though some or all of the proceeds of such sale are used by the Sponsor to pay expenses. U.S. shareholders may deduct their respective pro rata shares of each expense incurred by GLDM to the same extent as if they directly incurred such an expense. U.S. shareholders who are individuals, estates or trusts, however, may be required to treat some or all of the expenses of GLDM as miscellaneous itemized deductions. An individual may not deduct miscellaneous itemized deductions for tax years beginning after December 31, 2017 and before January 1, 2026. For tax years beginning before January 1, 2018 and after December 31, 2025, individuals may deduct certain miscellaneous itemized deductions only to the extent they exceed 2% of adjusted gross income. In addition, such deductions may be subject to phase-outs and other limitations under applicable provisions of the Internal Revenue Code and regulations thereunder and, if the U.S. shareholder is an individual subject to the alternative minimum tax, may not be deductible at all.
GENERAL RISKS
GLDM is exposed to various operational risks.
GLDM is exposed to various operational risks, including human error, information technology failures and failure to comply with formal procedures intended to mitigate these risks, and is particularly dependent on electronic means of communicating, record-keeping and otherwise conducting business. In addition, GLDM generally exculpates, and in some cases indemnifies, counterparties with respect to losses arising from unforeseen circumstances and events, which may include the interruption, suspension or restriction of trading on or the closure of NYSE Arca, power or other mechanical or technological failures or interruptions, computer viruses, communications disruptions, work stoppages, natural disasters, fire, war, terrorism, riots, rebellions or other circumstances beyond its or its counterparties’ control. Accordingly, GLDM generally bears the risk of loss with respect to these unforeseen circumstances and events to the extent relating to GLDM or the Shares.
Although it is expected that the GLDM’s direct counterparties will generally have disaster recovery or similar programs or safeguards in place to mitigate the effect of such unforeseen circumstances and events, these safeguards may not be in place for all parties whose activities may affect the performance of GLDM, and these safeguards, even if implemented, may not be successful in preventing losses associated with such unforeseen circumstances and events. Moreover, the systems and applications on which GLDM relies may not continue to operate as intended. In addition to potentially causing performance failures at, or direct losses to, GLDM, any such unforeseen circumstances and events or operational failures may further distract the counterparties or personnel on which GLDM relies, reducing their ability to conduct the activities on which GLDM is dependent. These risks cannot be fully mitigated or prevented, and further efforts or expenditures to do so may not be cost-effective, whether due to reduced benefits from implementing additional or redundant safeguards or due to increases in associated maintenance requirements and other expenses that may make it more costly for GLDM to operate in more typical circumstances.
24
GLDM as well as the Sponsor and its service providers are vulnerable to the effects of geopolitical events and the continuation of the war in Ukraine or other hostilities.
Geopolitical events and the continuation of the hostilities in Ukraine or other hostilities could disrupt and potentially impact the business activities of the Sponsor and its service providers and have an adverse effect on GLDM.
In late February 2022, Russia launched an invasion of Ukraine, significantly amplifying already existing geopolitical tensions among Russia and other countries in the region and in the west. On March 7, 2022, the LBMA suspended its accreditation of six Russian precious metals refiners. The LBMA stated that existing bars produced by the refiners before their suspension will still be accepted as good delivery. Following an announcement at the G7 Summit to collectively ban the import of Russian gold, the UK passed regulations which prohibit the direct or indirect (i) import of gold that originated in Russia, (ii) acquisition of gold that originated in Russia or is located in Russia and (iii) supply or delivery of gold that originated in Russia, all after July 21, 2022. Similarly, US regulations prohibit the import of gold of Russian origin into the United States on or after June 28, 2022 and EU regulations prohibit the direct or indirect import, purchase or transfer of gold if it originates in Russia and has been exported from Russia after July 22, 2022.
The responses of countries and political bodies to Russia’s actions, the larger overarching tensions, and Ukraine’s military response and the potential for wider conflict may increase financial market volatility generally, have adverse effects on regional and global economic markets, and cause volatility in the price of gold and the price of the Shares. In addition, the conflict in Ukraine, along with global political fallout and implications including sanctions, shipping disruptions, collateral war damage, and a potential expansion of the conflict beyond Ukraine’s borders, could disturb the gold market.
GLDM as well as the Sponsor and its service providers are vulnerable to the effects of public health crises, including the ongoing novel coronavirus pandemic (the
“COVID-19
pandemic”). Pandemics and other public health crises may cause a curtailment of business activities which may potentially impact the ability of the Sponsor and its service providers to operate. The
COVID-19
pandemic or a similar public health threat could adversely impact GLDM by causing operating delays and disruptions, market disruption and shutdowns (including as a result of government regulation and prevention measures). The COVID-19
pandemic has had and will likely continue to have serious negative effects on social, economic and financial systems, including significant uncertainty and volatility in the financial markets. To date, the impact of COVID-19
has not materially affected the operations of GLDM. The service providers engaged by GLDM may not carry adequate insurance to cover claims against them by GLDM, which could adversely affect the value of net assets of GLDM.
The Administrator, the Custodian, and other service providers engaged by GLDM maintain such insurance as they deem adequate with respect to their respective businesses. Shareholders cannot be assured that any of the aforementioned parties will maintain any insurance with respect to the GLDM’s assets held or the services that such parties provide to GLDM and, if they maintain insurance, that such insurance is sufficient to satisfy any losses incurred by them in respect of their relationship with GLDM. Accordingly, the GLDM will have to rely on the efforts of the service provider to recover from their insurer compensation for any losses incurred by GLDM in connection with such arrangements.
GLDM’s obligation to indemnify certain of its service providers could adversely affect an investment in the Shares.
GLDM has agreed to indemnify certain of its service providers, including the Custodian, the Sponsor and the Trustee, for certain liabilities incurred by such parties in connection with their respective agreements to provide services for GLDM. In the event GLDM is required to indemnify any of its service providers, it may be required to sell gold bullion to cover such expenses and the NAV would be reduced accordingly, thus adversely affecting an investment in the Shares.
25
Potential conflicts of interest may arise among the Sponsor or its affiliates and GLDM.
The Sponsor manages the business and affairs of GLDM. Conflicts of interest may arise among the Sponsor and its affiliates, on the one hand, and GLDM and its shareholders, on the other hand. As a result of these conflicts, the Sponsor may favor its own interests and the interests of its affiliates over GLDM and its shareholders. These potential conflicts include, among others:
| • | The Trust, on behalf of GLDM, has agreed to indemnify the Sponsor and its affiliates pursuant to the terms of the Declaration of Trust. |
| • | The Sponsor, its affiliates and their officers and employees are not prohibited from engaging in other businesses or activities, including those that might be in direct competition with GLDM. |
RISKS RELATED TO THE SHARES
GLDM is a passive investment vehicle and is not actively managed.
GLDM does not manage its portfolios to sell gold bullion at times when its price is high or acquire gold bullion at low prices in the expectation of future price increases. Also, GLDM does not use any of the hedging techniques available to professional gold investors to attempt to reduce the risks of losses resulting from gold price decreases. Any losses sustained by GLDM will adversely affect the value of the Shares.
The costs inherent in buying or selling Shares may detract significantly from investment results.
Buying or selling Shares on an exchange involves two types of costs that apply to all securities transactions effectuated on an exchange. When buying or selling Shares through a broker or other intermediary, you will likely incur a brokerage commission or other charges imposed by that broker or intermediary. In addition, you may incur the cost of the “spread,” that is, the difference between what investors are willing to pay for Shares (the “bid” price) and the price at which they are willing to sell Shares (the “ask” price). Because of the costs inherent in buying or selling Shares, frequent trading may detract significantly from investment results and an investment in Shares may not be advisable for investors who anticipate regularly making small investments.
The lack of an active trading market or a halt in trading of the Shares may result in losses on investment at the time of disposition of the Shares.
Although the Shares are listed for trading on NYSE Arca, we cannot guarantee that an active trading market for the Shares will be maintained. If an investor needs to sell Shares at a time when no active market for the Shares exists, or there is a halt in trading of securities generally or of the Shares, this will most likely adversely affect the price the investor receives for the Shares (assuming the investor is able to sell them).
The Shares may trade at a price that is at, above or below the NAV per Share and any discount or premium in the trading price relative to the NAV per Share may widen as a result of
non-concurrent
trading hours between the COMEX and NYSE Arca. The Shares may trade at, above or below the NAV per Share. The NAV per Share fluctuates with changes in the market value of the GLDM’s assets. The trading price of the Shares fluctuates in accordance with changes in the NAV per Share as well as market supply and demand. The amount of the discount or premium in the trading price relative to the NAV per Share may be influenced by
non-concurrent
trading hours between the COMEX and NYSE Arca. While the Shares trade on NYSE Arca until 4:00 p.m. New York time, liquidity in the global gold market may be reduced after the close of the COMEX at 1:30 p.m. New York time. As a result, after 1:30 p.m. New York time, trading spreads, and the resulting premium or discount, on the Shares may widen. However, because shares can be created and redeemed in Creation Units at NAV (unlike shares of many
closed-end
funds, which frequently trade at appreciable discounts from, and sometimes at premiums to, 26
their NAVs), the Sponsor believes that large discounts or premiums to the NAV of GLDM are not likely to be sustained over the long term. While the creation/redemption feature is designed to make it more likely that the Shares normally will trade on stock exchanges at prices close to the GLDM’s next calculated NAV, exchange prices are not expected to correlate exactly with the GLDM’s NAV due to timing reasons, supply and demand imbalances and other factors. In addition, disruptions to creations and redemptions, including disruptions at market makers or Authorized Participants, or to market participants or during periods of significant market volatility, may result in trading prices for the Shares that differ significantly from GLDM’s NAV.
If the process of creation and redemption of Creation Units encounters any unanticipated difficulties, the possibility for arbitrage transactions intended to keep the price of the Shares closely linked to the price of gold may not exist and, as a result, the price of the Shares may fall.
If the process for the creation and redemption of shares by Authorized Participants (which depends on, among other things, timely transfers of gold bullion to and by the Custodian) encounter any unanticipated difficulties, potential market participants who would otherwise be willing to purchase or redeem Creation Units to take advantage of arbitrage opportunities may not do so. If this is the case, the liquidity of the Shares may decline and the price of the Shares may fluctuate independently of the price of gold and may fall.
The value of the Shares could decline if unanticipated operational or trading problems arise.
There may be unanticipated problems or issues with respect to the mechanics of the GLDM’s operations and the trading of the Shares that could have a material adverse effect on an investment in the Shares. In addition, to the extent that unanticipated operational or trading problems or issues arise, the Sponsor’s past experience and qualifications may not be suitable for solving these problems or issues.
The amount of gold represented by the Shares will continue to be reduced during the life of GLDM due to the sales of gold bullion necessary to pay expenses irrespective of whether the trading price of the Shares rises or falls in response to changes in the price of gold.
Each outstanding Share represents a fractional, undivided interest in the gold bullion held by GLDM. GLDM does not generate any income and regularly sells gold bullion to pay for its ongoing expenses. Therefore, the amount of gold bullion represented by each Share will gradually decline over time. This is also true with respect to Shares that are issued in exchange for additional deposits of gold bullion into GLDM, as the amount of gold bullion required to create Shares proportionately reflects the amount of gold bullion represented by the Shares outstanding at the time of creation. Assuming a constant gold price, the trading price of the Shares is expected to gradually decline relative to the price of gold as the amount of gold bullion represented by the Shares gradually declines.
Investors should be aware that the gradual decline in the amount of gold bullion represented by the Shares will occur regardless of whether the trading price of the Shares rises or falls in response to changes in the price of gold. GLDM may be subject to certain liabilities (for example, as a result of litigation) that have not been assumed by the Sponsor. GLDM will sell gold bullion to pay those expenses, unless the Sponsor agrees to pay such expenses out of its own pocket.
An investment in the Shares may be adversely affected by competition from other methods of investing in gold.
GLDM competes with other financial vehicles, including traditional debt and equity securities issued by companies in the gold industry and other securities backed by or linked to gold, direct investments in gold and investment vehicles similar to GLDM. Market and financial conditions, and other conditions beyond the Sponsor’s control, may make it more attractive to invest in other financial vehicles or to invest in gold directly, which could limit the market for the Shares and reduce the liquidity of the Shares.
GLDM may be required to terminate and liquidate at a time that is disadvantageous to shareholders.
If GLDM is required to terminate and liquidate, such termination and liquidation could occur at a time that is disadvantageous to shareholders, such as when gold prices are lower than the gold prices at the
27
time when shareholders purchased their Shares. In such a case, when GLDM’s gold bullion is sold as part of the liquidation, the resulting proceeds distributed to shareholders will be fewer than if gold prices were higher at the time of sale.
Redemption orders may be subject to rejection, suspension or postponement.
GLDM has the right, but not the obligation, to reject any Redemption Order if (i) the order is not in proper form as described in the Participant Agreement, (ii) the fulfillment of the order, in the opinion of its counsel, might be unlawful, (iii) it determines that acceptance of the order from an Authorized Participant would expose it to credit risk, or (iv) circumstances outside the control of the Administrator, the Sponsor or the Custodian make the redemption, for all practical purposes, not feasible to process.
GLDM may, in its discretion, and will, when directed by the Sponsor, suspend the right of redemption, or postpone the redemption settlement date for: (1) any period during which NYSE Arca is closed other than customary weekend or holiday closings, or trading on NYSE Arca is suspended or restricted, (2) any period during which an emergency exists as a result of which delivery, disposal or evaluation of gold bullion is not reasonably practicable, or (3) such other period as the Sponsor determines to be necessary for the protection of the shareholders.
The Sponsor will not be liable to any person or liable in any way for any loss or damages that may result from any such rejection, suspension or postponement.
Loss of intellectual property rights related to GLDM, or competing claims over ownership of those rights, could adversely affect GLDM and an investment in the Shares.
While the Sponsor believes that all intellectual property rights needed to operate GLDM are owned by or licensed to the Sponsor or an affiliate or have been obtained, third parties may allege or assert ownership of intellectual property rights that may be related to the design, structure and operations of GLDM. To the extent any claims of such ownership are brought, or any proceedings are instituted to assert such claims, the negotiation, litigation or settlement of such claims, or the ultimate disposition of such claims in a court of law if a suit is brought, may adversely affect GLDM and an investment in the Shares, for example, resulting in expenses or damages or the termination of GLDM.
The liquidity of the Shares may be affected by the withdrawal of Authorized Participants and substantial redemptions by Authorized Participants.
In the event that one or more Authorized Participants that has substantial interests in the Shares withdraws from participation, the liquidity of the Shares will likely decrease, which could adversely affect the market price of the Shares. The liquidity of the Shares also may be affected by substantial redemptions by Authorized Participants related to or independent of the withdrawal from participation of Authorized Participants. If there are substantial redemptions of Shares or one or more Authorized Participants with a substantial interest in the Shares withdraws from participation, the liquidity of the Shares will likely decrease, which could adversely affect the market price of the Shares and result in your incurring a loss on your investment.
Shareholders do not have the rights enjoyed by investors in certain other vehicles.
As interests in an investment trust, the Shares have none of the statutory rights normally associated with the ownership of shares of a corporation (including, for example, the right to bring “oppression” or “derivative” actions). In addition, the Shares have limited voting and distribution rights (for example, Shareholders do not have the right to elect directors and will not receive dividends).
Shareholders do not have the protections associated with ownership of shares in an investment company registered under the Investment Company Act of 1940, as amended, or the protections afforded by the Commodity Exchange Act.
The Trust is not registered as an investment company under the Investment Company Act of 1940, as amended, and is not required to register under such act. Consequently, shareholders do not have the regulatory protections provided to investors in registered investment companies.
28
Furthermore, GLDM is not a commodity pool for purposes of the Commodity Exchange Act (the “CEA”), and none of the Sponsor, the Trustee, or the Marketing Agent is subject to regulation by the U.S. Commodity Futures Trading Commission as a commodity pool operator in connection with the Shares or a commodity trading advisor in connection with the Shares. Consequently, holders of the Shares do not have the regulatory protections provided to investors in
CEA-regulated
instruments or commodity pools. Item 1B.
Unresolved Staff Comments
Not applicable.
Item 2.
Properties
Not applicable.
Item 3.
Legal Proceedings
Not applicable.
Item 4.
Mine Safety Disclosures
Not applicable.
29
PART II
Item 5. |
Market for Registrant ’ s Common Equity, Related Stockholder Matters and Issuer Purchases of Equity Securities |
MARKET INFORMATION
SPDR® Gold MiniShares® Trust’s Shares are listed on the NYSE Arca under the symbol “GLDM” and have been listed since June 26, 2018.
HOLDERS OF RECORD
As of October 31, 2022, there were approximately 111 DTC participating shareholders of record of GLDM. Because most of the Shares are held by brokers and other institutions on behalf of shareholders, we are unable to estimate the total number of shareholders represented by these record holders.
ISSUER PURCHASE OF SHARES
Although GLDM does not purchase Shares directly from its shareholders, in connection with its redemption of Creation Units, GLDM redeemed 43,200,000 Shares (432 Creation Units) during the year ended September 30, 2022, including 16,000,000 Shares (160 Creation Units) for the three months ended September 30, 2022 as set forth in the table below.
| Period |
Total number of Shares redeemed |
Average ounces of gold per Share |
||||||
| 7/1/22 to 7/31/22 |
2,300,000 | .01986 | ||||||
| 8/1/22 to 8/31/22 |
4,100,000 | .01986 | ||||||
| 9/1/22 to 9/30/22 |
9,600,000 | .01986 | ||||||
| |
|
|
|
|||||
| TOTAL |
16,000,000 | .01986 | ||||||
Item 6.
[Reserved]
Item 7.
Management
’
s Discussion and Analysis of Financial Condition and Results of Operations
Trust Overview
The World Gold Trust (the “Trust”) was formed as a Delaware statutory trust on August 27, 2014. The Trust consists of multiple series (each, a “Fund” and collectively, the “Funds”). Each Fund issues common units of beneficial interest that represent units of fractional undivided beneficial interest in and ownership of such Fund. The term of the Trust and each Fund is perpetual (unless terminated earlier in certain circumstances). The Trust was organized in separate series as a Delaware statutory trust rather than as separate statutory trusts to achieve certain administrative and other efficiencies. The Trust is sponsored by WGC USA Asset Management Company, LLC (the “Sponsor”).
The Trust established six separate series, of which only SPDR® Gold MiniShares® Trust (“GLDM”) is operational as of September 30, 2022. GLDM commenced operations on June 26, 2018. GLDM’s investment objective is for its shares (the “Shares”) to reflect the performance of the price of gold, less its expenses.
30
Investing in the Shares does not insulate the investor from risks, including price volatility. The following chart illustrates the movement in the market price of the Shares and NAV of the Shares against the corresponding gold price (per 1/100 of an oz. of gold) since the day the Shares first began trading on the NYSE Arca:
Share price & NAV v. gold price—June 26, 2018 to September 30, 2022

Critical Accounting Policy
Valuation of Gold, Definition of Net Asset Value
GLDM values the investment in gold bullion at fair value. BNY Mellon Asset Servicing, a division of The Bank of New York Mellon (the “Administrator”), will value any gold bullion held by GLDM on the basis of the price of an ounce of gold as determined by the IBA. In determining the NAV, the Administrator will value the gold bullion held by GLDM on the basis of the LBMA Gold Price PM. The Administrator will calculate the NAV on each day the NYSE Arca is open for regular trading, at the earlier LBMA Gold Price PM for the day or 12:00 PM New York time. If no LBMA Gold Price (AM or PM) is made on a particular evaluation day or if the LBMA Gold Price PM has not been announced by 12:00 PM New York time on a particular evaluation day, the next most recent LBMA Gold Price AM or PM will be used in the determination of the NAV, unless the Sponsor determines that such price is inappropriate to use as the basis for such determination. Gold held by GLDM is reported at fair value on the Statement of Financial Condition.
Once the value of the gold has been determined, the Administrator subtracts all estimated accrued expenses and other liabilities of GLDM from the total value of the gold and all other assets of GLDM. The resulting figure is the NAV. The NAV is used to compute the Sponsor’s fee. The Administrator determines the NAV per Share by dividing the NAV of GLDM by the number of Shares outstanding as of the close of trading on NYSE Arca.
Inspectorate conducts two counts each year of the gold bullion held on behalf of the Trust at the vaults of the Custodian. A complete bar count is conducted once per year and coincides with the Trust’s financial year end at September 30
th
. On October 6, 2022, Inspectorate concluded the annual full count of the Trust’s gold bullion held by the Custodian. The second count is a random sample count and is conducted at a date which falls within the same financial year and was conducted most recently on May 4, 2022. The results can be found on www.spdrgoldshares.com
. The Sponsor generally visits the vaults of the Custodian twice a year as part of its due diligence procedures. 31
The table below summarizes the impact of unrealized appreciation on GLDM’s gold holdings at September 30, 2022 and 2021:
(Amount in 000’s of US$) |
Sep-30, 2022 |
Sep-30, 2021 |
||||||
| Investment in gold – cost |
$ | 4,864,729 | $ | 4,237,696 | ||||
| Unrealized appreciation/(depreciation) on investment in gold |
(172,342 | ) | 150,035 | |||||
| |
|
|
|
|||||
| Investment in gold – market value |
$ | 4,692,387 | $ | 4,387,731 | ||||
| |
|
|
|
|||||
Review of Financial Results
| Financial Highlights (All amounts in the following table and the subsequent paragraphs, are in 000’s of US$) |
For the year ended Sep-30, 2022 |
For the year ended Sep-30, 2021 |
For the year ended Sep-30, 2020 |
|||||||||
| Net realized and change in unrealized gain/(loss) on investment in gold |
$ | (289,201 | ) | $ | (338,455 | ) | $ | 446,656 | ||||
| Net income |
$ | (295,357 | ) | $ | (345,917 | ) | $ | 443,161 | ||||
| Net cash provided by operating activities |
$ | — | $ | — | $ | — | ||||||
GLDM’s net realized and change in unrealized loss on investment in gold for the year ended September 30, 2022 of $(289,201) is made up of a realized gain of $394 from the sale of gold to pay Sponsor fees, a realized gain of $32,782 from gold distributed for the redemption of shares, and a change in unrealized depreciation of $(322,377) on investment in gold.
GLDM’s net realized and change in unrealized loss on investment in gold for the year ended September 30, 2021 of $(338,455) is made up of a realized gain of $634 from the sale of gold to pay Sponsor fees, a realized gain of $39,311 from gold distributed for the redemption of shares, and a change in unrealized depreciation of $(378,400) on investment in gold.
GLDM’s net realized and change in unrealized gain on investment in gold for the year ended September 30, 2020 of $446,656 is made up of a realized gain of $455 from the sale of gold to pay Sponsor fees, a realized gain of $37,008 from gold distributed for the redemption of shares, and a change in unrealized appreciation of $409,193 on investment in gold.
Selected Supplemental Data
Year ended Sep-30, 2022 |
Year ended Sep-30, 2021 |
Year ended Sep-30, 2020 |
||||||||||
| Ounces of Gold: |
||||||||||||
| Opening balance |
2,517,632.7 | 1,877,680.9 | 697,523.6 | |||||||||
| Creations (excluding gold receivable at September 30, 2022 – 0; September 30, 2021—0 and September 30, 2020—9,959.7) |
917,800.7 | 893,821.8 | 1,355,433.7 | |||||||||
| Redemptions (excluding gold payable at September 30, 2022 – 31,570.5; September 30, 2021 – 0 and September 30, 2020 – 0) |
(625,024.9 | ) | (249,855.2 | ) | (173,448.7 | ) | ||||||
| Sales of gold |
(3,537.3 | ) | (4,014.8 | ) | (1,827.7 | ) | ||||||
| |
|
|
|
|
|
|||||||
| Closing balance |
2,806,871.2 | 2,517,632.7 | 1,877,680.9 | |||||||||
| |
|
|
|
|
|
|||||||
| Gold price per ounce – LBMA Gold Price PM |
$ | 1,671.75 | $ | 1,742.80 | $ | 1,886.90 | ||||||
| |
|
|
|
|
|
|||||||
| Market value of gold holdings (in 000’s) |
$ | 4,692,387 | $ | 4,387,731 | $ | 3,542,996 | ||||||
| |
|
|
|
|
|
|||||||
| Number of Shares (in 000’s): |
||||||||||||
| Opening balance |
126,600 | 94,750 | 35,450 | |||||||||
| Creations |
46,200 | 44,400 | 68,000 | |||||||||
| Redemptions . |
(33,050 | ) | (12,550 | ) | (8,700 | ) | ||||||
| |
|
|
|
|
|
|||||||
| Closing balance |
139,750 | 126,600 | 94,750 | |||||||||
| |
|
|
|
|
|
|||||||
Share values adjusted per reverse stock split effective Feb. 23, 2022
32
In the year ended September 30, 2022, 46,200,000 Shares (462 Creation Units) were created in exchange for 917,800.7 ounces of gold, 33,050,000 Shares (330 Creation Units) were redeemed in exchange for 656,595.4 ounces of gold and 3,537.3 ounces of gold were sold to pay Sponsor fees. For accounting purposes, GLDM reflects creations and redemptions on the date of receipt of a notification of a creation but does not issue Shares until the requisite amount of gold is received. Upon a redemption, GLDM delivers gold upon receipt of Shares. These creations were completed in the normal course of business.
As at September 30, 2022, the amount of gold owned by GLDM and held by the custodian in its vault was 2,806,871.2 ounces, 100% of which is allocated gold in the form of London Good Delivery gold bars with a market value $4,692,387,416 based on the LBMA Gold Price PM on September 30, 2022 (cost—$4,864,729,757).
As at September 30, 2021, the amount of gold owned by GLDM and held by the custodian in its vault was 2,517,632.7 ounces, 100% of which is allocated gold in the form of London Good Delivery gold bars with a market value $4,387,730,778 based on the LBMA Gold Price PM on September 30, 2021 (cost—$4,237,695,934).
As at September 30, 2020, the amount of gold owned by GLDM and held by the custodian in its vault was 1,887,680.9 ounces, 100% of which is allocated gold in the form of London Good Delivery gold bars with a market value $3,542,996,473 based on the LBMA Gold Price PM on September 30, 2020 (cost—$3,014,561,176).
Cash Flow from Operations
GLDM had no net cash flow from operations in the years ended September 30, 2022, 2021 and 2020. Cash received in respect of gold sold to pay expenses in the years ended September 30, 2022, 2021 and 2020 was the same as those expenses, resulting in a zero cash balance at September 30, 2022, 2021 and 2020.
Off-Balance
Sheet Arrangements Neither GLDM nor the Trust is a party to any
off-balance
sheet arrangements. Cash Resources and Liquidity
At September 30, 2022 and 2021 GLDM did not have any cash balances. When selling gold to pay expenses, GLDM endeavors to sell the exact amount of gold needed to pay expenses in order to minimize GLDM’s holdings of assets other than gold or any gold receivable. As a consequence, we expect that GLDM will not record any net cash flow from its operations and that its cash balance will be zero at the end of each reporting period.
Analysis of Movements in the Price of Gold
As movements in the price of gold are expected to directly affect the price of the Shares, it is important to understand the recent movements in the price of gold. However, past movements in the price of gold are not indicators of future movements.
The following chart shows movements in the price of gold based on the LBMA Gold Price PM in U.S. dollars per ounce over the period from June 26, 2018 (the first date the Shares began trading on the NYSE Arca) to September 30, 2022.
33
Daily Gold Price - June 26, 2018 - September 30, 2022
LBMA Gold Price PM USD

The average, high, low and gold prices for the three and twelve-month periods for the prior three years and for the period from June 26, 2018 (the date the Shares began trading on the NYSE Arca) to September 30, 2022, based on the LBMA Gold Price were:
end-of-period
Period |
Average |
High |
Date |
Low |
Date |
End of period |
Last business day (1) |
|||||||||||||||||||||
| Three months to December 31, 2019 |
$ | 1,480.96 | $ | 1,517.10 | Oct 3, 2019 | $ | 1,452.05 | Nov 12, 2019 | $ | 1,523.00 | Dec 31, 2019 | (2) | ||||||||||||||||
| Three months to March 31, 2020 |
$ | 1,582.80 | $ | 1,683.65 | Mar 6, 2020 | $ | 1,474.25 | Mar 19, 2020 | $ | 1,608.95 | Mar 31, 2020 | |||||||||||||||||
| Three months to June 30, 2020 |
$ | 1,711.13 | $ | 1,771.60 | June 29, 2020 | $ | 1,576.55 | Apr 1, 2020 | $ | 1,768.10 | June 30, 2020 | |||||||||||||||||
| Three months to September 30, 2020 |
$ | 1,908.56 | $ | 2,067.15 | Aug 6, 2020 | $ | 1,771.05 | July 1, 2020 | $ | 1,886.90 | Sep 30, 2020 | |||||||||||||||||
| Three months to December 31, 2020 |
$ | 1,874.23 | $ | 1,940.80 | Nov 6, 2020 | $ | 1,762.55 | Nov 30, 2020 | $ | 1,891.10 | Dec 31, 2020 | (2) | ||||||||||||||||
| Three months to March 31, 2021 |
$ | 1,794.01 | $ | 1,943.20 | Jan 4, 2021 | $ | 1,683.95 | Mar 30, 2021 | $ | 1,691.05 | Mar 31, 2021 | |||||||||||||||||
| Three months to June 30, 2021 |
$ | 1,816.48 | $ | 1,902.75 | June 2, 2021 | $ | 1,726.05 | Apr 1, 2021 | $ | 1,763.15 | June 30, 2021 | |||||||||||||||||
| Three months to September 30, 2021 |
$ | 1,789.52 | $ | 1,829.30 | July 29, 2021 | $ | 1,723.35 | Aug 10, 2021 | $ | 1,742.80 | Sep 30, 2021 | |||||||||||||||||
| Three months to December 31, 2021 |
$ | 1,795.25 | $ | 1,864.90 | Nov 17, 2021 | $ | 1,753.20 | Oct 5, 2021 | $ | 1,820.10 | Dec 31, 2021 | (2) | ||||||||||||||||
| Three months to March 31, 2022 |
$ | 1,877.16 | $ | 2,039.05 | Mar 8, 2022 | $ | 1,788.15 | Jan 28, 2022 | $ | 1,942.15 | Mar 31, 2022 | |||||||||||||||||
| Three months to June 30, 2022 |
$ | 1,870.58 | $ | 1,976.75 | Apr 13, 2022 | $ | 1,809.50 | May 16, 2022 | $ | 1,817.00 | June 30, 2022 | |||||||||||||||||
| Three months to September 30, 2022 |
$ | 1,728.91 | $ | 1,808.40 | Jul 4, 2022 | $ | 1,634.30 | Sep 27, 2022 | $ | 1,671.75 | Sep 30, 2022 | |||||||||||||||||
| |
|
|
|
|
|
|
|
|
|
|
|
|
|
|||||||||||||||
| Twelve months ended September 30, 2020 |
$ | 1,672.83 | $ | 2,067.15 | Aug 6, 2020 | $ | 1,452.05 | Nov 12, 2019 | $ | 1,886.90 | Sep 30, 2020 | |||||||||||||||||
| Twelve months ended September 30, 2021 |
$ | 1,818.12 | $ | 1,943.20 | Jan 4, 2021 | $ | 1,683.95 | Mar 30, 2021 | $ | 1,742.80 | Sep 30, 2021 | |||||||||||||||||
| Twelve months ended September 30, 2022 |
$ | 1,817.08 | $ | 2,039.05 | Mar 8, 2022 | $ | 1,634.30 | Sep 27, 2022 | $ | 1,671.75 | Sep 30, 2022 | |||||||||||||||||
| |
|
|
|
|
|
|
|
|
|
|
|
|
|
|||||||||||||||
| June 26, 2018 to September 30, 2022 |
$ | 1,630.97 | $ | 2,067.15 | Aug 6, 2020 | $ | 1,178.40 | Aug 17, 2018 | $ | 1,671.75 | Sep 30, 2022 | |||||||||||||||||
| |
|
|
|
|
|
|
|
|
|
|
|
|
|
|||||||||||||||
| (1) | The end of period gold price is the LBMA Gold Price PM on the last business day of the period. This is in accordance with the Trust Indenture and the basis used for calculating the Net Asset Value of the Trust. |
| (2) | There was no LBMA Gold Price PM on the last business day of December 2021, 2020 or 2019. The LBMA Gold Price AM on the last business day of December 2021, 2020 and 2019 was $1,820.10, $1,891.10 and $1,523.00 respectively. The Net Asset Value of the Trust on December 31, 2021, 2020 and 2019 was calculated using the LBMA Gold Price AM. |
Item 7A.
Quantitative and Qualitative Disclosures about Market Risk
GLDM is a passive investment vehicle. Fluctuations in the value of gold bullion will affect the value of Shares which are designed to reflect the performance of the price of gold bullion, less GLDM’s expenses.
Item 8.
Financial Statements and Supplementary Data
See Index to Financial Statements on
page F-1
for a list of the financial statements being filed therein, which are incorporated by reference herein. 34
Item 9.
Changes in and Disagreements with Accountants on Accounting and Financial Disclosure
There have been no changes in accountants and no disagreements with accountants on any matter of accounting principles or practices or financial statement disclosures during the fiscal year ended September 30, 2022.
Item 9A.
Controls and Procedures
Conclusion Regarding the Effectiveness of Disclosure Controls and Procedures
The Trust maintains disclosure controls and procedures that are designed to ensure that information required to be disclosed in its Exchange Act reports is recorded, processed, summarized and reported within the time periods specified in the SEC’s rules and forms, and that such information is accumulated and communicated to the Principal Executive Officer and Principal Financial and Accounting Officer of the Sponsor, and to the Audit Committee of the Board of Directors of the Sponsor, as appropriate, to allow timely decisions regarding required disclosure.
Under the supervision and with the participation of the Principal Executive Officer and the Principal Financial and Accounting Officer of the Sponsor, the Sponsor conducted an evaluation of the Trust’s disclosure controls and procedures, as defined under Exchange Act
Rule 13a-15(e).
Based on this evaluation, the Principal Executive Officer and the Principal Financial and Accounting Officer of the Sponsor concluded that, as of September 30, 2022, the Trust’s disclosure controls and procedures were effective. Change in Internal Control Over Financial Reporting
There was no change in the Trust’s or the Funds’ internal controls over financial reporting that occurred during the year ended September 30, 2022 that has materially affected, or is reasonably likely to materially affect, these internal controls.
Management’s Report on Internal Control over Financial Reporting
The Sponsor’s management is responsible for establishing and maintaining adequate internal control over financial reporting, as defined under Exchange Act Rules
13a-15(f)
and 15d-15(f).
The Trust’s and the Funds’ internal control over financial reporting is a process designed to provide reasonable assurance regarding the reliability of financial reporting and the preparation of financial statements for external purposes in accordance with accounting principles generally accepted in the United States. Internal control over financial reporting includes those policies and procedures that: (1) pertain to the maintenance of records that, in reasonable detail, accurately and fairly reflect the transactions and dispositions of the Trust’s and the Funds’ assets, (2) provide reasonable assurance that transactions are recorded as necessary to permit preparation of financial statements in accordance with generally accepted accounting principles, and that the Trust’s and the Funds’ receipts and expenditures are being made only in accordance with appropriate authorizations; and (3) provide reasonable assurance regarding prevention or timely detection of unauthorized acquisition, use, or disposition of the Trust’s and the Funds’ assets that could have a material effect on the financial statements. Because of its inherent limitations, internal control over financial reporting may not prevent or detect misstatements. Also, projections of any evaluation of effectiveness to future periods are subject to the risk that controls may become ineffective because of changes in conditions, or that the degree of compliance with the policies or procedures may deteriorate.
The Principal Executive Officer and Principal Financial and Accounting Officer of the Sponsor assessed the effectiveness of the Trust’s and GLDM’s internal control over financial reporting as of September 30, 2022. In making this assessment, they used the criteria set forth by the Committee of Sponsoring Organizations of the Treadway Commission (COSO) in Internal Control—Integrated Framework (2013). Their assessment included an evaluation of the design of the Trust’s and GLDM’s internal control over financial reporting and testing of the operational effectiveness of its internal control over
35
financial reporting. Based on their assessment and those criteria, the Principal Executive Officer and Principal Financial and Accounting Officer of the Sponsor concluded that the Trust and GLDM maintained effective internal control over financial reporting as of September 30, 2022.
KPMG LLP, the independent registered public accounting firm that audited and reported on the financial statements as of and for the year ended September 30, 2022 included in this
Form 10-K,
as stated in their report which is included herein, issued an attestation report on the effectiveness of the Trust’s and GLDM’s internal control over financial reporting as of September 30, 2022. November 23, 2022
36
Report of Independent Registered Public Accounting Firm
To the Shareholders and the Trustee of SPDR® Gold MiniShares® Trust, the Trustee of World Gold Trust and the Board of Directors of WGC USA Asset Management Company, LLC:
Opinion on Internal Control Over Financial Reporting
We have audited World Gold Trust’s (the Trust) and its series SPDR® Gold MiniShares® Trust’s (the Fund) internal control over financial reporting as of September 30, 2022, based on criteria established in Internal Control Integrated Framework (2013) issued by the Committee of Sponsoring Organizations of the Treadway Commission. In our opinion, the Trust and the Fund maintained, in all material respects, effective internal control over financial reporting as of September 30, 2022, based on criteria established in Internal Control Integrated Framework (2013) issued by the Committee of Sponsoring Organizations of the Treadway Commission.
We also have audited, in accordance with the standards of the Public Company Accounting Oversight Board (United States) (PCAOB), the (1) combined statements of financial condition of the Trust, including the combined schedules of investment, as of September 30, 2022 and 2021, the related combined statements of operations, cash flows, and changes in net assets for each of the years in the three-year period ended September 30, 2022, and the related notes, and (2) the statements of financial condition of the Fund, including the schedules of investment, as of September 30, 2022 and 2021, the related statements of operations, cash flows, and changes in net assets for each of the years in the three-year period ended September 30, 2022, and the related notes (collectively, the combined and individual financial statements), and our reports dated November 23, 2022 expressed an unqualified opinion on those combined and individual financial statements.
Basis for Opinion
The management of WGC USA Asset Management Company, LLC (the Trust’s and Fund’s sponsor) is responsible for maintaining effective internal control over financial reporting and for its assessment of the effectiveness of internal control over financial reporting, included in the accompanying Management’s Report on Internal Control over Financial Reporting. Our responsibility is to express an opinion on the Trust’s and Fund’s internal control over financial reporting based on our audits. We are a public accounting firm registered with the PCAOB and are required to be independent with respect to the Trust and Fund in accordance with the U.S. federal securities laws and the applicable rules and regulations of the Securities and Exchange Commission and the PCAOB.
We conducted our audits in accordance with the standards of the PCAOB. Those standards require that we plan and perform the audits to obtain reasonable assurance about whether effective internal control over financial reporting was maintained in all material respects. Our audits of internal control over financial reporting included obtaining an understanding of internal control over financial reporting, assessing the risk that a material weakness exists, and testing and evaluating the design and operating effectiveness of internal control based on the assessed risk. Our audits also included performing such other procedures as we considered necessary in the circumstances. We believe that our audits provide a reasonable basis for our opinion.
Definition and Limitations of Internal Control Over Financial Reporting
An entity’s internal control over financial reporting is a process designed to provide reasonable assurance regarding the reliability of financial reporting and the preparation of financial statements for external purposes in accordance with generally accepted accounting principles. An entity’s internal control over financial reporting includes those policies and procedures that (1) pertain to the maintenance of records that, in reasonable detail, accurately and fairly reflect the transactions and dispositions of the assets of the entity; (2) provide reasonable assurance that transactions are recorded as necessary to permit preparation of financial statements in accordance with generally accepted accounting principles, and that receipts and expenditures of the entity are being made only in accordance with
37
authorizations of management and directors of the entity; and (3) provide reasonable assurance regarding prevention or timely detection of unauthorized acquisition, use, or disposition of the entity’s assets that could have a material effect on the financial statements.
Because of its inherent limitations, internal control over financial reporting may not prevent or detect misstatements. Also, projections of any evaluation of effectiveness to future periods are subject to the risk that controls may become inadequate because of changes in conditions, or that the degree of compliance with the policies or procedures may deteriorate.
/s/ KPMG LLP
New York, New York
November 23, 2022
Item 9B.
Other Information
Not applicable.
Item 9C.
Disclosure Regarding Foreign Jurisdictions that Prevent Inspections.
Not applicable.
38
PART III
Item 10.
Directors, Executive Officers and Corporate Governance
Neither GLDM nor the Trust has any directors, officers or employees. The following persons, in their respective capacities as directors or executive officers of the Sponsor, a Delaware limited liability company, perform certain functions with respect to the Trust that, if the Trust had directors or executive officers, would typically be performed by them.
Joseph R. Cavatoni is the Principal Executive Officer and Amanda Krichman is the Principal Financial and Accounting Officer of the Sponsor. The Board of Directors of the Sponsor consists of six individuals, of whom five serve on its Audit Committee. The Audit Committee has the responsibility for overseeing the financial reporting process of the Trust, including the risks and controls of that process and such other oversight functions as are typically performed by an audit committee of a public company.
Joseph R. Cavatoni
Amanda Krichman
William J. Shea
39
Partner of Coopers & Lybrand (now PricewaterhouseCoopers), an international public accounting firm, for whom he worked from June 1974 to December 1992. Mr. Shea sits on the boards of AIG SunAmerica, a mutual funds company, and is Chairman of the Board of Demoulas Supermarkets, Inc., a privately held retail grocery store chain in New England. He was a board member of Boston Private Financial Holdings, a public bank holding company, and its related bank from June 2004 to May 2014. Mr. Shea has served on the boards of the Boston Children’s Hospital, Northeastern University, NASDAQ OMXBX, and the Boston Stock Exchange. Mr. Shea holds both a Bachelor of Arts degree and a Master of Arts degree in Economics.
The Sponsor has concluded that Mr. Shea should serve as Director because of the knowledge and extensive experience he gained in a variety of leadership roles with different financial institutions and an international public accounting firm, his extensive experience in business restructurings, and the experience he has gained serving as a director of WGTS.
Molly Duffy
The Sponsor has concluded that Ms. Duffy should serve as Director because of her knowledge and extensive experience in leadership roles at Standard Chartered Bank and the experience she has gained serving as a director of WGTS.
Carlos Rodriguez
non-for-profit
The Sponsor has concluded that Mr. Rodriguez should serve as Director because of the knowledge and extensive experience he gained in a variety of leadership roles different financial institutions and the experience he has gained serving as a director of WGTS.
40
Sara J. Sprung
The Sponsor has concluded that Ms. Sprung should serve as Director because of her extensive experience in financial services at various financial institutions and the experience she has gained serving as a director of DWS Ag, USA and WGTS.
David Tait
The Sponsor has concluded that Mr. Tait should serve as Director because of the knowledge and extensive experience he gained in a variety of leadership roles different financial institutions and the experience he has gained serving as the Chief Executive Officer of World Gold Council and director of WGTS.
Neal Wolkoff
non-executive
Chairman of that board. Mr. Wolkoff has also served on the Board of Directors and Executive Committee of the National Futures Association. Mr. Wolkoff received a Bachelor of Arts degree and a Juris Doctor degree and is a member of the Bar of the State of New York. The Sponsor has concluded that Mr. Wolkoff should serve as Director because of the knowledge and extensive experience he gained in a variety of leadership roles at a major stock exchange and futures exchange, the experience he gained as a trial attorney, his extensive experience as a director on other boards, and the experience he has gained serving as a director of WGTS.
41
The Sponsor has a code of ethics (the “Code of Ethics”) that applies to its executive officers and agents, including its Principal Executive Officer and Principal Financial and Accounting Officer, who perform certain functions with respect to the Trust that, if the Trust had executive officers would typically be performed by them. The Code of Ethics is available without charge by writing the Sponsor at 685 Third Avenue, 27th Floor, New York, NY 10017 or calling the Sponsor at
(212) 317-3800.
The Sponsor’s Code of Ethics is intended to be a codification of the business and ethical principles that guide the Sponsor, and to deter wrongdoing, to promote honest and ethical conduct, to avoid conflicts of interest, and to foster compliance with applicable governmental laws, rules and regulations, the prompt internal reporting of violations and accountability for adherence to this code. Item 11.
Executive Compensation
Not applicable.
Item 12. |
Security Ownership of Certain Beneficial Owners and Management and Related Stockholder Matters |
Securities Authorized for Issuance under Equity Compensation Plans and Related Stockholder Matters
Not applicable.
Security Ownership of Certain Beneficial Owners and Management
Not applicable.
Item 13.
Certain Relationships and Related Transactions and Director Independence
Not applicable.
Item 14.
Principal Accounting Fees and Services
Our independent registered public accounting firm is KPMG, LLP , New York NY , Auditor Firm ID: 185
Fees for services performed by KPMG LLP for the years ended September 30, 2022 and 2021 were:
Years Ended September 30, |
||||||||
2022 |
2021 |
|||||||
| Audit fees |
$ | 70,000 | $ | 77,000 | ||||
| Audit-related fees |
$ | 24,000 | $ | 43,000 | ||||
| |
|
|
|
|||||
| Total |
$ | 94,000 | $ | 120,000 | ||||
| |
|
|
|
|||||
In the table above, in accordance with the SEC’s definitions and rules, Audit Fees are fees paid to KPMG LLP for professional services for the audit of the Trust’s financial statements included in the Form
10-K
and review of financial statements included in the Forms 10-Q,
and for services that are normally provided by the accountants in connection with regulatory filings or engagements. Audit Related Fees are fees for assurance and related services that are reasonably related to the performance of the audit or review of the Trust’s financial statements. Pre-Approved
Policies and Procedures The Trust has no board of directors, and as a result, has no audit committee or
pre-approval
policy with respect to fees paid to its principal accounting firm. Such determinations, including for the fiscal year ended September 30, 2022, are made by the Sponsor’s Board of Directors and Audit Committee. 42
PART IV
Item 15. Exhibits and Financial Statements Schedules
1. Financial Statements
See Index to Financial Statements on
Page F-1
for a list of the financial statements being filed herein. 2. Financial Statement Schedules
Schedules have been omitted since they are either not required, not applicable, or the information has otherwise been included.
3. Exhibits
Exhibit Index
43
44
| Exhibit Number |
Exhibit Description |
Incorporated by Reference | ||||||
| Form |
Exhibit |
Filing Date/Period End Date | ||||||
| 101.CAL* |
Inline XBRL Taxonomy Extension Calculation Linkbase Document | |||||||
| 101.DEF* |
Inline XBRL Taxonomy Extension Definition Linkbase Document | |||||||
| 101.LAB* |
Inline XBRL Taxonomy Extension Label Linkbase Document | |||||||
| 101.PRE* |
Inline XBRL Taxonomy Extension Presentation Linkbase Document | |||||||
| 104.1 |
Cover Page Interactive Data File – The cover page interactive data file does not appear in the interactive data file because its XBRL tags are embedded within the inline XBRL document. | |||||||
| * | Filed herewith. |
Item 16.
Form
10-K
SummaryNot applicable.
45
SIGNATURES
Pursuant to the requirements of the Securities Exchange Act of 1934, the registrant has duly caused this report to be signed on its behalf by the undersigned in the capacities* indicated thereunto duly authorized.
| WGC USA Asset Management Company, LLC Sponsor of the World Gold Trust (Registrant) |
| /s/ Joseph R. Cavatoni |
| Joseph R. Cavatoni Principal Executive Officer* |
| /s/ Amanda Krichman |
| Amanda Krichman Principal Financial and Accounting Officer* |
| /s/ William J. Shea |
| William J. Shea Director* |
| /s/ Molly Duffy |
| Molly Duffy Director* |
| /s/ Carlos Rodriguez |
| Carlos Rodriguez Director* |
| /s/ Sara J. Sprung |
| Sara J. Sprung Director* |
| /s/ David Tait |
| David Tait Director* |
| /s/ Neal Wolkoff |
| Neal Wolkoff Director* |
Date: November
2
, 2022 3
| * | The Registrant is a trust and the persons are signing in their capacities as officers or directors of WGC USA Asset Management Company, LLC, the Sponsor of the Registrant. |
WORLD GOLD TRUST
FINANCIAL STATEMENTS AS OF SEPTEMBER 30, 2022
INDEX
Page |
||||
F-2 |
||||
F-4 |
||||
F-5 |
||||
F-6 |
||||
F-7 |
||||
F-8 |
||||
F-9 |
||||
F-11 |
||||
F-12 |
||||
F-13 |
||||
F-14 |
||||
F-15 |
||||
F-16 |
||||
F-1
Report of Independent Registered Public Accounting Firm
To the Trustee of World Gold Trust and the Board of Directors of WGC USA Asset Management Company, LLC:
Opinion on the Combined Financial Statements
We have audited the accompanying combined statements of financial condition of World Gold Trust and its series (the Trust), including the combined schedules of investment, as of September 30, 2022 and 2021, the related combined statements of operations, cash flows, and changes in net assets for each of the years in the three-year period ended September 30, 2022, and the related notes (collectively, the combined financial statements). In our opinion, the combined financial statements present fairly, in all material respects, the financial position of the Trust as of September 30, 2022 and 2021, and the results of its operations, its cash flows, and changes in its net assets for each of the years in the three-year period ended September 30, 2022, in conformity with U.S. generally accepted accounting principles.
We also have audited, in accordance with the standards of the Public Company Accounting Oversight Board (United States) (PCAOB), the Trust’s internal control over financial reporting as of September 30, 2022, based on criteria established in — issued by the Committee of Sponsoring Organizations of the Treadway Commission, and our report dated November 23, 2022 expressed an unqualified opinion on the effectiveness of the Trust’s internal control over financial reporting.
Internal Control
Integrated Framework (2013)
Basis for Opinion
These combined financial statements are the responsibility of WGC USA Asset Management Company, LLC (the Trust’s sponsor). Our responsibility is to express an opinion on these combined financial statements based on our audits. We are a public accounting firm registered with the PCAOB and are required to be independent with respect to the Trust in accordance with the U.S. federal securities laws and the applicable rules and regulations of the Securities and Exchange Commission and the PCAOB.
We conducted our audits in accordance with the standards of the PCAOB. Those standards require that we plan and perform the audit to obtain reasonable assurance about whether the combined financial statements are free of material misstatement, whether due to error or fraud. Our audits included performing procedures to assess the risks of material misstatement of the combined financial statements, whether due to error or fraud, and performing procedures that respond to those risks. Such procedures included examining, on a test basis, evidence regarding the amounts and disclosures in the combined financial statements. Our audits also included evaluating the accounting principles used and significant estimates made by management, as well as evaluating the overall presentation of the combined financial statements. We believe that our audits provide a reasonable basis for our opinion.
Critical Audit Matter
The critical audit matter communicated below is a matter arising from the current period audit of the combined financial statements that was communicated or required to be communicated to the audit committee and that: (1) relates to accounts or disclosures that are material to the combined financial statements and (2) involved our especially challenging, subjective, or complex judgments. The communication of a critical audit matter does not alter in any way our opinion on the combined financial statements, taken as a whole, and we are not, by communicating the critical audit matter below, providing a separate opinion on the critical audit matter or on the accounts or disclosures to which it relates.
F-2
Evaluation of the evidence pertaining to the existence of the gold holdings
As disclosed in the combined schedule of investment, as of September 30, 2022, the Trust’s market value of gold holdings was $4.7 billion, representing approximately 100% of the Trust’s total assets. All of the gold holdings, which were 2.8 million ounces as of September 30, 2022, were held by a third-party custodian (the custodian).
We identified the evaluation of the evidence pertaining to the existence of the gold holdings as a critical audit matter. Given the nature and volume of the gold holdings, subjective auditor judgment was required to evaluate the extent and nature of evidence obtained to assess the quantity of gold held by the custodian as of September 30, 2022.
The following are the primary procedures we performed to address this critical audit matter. We evaluated the design and tested the operating effectiveness of certain internal controls over the Trust’s gold holdings process, including controls over (1) the comparison of the Trust’s records of gold held to the custodian records and (2) the approval of gold deposits and withdrawals by the trustee of the Trust. We obtained a schedule directly from the custodian of the Trust’s gold holdings held by the custodian as of September 30, 2022. We compared the total ounces on such schedule to the Trust’s record of gold holdings. We also attended and observed part of the physical count of the Trust’s gold holdings performed at the custodian’s location by a third party engaged by the Trust’s sponsor. We obtained the physical count result of that third party and reconciled it to both the Trust’s and the custodian’s records.
/s/ KPMG LLP
We have served as the Trust’s auditor since 2016.
New York, New York
November 23, 2022
F-3
World Gold Trust
Combined Statements of Financial Condition
at September 30, 2022 and 2021
(Amounts in 000’s of US$) |
Sep-30, 2022 |
Sep-30, 2021 |
||||||
| ASSETS |
||||||||
| Investments in Gold, at fair value (cost $ |
$ | $ | ||||||
| |
|
|
|
|||||
| Total Assets |
$ | $ | ||||||
| |
|
|
|
|||||
| LIABILITIES |
||||||||
| Accounts payable to Sponsor |
$ | $ | ||||||
| Gold payable |
||||||||
| |
|
|
|
|||||
| Total Liabilities |
$ | $ | ||||||
| |
|
|
|
|||||
| Net Assets |
$ | $ | ||||||
| |
|
|
|
|||||
See notes to the combined financial statements.
F-4
World Gold Trust
Combined Schedules of Investment
(Amounts in 000’s except for percentages)
| September 30, 2022 |
Ounces of gold |
Cost |
Fair Value |
% of Net Assets |
||||||||||||
| Investment in Gold |
$ | $ | % | |||||||||||||
| |
|
|
|
|
|
|||||||||||
| Total Investment |
$ | $ | % | |||||||||||||
| Liabilities in excess of other assets |
( |
) | ( |
)% | ||||||||||||
| |
|
|
|
|||||||||||||
| Net Assets |
$ | % | ||||||||||||||
| |
|
|
|
|||||||||||||
| September 30, 2021 |
Ounces of gold |
Cost |
Fair Value |
% of Net Assets |
||||||||||||
| Investment in Gold |
$ | $ | % | |||||||||||||
| |
|
|
|
|
|
|||||||||||
| Total Investment |
$ | $ | % | |||||||||||||
| Liabilities in excess of other assets |
( |
) | ( |
)% | ||||||||||||
| |
|
|
|
|||||||||||||
| Net Assets |
$ | % | ||||||||||||||
| |
|
|
|
|||||||||||||
See notes to the combined financial statements.
F-5
World Gold Trust
Combined Statements of Operations
For the years ended September 30, 2022, 2021 and 2020
(Amounts in 000’s of US$) |
Year Ended Sep-30, 2022 |
Year Ended Sep-30, 2021 |
Year Ended Sep-30, 2020 |
|||||||||
| EXPENSES |
||||||||||||
| Sponsor fees |
$ | $ | $ | |||||||||
| |
|
|
|
|
|
|||||||
| Total expenses |
||||||||||||
| |
|
|
|
|
|
|||||||
| Net investment loss |
( |
) | ( |
) | ( |
) | ||||||
| |
|
|
|
|
|
|||||||
| Net realized and change in unrealized gain/(loss) on investment in gold |
||||||||||||
| Net realized gain/(loss) from investment in gold sold to pay Sponsor fees |
||||||||||||
| Net realized gain/(loss) from gold distributed for the redemption of shares |
||||||||||||
| Net change in unrealized gain/(loss) on investment in gold |
( |
) | ( |
) | ||||||||
| |
|
|
|
|
|
|||||||
| Net realized and change in unrealized gain/(loss) on investment in gold |
( |
) | ( |
) | ||||||||
| |
|
|
|
|
|
|||||||
| Net income/(loss) |
$ | ( |
) | $ | ( |
) | $ | |||||
| |
|
|
|
|
|
|||||||
See notes to the combined financial statements.
F-6
World Gold Trust
Combined Statements of Cash Flows
For the years ended September 30, 2022, 2021 and 2020
(Amounts in 000’s of US$) |
Year Ended Sep-30, 2022 |
Year Ended Sep-30, 2021 |
Year Ended Sep-30, 2020 |
|||||||||
| INCREASE/DECREASE IN CASH FROM OPERATIONS: |
||||||||||||
| Cash proceeds received from sales of gold |
$ | $ | $ | |||||||||
| Cash expenses paid |
( |
) | ( |
) | ( |
) | ||||||
| Increase/(Decrease) in cash resulting from operations |
||||||||||||
| |
|
|
|
|
|
|||||||
| Cash and cash equivalents at beginning of period |
||||||||||||
| |
|
|
|
|
|
|||||||
| Cash and cash equivalents at end of period |
$ | $ | $ | |||||||||
| |
|
|
|
|
|
|||||||
| SUPPLEMENTAL DISCLOSURE OF NON-CASH FINANCING ACTIVITIES: |
||||||||||||
| Value of gold received for creation of share-net of change in gold receivable |
$ |
$ |
$ |
|||||||||
| |
|
|
|
|
|
|||||||
| Value of gold distributed for redemption of shares-net of change in gold payable |
$ |
$ |
$ |
|||||||||
| |
|
|
|
|
|
|||||||
(Amounts in 000’s of US$) |
Year Ended Sep-30, 2022 |
Year Ended Sep-30, 2021 |
Year Ended Sep-30, 2020 |
|||||||||
| RECONCILIATION OF NET INCOME/(LOSS) TO NET CASH PROVIDED BY OPERATING ACTIVITIES |
||||||||||||
| Net Income/(Loss) |
$ | ( |
) | $ | ( |
) | $ | |||||
| Adjustments to reconcile net income/(loss) to net cash provided by operating activities: |
||||||||||||
| Proceeds from sales of gold to pay expenses |
||||||||||||
| Net realized (gain)/loss from investment in gold sold to pay Sponsor fees |
( |
) | ( |
) | ( |
) | ||||||
| Net realized (gain)/loss from gold distributed for the redemption of shares |
( |
) | ( |
) | ( |
) | ||||||
| Net change in unrealized gain/(loss) on investment in gold |
( |
) | ||||||||||
| Increase/(Decrease) in accounts payable to Sponsor |
( |
) | ||||||||||
| |
|
|
|
|
|
|||||||
| Net cash provided by operating activities |
$ | $ | $ | |||||||||
| |
|
|
|
|
|
|||||||
See notes to the combined financial statements.
F-7
World Gold Trust
Combined Statements of Changes in Net Assets
For the years ended September 30, 2022, 2021 and 2020
(Amounts in 000’s of US$) |
Year Ended Sep-30, 2022 |
Year Ended Sep-30, 2021 |
Year Ended Sep-30, 2020 |
|||||||||
| Net Assets – Opening Balance |
$ | $ | $ | |||||||||
| Creations |
||||||||||||
| Redemptions |
( |
) | ( |
) | ( |
) | ||||||
| Net investment loss |
( |
) | ( |
) | ( |
) | ||||||
| Net realized gain/(loss) from investment in gold sold to pay Sponsor fees |
||||||||||||
| Net realized gain/(loss) from gold distributed for the redemption of shares |
||||||||||||
| Net change in unrealized gain/(loss) on investment in gold |
( |
) | ( |
) | ||||||||
| |
|
|
|
|
|
|||||||
| Net Assets – Closing Balance |
$ | $ | $ | |||||||||
| |
|
|
|
|
|
|||||||
See notes to the combined financial statements.
F-8
Report of Independent Registered Public Accounting Firm
To the Shareholders and the Trustee of SPDR® Gold MiniShares® Trust and the Board of Directors of WGC USA Asset Management Company, LLC:
Opinion on the Financial Statements
We have audited the accompanying statements of financial condition of SPDR® Gold MiniShares® Trust (GLDM), a series of the World Gold Trust (the Trust), including the schedules of investment, as of September 30, 2022 and 2021, the related statements of operations, cash flows, and changes in net assets for each of the years in the three-year period ended September 30, 2022 and the related notes (collectively, the financial statements). In our opinion, the financial statements present fairly, in all material respects, the financial position of GLDM as of September 30, 2022 and 2021, and the results of its operations, its cash flows, and changes in its net assets for each of the years in the three-year period ended September 30, 2022, in conformity with U.S. generally accepted accounting principles.
We also have audited, in accordance with the standards of the Public Company Accounting Oversight Board (United States) (PCAOB), GLDM s internal control over financial reporting as of September 30, 2022, based on criteria established in issued by the Committee of Sponsoring Organizations of the Treadway Commission, and our report dated November 23, 2022 expressed an unqualified opinion on the effectiveness of GLDM s internal control over financial reporting.
Internal
Control Integrated Framework (2013)
Basis for Opinion
These financial statements are the responsibility of WGC USA Asset Management Company, LLC (the Trust’s sponsor). Our responsibility is to express an opinion on these financial statements based on our audits. We are a public accounting firm registered with the PCAOB and are required to be independent with respect to GLDM in accordance with the U.S. federal securities laws and the applicable rules and regulations of the Securities and Exchange Commission and the PCAOB.
We conducted our audits in accordance with the standards of the PCAOB. Those standards require that we plan and perform the audit to obtain reasonable assurance about whether the financial statements are free of material misstatement, whether due to error or fraud. Our audits included performing procedures to assess the risks of material misstatement of the financial statements, whether due to error or fraud, and performing procedures that respond to those risks. Such procedures included examining, on a test basis, evidence regarding the amounts and disclosures in the financial statements. Our audits also included evaluating the accounting principles used and significant estimates made by management, as well as evaluating the overall presentation of the financial statements. We believe that our audits provide a reasonable basis for our opinion.
Critical Audit Matter
The critical audit matter communicated below is a matter arising from the current period audit of the financial statements that was communicated or required to be communicated to the audit committee and that: (1) relates to accounts or disclosures that are material to the financial statements and (2) involved our especially challenging, subjective, or complex judgments. The communication of a critical audit matter does not alter in any way our opinion on the financial statements, taken as a whole, and we are not, by communicating the critical audit matter below, providing a separate opinion on the critical audit matter or on the accounts or disclosures to which it relates.
F-9
Evaluation of the evidence pertaining to the existence of the gold holdings
As disclosed in the schedule of investment, as of September 30, 2022, GLDM s market value of gold holdings was $4.7 billion, representing approximately 100% of GLDM s total assets. All of the gold holdings, which were 2.8 million ounces as of September 30, 2022, were held by a third-party custodian (the custodian).
We identified the evaluation of the evidence pertaining to the existence of the gold holdings as a critical audit matter. Given the nature and volume of the gold holdings, subjective auditor judgment was required to evaluate the extent and nature of evidence obtained to assess the quantity of gold held by the custodian as of September 30, 2022.
The following are the primary procedures we performed to address this critical audit matter. We evaluated the design and tested the operating effectiveness of certain internal controls over GLDM s gold holdings process, including controls over (1) the comparison of GLDM s records of gold held to the custodian records and (2) the approval of gold deposits and withdrawals by the trustee of GLDM. We obtained a schedule directly from the custodian of GLDM s gold holdings held by the custodian as of September 30, 2022. We compared the total ounces on such schedule to GLDM s record of gold holdings. We also attended and observed part of the physical count of GLDM s gold holdings performed at the custodian s location by a third party engaged by GLDM s sponsor. We obtained the physical count result of that third party and reconciled it to both GLDM s and the custodian s records.
/s/ KPMG LLP
We have served as GLDM’s auditor since 2016.
New York, New York
November 23, 2022
F-10
SPDR
Gold MiniShares
Trust
Statements of Financial Condition
at September 30, 2022 and 2021
(Amounts in 000’s of US$except for share and per share data) |
Sep-30, 2022 |
Sep-30, 2021 |
||||||
| ASSETS |
||||||||
| Investments in Gold, at fair value (cost $ |
$ | $ | ||||||
| |
|
|
|
|||||
| Total Assets |
$ | $ | ||||||
| |
|
|
|
|||||
| LIABILITIES |
||||||||
| Accounts payable to Sponsor |
$ | $ | ||||||
| Gold payable |
||||||||
| |
|
|
|
|||||
| Total Liabilities |
$ | $ | ||||||
| |
|
|
|
|||||
| Net Assets |
$ | $ | ||||||
| |
|
|
|
|||||
| Shares issued and outstanding (1) |
||||||||
| Net asset value per Share |
$ | $ | ||||||
(1) |
Authorized share capital is unlimited and the par value of the Shares is $ |
See notes to the financial statements.
F-11
SPDR
Gold MiniShares
Trust
Schedules of Investment
(Amounts in 000’s except for percentages)
| September 30, 2022 |
Ounces of gold |
Cost |
Fair Value |
% of Net Assets |
||||||||||||
| Investment in Gold |
$ | $ | % | |||||||||||||
| |
|
|
|
|
|
|||||||||||
| Total Investment |
$ | $ | % | |||||||||||||
| Liabilities in excess of other assets |
( |
) | ( |
)% | ||||||||||||
| |
|
|
|
|||||||||||||
| Net Assets |
$ | % | ||||||||||||||
| |
|
|
|
|||||||||||||
| September 30, 2021 |
Ounces of gold |
Cost |
Fair Value |
% of Net Assets |
||||||||||||
| Investment in Gold |
$ | $ | % | |||||||||||||
| |
|
|
|
|
|
|||||||||||
| Total Investment |
$ | $ | % | |||||||||||||
| Liabilities in excess of other assets |
( |
) | ( |
)% | ||||||||||||
| |
|
|
|
|||||||||||||
| Net Assets |
$ | % | ||||||||||||||
| |
|
|
|
|||||||||||||
See notes to the financial statements.
F-12
SPDR
Gold MiniShares
Trust
Statements of Operations
For the years ended September 30, 2022, 2021 and 2020
(Amounts in 000’s of US$, except per share data) |
Year Ended Sep-30, 2022 |
Year Ended Sep-30, 2021 |
Year Ended Sep-30, 2020 |
|||||||||
| EXPENSES |
||||||||||||
| Sponsor fees |
$ | $ | $ | |||||||||
| |
|
|
|
|
|
|||||||
| Total expenses |
||||||||||||
| |
|
|
|
|
|
|||||||
| Net investment loss |
( |
) | ( |
) | ( |
) | ||||||
| |
|
|
|
|
|
|||||||
| Net realized and change in unrealized gain/(loss) on investment in gold |
||||||||||||
| Net realized gain/(loss) from investment in gold sold to pay Sponsor fees |
||||||||||||
| Net realized gain/(loss) from gold distributed for the redemption of shares |
||||||||||||
| Net change in unrealized gain/(loss) on investment in gold |
( |
) | ( |
) | ||||||||
| |
|
|
|
|
|
|||||||
| Net realized and change in unrealized gain/(loss) on investment in gold |
( |
) | ( |
) | ||||||||
| |
|
|
|
|
|
|||||||
| Net income/(loss) |
$ | ( |
) | $ | ( |
) | $ | |||||
| |
|
|
|
|
|
|||||||
| Net income/(loss) per share |
$ | ( |
) | $ | ( |
) | $ | |||||
| Weighted average number of shares (in 000’s) |
||||||||||||
See notes to the financial statements.
F-13
SPDR
Gold MiniShares
Trust
Statements of Cash Flows
For the years ended September 30, 2022, 2021 and 2020
(Amounts in 000’s of US$) |
Year Ended Sep-30, 2022 |
Year Ended Sep-30, 2021 |
Year Ended Sep-30, 2020 |
|||||||||
| INCREASE/DECREASE IN CASH FROM OPERATIONS: |
||||||||||||
| Cash proceeds received from sales of gold |
$ | $ | $ | |||||||||
| Cash expenses paid |
( |
) | ( |
) | ( |
) | ||||||
| |
|
|
|
|
|
|||||||
| Increase/(Decrease) in cash resulting from operations |
||||||||||||
| Cash and cash equivalents at beginning of period |
||||||||||||
| |
|
|
|
|
|
|||||||
| Cash and cash equivalents at end of period |
$ | $ | $ | |||||||||
| |
|
|
|
|
|
|||||||
| SUPPLEMENTAL DISCLOSURE OF NON-CASH FINANCING ACTIVITIES: |
||||||||||||
| Value of gold received for creation of shares-net of change in gold receivable |
$ |
$ |
$ |
|||||||||
| |
|
|
|
|
|
|||||||
| Value of gold distributed for redemption of shares-net of change in gold payable |
$ |
$ |
$ |
|||||||||
| |
|
|
|
|
|
|||||||
(Amounts in 000’s of US$) |
Year Ended Sep-30, 2022 |
Year Ended Sep-30, 2021 |
Year Ended Sep-30, 2020 |
|||||||||
| RECONCILIATION OF NET INCOME/(LOSS) TO NET CASH PROVIDED BY OPERATING ACTIVITIES |
||||||||||||
| Net income/(loss) |
$ | ( |
) | $ | ( |
) | $ | |||||
| Adjustments to reconcile net income/(loss) to net cash provided by operating activities: |
||||||||||||
| Proceeds from sales of gold to pay expenses |
||||||||||||
| Net realized (gain)/loss from investment in gold sold to pay Sponsor fees |
( |
) | ( |
) | ( |
) | ||||||
| Net realized (gain)/loss from gold distributed for the redemption of shares |
( |
) | ( |
) | ( |
) | ||||||
| Net change in unrealized gain/(loss) on investment in gold |
( |
) | ||||||||||
| Increase/(Decrease) in accounts payable to Sponsor |
( |
) | ||||||||||
| |
|
|
|
|
|
|||||||
| Net cash provided by operating activities |
$ | $ | $ | |||||||||
| |
|
|
|
|
|
|||||||
See notes to the financial statements.
F-14
SPDR
Trust
Statements of Changes in Net Assets
For the years ended September 30, 2022, 2021 and 2020
(Amounts in 000’s of US$) |
Year Ended Sep-30, 2022 |
Year Ended Sep-30, 2021 |
Year Ended Sep-30, 2020 |
|||||||||
| Net Assets – Opening Balance |
$ | $ | $ | |||||||||
| Creations |
||||||||||||
| Redemptions |
( |
) | ( |
) | ( |
) | ||||||
| Net investment loss |
( |
) | ( |
) | ( |
) | ||||||
| Net realized gain/(loss) from investment in gold sold to pay Sponsor fees |
||||||||||||
| Net realized gain/(loss) from gold distributed for the redemption of shares |
||||||||||||
| Net change in unrealized gain(loss) on investment in gold |
( |
) | ( |
) | ||||||||
| |
|
|
|
|
|
|||||||
| Net Assets – Closing Balance |
$ | $ | $ | |||||||||
| |
|
|
|
|
|
|||||||
See notes to the financial statements.
F-15
World Gold Trust
Notes to the Financial Statements
1. Organization
World Gold Trust (the “Trust”), formerly known as “World Currency Gold Trust,” was organized as a Delaware statutory trust on August 27, 2014 and is governed by the Fourth Amended and Restated Agreement and Declaration of Trust (“Declaration of Trust”), dated as of April 16, 2018 and amended on February 6, 2020, between WGC USA Asset Management Company, LLC (the “Sponsor”) and the Delaware Trust Company (the “Trustee”). The Trust is authorized to issue an unlimited number of shares of beneficial interest. The beneficial interest in the Trust may be divided into one or more series. The Trust has established six one
The accompanying financial statements relate to the series SPDR® Gold MiniShares® Trust (“GLDM”). The shares of GLDM (the “Shares”) began publicly trading on June 26, 2018 on the NYSE Arca, Inc. (the “NYSE Arca”). The Shares are also listed on the Mexican Stock Exchange (Bolsa Mexicana de Valores). The fiscal
year-end
of GLDM is September 30th
. The investment objective of GLDM is for the Shares to reflect the performance of the price of gold bullion, less its expenses. GLDM’s only ordinary recurring expense is the Sponsor’s annual fee of 0.10
BNY Mellon Asset Servicing, a division of The Bank of New York Mellon (“BNYM” or the “Administrator”), is the administrator and transfer agent. BNYM also serves as the custodian of GLDM’s cash, if any. ICBC Standard Bank Plc (the “Custodian”) is responsible for custody of GLDM’s gold bullion. State Street Global Advisors Funds Distributors, LLC (the “Marketing Agent”) is the Marketing Agent.
The Trust had no operations with respect to GLDM’s Shares prior to June 26, 2018 other than matters relating to its organization and the registration of the offer and sale of GLDM’s Shares under the Securities Act of 1933, as amended.
2. Significant Accounting Policies
The preparation of financial statements in accordance with accounting principles generally accepted in the United States of America (“U.S. GAAP”) requires those responsible for preparing financial statements to make estimates and assumptions that affect the reported amounts and disclosures. Actual results could differ from those estimates. The following is a summary of significant accounting policies followed by GLDM and the Trust.
2.1 Basis of Accounting
For accounting purposes, GLDM is an investment company within the scope of Financial Accounting Standards Board (“FASB”) Accounting Standards Codification (“ASC”) Topic 946, Financial Services—Investment Companies, and therefore applies the specialized accounting and reporting guidance therein. It is not registered as an investment company under the Investment Company Act of 1940, as amended.
These financial statements present the financial condition, results of operations and cash flows of the Trust combined with its operating series and GLDM separately. For the periods presented, there were no balances or activity for the Trust and the footnotes accordingly relate to GLDM, unless stated otherwise.
2.2 Basis of Presentation
The financial statements are presented for the Trust, as the SEC registrant, combined with GLDM and for GLDM individually. The debts, liabilities, obligations and expenses incurred, contracted for or
F-16
World Gold Trust
Notes to the Financial Statements
2.2 Basis of Presentation—(continued)
otherwise existing with respect to GLDM are enforceable only against the assets of GLDM and not against the assets of the Trust generally or any other series that the Trust may establish.
2.3 Cash and Cash Equivalents
Cash and cash equivalents include highly liquid investments of sufficient credit quality with original maturity of three months or less.
2.4 Fair Value Measurement
U.S. GAAP defines fair value as the price a fund would receive to sell an asset or pay to transfer a liability in an orderly transaction between market participants at the measurement date. GLDM’s policy is to value its investments at fair value.
Various inputs are used in determining the fair value of GLDM’s assets or liabilities. Inputs may be based on independent market data (“observable inputs”) or they may be internally developed (“unobservable inputs”). These inputs are categorized into a disclosure hierarchy consisting of three broad levels for financial reporting purposes. The level of a value determined for an asset or liability within the fair value hierarchy is based on the lowest level of any input that is significant to the fair value measurement in its entirety. The three levels of the fair value hierarchy are:
| Level 1 – | Unadjusted quoted prices in active markets for identical assets or liabilities; |
| Level 2 – | Inputs other than quoted prices included within Level 1 that are observable for the asset or liability either directly or indirectly, including quoted prices for similar assets or liabilities in active markets, quoted prices for identical or similar assets or liabilities in markets that are not considered to be active, inputs other than quoted prices that are observable for the asset or liability and inputs that are derived principally from or corroborated by observable market data by correlation or other means; and |
| Level 3 – | Inputs that are unobservable for the asset and liability, including a fund’s assumptions (if any) used in determining the fair value of investments. |
The following table summarizes GLDM’s investment at fair value:
(Amounts in 000’s of US$) |
||||||||||||
September 30, 2022 |
Level 1 |
Level 2 |
Level 3 |
|||||||||
Investment in Gold |
$ | $ | $ | |||||||||
Total |
$ | $ | $ | |||||||||
(Amounts in 000’s of US$) |
||||||||||||
September 30, 2021 |
Level 1 |
Level 2 |
Level 3 |
|||||||||
Investment in Gold |
$ | $ | $ | |||||||||
Total |
$ | $ | $ | |||||||||
There were no
The Administrator values the gold held by GLDM on the basis of the price of an ounce of gold as determined by ICE Benchmark Administration Limited (the “IBA”), a benchmark administrator, which provides an independently administered auction process, as well as the overall administration and
F-17
World Gold Trust
Notes to the Financial Statements
2.4 Fair Value Measurement—(continued)
governance for the London Bullion Market Association (the “LBMA”). In determining the NAV of GLDM, the Administrator values the gold held on the basis of the price of an ounce of gold determined by the IBA 3:00 PM auction process (the “LBMA Gold Price PM”), which is an electronic auction. The auction runs twice daily at 10:30 AM and 3:00 PM London time. The Administrator calculates the NAV of GLDM on each day the NYSE Arca is open for regular trading, generally as of 12:00 PM New York time. If no LBMA Gold Price PM is made on a particular evaluation day or if the LBMA Gold Price PM has not been announced by 12:00 PM New York time on a particular evaluation day, the next most recent LBMA Gold Price AM or PM is used in the determination of the NAV of GLDM, unless the Administrator, in consultation with the Sponsor, determines that such price is inappropriate to use as the basis for such determination.
2.5. Custody of Gold
Gold is held by the Custodian on behalf of GLDM, 100
2.6. Gold Receivable
Gold receivable represents the quantity of gold covered by contractually binding orders for the creation of Shares where the gold has not yet been transferred to GLDM’s account. Generally, ownership of the gold is transferred within of the trade date.
(Amounts in 000’s of US$) |
Sep-30, 2022 |
Sep-30, 2021 |
||||||
Gold receivable |
$ | $ | ||||||
2.7. Gold Payable
Gold payable represents the quantity of gold covered by contractually binding orders for the redemption of Shares where the gold has not yet been transferred out of GLDM’s account. Generally, ownership of the gold is transferred within two business days of the trade date.
(Amounts in 000’s of US$) |
Sep-30, 2022 |
Sep-30, 2021 |
||||||
Gold payable |
$ | $ | ||||||
2.8. Creations and Redemptions of Shares
GLDM creates and redeems Shares from time to time, but only in one or more Creation Units (a Creation Unit equals a block of 100,000
F-18
World Gold Trust
Notes to the Financial Statements
2.8. Creations and Redemptions of Shares—(continued)
As the Shares are redeemable in Creation Units at the option of the Authorized Participants, GLDM has classified the Shares as Net Assets for financial reporting purposes. Changes in the Shares for the years ended September 30, 2022, 2021 and 2020 are as follows:
(Amounts are in 000’s) |
Year Ended Sep-30, 2022 |
Year Ended Sep-30, 2021 |
Year Ended Sep-30, 2020 |
|||||||||
Activity in Number of Shares Created and Redeemed: |
||||||||||||
Creations |
||||||||||||
Redemptions |
( |
) | ( |
) | ( |
) | ||||||
Net Change in Number of Shares Created and Redeemed |
|
|
|
|||||||||
(Amounts in 000’s of US$) |
Year Ended Sep-30, 2022 |
Year Ended Sep-30, 2021 |
Year Ended Sep-30, 2020 |
|||||||||
Activity in Value of Shares Created and Redeemed: |
||||||||||||
Creations |
$ | $ | $ | |||||||||
Redemptions |
( |
) | ( |
) | ( |
) | ||||||
Net change in Value of Shares Created and Redeemed |
$ | $ | $ | |||||||||
2.9. Income and Expense (Amounts in 000’s of US$)
The Administrator will, at the direction of the Sponsor, sell GLDM’s gold as necessary to pay its expenses. When selling gold to pay expenses, the Administrator will endeavor to sell the smallest amount of gold needed to pay expenses in order to minimize GLDM’s holdings of assets other than gold. Unless otherwise directed by the Sponsor, the Administrator will give a sell order and sell gold to the Custodian at the LBMA Gold Price PM following the sell order. A gain or loss is recognized based on the difference between the selling price and the average cost of the gold sold, and such amounts are reported as net realized gain/(loss) from investment in gold sold to pay Sponsor expenses on the Statement of Operations.
GLDM’s net realized and change in unrealized gain/(loss) on investment in gold for the year ended September 30, 2022 of $(289,201 394 32,782 322,377
GLDM’s net realized and change in unrealized gain/(loss) on investment in gold for the year ended September 30, 2021 of $(338,455 634 39,311 378,400
2.10. Income Taxes
GLDM is classified as a “grantor trust” for U.S. federal income tax purposes. As a result, it is not subject to U.S. federal income tax. Instead, its income and expenses “flow through” to the shareholders, and the Administrator will report GLDM’s proceeds, income, deductions, gains and losses to the Internal Revenue Service on that basis.
The Sponsor has evaluated whether there are uncertain tax positions that require financial statement recognition and has determined that no
F-19
World Gold Trust
Notes to the Financial Statements
2.10. Income Taxes—(continued)
3. Quarterly Statements of Operations
Year Ended September 30, 2022 |
Three Months Ended (unaudited) |
|||||||||||||||||||
(Amounts in 000’s of US$, except per share data) |
Dec 31, 2021 |
Mar 31, 2022 |
Jun 30, 2022 |
Sep 30, 2022 |
Year Ended Sep 30, 2022 |
|||||||||||||||
EXPENSES |
||||||||||||||||||||
Sponsor fees |
$ | $ | $ | $ | $ | |||||||||||||||
Total expenses |
||||||||||||||||||||
Net investment loss |
( |
) | ( |
) | ( |
) | ( |
) | ( |
) | ||||||||||
Net realized and change in unrealized gain/(loss) on investment in gold |
||||||||||||||||||||
Net realized gain/(loss) from investment in gold sold to pay Sponsor fees |
||||||||||||||||||||
Net realized gain/(loss) from gold distributed for the redemption of shares |
( |
) | ||||||||||||||||||
Net change in unrealized gain/(loss) on investment in gold |
( |
) | ( |
) | ( |
) | ||||||||||||||
Net realized and change in unrealized gain/(loss) on investment in gold |
( |
) | ( |
) | ( |
) | ||||||||||||||
Net income/(loss) |
$ | $ | $ | ( |
) | $ | ( |
) | $ | ( |
) | |||||||||
Net income/(loss) per share |
$ | $ | $ | ( |
) | $ | ( |
) | $ | ( |
) | |||||||||
Weighted average number of shares (in 000’s) |
||||||||||||||||||||
Year Ended September 30, 2021 |
Three Months Ended (unaudited) |
|||||||||||||||||||
(Amounts in 000’s of US$, except per share data) |
Dec 31, 2020 |
Mar 31, 2021 |
Jun 30, 2021 |
Sep 30, 2021 |
Year Ended Sep 30, 2021 |
|||||||||||||||
EXPENSES |
||||||||||||||||||||
Sponsor fees |
$ | $ | $ | $ | $ | |||||||||||||||
Total expenses |
||||||||||||||||||||
Net investment loss |
( |
) | ( |
) | ( |
) | ( |
) | ( |
) | ||||||||||
F-20
World Gold Trust
Notes to the Financial Statements
3. Quarterly Statements of Operations—(continued)
Net realized and change in unrealized gain/(loss) on investment in gold |
||||||||||||||||||||
Net realized gain/(loss) from investment in gold sold to pay Sponsor fees |
||||||||||||||||||||
Net realized gain/(loss) from gold distributed for the redemption of shares |
||||||||||||||||||||
Net change in unrealized gain/(loss) on investment in gold |
( |
) | ( |
) | ( |
) | ( |
) | ||||||||||||
Net realized and change in unrealized gain/(loss) on investment in gold |
( |
) | ( |
) | ( |
) | ||||||||||||||
Net income/(loss) |
$ | $ | ( |
) | $ | $ | ( |
) | $ | ( |
) | |||||||||
Net income/(loss) per share |
$ | $ | ( |
) | $ | $ | ( |
) | $ | ( |
) | |||||||||
Weighted average number of shares (in 000’s) |
||||||||||||||||||||
4. Related Parties – Sponsor
Effective February 23, 2022, the Sponsor reduced its annual fee of 0.18 0.10 reverse stock split of the Shares which now represent 1/50th of an ounce of gold 100,000
one-for-two
5. GLDM Expenses
GLDM’s only ordinary recurring operating expense is the Sponsor’s annual fee of 0.10
Expenses payable will reduce the NAV of GLDM.
6. Concentration of Risk
GLDM’s primary business activities are the investment in gold and the issuance and sale of Shares.
Various factors could affect the price of gold including: (i) global gold supply and demand, which is influenced by such factors as forward selling by gold producers, purchases made by gold producers to unwind gold hedge positions, central bank purchases and sales, and production and cost levels in major gold-producing countries such as China, Australia, South Africa and the United States; (ii) investors’ expectations with respect to the rate of inflation; (iii) currency exchange rates; (iv) interest rates; (v) investment and trading activities of hedge funds and commodity funds; (vi) other economic variables
F-21
World Gold Trust
Notes to the Financial Statements
6. Concentration of Risk—(continued)
such as income growth, economic output, and monetary policies; and (vii) global or regional political, economic or financial events and situations. In addition, while gold it used to preserve wealth by investors around the world, there is no assurance that gold will maintain its long-term value in terms of purchasing power in the future. In the event that the price of gold declines, the Sponsor expects the value of an investment in the Shares to decline proportionately. Each of these events could have a material effect on GLDM’s financial position and results of operations.
7. Indemnification
The Sponsor and each of its shareholders, members, directors, officers, employees, affiliates and subsidiaries will be indemnified by the Trust and held harmless against any losses, liabilities or expenses incurred in the performance of its duties under the Declaration of Trust without gross negligence, bad faith or willful misconduct. The Sponsor shall in no event be deemed to have assumed or incurred any liability, duty, or obligation to any shareholder or to the Trustee other than as expressly provided for in the Declaration of Trust.
The Trustee and each of its officers, affiliates, directors, employees, and agents will be indemnified by the Trust from and against any losses, claims, taxes, damages, reasonable expenses, and liabilities incurred with respect to the creation, operation or termination of the Trust, the execution, delivery or performance of the Declaration of Trust or the transactions contemplated thereby; provided that the indemnified party acted without willful misconduct, bad faith or gross negligence. The Sponsor will not be liable to the Trust, the Trustee or any shareholder for any action taken or for refraining from taking any action in good faith, or for errors in judgment or for depreciation or loss incurred by reason of the sale of any gold or other assets held in trust under Declaration of Trust. However, the preceding liability exclusion will not protect the Sponsor against any liability resulting from its own gross negligence, bad faith, or willful misconduct.
8. Financial Highlights
The following presentation includes financial highlights related to investment performance and operations of a Share outstanding for the years ended September 30, 2022, 2021 and 2020. The total return at net asset value is based on the change in net asset value of a Share during the period and the total return at market value is based on the change in market value of a Share on NYSE Arca during the period. An individual investor’s return and ratios may vary based on the timing of capital transactions.
Year Ended Sep-30, 2022 |
Year Ended Sep-30, 2021 |
Year Ended Sep-30, 2020 |
||||||||||
Net Asset Value |
||||||||||||
Net asset value per Share, beginning of period |
$ | $ | $ | |||||||||
Net investment income/(loss) |
( |
) | ( |
) | ( |
) | ||||||
Net Realized and Change in Unrealized Gain/(Loss) |
( |
) | ( |
) | ||||||||
Net Income/(Loss) |
( |
) | ( |
) | ||||||||
Net asset value per Share, end of period |
$ | $ | $ | |||||||||
Market value per Share, beginning of period |
$ | $ | $ | |||||||||
Market value per Share, end of period |
$ | $ | $ | |||||||||
F-22
World Gold Trust
Notes to the Financial Statements
8. Financial Highlights—(continued)
Ratio to average net assets |
||||||||||||
Net investment loss |
( |
)% | ( |
)% | ( |
)% | ||||||
Gross expenses |
% | % | % | |||||||||
Net expenses |
% | % | % | |||||||||
Total Return, at net asset value |
( |
)% | ( |
)% | % | |||||||
Total Return, at market value |
( |
)% | ( |
)% | % | |||||||
F-23