UNITED STATES
SECURITIES AND EXCHANGE COMMISSION
Washington, D.C. 20549
_________________
FORM
_________________
CURRENT REPORT
Pursuant to Section 13 or 15(d)
of the Securities Exchange Act of 1934
Date of Report (Date of earliest event reported):
_______________________________
(Exact name of registrant as specified in its charter)
_______________________________
(State or Other Jurisdiction of Incorporation) | (Commission File Number) | (I.R.S. Employer Identification No.) |
(Address of Principal Executive Offices) (Zip Code)
(
(Registrant's telephone number, including area code)
(Former name or former address, if changed since last report)
_______________________________
Check the appropriate box below if the Form 8-K filing is intended to simultaneously satisfy the filing obligation of the registrant under any of the following provisions:
Written communications pursuant to Rule 425 under the Securities Act (17 CFR 230.425) | |
Soliciting material pursuant to Rule 14a-12 under the Exchange Act (17 CFR 240.14a-12) | |
Pre-commencement communications pursuant to Rule 14d-2(b) under the Exchange Act (17 CFR 240.14d-2(b)) | |
Pre-commencement communications pursuant to Rule 13e-4(c) under the Exchange Act (17 CFR 240.13e-4(c)) |
Securities registered pursuant to Section 12(b) of the Act:
Title of each class | Trading Symbol(s) | Name of each exchange on which registered |
The |
Indicate by check mark whether the registrant is an emerging growth company as defined in Rule 405 of the Securities Act of 1933 (§230.405 of this chapter) or Rule 12b-2 of the Securities Exchange Act of 1934 (§240.12b-2 of this chapter).
Emerging growth company
If an emerging growth company, indicate by check mark if the registrant has elected not to use the extended transition period for complying with any new or revised financial accounting standards provided pursuant to Section 13(a) of the Exchange Act. ☐
On May 4, 2023, The Joint Corp. (the “Company”) issued a press release announcing its financial results for the quarter ended March 31, 2023. The press release is furnished as Exhibit 99.1 to this Current Report on Form 8-K.
The information furnished in this Item 2.02 and Exhibit 99.1 shall not be deemed “filed” for purposes of Section 18 of the Securities Exchange Act of 1934, as amended (the “Exchange Act”), or otherwise subject to the liabilities of that section, nor shall it be incorporated by reference in any filing under the Securities Act of 1933, as amended, or the Exchange Act, except as expressly set forth by specific reference in such a filing.
The Company is posting an earnings presentation to its website at https://ir.thejoint.com/. A copy of the earnings presentation is being furnished herewith as Exhibit 99.2. The Company will use the earnings presentation during its earnings conference call on May 4, 2023 and also may use the earnings presentation from time to time in conversations with analysts, investors and others.
The information furnished in this Item 7.01 and Exhibit 99.2 shall not be deemed “filed” for purposes of Section 18 of the Exchange Act, or otherwise subject to the liabilities of that section, nor shall it be incorporated by reference in any filing under the Securities Act of 1933, as amended, or the Exchange Act, except as expressly set forth by specific reference in such a filing.
The information contained in Exhibit 99.2 is summary information that is intended to be considered in the context of the Company’s filings with the SEC. The Company undertakes no duty or obligation to publicly update or revise the information contained in this report, although it may do so from time to time as its management believes is warranted. Any such updating may be made through the filing of other reports or documents with the SEC, through press releases or through other public disclosure.
(d) Exhibits
Exhibit Number | Description | |||
99.1 | Press Release dated May 4, 2023 | |||
99.2 | The Joint Corp. Earnings Presentation, May 2023 | |||
104 | Cover Page Interactive Data File (embedded within the Inline XBRL document) |
SIGNATURE
Pursuant to the requirements of the Securities Exchange Act of 1934, the registrant has duly caused this report to be signed on its behalf by the undersigned hereunto duly authorized.
The Joint Corp. | ||
Date: May 4, 2023 | By: | /s/ Peter D. Holt |
Peter D. Holt | ||
President and Chief Executive Officer | ||
EXHIBIT 99.1
The Joint Corp. Reports First Quarter 2023 Financial Results
- Grew Q1 2023 Revenue 27%, System-wide Sales 17% and System-wide Comp Sales 8% vs. Q1 2022 -
- Increased Clinic Count to 870, Including 130 Company-Owned or Managed Clinics, at March 31, 2023 -
SCOTTSDALE, Ariz., May 04, 2023 (GLOBE NEWSWIRE) -- The Joint Corp. (NASDAQ: JYNT), a national operator, manager, and franchisor of chiropractic clinics, reported its financial results for the quarter ended March 31, 2023.
Financial Highlights: Q1 2023 Compared to Q1 2022
Q1 2023 Operating Highlights
“We entered 2023 with a fortified foundation, and we performed well during the continued economic uncertainty in the first quarter of 2023,” said Peter D. Holt, President and Chief Executive Officer of The Joint Corp. “Steadfast in implementing our corporate initiatives to forge the chiropractic dream, harness the power of our data and accelerate the pace of clinic growth, we are gaining traction. Our educational outreach to associations and schools of chiropractic increased over the past couple of years and delivered more interest than ever from doctors in the recent graduating class. In data, we have launched our business intelligence and analytics reporting tool, and we are preparing to begin our automated marketing program. And we increased the number of our clinics opened year-over-year and have positioned the network for expansion as the economy improves. With only 16% of Americans using chiropractic care and spending $19.5 billion dollars on it annually, the chiropractic patient need is expanding as is our market opportunity. We are committed to growing the overall chiropractic care market as well as capturing greater share.”
Financial Results for First Quarter Ended March 31: 2023 Compared to 2022
Revenue was $28.5 million in the first quarter of 2023, compared to $22.4 million in the first quarter of 2022. The increase reflects a greater number of franchised and company-owned or managed clinics and continued organic growth. Cost of revenue was $2.6 million, compared to $2.3 million in the first quarter of 2022, reflecting the associated higher regional developer royalties and commissions.
Selling and marketing expenses were $4.2 million, up 27%, driven by the increase in advertising expenses from the larger number of clinics, an increase in local marketing expenditures by the company-owned or managed clinics, and the timing of the national marketing fund spend. Depreciation and amortization expenses increased 44% for the first quarter of 2023, as compared to the prior year period, primarily due to the increase of the development of greenfield clinics and the acquisition of franchised clinics.
General and administrative expenses were $19.9 million, compared to $15.4 million in the first quarter of 2022, reflecting increases in costs to support clinic growth and in payroll to remain competitive in the tight labor market.
Operating loss was $678,000, compared to a loss of $176,000 in the first quarter of 2022. Income tax expense, including the impact the employee retention credits, was $842,000, compared to $13,000 in the first quarter of 2022. Other income of $3.8 million included net employee retention credits of $3.9 million in the first quarter of 2023. Net income was $2.3 million, or $0.15 per diluted share, compared to a net loss of $206,000, or $0.01 per basic and diluted share, in the first quarter of 2022.
Adjusted EBITDA was $2.0 million, compared to $1.8 million in the first quarter of 2022. The company defines Adjusted EBITDA, a non-GAAP measure, as EBITDA before acquisition-related expenses, stock-based compensation expense, bargain purchase gain, net (gain)/loss on disposition or impairment, and other income related to employee retention credits. The company defines EBITDA as net income/(loss) before net interest, tax expense, depreciation, and amortization expenses.
Balance Sheet Liquidity
Unrestricted cash was $14.8 million at March 31, 2023, compared to $9.7 million at December 31, 2022. During the first quarter of 2023, cash provided by operating activities was $6.0 million, including the receipt of the employee retention credits mentioned above partially offset by investing activities of $1.2 million for the development of greenfield clinics and improvements of existing clinics.
2023 Guidance
For 2023, management reiterated financial and clinic opening guidance.
Note: Historically, guidance for company-owned or managed clinic openings included a combination of both greenfields and acquisitions. While the company will continue to acquire previously franchised clinics, these transactions are opportunistic, and management will no longer include them in guidance. In 2023, company-owned or managed guidance includes greenfield clinic openings only.
Conference Call
The Joint Corp. management will host a conference call at 5:00 p.m. ET on Thursday, May 4, 2023 to discuss the first quarter 2023 financial results. Shareholders and interested participants may listen to a live broadcast of the conference call by dialing (833) 630-0823 or (412) 317-1831 and ask to be joined into the ‘The Joint’ call approximately 15 minutes prior to the start time.
The live webcast of the call with accompanying slide presentation can be accessed in the IR events section https://ir.thejoint.com/events and will be available for approximately one year. An audio archive can be accessed for one week by dialing (877) 344-7529 or (412) 317-0088 and entering conference ID 8635209.
Commonly Discussed Performance Metrics
This release includes a presentation of commonly discussed performance metrics. System-wide sales include revenues at all clinics, whether operated by the company or by franchisees. While franchised sales are not recorded as revenues by the company, management believes the information is important in understanding the company’s financial performance, because these sales are the basis on which the company calculates and records royalty fees and are indicative of the financial health of the franchisee base. Comp sales include the revenues from both company-owned or managed clinics and franchised clinics that in each case have been open at least 13 full months and exclude any clinics that have closed.
Non-GAAP Financial Information
This release also includes a presentation of non-GAAP financial measures. EBITDA and Adjusted EBITDA are presented because they are important measures used by management to assess financial performance, as management believes they provide a more transparent view of the company’s underlying operating performance and operating trends. Reconciliation of net income/(loss) to EBITDA and Adjusted EBITDA is presented in the table below. The Company defines EBITDA as net income/(loss) before net interest, tax expense, depreciation, and amortization expenses. The company defines Adjusted EBITDA as EBITDA before acquisition-related expenses, bargain purchase gain, net (gain)/loss on disposition or impairment, stock-based compensation expenses, and other income related to employee retention credits. The company defines EBITDA as net income/(loss) before net interest, tax expense, depreciation, and amortization expenses.
EBITDA and Adjusted EBITDA do not represent and should not be considered alternatives to net income or cash flows from operations, as determined by accounting principles generally accepted in the United States, or GAAP. While EBITDA and Adjusted EBITDA are used as measures of financial performance and the ability to meet debt service requirements, they are not necessarily comparable to other similarly titled captions of other companies due to potential inconsistencies in the methods of calculation. EBITDA and Adjusted EBITDA should be reviewed in conjunction with the company’s financial statements filed with the SEC.
Forward-Looking Statements
This press release contains statements about future events and expectations that constitute forward-looking statements. Forward-looking statements are based on our beliefs, assumptions and expectations of industry trends, our future financial and operating performance and our growth plans, taking into account the information currently available to us. These statements are not statements of historical fact. Forward-looking statements involve risks and uncertainties that may cause our actual results to differ materially from the expectations of future results we express or imply in any forward-looking statements, and you should not place undue reliance on such statements. Factors that could contribute to these differences include, but are not limited to, our inability to identify and recruit enough qualified chiropractors and other personnel to staff our clinics, due in part to the nationwide labor shortage, and an increase in operating expenses due to measures we may need to take to address such shortage, inflation, exacerbated by COVID-19 and the current war in Ukraine, which has increased our costs and which could otherwise negatively impact our business, the potential for further disruption to our operations and the unpredictable impact on our business of the COVID-19 outbreak and outbreaks of other contagious diseases, our failure to develop or acquire company-owned or managed clinics as rapidly as we intend, our failure to profitably operate company-owned or managed clinics, short-selling strategies and negative opinions posted on the internet which could drive down the market price of our common stock and result in class action lawsuits, our failure to remediate future material weaknesses in our internal control over financial reporting, which could negatively impact our ability to accurately report our financial results, prevent fraud, or maintain investor confidence, and other factors described in our filings with the SEC, including in the section entitled “Risk Factors” in our Annual Report on Form 10-K for the year ended December 31, 2022 filed with the SEC on March 10, 2023 and subsequently-filed current and quarterly reports. Words such as, "anticipates," "believes," "continues," "estimates," "expects," "goal," "objectives," "intends," "may," "opportunity," "plans," "potential," "near-term," "long-term," "projections," "assumptions," "projects," "guidance," "forecasts," "outlook," "target," "trends," "should," "could," "would," "will," and similar expressions are intended to identify such forward-looking statements. We qualify any forward-looking statements entirely by these cautionary factors. We assume no obligation to update or revise any forward-looking statements for any reason or to update the reasons actual results could differ materially from those anticipated in these forward-looking statements, even if new information becomes available in the future. Comparisons of results for current and any prior periods are not intended to express any future trends or indications of future performance, unless expressed as such, and should only be viewed as historical data.
About The Joint Corp. (NASDAQ: JYNT)
The Joint Corp. (NASDAQ: JYNT) revolutionized access to chiropractic care when it introduced its retail healthcare business model in 2010. Today, it is the nation's largest operator, manager and franchisor of chiropractic clinics through The Joint Chiropractic network. The company is making quality care convenient and affordable, while eliminating the need for insurance, for millions of patients seeking pain relief and ongoing wellness. With more than 850 locations nationwide and over 12 million patient visits annually, The Joint Chiropractic is a key leader in the chiropractic industry. Ranked number one on Forbes’ 2022 America's Best Small Companies list, number three on Fortune’s 100 Fastest-Growing Companies list in 2022 and consistently named to Franchise Times “Top 400+ Franchises” and Entrepreneur's “Franchise 500®” lists, The Joint Chiropractic is an innovative force, where healthcare meets retail.
For more information, visit www.thejoint.com. To learn about franchise opportunities, visit www.thejointfranchise.com.
Business Structure
The Joint Corp. is a franchisor of clinics and an operator of clinics in certain states. In Arkansas, California, Colorado, District of Columbia, Florida, Illinois, Kansas, Kentucky, Maryland, Michigan, Minnesota, New Jersey, New York, North Carolina, Oregon, Pennsylvania, Rhode Island, South Dakota, Tennessee, Washington, West Virginia and Wyoming, The Joint Corp. and its franchisees provide management services to affiliated professional chiropractic practices.
Media Contact: Margie Wojciechowski, The Joint Corp., margie.wojciechowski@thejoint.com
Investor Contact: Kirsten Chapman, LHA Investor Relations, 415-433-3777, thejoint@lhai.com
– Financial Tables Follow –
THE JOINT CORP. AND SUBSIDIARY AND AFFILIATES
CONDENSED CONSOLIDATED BALANCE SHEETS
(unaudited)
March 31, 2023 | December 31, 2022 | ||||||
ASSETS | (unaudited) | ||||||
Current assets: | |||||||
Cash and cash equivalents | $ | 14,773,225 | $ | 9,745,066 | |||
Restricted cash | 731,379 | 805,351 | |||||
Accounts receivable, net | 3,525,643 | 3,911,272 | |||||
Deferred franchise and regional development costs, current portion | 1,059,126 | 1,054,060 | |||||
Prepaid expenses and other current assets | 3,468,749 | 2,098,359 | |||||
Total current assets | 23,558,122 | 17,614,108 | |||||
Property and equipment, net | 17,500,027 | 17,475,152 | |||||
Operating lease right-of-use asset | 22,451,137 | 20,587,199 | |||||
Deferred franchise and regional development costs, net of current portion | 5,678,935 | 5,707,678 | |||||
Intangible assets, net | 11,905,176 | 12,867,529 | |||||
Goodwill | 8,493,407 | 8,493,407 | |||||
Deferred tax assets | 7,708,323 | 8,441,713 | |||||
Deposits and other assets | 755,585 | 756,386 | |||||
Total assets | $ | 98,050,712 | $ | 91,943,172 | |||
LIABILITIES AND STOCKHOLDERS' EQUITY | |||||||
Current liabilities: | |||||||
Accounts payable | $ | 1,836,853 | $ | 2,966,589 | |||
Accrued expenses | 1,996,427 | 1,069,610 | |||||
Co-op funds liability | 731,379 | 805,351 | |||||
Payroll liabilities ($0.9 million and $0.6 million attributable to VIE) | 3,571,008 | 2,030,510 | |||||
Operating lease liability, current portion | 5,622,576 | 5,295,830 | |||||
Finance lease liability, current portion | 24,693 | 24,433 | |||||
Deferred franchise and regional developer fee revenue, current portion | 2,978,937 | 2,955,851 | |||||
Deferred revenue from company clinics ($4.9 million and $4.7 million attributable to VIE) | 7,713,735 | 7,471,549 | |||||
Other current liabilities | 494,250 | 499,250 | |||||
Total current liabilities | 24,969,858 | 23,118,973 | |||||
Operating lease liability, net of current portion | 20,211,159 | 18,672,719 | |||||
Finance lease liability, net of current portion | 57,235 | 63,507 | |||||
Debt under the Credit Agreement | 2,000,000 | 2,000,000 | |||||
Deferred franchise and regional developer fee revenue, net of current portion | 15,682,833 | 15,661,412 | |||||
Other liabilities | 27,230 | 27,230 | |||||
Total liabilities | 62,948,315 | 59,543,841 | |||||
Commitments and contingencies | |||||||
Stockholders' equity: | |||||||
Series A preferred stock, $0.001 par value; 50,000 shares authorized, 0 issued and outstanding, as of March 31, 2023 and December 31, 2022 | — | — | |||||
Common stock, $0.001 par value; 20,000,000 shares authorized, 14,671,360 shares issued and 14,639,325 shares outstanding as of March 31, 2023 and 14,560,353 shares issued and 14,528,487 outstanding as of December 31, 2022 | 14,671 | 14,560 | |||||
Additional paid-in capital | 45,962,861 | 45,558,305 | |||||
Treasury stock 32,035 shares as of March 31, 2023 and 31,866 shares as of December 31, 2022, at cost | (859,279 | ) | (856,642 | ) | |||
Accumulated deficit | (10,040,856 | ) | (12,341,892 | ) | |||
Total The Joint Corp. stockholders' equity | 35,077,397 | 32,374,331 | |||||
Non-controlling Interest | 25,000 | 25,000 | |||||
Total equity | 35,102,397 | 32,399,331 | |||||
Total liabilities and stockholders' equity | $ | 98,050,712 | $ | 91,943,172 |
THE JOINT CORP. AND SUBSIDIARY AND AFFILIATES
CONDENSED CONSOLIDATED INCOME STATEMENTS
(unaudited)
Three Months Ended March 31, | |||||||
2023 | 2022 | ||||||
Revenues: | |||||||
Revenues from company-owned or managed clinics | $ | 17,127,957 | $ | 12,606,999 | |||
Royalty fees | 6,866,023 | 6,008,932 | |||||
Franchise fees | 754,425 | 640,965 | |||||
Advertising fund revenue | 1,952,406 | 1,710,717 | |||||
Software fees | 1,210,005 | 956,998 | |||||
Regional developer fees | 149,478 | 201,787 | |||||
Other revenues | 390,004 | 312,140 | |||||
Total revenues | 28,450,298 | 22,438,538 | |||||
Cost of revenues: | |||||||
Franchise and regional development cost of revenues | 2,290,313 | 2,002,813 | |||||
IT cost of revenues | 333,850 | 309,958 | |||||
Total cost of revenues | 2,624,163 | 2,312,771 | |||||
Selling and marketing expenses | 4,160,244 | 3,287,488 | |||||
Depreciation and amortization | 2,342,544 | 1,629,176 | |||||
General and administrative expenses | 19,936,115 | 15,378,623 | |||||
Total selling, general and administrative expenses | 26,438,903 | 20,295,287 | |||||
Net loss on disposition or impairment | 65,469 | 6,906 | |||||
Loss from operations | (678,237 | ) | (176,426 | ) | |||
Other income (expense), net | 3,821,162 | (16,147 | ) | ||||
Income (loss) before income tax benefit | 3,142,925 | (192,573 | ) | ||||
Income tax expense (benefit) | 841,889 | 13,224 | |||||
Net income (loss) | $ | 2,301,036 | $ | (205,797 | ) | ||
Earnings per share: | |||||||
Basic earnings (loss) per share | $ | 0.16 | $ | (0.01 | ) | ||
Diluted earnings (loss) per share | $ | 0.15 | $ | (0.01 | ) | ||
Basic weighted average shares | 14,566,185 | 14,432,652 | |||||
Diluted weighted average shares | 14,861,734 | 14,432,652 |
THE JOINT CORP. AND SUBSIDIARY AND AFFILIATES
CONDENSED CONSOLIDATED STATEMENTS OF CASH FLOWS
(unaudited)
Three Months Ended March 31, | |||||||
2023 | 2022 | ||||||
Cash flows from operating activities: | |||||||
Net income (loss) | $ | 2,301,036 | $ | (205,797 | ) | ||
Adjustments to reconcile net income (loss) to net cash provided by operating activities: | |||||||
Depreciation and amortization | 2,342,544 | 1,629,176 | |||||
Net loss on disposition or impairment (non-cash portion) | 65,469 | 6,906 | |||||
Net franchise fees recognized upon termination of franchise agreements | (73,095 | ) | — | ||||
Deferred income taxes | 733,390 | (16,776 | ) | ||||
Stock based compensation expense | 266,210 | 323,556 | |||||
Changes in operating assets and liabilities: | |||||||
Accounts receivable | 385,629 | 88,008 | |||||
Prepaid expenses and other current assets | (1,370,390 | ) | (144,644 | ) | |||
Deferred franchise costs | (27,255 | ) | (86,692 | ) | |||
Deposits and other assets | 801 | (94,878 | ) | ||||
Accounts payable | (1,189,662 | ) | 59,461 | ||||
Accrued expenses | 818,784 | (164,751 | ) | ||||
Payroll liabilities | 1,540,498 | (1,522,340 | ) | ||||
Deferred revenue | 288,359 | 296,487 | |||||
Other liabilities | (57,725 | ) | 280,162 | ||||
Net cash provided by operating activities | 6,024,593 | 447,878 | |||||
Cash flows from investing activities: | |||||||
Purchase of property and equipment | (1,200,215 | ) | (1,289,943 | ) | |||
Reacquisition and termination of regional developer rights | — | (250,000 | ) | ||||
Net cash used in investing activities | (1,200,215 | ) | (1,539,943 | ) | |||
Cash flows from financing activities: | |||||||
Payments of finance lease obligation | (6,011 | ) | (21,387 | ) | |||
Purchases of treasury stock under employee stock plans | (2,637 | ) | (2,598 | ) | |||
Proceeds from exercise of stock options | 138,457 | 49,623 | |||||
Net cash provided by financing activities | 129,809 | 25,638 | |||||
Increase (decrease) in cash, cash equivalents and restricted cash | 4,954,187 | (1,066,427 | ) | ||||
Cash, cash equivalents and restricted cash, beginning of period | 10,550,417 | 19,912,338 | |||||
Cash, cash equivalents and restricted cash, end of period | $ | 15,504,604 | $ | 18,845,911 | |||
Reconciliation of cash, cash equivalents and restricted cash: | March 31, 2023 | March 31, 2022 | |||||
Cash and cash equivalents | $ | 14,773,225 | $ | 18,251,194 | |||
Restricted cash | 731,379 | 594,717 | |||||
$ | 15,504,604 | $ | 18,845,911 |
THE JOINT CORP. AND SUBSIDIARY AND AFFILIATES
RECONCILIATION FOR GAAP TO NON-GAAP
(unaudited)
Three Months Ended March 31, | |||||||
2023 | 2022 | ||||||
Non-GAAP Financial Data: | |||||||
Net (loss) income | $ | 2,301,036 | $ | (205,797 | ) | ||
Net interest expense | 49,725 | 15,859 | |||||
Depreciation and amortization expense | 2,342,544 | 1,629,176 | |||||
Tax expense (benefit) | 841,889 | 13,224 | |||||
EBITDA | 5,535,194 | 1,452,462 | |||||
Stock compensation expense | 266,210 | 323,556 | |||||
Acquisition related expenses | 39,332 | — | |||||
Loss on disposition or impairment | 65,469 | 6,906 | |||||
Other income (expense), net | (3,870,887 | ) | — | ||||
Adjusted EBITDA | $ | 2,035,318 | $ | 1,782,924 |
1 System-wide sales include revenues at all clinics, whether operated or managed by the company or by franchisees. While franchised sales are not recorded as revenues by the company, management believes the information is important in understanding the company’s financial performance, because these revenues are the basis on which the company calculates and records royalty fees and are indicative of the financial health of the franchisee base.
2 Comp sales include the revenues from both company-owned or managed clinics and franchised clinics that in each case have been open at least 13 full months and exclude any clinics that have closed.
Exhibit 99.2
Q1 2023 Financial Results As of March 31, 2023 | Reported on May 4, 2023 The Joint Corp. | NASDAQ: JYNT | thejoint.com
2 © 2023 The Joint Corp. All Rights Reserved. Safe Harbor Statements Certain statements contained in this presentation are "forward - looking statements” about future events and expectations. Forward - looking statements are based on our beliefs, assumptions and expectations of industry trends, our future financial and operating performance and our growth plans, taking into account th e information currently available to us. These statements are not statements of historical fact. Forward - looking statements involve risks and uncertainties that may cause our actual results to d iffer materially from the expectations of future results we express or imply in any forward - looking statements, and you should not place undue reliance on such statements. Factors that could contribu te to these differences include, our inability to identify and recruit enough qualified chiropractors and other personnel to staff our clinics, due in part to the nationwide labor shortage , a nd an increase in operating expenses due to measures we may need to take to address such shortage, inflation, exacerbated by COVID - 19 and the current war in Ukraine, which has increased our cos ts and which could otherwise negatively impact our business, the potential for further disruption to our operations and the unpredictable impact on our business of the COVID - 19 outbreak and outbreaks of other contagious diseases, our failure to develop or acquire company - owned or managed clinics as rapidly as we intend, our failure to profitably operate company - owned or managed clinics, short - selling strategies and negative opinions posted on the internet which could drive down the market price of our common stock and result in class action lawsuits, our f ail ure to remediate future material weaknesses in our internal control over financial reporting, which could negatively impact our ability to accurately report our financial results, preve nt fraud, or maintain investor confidence, and other factors described in our filings with the SEC, including in the section entitled “Risk Factors” in our Annual Report on Form 10 - K for the year ended December 31, 2022 filed with the SEC on March 10, 2023 and subsequently - filed current and quarterly reports. Words such as, "anticipates," "believes," "continues," "estimates," "expects," "goal," "objectives," "intends," "may," "opportunity," "plans," "potential," "near - term," "long - term," "projections," "assumptions," "projects," "guidance," "forecasts," "outlook," "target," "trends," "sho uld," "could," "would," "will," and similar expressions are intended to identify such forward - looking statements. We qualify any forward - looking statements entirely by these cautionary factors. We ass ume no obligation to update or revise any forward - looking statements for any reason or to update the reasons actual results could differ materially from those anticipated in these for war d - looking statements, even if new information becomes available in the future. Comparisons of results for current and any prior periods are not intended to express any future trends or indi cat ions of future performance, unless expressed as such, and should only be viewed as historical data. Business Structure The Joint Corp. is a franchisor of clinics and an operator of clinics in certain states. In Arkansas, California, Colorado, D ist rict of Columbia, Florida, Illinois, Kansas, Kentucky, Maryland, Michigan, Minnesota, New Jersey, New York, North Carolina, Oregon, Pennsylvania, Rhode Island, South Dakota, Tennessee, Washington, Wes t V irginia and Wyoming, The Joint Corp. and its franchisees provide management services to affiliated professional chiropractic practices.
Three Enterprise Initiatives to Advance Growth 3 Forging the Chiropractic Dream Accelerating the Pace of Clinic Growth Harnessing the Power of Our Data © 2023 The Joint Corp. All Rights Reserved.
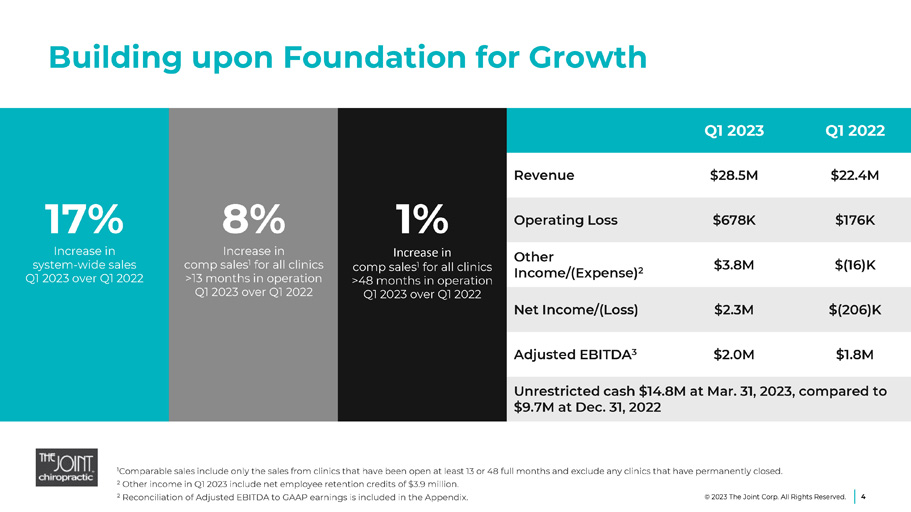
Building upon Foundation for Growth 4 © 2022 The Joint Corp. All Rights Reserved. 1 Comparable sales include only the sales from clinics that have been open at least 13 or 48 full months and exclude any clinics that have permanently closed. 2 Other income in Q1 2023 include net employee retention credits of $3.9 million. 2 Reconciliation of Adjusted EBITDA to GAAP earnings is included in the Appendix. 4 © 2023 The Joint Corp. All Rights Reserved. 17 % Increase in system - wide sales Q1 2023 over Q1 2022 8% In crease in comp sales 1 for all clinics >13 months in operation Q1 2023 over Q1 2022 1% In crease in comp sales 1 for all clinics >48 months in operation Q1 2023 over Q1 2022 Q1 2022 Q1 2023 $22.4M $28.5M Revenue $176K $678K Operating Loss $(16)K $3.8M Other Income/(Expense) 2 $(206)K $2.3M Net Income/(Loss) $1.8M $2.0M Adjusted EBITDA 3 Unrestricted cash $14.8M at Mar. 31, 2023, compared to $9.7 M at Dec. 31, 2022
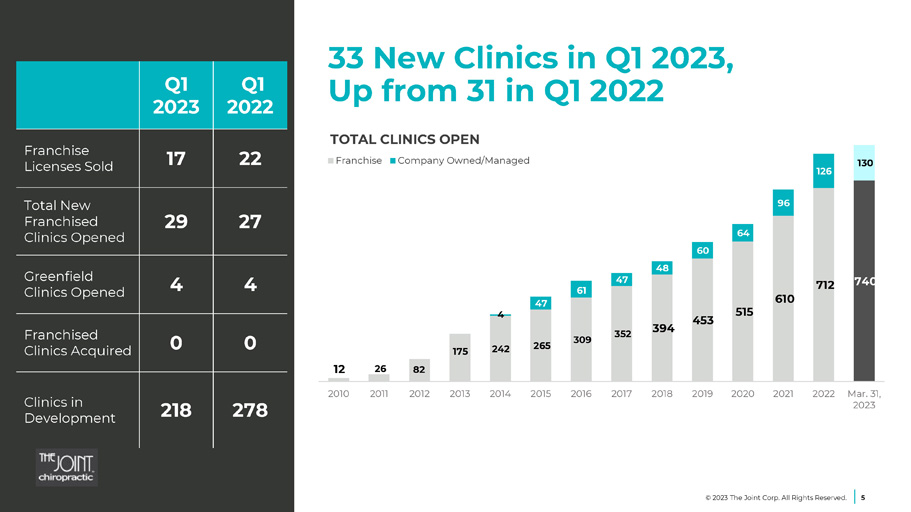
© 2023 The Joint Corp. All Rights Reserved. 5 33 New Clinics in Q1 2023, Up from 31 in Q1 2022 Q1 2022 Q1 2023 22 17 Franchise Licenses Sold 27 29 Total New Franchised Clinics Opened 4 4 Greenfield Clinics Opened 0 0 Franchised Clinics Acquired 278 218 Clinics in Development 12 26 82 175 242 265 309 352 394 453 515 610 712 740 4 47 61 47 48 60 64 96 126 130 2010 2011 2012 2013 2014 2015 2016 2017 2018 2019 2020 2021 2022 Mar. 31, 2023 TOTAL CLINICS OPEN Franchise Company Owned/Managed
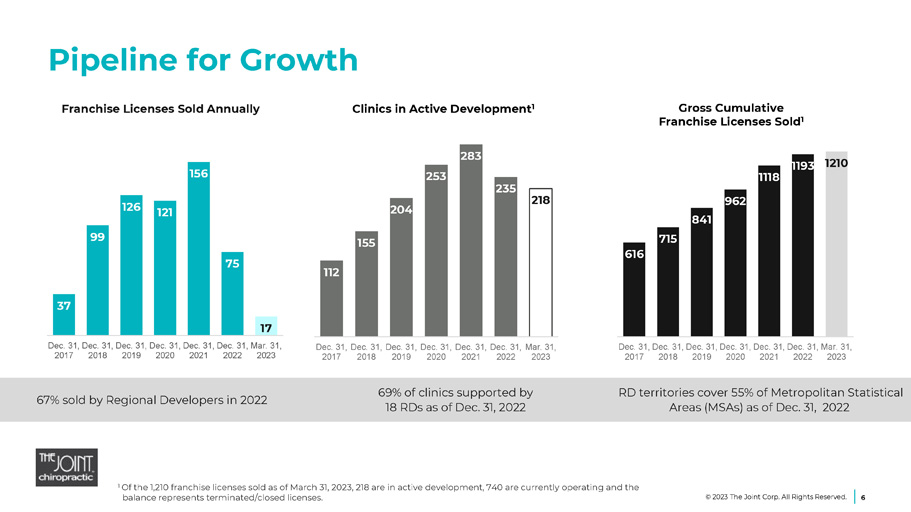
RD territories cover 55% of Metropolitan Statistical Areas (MSAs) as of Dec. 31, 2022 69% of clinics supported by 18 RDs as of Dec. 31, 2022 67% sold by Regional Developers in 2022 37 99 126 121 156 75 17 Dec. 31, 2017 Dec. 31, 2018 Dec. 31, 2019 Dec. 31, 2020 Dec. 31, 2021 Dec. 31, 2022 Mar. 31, 2023 616 715 841 962 1118 1193 1210 Dec. 31, 2017 Dec. 31, 2018 Dec. 31, 2019 Dec. 31, 2020 Dec. 31, 2021 Dec. 31, 2022 Mar. 31, 2023 112 155 204 253 283 235 218 Dec. 31, 2017 Dec. 31, 2018 Dec. 31, 2019 Dec. 31, 2020 Dec. 31, 2021 Dec. 31, 2022 Mar. 31, 2023 Pipeline for Growth © 2022 The Joint Corp. All Rights Reserved. 6 1 Of the 1,210 franchise licenses sold as of March 31, 2023, 218 are in active development, 740 are currently operating and the balance represents terminated/closed licenses. Gross Cumulative Franchise Licenses Sold 1 Franchise Licenses Sold Annually Clinics in Active Development 1 © 2023 The Joint Corp. All Rights Reserved.
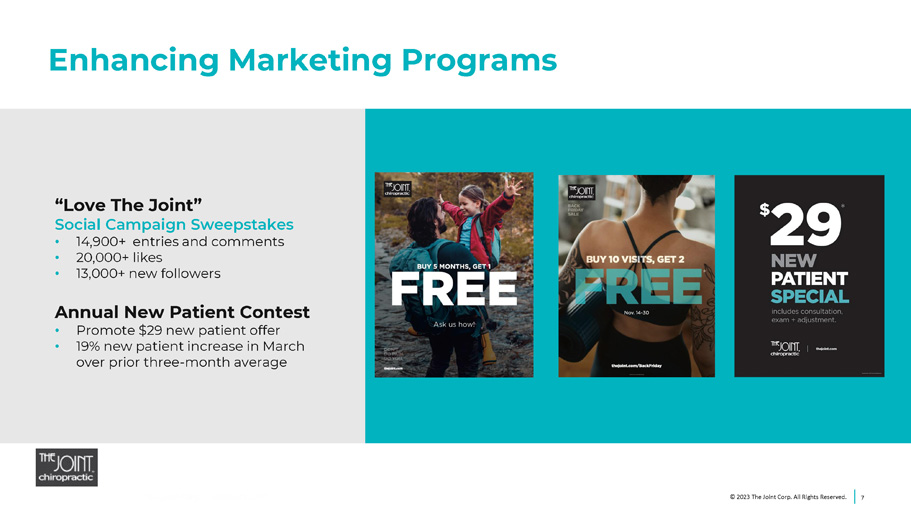
Enhancing Marketing Programs “Love The Joint ” S ocial C ampaign Sweepstakes • 14,900+ entries and comments • 20,000+ likes • 13,000+ new followers Annual New Patient Contest • Promote $29 new patient offer • 19% new patient increase in March over prior three - month average 7 © 2023 The Joint Corp. All Rights Reserved.
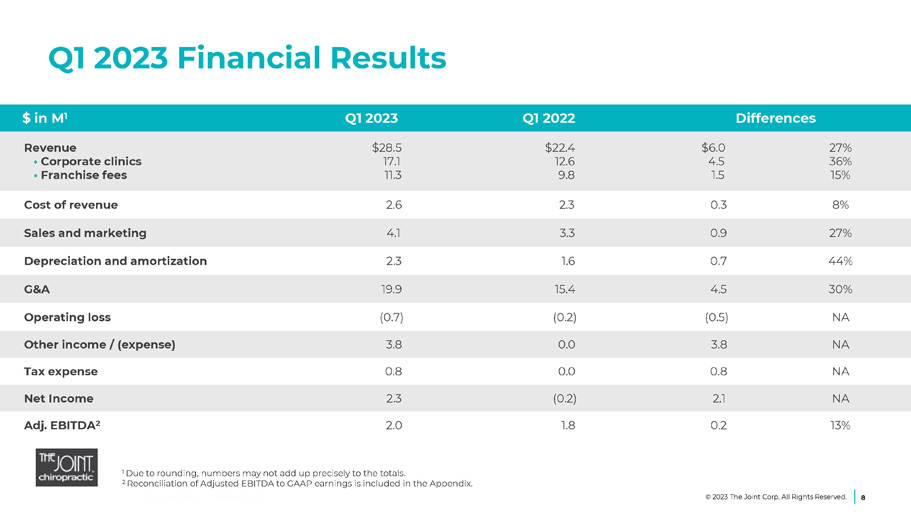
Q1 2023 Financial Results 8 Differences Q1 2022 Q1 2023 $ in M 1 27% 36% 15% $6.0 4.5 1.5 $22.4 12.6 9.8 $28.5 17.1 11.3 Revenue • Corporate clinics • Franchise fees 8% 0.3 2.3 2.6 Cost of revenue 27% 0.9 3.3 4.1 Sales and marketing 44% 0.7 1.6 2.3 Depreciation and amortization 30% 4.5 15.4 19.9 G&A NA (0.5) (0.2) (0.7) Operating loss NA 3.8 0.0 3.8 Other income / (expense) NA 0.8 0.0 0.8 Tax expense NA 2.1 (0.2) 2.3 Net Income 13% 0.2 1.8 2.0 Adj. EBITDA 2 1 Due to rounding, numbers may not add up precisely to the totals. 2 Reconciliation of Adjusted EBITDA to GAAP earnings is included in the Appendix. © 2023 The Joint Corp. All Rights Reserved.
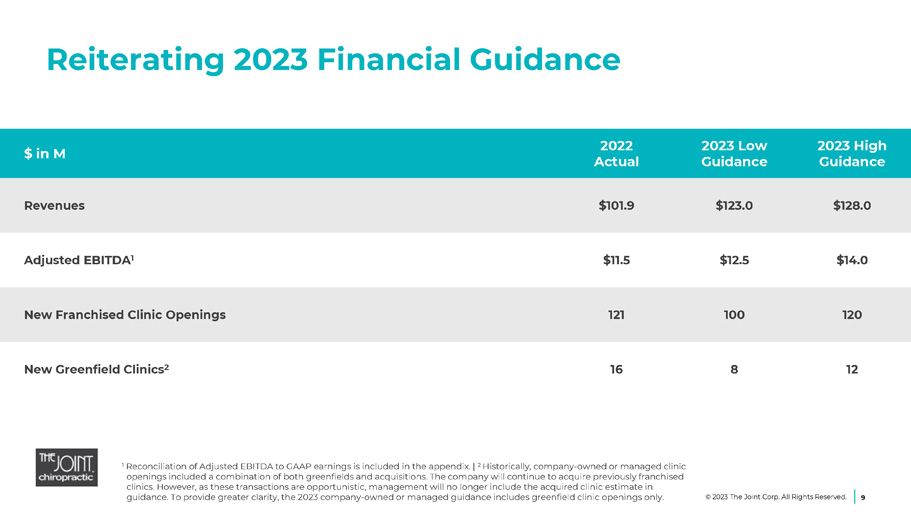
1 Reconciliation of Adjusted EBITDA to GAAP earnings is included in the appendix. | 2 Historically, company - owned or managed clinic openings included a combination of both greenfields and acquisitions. The company will continue to acquire previously franchi s ed clinics. However, as these transactions are opportunistic, management will no longer include the acquired clinic estimate in guidance. To provide greater clarity, the 2023 company - owned or managed guidance includes greenfield clinic openings only. Reiterating 2023 Financial Guidance 9 2023 High Guidance 2023 Low Guidance 2022 Actual $ in M $128.0 $123.0 $101.9 Revenues $14.0 $12.5 $11.5 Adjusted EBITDA 1 120 100 121 New Franchised Clinic Openings 12 8 16 New Greenfield Clinics 2 © 2023 The Joint Corp. All Rights Reserved.
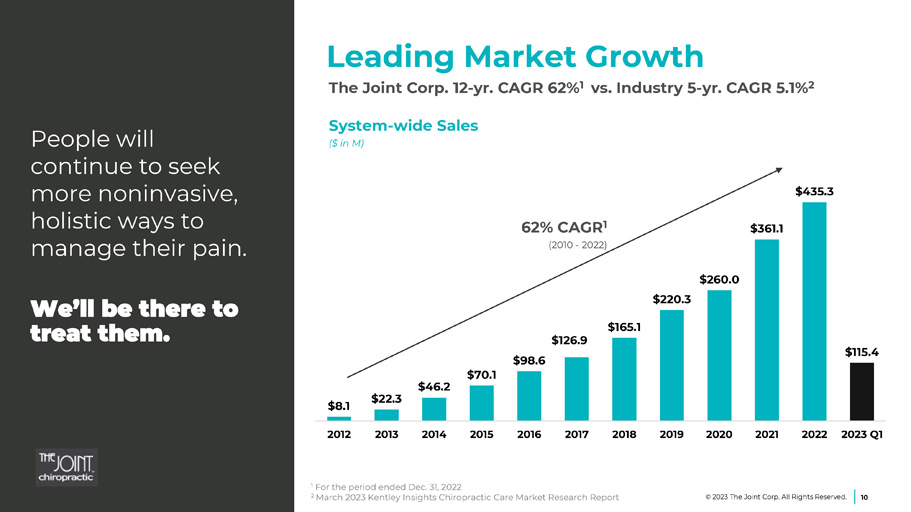
$8.1 $22.3 $46.2 $70.1 $98.6 $126.9 $165.1 $220.3 $260.0 $361.1 $435.3 $115.4 2012 2013 2014 2015 2016 2017 2018 2019 2020 2021 2022 2023 Q1 Leading Market Growth People will continue to seek more noninvasive, holistic ways to manage their pain. We’ll be there to treat them. The Joint Corp. 12 - yr. CAGR 62% 1 vs. Industry 5 - yr. CAGR 5.1% 2 1 For the period ended Dec. 31, 2022 2 March 2023 Kentley Insights Chiropractic Care Market Research Report 10 © 2023 The Joint Corp. All Rights Reserved. System - wide Sales ($ in M) 62% CAGR 1 (2010 - 2022)
Driving Long - term Shareholder Value 11 © 2023 The Joint Corp. All Rights Reserved. The most powerful brand - building tool is our storefronts .
Performance Metrics and Non - GAAP Measures 12 This presentation includes commonly discussed performance metrics. System - wide sales include sales at all clinics, whether operated by the company or by franchisees. While franchised sales are not recorded as revenues by the company, management believes the information is important in under sta nding the company’s financial performance, because these sales are the basis on which the company calculates and records royalty fees and are indicative of th e financial health of the franchisee base. Comp sales include the sales from both company - owned or managed clinics and franchised clinics that in each case have been open at least 13 full months and exclude any clinics that have closed. This presentation includes non - GAAP financial measures. EBITDA and Adjusted EBITDA are presented because they are important measures used by manag ement to assess financial performance, as management believes they provide a more transparent view of the Company’s underlying operating performance and operating trends than GAAP measures alone. Reconciliations of net loss to EBITDA and Adjusted EBITDA are presented where applicable. The Company defines EB ITDA as net income/(loss) before net interest, tax expense, depreciation, and amortization expenses. The Company defines Adjusted EBITDA as EBITDA before acquisit ion - related expenses, bargain purchase net gain, gain/(loss) on disposition or impairment, stock - based compensation expenses and employee retention credits. EBITDA and Adjusted EBITDA do not represent and should not be considered alternatives to net income or cash flows from operat ion s, as determined by accounting principles generally accepted in the United States, or GAAP. While EBITDA and Adjusted EBITDA are frequently used as measures of financial performance and the ability to meet debt service requirements, they are not necessarily comparable to other similarly titled captions of other companies due to potential inconsistencies in the methods of calculation. EBITDA and Adjusted EBITDA should be reviewed in conjunction with the Company’s financial statements filed with the SEC. © 2023 The Joint Corp. All Rights Reserved.
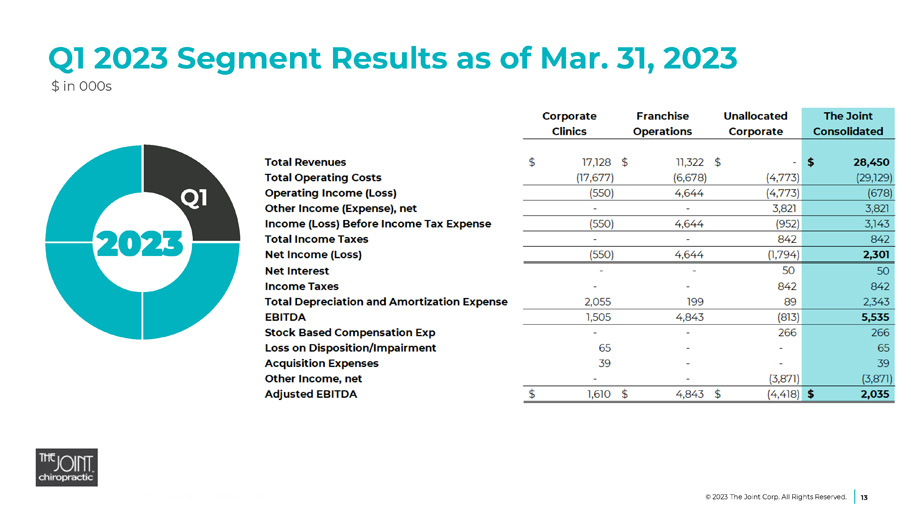
Q1 2023 Segment Results as of Mar. 31, 2023 13 2023 Q1 © 2022 The Joint Corp. All Rights Reserved. $ in 000s © 2023 The Joint Corp. All Rights Reserved.
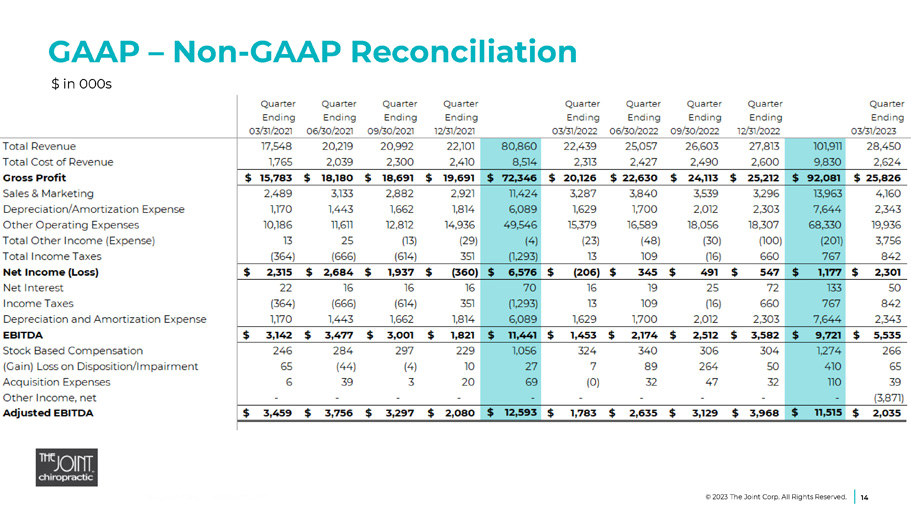
GAAP – Non - GAAP Reconciliation 14 $ in 000s © 2023 The Joint Corp. All Rights Reserved.
Jake Singleton, CFO jake.singleton@thejoint.com The Joint Corp. | 16767 N. Perimeter Dr., Suite 110, Scottsdale, AZ 85260 | (480) 245 - 5960 https://www.facebook.com/thejointchiro @ thejointchiro https://twitter.com/thejointchiro @ thejointchiro https://www.youtube.com/thejointcorp @ thejointcorp Peter D. Holt, President & CEO peter.holt@thejoint.com The Joint Corp. | 16767 N. Perimeter Dr., Suite 110, Scottsdale, AZ 85260 | (480) 245 - 5960 Kirsten Chapman, LHA Investor Relations thejoint@lhai.com LHA Investor Relations | 50 California Street, Suite 1500 | San Francisco, CA 94111| (415) 433 - 3777 Contact Information 15 © 2023 The Joint Corp. All Rights Reserved.
7!E96YU;0 I%4VQI8V54>7!E
M $EM9R &8F]U;F1S3V)J8P $ !28W0Q ! !4;W @
M;&]N9P 3&5F=&QO;F< $)T;VUL;VYG " !2
M9VAT;&]N9P X\ #=7)L5$585 $ !N=6QL5$585 $
M !- L>=
M%5LL826SKX(MKP3#SL:.2/!9>6&TY+;6.W5N$">422&.G__3\X3R9F3/C)3U
ML%EM=9>RH6/:PVV2&,W';ZEA;+O3;^ &YXS'DJ>8EYYWI&>J5[!'MC>\)\(7R!?.%]07VA?@%^8G["?R-_
MA'_E@$> J($*@6N!S8(P@I*"](-7@[J$'82 A..%1X6KA@Z& ;?+-HKR7?F3RC,VK0P1H"S23P"..ZC4 5+-#Q'=L5?%S2(L;2\JQJ
MI?D-Z@"M1BK]#='_ .?7W_.6NNZ1I6N:=H?E9]/UFS@OK%WUU$/B&FIXLJ16YVGV:[&FQB
M?TM=: 992 OA].EG^7Z+MX>'^TG8]3*7U46O;9F8MOM=72S>'X^1_P ;D5LJ
MV_\ :BEEO^"78ES1R0/BJ6+B#$Q*L9G^#8&NM*965X4#8R6L^H6AMKF*8I./41'4L*&AJ >V1&YV8R^DO
3XJUZ]GNFJZ
MLL<:\;>"GQ*O^4!W.9..(#')*V(W#SSG:$VY_P!V?!7D:4Z ;9:U)Y-I3#R_
M!JB5,MQ>&V>$U/'TTY5H?'D,B)^JF9AZ;2 Z=,R@F1%8'5:?++.)KX4.UO
M*I8\$<@;<#45^G!Q(II86(8O0LW^ZF)'S^R,;2!2'EB**#Z7':HI)M3PZ;XI
M40D; G745[;6U
MW W**X19$/LV=9"0D 0\O*)B:*?P]!DD)G%U^[%4P'08J[%78J[%78J[%78J
MI3R1Q1222NL<<:EG=B !N22>@RO+,0B2>2@6_+[\VO^<]CY/\RZ[Y>\J:79
M>8]+LUY_IIYF@DA=21+ IC$J2#8$."*;CK3--#7&8-CW.R.FY4>C\G_S6_,_
M6OS$U?4O._F6[MI'U&=J0W,4GJ&-2"L,:N_J"- =B[4IT.8\(DG<\V_BVJGE
M=LOEWS!!,L>@Q6=_;J]V+R"_:.W5(]Z^FZ24IUV?+ID@H&^P0M_Y>O=6ALXK
M=K9(+F@F9+ZQ6(A3L3SE' BIW)R<94CAIZSI$[:/:Z3HOE77M.\FV%H5_3&I
M:7>QW6KWTTE0_J7")P04Z!.=![X#( V65\(V98VO^0-*#:5!8WNNBXDYZA>S
MFWFOKL5/*+ZSJ)D=!7^1?NP<0DH.Z+_0NB:A%.=#_+LZ=8W:&2*VEU827E$.
MX]&)D!K6H'#IO7!PUU+*[2+5KK3+2RMM)7R/'HMQ/(J-JBSWL@C44^$LTC(S
M'KP&Z^U]HM&^6-6\Q:?'&-+BU:YT;D8_TA##*IMW1UD;TI>*%B/V@#QZ
M5Q,I1W!W91\WTSY-_P"
6\7A\=!4T4EVJ?$[Y*E49
M;NX 'J)&W'8$@G]9P$*MBN[AV"K#$.6_+A7 8@=464UACN'XF:Y>%:CJ"?8T
M ZY TD%E4<]E!"+<*W%J>J5H'E-/LF@J![9%MV9W:Z:TT4-N)N:LB2M91@A0
M3V8CLO0;[G*9SIMCC>]>6?RYN8([.ZU)Q:PL5,=LA&Q:G$D#H?"N8>346YT,
M'5]1_E_Y-T*VN%5Y!
VV89RWS
4=E;$,@:I
MV]1Q7WXYS7;^I!X<(Z[G]#L-#BXB9'H_*#7/-C6LL
K'=NM.F:K'C'1V8/0O#=46_GFN-2U"XEMZGU5MG(9B2U0RBAIN1M]
M&98D!L P,"A-/\O7U]^_CL[5)+QBEK:R/P,K\A5F5:D UJ:T&">81;\6F)+V
M34_^<"-KF>W /
MJM_=H3T*@C<[=\/ 3U1R3"V\]7!93<+]94'H_P 1^8KWK@.GI/B/0]$_,^XT
MV":+1[.ST\W2B.Y^LQ+(DR]22'# &O7!P$%D,C'O,?F'5?,;I%8^9_-?DKRZ[)
M?:K&TZ=+2 \Y:^ 45.6X]-*9H!HR:N$.99+9_G/Y,\O>5YM.GAN;/4M=@K81
MRIQ=E;HQ'[/COF9#'P0(ZN#+-QS!Z/5/R4UB]\X:;Y^:%R]J^B+9(M:"L_[J
MIITVKEFB$B)WRK[VCM&(/ !U?H)Y$.F1^6='L-)X+9Z/:Q:>L*$$1FW0)QV^
M6=EHYQEB'#TV>.S8CBF8EGT77[LR6I,!T&*NQ5V*I?JNI6NCZ;?ZK>N([/3;
M>2YNG\$B4LWX#*<^:.&$IRY ,HQXC0?A-^=GYE7/YA^;O,VKW'(+J4G&&%G"
M+!:)\,*EJ#8"@VZG.'N661R2YR-N_P 0X(B Z/GG4[Y]4EG\P31VQELR%@A0
M4C#QJ(E?X>JK3D>V7@<.W>V<%[O']2U..WN%GO;U[AY16&!F!4BI*M(5H1NQ
M('?,F(L;*^A_R-\G:WYXUJ._N+"5=*C 7ZT\1CB(J"I7L:'L/;-;KLT<8X0;
M+MNS\1G($A^A/F;R]HX\I:CI&H0)J%O]6>"*Q;D\88+\%8QL2#N*G;--Q&.[
MT/!8H\GX1_G'^6VI^5/,%Y TOUIKJLZB%&"BOQ$"H&P.V=CV=K8Y8 EXSM#0
MG%D-/!7T>_($DD4@Y@$A@>_?PS;C)$]742PSYK!:20J6&D6^
MKRQV\<1"$(* 4%!4]:>. 1LL25:RN4B47;E@ X!DW )IT^C$QW3&3US\JO/$
MNE:[]9NK]XA$&5')JU)?@(JU>H:F^,L=,HRW>P^<[:PU.^EMY9/JY95NYP1)
M(&9:TJJCE5@P/RZ93P]S:9 IAY9TO0M#O(K'SO91R>LOK7ME'.Z-/;3J&ADC
M$C,:!3563??<'$2[F-%5L_R[N_-MIK>JZ,)EUFRN57RXSQCZM=15*K"9DXAY
M%5?LL*MV[Y(2[U.SSWSC9^8TUB_TS5/+9T6Y@6..1G@6$W$JJ.1(8"H/^2*?
M/KD@;8WLC?+\[Z58RZ?=W :^OXD>Z6U55CMX4Y!5D9A6K>"@U RN<=T1WW3[
M2-0?33$NF\$N621F1XU
-:"ZXZ,WS"E/Y;FT9.5Q%ZLCS$)( :+MTJ?#$9Q([,)
M8#'H](\NQA9+6*0*T\_&):4(%3\1^>V864\RY>"(L/T3_+S4TETR&-1Q,*JE
M.G04Z?1FGXG> 7$/6HKBI4$;TKEA*1%%1R,XWVIM3<#*S*V5!=+8QR4+ &OV
MJ';*91; 4NGBM+2-Q;A8G;NH%2=9VC#,'#M4[$J:YCSS2Y!R,>'B
M?K]^1&A7_F-M%_,'6K9[0:5IWZ*T* L0CQJ.!E13V(J*]SG4=C::66L\NZ@\
M=VYJ,8)P8]][/O?6L/;QSI7G7B__ #D%>2CR5;Z5 I>75[U(V4?R1HSD_0P7
M.9]I\W#@$.\O1>R^'Q-8"?X1;\W_ "AH6MP?XCU/4E73;#3GE-SJ4YH.,8+-
MP'4T&<&9["O<^O#70QPWYT^2KK19/S9_,>XU6U]9M.L6$5NTAWBA3JW$5^)V
MI_F,W,,ITF'S+Q.HF>T=29_PCEY!]N>7=)M-!TVVTZPB6WAMXUC"L>3,*;DD
M]3WS33R&9XCU=]BA''$1#)89UC4E4^RM.&YKMUID&9W0#W+R/Z-.2[^JE*?3
M3Z<,65 .:60R< BD(:*_05 [=CAID%(B8$&@=C\:TH:G[L"5,RR(7)2M>K'P
M]NV%!2Z2Z8@H7'4\J^ ^>*A*;F\1S\:B0Q+\!%0-_EC2DH.WO860K*PA /ON
M1X>%,(V:Y%1END,DD2RN"10[CI[##:-J8EK'D/2O,ZSF\L&N9I%Y)+P !H:J
M.0%5^8S/T^60&S@Y\$9\WS3YM_)F?U+N"+3+F&U1V^L%9@5()HM*[T&;G#K-
MMW2Y^SNYX_J7Y.M"D\MGI4\D-K51=!J1I)2M>)'T5'7-CCU@ES+K,N@(Z)#H
MGY5ZOYIO%T\6;Q7;*2&F4H)#7L7 WIX9E#40KFXGY27<^DO*G_.&