UNITED STATES
SECURITIES AND EXCHANGE COMMISSION
Washington, D.C. 20549
FORM
(Mark One)
|
|
ANNUAL REPORT PURSUANT TO SECTION 13 OR 15(d) OF THE SECURITIES EXCHANGE ACT OF 1934 |
For the fiscal year ended
or
|
|
TRANSITION REPORT PURSUANT TO SECTION 13 OR 15(d) OF THE SECURITIES EXCHANGE ACT OF 1934 |
For the transition period from _______ to ______
Commission File Number:
(Exact name of registrant as specified in its charter)
|
|
|
|
|
(State or other jurisdiction of incorporation or organization) |
|
(I.R.S. Employer Identification No.) |
|
|
|
|
|
|
|
|
|
(Address of principal executive offices) |
|
(Zip Code) |
Registrant’s telephone number, including area code: (
Securities registered pursuant to Section 12(b) of the Act:
|
Title of each class |
|
Trading Symbol(s) |
|
Name of each exchange on which registered |
|
|
|
|
|
|
Securities registered pursuant to Section 12(g) of the Act: None
Indicate by check mark if the registrant is a well-known seasoned issuer, as defined in Rule 405 of the Securities Act.
Indicate by check mark if the registrant is not required to file reports pursuant to Section 13 or Section 15(d) of the Exchange Act. Yes ☐
Indicate by check mark whether the registrant (1) has filed all reports required to be filed by Section 13 or 15(d) of the Securities Exchange Act of 1934 during the preceding 12 months (or for such shorter period that the registrant was required to file such reports), and (2) has been subject to such filing requirements for the past 90 days.
Indicate by check mark whether the registrant has submitted electronically every Interactive Data File required to be submitted pursuant to Rule 405 of Regulation S-T (§ 232.405 of this chapter) during the preceding 12 months (or for such shorter period that the registrant was required to submit such files).
Indicate by check mark whether the registrant is a large accelerated filer, an accelerated filer, a non-accelerated filer, a smaller reporting company, or an emerging growth company. See the definitions of “large accelerated filer,” “accelerated filer,” “smaller reporting company,” and “emerging growth company” in Rule 12b-2 of the Exchange Act.
|
|
|
☒ |
|
Accelerated filer |
|
☐ |
|
Non-accelerated filer |
|
☐ |
|
Smaller reporting company |
|
|
|
|
|
|
|
Emerging growth company |
|
|
If an emerging growth company, indicate by check mark if the registrant has elected not to use the extended transition period for complying with any new or revised financial accounting standards provided pursuant to Section 13(a) of the Exchange Act. ☐
Indicate by check mark whether the registrant has filed a report on and attestation to its management’s assessment of the effectiveness of its internal control over financial reporting under Section 404(b) of the Sarbanes-Oxley Act (15 U.S.C. 7262(b)) by the registered public accounting firm that prepared or issued its audit report.
Indicate by check mark whether the registrant is a shell company (as defined in Rule 12b-2 of the Exchange Act). Yes
The aggregate market value of the registrant’s common stock held by non-affiliates of the registrant, based on the closing sale price of $89.49 on June 30, 2021, was approximately $
As of February 10, 2022, there were approximately
SYNEOS HEALTH, INC.
FORM 10-K
For the Fiscal Year Ended December 31, 2021
|
TABLE OF CONTENTS |
||
|
|
Page |
|
|
|
||
|
|
|
|
|
|
|
|
|
|
|
|
|
Item 1. |
||
|
|
|
|
|
Item 1A. |
||
|
|
|
|
|
Item 1B. |
||
|
|
|
|
|
Item 2. |
||
|
|
|
|
|
Item 3. |
||
|
|
|
|
|
Item 4. |
||
|
|
|
|
|
|
|
|
|
|
|
|
|
Item 5. |
||
|
|
|
|
|
Item 6. |
||
|
|
|
|
|
Item 7. |
Management’s Discussion and Analysis of Financial Condition and Results of Operations |
|
|
|
|
|
|
Item 7A. |
||
|
|
|
|
|
Item 8. |
||
|
|
|
|
|
Item 9. |
Changes in and Disagreements with Accountants on Accounting and Financial Disclosure |
|
|
|
|
|
|
Item 9A. |
||
|
|
|
|
|
Item 9B. |
||
|
|
|
|
|
Item 9C. |
Disclosure Regarding Foreign Jurisdictions that Prevent Inspections |
|
|
|
|
|
|
|
|
|
|
|
|
|
|
Item 10. |
||
|
|
|
|
|
Item 11. |
||
|
|
|
|
|
Item 12. |
Security Ownership of Certain Beneficial Owners and Management and Related Stockholder Matters |
|
|
|
|
|
|
Item 13. |
Certain Relationships and Related Transactions and Director Independence |
|
|
|
|
|
|
Item 14. |
||
|
|
|
|
|
|
|
|
|
|
|
|
|
Item 15. |
||
|
|
|
|
|
Item 16. |
||
|
|
|
|
|
|
||
2
FORWARD-LOOKING STATEMENTS
This Annual Report on Form 10-K contains forward-looking statements within the meaning of Section 27A of the Securities Act of 1933, as amended, or the Securities Act, and Section 21E of the Securities Exchange Act of 1934, as amended, or the Exchange Act. Such forward-looking statements reflect, among other things, our business plans and strategy, market trends, beliefs regarding our competitive strengths, current expectations, future capital expenditures, and anticipated results of operations, all of which are subject to known and unknown risks, uncertainties and other factors that may cause our actual results, performance or achievements, market trends, or industry results to differ materially from those expressed or implied by such forward-looking statements. Therefore, any statements contained herein that are not statements of historical fact may be forward-looking statements and should be evaluated as such, including our business strategy, the future impact of the COVID-19 pandemic on our business, financial results, and financial condition, and planned capital expenditures. Without limiting the foregoing, the words “anticipates,” “believes,” “can,” “continue,” “could,” “estimates,” “expects,” “intends,” “may,” “might,” “plans,” “projects,” “should,” “would,” “targets,” “will” and the negative thereof and similar words and expressions are intended to identify forward-looking statements. These forward-looking statements are subject to a number of risks, uncertainties and assumptions, including those described in Part I, Item 1A, “Risk Factors” in this Annual Report on Form 10-K. Unless legally required, we assume no obligation to update any such forward-looking information to reflect actual results or changes in the factors affecting such forward-looking information.
As used in this report, the terms “Syneos Health, Inc.,” “Company,” “we,” “us,” and “our” mean Syneos Health, Inc. and its subsidiaries unless the context indicates otherwise.
3
Summary of Principal Risk Factors
We operate in a rapidly changing environment that involves a number of risks, some of which are beyond our control. In evaluating our company, you should consider carefully the summary risks and uncertainties described below together with the other information included in this Annual Report on Form 10-K, including our consolidated financial statements and related notes included in Part II, Item 8, “Financial Statements and Supplementary Data” in this Annual Report on Form 10-K. The occurrence of any of the following risks may materially and adversely affect our business, financial condition, results of operations and future prospects.
|
|
• |
The COVID-19 pandemic and associated economic repercussions have adversely impacted our business and results of operations, and are expected to continue to do so. |
|
|
• |
If we do not generate a large number of new business awards, or if new business awards are delayed, terminated, reduced in scope, or fail to go to contract, our business, financial condition, results of operations, or cash flows may be materially adversely affected. |
|
|
• |
Our backlog might not be indicative of our future revenues, and we might not realize all of the anticipated future revenue reflected in our backlog. |
|
|
• |
If we underprice our contracts, overrun our cost estimates, or fail to receive approval for or experience delays in documentation of change orders, our business, financial condition, results of operations, or cash flows may be materially adversely affected. |
|
|
• |
Our business depends on the continued effectiveness and availability of our information systems, including the information systems we use to provide services to our customers and to store employee data, and failures of these systems, including cyber-attacks, may materially limit our operations or have an adverse effect on our reputation. |
|
|
• |
Our customer or therapeutic area concentration may have a material adverse effect on our business, financial condition, results of operations or cash flows. |
|
|
• |
Our business is subject to international economic, political and other risks that could have a material adverse effect on our business, financial condition, results of operations, cash flows or reputation. |
|
|
• |
Governmental authorities may question our intercompany transfer pricing policies or change their laws in a manner that could increase our effective tax rate or otherwise harm our business. |
|
|
• |
If we are unable to successfully increase our market share, our ability to grow our business and execute our growth strategies could be materially adversely affected. |
|
|
• |
Upgrading the information systems that support our operating processes and evolving the technology platform for our services pose risks to our business. |
|
|
• |
The operation of our early phase (Phase I and IIA) clinical facilities and the services we provide there as well as our clinical trial management, including direct interaction with clinical trial patients or volunteers, and our mobile research nursing clinical trial services, could create potential liability that may adversely affect our business, financial condition, results of operations, cash flows, and reputation. |
|
|
• |
If we are unable to attract suitable principal investigators and recruit and enroll patients for clinical trials, our clinical development business might suffer. |
|
|
• |
Our business could result in liability to us if a drug causes harm to a patient. While we are generally indemnified and insured against such risks, we may still suffer financial losses. |
4
|
|
• |
If we lose the services of key personnel or are unable to recruit experienced personnel, our business, financial condition, results of operations, cash flows, or reputation could be materially adversely affected. |
|
|
• |
Our acquisition strategy may present additional risks, including the risk that we may be unable to fully realize the competitive and operating synergies projected to be achieved through any specific acquisition. |
|
|
• |
Our relationships with existing or potential customers who are in competition with each other may adversely impact the degree to which other customers or potential customers use our services, which may adversely affect our business, financial condition, results of operations, or cash flows. |
|
|
• |
We face risks arising from the restructuring of our operations, which could adversely affect our financial condition, results of operations, cash flows, or business reputation. |
|
|
• |
We operate in many different jurisdictions and we could be adversely affected by violations of the Foreign Corrupt Practices Act, U.K. Bribery Act of 2010, and/or similar worldwide anti-corruption and anti-bribery laws. |
|
|
• |
The failure of third parties to provide us critical support services could adversely affect our business, financial condition, results of operations, cash flows, or reputation. |
|
|
• |
The biopharmaceutical services industry is highly competitive and our business could be materially impacted if we do not compete effectively. Outsourcing trends in the biopharmaceutical industry and changes in aggregate spending and research and development budgets could adversely affect our operating results and growth rate. |
|
|
• |
Actions by government regulators or customers to limit a prescription’s scope or withdraw an approved product from the market could adversely affect our business, results of operations, and financial condition. |
|
|
• |
If we fail to comply with federal, state, and foreign healthcare laws, including fraud and abuse laws, we could face substantial penalties and our business, financial condition, results of operations, cash flows, and prospects could be adversely affected. |
|
|
• |
We may be affected by healthcare reform and potential additional reforms which may adversely impact the biopharmaceutical industry and reduce the need for our services or negatively impact our profitability. |
|
|
• |
Current and proposed laws and regulations regarding the protection of personal data could result in increased risks of liability or increased cost to us or could limit our service offerings. |
|
|
• |
Our customers face intense competition from lower cost generic products and other competing products, which may lower the amount that they spend on our services and could have a material adverse effect on our business, results of operations, cash flows, and financial condition. |
|
|
• |
Our substantial debt could adversely affect our financial condition and cash flows from operations. Despite our level of indebtedness, we are able to incur more debt and undertake additional obligations. Incurring such debt or undertaking such additional obligations could further exacerbate the risks to our financial condition. |
|
|
• |
Interest rate fluctuations or foreign currency exchange rate fluctuations may have a material adverse effect on our business, financial condition, results of operations, or cash flows. |
|
|
• |
Our internal control over financial reporting is required to meet all the standards of Section 404 of Sarbanes-Oxley, and failure to achieve and maintain effective internal controls over financial reporting could have a material adverse effect on our stock price, reputation, business, financial condition, results of operations and cash flows. |
5
PART I
Item 1. Business.
Overview
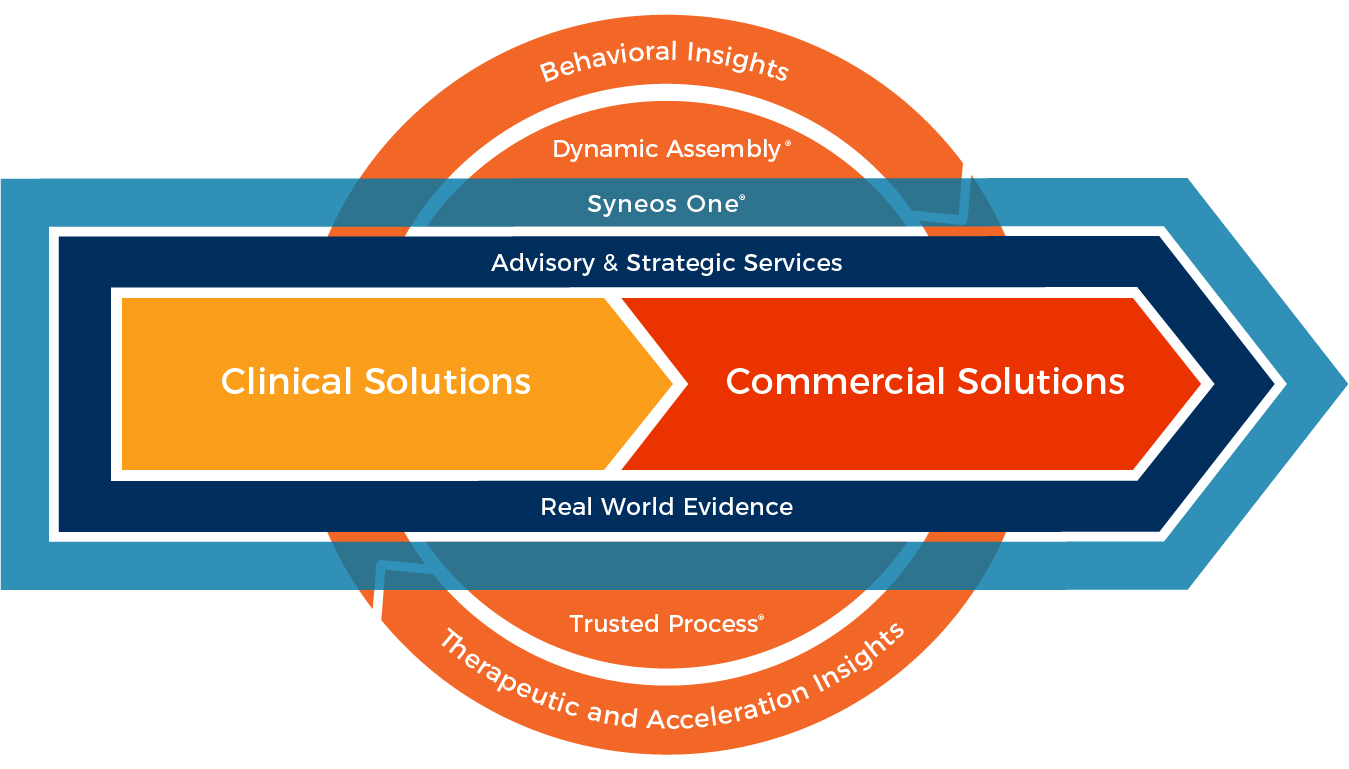
We are the only fully integrated biopharmaceutical solutions organization purpose-built to accelerate customer success. We lead with a product development mindset, strategically blending clinical development, medical affairs and commercial capabilities to address modern market realities for customers in the pharmaceutical, biotechnology, and healthcare industries. We offer both stand-alone and integrated biopharmaceutical product development solutions ranging from early phase (Phase I) clinical trials to the full commercialization of biopharmaceutical products, with the goal of increasing the likelihood of regulatory approval and commercial success while accelerating our customers’ delivery to patients in need worldwide.
We bring a deep understanding of patient and physician behaviors and market dynamics. Together we share insights, use the latest technologies, and apply advanced business practices to speed our customers’ delivery of important therapies to patients.
Our operations are divided into two reportable segments, Clinical Solutions and Commercial Solutions. Our Clinical Solutions segment offers comprehensive global services for the development of diagnostics, drugs, biologics, devices, and digital therapeutics that span Phase I to IV of clinical development. The segment is organized around clinical pharmacology and bioanalytical services, workforce deployment, full-service clinical studies, real world evidence, and consulting. This segment offers individual services including product development and regulatory consulting, project management, protocol development, investigational site recruitment, clinical monitoring, technology-enabled patient recruitment and engagement, clinical home health services, clinical trial diversity, biometrics, and regulatory affairs; all across a comprehensive range of therapeutic areas. Our Commercial Solutions segment provides commercialization services, including deployment solutions, communication solutions (public relations, advertising, and medical communications), and consulting services. We integrate our clinical and commercial capabilities into customized solutions by sharing knowledge, data, and insights. This collaboration across the development and commercialization continuum facilitates unique insights into patient populations, therapeutic environments, product timelines, and the competitive landscape.
Founded more than three decades ago as an academic organization dedicated to central nervous system (“CNS”) research, we have translated that knowledge into a global organization with deep expertise across a wide range of therapeutic specialties, as well as full data services and regulatory advisory and implementation support capabilities. Over the past decade, we have built our scale and capabilities to become a leading global provider of Phase I to Phase IV clinical development services, as well as a full range of commercialization and other complementary services. We were established as INC Research in 1998, and our corporate headquarters are located in Morrisville, North Carolina. INC Research Holdings, Inc. was incorporated in Delaware in August 2010. We changed our name to Syneos Health, Inc. after our 2017 merger (the “Merger”) with Double Eagle Parent, Inc. (“inVentiv”), the parent company of inVentiv Health, Inc.
COVID-19 Pandemic
The ongoing COVID-19 pandemic and associated economic repercussions have significantly impacted, and are expected to continue to impact, our business and our operations. With the spread of COVID-19 variants, the ongoing impacts of the COVID-19 pandemic could adversely impact our business and results of operations. See Part I, Item 1A, “Risk Factors” in this Annual Report on Form 10-K for further discussion of the potential continued impact of the pandemic on our business.
6
Our Market
The market for our solutions is primarily the biopharmaceutical industry that utilizes outsourced clinical drug and medical device development and commercialization services. We believe we are well-positioned to benefit from the following market trends:
Trends in clinical drug and medical device development. Biopharmaceutical companies continue to prioritize the outsourcing of Phase I to Phase IV clinical trials to contract research organizations (“CROs”). Several biopharmaceutical industry trends are increasing demand for outsourced research and development services from CROs:
|
|
• |
Large biopharmaceutical companies (top 50 by prior year research and development (“R&D”) expenditure) rely on CRO relationships in order to remain flexible and efficient as they seek to reduce costs and accelerate development timelines, particularly in complex therapeutic areas such as oncology. |
|
|
• |
Small and mid-sized biopharmaceutical companies typically have limited infrastructure and resources, making them more likely to outsource their clinical development. While biotechnology funding in 2021 was lighter than the peak experienced in 2020, the funding environment remains robust relative to historical levels. As a result of this increased funding, emerging biotechnology companies represent a high growth customer segment opportunity within the market. |
|
|
• |
Phase IV/post-approval/real world evidence represents an increasing area of spending across all customer segments. |
We believe that, based on industry sources and management estimates, the Phase I – IV clinical development market for CRO services will grow at a compound average annual rate of 6% to 8% through 2023, driven by a combination of research and development budget increases and further outsourcing spend. We estimate the total addressable clinical development market to be approximately $105 billion, of which $50 billion was outsourced to CROs in 2021.
Trends in commercialization outsourcing. We believe that, based on industry sources and management estimates, the market for biopharmaceutical commercial outsourcing will grow at a compound average growth rate of approximately 3% to 5% through 2023. We believe this potential growth is supported by: (i) significant biopharmaceutical sales and marketing budgets; (ii) a continuing shift toward specialty and more complex therapies requiring more complex and integrated sales and marketing execution; (iii) a robust funding environment, which provides capital to fuel development and commercialization spending, particularly for small to mid-sized companies; (iv) the strength of new drug approvals by the U.S. Food and Drug Administration (“FDA”) in recent years; (v) continued political scrutiny of pharmaceutical pricing, which is intensifying pressure for our customers to further reduce fixed costs by outsourcing; and (vi) an evolving industry landscape illustrated by a shift to more strategic relationships, particularly where economies of scale can reduce costs.
Increasingly challenging clinical development and commercialization environment. The biopharmaceutical industry is currently facing a number of challenges, including: (i) margin deterioration; (ii) reimbursement and provider access hurdles; (iii) fewer blockbuster and high profitability drugs; (iv) continued pressure from generic brand exposure; and (v) the consolidation of payers, healthcare systems, providers, and pharmacies. These challenges also make it more complicated to engage physicians and patients, making new product launches more difficult. At the same time, the industry is experiencing growing demand for specialty drugs, pressure to improve R&D productivity, the transition of the healthcare industry worldwide from a volume-based to a value-based reimbursement structure, and growing political and pricing pressures. Existing approaches to address these challenges include reducing overhead costs,
7
optimizing the deployment of marketing and field assets, and refocusing product portfolios around therapeutic areas with depth of presence and expanded market access capabilities.
Optimization of biopharmaceutical R&D efficiency. Market forces and healthcare reform, including the Patient Protection and Affordable Care Act, as amended by the Health Care and Education Reconciliation Act, the 21st Century Cures Act, and other governmental initiatives, place significant pressure on biopharmaceutical companies to improve cost efficiencies. At the same time, the complexity, size, duration, and globalization of clinical trials has increased drug development costs. In an effort to reduce these rising costs, biopharmaceutical companies need to demonstrate a new therapy’s relative improvement in quality, safety, and effectiveness compared to the current standard of care as early as possible in the development process. Outsourcing to CROs allows biopharmaceutical companies to deploy capital more efficiently, quickly benefiting from the CROs’ existing infrastructure and therapeutic expertise without having to continuously scale in-house development resources.
Globalization of clinical trials. Clinical trials have become increasingly global as biopharmaceutical companies seek to accelerate patient recruitment, particularly within protocol-eligible, treatment-naïve patient populations without co-morbidities that could skew clinical outcomes. Biopharmaceutical companies are also increasingly seeking to expand the commercial potential of their products by applying for regulatory approvals in multiple countries, including fast-growing economies that are spending more on healthcare. As part of the biopharmaceutical approval process in newer markets, especially in certain Asian and emerging markets, regulators now often require clinical trials to include specific percentages or numbers of people from local populations, resulting in a combination of multinational and domestic clinical trials.
Management of increasingly complex clinical trials. The biopharmaceutical industry operates in an increasingly sophisticated and highly regulated environment and has responded to the demands of novel therapeutics by adapting efficient drug development processes. Complex clinical trial design expertise has emerged as a significant competitive advantage for select CROs that have a track record of successfully navigating country-specific regulatory, clinical trial protocol, and patient enrollment barriers, including sometimes subjective, evolving clinical endpoints. In addition, the therapeutic areas where we have significant experience and expertise, including neuroscience, hematology/oncology, and other complex disease areas, often require more complicated protocols than other disease indications. Many of these studies have longer durations due to these factors, resulting in demand for greater clinical trial proficiency and expertise in these therapeutic areas, particularly in light of new methods such as the use of biomarkers, gene therapy, and digital therapeutics.
Evolving commercialization outsourcing needs for large versus small to mid-sized biopharmaceutical companies. The needs of large versus small to mid-sized customers are evolving differently based upon their distinct infrastructure and corporate commercialization goals. Large biopharmaceutical companies tend to have robust internal resources and generally are seeking to augment these resources with individual outsourced services on a brand-by-brand basis. Frequently, they are also looking to establish enterprise vendor relationships with volume considerations to support broader cost savings initiatives. Conversely, small to mid-sized biopharmaceutical companies typically have limited product portfolios with fewer internal resources and less commercialization experience. As a result, these companies generally require the full spectrum of commercialization capabilities, what we call full-service commercial solutions. Historically, their only viable commercialization option was to enter into licensing agreements or a divestiture, which often meant surrendering a significant portion of an asset’s long-term economic value. However, with today’s funding environment driving sufficient capital for product launch, we believe these companies are becoming more receptive to commercialization alternatives that allow them to maintain their independence.
8
Rapid adoption of remote technology-enabled platforms. Accelerated by the COVID-19 pandemic, we have observed a significant increase in the adoption of remote and digital solutions to facilitate continued healthcare delivery to patients and support to healthcare providers (“HCPs”) for our customers’ products. Technology-enabled, insights-powered site- and patient-centric solutions that have been on the rise include risk-based and remote monitoring, home health, and virtual personal and non-personal outreach to medical facilities and clinics. In light of these trends, we have continued to invest in our Decentralized Solutions and Kinetic capabilities. Decentralized Solutions are designed to speed clinical trial data collection, ease site and patient burden, expand available patient populations, and improve patient diversity. Kinetic is designed to digitally enhance our Commercial Solutions by synchronizing customer engagement across multiple personal and digital channels to provide real-time performance data and intelligence. In addition to investing in our current technologies, we invested in new technology and data capabilities in 2021 through our acquisitions of StudyKIK Corporation (“StudyKIK”) and RxDataScience, Inc. (“RxDataScience”). StudyKIK expands our portfolio of patient-direct, technology-enabled solutions while RxDataScience helps biopharmaceutical customers solve challenging problems through advanced analytics, data management, and artificial intelligence. As adoption of remote technology-enabled platforms increases over the longer term, we believe these capabilities provide an opportunity for improved efficiencies that could help to offset the potential revenue impact from reduced travel and other reimbursable expenses, while improving access to clinical trials and the health of patients worldwide.
Our Competitive Strengths
Our key competitive strengths are:
Differentiated positioning through our full suite of clinical and commercial services. We believe our customers are facing an increasingly complex and evolving market where regulatory approval no longer guarantees a successful product launch. To address this modern market reality, we believe that clinical development and commercial disciplines must work together to accelerate the delivery of differentiated therapies to the market that meet the needs of patients, healthcare professionals, and payers. As the only company with in-house capabilities to provide a full suite of integrated clinical development and commercial solutions, we believe we are well-positioned to successfully navigate this increasingly complex and evolving market for our customers.
Global leadership and experience in biopharmaceutical outsourcing. We believe our scale, global reach, and breadth of services, coupled with our deep industry expertise and experience, are critical to our customers who are seeking to consolidate their outsourcing to a smaller set of large global providers. We offer our services through a highly skilled staff of more than 28,000 employees and contingent workers located in more than 60 countries as of December 31, 2021, and have conducted work in more than 110 countries. In addition, over the last five years, more than 94% of all new molecular entities approved by the U.S. Food and Drug Administration (“FDA”) and 95% of the products granted marketing authorization by the European Medicines Agency (“EMA”) have been developed or commercialized with our support.
Syneos One® represents a unique offering in the market. Our Syneos One® offering coordinates integrated solutions across the full clinical development and commercialization continuum. This offering provides our small to mid-sized customers with an economic alternative to divesting, out-licensing, or co-promoting assets, and provides our large biopharmaceutical customers with further opportunity to reduce their fixed-cost infrastructure, and an alternative approach to developing and promoting their non-core assets. We believe this offering represents a unique capability in the market that can reduce program risk and optimize clinical development timelines, while maximizing return on investment.
9
Proprietary Methodology – the Trusted Process®. Since 2006, we have used the Trusted Process® to standardize our delivery methodology in the conduct of clinical trials, which increases our service delivery predictability, accelerates median clinical study start-up time on new projects, and reduces operational risk. We have recently evolved the Trusted Process to reflect the “product development mindset” that biopharmaceutical customers are increasingly expecting from a service provider and to provide our customers an operational strategy best designed to maximize their research and development investments.
Our dedicated Operations Management function defines, maintains, improves, and ensures consistent application of the Trusted Process® across our global footprint. In addition, it contributes to the absolute reduction of cycle times in critical path milestones, providing greater operating efficiency, more predictable project schedules, and a reduction in overall delivery timelines. Our metrics-driven Trusted Process® methodology is divided into four phases:
|
|
• |
PlanActivation® – the design phase, where the objectives are analyzed utilizing our therapeutic and technical subject matter experience to develop a quality-driven strategy for success; |
|
|
• |
QuickStart® – the engineering phase, which serves to align the team to the strategy, create shared expectations, and develop a joint execution plan; |
|
|
• |
ProgramAccelerate® – the execution and control phase, where we proactively manage conduct. Data is used to ensure timelines, risks, issues, and quality are actively managed while maintaining positive relationships with all stakeholders; and |
|
|
• |
QualityFinish® – the closing phase, where we develop a closeout plan that accounts for the remaining deliverables and provision of actionable data and/or the final product. |
While initially developed to better manage clinical trial complexity, the Trusted Process® is also actively deployed in our early phase, real world and late phase (“RWLP”), functional service provider (“FSP” or “FSP360”), Global Client Solutions, and Syneos One® offerings. Additionally, it is being adapted and deployed as warranted within our commercial service portfolio to further drive efficiency, consistency, and quality in our integrated operations.
Functional Service Provider Model. Our FSP360 model provides flexible resourcing solutions in the areas of biostatistics and programming, data management, drug safety and pharmacovigilance, study start-up, medical writing, clinical monitoring, trial master file support, and site and investigator payments. Our model includes a comprehensive plan designed to ensure both speed and quality for operations, relationship management, communication, quality and risk mitigation, and internal processes and tools. We collaborate extensively across functional teams to ensure customer needs are appropriately identified and supported.
Adding value across the biopharmaceutical product life cycle. We believe our ability to utilize our broad experience, data assets, and information technology assets across our full suite of services uniquely positions us to provide solutions that help biopharmaceutical customers optimize execution and reduce costs throughout the product development life cycle using the following capabilities:
|
|
• |
Superior clinical trial design: We believe our expanding clinical and commercial knowledge and our access to electronic medical records and claims data allows us to expedite the completion of clinical trials without sacrificing quality, improving the probability of regulatory approval, and subsequent commercial success. |
10
|
|
• |
Enhanced site selection and patient recruitment: We utilize our data assets, behavioral insights, social media, communications capabilities, and our expanded portfolio of patient-direct, technology-enabled solutions to enhance the speed and success of site selection and patient recruitment. These capabilities provide additional value with effective patient engagement, particularly for compliance with protocol requirements, and long-term patient retention. |
|
|
• |
Proactive pre-launch reimbursement and formulary management: We bridge the gap between clinical development and commercialization by using insights derived from our diverse capabilities and ability to communicate clinical benefits to payers and Pharmacy Benefit Managers (“PBMs”) to help optimize reimbursement and patient access. |
|
|
• |
Effective commercial product launch capabilities: We help our customers navigate the global complexities of launching a product by orchestrating interconnected work streams to develop and execute an effective product launch strategy that incorporates current therapeutic insights and market realities. |
|
|
• |
Full-service commercial: We enable companies to develop, launch, and commercially support their brands by accessing our comprehensive solutions, and acting as their virtual commercialization infrastructure. In 2021, approximately 33% of our commercialization customers purchased services from more than one of our commercialization services offerings. These customers represented approximately 88% of our Commercial Solutions revenue in 2021. |
|
|
• |
Efficient project ramp-up: We scale clinical or commercial projects rapidly and effectively through our recruiting, training, and deployment capabilities, leveraging our dedicated recruiting personnel and our proprietary database of approximately 1.1 million industry professionals. |
Harmonizing diverse data via Dynamic Assembly® to create “asset customized” insights. Our strategic, capital-efficient approach to data and technology, Dynamic Assembly®, allows us to quickly address the nuances of each customer challenge from their clinical trial protocol through to their commercial product launch. Our open, source-agnostic and flexible architecture focuses on integrating quality data with the insights and best practices we have established during our decades of developing and commercializing biopharmaceutical products. We have access to significant data assets from a diverse number of sources including a variety of third-party data and technology providers, as well as our clinical and commercial operations. Our recent acquisitions of StudyKIK and RxDataScience are intended to deliver new technology-enabled, data-driven insights to customers, helping to improve access to and diversity in clinical trials. Together, our acquisitions and partnerships with best-of-breed providers for Dynamic Assembly are helping customers harmonize multiple data types and sources, both structured and unstructured, creating new “asset-customized” data aimed at achieving deeper patient behavioral learnings and insights.
Agile, insights-driven virtual/digital solutions. We believe our innovative digital solutions, underpinned by our unique combination of therapeutic and behavioral insights, position us to address the evolving market dynamics in which our customers operate. These solutions include:
|
|
• |
Decentralized Solutions is our clinical model that allows for configurable, decentralized trials using a patient-centric approach supported by Dynamic Assembly to move beyond traditional trial design. We partner with best of breed technology and data providers, including some of our own – and leverage our clinical and commercial insights, therapeutic expertise, and knowledge of the site and patient communities – to design solutions that best fit the needs of a particular customer and protocol. |
11
|
|
• |
Technology-enabled solutions. These solutions help to drive increased performance in areas like clinical trial diversity, clinical trial protocol insights, decentralized clinical trials, real world evidence generation, and omnichannel analytics. For example, Kinetic is designed to optimize HCP engagement and accelerate patient referrals into clinical trials through advanced targeting and digital capabilities. Kinetic is our modern customer engagement capability that integrates intelligence to accelerate impact and optimize commercial performance of customer brands. This omnichannel capability enables our field teams to transition to virtual and hybrid teams, while overlaying new digital capabilities. As adoption of telehealth and digital channels increases, a greater number of siloed and uncoordinated channels are touching HCPs. This leads to reduced effectiveness of commercial programs. Kinetic addresses this challenge by deploying advanced targeting, analytics, and the latest technologies – powered by a team of data scientists and behavioral experts – to create connected intelligence across channels, platforms, and content. The net result of Kinetic is optimized outcomes for our customers, leveraging the appropriate combination and timing of communications to drive improved brand performance. |
|
|
• |
Therapeutic expertise and organizational alignment. We believe our approach for aligning Clinical Solutions business units therapeutically, particularly local country team alignment of clinical research associates (“CRAs”) by therapeutic area, differentiates us from our competitors and has played a key role in our growth, ability to win new clinical trials, and the successful relationships we have developed with clinical research sites. Our therapeutic expertise is managed by our senior leadership and delivered by our senior scientific and medical staff. Looking ahead, we are strengthening our local country teams for effective employee engagement while maintaining our advantage of therapeutically aligning CRAs. We believe this “global to local” therapeutic approach improves the effectiveness and efficiency of our customers’ clinical trials by ensuring that our clinical staff working at our investigative sites have the therapeutic expertise and experience required to manage clinical trials. We also believe our specialized therapeutic expertise within our Commercial Solutions segment is unique in our industry and is becoming increasingly important to our customers as therapies become more complex and targeted. Our experienced medical and scientific professionals include more than 1,700 employees with M.D.s, Ph.D.s, or Pharm D.s. These employees apply innovative insights and science to clinical trials as well as to the commercialization of products and support customers across both our Clinical Solutions and Commercial Solutions segments. |
Industry-leading principal investigator and clinical research site relationships. We have extensive, often longstanding relationships with principal investigators and clinical research sites. We believe quality site relationships are critical for delivering clinical trial results on time and on budget for our customers. Motivated and engaged investigator sites can facilitate faster patient recruitment, increase retention, maintain safety, ensure compliance with protocols as well as with local and international regulations, and streamline reporting. We have dedicated personnel focused on enhancing clinical research site relationships. We work with these sites in collaborative partnerships to improve cycle times and standardize start-up activities to drive efficiency.
12
Diversified customer base with a growing number of preferred provider relationships. We have a customer base of over 800 customers that includes nearly all of the 50 largest global biopharmaceutical companies (based on annual investment in research and development). Additionally, our customer base is geographically diverse with well-established relationships in the United States (“U.S.”), Europe, and Asia. We have several customers with whom we have achieved “preferred provider” or strategic alliance relationships. We define these customers as relationships from which we generate significant revenue and where we have executed master service agreements in addition to regularly scheduled strategy meetings to discuss the status of our relationship, and for which we serve as a preferred supplier of services. We have also entered into strategic agreements with small to mid-sized (“SMID”) biopharmaceutical companies to develop their full portfolio of products from early clinical development through commercialization. We believe these relationships provide us enhanced opportunities for more business, although they are not a guarantee of future business. Our 2020 acquisition of Synteract further enhanced our leading position for serving customers across the SMID category, diversifying our customer base and expanding support to the high-growth emerging biopharmaceutical segment. We continue to experience strong SMID demand, as evidenced by double-digit growth in our request-for-proposal volumes in 2021 as compared to 2020.
Highly experienced management team with a successful track record of delivering growth. We have a dedicated executive management team with significant experience and knowledge focused on the biopharmaceutical industry. Each member of our leadership team has 15 years or more of experience, including experience with biopharmaceutical companies, payers, healthcare systems, and outsourced services providers. This team has successfully grown our company into a leading biopharmaceutical solutions organization through a combination of organic growth and strategic acquisitions.
Our Business Strategy
Our goal is to increase our market share and improve our market position. We believe our end-to-end product development model, where clinical insights inform commercialization and commercial insights improve clinical trial design and execution, is unique to the industry. The key elements of our business strategy include:
Further penetrate the large pharmaceutical market. We believe one of the largest opportunities to increase our market share and improve our market position is to further penetrate large pharmaceutical companies. Large pharmaceutical companies have increasingly focused on partnering with larger outsourcing vendors that offer a full suite of service capabilities. We have invested in expanding our global scale, breadth of services, and infrastructure to build up our service capabilities for this customer sector.
Continued penetration of the small and mid-sized biopharmaceutical market. We are a leader in the small and mid-sized biopharmaceutical market, which is the fastest growing segment of the market, and we believe there is further opportunity to grow this segment. Our 2020 acquisition of Synteract further enhanced our leading position for serving SMID customers, diversifying our customer base and expanding support to high-growth emerging biopharmaceutical companies. Small and mid-sized biopharmaceutical companies typically have fewer internal resources, less existing infrastructure, and less clinical development and commercialization experience. This customer segment is attracted to our full suite of clinical and commercialization services, our Syneos One® offering, our therapeutic expertise and organizational alignment down to the CRA level, and our Trusted Process® operating model.
13
Bring differentiated solutions to the market and increase cross-selling opportunities. We believe we are uniquely positioned to address our customers’ evolving needs as the only fully integrated provider of a full suite of services across the product development continuum. Our breadth of services enables us to provide customized solutions designed to successfully accelerate the time to market for our customers’ clinical or commercial projects. We believe sharing commercial insights during the early phases of clinical trials can lead to better informed decisions around clinical trial design and strategies. Similarly, we believe our therapeutic and clinical trial expertise can lead to improved decisions about regulatory and payer approvals, market access, reimbursement and formulary inclusion, field team development, and other steps that are critical to the commercial success of our customers.
We believe that we have substantial opportunities to expand the reach of services that we provide to our existing customers. Given our past success in expanding the scope of services provided to current customers, we intend to further expand our business with our existing customers by cross-selling additional clinical and commercial services.
Strengthen our geographic footprint. We have developed a global platform with a presence in all of the major biopharmaceutical markets and intend to further expand our business outside of the U.S., targeting regions where we are underpenetrated and that offer significant growth opportunities. We have expanded our capabilities, existing relationships, and local regulatory knowledge, which we believe will continue to position us well for new customer wins in a wide array of markets. We have added geographic reach through both acquisitions and organic growth in areas such as Asia-Pacific, Latin America, the Middle East and Africa, and Europe, which we believe is critical to obtaining business awards from large and mid-sized biopharmaceutical companies. We may also selectively identify and acquire complementary businesses to enhance our services, capabilities, and geographic presence.
Capitalize on industry trends favoring outsourcing. Our Clinical Solutions and Commercial Solutions segments are benefiting from specific industry trends that are expected to drive attractive growth rates. Global demand for biopharmaceutical products continues to increase, driven by expanding access to healthcare, increasing life expectancy, and the growing prevalence of chronic conditions in both developed and emerging markets. However, higher costs and increased complexity are driving our customers to seek efficiency and expertise through outsourcing services. We believe outsourcing both clinical development and commercialization services optimizes returns on invested R&D for biopharmaceutical companies. Further, as business models continue to evolve in the healthcare sector, we believe that the rate of commercial outsourcing may follow a similar long-term path as that of the clinical development market.
Drive acceleration of commercial outsourcing with our Syneos One® offering. We believe regulatory approval is only the first step towards a successful outcome, as our customers cannot earn a positive economic return for their asset until they achieve significant adoption in the commercial marketplace. We believe our Syneos One® offering is uniquely positioned to determine the appropriate mix of clinical and commercial solutions to help customers optimize the development process of their products and maximize the return on their investment. In addition, Syneos One® enables multiple selling points along the operational timeline of product development. The need for a full suite of product development services is particularly strong with our small to mid-sized customers in the near-term, given their increased access to funding to bring a product to the market coupled with their limited internal resources. Large biopharmaceutical companies may represent a long-term opportunity if market pressures to reduce fixed-cost infrastructures further intensify. Given our strong relationships in both customer segments and our breadth of services, including our focus on Medical Affairs, we believe we are well positioned to capitalize on the needs of both customer types.
14
Meet demand for comprehensive commercialization solutions. Customer preference and the complexity of product development in the modern market is creating increasing demand for a full-service experience for commercial customers. We believe a move to more integrated outsourcing will drive future growth and further diversify our revenue and backlog. This full-service model creates a collaborative relationship, allowing for solutions that incorporate data and insights to drive patient-centric approaches. This combination helps achieve the customer’s goal of maximizing product performance while diversifying our Commercial portfolio, which we believe can drive more predictable revenue.
Successfully acquire and integrate companies and evaluate and pursue other strategic initiatives to augment our organic growth. As part of our ongoing business strategy, we regularly evaluate new opportunities for growth through strategic initiatives, including potential acquisitions, investments, dispositions, or other transformative transactions.
We closed the following strategic acquisitions during 2021:
|
|
• |
StudyKIK, a leading clinical trial recruitment and retention company, expanding our portfolio of patient-direct, technology-enabled solutions. StudyKIK supports patient recruitment, patient retention, eConsent Solutions, Telemedicine Video Calling, and study companion mobile applications to expedite clinical trials, which we believe will result in benefits to customers including accelerated patient enrollment and retention, extensive patient population-based insights, improved site, sponsor, and physician experiences, and reduced patient burden. |
|
|
• |
RxDataScience, a specialist organization that helps biopharmaceutical customers solve challenging problems through advanced analytics, data management, and artificial intelligence. RxDataScience is well aligned to our lab to life model offering advanced analytic solutions across the entire product development spectrum from clinical through commercial. |
Over the past decade, we have developed a systematic approach for integrating strategic and tuck-in acquisitions. These acquisitions have enabled us to provide fully integrated clinical and commercial solutions and expand our global service offerings while also allowing us to achieve significant synergies and cost reductions. We intend to continue evaluating selective strategic growth opportunities that we believe will enhance our services offerings and geographic presence and thereby create value for our shareholders.
Continue to enhance our Trusted Process® methodology to deliver superior outcomes. We intend to continue the development and enhancement of our Trusted Process® methodology, which has delivered measurable, beneficial results for our customers and provides actionable data that can expedite drug development decisions. While originally developed through years of experience and refinement in our Clinical Solutions segment, we are proactively evaluating opportunities to also deploy the Trusted Process® within our RWLP, FSP360 and Syneos One® offerings and is being adapted and deployed as warranted across our commercial service portfolio to further drive efficiency, consistency, and quality in our integrated operations. We believe our Trusted Process® will continue to lead to high levels of customer satisfaction, particularly as we evolve to a product life cycle operating model.
15
Our Services
We provide services through two reportable segments: Clinical Solutions and Commercial Solutions. Each reportable segment provides multiple service offerings that – when combined through the sharing of critical insights and data – creates a fully-integrated biopharmaceutical outsourced services provider. Our Clinical Solutions segment offers a variety of clinical development services spanning Phase I to Phase IV, including full-service global studies, unbundled service offerings, and real world evidence studies. Our Commercial Solutions segment provides customers with the full range of commercialization solutions, which include specialized field teams, communications solutions (advertising, public relations, and medical communications), and consulting services.
Clinical Solutions
Our extensive range of clinical solutions supports the entire clinical development process from Phase I to Phase IV and allows us to offer our customers an integrated suite of investigative site support and clinical development services. We offer these services across a wide variety of therapeutic areas with deep clinical expertise for Phase I to Phase IV clinical trials. We have particular strengths in the complex therapeutic areas such as neuroscience and hematology/oncology with the latter representing the largest and fastest growing therapeutic area. We provide total biopharmaceutical program development through our full-service platform, while also providing discrete services for any part of a trial, primarily through our FSP360 group. The combination of service area experts and the depth of clinical capability allows for enhanced protocol design and actionable clinical trial data. Importantly, all of our services in Clinical Solutions operate with the discipline of the Trusted Process®. Our comprehensive suite of clinical development services and delivery platforms includes:
16
Full-service Clinical Development
Our full-service clinical development offering provides comprehensive solutions to address the clinical development needs of our customers for Phase I to Phase IV clinical trials. Our solutions can be delivered on a full-service project basis, on a functional or resource basis (see FSP360 below), or through a hybrid approach depending on the needs of our customers. We are able to customize our services to provide customers support within an individual clinical study, a single function, multiple functions within a single therapeutic area, or across a customer’s entire product portfolio. Our comprehensive suite of clinical development services includes the following, among others:
|
|
• |
Patient Recruitment and Retention. Our patient recruitment services group helps identify and manage appropriate vendors, focuses on patient recruitment and retention strategies by utilizing our patient-direct, technology-enabled solutions, and acts as a liaison to media outlets and other vendors. These services also provide significant value for patient engagement and long-term retention throughout the conduct of a trial. |
|
|
• |
Site Start-Up. Our site start-up team helps maximize the enrollment period of the study by arranging applicable regulatory authority and ethics committee approvals, site contract negotiations, regulatory authority submissions, and the corresponding oversight of those activities. |
|
|
• |
Project Management. Our project managers and directors provide customer-focused leadership in managing clinical trials and are accountable for the successful execution of all assigned projects, where success includes on-time, on-budget, and high quality results that lead to satisfied customers. Project managers and directors have the skills, education, experience, and training to support the successful conduct of clinical trials. |
|
|
• |
Clinical Monitoring. Our CRAs oversee the conduct of a clinical trial by working with and monitoring clinical research sites to ensure the quality of the clinical data being gathered by the sites. The clinical monitor ensures the clinical trial is conducted according to Good Clinical Practice (“GCP”), International Conference on Harmonisation (“ICH”) guidelines, and local regulations, to meet the customers’ and regulatory authorities’ requirements according to the study protocol. CRAs engage with clinical research sites in site initiation, training, and patient recruitment. We deploy and manage CRAs in all regions of the globe. |
|
|
• |
Decentralized Solutions. The COVID-19 pandemic has accelerated the adoption of remote engagement with sites and patients, creating increased demand for decentralized solutions capabilities, including the provision of mobile research nursing clinical trial services. This is an area we invested in both before and during the pandemic, allowing us to quickly respond to demand. Our approach brings together our experts, data, process, and technology to create fit-for-purpose solutions to address the nuances of each study. This approach delivers on our goal of achieving decentralized clinical trial operations supporting sites and patients, focused on patient recruitment and retention, engagement, improved access, and patient diversity. |
|
|
• |
Drug Safety/Pharmacovigilance. Our drug safety teams are strategically located across the U.S., Europe, Latin America, and Asia-Pacific. We provide global drug safety expertise in all phases of clinical research for serious adverse event/adverse event collection, evaluation, classification, reporting, reconciliation, post-marketing safety, and pharmacovigilance. |
17
|
|
• |
Quality Assurance. Quality control steps are built into all of our processes. We have an independent quality assurance department that, in addition to conducting independent audits of all ongoing projects and processes as part of our internal quality assurance program, offers quality assurance services to customers, including audits of clinical research sites and of various vendors to the clinical research industry, mock regulatory inspections and clinical research site inspection-readiness training, standard operating procedure development, and quality assurance program development/consultation. |
|
|
• |
Regulatory and Medical Writing. We offer regulatory and medical writing expertise across the entire biopharmaceutical product life cycle. Our team has hands-on regulatory and medical writing knowledge gained through experience from working in large biopharmaceutical companies, as well as high-growth, small and mid-sized biopharmaceutical companies, CROs, and the FDA. Additionally, each member is trained in FDA regulations, including GCP/standard operating practice compliance guidelines and guidelines established by the ICH. |
|
|
• |
Clinical Data Management. Our clinical data management services allow us to confirm that the clinical trial database is ready, accurately populated, and locked in an expeditious manner, with verification and validation procedures throughout every phase of a clinical trial. This processing is done in synchronization with the clinical team, utilizing the information provided from the clinical trial to help ensure efficient processes are employed, regardless of the data collection method used. |
|
|
• |
Electronic Data Capture. To compete in today’s changing global drug and device development environment, companies must collect and distribute data faster than ever. We have the ability to manage electronic data capture (“EDC”) systems and processes to help our customers take advantage of the efficiencies available through EDC, which include improved access to data, reduced cycle time, increased productivity, and improved relationships with customers, vendors, and other parties. |
|
|
• |
Biostatistics. Our biostatistics team has a depth of experience with the FDA and EMA that allows our teams to provide customers with guidance on building a statistical plan to meet regulatory and safety requirements as well as a careful analysis of the resulting study data. In addition, we provide support for independent drug safety monitoring boards and a full range of related services. Our biostatisticians are also heavily involved in our Trusted Process® methodology, so that protocol and project development can be grounded in advanced statistical methodology. As part of a project team, our biostatisticians can provide data oversight throughout a clinical trial and address any data or data handling issues that may arise. |
FSP360
Our FSP360 offering helps sponsors review their approach to key functional areas of clinical research, specifically those areas not core to their clinical development business or in areas where they need to augment internal resources. We are able to customize our full-service offering to provide customers support within an individual clinical study, a single function, multiple functions within a single therapeutic area, or across a customer’s entire product portfolio. Any of our full-service clinical solutions outlined above can be delivered on an unbundled or functional basis or on a hybrid approach, based on our customers’ specific needs. We currently operate FSP360 hubs in North America, South America, Europe, and Asia.
18
Early Phase
Our early phase offering provides a full range of services for Phase I to Phase IIA clinical trial conduct, bioanalytical assay development and analysis, targeted translational science offerings, and clinical pharmacology services, including modeling and simulation. We also provide validation and sample analysis services from pre-clinical development through post-marketing support and purpose-built early phase biometrics support from North America and India. We conduct clinical trial studies at our facilities located in Quebec City, Canada, and Miami, Florida. We have extensive experience in first-in-human, proof-of concept, bioequivalence and bioavailability, biosimilars, and clinical pharmacology study conduct. We collaborate with leading hospitals for the conduct of early development and clinical pharmacology studies that require access to patients. We have a large base of available subjects, including patient populations with specific medical conditions, and healthy volunteers, which provide efficient and rapid patient recruitment. Furthermore, we can also provide early stage and clinical pharmacology studies through our Asia-Pacific Catalyst Model with Phase I to Phase IIA conduct capabilities in Australia, New Zealand, South Korea, and Japan.
Our two bioanalytical laboratories located in Quebec City, Canada and Princeton, New Jersey have extensive experience in method development, validation, and bioanalytical analysis support for both small molecule therapeutics and biologics using a variety of analytical techniques and instrumentation platforms, as well as the provision of critical reagents handling services for biologics.
Real World Evidence and Late Phase Services
Our RWLP group conducts studies to understand how a treatment, service, or method of delivering care works when applied in real world, clinical practice environments. Because real world evidence (“RWE”) provides both clinical and commercial benefits, adding value for customers across the product life cycle, our end-to-end model position allows us to uniquely provide value to our customers in this space.
The market for these services is increasing as regulatory changes are encouraging the use of RWE and payers are demanding these outcomes. Customers are using RWE to supplement clinical efficacy and safety data, to build a value story and in designing and implementing a successful commercialization strategy. RWE shows relatively low levels of outsourcing penetration, offering a growth opportunity for us.
We provide both consultative and operational expertise to our customers in real world data generation, from concept through core development, launch, and commercialization. This is informed by our Dynamic Assembly platform, which allows us to expand our data access and analytic capabilities, enhancing our ability to help customers demonstrate product value. By utilizing our successful drug life cycle management, we ensure we partner with our customers to gain better outcomes for patients, physicians, payers, and regulators. These services allow our customers to make timely and cost-effective advances in clinical treatment by providing data about actual experience of doctors and patients outside of the regulated environment of clinical development. The data and insights from our experience across the commercialization spectrum inform the design and conduct of these studies. Our services include patient registries, surveillance and observational studies, patient/health outcomes research, and economic studies.
Commercial Solutions
Our Commercial Solutions segment provides a broad suite of complementary commercialization services including specialized field teams, communications solutions (advertising, public relations, and medical communications), and consulting services. Additionally, these capabilities provide behavioral and patient insights used by our Clinical Solutions segment to design smarter clinical trials and to accelerate patient recruitment. Our comprehensive capabilities portfolio also allows us to provide full-service commercialization. This integrated approach allows us to maximize product or portfolio performance for customers, by sharing insights and expertise across the integrated commercial outsourcing team.
19
These services are enhanced by our Kinetic offering, our modern customer engagement capability. We use an intelligent and data-enabled approach to digitally enhance our Commercial Solutions by understanding the audiences for our customers’ products, synchronizing their experiences across multiple personal and digital channels and decoding the performance of these interactions to adapt in real-time.
Deployment Solutions
Deployment Solutions include field-based promotional and market access solutions, field-based clinical solutions, inside sales and contact center, insight and strategy design, patient support services, training, talent sourcing, and end-to-end sales operations. We provide contract field promotion teams with a broad array of capabilities, support services, and non-personal engagement solutions including tele-detailing and electronic detailing (“e-detailing”). Our field-based promotional teams are supported by recruiting and training capabilities, clinical and scientific professionals who advocate for and inform markets of novel therapies, and our customized patient behavioral models built on our proprietary insights and data-driven analytics. Services offered include market research, commercial analytics, managed markets access, biotechnology and specialty managed markets, and full-service commercialization. Our field promotion teams can be supported by our communications and consulting services.
|
|
• |
Value Access and Medical Teams. We are a leading provider of outsourced Value Access and Medical Team solutions to the biopharmaceutical industry. Our Teams – consisting of Field Reimbursement and Market Access Specialists, Medical Science Liaisons (“MSLs”), Contract US Medical Directors, and/or Nurse Educators – educate healthcare professionals, patients, advocacy organizations, and others with evidence-based scientific and practical information about disease states, current treatments, reimbursement, access, and the use of customers’ products. |
|
|
• |
Promotional Field Teams and Support. We are an industry leader in providing scalable capabilities to recruit, train, target, deploy, and support successful biopharmaceutical sales teams. As one of the largest providers of outsourced sales teams and sales solutions to the healthcare industry, we have well-established flexible processes and infrastructure to efficiently build, scale, deploy, execute, and retain high-performing field sales teams. |
|
|
• |
Commercial Recruiting Solutions. We are a market leading recruiting partner to the commercial life science industry based on our experience, branding capabilities, talent assessment process, and our proprietary talent database of the top MSL, Nurse Educator, Sales, Sales Management, and Market Access performers. |
|
|
• |
Training and Learning Solutions. We are a full-service provider of practical, high-impact training solutions that combine assessment, instructional design expertise, delivery services, interactive technologies, and deep subject matter expertise to assist customers globally in achieving business results. |
|
|
• |
Operations Support Services. We offer comprehensive, best-in-class operations support services that include field automation hardware/software, data management, targeting and alignment, analytics and reporting, incentive plan design and implementation, quality management, and help desk. These capabilities are used both individually and collectively to ensure that our deployed field teams perform optimally, respond rapidly to changing marketplace dynamics, and continuously improve. |
|
|
• |
Digital Enhancement. Our Deployment Solutions offerings leverage Kinetic to enhance established relationships. The relationships between HCPs and our field representatives remain central to the customer experience. However, Kinetic allows us to create virtually-enabled representatives, especially important for continuity during the pandemic, while overlaying new digital capabilities to optimize brand performance. |
20
Communications Services
Our healthcare focused communications services offering provides advertising, public relations, interactive digital strategies, branding and identity consulting services, and medical communications and education services. These services are scalable, as we can support product commercialization both domestically and internationally. Communications services are deployed throughout a product’s existence, beginning well before commercial launch, encompassing regulatory approval and market introduction, and continuing throughout the life of a product.
|
|
• |
Healthcare Advertising. We are one of the largest independent global communications groups in the world. Our advertising teams are immersed in healthcare data and connected to frontline experts who help them delve deeply into the real-life experience of healthcare, harvesting insights to create optimal communications strategies. We help our customers navigate the most critical challenges in healthcare, including, but not limited to, brand launch, utilization of mass and personalized media, advertising content creation and campaigns, patient analysis, disease state campaigns, and market perception analysis. Our advertising teams have deep therapeutic expertise, with agencies solely dedicated to oncology, chronic disease care and activation, biologics, and industry innovation. |
|
|
• |
Public Relations. Our Public Relations teams develop creative campaigns grounded in deep customer insight and integrated under a multi-channel strategy. These programs raise awareness and produce meaningful, measurable behavior change among audiences. With a diverse set of healthcare communications specialties under one umbrella, we deliver integrated advice and expert insight from a variety of strategic perspectives. We offer best-in-class capabilities spanning public relations, digital and social media, medical and scientific education, and research and analytics. Our teams create communications that enhance brand perception, drive engagement, and activate behavior shifts. |
|
|
• |
Medical Communications. Medical Communications helps our customers to frame their product position in a way that clinicians will find relevant, and creates strategies, campaigns, and tactics to help these stakeholders at the right time, with the right content. Our Medical Communications team provides support through strategic planning, publication planning, content development, and peer-to-peer education. |
Consulting Services
Our consulting services support critical decision points during a biopharmaceutical product’s life cycle, from licensing, to product and portfolio strategy development, to drug commercialization. Consulting services include commercial strategy development and planning, pricing and market access, medical affairs advisory, quality management and regulatory advisory, and risk and program management. We offer specialized practices in business development, managed markets, and brand management, including strategic product launch planning. Consulting services teams generate insights and solutions developed from their deep, functional knowledge of our customers’ core business. These services are centered on maximizing the commercial value of a client’s product pipeline, helping clinical leaders better deploy strategic resources, improve efficiency, and enhance the effectiveness of marketing and sales activities. Our overall consulting services capabilities include the following:
|
|
• |
Commercial Strategy Development and Planning. Our strategic consulting group offers advisory services that include strategic drug development, clinical development plans, registration strategies, exit strategies, transitional clarity, good clinical practice compliance strategies, clinical operations optimization, pricing and reimbursement, and due diligence. |
21
|
|
• |
Pricing and Market Access. Our team offers a full spectrum of market access solutions and services, including market assessment and analysis, comparative effectiveness research, pricing reimbursement, patient assistance services, and legislative and regulatory analysis. |
|
|
• |
Medical Affairs Advisory. Our Medical Affairs Advisory team assesses where customers are in their medical transformation by helping them identify their competitive position, prioritize their needs, understand their brand perception, and inform their market engagement strategy. |
|
|
• |
Quality Management and Regulatory Compliance Advisory. Our quality and compliance team delivers independent quality management services through audit, inspection, and implementation services, and assists our customers with developing and executing a clinical regulatory strategy through our Regulatory Content and Submission Management Services. |
|
|
• |
Risk and Program Management. Our communications consultants provide advice and subject matter expertise for risk evaluation on medicine affordability, compassionate use, and litigation and access barriers. We provide an evidence-based approach to ensure policy, patient, and provider acceptance on price, use best practices for how life sciences companies can deploy effective preventative strategies, implement compliance strategies to prepare for expanded access and compassionate use inquiries, and execute an Institute for Clinical and Economic Review strategy to demonstrate product value. |
Customers
We have a well-diversified customer base of over 800 customers that includes nearly all of the world’s largest biopharmaceutical companies, which we define as the top 50 biopharmaceutical companies measured by annual R&D spend, as well as numerous emerging and specialty biotechnology companies, medical device and diagnostics companies. We are diversified across our segments, deriving 77% and 23% of our revenue during 2021 from our Clinical Solutions and Commercial Solutions segments, respectively.
For the year ended December 31, 2021, our revenue attributable to large biopharmaceutical companies represented approximately 49% of our total revenue and revenue attributable to small and mid-sized biopharmaceutical companies represented approximately 51%. Additionally, we serve customers in a variety of locations throughout the world, with approximately 60% of our 2021 revenue generated from work performed in the U.S. and Canada; 26% from Europe, the Middle East, and Africa; 11% from Asia-Pacific; and 3% from Latin America. This diversification allows us to grow our business in multiple customer segments and geographies.
Our top five customers accounted for approximately 22% of our revenue in 2021. Among the majority of our customers, revenue is diversified by multiple projects and services. We believe that the tenure of our customer relationships as well as the depth of penetration of our services reflects our strong reputation and track record. We believe we are uniquely positioned to further penetrate our existing customer base and expand our services across the biopharmaceutical industry, as a significant number of the top 50 biopharmaceutical companies utilize both our clinical and commercial services.
Sales and Marketing
Our global team of business development professionals and support staff identifies needs, designs solutions, and promotes our services to the biopharmaceutical, biotechnology, and medical device industries. In addition to significant customer engagement and development experience, many of these individuals have technical and scientific backgrounds.
22
Our business development organization works with our leadership team to identify, develop, and maintain key customer relationships in addition to new business development activities. Teams use an integrated, customer-focused approach to develop joint engagement plans for key accounts. For many of our largest customer relationships, dedicated strategic account management teams under our Global Client Solutions and Syneos One® groups provide account leadership to meet financial goals, align delivery with strategic goals, and promote innovation. These teams are directly accountable for gross business award growth in our largest accounts by creating a differentiated customer experience, which is a key aspect of our growth strategy to improve patient access to new medicines by unleashing the power of our product development mindset and approach that drives value for patients and our customers.
The global reach and strong operational experience of our business development personnel ensure project demands are fulfilled. In general, each business development employee is responsible for a specific customer segment and for strengthening and expanding customer relationships. Each individual is responsible for developing a customer base, responding to customer requests for information, developing and defending proposals, and presenting to customers.
Competition
We operate in a number of highly competitive markets. Our competitors include a variety of companies providing services to the biopharmaceutical industry, including large CROs and smaller specialty CROs, large global communications holding companies, smaller specialized communications agencies, contract sales organizations, and a wide range of consulting companies. Both of our reportable segments face distinct competitors within the markets they serve. Notwithstanding competitive factors, we believe that our deep therapeutic expertise, global reach, integrated model, and operational strengths differentiate us from our competitors across both of our segments.
Clinical Solutions
Our Clinical Solutions segment competes primarily against other full-service CROs and services provided by in-house R&D departments of biopharmaceutical companies, universities, and teaching hospitals. Although the CRO industry has experienced increased consolidation in the past several years, the landscape remains fragmented. We generally compete on the basis of the following factors:
|
|
• |
experience within specific therapeutic areas; |
|
|
• |
the quality and availability of staff and services; |
|
|
• |
the range of services provided; |
|
|
• |
the ability to recruit principal investigators and patients into studies expeditiously; |
|
|
• |
the ability to organize and manage large-scale, global clinical trials; |
|
|
• |
an international presence with strategically located facilities; |
|
|
• |
medical database management capabilities; |
|
|
• |
the ability to deploy and integrate IT systems to improve the efficiency of contract research; |
|
|
• |
experience with a particular customer; |
|
|
• |
the ability to form strategic partnerships; |
23
|
|
• |
speed to completion; |
|
|
• |
financial strength and stability; |
|
|
• |
price; and |
|
|
• |
overall value. |
Commercial Solutions
Our Commercial Solutions segment competes primarily against the in-house sales and marketing departments of biopharmaceutical companies, other contract pharmaceutical sales and service organizations, communications holding companies and specialized agencies, and consulting firms. We generally compete on the basis of the following factors:
|
|
• |
experience within the specific therapeutic area; |
|
|
• |
quality of the staff and services; |
|
|
• |
creativity of the proposed solution; |
|
|
• |
perceived “chemistry” with the staff to be deployed; |
|
|
• |
previous experience with a particular customer; |
|
|
• |
price; and |
|
|
• |
overall value. |
Government Regulation
The biopharmaceutical industry is subject to a high degree of governmental regulation in both domestic and international markets. Regardless of the country or region in which approval is being sought, before a marketing application for a drug is ready for submission to regulatory authorities, the candidate drug must undergo rigorous testing in pre-clinical studies and clinical trials. The clinical trial process must be conducted in accordance with the Federal Food, Drug and Cosmetic Act in the U.S. and similar laws and regulations in the relevant foreign jurisdictions (e.g., the European Union Clinical Trial Regulation). These laws and regulations require the candidate drug to be tested and studied in certain ways prior to submission for approval.
24
Regulation of Our Clinical Solutions Segment
In the U.S., the FDA regulates the conduct of clinical trials of drug products in human subjects, and the form and content of regulatory applications. The FDA also regulates the development, approval, manufacture, safety, labeling, storage, record keeping, import, export, distribution, advertising, sale, and marketing of drug products. The FDA has similar authority and similar requirements with respect to the clinical testing of biological products and medical devices. In the EU and other jurisdictions where our customers intend to apply for marketing authorization (of drug products) or seek certification (of medical devices), similar laws and regulations apply. Within the EU, these requirements are enforced by the EMA and competent authorities of the EU member states. Additional national requirements vary slightly from one member state to another. In Canada, clinical trials are regulated by the Health Products Food Branch of Health Canada as well as provincial regulations. Similar requirements also apply in other jurisdictions, including Australia, Japan, and other Asian countries, where we operate or where our customers intend to apply for marketing authorization. Sponsors of clinical trials also follow the International Council for Harmonisation (“ICH”) Good Clinical Practice (“GCP”) guidelines, which are enforced by the FDA and other comparable regulatory authorities, and may be amended from time to time.
Our services are subject to various regulatory requirements designed to ensure the quality and integrity of the clinical trial process. In the U.S., we must perform our clinical development services in compliance with applicable laws, rules and regulations, including GCP and Good Pharmacovigilance Practice, which govern, among other things, the design, conduct, performance, monitoring, auditing, recording, analysis, and reporting of clinical trials. Before a human clinical trial may begin, the manufacturer or sponsor of the investigational drug or biologic must file an investigational new drug application (“IND”) with the FDA, which contains, among other things, the results of pre-clinical tests, manufacturing information, and other analytical data. A separate submission to an existing IND must also be made for each successive clinical trial conducted during product development. Each clinical trial conducted in the U.S. must be conducted pursuant to, and in accordance with, an effective IND. In addition, under GCP regulations, each human clinical trial we conduct is subject to the oversight of an independent institutional review board (“IRB”) which is an independent committee that has the regulatory authority to review, approve and monitor a clinical trial. The FDA, the IRB, or the sponsor may suspend or terminate a clinical trial at any time on various grounds, including a finding that the study subjects are being exposed to an unacceptable health risk.
Clinical trials conducted outside the U.S. are subject to the laws and regulations of the country where the trials are conducted. These laws and regulations might not be similar to the laws and regulations administered by the FDA and other laws and regulations regarding the protection of patient safety and privacy and the control of study pharmaceuticals, medical devices or other study materials. Studies conducted outside the U.S. can also be subject to regulation by the FDA if the studies are conducted pursuant to an IND, or in the case of a medical device, an investigational device exemption. It is the responsibility of the study sponsor or the parties conducting the studies to ensure that all applicable legal and regulatory requirements are fulfilled.
In order to comply with GCP and other regulations, we must, among other things:
|
|
• |
comply with specific requirements governing the selection of qualified principal investigators and clinical research sites; |
|
|
• |
obtain specific written commitments from principal investigators; |
|
|
• |
obtain review, approval, and supervision of the clinical trials by an IRB or ethics committee; |
|
|
• |
obtain favorable opinion from regulatory agencies to commence a clinical trial; |
|
|
• |
verify that appropriate patient informed consents are obtained before the patient participates in a clinical trial; |
25
|
|
• |
ensure that adverse drug reactions resulting from the administration of a drug or biologic during a clinical trial are medically evaluated and reported in a timely manner; |
|
|
• |
monitor the validity and accuracy of data; |
|
|
• |
monitor drug, biologic or device accountability at clinical research sites; and |
|
|
• |
verify that principal investigators and study staff maintain records and reports and permit appropriate governmental authorities access to data for review. |
Similar regulations and guidelines exist in various states and in other countries. In the EU, similarly to the U.S., the various phases of non-clinical and clinical research are subject to significant regulatory controls. Clinical trials of medicinal products must be conducted in accordance with EU and national regulations and the ICH guidelines on GCP, as well as the applicable regulatory requirements and the ethical principles that have their origin in the Declaration of Helsinki. If the sponsor of a clinical trial is not established within the EU, it must appoint an EU entity to act as its legal representative.
The regulatory landscape related to clinical trials in the EU has been subject to recent changes. The EU Clinical Trials Regulation (“CTR”), which was adopted in April 2014 and repeals the EU Clinical Trials Directive, became applicable on January 31, 2022. Unlike directives, the CTR is directly applicable in all EU member states, as well as Norway, Liechtenstein and Iceland, without the need for member states to further implement it into national law. The CTR notably harmonizes the assessment and supervision processes for clinical trials throughout the EU via a Clinical Trials Information System, which contains a centralized EU portal and database.
The United Kingdom (“UK”) left the EU on January 31, 2020, following which existing EU medicinal product legislation continued to apply in the UK during the transition period under the terms of the EU-UK Withdrawal Agreement. As of January 1, 2021, the Medicines and Healthcare products Regulatory Agency (“MHRA”) is the UK’s standalone medicines and medical devices regulator. MHRA seeks to amend the UK Medical Devices Regulations 2002 (which are based on EU legislation), in particular to create new access pathways to support innovation, create an innovative framework for regulating software and artificial intelligence as medical devices, reform in vitro diagnostics regulation, and foster sustainability through the reuse and remanufacture of medical devices. The new regime is expected to come into force in July 2023, coinciding with the end of the acceptance period for EU CE marks in Great Britain, subject to appropriate transitional arrangements.
We may be subject to regulatory action if we fail to comply with applicable rules and regulations. Failure to comply with certain regulations can also result in the termination of ongoing research and disqualification of data collected during the clinical trials. For example, violations of GCP could result, depending on the nature of the violation and the type of product involved, in the issuance of a warning letter, suspension or termination of a clinical study, refusal of the FDA or other comparable regulatory authorities to approve clinical trial or marketing applications or withdrawal of such applications, injunction, seizure of investigational products, civil penalties, criminal prosecutions, or debarment from assisting in the submission of new drug applications. See Part I, Item 1A, “Risk Factors – Risks Related to Our Business – If we fail to perform our services in accordance with contractual requirements, regulatory requirements, and ethical considerations, we could be subject to significant costs or liability and our reputation could be harmed.”
We monitor our clinical trials to test for compliance with applicable laws and regulations in the U.S and the foreign jurisdictions in which we operate. We have adopted standard operating procedures that are designed to satisfy regulatory requirements and serve as a mechanism for controlling and enhancing the quality of our clinical trials. In the U.S. and in foreign jurisdictions where we operate, our procedures were developed to ensure compliance with GCP and associated guidelines.
26
In addition to its comprehensive regulation of safety in the workplace, the U.S. Occupational Safety and Health Administration has established extensive requirements relating to workplace safety for healthcare employers whose workers might be exposed to blood-borne pathogens such as HIV and the hepatitis virus. Furthermore, certain employees might have to receive initial and periodic training to ensure compliance with applicable hazardous materials regulations and health and safety guidelines. We are subject to similar regulations in Canada and Spain.
Regulation of Our Commercial Solutions Segment
The safety of medicines continues to be monitored after drug product approvals and throughout their use in healthcare practice. Post-marketing safety surveillance is therefore also subject to FDA regulations as well as the EU Pharmacovigilance Legislation and other countries’ regulations.
In addition, our field personnel are subject to all laws, rules and regulations governing the promotion of pharmaceutical products in the U.S. and in every other country where such personnel perform work. In particular, these rules and regulations include limitations on the indications for which a product may be promoted and on promotional spending. Additionally, these laws, rules and regulations govern the manner in which the product may be promoted, and the scientific exchange of information related to the product. Violations of these rules may leave us at risk of direct regulatory enforcement action and/or cause us to be in breach of contract with our customers.
Some of our field personnel handle and distribute samples of pharmaceutical products. In the U.S., the handling and distribution of prescription drug product samples are subject to regulation under the Prescription Drug Marketing Act and other applicable federal, state and local laws and regulations and other countries may have similar laws or regulations. These laws and regulations regulate the distribution of drug samples by mandating procedures for storage and record-keeping requirements for drug samples and ban the purchase or sale of drug samples. Further, we must comply with the requirements of the U.S. Drug Enforcement Administration, which regulates the distribution, record-keeping, handling, security, and disposal of controlled substances.
Our communications solutions offerings are subject to all regulatory risks applicable to similar communications businesses as well as risks that relate specifically to the provision of these services to the biopharmaceutical industry. Such regulatory risks include enforcement by the FDA and the Federal Trade Commission in the U.S., Health Canada, the Department of Health in the UK, competent authorities of the EU member states, as well as state agencies and other foreign regulators enforcing laws relating to product advertising, false advertising, and unfair and deceptive trade practices. In addition to enforcement actions initiated by government agencies, there has been an increasing tendency in the U.S. and in foreign jurisdictions among biopharmaceutical companies to resort to the courts and industry and self-regulatory bodies to challenge comparative prescription drug advertising on the grounds that the advertising is false and deceptive. There continues to be an expansion of specific rules, prohibitions, media restrictions, labeling disclosures, and warning requirements with respect to the advertising for certain products.
27
Data Protection Regulation
We are subject to data protection laws and regulations in the countries in which we operate that address the privacy, security and other processing of personal information. These laws and regulations govern the collection, use, handling and disclosure of health-related and other personal information and require that we adopt and maintain reasonable and appropriate security measures that are designed to protect the confidentiality, integrity and availability of the information. These laws and regulations also typically require the adoption and maintenance of procedures that facilitate the exercise of an individual’s rights with respect to the information about them. Certain of these laws may also contain requirements relating to the location of the personal information, or the transfer of personal information from one country or region to other countries. Examples of data protection laws and regulations to which we may be subject include Canada’s Personal Information Protection and Electronic Documents Act, the EU’s General Data Protection Regulation (“GDPR”), and the California Consumer Privacy Act (“CCPA”). For additional information regarding these laws and regulations and their potential impacts on our business, see Part I, Item 1A, “Risk Factors – Risks Related to Our Business – Current and proposed laws and regulations regarding the protection of personal data could result in increased risks of liability or increased cost to us or could limit our service offerings.”
Intellectual Property
We develop and use a number of proprietary methodologies, analytics, systems, technologies, and other intellectual property in the conduct of our business. We rely upon a combination of confidentiality policies, nondisclosure agreements, and other contractual arrangements to protect our trade secrets, and patent, copyright and trademark laws to protect other intellectual property rights. We have obtained or applied for patents, trademarks and copyright protection in the U.S. and in a number of foreign countries. Our material trademarks include Trusted Process®, PlanActivation®, QuickStart®, ProgramAccelerate®, QualityFinish®, Shortening the distance from lab to life®, Syneos One®, Biopharmaceutical Acceleration Model®, Dynamic Assembly®, KineticTM, Syneos Health, and other corporate emblems. Although the duration of our intellectual property rights varies from country to country, trademarks generally may be renewed indefinitely so long as they are in use and/or their registrations are properly maintained, and so long as they have not been found to have become generic. Although we believe that the ownership of trademarks is an important factor in our business and that our success does depend in part on the ownership thereof, we rely primarily on the innovative skills, technical competence, and marketing abilities of our employees. We do not have any material patents, licenses, franchises, or concessions.
Human Capital Resources
As of December 31, 2021, we had 27,525 employees. Of these, 26,751 employees were regular and 774 were temporary. An additional 610 contingent workers provided services for us.
Our Culture and Values. Our culture is the cornerstone of all our human capital programs. Our shared purpose, Shortening the Distance from Lab to Life®, aligns our employees and the customers we serve. This purpose is surrounded by three agile-oriented values, designed to foster innovation, including Challenge the Status Quo, Collaborate to Deliver Solutions, and Passionate to Change Lives. We work hard and smart to speed much-needed therapies to those who need them most. This environment is fueled by a belief in caring for our collective well-being, which we refer to as Total Self. This belief enables employees to be their authentic selves at work, fostering a diverse, equitable, and inclusive culture where employees are empowered.
28
Safety and Health. The safety, health, and welfare of our employees are paramount to us. We work closely with our customers and regulatory agencies to continuously monitor our employees’ working conditions and implement measures to ensure their wellness. During 2021, in response to the ongoing COVID‑19 pandemic, we continued extensive safety measures to protect our employees, enabling the organization to continue to work with customers pursuing innovative ways to get effective therapies to patients as quickly as possible. These efforts included a U.S. employee vaccination mandate, adherence to stringent safety protocols for employees working at clinical study sites, and compliance with local government regulations. These efforts were further supported by extensive internal and external CEO-led communications supported by our medical community, making all stakeholders aware of the precautions taken to protect the health and safety of our employees and their families, our customers, patients, and communities.
Diversity, Equity, and Inclusion (“DE&I”). We strive to lead our industry in our DE&I efforts both internally and externally. We believe that addressing complex healthcare challenges requires contributions from diverse viewpoints and an inclusive, equitable space where our employees are able to succeed to their highest potential. We strive to foster a work environment that includes and embraces racial, ethnic, and gender diversity and other individual differences. Our policies prohibit unlawful discrimination based on race, color, creed, gender, religion, marital status, age, national origin or ancestry, genetic information, physical or mental disability, medical condition, sexual orientation, gender expression or identity, or any other characteristic protected by applicable law. The emphasis placed on DE&I by the Company and by our Board of Directors (the “Board”) is demonstrated by the inclusion of DE&I updates and metrics in the materials for each meeting of the Compensation and Management Development Committee of the Board. In addition, we have also created an external DE&I Advisory Council where we provide our clients with top-tier expertise to navigate corporate and healthcare initiatives.
As of December 31, 2021, 68% of our total workforce were women. Additionally, 56% of our management roles at Director level and above and 69% of our new hires in 2021 were women. Throughout 2021, 33% of our new hires in the U.S. were minorities. Our DE&I strategy is enabled by our DE&I Council, which was established in 2020, led by an executive leadership team member and comprised of leadership who represent and/or have oversight of our global, regionally diverse workforce. The Council oversees and strategically plans for diversity and inclusion within our Company under three pillars of focus: People, Customer, and Community.
Throughout 2021, we grew our existing Employee Resource Groups (“ERGs”) across the globe: Women, Veterans, LGBTQIA+ and Black. We also formed three new ERGs: Asian, People with Disabilities, and Developing Professionals. These ERGs further honor and support our inclusive environment of Total Self through building and supporting internal communities. We also have several development programs dedicated to women and minority representation in leadership, including actively partnering with the Healthcare Businesswomen’s Association, partnering with McKinsey Leadership programs targeting our underrepresented leadership populations, and establishing mentoring programs within our ERGs. We have a zero-tolerance policy on discrimination and harassment and have several programs under which employees can report incidents confidentially or anonymously and without fear of reprisal.
Recruitment, Retention and Development. The primary ways we recruit and retain employees are by (1) ensuring that our compensation and benefits are competitive in our industry and in local labor markets, (2) ensuring our leadership and development programs support our culture and values while preparing people for the future, and (3) maintaining an effective service delivery model conducive to work-life balance and employee needs.
Our Global Talent Acquisition Team leverages numerous resources including industry networks, online and social media platforms, university relations, and industry-focused career events to source talent for open positions. Candidates are thoroughly screened and evaluated against job-specific skills, experience, and education criteria. We continuously work at improving our candidate experience, which has been recognized seven years in a row with a North American Candidate Experience (“CandE”) Award, awarded by the Talent Board for excellence in Talent Acquisition.
29
In early 2021 we dedicated a small group of professionals, reporting to the Chief Human Resources Officer and the Chief Development Officer & Global Head Clinical Development Solutions, to focus on increased demand for clinical resources with an ultimate focus on our talent acquisition and retention strategies. This small and impactful team, called Enabling our Talent Advantage, or “ETA” is imbedded in the business and Human Resources (“HR”) organizations and focuses on talent optimization. Going beyond simply hiring replacements and additions, this team works with business leaders and our HR Centers of Excellence to refine policies, practices, and procedures to make it easier to join, work, and stay at Syneos Health. Examples of ETA initiatives include improving our internal mobility policy, developing feeder pools for key roles in support of our early talent strategy, and developing a line manager curriculum to better and more simply equip managers to support our workforce.
We regularly evaluate our compensation and benefit programs using external market data and feedback from our Global Talent Acquisition Team and have established processes to make necessary revisions. Our Total Rewards Team introduced a new global salary structure to drive consistent enterprise-wide compensation and job level practices, ensuring our compensation remains competitive in the many countries in which our employees reside.
Developing Our People for Current and Future Success. We are a continuous learning organization, listening to employees at all levels – particularly at key moments that matter – and harvesting actionable insights to shape the employee experience. Key elements of our listening strategy include purposeful pulse surveys designed to check on key audiences at key moments. Overall, our listening includes our employee engagement survey and regular employee life cycle surveys, including onboarding (following the first week and at 90 days of employment) and exit surveys. Ultimately, we leverage these insights to better enable our employee programs and services.
We offer extensive, award-winning training programs that provide regulatory, business, foreign language, and management training and other opportunities for professional and personal development. As part of our empowered employee experience, we offer a suite of tools to assist employees to proactively own their careers and aim to reach their highest professional potential. These opportunities include a mix of company-wide, role-based or business-specific individualized courses and programs to drive career development. As an organization with solutions spanning Clinical and Commercial as well as numerous corporate functions, we encourage internal mobility to support retention.
Ensuring Competence and Qualification. Syneos Health is the only organization to have achieved the prestigious and internationally recognized Silver Workforce Accreditation from the International Accrediting Organization for Clinical Research in 2020. We offer credentialed, competency-based training programs for clinical monitoring employees to provide customers and investors with confidence that our CRAs are trained to a high standard. Credentials are available at all levels, including entry level (CRA I), intermediate (CRA II), and advanced (Senior CRAs).
Specific training highlights for 2021 include the design of our Business Leader Program, built by some of our leaders for fellow senior leaders across the Company. The program lasts six months and features executive coaching, customized simulation trainings, cohort leader labs, and assessments against a newly developed Syneos Health Great Leader profile. Our Great Leader profile attracts, retains, and develops diverse talent, creates and maintains strong customer relationships, instills a sense of ownership and accountability, leads using a growth and enterprise mindset, and balances strategic thinking with execution.
30
Our pipeline leadership programs for aspiring, first-line, experienced, and senior managers now center around our Great Leader profile and these programs cover every step in a manager’s journey. These programs are accessible to all employees to develop and enhance their leadership skills and are purposely designed to support each person to meet their unique development and career needs. One of our values is “Collaborate to Deliver Solutions,” which encourages employees to learn from the expertise of their peers and to share knowledge and experience with colleagues using self-service coaching and mentoring, utilizing software to support mentoring and innovative reverse mentoring programs.
Indemnification and Insurance
In conjunction with our Clinical Solutions services, we employ or contract with research institutions and, in some jurisdictions, principal investigators and pharmacies on behalf of biopharmaceutical companies to serve as research centers and principal investigators in conducting clinical trials to test new candidate drugs on human volunteers. Such testing creates the risk of liability for personal injury or death of volunteers, particularly to volunteers with life-threatening illnesses, resulting from adverse reactions to the candidate drugs administered. It is possible that we could be held liable for claims and expenses arising from any professional malpractice of the principal investigators with whom we contract or engage, or in the event of personal injury to or death of persons participating in clinical trials. In addition, as a result of our operation of Phase I clinical trial facilities, we could be liable for the general risks associated with clinical trials including, but not limited to, adverse events resulting from the administration of candidate drugs to clinical trial participants or the professional malpractice of medical care providers. We also could be held liable for errors or omissions in connection with the services we perform through each of our service groups. For example, we could be held liable for errors, omissions, or breach of contract, if monitoring obligations have been transferred to us and one of our CRA’s inaccurately reports from source documents or fails to adequately monitor a human clinical trial resulting in inaccurately recorded results.
We have sought to reduce our risks by implementing the following where practicable:
|
|
• |
securing contractual assurances such as indemnification provisions and provisions seeking to limit or exclude liability contained in our contracts with customers, institutions, pharmacies, vendors and principal investigators; |
|
|
• |
securing contractual and other assurances that adequate insurance will be maintained to the extent applicable by customers, institutions, pharmacies, vendors, principal investigators and us; and |
|
|
• |
complying with various regulatory requirements, including monitoring that the oversight of independent review boards and ethics committees are intact where obligations are transferred to us and monitoring the oversight of the procurement by the principal investigator of each participant’s informed consent to participate in the study. |
Our contractual indemnifications generally do not fully protect us against certain of our own actions, such as negligence. Contractual arrangements are subject to negotiation with customers, and the terms and scope of any indemnification, limitation of liability or exclusion of liability varies from customer to customer and from clinical trial to clinical trial. Additionally, financial performance of these indemnities is not secured. Therefore, we bear the risk that any indemnifying party against which we have claims may not have the financial ability to fulfill its indemnification obligations to us.
31
While we maintain a global insurance program including professional liability and other types of insurance standard to our industry to cover our liability while conducting our business activities and contracted services, including drug safety issues as well as data processing and other errors and omissions, it is possible that we could become subject to claims not covered by insurance or that exceed our coverage limits. We could be materially and adversely affected if we were required to pay damages or bear the costs of defending any claim that is outside the scope of, or in excess of, a contractual indemnification provision, beyond the level of insurance coverage or not covered by insurance, or in the event that an indemnifying party does not fulfill its indemnification obligations.
Information about our Executive Officers
The following table sets forth information concerning our executive officers:
|
Name |
|
Age |
|
|
Position |
|
|
Alistair Macdonald |
|
|
52 |
|
|
Chief Executive Officer and Director |
|
Jason Meggs |
|
|
46 |
|
|
Chief Financial Officer |
|
Michael Brooks |
|
|
48 |
|
|
Chief Development Officer & Global Head Clinical Development Solutions |
|
Michelle Keefe |
|
|
55 |
|
|
President, Medical Affairs & Commercial Solutions |
|
Jonathan Olefson |
|
|
46 |
|
|
General Counsel and Corporate Secretary |
The following is a biographical summary of the experience of our executive officers:
Alistair Macdonald – Chief Executive Officer and Director
Alistair Macdonald has been our Chief Executive Officer (“CEO”) and a member of the Board since October 2016. He joined our Company in May 2002 and has served in various senior leadership roles during that time. Prior to his current role, Mr. Macdonald most recently served as President and Chief Operating Officer from January 2015 to September 2016 and Chief Operating Officer from January 2013 to January 2015. He also served as our President, Clinical Development Services from March 2012 to January 2013, Executive Vice President of our Global Oncology Unit from February 2011 to March 2012, Executive Vice President, Strategic Development from October 2009 to February 2011, and Senior Vice President, Biometrics from May 2002 to September 2009. He also previously served as the Chairman of the Board for the Association of Clinical Research Organizations (ACRO). He received his Master of Science in Environmental Diagnostics from Cranfield University. We believe Mr. Macdonald brings to our Board valuable perspective and experience as our Chief Executive Officer, and as a former Chief Operating Officer of our Company, as well as extensive knowledge of the CRO and biopharmaceutical industries, all of which qualify him to serve as one of our directors.
Jason Meggs – Chief Financial Officer
Jason Meggs was appointed our Chief Financial Officer (“CFO”) in May 2018 after serving as Executive Vice President and Interim CFO beginning in February 2018. Prior to his appointment to this role, he served as our Executive Vice President and CFO of the Commercial Solutions segment from August 2017 to February 2018. He also previously served as our Executive Vice President, Oncology Operations from January 2017 to August 2017 and our Senior Vice President, Business Finance from 2014 to 2016. Prior to joining Syneos Health, Mr. Meggs was Global Vice President, Internal Audit, at Quintiles Transnational Corporation, a leading global CRO, from 2013 to 2014 and held a number of finance roles at Quintiles from 2005 to 2013. He began his career as an auditor with Deloitte & Touche LLP and Arthur Anderson LLP, and is a certified public accountant. He also previously served as the Treasurer for the ACRO. He received his Bachelor of Science in Business Administration with a Major in Accounting from Western Carolina University.
32
Michael Brooks – Chief Development Officer & Global Head Clinical Development Solutions
Michael Brooks was appointed our Chief Development Officer & Global Head Clinical Development Solutions in November 2021 after serving as Chief Development Officer beginning in July 2021. Prior to joining Syneos Health, Mr. Brooks held multiple leadership roles at LabCorp (Covance), a leading global CRO. From November 2019 to November 2020, Mr. Brooks served as President & Global Head, Clinical Development & Commercialization Services and from December 2018 to November 2019 as Chief Diagnostics Operations Excellence Officer. Prior to joining LabCorp, Mr. Brooks held various leadership positions at PRA Health Sciences from February 2015 to November 2018. He received his Bachelor of Science in Biological Sciences from North Carolina State University (“NCSU”) and is currently a member of the NCSU College of Sciences Foundation Board of Directors.
Michelle Keefe – President, Medical Affairs & Commercial Solutions
Michelle Keefe has been our President, Medical Affairs & Commercial Solutions since November 2021, and previously served as our President, Commercial Solutions since December 2017. Prior to joining Syneos Health, Ms. Keefe spent six years at the Publicis Groupe, a communications holding company, taking on roles of increasing responsibility culminating as a group president in the Publicis Health Division from February 2012 to December 2017. From January 2015 to April 2016, Ms. Keefe was President and CEO of Publicis Touchpoint Solutions. From May 2016 to November 2017, Ms. Keefe was Group President at Publicis Health. Ms. Keefe broadened her healthcare experience by joining the Visiting Nurse Service of New York (“VNSNY”), the largest not for profit homecare business in the U.S., from 2010 to 2012 where she was the VP of market development. Prior to joining the VNSNY, Ms. Keefe spent 22 years rising through the ranks at Pfizer, a global pharmaceutical corporation, in a variety of sales, marketing and general management roles, culminating as a Regional President. Ms. Keefe received her Bachelor of Science in Marketing from Seton Hall University.
Jonathan Olefson – General Counsel and Corporate Secretary
Jonathan Olefson has been our General Counsel and Corporate Secretary since November 2018. Prior to joining Syneos Health, Mr. Olefson was Senior Vice President, General Counsel and Secretary at Cotiviti Holdings, Inc., a healthcare analytics firm, from October 2013 to October 2018. Prior to that, Mr. Olefson spent nine years in senior legal and compliance roles at Cognizant Technology Solutions, a multinational information technology and consulting services firm, most recently as Vice President and General Counsel (Corporate, M&A and Intellectual Property). Mr. Olefson received his Bachelor of Arts degree from Emory University and his J.D. from The George Washington University Law School, graduating with honors.
Available Information
Our website address is syneoshealth.com. Information on our website is not incorporated by reference herein. Copies of our annual reports on Form 10-K, quarterly reports on Form 10-Q, current reports on Form 8-K and our proxy statements for our annual stockholders meetings, and any amendments to those reports, as well as Section 16 reports filed by our insiders, are available free of charge on our website as soon as reasonably practicable after we file the reports with, or furnish the reports to, the Securities and Exchange Commission (the “SEC”).
33
Item 1A. Risk Factors.
We operate in a rapidly changing environment that involves a number of risks, some of which are beyond our control. In evaluating our company, you should consider carefully the risks and uncertainties described below together with the other information included in this Annual Report on Form 10-K, including our consolidated financial statements and related notes included in Part II, Item 8, “Financial Statements and Supplementary Data” in this Annual Report on Form 10-K. The occurrence of any of the following risks may materially and adversely affect our business, financial condition, results of operations and future prospects.
Risks Related to Our Business
The COVID-19 pandemic and associated economic repercussions have adversely impacted our business and results of operations, and are expected to continue to do so.
The ongoing COVID-19 pandemic and associated economic repercussions have significantly impacted, and are expected to continue to impact, our business and our operations. With the spread of COVID-19 variants, the ongoing impacts of the COVID-19 pandemic could continue to adversely impact our business and results of operations in a number of ways, including but not limited to:
|
|
• |
delays or difficulties in commencing new and operating ongoing clinical trials, including intermittent challenges accessing investigative sites, delays in enrolling patients, delays in obtaining approvals from regulatory authorities, and difficulty obtaining necessary pharmaceutical products and supplies; |
|
|
• |
restrictions on the ability of our field teams to visit HCPs and difficulty securing appropriate PPE and COVID-19 testing and other tools required for client-facing engagements and visits to sites/HCPs; |
|
|
• |
diversion of healthcare resources away from the conduct of clinical trials, including the diversion of hospitals serving as our clinical trial sites and hospital staff supporting the conduct of our clinical trials, as well as the reduction of our customers’ operating budgets; |
|
|
• |
interruption of key clinical trial activities, such as clinical trial site data monitoring, due to social distancing requirements, COVID-19 quarantine and isolation protocols or interruption of clinical trial subject visits and study procedures, which may impact the collection and integrity of study data and ability to measure clinical trial endpoints; |
|
|
• |
business disruptions at our customers; |
|
|
• |
limitations on our employee resources, including because of COVID-19 quarantine and isolation protocols, sickness of employees or their families or the desire of employees to avoid contact with large groups of people; |
|
|
• |
diversion of management resources to focus on mitigating the impacts of the COVID-19 pandemic; and |
|
|
• |
impacts from prolonged remote work arrangements, such as strains on our business continuity plans, cybersecurity risks, and inability of certain employees to perform their work remotely. |
34
These and other impacts of the COVID-19 pandemic could also have the effect of heightening many of the other risk factors included below in this Item 1A. The ultimate impact depends on the severity and duration of the COVID-19 pandemic, including the emergence and spread of COVID-19 variants, the continued availability and effectiveness of vaccines and treatments, and actions taken by governmental authorities and other third parties in response to the pandemic, each of which is uncertain, rapidly changing and difficult to predict. Any of these disruptions could adversely impact our business and results of operations. In addition, the continued prevalence of COVID-19 has led to disruption and volatility in the global capital markets, which increases the cost of, and adversely impacts access to, capital and increases economic uncertainty. This volatility and uncertainty has adversely affected our stock price, and may again adversely affect our stock price in the future.
If we do not generate a large number of new business awards, or if new business awards are delayed, terminated, reduced in scope, or fail to go to contract, our business, financial condition, results of operations, or cash flows may be materially adversely affected.
Our business is dependent on our ability to generate new business awards from new and existing customers and maintain existing customer contracts. Our inability to generate new business awards on a timely basis and subsequently enter into contracts for such awards could have a material adverse effect on our business, financial condition, results of operations or cash flows.
There is risk of cancelability in both the clinical and commercial businesses. The time between when a clinical study is awarded and when it goes to contract is typically several months, and prior to a new business award going to contract, our customer can cancel the award without notice. Once an award goes to contract, the majority of our customers can terminate the contract without cause with a notice period that generally ranges from 30 to 90 days. Our contracts may be delayed or terminated by our customers or reduced in scope for a variety of reasons beyond our control, including but not limited to:
|
|
• |
decisions to forego or terminate a particular trial; |
|
|
• |
budgetary limits or changing priorities; |
|
|
• |
actions by regulatory authorities; |
|
|
• |
production problems resulting in shortages of the candidate drug being tested; |
|
|
• |
failure of products being tested to satisfy safety requirements or efficacy criteria; |
|
|
• |
unexpected or undesired clinical results for products; |
|
|
• |
insufficient patient enrollment in a trial; |
|
|
• |
insufficient principal investigator recruitment; |
|
|
• |
production problems resulting in shortages of the product being tested; |
|
|
• |
the customers’ decision to terminate or scale back the development or commercialization of a product or to end a particular project; |
|
|
• |
shift of business to a competitor or internal resources; or |
|
|
• |
product withdrawal following market launch. |
35
Our commercial services contracts typically have a significantly shorter wind down period than clinical contracts, particularly within our Deployment Solutions offerings. Furthermore, many of our communications services and consulting services projects are tied to a customer’s annual marketing budget or ad hoc service requests, which can lead to seasonal variability in revenue and less predictability in future revenues. In addition, many of our biopharmaceutical Deployment Solutions service contracts provide our customers with the opportunity to internalize the resources provided under the contract and terminate all or a portion of the services we provide under the contract. Our customers may also decide to shift their business to a competitor. Each of these factors results in less visibility to future revenues and may result in high volatility in future revenues.
Contract terminations, delays and modifications are a regular part of our business across each of our segments. For example, our full-service offering within our Clinical Solutions business has been, and may continue to be, negatively impacted by project delays, which impact near term revenue disproportionately. In addition, project delays, downsizings and cancellations, particularly within our Deployment Solutions and communications offerings, which are part of our Commercial Solutions business, have impacted our results in the past and might impact them in the future. The loss, reduction in scope or delay of a large project or of multiple projects could have a material adverse effect on our business, results of operations, and financial condition. In addition, we might not realize the full benefits of our backlog if our customers cancel, delay, or reduce their commitments to us.
In the event of termination, our contracts often provide for fees for winding down the project, which include both fees incurred and actual and non-cancellable expenditures and may include a fee to cover a percentage of the remaining professional fees on the project. These fees might not be sufficient for us to maintain our margins, and termination may result in lower resource utilization rates and therefore lower operating margins. In addition, cancellation of a contract or project for the reasons noted above may result in the unwillingness or inability of our customer to satisfy its existing obligations to us such as payments of accounts receivable, which may in turn result in a material impact to our results of operations and cash flow. Historically, cancellations and delays have negatively impacted our operating results, and they might again. In addition, we might not realize the full benefits of our backlog if our customers cancel, delay, or reduce their commitments to us, which may occur if, among other things, a customer decides to shift its business to a competitor or revoke our status as a preferred provider. Thus, the loss or delay of a large business award or the loss or delay of multiple awards could adversely affect our revenues and profitability. Additionally, a change in the timing of a new business award could affect the period over which we recognize revenue and reduce our revenue in any one quarter.
Our backlog might not be indicative of our future revenues, and we might not realize all of the anticipated future revenue reflected in our backlog.
Our backlog consists of anticipated revenue awarded from contract and pre-contract commitments that are supported by written communications. Once work begins on a project, revenue is recognized over the duration of the project, provided the award has gone to contract. Projects may be canceled or delayed by the customer or delayed by regulatory authorities for reasons beyond our control. To the extent projects are delayed, the timing of our revenue could be adversely affected. In addition, if a customer terminates a contract, we typically would be entitled to receive payment for all services performed up to the termination date and subsequent customer-authorized services related to terminating the canceled project. Typically, however, we have no contractual right to the full amount of the future revenue reflected in our backlog in the event of a contract termination or subsequent changes in scope that reduce the value of the contract. The duration of the projects included in our backlog, and the related revenue recognition, typically range from a few months to several years. Our backlog might not be indicative of our future revenues, and we might not realize all the anticipated future revenue reflected in that backlog. A number of factors may affect backlog, including:
|
|
• |
the size, complexity, and duration of projects or strategic relationships; |
36
|
|
• |
the cancellation or delay of projects; |
|
|
• |
the failure of one or more business awards to go to contract; and |
|
|
• |
changes in the scope of work during the course of projects. |
The rate at which our backlog converts to revenue may vary over time. The revenue recognition on larger, more global projects could be slower than on smaller, more regional projects for a variety of reasons, including, but not limited to, an extended period of negotiation between the time the project is awarded to us and the actual execution of the contract, as well as an increased time frame for obtaining the necessary regulatory approvals.
Our backlog as of December 31, 2021 was $11.43 billion. Although an increase in backlog will generally result in an increase in revenues over time, an increase in backlog at a particular point in time does not necessarily correspond directly to an increase in revenues during any particular period, or at all. The extent to which contracts in backlog will result in revenue depends on many factors, including, but not limited to, delivery against project schedules, scope changes, contract terminations and the nature, duration, and complexity of the contracts, and can vary significantly over time.
Our operating results have historically fluctuated between fiscal quarters and may continue to fluctuate in the future, which may adversely affect the market price of our stock.
Our operating results have fluctuated in previous quarters and years and may continue to vary significantly from quarter to quarter and are influenced by a variety of factors, such as:
|
|
• |
timing of contract amendments for changes in scope that could affect the value of a contract and potentially impact the amount of net new business awards and revenue from quarter to quarter; |
|
|
• |
commencement, completion, execution, postponement, or termination of large contracts; |
|
|
• |
contract terms for the recognition of revenue milestones; |
|
|
• |
progress of ongoing contracts and retention of customers; |
|
|
• |
timing of and charges associated with completion of acquisitions, integration of acquired businesses, and other events; |
|
|
• |
changes in the mix of services delivered, both in terms of geography and type of services; |
|
|
• |
potential customer disputes, penalties or other issues that may impact the revenue we are able to recognize, or the collectability of our related accounts receivable; and |
|
|
• |
exchange rate fluctuations. |
Our operating results for any particular quarter are not necessarily a meaningful indicator of future results and fluctuations in our quarterly operating results could negatively affect the market price and liquidity of our stock.
37
If we underprice our contracts, overrun our cost estimates, or fail to receive approval for or experience delays in documentation of change orders, our business, financial condition, results of operations, or cash flows may be materially adversely affected.
We price our contracts based on assumptions regarding the scope of work required and cost to complete the work. We bear the financial risk if we initially underprice our contracts or otherwise overrun our cost estimates, which could adversely affect our cash flows and financial performance. In addition, contracts with our customers are subject to change orders, which occur when the scope of work we perform needs to be modified from that originally contemplated in our contract with the customers. This can occur, for example, when there is a change in a key study assumption or parameter or a significant change in timing. We may be unable to successfully negotiate changes in scope or change orders on a timely basis or at all, which could require us to incur cost outlays ahead of the receipt of any additional revenue. In addition, under generally accepted accounting principles in the United States of America (“GAAP”) we cannot recognize additional revenue anticipated from change orders until appropriate documentation is received by us from the customer authorizing the change. However, if we incur additional expense in anticipation of receipt of that documentation, we must recognize the expense as incurred. Any of the foregoing could have a material adverse effect on our business, financial condition, results of operations or cash flows.
Our business depends on the continued effectiveness and availability of our information systems, including the information systems we use to provide services to our customers and to store employee data, and failures of these systems may materially limit our operations or have an adverse effect on our reputation.
Our information systems consist of systems we have purchased or developed, legacy information systems from organizations we have acquired and, increasingly, web-enabled and other integrated information systems. In using these information systems, we frequently rely on third-party vendors to provide hosting and system management services, where our infrastructure is dependent upon the reliability of their underlying platforms, facilities, and communications systems. We also utilize integrated information systems that we provide customers access to or install for our customers in conjunction with our delivery of services.
As the breadth and complexity of our information systems continue to grow, we will increasingly be exposed to the risks inherent in maintaining the stability of our legacy systems due to prior customization, attrition of employees or vendors involved in their development, and obsolescence of the underlying technology, as well as risks from the increasing number and scope of external data breaches on multi-national companies. Because certain customers, clinical trials, and other long-term projects depend upon these legacy systems, we also face an increased level of embedded risk in maintaining the legacy systems and limited options to mitigate such risk. We are also exposed to risks associated with the availability of all our information systems, including:
|
|
• |
disruption, impairment or failure of data centers, telecommunications facilities or other key infrastructure platforms, including those maintained by our third-party vendors; |
|
|
• |
security breaches of, cyber-attacks on, and other failures or malfunctions in our internal systems, including our employee data and communications, critical application systems or their associated hardware, software, and databases; |
|
|
• |
excessive costs, excessive delays, or other deficiencies in systems development and deployment; and |
|
|
• |
potential for encryption based “Ransomware” attacks that could hinder our ability to access our systems and data until we are able to recover from backups. |
38
In addition to these availability risks, due to the interconnectedness of IT systems across platforms and hosts, we could see disruptions to our systems as “collateral damage” from attacks targeting our connected partners.
The materialization of any of these risks may impede the processing of data, the delivery of databases and services, and the day-to-day management of our business and could result in the corruption, loss or unauthorized disclosure of proprietary, confidential, or other data. In addition, a security breach could require that we expend substantial additional resources related to the security of our technical infrastructure, databases and services, diverting resources from other projects and disrupting our business. Despite any precautions we take, damage from fire, floods, hurricanes, power loss, telecommunications failures, computer viruses, break-ins, and similar events at our various computer facilities or those of our third-party vendors could result in interruptions in the flow of data to us and from us to our customers.
Corruption or loss of data may result in the need to repeat a project at no cost to the customer, but at significant cost to us, the termination of a contract, civil or criminal enforcement actions and penalties, or damage to our reputation. Additionally, significant delays in system enhancements or inadequate performance of new or upgraded systems once completed could damage our reputation and harm our business. Finally, long-term disruptions in the infrastructure caused by events such as natural disasters, the outbreak of war, the escalation of hostilities and acts of terrorism, particularly involving cities in which we have offices, and cyber-attacks such as those recently faced by other multi-national companies could adversely affect our businesses. As our business continues to expand globally, these types of risks may be further increased by instability in the geopolitical climate of certain regions, underdeveloped and less stable utilities and communications infrastructure, and other local and regional factors. Although we carry property, cyber incident, and business interruption insurance that we believe is customary for our industry, our coverage might not be adequate to compensate us for all losses that may occur.
We have been and expect that we will continue to be subject to attempts to gain unauthorized access to or through our information systems or those we internally or externally develop for our customers. In addition, we may be susceptible to physical or computer-based attacks by terrorists, nation states, or hackers due to our role in the biopharmaceutical service industry. Bad actors may be motivated by a desire to access or steal our or our clients’ intellectual property. These concerns about security are increased when information is transmitted over the Internet. In response to the COVID-19 pandemic, more of our employees are working remotely, which may increase the risk of such attacks. If such attacks are not detected immediately, their effect could be compounded. To date these attacks have not had a material impact on our operations or financial results. However, successful attacks in the future could result in negative publicity, significant remediation and recovery costs, legal liability and damage to our reputation and could have a material adverse effect on our financial condition, results of operations, and cash flows. In addition, our liability insurance might not be sufficient in type or amount to cover us against claims related to security breaches, cyber-attacks and other related breaches.
Additionally, we rely on service providers for the timely transmission of information across our global data network. If a service provider fails to provide the communications capacity or services we require for similar reasons, the failure could interrupt our services. Because of the centrality of our processing systems to our business, any interruption or degradation could adversely affect the perception of our brands’ reliability and harm our business. If a service provider experiences the unauthorized disclosure of sensitive or confidential data they are processing on our behalf, whether through systems failure or employee actions, cyber-attacks, fraud, or misappropriation, it could damage our reputation and cause us to lose customers. Similarly, such disclosure could result in negative publicity, significant remediation and recovery costs, legal liability and damage to our reputation, and could have a material adverse effect on our financial condition, results of operations, and cash flows. In addition, contractual indemnity, the service provider’s liability insurance and our liability insurance might not be sufficient in type or amount to cover us against claims related to security breaches, cyber-attacks, and other related breaches.
39
Our customer or therapeutic area concentration may have a material adverse effect on our business, financial condition, results of operations or cash flows.
If any large customer decreases or terminates its relationship with us, our business, financial condition, results of operations or cash flows could be materially adversely affected. For the year ended December 31, 2021, our top ten customers based on revenue accounted for approximately 36% of our consolidated revenue and our top ten Clinical Solutions customers based on backlog accounted for approximately 45% of our total backlog. No single customer accounted for greater than 10% of our total consolidated revenue for the years ended December 31, 2021, 2020, and 2019. It is possible that an even greater portion of our revenues will be attributable to a smaller number of customers in the future, including as a result of our entering into strategic provider relationships with customers. Also, consolidation in our potential customer base results in increased competition for important market segments and fewer available customer accounts.
Additionally, conducting multiple clinical trials for different sponsors in a single therapeutic class involving drugs with the same or similar chemical action may adversely affect our business if some or all of the trials are canceled because of new scientific information or regulatory judgments that affect the drugs as a class.
Similarly, marketing and selling products for different sponsors with similar drug action subjects us to risk if new scientific information or regulatory judgment prejudices the products as a class, leading to compelled or voluntary prescription limitations or withdrawal of some or all of the products from the market.
Our business is subject to international economic, political and other risks that could have a material adverse effect on our business, financial condition, results of operations, cash flows or reputation.
We have operations in many foreign countries, including, but not limited to, countries in the Asia-Pacific region, Europe, Latin America and the Middle East and Africa. As of December 31, 2021, approximately 58% of our workforce was located outside of the U.S., and for the fiscal year ended December 31, 2021, approximately 43% of our revenue was earned from work performed outside of the U.S. Our international operations are subject to risks and uncertainties inherent in operating in these regions, including:
|
|
• |
conducting a single project across multiple countries is complex, and issues in one country, such as a failure to comply with or unanticipated changes to local regulations, or restrictions such as restrictions on import or export of clinical trial material or availability of clinical trial data may affect the progress of the clinical trial in the other countries, resulting in delays or potential termination of contracts, which in turn may result in loss of revenue; |
|
|
• |
the U.S. or other countries could enact legislation or impose regulations or other restrictions, including unfavorable labor regulations, tax policies, data protection regulations or economic sanctions, which could have an adverse effect on our ability to conduct business in or expatriate profits from the countries in which we operate; |
|
|
• |
the U.S. has previously enacted and it or other countries may in the future enact legislation that limits or prohibits the use of foreign manufactured equipment or supplies, such as the Uyghur Forced Labor Prevention Act, which imposes a ban on virtually all imports from the Xinjiang region of China unless companies are able to prove that the products were not made with forced labor, which could have an adverse effect on our ability to conduct business; |
40
|
|
• |
foreign countries are expanding or may expand their banking regulations that govern international currency transactions, particularly cross-border transfers, which may inhibit our ability to transfer funds into or within a jurisdiction, impeding our ability to pay our principal investigators, vendors and employees, thereby impacting our ability to conduct trials in such jurisdictions; |
|
|
• |
foreign countries are expanding or may expand their regulatory framework with respect to patient informed consent, protection and compensation in clinical trials, or transparency reporting requirements (similar to the Physician Payments Sunshine Act in the U.S.), which could delay, inhibit or prohibit our ability to conduct projects in such jurisdictions; |
|
|
• |
the regulatory or judicial authorities of foreign countries might not enforce legal rights and recognize business procedures in a manner in which we are accustomed or would reasonably expect; |
|
|
• |
changes in political and economic conditions, including the UK’s withdrawal from the European Union and the policies of the current U.S. presidential administration, may lead to changes in the business environment in which we operate, as well as changes in inflation and foreign currency exchange rates; |
|
|
• |
potential violations of applicable anti-bribery/anti-corruption laws, including the U.S. Foreign Corrupt Practices Act (“FCPA”) and the UK Bribery Act of 2010, may cause a material adverse effect on our business, financial condition, results of operations, cash flows, or reputation; |
|
|
• |
customers in foreign jurisdictions may have longer payment cycles, and it may be more difficult to collect receivables in those jurisdictions; |
|
|
• |
natural disasters, pandemics, or international conflict, including terrorist acts, could interrupt our services, endanger our personnel, or cause project delays or loss of clinical trial materials or results; |
|
|
• |
political unrest, such as the current situation with Ukraine and Russia, could delay or disrupt the ability to conduct clinical trials or other business, and if such political unrest escalates or spills over to or otherwise impacts additional regions it could heighten many of the other risk factors included in this Item 1A; and |
|
|
• |
foreign governments may enact currency exchange controls that may limit the ability to fund our operations or significantly increase the cost of maintaining operations. |
These risks and uncertainties could negatively impact our ability to, among other things, perform large, global projects for our customers. Furthermore, our ability to deal with these issues could be affected by applicable U.S. laws. Any such risks could have an adverse impact on our business, financial condition, results of operations, cash flows, or reputation.
41
Governmental authorities may question our intercompany transfer pricing policies or change their laws in a manner that could increase our effective tax rate or otherwise harm our business.
As a U.S. company doing business in international markets through subsidiaries, we are subject to foreign tax and intercompany pricing laws, including those relating to the flow of funds between legal entities in various international jurisdictions. Tax authorities in the U.S. and in international markets have the right to examine our corporate structure and how we account for intercompany fund transfers. If such authorities challenge our corporate structure, transfer pricing mechanisms or intercompany transfers and the resulting assessments are upheld, our operations may be negatively impacted, and our effective tax rate may increase. Tax rates vary from country to country and if a tax authority determines that our profits in one jurisdiction should be increased, we might not be able to realize the full tax benefits in the event we cannot utilize all foreign tax credits that are generated, or we do not realize a compensating offsetting adjustment in another taxing jurisdiction. The effects of either would increase our effective tax rate. Additionally, the Organization for Economic Cooperation and Development has issued certain guidelines regarding base erosion and profit shifting. As these guidelines continue to be formally adopted by separate taxing jurisdictions, we may need to change our approach to intercompany transfer pricing in order to maintain compliance under the new guidelines. Our effective tax rate may increase or decrease depending on the current location of global operations at the time of the change. Finally, we might not always be in compliance with all applicable customs, exchange control, Value Added Tax, and transfer pricing laws despite our efforts to be aware of and to comply with such laws. If these laws change we may need to adjust our operating procedures and our business could be adversely affected.
If we are unable to successfully increase our market share, our ability to grow our business and execute our growth strategies could be materially adversely affected.
A key element of our growth strategy is increasing our market share within the biopharmaceutical services market, the clinical development market and in the geographic markets in which we operate. In addition, we continue to invest in expanding new services such as our medical affairs offerings and technology-enabled solutions. As we grow our market share within the biopharmaceutical services and clinical development markets and make investments in growing our newer service offerings, we might not have or adequately build the competencies necessary to perform our services satisfactorily or may face increased competition. If we are unable to succeed in increasing our market share or realize the benefits of our investments in our new service offerings, we may be unable to implement this element of our growth strategy, and our ability to grow our business or maintain our operating margins could be adversely affected.
Upgrading the information systems that support our operating processes and evolving the technology platform for our services pose risks to our business.
Continued efficient operation of our business requires that we implement standardized global business processes and evolve our information systems to enable this implementation, especially in the course of integrating acquired businesses into our company. We have continued to undertake significant programs to optimize business processes with respect to our services. Our inability to effectively manage the implementation of new information systems or upgrades and adapt to new processes designed into these new or upgraded systems in a timely and cost-effective manner may result in disruption to our business and negatively affect our operations.
42
We have entered into agreements with certain vendors to provide systems development, integration, and hosting services that develop or license to us the information technology (“IT”) platforms and capacity for programs to optimize our business processes. If such vendors or their products fail to perform as required or if there are substantial delays in developing, implementing, securing, and updating our IT platforms, our customer delivery may be impaired, and we may have to make substantial further investments, internally or with third parties, to achieve our objectives. For example, we rely on an external vendor to provide the clinical trial management software used in managing the completion of our customer clinical trials. If that externally provided system is not properly maintained we might not be able to meet the obligations of our contracts or may need to incur significant costs to replace the system or capability. Additionally, our progress may be limited by parties with existing or claimed patents who seek to enjoin us from using preferred technology or seek license payments from us.
Meeting our objectives is dependent on a number of factors which might not take place as we anticipate, including obtaining adequate technology-enabled services, depending upon our third-party vendors to develop and enhance existing applications to adequately support our business, creating IT-enabled services that our customers will find desirable, and implementing our business model with respect to these services. Also, increased IT-related expenditures and our potential inability to anticipate increases in service costs may negatively impact our business, financial condition, results of operations, or cash flows.
If we fail to perform our services in accordance with contractual requirements, regulatory requirements, and ethical considerations, we could be subject to significant costs or liability and our reputation could be harmed.
We contract with biopharmaceutical companies to perform a wide range of services to assist them in bringing new drugs to market and to support the commercial activity of products already in the marketplace. Our services include monitoring clinical trials, data and laboratory analysis, electronic data capture, patient recruitment, product launch consulting, Deployment Solutions, advertising, publications, and medical communications, and other related services. Such services are complex and subject to contractual requirements, regulatory standards, and ethical considerations. For example, we must adhere to applicable regulatory requirements such as those required by the FDA, the European Medicines Agency and the competent authorities of the member states of the European Union (“EU”), and the Medicines and Healthcare Products Regulatory Agency (“MHRA”) in the UK, including those laws and regulations governing the promotion, sales, and marketing of biopharmaceutical products, and Good Clinical Practice (“GCP”) requirements, which govern, among other things, the design, conduct, performance, monitoring, auditing, recording, analysis, and reporting of clinical trials. Once initiated, clinical trials must be conducted pursuant to and in accordance with the applicable investigational new drug application or clinical trial application, the requirements of the relevant institutional review boards or ethics committees, and GCP regulations. We are also subject to regulation by the Drug Enforcement Administration (“DEA”) which regulates the distribution, recordkeeping, handling, security, and disposal of controlled substances. If we fail to perform our services in accordance with these requirements, regulatory agencies may take action against us or our customers. Such actions may include sanctions such as injunctions or failure of such regulatory authorities to grant marketing approval of products, imposition of clinical holds or delays, suspension or withdrawal of approvals, rejection of data collected in our studies, license revocation, product seizures or recalls, operational restrictions, civil or criminal penalties or prosecutions, damages, or fines. Additionally, there is a risk that actions by regulatory authorities, if they result in significant inspectional observations or other measures, could harm our reputation and cause customers not to award us future contracts or to cancel existing contracts. Customers may also bring claims against us for breach of our contractual obligations, and patients in the clinical trials and patients taking drugs approved on the basis of those trials may bring personal injury claims against us. Any such action could have a material adverse effect on our business, financial condition, results of operations, cash flows, or reputation.
43
Such consequences could arise if, among other things, the following occur:
Improper performance of our services. The performance of our clinical development and other biopharmaceutical services is complex and time-consuming. For example, we may make mistakes in conducting a clinical trial that could negatively impact or obviate the usefulness of the clinical trial or cause the results of the clinical trial to be reported improperly. If the clinical trial results are compromised, we could be subject to significant costs or liability, which could have an adverse impact on our ability to perform our services and our reputation could be harmed. For example:
|
|
• |
non-compliance generally could result in the termination of ongoing clinical trials or the disqualification of data for submission to regulatory authorities; |
|
|
• |
compromise of data from a particular trial, such as failure to verify that adequate informed consent was obtained from subjects or improper monitoring of data, could require us to repeat the clinical trial under the terms of our contract at no further cost to our customer, but at a substantial cost to us; and |
|
|
• |
breach of a contractual term could result in liability for damages or termination of the contract. |
Large clinical trials can cost hundreds of millions of dollars and improper performance of our services could have a material adverse effect on our financial condition, damage our reputation, and result in the termination of current contracts or failure to obtain future contracts from the affected customer or other customers.
Interactive Voice/Web Response Technology malfunction. We develop, maintain, and use third-party computer-based interactive voice/web response systems to automatically manage the randomization of patients in a given clinical trial to different treatment arms and regulate the supply of investigational drugs, all by means of interactive voice/web response systems. An error in the design, programming, or validation of these systems could lead to inappropriate assignment or dosing of patients which could give rise to patient safety issues, invalidation of the trial, or liability claims against us. Furthermore, negative publicity associated with such a malfunction could have an adverse effect on our business and reputation. Additionally, errors in randomization may require us to repeat the clinical trial at no further cost to our customer, but at a substantial cost to us.
Investigation of customers. From time to time, one or more of our customers are audited or investigated by regulatory authorities or enforcement agencies with respect to regulatory compliance of their clinical trials, programs, or the marketing and sale of their drugs. In these situations, we have often provided services to our customers with respect to the clinical trials, programs, or activities being audited or investigated, and we are called upon to respond to requests for information by the authorities and agencies. There is a risk that either our customers or regulatory authorities could claim that we performed our services improperly or that we are responsible for clinical trial or program compliance. If our customers or regulatory authorities make such claims against us and prove them, we could be subject to damages, fines, or penalties. In addition, negative publicity regarding regulatory compliance of our customers’ clinical trials, programs, or drugs could have an adverse effect on our business and reputation.
Insufficient customer funding to complete a clinical trial. As noted above, clinical trials can cost hundreds of millions of dollars. There is a risk that we may initiate a clinical trial for a customer, and then the customer becomes unwilling or unable to fund the completion of the trial. In such a situation, notwithstanding the customer’s ability or willingness to pay for or otherwise facilitate the completion of the trial, we may be ethically bound to complete or wind down the clinical trial at our own expense.
44
In addition to the above U.S. laws and regulations, we must comply with the laws of all countries where we do business, including laws governing clinical trials in the jurisdiction where the trials are performed. Failure to comply with applicable requirements could subject us to regulatory risk, liability, and potential costs associated with redoing the trials, which could damage our reputation and adversely affect our operating results.
The operation of our early phase (Phase I and IIA) clinical facilities and the services we provide there as well as our clinical trial management, including direct interaction with clinical trial patients or volunteers, and our mobile research nursing clinical trial services, could create potential liability that may adversely affect our business, financial condition, results of operations, cash flows, and reputation.
We operate facilities where early phase clinical trials are conducted, which ordinarily involve testing an investigational drug on a limited number of individuals to evaluate a product’s safety, determine a safe dosage range and identify side effects. Additionally, our business involves clinical trial management, which is one of our clinical development service offerings, and includes the testing of investigational drugs on human volunteers. Some of these trials involve the administration of investigational drugs to known substance abusers or volunteers and patients that are already seriously ill and are at risk for further illness or death. Failure to operate any of our early phase facilities in accordance with applicable regulations could result in that facility being shut down, which could disrupt our operations and adversely affect our business, financial condition, results of operations, cash flows, and reputation.
Additionally, we face risks resulting from the administration of drugs to volunteers, including adverse events, and the professional malpractice of medical care providers, including improper administration of a drug or device. We also directly employ doctors, nurses, and other trained employees who assist in implementing the testing involved in our clinical trials, such as drawing blood from healthy volunteers. Our mobile research nurses engage in a wide range of services, from observing clinical trial participants ingesting drugs, to administering an infusion of oncology medicine to a pediatric study participant. Our exposure with respect to these activities could exceed any contractual limits on indemnification in our contracts with customers and vendors. Any professional malpractice or negligence by such doctors, nurses, principal investigators, or other employees could potentially result in liability to us in the event of personal injury to or death of a volunteer in clinical trials. This liability, particularly if it were to exceed the limits of any indemnification agreements and insurance coverage we may have, may adversely affect our business and financial condition, results of operations, cash flows, and reputation.
If we are unable to attract suitable principal investigators and recruit and enroll patients for clinical trials, our clinical development business might suffer.
The recruitment of principal investigators and patients for clinical trials is essential to our business. Principal investigators are typically located at hospitals, clinics, or other sites and supervise the administration of the investigational drug to patients during the course of a clinical trial. Patients generally include people from the communities in which the clinical trials are conducted. Several of our competitors have purchased site networks or site management organizations as a strategy for priority access to a specific site, which could put us at a competitive disadvantage. Our clinical development business could be adversely affected if we are unable to attract suitable and willing principal investigators or recruit and enroll patients for clinical trials on a consistent basis. The expanding global nature of clinical trials increases the risk associated with attracting suitable principal investigators and patients, especially if these trials are conducted in regions where our resources or experience may be more limited. For example, if we are unable to engage principal investigators to conduct clinical trials as planned or enroll sufficient patients in clinical trials, we might need to expend additional funds to obtain access to more principal investigators and patients than planned or else be compelled to delay or modify the clinical trial plans, which may result in additional costs to us or cancellation of the clinical trial by our customer. If realized, these risks may also inhibit our ability to attract new business, particularly in certain regions.
45
Our business could result in liability to us if a drug causes harm to a patient. While we are generally indemnified and insured against such risks, we may still suffer financial losses.
When we market drugs under contract for a biopharmaceutical company, we could suffer liability for harm allegedly caused by those drugs, either as a result of a lawsuit against the biopharmaceutical company to which we are joined, a lawsuit naming us or any of our subsidiaries, or an action launched by a regulatory body. Any claim could result in potential liability for us if the claim is outside the scope of the indemnification agreement we have with the biopharmaceutical company, the biopharmaceutical company does not abide by the indemnification agreement as required, or the liability exceeds the amount of any applicable indemnification limits or available insurance coverage. Such a result could have an adverse impact on our financial condition, results of operations, cash flows, and reputation. Furthermore, negative publicity associated with harm caused by drugs we helped to market could have an adverse effect on our business and reputation.
If we lose the services of key personnel or are unable to recruit experienced personnel, our business, financial condition, results of operations, cash flows, or reputation could be materially adversely affected.
Our success substantially depends on the collective performance, contributions, and expertise of our senior management team and other key personnel including qualified management, professional, scientific, and technical operating staff, and business development personnel, particularly as we integrate acquired businesses into our company. There is significant competition for qualified personnel, particularly those with higher educational degrees, in the biopharmaceutical and related services industries. For the year ended December 31, 2021, we experienced increased employee turnover and challenges due to the current industry-wide labor shortage and resulting competition to retain and attract qualified personnel. In addition, the close proximity of some of our facilities to offices of our major competitors could adversely impact our ability to successfully recruit and retain key personnel. The departure of any key executive, or our inability to continue to identify, attract and retain qualified personnel or replace any departed personnel in a timely fashion, might impact our ability to grow our business and compete effectively in our industry and might negatively affect our business, financial condition, results of operations, cash flows, or reputation.
Foreign currency exchange rate fluctuations may have a material adverse effect on our financial condition, results of operations, and cash flows.
Approximately 19% of our revenue for the year ended December 31, 2021 was denominated in currencies other than the U.S. dollar and 35% of our direct and operating costs are incurred in countries with functional currencies other than the U.S. dollar. Our financial statements are reported in U.S. dollars and changes in foreign currency exchange rates could significantly affect our financial condition, results of operations, or cash flows. Our primary exposure to fluctuations in foreign currency exchange rates is related to the following risks:
Foreign Currency Risk from Differences in Customer Contract Currency and Operating Costs Currency. The majority of our global contracts are denominated in U.S. dollars or Euros while our operating costs in foreign countries are denominated in various local currencies. Fluctuations in the exchange rates of the currencies we use to contract with our customers and the currencies in which we incur cost to fulfill those contracts can have a significant impact on our results of operations.
Foreign Currency Translation Risk. The revenue and expenses of our international operations are generally denominated in local currencies and translated into U.S. dollars for financial reporting purposes. Accordingly, exchange rate fluctuations between the value of the U.S. dollar versus local currencies will affect the U.S. dollar value of our foreign currency denominated revenue, costs, and results of operations.
46
Foreign Currency Transaction Risk. We earn revenue from our service contracts over a period of several months and, in many cases, over several years, resulting in timing differences between the consummation and cash settlement of a transaction. Accordingly, profitability of the transactions denominated in foreign currencies is subject to effects of fluctuations in foreign currency exchange rates during the period of time between the consummation and cash settlement of a transaction.
We may seek to limit our exposure to these risks through inclusion of foreign currency exchange rate provisions in our service contracts, and/or by hedging certain exposures with foreign exchange derivative instruments. These measures, however, might not offset or mitigate any, or all, of the adverse financial effects of unfavorable movements in foreign currency exchange rates.
Unfavorable economic conditions have previously and could in the future have a material adverse effect on our business, financial condition, results of operations, or cash flows.
Unfavorable economic conditions and other adverse macroeconomic factors on global and domestic markets have previously and may in the future result, among other matters, in tightening in the credit and capital markets, high levels of inflation, low liquidity, and volatility in fixed income, credit, currency, and equity markets. Such conditions have and could in the future have a negative effect on our business, financial condition, results of operations, or cash flows. For example, our customers might not be able to raise money to conduct existing clinical trials, or to fund new drug development and related future clinical trials. Resource-sharing customers may also scale back commercial support for their products. In addition, economic or market disruptions could negatively impact our vendors, contractors, or principal investigators which might have a negative effect on our business.
Our effective income tax rate may fluctuate, which may adversely affect our results of operations.
Our effective income tax rate is influenced by our profitability in the various taxing jurisdictions in which we operate. Changes in the distribution of profits and losses among taxing jurisdictions may have a significant impact on our effective income tax rate, which in turn could have an adverse effect on our results of operations. Factors that may affect our effective income tax rate include, but are not limited to:
|
|
• |
jurisdictional earnings; |
|
|
• |
the repatriation of foreign earnings to the U.S.; |
|
|
• |
uncertain tax positions; |
|
|
• |
changes in tax laws in various taxing jurisdictions, including interpretations of regulations related to the Tax Cuts and Jobs Act; |
|
|
• |
audits by taxing authorities; |
|
|
• |
the establishment of valuation allowances against deferred income tax assets if we determine that it is more likely than not that future income tax benefits will not be realized; |
|
|
• |
the release of a previously established valuation allowances against deferred income tax assets if we determine that it is more likely than not that future income tax benefits will be realized; |
|
|
• |
changes in the relative mix and size of clinical studies in various tax jurisdictions; and |
|
|
• |
the timing and amount of the vesting and exercising of share-based compensation. |
47
These changes may cause fluctuations in our effective income tax rate that could adversely affect our results of operations and cause fluctuations in our earnings and earnings per share.
We have only a limited ability to protect our intellectual property rights, and these rights are important to our success.
We develop, use, and protect our proprietary methodologies, analytics, systems, technologies, and other intellectual property. Existing laws of the various countries in which we provide services or solutions offer only limited protection of our intellectual property rights, and the protection in some countries may be very limited. We rely upon a combination of trade secrets, confidentiality policies, nondisclosure agreements, and other contractual arrangements, as well as patent, copyright and trademark laws, to protect our intellectual property rights. These laws are subject to change at any time and certain agreements might not be fully enforceable, which could further restrict our ability to protect our innovations. Our intellectual property rights might not prevent competitors from independently developing services similar to or duplicative of ours or alleging infringement of their intellectual property rights in certain jurisdictions. The steps we take in this regard might not be adequate to prevent or deter infringement or misappropriation of our intellectual property or claims against us for alleged infringement or misappropriation by competitors, former employees, or other third parties. Furthermore, we might not be able to detect unauthorized use of, or take appropriate and timely steps to enforce, our intellectual property rights. Enforcing our rights might also require considerable time, money, and oversight, and we might not be successful in enforcing our rights.
Our acquisition strategy may present additional risks, including the risk that we may be unable to fully realize the competitive and operating synergies projected to be achieved through any specific acquisition.
We have historically grown our business both organically and through acquisitions. We have and will continue to assess the need and opportunity to offer additional services through acquisitions of other companies. Acquisitions involve numerous risks, including the following:
|
|
• |
ability to identify suitable acquisition opportunities or obtain any necessary financing on commercially acceptable terms; |
|
|
• |
increased risk to our financial position and liquidity through changes to our capital structure and assumption of acquired liabilities, including any indebtedness incurred to finance the acquisitions and related interest expense; |
|
|
• |
diversion of management’s attention from normal daily operations of the business; |
|
|
• |
insufficient revenues to offset increased expenses associated with acquisitions; |
|
|
• |
assumption of liabilities and exposure to unforeseen liabilities of acquired companies, including liabilities for their failure to comply with healthcare, tax, and other regulations; |
|
|
• |
inability to achieve identified operating and financial synergies and other benefits anticipated to result from an acquisition; |
|
|
• |
difficulties integrating and documenting processes and controls in conformance with the requirements of Section 404 of the Sarbanes-Oxley Act of 2002; |
|
|
• |
ability to integrate acquired operations, products, and technologies into our business; |
|
|
• |
difficulties retaining and integrating acquired personnel and distinct cultures into our business; and |
48
|
|
• |
the potential loss of key employees, customers, or projects. |
We may also spend time and money investigating and negotiating with potential acquisition targets but not complete the transaction. Any acquisition could involve other risks, including, among others, the assumption of additional liabilities and expenses, difficulties and expenses in connection with integrating the acquired companies and achieving the expected benefits, issuances of potentially dilutive securities or interest-bearing debt, loss of key employees of the acquired companies, transaction expenses, diversion of management's attention from other business concerns, and, with respect to the acquisition of international companies, the inability to overcome differences in international business practices, language and customs. Our failure to successfully integrate potential future acquisitions could have a material adverse effect on our business, financial condition, results of operations, and cash flows.
Our relationships with existing or potential customers who are in competition with each other may adversely impact the degree to which other customers or potential customers use our services, which may adversely affect our business, financial condition, results of operations, or cash flows.
The biopharmaceutical industry is highly competitive, with biopharmaceutical companies each seeking to persuade payers, providers, and patients that their drug therapies are better and more cost-effective than competing therapies marketed or being developed by competing firms. In addition to the adverse competitive interests that biopharmaceutical companies have with each other, biopharmaceutical companies also have adverse interests with respect to drug selection and reimbursement with other participants in the healthcare industry, including payers and providers. Biopharmaceutical companies also compete to be first to market with new drug therapies. We regularly provide services to biopharmaceutical companies that compete with each other, and we sometimes provide services to such customers regarding competing drugs in the market and in development. Our existing or future relationships, particularly broader strategic provider and commercial relationships, with our biopharmaceutical customers may therefore deter other biopharmaceutical customers from using our services or may result in our customers seeking to place limits on our ability to serve other biopharmaceutical industry participants. In addition, our further expansion into the broader healthcare market may adversely impact our relationships with biopharmaceutical customers, and such customers may elect not to use our services, reduce the scope of services that we provide to them or seek to place restrictions on our ability to serve customers in the broader healthcare market with interests that are adverse to theirs. Any loss of customers or reductions in the level of revenues from a customer could have a material adverse effect on our business, financial condition, results of operations, or cash flows.
Our results of operations may be adversely affected if we fail to realize the full value of our goodwill and intangible assets.
As of December 31, 2021, our goodwill and net intangible assets were valued at $5.81 billion, which constituted approximately 71% of our total assets.
Our goodwill is principally related to the acquisition of inVentiv completed in August 2017. Goodwill is tested for impairment at the reporting unit level, which is one level below the operating segment level. This test requires us to determine if the implied fair value of the reporting unit’s goodwill is less than its carrying amount. The impairment analysis requires significant judgments, estimates and assumptions. There is no assurance that the actual future earnings or cash flows of the reporting units will not decline significantly from the projections used in the impairment analysis. Goodwill impairment charges may be recognized in future periods in one or more of the reporting units to the extent changes in factors or circumstances occur, including deterioration in the macroeconomic environment or industry, deterioration in our performance or our future projections, or changes in plans for one or more of our reporting units. As of December 31, 2021, our goodwill is assigned to four reporting units. We completed our annual impairment test as of October 1, 2021 for all of our reporting units and concluded that there were no impairments.
49
Intangible assets consist of customer relationships, acquired backlog, trade names, trademarks, patient communities, and acquired technologies. We review intangible assets at the end of each reporting period to determine if facts and circumstances indicate that the useful life is shorter than originally estimated or that the carrying amount of the assets might not be recoverable. If such facts and circumstances exist, we assess the recoverability of identified assets by comparing the projected undiscounted net cash flows associated with the related asset or group of assets over their remaining lives to their respective carrying amounts. Impairments, if any, are based on the excess of the carrying amount over the fair value of those assets and occur in the period in which the impairment determination was made. We have experienced material impairment losses in the past, and could experience additional material impairment losses in the future. The process of testing intangible assets for impairment involves numerous judgments, assumptions, and estimates made by management including expected future profitability, cash flows, and the fair values of assets and liabilities, which inherently reflect a high degree of uncertainty and may be affected by significant variability. If the business climate deteriorates, then actual results may not be consistent with these judgments, assumptions, and estimates, and our intangible assets may become impaired in future periods. Both the deterioration of the business climate and any potential impairment losses caused as a result of such deterioration could in turn have an adverse impact on our business, financial condition, and results of operations.
We face risks arising from the restructuring of our operations, which could adversely affect our financial condition, results of operations, cash flows, or business reputation.
From time to time, we have adopted cost savings initiatives to improve our operating efficiency through various means such as: (i) the reduction of overcapacity, primarily in our costs of services (billable) function; (ii) elimination of non-billable support roles; and (iii) the consolidation or other realignment of our resources. During the year ended December 31, 2021, we recognized approximately $14.5 million of employee severance costs, facility closure and lease termination costs of $8.2 million, and other costs of $0.1 million related to our focus on optimizing our resources worldwide.
Restructuring actions present significant risks that could have a material adverse effect on our operations, financial condition, results of operations, cash flows, or business reputation. Such risks include:
|
|
• |
a decrease in employee morale and retention of key employees; |
|
|
• |
a greater number of employment claims; |
|
|
• |
actual or perceived disruption of service or reduction in service standards to customers; |
|
|
• |
the failure to preserve supplier relationships and distribution, sales and other important relationships, and to resolve conflicts that may arise; |
|
|
• |
the failure to achieve targeted cost savings; and |
|
|
• |
the failure to meet operational targets and customer requirements due to the loss of employees and any work stoppages that might occur. |
50
We operate in many different jurisdictions and we could be adversely affected by violations of the FCPA, U.K. Bribery Act of 2010, and/or similar worldwide anti-corruption and anti-bribery laws.
The FCPA, U.K. Bribery Act of 2010, and similar worldwide anti-corruption laws prohibit companies and their intermediaries from making improper payments for the purpose of obtaining or retaining business. Our internal policies mandate compliance with these anti-corruption laws. We operate in many parts of the world that have experienced corruption to some degree and, in certain circumstances, anti-corruption laws have appeared to conflict with local customs and practices. Despite our training and compliance programs, we cannot assure that our internal control policies and procedures will protect us from acts in violation of anti-corruption laws committed by persons associated with us, and our continued expansion outside the U.S., including in developing countries, could increase such risk in the future. Violations of the FCPA or other ex-U.S. anti-corruption laws, or even allegations of such violations, could disrupt our business and result in a material adverse effect on our financial condition, results of operations, cash flows, and reputation. For example, violations of anti-corruption laws can result in restatements of, or irregularities in, our financial statements as well as severe criminal or civil sanctions. In some cases, companies that violate the FCPA (or similar laws in other jurisdictions outside the U.S.) might be debarred by the U.S. government and/or lose their U.S. export privileges. In addition, U.S. or other governments might seek to hold us liable for successor liability for FCPA violations or violations of other anti-corruption laws committed by companies that we acquire or in which we invest, or by or on behalf of persons working for or representing our Company. Changes in anti-corruption laws or enforcement priorities could also result in increased compliance requirements and related costs which could adversely affect our business, financial condition, results of operations, and cash flows.
The failure of third parties to provide us critical support services could adversely affect our business, financial condition, results of operations, cash flows, or reputation.
We depend on third parties for support services vital to our business. Such support services include, but are not limited to, IT services, laboratory services, third-party transportation and travel providers, freight forwarders and customs brokers, drug depots and distribution centers, suppliers or contract manufacturers of drugs for patients participating in clinical trials, and providers of licensing agreements, maintenance contracts, or other services. In addition, we also rely on third-party CROs and other contract clinical personnel for clinical services either in regions where we have limited resources, or in cases where demand cannot be met by our internal staff. The failure of any of these third parties to adequately provide us critical support services could have a material adverse effect on our business, financial condition, results of operations, cash flows, or reputation.
Our embedded and functional outsourcing services could subject us to employment liability, which may cause adverse effects on our business.
With our embedded and functional outsourcing services, we place employees at the physical workplaces of our customers. The risks of this activity include claims of errors and omissions, misuse or misappropriation of client proprietary information, theft of client property, and torts or other claims under employment liability, co-employment liability, or joint employment liability. We have policies and guidelines in place to reduce our exposure to such risks, but if we fail to follow these policies and guidelines we may suffer reputational damage, loss of customer relationships and business, and monetary damages.
51
Our increasing focus on environmental sustainability and social initiatives could increase our costs, and inaction could harm our reputation and adversely impact our financial results.
There has been increasing public focus by investors, customers, environmental activists, the media and governmental and nongovernmental organizations on a variety of environmental, social and other sustainability matters. As an organization, we understand the importance of our role in lessening our environmental footprint and supporting positive social impact. We established a cross-functional team to make commitments relating to sustainability matters that affect us, including the design and implementation of specific risk mitigation strategic initiatives relating to sustainability. In light of the importance of this to our culture, as well as internal and external stakeholders, if we are not effective in addressing environmental, social and other sustainability matters affecting our business, or setting and meeting relevant sustainability goals, our reputation and financial results may suffer. We may experience increased costs in order to execute upon our sustainability goals and measure achievement of those goals, which could have an adverse impact on our business and financial condition.
In addition, this emphasis on environmental, social, and other sustainability matters has resulted and may result in the adoption of new laws and regulations, including new reporting requirements. If we fail to comply with new laws, regulations, or reporting requirements, our reputation and business could be adversely impacted.
We might not be able to utilize certain of our net operating loss carryforwards and certain other tax attributes, which could harm our profitability.
As of December 31, 2021, we had approximately $317.4 million of net operating loss (“NOL”) carryforwards available to reduce U.S. federal taxable income in future years. Under Section 382 and similar provisions of the Internal Revenue Code (the “Code”), if a corporation undergoes an “ownership change,” that corporation’s ability to use its pre-change NOL carryforwards and other pre-change tax attributes, such as research tax credits, to offset its post-change income and taxes may be limited for U.S. federal income tax purposes (or similar provisions of other jurisdictions). These limitations may be subject to certain exceptions, including if there is “net unrealized built-in gain” in the assets of the corporation undergoing the ownership change.
Downgrades of our credit ratings could adversely affect us.
We can be adversely affected by downgrades of our credit ratings because ratings are a factor influencing our ability to access capital and the terms of any new indebtedness, including covenants and interest rates. Our customers and vendors may also consider our credit profile when negotiating contract terms, and if they were to change the terms on which they deal with us, it could have a material adverse effect on our business, results of operations, cash flows, and financial condition.
Many of our vendors have the right to declare us in default of our agreements if any such vendor, including the lessors under our vehicle fleet leases, determines that a change in our financial condition poses a substantially increased credit risk. Upon default, the lessors can repossess the vehicles and require us to compensate them for any remaining lease payments in excess of the value of the repossessed vehicles. As of December 31, 2021, we had $54.8 million in finance lease obligations, primarily related to vehicles used in Deployment Solutions in the U.S. Deployment Solutions may be negatively impacted if we lose the use of vehicles for any period of time.
Our credit agreement (as amended, the “Credit Agreement”) contains covenants that may restrict our ability to, among other things, borrow money, pay dividends, make capital expenditures, make strategic acquisitions and effect a consolidation, merger, or disposal of all or substantially all of our assets. Refer to “Risks Related to Our Indebtedness – Covenant restrictions under the Credit Agreement may limit our ability to operate our business” for further details on our covenant restrictions.
52
Risks Related to Our Industry
The biopharmaceutical services industry is highly competitive and our business could be materially impacted if we do not compete effectively.
The biopharmaceutical services industry is highly competitive. Our business often competes with other biopharmaceutical services companies, internal discovery departments, development departments, sales and marketing departments, information technology departments, and other departments within our customers, some of which could be considered large biopharmaceutical services companies in their own right with greater resources than ours. To the extent that our clients choose to internally perform the clinical development and commercialization tasks that we provide, our business will suffer. We also compete with universities, teaching hospitals, governmental agencies, and others. If we do not compete successfully, our business will suffer. The industry is highly fragmented, with numerous smaller specialized companies and a handful of companies with global capabilities similar to certain of our own capabilities. Increased competition has led to price and other forms of competition (such as acceptance of less favorable contract terms) that could adversely affect our operating results. There are few barriers to entry for companies considering offering any one or more of the services we offer. Because of their size and focus, these companies might compete effectively against us, which could have a material adverse impact on our business.
In recent years, our industry has experienced increased consolidation which may continue and might put us at risk of growing more slowly than our competitors that make acquisitions. This trend is likely to produce more competition from the resulting larger companies, and ones without the cost pressures of being public, for both customers and acquisition candidates. One specific aspect of this consolidation competition involves CROs entering into transactions to attempt to control more access to clinical trial participants, like acquisition of site networks and data. These trends could make it harder for us to compete successfully.
In addition, the emergence of the use of real world evidence and new tools such as machine learning and artificial intelligence that capitalize on the availability of large data sets may reduce the time and costs of the discovery and development process, may allow our clients to more readily perform clinical development tasks and services that we provide themselves or may cause price competition. More broadly, our current competitors or other businesses might develop technologies or services that are more effective or commercially attractive than, or render obsolete, our current or future technologies and services. Our failure to develop and offer competitive solutions that address these and other technological advances in a timely, cost-effective manner or to keep pace with rapid technological change could adversely affect our competitive position and our results of operations.
53
Our future growth and success will depend on our ability to successfully compete with other companies that provide similar services in the same markets, some of which may have financial, marketing, technical, and other advantages. We also expect that competition will continue to increase as a result of consolidation among these various companies. Large technology companies with substantial resources, technical expertise, and greater brand power could also decide to enter or further expand in the markets where our business operates and compete with us. If one or more of our competitors or potential competitors were to merge or partner with another of our competitors, or if a new entrant emerged with substantial resources, the change in the competitive landscape could adversely affect our ability to compete effectively. We compete on the basis of various factors, including breadth and depth of services, reputation, reliability, quality, innovation, security, price, and industry expertise and experience. In addition, our ability to compete successfully may be impacted by the growing availability of health information from social media, government health information systems, and other free or low-cost sources. In addition, consolidation or integration of wholesalers, retail pharmacies, health networks, payers, or other healthcare stakeholders may lead any of them to provide information services directly to customers or indirectly through a designated service provider, resulting in increased competition from firms that may have lower costs to market (e.g., no data supply costs). Any of the above may result in lower demand for our services, which could result in a material adverse impact on our operating results and financial condition.
Outsourcing trends in the biopharmaceutical industry and changes in aggregate spending and research and development budgets could adversely affect our operating results and growth rate.
Our revenues depend on the level of R&D and commercialization expenditures, size of the drug-development pipelines, and outsourcing trends of the biopharmaceutical industry, including the amount of such R&D and commercialization spend that is outsourced and subject to competitive bidding amongst us and our competitors. Accordingly, economic factors and industry trends that affect biopharmaceutical companies affect our business.
Biopharmaceutical companies continue to seek long-term strategic collaborations with global CROs with favorable pricing terms. Competition for these collaborations is intense and we might not be selected, in which case a competitor may enter into the collaboration and our business with the customer, if any, may be limited. Our success depends in part on our ability to establish and maintain preferred provider relationships with large biopharmaceutical companies. Our failure to develop or maintain these preferred provider relationships could have a material adverse effect on our business and results of operations. Furthermore, in order to obtain preferred provider relationships or other large contracts for commercialization services, we may have to reduce the prices for our services, which could negatively impact our gross margin for these services.
Our small and mid-sized biopharmaceutical company clients may rely on funding from venture capital and other sources to drive their business. To the extent that this funding is reduced, our small and mid-sized biopharmaceutical company clients may be forced to reduce their outsourced R&D and commercialization expenditures, which could have a material adverse effect on our business and results of operations.
In addition, if the biopharmaceutical industry reduces its outsourcing of clinical trials or commercialization services or such outsourcing fails to grow at projected rates, our business, financial condition, results of operations, and cash flows could be materially and adversely affected. We may also be negatively impacted by consolidation and other factors in the biopharmaceutical industry, which may slow decision making by our customers, result in the delay or cancellation of existing projects, cause reductions in overall R&D expenditures, or lead to increased pricing pressures. Further, in the event that one of our customers combines with a company that is using the services of one of our competitors, the combined company could decide to use the services of that competitor or another provider. All of these events could adversely affect our business, financial condition, cash flows, or results of operations.
54
Actions by government regulators or customers to limit a prescription’s scope or withdraw an approved product from the market could adversely affect our business, results of operations, and financial condition.
Government regulators have the authority, after approving a biopharmaceutical product, to limit its indicated use, impose restrictions on its marketing, or withdraw it from the market completely based on safety or other concerns. Similarly, customers may act to voluntarily limit the sales of biopharmaceutical products or withdraw them from the market. Actions by payers to limit a product on a formulary list or restrict coverage or reimbursement for a product can influence customer decisions to withdraw or limit market support for a product. In the past, we have provided services with respect to products that have been limited or withdrawn. If we are providing services to customers for products that are limited or withdrawn, we may be required to narrow the scope of or terminate our services with respect to such products, which would prevent us from earning the full amount of revenues anticipated under the related contracts with negative impacts to our business, results of operations, cash flows, and financial condition.
If we fail to comply with federal, state, and foreign healthcare laws, including fraud and abuse laws, we could face substantial penalties and our business, financial condition, results of operations, cash flows, and prospects could be adversely affected.
Even though we do not and will not order healthcare services or bill directly to Medicare, Medicaid, or other third-party payers, certain federal and state healthcare laws and regulations pertaining to fraud and abuse are and will be applicable to our business. We could be subject to healthcare fraud and abuse laws of both the federal government and the states in which we conduct our business. Because of the breadth of these laws and the narrowness of available statutory and regulatory exceptions, it is possible that some of our business activities could be subject to challenge under one or more of such laws. If we or our operations are found to be in violation of any of the laws described above or any other governmental regulations that apply to us, we may be subject to penalties, including civil and criminal penalties, damages, fines, imprisonment, and the curtailment or restructuring of our operations, any of which could materially adversely affect our ability to operate our business, our financial results, and our reputation.
We may be affected by healthcare reform and potential additional reforms which may adversely impact the biopharmaceutical industry and reduce the need for our services or negatively impact our profitability.
Numerous government bodies are considering or have adopted healthcare reforms and may undertake, or are in the process of undertaking, efforts to control healthcare costs through legislation, regulation, and agreements with HCPs and biopharmaceutical companies, including many of our customers. As governmental administrations change and reforms take place, we are unable to predict what legislative proposals, if any, will be adopted in the future. If regulatory cost-containment efforts limit the profitability of new drugs by, for example, continuing to place downward pressure on pharmaceutical pricing and/or increasing regulatory burdens and operating costs of the biopharmaceutical industry, our customers may reduce their commercialization and R&D spending, which could reduce the business they outsource to us. In addition, if regulatory requirements are relaxed or simplified drug approval procedures are adopted, the demand for our services could decrease.
55
Government bodies have adopted and may continue to adopt new healthcare legislation or regulations that are more burdensome than existing regulations. For example, product safety concerns and recommendations by the Drug Safety Oversight Board could change the regulatory environment for drug products, and new or heightened regulatory requirements may increase our expenses or limit our ability to offer some of our services. We might have to incur additional costs to comply with these or other new regulations, and failure to comply could harm our financial condition, results of operations, cash flows, and reputation, and result in adverse legal action(s). Additionally, new or heightened regulatory requirements may have a negative impact on the ability of our customers to conduct industry-sponsored clinical trials, which could reduce the need for our post-approval development services. For instance, in the EU, the Clinical Trials Regulation (“CTR”), which was adopted in April 2014, will become applicable on January 31, 2022. The CTR will be directly applicable in all EU member states, repealing the current Clinical Trials Directive. The CTR harmonizes the assessment and supervision processes for clinical trials throughout the EU via a Clinical Trials Information System, which will notably contain a centralized EU portal and database.
It is currently unclear to what extent the UK will seek to align its regulations with the EU Clinical Trials Regulation (EU) No 536/2014, which was enacted in 2014 and became effective on January 31, 2022. The UK regulatory framework in relation to clinical trials is derived from existing EU legislation (as implemented into UK law, through secondary legislation). If the decision by the UK is not to closely align its regulations with the new approach that will be adopted in the EU, it could have an effect on the cost of conducting clinical trials in the UK as opposed to other countries and/or make it harder to seek a marketing authorization in the EU for product candidates on the basis of clinical trials conducted in the UK.
Current and proposed laws and regulations regarding the protection of personal data could result in increased risks of liability or increased cost to us or could limit our service offerings.
The global data protection landscape is rapidly evolving, and we are or may become subject to numerous state, federal and foreign laws, requirements, and regulations governing the collection, use, disclosure, retention, and security of personal information, such as information we may collect about individuals in the U.S., the EEA, the UK, and other countries where we have operations, including but not limited to Japan, China, South Korea, Brazil, and Singapore. Federal, state, and foreign governments may propose or have adopted additional legislation governing the collection, possession, use, storage, or disclosure of personal data, including but not limited to health and financial data, as well as security breach notification rules for loss or theft of such data. Additional legislation or regulation of this type might, among other things, require us to implement additional security measures and processes or to anonymize or de-identify health or other personal data in excess of what we are already obliged to do, each of which may require substantial expenditures or limit our ability to offer some of our services. Failure to comply with these data protection and privacy laws, rules, and regulations, or to resolve any privacy or security complaints, could subject us to regulatory sanctions, fines, delays in clinical trials, criminal prosecution, or civil liability, as well as reputational damage.
56
In the U.S., we are subject to certain state privacy and data security laws and regulations in the states in which we operate, such as the CCPA, which became effective as of January 2020, and creates individual privacy rights for California consumers and increases the privacy and security obligations of entities handling certain personal information. The CCPA provides for civil penalties for violations, as well as a private right of action for data breaches that is expected to increase data breach litigation. Further, the California Privacy Rights Act (the “CPRA”) recently passed in California. The CPRA will impose additional data protection obligations on covered businesses, including additional consumer rights processes, limitations on data uses, new audit requirements for higher risk data, and opt outs for certain uses of sensitive data. It will also create a new California data protection agency authorized to issue substantive regulations and could result in increased privacy and information security enforcement. The majority of the provisions will go into effect on January 1, 2023, and additional compliance investment and potential business process changes may be required. Similar laws have passed in Virginia and Colorado, and have been proposed in other states and at the federal level, reflecting a trend toward more stringent privacy legislation in the U.S. The enactment of such laws could have potentially conflicting requirements that would make compliance challenging. In the event that we are subject to or affected by the CCPA, the CPRA, or other domestic privacy and data protection laws, any liability from failure to comply with the requirements of these laws could adversely affect our financial condition.
In the EEA, we are subject to the EU GDPR, and in the UK, we are subject to the UK data protection regime consisting primarily of the UK General Data Protection Regulation, or UK GDPR, and the UK Data Protection Act 2018, (collectively, the GDPR), in each case in relation to our collection, control, processing, sharing, disclosure, and other use of data relating to an identifiable living individual (personal data). The GDPR contains provisions specifically directed at the processing of health data, rights of data subjects, data breach notification, and extra-territoriality measures intended to extend the applicability of the law to certain activities performed by non-EEA/UK organizations (such as the targeting or monitoring of individuals located in the EEA/UK by organizations located in other locations). Failure by us, or by our partners, our service providers, or our employees or contractors, to comply with the GDPR could result in regulatory investigations, reputational damage, orders to cease/ change our use of data, enforcement notices and/ or fines of the greater of €20 million/£17.5 million or 4% of total global annual revenue, as well as potential civil claims including class actions where individuals suffer harm. These changes may lead to additional compliance costs and could increase our overall risk. As we expand into other foreign countries and jurisdictions, we may be subject to additional laws and regulations that may affect how we conduct business.
In addition to data protection laws and regulations, regulators are considering (or are adopting) other laws, regulations and guidelines that impact the processing of personal information. For example, the evolving landscape surrounding the use of artificial intelligence and online advertising may lead to additional compliance costs and could increase our overall risk.
In addition, we operate on a global basis and may transfer personal data to our affiliates and service providers in the course of administering our business and performing our services. As a result, we are subject to legal requirements that govern the cross-border transfer of personal data. For example, the GDPR prohibits the transfer of personal data outside the EEA and the UK to third countries that have not been found to provide adequate protection to such personal data, including the U.S., in the absence of certain safeguards. We rely upon Standard Contractual Clauses (“SCCs”) and other appropriate safeguards or derogations for such transfers of personal data.
57
The European Commission issued revised SCCs on June 4, 2021 to account for the decision of the CJEU and recommendations made by the European Data Protection Board. The revised SCCs must be used for relevant new data transfers from September 27, 2021; existing standard contractual clauses arrangements must be migrated to the revised clauses by December 27, 2022. The new SCCs apply only to the transfer of personal data outside of the EEA and not the UK; the UK’s Information Commissioner’s Office launched a public consultation on its draft revised data transfers mechanisms in August 2021. There is some uncertainty around whether the revised clauses can be used for all types of data transfers, particularly whether they can be relied on for data transfers to non-EEA entities subject to the GDPR.
As noted in prior disclosures, certain of our clinical entities relied in part on the EU-U.S. and Swiss-U.S. Privacy Shield frameworks to transfer certain personal data from the EU and Switzerland, respectively, to the U.S. On July 16, 2020, the Court of Justice of the European Union (“CJEU”) invalidated the EU-US Privacy Shield. Similarly, on September 8, 2020, Switzerland’s Federal Data Protection and Information Commissioner (“FDPIC”) issued an opinion concluding that the Swiss-US Privacy Shield Framework does not provide an adequate level of protection to transfer Personal Data from Switzerland to the U.S. Because of these developments, we no longer leverage these frameworks to support the transfer of personal data from the EU and Switzerland to the U.S., although we continue participation in them, in an effort to demonstrate our commitment to the protection of personal data.
We are accountable for the acts and omissions of our third-party service providers we engage to process personal data on our behalf, subject to limitations and exclusions provided by law. There is no assurance that contractual measures and our own privacy and security-related safeguards will protect us from the risks associated with the third-party processing, storage and transmission of such information. Any violation of data protection laws by our third-party processors could have a material adverse effect on our business and result in the fines and penalties outlined above.
Although we work to comply with applicable laws, regulations and standards, our contractual obligations, and other legal obligations, these requirements are evolving and may be modified, interpreted and applied in an inconsistent manner from one jurisdiction to another, and may conflict with one another or other legal obligations with which we must comply. Any failure or perceived failure by us or our employees, representatives, contractors, consultants, collaborators, or other third parties to comply with such requirements or adequately address privacy and security concerns, even if unfounded, could result in additional cost and liability to us, damage our reputation, and adversely affect our business and results of operations.
Our customers face intense competition from lower cost generic products and other competing products, which may lower the amount that they spend on our services and could have a material adverse effect on our business, results of operations, cash flows, and financial condition.
Our customers face increasing competition from competing products and, in particular, from lower cost generic products, which in turn may affect their ability to pursue clinical development and commercialization activities. In the U.S., the EU and Japan, political pressure to reduce spending on prescription products has led to legislation and other measures which encourage the use of generic products. In addition, proposals emerge from time to time in the U.S. and other countries for legislation to further encourage the early and rapid approval of generic products. Loss of patent protection for a product typically is followed promptly by generic substitutes, reducing our customers’ sales of that product and their overall profitability. Availability of generic substitutes for our customers’ products or other competing products may cause them to lose market share and, as a result, may adversely affect their results of operations and cash flow, which in turn may mean that they would not have adequate capital to purchase our services. If competition from generic or other products impacts our customers’ finances such that they decide to curtail our services, our net revenues may decline and this could have a material adverse effect on our business, results of operations, and financial condition.
58
The biopharmaceutical industry has a history of patent and other intellectual property litigation and we might be involved in costly intellectual property lawsuits.
The biopharmaceutical industry has a history of intellectual property litigation and these lawsuits will likely continue in the future. Accordingly, we may face patent infringement suits or be called upon to provide documentation by companies that have patents for similar business processes or other suits alleging infringement of their intellectual property rights. Legal proceedings relating to intellectual property could be expensive, take significant time, and divert management’s attention from other business concerns, regardless of the outcome of the litigation. In the event an infringement lawsuit were brought against us and we did not prevail, we might have to pay substantial damages and we could be required to stop infringing activity or obtain a license to use technology on unfavorable terms.
Risks Related to Our Indebtedness
Our substantial debt could adversely affect our financial condition and cash flows from operations.
As of December 31, 2021, our total principal amount of indebtedness was $2.84 billion, which consisted of: (i) $1.79 billion in term loan debt; (ii) $600.0 million of 3.625% senior notes (the “Notes”); (iii) borrowings of $400.0 million under our accounts receivable financing agreement; and (iv) $54.8 million in current and non-current finance lease obligations. Our substantial indebtedness could adversely affect our financial condition and cash flows from operations and thus make it more difficult for us to satisfy our obligations with respect to our senior secured facilities. If our cash flow is not sufficient to service our debt and adequately fund our business, we may be required to seek further additional financing or refinancing or dispose of assets. We might not be able to influence any of these alternatives on satisfactory terms or at all. Our substantial indebtedness could also:
|
|
• |
increase our vulnerability to adverse general economic, industry, or competitive developments; |
|
|
• |
require us to dedicate a more substantial portion of our cash flows from operations to payments on our indebtedness, thereby reducing the availability of our cash flows to fund working capital, investments, acquisitions, capital expenditures, and other general corporate purposes; |
|
|
• |
limit our ability to make required payments under our existing contractual commitments, including our existing long-term indebtedness; |
|
|
• |
limit our ability to fund a change of control offer; |
|
|
• |
require us to sell certain assets; |
|
|
• |
restrict us from making strategic investments, including acquisitions, or causing us to make non-strategic divestitures; |
|
|
• |
limit our flexibility in planning for, or reacting to, changes in our business and the industry in which we operate; |
|
|
• |
place us at a competitive disadvantage compared to our competitors that have less debt; |
|
|
• |
cause us to incur substantial fees from time to time in connection with debt amendments or refinancings; |
|
|
• |
increase our exposure to rising interest rates because a substantial portion of our borrowings is at variable interest rates; and |
59
|
|
• |
limit our ability to borrow additional funds or to borrow on terms that are satisfactory to us. |
Despite our level of indebtedness, we are able to incur more debt and undertake additional obligations. Incurring such debt or undertaking such additional obligations could further exacerbate the risks to our financial condition.
We also may be able to incur additional indebtedness in the future. Although covenants under the Credit Agreement limit our ability to incur certain additional indebtedness, these restrictions are subject to a number of qualifications and exceptions, and the indebtedness incurred in compliance with these restrictions could be substantial. To the extent we incur additional indebtedness, the risks associated with our leverage, including our possible inability to service our debt obligations, would increase.
Servicing our debt will require a significant amount of cash, and our ability to generate sufficient cash depends on many factors, some of which are beyond our control.
Our ability to make payments on and refinance our debt, make strategic acquisitions, and fund capital expenditures depends on our ability to generate cash flow in the future. To some extent, our ability to generate future cash flow is subject to general economic, financial, competitive, and other factors that are beyond our control. We cannot assure you that:
|
|
• |
our business will generate sufficient cash flow from operations; |
|
|
• |
we will continue to realize the cost savings, revenue growth, and operating improvements that resulted from the execution of our long-term strategic plan; or |
|
|
• |
future sources of funding will be available to us in amounts sufficient to enable us to fund our liquidity needs. |
We also may experience difficulties repatriating cash from foreign subsidiaries and accounts due to law, regulation, or contracts which could further constrain our liquidity. If we cannot fund our liquidity needs, we will have to take actions such as reducing or delaying capital expenditures, marketing efforts, strategic acquisitions, investments and alliances, selling assets, restructuring or refinancing our debt, or seeking additional equity capital. We cannot assure you that any of these remedies could, if necessary, be effected on commercially reasonable or favorable terms, or at all, or that they would permit us to meet our scheduled debt service obligations. Any inability to generate sufficient cash flow or refinance our debt on favorable terms could have a material adverse effect on our financial condition.
60
Covenant restrictions under the Credit Agreement, our other financing arrangements, and lease agreement may limit our ability to operate our business.
The Credit Agreement and our indentures governing our Notes contain covenants that may restrict our ability to, among other things, borrow money, pay dividends, make capital expenditures, make strategic acquisitions and effect a consolidation, merger or disposal of all or substantially all of our assets. Although the covenants in the Credit Agreement and our other debt instruments are subject to various exceptions, we cannot assure you that these covenants will not adversely affect our ability to finance future operations, capital needs, or to engage in other activities that may be in our best interest. In addition, in certain circumstances, our long-term debt requires us to maintain a specified financial ratio and satisfy certain financial condition tests, which may require that we take action to reduce our debt or to act in a manner contrary to our business objectives. A breach of any of these covenants could result in a default under our senior secured facilities or our indentures governing our senior unsecured notes. If an event of default under the Credit Agreement or our other debt instruments occurs, the lenders thereunder or holders of the defaulted debt could elect to declare all amounts outstanding, together with accrued interest, to be immediately due and payable. In such case, we might not have sufficient funds to repay all the outstanding amounts. In addition, the Credit Agreement is secured by first priority security interests on substantially all of our real and personal property, including the capital stock of certain of our subsidiaries. If an event of default under the Credit Agreement occurs, the lenders thereunder could exercise their rights under the related security documents. Any acceleration of amounts due under the Credit Agreement or the substantial exercise by the lenders of their rights under the security documents would likely have a material adverse effect on us. Our receivables facility also contains covenants customary in such facilities that may restrict our ability to operate our business.
Under the terms of the lease agreement for our corporate headquarters in Morrisville, North Carolina we may be required to issue a letter of credit (“LOCs”) to the landlord based on our debt rating issued by Moody’s Investors Service (or other nationally-recognized debt rating agency, such as S&P Global Ratings).
As of December 31, 2021, our debt rating was such that no LOC is currently required. Any LOCs issued in accordance with the aforementioned requirements could be issued under our revolving credit facility (the “Revolver”) under the Credit Agreement, and, if issued under our Revolver, would reduce our available borrowing capacity by the same amount accordingly.
Interest rate fluctuations may have a material adverse effect on our business, financial condition, results of operations, or cash flows.
Because we have substantial variable rate debt, fluctuations in interest rates may affect our business, financial condition, results of operations, or cash flows. We currently utilize interest rate swaps to limit our exposure to interest rate fluctuations; however, such instruments may not be effective. As of December 31, 2021, we had approximately $2.84 billion of total principal indebtedness consisting of $1.79 billion in term loan debt, $600.0 million under the Notes, borrowings of $400.0 million under our accounts receivable financing agreement, and $54.8 million in current and non-current of finance lease obligations, of which $1.03 billion (excluding finance leases) was subject to variable interest rates.
61
A portion of our indebtedness bears interest at variable interest rates, primarily based on the London Inter-bank Offered Rate (“LIBOR”), which may be subject to regulatory guidance and/or reform that could cause interest rates under our current or future debt agreements to perform differently than in the past or cause other unanticipated consequences. Some tenors of LIBOR were discontinued on December 31, 2021. Although we expect that the capital and debt markets will cease to use LIBOR as a benchmark in the near future and the administrator of LIBOR has announced its intention to extend the publication of most tenors of LIBOR for U.S. dollars through June 30, 2023, we cannot predict whether or when LIBOR will actually cease to be available, whether the Secured Overnight Funding Rate, or SOFR, will become the market benchmark in its place or what impact such a transition may have on our business, financial condition, and results of operations.
A lowering or withdrawal of the ratings assigned to our debt securities by rating agencies may increase our future borrowing costs and reduce our access to capital.
Our debt currently has a non-investment grade rating, and any rating assigned could be lowered or withdrawn entirely by a rating agency if, in that rating agency’s judgment, future circumstances relating to the basis of the rating, such as adverse changes, so warrant. Consequently, real or anticipated changes in our credit ratings will generally affect the market value of our debt. Credit ratings are not recommendations to purchase, hold, or sell the Notes. Any future lowering of our ratings likely would make it more difficult or more expensive for us to obtain additional debt financing.
Risks Related to Ownership of Our Common Stock
We do not expect to pay any cash dividends for the foreseeable future.
We do not anticipate that we will pay any dividends to holders of our stock for the foreseeable future. Any payment of cash dividends will be at the discretion of our Board and will depend on our financial condition, capital requirements, legal requirements, earnings, and other factors. Our ability to pay dividends is restricted by the terms of the Credit Agreement and might be restricted by the terms of any indebtedness that we incur in the future. Consequently, you should not rely on dividends in order to receive a return on your investment.
Provisions of our corporate governance documents and Delaware law could make an acquisition of our company more difficult and may prevent attempts by our shareholders to replace or remove our current management, even if beneficial to our shareholders.
Provisions of our certificate of incorporation and our amended and restated bylaws contain provisions that delay, defer or discourage transactions involving an actual or potential change in control of us or change in our management that shareholders may consider favorable, including transactions in which you might otherwise receive a premium for your shares. These provisions could also limit the price that investors might be willing to pay in the future for shares of our stock, thereby depressing the market price of our stock. In addition, these provisions may frustrate or prevent any attempts by our shareholders to replace or remove our current management by making it more difficult for shareholders to replace members of the Board. Because the Board is responsible for appointing the members of our management team, these provisions could in turn affect any attempt to replace current members of our management team. Among others, these provisions include: (i) our ability to issue preferred stock without shareholder approval; (ii) the requirement that our shareholders may not act without a meeting; (iii) requirements for advance notification of shareholder nominations and proposals contained in our bylaws; (iv) the absence of cumulative voting for our directors; and (v) requirements for shareholder approval of certain business combinations.
62
Additionally, Section 203 of the Delaware General Corporation Law prohibits a publicly held Delaware corporation from engaging in a business combination with an interested shareholder, generally a person which together with its affiliates owns, or within the last three years has owned, 15% of our voting stock, for a period of three years after the date of the merger in which the person became an interested shareholder, unless the business combination is approved in a prescribed manner. The existence of the foregoing provision could also limit the price that investors might be willing to pay in the future for shares of our stock, thereby depressing the market price of our stock.
Our certificate of incorporation, as amended, provides, subject to certain exceptions, that the Court of Chancery of the State of Delaware will be the sole and exclusive forum for certain stockholder litigation matters, which could limit our stockholders’ ability to obtain a favorable judicial forum for disputes with us or our directors, officers or stockholders.
Our certificate of incorporation, as amended, provides, subject to limited exceptions, that the Court of Chancery of the State of Delaware will, to the fullest extent permitted by law, be the sole and exclusive forum for (1) any derivative action or proceeding brought on our behalf; (2) any action asserting a claim of breach of a fiduciary duty owed by, or any wrongdoing by, any of our directors, officers or stockholders to us or our stockholders; (3) any action asserting a claim arising pursuant to any provision of the Delaware General Corporation Law, our certificate of incorporation, as amended, or our amended and restated bylaws; (4) any action to interpret, apply, enforce or determine the validity of our certificate of incorporation, as amended, or our amended and restated bylaws or (5) any action asserting a claim governed by the internal affairs doctrine. This provision would not apply to suits brought to enforce a duty or liability created by the Exchange Act, Securities Act, or, in each case, the rules and regulations thereunder, or any other claim for which the U.S. federal courts have exclusive jurisdiction. Any person or entity purchasing or otherwise acquiring or holding any interest in shares of our capital stock shall be deemed to have notice of and to have consented to the provisions of our certificate of incorporation, as amended, described above. This exclusive forum provision may increase the costs associated with bringing a claim, discourage claims or limit a stockholder’s ability to bring a claim in a judicial forum that it finds favorable for disputes with us or any of our directors, officers or stockholders, any of which may discourage lawsuits with respect to such claims. Alternatively, if a court were to find the exclusive forum provision in our certificate of incorporation, as amended, to be inapplicable or unenforceable in an action, we may incur additional costs associated with resolving such action in other jurisdictions, which could materially adversely affect our business, financial condition and results of operations.
The outcome of the putative class action lawsuit filed against us could have a material adverse effect on our business, financial condition, results of operation, and cash flows.
On January 25, 2018, a complaint was filed in the Eastern District of North Carolina on behalf of a putative class of shareholders who purchased our common stock during the period between May 10, 2017 and November 8, 2017. The complaint names us and certain of our executive officers as defendants and alleges violations of the Securities Exchange Act of 1934, as amended, based upon allegedly inaccurate or incomplete information regarding, among other things, the financial performance and business outlook for inVentiv’s business prior to the Merger and with respect to the combined company following the Merger. The plaintiffs seek awards of compensatory damages, among other relief, and their costs and attorneys’ and experts’ fees. We are presently unable to predict the duration, scope or result of this putative class action, or any other related lawsuit or investigation.
63
Our internal control over financial reporting is required to meet all the standards of Section 404 of Sarbanes-Oxley, and failure to achieve and maintain effective internal controls over financial reporting could have a material adverse effect on our stock price, reputation, business, financial condition, results of operations and cash flows.
Section 404 of Sarbanes-Oxley requires management and our independent registered public accounting firm to assess and attest to the effectiveness of internal control over financial reporting on an annual basis. The rules governing the standards that must be met to assess our internal control over financial reporting are complex and require significant documentation, testing, and possible remediation of our existing controls and could result in incurring significant additional expenditures. We are required to design, implement, and test our internal control over financial reporting in order to comply with this obligation. The effort necessary to meet these requirements is time consuming, costly, and complicated, and we must continually evaluate and refine these processes on an ongoing basis. We might encounter problems or delays in completing the implementation of any required improvements and therefore fail to receive a favorable attestation provided by our independent registered public accounting firm.
Further, we have previously had material weaknesses or significant deficiencies in our internal control over financial reporting and new material weaknesses or significant deficiencies may exist or otherwise be discovered in the future. If we fail to maintain an effective internal control environment, such failure could limit our ability to report our financial results accurately and timely, resulting in misstatements and/or restatements of our consolidated financial statements, which may cause investors to lose confidence and have a material adverse effect on our stock price, reputation, business, financial condition, results of operations, and cash flows.
We are a holding company and rely on dividends and other payments, advances, and transfers of funds from our subsidiaries to meet our obligations and pay any dividends.
We have no direct operations and no significant assets other than ownership of 100% of the capital stock of our subsidiaries. Because we conduct our operations through our subsidiaries, we depend on those entities for dividends and other payments to generate the funds necessary to meet our financial obligations, and to pay any dividends with respect to our stock. Legal and contractual restrictions in the Credit Agreement and other agreements, which may govern future indebtedness of our subsidiaries, as well as the financial condition and operating requirements of our subsidiaries, may limit our ability to obtain cash from our subsidiaries. The earnings from, or other available assets of, our subsidiaries might not be sufficient to pay dividends, make distributions, or loans to enable us to pay any dividends on our stock or other obligations. Any of the foregoing could materially and adversely affect our business, financial condition, results of operations, and cash flows.
General Risk Factors
Our stock price is subject to volatility, which could have a material adverse impact on investors and employee retention.
Since our initial public offering in November 2014 (the “IPO”), the price of our stock, as reported by Nasdaq, has ranged from a low of $19.61 on November 7, 2014 to a high of $104.18 on November 12, 2021. In addition, securities markets worldwide have experienced, and are likely to continue to experience, significant price and volume fluctuations. This market volatility, as well as general economic, market or political conditions, could affect stock price in ways that may be unrelated to our operating performance. The trading price of our stock is subject to significant price fluctuations in response to many factors, including:
|
|
• |
market conditions or trends in our industry, including with respect to the regulatory environment, or the economy as a whole; |
64
|
|
• |
fluctuations in quarterly operating results, as well as differences between our actual financial and operating results and those expected by investors; |
|
|
• |
future performance guidance, if any, that we provide to the public, any changes in this guidance or our failure to meet this guidance; |
|
|
• |
changes in financial estimates or ratings by any securities analysts who follow our stock, our failure to meet those estimates or the failure of those analysts to initiate or maintain coverage of our stock; |
|
|
• |
changes in key personnel; |
|
|
• |
entry into new markets; |
|
|
• |
announcements by us or our competitors of new service offerings or significant acquisitions, divestitures, strategic partnerships, joint ventures or capital commitments; |
|
|
• |
actions by competitors; |
|
|
• |
changes in operating performance and market valuations of other companies in the industry; |
|
|
• |
investors’ perceptions of our prospects and the prospects of the industry; |
|
|
• |
investors’ perceptions of the investment opportunity associated with our stock relative to other investment alternatives; |
|
|
• |
the public’s reaction to press releases or other public announcements by us or third parties, including our filings with the SEC; |
|
|
• |
announcements related to litigation; |
|
|
• |
changes in the credit ratings of our debt; |
|
|
• |
the sustainability of an active trading market for our stock; |
|
|
• |
future sales of our stock by our significant shareholders, officers, and directors; and |
|
|
• |
other events or factors, including those resulting from system failures and disruptions, cyber-attacks, earthquakes, hurricanes, war, acts of terrorism, pandemics, other natural disasters, or responses to these events. |
These and other factors may cause the market price and demand for shares of our stock to fluctuate substantially, which could result in reduced liquidity and a decline in the price of our stock. When the market price of a stock is volatile, security holders often institute class action litigation against the company that issued the stock. If we become involved in this type of litigation, regardless of the outcome, we could incur substantial legal costs and our management’s attention could be diverted from the operation of our business, which could have a material adverse effect on our business, financial condition, results of operations, and cash flows.
65
Any litigation against us could be costly and time-consuming to defend.
We are subject to and may become subject, from time to time, to additional legal proceedings and claims that arise in the ordinary course of business or pursuant to governmental or regulatory enforcement activity. While we do not believe that the resolution of any currently pending lawsuits against us will, individually or in the aggregate, have a material adverse effect on our business, financial condition, results of operations, or cash flows, we might be wrong, and future litigation might result in substantial costs and divert management’s attention and resources, which might seriously harm our business, financial condition, results of operations, and cash flows. Insurance might not cover such claims, provide sufficient payments to cover all of the costs to resolve one or more such claims, or continue to be available on terms acceptable to us. In particular, any claim could result in potential liability for us if the claim is outside the scope of the indemnification agreement we have with our customers, our customers do not abide by the indemnification agreement as required or the liability exceeds the amount of any applicable indemnification limits or available insurance coverage. A claim brought against us that is uninsured or underinsured could result in unanticipated costs and could have a material adverse effect on our financial condition, results of operations, cash flows, or reputation.
If our insurance does not cover all of our indemnification obligations and other liabilities associated with our operations, our business, financial condition, results of operations, or cash flows may be materially adversely affected.
We maintain insurance designed to provide coverage for ordinary risks associated with our operations and our ordinary indemnification obligations that we believe to be customary for our industry. The coverage provided by such insurance might not be adequate for all claims we make or may be contested by our insurance carriers. If our insurance is not adequate or available to pay all claims or exposures associated with our operations, or if we are unable to purchase adequate insurance at reasonable rates in the future, our business, financial condition, results of operations, or cash flows may be materially adversely affected.
Item 1B. Unresolved Staff Comments.
None.
Item 2. Properties.
As of December 31, 2021, we had 113 operating facilities located in 50 countries. Most of our facilities consist solely of office space. We lease all of our facilities, except for non-material office space owned in Madrid, Spain; Tiraine, Latvia; and Macclesfield, United Kingdom. Our corporate headquarters and principal executive offices are in Morrisville, North Carolina, where we lease space totaling approximately 258,250 square feet. The lease will expire in January 2032. We also lease space totaling approximately 62,000 square feet in Farnborough, United Kingdom, which will expire in January 2028.
In addition, we lease substantial facilities in Columbus, Ohio; Gurgaon, India; Hyderabad, India; Mexico City, Mexico; Munich, Germany; New York, New York; Newtown, Pennsylvania; Princeton, New Jersey; Pune, India; Quebec City, Canada; Somerset, New Jersey; and Tokyo, Japan. We also maintain offices in various other Asian-Pacific, European, Latin American and North American locations, as well as Australia, the Middle East and Africa. Our leases are not individually material to our business model and all either have options to renew or are in major markets where we believe there are adequate opportunities to continue business operations at terms satisfactory to us.
66
Item 3. Legal Proceedings.
We are party to legal proceedings incidental to our business. While our management currently believes the ultimate outcome of these proceedings, individually and in the aggregate, will not have a material adverse effect on our consolidated financial statements, litigation is subject to inherent uncertainties. Were an unfavorable ruling to occur, there exists the possibility of a material adverse impact on our financial condition and results of operations.
Please refer to “Note 17 – Commitments and Contingencies” to our consolidated financial statements included in Part II, Item 8, “Financial Statements and Supplementary Data” in this Annual Report on Form 10-K for information pertaining to legal proceedings.
Item 4. Mine Safety Disclosures.
Not applicable.
PART II
Item 5. Market for Registrants’ Common Equity, Related Stockholder Matters, and Issuer Purchases of Equity Securities.
Holders of Record
On February 10, 2022, there were approximately 20 shareholders of record of our common stock as reported by our transfer agent. Shareholders of record are those who have the rights, benefits, and responsibilities of ownership of shares registered in their own names. This number does not include shareholders for whom shares are held in “nominee” or “street” name or beneficial owners of common stock whose shares are held in the names of brokers, dealers, or clearing agencies outside of our transfer agent.
Dividend Policy
Since becoming a public company, we have not declared or paid cash dividends on our common stock, nor do we intend to pay cash dividends on our common stock in the foreseeable future. However, in the future, subject to the factors described below and our future liquidity and capitalization, we may change this policy and choose to pay dividends.
We are a holding company that does not conduct any business operations of our own. As a result, our ability to pay cash dividends on our common stock is dependent upon cash dividends, distributions, and other transfers from our subsidiaries. Our ability to pay dividends is currently restricted by the terms of our credit agreement, dated August 1, 2017, as amended (the “Credit Agreement”), and other financing agreements, and may be further restricted by any future indebtedness we or our subsidiaries incur. In addition, under Delaware law, the Board of Directors (the “Board”) may declare dividends only to the extent of our surplus (which is defined as total assets at fair market value minus total liabilities, minus statutory capital) or, if there is no surplus, out of our net profits for the then current and/or immediately preceding fiscal year.
67
Any future determination to pay dividends will be at the discretion of the Board and will take into account restrictions in our debt instruments, including the Credit Agreement, general economic business conditions, our financial condition, results of operations and cash flows, our capital requirements, our business prospects, the ability of our operating subsidiaries to pay dividends and make distributions to us, legal restrictions, and such other factors as the Board may deem relevant. For additional information on these restrictive covenants, see Part II, Item 7, “Management’s Discussion and Analysis of Financial Condition and Results of Operations – Liquidity and Capital Resources” and “Note 4 – Long-Term Debt Obligations” to our consolidated financial statements included in Part II, Item 8, “Financial Statements and Supplementary Data” in this Annual Report on Form 10-K.
Recent Sales of Unregistered Equity Securities
We did not have any sales of unregistered equity securities during 2021.
Purchases of Equity Securities by the Issuer
On November 17, 2020, the Board authorized the repurchase of up to an aggregate of $300.0 million of our Class A common stock, par value $0.01 per share, to be executed from time to time in open market transactions effected through a broker at prevailing market prices, in block trades, or privately negotiated transactions through December 31, 2022 (the “2021 Stock Repurchase Program”). The 2021 Stock Repurchase Program took effect on January 1, 2021. Share repurchases are funded primarily with our working capital, cash flow from operations, and funds available through various borrowing arrangements.
The 2021 Stock Repurchase Program does not obligate us to repurchase any particular amount of our Class A common stock, and may be modified, extended, suspended, or discontinued at any time. The timing and amount of repurchases are determined by our management based on a variety of factors such as the market price of our Class A common stock, our corporate cash requirements, and overall market conditions. The 2021 Stock Repurchase Program is subject to applicable legal requirements, including federal and state securities laws and applicable Nasdaq rules. We may also repurchase shares of our Class A common stock pursuant to a trading plan meeting the requirements of Rule 10b5-1 under the Securities Exchange Act of 1934, as amended, which would permit shares of our Class A common stock to be repurchased when we might otherwise be precluded from doing so by law.
For the year ended December 31, 2021, we repurchased 1,500,000 shares of our Class A common stock in private transactions, for a total purchase price of approximately $117.5 million, representing the entirety of our share repurchases for the year. All such shares were purchased under our 2021 Stock Repurchase Program. We immediately retired all of the repurchased common stock and charged the par value of the shares to common stock. The excess of the repurchase price over the par value was applied on a pro rata basis against additional paid-in capital, with the remainder applied to accumulated deficit.
There were no share repurchases during the three months ended December 31, 2021. As of December 31, 2021, we have remaining authorization to repurchase up to approximately $182.5 million of shares of our Class A Common Stock under the 2021 Stock Repurchase Program.
68
Stock Performance Graph
The information included under the heading “Stock Performance Graph” is “furnished” and not “filed” for purposes of Section 18 of the Exchange Act, or otherwise subject to the liabilities of that section, nor shall it be deemed to be “soliciting material” subject to Regulation 14A or incorporated by reference in any filing under the Securities Act of 1933, as amended, or the Exchange Act of 1934, as amended.
Our common stock is traded on the Nasdaq under the symbol “SYNH.” From November 7, 2014 through January 7, 2018, our common stock was listed on the Nasdaq under the trading symbol “INCR.” The Stock Price Performance Graph set forth below compares the cumulative total shareholder return on our common stock for the period from December 31, 2016 through December 31, 2021, with the cumulative total return of the Nasdaq Composite Index and the Nasdaq Health Care Index over the same period. The comparison assumes $100 was invested on December 31, 2016 in our common stock, in the Nasdaq Composite Index, and in the Nasdaq Health Care Index and assumes reinvestment of dividends, if any.
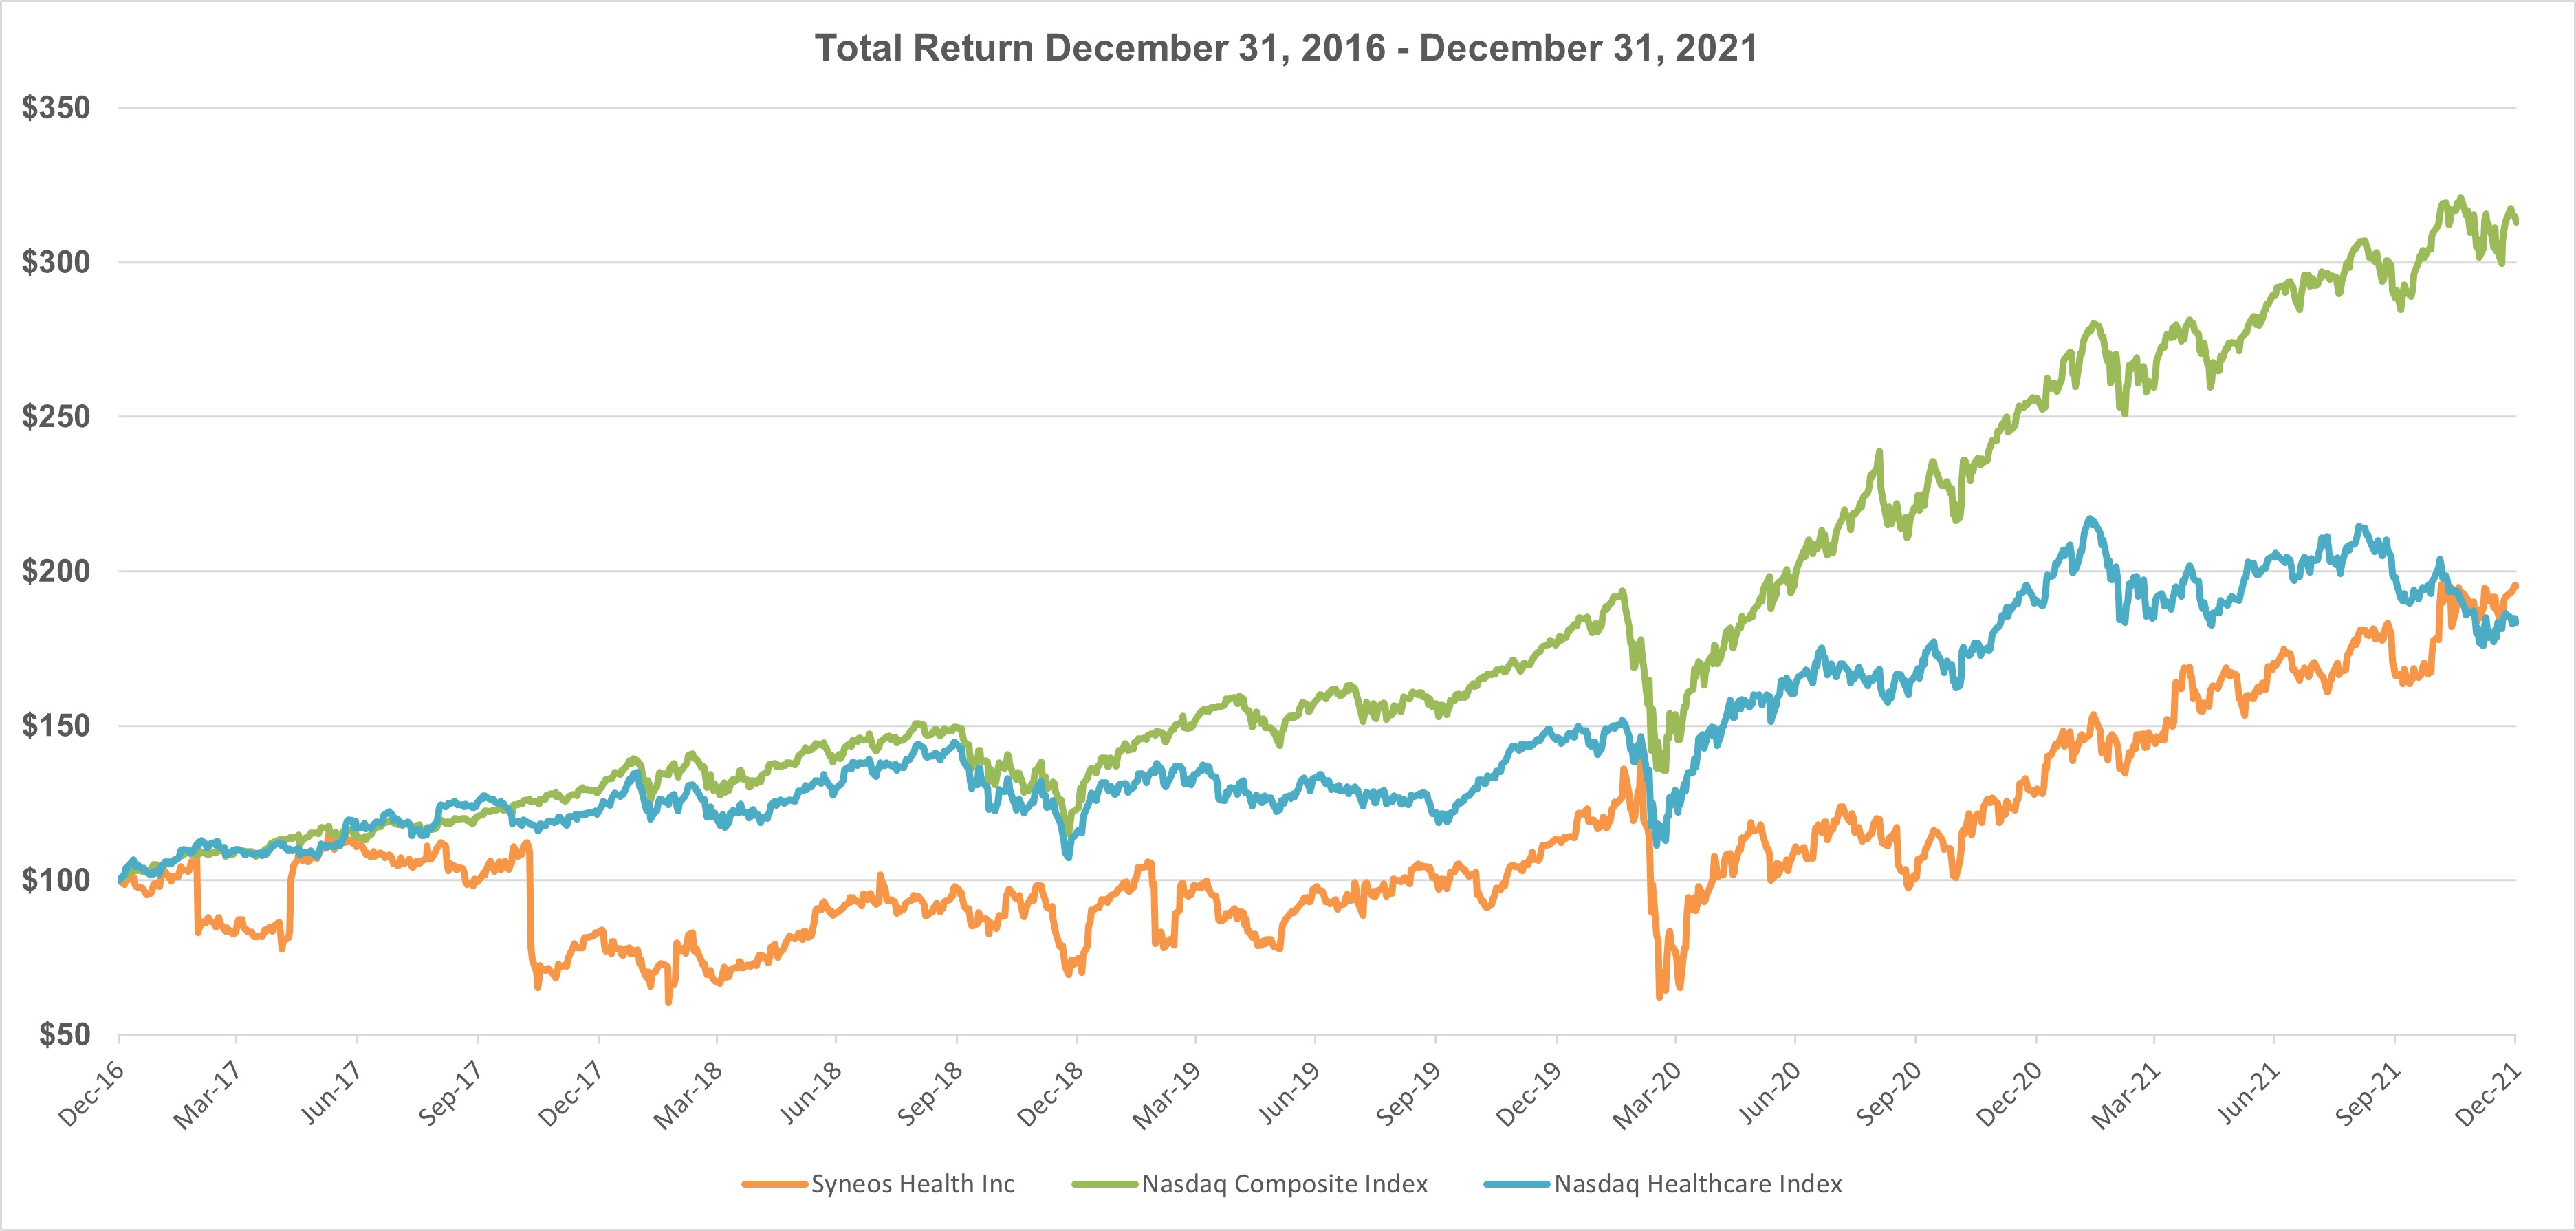
The stock price performance shown on the graph above is not necessarily indicative of future price performance. Information used in the graph was obtained from the Nasdaq Stock Market, a source believed to be reliable, but we are not responsible for any errors or omissions in such information.
Item 6. [Reserved]
69
Item 7. Management’s Discussion and Analysis of Financial Condition and Results of Operations.
The following discussion and analysis of our financial condition and results of operations should be read together with the consolidated financial statements and the related notes included in Part II, Item 8, “Financial Statements and Supplementary Data” in this Annual Report on Form 10-K. This discussion contains forward-looking statements related to future events and our future financial performance that are based on current expectations and subject to risks and uncertainties. Our actual results may differ materially from those anticipated in these forward-looking statements as a result of many important factors, including those described in Part I, Item 1A, “Risk Factors” and elsewhere in this Annual Report on Form 10-K.
This section of the Form 10-K generally discusses our results of operations for the years ended December 31, 2021 and 2020, including a year-to-year comparison between 2021 and 2020. For a full discussion related to the results of operations for the year ended December 31, 2019, including a year-to-year comparison between 2020 and 2019, refer to Part II, Item 7, “Management's Discussion and Analysis of Financial Condition and Results of Operations” in our Form 10-K for the year ended December 31, 2020.
Overview of Our Business and Services
We are the only fully integrated biopharmaceutical solutions organization purpose-built to accelerate customer success. We lead with a product development mindset, strategically blending clinical development, medical affairs, and commercial capabilities to address modern market realities for customers in the biopharmaceutical, biotechnology, and healthcare industries. We offer both stand-alone and integrated biopharmaceutical product development solutions ranging from early phase (Phase I) clinical trials to the full commercialization of biopharmaceutical products, with the goal of increasing the likelihood of regulatory approval and commercial success.
Our operations are divided into two reportable segments, Clinical Solutions and Commercial Solutions. Our Clinical Solutions segment offers comprehensive global services for the development of diagnostics, drugs, biologics, devices, and digital therapeutics that span Phases I to IV of clinical development. The segment is organized around clinical pharmacology and bioanalytical services, workforce deployment, full-service clinical studies, real world evidence, and consulting. Our Commercial Solutions segment provides commercialization services, including deployment solutions, communication solutions (public relations, advertising, and medical communications), and consulting services. We integrate our clinical and commercial capabilities into customized solutions by sharing knowledge, data, and insights. This collaboration across the development and commercialization continuum facilitates unique insights into patient populations, therapeutic environments, product timelines, and the competitive landscape. For further discussion, refer to Part I, Item 1, “Business” in this Annual Report on Form 10-K.
We acquired the following companies during 2021:
|
|
• |
StudyKIK, a leading clinical trial recruitment and retention company, expanding our portfolio of patient-direct, technology-enabled solutions. StudyKIK supports patient recruitment, patient retention, eConsent Solutions, Telemedicine Video Calling, and study companion mobile applications to expedite clinical trials, which we believe will result in benefits to customers including accelerated patient enrollment and retention, extensive patient population-based insights, improved site, sponsor, and physician experiences, and reduced patient burden. |
|
|
• |
RxDataScience, a specialist organization that helps biopharmaceutical customers solve challenging problems through advanced analytics, data management, and artificial intelligence. RxDataScience is well aligned to our lab to life model offering advanced analytic solutions across the entire product development spectrum from clinical through commercial. |
70
Prior period segment results have been recast to reflect the transfer of the Kinapse Regulatory and Operations Consulting service lines from Commercial Solutions to Clinical Solutions to align with management reporting in 2021.
COVID-19 Pandemic
The ongoing COVID-19 pandemic and associated economic repercussions have significantly impacted, and are expected to continue to impact, our business and our operations. Within Clinical Solutions, the pandemic has accelerated the adoption of virtual engagement with sites and patients, creating increased demand for decentralized solutions capabilities. As a result, we have continued to experience reduced travel and other reimbursable out-of-pocket expenses related to lower physical monitoring visits for Clinical Solutions relative to pre-pandemic levels. We have also experienced a reduction in the costs associated with investigational medicinal products, which has also resulted in lower reimbursable out-of-pocket expenses. Within Commercial Solutions, we have continued to experience fewer field team visits to healthcare providers and increased virtual investigator meetings. Therefore, we expect reimbursable out-of-pocket expenses as a percentage of revenue to remain lower relative to pre-pandemic levels. With the spread of COVID-19 variants, the ongoing impacts of the COVID-19 pandemic could adversely impact our business and results of operations. See Part I, Item 1A “Risk Factors” in this Annual Report on Form 10-K for further discussion of the potential impact of the pandemic on our business.
New Business Awards and Backlog
We add new business awards to backlog when we enter into a contract or when we receive a written commitment from the customer selecting us as a service provider, provided that:
|
|
• |
collection of the award value is probable; |
|
|
• |
the project or projects are expected to commence within a certain period of time from the end of the quarter in which the award was granted; |
|
|
• |
project contingencies such as the outcome of other clinical trials, funding approvals, or other events, are not anticipated to prevent the project or projects from commencing in accordance with the expected timeline; |
|
|
• |
the customer has entered or intends to enter into a comprehensive contract as soon as practicable; and |
|
|
• |
for awards related to deployment solutions and functional service provider offerings, a maximum of twelve months of services are included in the award value. |
In addition, we continually evaluate our backlog to determine if any of the previously awarded work is no longer expected to be performed, regardless of whether we have received formal cancellation notice from the customer. If we determine that any previously awarded work is no longer probable of being performed, we remove the value from our backlog based on the risk of cancellation. We recognize revenue from these awards as services are performed, provided we have received proper authorization from the customer.
We report new business awards for our Clinical Solutions and Commercial Solutions segments as well as backlog for our Clinical Solutions segment and the deployment solutions offering within our Commercial Solutions segment. We do not report backlog for the remaining service offerings in the Commercial Solutions segment.
71
Backlog
Our backlog consists of anticipated future revenue from business awards that either have not started, or that are in process and have not been completed. Our backlog also reflects any cancellation or adjustment activity related to these awards. The average duration of our contracts will fluctuate from period to period based on the contracts comprising our backlog at any given time. The majority of our contracts contain early termination provisions that typically require notice periods ranging from 30 to 90 days.
Our backlog as of December 31 was as follows (in millions):
|
|
|
2021 |
|
|
2020 |
|
|
Change |
|
|||||||
|
Clinical Solutions |
|
$ |
10,567.3 |
|
|
$ |
10,270.5 |
|
|
$ |
296.8 |
|
|
|
2.9 |
% |
|
Commercial Solutions - Deployment Solutions |
|
|
860.3 |
|
|
|
711.6 |
|
|
|
148.7 |
|
|
|
20.9 |
% |
|
Total backlog |
|
$ |
11,427.6 |
|
|
$ |
10,982.1 |
|
|
$ |
445.5 |
|
|
|
4.1 |
% |
We expect approximately $4.68 billion of our backlog as of December 31, 2021 will be recognized as revenue during 2022. We adjust the amount of our backlog each quarter for the effects of fluctuations in foreign currency exchange rates.
Net New Business Awards
New business awards, net of cancellations, were as follows (in millions):
|
|
|
Year Ended December 31, |
|
|
Change |
|
||||||||||||||||||||||
|
|
|
2021 |
|
|
2020 |
|
|
2019 |
|
|
2021 to 2020 |
|
|
2020 to 2019 |
|
|||||||||||||
|
Clinical Solutions |
|
$ |
4,362.6 |
|
|
$ |
4,735.1 |
|
|
$ |
4,183.0 |
|
|
$ |
(372.5 |
) |
|
|
(7.9 |
)% |
|
$ |
552.1 |
|
|
|
13.2 |
% |
|
Commercial Solutions |
|
|
1,370.1 |
|
|
|
1,128.0 |
|
|
|
1,270.6 |
|
|
|
242.1 |
|
|
|
21.5 |
% |
|
|
(142.6 |
) |
|
|
(11.2 |
)% |
|
Total net new business awards |
|
$ |
5,732.7 |
|
|
$ |
5,863.1 |
|
|
$ |
5,453.6 |
|
|
$ |
(130.4 |
) |
|
|
(2.2 |
)% |
|
$ |
409.5 |
|
|
|
7.5 |
% |
New business awards have varied and may continue to vary significantly from year to year. Fluctuations in our net new business award levels often result from the fact that we may receive a small number of relatively large orders in any given reporting period. Because of these large orders, our backlog and net new business awards in a reporting period may reach levels that are not sustainable in subsequent reporting periods.
We believe that our backlog and net new business awards might not be consistent indicators of future revenue because they have been, and likely will continue to be, affected by a number of factors, including the variable size and duration of projects, many of which are performed over several years, and changes to the scope of work during the course of projects. Additionally, projects may be canceled or delayed by the customer or regulatory authorities. Net new business awards and backlog have been and we expect will continue to be affected by the broad effects of the COVID-19 pandemic on the global economy and major financial markets, as well as various other risks and uncertainties detailed in Part I, Item 1A, “Risk Factors – Risks Related to Our Business – The COVID-19 pandemic has adversely impacted our business and results of operations, and is expected to continue to do so” of this Annual Report on Form 10-K. We generally do not have a contractual right to the full amount of the awards reflected in our backlog. If a customer cancels an award, we might be reimbursed for the costs we have incurred. As we increasingly compete for and enter into large contracts that are more global in nature, we expect that the rate at which our backlog and net new business awards convert into revenue is likely to decrease, and the duration of projects and the period over which related revenue is recognized to lengthen. For more information about risks related to our backlog see Part I, Item 1A, “Risk Factors – Risks Related to Our Business – Our backlog might not be indicative of our future revenues, and we might not realize all of the anticipated future revenue reflected in our backlog” of this Annual Report on Form 10-K.
72
Results of Operations
The following table sets forth amounts from our consolidated financial statements along with dollar and percentage changes (in thousands, except percentages):
|
|
|
Year Ended December 31, |
|
|
Change |
|
||||||||||||||||||||||
|
|
|
2021 |
|
|
2020 |
|
|
2019 |
|
|
2021 to 2020 |
|
|
2020 to 2019 |
|
|||||||||||||
|
Revenue |
|
$ |
5,212,970 |
|
|
$ |
4,415,777 |
|
|
$ |
4,675,815 |
|
|
$ |
797,193 |
|
|
|
18.1 |
% |
|
$ |
(260,038 |
) |
|
|
(5.6 |
)% |
|
Costs and operating expenses: |
|
|
|
|
|
|
|
|
|
|
|
|
|
|
|
|
|
|
|
|
|
|
|
|
|
|
|
|
|
Direct costs (exclusive of depreciation and amortization) |
|
|
3,994,484 |
|
|
|
3,398,142 |
|
|
|
3,645,905 |
|
|
|
596,342 |
|
|
|
17.5 |
% |
|
|
(247,763 |
) |
|
|
(6.8 |
)% |
|
Selling, general, and administrative expenses |
|
|
570,765 |
|
|
|
472,726 |
|
|
|
507,556 |
|
|
|
98,039 |
|
|
|
20.7 |
% |
|
|
(34,830 |
) |
|
|
(6.9 |
)% |
|
Restructuring and other costs |
|
|
22,816 |
|
|
|
29,414 |
|
|
|
42,135 |
|
|
|
(6,598 |
) |
|
|
(22.4 |
)% |
|
|
(12,721 |
) |
|
|
(30.2 |
)% |
|
Depreciation and amortization |
|
|
235,625 |
|
|
|
222,352 |
|
|
|
242,465 |
|
|
|
13,273 |
|
|
|
6.0 |
% |
|
|
(20,113 |
) |
|
|
(8.3 |
)% |
|
Total operating expenses |
|
|
4,823,690 |
|
|
|
4,122,634 |
|
|
|
4,438,061 |
|
|
|
701,056 |
|
|
|
17.0 |
% |
|
|
(315,427 |
) |
|
|
(7.1 |
)% |
|
Income from operations |
|
|
389,280 |
|
|
|
293,143 |
|
|
|
237,754 |
|
|
|
96,137 |
|
|
|
32.8 |
% |
|
|
55,389 |
|
|
|
23.3 |
% |
|
Total other expense, net |
|
|
74,120 |
|
|
|
89,485 |
|
|
|
136,045 |
|
|
|
(15,365 |
) |
|
|
(17.2 |
)% |
|
|
(46,560 |
) |
|
|
(34.2 |
)% |
|
Income before provision for income taxes |
|
|
315,160 |
|
|
|
203,658 |
|
|
|
101,709 |
|
|
|
111,502 |
|
|
|
54.7 |
% |
|
|
101,949 |
|
|
|
100.2 |
% |
|
Income tax expense (benefit) |
|
|
80,329 |
|
|
|
10,871 |
|
|
|
(29,549 |
) |
|
|
69,458 |
|
|
|
638.9 |
% |
|
|
40,420 |
|
|
n/m |
|
|
|
Net income |
|
$ |
234,831 |
|
|
$ |
192,787 |
|
|
$ |
131,258 |
|
|
$ |
42,044 |
|
|
|
21.8 |
% |
|
$ |
61,529 |
|
|
|
46.9 |
% |
Revenue
For the year ended December 31, 2021, our revenue increased by $797.2 million, or 18.1%, to $5.21 billion from $4.42 billion for the year ended December 31, 2020. This increase was primarily driven by growth in both our Clinical Solutions and Commercial Solutions segments as discussed below.
No single customer accounted for greater than 10% of our total consolidated revenue for the year ended December 31, 2021 or 2020. Revenue from our top five customers accounted for approximately 22% of revenue for both of the years ended December 31, 2021 and 2020.
Revenue for each of our segments was as follows (dollars in thousands):
|
|
|
Year Ended December 31, |
|
|
Change |
|
||||||||||||||||||||||
|
|
|
2021 |
|
|
2020 |
|
|
2019 |
|
|
2021 to 2020 |
|
|
2020 to 2019 |
|
|||||||||||||
|
Clinical Solutions |
|
$ |
4,009,057 |
|
|
$ |
3,339,451 |
|
|
$ |
3,450,223 |
|
|
$ |
669,606 |
|
|
|
20.1 |
% |
|
$ |
(110,772 |
) |
|
|
(3.2 |
)% |
|
% of total |
|
|
76.9 |
% |
|
|
75.6 |
% |
|
|
73.8 |
% |
|
|
|
|
|
|
|
|
|
|
|
|
|
|
|
|
|
Commercial Solutions |
|
|
1,203,913 |
|
|
|
1,076,326 |
|
|
|
1,225,592 |
|
|
|
127,587 |
|
|
|
11.9 |
% |
|
|
(149,266 |
) |
|
|
(12.2 |
)% |
|
% of total |
|
|
23.1 |
% |
|
|
24.4 |
% |
|
|
26.2 |
% |
|
|
|
|
|
|
|
|
|
|
|
|
|
|
|
|
|
Total revenue |
|
$ |
5,212,970 |
|
|
$ |
4,415,777 |
|
|
$ |
4,675,815 |
|
|
$ |
797,193 |
|
|
|
18.1 |
% |
|
$ |
(260,038 |
) |
|
|
(5.6 |
)% |
Clinical Solutions
For the year ended December 31, 2021, revenue attributable to our Clinical Solutions segment increased compared to the prior year, primarily driven by recovery from the COVID-19 pandemic and the acquisitions of Synteract and Illingworth Research that were completed in the fourth quarter of 2020. The recovery from the COVID-19 pandemic includes increased project start-ups, including larger pharmaceutical customer relationships and COVID-19 projects that generally have higher reimbursable out-of-pocket expenses. For the year ended December 31, 2021, revenue was positively impacted by $40.9 million from foreign currency exchange rates fluctuations compared to the prior year.
73
We experienced reduced impacts from the COVID-19 pandemic to our Clinical Solutions revenue during 2021 as compared to 2020 as governments eased restrictions. Future impacts are dependent on the continuation of the pandemic including the potential spread of COVID-19 variants. We believe the primary ongoing impact to revenue relates to increased demand for decentralized solutions capabilities including remote monitoring, which results in lower reimbursable out-of-pocket expenses. Therefore, we expect reimbursable out-of-pocket expenses as a percentage of revenue to remain lower relative to pre-pandemic levels.
Commercial Solutions
For the year ended December 31, 2021, revenue attributable to our Commercial Solutions segment increased compared to the prior year, primarily driven by recovery from the COVID-19 pandemic and strength in new project start-ups. The revenue increases were partially offset by decreases related to the divestiture of our medication adherence business in the fourth quarter of 2020.
We experienced reduced impacts from the COVID-19 pandemic to our Commercial Solutions revenue during 2021 as compared to 2020 as governments eased restrictions. Future impacts are dependent on the continuation of the pandemic including the potential spread of COVID-19 variants. We believe the primary ongoing impacts to revenue relate to declines in field team visits to healthcare providers and increased virtual investigator meetings, which result in lower reimbursable out-of-pocket expenses. Therefore, we expect reimbursable out-of-pocket expenses as a percentage of revenue to remain lower relative to pre-pandemic levels.
Direct Costs
Direct costs consist principally of compensation expense and benefits associated with our employees and other employee-related costs, and reimbursable out-of-pocket expenses directly related to delivering on our projects. While we have some ability to manage the majority of these costs relative to the amount of contracted services we have during any given period, direct costs as a percentage of revenue can vary from period to period. Such fluctuations are due to a variety of factors, including, among others: (i) the level of staff utilization on our projects; (ii) adjustments to the timing of work on specific customer contracts; (iii) the experience mix of personnel assigned to projects; (iv) the service mix and pricing of our contracts; and (v) the timing of the incurrence of reimbursable out-of-pocket expenses. Relative to pre-pandemic levels, we continue to experience reduced travel and other reimbursable out-of-pocket expenses related to lower physical monitoring visits for Clinical Solutions, as well as fewer field team visits to healthcare providers and investigator meetings for Commercial Solutions.
Direct costs were as follows (dollars in thousands):
|
|
|
Year Ended December 31, |
|
|
Change |
|
||||||||||||||||||||||
|
|
|
2021 |
|
|
2020 |
|
|
2019 |
|
|
2021 to 2020 |
|
|
2020 to 2019 |
|
|||||||||||||
|
Direct costs (exclusive of depreciation and amortization) |
|
$ |
3,994,484 |
|
|
$ |
3,398,142 |
|
|
$ |
3,645,905 |
|
|
$ |
596,342 |
|
|
|
17.5 |
% |
|
$ |
(247,763 |
) |
|
|
(6.8 |
)% |
|
% of revenue |
|
|
76.6 |
% |
|
|
77.0 |
% |
|
|
78.0 |
% |
|
|
|
|
|
|
|
|
|
|
|
|
|
|
|
|
|
Gross margin % |
|
|
23.4 |
% |
|
|
23.0 |
% |
|
|
22.0 |
% |
|
|
|
|
|
|
|
|
|
|
|
|
|
|
|
|
For the year ended December 31, 2021, our direct costs increased by $596.3 million, or 17.5%, compared to the year ended December 31, 2020, primarily driven by higher reimbursable out-of-pocket expenses, impacts from acquisitions, and the end of temporary cost management strategies in response to the COVID-19 pandemic implemented in the prior year. These increases were partially offset by decreases from business divestitures in 2020.
74
Clinical Solutions
Direct costs for our Clinical Solutions segment, excluding share-based compensation expense, were as follows (dollars in thousands):
|
|
|
Year Ended December 31, |
|
|
Change |
|
||||||||||||||||||||||
|
|
|
2021 |
|
|
2020 |
|
|
2019 |
|
|
2021 to 2020 |
|
|
2020 to 2019 |
|
|||||||||||||
|
Direct costs |
|
$ |
3,005,938 |
|
|
$ |
2,513,240 |
|
|
$ |
2,637,016 |
|
|
$ |
492,698 |
|
|
|
19.6 |
% |
|
$ |
(123,776 |
) |
|
|
(4.7 |
)% |
|
% of segment revenue |
|
|
75.0 |
% |
|
|
75.3 |
% |
|
|
76.4 |
% |
|
|
|
|
|
|
|
|
|
|
|
|
|
|
|
|
|
Segment gross margin % |
|
|
25.0 |
% |
|
|
24.7 |
% |
|
|
23.6 |
% |
|
|
|
|
|
|
|
|
|
|
|
|
|
|
|
|
For the year ended December 31, 2021, our Clinical Solutions segment direct costs increased by $492.7 million, or 19.6%, compared to the year ended December 31, 2020, primarily driven by impacts from acquisitions, higher reimbursable out-of-pocket expenses, the end of temporary cost management strategies in response to the COVID-19 pandemic implemented in the prior year, and negative impacts of foreign exchange rate fluctuations. These increases were partially offset by positive impacts from our ForwardBound margin enhancement initiative.
Gross margins for our Clinical Solutions segment were 25.0% and 24.7% for the years ended December 31, 2021 and 2020, respectively. Gross margin was higher during 2021 as compared to the prior year primarily due to revenue growth and positive impacts from our ForwardBound margin enhancement initiative, partially offset by higher reimbursable out-of-pocket expenses, the end of temporary cost management strategies in response to the COVID-19 pandemic implemented in the prior year, and negative impacts of foreign exchange rate fluctuations.
Commercial Solutions
Direct costs for our Commercial Solutions segment, excluding share-based compensation expense, were as follows (dollars in thousands):
|
|
|
Year Ended December 31, |
|
|
Change |
|
||||||||||||||||||||||
|
|
|
2021 |
|
|
2020 |
|
|
2019 |
|
|
2021 to 2020 |
|
|
2020 to 2019 |
|
|||||||||||||
|
Direct costs |
|
$ |
955,326 |
|
|
$ |
853,555 |
|
|
$ |
979,878 |
|
|
$ |
101,771 |
|
|
|
11.9 |
% |
|
$ |
(126,323 |
) |
|
|
(12.9 |
)% |
|
% of segment revenue |
|
|
79.4 |
% |
|
|
79.3 |
% |
|
|
80.0 |
% |
|
|
|
|
|
|
|
|
|
|
|
|
|
|
|
|
|
Segment gross margin % |
|
|
20.6 |
% |
|
|
20.7 |
% |
|
|
20.0 |
% |
|
|
|
|
|
|
|
|
|
|
|
|
|
|
|
|
For the year ended December 31, 2021, our Commercial Solutions segment direct costs increased by $101.8 million, or 11.9%, compared to the year ended December 31, 2020, primarily related to recovery from the COVID-19 pandemic and the end of temporary cost management strategies implemented in the prior year, partially offset by the divestiture of our medication adherence business in the fourth quarter of 2020.
Gross margins for our Commercial Solutions segment were 20.6% and 20.7% for the years ended December 31, 2021 and 2020, respectively. Gross margin was lower during 2021 as compared to the prior year primarily due to higher costs in the current year primarily driven by recovery from the COVID-19 pandemic, including higher reimbursable out-of-pocket expenses and the end of temporary cost management strategies in response to the COVID-19 pandemic implemented in the prior year, partially offset by revenue growth.
75
Selling, General and Administrative Expenses
Selling, general and administrative expenses were as follows (dollars in thousands):
|
|
|
Year Ended December 31, |
|
|
Change |
|
||||||||||||||||||||||
|
|
|
2021 |
|
|
2020 |
|
|
2019 |
|
|
2021 to 2020 |
|
|
2020 to 2019 |
|
|||||||||||||
|
Selling, general and administrative expenses |
|
$ |
570,765 |
|
|
$ |
472,726 |
|
|
$ |
507,556 |
|
|
$ |
98,039 |
|
|
|
20.7 |
% |
|
$ |
(34,830 |
) |
|
|
(6.9 |
)% |
|
% of total revenue |
|
|
10.9 |
% |
|
|
10.7 |
% |
|
|
10.9 |
% |
|
|
|
|
|
|
|
|
|
|
|
|
|
|
|
|
Selling, general, and administrative expenses for the year ended December 31, 2021 increased compared to the prior year primarily due to acquisitions, including higher transaction and integration-related expenses, and the end of temporary cost management strategies in response to the COVID-19 pandemic implemented in the prior year. Transaction and integration-related expenses are no longer reported separately and are included in selling, general, and administrative expenses. These increases were partially offset by positive impacts from our ForwardBound margin enhancement initiative.
Restructuring and Other Costs
Restructuring and other costs were $22.8 million and $29.4 million for the years ended December 31, 2021 and 2020, respectively. The costs incurred during 2021 were primarily related to our ForwardBound margin enhancement initiative as we continue the ongoing evaluations of our workforce and facilities infrastructure needs in an effort to optimize our resources. The costs incurred during 2020 were primarily related to our cost management strategies in response to the COVID-19 pandemic, as well as our ForwardBound initiative.
Restructuring and other costs consisted of the following (in thousands):
|
|
|
Year Ended December 31, |
|
|||||||||
|
|
|
2021 |
|
|
2020 |
|
|
2019 |
|
|||
|
Employee severance and benefit costs |
|
$ |
14,526 |
|
|
$ |
26,321 |
|
|
$ |
25,243 |
|
|
Facility and lease termination costs |
|
|
8,226 |
|
|
|
2,313 |
|
|
|
16,202 |
|
|
Other costs |
|
|
64 |
|
|
|
780 |
|
|
|
690 |
|
|
Total restructuring and other costs |
|
$ |
22,816 |
|
|
$ |
29,414 |
|
|
$ |
42,135 |
|
We expect to continue to incur costs related to the restructuring of our operations in order to achieve cost savings and targeted synergies related to our acquisitions. However, the timing and the amount of these costs depends on various factors, including, but not limited to, identifying and realizing synergy opportunities and executing the integration of our combined operations. We may also continue to incur additional restructuring and other costs during and beyond 2022 related to our ForwardBound margin enhancement initiative.
Depreciation and Amortization Expense
Total depreciation and amortization expense was $235.6 million and $222.4 million for the years ended December 31, 2021 and 2020, respectively. The increase in total depreciation and amortization expense in 2021 compared to 2020 was primarily due to the acquisitions that were completed in the fourth quarter of 2020, partially offset by decreases due to fully amortized intangible assets from prior acquisitions.
76
Total Other Expense, Net
Total other expense, net consisted of the following (dollars in thousands):
|
|
|
Year Ended December 31, |
|
|
Change |
|
||||||||||||||||||||||
|
|
|
2021 |
|
|
2020 |
|
|
2019 |
|
|
2021 to 2020 |
|
|
2020 to 2019 |
|
|||||||||||||
|
Interest income |
|
$ |
(111 |
) |
|
$ |
(265 |
) |
|
$ |
(7,542 |
) |
|
$ |
154 |
|
|
|
58.1 |
% |
|
$ |
7,277 |
|
|
|
96.5 |
% |
|
Interest expense |
|
|
79,252 |
|
|
|
91,145 |
|
|
|
129,820 |
|
|
|
(11,893 |
) |
|
|
(13.0 |
)% |
|
|
(38,675 |
) |
|
|
(29.8 |
)% |
|
Loss (gain) on extinguishment of debt |
|
|
3,612 |
|
|
|
1,581 |
|
|
|
(10,395 |
) |
|
|
2,031 |
|
|
|
128.5 |
% |
|
|
11,976 |
|
|
n/m |
|
|
|
Other (income) expense, net |
|
|
(8,633 |
) |
|
|
(2,976 |
) |
|
|
24,162 |
|
|
|
(5,657 |
) |
|
|
(190.1 |
)% |
|
|
(27,138 |
) |
|
n/m |
|
|
|
Total other expense, net |
|
$ |
74,120 |
|
|
$ |
89,485 |
|
|
$ |
136,045 |
|
|
$ |
(15,365 |
) |
|
|
(17.2 |
)% |
|
$ |
(46,560 |
) |
|
|
(34.2 |
)% |
Total other expense, net was $74.1 million and $89.5 million for the years ended December 31, 2021 and 2020, respectively. The decrease in total other expense, net in 2021 compared to 2020 was primarily due to a decrease in interest expense, primarily related to reductions in our higher interest rate debt as a result of debt prepayments and refinancing transactions and lower interest rates on our variable interest rate debt. Other (income) expense, net primarily consists of foreign currency gains and losses that result from exchange rate fluctuations on our monetary asset balances denominated in currencies other than our functional currency, other gains and losses related to investments, and contingent consideration related to divested businesses.
The loss on extinguishment of debt was $3.6 million for the year ended December 31, 2021 compared to $1.6 million for the year ended December 31, 2020. These losses were incurred primarily as a result of our debt prepayments and refinancing transactions.
Income Tax Expense
For the year ended December 31, 2021, we recorded income tax expense of $80.3 million, on pre-tax income of $315.2 million. The effective income tax rate for the year ended December 31, 2021 varied from the U.S. federal statutory income tax rate of 21.0% primarily due to foreign income inclusions such as the Global Intangible Low-Taxed Income (“GILTI”) provisions, state and local taxes on U.S. income, and research and general business credits.
For the year ended December 31, 2020, we recorded income tax expense of $10.9 million, on pre-tax income of $203.7 million. The effective income tax rate for the year ended December 31, 2020 varied from the U.S. federal statutory income tax rate of 21.0% primarily due to the recognition of U.S. federal and foreign unrecognized tax benefits, changes to income tax valuation allowances on deferred tax assets, and tax benefits recognized related to the elections to retroactively apply regulations relative to the GILTI high-tax exclusion and Section 163(j) CFC group election for interest deductibility.
We currently maintain valuation allowances against a portion of our state deferred tax assets and a portion of our foreign deferred tax assets as of December 31, 2021. We intend to continue to maintain valuation allowances on these deferred tax assets until there is sufficient evidence to support the reversal of all or some portion of these allowances.
Liquidity and Capital Resources
Key measures of our liquidity were as follows as of December 31 (in thousands):
|
|
|
2021 |
|
|
2020 |
|
||
|
Balance sheet statistics: |
|
|
|
|
|
|
|
|
|
Cash and cash equivalents |
|
$ |
106,363 |
|
|
$ |
271,901 |
|
|
Restricted cash |
|
|
112 |
|
|
|
272 |
|
|
Working capital (excluding restricted cash) |
|
|
112,228 |
|
|
|
160,409 |
|
77
As of December 31, 2021, we had $106.5 million of cash, cash equivalents, and restricted cash. As of December 31, 2021, substantially all of our cash, cash equivalents, and restricted cash was held within the U.S. In addition, we had $585.8 million (net of $14.2 million in outstanding letters of credit (“LOCs”)) available for borrowing under our $600.0 million Revolver, of which $135.8 million was available for LOCs.
We have historically funded our operations and growth, including acquisitions, primarily with our working capital, cash flow from operations and funds available through various borrowing arrangements. Our principal liquidity requirements are to fund our debt service obligations, capital expenditures, expansion of service offerings, possible acquisitions, integration and restructuring costs, geographic expansion, stock repurchases, working capital, and other general corporate expenses. Cash from operations also could be affected by various risks and uncertainties, including, but not limited to, the effects of the COVID-19 pandemic on the global economy and major financial markets, as well as other risks detailed in Part I, Item 1A, “Risk Factors” in this Annual Report on Form 10-K. Based on past performance and current expectations, we believe our cash and cash equivalents, cash generated from operations, and funds available under the Revolver will be sufficient to meet our working capital needs, capital expenditures, scheduled debt and interest payments, income tax obligations, and other currently anticipated liquidity requirements for at least the next 12 months.
We may seek to raise additional capital, particularly in the event of a sustained market deterioration, which could be in the form of bonds, convertible debt, or equity. If we obtain additional capital by issuing equity, the interests of our existing stockholders will be diluted. If we incur additional indebtedness, that indebtedness may contain significant financial and other covenants that may significantly restrict our operations. We cannot assure you that we could obtain any refinancing or additional financing we may seek on favorable terms or at all.
Contractual Obligations
In addition to the indebtedness and related interest payments, operating leases, deferred compensation, commitments to unconsolidated affiliates, contingent obligations assumed in business combinations, and uncertain tax positions discussed elsewhere, we signed a non-cancellable purchase obligation of $22.1 million during the fourth quarter of 2021, with equal quarterly payments due over the next four years, beginning in the third quarter of 2022.
Indebtedness
As of December 31, 2021, we had approximately $2.84 billion of total principal indebtedness (including $54.8 million in finance lease obligations), consisting of $1.79 billion in term loan debt, $600.0 million under the Notes, and $400.0 million in borrowings against our accounts receivable financing agreement. Approximately $1.03 billion of our indebtedness (excluding finance leases) was subject to variable interest rates.
Credit Agreement
We are party to a credit agreement (as amended, the “Credit Agreement”) that included a $1.55 billion Term Loan A facility (“Term Loan A”) that has two tranches, tranche one that matures on March 26, 2024 and tranche two that matures on August 1, 2024, a $1.60 billion Term Loan B facility (“Term Loan B”) that was paid in full during the second quarter of 2021, and a $600.0 million Revolver that matures on August 1, 2024. The Revolver includes LOCs with a sublimit of $150.0 million.
78
On June 30, 2021 (the “Closing Date”), we entered into Amendment No. 5 (the “Fifth Amendment”) to the Credit Agreement. The Fifth Amendment modified the Credit Agreement to increase Term Loan A in an aggregate principal amount of $495.0 million (“Incremental Term Loan A”). Incremental Term Loan A was funded on the Closing Date, and the proceeds were used, along with cash on hand, to repay the outstanding Term Loan B in full under the Credit Agreement and to pay fees and expenses in connection with the Fifth Amendment and the incurrence of Incremental Term Loan A. Incremental Term Loan A has the same terms as Term Loan A under the Credit Agreement, and is subject to the same covenants. We recorded an additional discount of $0.5 million against the Term Loan A borrowings in connection with the Fifth Amendment, which is being amortized as a component of interest expense using the effective interest method over the term of Term Loan A.
During the year ended December 31, 2021, we made $166.8 million and $560.5 million of voluntary prepayments against Term Loan A and Term Loan B, respectively, that were applied to future mandatory principal payments due. As a result of these and previous voluntary prepayments, we are not required to make a mandatory payment against the principal balance of Term Loan A until October 2023 and Term Loan B has been paid in full. In connection with these prepayments, we recorded a $3.6 million loss on extinguishment of debt during the year ended December 31, 2021.
In February 2021, as a result of our First Lien Leverage Ratio (as defined in the Credit Agreement) being less than or equal to 2.5x, the Adjusted Eurocurrency Rate Spread (as defined in the Credit Agreement) on Term Loan A and the Revolver decreased from 1.50% to 1.25%. As of December 31, 2021, the interest rate on the Term Loan A and the Revolver was 1.35%.
Our ability to make payments on our indebtedness and to fund planned capital expenditures and necessary working capital will depend on our ability to generate cash in the future. Our ability to meet our cash needs through cash flows from operations will depend on the demand for our services, as well as general economic, financial, competitive, and other factors, many of which are beyond our control, including the broad effects of the COVID-19 pandemic on the global economy and major financial markets. Our business may not generate cash flow in an amount sufficient to enable us to pay the principal of, or interest on, our indebtedness, or to fund our other liquidity needs, including working capital, capital expenditures, acquisitions, investments, and other general corporate requirements. If we cannot fund our liquidity needs, we will have to take actions such as reducing or delaying capital expenditures, acquisitions or investments, selling assets, restructuring or refinancing our debt, reducing the scope of our operations and growth plans, or seeking additional capital. We cannot assure you that any of these remedies could, if necessary, be affected on commercially reasonable terms, or at all, or that they would permit us to meet our scheduled debt service obligations. The Credit Agreement contains covenant restrictions that limit our ability to direct the use of proceeds from any disposition of assets and, as a result, we may not be allowed to use the proceeds from any such dispositions to satisfy all current debt service obligations.
Revolver and Letters of Credit
The Revolver includes LOCs with a sublimit of $150.0 million. As of December 31, 2021, we had no outstanding Revolver borrowings and $14.2 million of LOCs outstanding, leaving $585.8 million of available borrowings under the Revolver, including $135.8 million available for LOCs.
The lease agreement for our corporate headquarters in Morrisville, North Carolina includes a provision that may require us to issue a LOC to the landlord based on our debt rating issued by Moody’s Investors Service (or other nationally-recognized debt rating agency, such as S&P Global Ratings). As of December 31, 2021, our debt rating was such that no LOC is currently required. Any LOCs issued in accordance with the aforementioned requirements could be issued under our Revolver, and if issued under our Revolver, would reduce our available borrowing capacity by the same amount.
79
We pay a quarterly commitment fee between 0.25% and 0.375% on the average daily unused balance of the Revolver based on the “First Lien Leverage Ratio” at the adjustment date. Fees are charged on all outstanding LOCs at an annual rate equal to the margin in effect on Eurocurrency Rate revolving loans plus participation and fronting fees.
The Notes
On November 24, 2020, we completed the issuance and sale of the Notes, with an aggregate principal amount of $600.0 million, which bears interest at a rate of 3.625% per annum, payable semi-annually in arrears beginning on July 15, 2021, and matures on January 15, 2029. The Notes were issued pursuant to an indenture (the “Indenture”), which provides, among other things, that the Notes are senior unsecured obligations of us and are guaranteed, jointly and severally, on a senior unsecured basis, by certain of our subsidiaries.
We may redeem some or all of the Notes at any time prior to January 15, 2024 at a redemption price equal to 100% of the aggregate principal amount of the Notes to be redeemed plus a “make-whole” premium and accrued and unpaid interest. In addition, prior to July 15, 2023, we may redeem up to 40% of the original principal amount of the Notes with proceeds of certain equity offerings at a redemption price equal to 103.625% of the aggregate principal amount of such Notes plus accrued and unpaid interest. On or after January 15, 2024, we may redeem some or all of the Notes at the redemption prices set forth in the Indenture plus accrued and unpaid interest.
The Indenture contains covenants that limit the ability of us and our restricted subsidiaries to, among other things, (1) incur additional liens, (2) engage in certain sale and leaseback transactions, and (3) conduct mergers, consolidations, or asset sales. These covenants are subject to exceptions and qualifications set forth in the Indenture.
If we sell certain of our assets or experience specific kinds of changes of control, we are required to offer to repurchase the Notes at a repurchase price equal to (1) par plus any accrued and unpaid interest in the case of an asset sale or (2) 101% of the aggregate principal amount thereof plus any accrued and unpaid interest in the case of a change of control.
Debt Covenants
The Credit Agreement contains usual and customary restrictive covenants that among other things, place limitations on our ability to pay dividends or make other restricted payments; prepay, redeem or purchase debt; incur liens; make loans and investments; incur additional indebtedness; amend or otherwise alter debt and other material arrangements; make acquisitions and dispose of assets; transact with affiliates; and engage in transactions that are not related to our existing business. Each of the restrictive covenants is subject to important exceptions and qualifications that would allow us to engage in these activities under certain conditions, including our ability to: (i) pay dividends each year in an amount up to the greater of (a) 6% of the net cash proceeds received by us from any public offering and (b) 5% of our market capitalization; and (ii) pay unlimited dividends if our Secured Leverage Ratio (as defined in the Credit Agreement) is no greater than 3.0 to 1.0. In addition, the Credit Agreement requires us to maintain a maximum First Lien Leverage Ratio (as defined in the Credit Agreement) of no more than 4.5 to 1.0 as of the last day of each fiscal quarter from and after March 31, 2020.
The Indenture also contains customary events of default, including (1) failure to make required payments, (2) failure to comply with certain covenants, (3) failure to pay certain other indebtedness, (4) certain events of bankruptcy and insolvency, and (5) failure to pay certain judgments. An event of default under the Indenture allows either the Trustee or the holders of at least 25% in aggregate principal amount of the Notes, as applicable, issued under such Indenture, to accelerate the amounts due under the Notes, or in the case of a bankruptcy or insolvency, will automatically cause the acceleration of the amounts due under the Notes.
80
As of December 31, 2021, we were in compliance with all applicable debt covenants.
Accounts Receivable Financing Agreement
Under our accounts receivable financing agreement, certain of our consolidated subsidiaries sell accounts receivable and unbilled services (including contract assets) balances to a wholly-owned, bankruptcy-remote special purpose entity (“SPE”), which is the borrower under the facility. The facility is without recourse to us or any subsidiaries of ours other than the SPE, other than with respect to limited indemnity obligations of the selling entities and the servicer of the receivables in respect of the character of the receivables sold by them and the performance of the servicing duties.
On January 28, 2021, we amended our accounts receivable financing agreement to increase the amount we can borrow from $300.0 million to $365.0 million and drew down the additional $65.0 million to partially fund the Term Loan A and Term Loan B voluntary prepayments. Accordingly, there was no incremental impact on our total debt.
On October 13, 2021, we further amended our accounts receivable financing agreement to increase the amount we can borrow from $365.0 million to $400.0 million, extended the maturity to October 2024, and drew down the additional $35.0 million. At the same time, we paid down $35.0 million on facilities under our Credit Agreement, resulting in no net impact on leverage.
As of December 31, 2021, we had $400.0 million of outstanding borrowings under this agreement with no remaining borrowing capacity available.
This agreement is secured by a lien on certain receivables and other assets, and we have guaranteed the performance of the obligations of existing and future subsidiaries that sell and service the accounts receivable under this agreement. The available borrowing capacity varies monthly according to the levels of our eligible accounts receivable and unbilled receivables. Loans under this agreement will accrue interest at a reserve-adjusted LIBOR rate or a base rate equal to the higher of (i) the applicable lender’s prime rate and (ii) the federal funds rate plus 0.50%. As of December 31, 2021, the interest rate on the accounts receivable financing agreement was 1.05%.
Interest Rates
We have entered into various interest rate swaps to mitigate our exposure to changes in interest rates on our term loans. As of December 31, 2021, the percentage of our total principal debt (excluding finance leases) that is subject to fixed interest rates was approximately 63%. Each quarter-point increase or decrease in the applicable floating interest rate as of December 31, 2021 would change our annual interest expense by approximately $2.6 million.
We do not expect the transition from LIBOR to impact our debt agreements during 2022 and therefore we are under no obligation to amend these agreements in 2022.
2021 Stock Repurchase Program
On November 17, 2020, our Board authorized the repurchase of up to an aggregate of $300.0 million of our Class A common stock, par value $0.01 per share, to be executed from time to time in open market transactions effected through a broker at prevailing market prices, in block trades, or through privately negotiated transactions through December 31, 2022. The 2021 Stock Repurchase Program took effect on January 1, 2021. Share repurchases are funded primarily with our working capital, cash flow from operations, and funds available through various borrowing arrangements.
81
The 2021 Stock Repurchase Program does not obligate us to repurchase any particular amount of our Class A common stock, and may be modified, extended, suspended, or discontinued at any time. The timing and amount of repurchases are determined by our management based on a variety of factors such as the market price of our Class A common stock, our corporate cash requirements, and overall market conditions. The 2021 Stock Repurchase Program is subject to applicable legal requirements, including federal and state securities laws and applicable Nasdaq rules. We may also repurchase shares of our Class A common stock pursuant to a trading plan meeting the requirements of Rule 10b5-1 under the Securities Exchange Act of 1934, as amended, which would permit shares of our Class A common stock to be repurchased when we might otherwise be precluded from doing so by law.
The following table sets forth repurchase activity under the 2021 Stock Repurchase Program from inception through December 31, 2021:
|
Period |
|
Total number of shares purchased |
|
|
Average price paid per share |
|
|
Approximate dollar value of shares purchased (in thousands) |
|
|||
|
March 2021 |
|
|
600,000 |
|
|
$ |
74.18 |
|
|
$ |
44,505 |
|
|
May 2021 |
|
|
400,000 |
|
|
|
81.04 |
|
|
|
32,416 |
|
|
June 2021 |
|
|
500,000 |
|
|
|
81.20 |
|
|
|
40,600 |
|
|
Total |
|
|
1,500,000 |
|
|
|
|
|
|
$ |
117,521 |
|
As of December 31, 2021, we had remaining authorization to repurchase up to approximately $182.5 million of shares of our common stock under the 2021 Stock Repurchase Program.
Cash, Cash Equivalents and Restricted Cash
Our cash flows from operating, investing, and financing activities were as follows (in thousands):
|
|
|
Year Ended December 31, |
|
|
Change |
|
||||||||||||||||||||||
|
|
|
2021 |
|
|
2020 |
|
|
2019 |
|
|
2021 to 2020 |
|
|
2020 to 2019 |
|
|||||||||||||
|
Net cash provided by operating activities |
|
$ |
450,278 |
|
|
$ |
425,493 |
|
|
$ |
318,481 |
|
|
$ |
24,785 |
|
|
|
5.8 |
% |
|
$ |
107,012 |
|
|
|
33.6 |
% |
|
Net cash used in investing activities |
|
|
(340,346 |
) |
|
|
(504,084 |
) |
|
|
(81,661 |
) |
|
|
163,738 |
|
|
|
32.5 |
% |
|
|
(422,423 |
) |
|
|
(517.3 |
)% |
|
Net cash (used in) provided by financing activities |
|
|
(277,577 |
) |
|
|
178,265 |
|
|
|
(215,469 |
) |
|
|
(455,842 |
) |
|
n/m |
|
|
|
393,734 |
|
|
n/m |
|
||
Cash Flows from Operating Activities
Cash flows provided by operating activities increased by $24.8 million during the year ended December 31, 2021 as compared to the prior year. The increase was primarily due to higher cash-related net income, partially offset by negative changes in operating assets and liabilities relative to the prior year including payment of certain taxes deferred in 2020 as permitted by the Coronavirus Aid, Relief, and Economic Security Act. Fluctuations in accounts receivable, unbilled services (including contract assets), and deferred revenue occur on a regular basis as we perform services, achieve milestones or other billing criteria, send invoices to customers, and collect outstanding accounts receivable. This activity varies by individual customer and contract. We attempt to negotiate payment terms that provide for payment of services prior to or soon after the provision of services, but the levels of accounts receivable, unbilled services (including contract assets), and deferred revenue can vary significantly from period to period.
82
Cash Flows from Investing Activities
For the year ended December 31, 2021, we used $340.3 million in cash for investing activities, which consisted of $278.9 million of payments related to acquisitions, including StudyKIK and RxDataScience, and $56.8 million for purchases of property and equipment. We continue to closely monitor our capital expenditures, especially in light of the COVID-19 pandemic, while making strategic investments in the development of our information technology infrastructure to meet the needs of our workforce, enable efficiencies, reduce business continuity risks, and conform to changes in governing rules and regulations.
For the year ended December 31, 2020, we used $504.1 million in cash for investing activities, which primarily consisted of $456.5 million of cash paid for the acquisitions of Synteract and Illingworth Research. Additionally, we used $50.0 million in cash for purchases of property and equipment and $15.6 million in cash for investments in unconsolidated affiliates, partially offset by cash received of $18.0 million for the sale of our medication adherence business.
Cash Flows from Financing Activities
For the year ended December 31, 2021, we used $277.6 million in cash for financing activities, which consisted primarily of net repayments of long-term debt and repurchases of our common stock. These payments were partially offset by proceeds from our accounts receivable financing arrangement.
For the year ended December 31, 2020, financing activities provided $178.3 million in cash, primarily resulting from a net increase in long-term debt from the issuance of the Notes, partially offset by repayments of other long-term debt, repurchases of our common stock, and contingent consideration payments.
Inflation
The majority of our long-term contracts include inflation or cost of living adjustments for the portion of the services to be performed beyond the year in which services begin. In the event actual inflation rates are greater than our contractual inflation rates or cost of living adjustments, generally our contracts allow for increases to our inflationary assumptions to offset.
Critical Accounting Policies and Estimates
The preparation of the consolidated financial statements in conformity with accounting principles generally accepted in the United States of America (“U.S. GAAP”) requires management to make estimates, judgments, and assumptions that affect the reported amounts of assets, liabilities, revenues, and expenses during the period, as well as disclosures of contingent assets and liabilities at the date of the financial statements. We evaluate our estimates on an ongoing basis, including those related to revenue recognition, valuation of goodwill and identifiable intangibles, and tax-related contingencies and valuation allowances. These estimates are based on the information available to management at the time these estimates, judgments, and assumptions are made. Actual results may differ materially from these estimates.
Acquisitions
We account for acquisitions in accordance with ASC Topic 805, Business Combinations, using the acquisition method of accounting. The purchase price, or total consideration transferred, is determined as the fair value of assets exchanged, equity instruments issued, and liabilities assumed at the acquisition date. The acquisition method of accounting requires that the identifiable assets acquired, the liabilities assumed, and any non-controlling interest in the acquiree are measured and recorded at their fair values on the date of an acquisition. Goodwill represents the excess of the purchase price over the estimated fair value of the net assets acquired, including the amount assigned to identifiable intangible assets.
83
Acquisition-related costs are expensed as incurred. The consolidated financial statements reflect the results of operations of the acquiree from the date of the acquisition. For additional information, see Part II, Item 8, “Financial Statements and Supplemental Data – Note 3 – Acquisitions, Divestitures, and Investments.”
Revenue Recognition
We adopted ASC Topic 606, Revenue from Contracts with Customers and all the related amendments (“new revenue standard” or “ASC 606”) on January 1, 2018 using the modified retrospective method for all contracts not completed as of the date of adoption. In accordance with ASC 606, revenue is recognized when, or as, a customer obtains control of promised services. The amount of revenue recognized reflects the consideration to which we expect to be entitled to receive in exchange for these services.
The majority of our Clinical Solutions segment revenue is for service offerings that range in duration from a few months to several years and typically represent a single performance obligation. Revenue for these service contracts is recognized over time using an input measure of progress. The input measure reflects costs (including investigator payments and pass-through costs) incurred to date relative to total estimated costs to complete the contract (“cost-to-cost measure of progress”). Under the cost-to-cost measure of progress methodology, revenue is recorded proportionally to costs incurred. Contract costs principally include direct labor, investigator payments, and pass-through costs. The estimate of total revenue and costs to completion requires significant judgment. Contract estimates are based on various assumptions to project future outcomes of events that often span several years, as well as on evaluations and updates made on an ongoing basis. These estimates are reviewed periodically and any adjustments are recognized on a cumulative catch-up basis in the period they become known. Updates and adjustments to estimates are likely to result in variability in revenue recognized from period to period and may cause unexpected variability in our operating results. In addition, in certain instances a customer contract may include forms of variable consideration such as incentive fees, volume rebates or other provisions that can increase or decrease the transaction price. This variable consideration is generally awarded upon achievement of certain performance metrics, program milestones or cost targets. For the purposes of revenue recognition, variable consideration is assessed on a contract-by-contract basis and the amount to be recorded is estimated based on the assessment of our anticipated performance and consideration of all information that is reasonably available. Variable consideration is recognized as revenue if and when it is deemed probable that a significant reversal in the amount of cumulative revenue recognized will not occur when the uncertainty associated with the variable consideration is resolved in the future.
The largest of the service offerings within the Commercial Solutions segment relates to Deployment Solutions. Deployment Solutions contracts consist of services to promote and sell commercial products on behalf of a customer. The remaining Commercial Solutions contracts are generally short-term, month-to-month contracts or time and materials contracts. As such, Commercial Solutions revenue is generally recognized as services are performed for the amount we estimate we are entitled to for the period. For contracts billed on a fixed price basis, revenue is recognized over time based on the proportion of labor costs expended to total labor costs expected to complete the contract.
Most of our contracts can be terminated by the customer without cause with a notice period that generally ranges from 30 to 90 days. In the event of termination, our contracts generally provide that the customer pay us for: (i) fees earned through the termination date; (ii) fees and expenses for winding down the project, which include both fees incurred and actual expenses; (iii) non-cancellable expenditures; and (iv) in some cases, a fee to cover a portion of the remaining professional fees on the project. Our long-term clinical trial contracts contain implied substantive termination penalties because of the significant wind-down cost of terminating a clinical trial. These provisions for termination penalties result in these types of contracts being treated as long-term for revenue recognition purposes.
84
Changes in the scope of work are common, especially under long-term contracts, and generally result in a renegotiation of future contract pricing terms and change in contract transaction price. If the customer does not agree to a contract modification, we could bear the risk of cost overruns. Most of our contract modifications are for services that are not distinct from the services under the existing contract due to the significant integration service provided in the context of the contract and therefore result in a cumulative catch-up adjustment to revenue at the date of contract modification.
Timing of Billing and Performance
Differences in the timing of revenue recognition and associated billings and cash collections result in recording of billed accounts receivable, unbilled accounts receivable, contract assets, and deferred revenue on the consolidated balance sheet. Amounts are billed as work progresses in accordance with agreed-upon contractual terms either at periodic intervals or upon achievement of contractual milestones. Billings generally occur subsequent to revenue recognition, resulting in recording of unbilled accounts receivable in instances where the right to bill is contingent solely on the passage of time (e.g., in the following month) and contract assets in instances where the right to bill is associated with a contingency (e.g., achievement of a milestone).
Accounts receivable are recorded at net realizable value. Unbilled accounts receivable (including contract assets) arise when services have been rendered for which revenue has been recognized but the customers have not been billed. In general, prerequisites for billings and payments are established by contractual provisions, including predetermined payment schedules, which may or may not correspond to the timing of the performance of services under the contract. Contract assets include unbilled amounts typically resulting from revenue recognized in excess of the amounts billed to the customer for which the right to payment is subject to factors other than the passage of time. These amounts may not exceed their net realizable value. Contract assets are generally classified as current. Deferred revenue represents contract liabilities and consists of customer payments received in advance of performance and billings in excess of revenue recognized, net of revenue recognized from the balance at the beginning of the period. Contract assets and deferred revenue are presented on the balance sheet on a net contract-by-contract basis at the end of each reporting period.
Goodwill and Intangible Assets
Goodwill represents the excess of purchase price over the estimated fair value of net assets acquired, including the amount assigned to identifiable intangible assets, in acquisitions. In accordance with ASC Topic 350, Intangibles – Goodwill and Other, goodwill is not subject to amortization but must be tested for impairment annually or more frequently if events or changes in circumstances indicate that goodwill might be impaired. Goodwill is tested for impairment at the reporting unit level, which is one level below the operating segment level. This test requires us to determine if the implied fair value of the reporting unit’s goodwill is less than its carrying amount.
The impairment analysis requires significant judgments, estimates and assumptions. There is no assurance that the actual future earnings or cash flows of the reporting units will not decline significantly from the projections used in the impairment analysis. Goodwill impairment charges may be recognized in future periods in one or more of the reporting units to the extent changes in factors or circumstances occur, including deterioration in the macroeconomic environment, industry, deterioration in our performance or our future projections, or changes in plans for one or more of our reporting units.
We completed our annual impairment test for potential impairment as of October 1, 2021 for all four of our reporting units, determining that there were no impairments. Our goodwill is principally related to the Merger completed on August 1, 2017. Depending on the extent to which future developments negatively impact our results of operations and financial outlook, an interim impairment test may be required in the future.
85
Intangible assets consist of customer relationships, acquired backlog, trade names, trademarks, patient communities, and acquired technologies. We amortize intangible assets related to customer relationships, trade names, trademarks, patient communities, and acquired technologies on a straight-line basis over the estimated useful life of the asset. Intangible assets related to acquired backlog are amortized based on our expectations of the timing of when revenue associated with the backlog is expected to be recognized.
We review intangible assets at the end of each reporting period to determine if facts and circumstances indicate that the useful life is shorter than originally estimated or that the carrying amount of the assets might not be recoverable. If such facts and circumstances exist, we assess the recoverability of identified assets by comparing the projected undiscounted net cash flows associated with the related asset or group of assets over their remaining lives to their respective carrying amounts. Impairments, if any, are based on the excess of the carrying amount over the fair value of those assets and occur in the period in which the impairment determination is made.
Income Taxes
The majority of our U.S. subsidiaries file a consolidated U.S. federal income tax return, while certain U.S. subsidiaries, including recently acquired entities, may file separate U.S. federal tax returns. Our subsidiaries in international jurisdictions file tax returns in their respective jurisdictions.
We provide for income taxes on all transactions that have been recognized in the consolidated financial statements. Specifically, we estimate our tax liability based on current tax laws in the statutory jurisdictions in which we operate. Accordingly, the impact of changes in income tax laws on deferred tax assets and deferred tax liabilities are recognized in net earnings in the period during which such changes are enacted. We record deferred tax assets and liabilities based on temporary differences between the financial statement and tax bases of assets and liabilities and for tax benefit carryforwards using enacted tax rates in effect in the year in which the differences are expected to reverse.
We provide valuation allowances against deferred tax assets for amounts that are not considered more likely than not to be realized. The valuation of the deferred tax asset is dependent on, among other things, our ability to generate a sufficient level of future taxable income. In estimating future taxable income, we have considered both positive and negative evidence, such as historical and forecasted results of operations, and have considered the implementation of prudent and feasible tax planning strategies. If the objectively verifiable negative evidence outweighs any available positive evidence (or the only available positive is subjective and cannot be verified), then a valuation allowance will likely be deemed necessary. If a valuation allowance is deemed to be unnecessary, such allowance is released and any related benefit is recognized in the period of the change.
We recognize a tax benefit from an uncertain tax position only if we believe it is more likely than not to be sustained upon examination based on the technical merits of the position. Judgment is required in determining what constitutes an individual tax position, as well as the assessment of the outcome of each tax position. We consider many factors when evaluating and estimating tax positions and tax benefits. In addition, the calculation of tax liabilities involves dealing with uncertainties in the application of complex tax regulations in domestic and foreign jurisdictions. We evaluate uncertain tax positions pursuant to the more likely than not standard, and benefits related to such uncertain tax positions are recognized as the largest amount of benefit, determined on a cumulative probability basis, to be realized upon ultimate settlement of the position. If the calculation of the liability related to uncertain tax positions proves to be more or less than the ultimate settlement, a tax expense or benefit, respectively, would result. Unrecognized tax benefits are presented as either a reduction to a deferred tax asset or as a separate liability.
86
Recently Issued Accounting Standards
For a description of recently issued accounting pronouncements, including the expected dates of adoption and the estimated effects, if any, on our consolidated financial statements, see “Note 1 - Basis of Presentation and Summary of Significant Accounting Policies” to our consolidated financial statements in Part II, Item 8, “Financial Statements and Supplementary Data” in this Annual Report on Form 10-K.
Item 7A. Quantitative and Qualitative Disclosures About Market Risk.
Market risk is the potential loss arising from adverse changes in market rates and prices, such as foreign currency exchange rates, interest rates, and other relevant market rate or price changes. In the ordinary course of business, we are exposed to various market risks, including changes in foreign currency exchange rates and interest rates, and we regularly evaluate our exposure to such changes. Our overall risk management strategy seeks to balance the magnitude of the exposure and the cost and availability of appropriate financial instruments. From time to time, we have utilized forward exchange contracts to manage our foreign currency exchange rate and interest rate risk.
Foreign Currency Exchange Rates
Approximately 19% of our revenues for the year ended December 31, 2021 were denominated in currencies other than the U.S. dollar. Our financial statements are reported in U.S. dollars and, accordingly, fluctuations in exchange rates will affect the translation of our revenues and expenses denominated in foreign currencies into U.S. dollars for purposes of reporting our consolidated financial results. During 2021 and 2020, the most significant currency exchange rate exposures were the British Pound, Euro, Canadian Dollar, and Japanese Yen. A hypothetical change of 10% in average exchange rates used to translate all foreign currencies to U.S. dollars would have impacted income before income taxes for 2021 by approximately $54.4 million. The impact of this could be partially offset by exchange rate fluctuation provisions stated in some of our contracts with customers designed to mitigate our exposure to fluctuations in currency exchange rates over the life of the contract. For example, during the year ended December 31, 2021, our revenue was reduced by $2.1 million to reflect the reduced operating costs required to fulfill the contracts as a result of the fluctuations in foreign currency exchange rates. We do not have significant operations in countries in which the economy is considered to be highly inflationary.
We are subject to foreign currency transaction risk for fluctuations in exchange rates during the period of time between the consummation and cash settlement of a transaction. Accordingly, exchange rate fluctuations during this period may affect our profitability with respect to such contracts. We are able to partially offset our foreign currency transaction risk through exchange rate fluctuation adjustment provisions stated in our contracts with customers, or we may hedge our transaction risk with foreign currency exchange contracts.
Foreign Exchange Forward
On October 30, 2020, we entered into a foreign exchange forward in order to minimize monthly foreign currency remeasurement gains or losses on non-functional currency monetary balances. The foreign exchange forward notional value may be adjusted each month as the exposure balance changes. We elected not to designate the derivative as a hedge. All changes in the mark-to-market of the foreign exchange forward are recorded in earnings every month to other (income) expense, net in the accompanying consolidated statements of income. We recognized $0.7 million of realized losses and $1.5 million of realized gains during the year ended December 31, 2021 and 2020, respectively, related to this foreign exchange forward. As of December 31, 2021, the notional value of this foreign exchange forward was $70.0 million.
87
Interest Rates
We are subject to market risk associated with changes in interest rates. In June 2018, we entered into an interest rate swap with multiple counterparties that had an initial aggregate notional value of $1.01 billion, an effective date of December 31, 2018, and expired on June 30, 2021.
In March 2020, we entered into an interest rate swap with an initial aggregate notional value of $549.2 million, that increased to $1.42 billion on June 30, 2021, an effective date of March 31, 2020, and will expire on March 31, 2023. As of December 31, 2021, the notional value of this interest rate swap was $1.16 billion.
As of December 31, 2021 and 2020, we had $2.84 billion and $2.97 billion, respectively, of total principal indebtedness (including finance leases of $54.8 million and $49.0 million, respectively), of which $1.03 billion and $809.5 million, respectively, was subject to variable interest rates (excluding finance leases). Each quarter-point increase or decrease in the applicable interest rate as of December 31, 2021 and 2020 would change our annual interest expense by approximately $2.6 million and $2.0 million, respectively.
88
Item 8. Financial Statements and Supplementary Data.
Index to Consolidated Financial Statements
89
REPORT OF INDEPENDENT REGISTERED PUBLIC ACCOUNTING FIRM
To the shareholders and the Board of Directors of Syneos Health, Inc.
Opinion on the Financial Statements
We have audited the accompanying consolidated balance sheets of Syneos Health, Inc. and subsidiaries (the “Company”) as of December 31, 2021 and 2020, the related consolidated statements of income, comprehensive income, cash flows, and shareholders’ equity, for each of the three years in the period ended December 31, 2021, and the related notes (collectively referred to as the “financial statements”). In our opinion, the financial statements present fairly, in all material respects, the financial position of the Company as of December 31, 2021 and 2020, and the results of its operations and its cash flows for each of the three years in the period ended December 31, 2021, in conformity with accounting principles generally accepted in the United States of America.
We have also audited, in accordance with the standards of the Public Company Accounting Oversight Board (United States) (PCAOB), the Company’s internal control over financial reporting as of December 31, 2021, based on criteria established in Internal Control – Integrated Framework (2013) issued by the Committee of Sponsoring Organizations of the Treadway Commission and our report dated February 16, 2022, expressed an unqualified opinion on the Company’s internal control over financial reporting.
Basis for Opinion
These financial statements are the responsibility of the Company’s management. Our responsibility is to express an opinion on the Company’s financial statements based on our audits. We are a public accounting firm registered with the PCAOB and are required to be independent with respect to the Company in accordance with the U.S. federal securities laws and the applicable rules and regulations of the Securities and Exchange Commission and the PCAOB.
We conducted our audits in accordance with the standards of the PCAOB. Those standards require that we plan and perform the audit to obtain reasonable assurance about whether the financial statements are free of material misstatement, whether due to error or fraud. Our audits included performing procedures to assess the risks of material misstatement of the financial statements, whether due to error or fraud, and performing procedures that respond to those risks. Such procedures included examining, on a test basis, evidence regarding the amounts and disclosures in the financial statements. Our audits also included evaluating the accounting principles used and significant estimates made by management, as well as evaluating the overall presentation of the financial statements. We believe that our audits provide a reasonable basis for our opinion.
Critical Audit Matter
The critical audit matter communicated below is a matter arising from the current-period audit of the financial statements that was communicated or required to be communicated to the audit committee and that (1) relates to accounts or disclosures that are material to the financial statements and (2) involved our especially challenging, subjective, or complex judgments. The communication of critical audit matters does not alter in any way our opinion on the financial statements, taken as a whole, and we are not, by communicating the critical audit matter below, providing a separate opinion on the critical audit matter or on the accounts or disclosures to which it relates.
90
Revenue – Full-service Clinical Contracts – Refer to Notes 1 and 12 to the consolidated financial statements
Critical Audit Matter Description
The majority of the Company’s Clinical Solutions segment contracts have a single performance obligation because the promise to transfer individual services is not separately identifiable from other promises in the contracts, and therefore, is not distinct. Revenue is recognized over time using an input measure of progress. The input measure reflects costs (including investigator payments and pass-through costs) incurred to date relative to total estimated costs to complete (“cost-to-cost measure of progress”). Under the cost-to-cost measure of progress methodology, revenue is recorded proportionally to costs incurred. Contract costs principally include direct labor, investigator payments, and pass-through costs. The accounting for these contracts involves judgment, particularly as it relates to estimating total contract costs based on the scope of work, the complexity of the clinical trial services, the geographical locations involved, industry information, and historical experience, among other factors.
Given the judgments necessary to estimate total contract costs in order to estimate the amount of revenue to recognize for certain long-term clinical research contracts which use the cost-to-cost method, auditing such estimates required extensive audit effort due to the complexity of these contracts and a high degree of auditor judgment when performing audit procedures and evaluating the results of those procedures.
How the Critical Audit Matter Was Addressed in the Audit
Our audit procedures related to management’s estimates of total contract costs to estimate the amount of revenue to recognize for full-service clinical research contracts included the following, among others:
|
|
• |
We tested the effectiveness of controls over long-term contract revenue, including those over the estimates of total contract costs related to the performance obligation. |
|
|
• |
We selected a sample of long-term contracts and performed the following: |
|
|
- |
Evaluated whether the contracts were properly included in management’s calculation of long-term contract revenue based on the terms and conditions of each contract, including whether continuous transfer of control to the customer occurred as progress was made toward fulfilling the performance obligation. |
|
|
- |
Compared the transaction prices to the consideration expected to be received based on current rights and obligations under the contracts and any contract modifications that were agreed upon with the customers. |
|
|
- |
Evaluated management’s identification of distinct performance obligations by assessing whether the underlying services were highly interdependent and interrelated. |
|
|
- |
Tested the accuracy and completeness of the total contract costs incurred to date for the performance obligation. |
|
|
- |
Evaluated the estimates of total contract cost for the performance obligation by: |
|
|
• |
Evaluating management’s ability to achieve the estimates of total contract cost by performing corroborating inquiries with the Company’s project managers and project financial analysts and comparing the estimates to management’s work plans and cost estimates. |
91
|
|
• |
Comparing management’s estimates of cost and revenue for the selected contracts to historical experience, and evaluating the reasonableness of management’s forecast of remaining costs to be incurred for each contract based on progress to date. |
|
|
- |
Tested the mathematical accuracy of management’s calculation of revenue for the performance obligation. |
|
|
• |
We evaluated management’s ability to accurately estimate total contract costs and revenue by comparing actual costs to management’s historical estimates for performance obligations that have been fulfilled. |
/s/
February 16, 2022
We have served as the Company’s auditor since 2016.
92
REPORT OF INDEPENDENT REGISTERED PUBLIC ACCOUNTING FIRM
To the shareholders and the Board of Directors of Syneos Health, Inc.
Opinion on Internal Control over Financial Reporting
We have audited the internal control over financial reporting of Syneos Health, Inc. and subsidiaries (the “Company”) as of December 31, 2021, based on criteria established in Internal Control – Integrated Framework (2013) issued by the Committee of Sponsoring Organizations of the Treadway Commission (COSO). In our opinion, the Company maintained, in all material respects, effective internal control over financial reporting as of December 31, 2021, based on criteria established in Internal Control – Integrated Framework (2013) issued by COSO.
We have also audited, in accordance with the standards of the Public Company Accounting Oversight Board (United States) (PCAOB), the consolidated financial statements as of and for the year ended December 31, 2021, of the Company and our report dated February 16, 2022 expressed an unqualified opinion on those financial statements.
Basis for Opinion
The Company’s management is responsible for maintaining effective internal control over financial reporting and for its assessment of the effectiveness of internal control over financial reporting, included in the accompanying Management’s Annual Report on Internal Control Over Financial Reporting. Our responsibility is to express an opinion on the Company’s internal control over financial reporting based on our audit. We are a public accounting firm registered with the PCAOB and are required to be independent with respect to the Company in accordance with the U.S. federal securities laws and the applicable rules and regulations of the Securities and Exchange Commission and the PCAOB.
We conducted our audit in accordance with the standards of the PCAOB. Those standards require that we plan and perform the audit to obtain reasonable assurance about whether effective internal control over financial reporting was maintained in all material respects. Our audit included obtaining an understanding of internal control over financial reporting, assessing the risk that a material weakness exists, testing and evaluating the design and operating effectiveness of internal control based on the assessed risk, and performing such other procedures as we considered necessary in the circumstances. We believe that our audit provides a reasonable basis for our opinion.
Definition and Limitations of Internal Control over Financial Reporting
A company’s internal control over financial reporting is a process designed to provide reasonable assurance regarding the reliability of financial reporting and the preparation of financial statements for external purposes in accordance with generally accepted accounting principles. A company’s internal control over financial reporting includes those policies and procedures that (1) pertain to the maintenance of records that, in reasonable detail, accurately and fairly reflect the transactions and dispositions of the assets of the company; (2) provide reasonable assurance that transactions are recorded as necessary to permit preparation of financial statements in accordance with generally accepted accounting principles, and that receipts and expenditures of the company are being made only in accordance with authorizations of management and directors of the company; and (3) provide reasonable assurance regarding prevention or timely detection of unauthorized acquisition, use, or disposition of the company’s assets that could have a material effect on the financial statements.
Because of its inherent limitations, internal control over financial reporting may not prevent or detect misstatements. Also, projections of any evaluation of effectiveness to future periods are subject to the risk that controls may become inadequate because of changes in conditions, or that the degree of compliance with the policies or procedures may deteriorate.
/s/ Deloitte & Touche LLP
Raleigh, North Carolina
February 16, 2022
93
SYNEOS HEALTH, INC. AND SUBSIDIARIES
CONSOLIDATED STATEMENTS OF INCOME
|
|
|
Year Ended December 31, |
|
|||||||||
|
|
|
2021 |
|
|
2020 |
|
|
2019 |
|
|||
|
|
|
(in thousands, except per share data) |
|
|||||||||
|
Revenue |
|
$ |
|
|
|
$ |
|
|
|
$ |
|
|
|
|
|
|
|
|
|
|
|
|
|
|
|
|
|
Costs and operating expenses: |
|
|
|
|
|
|
|
|
|
|
|
|
|
Direct costs (exclusive of depreciation and amortization) |
|
|
|
|
|
|
|
|
|
|
|
|
|
Selling, general, and administrative expenses |
|
|
|
|
|
|
|
|
|
|
|
|
|
Restructuring and other costs |
|
|
|
|
|
|
|
|
|
|
|
|
|
Depreciation |
|
|
|
|
|
|
|
|
|
|
|
|
|
Amortization |
|
|
|
|
|
|
|
|
|
|
|
|
|
Total operating expenses |
|
|
|
|
|
|
|
|
|
|
|
|
|
Income from operations |
|
|
|
|
|
|
|
|
|
|
|
|
|
|
|
|
|
|
|
|
|
|
|
|
|
|
|
Total other expense, net: |
|
|
|
|
|
|
|
|
|
|
|
|
|
Interest income |
|
|
( |
) |
|
|
( |
) |
|
|
( |
) |
|
Interest expense |
|
|
|
|
|
|
|
|
|
|
|
|
|
Loss (gain) on extinguishment of debt |
|
|
|
|
|
|
|
|
|
|
( |
) |
|
Other (income) expense, net |
|
|
( |
) |
|
|
( |
) |
|
|
|
|
|
Total other expense, net |
|
|
|
|
|
|
|
|
|
|
|
|
|
Income before provision for income taxes |
|
|
|
|
|
|
|
|
|
|
|
|
|
Income tax expense (benefit) |
|
|
|
|
|
|
|
|
|
|
( |
) |
|
Net income |
|
$ |
|
|
|
$ |
|
|
|
$ |
|
|
|
|
|
|
|
|
|
|
|
|
|
|
|
|
|
Earnings per share: |
|
|
|
|
|
|
|
|
|
|
|
|
|
Basic |
|
$ |
|
|
|
$ |
|
|
|
$ |
|
|
|
Diluted |
|
$ |
|
|
|
$ |
|
|
|
$ |
|
|
|
Weighted average common shares outstanding: |
|
|
|
|
|
|
|
|
|
|
|
|
|
Basic |
|
|
|
|
|
|
|
|
|
|
|
|
|
Diluted |
|
|
|
|
|
|
|
|
|
|
|
|
The accompanying notes are an integral part of these consolidated financial statements.
94
SYNEOS HEALTH, INC. AND SUBSIDIARIES
CONSOLIDATED STATEMENTS OF COMPREHENSIVE INCOME
|
|
|
Year Ended December 31, |
|
|||||||||
|
|
|
2021 |
|
|
2020 |
|
|
2019 |
|
|||
|
|
|
(in thousands) |
|
|||||||||
|
Net income |
|
$ |
|
|
|
$ |
|
|
|
$ |
|
|
|
Unrealized gain (loss) on derivative instruments, net of income tax expense (benefit) of $ |
|
|
|
|
|
|
( |
) |
|
|
( |
) |
|
Foreign currency translation adjustments, net of income tax (benefit) expense of $( |
|
|
( |
) |
|
|
|
|
|
|
|
|
|
Comprehensive income |
$ |
|
|
|
$ |
|
|
|
$ |
|
|
|
The accompanying notes are an integral part of these consolidated financial statements.
95
SYNEOS HEALTH, INC. AND SUBSIDIARIES
CONSOLIDATED BALANCE SHEETS
|
|
|
December 31, |
|
|||||
|
|
|
2021 |
|
|
2020 |
|
||
|
|
|
(in thousands, except par value) |
|
|||||
|
ASSETS |
|
|
|
|
|
|
|
|
|
Current assets: |
|
|
|
|
|
|
|
|
|
Cash, cash equivalents, and restricted cash |
|
$ |
|
|
|
$ |
|
|
|
Accounts receivable and unbilled services, net |
|
|
|
|
|
|
|
|
|
Prepaid expenses and other current assets |
|
|
|
|
|
|
|
|
|
Total current assets |
|
|
|
|
|
|
|
|
|
Property and equipment, net |
|
|
|
|
|
|
|
|
|
Operating lease right-of-use assets |
|
|
|
|
|
|
|
|
|
Goodwill |
|
|
|
|
|
|
|
|
|
Intangible assets, net |
|
|
|
|
|
|
|
|
|
Deferred income tax assets |
|
|
|
|
|
|
|
|
|
Other long-term assets |
|
|
|
|
|
|
|
|
|
Total assets |
|
$ |
|
|
|
$ |
|
|
|
|
|
|
|
|
|
|
|
|
|
LIABILITIES AND SHAREHOLDERS’ EQUITY |
|
|
|
|
|
|
|
|
|
Current liabilities: |
|
|
|
|
|
|
|
|
|
Accounts payable |
|
$ |
|
|
|
$ |
|
|
|
Accrued expenses |
|
|
|
|
|
|
|
|
|
Deferred revenue |
|
|
|
|
|
|
|
|
|
Current portion of operating lease obligations |
|
|
|
|
|
|
|
|
|
Current portion of finance lease obligations |
|
|
|
|
|
|
|
|
|
Total current liabilities |
|
|
|
|
|
|
|
|
|
Long-term debt |
|
|
|
|
|
|
|
|
|
Operating lease long-term obligations |
|
|
|
|
|
|
|
|
|
Finance lease long-term obligations |
|
|
|
|
|
|
|
|
|
Deferred income tax liabilities |
|
|
|
|
|
|
|
|
|
Other long-term liabilities |
|
|
|
|
|
|
|
|
|
Total liabilities |
|
|
|
|
|
|
|
|
|
|
|
|
|
|
|
|
|
|
|
Commitments and contingencies (Note 17) |
|
|
|
|
|
|
|
|
|
|
|
|
|
|
|
|
|
|
|
Shareholders’ equity: |
|
|
|
|
|
|
|
|
|
Preferred stock, $ |
|
|
|
|
|
|
|
|
|
Common stock, $ |
|
|
|
|
|
|
|
|
|
Additional paid-in capital |
|
|
|
|
|
|
|
|
|
Accumulated other comprehensive loss, net of taxes |
|
|
( |
) |
|
|
( |
) |
|
Accumulated deficit |
|
|
( |
) |
|
|
( |
) |
|
Total shareholders’ equity |
|
|
|
|
|
|
|
|
|
Total liabilities and shareholders’ equity |
|
$ |
|
|
|
$ |
|
|
The accompanying notes are an integral part of these consolidated financial statements.
96
SYNEOS HEALTH, INC. AND SUBSIDIARIES
CONSOLIDATED STATEMENTS OF CASH FLOWS
|
|
|
Year Ended December 31, |
|
|||||||||
|
|
|
2021 |
|
|
2020 |
|
|
2019 |
|
|||
|
|
|
(in thousands) |
|
|||||||||
|
Cash flows from operating activities: |
|
|
|
|
|
|
|
|
|
|
|
|
|
Net income |
|
$ |
|
|
|
$ |
|
|
|
$ |
|
|
|
Adjustments to reconcile net income to net cash provided by operating activities: |
|
|
|
|
|
|
|
|
|
|
|
|
|
Depreciation and amortization |
|
|
|
|
|
|
|
|
|
|
|
|
|
Share-based compensation |
|
|
|
|
|
|
|
|
|
|
|
|
|
Provision for doubtful accounts |
|
|
|
|
|
|
|
|
|
|
|
|
|
Provision for (benefit from) deferred income taxes |
|
|
|
|
|
|
( |
) |
|
|
( |
) |
|
Foreign currency transaction adjustments |
|
|
( |
) |
|
|
|
|
|
|
|
|
|
Fair value adjustment of contingent obligations |
|
|
( |
) |
|
|
( |
) |
|
|
|
|
|
Gain on sale of business |
|
|
— |
|
|
|
( |
) |
|
|
— |
|
|
Loss (gain) on extinguishment of debt |
|
|
|
|
|
|
|
|
|
|
( |
) |
|
Other non-cash items |
|
|
|
|
|
|
|
|
|
|
|
|
|
Changes in operating assets and liabilities, net of effect of acquisitions: |
|
|
|
|
|
|
|
|
|
|
|
|
|
Accounts receivable, unbilled services, and deferred revenue |
|
|
( |
) |
|
|
|
|
|
|
( |
) |
|
Accounts payable and accrued expenses |
|
|
|
|
|
|
( |
) |
|
|
|
|
|
Other assets and liabilities |
|
|
( |
) |
|
|
( |
) |
|
|
( |
) |
|
Net cash provided by operating activities |
|
|
|
|
|
|
|
|
|
|
|
|
|
Cash flows from investing activities: |
|
|
|
|
|
|
|
|
|
|
|
|
|
Payments related to acquisitions of businesses, net of cash acquired |
|
|
( |
) |
|
|
( |
) |
|
|
( |
) |
|
Proceeds from notes receivable from divestiture |
|
|
|
|
|
|
— |
|
|
|
— |
|
|
Proceeds from sale of business |
|
|
— |
|
|
|
|
|
|
|
— |
|
|
Purchases of property and equipment |
|
|
( |
) |
|
|
( |
) |
|
|
( |
) |
|
Investments in unconsolidated affiliates |
|
|
( |
) |
|
|
( |
) |
|
|
( |
) |
|
Loan to unconsolidated affiliate |
|
|
( |
) |
|
|
— |
|
|
|
— |
|
|
Net cash used in investing activities |
|
|
( |
) |
|
|
( |
) |
|
|
( |
) |
|
Cash flows from financing activities: |
|
|
|
|
|
|
|
|
|
|
|
|
|
Proceeds from issuance of long-term debt, net of discount |
|
|
|
|
|
|
|
|
|
|
|
|
|
Payments of debt financing costs |
|
|
( |
) |
|
|
( |
) |
|
|
( |
) |
|
Repayments of long-term debt |
|
|
( |
) |
|
|
( |
) |
|
|
( |
) |
|
Proceeds from accounts receivable financing agreement |
|
|
|
|
|
|
|
|
|
|
|
|
|
Repayments of accounts receivable financing agreement |
|
|
— |
|
|
|
( |
) |
|
|
( |
) |
|
Proceeds from revolving line of credit |
|
|
|
|
|
|
|
|
|
|
— |
|
|
Repayments of revolving line of credit |
|
|
( |
) |
|
|
( |
) |
|
|
— |
|
|
Redemption of Senior Notes and associated breakage fees |
|
|
— |
|
|
|
— |
|
|
|
( |
) |
|
Payments of contingent consideration related to acquisitions |
|
|
( |
) |
|
|
( |
) |
|
|
( |
) |
|
Payments of finance leases |
|
|
( |
) |
|
|
( |
) |
|
|
( |
) |
|
Payments for repurchases of common stock |
|
|
( |
) |
|
|
( |
) |
|
|
( |
) |
|
Proceeds from exercises of stock options |
|
|
|
|
|
|
|
|
|
|
|
|
|
Payments related to tax withholdings for share-based compensation |
|
|
( |
) |
|
|
( |
) |
|
|
( |
) |
|
Net cash (used in) provided by financing activities |
|
|
( |
) |
|
|
|
|
|
|
( |
) |
|
Effect of exchange rate changes on cash, cash equivalents, and restricted cash |
|
|
|
|
|
|
|
|
|
|
( |
) |
|
Net change in cash, cash equivalents, and restricted cash |
|
|
( |
) |
|
|
|
|
|
|
|
|
|
Cash, cash equivalents, and restricted cash - beginning of period |
|
|
|
|
|
|
|
|
|
|
|
|
|
Cash, cash equivalents, and restricted cash - end of period |
|
$ |
|
|
|
$ |
|
|
|
$ |
|
|
The accompanying notes are an integral part of these consolidated financial statements.
97
SYNEOS HEALTH, INC. AND SUBSIDIARIES
CONSOLIDATED STATEMENTS OF SHAREHOLDERS’ EQUITY
|
|
|
Year Ended December 31, |
|
|||||||||
|
|
|
2021 |
|
|
2020 |
|
|
2019 |
|
|||
|
|
|
(in thousands) |
|
|||||||||
|
Shareholders’ equity, beginning balance |
|
$ |
|
|
|
$ |
|
|
|
$ |
|
|
|
Impact from adoption of ASU 2016-13 |
|
|
— |
|
|
|
( |
) |
|
|
— |
|
|
Shareholders’ equity, adjusted beginning balance |
|
|
|
|
|
|
|
|
|
|
|
|
|
|
|
|
|
|
|
|
|
|
|
|
|
|
|
Common stock: |
|
|
|
|
|
|
|
|
|
|
|
|
|
Beginning balance |
|
|
|
|
|
|
|
|
|
|
|
|
|
Repurchases of common stock |
|
|
( |
) |
|
|
( |
) |
|
|
( |
) |
|
Issuances of common stock |
|
|
|
|
|
|
|
|
|
|
|
|
|
Ending balance |
|
|
|
|
|
|
|
|
|
|
|
|
|
|
|
|
|
|
|
|
|
|
|
|
|
|
|
Additional paid-in capital: |
|
|
|
|
|
|
|
|
|
|
|
|
|
Beginning balance |
|
|
|
|
|
|
|
|
|
|
|
|
|
Repurchases of common stock |
|
|
( |
) |
|
|
( |
) |
|
|
( |
) |
|
Issuances of common stock |
|
|
( |
) |
|
|
|
|
|
|
|
|
|
Share-based compensation |
|
|
|
|
|
|
|
|
|
|
|
|
|
Ending balance |
|
|
|
|
|
|
|
|
|
|
|
|
|
|
|
|
|
|
|
|
|
|
|
|
|
|
|
Accumulated other comprehensive loss: |
|
|
|
|
|
|
|
|
|
|
|
|
|
Beginning balance |
|
|
( |
) |
|
|
( |
) |
|
|
( |
) |
|
Unrealized gain (loss) on derivative instruments, net of taxes |
|
|
|
|
|
|
( |
) |
|
|
( |
) |
|
Foreign currency translation adjustment, net of taxes |
|
|
( |
) |
|
|
|
|
|
|
|
|
|
Ending balance |
|
|
( |
) |
|
|
( |
) |
|
|
( |
) |
|
|
|
|
|
|
|
|
|
|
|
|
|
|
|
Accumulated deficit: |
|
|
|
|
|
|
|
|
|
|
|
|
|
Beginning balance |
|
|
( |
) |
|
|
( |
) |
|
|
( |
) |
|
Impact from adoption of ASU 2016-13 |
|
|
— |
|
|
|
( |
) |
|
|
— |
|
|
Adjusted beginning balance |
|
|
( |
) |
|
|
( |
) |
|
|
( |
) |
|
Repurchases of common stock |
|
|
( |
) |
|
|
( |
) |
|
|
( |
) |
|
Net income |
|
|
|
|
|
|
|
|
|
|
|
|
|
Ending balance |
|
|
( |
) |
|
|
( |
) |
|
|
( |
) |
|
|
|
|
|
|
|
|
|
|
|
|
|
|
|
Shareholders’ equity, ending balance |
|
$ |
|
|
|
$ |
|
|
|
$ |
|
|
The accompanying notes are an integral part of these consolidated financial statements.
98
Syneos Health, Inc. and Subsidiaries
Notes to Consolidated Financial Statements
1. Basis of Presentation and Summary of Significant Accounting Policies
Principal Business
Syneos Health, Inc. (the “Company”) is a global provider of end-to-end biopharmaceutical outsourcing solutions. The Company operates under
Principles of Consolidation
The accompanying consolidated financial statements have been prepared in accordance with accounting principles generally accepted in the United States of America (“U.S. GAAP”), and include the accounts and results of operations of the Company and its controlled subsidiaries. All intercompany balances and transactions have been eliminated.
Reclassification
Certain previously reported amounts have been reclassified to conform to the current year presentation.
COVID-19 Pandemic
The ongoing COVID-19 pandemic and associated economic repercussions have significantly impacted, and are expected to continue to impact, the Company’s business and operations. The continued availability and effectiveness of vaccines may partially mitigate the risks around the continued spread of COVID-19, however, with the spread of COVID-19 variants, the ongoing impacts of the COVID-19 pandemic could adversely impact its business and results of operations. See Part I, Item 1A “Risk Factors” in this Annual Report on Form 10-K for further discussion of the potential impact of the pandemic on its business.
Use of Estimates
The preparation of the consolidated financial statements in conformity with U.S. GAAP requires management to make estimates and assumptions. These estimates and assumptions affect the reported amounts of assets and liabilities and the disclosures of contingent assets and liabilities as of the date of the financial statements, and the reported amounts of revenue and expenses for the periods presented in the financial statements. Examples of estimates and assumptions include, but are not limited to, determining the fair value of goodwill and intangible assets and their potential impairment, useful lives of tangible and intangible assets, useful lives of assets subject to leases, valuation of the Company’s right of use assets, allowances for doubtful accounts, potential future outcomes of events for which income tax consequences have been recognized in the Company’s consolidated financial statements or tax returns, valuation allowances for deferred tax assets, fair value of share-based compensation and its recognition period, loss contingencies, fair value of derivative instruments and related hedge effectiveness, fair value of contingent tax sharing obligations, and judgments related to revenue recognition, among others. In addition, estimates and assumptions are used in the accounting for acquisitions, including the fair value and useful lives of acquired tangible and intangible assets and the fair value of assumed liabilities.
99
The Company evaluates its estimates and assumptions on an ongoing basis and bases its estimates on historical experience, current and expected future conditions, third-party evaluations, and various other assumptions that management believes are reasonable under the circumstances based on the information available to management at the time these estimates and assumptions are made. Actual results and outcomes may differ significantly from these estimates and assumptions.
Acquisitions
The Company accounts for acquisitions in accordance with ASC Topic 805, Business Combinations, using the acquisition method of accounting. The purchase price, or total consideration transferred, is determined as the fair value of assets exchanged, equity instruments issued, and liabilities assumed at the acquisition date. The acquisition method of accounting requires that the identifiable assets acquired, the liabilities assumed, and any non-controlling interest in the acquiree are measured and recorded at their fair values on the date of an acquisition. Goodwill represents the excess of the purchase price over the estimated fair value of the net assets acquired, including the amount assigned to identifiable intangible assets. Acquisition-related costs are expensed as incurred. The consolidated financial statements reflect the results of operations of the acquiree from the date of the acquisition. For additional information, see “Note 3 – Acquisitions, Divestitures, and Investments.”
Foreign Currency Translation and Transactions
For subsidiaries outside of the U.S. that operate in a local currency environment, revenue and expenses are translated to U.S. dollars at the monthly average rates of exchange prevailing during the period, assets and liabilities are translated at period-end exchange rates, and equity accounts are translated at historical exchange rates. The net effect of foreign currency translation adjustments is included in shareholders’ equity as a component of accumulated other comprehensive loss in the accompanying consolidated balance sheets.
Foreign currency transaction gains and losses are the result of exchange rate changes during the period of time between the consummation and cash settlement of transactions denominated in currencies other than the functional currency. Foreign currency transaction gains and losses are recognized in earnings as incurred and are included in other (income) expense, net in the accompanying consolidated statements of income.
Comprehensive Income
Comprehensive income refers to revenue, expenses, gains, and losses that, under U.S. GAAP, are recorded as an element of shareholders’ equity but are excluded from net income. The Company’s comprehensive income consists of foreign currency translation adjustments, net of applicable taxes, resulting from the translation of foreign subsidiaries with functional currencies other than the U.S. dollar and the effective portions of the unrealized gains or losses associated with derivative instruments designated and accounted for as hedging instruments.
100
Cash and Cash Equivalents
Cash and cash equivalents consist of demand deposits with banks and other financial institutions and highly liquid investments with an original maturity of three months or less at the date of purchase. Cash and cash equivalents are carried at cost, which approximates their fair value.
Certain of the Company’s subsidiaries participate in a notional cash pooling arrangement to manage global liquidity requirements. As part of a master netting arrangement, the participants combine their cash balances in pooling accounts at the same financial institution with the ability to offset bank overdrafts of one participant against positive cash account balances held by another participant. Under the terms of the master netting arrangement, the financial institution has the right, ability, and intent to offset a positive balance in one account against an overdrawn amount in another account. Amounts in each of the accounts are unencumbered and unrestricted with respect to use. As such, the net cash balance related to this pooling arrangement is included in cash, cash equivalents, and restricted cash in the accompanying consolidated balance sheets.
The Company’s net cash pool position consisted of the following as of December 31 (in thousands):
|
|
|
2021 |
|
|
2020 |
|
||
|
Gross cash position |
|
$ |
|
|
|
$ |
|
|
|
Less: cash borrowings |
|
|
( |
) |
|
|
( |
) |
|
Net cash position |
|
$ |
|
|
|
$ |
|
|
Restricted Cash
Restricted cash represents cash and deposits held as security over bank deposits, lease guarantees, and insurance obligations that are restricted as to withdrawal or use. Restricted cash is classified as a current or long-term asset based on the timing and nature of when and how the cash is expected to be used or when the restrictions are expected to lapse. As of December 31, 2021 and 2020, restricted cash balances were $
Fair Value
The Company records certain assets and liabilities at fair value in accordance with ASC Topic 820, Fair Value Measurement (see “Note 7 - Fair Value Measurements”). Fair value is defined as the price that would be received to sell an asset or paid to transfer a liability in the principal or most advantageous market for the asset or liability in an orderly transaction between market participants at the measurement date. This guidance also specifies a fair value hierarchy that distinguishes between valuation assumptions developed based on market data obtained from independent external sources and the reporting entity’s own assumptions. Fair value measurements are classified according to the lowest level input or value-driver that is significant to the valuation. In accordance with this guidance, fair value measurements are classified under the following hierarchy:
Level 1 – Unadjusted quoted prices in active markets for identical instruments;
Level 2 – Quoted prices for similar instruments in active markets; quoted prices for identical or similar instruments in markets that are not active; and model-derived valuations in which all significant inputs or significant value-drivers are observable in active markets; and
Level 3 – Model-derived valuations in which one or more significant inputs or significant value-drivers are unobservable, including internally developed models.
101
Derivative Financial Instruments
Interest Rate Swaps
The Company uses interest rate swaps to manage exposure to variable interest rates on its debt obligations. The Company designates its interest rate swaps as cash flow hedges because they are executed to hedge the Company’s exposure to the variability in expected future cash flows that are attributable to changes in interest rates.
Derivative financial instruments are measured at fair value and recognized in the accompanying consolidated balance sheets in prepaid expenses and other current assets, other long-term assets, accrued expenses, and other long-term liabilities, as disclosed in “Note 6 – Derivatives.” The fair value of interest rate swaps is determined using the market standard methodology of discounted future variable cash receipts. The variable cash receipts are determined by discounting the future expected cash receipts that would occur if variable interest rates rise above the fixed rate of the swaps. The variable interest rates used in the calculation of projected receipts on the swap are based on an expectation of future interest rates derived from observable market interest rate curves and volatilities. Changes in the fair value of derivative instruments designated as hedging instruments are recorded each period according to the determination of the derivative’s effectiveness. The effective portion of changes in the fair value of derivatives designated as cash flow hedges is recorded in accumulated other comprehensive loss and subsequently reclassified into earnings in the period during which the hedged transaction is recognized in earnings. The ineffective portion of the change in fair value of the derivatives is recognized as non-operating income or expense immediately when incurred and included in interest expense in the accompanying consolidated statements of income.
Foreign Exchange Forward
The Company utilizes a foreign exchange forward in order to minimize monthly foreign currency remeasurement gains or losses on non-functional currency monetary balances. The Company did not designate the derivative as a hedge. All changes in the fair value of the foreign exchange forward are recorded in earnings every month to other (income) expense, net in the accompanying consolidated statements of income, as disclosed in “Note 6 – Derivatives.”
Allowance for Doubtful Accounts
The Company maintains a credit approval process and makes judgments in connection with assessing its customers’ ability to pay for contracted services. Generally, the Company has the ability to limit credit exposure by discontinuing services in the event of non-payment. The Company monitors its customers’ credit worthiness and applies judgment in establishing a provision for estimated credit losses based on historical experience, the aging of receivables, and customer-specific circumstances that would affect the customers’ ability to pay for services rendered.
Property and Equipment
Property and equipment primarily consists of furniture, vehicles, software, office equipment, computer equipment, and lab equipment. Purchased and constructed property and equipment is initially recorded at historical cost plus the estimated value of any associated legally or contractually required retirement obligations. Property and equipment acquired in an acquisition are recorded based on the estimated fair value as of the acquisition date. The Company leases vehicles for certain sales representatives in the Commercial Solutions segment. These leases are classified and accounted for as leases in accordance with ASC Topic 842, Leases (“ASC 842”). For further information about lease arrangements, see “Note 5 - Leases.”
102
Property and equipment assets are depreciated using the straight-line method over the respective estimated useful lives as follows:
|
|
|
Useful Life |
|
Buildings |
|
|
|
Furniture and fixtures |
|
|
|
Equipment |
|
|
|
Computer equipment and software |
|
|
|
Vehicles |
|
Lesser of lease term or the estimated economic life of the leased asset |
|
Leasehold improvements |
|
Lesser of remaining life of lease or the useful life of the asset |
Expenditures for repairs and maintenance are expensed as incurred and expenditures for major improvements that increase the functionality or extend the useful life of the asset are capitalized and depreciated over the estimated useful life of the asset.
The Company capitalizes costs of computer software obtained for internal use and amortizes these costs on a straight-line basis over the estimated useful life of the product, not to exceed
The Company reviews property and equipment for impairment whenever facts and circumstances indicate that the carrying amounts of these assets might not be recoverable. For assessment purposes, property and equipment are grouped with other assets and liabilities at the lowest level that identifiable cash flows are largely independent of the cash flows of other assets and liabilities. Recoverability of the carrying amount of an asset group is assessed by comparing its carrying amount to the estimated undiscounted future cash flows expected to be generated by the asset group. If the carrying value of the asset group exceeds its fair value, an impairment charge is recognized for the excess.
Leases
At inception, a contract contains a lease if the contract conveys the right to control the use of an identified asset for a period of time in exchange for consideration. In evaluating whether it has the right to control the use of an identified asset, the Company assesses whether they have the right to direct the use of the identified asset and to obtain substantially all of the economic benefit from the use of the identified asset.
Right-of-use (“ROU”) assets represent the Company’s right to use an underlying asset during the lease term and lease liabilities represent the Company’s obligation to make lease payments arising from the lease. Assets and liabilities are recognized based on the present value of lease payments over the lease term. Most leases include one or more options to renew. The exercise of the renewal option is at the Company’s sole discretion and the Company includes these options in determining the lease term used to establish its right-of-use assets and lease liabilities when it is reasonably certain the Company will exercise its option.
Because most of the Company’s leases do not provide an implicit rate, the Company uses its incremental borrowing rate based on the information available at the lease commencement date in determining the present value of lease payments. The Company uses the implicit rate when readily determinable. Operating lease expense is generally recognized on a straight-line basis over the lease term.
103
The Company has agreements with lease and non-lease components, which are accounted for as a single lease component. Leases with a lease term of 12 months or less are not recorded on the balance sheet. The Company recognizes lease expense for these leases on a straight-line basis over the lease term. Variable lease payment amounts that cannot be determined at the commencement of the lease, such as increases in lease payments based on changes in index rates, are not included in the right-of-use assets or liabilities. These variable lease payments are expensed as incurred.
Goodwill and Intangible Assets
Goodwill represents the excess of the purchase price over the estimated fair value of net assets acquired, including the amount assigned to identifiable intangible assets, in acquisitions. In accordance with ASC Topic 350, Intangibles – Goodwill and Other, goodwill is not subject to amortization but must be tested for impairment annually or more frequently if events or changes in circumstances indicate that goodwill might be impaired. Goodwill is tested for impairment at the reporting unit level, which is one level below the operating segment level. This test requires the Company to determine if the implied fair value of the reporting unit’s goodwill is less than its carrying amount.
The Company has assigned goodwill to
Intangible assets consist of customer relationships, acquired backlog, trade names, trademarks, patient communities, and acquired technologies. The Company amortizes intangible assets related to customer relationships, trade names, trademarks, patient communities, and acquired technologies on a straight-line basis over the estimated useful life of the asset. Intangible assets related to acquired backlog are amortized based on the Company’s expectations of the timing of when revenue associated with the backlog is expected to be recognized.
The Company reviews intangible assets at the end of each reporting period to determine if facts and circumstances indicate that the useful life is shorter than originally estimated or that the carrying amount of the assets might not be recoverable. If such facts and circumstances exist, the Company assesses the recoverability of identified assets by comparing the projected undiscounted cash flows associated with the related asset or group of assets to their respective carrying amounts. Impairments, if any, are based on the excess of the carrying amount over the fair value of those assets and occur in the period in which the impairment determination is made.
The weighted average estimated useful lives of the Company’s intangible assets were as follows as of December 31:
|
|
|
2021 |
|
2020 |
|
Customer relationships |
|
|
|
|
|
Acquired backlog |
|
|
|
|
|
Trade names and trademarks |
|
|
|
|
|
Intellectual property (medical patent) |
|
n/a |
|
|
|
Patient communities |
|
|
|
n/a |
|
Acquired technologies |
|
|
|
n/a |
104
Contingencies
In the normal course of business, the Company periodically becomes involved in various proceedings and claims, including investigations, disputes, litigations, and regulatory matters that are incidental to its business. The Company evaluates the likelihood of an unfavorable outcome of all legal and regulatory matters and records accruals for probable loss contingencies for which the amount of the loss can be reasonably estimated. Gain contingencies are not recognized until realized. Legal fees are expensed as incurred.
Because these matters are inherently unpredictable, and unfavorable developments or resolutions can occur, assessing contingencies is highly subjective and requires judgments about future events. These judgments and estimates are based, among other factors, on the status of the proceedings, the merits of the Company’s defenses, and the consultation with in-house and external counsel. The Company regularly reviews contingencies to determine whether its accruals and related disclosures are adequate. Although the Company believes that it has substantial defenses in these matters, the amount of losses incurred as a result of actual outcomes may differ significantly from the Company’s estimates.
Revenue Recognition
In accordance with ASC Topic 606, Revenue from Contracts with Customers and all related amendments (“ASC 606”), revenue is recognized when, or as, a customer obtains control of promised services. The amount of revenue recognized reflects the consideration to which the Company expects to be entitled to receive in exchange for these services.
A performance obligation is a promise (or a combination of promises) in a contract to transfer distinct goods or services to a customer and is the unit of accounting under ASC 606 for the purposes of revenue recognition. A contract’s transaction price is allocated to each performance obligation and is recognized as revenue, when, or as, each performance obligation is satisfied. The majority of the Company’s Clinical Solutions segment contracts have a single performance obligation because the promise to transfer individual services is not separately identifiable from other promises in the contracts, and therefore, is not distinct. For contracts with multiple performance obligations, the contract’s transaction price is allocated to each performance obligation using the best estimate of the standalone selling price of each distinct good or service in the contract.
The majority of the Company’s revenue arrangements are service contracts that range in duration from a few months to several years. Substantially all of the Company’s performance obligations, and associated revenue, are transferred to the customer over time. The Company generally receives compensation based on measuring progress toward completion using anticipated project budgets for direct labor and prices for each service offering. The Company is also reimbursed for certain third-party pass-through and out-of-pocket costs. In addition, in certain instances a customer contract may include forms of variable consideration such as incentive fees, volume rebates or other provisions that can increase or decrease the transaction price. This variable consideration is generally awarded upon achievement of certain performance metrics, program milestones or cost targets. For the purposes of revenue recognition, variable consideration is assessed on a contract-by-contract basis and the amount included in the transaction price is estimated based on the Company’s anticipated performance and consideration of all information that is reasonably available. Variable consideration is recognized as revenue if and when it is deemed probable that a significant reversal in the amount of cumulative revenue recognized will not occur when the uncertainty associated with the variable consideration is resolved in the future.
105
Most of the Company’s contracts can be terminated by the customer without cause with a notice period that generally ranges from 30 to 90 days. In the event of termination, the Company’s contracts generally provide that the customer pay the Company for: (i) fees earned through the termination date; (ii) fees and expenses for winding down the project, which include both fees incurred and actual expenses; (iii) non-cancellable expenditures; and (iv) in some cases, a fee to cover a portion of the remaining professional fees on the project. The Company’s long-term clinical trial contracts contain implied substantive termination penalties because of the significant wind-down cost of terminating a clinical trial. These provisions for termination penalties result in these types of contracts being treated as long-term for revenue recognition purposes.
Changes in the scope of work are common, especially under long-term contracts, and generally result in a change in the total contract transaction price. If the customer does not agree to a contract modification, the Company could bear the risk of cost overruns. Most of the Company’s contract modifications are for services that are not distinct from the services under the existing contract due to the significant integration service provided in the context of the contract and therefore result in a cumulative catch-up adjustment to revenue at the date of contract modification.
Capitalized Costs
The Company capitalizes certain costs associated with commissions and bonuses paid to its employees in the Clinical Solutions segment because these costs are incurred in obtaining contracts that have a term greater than one year. Capitalized costs are included in prepaid expenses and other current assets and other long-term assets in the accompanying consolidated balance sheets. The Company amortizes these costs in a manner that is consistent with the pattern of revenue recognition described below. The Company expenses costs to obtain contracts that have a term of one year or less.
Clinical Solutions
The Company’s Clinical Solutions segment provides solutions to address the clinical development needs of customers. The Company provides total biopharmaceutical program development through its full-service platform, while also providing discrete services for any part of a clinical trial, primarily through functional service provider, Early Stage, and Real World and Late Phase (“RWLP”) services. The services provided via the full-service platform and RWLP platforms generally span several years and a significant benefit to the customer is provided by integrating the services provided by the Company’s employees as well as those performed by third parties. Because the Company’s full-service platform provides a significant integration service to the customer, these contracts contain a single performance obligation. Revenue is recognized over time using an input measure of progress. The input measure reflects costs (including investigator payments and pass-through costs) incurred to date relative to total estimated costs to complete (“cost-to-cost measure of progress”). Under the cost-to-cost measure of progress methodology, revenue is recorded proportionally to costs incurred. Contract costs principally include direct labor, investigator payments, and pass-through costs. The estimate of total estimated costs at completion requires significant judgment. Contract estimates are based on various assumptions to project future outcomes of events that often span several years. These estimates are reviewed periodically and any adjustments are recognized on a cumulative catch-up basis in the period they become known.
The remaining service offerings within the Clinical Solutions segment are generally short-term, month-to-month contracts, time and materials basis contracts, or provide a series of distinct services that are substantially the same and have the same pattern of transfer to the customer (“series”). As such, revenue for these service offerings is generally recognized as services are performed for the amount the Company estimates it is entitled to for the period.
106
Commercial Solutions
The Company’s Commercial Solutions segment provides a broad suite of complementary commercialization services including Deployment Solutions, communications (advertising and public relations), and consulting services. Deployment Solutions contracts offer outsourced services to promote commercial products on behalf of a customer.
The remaining Commercial Solutions contracts are generally short-term, month-to-month contracts or time and materials contracts. As such, Commercial Solutions revenue is generally recognized as services are performed for the amount of consideration the Company estimates it is entitled to for the period. For contracts billed on a fixed price basis, revenue is recognized over time based on the proportion of labor costs expended to total labor costs expected to complete the contract.
Accounts Receivable, Unbilled Services, and Deferred Revenue
Accounts receivable are recorded at net realizable value. Unbilled accounts receivable arise when services have been rendered for which revenue has been recognized but the customers have not been billed. Contractual provisions and payment schedules may or may not correspond to the timing of the performance of services under the contract.
Unbilled services include contract assets, under which the right to bill the customer is subject to factors other than the passage of time. These amounts may not exceed their net realizable value. Contract assets are generally classified as current.
Deferred revenue is a contract liability that consists of customer payments received in advance of performance and billings in excess of revenue recognized, net of revenue recognized from the balance at the beginning of the period.
Timing of Billing and Performance
Differences in the timing of revenue recognition and associated billings and cash collections result in recording of billed accounts receivable, unbilled accounts receivable (including contract assets), and deferred revenue on the consolidated balance sheet. Amounts are billed as work progresses in accordance with agreed-upon contractual terms either at periodic intervals or upon achievement of contractual milestones. Billings generally occur subsequent to revenue recognition, resulting in recording unbilled accounts receivable in instances where the right to bill is contingent solely on the passage of time (e.g., in the following month), and contract assets in instances where the right to bill is associated with achievement of a milestone.
Reimbursable Out-of-Pocket Expenses
The Company incurs and is reimbursed by its customers for certain costs, including fees paid to principal investigators and for other out-of-pocket costs (such as travel expenses for the Company’s clinical monitors and sales representatives). The Company includes these costs in total operating expenses, and the related reimbursements in revenue, as the Company is the principal in the applicable arrangements and is responsible for fulfilling the promise to provide the specified services.
Share-Based Compensation
The Company measures and recognizes compensation expense related to all share-based awards based on the estimated fair value of the awards. The fair value of restricted stock and stock unit awards is measured on the grant date based on the fair market value of the Company’s common stock.
107
Share-based compensation expense is recognized on a straight-line basis over the shorter of the requisite service period or the vesting term. For awards with performance conditions, stock-based compensation expense is recognized when the achievement of each individual performance target becomes probable, and the number of shares expected to vest is adjusted for the weighted probability of attainment of the relevant performance targets. Forfeitures are accounted for as they occur.
All excess tax benefits and tax deficiencies (including tax benefits of dividends on share-based payment awards, if applicable) are recognized as income tax expense or benefit in the consolidated statements of income. The tax effects of exercised or vested awards are treated as discrete items in the reporting period in which they occur. The Company also recognizes excess tax benefits regardless of whether the benefit reduces taxes payable in the current period.
Income Taxes
The majority of the Company’s U.S. subsidiaries file a consolidated U.S. federal income tax return, while certain U.S. subsidiaries, including recently acquired entities, may file separate U.S. federal tax returns. The Company’s subsidiaries in international jurisdictions file tax returns in their respective jurisdictions.
The Company estimates its tax liability based on current tax laws in the statutory jurisdictions in which it operates. Accordingly, the impact of changes in income tax laws on deferred tax assets and deferred tax liabilities is recognized in earnings in the period during which such changes are enacted. The Company records deferred tax assets and liabilities based on temporary differences between the financial reporting basis and tax basis of the Company’s assets and liabilities at enacted tax rates expected to be in effect when the differences are realized or settled.
Deferred income tax assets represent amounts available to reduce income taxes payable on taxable income in future years. Such assets arise because of temporary differences between the financial reporting and tax bases of assets and liabilities, as well as from net operating loss and tax credit carryforwards. The Company evaluates recoverability of these future tax deductions. The Company establishes a valuation allowance for deferred income tax assets when the Company believes it is more likely than not the assets will not be realized. The Company evaluates the recoverability of these future tax deductions by assessing future expected taxable income. In estimating future taxable income, the Company considers both positive and negative evidence, such as historical and forecasted results of operations, and implementation of prudent and feasible tax planning strategies. If the objectively verifiable negative evidence outweighs any available positive evidence (or the only available positive is subjective and cannot be verified), then a valuation allowance will likely be deemed necessary. If a valuation allowance is deemed to be unnecessary, such allowance is released and any related benefit is recognized in the period of the change.
The Company recognizes a tax benefit from any uncertain tax positions only if they are more likely than not to be sustained upon examination based on the technical merits of the position. The Company evaluates uncertain tax positions pursuant to the more likely than not standard, and benefits related to such uncertain tax positions are recognized as the largest amount of benefit, determined on a cumulative probability basis, to be realized upon ultimate settlement of the position. Components of the reserve for uncertain tax positions are classified as either a current or a long-term liability in the accompanying consolidated balance sheets based on management’s expectation of future cash settlements.
Judgment is required in determining what constitutes an uncertain tax position, as well as assessing the outcome of each tax position. The Company considers many factors when evaluating and estimating tax positions and tax benefits. In addition, the calculation of tax liabilities involves dealing with uncertainties in the application of complex tax regulations in domestic and foreign jurisdictions. If the calculation of the liability related to uncertain tax positions proves to be more or less than the ultimate settlement, a tax expense or tax benefit, respectively, would result. Unrecognized tax benefits are presented as either a reduction to a deferred tax asset or as a separate liability.
108
Restructuring and Other Costs
Restructuring and other costs primarily consist of one-time employee termination benefits, contract termination costs, and other costs associated with an exit or disposal activity. The Company accounts for restructuring costs in accordance with ASC Topic 420, Exit or Disposal Cost Obligations. This guidance requires that a liability for a cost associated with an exit or disposal activity be recognized in the period in which the liability is incurred, as opposed to the period in which management commits to a plan of action for termination. The guidance also requires that the liabilities associated with an exit or disposal activity be measured at the fair value in the period in which the liability is incurred, except for: (i) liabilities related to one-time employee termination benefits, which shall be measured and recognized at the date the entity notifies employees of termination, unless employees are required to render services beyond a minimum retention period, in which case the liability is recognized ratably over the future service period; and (ii) liabilities related to an operating lease, which shall be measured and recognized when the contract does not have any future economic benefit to the entity (i.e., the entity ceases to utilize the rights conveyed by the contract). Restructuring liabilities are included in accrued expenses and other long-term liabilities in the accompanying consolidated balance sheets.
Earnings Per Share
The Company determines earnings per share in accordance with ASC Topic 260, Earnings Per Share. The Company has one class of common stock for purposes of the earnings per share calculation and therefore computes basic earnings per share by dividing net income (loss) by the weighted average number of common shares outstanding for the applicable period. Diluted earnings per share are computed in the same manner as basic earnings per share, except that the number of shares is increased to assume exercise of potentially dilutive equity awards using the treasury stock method, unless the effect of such increase would be anti-dilutive. Under the treasury stock method, the amount the employee must pay for exercising equity awards and the amount of compensation cost for future service that the Company has not yet recognized are assumed to be used to repurchase shares.
Subsequent Events
The Company considers events or transactions that occur after the balance sheet date but before the financial statements are issued to provide additional evidence relative to certain estimates or to identify matters that require additional disclosure. The Company evaluated all events and transactions through the date that these financial statements were issued.
Recently Adopted Accounting Standards
In June 2016, the Financial Accounting Standards Board (“FASB”) issued ASU No. 2016-13 (“ASU 2016-13”), Financial Instruments - Credit Losses (Topic 326) to modify the impairment model to utilize an expected loss methodology in place of the previous incurred loss methodology and require consideration of a broader range of reasonable and supportable information to inform credit loss estimates. The Company adopted ASU 2016-13 on
109
2. Financial Statement Details
Accounts Receivable and Unbilled Services, net
Accounts receivable and unbilled services (including contract assets), net of allowance for doubtful accounts, consisted of the following as of December 31 (in thousands):
|
|
|
2021 |
|
|
2020 |
|
||
|
Accounts receivable billed |
|
$ |
|
|
|
$ |
|
|
|
Accounts receivable unbilled |
|
|
|
|
|
|
|
|
|
Contract assets |
|
|
|
|
|
|
|
|
|
Less: Allowance for doubtful accounts |
|
|
( |
) |
|
|
( |
) |
|
Accounts receivable and unbilled services, net |
|
$ |
|
|
|
$ |
|
|
The following table summarizes the changes in the allowance for doubtful accounts (in thousands):
|
|
|
Year Ended December 31, |
|
|||||||||
|
|
|
2021 |
|
|
2020 |
|
|
2019 |
|
|||
|
Balance at the beginning of the period |
|
$ |
( |
) |
|
$ |
( |
) |
|
$ |
( |
) |
|
Impact from adoption of ASU 2016-13 |
|
|
— |
|
|
|
( |
) |
|
|
— |
|
|
Current year provision |
|
|
( |
) |
|
|
( |
) |
|
|
( |
) |
|
Write-offs, net of recoveries and the effects of foreign currency exchange |
|
|
|
|
|
|
|
|
|
|
|
|
|
Balance at the end of the period |
|
$ |
( |
) |
|
$ |
( |
) |
|
$ |
( |
) |
Accounts Receivable Factoring Arrangement
The Company has an accounts receivable factoring agreement to sell certain eligible unsecured trade accounts receivable, at its option, without recourse, to an unrelated third-party financial institution for cash. For the years ended December 31, 2021 and 2020, the Company factored $
Property and Equipment, net
Property and equipment, net of accumulated depreciation, consisted of the following as of December 31 (in thousands):
|
|
|
2021 |
|
|
2020 |
|
||
|
Software |
|
$ |
|
|
|
$ |
|
|
|
Leasehold improvements |
|
|
|
|
|
|
|
|
|
Computer equipment |
|
|
|
|
|
|
|
|
|
Vehicles |
|
|
|
|
|
|
|
|
|
Office furniture, fixtures, and equipment |
|
|
|
|
|
|
|
|
|
Buildings and land |
|
|
|
|
|
|
|
|
|
Assets not yet placed in service |
|
|
|
|
|
|
|
|
|
Property and equipment, gross |
|
|
|
|
|
|
|
|
|
Less: Accumulated depreciation |
|
|
( |
) |
|
|
( |
) |
|
Property and equipment, net |
|
$ |
|
|
|
$ |
|
|
110
As of December 31, 2021 and 2020, the gross book value of vehicles under finance leases was $
Goodwill and Intangible Assets
The changes in carrying amount of goodwill by segment were as follows (in thousands):
|
|
|
Clinical Solutions (a) |
|
|
Commercial Solutions (b) |
|
|
Total |
|
|||
|
Balance as of December 31, 2019 |
|
$ |
|
|
|
$ |
|
|
|
$ |
|
|
|
Acquisitions and divestitures (c) |
|
|
|
|
|
|
( |
) |
|
|
|
|
|
Impact of foreign currency translation |
|
|
|
|
|
|
|
|
|
|
|
|
|
Balance as of December 31, 2020 |
|
|
|
|
|
|
|
|
|
|
|
|
|
Acquisitions (d) |
|
|
|
|
|
|
— |
|
|
|
|
|
|
Impact of foreign currency translation and other (e) |
|
|
|
|
|
|
( |
) |
|
|
( |
) |
|
Balance as of December 31, 2021 |
|
$ |
|
|
|
$ |
|
|
|
$ |
|
|
(a) Accumulated impairment losses of $
(b) Accumulated impairment losses of $
(c) Amounts represent goodwill recognized in connection with the 2020 acquisitions of SHCR Holdings Corporation (“Synteract”) and Illingworth Research Group™ (“Illingworth Research”) within the Clinical Solutions segment and goodwill disposed upon the sale of the medication adherence business within the Commercial Solutions segment.
(d) Amount represents goodwill recognized in connection with the acquisitions of StudyKIK Corporation (“StudyKIK”) and RxDataScience, Inc. (“RxDataScience”), other insignificant acquisitions in 2021, and insignificant measurement period adjustments recognized in connection with the 2020 acquisitions of Synteract and Illingworth Research within the Clinical Solutions segment.
(e) Includes $
Intangible assets, net consisted of the following (in thousands):
|
|
|
December 31, 2021 |
|
|
December 31, 2020 |
|
||||||||||||||||||
|
|
|
Gross |
|
|
Accumulated Amortization |
|
|
Net |
|
|
Gross |
|
|
Accumulated Amortization |
|
|
Net |
|
||||||
|
Customer relationships |
|
$ |
|
|
|
$ |
( |
) |
|
$ |
|
|
|
$ |
|
|
|
$ |
( |
) |
|
$ |
|
|
|
Acquired backlog |
|
|
|
|
|
|
( |
) |
|
|
|
|
|
|
|
|
|
|
( |
) |
|
|
|
|
|
Trade names and trademarks |
|
|
|
|
|
|
( |
) |
|
|
|
|
|
|
|
|
|
|
( |
) |
|
|
|
|
|
Intellectual property (medical patent) |
|
|
— |
|
|
|
— |
|
|
|
— |
|
|
|
|
|
|
|
( |
) |
|
|
|
|
|
Patient communities |
|
|
|
|
|
|
( |
) |
|
|
|
|
|
|
— |
|
|
|
— |
|
|
|
— |
|
|
Acquired technologies |
|
|
|
|
|
|
( |
) |
|
|
|
|
|
|
— |
|
|
|
— |
|
|
|
— |
|
|
Intangible assets, net |
|
$ |
|
|
|
$ |
( |
) |
|
$ |
|
|
|
$ |
|
|
|
$ |
( |
) |
|
$ |
|
|
111
|
Year Ended December 31, |
|
|
|
|
|
2022 |
|
$ |
|
|
|
2023 |
|
|
|
|
|
2024 |
|
|
|
|
|
2025 |
|
|
|
|
|
2026 |
|
|
|
|
|
2027 and thereafter |
|
|
|
|
|
Total |
|
$ |
|
|
Accrued Expenses
Accrued expenses consisted of the following as of December 31 (in thousands):
|
|
|
2021 |
|
|
2020 |
|
||
|
Professional fees, investigator fees, and pass-through costs |
|
$ |
|
|
|
$ |
|
|
|
Compensation, including bonuses, fringe benefits, and payroll taxes |
|
|
|
|
|
|
|
|
|
Income and other taxes |
|
|
|
|
|
|
|
|
|
Rebates to customers |
|
|
|
|
|
|
|
|
|
Restructuring and other costs, current portion |
|
|
|
|
|
|
|
|
|
Contingent obligations, current |
|
|
|
|
|
|
|
|
|
Interest rate swaps - current |
|
|
|
|
|
|
|
|
|
Other liabilities |
|
|
|
|
|
|
|
|
|
Total accrued expenses |
|
$ |
|
|
|
$ |
|
|
Accumulated Other Comprehensive Loss, Net of Taxes
Accumulated other comprehensive loss, net of taxes, consisted of the following (in thousands):
|
|
|
Year Ended December 31, |
|
|||||
|
|
|
2021 |
|
|
2020 |
|
||
|
Beginning balance |
|
$ |
( |
) |
|
$ |
( |
) |
|
|
|
|
|
|
|
|
|
|
|
Derivative Instruments: |
|
|
|
|
|
|
|
|
|
Beginning balance |
|
|
( |
) |
|
|
( |
) |
|
Other comprehensive gain (loss) before reclassifications |
|
|
|
|
|
|
( |
) |
|
Reclassification adjustments |
|
|
|
|
|
|
|
|
|
Ending balance |
|
|
( |
) |
|
|
( |
) |
|
|
|
|
|
|
|
|
|
|
|
Foreign Currency Translation: |
|
|
|
|
|
|
|
|
|
Beginning balance |
|
|
( |
) |
|
|
( |
) |
|
Other comprehensive (loss) income before reclassifications |
|
|
( |
) |
|
|
|
|
|
Ending balance |
|
|
( |
) |
|
|
( |
) |
|
|
|
|
|
|
|
|
|
|
|
Accumulated other comprehensive loss, net of taxes |
|
$ |
( |
) |
|
$ |
( |
) |
112
Changes in accumulated other comprehensive loss consisted of the following (in thousands):
|
|
|
Year Ended December 31, |
|
|||||||||
|
|
|
2021 |
|
|
2020 |
|
|
2019 |
|
|||
|
Unrealized loss on derivative instruments: |
|
|
|
|
|
|
|
|
|
|
|
|
|
Unrealized gain (loss) during period, before taxes |
|
$ |
|
|
|
$ |
( |
) |
|
$ |
( |
) |
|
Income tax expense (benefit) |
|
|
|
|
|
|
( |
) |
|
|
( |
) |
|
Unrealized gain (loss) during period, net of taxes |
|
|
|
|
|
|
( |
) |
|
|
( |
) |
|
Reclassification adjustment, before taxes |
|
|
|
|
|
|
|
|
|
|
|
|
|
Income tax expense |
|
|
|
|
|
|
|
|
|
|
|
|
|
Reclassification adjustment, net of taxes |
|
|
|
|
|
|
|
|
|
|
|
|
|
Total unrealized gain (loss) on derivative instruments, net of taxes |
|
|
|
|
|
|
( |
) |
|
|
( |
) |
|
|
|
|
|
|
|
|
|
|
|
|
|
|
|
Foreign currency translation adjustments: |
|
|
|
|
|
|
|
|
|
|
|
|
|
Foreign currency translation adjustments, before taxes |
|
|
( |
) |
|
|
|
|
|
|
|
|
|
Income tax (benefit) expense |
|
|
( |
) |
|
|
|
|
|
|
— |
|
|
Foreign currency translation adjustments, net of taxes |
|
|
( |
) |
|
|
|
|
|
|
|
|
|
|
|
|
|
|
|
|
|
|
|
|
|
|
|
Total other comprehensive (loss) income, net of taxes |
|
$ |
( |
) |
|
$ |
|
|
|
$ |
|
|
Other (Income) Expense, Net
Other (income) expense, net consisted of the following (in thousands):
|
|
|
Year Ended December 31, |
|
|||||||||
|
|
|
2021 |
|
|
2020 |
|
|
2019 |
|
|||
|
Net realized foreign currency loss |
|
$ |
|
|
|
$ |
|
|
|
$ |
|
|
|
Net unrealized foreign currency (gain) loss |
|
|
( |
) |
|
|
|
|
|
|
|
|
|
Gain on sale of business |
|
|
— |
|
|
|
( |
) |
|
|
— |
|
|
Equity investment (income) expense |
|
|
( |
) |
|
|
( |
) |
|
|
|
|
|
Other, net |
|
|
( |
) |
|
|
|
|
|
|
|
|
|
Total other (income) expense, net |
|
$ |
( |
) |
|
$ |
( |
) |
|
$ |
|
|
Supplemental disclosure of cash flow information
The following table provides details of supplemental cash flow information (in thousands):
|
|
|
Year Ended December 31, |
|
|||||||||
|
|
|
2021 |
|
|
2020 |
|
|
2019 |
|
|||
|
Cash paid for income taxes, net of refunds |
|
$ |
|
|
|
$ |
|
|
|
$ |
|
|
|
Cash paid for interest (excluding finance leases) |
|
|
|
|
|
|
|
|
|
|
|
|
|
Supplemental disclosure of noncash investing and financing activities |
|
|
|
|
|
|
|
|
|
|
|
|
|
Non-cash investment to acquire certain intellectual property rights from a customer in lieu of cash payment for services rendered |
|
|
— |
|
|
|
|
|
|
|
— |
|
|
Fair value of contingent consideration related to acquisitions |
|
|
|
|
|
|
— |
|
|
|
— |
|
|
Change in property and equipment included in liabilities |
|
|
|
|
|
|
|
|
|
|
|
|
|
Vehicles acquired through finance lease agreements |
|
|
|
|
|
|
|
|
|
|
|
|
113
3. Acquisitions, Divestitures, and Investments
StudyKIK Acquisition
On
The purchase price has been allocated to the tangible assets and identifiable intangible assets acquired and liabilities assumed based upon their fair values. The excess of the purchase price over the tangible and intangible assets acquired and liabilities assumed has been recorded as goodwill. Goodwill is attributable to the acquired workforce as well as future synergies and is not deductible for income tax purposes. The operating results from the acquisition have been included in the Company’s Clinical Solutions segment from the date of acquisition.
The following table summarizes the fair values of identified intangible assets and their respective useful lives (dollars in thousands):
|
|
|
Estimated Fair Value |
|
|
Estimated Useful Life |
|
|
Customer relationships |
|
$ |
|
|
|
|
|
Acquired backlog |
|
|
|
|
|
|
|
Trade name |
|
|
|
|
|
|
|
Patient communities |
|
|
|
|
|
|
|
Acquired technologies |
|
|
|
|
|
|
|
Total intangible assets |
|
$ |
|
|
|
|
RxDataScience Acquisition
On
The purchase price has been allocated to the tangible assets and identifiable intangible assets acquired and liabilities assumed based upon their fair values. The excess of the purchase price over the tangible and intangible assets acquired and liabilities assumed has been recorded as goodwill. Goodwill is attributable to the acquired workforce as well as future synergies and is not deductible for income tax purposes. The operating results from the acquisition have been included in the Company’s Clinical Solutions segment from the date of acquisition.
The Company’s assessments of fair value and the purchase price allocations related to these 2021 acquisitions are preliminary and further adjustments may be necessary as additional information related to the fair values of assets acquired and liabilities assumed is assessed during the measurement period (up to one year from the respective acquisition dates).
114
Synteract Acquisition
On
Allocation of Consideration Transferred
The following table summarizes the estimated fair value of the net assets acquired at the date of the acquisition:
|
Assets acquired: |
|
|
|
|
|
Cash and cash equivalents |
|
$ |
|
|
|
Accounts receivable and unbilled services |
|
|
|
|
|
Prepaid expenses and other current assets |
|
|
|
|
|
Property and equipment |
|
|
|
|
|
Operating lease right-of-use assets |
|
|
|
|
|
Other identifiable intangible assets |
|
|
|
|
|
Goodwill |
|
|
|
|
|
Other assets |
|
|
|
|
|
Total assets acquired |
|
|
|
|
|
Liabilities assumed: |
|
|
|
|
|
Accounts payable and accrued expenses |
|
|
|
|
|
Deferred revenue |
|
|
|
|
|
Operating lease obligations |
|
|
|
|
|
Deferred income taxes, net |
|
|
|
|
|
Other liabilities |
|
|
|
|
|
Total liabilities assumed |
|
|
|
|
|
Net assets acquired |
|
$ |
|
|
The purchase price has been allocated to the tangible assets and identifiable intangible assets acquired and liabilities assumed based upon their fair values. The excess of the purchase price over the tangible and intangible assets acquired and liabilities assumed has been recorded as goodwill. Goodwill is attributable to the acquired workforce as well as future synergies and is not deductible for income tax purposes. The operating results from the acquisition of Synteract have been included in the Company’s Clinical Solutions segment from the date of acquisition.
The following table summarizes the fair value of identified intangible assets and their respective useful lives at the date of the acquisition (dollars in thousands):
|
|
|
Estimated Fair Value |
|
|
Estimated Useful Life |
|
|
Acquired backlog |
|
$ |
|
|
|
4 years |
|
Trade name |
|
|
|
|
|
8 years |
|
Total intangible assets |
|
$ |
|
|
|
|
115
Illingworth Research Group Acquisition
On
The purchase price has been allocated to the tangible assets and identifiable intangible assets acquired and liabilities assumed based upon their fair values. The excess of the purchase price over the tangible and intangible assets acquired and liabilities assumed has been recorded as goodwill. Goodwill is attributable to the acquired workforce as well as future synergies and is not deductible for income tax purposes. The operating results from the acquisition of Illingworth Research have been included in the Company’s Clinical Solutions segment from the date of acquisition.
Pro forma information for these acquisitions is not presented as the operations of the acquired businesses, individually and in the aggregate, are not significant to the overall operations of the Company.
Divestitures
During the second quarter of 2020, the Company sold its contingent staffing business to a related party in exchange for potential future cash consideration not to exceed $
During the fourth quarter of 2020, the Company sold its medication adherence business for consideration of $
Investments
During the second quarter of 2020, the Company made a non-cash investment of $
116
4. Long-Term Debt Obligations
The Company’s debt obligations consisted of the following as of December 31 (in thousands):
|
|
|
2021 |
|
|
2020 |
|
||
|
Secured Debt |
|
|
|
|
|
|
|
|
|
Term Loan A - tranche one due March 2024 |
|
$ |
|
|
|
$ |
|
|
|
Term Loan A - tranche two due August 2024 |
|
|
|
|
|
|
|
|
|
Term Loan B due August 2024 |
|
|
— |
|
|
|
|
|
|
Accounts receivable financing agreement due October 2024 |
|
|
|
|
|
|
|
|
|
Total secured debt |
|
|
|
|
|
|
|
|
|
Unsecured Debt |
|
|
|
|
|
|
|
|
|
Senior notes due January 2029 (the “Notes”) |
|
|
|
|
|
|
|
|
|
Total debt obligations |
|
|
|
|
|
|
|
|
|
Less: Term loans original issuance discount |
|
|
( |
) |
|
|
( |
) |
|
Less: Unamortized deferred issuance costs |
|
|
( |
) |
|
|
( |
) |
|
Total long-term debt |
|
$ |
|
|
|
$ |
|
|
Credit Agreement
The Company is party to a credit agreement (as amended, the “Credit Agreement”) that included a $
On June 30, 2021 (the “Closing Date”), the Company entered into Amendment No. 5 (the “Fifth Amendment”) to the Credit Agreement. The Fifth Amendment modified the Credit Agreement to increase Term Loan A in an aggregate principal amount of $
During the year ended December 31, 2021, the Company made $
All obligations under the Credit Agreement are guaranteed by the Company and certain of the Company’s direct and indirect wholly-owned domestic subsidiaries. The obligations under the Credit Agreement are secured by substantially all of the assets of the Company and the guarantors, including
117
The term loans and the Revolver bear interest at a rate per annum equal to the Adjusted Eurocurrency Rate (“Eurocurrency Rate”) plus an applicable margin or an Alternate Base Rate plus an applicable margin. The Company may select among the Adjusted Eurocurrency Rate or the Alternate Base Rate, whichever is lower, except in circumstances where the Company requests a loan with less than a three-day notice. In such cases, the Company must use the Alternate Base Rate. The Adjusted Eurocurrency Rate is equal to the London Inter-bank Offered Rate (“LIBOR”), subject to adjustment for reserve requirements. The Alternate Base Rate is equal to the highest of: (i) the federal funds rate plus
The applicable margins with respect to Alternate Base Rate and Adjusted Eurocurrency Rate borrowings are determined depending on the “First Lien Leverage Ratio” or the “Secured Net Leverage Ratio” (as defined in the Credit Agreement) and range as follows:
|
|
|
Alternate Base Rate |
|
Adjusted Eurocurrency Rate |
|
Term Loan A |
|
|
|
|
|
Term Loan B |
|
|
|
|
|
Revolver |
|
|
|
|
In February 2021, as a result of the Company’s First Lien Leverage Ratio (as defined in the Credit Agreement) being less than or equal to
The Company also pays a quarterly commitment fee between
Revolver and Letters of Credit
The Revolver includes letters of credit (“LOCs”) with a sublimit of $
Accounts Receivable Financing Agreement
Under the Company’s accounts receivable financing agreement, certain of the Company’s consolidated subsidiaries sell accounts receivable and unbilled services (including contract assets) balances to a wholly-owned, bankruptcy-remote special purpose entity (“SPE”), which is the borrower under the facility. The facility is without recourse to the Company or any subsidiaries of the Company other than the SPE, other than with respect to limited indemnity obligations of the selling entities and the servicer of the receivables in respect of the character of the receivables sold by them and the performance of the servicing duties.
On January 28, 2021, the Company amended its accounts receivable financing agreement to increase the amount it can borrow from $
118
On October 13, 2021, the Company further amended its accounts receivable financing agreement to increase the amount it can borrow from $
As of December 31, 2021, the Company had $
This agreement is secured by a lien on certain receivables and other assets, and the Company has guaranteed the performance of the obligations of existing and future subsidiaries that sell and service the accounts receivable under this agreement. The available borrowing capacity varies monthly according to the levels of its eligible accounts receivable and unbilled receivables. Loans under this agreement will accrue interest at a reserve-adjusted LIBOR rate or a base rate equal to the higher of (i) the applicable lender’s prime rate and (ii) the federal funds rate plus
The Notes
On November 24, 2020, the Company completed the issuance and sale of the Notes, with an aggregate principal amount of $
The Company may redeem some or all of the Notes at any time prior to January 15, 2024 at a redemption price equal to 100% of the aggregate principal amount of the Notes to be redeemed plus a “make-whole” premium and accrued and unpaid interest. In addition, prior to July 15, 2023, the Company may redeem up to
The Indenture contains covenants that limit the ability of the Company and its restricted subsidiaries to, among other things, (1) incur additional liens, (2) engage in certain sale and leaseback transactions, and (3) conduct mergers, consolidations, or asset sales. These covenants are subject to exceptions and qualifications set forth in the Indenture.
If the Company sells certain of its assets or experience specific kinds of changes of control, the Company is required to offer to repurchase the Notes at a repurchase price equal to (1) par plus any accrued and unpaid interest in the case of an asset sale or (2) 101% of the aggregate principal amount thereof plus any accrued and unpaid interest in the case of a change of control.
119
Maturities of Debt Obligations
As of December 31, 2021, the contractual maturities of the Company’s debt obligations (excluding finance leases that are presented in “Note 5 – Leases”) were as follows (in thousands):
|
2022 |
|
$ |
— |
|
|
2023 |
|
|
|
|
|
2024 |
|
|
|
|
|
2025 |
|
|
— |
|
|
2026 |
|
|
— |
|
|
2027 and thereafter |
|
|
|
|
|
Less: Term loan original issuance discount |
|
|
( |
) |
|
Less: Unamortized deferred issuance costs |
|
|
( |
) |
|
Total |
|
$ |
|
|
5. Leases
The Company’s operating leases are primarily related to its office facilities. The Company’s finance leases are related to vehicles that the Company leases for certain sales representatives in its Commercial Solutions segment. The Company’s leases have remaining lease terms of less than
ROU assets and lease liabilities are recognized based on the present value of the fixed lease payments over the lease term at the commencement date. The ROU assets also include any initial direct costs incurred and lease payments made at or before the commencement date, and are reduced by lease incentives. The Company uses its incremental borrowing rate as the discount rate to determine the present value of the lease payments for leases that do not have a readily determinable implicit discount rate. The Company’s incremental borrowing rate is the rate of interest that it would have to borrow on a collateralized basis over a similar term and amount in a similar economic environment. The Company determines the incremental borrowing rates for its leases by adjusting the local risk free interest rate with a credit risk premium corresponding to the Company’s credit rating.
The Company records rent expense for its operating leases on a straight-line basis from the lease commencement date until the end of the lease term. The Company records finance lease cost as a combination of the amortization expense for the ROU assets and interest expense for the outstanding lease liabilities using the discount rate discussed above. Variable lease payments for operating leases are related to office facilities and include but are not limited to common area maintenance, parking, electricity, and management fees. The variable lease payments for finance leases are related to maintenance programs for leased vehicles. Variable lease payments are based on occurrence or based on usage; therefore, they are not included as part of the initial calculations of the ROU assets and liabilities.
120
The components of lease cost were as follows for the year ended December 31 and the line items on the accompanying consolidated statements of income to which they were recorded were as follows (in thousands):
|
|
|
Statement of Income Classification |
|
2021 |
|
|
2020 |
|
||
|
Operating leases: |
|
|
|
|
|
|
|
|
|
|
|
Fixed lease costs |
|
Direct costs, selling, general, and administrative expenses and restructuring and other costs |
|
$ |
|
|
|
$ |
|
|
|
Short-term lease costs |
|
Direct costs and selling, general, and administrative expenses |
|
|
|
|
|
|
|
|
|
Variable lease costs |
|
Direct costs, selling, general, and administrative expenses and restructuring and other costs |
|
|
|
|
|
|
|
|
|
Total operating lease costs |
|
|
|
$ |
|
|
|
$ |
|
|
|
Finance leases: |
|
|
|
|
|
|
|
|
|
|
|
Amortization of right-of-use assets |
|
Depreciation |
|
$ |
|
|
|
$ |
|
|
|
Interest on lease liabilities |
|
Interest expense |
|
|
|
|
|
|
|
|
|
Variable lease costs |
|
Direct costs |
|
|
|
|
|
|
|
|
|
Total finance lease costs |
|
|
|
$ |
|
|
|
$ |
|
|
Supplemental balance sheet information related to finance leases was as follows as of December 31 (in thousands):
|
|
|
2021 |
|
|
2020 |
|
||
|
Property and equipment, gross |
|
$ |
|
|
|
$ |
|
|
|
Accumulated depreciation |
|
|
( |
) |
|
|
( |
) |
|
Property and equipment, net |
|
$ |
|
|
|
$ |
|
|
|
|
|
|
|
|
|
|
|
|
|
Current portion of finance lease obligations |
|
$ |
|
|
|
$ |
|
|
|
Finance lease long-term obligations |
|
|
|
|
|
|
|
|
|
Total finance lease liabilities |
|
$ |
|
|
|
$ |
|
|
Supplemental cash flow information related to leases was as follows for the year ended December 31 (in thousands):
|
|
|
2021 |
|
|
2020 |
|
||
|
Cash paid for amounts included in the measurement of lease liabilities: |
|
|
|
|
|
|
|
|
|
Operating cash flows for operating leases |
|
$ |
( |
) |
|
$ |
( |
) |
|
Operating cash flows for finance leases |
|
|
( |
) |
|
|
( |
) |
|
Financing cash flows for finance leases |
|
|
( |
) |
|
|
( |
) |
|
|
|
|
|
|
|
|
|
|
|
Right-of-use assets obtained in exchange for lease obligations: |
|
|
|
|
|
|
|
|
|
Operating leases |
|
$ |
|
|
|
$ |
|
|
|
Finance leases |
|
|
|
|
|
|
|
|
|
|
|
|
|
|
|
|
|
|
|
Lease obligations closed out in exchange for right-of-use assets: |
|
|
|
|
|
|
|
|
|
Operating leases |
|
$ |
( |
) |
|
$ |
( |
) |
|
Weighted average remaining lease term as of December 31: |
|
2021 |
|
2020 |
|
Operating leases |
|
|
|
|
|
Finance leases |
|
|
|
|
121
|
Weighted average discount rate as of December 31: |
|
2021 |
|
|
2020 |
|
||
|
Operating leases |
|
|
|
% |
|
|
|
% |
|
Finance leases |
|
|
|
% |
|
|
|
% |
As of December 31, 2021, maturities of lease liabilities were as follows (in thousands):
|
|
|
Operating Leases |
|
|
Finance Leases |
|
|
Total |
|
|||
|
2022 |
|
$ |
|
|
|
$ |
|
|
|
$ |
|
|
|
2023 |
|
|
|
|
|
|
|
|
|
|
|
|
|
2024 |
|
|
|
|
|
|
|
|
|
|
|
|
|
2025 |
|
|
|
|
|
|
|
|
|
|
|
|
|
2026 |
|
|
|
|
|
|
|
|
|
|
|
|
|
2027 and thereafter |
|
|
|
|
|
|
— |
|
|
|
|
|
|
Total lease payments |
|
|
|
|
|
|
|
|
|
$ |
|
|
|
Less: Management fee |
|
|
— |
|
|
|
( |
) |
|
|
|
|
|
Less: Imputed interest |
|
|
( |
) |
|
|
( |
) |
|
|
|
|
|
Total lease liabilities |
|
$ |
|
|
|
$ |
|
|
|
|
|
|
6. Derivatives
Interest Rate Swaps
The Company has entered into various interest rate swaps to mitigate its exposure to changes in interest rates on its term loan. In June 2018, the Company entered into an interest rate swap with multiple counterparties that had an initial aggregate notional value of $
In March 2020, the Company entered into interest rate swaps with multiple counterparties. The interest rate swaps had an initial aggregate notional value of $
The significant terms of these derivatives are substantially the same as those contained within the Credit Agreement, including monthly settlements with the swap counterparties. Interest rate swaps are designated as hedging instruments. The amounts of hedge ineffectiveness recorded in net income during the years ended December 31, 2021, 2020, and 2019 were insignificant.
Foreign Exchange Forward
On October 30, 2020, the Company entered into a foreign exchange forward in order to minimize monthly foreign currency remeasurement gains or losses on non-functional currency monetary balances. The foreign exchange forward notional value may be adjusted each month as the exposure balance changes. The Company did not designate the derivative as a hedge. All changes in the fair value of the foreign exchange forward are recorded in earnings every month to other (income) expense, net in the accompanying consolidated statements of income. The Company recognized $
122
Fair Values
The fair values of the Company’s derivative financial instruments as of December 31 and the line items on the accompanying consolidated balance sheets to which they were recorded were as follows (in thousands):
|
|
|
Balance Sheet Classification |
|
2021 |
|
|
2020 |
|
||
|
Interest rate swaps - non-current |
|
Other long-term assets |
|
$ |
|
|
|
$ |
— |
|
|
Fair value of derivative assets |
|
|
|
$ |
|
|
|
$ |
— |
|
|
|
|
|
|
|
|
|
|
|
|
|
|
Interest rate swaps - current |
|
Accrued expenses |
|
$ |
|
|
|
$ |
|
|
|
Interest rate swaps - non-current |
|
Other long-term liabilities |
|
|
— |
|
|
|
|
|
|
Fair value of derivative liabilities |
|
|
|
$ |
|
|
|
$ |
|
|
7. Fair Value Measurements
Assets and Liabilities Carried at Fair Value
As of December 31, 2021 and 2020, the Company’s financial assets and liabilities carried at fair value included cash and cash equivalents, restricted cash, trading securities, accounts receivable, unbilled services (including contract assets), accounts payable, accrued expenses, deferred revenue, contingent obligations, liabilities under the accounts receivable financing agreement, and derivative instruments.
The fair values of cash and cash equivalents, restricted cash, accounts receivable, unbilled services (including contract assets), accounts payable, accrued expenses, deferred revenue, and the liabilities under the accounts receivable financing agreement approximate their respective carrying amounts because of the liquidity and short-term nature of these financial instruments.
Financial Instruments Subject to Recurring Fair Value Measurements
As of December 31, 2021, the fair values of the major classes of the Company’s assets and liabilities measured at fair value on a recurring basis were as follows (in thousands):
|
|
|
Level 1 |
|
|
Level 2 |
|
|
Level 3 |
|
|
Investments Measured at Net Asset Value |
|
|
Total |
|
|||||
|
Assets: |
|
|
|
|
|
|
|
|
|
|
|
|
|
|
|
|
|
|
|
|
|
Trading securities (a) |
|
$ |
|
|
|
$ |
— |
|
|
$ |
— |
|
|
$ |
— |
|
|
$ |
|
|
|
Partnership interest (b) |
|
|
— |
|
|
|
— |
|
|
|
— |
|
|
|
|
|
|
|
|
|
|
Derivative instruments (c) |
|
|
— |
|
|
|
|
|
|
|
— |
|
|
|
— |
|
|
|
|
|
|
Total assets |
|
$ |
|
|
|
$ |
|
|
|
$ |
— |
|
|
$ |
|
|
|
$ |
|
|
|
|
|
|
|
|
|
|
|
|
|
|
|
|
|
|
|
|
|
|
|
|
|
Liabilities: |
|
|
|
|
|
|
|
|
|
|
|
|
|
|
|
|
|
|
|
|
|
Derivative instruments (c) |
|
$ |
— |
|
|
$ |
|
|
|
$ |
— |
|
|
$ |
— |
|
|
$ |
|
|
|
Contingent obligations related to acquisitions (d) |
|
|
— |
|
|
|
— |
|
|
|
|
|
|
|
— |
|
|
|
|
|
|
Total liabilities |
|
$ |
— |
|
|
$ |
|
|
|
$ |
|
|
|
$ |
— |
|
|
$ |
|
|
123
As of December 31, 2020, the fair value of the major classes of the Company’s assets and liabilities measured at fair value on a recurring basis were as follows (in thousands):
|
|
|
Level 1 |
|
|
Level 2 |
|
|
Level 3 |
|
|
Investments Measured at Net Asset Value |
|
|
Total |
|
|||||
|
Assets: |
|
|
|
|
|
|
|
|
|
|
|
|
|
|
|
|
|
|
|
|
|
Trading securities (a) |
|
$ |
|
|
|
$ |
— |
|
|
$ |
— |
|
|
$ |
— |
|
|
$ |
|
|
|
Partnership interest (b) |
|
|
— |
|
|
|
— |
|
|
|
— |
|
|
|
|
|
|
|
|
|
|
Total assets |
|
$ |
|
|
|
$ |
— |
|
|
$ |
— |
|
|
$ |
|
|
|
$ |
|
|
|
|
|
|
|
|
|
|
|
|
|
|
|
|
|
|
|
|
|
|
|
|
|
Liabilities: |
|
|
|
|
|
|
|
|
|
|
|
|
|
|
|
|
|
|
|
|
|
Derivative instruments (c) |
|
$ |
— |
|
|
$ |
|
|
|
$ |
— |
|
|
$ |
— |
|
|
$ |
|
|
|
Contingent obligations related to acquisitions (d) |
|
|
— |
|
|
|
— |
|
|
|
|
|
|
|
— |
|
|
|
|
|
|
Total liabilities |
|
$ |
— |
|
|
$ |
|
|
|
$ |
|
|
|
$ |
— |
|
|
$ |
|
|
(a) Represents the fair value of investments in mutual funds based on quoted market prices that are used to fund the liability associated with the Company’s deferred compensation plan.
(b) The Company has committed to invest $
(c) Represents the fair value of interest rate swap arrangements (see “Note 6 – Derivatives” for further information).
(d) Represents the fair value of contingent consideration obligations related to acquisitions. The fair values of these liabilities are determined based on the Company’s best estimate of the probable timing and amount of settlement.
The following table presents a reconciliation of changes in the carrying amount of contingent obligations classified as Level 3 for the years ended December 31, 2021 and 2020 (in thousands):
|
Balance as of December 31, 2019 |
|
$ |
|
|
|
Additions |
|
|
— |
|
|
Changes in fair value recognized in earnings (a) |
|
|
( |
) |
|
Payments |
|
|
( |
) |
|
Balance as of December 31, 2020 |
|
|
|
|
|
Additions (b) |
|
|
|
|
|
Changes in fair value recognized in earnings |
|
|
( |
) |
|
Payments (c) |
|
|
( |
) |
|
Balance as of December 31, 2021 |
|
$ |
|
|
(a) The change in fair value recognized in earnings for the year ended December 31, 2020 is primarily due to a decrease in the estimate of the contingent consideration associated with the acquisition of Kinapse (see “Note 17 – Commitments and Contingencies” for further information).
(b) Represents obligations in connection with the acquisition of RxDataScience and insignificant acquisitions completed during 2021.
124
(c) The Company made payments to fully settle the contingent tax-sharing obligation arising from inVentiv Health, Inc.’s 2016 merger with Double Eagle Parent, Inc. (see “Note 17 – Commitments and Contingencies” for further information) during the first quarter of 2021 and obligations in connection with the insignificant acquisition completed during the second quarter of 2021.
During the years ended December 31, 2021 and 2020, there were
Financial Instruments Subject to Non-Recurring Fair Value Measurements
Certain assets, including goodwill and identifiable intangible assets, are carried on the accompanying consolidated balance sheets at cost and, subsequent to initial recognition, are measured at fair value on a non-recurring basis when certain identified events or changes in circumstances that may have a significant adverse effect on the carrying values of these assets occur. These assets are classified as Level 3 fair value measurements within the fair value hierarchy. Goodwill is tested for impairment annually or more frequently if events or changes in circumstances indicate a triggering event has occurred. Intangible assets are tested for impairment upon the occurrence of certain triggering events. As of December 31, 2021 and 2020, assets carried on the consolidated balance sheets and not remeasured to fair value on a recurring basis totaled $
Fair Value Disclosures for Financial Instruments Not Carried at Fair Value
The estimated fair values of the term loans and the Notes are determined based on the price that the Company would have had to pay to settle the liabilities. As these liabilities are not actively traded, they are classified as Level 2 fair value measurements.
|
|
|
December 31, 2021 |
|
|
December 31, 2020 |
|
||||||||||
|
|
|
Carrying Value (a) |
|
|
Estimated Fair Value |
|
|
Carrying Value (a) |
|
|
Estimated Fair Value |
|
||||
|
Term Loan A - tranche one due March 2024 |
|
$ |
|
|
|
$ |
|
|
|
$ |
|
|
|
$ |
|
|
|
Term Loan A - tranche two due August 2024 |
|
|
|
|
|
|
|
|
|
|
|
|
|
|
|
|
|
Term Loan B due August 2024 |
|
|
— |
|
|
|
— |
|
|
|
|
|
|
|
|
|
|
Senior notes due January 2029 |
|
|
|
|
|
|
|
|
|
|
|
|
|
|
|
|
8. Restructuring and Other Costs
During the year ended December 31, 2021, the Company incurred employee severance and benefit costs, facility and lease termination costs, and other costs related to its restructuring activities. These costs were primarily related to the Company’s ForwardBound margin enhancement initiative. The costs incurred during the year ended December 31, 2020 were primarily related to the Company’s cost management strategies in response to the COVID-19 pandemic as well as the Company’s ForwardBound initiative.
Restructuring and other costs consisted of the following (in thousands):
|
|
|
Year Ended December 31, |
|
|||||||||
|
|
|
2021 |
|
|
2020 |
|
|
2019 |
|
|||
|
Employee severance and benefit costs |
|
$ |
|
|
|
$ |
|
|
|
$ |
|
|
|
Facility and lease termination costs |
|
|
|
|
|
|
|
|
|
|
|
|
|
Other costs |
|
|
|
|
|
|
|
|
|
|
|
|
|
Total restructuring and other costs |
|
$ |
|
|
|
$ |
|
|
|
$ |
|
|
125
The Company expects to continue to incur costs related to restructuring of its operations in order to achieve cost savings and the targeted synergies related to its acquisitions. However, the timing and the amount of these costs depends on various factors, including, but not limited to, identifying and realizing synergy opportunities and executing the integration of its combined operations. The Company may also continue to incur additional restructuring and other costs during and beyond 2022 related to its ForwardBound margin enhancement initiative.
Accrued Restructuring Liabilities
The following table summarizes activity related to the liabilities associated with restructuring and other costs (in thousands):
|
|
|
Employee Severance Costs |
|
|
Other Costs |
|
|
Total |
|
|||
|
Balance as of December 31, 2019 |
|
$ |
|
|
|
$ |
|
|
|
$ |
|
|
|
Expenses incurred (a) |
|
|
|
|
|
|
|
|
|
|
|
|
|
Payments |
|
|
( |
) |
|
|
( |
) |
|
|
( |
) |
|
Balance as of December 31, 2020 |
|
|
|
|
|
|
— |
|
|
|
|
|
|
Expenses incurred (a) |
|
|
|
|
|
|
|
|
|
|
|
|
|
Payments |
|
|
( |
) |
|
|
( |
) |
|
|
( |
) |
|
Balance as of December 31, 2021 |
|
$ |
|
|
|
$ |
— |
|
|
$ |
|
|
(a)
The Company expects the employee severance costs accrued as of December 31, 2021 will be paid within the next twelve months. Liabilities associated with restructuring and other costs are included in accrued expenses and other long-term liabilities on the accompanying consolidated balance sheets.
9. Shareholders’ Equity
Shares Outstanding
Shares of common stock outstanding were as follows (in thousands):
|
|
|
Year Ended December 31, |
|
|||||||||
|
|
|
2021 |
|
|
2020 |
|
|
2019 |
|
|||
|
Common stock shares, beginning balance |
|
|
|
|
|
|
|
|
|
|
|
|
|
Repurchases of common stock |
|
|
( |
) |
|
|
( |
) |
|
|
( |
) |
|
Issuances of common stock |
|
|
|
|
|
|
|
|
|
|
|
|
|
Common stock shares, ending balance |
|
|
|
|
|
|
|
|
|
|
|
|
Stock Repurchase Programs
On February 26, 2018, the Company’s Board of Directors (the “Board”) authorized the repurchase of up to an aggregate of $
126
On November 17, 2020, the Company’s Board authorized the repurchase of up to an aggregate of $
The 2021 Stock Repurchase Program does not obligate the Company to repurchase any particular amount of the Company’s common stock, and may be modified, extended, suspended, or discontinued at any time. The timing and amount of repurchases are determined by the Company’s management based on a variety of factors such as the market price of the Company’s common stock, the Company’s corporate cash requirements, and overall market conditions. The 2021 Stock Repurchase Program is subject to applicable legal requirements, including federal and state securities laws and applicable Nasdaq rules. The Company may also repurchase shares of its common stock pursuant to a trading plan meeting the requirements of Rule 10b5-1 under the Securities Exchange Act of 1934, as amended, which would permit shares of the Company’s common stock to be repurchased when the Company might otherwise be precluded from doing so by law.
During the year ended December 31, 2021, the Company repurchased
The following table sets forth repurchase activity under the Company’s stock repurchase programs from inception through December 31, 2021:
|
|
|
Total number of shares purchased |
|
|
Average price paid per share |
|
|
Approximate dollar value of shares purchased (in thousands) |
|
|||
|
March 2018 |
|
|
|
|
|
$ |
|
|
|
$ |
|
|
|
April 2018 |
|
|
|
|
|
|
|
|
|
|
|
|
|
January 2019 |
|
|
|
|
|
|
|
|
|
|
|
|
|
February 2019 |
|
|
|
|
|
|
|
|
|
|
|
|
|
June 2019 |
|
|
|
|
|
|
|
|
|
|
|
|
|
August 2019 |
|
|
|
|
|
|
|
|
|
|
|
|
|
March 2020 |
|
|
|
|
|
|
|
|
|
|
|
|
|
September 2020 |
|
|
|
|
|
|
|
|
|
|
|
|
|
October 2020 |
|
|
|
|
|
|
|
|
|
|
|
|
|
March 2021 |
|
|
|
|
|
|
|
|
|
|
|
|
|
May 2021 |
|
|
|
|
|
|
|
|
|
|
|
|
|
June 2021 |
|
|
|
|
|
|
|
|
|
|
|
|
|
Total |
|
|
|
|
|
|
|
|
|
$ |
|
|
The Company immediately retired all of the repurchased common stock and charged the par value of the shares to common stock. The excess of the repurchase price over the par value was applied on a pro rata basis against additional paid-in capital, with the remainder applied to accumulated deficit.
As of December 31, 2021, the Company had remaining authorization to repurchase up to approximately $
127
The following is a summary of the Company’s authorized, issued, and outstanding shares as of December 31:
|
|
|
2021 |
|
|
2020 |
|
||
|
Shares Authorized: |
|
|
|
|
|
|
|
|
|
Class A common stock |
|
|
|
|
|
|
|
|
|
Class B common stock |
|
|
|
|
|
|
|
|
|
Preferred stock |
|
|
|
|
|
|
|
|
|
Total shares authorized |
|
|
|
|
|
|
|
|
|
Shares Issued and Outstanding: |
|
|
|
|
|
|
|
|
|
Class A common stock |
|
|
|
|
|
|
|
|
|
Class B common stock |
|
|
— |
|
|
|
— |
|
|
Preferred stock |
|
|
— |
|
|
|
— |
|
|
Total shares issued and outstanding |
|
|
|
|
|
|
|
|
Voting Rights and Conversion Rights of Common Stock
Each share of Class A common stock is entitled to
Dividend Rights and Preferences of Common Stock
The holders of Class A and Class B common stock are entitled to dividends on a pro rata basis at such time and in such amounts as declared by the Board. There were
Liquidation Rights and Preferences of Common Stock
The holders of Class A and Class B common stock are entitled to participate on a pro rata basis in all distributions made in connection with a voluntary or involuntary liquidation, dissolution, or winding up of the affairs of the Company.
10. Earnings Per Share
The following table provides a reconciliation of the numerators and denominators of the basic and diluted earnings per share computations (in thousands, except per share data):
|
|
|
Year Ended December 31, |
|
|||||||||
|
|
|
2021 |
|
|
2020 |
|
|
2019 |
|
|||
|
Numerator: |
|
|
|
|
|
|
|
|
|
|
|
|
|
Net income |
|
$ |
|
|
|
$ |
|
|
|
$ |
|
|
|
Denominator: |
|
|
|
|
|
|
|
|
|
|
|
|
|
Basic weighted average common shares outstanding |
|
|
|
|
|
|
|
|
|
|
|
|
|
Effect of dilutive securities: |
|
|
|
|
|
|
|
|
|
|
|
|
|
Stock options and other awards under deferred share-based compensation programs |
|
|
|
|
|
|
|
|
|
|
|
|
|
Diluted weighted average common shares outstanding |
|
|
|
|
|
|
|
|
|
|
|
|
|
Earnings per share: |
|
|
|
|
|
|
|
|
|
|
|
|
|
Basic |
|
$ |
|
|
|
$ |
|
|
|
$ |
|
|
|
Diluted |
|
$ |
|
|
|
$ |
|
|
|
$ |
|
|
128
Potential common shares outstanding that are considered anti-dilutive are excluded from the computation of diluted earnings per share. Potential common shares related to stock options and other awards under share-based compensation programs may be determined to be anti-dilutive based on the application of the treasury stock method. Potential common shares are also anti-dilutive in periods when the Company incurs a net loss.
The number of potential shares outstanding that were anti-dilutive and therefore excluded from the computation of diluted earnings per share, weighted for the portion of the period they were outstanding, were
11. Income Taxes
The components of income before provision for income taxes were as follows (in thousands):
|
|
|
Year Ended December 31, |
|
|||||||||
|
|
|
2021 |
|
|
2020 |
|
|
2019 |
|
|||
|
Domestic |
|
$ |
|
|
|
$ |
|
|
|
$ |
( |
) |
|
Foreign |
|
|
|
|
|
|
|
|
|
|
|
|
|
Income before provision for income taxes |
|
$ |
|
|
|
$ |
|
|
|
$ |
|
|
The components of income tax expense (benefit) were as follows (in thousands):
|
|
|
Year Ended December 31, |
|
|||||||||
|
|
|
2021 |
|
|
2020 |
|
|
2019 |
|
|||
|
Federal income taxes: |
|
|
|
|
|
|
|
|
|
|
|
|
|
Current |
|
$ |
|
|
|
$ |
( |
) |
|
$ |
( |
) |
|
Deferred |
|
|
|
|
|
|
|
|
|
|
( |
) |
|
Foreign income taxes: |
|
|
|
|
|
|
|
|
|
|
|
|
|
Current |
|
|
|
|
|
|
|
|
|
|
|
|
|
Deferred |
|
|
( |
) |
|
|
( |
) |
|
|
( |
) |
|
State income taxes: |
|
|
|
|
|
|
|
|
|
|
|
|
|
Current |
|
|
|
|
|
|
|
|
|
|
|
|
|
Deferred |
|
|
|
|
|
|
( |
) |
|
|
( |
) |
|
Income tax expense (benefit) |
|
$ |
|
|
|
$ |
|
|
|
$ |
( |
) |
Foreign Earnings
The Company has approximately $
BEAT
The Company’s base eroding payments do not exceed the three percent threshold of its deductible payments in 2021; therefore, the Company has not recorded any base erosion and anti-abuse minimum tax (“BEAT”) liability for the years ended December 31, 2021 and December 31, 2020.
129
Actual income tax expense differed from the amount computed by applying the U.S. federal tax rate of
|
|
|
Year Ended December 31, |
|
|||||||||
|
|
|
2021 |
|
|
2020 |
|
|
2019 |
|
|||
|
Expected income tax expense at statutory rate |
|
$ |
|
|
|
$ |
|
|
|
$ |
|
|
|
Change in income tax expense resulting from: |
|
|
|
|
|
|
|
|
|
|
|
|
|
Foreign income inclusion |
|
|
|
|
|
|
|
|
|
|
|
|
|
Foreign earnings not indefinitely reinvested |
|
|
|
|
|
|
|
|
|
|
— |
|
|
Foreign tax credits |
|
|
( |
) |
|
|
— |
|
|
|
— |
|
|
Changes in income tax valuation allowance (all jurisdictions) |
|
|
( |
) |
|
|
|
|
|
|
( |
) |
|
Change in fair value of contingent obligations |
|
|
( |
) |
|
|
( |
) |
|
|
|
|
|
Share-based compensation |
|
|
( |
) |
|
|
( |
) |
|
|
|
|
|
Research and general business tax credits (a) |
|
|
( |
) |
|
|
( |
) |
|
|
( |
) |
|
State and local taxes, net of federal benefit |
|
|
|
|
|
|
|
|
|
|
( |
) |
|
Capital loss carryforward (b) |
|
|
( |
) |
|
|
( |
) |
|
|
— |
|
|
Foreign rate differential |
|
|
|
|
|
|
( |
) |
|
|
( |
) |
|
Changes in reserve for uncertain tax positions including interest |
|
|
|
|
|
|
( |
) |
|
|
|
|
|
Provision to tax return and other deferred tax adjustments |
|
|
( |
) |
|
|
( |
) |
|
|
( |
) |
|
Gain on sale of business |
|
|
— |
|
|
|
( |
) |
|
|
— |
|
|
Base erosion and anti-abuse tax |
|
|
— |
|
|
|
— |
|
|
|
( |
) |
|
Nondeductible executive compensation |
|
|
|
|
|
|
|
|
|
|
|
|
|
Other, net |
|
|
|
|
|
|
|
|
|
|
|
|
|
Income tax expense (benefit) |
|
$ |
|
|
|
$ |
|
|
|
$ |
( |
) |
(a) Year ended December 31, 2021 included a $
The changes in the valuation allowance for deferred tax assets were as follows (in thousands):
|
|
|
Year Ended December 31, |
|
|||||||||
|
|
|
2021 |
|
|
2020 |
|
|
2019 |
|
|||
|
Balance at the beginning of the period |
|
$ |
|
|
|
$ |
|
|
|
$ |
|
|
|
Deferred tax assets assumed through acquisitions |
|
|
— |
|
|
|
|
|
|
|
— |
|
|
Deferred tax assets released through divestitures |
|
|
— |
|
|
|
( |
) |
|
|
— |
|
|
(Credited) charged to income tax expense |
|
|
( |
) |
|
|
|
|
|
|
( |
) |
|
Charged to equity |
|
|
— |
|
|
|
— |
|
|
|
|
|
|
Foreign currency exchange |
|
|
( |
) |
|
|
|
|
|
|
|
|
|
Other adjustments |
|
|
( |
) |
|
|
— |
|
|
|
— |
|
|
Balance at the end of the period |
|
$ |
|
|
|
$ |
|
|
|
$ |
|
|
As of December 31, 2021, the valuation allowance decreased by $
As of December 31, 2020, the valuation allowance increased by $
130
The income tax effects of temporary differences that give rise to significant portions of the deferred tax assets and liabilities are as follows as of December 31 (in thousands):
|
|
|
2021 |
|
|
2020 |
|
||
|
Deferred tax assets: |
|
|
|
|
|
|
|
|
|
Net operating losses |
|
$ |
|
|
|
$ |
|
|
|
Tax credits |
|
|
|
|
|
|
|
|
|
Deferred revenue |
|
|
— |
|
|
|
|
|
|
Employee compensation and other benefits |
|
|
|
|
|
|
|
|
|
Allowance for doubtful accounts |
|
|
|
|
|
|
|
|
|
Lease obligations |
|
|
|
|
|
|
|
|
|
Accrued expenses |
|
|
|
|
|
|
|
|
|
Prepaid royalty |
|
|
— |
|
|
|
|
|
|
Capital loss carryforward |
|
|
|
|
|
|
|
|
|
Interest limitation carryforwards |
|
|
|
|
|
|
|
|
|
Other |
|
|
|
|
|
|
|
|
|
Total deferred tax assets |
|
|
|
|
|
|
|
|
|
Less: valuation allowance |
|
|
( |
) |
|
|
( |
) |
|
Net deferred tax assets |
|
|
|
|
|
|
|
|
|
Deferred tax liabilities: |
|
|
|
|
|
|
|
|
|
Undistributed foreign earnings |
|
|
( |
) |
|
|
( |
) |
|
Right of use asset |
|
|
( |
) |
|
|
( |
) |
|
Depreciation and amortization |
|
|
( |
) |
|
|
( |
) |
|
Deferred revenue |
|
|
( |
) |
|
|
— |
|
|
Other |
|
|
( |
) |
|
|
( |
) |
|
Total deferred tax liabilities |
|
|
( |
) |
|
|
( |
) |
|
Net deferred tax assets |
|
$ |
( |
) |
|
$ |
|
|
As of December 31, 2021 and 2020, the Company had U.S. federal net operating loss (“NOL”) carryforwards of approximately $
As of December 31, 2021 and 2020, the Company had state NOL carryforwards of approximately $
As of December 31, 2021 and 2020, the Company had Canadian research and development credit carryforwards of $
The Company’s gross unrecognized tax benefits, exclusive of associated interest and penalties, were $
131
The Company believes it is reasonably possible that its unrecognized tax benefits may decrease by approximately $
|
Unrecognized tax benefits balance as of December 31, 2018 |
|
$ |
|
|
|
Increases for tax positions in the current year |
|
|
|
|
|
Increases for tax positions of prior years |
|
|
|
|
|
Decreases for tax positions in prior year |
|
|
( |
) |
|
Impact of foreign currency translation |
|
|
( |
) |
|
Unrecognized tax benefits balance as of December 31, 2019 |
|
|
|
|
|
Increases for tax positions in the current year |
|
|
|
|
|
Increases for tax positions of prior years |
|
|
|
|
|
Decreases for tax positions in prior year |
|
|
( |
) |
|
Impact of foreign currency translation |
|
|
|
|
|
Lapse of statute limitations |
|
|
( |
) |
|
Unrecognized tax benefits balance as of December 31, 2020 |
|
|
|
|
|
Increases for tax positions in the current year |
|
|
|
|
|
Increases for tax positions of prior years |
|
|
|
|
|
Settlements with tax authorities |
|
|
( |
) |
|
Impact of foreign currency translation |
|
|
( |
) |
|
Lapse of statute limitations |
|
|
( |
) |
|
Unrecognized tax benefits balance as of December 31, 2021 |
|
$ |
|
|
Due to the geographic breadth of the Company’s operations, numerous tax audits may be ongoing throughout the world at any point in time. Income tax liabilities are recorded based on estimates of additional income taxes which will be due upon the conclusion of these audits. Estimates of these income tax liabilities are made based upon prior experience and are updated in light of changes in facts and circumstances. However, due to the uncertain and complex application of tax regulations, it is possible that the ultimate resolution of audits may result in liabilities which could be materially different from these estimates. In such an event, the Company will record additional income tax expense or benefit in the period in which such resolution occurs.
The Company is not currently under any U.S. federal income tax audits, however, income tax returns are under examination by tax authorities in several state and foreign jurisdictions. The Company’s federal and state tax filings are open to investigations in numerous years due to NOL carryforwards. Additionally, the Company currently has an ongoing examination for tax years 2017 to 2019 in the United Kingdom. The United Kingdom is the jurisdiction with the Company’s largest foreign operations. The Company believes that its reserve for uncertain tax positions is adequate to cover existing risks or exposures related to all open tax years and jurisdictions.
12. Revenue from Contracts with Customers
Unsatisfied Performance Obligations
As of December 31, 2021, the total aggregate transaction price allocated to the unsatisfied performance obligations under contracts with contract terms greater than one year and that are not accounted for as a series pursuant to ASC 606 was $
132
Timing of Billing and Performance
During the year ended December 31, 2021, the Company recognized approximately $
13. Segment Information
The Company is managed through
The Company’s Chief Operating Decision Maker (the “CODM”) reviews segment performance and allocates resources based upon segment revenue and income from operations. Inter-segment revenue is eliminated from the segment reporting provided to the CODM and is not included in the segment revenue presented in the table below. Certain costs are not allocated to the Company’s reportable segments and are reported as general corporate expenses. These costs primarily consist of share-based compensation, general operating expenses associated with the Board and the Company’s senior leadership, finance, investor relations, and internal audit functions, and transaction and integration-related expenses. The Company does not allocate depreciation, amortization, asset impairment charges, or restructuring and other costs to its segments. Prior period segment results have been recast to reflect the transfer of the Kinapse Regulatory and Operations Consulting service lines from Commercial Solutions to Clinical Solutions to align with management reporting in 2021. Additionally, the CODM reviews the Company’s assets on a consolidated basis and does not allocate assets to its reportable segments for purposes of assessing segment performance or allocating resources.
133
Information about reportable segment operating results was as follows (in thousands):
|
|
|
Year Ended December 31, |
|
|||||||||
|
|
|
2021 |
|
|
2020 |
|
|
2019 |
|
|||
|
Revenue: |
|
|
|
|
|
|
|
|
|
|
|
|
|
Clinical Solutions |
|
$ |
|
|
|
$ |
|
|
|
$ |
|
|
|
Commercial Solutions |
|
|
|
|
|
|
|
|
|
|
|
|
|
Total revenue |
|
|
|
|
|
|
|
|
|
|
|
|
|
Segment direct costs: |
|
|
|
|
|
|
|
|
|
|
|
|
|
Clinical Solutions |
|
|
|
|
|
|
|
|
|
|
|
|
|
Commercial Solutions |
|
|
|
|
|
|
|
|
|
|
|
|
|
Total segment direct costs |
|
|
|
|
|
|
|
|
|
|
|
|
|
Segment selling, general, and administrative expenses: |
|
|
|
|
|
|
|
|
|
|
|
|
|
Clinical Solutions |
|
|
|
|
|
|
|
|
|
|
|
|
|
Commercial Solutions |
|
|
|
|
|
|
|
|
|
|
|
|
|
Total segment selling, general, and administrative expenses |
|
|
|
|
|
|
|
|
|
|
|
|
|
Segment operating income: |
|
|
|
|
|
|
|
|
|
|
|
|
|
Clinical Solutions |
|
|
|
|
|
|
|
|
|
|
|
|
|
Commercial Solutions |
|
|
|
|
|
|
|
|
|
|
|
|
|
Total segment operating income |
|
|
|
|
|
|
|
|
|
|
|
|
|
Direct costs and operating expenses not allocated to segments: |
|
|
|
|
|
|
|
|
|
|
|
|
|
Share-based compensation included in direct costs |
|
|
|
|
|
|
|
|
|
|
|
|
|
Share-based compensation included in selling, general, and administrative expenses |
|
|
|
|
|
|
|
|
|
|
|
|
|
Corporate selling, general, and administrative expenses |
|
|
|
|
|
|
|
|
|
|
|
|
|
Restructuring and other costs |
|
|
|
|
|
|
|
|
|
|
|
|
|
Depreciation and amortization |
|
|
|
|
|
|
|
|
|
|
|
|
|
Total income from operations |
|
$ |
|
|
|
$ |
|
|
|
$ |
|
|
14. Operations by Geographic Location
The following table summarizes total revenue by geographic area (in thousands, all intercompany transactions have been eliminated):
|
|
|
Year Ended December 31, |
|
|||||||||
|
|
|
2021 |
|
|
2020 |
|
|
2019 |
|
|||
|
Revenue: |
|
|
|
|
|
|
|
|
|
|
|
|
|
North America (a) |
|
$ |
|
|
|
$ |
|
|
|
$ |
|
|
|
Europe, Middle East and Africa |
|
|
|
|
|
|
|
|
|
|
|
|
|
Asia-Pacific |
|
|
|
|
|
|
|
|
|
|
|
|
|
Latin America |
|
|
|
|
|
|
|
|
|
|
|
|
|
Total revenue |
|
$ |
|
|
|
$ |
|
|
|
$ |
|
|
(a) Revenue for the North America region includes revenue attributable to the U.S. of $
134
The following table summarizes long-lived assets by geographic area as of December 31 (in thousands, all intercompany transactions have been eliminated):
|
|
|
2021 |
|
|
2020 |
|
||
|
Property and equipment, net: |
|
|
|
|
|
|
|
|
|
North America (a) |
|
$ |
|
|
|
$ |
|
|
|
Europe, Middle East and Africa |
|
|
|
|
|
|
|
|
|
Asia-Pacific |
|
|
|
|
|
|
|
|
|
Latin America |
|
|
|
|
|
|
|
|
|
Total property and equipment, net |
|
$ |
|
|
|
$ |
|
|
(
15. Concentration of Credit Risk
Financial assets that subject the Company to credit risk primarily consist of cash and cash equivalents, accounts receivable and unbilled services (including contract assets). The Company’s cash and cash equivalents consist principally of cash and are maintained at several financial institutions with reputable credit ratings. The Company maintains cash depository accounts with several financial institutions worldwide and is exposed to credit risk related to the potential inability to access liquidity in financial institutions where its cash and cash equivalents are concentrated. The Company has not historically incurred any losses with respect to these balances and believes that they bear minimal credit risk.
As of December 31, 2021 and 2020, substantially all of the Company’s cash and cash equivalents were held within the U.S.
Substantially all of the Company’s revenue is earned by performing services under contracts with pharmaceutical and biotechnology companies. The concentration of credit risk is equal to the outstanding accounts receivable and unbilled services (including contract assets) balances less deferred revenue.
No single customer accounted for greater than
No single customer accounted for greater than
16. Related-Party Transactions
For the year ended December 31, 2021, the Company had combined revenue of $
On
135
For the year ended December 31, 2020, the Company had revenue of $
For the year ended December 31, 2019, the Company had revenue of $
For the year ended December 31, 2019, the Company incurred reimbursable out-of-pocket expenses of $
17. Commitments and Contingencies
Legal Contingencies
The Company is involved in various claims and legal actions arising in the ordinary course of business. The Company accrues a liability when a loss is considered probable and the amount can be reasonably estimated. When a material loss contingency is reasonably possible but not probable, the Company does not record a liability, but instead discloses the nature and the amount of the claim, and an estimate of the loss or range of loss, if such an estimate can be made. Legal fees are expensed as incurred. In the opinion of management, the outcome of any existing claims and legal or regulatory proceedings, other than the specific matters described below, if decided adversely, is not expected to have a material adverse effect on the Company's business, financial condition, results of operations, or cash flows.
On December 1, 2017, the first of
136
action and (ii) awarding compensatory damages in an amount to be proven at trial, including interest thereon, and reasonable costs and expenses incurred in this action, including attorneys’ fees and expert fees, to Lead Plaintiffs and other class members. On September 20, 2018, Defendants moved to dismiss the action. On August 30, 2021, the District Court entered an order granting the motion to dismiss in its entirety, and on October 21, 2021, the Court entered judgment for Defendants. On November 19, 2021, Lead Plaintiffs appealed from this judgment to the U.S. Court of Appeals for the Fourth Circuit, which appeal remains pending.
The Company is presently unable to predict the duration, scope, or result of the foregoing putative class actions, or any other related lawsuit. As such, the Company is presently unable to develop a reasonable estimate of a possible loss or range of losses, if any, related to these matters. While the Company intends to defend any further proceedings in the putative class action litigation vigorously, the outcome of such litigation or any other litigation is necessarily uncertain. The Company could be forced to expend significant resources in the defense of these lawsuits or future ones, and it may not prevail. As such, these matters could have a material adverse effect on the Company's business, annual, or interim results of operations, cash flows, or its financial condition.
Assumed Contingent Tax-Sharing Obligation
As a result of the Merger, the Company assumed contingent tax-sharing obligations arising from inVentiv Health, Inc.’s 2016 merger with Double Eagle Parent, Inc. During the first quarter of 2021, the Company made payments of $
Contingent Earn-out Liabilities
In connection with the RxDataScience acquisition, the Company recorded a contingent earn-out liability to be paid based on achievement of revenue targets in 2022 and the renewal of a specific customer contract. The estimated fair value of the contingent earn-out liability as of December 31, 2021 was $
In connection with an insignificant acquisition in 2021, the Company recorded a contingent earn-out liability to be paid based on achievement of employee retention benchmarks. The estimated fair value of the contingent obligation was $
137
18. Share-Based Compensation
Overview of Employee Share-Based Compensation Plans
The Company has
As of December 31, 2021, the maximum number of shares reserved for issuance under the Company’s share-based compensation plans was
Employee Stock Purchase Plan
In March 2016, the Board approved the ESPP, which was also approved by the Company’s shareholders in May 2016. The ESPP was subsequently amended and restated and approved by the Board in March 2018, and also approved by the Company’s shareholders in May 2018. The ESPP allows eligible employees to authorize payroll deductions of up to
The fair values of ESPP offerings were determined using the Black-Scholes valuation model and the following assumptions:
|
|
|
Year Ended December 31, |
|
|||||||||
|
|
|
2021 |
|
|
2020 |
|
|
2019 |
|
|||
|
Expected volatility |
|
|
|
|
|
|
|
|
|
|||
|
Risk-free interest rate |
|
|
|
|
|
|
|
|
|
|||
|
Expected term (in years) |
|
|
|
|
|
|
|
|
|
|
|
|
138
Stock Option Awards
The following table sets forth the summary of stock option activity for the year ended December 31, 2021:
|
|
|
Number of Options |
|
|
Weighted Average Exercise Price |
|
|
Weighted Average Remaining Contractual Life (in years) |
|
|
Aggregate Intrinsic Value (in thousands)(a) |
|
||||
|
Outstanding as of December 31, 2020 |
|
|
|
|
|
$ |
|
|
|
|
|
|
|
|
|
|
|
Exercised |
|
|
( |
) |
|
|
|
|
|
|
|
|
|
|
|
|
|
Forfeited |
|
|
— |
|
|
|
— |
|
|
|
|
|
|
|
|
|
|
Outstanding as of December 31, 2021 |
|
|
|
|
|
|
|
|
|
|
|
|
|
$ |
|
|
|
Vested and expected to vest as of December 31, 2021 |
|
|
|
|
|
|
|
|
|
|
|
|
|
$ |
|
|
|
Exercisable as of December 31, 2021 |
|
|
|
|
|
|
|
|
|
|
|
|
|
$ |
|
|
(a) Represents the total pre-tax intrinsic value (i.e., the aggregate difference between the closing price of the Company’s common stock on December 31, 2021 of $
As of December 31, 2021, there was
There have been
Restricted Stock Units Awards
The following table sets forth a summary of RSUs outstanding under the 2014 and 2018 Plans as of December 31, 2021 and changes during the year then ended:
|
|
|
Time-based |
|
|
Performance-based |
|
|
|
|
|
||||||||||
|
|
|
Number of Shares |
|
|
Weighted Average Grant Date Fair Value |
|
|
Number of Shares |
|
|
Weighted Average Grant Date Fair Value |
|
|
Total Number of Shares |
|
|||||
|
Non-vested as of December 31, 2020 |
|
|
|
|
|
$ |
|
|
|
|
|
|
|
$ |
|
|
|
|
|
|
|
Granted |
|
|
|
|
|
|
|
|
|
|
|
|
|
|
|
|
|
|
|
|
|
Vested |
|
|
( |
) |
|
|
|
|
|
|
( |
) |
|
|
|
|
|
|
( |
) |
|
Forfeited |
|
|
( |
) |
|
|
|
|
|
|
( |
) |
|
|
|
|
|
|
( |
) |
|
Non-vested as of December 31, 2021 |
|
|
|
|
|
$ |
|
|
|
|
|
|
|
$ |
|
|
|
|
|
|
|
|
|
|
|
|
|
|
|
|
|
|
|
|
|
|
|
|
|
|
|
|
|
Unrecognized compensation expense (in millions) |
|
$ |
|
|
|
|
|
|
|
$ |
|
|
|
|
|
|
|
|
|
|
|
Weighted average period unrecognized compensation is expected to be recognized |
|
|
|
|
|
|
|
|
|
|
|
|
|
|
|
|
|
|
||
139
Time-based Awards
The weighted-average grant-date fair value of the RSUs granted during the years ended December 31, 2020 and 2019 was $
Performance-Based Awards
During the years ended December 31, 2021, 2020, and 2019, the Board and Compensation and Management Development Committee granted certain executive officers performance-based RSUs (“PRSUs”). The PRSUs are subject to the Company’s achieving certain performance targets including revenue growth, adjusted diluted EPS growth, and return on invested capital. Compensation expense related to PRSUs is recorded based on the estimated quantity of awards that are expected to vest. At each reporting period, management re-assesses the probability that the performance conditions will be achieved and adjusts compensation expense to reflect any changes in the estimated probability of vesting until the actual level of achievement of the performance targets is known.
The weighted-average grant-date fair value of the PRSUs granted during the years ended December 31, 2020 and 2019 was $
Share-Based Compensation Expense
Total share-based compensation expense recognized was as follows (in thousands):
|
|
|
Year Ended December 31, |
|
|||||||||
|
|
|
2021 |
|
|
2020 |
|
|
2019 |
|
|||
|
Direct costs |
|
$ |
|
|
|
$ |
|
|
|
$ |
|
|
|
Selling, general, and administrative expenses |
|
|
|
|
|
|
|
|
|
|
|
|
|
Total share-based compensation expense |
|
$ |
|
|
|
$ |
|
|
|
$ |
|
|
The total income tax benefit recognized in the consolidated statements of income for share-based compensation arrangements was approximately $
19. Employee Benefit Plans
Defined Contribution Retirement Plans
In the U.S., the Company offers defined contribution retirement benefit plans that comply with Section 401(a) of the Internal Revenue Code under which it matches employee deferrals at varying percentages and at specified limits of the employee’s salary. In 2020, the Company implemented cost management strategies, including suspending the Company match on U.S. employee 401(k) contributions for six months. The match was resumed in the fourth quarter of 2020.
The Company’s contributions related to these defined contribution retirement plans were as follows (in thousands):
|
|
|
Year Ended December 31, |
|
|||||||||
|
|
|
2021 |
|
|
2020 |
|
|
2019 |
|
|||
|
Defined contribution retirement plan contributions |
|
$ |
|
|
|
$ |
|
|
|
$ |
|
|
140
The Company also has defined contribution retirement plans outside of the U.S. The Company’s contributions related to these plans were approximately $
Deferred Compensation Plan
The Company offers a Nonqualified Deferred Compensation Plan for certain employees pursuant to Section 409A of the Internal Revenue Code (“NQDC Plan”). Under this plan, participants can defer, on a pre-tax basis, from
As of December 31, 2021 and 2020, the NQDC Plan deferred compensation liabilities were $
Item 9. Changes in and Disagreements with Accountants on Accounting and Financial Disclosure.
None.
Item 9A. Controls and Procedures.
Evaluation of Disclosure Controls and Procedures
As required by Rule 13a-15(b) under the Exchange Act, our management, with the participation of our CEO and CFO, carried out an evaluation of the effectiveness of our disclosure controls and procedures (as defined in Rule 13a-15(e) under the Exchange Act). There are inherent limitations to the effectiveness of any system of disclosure controls and procedures, including the possibility of human error and the circumvention or overriding of the controls and procedures. Accordingly, even effective disclosure controls and procedures can only provide reasonable assurance of achieving their control objectives.
Based upon their evaluation, our CEO and CFO concluded that, as of December 31, 2021, our disclosure controls and procedures were effective at the reasonable assurance level.
Changes in Internal Control Over Financial Reporting
There have been no changes in our internal control over financial reporting (as defined in Rules 13a-15(f) and 15d-15(f) under the Exchange Act) during the quarter ended December 31, 2021 that have materially affected, or are reasonably likely to materially affect, our internal control over financial reporting.
141
Management’s Annual Report on Internal Control Over Financial Reporting
The management of Syneos Health, Inc. (the “Company”) is responsible for establishing and maintaining adequate internal control over financial reporting. Internal control over financial reporting is a process designed to provide reasonable assurance regarding the reliability of financial reporting and the preparation of financial statements for external purposes in accordance with generally accepted accounting principles. A company’s internal control over financial reporting includes those policies and procedures that pertain to the maintenance of records that, in reasonable detail, accurately and fairly reflect the transactions and dispositions of the assets of the company; provide reasonable assurance that transactions are recorded as necessary to permit preparation of financial statements in accordance with generally accepted accounting principles in the United States of America, and that receipts and expenditures of the company are being made only in accordance with authorizations of management and directors of the company; and provide reasonable assurance regarding prevention or timely detection of unauthorized acquisition, use, or disposition of the company’s assets that could have a material effect on the financial statements.
Because of its inherent limitations, internal control over financial reporting might not prevent or detect misstatements. Also, projections of any evaluation of effectiveness to future periods are subject to the risk that controls may become inadequate because of changes in conditions, or that the degree of compliance with the policies or procedures may deteriorate.
Management assessed the effectiveness of the Company’s internal control over financial reporting as of December 31, 2021. In making this assessment, management used the framework established in the Internal Control-Integrated Framework issued in 2013 by the Committee of Sponsoring Organizations of the Treadway Commission (“COSO”). As a result of this assessment and based on the criteria in the COSO framework, management has concluded that, as of December 31, 2021, the Company’s internal control over financial reporting was effective.
The effectiveness of the Company’s internal control over financial reporting as of December 31, 2021 has been audited by Deloitte & Touche LLP, an independent registered public accounting firm, as stated in their attestation report which appears herein.
Item 9B. Other Information.
None.
Item 9C. Disclosure Regarding Foreign Jurisdictions that Prevent Inspections.
Not applicable.
PART III
Item 10. Directors, Executive Officers and Corporate Governance.
Pursuant to General Instruction G(3) on Form 10-K, information required by this Item concerning our directors and corporate governance is incorporated by reference from the sections captioned “Election of Directors” and “Corporate Governance Matters” contained in our 2022 Proxy Statement related to our Annual Meeting of Stockholders, which we intend to file with the SEC within 120 days of the end of our fiscal year.
142
We have adopted a code of business conduct and ethics relating to the conduct of our business by all of our employees, officers, and directors, as well as a code of ethics specifically for our principal executive officer and senior financial officers. Each of these policies is posted on our website: www.syneoshealth.com. We intend to post on our website all disclosures that are required by law or Nasdaq Stock Market listing standards concerning any amendments to, or waivers from, any provision of our code of business conduct and ethics and our code of ethics.
The information required by this Item concerning our executive officers is set forth at the end of Part I, Item 1, “Business” in this Annual Report on Form 10-K under the section captioned “Information About Executive Officers.”
The information required by this Item concerning compliance with Section 16(a) of the Securities Exchange Act of 1934, as amended, if applicable, is incorporated by reference from the section of the 2022 Proxy Statement captioned “Delinquent Section 16(a) Reports,” if any.
Item 11. Executive Compensation.
The information required by this Item is incorporated by reference to the information under the sections captioned “Executive Compensation and Other Matters,” “Director Compensation for Fiscal Year 2021” and “Corporate Governance Matters” in the 2022 Proxy Statement.
Item 12. Security Ownership of Certain Beneficial Owners and Management and Related Stockholder Matters.
Securities Authorized for Issuance Under Equity Compensation Plans
The following table sets forth the indicated information as of December 31, 2021 with respect to our equity compensation plans approved by security holders:
|
Plan Description |
|
Number of securities to be issued upon exercise of outstanding options, warrants and rights |
|
|
Weighted-average exercise price of outstanding options, warrants and rights |
|
|
Number of securities remaining available for future issuance under equity compensation plans |
|
|||
|
2018 Equity Incentive Plan |
|
|
— |
|
|
$ |
— |
|
|
|
3,446,778 |
|
|
2016 Employee Stock Purchase Plan |
|
|
— |
|
|
$ |
— |
|
|
|
1,905,688 |
|
|
2014 Equity Incentive Plan |
|
|
121,579 |
|
|
$ |
43.07 |
|
|
|
— |
|
|
2010 Equity Incentive Plan |
|
|
152,753 |
|
|
$ |
13.07 |
|
|
|
— |
|
|
2016 Omnibus Equity Incentive Plan (a) |
|
|
110,155 |
|
|
$ |
31.41 |
|
|
|
— |
|
|
Total |
|
|
384,487 |
|
|
|
|
|
|
|
5,352,466 |
|
(a) On August 1, 2017, in connection with the Merger, the Company filed a Form S-8 Registration Statement for the Double Eagle Parent, Inc. 2016 Omnibus Equity Incentive Plan. The number of shares registered in that filing was 1,500,000. Under this plan, the Company issued replacement awards consisting of stock options and RSUs. No further awards can be issued under the Double Eagle Plan.
143
Our equity compensation plans consist of the 2018 Equity Incentive Plan, the 2016 Employee Stock Purchase Plan, the 2014 Equity Incentive Plan, the 2010 Equity Incentive Plan, and the 2016 Omnibus Equity Incentive Plan, which were approved by our shareholders. We do not have any equity compensation plans or arrangements that have not been approved by our shareholders.
The remaining information in response to this Item is incorporated by reference to the information under the section captioned “Security Ownership of Certain Beneficial Owners and Management” in the 2022 Proxy Statement.
Item 13. Certain Relationships and Related Transactions and Director Independence.
The information required by this Item is incorporated by reference to the information under the section captioned “Certain Relationships and Related Person Transactions” and “Corporate Governance Matters” in the 2022 Proxy Statement.
Item 14. Principal Accounting Fees and Services.
The information required by this Item is incorporated by reference to the information under the section captioned “Audit Committee Report” in the 2022 Proxy Statement.
PART IV
Item 15. Exhibits and Financial Statement Schedules.
(a) The following documents are filed as part of this report:
(1) Financial Statements
The financial statements and report of the independent registered public accounting firm are filed as part of this Annual Report (see “Index to Consolidated Financial Statements” at Item 8).
(2) Financial Statement Schedules
The financial statements schedules are omitted because they are not applicable or the required information is shown in the consolidated financial statements or notes thereto.
(b) Exhibits
|
|
|
|
Incorporated by Reference (Unless Otherwise Indicated) |
||||
|
Exhibit Number |
|
Exhibit Description |
Form |
File No. |
Exhibit |
Filing Date |
|
|
3.1 |
|
8-K |
001-36730 |
|
3.1 |
August 1, 2017 |
|
|
3.2 |
|
Certificate of Amendment of Certificate of Incorporation of Syneos Health, Inc. |
8-K |
001-36730 |
|
3.1 |
January 8, 2018 |
|
3.3 |
|
8-K |
001-36730 |
|
3.2 |
January 8, 2018 |
|
|
4.1 |
|
S-1/A |
333-199178 |
|
4.1 |
October 27, 2014 |
|
|
4.2 |
|
8-K |
001-36730 |
|
4.1 |
November 25, 2020 |
|
|
4.3 |
|
Form of 3.625% senior note due 2029 (included in Exhibit 4.2). |
8-K |
001-36730 |
|
4.2 |
November 25, 2020 |
|
4.4 |
|
8-K |
001-36730 |
|
4.3 |
November 25, 2020 |
|
144
|
4.5 |
|
10-Q |
001-36730 |
|
4.1 |
August 6, 2021 |
|
|
4.6 |
|
— |
— |
|
— |
Filed herewith |
|
|
4.7 |
|
10-K |
001-36730 |
|
4.4 |
February 20, 2020 |
|
|
10.1# |
|
10-K |
001-36730 |
|
10.3 |
February 20, 2020 |
|
|
10.2.1# |
|
8-K |
001-36730 |
|
10.2 |
July 28, 2016 |
|
|
10.2.2# |
|
8-K |
001-36730 |
|
10.4 |
July 28, 2016 |
|
|
10.2.3# |
|
8-K |
001-36730 |
|
10.1 |
April 6, 2017 |
|
|
10.2.4# |
|
10-K |
001-36730 |
|
10.4.4 |
February 20, 2020 |
|
|
10.2.5# |
|
Letter Agreement between Syneos Health UK Limited and Alistair Macdonald, dated May 3, 2019. |
10-Q |
001-36730 |
|
10.8 |
April 30, 2020 |
|
10.3.1# |
|
10-Q |
001-36730 |
|
10.3 |
May 9, 2018 |
|
|
10.3.2# |
|
Letter Agreement, dated March 20, 2018, by and among Syneos Health, Inc. and Jason Meggs. |
10-Q |
001-36730 |
|
10.4 |
May 9, 2018 |
|
10.3.3# |
|
Letter Agreement, effective May 6, 2018, by and among Syneos Health, Inc. and Jason Meggs. |
10-Q |
001-36730 |
|
10.5 |
May 9, 2018 |
|
10.4.1# |
|
Letter Agreement, dated November 13, 2018, by and among Syneos Health, Inc. and Jonathan Olefson. |
10-K |
001-36730 |
|
10.6 |
March 18, 2019 |
|
10.5.1# |
|
10-K |
001-36730 |
|
10.7 |
February 20, 2020 |
|
|
10.6.1# |
|
Letter Agreement, dated August 29, 2018, by and between Syneos Health, Inc. and Paul D. Colvin. |
10-K |
001-36730 |
|
10.8 |
February 20, 2020 |
|
10.7# |
|
Letter Agreement, dated September 21, 2020, by and between Syneos Health, Inc. and Michael Brooks. |
— |
— |
|
— |
Filed herewith |
|
10.8# |
|
10-Q |
001-36730 |
|
10.1 |
November 6, 2018 |
|
|
10.9# |
|
10-Q |
001-36730 |
|
10.1 |
August 6, 2020 |
145
|
10.10# |
|
Syneos Health, Inc. 2016 Employee Stock Purchase Plan (as Amended and Restated). |
8-K |
001-36730 |
|
10.2 |
May 25, 2018 |
|
10.11.1# |
|
8-K |
001-36730 |
|
10.1 |
May 25, 2018 |
|
|
10.11.2# |
|
10-K |
001-36730 |
|
10.17.2 |
March 18, 2019 |
|
|
10.11.3# |
|
10-K |
001-36730 |
|
10.17.3 |
March 18, 2019 |
|
|
10.11.4# |
|
8-K |
001-36730 |
|
10.1 |
January 21, 2021 |
|
|
10.11.5# |
|
8-K |
001-36730 |
|
10.2 |
January 21, 2021 |
|
|
10.11.6# |
|
10-Q |
001-36730 |
|
10.1 |
August 6, 2021 |
|
|
10.11.7# |
|
— |
— |
|
— |
Filed herewith |
|
|
10.11.8# |
|
— |
— |
|
— |
Filed herewith |
|
|
10.11.9# |
|
— |
— |
|
— |
Filed herewith |
|
|
10.11.10# |
|
— |
— |
|
— |
Filed herewith |
|
|
10.12.1 |
|
8-K |
001-36730 |
|
10.1 |
August 1, 2017 |
|
|
10.12.2 |
|
8-K |
001-36730 |
|
10.1 |
May 7, 2018 |
|
|
10.12.3 |
|
8-K |
001-36730 |
|
10.1 |
March 28, 2019 |
146
|
10.12.4 |
|
10-Q |
001-36730 |
|
10.2 |
April 30, 2020 |
|
|
10.12.5 |
|
8-K |
001-36730 |
|
4.4 |
November 25, 2020 |
|
|
10.12.6 |
|
8-K |
001-36730 |
|
10.1 |
July 1, 2021 |
|
|
10.12.7 |
|
— |
— |
|
— |
Filed herewith |
|
|
10.13.1 |
|
8-K |
001-36730 |
|
10.2 |
June 29, 2018 |
|
|
10.13.2† |
|
10-K |
001-36730 |
|
10.16.2 |
February 18, 2021 |
|
|
10.13.3 |
|
10-Q |
001-36730 |
|
10.3 |
October 29, 2020 |
|
|
10.13.4 |
|
10-Q |
001-36730 |
|
10.1 |
October 29, 2020 |
|
|
10.13.5† |
|
10-K |
001-36730 |
|
10.16.5 |
February 18, 2021 |
|
|
10.13.6 |
|
10-Q |
001-36730 |
|
10.2 |
November 3, 2021 |
147
|
10.14.1 |
|
8-K |
001-36730 |
|
10.1 |
June 29, 2018 |
|
|
10.14.2 |
|
10-Q |
001-36730 |
|
10.6 |
August 2, 2018 |
|
|
10.14.3 |
|
10-Q |
001-36730 |
|
10.2 |
November 6, 2018 |
|
|
10.14.4 |
|
10-Q |
001-36730 |
|
10.3 |
November 6, 2018 |
|
|
10.14.5 |
|
10-Q |
001-36730 |
|
10.1 |
August 6, 2019 |
|
|
10.14.6 |
|
10-Q |
001-36730 |
|
10.2 |
August 6, 2019 |
|
|
10.14.7 |
|
10-Q |
001-36730 |
|
10.1 |
October 31, 2019 |
148
|
10.14.8 |
|
10-K |
001-36730 |
|
10.19.8 |
February 20, 2020 |
|
|
10.14.9 |
|
10-Q |
001-36730 |
|
10.1 |
April 30, 2020 |
|
|
10.14.10 |
|
10-Q |
001-36730 |
|
10.2 |
October 29, 2020 |
|
|
10.14.11 |
|
10-K |
001-36730 |
|
10.17.11 |
February 18, 2021 |
|
|
10.14.12 |
|
10-Q |
001-36730 |
|
10.1 |
November 3, 2021 |
|
|
21.1 |
|
— |
— |
|
— |
Filed herewith |
|
|
23.1 |
|
— |
— |
|
— |
Filed herewith |
|
|
31.1 |
|
Certification of Chief Executive Officer pursuant to Section 302 of the Sarbanes-Oxley Act of 2002. |
— |
— |
|
— |
Filed herewith |
|
31.2 |
|
Certification of Chief Financial Officer pursuant to Section 302 of the Sarbanes-Oxley Act of 2002. |
— |
— |
|
— |
Filed herewith |
|
32.1 |
|
Certification of Chief Executive Officer pursuant to Section 906 of the Sarbanes-Oxley Act of 2002. |
— |
— |
|
— |
Furnished herewith |
|
32.2 |
|
Certification of Chief Financial Officer pursuant to Section 906 of the Sarbanes-Oxley Act of 2002. |
— |
— |
|
— |
Furnished herewith |
|
101.INS |
|
Inline XBRL Instance Document - the Instance Document does not appear in the interactive data file because its XBRL tags are embedded within the Inline XBRL document. |
— |
— |
|
— |
Filed herewith |
|
101.SCH |
|
Inline XBRL Taxonomy Extension Schema Document. |
— |
— |
|
— |
Filed herewith |
149
|
101.CAL |
|
Inline XBRL Taxonomy Extension Calculation Linkbase Document. |
— |
— |
|
— |
Filed herewith |
|
101.DEF |
|
Inline XBRL Taxonomy Extension Definition Linkbase Document. |
— |
— |
|
— |
Filed herewith |
|
101.LAB |
|
Inline XBRL Taxonomy Extension Label Linkbase Document. |
— |
— |
|
— |
Filed herewith |
|
101.PRE |
|
Inline Taxonomy Extension Presentation Linkbase Document. |
— |
— |
|
— |
Filed herewith |
|
104 |
|
Cover Page Interactive Data File (formatted as Inline XBRL and contained in Exhibit 101) |
— |
— |
|
— |
Filed herewith |
# Denotes management contract or compensatory plan.
† The annexes, schedules, and certain exhibits to this Exhibit have been omitted pursuant to Item 601(a)(5) of Regulation S-K. The Registrant hereby agrees to furnish supplementally a copy of any omitted annex, schedule or exhibit to the SEC upon request.
Item 16. Form 10-K Summary.
None.
150
SIGNATURES
Pursuant to the requirements of Section 13 or 15(d) of the Securities Exchange Act of 1934, the registrant has duly caused this report to be signed on its behalf by the undersigned, thereunto duly authorized.
|
|
Syneos Health, Inc. |
|||||
|
|
By: |
|
/s/ Alistair Macdonald |
|||
|
|
|
|
Name: |
|
Alistair Macdonald |
|
|
|
|
|
Title: |
|
Chief Executive Officer (Principal |
|
|
|
|
|
Date: |
|
February 16, 2022 |
|
Pursuant to the requirements of the Securities Exchange Act of 1934, this report has been signed below by the following persons on behalf of the registrant in the capacities and on the dates indicated.
|
Signature |
|
Title |
|
Date |
|
|
|
|
|
|
|
|
|
/s/ Alistair Macdonald |
|
Chief Executive Officer (Principal Executive Officer) and Director |
|
February 16, 2022 |
|
|
Alistair Macdonald |
|
|
|
|
|
|
|
|
|
|
|
|
|
/s/ Jason Meggs |
|
Chief Financial Officer (Principal Financial Officer) |
|
February 16, 2022 |
|
|
Jason Meggs |
|
|
|
|
|
|
|
|
|
|
|
|
|
/s/ Donna Kralowetz |
|
Senior Vice President, Chief Accounting Officer (Principal Accounting Officer) |
|
February 16, 2022 |
|
|
Donna Kralowetz |
|
|
|
|
|
|
|
|
|
|
|
|
|
/s/ John Dineen |
|
Chair of the Board and Director |
|
February 16, 2022 |
|
|
John Dineen |
|
|
|
|
|
|
|
|
|
|
|
|
|
/s/ Todd Abbrecht |
|
Director |
|
February 16, 2022 |
|
|
Todd Abbrecht |
|
|
|
|
|
|
|
|
|
|
|
|
|
/s/ Barbara Bodem |
|
Director |
|
February 16, 2022 |
|
|
Barbara Bodem |
|
|
|
|
|
|
|
|
|
|
|
|
|
/s/ Bernadette Connaughton |
|
Director |
|
February 16, 2022 |
|
|
Bernadette Connaughton |
|
|
|
|
|
|
|
|
|
|
|
|
|
/s/ Linda Harty |
|
Director |
|
February 16, 2022 |
|
|
Linda Harty |
|
|
|
|
|
|
|
|
|
|
|
|
|
/s/ William Klitgaard |
|
Director |
|
February 16, 2022 |
|
|
William Klitgaard |
|
|
|
|
|
|
|
|
|
|
|
|
|
/s/ Kenneth Meyers |
|
Director |
|
February 16, 2022 |
|
|
Kenneth Meyers |
|
|
|
|
|
|
|
|
|
|
|
|
|
/s/ Matthew Monaghan |
|
Director |
|
February 16, 2022 |
|
|
Matthew Monaghan |
|
|
|
|
|
|
|
|
|
|
|
|
|
/s/ David Wilkes |
|
Director |
|
February 16, 2022 |
|
|
David Wilkes, M.D. |
|
|
|
|
|
|
|
|
|
|
|
|
|
/s/ Alfonso Zulueta |
|
Director |
|
February 16, 2022 |
|
|
Alfonso Zulueta |
|
|
|
|
151