![]()
Diplomat Announces 1st Quarter Financial Results
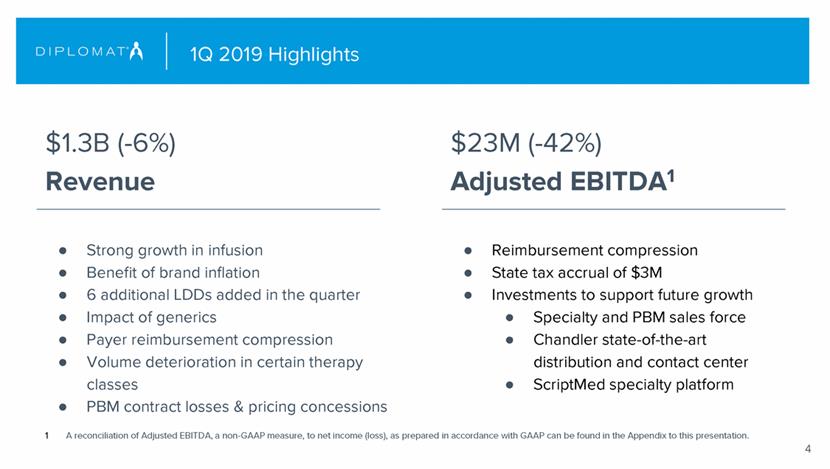
1st Quarter Revenue of $1,257 Million, compared to $1,342 Million, Net Loss of $14.3 Million, compared to a Net Loss of $0.5 Million, Adjusted EBITDA of $23.1 Million, compared to $39.6 Million
FLINT, Mich., May 7, 2019 — Diplomat Pharmacy, Inc. (NYSE: DPLO), the nation’s largest independent provider of specialty pharmacy and infusion services, announced financial results for the quarter ended March 31, 2019. All comparisons, unless otherwise noted, are to the quarter ended March 31, 2018. Prior period financials have been recast to include certain direct expenses as part of cost of sales instead of selling, general and administrative expense for our Specialty segment. This change is a reclassification only and has no impact on overall results.
First Quarter 2019 Highlights include:
· Revenue of $1,257 million, compared to $1,342 million
· Specialty segment revenue of $1,168 million, compared to $1,153 million
· PBM segment revenue of $98 million, compared to $191 million
· Specialty segment total prescriptions dispensed of 225,000, compared to 223,000
· PBM segment total volume, adjusted to 30-day equivalent, of 1,045,000, compared to 2,181,000
· Gross margin of 6.3% versus 6.7%
· Specialty segment gross margin of 5.8% versus 6.3%
· PBM segment gross margin of 11.9% versus 9.2%
· EPS of $(0.19) per basic/diluted common share versus $(0.01) per basic/diluted common share
· Adjusted EBITDA of $23.1 million, compared to $39.6 million
· Adjusted EBITDA margin of 1.8% versus 3.0%
· Net cash provided by operating activities was $23.7 million, compared to $48.6 million
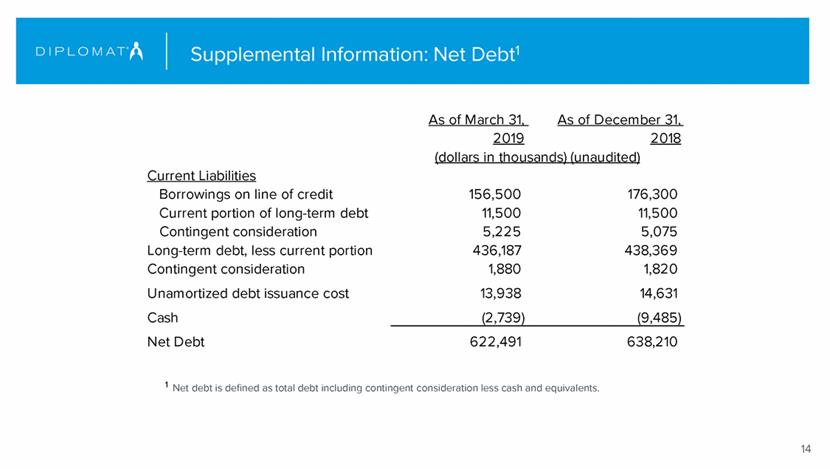
· Net debt(1) decreased to $622.5 million, from $638.2 million at December 31, 2018.
Brian Griffin, Chairman and CEO of Diplomat, commented “Our quarterly results reflect the competitive challenges we are facing in our core specialty pharmacy business and the impact of contract losses in the PBM business, while specialty infusion continues to be a bright spot. The company is starting to benefit from prior investments in sales and account management resources and we remain encouraged by the pipeline of opportunity across all of Diplomat’s businesses as our value proposition gains traction in the market. We expect to achieve the previously communicated revenue and Adjusted EBITDA guidance for 2019, but have increased our GAAP net loss and EPS loss expectations due to a change in tax forecasts. Diplomat’s Board and management team are committed to maximizing shareholder value, while maintaining focus on rebuilding our PBM business and expanding business with health plans, hospital systems and manufacturer partners.”
(1) Net debt is defined as total debt including contingent consideration less cash and equivalents.
First Quarter Financial Summary:
Revenue for the first quarter of 2019 was $1,257 million, compared to $1,342 million in the first quarter of 2018, a decrease of $86 million or 6%. Our Specialty segment revenue amounted to $1,168 million, compared to $1,153 million in the prior year quarter, while revenue from our PBM segment amounted to $98 million, compared to $191 million in the prior year quarter. The increase in our Specialty segment was primarily driven by manufacturer price increases and growth in our infusion therapy class. The increase was partially offset by payor reimbursement compression, volume deterioration in certain therapy classes primarily due to narrowing of specialty pharmacy networks and competitor member channel management, and the conversion of some brand drugs to their generic equivalent. The decrease in our PBM segment was due to previously disclosed contract losses.
Gross profit in the first quarter of 2019 was $79.2 million and generated a 6.3% gross margin, compared to $90.4 million gross profit and a 6.7% gross margin in the first quarter of 2018. Gross profit from our Specialty segment was $67.5 million and generated a 5.8% gross margin, compared to $72.8 million and a 6.3% gross margin in the prior period. The gross margin decrease in our Specialty segment was driven by reimbursement compression, lower volumes within higher margin therapies, and a one-time $3.0 million charge to establish sales and use and gross receipt tax liabilities, for prior year periods, related to certain states where we do business. Gross profit from our PBM segment was $11.7 million and generated an 11.9% gross margin, compared to $17.6 million and a 9.2% gross margin. The gross margin increase in our PBM segment was driven by lost business that had lower margins and the timing of rebate recognition in 2018 which suppressed our margins in the first quarter of that year.
Selling, general and administrative expenses for the first quarter of 2019 were $82.9 million, an increase of $1.2 million, compared to $81.7 million in the first quarter of 2018. This increase is primarily driven by a $5.5 million increase in employee cost, including a $0.4 million increase in share-based compensation. The increase in employee expense was largely due to an investment in our sales and account management teams across the organization to drive new business, as well as higher executive compensation. The increase in employee cost was partially offset by a $2.7 million decrease in amortization due to the impairment of our definite-lived intangible assets in the fourth quarter of 2018 and a $1.7 million decrease in acquisition related expenses.
Net loss for the first quarter of 2019 was $(14.3) million compared to $(0.5) million in the first quarter of 2018. This decrease was primarily driven by a $12.3 million change in (loss) income from operations and a $1.5 million change in income tax (expense) benefit primarily due to the establishment of a valuation allowance against operating losses due to our cumulative loss position. Adjusted EBITDA for the first quarter of 2019 was $23.1 million compared to $39.6 million in the first quarter of 2018, a decrease of $16.5 million.
Loss per share for the first quarter of 2019 was $(0.19) per basic/diluted common share, compared to $(0.01) per basic/diluted common share for the first quarter of 2018.
2019 Financial Outlook
For the full-year 2019, we are maintaining our financial guidance for revenue and adjusted EBITDA and updating our expectations for net loss and diluted EPS:
· Revenue between $4.7 and $5.0 billion
· Specialty segment revenue between $4.4 and $4.6 billion
· PBM segment revenue between $0.3 and $0.4 billion
· Net loss between $(49) and $(33) million, versus the previous range of $(37) and $(26) million
· Adjusted EBITDA between $110 and $116 million
· Diluted EPS between $(0.65) and $(0.44), versus the previous range of $(0.50) and $(0.34)
We have updated our income tax expectation for the year to an expense range of $1.6 to $2.6 million, primarily related to state taxes, versus our previous expectation of recording a tax benefit. A federal tax benefit will not be recorded for our 2019 losses as we are required to record a valuation allowance against any such benefit due to being in a cumulative loss position. Our EPS expectations for 2019 assume approximately 75,300,000 weighted average common shares outstanding on a diluted basis which could differ materially.
Earnings Conference Call Information
As previously announced, the Company will hold a conference call to discuss its first quarter performance this morning, May 7, 2019, at 8:30 a.m. Eastern Time. Shareholders and interested participants may listen to a live broadcast of the conference call by dialing 833.286.5805 (647.689.4450 for international callers) and referencing participant code 7747209 approximately 15 minutes prior to the call. A live webcast of the conference call and associated slide presentation will be available on the investor relations section of the Company’s website for approximately 90 days at ir.diplomat.is.
About Diplomat
Diplomat (NYSE: DPLO) is the nation’s largest independent provider of specialty pharmacy and infusion services. Diplomat helps people with complex and chronic health conditions in all 50 states, partnering with payers, providers, hospitals, manufacturers, and more. Rooted in this patient care expertise, Diplomat also serves payers through CastiaRx, a leading specialty benefit manager, and offers tailored solutions for healthcare innovators through EnvoyHealth. Diplomat opened its doors in 1975 as a neighborhood pharmacy with one essential tenet: “Take good care of patients and the rest falls into place.” Today, that tradition continues—always focused on improving patient care. For more information, visit diplomat.is.
Non-GAAP Information
We define Adjusted EBITDA as net (loss) income before interest expense, income taxes, depreciation and amortization, share-based compensation, change in fair value of contingent consideration and other merger and acquisition-related expenses, restructuring and impairment charges, and certain other items that we do not consider indicative of our ongoing operating performance (which are itemized below in the reconciliation to net loss). Adjusted EBITDA is not in accordance with, or an alternative to, GAAP. In addition, this non-GAAP measure is not based on any comprehensive set of accounting rules or principles. You should be aware that in the future we may incur expenses that are the same as or similar to some of the adjustments in the presentation, and we do not infer that our future results will be unaffected by unusual or non-recurring items.
We consider Adjusted EBITDA to be a supplemental measure of our operating performance. We present Adjusted EBITDA because it is used by our Board of Directors and management to evaluate our operating performance. Adjusted EBITDA is also used as a factor in determining incentive compensation, for budgetary planning and forecasting overall financial and operational expectations, for identifying underlying trends, and for evaluating the effectiveness of our business strategies. Further, we believe it assists us, as well as investors, in comparing performance from period-to-period on a consistent basis. Other companies in our industry may calculate Adjusted EBITDA differently than we do and their calculation may not be comparable to our Adjusted EBITDA metric. A reconciliation of Adjusted EBITDA, a non-GAAP measure, to net loss can be found below.
Forward Looking Statements
This press release contains forward-looking statements made pursuant to the safe harbor provisions of the Private Securities Litigation Reform Act of 1995. Forward-looking statements give current expectations or forecasts of
future events or our future financial or operating performance, and may include Diplomat’s expectations regarding revenues, net (loss) income, Adjusted EBITDA, EPS, market share, new business and contract wins, the expected benefits and performance of business and growth strategies, impact of operational improvement initiatives and results of operational and capital expenditures. The forward-looking statements contained in this press release are based on management’s good-faith belief and reasonable judgment based on current information. These statements are qualified by important risks and uncertainties, many of which are beyond our control, that could cause our actual results to differ materially from those forecasted or indicated by such forward-looking statements. These risks and uncertainties include: our ability to adapt to changes or trends within the specialty pharmacy industry; a significant increase in competition from a variety of companies in the health care industry; significant and increasing pricing pressure from third party payors, resulting in continuing margin compression and adversely impacting contract profitability; possibility of client losses and/or the failure to win new business; declining gross margins in the PBM industry; shifts in pharmacy mix toward lower margin drugs; supply disruption of any of the specialty drugs we dispense; potential for contracting at reduced rates to win new business or secure renewal business; the dependence on key employees and effective succession planning and managing recent turnover among key employees; potential disruption to our workforce and operations due to cost savings and restructuring initiatives; disruption in our operations as we implement a new operating system within our Specialty segment; our ability to expand the number of specialty drugs we dispense and related services; maintaining existing patients; increasing consolidation in the healthcare industry; complying with complex and evolving requirements and changes in state and federal government regulations, including Medicare and Medicaid; current or proposed legislative and regulatory policies designed to manage healthcare costs or alter healthcare financing practices, including as it relates to the PBM industry’s retention of rebates; the amount of direct and indirect remuneration fees, as well as the timing of assessing such fees and the methodology used to calculate such fees; the outcome of material legal proceedings; our relationships with wholesalers and key pharmaceutical manufacturers; bad publicity about, or market withdrawal of, specialty drugs we dispense; revenue concentration of the top specialty drugs we dispense; managing our growth effectively; our ability to drive volume through a refreshed marketing strategy in traditional specialty pharmacy; our capability to penetrate the fragmented infusion market; the success of our strategy in the PBM industry; failure to effectively differentiate our products and services in the PBM market place; our debt service obligations; our inability to remediate present material weaknesses, and to identify and remediate future material weaknesses, in our disclosure controls and procedures and internal control over financial reporting, which could impair our ability to produce accurate and timely financial statements; the effect of any future impairments to our goodwill or other intangible assets on our net income (loss) and EPS, and the underlying reasons for such impairment; investments in new business strategies and initiatives, including with respect to data and analytics capabilities, could disrupt our ongoing business and present risks not originally contemplated; tax matters and imposition of new taxes; and the additional factors set forth in “Risk Factors” in Diplomat’s most recent Annual Report on Form 10-K and in subsequent reports filed with or furnished to the Securities and Exchange Commission. Except as may be required by any applicable laws, Diplomat assumes no obligation to publicly update such forward-looking statements, which are made as of the date hereof or the earlier date specified herein, whether as a result of new information, future developments, or otherwise.
CONTACT:
Terri Anne Powers, Vice President Investor Relations
312-889-5244 | tpowers@diplomat.is
DIPLOMAT PHARMACY, INC.
Condensed Consolidated Balance Sheets
(Dollars in thousands)
|
|
|
March 31, |
|
December 31, |
| ||
|
|
|
2019 |
|
2018 |
| ||
|
|
|
(unaudited) |
|
|
| ||
|
ASSETS |
|
|
|
|
| ||
|
Current assets: |
|
|
|
|
| ||
|
Cash and equivalents |
|
$ |
2,739 |
|
$ |
9,485 |
|
|
Receivables, net |
|
329,881 |
|
326,602 |
| ||
|
Inventories |
|
174,507 |
|
210,573 |
| ||
|
Prepaid expenses and other current assets |
|
10,544 |
|
9,596 |
| ||
|
Total current assets |
|
517,671 |
|
556,256 |
| ||
|
Property and equipment, net |
|
31,244 |
|
34,525 |
| ||
|
Capitalized software for internal use, net |
|
29,844 |
|
30,506 |
| ||
|
Operating lease right-of-use assets |
|
27,325 |
|
— |
| ||
|
Goodwill |
|
609,592 |
|
609,592 |
| ||
|
Definite-lived intangible assets, net |
|
227,005 |
|
240,810 |
| ||
|
Other noncurrent assets |
|
4,387 |
|
4,670 |
| ||
|
Total assets |
|
$ |
1,447,068 |
|
$ |
1,476,359 |
|
|
|
|
|
|
|
| ||
|
LIABILITIES AND SHAREHOLDERS’ EQUITY |
|
|
|
|
| ||
|
Current liabilities: |
|
|
|
|
| ||
|
Accounts payable |
|
$ |
283,893 |
|
$ |
308,084 |
|
|
Rebates payable to PBM customers |
|
21,573 |
|
23,264 |
| ||
|
Borrowings on line of credit |
|
156,500 |
|
176,300 |
| ||
|
Current portion of long-term debt |
|
11,500 |
|
11,500 |
| ||
|
Current portion of operating lease liabilities |
|
4,239 |
|
— |
| ||
|
Accrued expenses: |
|
|
|
|
| ||
|
Compensation and benefits |
|
12,228 |
|
13,348 |
| ||
|
Contingent consideration |
|
5,225 |
|
5,075 |
| ||
|
Other |
|
22,361 |
|
21,014 |
| ||
|
Total current liabilities |
|
517,519 |
|
558,585 |
| ||
|
Long-term debt, less current portion |
|
436,187 |
|
438,369 |
| ||
|
Noncurrent operating lease liabilities |
|
23,950 |
|
— |
| ||
|
Deferred income taxes |
|
3,233 |
|
2,781 |
| ||
|
Contingent consideration |
|
1,880 |
|
1,820 |
| ||
|
Derivative liability |
|
6,419 |
|
4,292 |
| ||
|
Deferred gain |
|
— |
|
5,175 |
| ||
|
Other |
|
— |
|
253 |
| ||
|
Total liabilities |
|
989,188 |
|
1,011,275 |
| ||
|
Shareholders’ equity: |
|
|
|
|
| ||
|
Preferred stock (10,000,000 shares authorized; none issued and outstanding) |
|
— |
|
— |
| ||
|
Common stock (no par value, 590,000,000 shares authorized; 74,713,696 and 74,474,677 shares issued and outstanding at March 31, 2019 and December 31, 2018, respectively) |
|
634,214 |
|
629,411 |
| ||
|
Additional paid-in capital |
|
49,313 |
|
50,544 |
| ||
|
Accumulated deficit |
|
(219,228 |
) |
(210,579 |
) | ||
|
Accumulated other comprehensive loss |
|
(6,419 |
) |
(4,292 |
) | ||
|
Total shareholders’ equity |
|
457,880 |
|
465,084 |
| ||
|
Total liabilities and shareholders’ equity |
|
$ |
1,447,068 |
|
$ |
1,476,359 |
|
DIPLOMAT PHARMACY, INC.
Condensed Consolidated Statements of Operations (Unaudited)
(dollars in thousands, except per share amounts)
|
|
|
Three Months Ended |
| ||||
|
|
|
March 31, |
| ||||
|
|
|
2019 |
|
2018 |
| ||
|
Net sales |
|
$ |
1,256,808 |
|
$ |
1,342,484 |
|
|
Cost of sales |
|
(1,177,588 |
) |
(1,252,106 |
) | ||
|
Gross profit |
|
79,220 |
|
90,378 |
| ||
|
Selling, general and administrative expenses |
|
(82,868 |
) |
(81,687 |
) | ||
|
(Loss) income from operations |
|
(3,648 |
) |
8,691 |
| ||
|
Other (expense) income: |
|
|
|
|
| ||
|
Interest expense |
|
(10,215 |
) |
(10,427 |
) | ||
|
Other |
|
181 |
|
418 |
| ||
|
Total other expense |
|
(10,034 |
) |
(10,009 |
) | ||
|
Loss before income taxes |
|
(13,682 |
) |
(1,318 |
) | ||
|
Income tax (expense) benefit |
|
(619 |
) |
868 |
| ||
|
Net loss |
|
$ |
(14,301 |
) |
$ |
(450 |
) |
|
|
|
|
|
|
| ||
|
Loss per common share, basic and diluted |
|
$ |
(0.19 |
) |
$ |
(0.01 |
) |
|
|
|
|
|
|
| ||
|
Weighted average common shares outstanding, basic and diluted |
|
74,460,990 |
|
73,996,313 |
| ||
Condensed Consolidated Statements of Operations, Inclusive of Reportable Segment Breakout (Unaudited)
(dollars in thousands, except per share amounts)
|
|
|
Three Months Ended |
| ||||
|
|
|
March 31, |
| ||||
|
|
|
2019 |
|
2018 |
| ||
|
Net sales - Specialty |
|
$ |
1,168,365 |
|
$ |
1,152,979 |
|
|
Net sales - PBM |
|
97,917 |
|
191,468 |
| ||
|
Inter-segment elimination |
|
(9,474 |
) |
(1,963 |
) | ||
|
Net sales |
|
1,256,808 |
|
1,342,484 |
| ||
|
|
|
|
|
|
| ||
|
Cost of sales - Specialty |
|
(1,100,841 |
) |
(1,080,159 |
) | ||
|
Cost of sales - PBM |
|
(86,221 |
) |
(173,910 |
) | ||
|
Inter-segment elimination |
|
9,474 |
|
1,963 |
| ||
|
Cost of sales |
|
(1,177,588 |
) |
(1,252,106 |
) | ||
|
|
|
|
|
|
| ||
|
Gross profit - Specialty |
|
67,524 |
|
72,820 |
| ||
|
Gross profit - PBM |
|
11,696 |
|
17,558 |
| ||
|
Gross profit |
|
79,220 |
|
90,378 |
| ||
|
Selling, general and administrative expenses |
|
(82,868 |
) |
(81,687 |
) | ||
|
(Loss) income from operations |
|
(3,648 |
) |
8,691 |
| ||
|
Other (expense) income: |
|
|
|
|
| ||
|
Interest expense |
|
(10,215 |
) |
(10,427 |
) | ||
|
Other |
|
181 |
|
418 |
| ||
|
Total other expense |
|
(10,034 |
) |
(10,009 |
) | ||
|
Loss before income taxes |
|
(13,682 |
) |
(1,318 |
) | ||
|
Income tax (expense) benefit |
|
(619 |
) |
868 |
| ||
|
Net loss |
|
$ |
(14,301 |
) |
$ |
(450 |
) |
|
|
|
|
|
|
| ||
|
Loss per common share, basic and diluted |
|
$ |
(0.19 |
) |
$ |
(0.01 |
) |
|
|
|
|
|
|
| ||
|
Weighted average common shares outstanding, basic and diluted |
|
74,460,990 |
|
73,996,313 |
| ||
DIPLOMAT PHARMACY, INC.
Condensed Consolidated Statements of Cash Flows (Unaudited)
(dollars in thousands)
|
|
|
Three Months Ended |
| ||||
|
|
|
March 31, |
| ||||
|
|
|
2019 |
|
2018 |
| ||
|
Cash flows from operating activities: |
|
|
|
|
| ||
|
Net loss |
|
$ |
(14,301 |
) |
$ |
(450 |
) |
|
Adjustments to reconcile net loss to net cash provided by operating activities: |
|
|
|
|
| ||
|
Depreciation and amortization |
|
21,395 |
|
23,951 |
| ||
|
Share-based compensation expense |
|
3,572 |
|
3,161 |
| ||
|
Net provision for doubtful accounts |
|
2,447 |
|
2,322 |
| ||
|
Amortization of debt issuance costs |
|
961 |
|
1,132 |
| ||
|
Changes in fair value of contingent consideration |
|
210 |
|
— |
| ||
|
Contingent consideration payments |
|
— |
|
(470 |
) | ||
|
Deferred income tax expense (benefit) |
|
452 |
|
(547 |
) | ||
|
Other |
|
633 |
|
(3 |
) | ||
|
Changes in operating assets and liabilities, net of business acquisitions: |
|
|
|
|
| ||
|
Accounts receivable |
|
(5,726 |
) |
21 |
| ||
|
Inventories |
|
36,779 |
|
11,903 |
| ||
|
Accounts payable |
|
(24,191 |
) |
8,465 |
| ||
|
Rebates payable |
|
(1,691 |
) |
3,288 |
| ||
|
Other assets and liabilities |
|
3,112 |
|
(4,201 |
) | ||
|
Net cash provided by operating activities |
|
23,652 |
|
48,572 |
| ||
|
Cash flows from investing activities: |
|
|
|
|
| ||
|
Expenditures for property and equipment |
|
(897 |
) |
(2,302 |
) | ||
|
Expenditures for capitalized software for internal use |
|
(6,840 |
) |
(567 |
) | ||
|
Other |
|
14 |
|
3 |
| ||
|
Net cash used in investing activities |
|
(7,723 |
) |
(2,866 |
) | ||
|
Cash flows from financing activities: |
|
|
|
|
| ||
|
Net payments on line of credit |
|
(19,800 |
) |
(48,250 |
) | ||
|
Payments on long-term debt |
|
(2,875 |
) |
(76,875 |
) | ||
|
Payments of debt issuance costs |
|
— |
|
(171 |
) | ||
|
Proceeds from issuance of stock upon stock option exercises |
|
— |
|
1,909 |
| ||
|
Contingent consideration payment |
|
— |
|
(530 |
) | ||
|
Net cash used in financing activities |
|
(22,675 |
) |
(123,917 |
) | ||
|
Net decrease in cash and equivalents |
|
(6,746 |
) |
(78,211 |
) | ||
|
Cash and equivalents at beginning of period |
|
9,485 |
|
84,251 |
| ||
|
Cash and equivalents at end of period |
|
$ |
2,739 |
|
$ |
6,040 |
|
|
Supplemental disclosures of cash flow information: |
|
|
|
|
| ||
|
Cash paid for interest |
|
$ |
(9,254 |
) |
$ |
(10,160 |
) |
|
Cash paid for income taxes |
|
$ |
(67 |
) |
$ |
(48 |
) |
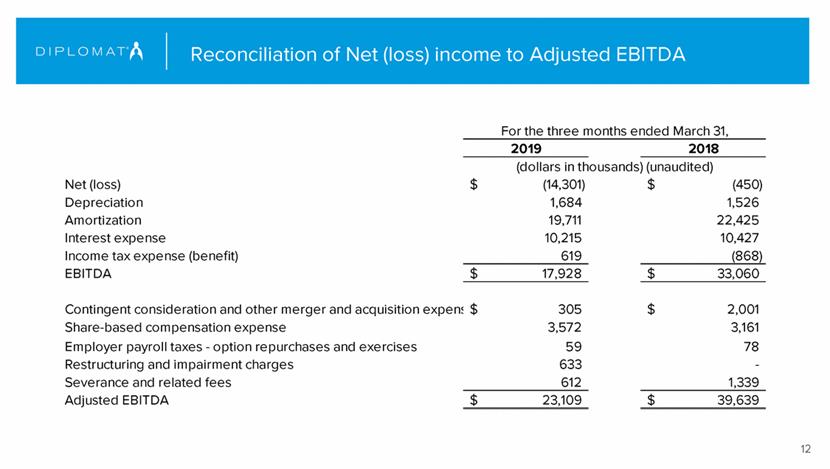
Adjusted EBITDA
The table below presents a reconciliation of net loss to Adjusted EBITDA for the periods indicated.
|
|
|
For the three months ended March 31, |
| ||||
|
|
|
2019 |
|
2018 |
| ||
|
|
|
(dollars in thousands) (unaudited) |
| ||||
|
Net loss |
|
$ |
(14,301 |
) |
$ |
(450 |
) |
|
Depreciation |
|
1,684 |
|
1,526 |
| ||
|
Amortization |
|
19,711 |
|
22,425 |
| ||
|
Interest expense |
|
10,215 |
|
10,427 |
| ||
|
Income tax expense (benefit) |
|
619 |
|
(868 |
) | ||
|
EBITDA |
|
$ |
17,928 |
|
$ |
33,060 |
|
|
|
|
|
|
|
| ||
|
Contingent consideration and other merger and acquisition expense |
|
$ |
305 |
|
$ |
2,001 |
|
|
Share-based compensation expense |
|
3,572 |
|
3,161 |
| ||
|
Employer payroll taxes - option repurchases and exercises |
|
59 |
|
78 |
| ||
|
Restructuring and impairment charges |
|
633 |
|
— |
| ||
|
Severance and related fees |
|
612 |
|
1,339 |
| ||
|
Adjusted EBITDA |
|
$ |
23,109 |
|
$ |
39,639 |
|
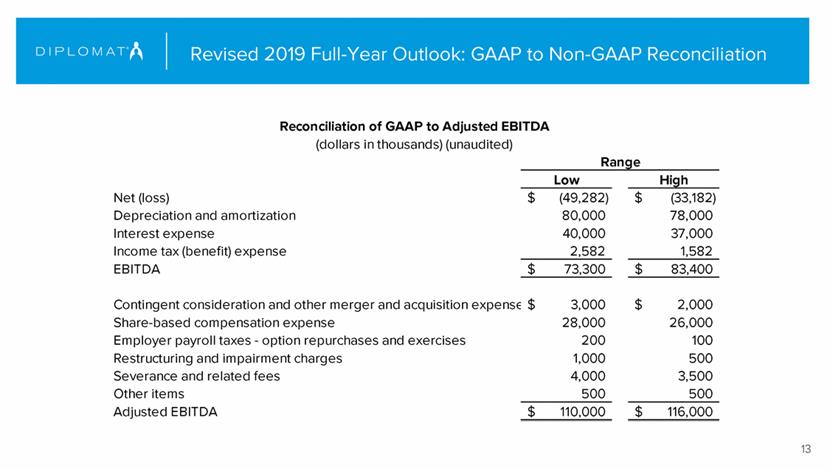
2019 Full Year Guidance: GAAP to Non-GAAP Reconciliation
The table below presents a reconciliation of net loss to Adjusted EBITDA for the year ended December 31, 2019.
Reconciliation of GAAP to Adjusted EBITDA
(dollars in thousands) (unaudited)
|
|
|
Range |
| ||||
|
|
|
Low |
|
High |
| ||
|
Net loss |
|
$ |
(49,282 |
) |
$ |
(33,182 |
) |
|
Depreciation and amortization |
|
80,000 |
|
78,000 |
| ||
|
Interest expense |
|
40,000 |
|
37,000 |
| ||
|
Income tax (benefit) expense |
|
2,582 |
|
1,582 |
| ||
|
EBITDA |
|
$ |
73,300 |
|
$ |
83,400 |
|
|
|
|
|
|
|
| ||
|
Contingent consideration and other merger and acquisition expense |
|
$ |
3,000 |
|
$ |
2,000 |
|
|
Share-based compensation expense |
|
28,000 |
|
26,000 |
| ||
|
Employer payroll taxes - option repurchases and exercises |
|
200 |
|
100 |
| ||
|
Restructuring and impairment charges |
|
1,000 |
|
500 |
| ||
|
Severance and related fees |
|
4,000 |
|
3,500 |
| ||
|
Other items |
|
500 |
|
500 |
| ||
|
Adjusted EBITDA |
|
$ |
110,000 |
|
$ |
116,000 |
|