000160980412/312019FYFALSEP1YP1YP2YP3Y33.3333.3333.33P6YP1Y00016098042019-01-012019-12-31iso4217:USD00016098042019-06-30xbrli:shares00016098042020-02-1900016098042019-12-310001609804us-gaap:AdditionalPaidInCapitalMember2019-01-012019-12-3100016098042018-01-012018-12-3100016098042017-01-012017-12-31iso4217:USDxbrli:shares00016098042018-12-3100016098042017-12-3100016098042016-12-310001609804us-gaap:CommonStockMember2016-12-310001609804us-gaap:TreasuryStockMember2016-12-310001609804us-gaap:AdditionalPaidInCapitalMember2016-12-310001609804us-gaap:RetainedEarningsMember2016-12-310001609804us-gaap:AccumulatedOtherComprehensiveIncomeMember2016-12-310001609804us-gaap:RetainedEarningsMember2017-01-012017-12-310001609804us-gaap:AccumulatedOtherComprehensiveIncomeMember2017-01-012017-12-310001609804us-gaap:AdditionalPaidInCapitalMember2017-01-012017-12-310001609804us-gaap:CommonStockMember2017-12-310001609804us-gaap:TreasuryStockMember2017-12-310001609804us-gaap:AdditionalPaidInCapitalMember2017-12-310001609804us-gaap:RetainedEarningsMember2017-12-310001609804us-gaap:AccumulatedOtherComprehensiveIncomeMember2017-12-310001609804us-gaap:RetainedEarningsMember2018-01-012018-12-310001609804us-gaap:AccumulatedOtherComprehensiveIncomeMember2018-01-012018-12-310001609804us-gaap:AdditionalPaidInCapitalMember2018-01-012018-12-310001609804us-gaap:CommonStockMember2018-01-012018-12-310001609804us-gaap:TreasuryStockMember2018-01-012018-12-310001609804us-gaap:CommonStockMember2018-12-310001609804us-gaap:TreasuryStockMember2018-12-310001609804us-gaap:AdditionalPaidInCapitalMember2018-12-310001609804us-gaap:RetainedEarningsMember2018-12-310001609804us-gaap:AccumulatedOtherComprehensiveIncomeMember2018-12-310001609804us-gaap:RetainedEarningsMember2019-01-012019-12-310001609804us-gaap:AccumulatedOtherComprehensiveIncomeMember2019-01-012019-12-310001609804us-gaap:CommonStockMember2019-01-012019-12-310001609804us-gaap:TreasuryStockMember2019-01-012019-12-310001609804us-gaap:CommonStockMember2019-12-310001609804us-gaap:TreasuryStockMember2019-12-310001609804us-gaap:AdditionalPaidInCapitalMember2019-12-310001609804us-gaap:RetainedEarningsMember2019-12-310001609804us-gaap:AccumulatedOtherComprehensiveIncomeMember2019-12-3100016098042019-03-31oec:assetxbrli:pure0001609804oec:RubberCarbonBlackSegmentMemberoec:TenLargestCustomersMemberus-gaap:CustomerConcentrationRiskMemberus-gaap:SalesRevenueNetMember2019-01-012019-12-310001609804oec:SpecialtyCarbonBlackSegmentMemberoec:TenLargestCustomersMemberus-gaap:CustomerConcentrationRiskMemberus-gaap:SalesRevenueNetMember2019-01-012019-12-310001609804oec:TenLargestCustomersMemberus-gaap:CustomerConcentrationRiskMemberus-gaap:SalesRevenueNetMember2019-01-012019-12-31iso4217:EUR0001609804us-gaap:RevolvingCreditFacilityMember2019-12-31oec:financial_institution0001609804us-gaap:RevolvingCreditFacilityMember2019-01-012019-12-310001609804us-gaap:TrademarksAndTradeNamesMember2019-01-012019-12-310001609804oec:DevelopedTechnologyandPatentsMember2019-01-012019-12-310001609804srt:MinimumMemberus-gaap:OtherIntangibleAssetsMember2019-01-012019-12-310001609804srt:MaximumMemberus-gaap:OtherIntangibleAssetsMember2019-01-012019-12-310001609804oec:EvonikMemberus-gaap:CustomerRelationshipsMember2019-01-012019-12-310001609804oec:SocitDuNoirDActylneDeLAubetteSASMemberus-gaap:CustomerRelationshipsMember2019-01-012019-12-31oec:reporting_unitoec:segment0001609804srt:MinimumMemberus-gaap:BuildingMember2019-01-012019-12-310001609804srt:MaximumMemberus-gaap:BuildingMember2019-01-012019-12-310001609804srt:MinimumMemberoec:PlantAndMachineryMember2019-01-012019-12-310001609804srt:MaximumMemberoec:PlantAndMachineryMember2019-01-012019-12-310001609804srt:MinimumMemberus-gaap:FurnitureAndFixturesMember2019-01-012019-12-310001609804srt:MaximumMemberus-gaap:FurnitureAndFixturesMember2019-01-012019-12-3100016098042019-01-010001609804oec:CologneGermanyMember2019-12-310001609804us-gaap:LandMember2019-12-310001609804us-gaap:LandMember2018-12-310001609804oec:LandRightsAndBuildingsMember2019-12-310001609804oec:LandRightsAndBuildingsMember2018-12-310001609804oec:PlantAndMachineryMember2019-12-310001609804oec:PlantAndMachineryMember2018-12-310001609804us-gaap:FurnitureAndFixturesMember2019-12-310001609804us-gaap:FurnitureAndFixturesMember2018-12-310001609804oec:PrepaymentsAndConstructionInProgressMember2019-12-310001609804oec:PrepaymentsAndConstructionInProgressMember2018-12-310001609804oec:TermLoanFacilityMemberoec:TermLoanMember2019-12-310001609804oec:TermLoanFacilityMemberoec:TermLoanMember2018-12-310001609804oec:TermLoanFacilityMemberoec:TermLoanMember2014-07-250001609804oec:TermLoanUSDMemberoec:TermLoanMember2014-07-250001609804oec:TermLoanEURMemberoec:TermLoanMember2014-07-250001609804us-gaap:LondonInterbankOfferedRateLIBORMemberoec:TermLoanUSDMembersrt:MinimumMemberoec:TermLoanMember2014-07-252014-07-250001609804oec:TermLoanEURMemberoec:EuroInterbankOfferedRateEURIBORMembersrt:MinimumMemberoec:TermLoanMember2014-07-252014-07-250001609804oec:TermLoanEURMemberoec:EuroInterbankOfferedRateEURIBORMembersrt:MaximumMemberoec:TermLoanMember2014-07-252014-07-250001609804us-gaap:LondonInterbankOfferedRateLIBORMemberoec:TermLoanUSDMembersrt:MaximumMemberoec:TermLoanMember2014-07-252014-07-250001609804us-gaap:LondonInterbankOfferedRateLIBORMemberoec:TermLoanUSDMemberoec:TermLoanMember2014-07-252014-07-250001609804oec:TermLoanEURMemberoec:EuroInterbankOfferedRateEURIBORMemberoec:TermLoanMember2014-07-252014-07-250001609804oec:TermLoanFacilityMemberoec:TermLoanMember2014-07-252014-07-250001609804oec:TermLoanEURMemberoec:TermLoanMember2015-01-012017-12-310001609804oec:TermLoanUSDMemberoec:TermLoanMember2015-01-012017-12-310001609804us-gaap:LondonInterbankOfferedRateLIBORMemberoec:TermLoanUSDMemberoec:TermLoanMember2019-01-012019-12-310001609804oec:TermLoanEURMemberoec:EuroInterbankOfferedRateEURIBORMemberoec:TermLoanMember2019-01-012019-12-310001609804oec:TermLoanFacilityMemberoec:TermLoanMember2019-01-012019-12-310001609804oec:TermLoanFacilityMemberoec:TermLoanMember2018-01-012018-12-310001609804oec:TermLoanFacilityMemberoec:TermLoanMember2017-01-012017-12-310001609804oec:TermLoanFacilityMemberoec:TermLoanMember2016-01-012016-12-310001609804us-gaap:CashFlowHedgingMemberus-gaap:CrossCurrencyInterestRateContractMemberus-gaap:DesignatedAsHedgingInstrumentMember2018-05-110001609804oec:TermLoanFacilityMemberoec:TermLoanMember2018-05-112018-05-110001609804us-gaap:CurrencySwapMemberus-gaap:NetInvestmentHedgingMemberus-gaap:DesignatedAsHedgingInstrumentMember2015-01-010001609804us-gaap:CurrencySwapMemberus-gaap:NetInvestmentHedgingMemberus-gaap:DesignatedAsHedgingInstrumentMember2019-12-310001609804us-gaap:RevolvingCreditFacilityMember2014-07-250001609804us-gaap:RevolvingCreditFacilityMembersrt:MinimumMemberoec:EURIBORAndLIBORMember2014-07-252014-07-250001609804srt:MaximumMemberus-gaap:RevolvingCreditFacilityMemberoec:EURIBORAndLIBORMember2014-07-252014-07-250001609804us-gaap:RevolvingCreditFacilityMember2017-05-042017-05-040001609804us-gaap:RevolvingCreditFacilityMember2017-05-052017-05-050001609804us-gaap:RevolvingCreditFacilityMember2017-05-050001609804us-gaap:RevolvingCreditFacilityMember2019-04-022019-04-020001609804us-gaap:RevolvingCreditFacilityMember2019-04-010001609804us-gaap:RevolvingCreditFacilityMember2019-04-020001609804us-gaap:RevolvingCreditFacilityMemberus-gaap:EurodollarMember2019-04-022019-04-020001609804srt:MaximumMemberus-gaap:RevolvingCreditFacilityMember2019-04-020001609804us-gaap:RevolvingCreditFacilityMembersrt:MinimumMember2019-04-020001609804us-gaap:RevolvingCreditFacilityMemberus-gaap:EurodollarMember2019-04-012019-04-010001609804us-gaap:RevolvingCreditFacilityMember2018-01-012018-12-310001609804us-gaap:RevolvingCreditFacilityMember2018-12-310001609804oec:DeutscheBankAGMember2019-01-012019-12-310001609804oec:DeutscheBankAGMember2018-01-012018-12-310001609804oec:UnicreditMember2019-01-012019-12-310001609804oec:UnicreditMember2018-01-012018-12-310001609804oec:TermLoanFacilityMember2019-12-310001609804oec:SocitDuNoirDActylneDeLAubetteSASMember2018-10-310001609804oec:SocitDuNoirDActylneDeLAubetteSASMember2018-10-312018-10-310001609804oec:SocitDuNoirDActylneDeLAubetteSASMembersrt:ScenarioPreviouslyReportedMember2018-10-310001609804oec:SocitDuNoirDActylneDeLAubetteSASMember2019-10-012019-12-310001609804oec:SocitDuNoirDActylneDeLAubetteSASMemberoec:FairValueAdjustmentToAssetsAndRelatedDeferredTaxLiabilityMember2019-10-012019-12-310001609804oec:RubberMember2017-12-310001609804oec:SpecialtiesMember2017-12-310001609804oec:RubberMember2018-01-012018-12-310001609804oec:SpecialtiesMember2018-01-012018-12-310001609804oec:RubberMember2018-12-310001609804oec:SpecialtiesMember2018-12-310001609804oec:SpecialtiesMember2019-01-012019-12-310001609804oec:RubberMember2019-01-012019-12-310001609804oec:RubberMember2019-12-310001609804oec:SpecialtiesMember2019-12-310001609804oec:DevelopedTechnologyandPatentsMember2019-12-310001609804oec:DevelopedTechnologyandPatentsMember2018-12-310001609804us-gaap:CustomerRelationshipsMember2019-12-310001609804us-gaap:CustomerRelationshipsMember2018-12-310001609804us-gaap:TrademarksMember2019-12-310001609804us-gaap:TrademarksMember2018-12-310001609804us-gaap:ContractBasedIntangibleAssetsMember2019-12-310001609804us-gaap:ContractBasedIntangibleAssetsMember2018-12-310001609804us-gaap:OtherIntangibleAssetsMember2019-12-310001609804us-gaap:OtherIntangibleAssetsMember2018-12-310001609804srt:MinimumMember2019-01-012019-12-310001609804srt:MaximumMember2019-01-012019-12-310001609804us-gaap:FairValueInputsLevel2Member2019-12-310001609804us-gaap:FairValueInputsLevel2Member2018-12-310001609804oec:CreditFacilityTermLoanMemberus-gaap:FairValueInputsLevel2Member2019-12-310001609804oec:CreditFacilityTermLoanMemberus-gaap:FairValueInputsLevel2Member2018-12-310001609804us-gaap:FairValueInputsLevel2Memberoec:LocalBankLoanMember2019-12-310001609804us-gaap:FairValueInputsLevel2Memberoec:LocalBankLoanMember2018-12-310001609804us-gaap:CashFlowHedgingMemberoec:EuroInterestRateCapStartDate2014Memberus-gaap:DesignatedAsHedgingInstrumentMember2014-11-280001609804us-gaap:CashFlowHedgingMemberoec:EuroInterestRateCapStartDate2014Memberus-gaap:DesignatedAsHedgingInstrumentMember2014-07-250001609804us-gaap:CashFlowHedgingMemberoec:USDInterestRateCapStartDate2014Memberus-gaap:DesignatedAsHedgingInstrumentMember2014-11-280001609804us-gaap:CashFlowHedgingMemberoec:USDInterestRateCapStartDate2014Memberus-gaap:DesignatedAsHedgingInstrumentMember2014-07-250001609804us-gaap:CashFlowHedgingMemberoec:EuroInterestRateCapStartDate2014Memberoec:ThreeMonthEURIBORMemberus-gaap:DesignatedAsHedgingInstrumentMember2014-07-250001609804us-gaap:CashFlowHedgingMemberoec:ThreeMonthUSDLIBORMemberoec:USDInterestRateCapStartDate2014Memberus-gaap:DesignatedAsHedgingInstrumentMember2014-07-250001609804us-gaap:CashFlowHedgingMemberus-gaap:CrossCurrencyInterestRateContractMemberus-gaap:DesignatedAsHedgingInstrumentMember2018-05-150001609804us-gaap:GeographicConcentrationRiskMemberoec:ProjectedBenefitPensionObligationMembercountry:DE2019-01-012019-12-310001609804us-gaap:GeographicConcentrationRiskMemberoec:ProjectedBenefitPensionObligationMembercountry:DE2018-01-012018-12-31oec:program0001609804country:FR2016-01-012016-12-310001609804us-gaap:PensionPlansDefinedBenefitMember2019-12-310001609804us-gaap:OtherPostretirementBenefitPlansDefinedBenefitMember2019-12-310001609804us-gaap:PensionPlansDefinedBenefitMember2018-12-310001609804us-gaap:DefinedBenefitPlanEquitySecuritiesMember2019-12-310001609804us-gaap:DefinedBenefitPlanEquitySecuritiesMember2018-12-310001609804us-gaap:DefinedBenefitPlanDebtSecurityMember2019-12-310001609804us-gaap:DefinedBenefitPlanDebtSecurityMember2018-12-310001609804oec:DefinedBenefitPlanOtherSecuritiesMember2019-12-310001609804oec:DefinedBenefitPlanOtherSecuritiesMember2018-12-310001609804us-gaap:RestrictedStockUnitsRSUMember2019-01-012019-12-310001609804us-gaap:RestrictedStockUnitsRSUMemberoec:ShareBasedPaymentArrangementEmployeeNewHireSignOnMemberoec:ExecutiveCommitteeMember2019-01-012019-12-310001609804us-gaap:RestrictedStockUnitsRSUMemberoec:ShareBasedPaymentArrangementEmployeeNewHireSignOnMemberus-gaap:ShareBasedCompensationAwardTrancheOneMemberoec:ExecutiveCommitteeMember2019-01-012019-12-310001609804us-gaap:RestrictedStockUnitsRSUMemberoec:ShareBasedPaymentArrangementEmployeeNewHireSignOnMemberus-gaap:ShareBasedCompensationAwardTrancheTwoMemberoec:ExecutiveCommitteeMember2019-01-012019-12-310001609804us-gaap:RestrictedStockUnitsRSUMemberus-gaap:ShareBasedCompensationAwardTrancheThreeMemberoec:ShareBasedPaymentArrangementEmployeeNewHireSignOnMemberoec:ExecutiveCommitteeMember2019-01-012019-12-310001609804oec:TwoThousandFifteenPlanMember2019-01-012019-12-310001609804oec:TwoThousandFifteenPlanMember2018-01-012018-12-310001609804oec:TwoThousandFifteenPlanMember2017-01-012017-12-310001609804oec:TwoThousandSixteenPlanMember2019-01-012019-12-310001609804oec:TwoThousandSixteenPlanMember2018-01-012018-12-310001609804oec:TwoThousandSixteenPlanMember2017-01-012017-12-310001609804oec:TwoThousandSeventeenPlanMember2019-01-012019-12-310001609804oec:TwoThousandSeventeenPlanMember2018-01-012018-12-310001609804oec:TwoThousandSeventeenPlanMember2017-01-012017-12-310001609804oec:A2018PanIncentiveMember2019-01-012019-12-310001609804oec:A2018PanIncentiveMember2018-01-012018-12-310001609804oec:A2018PanIncentiveMember2017-01-012017-12-310001609804oec:A2018PlanPaymentTransactionMember2019-01-012019-12-310001609804oec:A2018PlanPaymentTransactionMember2018-01-012018-12-310001609804oec:A2018PlanPaymentTransactionMember2017-01-012017-12-310001609804oec:A2019PlanCEOIncentiveMember2019-01-012019-12-310001609804oec:A2019PlanCEOIncentiveMember2018-01-012018-12-310001609804oec:A2019PlanCEOIncentiveMember2017-01-012017-12-310001609804oec:A2019PlanMember2019-01-012019-12-310001609804oec:A2019PlanMember2018-01-012018-12-310001609804oec:A2019PlanMember2017-01-012017-12-310001609804oec:TwoThousandSixteenPlanMemberus-gaap:PerformanceSharesMember2018-12-310001609804oec:TwoThousandSixteenPlanMemberus-gaap:PerformanceSharesMember2019-01-012019-12-310001609804oec:TwoThousandSixteenPlanMemberus-gaap:PerformanceSharesMember2019-04-012019-04-300001609804oec:TwoThousandSixteenPlanMemberus-gaap:PerformanceSharesMember2019-12-310001609804oec:TwoThousandSeventeenPlanMemberus-gaap:PerformanceSharesMember2018-12-310001609804oec:TwoThousandSeventeenPlanMemberus-gaap:PerformanceSharesMember2019-01-012019-12-310001609804oec:TwoThousandSeventeenPlanMemberus-gaap:PerformanceSharesMember2019-12-310001609804us-gaap:PerformanceSharesMemberoec:TwoThousandEighteenPlanMember2018-12-310001609804us-gaap:PerformanceSharesMemberoec:TwoThousandEighteenPlanMember2019-01-012019-12-310001609804us-gaap:PerformanceSharesMemberoec:TwoThousandEighteenPlanMember2019-12-310001609804oec:TwoThousandNineteenPlanMemberus-gaap:PerformanceSharesMember2018-12-310001609804oec:TwoThousandNineteenPlanMemberus-gaap:PerformanceSharesMember2019-01-012019-12-310001609804oec:TwoThousandNineteenPlanMemberus-gaap:PerformanceSharesMember2019-12-310001609804us-gaap:PerformanceSharesMember2018-12-310001609804us-gaap:PerformanceSharesMember2019-01-012019-12-310001609804us-gaap:PerformanceSharesMember2019-12-310001609804us-gaap:PerformanceSharesMember2017-12-310001609804us-gaap:PerformanceSharesMember2018-01-012018-12-310001609804us-gaap:PerformanceSharesMember2016-12-310001609804us-gaap:PerformanceSharesMember2017-01-012017-12-310001609804us-gaap:RestrictedStockUnitsRSUMemberoec:ShareBasedPaymentArrangementEmployeeNewHireSignOnMemberoec:TwoThousandEighteenPlanMember2018-12-310001609804us-gaap:RestrictedStockUnitsRSUMemberoec:ShareBasedPaymentArrangementEmployeeNewHireSignOnMemberoec:TwoThousandEighteenPlanMember2019-01-012019-12-310001609804us-gaap:RestrictedStockUnitsRSUMemberoec:ShareBasedPaymentArrangementEmployeeNewHireSignOnMemberoec:TwoThousandEighteenPlanMember2019-12-310001609804us-gaap:RestrictedStockUnitsRSUMemberoec:TwoThousandNineteenPlanMemberoec:ShareBasedPaymentArrangementEmployeeNewHireSignOnMember2018-12-310001609804us-gaap:RestrictedStockUnitsRSUMemberoec:TwoThousandNineteenPlanMemberoec:ShareBasedPaymentArrangementEmployeeNewHireSignOnMember2019-01-012019-12-310001609804us-gaap:RestrictedStockUnitsRSUMemberoec:TwoThousandNineteenPlanMemberoec:ShareBasedPaymentArrangementEmployeeNewHireSignOnMember2019-12-310001609804oec:ShareBasedPaymentArrangementEmployeeExistingEmployeesMemberus-gaap:RestrictedStockUnitsRSUMemberoec:TwoThousandNineteenPlanMember2018-12-310001609804oec:ShareBasedPaymentArrangementEmployeeExistingEmployeesMemberus-gaap:RestrictedStockUnitsRSUMemberoec:TwoThousandNineteenPlanMember2019-01-012019-12-310001609804oec:ShareBasedPaymentArrangementEmployeeExistingEmployeesMemberus-gaap:RestrictedStockUnitsRSUMemberoec:TwoThousandNineteenPlanMember2019-12-310001609804us-gaap:RestrictedStockUnitsRSUMember2018-12-310001609804us-gaap:RestrictedStockUnitsRSUMember2019-12-310001609804us-gaap:RestrictedStockUnitsRSUMember2017-12-310001609804us-gaap:RestrictedStockUnitsRSUMember2018-01-012018-12-310001609804us-gaap:RestrictedStockUnitsRSUMember2016-12-310001609804us-gaap:RestrictedStockUnitsRSUMember2017-01-012017-12-310001609804us-gaap:RestrictedStockMemberus-gaap:ShareBasedPaymentArrangementNonemployeeMember2019-12-310001609804us-gaap:PerformanceSharesMemberoec:TwoThousandFifteenPlanMember2018-04-012018-04-300001609804us-gaap:CostOfSalesMember2019-01-012019-12-310001609804us-gaap:CostOfSalesMember2018-01-012018-12-310001609804us-gaap:CostOfSalesMember2017-01-012017-12-310001609804us-gaap:SellingAndMarketingExpenseMember2019-01-012019-12-310001609804us-gaap:SellingAndMarketingExpenseMember2018-01-012018-12-310001609804us-gaap:SellingAndMarketingExpenseMember2017-01-012017-12-310001609804us-gaap:GeneralAndAdministrativeExpenseMember2019-01-012019-12-310001609804us-gaap:GeneralAndAdministrativeExpenseMember2018-01-012018-12-310001609804us-gaap:GeneralAndAdministrativeExpenseMember2017-01-012017-12-310001609804us-gaap:ResearchAndDevelopmentExpenseMember2019-01-012019-12-310001609804us-gaap:ResearchAndDevelopmentExpenseMember2018-01-012018-12-310001609804us-gaap:ResearchAndDevelopmentExpenseMember2017-01-012017-12-310001609804us-gaap:RestrictedStockUnitsRSUMemberus-gaap:ShareBasedCompensationAwardTrancheOneMember2019-01-012019-12-310001609804us-gaap:RestrictedStockUnitsRSUMemberus-gaap:ShareBasedCompensationAwardTrancheTwoMember2019-01-012019-12-310001609804us-gaap:RestrictedStockUnitsRSUMemberus-gaap:ShareBasedCompensationAwardTrancheThreeMember2019-01-012019-12-310001609804us-gaap:EmployeeSeveranceMember2016-12-310001609804us-gaap:FacilityClosingMember2016-12-310001609804oec:GroundRemediationCostsRelatedToRestructuringMember2016-12-310001609804us-gaap:OtherRestructuringMember2016-12-310001609804us-gaap:EmployeeSeveranceMember2017-01-012017-12-310001609804us-gaap:FacilityClosingMember2017-01-012017-12-310001609804oec:GroundRemediationCostsRelatedToRestructuringMember2017-01-012017-12-310001609804us-gaap:OtherRestructuringMember2017-01-012017-12-310001609804us-gaap:EmployeeSeveranceMember2017-12-310001609804us-gaap:FacilityClosingMember2017-12-310001609804oec:GroundRemediationCostsRelatedToRestructuringMember2017-12-310001609804us-gaap:OtherRestructuringMember2017-12-310001609804us-gaap:EmployeeSeveranceMember2018-01-012018-12-310001609804us-gaap:FacilityClosingMember2018-01-012018-12-310001609804oec:GroundRemediationCostsRelatedToRestructuringMember2018-01-012018-12-310001609804us-gaap:OtherRestructuringMember2018-01-012018-12-310001609804us-gaap:EmployeeSeveranceMember2018-12-310001609804us-gaap:FacilityClosingMember2018-12-310001609804oec:GroundRemediationCostsRelatedToRestructuringMember2018-12-310001609804us-gaap:OtherRestructuringMember2018-12-310001609804us-gaap:EmployeeSeveranceMember2019-01-012019-12-310001609804us-gaap:FacilityClosingMember2019-01-012019-12-310001609804oec:GroundRemediationCostsRelatedToRestructuringMember2019-01-012019-12-310001609804us-gaap:OtherRestructuringMember2019-01-012019-12-310001609804us-gaap:EmployeeSeveranceMember2019-12-310001609804us-gaap:FacilityClosingMember2019-12-310001609804oec:GroundRemediationCostsRelatedToRestructuringMember2019-12-310001609804us-gaap:OtherRestructuringMember2019-12-31oec:kmt0001609804oec:RubberMember2016-01-012016-12-3100016098042018-01-012018-06-30oec:plant00016098042018-06-300001609804us-gaap:EmployeeSeveranceMember2018-01-012018-06-300001609804us-gaap:AccumulatedTranslationAdjustmentMember2016-12-310001609804us-gaap:AccumulatedNetGainLossFromDesignatedOrQualifyingCashFlowHedgesMember2016-12-310001609804us-gaap:AccumulatedDefinedBenefitPlansAdjustmentMember2016-12-310001609804us-gaap:AccumulatedTranslationAdjustmentMember2017-01-012017-12-310001609804us-gaap:AccumulatedNetGainLossFromDesignatedOrQualifyingCashFlowHedgesMember2017-01-012017-12-310001609804us-gaap:AccumulatedDefinedBenefitPlansAdjustmentMember2017-01-012017-12-310001609804us-gaap:AccumulatedTranslationAdjustmentMember2017-12-310001609804us-gaap:AccumulatedNetGainLossFromDesignatedOrQualifyingCashFlowHedgesMember2017-12-310001609804us-gaap:AccumulatedDefinedBenefitPlansAdjustmentMember2017-12-310001609804us-gaap:AccumulatedTranslationAdjustmentMember2018-01-012018-12-310001609804us-gaap:AccumulatedNetGainLossFromDesignatedOrQualifyingCashFlowHedgesMember2018-01-012018-12-310001609804us-gaap:AccumulatedDefinedBenefitPlansAdjustmentMember2018-01-012018-12-310001609804us-gaap:AccumulatedTranslationAdjustmentMember2018-12-310001609804us-gaap:AccumulatedNetGainLossFromDesignatedOrQualifyingCashFlowHedgesMember2018-12-310001609804us-gaap:AccumulatedDefinedBenefitPlansAdjustmentMember2018-12-310001609804us-gaap:AccumulatedTranslationAdjustmentMember2019-01-012019-12-310001609804us-gaap:AccumulatedNetGainLossFromDesignatedOrQualifyingCashFlowHedgesMember2019-01-012019-12-310001609804us-gaap:AccumulatedDefinedBenefitPlansAdjustmentMember2019-01-012019-12-310001609804us-gaap:AccumulatedTranslationAdjustmentMember2019-12-310001609804us-gaap:AccumulatedNetGainLossFromDesignatedOrQualifyingCashFlowHedgesMember2019-12-310001609804us-gaap:AccumulatedDefinedBenefitPlansAdjustmentMember2019-12-310001609804us-gaap:AccumulatedDefinedBenefitPlansAdjustmentNetUnamortizedGainLossMemberus-gaap:ReclassificationOutOfAccumulatedOtherComprehensiveIncomeMember2019-01-012019-12-310001609804us-gaap:AccumulatedDefinedBenefitPlansAdjustmentNetUnamortizedGainLossMemberus-gaap:ReclassificationOutOfAccumulatedOtherComprehensiveIncomeMember2018-01-012018-12-310001609804us-gaap:AccumulatedDefinedBenefitPlansAdjustmentNetUnamortizedGainLossMemberus-gaap:ReclassificationOutOfAccumulatedOtherComprehensiveIncomeMember2017-01-012017-12-310001609804us-gaap:ReclassificationOutOfAccumulatedOtherComprehensiveIncomeMember2019-01-012019-12-310001609804us-gaap:ReclassificationOutOfAccumulatedOtherComprehensiveIncomeMember2018-01-012018-12-310001609804us-gaap:ReclassificationOutOfAccumulatedOtherComprehensiveIncomeMember2017-01-012017-12-310001609804country:DE2019-01-012019-12-310001609804country:DE2018-01-012018-12-310001609804country:DE2017-01-012017-12-310001609804us-gaap:ForeignCountryMembercountry:US2017-01-012017-12-310001609804country:BRus-gaap:ForeignCountryMember2019-01-012019-12-310001609804country:BRus-gaap:ForeignCountryMember2018-01-012018-12-310001609804country:BRus-gaap:ForeignCountryMember2017-01-012017-12-310001609804us-gaap:ForeignCountryMembercountry:KR2018-01-012018-12-310001609804oec:TaxYears2019Through2025Member2019-12-310001609804oec:TaxYearsAfter2025Member2019-12-310001609804oec:IndefiniteMember2019-12-31oec:defendant0001609804us-gaap:SettledLitigationMemberus-gaap:UnfavorableRegulatoryActionMember2017-12-222017-12-22oec:facility0001609804country:US2019-01-012019-12-310001609804stpr:LAus-gaap:SettledLitigationMemberus-gaap:UnfavorableRegulatoryActionMember2017-12-222017-12-220001609804stpr:LAus-gaap:SettledLitigationMembersrt:MaximumMemberus-gaap:UnfavorableRegulatoryActionMember2017-12-220001609804oec:TermLoanUSDMemberoec:TermLoanMember2019-12-310001609804oec:TermLoanEURMemberoec:TermLoanMember2019-12-31oec:guarantee0001609804oec:EulerHermesS.A.Member2019-12-310001609804oec:EulerHermesS.A.Member2018-12-310001609804oec:DeutscheBankAGMember2019-12-310001609804oec:DeutscheBankAGMember2018-12-310001609804oec:RubberMemberus-gaap:ProductConcentrationRiskMemberus-gaap:SalesRevenueNetMember2019-01-012019-12-310001609804oec:RubberMemberus-gaap:ProductConcentrationRiskMemberus-gaap:SalesRevenueNetMember2018-01-012018-12-310001609804oec:RubberMemberus-gaap:ProductConcentrationRiskMemberus-gaap:SalesRevenueNetMember2017-01-012017-12-310001609804us-gaap:ProductConcentrationRiskMemberus-gaap:SalesRevenueNetMemberoec:SpecialtiesMember2019-01-012019-12-310001609804us-gaap:ProductConcentrationRiskMemberus-gaap:SalesRevenueNetMemberoec:SpecialtiesMember2018-01-012018-12-310001609804us-gaap:ProductConcentrationRiskMemberus-gaap:SalesRevenueNetMemberoec:SpecialtiesMember2017-01-012017-12-310001609804oec:RubberMemberus-gaap:OperatingSegmentsMember2019-01-012019-12-310001609804us-gaap:OperatingSegmentsMemberoec:SpecialtiesMember2019-01-012019-12-310001609804us-gaap:CorporateNonSegmentMember2019-01-012019-12-310001609804oec:RubberMemberus-gaap:OperatingSegmentsMember2019-12-310001609804us-gaap:OperatingSegmentsMemberoec:SpecialtiesMember2019-12-310001609804us-gaap:CorporateNonSegmentMember2019-12-310001609804oec:RubberMemberus-gaap:OperatingSegmentsMember2018-01-012018-12-310001609804us-gaap:OperatingSegmentsMemberoec:SpecialtiesMember2018-01-012018-12-310001609804us-gaap:CorporateNonSegmentMember2018-01-012018-12-310001609804oec:RubberMemberus-gaap:OperatingSegmentsMember2018-12-310001609804us-gaap:OperatingSegmentsMemberoec:SpecialtiesMember2018-12-310001609804us-gaap:CorporateNonSegmentMember2018-12-310001609804oec:RubberMemberus-gaap:OperatingSegmentsMember2017-01-012017-12-310001609804us-gaap:OperatingSegmentsMemberoec:SpecialtiesMember2017-01-012017-12-310001609804us-gaap:CorporateNonSegmentMember2017-01-012017-12-310001609804oec:RubberMemberus-gaap:OperatingSegmentsMember2017-12-310001609804us-gaap:OperatingSegmentsMemberoec:SpecialtiesMember2017-12-310001609804us-gaap:CorporateNonSegmentMember2017-12-310001609804country:US2018-01-012018-12-310001609804country:US2017-01-012017-12-310001609804country:KR2019-01-012019-12-310001609804country:KR2018-01-012018-12-310001609804country:KR2017-01-012017-12-310001609804country:BR2019-01-012019-12-310001609804country:BR2018-01-012018-12-310001609804country:BR2017-01-012017-12-310001609804country:CN2019-01-012019-12-310001609804country:CN2018-01-012018-12-310001609804country:CN2017-01-012017-12-310001609804country:ZA2019-01-012019-12-310001609804country:ZA2018-01-012018-12-310001609804country:ZA2017-01-012017-12-310001609804oec:OtherMiscellaneousCountriesMember2019-01-012019-12-310001609804oec:OtherMiscellaneousCountriesMember2018-01-012018-12-310001609804oec:OtherMiscellaneousCountriesMember2017-01-012017-12-310001609804oec:OtherEuropeanCountriesMember2019-01-012019-12-310001609804oec:OtherEuropeanCountriesMember2018-01-012018-12-310001609804oec:OtherEuropeanCountriesMember2017-01-012017-12-310001609804oec:RubberMemberus-gaap:CustomerConcentrationRiskMemberus-gaap:SalesRevenueNetMemberoec:CustomerAMember2019-01-012019-12-310001609804oec:RubberMemberus-gaap:CustomerConcentrationRiskMemberus-gaap:SalesRevenueNetMemberoec:CustomerAMember2018-01-012018-12-310001609804oec:RubberMemberus-gaap:CustomerConcentrationRiskMemberus-gaap:SalesRevenueNetMemberoec:CustomerAMember2017-01-012017-12-310001609804country:DE2019-12-310001609804country:DE2018-12-310001609804country:SE2019-12-310001609804country:SE2018-12-310001609804country:IT2019-12-310001609804country:IT2018-12-310001609804country:PL2019-12-310001609804country:PL2018-12-310001609804oec:OtherEuropeanCountriesMember2019-12-310001609804oec:OtherEuropeanCountriesMember2018-12-310001609804srt:EuropeMember2019-12-310001609804srt:EuropeMember2018-12-310001609804country:US2019-12-310001609804country:US2018-12-310001609804country:KR2019-12-310001609804country:KR2018-12-310001609804country:ZA2019-12-310001609804country:ZA2018-12-310001609804country:BR2019-12-310001609804country:BR2018-12-310001609804country:CN2019-12-310001609804country:CN2018-12-310001609804oec:OtherMiscellaneousCountriesMember2019-12-310001609804oec:OtherMiscellaneousCountriesMember2018-12-31oec:related_party0001609804us-gaap:EquityMethodInvesteeMember2018-01-012018-12-310001609804us-gaap:PrincipalOwnerMember2018-01-012018-12-310001609804srt:AffiliatedEntityMember2019-12-310001609804srt:AffiliatedEntityMember2018-12-310001609804srt:AffiliatedEntityMember2019-01-012019-12-310001609804srt:AffiliatedEntityMember2018-01-012018-12-310001609804srt:AffiliatedEntityMember2017-01-012017-12-3100016098042019-01-012019-03-3100016098042019-04-012019-06-3000016098042019-07-012019-09-3000016098042019-10-012019-12-3100016098042018-01-012018-03-3100016098042018-04-012018-06-3000016098042018-07-012018-09-3000016098042018-10-012018-12-31
UNITED STATES SECURITIES AND EXCHANGE COMMISSION
Washington, D.C. 20549
FORM 10-K
| | | | | |
| ☒ | ANNUAL REPORT PURSUANT TO SECTION 13 OR 15(D) OF THE SECURITIES EXCHANGE ACT OF 1934 |
For the fiscal year ended December 31, 2019
OR
| | | | | |
| ☐ | TRANSITION REPORT PURSUANT TO SECTION 13 OR 15(d) OF THE SECURITIES EXCHANGE ACT OF 1934 |
For the transition period from _______________ to _______________
Commission file number 001-36563
ORION ENGINEERED CARBONS S.A.
(Exact name of registrant as specified in its charter)
| | | | | | | | | | | | | | |
| Grand Duchy of Luxembourg | | | 00-0000000 | |
(State or other jurisdiction of incorporation or organization) | | | (I.R.S. Employer Identification No.) | |
| | | | |
| 4501 Magnolia Cove Drive Suite 106 | Houston, | Texas | 77345 | |
(Address of Principal Executive Offices) | | | (Zip Code) | |
(281) 318-2959
Registrant's telephone number, including area code
Securities registered pursuant to Section 12(b) of the Act:
| | | | | | | | |
| Title of each class | Trading Symbol(s) | Name of each exchange on which registered |
| Common Shares, no par value | OEC | New York Stock Exchange |
Securities registered pursuant to section 12(g) of the Act:
________________________none_________________________
Indicate by check mark if the registrant is a well-known seasoned issuer, as defined in Rule 405 of the Securities Act.
Yes x No o
Indicate by check mark if the registrant is not required to file reports pursuant to Section 13 or Section 15(d) of the Act.
Yes o No x
Indicate by check mark whether the registrant: (1) has filed all reports required to be filed by Section 13 or 15(d) of the Securities Exchange Act of 1934 during the preceding 12 months (or for such shorter period that the registrant was required to file such reports); and (2) has been subject to such filing requirements for the past 90 days. Yes x No o
Indicate by check mark whether the registrant has submitted every Interactive Data File required to be submitted pursuant to Rule 405 of Regulation S-T (§232.405 of this chapter) during the preceding 12 months (or for such shorter period that the registrant was required to submit such files).
Yes x No o
Indicate by check mark whether the registrant is a large accelerated filer, an accelerated filer, a non-accelerated filer, a smaller reporting company, or an emerging growth company. See the definitions of “large accelerated filer,” “accelerated filer”, "smaller reporting company" and “emerging growth company” in Rule 12b-2 of the Exchange Act.
| | | | | | | | | | | |
| Large accelerated filer | x | Accelerated filer | ☐ |
Non-accelerated filer | ☐ | Smaller reporting company | ☐ |
| | Emerging growth company | ☐ |
If an emerging growth company, indicate by check mark if the registrant has elected not to use the extended transition period for complying with any new or revised financial accounting standards provided pursuant to Section 13(a) of the Exchange Act.
☐
Indicate by check mark whether the registrant is a shell company (as defined in Rule 12b-2 of the Act). Yes ☐ No x
The aggregate market value of voting and non-voting common equity held by non-affiliates, based upon the closing price for the common shares, as reported on the New York Stock Exchange on the last business day of the registrant’s most recently completed second fiscal quarter, of $21.41, was approximately $1.3 billion.
The registrant had outstanding 60,224,147 shares of common stock as of February 19, 2020.
DOCUMENTS INCORPORATED BY REFERENCE
Portions of the Registrant's definitive proxy statement for the 2020 annual meeting of shareholders.
TABLE OF CONTENTS
CERTAIN DEFINED TERMS
In this annual report, unless otherwise specified or if the context so requires:
•References in this report to “Orion,” the “Group,” the “Orion Group,” the “Company,” “we,” “us” or “our” are to Orion Engineered Carbons S.A.; a Luxembourg joint stock corporation (société anonyme); and its consolidated subsidiaries;
•References in this report to “Kinove Holdings” are to Kinove Luxembourg Holdings 1 S.à r.l., a Luxembourg limited liability company (société à responsabilité limitée), our previous principal shareholder which was owned by investment funds managed by affiliates of Rhône Capital L.L.C., investment funds managed directly or indirectly by Triton Managers III Limited and TFF III Limited and Luxinva S.A., a wholly-owned subsidiary of the Abu Dhabi Investment Authority, a public institution wholly-owned by the Government of the Emirate of Abu Dhabi;
•References in this report to “Luxco Coinvest” are to Kinove Luxembourg Coinvestment S.C.A., a liquidated investment vehicle previously owned by members of the Company’s management;
•References to the “Acquisition” are to the acquisition of the carbon black business line from Evonik Industries AG, completed on July 29, 2011; and
•References to the “Credit Agreement” are to the Credit Agreement, dated as of July 25, 2014, among the Company, Orion Engineered Carbons Holdings GmbH, Orion Engineered Carbons Bondco GmbH, Orion Engineered Carbons GmbH, OEC Finance US LLC, the revolving borrowers named therein, the guarantors named on the signature page thereto, the lenders named therein, and Goldman Sachs Bank USA as administrative agent, as amended.
•Reference to “Evonik” are to Evonik Industries AG, Germany, Evonik Degussa GmbH, Germany and any affiliated companies.
PRESENTATION OF CERTAIN FINANCIAL AND OTHER INFORMATION
The financial statements included in this report have been prepared in accordance with accounting principles generally accepted in the United States (“U.S. GAAP” or “GAAP”).
Non-GAAP Financial Measures
In this report, we present certain financial measures that are not recognized by GAAP and that may not be permitted to appear on the face of GAAP-compliant financial statements or notes thereto.
The non-GAAP financial measures used in this report are Contribution Margin, Contribution Margin per Metric Ton (collectively, “Contribution Margins”), Adjusted EBITDA, Net Working Capital and Capital Expenditures. We define Contribution Margin as revenue less variable costs (such as raw materials, packaging, utilities and distribution costs). We define Contribution Margin per Metric Ton as Contribution Margin divided by volume measured in metric tons. We define Adjusted EBITDA as operating result (EBIT) before depreciation and amortization, adjusted for acquisition related expenses, restructuring expenses, consulting fees related to Company strategy, share of profit or loss of joint venture and certain other items. Adjusted EBITDA is defined similarly in the Credit Agreement. Adjusted EBITDA is used by our management to evaluate our operating performance and make decisions regarding allocation of capital because it excludes the effects of items that have less bearing on the performance of our underlying core business. We define Net Working Capital as inventories plus current trade receivables minus trade payables. We define Capital Expenditures as cash paid for the acquisition of intangible assets and property, plant and equipment as shown in the consolidated financial statements.
We also use Segment Adjusted EBITDA Margin, which we define as Adjusted EBITDA for the relevant segment divided by the revenue for that segment.
We use Adjusted EBITDA, Contribution Margins and Net Working Capital, as well as Adjusted EBITDA by segment and Segment Adjusted EBITDA Margin, as internal measures of performance to benchmark and compare performance among our own operations. We use these measures, together with other measures of performance under GAAP, to compare the relative performance of operations in planning, budgeting and reviewing the performance of our business. We believe these measures are useful measures of financial performance in addition to consolidated net income for the period, income from operations (EBIT) and other profitability measures under GAAP because they facilitate operating performance comparisons from period to period and company to company and, with respect to Contribution Margin, eliminate volatility in feedstock prices. By eliminating potential differences in results of operations between periods or companies caused by factors such as depreciation and amortization methods, historic cost and age of assets, financing and capital structures and taxation positions or regimes, we believe that Adjusted EBITDA can provide a useful additional basis for comparing the current performance of the underlying operations being evaluated. For these reasons, we believe EBITDA-based measures are often used by the investment community as a means of comparison of companies in our industry. By deducting variable costs (such as raw materials, packaging, utilities and distribution costs) from revenue, we believe that Contribution Margins can provide a useful basis for comparing the current performance of the underlying operations being evaluated by indicating the portion of revenue that is not consumed by these variable costs and therefore contributes to the coverage of all costs and profits.
Different companies and analysts may calculate measures based on EBITDA, contribution margins and working capital differently, so making comparisons among companies on this basis should be done carefully. Adjusted EBITDA, Contribution Margins and Net Working Capital are not measures of performance under GAAP and should not be considered in isolation or construed as substitutes for revenue, consolidated net income for the period, income from operations (EBIT), gross profit and other GAAP measures as an indicator of our operations in accordance with GAAP.
Reconciliation of Non-GAAP Financial Measures
The non-GAAP financial measures contained in this report are unaudited and have not been prepared in accordance with GAAP or the accounting standards of any other jurisdiction and may not be comparable to other similarly titled measures of other companies. For a reconciliation of these non-GAAP financial measures to the most directly comparable GAAP measures, see “Item 7. Management's Discussion and Analysis of Financial Condition and Results of Operations—Reconciliation of non-GAAP Financial Measures.”
NOTE REGARDING FORWARD-LOOKING STATEMENTS
This report contains and refers to certain forward-looking statements with respect to our financial condition, results of operations and business. These statements constitute forward-looking statements within the meaning of Section 21E of the Securities Exchange Act of 1934, as amended (the “Exchange Act”). Forward-looking statements are statements of future expectations that are based on management’s current expectations and assumptions and involve known and unknown risks and uncertainties that could cause actual results, performance or events to differ materially from those expressed or implied in these statements. Forward-looking statements include, among others, statements concerning the potential exposure to market risks, statements expressing management’s expectations, beliefs, estimates, forecasts, projections and assumptions and statements that are not limited to statements of historical or present facts or conditions.
Forward-looking statements are typically identified by words such as “anticipate,” “assume,” “assures” “believe,” “confident,” “could,” “estimate,” “expect,” “intend,” “may,” “plan,” “objectives,” “outlook,” “probably,” “project,” “will,” “seek,” “strong,” “target”
“to be,” and other words of similar meaning. These forward-looking statements include, without limitation, statements about the following matters:
•our strategies for (i) strengthening our position in specialty carbon blacks and rubber carbon blacks, (ii) increasing our rubber carbon black margins and (iii) strengthening the competitiveness of our operations;
•the ability to pay dividends at current dividend levels or at all;
•cash flow projections;
•the installation of pollution control technology in our U.S. manufacturing facilities pursuant to the EPA consent decree described herein;
•the outcome of any in-progress, pending or possible litigation or regulatory proceedings; and
•our expectation that the markets we serve will continue to grow.
All these forward-looking statements are based on estimates and assumptions that, although believed to be reasonable, are inherently uncertain. Therefore, undue reliance should not be placed upon any forward-looking statements. There are important factors that could cause actual results to differ materially from those contemplated by such forward-looking statements. These factors include, among others:
•negative or uncertain worldwide economic conditions;
•volatility and cyclicality in the industries in which we operate;
•operational risks inherent in chemicals manufacturing, including disruptions as a result of severe weather conditions and natural disasters;
•our dependence on major customers and suppliers;
•our ability to compete in the industries and markets in which we operate;
•our ability to address changes in the nature of future transportation and mobility concepts which may impact our customers and our business
•our ability to develop new products and technologies successfully and the availability of substitutes for our products;
•our ability to implement our business strategies;
•volatility in the costs and availability of raw materials (including but not limited to any and all effects from restrictions imposed by the MARPOL convention and respective International Maritime Organization (IMO) regulations in particular to reduce sulfur oxides (SOx) emissions from ships) and energy;
•our ability to respond to changes in feedstock prices and quality;
•our ability to realize benefits from investments, joint ventures, acquisitions or alliances;
•our ability to realize benefits from planned plant capacity expansions and site development projects and the potential delays to such expansions and projects;
•information technology systems failures, network disruptions and breaches of data security;
•our relationships with our workforce, including negotiations with labor unions, strikes and work stoppages;
•our ability to recruit or retain key management and personnel;
•our exposure to political or country risks inherent in doing business in some countries;
•geopolitical events in the European Union, and in particular the ultimate future relations between the European Union and the United Kingdom resulting from the “Brexit” which may impact the Euro;
•environmental, health and safety regulations, including nanomaterial and greenhouse gas emissions regulations, and the related costs of maintaining compliance and addressing liabilities;
•possible future investigations and enforcement actions by governmental or supranational agencies;
•our operations as a company in the chemical sector, including the related risks of leaks, fires and toxic releases;
•market and regulatory changes that may affect our ability to sell or otherwise benefit from co-generated energy;
•litigation or legal proceedings, including product liability and environmental claims;
•our ability to protect our intellectual property rights and know-how;
•our ability to generate the funds required to service our debt and finance our operations;
•fluctuations in foreign currency exchange and interest rates;
•the availability and efficiency of hedging;
•changes in international and local economic conditions, including with regard to the Euro, dislocations in credit and capital markets and inflation or deflation;
•potential impairments or write-offs of certain assets;
•required increases in our pension fund contributions;
•the adequacy of our insurance coverage;
•changes in our jurisdictional earnings mix or in the tax laws or accepted interpretations of tax laws in those jurisdictions;
•our indemnities to and from Evonik (as defined below);
•challenges to our decisions and assumptions in assessing and complying with our tax obligations; and
•potential difficulty in obtaining or enforcing judgments or bringing actions against us in the United States.
In light of these risks, our results could differ materially from the forward-looking statements contained in this report and no undue reliance should be placed on those forward-looking statements. For further information regarding factors that could affect our business and financial results and the related forward-looking statements, see “Item 1A. Risk Factors.”
PART I
Item 1. Business
Overview
We are a leading global producer of carbon black. Carbon black is a form of carbon used to improve certain properties of materials into which it is added. It is used as a pigment and as a performance additive in coatings, polymers, printing and special applications (specialty carbon black) and in the reinforcement of rubber in tires and mechanical rubber goods (rubber carbon black).
We are one of the largest global producers of carbon black and our business is divided into two segments: Specialty Carbon Black and Rubber Carbon Black.
We operate a global supply chain network currently comprising 13 wholly owned production facilities in Europe, North and South America, Asia and South Africa and three sales companies, as well as one jointly-owned production plant in Germany.
Products and Applications
We have a diversified carbon black production platform across the Specialty Carbon Black and Rubber Carbon Black operating segments. In 2019, we offered more than 280 specialty carbon black grades and approximately 60 rubber carbon black grades under a number of well-recognized brand names and trademarks. Our product portfolio is one of the broadest in the industry. Our product and geographic diversity exposes us to a wide variety of applications and industries, which in turn lowers our dependency on individual customers or regions. Our overall product portfolio benefits from higher margin specialty, certain technically superior grade rubber carbon black products (technical grade rubber black) and stable margin rubber carbon black products.
We continuously strive to meet our customers’ changing demands and adjust our products accordingly, as well as to enhance our product portfolio with innovations. In our Specialty Carbon Black segment, we have launched over the years several new post-treated specialty carbon black grades for coatings and printing applications, as well as several new high purity carbon black grades for the fiber industry and conductive carbon black grades for polymers, printing and new markets, such as for battery electrodes. In our Rubber Carbon Black segment, we have developed in the past two product families: PUREX® for mechanical rubber goods (“MRG”) applications, which complies with high cleanliness requirements, and ECORAX® for tires, which is characterized by improved tire properties of wear and fuel consumption.
Specialty Carbon Black
Overview
We are one of the largest global producers of specialty carbon black with an estimated share of global industry sales of approximately 24% in 2019 measured by volume in kmt. We manufacture specialty carbon black at multiple sites for a broad range of specialized applications. Specialty carbon black imparts specific characteristics, such as high-quality pigmentation, UV light protection, viscosity control and electrical conductivity.
In 2019, our Specialty Carbon Black segment generated $508.5 million in revenues, 251.0 kmt in volume, $122.2 million in Segment Adjusted EBITDA and Segment Adjusted EBITDA Margin of 24.0%. The Specialty Carbon Black segment has a product mix divided into four sectors: Coatings, Polymers, Printing and Special Applications. In 2019, Polymer applications accounted for about 69% of our volume measured in kmt, Printing accounted for nearly 15%, while Coatings, Special Applications and cross-sector sales to distributors represented the remainder.
Our Specialty Carbon Black segment generates higher margins per metric ton than our Rubber Carbon Black segment, with the highest margin per metric ton in Coatings. We believe the key driver of attractive margins in specialty carbon black is innovation supported by our innovation group, which works in close coordination with our customers and technical marketing support. We provide assistance to our customers through the whole value chain, including product formulation, technical support, product handling, packaging, logistics, supply chain management and final application.
We are recognized by our customers as a leading innovator and manufacturer of customized products fitting specific application needs. Our specialty carbon black customer base is relatively diverse, with the top five customers accounting for approximately 26% of the Specialty Carbon Black segment volume in 2019. We have been supplying most of our key industry customers for more than 30 years.
Coatings
Product and Application Portfolio
We have a broad Coatings product portfolio, which includes products used for pigmentation in black coatings and enhancement of other coatings (for example, in automotive basecoats and architectural coatings), for conductivity and for tinting in all other coatings, as well as for paints and for light tinting in transparent coatings (for example, for metallic effects and wood glazing). The variety of our
manufacturing processes allows the creation of specialty carbon black with different morphological and chemical properties, thereby giving some of our products unique characteristics.
The following table provides examples of our Coatings applications.
| | | | | | | | | | | | | | | | | | | | |
| Coatings | | Automotive | | General Industrial | | Architectural & Decorative |
| Applications | | Automotive original
equipment manufacturing
Automotive refinish
Automotive parts | | Wood, coil and plastic coatings
Protective and marine
Aerospace Packaging | | Architectural
Decorative |
| Attributes | | Pigmentation, high
jetness and blue
undertone, conductivity | | High-performance tinting
Conductivity | | Tinting |
| Brands | | PRINTEX® NEROX® LAMP BLACK COLOUR BLACK SPECIAL BLACK | | PRINTEX® NEROX® LAMP BLACK COLOUR BLACK SPECIAL BLACK | | PRINTEX® NEROX® LAMP BLACK COLOUR BLACK SPECIAL BLACK |
Customers
We believe that the global Coatings industry consists of a few key suppliers that account for approximately half of the global Coatings capacity. Over time we have demonstrated to leverage our application technology platform to play a substantial role in our Coatings customer's product innovation process and to meet their demanding requirements. The customized nature of Coatings products leads to attractive margins in the industry.
We supply many of the Coatings industry’s key industry players and mid-sized customers and have longstanding relationships with several major global customers. We have been serving several of the key industry players for more than 30 years. The Coatings market is relatively fragmented, although our top five customers accounted for approximately 38% of Coatings volume in 2019.
Polymers
Product and Application Portfolio
Polymers are the largest end-use market for specialty carbon blacks. Our Polymer portfolio is one of the broadest in the industry and, supported by an application technology platform, enables us to cover most of the product demand spectrum.
Our Polymers portfolio is tailored to meet specific industry and customer needs. For example, potable water pipes made of polyethylene, agricultural films, cables and other articles exposed to UV radiation (sunlight) need to be protected against polymer degradation and subsequent deterioration of mechanical strength. We offer tailor-made products that not only provide efficient UV protection but also provide additional benefits, such as good processing properties and easy handling. Products offered also meet special performance criteria, including food-contact compliance and spin-fiber quality.
In addition to UV protection, our portfolio includes products from standard- to high-performance grades designed and modified to provide electrical conductivity, antistatic and reinforcing properties to many different polymer articles, including high-voltage cables, films, boxes and high pressure pipes.
Our portfolio offering targeted at fiber products and technology represents a growth area and provides a combination of a broad range of jetness with good spinnability. Certain of our polymer products have a bluish undertone, which makes these grades especially attractive for high-performance fibers in textiles, with luxury touch and feel. Ultra clean products provide good process stability during the small and thin fiber manufacturing processes.
The following table provides examples of our polymers applications.
| | | | | | | | | | | | | | | | | | | | | | | | | | | | | | | | | | | | | | | | | | | | |
| Polymers | | Pipe | | Wire & Cable | | Films | | Blow &
Injection
Molding | | Fiber | | Thermal
Insulation | | Other |
| Applications | | Pressure pipes (water, gas) Irrigation Sewage pipes Conductive pipes/hoses | | Power cables (LV to HV) Jacketing | | Agricultural Packaging Geomembrane Foil Laminations | | Packaging Housing Container Automotive | | Textile Industrial Non-Woven | | Construction | | Thermosets TPE profiles Plastics |
| Attributes | | Dispersibility UV protection Conductivity | | Dispersibility UV protection Conductivity | | Dispersibility UV protection Coloring | | Dispersibility UV protection Conductivity | | Dispersibility Coloring | | IR absorption | | Thixotrophy Dispersibility Coloring Reinforcing UV protection |
| Brands | | PRINTEX® AROSPERSE HIBLACK® | | PRINTEX® HIBLACK® | | PRINTEX® AROSPERSE HIBLACK® | | PRINTEX® AROSPERSE HIBLACK® | | PRINTEX® AROSPERSE COLOUR BLACK | | LAMP BLACK AROSPERSE | | PRINTEX® AROSPERSE HIBLACK® LAMP BLACK |
Customers
Due to the diverse nature of Polymer applications (construction, general industrial, engineering, consumer goods, automotive and packaging), the customer base for Polymers tends to be wide-ranging from regional and international master batch producers to global integrated petrochemical and polyolefin producers. We supply many of the plastics industry’s customers and supply leading customers in each region. We have been serving certain of our key customers for more than 30 years. Our top five customers accounted for approximately 34% of Polymers volume in 2019.
Printing
Product and Application Portfolio
We have a broad Printing product portfolio with a large number of grades for different printing technologies and applications. We apply different process technologies to offer highly specialized products that meet specific requirements, including compliance with food-contact regulations and specially formulated products with different coloristic properties (such as undertone, optical density and gloss), rheological effects and dispersibility functions.
We focus on Printing products with the highest potential for specialty applications, such as packaging and specialty niches. Consequently, relatively low-end newspaper and other print media applications represented only a small portion of our overall specialty carbon black sales in 2019. Producers must meet and balance numerous technical properties. These properties include ease of dispersion, processing, handling, formulation requirements, final product performance hold-out, rub resistance and, most importantly, coloristic properties, such as optical density, gloss, light-fastness and color tone. Our specialty carbon black product portfolio supports printing ink manufactures in achieving these attributes.
Packaging inks require special rheology, dispersion and wetting behavior properties. For example, UV curing inks on nonporous substrates require special surface chemistry for wetting, flow, color and stability.
The following table provides examples of our printing applications.
| | | | | | | | | | | | | | | | | | | | | | | | | | | | | | | | | | | | | | | | | | | | |
| | Packaging | | | | | | Print Media | | | | | | |
| Printing | | High-end
Packaging | | Packaging | | Display
Advertising | | Publication
(magazines) | | Special
Applications | | Books, Posters,
Brochures | | Newspaper |
| Applications | | Liquid inks
UV curing
Sheetfed
Screen | | Liquid inks | | Heatset
Sheetfed
Screen | | Heatset
Sheetfed
Publication
gravure | | Screen
Water-
based
gravure UV
curing | | Sheetfed
UV curing | | Water-based
flexo Coldset |
| Attributes | | Coloring
Gloss Food
contact
regulations
Wettability | | Coloring | | Coloring
Gloss
Moderate
flow
Wettability | | Coloring
Gloss
Good flow
Low abrasion | | Coloring
Gloss
Moderate
flow
Wettability | | Coloring
Gloss
Moderate
flow
Wettability | | Coloring |
| Brands | | NEROX® PRINTEX® SPECIAL BLACK | | PRINTEX® HIBLACK® | | NEROX® HIBLACK® PRINTEX® SPECIAL BLACK | | PRINTEX® HIBLACK® | | PRINTEX® SPECIAL BLACK | | PRINTEX® SPECIAL BLACK | | PRINTEX® HIBLACK® |
Customers
The global Printing industry has been undergoing consolidation over the past few years. Currently, the industry is dominated by a few key players. Sourcing decisions are largely based on specialty carbon black product attributes. For low-end applications, decisions are made based primarily on price. For high-end applications, the required degree of product and technology know-how makes purchasing decisions less price sensitive. We play an important role in helping our customers develop customized Printing solutions and are recognized by customers as a preferred strategic and technical partner. We have been serving certain of our key customers for more than 30 years. Due to the relatively consolidated nature of the Printing industry, our top five Printing customers accounted for approximately 63% of Printing volume in 2019.
Special Applications
The Special Applications product category comprises applications not included into our Coatings, Polymers and Printing portfolios, such as, silicones, non-woven textile, building materials, battery electrodes metallurgical, agrochemicals and carbon brushes. Our top five customers accounted for approximately 37% of Special Applications volume in 2019.
Distribution
We sell most of our specialty carbon black products directly to our customers and only a smaller part of our sales is made via external channel partners and distributors. External channel partners and distributors generally sell our products in smaller lots to smaller customers, who do not negotiate with us directly. These sales are made across all our specialty carbon black applications, including Coatings, Polymers, Printing and Special Applications.
Competition
We are one of the largest global producers of specialty carbon black with an estimated share of global industry sales of approximately 24% measured by volume in kmt in 2019. Cabot and Birla are the other two large global producers of specialty carbon black. Each of the top three producers of specialty carbon black leverages R&D and applications technology platforms to tailor products to customer needs and to introduce its products into new application niches.
Rubber Carbon Black
Overview
We are one of the largest global producers of rubber carbon black. Rubber carbon black sales are largely regional, since transportation costs are high relative to sales price. In 2019, our largest rubber carbon black customer accounted for approximately 20% and the second largest customer for approximately 10% of our rubber carbon black segment net sales with no other customer exceeding 10% of our segment net sales. The largest rubber carbon black customer (Michelin) accounted in addition for approximately 13% of the Company's overall consolidated net sales with no other customer exceeding 10% of our Company's net sales.
In 2019, our Rubber Carbon Black segment generated $967.9 million in revenues, 772.1 kmt in volume, $145.2 million in Segment Adjusted EBITDA and Segment Adjusted EBITDA Margin of 15.0%. Rubber carbon black is primarily used for reinforcement of rubber compounds and to adjust specific performances of rubber articles. Based on the application of rubber carbon black, we have divided the Rubber Carbon Black segment into two categories: Tires and Mechanical Rubber Goods (MRG).
Tires
Product and Application Portfolio
We offer a broad Tire product portfolio, which includes high reinforcing grades and semi-reinforcing grades. Fine particle reinforcing grade carbon blacks are used mostly in the tread of tires. Other reinforcing grade carbon blacks are also used in different components of the tire carcass. In addition to standardized grades, we produce advanced grades tailored to meet specific customer performance requirements, such as ECORAX® grades designed to lower rolling resistance and HP grades for truck tires and high- and ultra-high-performance passenger car tires. Semi-reinforcing grade carbon blacks are used in several components of the tire carcass like sidewall and bead area. We cover the full portfolio of standard semi-reinforcing grade carbon blacks and have a portfolio of special semi-reinforcing grade carbon blacks, which fulfill special customer requirements using special production technology. These special semi-reinforcing grade carbon blacks are part of our ECORAX® product family.
Customers
Given the highly consolidated nature of the tire industry, our top ten customers represented slightly more than 85% of our tires volume in 2019. A significant portion of our Tire products are sold to leading tire manufacturers. We have longstanding relationships with most of these customers and have the capacity to serve them in major global regions. We have been serving certain of our key customers for more than 30 years.
We believe that our customers value the quality, consistency and reliability of our operations and are generally reluctant to switch suppliers without due cause. In addition, because automotive tires have safety implications, tire manufacturers are often required to go through lab and extensive plant approval processes before they change their supplier of carbon black.
Mechanical Rubber Goods
Product and Application Portfolio
We produce a wide range of mechanical rubber goods products for a variety of end-uses, including automotive production, construction, manufacturing of wires and cables, as well as certain food, consumer and medical applications. Our MRG products can be divided into four main groups: (i) standardized ASTM furnace grades, (ii) specialized ASTM furnace grades, (iii) specialized non-ASTM furnace grades and rubber carbon blacks from special production processes lampblack (Durex O) and (iv) thermal black (N990) and gas black (CK3). In the field of special ASTM and non-ASTM blacks we offer an extensive portfolio of “PUREX®” grades. These grades are mainly used in automotive rubber parts like window sealings and hoses. These grades have an exceptionally high purity, high consistency and can be dispersed well in rubber compounds. The grades of the PUREX® family aiming at the adjustment of special requirements like smooth surface, special surface appearance of sealing systems, electrical resistance and other specific requirements. The trend towards light weight construction of cars and the resulting use of aluminum require more attention to electrical resistivity of MRG parts.
The following table presents examples of our mechanical rubber goods applications.
| | | | | | | | | | | | | | | | | | | | | | | | | | | | | | | | | | | | | | | | | | | | |
Mechanical Rubber Goods | | Transportation
Construction
and Others | | | | Automotive | | | | Conductive & Isolation | | | | Food &
Medical |
| Applications | | Conveyor belts Construction profiles Mechanical rubber goods | | Extruded and other profiles | | Damping elements Hoses Transmission belts | | Molded goods with high resistance | | Seals rubber- to-metal bonding Unvulcanized sheets and adhesives | | Electrically conductive and antistatic rubber goods | | Profiles Tubing Hoses Sealings |
| Attributes | | Tensile strength Tear and abrasion resistance Reinforcement | | Filler loading Compression Smooth surfaces Processability Consistency | | Processability Injection molding and calendaring | | Low hysteresis Reinforcement Processing | | Scorch safety Tensile strength | | Electrical conductivity or antistatic behavior | | Dispersion Filler loadings |
| Brands | | CORAX® | | PUREX® DUREX® CORAX® N990 | | CORAX® PUREX® DUREX® | | PUREX® | | CK 3 | | PRINTEX® CORAX® PUREX® | | PUREX® CORAX® N990 |
Customers
We serve customers across the entire value chain and MRG applications, including compounders, parts and component manufacturers and automotive system suppliers. The mechanical rubber goods industry is fragmented in nature and supports a large number of suppliers. The industry, however, is undergoing a consolidation process. Our top ten global customers accounted for approximately 50% of our mechanical rubber goods volume in 2019. We have a diversified geographic presence with significant exposure to the European, North and South American and Asian MRG markets. We supply various key industry customers and have longstanding relationships with several of them. We have been serving certain key customers for more than 30 years.
Competition
We are one of the largest global producers of rubber carbon black in the world while Cabot, Birla and Black Cat were the three largest global producers of rubber carbon black in 2019.
Rubber carbon black sales are largely regional, since transportation costs are high relative to sales price. As a result, the global rubber carbon black industry is more fragmented compared to the specialty carbon black industry. The smaller regional suppliers participate mainly in standard tire and mechanical rubber goods applications and are less prevalent in more specialized products for the higher-end tire and mechanical rubber goods applications.
Procurement and Raw Materials
In 2019, raw materials accounted for 75% of our cost of sales. Approximately 79% of the cost of raw material used in the production of carbon black is related to petroleum-based or coal-based feedstock known as carbon black oil, with some limited use of other raw materials, such as nitrogen tetroxide, hydrogen, natural gas and acetylene. Carbon black oil comes from three main sources: (i) fluid catalytic cracking bottoms, a by-product of fuel producing refineries, (ii) steam cracker tar, a by-product of ethylene producing crackers, and (iii) certain coal tar products.
Efficient procurement of carbon black oil is an important factor in achieving optimal production costs and profitability. Our carbon black oil procurement strategy entails global sourcing of carbon black oil, using proprietary optimization tools to maximize value.
Approximately 50% of our carbon black oil supply is covered by short- and long-term contracts with a wide variety of suppliers.
The pricing of carbon black oil is typically indexed to the price of fuel oil. In general, we benchmark against Platts indices in the sourcing regions e.g. USGC, New York, Rotterdam and Singapore. In some areas the Gasoil index is used. While the majority of our purchases are based on underlying fuel oil indices, the ultimate carbon black oil price also depends on carbon black oil specific quality characteristics, differentials (premiums or discounts to Platts indices), freight costs and region-specific supply and demand as well as regulatory factors. Carbon black oil procurement is an important factor in achieving best-in-class production costs.
Characteristics of Production Capability
Production Know-how
With exception of our plant in France, we produce rubber carbon black at all, and specialty carbon blacks at many, of our production sites. We have the production know-how to manufacture a wide range of specialty carbon blacks and rubber carbon blacks worldwide. We believe we are currently the only supplier with core production competencies across all leading production processes (furnace black, gas black, lamp black, thermal black and acetylene black). This provides us flexibility to offer a wide range of specialty carbon black and rubber carbon black products that are best suited to customers’ needs.
Location of Production Facilities
Our production sites are strategically located throughout the world in all major regions. This is important for our rubber carbon black business, which is largely regional. Since specialty carbon black’s freight costs represent a smaller component of the final cost (relative to rubber carbon black), it is commercially viable to ship specialty carbon blacks across geographic regions from our key production sites in Germany, South Korea, China and the United States. The regional spread of our production network also offers access to high-growth regions globally.
Flexibility of Asset Base
We have implemented a flexible and intelligent production and supply chain network under the concept of operating all regional production sites as one large virtual plant. This allows us to shift production of specialty carbon black and rubber carbon black among different plants in order to optimize costs and plant utilization. In most cases, more than one plant is approved by our customers for specific products, which not only increases production flexibility but also ensures a higher supply security for customers.
Innovation
We enjoy a long-standing reputation within the industry for carbon black product and process technology, applications knowledge, and innovation. Carbon black products are highly versatile and meet specific performance requirements across many industries. This creates significant opportunities for product and process innovation. The final properties of the carbon black product depend on the mixture of raw materials used and to a large extent on the configuration and operating conditions of the specific reactor and the further processing of the initial product in beading, drying and after-treatment steps. Minimal changes to just one of the many process parameters can result in completely different carbon black products with different properties and potential end uses.
We maintain multiple product applications and process development centers in Europe, Asia and the Americas. Our innovation group is divided into applications technology and process development teams. The applications technology team works closely with our major clients to develop innovative products and expand the applications range for carbon black products. Success in applications development deepens our understanding of customer and industry requirements gained through these interactions. The process development team works closely with our manufacturing and procurement teams to enhance company competitiveness. This team focuses on efforts that lead to improved production processes, improved product quality and improved cost structure.
Our leading competence center is located in Cologne (Germany) to support and enhance our global innovation group activities. This center includes carbon black technologists, applications technology laboratories and process development staff, co-located with our pilot process development facilities. Staffing in our Cologne technical center includes physicists, chemists and engineers who can effectively and efficiently collaborate to create and analyze various carbon black properties with a goal to develop new products to meet customer requirements. Common processes and information technology tools further enhance coordination and communication with our regional technical centers located in South Korea, China and the United States.
Applications Technology
Our goal is to remain at the forefront of the industry in terms of product development by having dedicated applications technology facilities. Success relies on close collaboration with customers, often through long-term R&D alliances, which create superior technical interfaces. These interactions enable us to develop tailored solutions and meet unique customer requirements.
Our applications technology teams bring together a deep knowledge of carbon black technology with an understanding of the key applications practiced by our customers. This team has access to extensive laboratory and testing facilities using similar formulations, processing and test methods employed by our customers.
Applications technology plays a supporting role in the process of new product launch by providing technical data and presentations, training and support and establishment and monitoring of quality targets. The application technology team works closely with customers to provide support during the qualification cycle, which can be long and may last over one year. This close cooperation decreases the likelihood of customers switching suppliers once a product has been approved.
Process Development
We believe our process development capabilities represent a key competitive advantage. Product customization relies upon extensive process capabilities. Unique products and products that are difficult to replicate add value to customers’ end-products. Our customers have come to rely upon a continuous improvement in product quality and performance. Process development also enables improvements in manufacturing costs and efficiencies.
Our innovation group also operates pilot plants (small scale production facilities used for real-world trials of new carbon black grades) and a family of mini plants which include a smaller furnace reactor for basic studies as well as various facilities for chemical after-treatment, granulation and drying to tailor new products to specific customer requirements, especially in the specialty carbon black area
Spending on innovation, including both applications technology and process development, amounted to $19.9 million in 2019, $20.3 million in 2018 and $18.2 million in 2017 and was mostly directed towards the development of new specialty carbon black products, new applications for carbon black products and the improvement of process efficiencies as well as reduction of emission levels.
Marketing, Sales and Customer Contracts
We have an integrated sales and marketing process that combines key management, regional sales and technical marketing and applications support. This allows us to focus on customer solutions tailored to particular industries or regions.
Sales
Our Sales department is organized into two main groups: Key Account Management and Regional Sales. The Key Account Management team deals with the largest customers and has dedicated sales people by global account. The Regional sales team covers all other customers located in Europe, the Middle East and Africa, in the Americas and in Asia-Pacific. The field sales force operates along geographical regions. In addition to selling carbon black directly, we work with third-party distributors serving our markets with all required smaller volume lots.
Contracts
Most of our long-term contracts contain formula-driven price adjustment mechanisms for changes in raw material and/or energy costs and in some, foreign exchange rates. We sell carbon black under the following two main categories of contracts based on price adjustment mechanisms:
•Contracts with feedstock adjustments (indexed contracts). This category includes contracts with monthly or, in some cases, quarterly automatic feedstock and/or energy costs adjustments, which cover approximately 75% of our global volumes.
•Non-indexed contracts. This category includes short-term contracts (usually shorter than three months) where sales prices of our carbon black products are not linked to carbon black oil market prices.
Many of our indexed contracts allow for monthly price adjustments, while a small portion (by volume sold) allow for quarterly price adjustments. We believe that these contracts have enabled us generally to maintain our Segment Adjusted EBITDA Margins; however, rapid and significant oil or energy price fluctuations have had and are likely to continue to have significant and varying effects on our earnings and results of operations, partly because oil price changes affect our sales prices and our cost of raw materials and energy at different times and amounts, and partly due to other factors, such as differentials affecting the ultimate carbon black oil prices paid by us (versus a particular reference price index), actual carbon black oil usage amounts and our ongoing efficiency initiatives. See “Item 7. Management's Discussion and Analysis of Financial Condition and Results of Operations—Key Factors Affecting Our Results of Operations—Raw Material and Energy Costs” as well as “Item 1A. Risk Factors—Risks Related to Our Business—We are subject to volatility in the costs and availability of raw materials and energy, which could decrease our margins and adversely affect our business, financial condition, results of operations and cash flows.” Sales prices under non-indexed contracts are reviewed on a regular basis to reflect raw material and energy price fluctuations as well as overall market conditions.
Outbound Logistics and Distribution
Our outbound logistics and distribution function has critical importance given the high cost involved in the transportation of carbon black, in particular rubber carbon black. Each of our plants has different logistics demands based on the products manufactured and the region’s export requirements. Unlike rubber carbon blacks, which are mostly sold regionally, specialty carbon blacks are sold globally, since freight costs typically represent a smaller component of the final price. Europe, North America and South Korea, which export high volumes of specialty carbon black, have complex and demanding logistics requirements. Other regions, such as South Africa and Brazil, are relatively self-contained with the vast majority of production sold within the respective countries.
The primary method of the carbon black transportation to customers is by truck and rail. The majority of the regions use primarily trucks, with the exception of the United States, where rail transport accounts for approximately half of transportation modes. We lease the majority of our rail cars and have a variety of third-party agreements with railroad companies for the management of vehicles.
Intellectual Property
We consider intellectual property development and management as a source of strategic competitive advantage. We initiate and maintain patents and trademarks on a number of our products and processes. However, we often do not patent a production method or product to avoid disclosure of business specific know-how. We proactively make careful assessments with respect to production process improvements and decide whether to apply for patents or retain and protect these improvements as trade secrets. When we file a patent application, it is usually filed in the relevant countries with active competition and markets for our products. In addition to patents, a significant part of our intellectual property is our trade secrets, general know-how and experience regarding the manufacturing technology, plant operation and quality management.
We rely on intellectual property laws, confidentiality procedures and contractual provisions to protect our intellectual property rights. We regard our patents, trade secrets and other intellectual property as valuable assets and take action when we deem it necessary to protect them. We proactively monitor competing patents and patent applications to ensure that we do not infringe the rights of other industry participants and/or challenge patent applications that may be without merit and would inhibit our ability to utilize our technology.
In connection with the separation of our business from Evonik, Evonik assigned to us its intellectual property that was exclusively used in its carbon black business, as well as certain intellectual property rights that are still in use in its retained business. However, we may be restricted in leveraging our intellectual property that we use on the basis of a license from Evonik or the intellectual property that is subject to grant-back license to expand our business into fields outside of carbon black. For additional information, see “Item 1A. Risk Factors—Legal and Regulatory Risks—We may not be able to protect our intellectual property rights successfully and we are still subject to restrictions and risks associated with our intellectual property sharing arrangements with Evonik.”
Environmental, Health and Safety Matters
Protection of humans and the environment, fair treatment of our partners and a clear alignment to the needs of customers are the essential components of our activities. Therefore, we strive not only to comply with all applicable laws and voluntary obligations, but strive to continuously improve our performance and management systems. Our integrated global management system with established standards and processes is based on the principles of the Responsible Care, ISO 9001 Quality Management System, ISO 14001 Environmental Management Systems, and OSHAS 18001 Safety Management Systems. All our operating sites are third-party certified by ISO 14001 and ISO 9001. The global management system outlines our processes and procedures practiced in relation to environmental protection, occupational and process safety, health protection and quality management including sustainable compliance, social accountability and product stewardship. In 2019, OEC published its first sustainability report in which the main environmental, health and safety performance data are reported according the Global Reporting Initiative protocols. The report is posted to the Sustainability portion of our webpage: www.orioncarbons.com.
Our operations involve the use, processing, handling, storage and transportation of materials that are subject to numerous supranational, national and local environmental and safety laws and regulations. Our production facilities require operating permits that are subject to renewal or modification. We could incur significant costs, including fines, penalties and other sanctions, third-party claims and environmental cleanup costs, as a result of violations of or liabilities under environmental, health and safety laws and regulations or operational permits required thereunder. We believe that our operations are currently in substantial compliance with all applicable environmental, health and safety laws and regulations. Although our management systems and practices are designed to ensure compliance with laws and regulations, future developments and increasingly stringent regulation could require us to make additional unforeseen environmental, health and safety expenditures. See as well risks described in “Item 1A. Risk Factors—Legal and Regulatory Risks—Our operations are subject to environmental, health and safety regulations. We have been and may in the future be subject to investigations by regulatory authorities in respect of alleged violations and may incur significant costs to maintain compliance with, and to address liabilities under, these laws and regulations”.
Environmental
Air Quality
One of the main environmental challenges of a carbon black plant is the management of exhaust gas from production processes. This exhaust gas contains a number of regulated pollutants, including carbon monoxide and sulfur compounds. The most common method for controlling these gases is through combustion, which produces useable energy as a by-product. Currently, eight manufacturing sites have the capability to beneficially utilize these gases through some form of energy co-generation, such as the sale or reuse of steam, gas or electricity. In addition, we are evaluating initiatives to build additional co-generation facilities.
The primary air pollutants of concern include sulfur dioxide (SO2), nitrogen oxides (NOx) and particulates. In order to maintain compliance with emission requirements, we utilize various desulfurization and de-NOx processes in some of our plants. We control the particulate matter by using our bag filter technology.
With regard to air quality we are subject to emission control provisions at the national as well as at the EU level. The EU Directive No. 2010/75/EU on industrial emissions (“IED Directive”) entered into force on January 6, 2011. It provides for regulation on the prevention and control of pollution from industrial activities and includes rules aiming to reduce emissions into air, water, and land and to prevent the generation of waste. Starting January 2013, the EU member states had to comply with emissions limits for certain industries.
Moreover, the IED Directive amended the former EU Directive 2008/1/EC on integrated pollution prevention and control (“IPPC Directive”) by defining best available techniques as binding industry standards. The Best Available Techniques Reference (BREF Notes) document applied to the carbon black industry was developed and implemented in August 2007 and it is subject its revision beginning at the end of 2020 or in 2021 by the European Commission.
Germany, for example, implemented the IED Directive by amendments to certain German statutes (among other things, the Federal Emissions Control Act (Bundes-Immissionsschutzgesetz), the Federal Water Act (Wasserhaushaltsgesetz) and the Act on Recycling (Kreislaufwirtschaftsgesetz). With respect to new emissions thresholds and new binding industry standards, permits need to comply with these standards and will, in general, not be grandfathered.
Besides the IED Directive and its implementation, European jurisdictions in which we operate may provide for further regulations regarding emission reduction and safety technology standards that apply to our facilities (for example, the German Emissions Control Act). Therefore, under such regulations we would have to modernize our facilities regularly to meet the required standards.
In the United States, we are subject to emissions limitations under the federal Clean Air Act (“CAA”) and a consent decree entered into with the U.S. Environmental Protection Agency (“EPA”) as described in more detail below under “—Environmental Proceedings”, as well as analogous state and local laws, which regulate the emission of air pollutants from our facilities and impose significant monitoring, record keeping and reporting requirements. In addition, these laws and regulations require us to obtain pre-approval for the construction or modification of facilities expected to produce or significantly increase air emissions and to obtain and comply with air permits that include stringent conditions on air emissions and operations. In certain cases, we may need to incur capital and operating expenditures for specific equipment or technologies to control emissions. All our U.S. facilities are required to obtain federal “Title V” permits, which are required for stationary sources classified as “major” on the basis of their emissions. Obtaining permits and approvals required for the construction, modification and operation of our facilities, or the appeal of such permits and approvals once they are issued, has the potential to delay the development of our projects. We have incurred, and expect to continue to incur, substantial administrative and capital expenditures to maintain compliance with CAA requirements that have been promulgated or may be promulgated or revised in the future.
Pursuant to the CAA, the EPA has developed industry-specific National Emission Standards for Hazardous Air Pollutants (“NESHAPs”) for stationary sources classified as “major” on the basis of their hazardous air pollutant emissions. Our U.S. facilities are subject to NESHAPs applicable to carbon black facilities, as well as NESHAPs applicable to industrial boilers. The NESHAPs establish emissions reduction requirements and require use of control technology requirements that meet a minimum standard and which may entail a combination of technology, processes, and techniques. These requirements are imposed through our Title V permits, and require specific monitoring, recordkeeping and reporting requirements. See “—Environmental Proceedings” for information regarding our compliance with the CAA.
In China, a reduction of NOx emission limits for a boiler from 300 parts per million (“ppm”) to 200 ppm and dust from 30 micro gram per cubic meter (“mg/m3”) to 20 mg/m3 was required following a change in China's Air Pollution Prevention law in October 2017. In addition, Chinese government reduced SO2 limits for the boiler from 200 ppm to 50 ppm effective from 2018.
Further reduction of NOx emissions from 200 to 100 ppm and dust from 20mg/m3 to 10mg/m3 became effective in 2019. With effect from calendar year 2020 SO2 emission limits for a dryer will be reduced from 200 ppm to 50 ppm.
In Korea, the Clean Air Conservation Act changed, leading to reduced air emission limits for carbon black manufacturing processes for SO2 from 400 ppm to 200 ppm, and in the energy generation processes for SO2 from 300 ppm to 200 ppm, for NOx from 200 ppm to 150 ppm and dust from 50ppm to 30 ppm and the energy processes NOx is to be reduced from 220 ppm to 180 ppm and dust from 35 ppm to 20 ppm on condition of 6% oxygen concentration. These changes will become effective in calendar year 2020.
These regulation changes in China and South Korea in prior years have been complied with and those to come may require additional capital and operating expenditures for specific equipment or technologies to control emissions and we have projects underway to address the new requirements.
Greenhouse Gas Regulation and Emissions Trading
Our facilities also emit significant volumes of CO2. In the European Union, all our production facilities are subject to the European Emission Trading Scheme (“ETS”) for CO2 emissions. The ETS was set up in 2003 by the Directive 2003/87/EC in order to considerably reduce the output of greenhouse gas (“GHG”). The directive has been implemented into German law as the Greenhouse Gas Emissions Trading Act (Treibhausgas-Emissionshandelsgesetz). Industrial sites to which the ETS applies receive a certain number of allowances to emit GHGs and must surrender one allowance for each metric ton of GHG emitted. For the trading period that commenced in 2013, the ETS has been revised such that the EU-wide quantity of emission allowances allocated each year have been significantly reduced as compared to the average annual total quantity of allowances issued in the EU between 2008 and 2012 and no free-of-charge allocation for any electricity producing entity exists anymore.
The ETS affects carbon black manufacturers in the European Union. Carbon black production is currently listed on the carbon leakage list, which allows receiving the significant share of needed emission allowances free of charge. This list was reviewed by the European Commission and Carbon Black remained on the Carbon Leakage List for the ETS Phase IV (2021-2030). See “Item 1A. Risk Factors—Legal and Regulatory Risks—Regulations requiring a reduction of greenhouse gas emissions could adversely affect our business,
financial condition, results of operations and cash flows.” The preparation for the ETS Phase IV (2021-2030) started in 2017 by the European Commission, the European Council and the European Parliament in cooperation, Council and Parliament announced during 2018 the implementation timetable with regard to ETS Phase IV. As part of International Carbon Black Association's (“ICBA”) joint activity towards ETS, OEC completed the emission data collection for the period 2014-2018 according to the relevant European Union regulations. This data collection contributed to help developing an industrial benchmark of emission data. These data will provide the basis for expected discussions and exchanges between environmental agencies across the EU to be expected to take place in the middle of 2020 to complete the emission allocation process for ETS Phase IV.
The design concept of the South Korean ETS is similar to the European ETS. Currently, we purchase emission rights for an insignificant amount in South Korea to cover our excess requirements.
In the U.S., comprehensive climate change legislation has not yet been adopted. After determining that emissions of carbon dioxide, methane, and certain other gases endanger public health and the environment in December 2009, the EPA has regulated GHG emissions under various provisions of the Clean Air Act. The EPA adopted rules that require reporting of GHG emissions by owners and operators of facilities in certain source categories or that exceed certain GHG emissions thresholds, and our facilities are subject to this rule. Further, EPA issued the GHG “Tailoring Rule” in May 2010, to address GHG permitting requirements pursuant to its determination that GHG emissions triggered permitting requirements for stationary sources starting in January 2011, and has since continued efforts to regulate GHG emissions.
Apart from the EPA’s efforts, Congress has from time to time considered legislation to reduce emissions of GHGs, but no legislation has been enacted to date. At the state level, approximately one-half of the states have already taken legal measures to reduce emissions of GHGs, primarily through the planned development of GHG emission inventories and/or regional GHG cap-and-trade programs. There is no assurance that the current level of regulation will continue at the federal or state level in the future, or that future changes would not materially affect our operations or require material capital expenditures. The adoption of legislation or regulations that require reporting of GHGs, establish permitting thresholds based on GHG emissions or otherwise limit or impose compliance obligations for emissions of GHGs from our equipment and operations could require us to incur costs to obtain and comply with permits, reduce emissions of GHGs associated with our operations or purchase carbon offsets or allowances.
South African Carbon Offsets Law came into effect from June 1, 2019. The carbon black process is listed on Table 3 of this bill and a process emission factor was determined for a ton of carbon black produced using furnace black technology. The current amount of tax is determined to be 120 ZAR per ton of CO2 emitted into the atmosphere. Our facility in Port Elizabeth is subject to pay the tax for its emissions calculated from June 1, 2019 and on yearly basis thereafter. Based on current production levels the total annual tax is expected to be not material and not to exceed $0.2 million per fiscal year.
There are also ongoing discussions and regulatory initiatives in other countries in which we have facilities, including Brazil, regarding GHG emission reduction programs, but those programs have not yet been defined.
Water Quality
Our plants are net consumers of water and are generally subject to laws and regulations related to water management. Most of our plants recycle a substantial amount of the water used in the manufacturing process, which is used as “quench water” in the cooling process. Water discharge from most plants consists primarily of storm-water during and after heavy rain, as well as limited wastewater from ancillary operations such as boiler blowdown and equipment washing; these discharges only take place under permitted conditions. For those plants that discharge water, the treatment generally is a settling pond system. Some facilities operate more advanced wastewater treatment systems, such as filtration and aeration systems incorporating chlorination or ozonation, depending on local requirements.
At the EU level, the European Directive No. 2000/60/EC, also known as the Water Framework Directive (“WTD”), aimed to achieve a good qualitative and quantitative status of all water bodies by 2015. Its main goals include expanding the scope of water protection to all waters, including surface waters and groundwater, water management based on river basins, a “combined approach” of emission limit values and quality standards and streamlining legislation. A lot of effort has been put into the preparation and drafting of the River Basin Management Plans by 2009. The Plans should have identified all actions to be taken in the river basin district to deliver the objectives of the WFD. An interim Commission’s Assessment with respect to the status of water conditions in the EU, and activities influencing it, is attesting best water qualities ever since. However, the assessment shows that a more determined effort is needed to ensure achievement of WFD objectives in the enacted 6-year cycles ending in 2021 and 2027.
Moreover, the use of water for the manufacturing process may require permits or licenses as, for example, under the German Federal Water Act or German local laws. Permits may also be required for the discharge of wastewater into the public sewer system. Such permit or license may be revoked without compensation under certain circumstances.
In the United States, our facilities are subject to the federal Clean Water Act (“CWA”), and analogous state laws and regulations that impose restrictions on the discharge of pollutants into waters of the United States. Any such discharge of pollutants must be in accordance with the terms of the permit issued by EPA or the analogous state agency. In addition, the CWA and implementing state laws and regulations require individual permits or coverage under general permits for discharges of storm water runoff from certain types of facilities. Federal and state regulatory agencies can impose administrative, civil and criminal penalties for non-compliance with discharge permits or other requirements of the CWA and analogous state laws and regulations. These permits generally have a term of five years. Our
facilities are subject to CWA permitting requirements, and must obtain and comply with National Pollutant Discharge Elimination System permits, which establish standards for, and require monitoring of, our discharges. We are subject to categorical pretreatment standards for the Carbon Black Manufacturing Point Source category, which, among other requirements, prohibits discharges of process wastewater pollutants to navigable water.
Contamination
As we handle chemicals that could cause water or soil contamination, we may be subject to remediation obligations under national law. Additionally, third parties may be able to file claims for personal injury and property damage allegedly caused by the release of hazardous substances or other pollutants into the environment.
In particular, the German Federal Act on Soil Protection (Bundes-Bodenschutzgesetz) requires the prevention of soil contamination by taking adequate precautions. In case of discovery of any contamination or past pollution (Altlasten) the owner, the current controlling person of the property, the polluter, its universal successor (Gesamtrechtsnachfolger) or the previous owner (if such owner transferred title to the real property after March 1, 1999 and knew or should have known of the contamination or past pollution) may be held responsible for remediation measures. Responsibility may be placed on either or several of the persons even in the absence of any fault or negligence. The competent authorities may also take remediation measures themselves and require the responsible party to bear the costs of such remediation. If several parties are responsible, they are jointly or severally liable and each party has the legal claim to reimbursement against the other parties. Such reimbursement may be contractually modified or waived among the parties.
In case of contamination of ground or surface water, the responsibility for remediation measures results from the Federal Act on Soil Protection in conjunction with the Federal Water Act and local water protection laws.
In the United States, our facilities are subject to the Comprehensive Environmental Response, Compensation, and Liability Act (“CERCLA”), the Resource Conservation and Recovery Act (“RCRA”) and similar state laws. CERCLA establishes liability for parties, including current and former site owners and operators, generators, and transporters, in connection with releases of hazardous substances. Under CERCLA, we may be subject to liability without regard to fault or the lawfulness of the disposal or other activity. Our operations involve the storage, handling, transportation and disposal of hazardous substances within the meaning of CERCLA. As a result, we may be jointly and severally liable under CERCLA for all or part of the costs required to clean up sites at which hazardous substances have been released into the environment. Under CERCLA and similar state laws, we could be required to remove previously disposed substances and wastes, remediate contaminated property and groundwater, conduct natural resource damage assessments and pay compensation and penalties. RCRA is the principal federal statute regulating the generation, treatment, storage and disposal of hazardous and other wastes. RCRA and state hazardous waste regulations impose detailed operating, inspection, training and response standards and requirements for permitting, closure, remediation, financial responsibility, record keeping and reporting. Our sites have areas currently and formerly used as landfills for wastes generated by our operations. These landfills may be subject to regulation under RCRA, and certain of our facilities have been investigated and remediated under RCRA. These laws and regulations may also expose us to liability for acts that were in compliance with applicable laws at the time we performed those acts. We could incur significant costs in connection with investigation and remediation activities or claims asserted at current or former facilities or third-party sites.
Non-hazardous and Hazardous Waste
In some jurisdictions in which we operate we are subject to provisions regarding waste management and the handling and storage of hazardous substances. Those provisions may require documentation on the disposal of waste or compliance with certain safety standards (for example, as set forth in Council Directive 96/82/EC on the control of major-accident hazards involving dangerous substances, known as Seveso II Directive). The directive was implemented into German law by the 12th Ordinance under the German Emissions Control Act.
We generate hazardous waste in the form of spent solvents at our plant labs. In addition, coal tar fractions, a common raw material at some plants, are considered hazardous waste if spilled or otherwise require disposal, as are certain refractories that contain hexavalent chromium, which are generated infrequently. Certain facilities have on-site landfills permitted for the current disposal of non-hazardous solid waste.
Energy Surcharge
The German Renewable Energies Act grants above-market payments to the producers of energy generated from renewable sources. To balance these payments, an energy surcharge is imposed on the consumers of energy. Certain exemptions regarding that surcharge are provided in the EEG, in particular for energy intensive industries and self-consumption of self-produced energy. The European Commission opened an in-depth investigation procedure in December 2013 to examine whether the reductions granted under the EEG comply with EU state aid rules. Currently, the European Commission and the German government are working out an agreement regarding future benefits in that respect. Accordingly, the German legislator is amending the national regulations and setting up a new regime regarding energy intensive industries. It is expected that the exemption from the energy surcharge regarding electricity generated for the Company’s own consumption will be grandfathered. However, there is no assurance that we can maintain the exemption status permanently.
Environmental Proceedings
During 2008 and 2009, the EPA contacted all U.S. carbon black producers as part of an industry-wide EPA initiative, requesting extensive and comprehensive information under Section 114 of the U.S. Clean Air Act. The EPA used that information to determine, for each facility, that either: (i) the facility has been in compliance with the Clean Air Act; (ii) violations have occurred and enforcement litigation may be undertaken; or (iii) violations have occurred and a settlement of an enforcement case is appropriate. In response to information requests received by the Company’s U.S. facilities, the Company furnished information to the EPA on each of its U.S. facilities. EPA subsequently sent notices under Section 113(a) of the Clean Air Act in 2010 alleging violations of Prevention of Significant Deterioration (“PSD”) and Title V permitting requirements under the Clean Air Act at the Company’s Belpre (Ohio) facility. In October 2012, the Company received a corresponding notice and finding of violation (a “NOV”) alleging the failure to obtain PSD and Title V permits reflecting Best Available Control Technology (“BACT”) at several units of the Company’s Ivanhoe (Louisiana) facility, and in January 2013 the Company also received a NOV issued by the EPA for its facility in Borger (Texas) alleging the failure to obtain PSD and Title V permits reflecting BACT during the years 1996 to 2008. A comparable NOV for the Company’s U.S. facility in Orange (Texas) was issued by the EPA in February 2013; and EPA issued an additional NOV in March 2016 alleging more recent non-PSD air emissions violations primarily at the dryers and the incinerator of the Orange facility.
In 2013, Orion began discussions with the EPA and the U.S. Department of Justice about a potential settlement to resolve the NOVs received, which ultimately led to a consent decree executed between Orion Engineered Carbons LLC (for purpose of this section “Orion”) and the United States (on behalf of the EPA), as well as the Louisiana Department of Environmental Quality. The consent decree (the “EPA CD”) became effective on June 7, 2018. The consent decree resolves and settles the EPA’s claims of noncompliance set forth in the NOVs and in a respective complaint filed in court against Orion by the United States immediately prior to the filing of the consent decree.
All five U.S. carbon black producers have settled with the U.S. government.
Under Orion’s EPA CD, Orion will install certain pollution control technology in order to further reduce emissions at its four U.S. manufacturing facilities in Ivanhoe (Louisiana), Belpre (Ohio), Borger (Texas), and Orange (Texas) over approximately six years. The EPA CD also requires the continuous monitoring of emissions reductions that Orion will need to comply with over a number of years. Orion has commenced the installation works for its Ivanhoe facility, and expects to complete the installation in this facility over the next year. Under the EPA CD, Orion can choose either its Belpre or Borger facilities as the next site for installation of pollution control equipment with comparable effectiveness. We expect the capital expenditures for installation of pollution control equipment in the remaining Orion facilities to decrease due to economies of scale and synergies from prior installations. We estimate the installations of monitoring and pollution control equipment at all four Orion plants in the U.S. will require capital expenditures of approximately $190 million, subject to the results of further scope design and estimation efforts presently underway. However, the actual total capital expenditures we might need to incur in order to fulfill the requirements of the EPA CD remain uncertain. The EPA CD allows some flexibility for Orion to choose among different technology solutions for reducing emissions and the locations where these solutions are implemented. The solutions Orion ultimately chooses to implement at its facilities other than Ivanhoe (Louisiana), may differ in scope and operation from those it currently anticipates (including those discussed in the next paragraph) and, for any and all of the its facilities, factors, such as timing, locations, target levels, changing cost estimates and local regulations, could cause actual capital expenditures to significantly exceed current expectations or affect Orion’s ability to meet the agreed target emission levels or target dates for installing required equipment as anticipated or at all. Noncompliance with applicable emissions limits could lead to penalty payments to the EPA.
As part of Orion’s compliance plan under the EPA CD, in April 2018 Orion signed a contract with Haldor Topsoe group to install its SNOXTM emissions control technology to remove SO2, NOx and dust particles from tail gases at Orion’s Ivanhoe, Louisiana Carbon Black production plant. The SNOXTM technology has not been used previously in the carbon black industry.
Orion’s Share Purchase Agreement with Evonik in connection with the Acquisition provides for a partial indemnity from Evonik against various exposures, including, but not limited to, capital investments, fines and costs arising in connection with Clean Air Act violations that occurred prior to July 29, 2011. Except for certain less relevant allegations contained in the second NOV received for the Company’s facility in Orange (Texas) in March 2016, all of the other allegations made by the EPA with regard to all four of the Company’s U.S. facilities - as discussed above - relate to alleged violations before July 29, 2011. The indemnity provides for a recovery from Evonik of a share of the costs (including fines), expenses (including reasonable attorney’s fees, but excluding costs for maintenance and control in the ordinary course of business and any internal cost of monitoring the remedy), liabilities, damages and losses suffered and is subject to various contractual provisions including provisions set forth in the Share Purchase Agreement with Evonik, such as a de minimis clause, a basket, overall caps (which apply to all covered exposures and all covered environmental exposures, in the aggregate), damage mitigation and cooperation requirements, as well as a statute of limitations provision. Due to the cost-sharing and cap provisions in Evonik’s indemnity, the Company expects that substantial costs it has already incurred and will incur in this EPA enforcement initiative and the EPA CD likely will exceed the scope of the indemnity in the tens of millions of US dollars. In addition, Evonik signaled that it is not honoring Orion’s claims under the indemnity. In June 2019, Orion initiated arbitration proceedings to enforce its rights against Evonik. Evonik in turn has submitted certain counterclaims related to a tax indemnity and cost reimbursement against Orion, which counterclaims we do not believe to be material. Although Orion believes that it is entitled to the indemnity and that its rights thereunder are enforceable, there is no assurance that the Company will be able to recover costs or expenditures incurred under the indemnity as it expects or at all. See “Item 1A. Risk-Factors-Risks Related to Indebtedness, Currency Exposure and Other Financial Matters-Our agreements with Evonik in connection
with the Acquisition require us to indemnify Evonik with respect to certain aspects of our business and require Evonik to indemnify us for certain retained liabilities. We cannot offer assurance that we will be able to enforce claims under these indemnities as we expect.”
Chemical Regulations
Some jurisdictions we operate in have established regimes to regulate or control chemical products to ensure the safe manufacture, use and disposal of chemicals.
In the European Union, the Regulation on Registration, Evaluation, Authorization of Chemicals (“REACh”) was signed in December 2006, came into effect on June 1, 2007 and requires chemical manufacturers and importers in the European Union to register all chemicals manufactured in, or imported into the European Union in quantities of more than one ton annually. Registration has to be made at the European Chemicals Agency (“ECHA”). The registration process requires capital and resource commitments to compile and file comprehensive chemical dossiers regarding the use and attributes of each chemical substance manufactured or imported by us and requires us to perform chemical safety assessments. Moreover, the use of certain “highly hazardous chemicals” must be authorized by ECHA. Furthermore, REACh Regulation contains rules on bringing substances to the market that have been identified as substances of very high concern (“SVHC”). If identified as SVHC, manufactured substances will be listed on the “candidate list” and potentially prioritized for or inclusion into Annex XIV to the REACh Regulation which may mean a full ban or requirement for authorization to be granted by the European Commission at its discretion. Carbon black oils used as raw materials in the carbon black production are considered intermediates under REACh. Use of intermediates is exempted from authorization under REACh.
Registration of certain chemicals with ECHA has been compulsory since June 1, 2008. For pre-registered substances, three registration deadlines are applicable, depending on the tonnage of the substance. Substances manufactured or imported into the EU exceeding 1,000 mt/y and specific SVHC in lower volumes had to be registered before December 1, 2010. The second period regarding substances in quantities of 100 to 1,000 mt/y ended on May 31, 2013. The last deadline for substances of more than 1 mt/y was May 31, 2018.
Further national provisions exist that apply to our business. For example, under German law, the Chemicals Act (Chemikaliengesetz) and related ordinances impose particular obligations on producers, processors, and handlers of chemical agents. We have to comply with safety obligations in this respect, particularly regarding the handling and storage of hazardous substances.
In the United States, we are subject to federal and state requirements relating to our business and products. In particular, we are subject to the California Safe Water and Toxic Enforcement Act, known as Proposition 65. Among other requirements, Proposition 65 imposes labeling and record keeping requirements. Non-compliance may result in significant penalties or fines, and future amendments to Proposition 65 could result in increased labeling or other compliance obligations applicable to our products.
In South Korea the so called Chemical Control Act was enacted. According to the act coal based feedstock oils such as CCT, CTD, SPO containing more than 0.001% quinoline are treated as hazardous chemicals requiring production sites to be duly licensed to use these coal based feedstock from 2019. We may incur capital and operational expenses to meet the relevant requirements to become duly licensed.
We are a member of the International Carbon Black Association (the “ICBA”), which currently consists of representatives from carbon black manufacturers in Europe, North and South America, Asia and Africa. The ICBA seeks to address common environmental, health and safety issues, undertakes research on health implications of carbon black, and serves as the leading advocate for the industry in the regulatory and public-interest arenas. The ICBA funds research on international environmental, health, product safety and workplace safety matters.
We are also a member of the European consortium for carbon black (“cb4reach Consortium”) which has pre-registered and registered carbon black with ECHA as required by the REACh Regulation. Besides the Company, the following companies are members of the cb4reach Consortium: Cabot Corporation, Cancarb Limited, Birla Carbon, Continental Carbon Company, Tokai Carbon, and Imerys S.A.
Health and Safety
The health and safety of our employees and customers is one of our highest priorities. We maintain very good performance in occupational injury and illness rates. New employees and contractors working on site are given environmental, health and safety training and we keep track of environmental, health and safety matters. Employees are required to report and log incidents including near misses into the electronic environmental, health and safety (“EHS”) management system. Our sites are required to implement and report EHS leading and lagging indicators for EHS performance. Plant managers are required to track and monitor these leading and lagging indicators and take action as appropriate. Leading and lagging indicator data and incidents are reviewed by senior management on a monthly basis.
Carbon black is produced under controlled conditions and has high purity levels. It therefore differs from other combustion products that may contain high concentrations of hazardous compounds. Due to its high purity, certain carbon black grades are permitted for use in cosmetics or in products in contact with food.
The International Agency for Research on Cancer (“IARC”) classifies carbon black as a Group 2B substance (known animal carcinogen, possible human carcinogen). We have communicated IARC’s classification of carbon black to our customers and employees in
accordance with applicable regulatory requirements. The Permanent Senate Commission for the Investigation of Health Hazards of Chemical Compounds in the Work Area (the “MAK Commission”) of the German Research Foundation (Deutsche Forschungsgemeinschaft), which uses a different rating system, classifies carbon black as a suspect carcinogen (Category 3B). Other national and international health organizations have not rated carbon black. Any risk reclassification of our raw materials, intermediates or finished product could result in increased operating costs or affect product lines or sales.
The Community Rolling Action Plan (“CoRAP”) indicates substances for evaluation by the European Member States. The evaluation aims to clarify the initial concern that manufacturing and/or use of shortlisted substances could pose a risk to human health or the environment. With ECHA's update of the CoRAP list in March 2016 Carbon black was included in CoRAP for substance evaluation in 2018 though it has been postponed several times. The most recent ECHA update from October 2019 the substance evaluation is proposed to be further delayed to 2022. The substance evaluation for carbon black was proposed by France. The initial reasons of concern raised by the French Agency for Food, Environmental and Occupational Health & Safety (“ANSES”) relate to carbon black being an alleged carcinogenic substance and a suspected reproduction toxicant. Orion is working as a member of the cb4reach Consortium and ICBA to address the reasons for nomination. The conclusion of the evaluation may have significant business impact should ANSES conclude that carbon black poses a risk to human health. A potential outcome could be a harmonized classification and labeling of carbon black for carcinogenicity and toxicity to reproduction. These developments may significantly affect our business, including increasing costs of doing business.
According to the recommendation of October 18, 2011 (2011/696/EU), carbon black is defined as a nano-material in Europe. Afterwards the ISO developed the ISO TC 229 “Nanotechnologies,” which considers carbon black as a “nano-structured material.” Other countries (such as, US, Canada, France, Belgium, Sweden, Switzerland, etc.) have implemented notification schemes related to nano materials. In Europe, Commission Regulation (EU) 2018/1881 as of December 3, 2018 amending the REACh regulation introduced new information requirements for substances with forms meeting the definition criteria of EU COM 2011/696/EU. The notification of carbon black under the different notification schemes as well as meeting the new nano-related information requirements under REACh requires capital and resource commitments to compile and file dossiers. Furthermore, more and more specific requirements for substances regarded as nanomaterials are emerging with Europe. For example, Germany is planning to introduce a more stringent Occupational Exposure Limit for nanomaterials. These developments may significantly affect our business, including increasing costs of doing business.
Further Regulatory Matters
We are subject to further governmental regulation from national, European Union and other international regulatory authorities concerning, among other things: product safety, export and import control regulations and other customs regulations, data protection and our competitive and marketplace conduct. We believe that we are in compliance in all material respects with these regulations. We cannot guarantee, however, that any future changes in the requirements or mode of enforcement of these laws and regulations will not have a material adverse effect on our business, financial condition, results of operations or cash flows.
Employees
As of December 31, 2019, we had 1,493 employees and approximately 362 contractors in our wholly-owned entities.
Labor Relations
Our employees in many countries are represented by employees labor unions in accordance with local law and practices, which could provide with participation and information rights to those representatives. Membership of employees labor unions varies in accordance with the business area, local practice and country in which we operate. We have entered into collective bargaining agreements with employees labor unions either directly or as members of employer organizations. In particular, 73% of our employees are covered by such bargaining agreements. These agreements typically govern, among other things, terms and conditions of employment and reflect the prevailing practices in each country. We believe we have stable relations with our employees and voluntary turnover has been low in recent years.
In 2017, 35 of the former employees in our closed facility in Ambès, France filed claims with the labor court of Bordeaux contesting the termination of their employment and seeking damages. The court held several hearings on the claims in 2018 and 2019. While we intend to continue to oppose these claims, our results of operations reflect accruals made by us to satisfy these claims should the former employees prevail.
Corporate information
Orion Engineered Carbons S.A. is a Luxembourg joint stock corporation (société anonyme or S.A.), incorporated on July 28, 2014 as a Luxembourg limited liability company (société à responsabilité limitée). The Company's registered office is located at 6, Route de Trèves, L-2633 Senningerberg (Municipality of Niederanven), Grand Duchy of Luxembourg. Our principal executive offices are located in Houston, Texas, U.S., and our telephone number is (281) 318-2959. Our website address is www.orioncarbons.com. The SEC maintains a website (www.sec.gov) that contains reports and other information regarding issuers that file electronically with the SEC. The information contained on, or that can be accessed through these websites is not part of, and is not incorporated into, this report.
Historically, our business operated as a business line of Evonik. Effective July 29, 2011, private investors indirectly acquired from Evonik the entities operating its carbon black business. On July 30, 2014, the Company completed its initial public offering. During 2017, Kinove Holdings sold all its remaining common shares. Currently, we operate on a fully stand-alone basis with all our shares held by public investors except for 505,142 shares held by us in treasury.
Available information
We make available on or through our internet website at www.orioncarbons.com, our annual reports on Form 10-K, quarterly reports on Form 10-Q, current reports on Form 8-K and amendments to those reports filed or furnished pursuant to Section 13(a) or 15(d) of the Exchange Act, as soon as reasonably practicable after electronically filing such material with the SEC at http://www.sec.gov. This Annual Report on Form 10-K and our other SEC filings are also accessible through the SEC’s website at http://www.sec.gov. All references to websites contained herein do not constitute incorporation by reference of information contained on such websites and such information should not be considered part of this document.
Item 1A. Risk Factors
The following risks may have material adverse effects on our business, financial condition and results of operations. Additional risks and uncertainties of which we are not presently aware or that we currently deem immaterial could also materially affect our business operations and financial condition.
Risks Related to Our Business
Negative or uncertain worldwide economic conditions may result in business volatility and may adversely impact our business, financial condition, results of operations and cash flows.
Our operations and performance are materially affected by worldwide economic conditions. Because carbon black is used in a diverse group of end products, demand for carbon black has historically been related to real gross domestic product (“GDP”) and general global economic conditions. In particular, a large part of our sales has direct exposure to the cyclical automotive industry and, to a lesser extent, the construction industry. As a result, our business experiences a level of inherent cyclicality. The nature of our business and our large fixed asset base make it difficult to rapidly adjust our fixed costs downward when demand for our products declines, which could materially affect our profitability. A global or regional economic downturn may reduce demand for our products, which would decrease our revenue and could have a material adverse effect on our business, financial condition, results of operations and cash flows. In periods with significant market turmoil and tightened credit availability, we expect to experience difficulties in collecting accounts receivable, pricing pressure and reduced global or local business activity.
Structural changes in the industries in which we operate may result in business volatility and may adversely affect our business, financial condition, results of operations and cash flows.
Our business is influenced by structural changes in the industries in which we operate, such as the entry of new suppliers, product substitution, changing technologies, industry consolidation and the migration of customers to lower-cost countries. Some of our customers have shifted, and may continue to shift, manufacturing capacity from mature regions, such as North America and Europe, to emerging regions, such as Asia and South America or Africa. Although we have developed and implemented strategies to meet these changes in demand, we cannot be certain that we will be able to successfully expand capacity in emerging regions. Our ability to expand in these regions depends in part on their economic, regulatory and political conditions and on our ability to establish and finance operations, construct additional manufacturing capacity or form strategic business alliances including acquisitions and joint ventures. In addition, we may not be successful in adapting capacity in mature regions commensurate with industry demand. Similarly, demand for our customers’ products and our competitors’ reactions to market conditions could affect our results. Our business is also sensitive to changes in industry capacity utilization. Prices tend to decrease when capacity utilization decreases, which could adversely affect our business, financial condition, results of operations and cash flows.
Our business is subject to operational risks, which could adversely affect our business, financial condition, results of operations and cash flows.
Our operations are subject to hazards inherent in chemicals manufacturing and the related use, storage, transportation and disposal of feedstocks, products and wastes, including, but not limited to, fires and explosions, accidents, severe weather and natural disasters (including hurricanes, tornadoes, ice storms, droughts, floods and earthquakes), pandemics or epidemics, mechanical failures, unscheduled downtime at our production facilities, transportation interruptions, harbor-, road-, pipeline- or tank-access, pipeline leaks and ruptures, quality problems, technical difficulties, energy grid shutdowns, discharges or releases of toxic or hazardous substances or gases, other environmental risks, and sabotage, terrorist attacks or other acts of violence as well as potential boycotts, general strikes, sanctions or blockades.
Such events could disrupt our supply of raw materials or otherwise affect sales, production, transportation and delivery of our products or affect demand for our products. We could incur significant expenditures in connection with such operational risks. These may be caused both by external factors, such as natural disasters, pandemics or epidemics, war, acts of terrorism, strikes, official orders,
technical interruptions or material defects and accidents or mistakes in internal procedures, such as fire, explosion or release of toxic or hazardous substances. In all of these cases, our property, third-party property or the environment may sustain damage, or there may be human exposure to hazardous substances, personal injuries or fatalities. Such events could result in material financial liabilities, civil or criminal law consequences, the temporary or permanent closure of the relevant production or administrative sites or power plant and a negative impact on our financial condition, results of operations and cash flows.
We are dependent on major customers for a significant portion of our sales, and a significant adverse change in a customer relationship could adversely affect our business, financial condition, results of operations and cash flows.
Customer concentration is driven by the consolidated nature of the industries we serve. In 2019, our top ten customers accounted for approximately 51% of our volume measured in thousand metric tons (“kmt”). Our success in strengthening relationships and growing business with our largest customers and retaining their business over extended time periods could affect our future results. The loss of any of our major customers (including due to industry consolidation) or a reduction in volumes sold to them, could adversely affect our results of operations. Any deterioration in the financial condition of any of our customers or the industries they operate in or serve that impairs our customers’ ability to make payments to us could decrease our sales or increase our uncollectible receivables and could adversely affect our business, financial condition, results of operations and cash flows.
We may not be able to compete successfully in the industries and markets in which we operate.
The industries in which we operate are highly competitive based on price, product innovation, product quality, distribution capability, and industry and customer knowledge. We face competition from global and regional suppliers, both in developed and in emerging regions. While we aim to operate at low cost and are focused on reducing our fixed and variable cost base across our production chain, there may be improvements in the cost competitiveness of other manufacturers relative to us or in the performance properties of substitutable products and raw materials, which could result in advantages for our competitors and adversely affect our business. Furthermore, some of our competitors may have greater financial and other resources and larger capitalization than we do. If we are unable to respond successfully to changing competitive conditions, the demand for our products could be adversely affected which could have a material adverse effect on our business, financial condition, results of operations and cash flows.
We may not successfully develop new products and technologies that address our customers’ changing requirements or competitive challenges, and our customers may substitute our products by using other products we do not offer.
The industries into which we sell our products are subject to periodic technological changes, ongoing product improvements, product substitution and changes in customer requirements. Increased competition from existing or newly developed products offered by our competitors or companies whose products offer a similar or better functionality to our products may negatively affect demand for our products. We work to identify, develop and market innovative products on a timely basis to meet our customers’ changing requirements and competitive challenges. Should we not be able to substantially maintain or further develop our product portfolio, customers may elect to source comparable or other products from competitors, which could adversely affect our business, financial condition, results of operations and cash flows.
Although carbon black continues to offer opportunities for product and process innovation, we cannot be certain that the investments we make in our innovation group will result in proportional increases in revenue or profits. In addition, the timely commercialization of products that we are developing may be disrupted or delayed by manufacturing or other technical difficulties, industry acceptance or insufficient industry size to support a new product, competitors’ new products, and difficulties in moving from the experimental stage to the production stage. These disruptions or delays could adversely affect our business, financial condition, results of operations and cash flows.
As a reinforcing agent in certain rubber applications, carbon black competes primarily with precipitated silica in combination with silane, which are both not part of our product portfolio. Historically, silica has offered some performance benefits over carbon black in the area of rolling resistance. To date, silica-based tire applications have gained position in passenger car tire treads. Although substitution has not been significant due to carbon black’s cost advantage, technological advances and changing customer requirements may lead to increased demand for silica-based tires, especially in developed regions. Increased substitution and competition from precipitated silica producers could adversely affect our business, financial condition, results of operations and cash flows. If we should decide to include precipitated silica in combination with silane in our product portfolio in the future, we may be restricted in our ability to do so under our intellectual property sharing arrangements with Evonik.
Alternative materials, procedures or technologies may be developed, or existing ones may be improved, and may replace those currently offered in the carbon black industry. If such newly developed or improved products are being offered at lower prices, have preferable features or other advantages, in particular from a regulatory perspective, and we are not able to offer similar new or improved products, we may lose substantial sales volumes or customers, which could have an adverse effect on our business, financial condition, results of operations and cash flows.
We may be unable to implement our business strategies in an effective manner.
Our future financial performance and success largely depend on our ability to maintain our current position and to implement our business strategies for growth successfully. We cannot guarantee that we will successfully implement our business strategies or that
implementing these strategies will sustain or improve and not harm our results of operations. We may not be able to increase or sustain our manufacturing efficiency or asset utilization, enhance our current portfolio of products or achieve other fixed or variable cost savings. In addition, the costs involved in implementing our strategies may be significantly higher than we currently anticipate. Our ability to complete capacity expansions may be delayed or interrupted by the need to obtain environmental and other regulatory approvals, the availability of labor and materials, unforeseen hazards, such as weather conditions, adverse political or market developments, and other risks customarily associated with construction or expansion projects. Moreover, the cost of expanding capacity could have a negative impact on our financial results until capacity utilization is sufficient to absorb the incremental costs associated with the expansion. Further, labor or governmental restrictions could impede or delay our ability to reduce headcount in the event headcount reduction is deemed to be sensible in our opinion.
Our business strategies are based on our assumptions about future demand for our existing products and the new products and applications we are developing, and on our continuing ability to produce our products profitably. Each of these factors depends on, among other things, our ability to realign our product portfolio, divest businesses or discontinue product lines on favorable terms and with minimal disruptions, finance our operations and product development activities, negotiate favorable terms, maintain high-quality and efficient manufacturing operations, relocate and close certain manufacturing facilities with minimal disruption to our operations, respond to competitive and regulatory changes, access quality raw materials in a cost-effective and timely manner, and retain and attract highly skilled technical, managerial, marketing and finance personnel. Any failure to develop, revise or implement our business strategies in a timely and effective manner may adversely affect our business, financial condition, results of operations and cash flows.
We are subject to volatility in the costs, quality and availability of raw materials and energy, which could decrease our production volumes and margins and adversely affect our business, financial condition, results of operations and cash flows.
Our manufacturing processes consume significant amounts of raw materials and energy, the costs of which are subject to fluctuations in worldwide supply and demand as well as other factors beyond our control. In 2019, raw materials accounted for 75% of our cost of sales. Approximately 79% of the cost of raw material used in the production of carbon black is related to petroleum-based or coal-based feedstock known as carbon black oil, with some limited use of other raw materials, such as acetylene, nitrogen tetroxide, hydrogen and natural gas. We obtain a considerable portion of our raw materials and energy from selected key suppliers. Although we maintain raw material reserves, if any of these suppliers is unable to meet its obligations under supply agreements with us on a timely basis or at all, or if we cannot source sufficient supply, we may be forced to incur higher costs to obtain the necessary raw materials and energy elsewhere or, in certain limited cases, we may not be able to obtain carbon black oil or raw materials at all. Additionally, raw material sourcing and related infrastructure (like harbor access, cargo or ship availability, pipeline-, tank- or road-access), may be subject to local developments or regulations in certain jurisdictions where we operate that may reduce, delay or halt the physical supply of raw materials. Our inability to source quality raw materials or energy in a timely fashion and pass through cost increases to our customers could have an adverse impact on our business, financial condition, results of operations and cash flows.
Most of our carbon black supply contracts contain provisions that adjust prices to account for changes in a relevant feedstock price index. We are exposed to oil price fluctuations and there can be no assurance that we will be able to shift price risks to our customers. Success in offsetting increased raw material, energy and tax or tariff costs with related price increases is also influenced by competitive and economic conditions, as well as the speed and severity of such changes, and could vary significantly, depending on the segment served. Such increases may not be accepted by our customers, may not be fully reflected in the indices used in our pricing formulas, may not be sufficient to compensate for increased raw material and energy costs or may decrease demand for our products and our volume of sales. Rapid and significant oil or energy price fluctuations have had and are likely to continue to have significant and varying effects on our earnings and results of operations, partly because oil price changes affect our sales prices and our cost of raw materials and energy at different times and amounts, and partly due to other factors, such as differentials affecting the ultimate carbon black oil price paid by us (versus a particular reference price index), carbon black oil usage amounts and ongoing efficiency initiatives. Failure to fully offset the effects of fluctuating raw material or energy costs could have a material adverse effect on our business, financial condition, results of operations and cash flows. Further, volatility in costs and pricing could result in commercial disputes with suppliers and customers regarding the interpretations of complex contractual pricing arrangements, which could adversely affect our business.
Significant movements in the market price for crude oil tend to create volatility in our carbon black feedstock costs, which can affect our Net Working Capital, cash requirements and operating results. Most recently the International Maritime Organization introduced regulatory changes, known as “MARPOL”, to further restrict the sulfur emissions for the shipping industry beginning January 1, 2020. This has and could impact the prices and the availability of certain types of oil we use as feedstock for our products. Changes in raw material and energy prices have a direct impact on our Net Working Capital levels. Increases in the cost of raw materials lead to an increase in our Net Working Capital. Due to the quantity of carbon black oil and finished goods that we typically keep in stock together with the levels of receivables and payables maintained, increases occur gradually over a two to three-month period but can vary depending on inventory levels and working capital levels generally. Net Working Capital swings are particularly significant in an environment of high price volatility.
Any failure to realize benefits from investments, joint ventures, acquisitions or alliances could adversely affect our business, financial condition, results of operations and cash flows.
We have made, and may continue to make, investments and acquisitions and enter into joint ventures. The success of acquisitions of existing facilities, new technologies, companies and products, or arrangements with third parties is not always predictable and we may not achieve our anticipated objectives.
Plant capacity expansions and site development projects may be delayed and/or may not achieve the expected benefits.
Our ability to complete capacity expansions and consolidations as planned, including capacity conversions from rubber carbon black to specialty carbon black and vice versa, and other site development projects, including those associated with yield efficiency improvements or emission controls, may be delayed, interrupted, or otherwise limited by the need to obtain environmental and other regulatory approvals, unexpected cost increases, availability of labor and materials, unforeseen hazards such as weather or health conditions, and other risks customarily associated with construction projects. In addition, lower oil prices may result in lower yield efficiency improvements. Moreover, the costs of these activities could have a negative impact on our results of operations and capacity utilization at any particular facility may not be able to absorb the incremental costs associated with capacity expansion projects. In addition, our ability to expand capacity in emerging countries depends in part on economic and political conditions in these regions and, in some cases, on our ability to establish operations, construct additional manufacturing capacity or form strategic business alliances.
The capital expenditures we might need to incur under the EPA consent decree remain uncertain; timing, locations, target levels and other factors could also affect our ability to meet target emission levels and target dates under the EPA consent decree.
On June 7, 2018, a consent decree (the “EPA CD”) between Orion Engineered Carbons LLC (for purposes of this risk factor, “Orion”) and the United States on behalf of U.S. Environmental Protection Agency (“EPA”), as well as the Louisiana Department of Environmental Quality became effective. The consent decree resolves and settles the EPA’s claims of noncompliance set forth in the notices and finding of violations from the EPA with respect to the Company's U.S. facilities.
Under Orion’s EPA CD, Orion will install certain pollution control technology in order to further reduce emissions at its four U.S. manufacturing facilities in Ivanhoe (Louisiana), Belpre (Ohio), Borger (Texas), and Orange (Texas) over approximately six years. The EPA CD also requires the continuous monitoring of emissions reductions that Orion will need to comply with over a number of years. The installations for the Orange facility need to be in operation in 2020 and installations for the Ivanhoe facility in 2021. Orion has commenced the installation works for its Ivanhoe facility, and expects to complete the installation in this facility over the next year. Under the EPA CD, Orion can choose either its Belpre or Borger facilities as the next site for installation of pollution control equipment with comparable effectiveness to Ivanhoe. We expect the capital expenditures for installation of pollution control equipment in the remaining Orion facilities to decrease due to economies of scale and synergies from prior installations. We estimate the installations of monitoring and pollution control equipment at all four Orion plants in the U.S. will require capital expenditures of approximately $190 million, subject to the results of further scope design and estimation efforts presently underway. However, the actual total capital expenditures we might need to incur in order to fulfill the requirements of the EPA CD remain uncertain. The EPA CD allows some flexibility for Orion to choose among different technology solutions for reducing emissions and the locations where these solutions are implemented. The solutions Orion ultimately chooses to implement at its facilities other than Ivanhoe (Louisiana), may differ in scope and operation from those it currently anticipates for any and all of its four facilities, and factors, such as timing, locations, target levels, changing cost estimates and local regulations, could cause actual capital expenditures to significantly exceed current expectations or affect Orion’s ability to meet the agreed target emission levels or target dates for installing required equipment as anticipated or at all. Noncompliance with applicable emissions limits could lead to payments to the EPA or other penalties.
We may be subject to information technology systems failures, network disruptions, cybersecurity attacks and breaches of data security.
We rely on information technology systems to manage and operate our production facilities, business, process transactions, and summarize our operating results. Our information technology systems are an important element for effectively operating our business. Information technology systems failures, particularly in connection with running SAP, including risks associated with upgrading or timely updating our systems, network disruptions, missuses, cybercrime and breaches of data security, could disrupt our production as well as our operations by impeding our processing of transactions, our ability to protect customer or company information and our financial reporting, and lead to increased costs. It is possible that future technological developments could adversely affect the functionality of our computer systems and require further action and substantial funds to prevent or repair computer malfunctions. Our information technology systems, including our back-up systems, are subject to damage or interruption from power outages, computer and telecommunications failures, computer viruses, cybercrime, internal or external security breaches, catastrophic events such as fires, earthquakes, floods, tornadoes, hurricanes, acts of war or terrorism, and usage errors by our employees or third-party providers. Although we have taken extensive steps to address these concerns by implementing sophisticated network security, back-up systems and internal control measures, there can be no assurance that a system failure or data security breach will not have a material adverse effect on our business, financial condition, results of operations and cash flows. If our information technology systems are damaged or cease to function properly, we may have to make a significant investment to fix or replace them, and we may suffer loss of critical data and interruptions or delays in our production and operations. Any material disruption in our information technology systems, or delays or difficulties in implementing or integrating new systems or enhancing current systems, could have an adverse effect on our business, financial condition or results of operations.
We also face global cybersecurity threats, which may range from uncoordinated individual attempts to sophisticated and targeted measures, known as advanced persistent threats, directed at us. Cybersecurity attacks and security breaches may include, but are not limited to, attempts to access information, computer viruses, denial of service and other electronic security breaches.
We believe that we face a moderate threat of cybersecurity attacks. We have experienced non-material cybersecurity attacks in the past, and may experience them in the future, potentially with more frequency or sophistication. Based on information known to date, past
attacks have not had a material impact on our financial condition or results of operations. However, due to the evolving nature of cybersecurity threats, the scope and impact of any future incident cannot be predicted.
While we continually work to safeguard our systems and mitigate potential risks, there is no assurance that such actions will be sufficient to prevent cybersecurity attacks or security breaches that manipulate or improperly use our systems or networks, compromise confidential or otherwise protected information, destroy or corrupt data, or otherwise disrupt our operations. The occurrence of such events could negatively impact our reputation and our competitive position and could result in litigation with third parties, regulatory action, loss of business, potential liability and increased remediation costs, any of which could have a material adverse effect on our financial condition and results of operations. In addition, such attacks or breaches could require significant management attention and resources, and result in the diminution of the value of the Company’s investment in research and development and other assets. A breakdown in existing controls and procedures around the Company’s cybersecurity and security prevention environment may prevent us from detecting, reporting or responding to cybersecurity incidents in a timely manner and could have a material adverse effect on our financial condition or the market price of our securities.
In addition to supporting our operations, we use our systems to collect and store confidential and sensitive data, including information about our know-how, technology and business, as well as about our customers and our employees. As our technology continues to evolve, we anticipate that we will collect and store even more data in the future, and that our systems will increasingly use remote communication features that are sensitive to both willful and unintentional security breaches. Much of our value is derived from our confidential business information, including customer data, proprietary technology and trade secrets. To the extent the confidentiality of such information is compromised, we may lose our competitive advantage, and our business, financial condition, results of operations and cash flows may suffer. We also collect, retain and use personal information, including data we gather from customers for product development and marketing purposes, and data we obtain from employees. In the event of a breach in security that allows third parties access to this personal information, we are subject to a variety of laws on a global basis that require us to provide notification to the data owners, and that subject us to lawsuits, fines and other means of regulatory enforcement. Our reputation could suffer in the event of such a data breach, which could cause customers to purchase from our competitors. Ultimately, any compromise of our data security could have a material adverse effect on our business, financial condition, results of operations and cash flows.
If we are unable to successfully negotiate with the representatives of our employees, including labor unions and works councils, we may experience strikes and work stoppages.
We are party to collective bargaining agreements and social plans with our employees’ labor unions. In particular, 73% of our employees are covered by collective bargaining agreements. We also are required to consult with our employee representatives, such as works councils, on certain matters such as restructuring, acquisitions and divestitures. Although we believe that our relations with our employees are good, there can be no assurance that current agreements may be terminated, new agreements will be reached or consultations will be completed without union or works council actions or on terms satisfactory to us. Current and future negotiations and consultations with employee representatives could have a material adverse effect on our business. In addition, a material work stoppage or union dispute could adversely affect our business, financial condition, results of operations and cash flows.
We may not be able to recruit or retain key management and personnel.
Our success is dependent on the management and leadership skills of our key management and personnel. The loss of any member of our key leadership team and personnel or an inability to attract, retain, develop and maintain additional personnel could prevent us from implementing our business strategy. The loss of one or more member of our key management or operating personnel, or the failure to attract, retain and develop additional key personnel, could have a material adverse effect on our business, financial condition, results of operations and cash flows.
We are exposed to political or country risk inherent in doing business in some countries.
We operate a global network of production plants, located in Europe, North America, South Korea, China, South Africa and Brazil. Accordingly, our business is subject to risks related to the different legal, political, social and regulatory requirements and economic conditions of many jurisdictions. Risks inherent in international operations include the following: changes in the rate of economic growth, unsettled political or economic conditions, expropriation or other governmental actions; social unrest, war, terrorist activities or other armed conflict; national and regional labor strikes, confiscatory taxation or other adverse tax policies, trade and or tariff disputes between countries, deprivation of contract rights, trade regulations affecting production, pricing and marketing of products; reduced protection of intellectual property rights; restrictions on the repatriation of income or capital, exchange controls, inflation, deflation, currency fluctuations and devaluation, the effect of global environmental, health and safety issues, pandemics or epidemics, on economic conditions, market opportunities and operating restrictions, changes in foreign laws and tax rates, changes in trade sanctions or embargoes that result in losing access to customers and suppliers in those countries, costs associated with compliance with anti-bribery and anti-corruption laws, nationalization of private enterprises by foreign governments, and changes in financial policy and availability of credit or financing sources. These factors could adversely affect our business, financial condition, results of operations and cash flows.
Legal and Regulatory Risks
Our operations are subject to environmental, health and safety regulations. We have been and may in the future be subject to investigations by regulatory authorities in respect of alleged violations and may incur significant costs to maintain compliance with, and to address liabilities under, these laws and regulations.
We are subject to extensive domestic, foreign, federal, state and local laws and regulations governing environmental protection and occupational health and safety, all of which may be subject to change in the future. The production and processing of carbon black and other chemicals we produce involve the handling, transportation, manufacture, use and disposal of substances or components that may pose environmental risks or be considered toxic, hazardous or carcinogenic under these laws. We are also required to obtain permits or other approvals from various regulatory authorities for our operations, which may be required for matters including air emissions; wastewater and storm water discharges; storage, handling and disposal of hazardous substances; remediation of soil or buildings and operation, maintenance and closure of landfills. If we violate, or are found to have violated or otherwise fail to comply with these laws, regulations or permits or other approvals, or fail to receive the timely renewal of and due application for required permits, we may have to limit production, we may incur fines or other sanctions, be required to undertake significant capital expenditures to achieve compliance, or be subject to other obligations by one or more regulatory authorities.
If environmental harm to soil, groundwater, surface water or natural resources is found to have occurred as a result of our current or historical operations, we may be required to incur significant remediation costs at our current or former production facilities or at third-party sites. Many of our facilities have a long history of operation, which may contribute to our environmental compliance and remediation costs due to past spills, chemical storage, wastewater treatment and waste disposal practices and other activities. For instance, many of our facilities have onsite landfills that have been in use for a number of years, and we may incur significant costs when these landfills reach capacity in order to close them in accordance with applicable laws and regulations and to address contamination of soil and groundwater at, under or migrating from the facilities, including costs to address impacts to natural resources. Under certain laws and regulations, the obligations to investigate and remediate contamination at a facility or site may be imposed on current and former owners or operators, or on persons who may have sent waste to that facility or site for disposal. Liability under such laws and regulations may be without regard to fault or to the legality of the activities giving rise to the contamination. As a result, we may incur liabilities for wastes, including hazardous wastes, generated by our operations and disposed of onsite or at offsite locations, even if we were not responsible for the disposal. Further, we may also incur additional closure and cleanup costs in connection with the closure of plants or separate feedstock storage sites, including costs relating to decommissioning of equipment, asbestos removal and closure of features such as storage tanks, wastewater treatment systems, ponds and landfills.
We store carbon black oil and other substances in underground and above ground storage tanks. Our operations are also subject to significant hazards and risks inherent in storing carbon black oil and carbon black products. These hazards and risks include fires, explosions, spills, discharges and other releases, any of which could result in distribution difficulties and disruptions, environmental pollution, governmentally imposed fines or clean up obligations, personal injury or wrongful death claims and other damage to our properties and the properties of others.
Environmental and safety regulations are subject to frequent change, as are the priorities of those who enforce them, and we could incur substantial costs to comply with future laws and regulations. The trend in environmental regulation is imposing increasingly stringent restrictions on activities that may affect the environment. Any new or amended environmental laws and regulations may result in costly measures for matters subject to regulation, including but not limited to more stringent limits or control requirements for our air emissions; new or increased compliance obligations relating to GHG emissions; stricter requirements for noise, waste handling, storage, transport, disposal, wastewater and storm water discharges; and more stringent cleanup and remediation standards, which, in each case, could have a material adverse effect on our operations and financial condition.
Certain national and international health organizations have classified carbon black as a possible or suspect human carcinogen. To the extent that, in the future, (i) these organizations re-classify carbon black as a known or confirmed carcinogen, (ii) other organizations or government authorities in other jurisdictions classify carbon black or any of our other finished products, raw materials or intermediates as suspected or known carcinogens or (iii) there is discovery of adverse health effects attributable to the production or use of carbon black or any of our other finished products, raw materials or intermediates, we could be required to incur significantly higher costs to comply with environmental, health and safety laws, or to comply with restrictions on sales of our products, and our reputation and business could be adversely affected. In addition, chemicals that are currently classified as harmless may be classified as dangerous in the future, and our products may have characteristics that are not recognized today but may be found in the future to impair human health or to be carcinogenic. See “Item 1. Business—Environmental, Health and Safety Matters.”
Regulations requiring a reduction of or additional taxes of fees on greenhouse gas emissions could adversely affect our business, financial condition, results of operations and cash flows and increased awareness and adverse publicity about potential impacts on the climate change by us or other companies in our industry could harm our reputation
Significant volumes of carbon dioxide (“CO2”), a GHG, are emitted in carbon black manufacturing processes. Over the past few decades, concerns about the relationship between GHGs and global climate change have resulted in increased levels of scrutiny from regulators, investors and the public alike, and have led to proposed and enacted regulations on both national and supranational levels, to monitor, regulate, control and tax emissions of CO2 and other GHGs. Investors have also begun to voice concern about sustainability and
climate change as it relates to their investment decisions. Increased awareness in the investment community and any adverse publicity in the global marketplace about potential impacts on climate change by us or other companies in our industry could harm our reputation.
The international community continues to negotiate a binding treaty that would require reductions in GHG emissions by developed countries. In addition, a number of further measures addressing GHG emissions may be implemented, such as a successor international agreement, if any, to the Kyoto Protocol and the European Union’s proposal to consider raising its commitment to reduce carbon emissions by 20% to a 40% reduction by 2030 (compared to 1990 emission levels). The United Nations Conference on Climate Change in December 2015 led to the creation of the Paris Agreement and encourages countries to continuously review and improve their GHG emission reduction goals. While signing the Paris Agreement does not legally bind countries to reduce GHG emissions, countries that participate may respond by enacting legislation or regulations in order to progress in lowering GHG emissions. In the United States, Congress has from time to time considered legislation to reduce emissions of GHGs, but no comprehensive legislation has been enacted to date, and significant uncertainty currently exists as to how any such GHG legislation or regulations would impact large stationary sources, such as our facilities in Belpre (Ohio), Borger (Texas), Orange (Texas) and Ivanhoe (Louisiana), and what costs or operational changes these regulations may require in the future. The current administration has withdrawn from the Paris Agreement. There are currently no efforts within the US Congress or the EPA to proceed with additional GHG regulations on a national level. However, almost one-half of the U.S. states have taken legal measures to reduce emissions of GHGs, primarily through the development of GHG emission inventories and/or regional or state GHG cap-and-trade programs. There are also ongoing discussions and regulatory initiatives in other countries, including in Brazil and South Korea where we have facilities, regarding GHG emission reduction programs, but those programs have not yet been defined. There is no assurance that, in the future, the current level of regulation will continue in the jurisdictions where we operate. In addition several countries, including the European Union, are currently evaluating further and more restrictive regulations to reduce GHG emissions.
Compliance with current or future GHG regulations governing our operations may result in significantly increased capital expenditures for measures such as the installation of more environmentally efficient technology or the purchase of allowances to emit carbon dioxide or other GHGs. While their potential effect on our manufacturing operations or financial results cannot be estimated, it could be substantial. There is no way to predict the form that future regulations may take or to estimate any costs that we may be required to incur with respect to these or any other future requirements. In addition to the increased expenditures outlined above, such requirements could also adversely affect our energy supply, or the costs (and types) of raw materials we use, and ultimately may directly or indirectly restrict our operations or reduce demand for our products. The realization of any or all of these consequences could have a material adverse effect on our business, financial condition, results of operations and cash flows. See “Item 1. Business—Environmental, Health and Safety Matters.”
Developing regulation of carbon black as a nano-scale material could require us to comply with costly new requirements.
Carbon black consists of aggregates of primary nano-scale particles. The EPA and other governmental agencies are currently developing a regulatory approach under which they will collect further data on nano-scale materials, including carbon black, under the Toxic Substances Control Act (“TSCA”). The EPA has proposed rules that would require manufacturers of nano-scale materials to submit additional manufacturing information, exposure and release information and available health and safety data. Based on a review of the Rule and the Working Guidance issued by the EPA, it is the determination of the International Carbon Black Association (ICBA) that carbon black is not subject to reporting under the TSCA 8(a) Reporting Rule. However, the EPA and other nations’ environmental regulatory authorities, including the European Commission, are also conducting extensive environmental health and safety testing of nano-scale materials. If carbon black is found to be harmful to humans and/or to the environment, it could be subject to more stringent regulatory control, which could require us to incur significantly higher costs to comply with new environmental, health and safety laws and could adversely affect our reputation and business. See “Item 1. Business—Environmental, Health and Safety Matters.”
Parallel to the TSCA, the European Commission is in the process of defining “nano-material”. According to its recommendation of October 18, 2011 (2011/696/EU) carbon black is defined as a nano-material. In a similar approach, the International Organization for Standardization (“ISO”) developed the ISO TC 229 “Nanotechnologies,” which considers carbon black a “nano-structured material.” The industry is not yet generally affected by these definitions. However, certain regulations regarding cosmetics applications or articles which are intended for food contact have already been implemented, and other regulations are being discussed which may affect the use of carbon black in the future. This development may significantly affect our business in a manner we cannot predict, including by increasing the costs of doing business or decreasing the marketability of our products.
Our operations have the potential to cause environmental and other damage as well as personal injury.
The operation of a chemical manufacturing business as well as the sale and distribution of chemical products involve safety, health and environmental risks. For example, the production and processing of carbon black and other chemicals involves the storage, handling, transportation, manufacture or use of certain substances or components that may be considered toxic or hazardous. Our manufacturing processes and the storage and transportation of chemical products entail risks such as leaks, fires, explosions, toxic releases or mechanical failures. If operational risks materialize, they could result in injury or loss of life, damage to the environment or damage to property. In addition, the occurrence of material operating problems at our facilities due to any of these hazards may result in loss of production, which, in turn, may make it difficult for us to meet customer needs. Accordingly, these hazards and their consequences could have a material adverse effect on our business, financial condition, results of operations and cash flows, both during and after the period of operational difficulties, and could harm our reputation.
The European Union REACh legislation or similar legislation in other countries may affect our ability to manufacture and sell certain products.
In December 2006, the European Union signed the REACh (Registration, Evaluation, Authorization and Restriction of Chemicals) legislation. This legislation requires chemical manufacturers and importers in the European Union to demonstrate the safety of the chemical substances contained in their products through a substance registration process. We have registered under REACh, which is a functional prerequisite to the continued sale of our products in the European Union markets. REACh presents a risk to the continued sale of our products in the European Union should our existing classification registration no longer apply as a result of changes in the interpretation of REACh by the authorities, changes in our product mix or purity, or if the European Union seeks to ban or materially restrict the production or importation of the chemical substances used in our products. In March 2016, the European Chemical Agency (ECHA) announced a carbon black substance evaluation, and carbon black was included in the Community Rolling Action Plan (CoRAP). CoRAP listed substances have been prioritized for substance evaluation. The reasons for including carbon black in CoRAP are carbon black being suspected of posing a risk to human health (carcinogenic, suspected reproduction toxicant), exposure of workers, exposure of sensitive populations and a high (aggregated) tonnage and use potential. The evaluation, which will be conducted by ANSES (the French Agency for Food, Environmental and Occupational Health & Safety), is scheduled to take place from 2020 to 2022 under the draft CoRAP (which is likely to be adopted in 2020). The outcome of the evaluation will be of significant importance for the carbon black industry.
Additionally, other organizations and countries, including South Korea and China, have adopted or may in the future adopt comparable or even more restrictive regulations than REACh, which could affect our ability to manufacture and sell certain products in the future.
In certain jurisdictions, carbon black has been added to lists of hazardous products that are subject to labeling and other requirements. Compliance with these requirements is required to sell our products in these jurisdictions, and noncompliance may result in material fines or penalties. Changes in the classification of carbon black on these lists or to the applicable regulations could result in more stringent or new requirements and adversely affect our compliance costs. See “Item 1. Business—Environmental, Health and Safety Matters.”
Market and regulatory changes may affect our ability to sell or otherwise benefit from co-generated energy, which may adversely affect our business, results of operations and cash flows.
Currently, eight of our manufacturing sites have some form of co-generation transforming combustible exhaust gas, the main by-product of the carbon black production process, into electricity, steam or hot water. Some of this co-generated energy is self-consumed and the excess may be sold to third parties. Our ability to benefit from co-generation, and in particular our ability to sell it to third parties, may be limited due to general market conditions or regulatory changes, which may adversely affect our business, results of operations and cash flows.
In December 2013, the European Commission opened an in-depth investigation into certain exemptions from an energy surcharge granted under the German Renewable Energies Act (Erneuerbare-Energien-Gesetz or “EEG”). Under the EEG, energy intensive industries are exempted to a large extent from the energy surcharge that aims to balance above-market payments for green energy. Another exemption exists for the consumption of self-generated electricity. The German legislature amended the national regulations of the EEG in August 2014. Under new regulations, the exemption regarding self-consumption (Eigenverbrauch) of self-produced electricity is grandfathered for power plants that were installed before August 1, 2014. Our German production facilities are exempted from the energy surcharge under the current law to the extent that we consume our self-produced energy. However, a potential loss of this benefit due to a future change in legislation or a change in the material setup of any of our plants may adversely affect our business, results of operations and cash flows.
Litigation or legal proceedings could expose us to significant liabilities and thus adversely affect our business, financial condition, results of operations and cash flows.
From time to time, we may be involved in various claims and lawsuits arising in the ordinary course of our business. In particular, certain asbestos related claims have been filed with respect to time periods when Evonik and other preceding owners were in control of our business. Some of those claims are subject to a limited indemnity from Evonik under the agreements related to the Acquisition. Some matters are not covered by an indemnity and involve claims for large amounts of damages as well as other relief. Additional claims by (former) employees based on alleged past exposure to asbestos have been received by the Company and may be received in the future.
The outcome of legal proceedings is extremely difficult to predict and we offer no assurances in this regard. Adverse rulings, judgments or settlements in pending or future litigation, including employment-related litigation, contract litigation, intellectual property disputes, product liability claims, personal injury claims, claims based on alleged exposure to asbestos, chemicals or to carbon black, environmental permitting disputes or in connection with environmental remediation activities, could have an adverse effect on our business, financial condition, results of operations and cash flows.
Because many of our products provide critical performance attributes to our customers’ applications and products, the sale of these products involves a risk of product liability claims against us, including claims arising in connection with the use of, or exposure to, our products. Our products have widespread end-uses in a variety of consumer industries. A successful product liability claim, or series of claims, arising out of these various uses that results in liabilities in excess of our insurance coverage or for which we are not indemnified or have not otherwise provided, could have a material adverse effect on our business, financial condition, results of operations and cash flows.
In particular, we could be required to increase our debt or divert resources from other investments in our business in order to discharge any such liabilities.
We may not be able to protect our intellectual property rights successfully
Our intellectual property rights are important to our success and competitive position. We own various patents and other intellectual property rights, and have licenses to use intellectual property rights covering some of our products as well as certain processes and product uses. We often choose not to seek to patent a production method or product in order to avoid disclosure of business specific know-how. In addition to patents, a significant part of our intellectual property are our trade secrets, general know-how and experience regarding manufacturing technology, plant operation and quality management, which third parties, including our competitors, may develop independently without violating our trade secret rights. We make careful assessments with respect to production process improvements and decide whether to apply for patents or retain and protect them as trade secrets. In some of the countries in which we operate or sell products, such as China, the laws protecting patent holders are significantly weaker than in the United States, the European Union and certain other countries. When we file a patent application, it is usually filed for all countries with active competition, where we have existing customers. Nonetheless, because the laws and enforcement mechanisms in some countries may not be as effective as in others, and because our intellectual property rights may, if asserted, ultimately be found to be invalid or unenforceable, we may not be able to protect all of our intellectual property rights successfully. Insufficient protection of intellectual property may limit our ability to make use of technological advantages or result in a reduction of future profits. This may cause competitive restrictions and may have an adverse effect on our business, financial condition, results of operations and cash flows.
We may also be subject to claims that our products, processes or product uses infringe or misappropriate the intellectual property rights of others. These claims, even if without merit, can be expensive and time consuming to litigate. We are, for example, currently in a dispute with Haldor Topsoe in which we may not ultimately prevail. In such proceedings, we have asserted certain patent and contractual rights against Haldor Topsoe seeking monetary and injunctive relief, and Haldor Topsoe has asserted certain patent, contractual and common law claims seeking monetary and declaratory relief. If we were to suffer an adverse ruling, we could be subject to injunctions, obliged to pay damages or enter into licensing agreements requiring royalty payments and use restrictions, all of which could adversely affect our business, financial condition, results of operations and cash flows. In addition, licensing agreements may not be available to us, and, if available, may not be available to us on acceptable terms.
In connection with the separation of our business from Evonik, Evonik assigned to us intellectual property that was exclusively used in its carbon black business as well as certain intellectual property rights that are still in use in its retained business. Evonik retained ownership of certain intellectual property that is not material to us. Evonik has granted us a non-exclusive license to use such retained intellectual property in the field of carbon black. In addition, we have granted back to Evonik licenses relating to some of our intellectual property rights to use such intellectual property in all fields outside the field of carbon black, which licenses are exclusive, subject to certain exceptions in areas adjacent to carbon black. Accordingly, we may be restricted in leveraging the intellectual property that we use on the basis of a license from Evonik or the intellectual property that is subject to the grant-back licenses to expand our business into fields outside of carbon black.
Risks Related to Indebtedness, Currency Exposure and Other Financial Matters
Our leverage may make it difficult for us to service our debt and operate our businesses.
We are leveraged with recurring debt service obligations and expect to continue to have comparable leverage for the foreseeable future. We may as well incur more debt in the future. This may have negative consequences for our business and investors, including requiring that a substantial portion of the cash flows from our operations be dedicated to debt service obligations; reducing the availability of cash flows to fund internal growth through working capital, Capital Expenditures, other general corporate purposes and payments of dividends; increasing our vulnerability to economic downturns in our industry; exposing us to interest rate increases on our existing indebtedness and indebtedness that we may incur in the future; placing us at a competitive disadvantage compared to our competitors that have less debt in relation to cash flows; limiting our flexibility in planning for or reacting to changes in our business and our industry; restricting us from pursuing strategic acquisitions or exploiting certain business opportunities; and limiting, among other things, our ability to borrow additional funds or raise equity capital in the future and increasing the costs of such additional financings.
If our future cash flows from operations and other capital resources are insufficient to pay our obligations as they mature or to fund our liquidity needs, we may be forced to reduce or delay our business activities and capital expenditures, sell assets, obtain additional debt or equity financing, restructure or refinance all or a portion of our debt on or before maturity or reduce our dividend. In the worst-case scenario, an actual or impending inability to pay debts as they become due and payable could result in our insolvency or an insolvency of one or more of our subsidiaries.
Restrictive covenants in our debt instruments may limit our ability to operate our business. Our failure to comply with these covenants, including as a result of events beyond our control, could result in an event of default that may adversely affect our business, financial condition, results of operations and cash flows.
Our current debt instruments impose some operating and financial restrictions on us. These restrictions include limitations on our ability to, among other things, merge or consolidate with other companies; sell, lease, transfer or dispose of assets; pay dividends, redeem share capital or redeem or reduce subordinated indebtedness; and make acquisitions or investments.
Our debt instruments contain covenants that may adversely affect our ability to finance our future operations and capital needs and to pursue available business opportunities. Our ability to comply with these provisions may be affected by changes in economic or business conditions or other events beyond our control. In addition, our debt instruments contain cross-default provisions such that a default under one particular financing arrangement could automatically trigger defaults under other financing arrangements and cause such indebtedness to become due and payable, together with accrued and unpaid interest. As a result, any default under an indebtedness to which we are party could result in a substantial loss to us and could adversely affect our business, financial condition, results of operations and cash flows.
A deterioration in our financial position or a downgrade of our ratings by a credit rating agency could increase our borrowing costs and our business relationships could be adversely affected.
A deterioration of our financial position or a downgrade of our credit ratings for any reason could increase our borrowing costs and have an adverse effect on our business relationships as well as on the payments and other terms agreeable with customers, suppliers and hedging counterparties. We may enter into various forms of hedging arrangements against currency, interest rate or oil price fluctuations. Financial strength and credit ratings are important to the availability and pricing of these hedging activities. As a result, any downgrade of our credit ratings may make it more costly for us to engage in these activities, and changes to our level of indebtedness may make it more difficult or costly for us to engage in these activities in the future.
In addition, a downgrade could adversely affect our existing financing, limit access to the capital or credit markets, or otherwise adversely affect the availability of other new financing on favorable terms, if at all, result in more restrictive covenants in agreements governing the terms of any future indebtedness that we incur, increase our borrowing costs, or otherwise adversely affect our business, financial condition, results of operations and cash flows.
Fluctuations in foreign currency exchange and interest rates could adversely affect our business, financial condition, results of operations and cash flows
We are exposed to market risks relating to fluctuations in foreign currency exchange and interest rates. Our results of operations may be affected by both the transaction effects and the translation effects of foreign currency exchange rate fluctuations. We are exposed to currency fluctuation when we convert currencies that we may receive for our products into currencies required to pay our debt, or into currencies in which we purchase raw materials, meet our fixed costs or pay for services, which could result in a gain or loss depending on fluctuations in exchange rates. Fluctuations in currency exchange rates could require us to reduce our prices to remain competitive in foreign markets. In each case, the relevant income or expense is reported in the relevant local currency and translated into U.S. Dollar at the applicable currency exchange rate for inclusion in our consolidated financial statements. Therefore, our financial results in any given period are materially affected by fluctuations in the value of the U.S. Dollar relative to other currencies, in particular the Euro, the Korean Won and Chinese Renminbi. Generally, a depreciation of Euro against the U.S. Dollar has a negative impact on (by increasing) our Net Working Capital, because a large part of our raw material are purchased by and held at entities using the Euro. In addition, 56.3% of our outstanding debt obligations are denominated, pay interest in and must be repaid in Euro (and certain of our future debt obligations may be denominated in Euro), and therefore expose us to additional exchange rate risks. An appreciation of the Euro would make our financing under Euro-denominated instruments more expensive. Significant changes in the value of the U.S. Dollar relative to the other currencies could have a material adverse effect on our business, financial condition, results of operations and cash flows. In addition, we are exposed to adverse changes in interest rates. We manage our foreign exchange risk through normal operating and financing activities and, when deemed appropriate, through the selective use of derivative transactions, the effectiveness of which is dependent, in part, upon the counterparties to these contracts honoring their financial obligations to us. We cannot be certain that we will be successful in reducing the risks inherent in exposures to foreign currency and interest rate fluctuations, and our financial results could be adversely affected.
From time to time, it may be necessary for us to enter into hedging arrangements to reduce the impact of price and exchange rate volatility. Unavailability or inefficiency of hedging could adversely affect our business, financial condition, results of operations and cash flows.
In the past, we have entered into certain hedging arrangements to reduce the impact of raw material and energy price volatility as well as interest rate and currency exchange rate fluctuations. It may be necessary for us to enter into hedging arrangements in the future to reduce the impact of raw material or energy price volatility or currency and exchange rate fluctuation, which may or may not be effective. The use of derivative hedging instruments is generally dependent on the availability of adequate credit lines with appropriate financial institutions. As a result, we could be unable to use derivative financial instruments in the future, to the extent necessary or on commercially reasonable terms, and any hedging strategy we employ could therefore be adversely affected. The effectiveness of our derivative hedging instruments will also depend on the relevant hedging counterparties honoring their financial obligations. Any failure by a hedging counterparty to perform its obligations could adversely affect our business, financial condition, results of operations and cash flows.
Geopolitical events in the EU, and in particular ultimate future relations between the EU and UK following the “Brexit,” may impact the Euro and as a result, our business, financial condition, results of operations and cash flows.
On February 1, 2020 the EU membership of United Kingdom (the “U.K.”) formally ceased, as a direct result of a referendum held on June 23, 2016 in the U.K. in which a majority voted to exit the EU. This referendum has come to be known as “Brexit”. At this time, the U.K.’s future relationship to the EU is not yet formally agreed upon. During a transition period until December 31, 2020 previously existing membership regulations remain effective. If no mutual agreements were to be reached by December 31, 2020, this could result in a considerable uncertainty as to the ongoing terms of the U.K’s relationship with the EU, including the terms of trade between the U.K. and the EU, and a likely negative impact on all parties. The Brexit vote has given rise to calls for the governments of other European Union member states to consider withdrawal. These developments, or the perception that any of them could occur, have caused and may continue to cause significant volatility in global financial markets as well as adversely affect the exchange rate of the Euro with respect to the U.S. Dollar, which as described under “—Fluctuations in foreign currency exchange and interest rates could adversely affect our business, financial condition, results of operations and cash flows” above, could have an adverse effect on us.
Political, social and economic uncertainty and changes arising from Brexit, may have a negative impact not only on the economy of the U.K. but also on the economies of non-U.K. EU and EEA countries and the overall stability of the Euro. Should the Euro dissolve entirely, the legal and contractual consequences for holders of Euro-denominated obligations and for parties subject to other contractual provisions referencing the Euro would be determined by laws in effect at such time. These potential developments, or market perceptions concerning these and related issues, could have adverse consequences for us with respect to our outstanding Euro-denominated debt obligations and, as we have a substantial amount of debt denominated in Euro, could adversely affect our business, financial condition, results of operations and cash flows.
Dislocations in credit and capital markets may make it more difficult for us and our suppliers and customers to borrow money or raise capital.
Dislocations in the credit markets may result in less credit being made available by banks and other lending institutions. As a result, we may not be able to obtain financing for our business and acquisitions or to pursue other business plans or make necessary investments, which could have a material adverse effect on our business, financial condition, results of operations and cash flows.
Furthermore, a number of our customers and suppliers rely on access to credit to adequately fund their operations, which may also be limited due to dislocations in the credit markets. The inability of our customers to obtain credit facilities or capital market financing may adversely affect our business by reducing our sales and increasing our exposure to bad debt, while the inability of our suppliers to access adequate financing may adversely affect our business by increasing prices for raw materials, energy and transportation.
In addition, payments received from customers that later enter into insolvency or comparable proceedings under applicable laws may be subject to claw back risks.
We may be required to impair or write off certain assets if our assumptions about future sales and profitability prove incorrect.
In analyzing the value of our inventory, property, plant and equipment, investments and intangible assets, we have made assumptions about future sales (prices and volume), costs and cash generation. These assumptions are based on management’s best estimates and, if the actual results differ significantly from these assumptions, we may not be able to realize the value of the assets recorded, which could lead to an impairment or write-off of certain of these assets and that could have a material adverse effect on our business, financial condition and results of operations.
We may be required to increase our pension fund contributions.
We have made pension commitments to our existing and some of our former employees. These commitments are partially covered by pension schemes, pension and benevolent funds and insurance policies some of which are maintained by previous employers. The amount of obligations is based on certain actuarial assumptions, including discount factors, life expectancy, pension trends and future salary development as well as expected interest rates applicable to the plan assets. Actual results deviating from these assumptions could result in a considerable increase of our pension commitments and liabilities and higher allocations to the pension reserves in future years, which could have a material adverse effect on our business, financial condition, results of operations and cash flows. For a more detailed description of our defined benefit plans see our consolidated financial statements and the related notes included in “Item 8. Financial Statements and Supplementary Data” of this report.
Our insurance coverage may not be adequate to cover all the risks we may face and it may be difficult to obtain replacement insurance on acceptable terms or at all.
Our plants, equipment and other assets are insured for property damage and business interruption risks, and our business as a whole is insured for public and products liability risks as well as certain bad debt losses in Europe under insurance policies with reputable insurance companies. We believe these insurance policies are generally in accordance with customary industry practices, including deductibles and coverage limits. However, we cannot be fully insured against all potential hazards incident to our business, including losses resulting from war risks or terrorist acts, or all potential losses, including damage to our reputation. If we were to incur a significant
liability for which we were not fully insured, it could have a material adverse effect on our business, financial condition, results of operations and cash flows.
As a result of market conditions, premiums and deductibles for certain insurance policies can increase substantially and, in some instances, certain insurance may become unavailable at a reasonable cost or available only for certain risks. We can provide no assurances that we would be able to obtain replacement insurance on acceptable terms or at all.
Significant changes in our jurisdictional earnings mix or in the tax laws of those jurisdictions, as well as changes in their interpretation, could adversely affect our business, financial condition, results of operations and cash flows.
Our future tax rates may be adversely affected by a number of factors, including the enactment of new tax legislation such as the U.S. tax reform, other changes in tax laws or the interpretation of such tax laws, changes in the estimated realization of our net deferred tax assets (arising, among other things, from tax loss carry forwards and the Acquisition), the jurisdictions in which profits are determined to be earned and taxed, adjustments to estimated taxes upon finalization of various tax returns, increases in expenses that are not deductible for tax purposes, including write-offs of acquired in process R&D and impairment of goodwill in connection with acquisitions, changes in available tax credits and additional tax or interest payments resulting from tax audits with various tax authorities. Losses for which no tax benefits can be recorded could materially impact our tax rate and its volatility from period to period. Any significant change in our jurisdictional earnings mix or in the tax laws in those jurisdictions, as well as changes in their interpretation, could increase our tax rates and adversely affect our financial results in those periods.
Our agreements with Evonik in connection with the Acquisition require us to indemnify Evonik with respect to certain aspects of our business and require Evonik to indemnify us for certain retained liabilities. We cannot offer assurance that we will be able to enforce claims under these indemnities as we expect.
In connection with the Acquisition, we agreed to indemnify Evonik with respect to future liabilities related to our business and Evonik agreed to indemnify us, subject to certain limitations, for certain liabilities that it agreed to retain. Our potential exposure for such liabilities could be significant. There can be no assurance that we will be able to enforce our claims under the indemnity from Evonik. Even if we ultimately succeed in recovering from Evonik any amounts for which we are held liable, we may be temporarily required to bear these losses ourselves. In addition, our ability to enforce claims under our indemnity from Evonik is dependent on Evonik’s creditworthiness at the time we seek to enforce these claims, and there can be no assurance as to what Evonik’s financial condition will be in the future. In particular, the agreement with Evonik provides for a partial indemnity from Evonik against various exposures, including, but not limited to, capital investments, fines and costs arising in connection with Clean Air Act violations that occurred prior to July 29, 2011. Almost all of the allegations made by the EPA with regard to Company’s U.S. facilities relate to alleged violations before July 29, 2011. The indemnity provides for a recovery from Evonik of a share of the costs (including fines), expenses (including reasonable attorney’s fees, but excluding costs for maintenance and control in the ordinary course of business and any internal cost of monitoring the remedy), liabilities, damages and losses suffered and is subject to various contractual provisions including provisions set forth in the Share Purchase Agreement with Evonik, such as a de minimis clause, a basket, overall caps (which apply to all covered exposures and all covered environmental exposures, in the aggregate), damage mitigation and cooperating requirements, as well as a statute of limitations provision. Due to the cost-sharing and cap provisions in Evonik’s indemnity, we expect that substantial costs we will incur in the EPA enforcement initiative and its respective settlement could exceed the scope of the indemnity in the tens of millions of dollars. In addition, Evonik has signaled that it may likely defend itself against claims under the indemnity; while we intend to enforce our rights vigorously and we have initiated arbitration proceedings, there is no assurance that we will be able to recover costs or expenditures incurred under the indemnity as we expect or at all.
We could experience a material adverse effect on our financial condition if the tax authorities were to successfully challenge decisions and assumptions we have made in assessing and complying with our tax obligations.
We make, and have in the past made, numerous decisions and assumptions in assessing and complying with our tax obligations, including in respect of the tax treatment of the separation of our business from Evonik, the Acquisition, assumptions regarding the tax deductibility of certain interest expenses under German tax regulations, the upholding and recognition of our German tax group and the applicability of the regulations to our business as a group headquartered by a Luxembourg company. Many of the tax laws that apply to us, including tax laws that apply to the separation of our business from Evonik and the Acquisition, are complex and often require judgments to be made when the law is unclear or the facts are uncertain. While we believe the decisions we have made and the assumptions and practices we have applied are reasonable and accurate, we cannot guarantee that these decisions, assumptions and practices will not be questioned or rejected by the tax authorities. In particular, we are subject to tax audits for the period in which the Acquisition occurred by tax authorities in multiple jurisdictions worldwide, and in many cases these audits have not yet begun or have not been completed and could give rise to issues of this kind. If these tax authorities were to successfully challenge such decisions or assumptions, we could be required to pay additional amounts to such authorities to satisfy our tax obligations, which could have a material adverse effect on our business, financial condition, results of operations and cash flows. In particular, the German tax authorities are conducting their first audit of Orion Engineered Carbons GmbH following the Acquisition. Currently, we are unable to assess when this audit will be completed or the possible outcome of this audit. While currently we do not believe this audit will have a material adverse impact on our financial position, it could raise one or more issues of the kind referenced above.
Risks Related to Ownership of our Common Shares
Business dynamics and exchange rate fluctuations may reduce the amount of U.S. Dollars shareholders receive in respect of any dividends or other distributions we may pay in the future in connection with our common shares.
Under Luxembourg law, the determination of whether we have sufficient distributable profits to pay dividends is made on the basis of our unconsolidated annual financial statements prepared under the Luxembourg Company Law in accordance with accounting principles generally accepted in Luxembourg and in Euros. Exchange rate fluctuations may affect the amount in Euro that we are able to distribute, and the amount in U.S. Dollars that our shareholders receive upon the payment of cash dividends or other distributions if we declare and pay in Euro, if any. Such fluctuations could adversely affect the value of our common shares, and, in turn, the U.S. Dollar proceeds that holders receive from the sale of our common shares.
We cannot assure investors that we will continue to pay dividends on our common shares at historical rates or at all.
Our ability to continue to pay dividends on our common shares at historical rates or at all is subject to the discretion of our board of directors and will depend on a number of factors, including, among others, our financial condition and results of future operations, growth opportunities and restrictive covenants in our debt instruments. If we do not maintain or periodically increase the dividend on our common shares, it may have an adverse effect on the market price of our common shares.
Failure to maintain effective internal controls in accordance with Section 404 of Sarbanes-Oxley could have a material adverse effect on our business and share price.
As a public company, we are required to document and test our internal control over financial reporting in order to satisfy the requirements of Section 404 of the Sarbanes-Oxley Act of 2002 (“Sarbanes-Oxley”), which requires, an annual report on management’s assessment of the effectiveness of our internal control over financial reporting and a report by our independent registered public accounting firm that addresses the effectiveness of internal control over financial reporting. During this process, we may identify deficiencies that we may not be able to remediate in a timely manner to meet our deadline for compliance with Section 404 or that constitute a material weakness, which could require a restatement or other revision of our financial statements. Testing and maintaining internal control could divert our management’s attention from other matters that are important to the operation of our business, increase our legal and financial compliance costs and make some management activities more difficult, time consuming and costly. We may not be able to conclude on an ongoing basis that we have effective internal control over financial reporting in accordance with Section 404 or our independent registered public accounting firm may not issue an unqualified report on the effectiveness of our internal control over financial reporting. In such an event, we could not be certain that our financial statements will be accurate and investors could lose confidence in our reported financial information, which would likely have a negative effect on the trading price of our common shares. In addition, if we do not maintain effective internal controls, we may not be able to accurately report our financial information on a timely basis, which could harm the trading price of our common shares, impair our ability to raise additional capital, or jeopardize our stock exchange listing.
If securities or industry analysts do not continue to publish research or reports about our business, or if they adversely change their recommendations regarding our common shares, the market price and trading volume of our common shares could decline.
The trading market for our common shares will be influenced by research or reports that industry or securities analysts publish about our business. If one or more analysts who cover us downgrade our common shares, the market price for our common shares would likely decline. If one or more of these analysts cease to cover us or fail to regularly publish reports on us, we could lose visibility in the financial markets, which, in turn, could cause the market price or trading volume for our common shares to decline.
We are required to comply with the Exchange Act’s domestic reporting regime.
We lost our “foreign private issuer” status as such term is defined in Rule 405 under the Securities Act. As a result, as of January 1, 2020, we are required to comply with the Exchange Act reporting and other requirements applicable to U.S. domestic issuers, which are more detailed and extensive than the requirements for foreign private issuers. We have been required to make changes in our corporate governance practices in accordance with various SEC and NYSE rules. In addition, our officers and directors are no longer exempt from the reporting and “short-swing” profit recovery provisions of Section 16 of the Exchange Act and related rules with respect to their purchase and sales of our securities. Our loss of foreign private issuer status caused transitory costs, may increase our legal and financial compliance costs in the future and has made some activities highly time consuming and costly.
The rights of our shareholders may differ from the rights they would have as shareholders of a U.S. corporation, which could adversely affect trading in our common shares and our ability to conduct equity financings.
Our corporate affairs are governed by our Articles of Association and the laws of Luxembourg, including the Luxembourg Company Law (loi du 10 août 1915 concernant les sociétés commerciales, telle quelle a été modifiée). The rights of our shareholders and the responsibilities of our directors and officers under Luxembourg law are different from those applicable to a corporation incorporated in the United States. Luxembourg laws may not be as extensive as those in effect in the United States, and Luxembourg law and regulations in respect of corporate governance matters might not be as protective of minority shareholders as state corporation laws in the United States.
As a result, our shareholders may have more difficulty in protecting their interests in connection with actions taken by our directors and officers than they would as shareholders of a corporation incorporated in the United States.
We are organized under the laws of the Grand Duchy of Luxembourg and it may be difficult to obtain or enforce judgments or bring original actions against us or the members of our Board of Directors in the United States.
We are organized under the laws of the Grand Duchy of Luxembourg and the majority of our assets are located outside the United States. Furthermore, some of the members of our Board of Directors and officers reside outside the United States and a substantial portion of their assets are located outside the United States. Investors may not be able to effect service of process within the United States upon us or these persons or to enforce judgments obtained against us or these persons in U.S. courts, including judgments in actions predicated upon the civil liability provisions of the U.S. federal securities laws. Likewise, it may also be difficult for an investor to enforce in U.S. courts judgments obtained against us or these persons in courts located in jurisdictions outside the United States, including judgments predicated upon the civil liability provisions of the U.S. federal securities laws. Awards of punitive damages in actions brought in the United States or elsewhere are generally not enforceable in Luxembourg.
As there is no treaty in force on the reciprocal recognition and enforcement of judgments in civil and commercial matters between the United States and the Grand Duchy of Luxembourg, courts in Luxembourg will not automatically recognize and enforce a final judgment rendered by a U.S. court. The enforceability in Luxembourg courts of judgments rendered by U.S. courts will be subject, prior to any enforcement in Luxembourg, to the procedure and the conditions set forth in the Luxembourg procedural code, which conditions may include the following as of the date of this report (which may change):
•the judgment of the U.S. court is final and enforceable (exécutoire) in the United States;
•the U.S. court had jurisdiction over the subject matter leading to the judgment (that is, its jurisdiction was in compliance both with Luxembourg private international law rules and with the applicable domestic U.S. federal or state jurisdictional rules);
•the U.S. court applied to the dispute the substantive law that would have been applied by Luxembourg courts (based on recent case law and legal doctrine, it is not certain that this condition would still be required for enforcement (exequatur) to be granted by a Luxembourg court);
•the judgment was granted following proceedings where the counterparty had the opportunity to appear and, if it appeared, to present a defense, and the decision of the foreign court must not have been obtained by fraud, but in compliance with the rights of the defendant;
•the U.S. court acted in accordance with its own procedural laws; and
•the decisions and the considerations of the U.S. court must not be contrary to Luxembourg international public policy rules or have been given in proceedings of a tax or criminal nature or rendered subsequent to an evasion of Luxembourg law (fraude à la loi). Awards of damages made under civil liability provisions of the U.S. federal securities laws, or other laws, which are classified by Luxembourg courts as being of a penal or punitive nature (for example, fines or punitive damages), might not be recognized by Luxembourg courts. Ordinarily, an award of monetary damages would not be considered as a penalty, but if the monetary damages include punitive damages, such punitive damages may be considered a penalty.
In addition, actions brought in a Luxembourg court against us or the members of our Board of Directors and our officers to enforce liabilities based on U.S. federal securities laws may be subject to certain restrictions. In particular, Luxembourg courts generally do not award punitive damages. Litigation in Luxembourg is also subject to rules of procedure that differ from the U.S. rules, including with respect to the taking and admissibility of evidence, the conduct of the proceedings and the allocation of costs. For these reasons, it may be difficult for a U.S. investor to bring an original action in a Luxembourg court predicated upon the civil liability provisions of the U.S. federal securities laws against us, the members of our Board of Directors or our officers. In addition, even if a judgment is obtained against our company, the non-U.S. members of our Board of Directors or our officers based on the civil liability provisions of the U.S. federal securities laws, a U.S. investor may not be able to enforce it in U.S. or Luxembourg courts.
Under our Articles of Association, we may indemnify our directors for and hold them harmless against all claims, actions, suits or proceedings brought against them, subject to limited exceptions. The right to indemnification does not exist in the case of gross negligence, fraud or wrongful misconduct. The rights and obligations among or between us and any of our current or former directors and officers are generally governed by the laws of the Grand Duchy of Luxembourg and are subject to the jurisdiction of the Luxembourg courts, unless such rights or obligations do not relate to or arise out of such persons’ capacities listed above. Although there is doubt as to whether U.S. courts would enforce this indemnification provision in an action brought in the United States under U.S. federal or state securities laws, this provision could make judgments obtained outside Luxembourg more difficult to enforce against our assets in Luxembourg or in jurisdictions that would apply Luxembourg law.
Luxembourg and European insolvency and bankruptcy laws are substantially different from U.S. insolvency laws and may offer our shareholders less protection than they would have under U.S. insolvency and bankruptcy laws.
As a joint stock corporation organized under the laws of Luxembourg with its registered office in Luxembourg, we are subject to Luxembourg insolvency and bankruptcy laws in the event any insolvency proceedings are initiated against us including, among other things, Council Regulation (EC) No. 1346/2000 of May 29, 2000 on insolvency proceedings. Should courts in another European country
determine that the insolvency and bankruptcy laws of that country apply to us in accordance with and subject to such EU regulations, the courts in that country could have jurisdiction over the insolvency proceedings initiated against us. Insolvency and bankruptcy laws in Luxembourg or the relevant other European country, if any, may offer our shareholders less protection than they would have under U.S. insolvency and bankruptcy laws and make it more difficult for them to recover the amount they could expect to recover in a liquidation under U.S. insolvency and bankruptcy laws.
Item 1B. Unresolved Staff Comments
None
Item 2. Properties
Production Facilities
We currently operate a global platform of 13 wholly owned production facilities in Europe, North and South America, Asia and South Africa and three sales companies, as well as one jointly-owned production plant in Germany. All of our production plants are ISO 9001 (Quality Management) and ISO 14001 (Environmental Management) certified. Our global production capacity totaled approximately 1,275 kmt in 2019, of which 420 kmt was in Europe, 375 kmt was in North America, 245 kmt in South Korea, 95 kmt was in Brazil, 75 kmt was in China, 65 kmt was in South Africa, and the capacity of the German JV proportionate to our shareholding. We estimate that our average plant utilization rate was 91% in 2019.
The following map provides an overview of the geographical footprint of our production network as of December 31, 2019.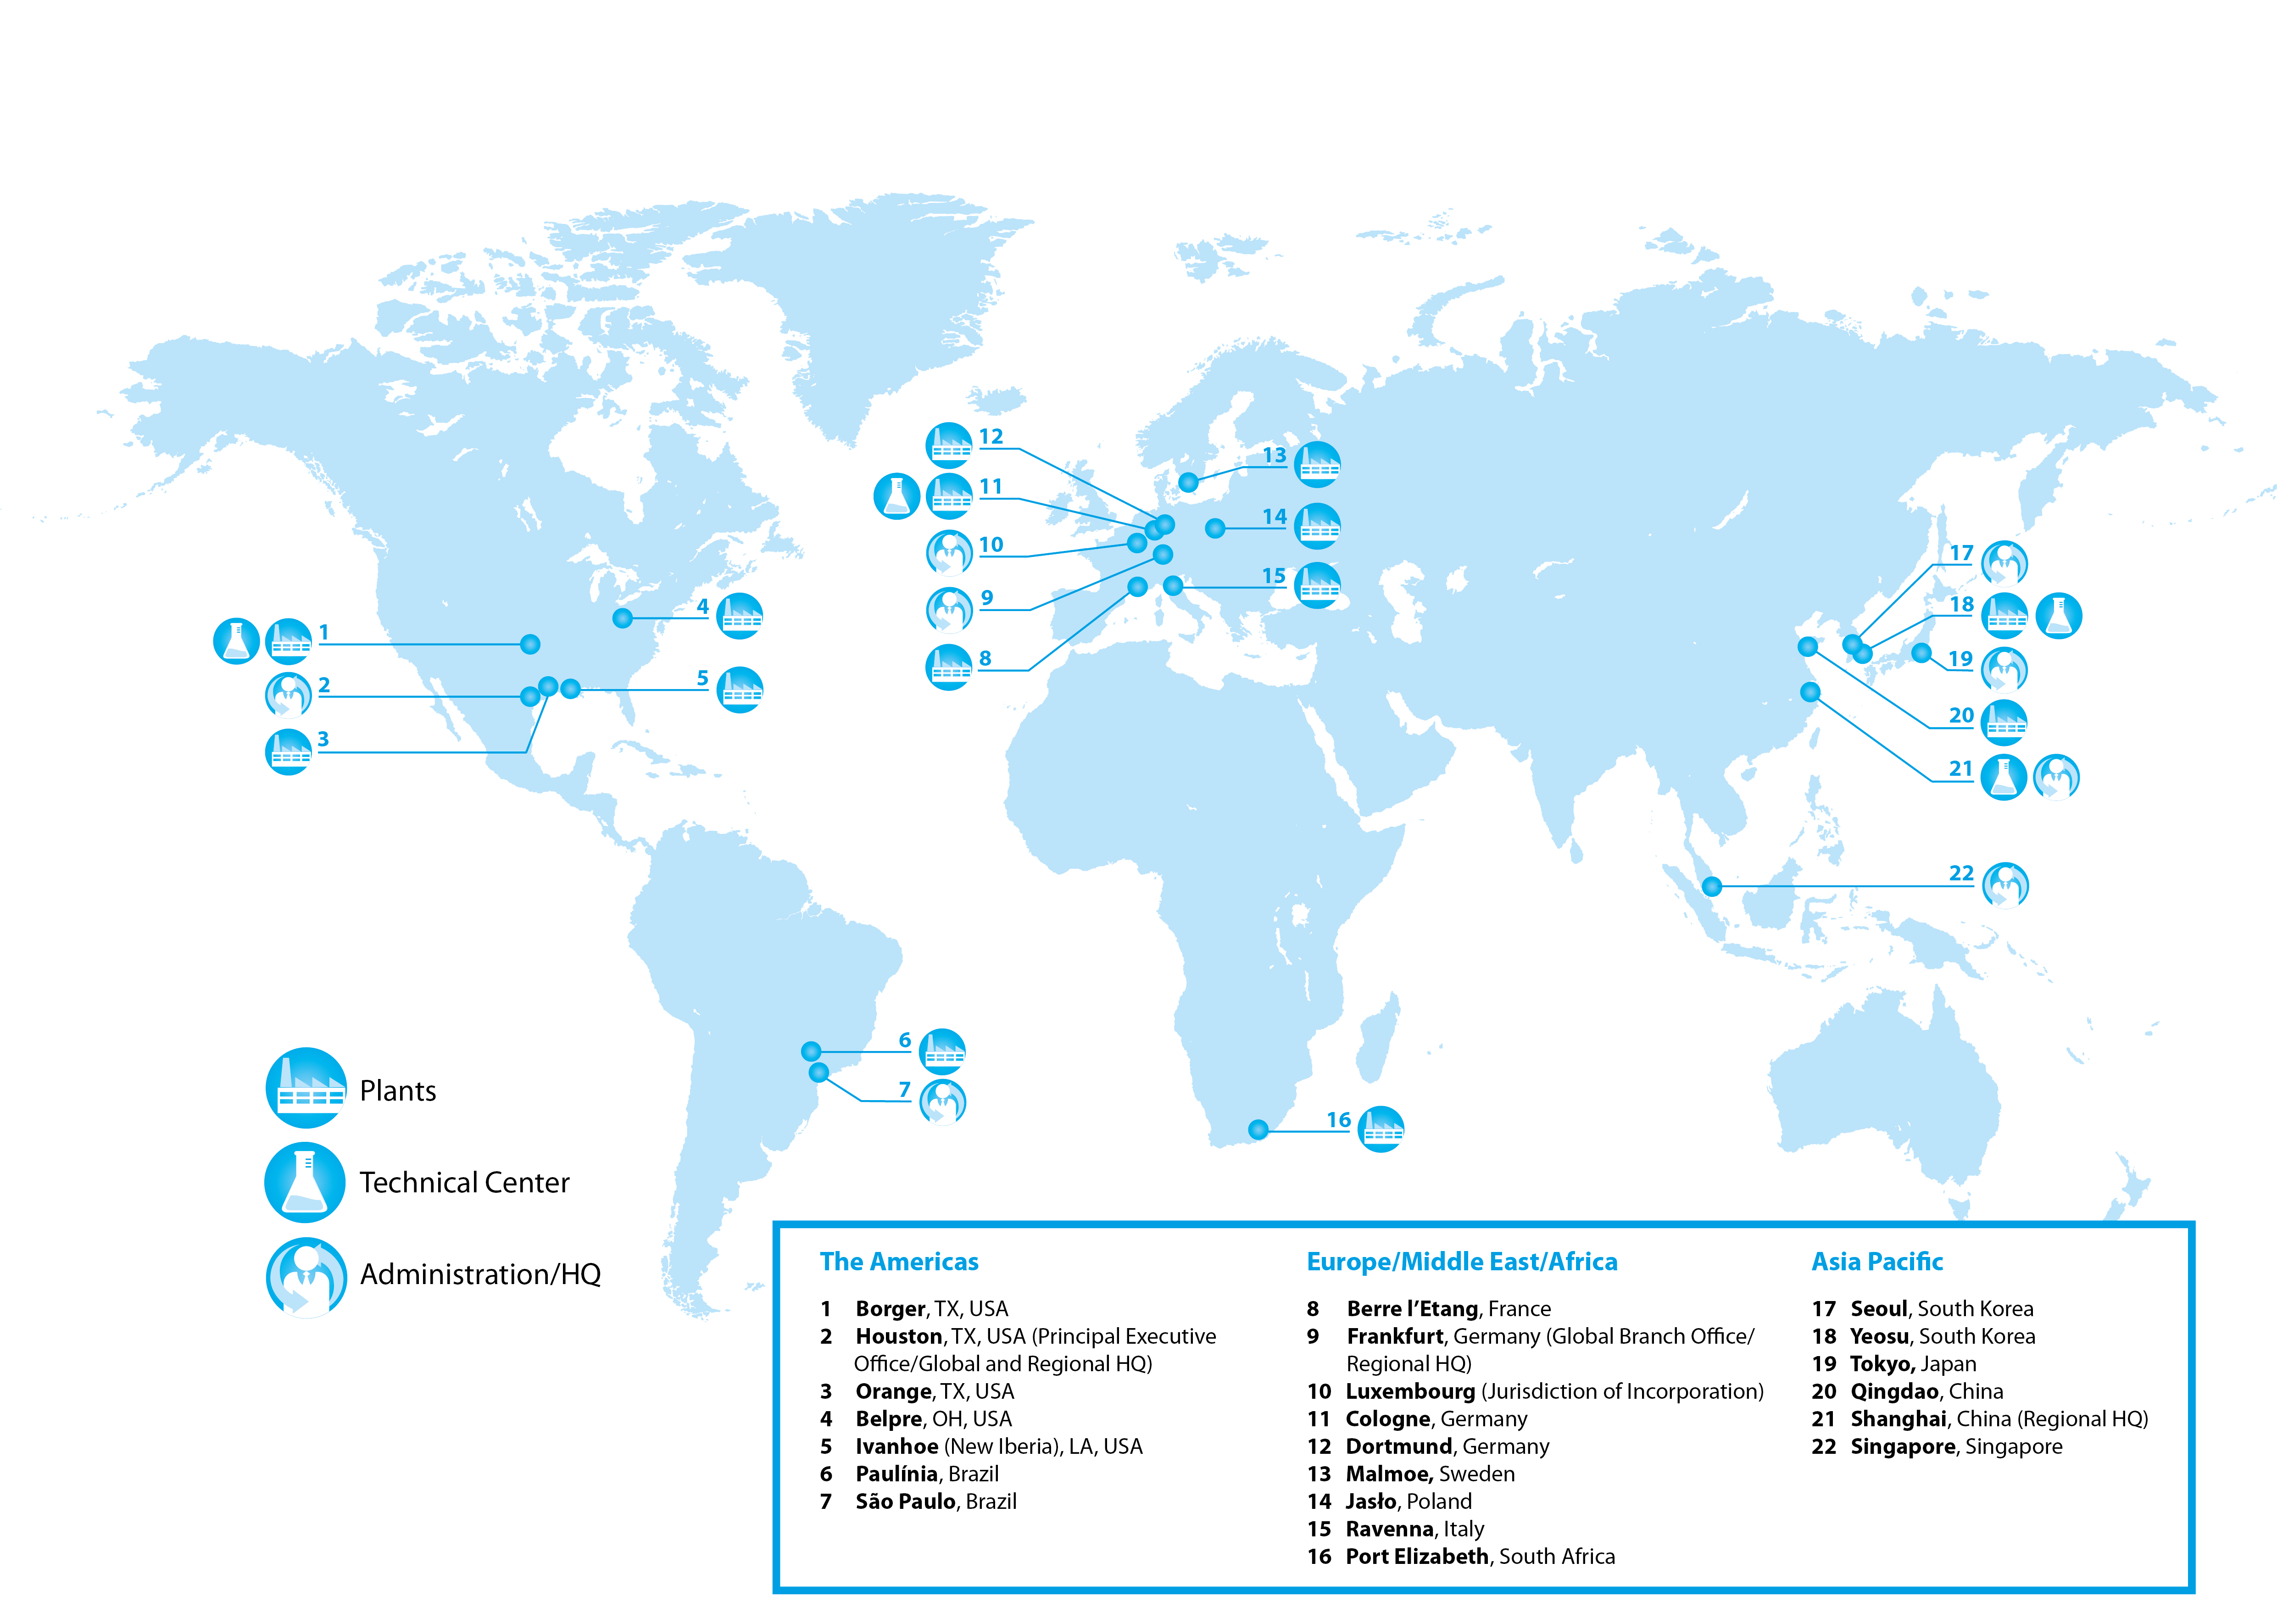
Item 3. Legal Proceedings
We become involved from time to time in various claims and lawsuits arising in the ordinary course of our business, such as employment related claims and asbestos litigation, against some of which we have limited indemnification from Evonik under the agreements relating to the Acquisition. Some matters involve claims for large amounts of damages as well as other relief. With respect to our settlement of the EPA’s enforcement initiative and the arbitration proceedings with Evonik see “Item 1. Business—Environmental,
Health and Safety Matters—Environmental—Environmental Proceedings.” and “Item 1A. Risk Factors—Legal and Regulatory Matter—Litigation or legal proceedings could expose us to significant liabilities and thus adversely affect our business, financial condition, results of operations and cash flows.” as well as “Item 1A. Risk Factors—Legal and Regulatory Matter—We may not be able to protect our intellectual property rights successfully.” We believe, based on currently available information, that the results of the proceedings referenced above, in the aggregate, will not have a material adverse effect on our financial condition, but may be material to our operating results and cash flow for any particular period when the relevant costs are incurred. We note that the outcome of legal proceedings is inherently uncertain, and we offer no assurances as to the outcome of any of these matters or their effect on the Company.
Item 4. Mine Safety Disclosures
Not applicable
PART II
Item 5. Market for Registrant's Common Equity, Related Stockholder Matters and Issuer Purchases of Equity Securities
Our common stock is listed on the New York Stock Exchange (NYSE) under the symbol “OEC”. As of February 18, 2020, the closing price of our common stock on the NYSE was $16.20, and we had seven stockholders of record.
During the fiscal year ended December 31, 2019, we did not sell any equity securities that were not registered under the Securities Act.
From time to time, we may repurchase our common stock in the open market pursuant to programs approved by our Board. During 2019, we did not repurchase any shares of our common stock.
The information required by Item 201(d) of Regulation S-K is incorporated by reference to the Proxy Statement (as defined in Item 10 below) under the heading “Equity Compensation Plan Information at December 31, 2019.”
Dividend Policy
In accordance with the Luxembourg Company Law, the general meeting of shareholders has the power to make a resolution on the payment of dividends upon the recommendation of the Board of Directors. In deciding whether to recommend any future dividend, the Board of Directors would take into account any legal or contractual limitation, our actual and anticipated future earnings, cash flows, debt service and capital requirements, our business plans and such other matters as the Board of Directors believes appropriate, in its discretion. Generally, any dividend approved by a general meeting of shareholders would be paid out shortly after the meeting.
During the fiscal year 2019, our board of directors declared dividends of $0.80 per common share, equivalent to a total distribution of $48.0 million. The dividends were paid in quarterly installments at $0.20 per share. Luxembourg withholding tax at a rate of 15% was deducted from the dividends, subject to certain exemptions and reductions in certain circumstances.
Item 6. Selected Financial Data
The following tables set forth selected historical financial information for fiscal years 2019, 2018, 2017, 2016 and 2015 and as of December 31, 2019, 2018, 2017, 2016 and 2015. The financial information for fiscal years 2019, 2018 and 2017 and balance sheet information as of December 31, 2019 and 2018 has been derived from our audited consolidated financial statements included elsewhere in this report. The financial information for fiscal year 2016 and balance sheet information as of December 31, 2017 and 2016 has been derived from our audited consolidated financial statements included in our Annual Report for the year ended 2018 on Form 20-F, filed with the SEC. The financial information for fiscal year 2015 has been derived from our unaudited consolidated financial statements converted to U.S. GAAP and into U.S. Dollars. This information should be read in conjunction with the consolidated financial statements included elsewhere in this report, the related notes and other financial information included herein, and financial information previously filed with or furnished to the Securities and Exchange Commission (the “SEC”).
| | | | | | | | | | | | | | | | | | | | | | | | | | | | | |
Consolidated Statements of Operations Data | Year Ended December 31, | | | | | | | | |
| | | | | | | | | |
| 2019 | | 2018 | | 2017 | | 2016 | | 2015 |
| (In millions, except per share amounts) | | | | | | | | | | |
| Net sales | $ | 1,476.4 | | | $ | 1,578.2 | | | $ | 1,328.3 | | | $ | 1,139.3 | | | | $ | 1,234.5 | |
| Cost of sales | 1,086.6 | | | 1,148.2 | | | 950.7 | | | 764.9 | | | | 879.4 | |
| Gross profit | 389.7 | | | 430.0 | | | 377.6 | | | 374.4 | | | | 355.1 | |
| | | | | | | | | |
| Selling, general and administrative expenses | 206.9 | | | 231.9 | | | 207.5 | | | 202.5 | | | | 188.8 | |
| Research and development costs | 19.9 | | | 20.3 | | | 18.2 | | | 16.1 | | | | 14.8 | |
| Other expenses, net | 12.2 | | | 6.1 | | | 7.6 | | | 9.0 | | | | 15.7 | |
| Restructuring income | 0.0 | | | 40.3 | | | — | | | — | | | | — | |
| Restructuring expenses | 3.6 | | | 15.6 | | | 6.5 | | | 30.0 | | | | — | |
| Income from operations | 147.2 | | | 196.3 | | | 137.9 | | | 116.8 | | | | 135.8 | |
| | | | | | | | | |
| Interest and other financial expense, net | 27.6 | | | 28.6 | | | 44.1 | | | 43.3 | | | | 62.1 | |
| Reclassification of actuarial losses from AOCI | — | | | — | | | 9.7 | | | 0.1 | | | | 10.5 | |
| Income from operations before income tax expense and equity in earnings of affiliated companies | 119.6 | | | 167.7 | | | 84.0 | | | 73.4 | | | | 63.2 | |
| | | | | | | | | |
| Income tax expense | 33.2 | | | 46.9 | | | 19.7 | | | 24.4 | | | | 23.1 | |
| Equity in earnings of affiliated companies, net of tax | 0.6 | | | 0.6 | | | 0.5 | | | 0.5 | | | | 0.5 | |
| Net income | $ | 86.9 | | | $ | 121.3 | | | $ | 64.9 | | | $ | 49.5 | | | | $ | 40.6 | |
| | | | | | | | | |
| Earnings per share - basic | $ | 1.45 | | | $ | 2.04 | | | $ | 1.09 | | | $ | 0.83 | | | | $ | 0.68 | |
| Earnings per share - diluted | $ | 1.42 | | | $ | 1.99 | | | $ | 1.07 | | | $ | 0.82 | | | | $ | 0.68 | |
| Dividends per share | $ | 0.80 | | | $ | 0.80 | | | $ | 0.77 | | | $ | 0.74 | | | | $ | 0.74 | |
| | | | | | | | | | | | | | | | | | | | | | | | | | | | | |
Statement of Cash Flows Data | Year Ended December 31, | | | | | | | | |
| | | | | | | | | |
| 2019 | | 2018 | | 2017 | | 2016 | | 2015 |
| (In millions) | | | | | | | | | |
| Net cash provided by operating activities | $ | 231.5 | | | $ | 122.0 | | | $ | 147.7 | | | $ | 177.4 | | | $ | 195.1 | |
| Net cash used in investing activities | (155.8) | | | (88.1) | | | (90.3) | | | (68.5) | | | (83.0) | |
| Net cash used in financing activities | (68.6) | | | (43.8) | | | (68.5) | | | (101.8) | | | (112.3) | |
| | | | | | | | | | | | | | | | | | | | | | | | | | | | | |
Balance Sheet Data | Year Ended December 31, | | | | | | | | |
| | | | | | | | | |
| 2019 | | 2018 | | 2017 | | 2016 | | 2015 |
| (In millions) | | | | | | | | | |
| Cash and cash equivalents | $ | 63.7 | | | $ | 57.0 | | | $ | 72.3 | | | $ | 77.9 | | | $ | 71.1 | |
| Property, plant and equipment | 534.1 | | | 483.5 | | | 462.1 | | | 409.9 | | | 420.1 | |
| Total assets | 1,257.4 | | | 1,273.0 | | | 1,164.4 | | | 1,055.5 | | | 1,057.6 | |
| Total liabilities | 1,071.4 | | | 1,114.1 | | | 1,069.1 | | | 1,000.8 | | | 1,004.9 | |
Total stockholders' equity(1) | 186.0 | | | 158.9 | | | 95.3 | | | 54.7 | | | 52.7 | |
(1) Our share capital as of December 31, 2019 is denominated in Euro and was €60,729,289 (a USD-equivalent amount of $68,223,283, respectively, applying a closing rate of 1.1234 US-Dollar per 1 Euro), represented by 60,729,289 common shares with no par value of which 505,142 common shares are held in treasury.
The following tables present a reconciliation of the non-GAAP measure Adjusted EBITDA to net income (See “Item 7. Management's Discussion and Analysis of Financial Condition and Results of Operations—Reconciliation of Non-GAAP Financial Measures” for further details on non-GAAP measures):
| | | | | | | | | | | | | | | | | | | | | | | | | | | | | |
| Reconciliation of profit or (loss) | Year Ended December 31, | | | | | | | | |
| | | | | | | | | |
| 2019 | | 2018 | | 2017 | | 2016 | | 2015 |
| (In millions) | | | | | | | | | |
| Net income | $ | 86.9 | | | $ | 121.3 | | | $ | 64.9 | | | $ | 49.5 | | | $ | 40.6 | |
| Add back income tax expense | 33.2 | | | 46.9 | | | 19.7 | | | 24.4 | | | 23.1 | |
| Add back equity in earnings of affiliated companies, net of tax | (0.6) | | | (0.6) | | | (0.5) | | | (0.5) | | | (0.5) | |
| Income from operations before income taxes and equity in earnings of affiliated companies | 119.6 | | | 167.7 | | | 84.0 | | | 73.4 | | | 63.2 | |
| Add back interest and other financial expense, net | 27.6 | | | 28.6 | | | 44.1 | | | 43.3 | | | 62.1 | |
| Reclassification of actuarial losses from AOCI | — | | | — | | | 9.7 | | | 0.1 | | | 10.5 | |
| Income from operations | 147.2 | | | 196.3 | | | 137.9 | | | 116.8 | | | 135.8 | |
| Add back depreciation, amortization and impairment of intangible assets and property, plant and equipment | 96.7 | | | 98.2 | | | 98.4 | | | 97.1 | | | 80.9 | |
| EBITDA | 243.9 | | | 294.5 | | | 236.2 | | | 214.0 | | | 216.7 | |
| Equity in earnings of affiliated companies, net of tax | 0.6 | | | 0.6 | | | 0.5 | | | 0.5 | | | 0.5 | |
| Restructuring expenses/(income) | 3.6 | | | (24.6) | | | 6.5 | | | 19.8 | | | — | |
| Consulting fees related to Company strategy | 3.0 | | | 4.8 | | | 2.8 | | | 2.8 | | | 1.6 | |
| Long term incentive plan | 9.4 | | | 13.9 | | | 8.8 | | | 4.0 | | | 1.0 | |
| Other adjustments | 6.8 | | | 5.0 | | | 2.1 | | | 5.7 | | | 11.7 | |
| Adjusted EBITDA | $ | 267.3 | | | $ | 294.1 | | | $ | 257.0 | | | $ | 246.7 | | | $ | 231.6 | |
Item 7. Management's Discussion and Analysis of Financial Condition and Results of Operations
The following discussion and analysis summarizes the significant factors affecting our results of operations and financial condition during the years ended December 31, 2019, 2018 and 2017 and should be read in conjunction with the information included under Item 1. Business and Item 8. Financial Statements and Supplementary Data included elsewhere in this Annual Report. We prepare our financial statements in accordance with accounting principles generally accepted in the United States and in US Dollars.
Overview
In 2019, we generated revenue of $1,476.4 million on a volume of 1,023.2 kmt, a net income of $86.9 million, and Adjusted EBITDA of $267.3 million. Adjusted EBITDA for our Specialty Carbon Black segment was $122.2 million, and the Segment Adjusted EBITDA Margin was 24.0%. This segment accounted for 34.4% of our total revenue, 45.7% of total Adjusted EBITDA and 24.3% of our total volume in kmt in 2019. Adjusted EBITDA for our Rubber Carbon Black segment was $145.2 million, and Segment Adjusted EBITDA Margin was 15.0%. This segment accounted for 65.6% of our total revenue, 54.3% of total Adjusted EBITDA and 75.7% of our total volume in kmt in 2019.
Key Factors Affecting Our Results of Operations
We believe that certain factors have had, and will continue to have, a material effect on our results of operations and financial condition. As many of these factors are beyond our control and certain of these factors have historically been volatile, past performance will not necessarily be indicative of future performance and it is difficult to predict future performance with any degree of certainty. In addition, important factors that could cause our actual results of operations or financial conditions to differ materially from those expressed or implied below, include, but are not limited to, factors indicated under “Item 1A. Risk Factors”, “Note Regarding Forward-Looking Statements” of this report.
General Economic Conditions, Cyclicality and Seasonality
Our results of operations are affected by worldwide economic conditions. Because carbon black is used in a diverse group of end products, demand for carbon black has historically been related to real GDP and general global economic conditions. In particular, a large part of our sales has direct exposure to the cyclical automotive industry and, to a lesser extent, the construction industry. As a result, our results of operations experience a level of inherent cyclicality. The nature of our business and our large fixed asset base make it difficult to rapidly adjust our fixed costs downward when demand for our products declines, which materially affects our results of operations.
Our business is generally not seasonal in nature, although we may experience some regional seasonal declines during holiday periods and our results of operations are generally weaker in the last three months of the year.
Drivers of Demand
Besides general global economic conditions, certain specific drivers of demand for carbon black differ among our operating segments. Specialty carbon black has a wide variety of end-uses and demand is largely driven by the development of the coatings, polymers and printing industries. Demand for specialty carbon black in the coatings and polymers industries is mainly influenced by the levels of industrialization, automobile OEM demand, infrastructure, consumer goods and construction. Demand for specialty carbon black in the printing industry is mainly influenced by developments in print media and packaging materials. Demand for rubber carbon black is largely driven by the development of the tire and mechanical rubber goods industries. Demand for rubber carbon black in tires is mainly influenced by the number of replacement and original equipment tires produced, which in turn is driven by (i) vehicle trends, including the number of vehicles produced and registered, and the number of miles driven, (ii) demand for high-performance tires, (iii) demand for larger vehicles, such as trucks and buses and (iv) changes in regulatory requirements. Demand for rubber carbon black in mechanical rubber goods is mainly influenced by vehicle trends, construction activity and general industrial production.
Demand in the developed West European and North American regions is mainly driven by demographic changes, customers’ high-quality requirements, stringent tire regulation standards and relatively stable tire replacement demand. Demand in emerging markets, such as China, Southeastern Asia, South America and Eastern Europe, is mainly driven by the growing middle class, rapid industrialization, new infrastructure spending and increasing car ownership trends. The growth in vehicle production in turn drives demand for both original equipment tire manufacturing and replacement tires in developing regions.
Asset Utilization
Margins in the carbon black industry, and the chemical industry generally, are strongly influenced by industry capacity utilization. As demand for products approaches available supply, utilization rates rise, and prices and margins typically increase over time. Historically, this relationship has been highly cyclical, due to fluctuations in supply resulting from the timing of new investments in capacity and general economic conditions affecting the relative strength or weakness of demand. Generally, capacity is more likely to be added in periods when current or expected future demand is strong and margins are, or are expected to be, high. Investments in new capacity can result, and in the past frequently have resulted, in over-capacity, which typically leads to a reduction of margins. For example, some of our customers have shifted, and may continue to shift, manufacturing capacity from mature regions, such as North America and Europe, to emerging regions, such as Asia and South America. Consequently, competitors in China have added capacity (particularly regarding production of standard tire grades), at far greater proportion than demand has risen, which resulted in pressured margins in the region. In response, producers typically reduce capacity utilization or limit further capacity additions, eventually causing the industry to be relatively undersupplied. In recent years,
a systematic reduction in capacity in North America and Europe, together with increased manufacturing efficiencies, has enabled us to largely preserve margins and maintain high utilization rates.
Although utilization levels can differ significantly by plant, these levels tend to be driven more by variations in demand from specific customers served by each plant rather than by general trends in the region where the plant is located. We estimate our average plant utilization rate to have been at approximately 91% in 2019, approximately 91% in 2018 and approximately 90% in 2017. We have made recent investments in strategic sites to increase the flexibility of our production platform and closed production facilities in Europe and South Korea in order to consolidate capacities in the European and Asian regions. Both actions allow us to opportunistically upgrade and expand our capacity to produce higher margin products, as demand allows, and positions us better to shift additional production capacity to specialty carbon black products and rubber carbon black for higher-end mechanical rubber goods. We intend to achieve further growth in production volume, as customer demand allows, by improving utilization rates, improving the availability of our assets by minimizing planned and unplanned facility downtime and improving the capacity of our assets through systematic supply chain planning and improved operating technologies. In addition a new specialty carbon black line is under construction at our Ravenna (Italy) plant, which is expected to commence production in 2021. Unplanned outages can impact our operating results. Similarly, planned or unplanned outages of our competitors can positively affect our operating results by decreasing the product supply in the industry.
Raw Material and Energy Costs
Our results of operations are affected, directly and indirectly, by fluctuations in raw material and energy prices. Our manufacturing processes consume significant amounts of raw materials and energy, the costs of which are subject to fluctuations in worldwide supply and demand, in addition to other factors beyond our control. In 2019, raw materials accounted for approximately 75% of our cost of sales. Approximately 79% of the cost of raw material used in the production of carbon black is related to petroleum-based or coal-based feedstock known as carbon black oil, with some limited use of other raw materials, such as acetylene, nitrogen tetroxide, hydrogen and natural gas. The pricing of carbon black oil is typically indexed to the price of fuel oil. In general, we benchmark against Platts indices in the sourcing regions e.g. USGC, New York, Rotterdam and Singapore. In some areas the Gasoil index is used. While the majority of our purchases are based on underlying fuel oil indices, the ultimate carbon black oil price also depends on carbon black oil specific quality characteristics, differentials (premiums or discounts to Platts indices), freight costs and region-specific supply and demand as well as regulatory factors. Carbon black oil procurement is an important factor in achieving best-in-class production costs. Approximately 50% of our carbon black oil supply is covered by short- and long-term contracts with a wide variety of suppliers.
A significant portion of approximately 75% of our volume is sold based on formula-driven price adjustment mechanisms for changes in costs of raw materials, Sales prices under our non-indexed contracts are reviewed regularly with a view to reflecting raw material and energy price fluctuations as overall market conditions allow. In addition, there can be no guarantee that we will be able to timely adjust prices under our non-indexed contracts in the future, see “Item 1A. Risk Factors—Risks Related to Our Business—We are subject to volatility in the costs, quality and availability of raw materials and energy, which could decrease our production volumes and margins and adversely affect our business, financial condition, results of operations and cash flows.”
Costs for raw materials and energy have fluctuated significantly and may continue to fluctuate in the future. We believe that our contracts enable us generally to maintain our Segment Adjusted EBITDA Margins, however, rapid and significant oil or energy price fluctuations have had and are likely to continue to have significant and varying effects on our earnings and results of operations, partly because oil price changes affect our sales prices and our cost of raw materials and energy at different times and amounts, and partly due to other factors, such as differentials affecting the ultimate carbon black oil price paid by us (versus a particular reference price index), actual carbon black oil usage amounts and our ongoing efficiency initiatives. As a result of the significant decline in oil prices in particular in 2014, we have seen one or more of these factors come into play at different times and adversely affect our profitability, and this is likely to be seen again in future periods of a declining oil pricing environment. It is also possible that in this environment, other factors come into play and interact adversely with our longer-term formula-based customer pricing arrangements. It is difficult to predict the impact of these factors going forward. In general, our customer pricing arrangements, and in particular the price adjustment formulas, are designed to protect us against rising or higher oil prices, and while we may seek to adjust them to accommodate the current environment, they may be difficult to change quickly, and if changed, may not be as protective if and when oil prices begin to rise.
Foreign Currency Exchange Rate Fluctuations
Our results of operations and Net Working Capital are affected by foreign currency exchange rate fluctuations. Our exposure to foreign currencies comes from three main sources: (i) currency translation, when we translate results of our subsidiaries denominated in local functional currencies into U.S. Dollar, (ii) commercial transactions, such as when we contract purchases of our feedstock, which are mostly in U.S. Dollars, at non-U.S.-Dollar entities and (iii) financing transactions, as a large portion of our financial obligations are denominated in U.S. Dollars, some of which are hedged. In 2019, 40%, 27% and 16% of our net sales were generated by our subsidiaries whose functional currency is the Euro, the U.S. Dollar and the Korean Won, respectively, with the remainder in other currencies. Fluctuations in currency exchange rates could require us to reduce our prices to remain competitive in foreign regions. In each case, the relevant income or expense is reported in the respective local currency and translated into U.S. Dollar at the applicable currency exchange rate for inclusion in our consolidated financial information. Therefore, our financial results in any given period are materially affected by fluctuations in the value of the U.S. Dollar relative to other currencies, in particular the Euro and the Korean Won. Our foreign currency transaction exposure is partially offset by costs and expenses incurred by our subsidiaries in their local functional currencies.
The pricing of carbon black oil, our main raw material, is linked to the price of heavy fuel oil and is generally benchmarked against Platts indices of three regions: the U.S. Gulf Coast, Rotterdam and Singapore. Most of our carbon black oil purchase contracts are
denominated in U.S. Dollars. Generally, an appreciation of the U.S. Dollar has a negative impact on our results of operations and Net Working Capital, because our raw material purchases in U.S. Dollars may not be fully offset by our ability to pass-through changes in raw material costs to customers and by the translation effect of our results of operations outside the United States.
We manage our foreign currency exchange exposure through the use of derivative instruments to economically hedge on balance sheet foreign currency denominated receivables and payables. In May 2018, we entered into a $235 million cross-currency swap to hedge interest rate risk and foreign currency exposure related to the U.S. Dollar-denominated Term Loan entered into by our German entity. In conjunction therewith we discontinued the use of the U.S. Dollar-denominated portion of our Term loan to hedge our U.S. operations. See “Item 8.—Financial Statements—Note K. Derivatives”. We use customary products to manage other foreign exchange risk, including forward exchange contracts and currency options. We do not generally use foreign exchange hedging for expected exposure, as our expected exposure from sales is largely offset by our expected exposure from purchases.
Current and Future Environmental Regulations
Our operations are subject to extensive environmental laws and regulations, which require us to invest significant financial and technical resources to maintain compliance with applicable requirements. If environmental harm is found to have occurred as a result of our current or historical operations, we may incur significant remediation costs at current or former production facilities or third-party sites and may have to pay fines and damages. Many of our facilities have a long history of operation and have never been the subject of comprehensive environmental investigations. As a result, our environmental compliance and remediation costs could increase. Future closure and decommissioning at any one of these facilities, or of process units at these facilities, could result in significant remediation costs. For instance, many of our facilities have onsite landfills, storage tanks, wastewater treatment systems, ponds and other units that have been in use for a number of years, and we may incur significant costs when closing these units in accordance with applicable laws and regulations and when addressing related contamination of soil and groundwater. For more information about information requests made by the EPA to, and alleged violations of the U.S. Clean Air Act by, certain of our facilities located in the United States, see “Item 1.—Business—Environmental, Health and Safety Matters—Environmental—Environmental Proceedings.”
Changes to environmental regulations or laws that may affect previously unregulated aspects of our business may also require us to incur significant compliance costs. New regulations requiring further reductions of GHG and other emissions are being considered in Europe, the United States, China, Brazil and South Korea. Our carbon black operations may generate more CO2 than is permitted under current or future allocation schemes for GHG emissions, requiring us either to purchase emission credits or to modify our production processes to reduce emissions. Additionally, nano-scale materials, including carbon black, are under increased and ongoing scrutiny in multiple jurisdictions, including the European Union, and are likely to be subject to stricter regulation in the future, which may require us to incur significant costs in order to comply with new laws and requirements. Further, carbon black has been classified by certain national and international health organizations as a possible or suspected human carcinogen. A negative reclassification of carbon black by these organizations, or similar classifications of carbon black or other finished products, raw materials or intermediates by other organizations or governmental authorities could adversely affect our compliance costs, operations, sales and reputation.
Environmental considerations can also affect the industries in which we operate, including our position with respect to our competitors. For example, new tire labeling regulatory requirements globally (particularly in Europe) are expected to reduce the threat of low-cost tire imports significantly and to favorably affect demand in developed regions.
In connection with the Acquisition, Evonik agreed, subject to certain deductibles, caps, exclusions and procedural requirements, to indemnify us for certain historical environmental liabilities. See “Item 1A.—Risk Factors—Risks Related to Indebtedness, Currency Exposure and Other Financial Matters—Our Agreements with Evonik in connection with the Acquisition require us to indemnify Evonik with respect to certain aspects of our business and require Evonik to indemnify us for certain retained liabilities. We cannot offer assurance that we will be able to enforce claims under these indemnities as we expect.”
Critical Accounting Policies
The preparation of our financial statements requires management to make estimates and judgments that affect the reported amounts of assets, liabilities, revenues, and expenses and related disclosure of contingent assets and liabilities. We consider an accounting estimate to be critical to the financial statements if (i) the estimate is complex in nature or requires a high degree of judgment and (ii) different estimates and assumptions were used, the results could have a material impact on the consolidated financial statements. We evaluate our estimates and application of our policies on an ongoing basis. We base our estimates on historical experience, current conditions and on various other assumptions that we believe are reasonable under the circumstances, the results of which form the basis for making judgments about the carrying values of assets and liabilities that are not readily apparent from other sources. Actual results may differ from these estimates under different assumptions or conditions. The policies that we believe are critical to the preparation of the consolidated financial statements are the following:
•Revenue and expense recognition;
•Goodwill;
•Valuation of intangibles acquired in a business combination
•Inventories;
•Pension provisions;
•Deferred taxes, current income taxes;
•Derivative financial instruments;
•Hedge accounting; and
•Contingent liabilities and other financial obligations.
These critical accounting policies and other significant accounting policies are discussed in Note A. Significant Accounting Policies to our audited consolidated financial statements included elsewhere in this report. See also Note L. Employee Benefit Plans to our audited consolidated financial statements for information about sensitivities of inputs used with respect to pension provisions. See also Note H. Business Combination, Goodwill and Intangible Assets to our audited consolidated financial statements with respect to goodwill. In particular, with regard to the assessment of the fair value of the reporting unit to which goodwill is allocated, management believes that no reasonably possible change in any of the key assumptions would cause the carrying value of the reporting units to materially exceed their recoverable amounts.
Effective from January 1, 2018 ASC 606 with respect to revenue recognition became effective. The adoption of this standard did not result in a material difference in our revenue recognition.
Effective from January 1, 2019 ASC 842 with respect to treatment and recognition of lease agreements became effective. We have adopted this standard and based on the lease portfolio as of January 1, 2019, the Company recorded additional operating lease ROU assets of approximately $30 million and operating lease liabilities of $31 million on its consolidated balance sheet, with no other adoption impacts to its consolidated statements of operations. One asset recorded under build-to-suit accounting as of December 31, 2018 and its associated liability of $29 million was derecognized upon adoption of the new standard. For our current lease obligation see also Note R. Commitments and Contingencies.
Certain of the significant accounting policies include the use of estimates, but do not meet the definition of critical because they generally do not require estimates or judgments that are as difficult or subjective to measure. However, these policies are important to an understanding of the consolidated financial statements.
Reconciliation of Non-GAAP Financial Measures
We use Contribution Margin and Adjusted EBITDA as supplemental measures of our operating performance. Contribution Margin and Adjusted EBITDA presented in this Management Discussion and Analysis have not been prepared in accordance with GAAP or the accounting standards of any other jurisdiction. Other companies may use similar non-GAAP financial measures that are calculated differently from the way we calculate these measures. Accordingly, our Contribution Margin and Adjusted EBITDA may not be comparable to similar measures used by other companies and should not be considered in isolation, or construed as substitutes for, revenue, consolidated net income for the period, income from operations (EBIT), gross profit and other GAAP measures as indicators of our results of operations in accordance with GAAP.
Contribution Margin and Contribution Margin per Metric Ton (Non-GAAP Financial Measures)
We calculate Contribution Margin by subtracting variable costs (such as raw materials, packaging, utilities and distribution costs) from our revenue. We believe that Contribution Margin is useful because we see this measure as indicating the portion of revenue that is not consumed by such variable costs and therefore contributes to the coverage of all other costs and profits. The following table reconciles Contribution Margin and Contribution Margin per Metric Ton to gross profit:
| | | | | | | | | | | | | | | | | | | | |
| | Year Ended December 31, | | | | |
| | 2019 | | 2018 | | 2017 |
| | unaudited (in millions, unless otherwise indicated) | | | | |
Revenue(1) | | $ | 1,476.4 | | | $ | 1,578.2 | | | $ | 1,328.3 | |
Variable costs(2) | | (935.7) | | | (1,000.6) | | | (803.8) | |
| Contribution margin | | 540.7 | | | 577.6 | | | 524.5 | |
| Freight | | 79.0 | | | 87.7 | | | 75.8 | |
Fixed Costs(3) | | (229.8) | | | (235.4) | | | (222.7) | |
Gross profit (1) | | $ | 389.9 | | | $ | 430.0 | | | $ | 377.6 | |
| Volume (in kmt) | | 1,023.2 | | | 1,084.7 | | | 1,087.4 | |
| Contribution margin per metric ton | | $ | 528.5 | | | $ | 532.6 | | | $ | 482.4 | |
| Gross profit per metric ton | | $ | 380.9 | | | $ | 396.4 | | | $ | 347.2 | |
(1) Separate line item in audited Financial Statements.
(2) Includes costs such as raw materials, packaging, utilities and distribution.
(3) Includes costs such as depreciation, amortization and impairment of intangible assets and property, plant and equipment,
personnel and other production related costs.
Adjusted EBITDA (Non-GAAP Financial Measure)
We define Adjusted EBITDA as income from operations (EBIT) before depreciation and amortization, adjusted for acquisition related expenses, restructuring expenses, consulting fees related to Company strategy, share of profit or loss of joint venture and certain other items. Adjusted EBITDA is defined similarly in our Credit Agreements. Adjusted EBITDA is used by our management to evaluate our operating performance and make decisions regarding allocation of capital because it excludes the effects of items that have less bearing on the performance of our underlying core business.
Our use of Adjusted EBITDA has limitations as an analytical tool, and should not be considered in isolation or as a substitute for analysis of our financial results as reported under GAAP. Some of these limitations are: (a) although Adjusted EBITDA excludes the impact of depreciation and amortization, the assets being depreciated and amortized may have to be replaced in the future and thus the cost of replacing assets or acquiring new assets, which will affect our operating results over time, is not reflected; (b) Adjusted EBITDA does not reflect interest or certain other costs that we will continue to incur over time and will adversely affect our profit or loss, which is the ultimate measure of our financial performance and (c) other companies, including companies in our industry, may calculate Adjusted EBITDA or similarly titled measures differently. Because of these and other limitations, Adjusted EBITDA should be considered alongside our other GAAP-based financial performance measures, such as revenue, consolidated net income for the period or income from operations (EBIT).
The following table presents a reconciliation of Adjusted EBITDA to consolidated net income for each of the periods indicated:
| | | | | | | | | | | | | | | | | | | | |
| | Year Ended December 31, | | | | |
| | 2019 | | 2018 | | 2017 |
| | (in $ millions) | | | | | |
| Net income | | $ | 86.9 | | | $ | 121.3 | | | $ | 64.9 | |
| Add back income tax expense | | 33.2 | | | 46.9 | | | 19.7 | |
| Add back equity in earnings of affiliated companies, net of tax | | (0.6) | | | (0.6) | | | (0.5) | |
| Income from operations before income taxes and equity in earnings of affiliated companies | | 119.6 | | | 167.7 | | | 84.0 | |
| Add back interest and other financial expense, net | | 27.6 | | | 28.6 | | | 44.1 | |
| Reclassification of actuarial losses from AOCI | | — | | | — | | | 9.7 | |
| Earnings before income taxes and finance income/costs | | 147.2 | | | 196.3 | | | 137.9 | |
| Add back depreciation, amortization and impairment of intangible assets and property, plant and equipment | | 96.7 | | | 98.2 | | | 98.4 | |
| EBITDA | | 243.9 | | | 294.5 | | | 236.2 | |
| Equity in earnings of affiliated companies, net of tax | | 0.6 | | | 0.6 | | | 0.5 | |
Restructuring expenses/(income) (1) | | 3.6 | | | (24.6) | | | 6.5 | |
Consulting fees related to Company strategy (2) | | 3.0 | | | 4.8 | | | 2.8 | |
| Long term incentive plan | | 9.4 | | | 13.9 | | | 8.8 | |
Other adjustments (3) | | 6.8 | | | 5.0 | | | 2.1 | |
| Adjusted EBITDA | | $ | 267.3 | | | $ | 294.1 | | | $ | 257.0 | |
Thereof Adjusted EBITDA Specialty Carbon Black | | $ | 122.2 | | | $ | 149.3 | | | $ | 145.5 | |
Thereof Adjusted EBITDA Rubber Carbon Black | | $ | 145.2 | | | $ | 144.9 | | | $ | 111.5 | |
(1) Restructuring expenses for the periods ended December 31, 2019 and December 31, 2017 are related to our strategic realignment of our worldwide Rubber footprint, and resulted in restructuring income in the period ended December 31, 2018 in particular as a result of the gain recognized in connection with the land sale in South Korea exceeding the associated cessation costs related to our worldwide Rubber footprint initiative.
(2) Consulting fees related to the Orion strategy include external consulting for establishing and executing Company strategies relating to Rubber footprint realignment, conversion to U.S. dollar and U.S. GAAP, as well as costs relating to our assessment of feasibility for inclusion in certain U.S. indices.
(3) Other adjustments (from items with less bearing on the underlying performance of the Company’s core business) in the period ended December 31, 2019 relate to an amount of $2.9 million in non-income tax expense incurred during the construction phase of an asset. The asset under construction is expected to qualify for certain non-income tax credits once operational, since such credits were applied to the predecessor machine. This tax disadvantage cannot be capitalized as part of the project’s capital expenditure. The remainder of other adjustments include in particular costs to meet the EPA requirements of $2.3 million. Other adjustments in the period December 31, 2018 related to license fees required for certain innovative technologies to meet the EPA requirements of $1.2 million and other EPA related costs of $1.4 million. Other adjustments in the period ended December 31, 2017 primarily relate to costs associated with our EPA enforcement action of $2.4 million, costs to remediate damages incurred by hurricane Harvey of $1.4 million and costs associate with the secondary offering of our shares, offset by $1.4 million of reimbursements of reassessed real estate transfer taxes.
Operating Results
2019 Compared to 2018
The table below presents our historical results derived from our consolidated financial statements for the periods indicated.
| | | | | | | | | | | |
| Statement of operations data | Year Ended December 31, | | |
| 2019 | | 2018 |
| (In millions) | | |
| Net sales | $ | 1,476.4 | | | $ | 1,578.2 | |
| Cost of sales | 1,086.6 | | | 1,148.2 | |
| Gross profit | 389.7 | | 430.0 |
| Selling, general and administrative expenses | 206.9 | | | 231.9 | |
| Research and development costs | 19.9 | | | 20.3 | |
| Other expenses, net | 12.2 | | | 6.1 | |
| Restructuring income | — | | | 40.3 | |
| Restructuring expenses | 3.6 | | | 15.6 | |
| Income from operations | 147.2 | | 196.3 |
| Interest and other financial expense, net | 27.6 | | | 28.6 | |
| | | |
| Income from operations before income tax expense and equity in earnings of affiliated companies | 119.6 | | 167.7 |
| Income tax expense | 33.2 | | | 46.9 | |
| Equity in earnings of affiliated companies, net of tax | 0.6 | | | 0.6 | |
| Net income | $ | 86.9 | | | $ | 121.3 | |
Net sales
Net sales decreased overall by $101.9 million, or 6.5%, from $1,578.2 million in 2018 to $1,476.4 million in 2019.
This net sales decrease was primarily due to lower volumes, foreign exchange translation effects and contractually indexed sales price decreases in our Rubber Carbon Black segment resulting from the pass through of lower feedstock costs to customers with agreements that link price to the cost of feedstock offset by certain base price increases.
Volume decreased by 61.5 kmt, or 5.7%, from 1,084.7 kmt in 2018 to 1,023.2 kmt in 2019. This decrease largely reflected reduced Rubber volumes in South Korea due to the closure of the plant in Seoul and slowing demand Europe and China. The decrease in volume contributed a decrease of net sales of $86.8 million. In addition to the volume related decrease of net sales, unfavorable impacts from foreign exchange translation effects of $33.5 million were incurred. Oil price changes contributed a further reduction of net sales in 2019 compared to 2018 of $18.4 million. These unfavorable impacts were in part offset by increases of certain base prices of $40.8 million.
Cost of sales and Gross profit
Cost of sales decreased by $61.6 million, or 5.4%, from $1,148.2 million in 2018 to $1,086.6 million in 2019. The 5.7% decrease in volume in 2019 compared to 2018 resulted in a decrease of cost of sales of 4.9%, or $56.4 million in 2019 compared to 2018.
Lower overall net sales as a result of the above mentioned impacts were not fully offset by lower cost of sales. As a result gross profit decreased by $40.3 million, or 9.4%, from $430.0 million in 2018 to $389.7 million in 2019 for reasons described above.
Selling, general and administrative expenses
Selling, general and administrative expenses decreased by $25.0 million, or 10.8%, from $231.9 million in 2018 to $206.9 million in 2019 mainly as a result of lower volume in 2019 compared to 2018 and lower personnel related expenses in fiscal year 2019 related to bonuses and long term incentive expenses as well as favorable impacts from foreign currency translation impacts.
Research and development costs
R&D expenses decreased by $0.4 million, from $20.3 million in 2018 to $19.9 million in 2019. This decrease is primarily related to the timing of expenditures for individual development of programs.
Other expenses, net
Other expenses, net which comprises other operating income and other operating expenses, amounted to $12.2 million in 2019 and
$6.1 million in 2018.
In 2019, other operating income amounted to $5.9 million and included, among other items, a gain related to an operating derivative of $1.3 million, a non-income tax related tax reimbursement $1.1 million and insurance claims of $0.8 million. Other operating expenses in 2019 amounted to $18.1 million, comprised primarily of $9.9 million treated as other adjustment items and consulting fees related to Company strategy, miscellaneous other third-party expenses of $4.3 million and an impairment charge of $1.3 million.
In 2018, other operating income amounted to $5.0 million and included, among other items, $1.7 million income from the reversal of provisions. Other operating expenses in 2018 amounted to $11.1 million, comprised primarily of $4.8 million consulting fees related to Company strategy and license fees required for certain innovative technologies to meet the EPA requirements of $1.2 million and other EPA related costs of $1.9 million.
Restructuring expenses/(income), net
In 2019 restructuring expenses amounted to $3.6 million associated with our Rubber footprint restructuring costs.
In 2018, restructuring expenses/(income), net, comprise restructuring income of $40.3 million and restructuring expenses of $15.6 million. As part of the strategic repositioning of the Rubber business footprint, we consolidated our two production network in South Korea, ceased production at our Seoul plant and sold the land. Proceeds from the land sale exceeded the associated closing and remediation costs and we recorded a restructuring gain of $24.6 million.
Our Rubber footprint restructuring activities in the fiscal years 2016 to 2019 generated annualized savings of approximately $16 million per year on a consolidated basis since the end of fiscal year 2018 from the facility shutdown in Ambès, France, the facility consolidations in Seoul, South Korea, the related headcount reductions, as well as to a lesser extent, to operational efficiencies. These anticipated savings were expected to come essentially in full from our reportable Rubber segment. Besides the realized one-time gain recorded upon the sale of our land in Seoul, South Korea, a significant portion of the anticipated savings are expected to be reinvested in business development, research & development and capital improvements to help drive organic growth.
Income from operations
Income from operations decreased by $49.2 million, or 25.0%, from $196.3 million in 2018 to $147.2 million in 2019 mainly as a result of decreased gross profit and the absence of positive one-time proceeds from our land sale in South Korea in 2018.
Interest and other financial expense, net
Interest and other financial expense, net comprises interest and other financial income and interest and other financial expenses. Interest and other financial expense, net amounted to $27.6 million in 2019 compared to $28.6 million in 2018.
Interest and other financial expense, net in 2019 includes, among others, $15.2 million of regular interest expenses for our term loan facilities, $2.1 million of amortization of capitalized transaction costs and $3.6 million net expenses of foreign currency revaluation effects.
Interest and other financial expense, net in 2018 includes, $20.6 million of regular interest expenses for our term loan facilities, $2.2 million of amortization of capitalized transaction costs and $1.3 million net expenses of foreign currency revaluation effects.
Income from operations before income tax expense and equity in earnings of affiliated companies
Income from operations before income tax expense and equity in earnings of affiliated companies decreased by $48.1 million, or 28.7%, from $167.7 million in 2018 to $119.6 million in 2019, as a result of the effects described above.
Income tax expense
Income tax expense amounted to $33.2 million in 2019 compared to $46.9 million in 2018, as a result of decreased income before taxes.
In 2019, the effective tax rate of 27.6% deviated from the expected Company rate of 32.0% in particular due to favorable impacts from tax rate differentials of $3.5 million and prior year taxes of $3.2 primarily associated with a conclusion of a tax audit. The amounts previously accrued for this purpose were released accordingly. For details regarding this deviation see Note Q. Income Taxes to the audited consolidated financial statements.
In 2018, the effective tax rate of 27.9% deviated from the expected Company rate of 32.0% in particular due tax rate differentials of $6.7 million. For details regarding this deviation see Note Q. Income Taxes to the audited consolidated financial statements.
Equity in earnings of affiliated companies, net of tax
Equity in earnings of affiliated companies represents the equity income from our German JV, which was comparable in 2019 and
2018.
Net income
Our net income in 2019 amounted to $86.9 million, a decrease of $34.4 million, reflecting all the factors described above.
Contribution Margin and Contribution Margin per Metric Ton (Non-GAAP Financial Measures)
Contribution Margin decreased by $37.0 million, or 6.4%, from $577.6 million in 2018 to $540.7 million in 2019, primarily due to lower volumes, foreign exchange rate translation effects and unfavorable oil price differentials, partially offset by base price increases. Contribution Margin per Metric Ton decreased slightly by 0.8%, from $532.6 per Metric Ton in 2018 to $528.5 per Metric Ton in 2019.
Adjusted EBITDA (Non-GAAP Financial Measure)
Adjusted EBITDA decreased by $26.8 million, or 9.1%, from $294.1 million in 2018 to $267.3 million in 2019 mainly as a result of the decrease in Contribution Margin, somewhat offset by lower bonus expenses.
2018 Compared to 2017
The comparison of the fiscal years ended December 31, 2018 and 2017 can be found in our annual report on Form 20-F for the fiscal year ended December 31, 2018 located within Part I, Item 5. Operating and Financial Review and Prospects, which is incorporated by reference herein.
Segment Discussion
Our business operations are divided into two operating segments: the Specialty Carbon Black segment and the Rubber Carbon Black segment. We use segment revenue, segment gross profit, segment volume, Segment Adjusted EBITDA and Segment Adjusted EBITDA Margin as measures of segment performance and profitability.
The table below presents our segment results derived from our audited consolidated financial statements for 2019, 2018 and 2017.
| | | | | | | | | | | | | | | | | |
| Year Ended December 31, | | | | |
| 2019 | | 2018 | | 2017 |
| (In millions, unless otherwise indicated) | | | | |
| Specialty Carbon Black | | | | | |
| Net sales | $ | 508.5 | | | $ | 545.4 | | | $ | 478.9 | |
| Cost of sales | (338.0) | | | (346.0) | | | (289.5) | |
| Gross profit | $ | 170.4 | | | $ | 199.4 | | | $ | 189.4 | |
Volume (kmt)(1) | 251.0 | | | 262.4 | | | 261.4 | |
| Adjusted EBITDA | $ | 122.2 | | | $ | 149.3 | | | $ | 145.5 | |
Adjusted EBITDA Margin (%)(2) | 24.0 | | | 27.4 | | | 30.4 | |
| | | | | |
| Rubber Carbon Black | | | | | |
| Net sales | $ | 967.9 | | | $ | 1,032.8 | | | $ | 849.4 | |
| Cost of sales | (748.6) | | | (802.2) | | | (661.2) | |
| Gross profit | $ | 219.3 | | | $ | 230.6 | | | $ | 188.2 | |
Volume (kmt)(1) | 772.1 | | | 822.3 | | | 826.0 | |
| Adjusted EBITDA | $ | 145.2 | | | $ | 144.9 | | | $ | 111.5 | |
Adjusted EBITDA Margin (%)(2) | 15.0 | | | 14.0 | | | 13.1 | |
(1) Unaudited.
(2) Defined as Adjusted EBITDA divided by net sales.
Specialty Carbon Black
2019 Compared to 2018
Net sales of the Specialty Carbon Black segment decreased by $36.9 million, or 6.8%, from $545.4 million in 2018 to $508.5 million in 2019, primarily due to lower volumes and foreign exchange rate translation effects, partially offset by base price increases.
Volume of the Specialty Carbon Black segment decreased by 11.3 kmt, or 4.3%, from 262.4 kmt in 2018 to 251.0 kmt in 2019, as a result of lower demand in particular in North America, partially offset by increased volumes from our Chinese and European plants.
Gross profit of the Specialty Carbon Black segment decreased by $28.9 million, or 14.5%, from $199.4 million in 2018 to $170.4 million in 2019, mainly as a result of unfavorable foreign exchange rate translation effects and lower volumes.
Adjusted EBITDA of the Specialty Carbon Black segment decreased by $27.1 million, or 18.1%, from $149.3 million in 2018 to $122.2 million in 2019, primarily reflecting the decrease in gross profit.
2018 Compared to 2017
The comparison of the fiscal years ended December 31, 2018 and 2017 can be found in our annual report on Form 20-F for the fiscal year ended December 31, 2018 located within Part I, Item 5. Operating and Financial Review and Prospects, which is incorporated by reference herein.
Rubber Carbon Black
2019 Compared to 2018
Net sales of the Rubber Carbon Black segment decreased by $64.9 million, or 6.3%, from $1,032.8 million in 2018 to $967.9 million in 2019, primarily due to lower volumes. Unfavorable impacts from contractually indexed sales prices resulting from the pass through changes in feedstock costs as well as unfavorable foreign exchange rate translation effects were almost in full offset by base price increases.
Volume of the Rubber Carbon Black segment decreased by 50.2 kmt, or 6.1%, from 822.3 kmt in 2018 to 772.1 kmt in 2019 mainly due to lower demand in all our major regions except for North America.
Gross profit of the Rubber Carbon Black segment decreased by $11.3 million, or 4.9%, from $230.6 million in 2018 to $219.3 million in 2019, mainly as a result of lower volumes, negative feedstock differentials and negative foreign exchange rate translation effects, in part offset by base price increases.
Adjusted EBITDA of the Rubber Carbon Black segment increased by $0.3 million, or 0.2%, from $144.9 million in 2018 to $145.2 million in 2019, while the decrease in gross profit was offset in part by lower selling and general administrative charges, bonus expenses as well as compensating impacts for foreign exchange rates translation effects.
2018 Compared to 2017
We refer to our annual report 2018 filed with the SEC on From 20-F.The comparison of the fiscal years ended December 31, 2018 and 2017 can be found in our annual report on Form 20-F for the fiscal year ended December 31, 2018 located within Part I, Item 5. Operating and Financial Review and Prospects, which is incorporated by reference herein.
Liquidity and Capital Resources
Historical Cash Flows
The tables below present our historical cash flows derived from our audited consolidated financial statements for 2019, 2018 and 2017.
| | | | | | | | | | | | | | | | | |
| Year Ended December 31, | | | | |
| 2019 | | 2018 | | 2017 |
| (In millions) | | | | |
| Net cash provided by operating activities | $ | 231.5 | | | $ | 122.0 | | | $ | 147.7 | |
| Net cash used in investing activities | (155.8) | | | (88.1) | | | (90.3) | |
| Net cash used in financing activities | (68.6) | | | (43.8) | | | (68.5) | |
| | | | | |
| Cash, cash equivalents and restricted cash at the end of the period | 68.2 | | | 61.6 | | | 75.2 | |
| Less restricted cash at the end of the period | 4.5 | | | 4.6 | | | 2.9 | |
| Cash and cash equivalents at the end of the period | 63.7 | | | 57.0 | | | 72.3 | |
2019
Net cash provided by operating activities in 2019 amounted to $231.5 million and consisted of a consolidated profit for the period of $86.9 million, adjustments primarily for depreciation of $96.7 million and cash inflows from changes in operating assets and liabilities of $17.7 million including changes in Net Working Capital of $49.8 million.
Net cash used in investing activities in 2019 amounted to $155.8 million comprised of $100.2 million capital expenditure for maintenance and overhaul projects and expenditures associated as well as $50.6 million environmental improvements of our U.S. based facilities to address the EPA requirements.
Net cash used in financing activities in 2019 amounted to $68.6 million. Cash inflows during the fiscal year of $97.0 million are related to local bank loan facilities while $101.3 million of cash outflows were used during the year for repayments of those and other current borrowings, $8.0 million regular debt repayment and $48.0 million dividend payments.
2018
Net cash provided by operating activities in 2018 amounted to $122.0 million and consisted of a consolidated profit for the period of $121.3 million, adjustments primarily for depreciation of $98.2 million and cash outflows from Net Working Capital of $65.6 million.
Net cash used in investing activities in 2018 amounted to $88.1 million. It comprises proceeds from our land sale in Korea and $36.6 million were used in connection with the acquisition of the acetylene carbon black manufacturer Société du Noird'Acétylène de l'Aubette, SAS (“SN2A”), SN2A, now known as Orion Engineered Carbons SAS. The remaining capital expenditure for maintenance and overhaul projects, as well as expenditures associated with our efforts to consolidate our two productions plants in South Korea were approximately $103.8 million as well as expenditures of $12.6 million used in commencing the EPA related investments.
Net cash used in financing activities in 2018 amounted to $43.8 million. $26.4 million was used for repayments of current borrowing, $8.3 million of regular debt repayments, $4.9 million used for share repurchases and $47.7 million for dividend payments. Cash inflows of $49.0 million is related to local bank loan facilities.
2017
Net cash provided by operating activities in 2017 amounted to $147.7 million and consisted of a consolidated profit for the period of $64.9 million, adjustments primarily for depreciation of $98.4 million, cash outflows from changes in operating assets and liabilities of $21.6 million including changes in Net Working Capital of $24.0 million.
Net cash used in investing activities in 2017 amounted to $90.3 million for capital expenditure for maintenance and overhaul projects as well as expenditures associated with our efforts to consolidate our two production plants in South Korea.
Cash outflows from financing activities in 2017 amounted to $68.5 million. $28.9 million reflecting repayments of borrowing, of which $20.7 million was paid as voluntary redemption of our Term Loan. In addition, $45.7 million was used for dividend payments. Cash inflows of $11.7 million is related to local ancillary bank loan facilities.
Sources of Liquidity
Our principal sources of liquidity are the net cash generated from our operating activities, the cash balances, amounts available under our multicurrency, senior secured Revolving Credit Facility and financing sources like the subsidiaries facilities with local financial institutions. We believe that our cash position and cash generated from operations will be adequate to support the further growth of our business.
Net Working Capital (Non-GAAP Financial Measure)
We define Net Working Capital as the total of inventories and current trade receivables, less trade payables. Net Working Capital is a non-GAAP financial measure, and other companies may use a similarly titled financial measure that is calculated differently from the way we calculate Net Working Capital. The following tables set forth the principal components of our Net Working Capital as of the dates indicated.
| | | | | | | | | | | | | | | | | | | | |
| | Year Ended December 31, | | | | |
| | 2019 | | 2018 | | 2017 |
| | (In millions) | | | | |
| Inventories | | $ | 164.8 | | | $ | 183.6 | | | $ | 159.3 | |
| Trade receivables | | $ | 212.6 | | | $ | 262.8 | | | $ | 234.3 | |
| Trade payables | | $ | (156.3) | | | $ | (163.6) | | | $ | 169.6 | |
| Net working capital | | $ | 221.1 | | | $ | 282.9 | | | $ | 224.0 | |
Our Net Working Capital position can vary significantly from month to month, mainly due to fluctuations in oil prices and receipts of carbon black oil shipments. In general, increases in the cost of raw materials lead to an increase in our Net Working Capital requirements, as our inventories and trade receivables increase as a result of higher carbon black oil prices and related sales levels. These increases are partially offset by related increases in trade payables. Due to the quantity of carbon black oil that we typically keep in stock, such increases in Net Working Capital occur gradually over a period of two to three months. Conversely, decreases in the cost of raw materials lead to a decrease in our Net Working Capital requirements over the same period of time. Based on 2019 Net Working Capital requirements, we estimate that a $10 per barrel movement in the Brent crude oil price correlates to a movement in our Net Working Capital of approximately $27 million to $30 million within about a two to three month period. In times of relatively stable oil prices, the effects on our Net Working Capital levels are less significant and Net Working Capital swings increase in an environment of high price volatility.
Our Net Working Capital decreased from $282.9 million as of December 31, 2018 to $221.1 million as of December 31, 2019 primarily due to the impact from lower feedstock costs and overall weaker volumes and thus lower receivables at year end.
Capital Expenditures (Non-GAAP Financial Measure)
We define Capital Expenditures as cash paid for the acquisition of intangible assets and property, plant and equipment as shown in the consolidated financial statements.
Our Capital Expenditures amounted to $90.3 million in 2017, $116.2 million in 2018 and $155.8 million in 2019. We plan to finance our Capital Expenditures, including the increase seen in 2019 related to EPA related expenditure, with cash generated by our operating activities. With the exception of required expenditures in association with our settlement with the EPA we currently do not have any material commitments to make Capital Expenditures, and do not plan to make Capital Expenditures, outside the ordinary course of our business. See “Note R. Commitments and Contingencies” for further details regarding the EPA settlement.
Capital Expenditures in 2019 amounted to $155.8 million and were mainly composed of maintenance and overhaul projects including 50.6 million expenditures associated with our efforts to commencing environmental investments required to address the EPA requirements in the United States.
Capital Expenditures in 2018 amounted to $116.2 million and were mainly composed of maintenance and overhaul projects as well as expenditures associated with our efforts to consolidate our to productions plants in South Korea and commencing investments required to address the EPA requirements in the United States of $12.6 million.
Capital Expenditures in 2017 amounted to $90.3 million and were mainly composed of maintenance and overhaul projects.
Research and Development, Patents and Licenses, etc.
Spending on innovation, including both applications technology and process development, amounted to $19.9 million in 2019, $20.3 million in 2018 and $18.2 million in 2017 and was mostly directed towards the development of new specialty carbon black products, new applications for carbon black products and the improvement of process efficiencies, and to a lesser extent towards research on installation of equipment to reduce emission levels in connection with the recent EPA consent decree. For further information see “Item 1. Business—Innovation.”
Trend Information
See “Item 1. Business.”
Off-Balance Sheet Arrangements
As of December 31, 2019, we did not have any off-balance sheet arrangements.
Contractual Obligations
The following table sets forth our contractual obligations as of December 31, 2019:
| | | | | | | | | | | | | | | | | | | | | | | | | | | | | |
| | Less than 1 year | | 1-3 years | | 4-5 years | | More than 5 years | | Total |
| In million | | | | | | | | |
Long-term debt obligations(1) | $ | 26.9 | | | $ | 51.5 | | | $ | 646.3 | | | $ | — | | | $ | 724.7 | |
Revolving credit facility(2) | — | | | — | | | — | | | — | | | — | |
Term loan(3) | 8.1 | | | 16.1 | | | 618.9 | | | — | | | 643.1 | |
Interest expense on long-term debt(4) | 18.8 | | | 35.3 | | | 27.4 | | | — | | | 81.6 | |
Purchase commitments(5) | 137.2 | | | 205.0 | | | — | | | — | | | 342.2 | |
| Operating leases | 7.6 | | | 12.0 | | | 9.4 | | | 5.6 | | | 34.6 | |
Total contractual obligations(6) | $ | 171.7 | | | $ | 268.5 | | | $ | 655.7 | | | $ | 5.6 | | | $ | 1,101.4 | |
(1)Sets forth obligations to repay principal and interest under our long-term debt obligations.
(2)Represents the obligation under the Revolving Credit Facility. As of December 31, 2019, there were no cash amounts drawn under our Revolving Credit Facility of €175.0 million (USD equivalent: $196.6 million).
(3)Represents the Term Loans and includes the outstanding principal amounts of $281.3 million (U.S. Dollar term loan) and $361.8 million (EUR term loan) which has been translated at an exchange rate at the reporting date of $1.1234 per €1.00. The borrowing costs on the principal of the Euro-denominated Term Loan have been translated applying the same exchange rate.
(4)Represents interest expenses related to indebtedness from our Term Loans, assuming future interest based on a forward rate assumption.
(5)Represents purchase commitments under long-term supply agreements for the supply of raw materials, mainly oil and gas.
(6)This amount does not reflect the Company’s obligations under its existing pension arrangements, which as of December 31, 2019 amounted to $21.4 million (see “Note L. Employee Benefit Plans” with regard to pension provisions and post-retirement benefits included in the audited financial statements).
The level of performance bonds, guarantees and letters of credit required for carbon black oil purchasing could increase as a result of increasing oil prices or other factors (such as our ownership structure). As at December 31, 2019 Orion Engineered Carbons GmbH has three guarantees issued by Euler Hermes S.A. with a total volume of $9.2 million (in prior year four guarantees by Euler Hermes S.A. of $15.2 million; one guarantee insurance issued by Deutsche Bank AG with a volume of $2.2 million (in prior year one guarantee issued by Deutsche Bank AG with a volume of $2.9 million). None of these guarantees reduce the possible utilization limit of the current RCF.
Item 7A. Quantitative and Qualitative Disclosures About Market Risk
Our activities expose us to a variety of market risks. Our primary market risk exposures relate to foreign exchange, interest rate and commodity risks. To manage these risks and our exposure to the unpredictability of financial markets, we seek to minimize potential adverse effects on our financial performance and capital. Where appropriate, we use derivative financial instruments solely for the purpose of hedging the currency, interest and commodity risks arising from our operations and sources of finance. For this purpose, a systematic financial and risk management system has been established. We do not enter into derivative financial instruments for speculative purposes.
The following discussion and analysis only addresses our market risk and does not address other financial risks that we face in the normal course of business, including credit risk and liquidity risk.
Interest Rate Risk
Interest rate risk management aims to protect consolidated net income from negative effects from market interest rate fluctuations. Orion would be exposed to interest rate risk which might arise from incurring new liabilities at this time due to higher interest rates. Since the Term Loans are variable interest rate instruments, we are exposed to the market risk arising from changes in the yield curve. Appropriate hedging instruments are in place to mitigate the exposure arising from increasing interest rates.
The table below shows the sensitivity of the interest expense to changes in the interest rate, after the impact of hedge accounting. It shows the change resulting from a hypothetical fluctuation in the three-month LIBOR of 50 basis points (0.50%) as of December 31, 2019 assuming that all other variables remain unchanged. For example changes in USD/EUR currency rate would have an impact on our interest exposure and vice versa. Changes in interest rates would also have a related impact on our foreign currency (USD) exposure. The sensitivity analysis assumes that the hypothetical interest rate was valid and that the Revolving Credit Facilities was utilized in the full amount over the course of the entire year. The effect of this hypothetical change in the interest rate of the variable rate loan on our consolidated income from operations before taxes and equity in earnings of affiliated companies ("income before taxes" in this section) for the year ended December 31, 2019 is as follows:
| | | | | | | | | | | | | | |
| | December 31, 2019 | | |
| | Increase by 0.50% | | Decrease by 0.50% |
| | In thousands | | | |
| Increase (decrease) in the interest expense | | $ | 12,648 | | | $ | (2,770) | |
| Increase (decrease) in income before taxes | | $ | 12,648 | | | $ | 2,770 | |
| Increase (decrease) in equity (cash flow hedge reserve) | | $ | 2,566 | | | $ | (1,302) | |
| Increase (decrease) in total comprehensive income before taxes | | $ | 15,214 | | | $ | 1,468 | |
Currency Risk
Our functional currency of our Company's main borrowing entity, OEC GmbH, is Euro. Currency risks primarily stem from future cash flows related to interest payments and the U.S. Dollar-denominated Term Loan. In addition to currency risks from operating activities, these interest and principal repayments mainly represent the risk in connection with exchange rate fluctuations.
The table below shows the sensitivity with regard to the effect of a change in the Euro/U.S. Dollar exchange rate using the outstanding amount and the interest for the U.S. Dollar-denominated Term Loan. A fluctuation of the Euro/U.S. Dollar exchange rate of 10% as of December 31, 2019 with other conditions remaining unchanged, would have the following effect on our income from operations before taxes and equity in earnings from affiliated companies or capital:
| | | | | | | | | | | | | | |
| | December 31, 2019 | | |
| | Value of the U.S. Dollar in relation to the Euro (1) | | |
| | Increase by 10% | | Decrease by 10% |
| | In thousands | | | |
| FX gain / (FX loss) in finance result | | $ | 1,479 | | | $ | (1,807) | |
| Increase (decrease) in income before taxes | | $ | 1,479 | | | $ | (1,807) | |
| Increase (decrease) in total comprehensive income before taxes | | $ | 1,479 | | | $ | (1,807) | |
(1) U.S. Dollar/Euro exchange rate as of December 31, 2019: 1.1234.
Commodity Risk
Commodity risk results from changes in market prices for raw materials, mainly carbon black oil. Raw materials are primarily purchased to meet our production requirements. Factors of importance to our risk position are the availability and price of raw materials, energy, starting products and intermediates. In particular, our raw material prices depend on exchange rates and the price of crude oil. Pricing and procurement risks are reduced through worldwide procurement and optimized processes to ensure immediate sourcing of additional raw material requirements. Costs for raw materials and energy have fluctuated significantly in past years and may continue to fluctuate in the future. We endeavor to reduce purchasing risks on the procurement markets through worldwide purchasing activities and optimized processes for the purchase of additional raw materials. Raw materials are purchased exclusively to cover our own requirements.
A significant portion of our volume of approximately 75% is sold based on formula-driven price adjustment mechanisms for changes in costs of raw materials. Sales prices under non-indexed contracts are reviewed on a quarterly basis to reflect raw material and market fluctuation. We believe that our contracts enable us to generally maintain our Segment Adjusted EBITDA Margins since the Acquisition. Beginning in 2016 we entered into limited short-term commodity derivatives for a specific carbon black oil grade.
Item 8. Financial Statements and Supplementary Data
REPORTS OF INDEPENDENT REGISTERED PUBLIC ACCOUNTING FIRM
To the Shareholders and the Board of Directors of Orion Engineered Carbons S.A.
Opinion on the Financial Statements
We have audited the accompanying consolidated balance sheets of Orion Engineered Carbons S.A. (the Company) as of December 31, 2019 and 2018, the related consolidated statements of operations, comprehensive income, changes in stockholders' equity and cash flows for each of the three years in the period ended December 31, 2019, and the related notes (collectively referred to as the “consolidated financial statements”). In our opinion, the consolidated financial statements present fairly, in all material respects, the financial position of the Company at December 31, 2019 and 2018, and the results of its operations and its cash flows for each of the three years in the period ended December 31, 2019, in conformity with U.S. generally accepted accounting principles.
We also have audited, in accordance with the standards of the Public Company Accounting Oversight Board (United States) (PCAOB), the Company's internal control over financial reporting as of December 31, 2019, based on criteria established in Internal Control-Integrated Framework issued by the Committee of Sponsoring Organizations of the Treadway Commission (2013 framework) and our report dated February 28, 2020 expressed an unqualified opinion thereon.
Basis for Opinion
These financial statements are the responsibility of the Company's management. Our responsibility is to express an opinion on the Company’s financial statements based on our audits. We are a public accounting firm registered with the PCAOB and are required to be independent with respect to the Company in accordance with the U.S. federal securities laws and the applicable rules and regulations of the Securities and Exchange Commission and the PCAOB.
We conducted our audits in accordance with the standards of the PCAOB. Those standards require that we plan and perform the audit to obtain reasonable assurance about whether the financial statements are free of material misstatement, whether due to error or fraud. Our audits included performing procedures to assess the risks of material misstatement of the financial statements, whether due to error or fraud, and performing procedures that respond to those risks. Such procedures included examining, on a test basis, evidence regarding the amounts and disclosures in the financial statements. Our audits also included evaluating the accounting principles used and significant estimates made by management, as well as evaluating the overall presentation of the financial statements. We believe that our audits provide a reasonable basis for our opinion.
Critical Audit Matter
The critical audit matter communicated below is a matter arising from the current period audit of the financial statements that was communicated or required to be communicated to the audit committee and that: (1) relates to accounts or disclosures that are material to the financial statements and (2) involved our especially challenging, subjective, or complex judgments. The communication of the critical audit matter does not alter in any way our opinion on the consolidated financial statements, taken as a whole, and we are not, by communicating the critical audit matter below, providing a separate opinion on the critical audit matter or on the accounts or disclosures to which it relates.
| | | | | | | | |
| | Income Taxes – Uncertain Tax Positions |
| | |
| Description of the Matter | | The Company operates in various countries and fiscal jurisdictions which are each subject to their respective local and distinct tax regulations and recognizes uncertain tax positions as described in Note P of the consolidated financial statements. Auditing the Company´s recognition and measurement of uncertain tax positions was complex due to significant estimates and judgment made by management in the assessment of the related tax matters. The Company´s estimates and judgment involve the interpretation of tax legislation, the evaluation of the risk of incorrect application of tax legislation and the evaluation of the applicability of tax case law and previous tax audit outcomes to current tax positions. Given the complexity and the subjective nature of the assessment of uncertain tax positions, evaluating management´s estimates relating to the determination of the uncertain tax positions requires extensive audit effort and a high degree of auditor judgment. |
| | |
| How We Addressed the Matter in Our Audit | | We obtained an understanding, evaluated the design and tested the operating effectiveness of the Company’s controls to recognize and measure uncertain tax positions. This included testing controls over the completeness of uncertain tax positions and management’s review of the estimates and judgments described above. To test the recognition and measurement of the Company’s uncertain tax positions, we performed audit procedures that included, among others, assessing management’s methodology and the completeness and clerical accuracy of underlying data used by the Company in its analysis. We involved our tax professionals to assist with our procedures. We evaluated the estimates and significant judgments made by management in determining the recognition and measurement of the uncertain tax positions recorded taking into consideration the Company’s correspondence with the relevant tax authorities, income tax opinions, and third-party advice. We tested the consistency of the Company’s estimates and judgments in determining its tax positions with relevant jurisdictional income tax regulation, applicable tax case law, previous tax audit outcomes and other relevant information. We also evaluated the adequacy of the Company’s financial statement disclosures related to these tax matters. |
| | | | | | | | |
| /s/Tobias Schlebusch | | /s/Titus Zwirner |
| Wirtschaftsprüfer | | Wirtschaftsprüfer |
| (German Public Auditor) | | (German Public Auditor) |
Ernst & Young GmbH Wirtschaftsprüfungsgesellschaft
We have served as the Company’s auditor since 2011
Cologne, Germany
February 20, 2020
Consolidated statements of operations of Orion Engineered Carbons S.A.
| | | | | | | | | | | | | | | | | | | | | | | | | | |
| | | | Years Ended December 31, | | | | |
| | | | 2019 | | 2018 | | 2017 |
| | | | (In thousands, except per share amounts) | | | | |
| Net sales | | | | $ | 1,476,353 | | | $ | 1,578,203 | | | $ | 1,328,297 | |
| Cost of sales | | | | 1,086,644 | | | 1,148,232 | | | 950,701 | |
| Gross profit | | | | 389,708 | | | 429,971 | | | 377,596 | |
| | | | | | | | |
| Selling, general and administrative expenses | | | | 206,886 | | | 231,918 | | | 207,493 | |
| Research and development costs | | | | 19,874 | | | 20,320 | | | 18,159 | |
| Other expenses, net | | | | 12,169 | | | 6,061 | | | 7,581 | |
| Restructuring income | | | | — | | | 40,253 | | | — | |
| Restructuring expenses | | | | 3,628 | | | 15,620 | | | 6,492 | |
| Income from operations | | | | 147,151 | | | 196,305 | | | 137,871 | |
| | | | | | | | |
| Interest and other financial expense, net | | | | 27,572 | | | 28,642 | | | 44,135 | |
| Reclassification of actuarial losses from AOCI | | | | — | | | — | | | 9,687 | |
| Income from operations before income taxes and equity in earnings of affiliated companies | | | | 119,579 | | | 167,663 | | | 84,049 | |
| | | | | | | | |
| Income tax expense | | | | 33,216 | | | 46,944 | | | 19,736 | |
| Equity in earnings of affiliated companies, net of tax | | | | 558 | | | 591 | | | 547 | |
| Net income | | | | $ | 86,920 | | | $ | 121,310 | | | $ | 64,860 | |
| | | | | | | | |
| Weighted-average shares outstanding (in thousands of shares): | | | | | | | | |
| Basic | | | | 59,986 | | | 59,567 | | | 59,320 | |
| Diluted | | | | 61,300 | | | 61,049 | | | 60,674 | |
| Earnings per share (USD per share): | | | | | | | | |
| Basic | | | | $ | 1.45 | | | $ | 2.04 | | | $ | 1.09 | |
| Diluted | | | | 1.42 | | | 1.99 | | | 1.07 | |
| | | | | | | | |
| Dividends per share | | | | $ | 0.80 | | | $ | 0.80 | | | $ | 0.77 | |
The accompanying notes are an integral part of these consolidated financial statements.
Consolidated Statements of Comprehensive Income of Orion Engineered Carbons S.A.
| | | | | | | | | | | | | | | | | | | | | | | | | | |
| | | | Years Ended December 31, | | | | |
| | | | 2019 | | 2018 | | 2017 |
| | | | | | (In thousands) | | |
| Net income | | | | $ | 86,920 | | | $ | 121,310 | | | $ | 64,860 | |
| Other comprehensive income (loss), net of tax | | | | | | | | |
| Foreign currency translation adjustments | | | | (1,632) | | | (10,096) | | | (4,932) | |
| Unrealized net gains/(losses) on hedges of a net investment in a foreign operation | | | | 27 | | | (269) | | | 14,569 | |
| Unrealized net losses on cash flow hedges | | | | (4,772) | | | (4,077) | | | (1,108) | |
| Gains/(losses) on defined benefit plans | | | | (8,358) | | | 134 | | | 4,099 | |
| | | | | | | | |
| Other comprehensive income (loss) | | | | (14,734) | | | (14,308) | | | 12,628 | |
| Comprehensive income | | | | $ | 72,186 | | | $ | 107,002 | | | $ | 77,488 | |
The accompanying notes are an integral part of these consolidated financial statements.
Consolidated Balance Sheets of Orion Engineered Carbons S.A.
| | | | | | | | | | | | | | | | | | | | | | | | | | | | | | | | |
| | | | | | | | December 31 | | |
| | | | | | | | 2019 | | 2018 |
| | | | | | | | (In thousands, except share amounts) | | |
| Current assets | | | | | | | | | | |
| Cash and cash equivalents | | | | | | | | $ | 63,726 | | | $ | 57,016 | |
| Accounts receivable, net of reserve for doubtful accounts | | | | | | | | | | | | |
| of | $6,632 | | and | $5,081 | | | | | 212,565 | | | 262,821 | |
| Other current financial assets | | | | | | | | 11,347 | | | 12,573 | |
| Inventories | | | | | | | | 164,799 | | | 183,629 | |
| Income tax receivables | | | | | | | | 17,924 | | | 24,342 | |
| Prepaid expenses and other current assets | | | | | | | | 37,358 | | | 34,938 | |
| Total current assets | | | | | | | | 507,718 | | | 575,319 | |
| Property, plant and equipment - net | | | | | | | | 534,054 | | | 483,534 | |
| Operating lease right-of-use assets | | | | | | | | 27,532 | | | — | |
| Goodwill | | | | | | | | 77,341 | | | 55,546 | |
| Intangible assets - net | | | | | | | | 50,596 | | | 95,245 | |
| Investment in equity method affiliates | | | | | | | | 5,232 | | | 5,332 | |
| Deferred income tax assets | | | | | | | | 48,720 | | | 52,395 | |
| Other financial assets | | | | | | | | 2,501 | | | 2,723 | |
| Other assets | | | | | | | | 3,701 | | | 2,928 | |
| Total non-current assets | | | | | | | | 749,676 | | | 697,703 | |
| Total assets | | | | | | | | $ | 1,257,394 | | | $ | 1,273,022 | |
| | | | | | | | | | | | | | | | | | | | |
| Current liabilities | | | | | | |
| Accounts payable | | | | $ | 156,298 | | | $ | 163,585 | |
| Current portion of long term debt and other financial liabilities | | | | 36,410 | | | 41,020 | |
| Current portion of employee benefit plan obligation | | | | 908 | | | 855 | |
| Accrued liabilities | | | | 44,931 | | | 56,297 | |
| Income taxes payable | | | | 14,154 | | | 28,086 | |
| Other current liabilities | | | | 32,509 | | | 30,493 | |
| Total current liabilities | | | | 285,211 | | | 320,336 | |
| Long-term debt, net | | | | 630,261 | | | 643,748 | |
| Employee benefit plan obligation | | | | 71,901 | | | 60,377 | |
| Deferred income tax liabilities | | | | 43,308 | | | 45,504 | |
| Other liabilities | | | | 40,701 | | | 44,161 | |
| Commitments and contingencies | | Note R | | — | | | | — | |
| Total non-current liabilities | | | | 786,171 | | | 793,790 | |
Stockholders' equity
| | | | | | |
| Common stock | | | | | | |
Authorized: 65,035,579 and 89,452,626 shares with no par value | | | | | | |
Issued – 60,729,289 and 60,035,579 shares with no par value | | | | | | |
Outstanding – 60,224,147 and 59,518,498 shares | | | | 85,032 | | | 84,254 | |
Less 505,142 and 517,081 shares of common treasury stock, at cost | | | | (8,515) | | | (8,683) | |
| Additional paid-in capital | | | | 65,562 | | | 63,544 | |
| Retained earnings | | | | 78,296 | | | 39,409 | |
| Accumulated other comprehensive loss | | | | (34,362) | | | (19,628) | |
| Total stockholders' equity | | | | 186,013 | | | 158,896 | |
| Total liabilities and stockholders' equity | | | | $ | 1,257,394 | | | $ | 1,273,022 | |
The accompanying notes are an integral part of these consolidated financial statements.
Consolidated Statements of Cash Flows of Orion Engineered Carbons S.A.
| | | | | | | | | | | | | | | | | | | | | | | | | | |
| | | | Years Ended December 31, | | | | |
| | | | 2019 | | 2018 | | 2017 |
| | | | (In thousands) | | | | |
| Cash flows from operating activities: | | | | | | | | |
| Net income | | | | $ | 86,920 | | | | $ | 121,310 | | | | $ | 64,860 | |
| Adjustments to reconcile net income to net cash provided by operating activities: | | | | | | | | | | | | | |
| Depreciation of property, plant and equipment and amortization of intangible assets | | | | 96,713 | | | | 98,156 | | | | 98,356 | |
| | | | | | | | |
| Amortization of debt issuance costs | | | | 2,082 | | | | 2,220 | | | | 4,171 | |
| Share-based incentive compensation | | | | 9,438 | | | | 13,919 | | | | 8,835 | |
| Deferred tax (benefit)/provision | | | | 15,826 | | | | (3,634) | | | | (7,667) | |
| | | | | | | | |
| Foreign currency transactions | | | | 1,052 | | | | 2,782 | | | | (14,402) | |
| Other operating non-cash items | | | | 1,813 | | | | 1,165 | | | | 15,163 | |
| Changes in operating assets and liabilities, net of effects of businesses acquired: | | | | | | | | | | | | | |
| (Increase)/decrease in trade receivables | | | | 45,412 | | | | (39,680) | | | | (15,885) | |
| (Increase)/decrease in inventories | | | | 16,413 | | | | (31,406) | | | | (25,632) | |
| Increase/(decrease) in trade payables | | | | (12,036) | | | | 5,444 | | | | 17,545 | |
| Increase/(decrease) in provisions | | | | (10,375) | | | | (4,427) | | | | (12,317) | |
| Increase/(decrease) in tax liabilities | | | | (7,254) | | | | 4,843 | | | | (11,954) | |
| Increase/(decrease) in other assets and liabilities that cannot be allocated to investing or financing activities | | | | (14,497) | | | | (48,707) | | | | 26,666 | |
| Net cash provided by operating activities | | | | $ | 231,507 | | | | $ | 121,985 | | | | $ | 147,739 | |
| Cash flows from investing activities: | | | | | | | | | | | | | |
| Cash paid for the acquisition of intangible assets and property, plant and equipment | | | | $ | (155,848) | | | | $ | (116,157) | | | | $ | (90,282) | |
| Acquisition of businesses, net of cash and cash equivalents acquired | | | | — | | | | (36,571) | | | | — | |
| Cash received from the disposal of intangible assets and property, plant and equipment | | | | — | | | | 64,672 | | | | — | |
| Net cash used in investing activities | | | | $ | (155,848) | | | | $ | (88,056) | | | | $ | (90,282) | |
| Cash flows from financing activities: | | | | | | | | | | | | | |
| Proceeds from borrowings | | | | $ | — | | | | $ | — | | | | $ | 11,890 | |
| Payments for debt issue costs | | | | (1,721) | | | | (741) | | | | (5,327) | |
| Repayments of long-term debt | | | | (8,036) | | | | (8,288) | | | | (28,866) | |
| Cash inflows related to current financial liabilities | | | | 96,956 | | | | 48,963 | | | | 11,652 | |
| Cash outflows related to current financial liabilities | | | | (101,303) | | | | (26,370) | | | | (12,141) | |
| Dividends paid to shareholders | | | | (48,033) | | | | (47,665) | | | | (45,705) | |
| Repurchase of common stock | | | | — | | | | (4,926) | | | | — | |
| Taxes paid for shares issued under net settlement feature | | | | (6,475) | | | | (4,741) | | | | — | |
| Net cash used in financing activities | | | | $ | (68,612) | | | | $ | (43,768) | | | | $ | (68,497) | |
| Increase (decrease) in cash, cash equivalents and restricted cash | | | | $ | 7,047 | | | | $ | (9,839) | | | | $ | (11,040) | |
| Cash, cash equivalents and restricted cash at the beginning of the period | | | | 61,604 | | | | 75,213 | | | | 80,480 | |
| Effect of exchange rate changes on cash | | | | (420) | | | | (3,770) | | | | 5,773 | |
| Cash, cash equivalents and restricted cash at the end of the period | | | | $ | 68,231 | | | | $ | 61,604 | | | | $ | 75,213 | |
| Less restricted cash at the end of the period | | | | 4,505 | | | | 4,588 | | | | 2,929 | |
| Cash and cash equivalents at the end of the period | | | | $ | 63,726 | | | | $ | 57,016 | | | | $ | 72,284 | |
| | | | | | | | |
| Cash paid for interest, net | | | | $(20,399) | | $ | (24,367) | | | $ | (25,905) | |
| Cash paid for income taxes | | | | $(24,106) | | $ | (60,228) | | | $ | (39,549) | |
| Supplemental disclosure of non-cash activity: | | | | | | | | |
| Liabilities under build-to-suit lease | | | | $ | — | | | $ | 28,657 | | | $ | — | |
| Liabilities for leasing - current | | | | $ | 6,254 | | | $ | — | | | $ | — | |
| Liabilities for leasing - non-current | | | | $ | 26,280 | | | $ | — | | | $ | — | |
The accompanying notes are an integral part of these consolidated financial statements.
Consolidated Statements of Changes in Stockholders’ Equity of Orion Engineered Carbons S.A.
| | | | | | | | | | | | | | | | | | | | | | | | | | | | | | | | | | | | | | | | | | | | | | | | | | |
| | | | Common stock | | | | | | | | | | | | |
| (In thousands, except per share amounts) | | | | Number of common shares | | Amount | | Treasury shares | | Addi-tional
paid-in
capital | | Retained
earnings | | Accumulated other compre-hensive loss | | Total equity |
| As at January 1, 2017 | | | | 59,320,214 | | | $ | 83,770 | | | $ | (3,773) | | | $ | 139,399 | | | $ | (146,761) | | | $ | (17,948) | | | $ | 54,687 | |
| Net income | | | | — | | | — | | | — | | | — | | | 64,860 | | | — | | | 64,860 | |
| Other comprehensive income, net of tax | | | | — | | | — | | | — | | | — | | | — | | | 12,628 | | | 12,628 | |
| Distributions from additional paid-in capital | | | | — | | | — | | | — | | | (45,705) | | | — | | | — | | | (45,705) | |
| | $0.77 | | per share | | | | | | | | | | | | | | |
| | | | | | | | | | | | | | | | |
| Share based compensation | | | | — | | | — | | | — | | | 8,835 | | | — | | | — | | | 8,835 | |
| | | | | | | | | | | | | | | | |
| As at December 31, 2017 | | | | 59,320,214 | | | 83,770 | | | (3,773) | | | 102,529 | | | (81,901) | | | (5,320) | | | 95,305 | |
| Net income | | | | — | | | — | | | — | | | — | | | 121,310 | | | — | | | 121,310 | |
| Other comprehensive loss, net of tax | | | | — | | | — | | | — | | | — | | | — | | | (14,308) | | | (14,308) | |
| Distributions from additional paid-in capital | | | | — | | | — | | | — | | | (47,665) | | | — | | | — | | | (47,665) | |
| | $0.80 | | per share | | | | | | | | | | | | | | |
| Share buyback | | | | (206,501) | | | — | | | (4,926) | | | — | | | — | | | — | | | (4,926) | |
| Share based compensation | | | | — | | | — | | | — | | | 8,680 | | | — | | | — | | | 8,680 | |
| Issuance of stock under equity compensation plans | | | | 404,785 | | | 484 | | | 16 | | | — | | | — | | | — | | | 500 | |
| As at December 31, 2018 | | | | 59,518,498 | | | 84,254 | | | (8,683) | | | 63,544 | | | 39,409 | | | (19,628) | | | 158,896 | |
| Net income | | | | — | | | — | | | — | | | — | | | 86,920 | | | — | | | 86,920 | |
| Other comprehensive loss, net of tax | | | | — | | | — | | | — | | | — | | | — | | | (14,734) | | | (14,734) | |
| Dividends paid - | | $0.80 | | per share | | — | | | — | | | — | | | — | | | (48,033) | | | — | | | (48,033) | |
| | | | | | | | | | | | | | | | |
| Share based compensation | | | | — | | | — | | | — | | | 2,018 | | | — | | | — | | | 2,018 | |
| Issuance of stock under equity compensation plans | | | | 705,649 | | | 778 | | | 168 | | | — | | | — | | | — | | | 946 | |
| As at December 31, 2019 | | | | 60,224,147 | | | $ | 85,032 | | | $ | (8,515) | | | $ | 65,562 | | | $ | 78,296 | | | $ | (34,362) | | | $ | 186,013 | |
| | | | | | | | | | | | | | | | |
The accompanying notes are an integral part of these consolidated financial statements.
Note A. Significant Accounting Policies
Orion’s audited consolidated financial statements comprise Orion and its subsidiaries (the “Orion Group”, or the “Group” or the “Company”). The Company's fiscal year comprises the period from January 1 to December 31, 2019.
The Company’s audited consolidated financial statements are prepared in US Dollars, the presentation currency of the Company. Except where stated otherwise, all figures are presented in thousands of US Dollars.
The consolidated financial statements have been prepared in conformity with accounting principles generally accepted in the United States of America (“GAAP”).
Adoption of accounting standards
In February 2016, the FASB issued ASU 2016-02, Leases (Topic 842). Under the amendments in ASU 2016-02, lessees are required to recognize (i) a lease liability, which is a lessee’s obligation to make lease payments arising from a lease, measured on a discounted basis; and (ii) a right-of-use asset, which is an asset that represents the lessee’s right to use, or control the use of, a specified asset for the lease term for all leases (with the exception of short-term leases) at the commencement date. This guidance is effective for fiscal years beginning after December 15, 2018 including interim periods within those fiscal years. Early adoption is permitted. In July 2018, the FASB issued ASU 2018-11, Leases (Topic 842): Targeted Improvements, to provide an additional (and optional) transition method with which to adopt ASU 2016-02. In July 2018, the FASB also issued ASU 2018-10, Codification Improvements to Topic 842, Leases, to clarify the codification more generally and/or to correct unintended application of guidance. More recently, in March 2019, the FASB issued ASU No. 2019-01, Leases (Topic 842): Codification Improvements, which was also issued to clarify the codification more generally and/or to correct unintended application of guidance. ASU 2019-01 clarifies transition disclosure requirements upon adoption of Topic 842. We adopted ASUs 2016-02, 2018-11, 2018-10 and 2019-01 (“Lease ASUs”) as of January 1, 2019 using the optional transition method under ASU 2018-11 that allows for a cumulative-effect adjustment in the period of adoption without restating prior periods. Orion elected the practical expedients upon transition to retain the lease classification and initial direct costs for any leases that existed prior to adoption of the standard. As a result of adopting these Lease ASUs we recorded additional lease assets and liabilities of approximately $30 million and $31 million on our condensed consolidated balance sheet as of March 31, 2019. Additionally, upon adoption of ASU 2016-02 we de-recognized one asset previously recorded under build-to-suit accounting and its associated liability of $29 million. A right-of-use asset will be capitalized upon subsequent commencement of the lease. Refer to Note C. Leases for further information about adoption of Topic 842.
In October 2018, the FASB issued ASU No. 2018-16, Derivatives and Hedging (Topic 815): Inclusion of the Secured Overnight Financing Rate (SOFR) Overnight Index Swap (OIS) Rate as a Benchmark Interest Rate for Hedge Accounting Purposes. The amendments in the update permit use of the OIS rate based on SOFR as a U.S. benchmark interest rate. Including the OIS rate based on SOFR as an eligible benchmark interest rate during the early stages of the marketplace transition will facilitate the LIBOR to SOFR transition and provide sufficient lead time for entities to prepare for changes to interest rate risk hedging strategies for both risk management and accounting purposes. The new standard is required to be adopted concurrently with the amendments in ASU 2017-12, and early adoption is permitted if an entity has already adopted ASU 2017-12. The Company adopted ASU 2018-16 concurrently with ASU 2017-12 as of January 1, 2019. The adoption of this guidance did not have a significant impact on the Company's financial statements.
In August 2018, the FASB issued ASU No. 2018-13, Fair Value Measurement (Topic 820): Disclosure Framework - Changes to the Disclosure Requirements for Fair Value Measurement, that modifies the disclosure requirements for fair value measurements made in accordance with Topic 820, Fair Value Measurement, based on the concepts in the Concepts Statement, including the consideration of costs and benefits. The new guidance removes requirements to disclose the amount of and reason for transfers between Level 1 and Level 2 of the fair value hierarchy, the policy for timing of transfers between levels and the valuation processes for Level 3 fair value measurements. The new standard is effective for fiscal years, and interim periods within those fiscal years, beginning after December 15, 2019. The Company early adopted ASU 2018-13 as of January 1, 2019. The adoption of this guidance did not have an impact on the Company's financial statements.
In February 2018, the FASB issued ASU No. 2018-02, Income Statement - Reporting Comprehensive Income (Topic 220): Reclassification of Certain Tax Effects from Accumulated Other Comprehensive Income, which allows for the elimination of the stranded income tax effects resulting from the enactment of the Tax Cuts and Jobs Act through a reclassification from accumulated other comprehensive income to retained earnings. The standard is effective for fiscal years beginning after December 15, 2018. Early adoption is permitted. The Company adopted ASU 2018-02 as of January 1, 2019. The adoption of this guidance did not have an impact on the Company's financial statements.
In August 2017, the FASB issued ASU No. 2017-12, Derivatives and Hedging (Topic 815): Targeted Improvements to Accounting for Hedging Activities, that amends the hedge accounting recognition and presentation requirements under hedge accounting. The new standard will make more financial and non-financial hedging strategies eligible for hedge accounting, amends the presentation and disclosure requirements, and simplifies how companies assess effectiveness. The new standard is effective for fiscal years beginning after December 15, 2018, including interim periods within those years, and early adoption is permitted. The Company adopted ASU 2017-12 as of January 1, 2019. The adoption of this guidance did not have a material impact on the Company's financial statements.
In June 2016, the FASB issued ASU No. 2016-13, Financial Instruments - Credit Losses. The new guidance requires the Company to measure all expected credit losses for financial instruments held at the reporting date based on historical experience, current conditions and reasonable and supportable forecasts. The new standard is effective for fiscal years beginning after December 15, 2019, including all interim periods within those years, and early adoption is permitted for fiscal years beginning after December 15, 2018. The Company adopted ASU 2016-13 as of January 1, 2019. The adoption of this guidance and recognition of a loss allowance at an amount equal to lifetime expected credit losses for trade receivables was immaterial and did not result in a transition adjustment on retained earnings.
Principles of consolidation
The consolidated financial statements include all subsidiaries indirectly or directly controlled by Orion. Entities are consolidated from the date Orion obtains control, which generally is the acquisition date, and are deconsolidated when control is lost.
Control is achieved when Orion is exposed, or has the right, to variable returns from its involvement with the investee and has the ability to affect those returns through its power over the investee. Orion re-assesses whether or not it controls an investee if facts and circumstances indicate that there are changes to one or more of these three elements of control.
Orion consolidated financial statements are prepared in accordance with uniform accounting policies. Income and expenses, intercompany profits and losses, and receivables and liabilities between consolidated subsidiaries are eliminated.
Use of estimates
The preparation of consolidated financial statements in conformity with accounting principles generally accepted in the U.S. requires management to make certain estimates and assumptions that affect the reported amount of assets and liabilities and the disclosure of contingent assets and liabilities at the date of the consolidated financial statements and the reported amounts of revenue and expenses during the reported period. Actual results could differ from those estimates.
Foreign currency translation
Foreign currency transactions are measured at the exchange rate at the date of initial recognition. Any gains or losses resulting from the valuation of foreign currency monetary assets and liabilities using the currency exchange rates as at the reporting date are recognized in other expenses, net. Other operating income from currency translation amounted to zero in 2019, $0.3 million in 2018 and $0.1 million in 2017. Other operating expenses from currency translation amounted to zero in 2019, $0.1 million in 2018 and zero in 2017.
Currency exchange differences relating to financing activities are recognized in interest and other financial income and interest and other financial expense.
The assets and liabilities of foreign operations with functional currencies different from the presentation currency U.S. dollars are translated using closing rates as at the reporting date. Income and expense items are translated at average monthly exchange rates for the respective period. The translation of equity is performed using historical exchange rates. The overall foreign currency impact from translating the statement of financial position and income statement of all the foreign entities is recognized in accumulated other comprehensive income (loss) ("AOCI").
Revenue and income recognition
OEC recognizes revenue when or as it satisfies a performance obligation by transferring a good or a service to a customer. Revenue is only recognized when control is transferred to the customer. The amount of consideration we receive and revenue we recognize is based upon the terms stated in the sales contract, which may contain variable consideration such as discounts or rebates. We also give our customers a limited right to return product that has been damaged, does not satisfy their specifications, or other specific reasons. Payment terms on product sales to our customers typically range from 30 to 90 days. Although certain exceptions exist where standard payment terms are exceeded, these instances are infrequent and do not exceed one year.
Revenue is recognized according to the five-step model proscribed in ASC 606. Under the first step, the entity has to identify the contract entered with a customer granting the right to receive goods or service in exchange for consideration. The second step requires the identification of distinct performance obligations within a contract. The transaction price of the arrangement is defined in Step 3 of ASC 606. In addition to the contractual fixed price the entity has to take variable considerations into account. If the entity identified more than one separate performance obligation under step 2, it has to account for this contract as a multiple element arrangement resulting in an allocation of revenues to the obligations identified. If these conditions are satisfied, revenue from the sale of goods is recognized when control have been transferred to the buyer, either at a point in time, or over time.
The Company records a provision for warranty costs, based on historical trends of warranty costs incurred as a percentage of sales, which management has determined to be a reasonable estimate of the probable losses to be incurred for warranty claims in a period.
The Company derives substantial majority of revenues by selling carbon black to industrial customers for further processing. Revenue recognition and measurement is governed by the following principles. The amount of revenue, the transactions price, is
contractually specified between the parties and is measured at the amount expected be received less value-added tax and any trade discounts and volume rebates granted. Discounts and volume rebates are accounted for as estimates of variable consideration and deducted from revenue.
With respect to the sale of goods, sales are recognized at the point in time control over the good transfers to the customer. The timing of the transfer of control varies depending on the individual terms of the sales agreement.
Shipping and handling costs incurred in connection with the satisfaction of performance obligations are accounted for as fulfillment activities rather than separate performance obligations.
Interest income is recognized using the effective interest method.
Cost of sales
Cost of Sales consists of the raw and packaging materials, direct manufacturing costs, depreciation, inspection costs, inbound freight cost and shipping, internal handling costs and other overhead expenses necessary to manufacture the products.
Selling and administrative expenses
Selling and administrative expenses consist of salaries and other compensation benefits of sales and office personnel, general office expenses and other expenses not directly related to manufacturing operations.
Research and development costs
Research and development costs include salaries, equipment and material expenditures, and contractor fees and are expensed as incurred.
Income taxes
Current income tax receivables and liabilities are measured at the amount expected to be recovered from or paid to the taxation authorities. They are calculated based on the tax rates and tax laws that are enacted on the reporting date.
Deferred tax assets and liabilities are determined based on the estimated future tax effects of differences between financial statement carrying amounts and the tax bases of existing assets and liabilities. Deferred tax assets are recognized to the extent that realization of those assets is considered to be more likely than not. They are measured using statutory tax rates that are expected to apply to taxable income in the jurisdictions and years when the asset is realized or the liability is settled, based on tax rates that are enacted at the reporting date. The effect on deferred tax assets and liabilities of a change in tax rates is recognized in income in the period that includes the enactment date.
A valuation allowance is established for deferred taxes when it is more likely than not that all or a portion of the deferred tax assets will not be realized.
Orion records benefits for uncertain tax positions based on the assessment of whether the position is more likely than not to be sustained by taxing authorities. If the threshold is not met, no tax benefit of the uncertain tax position is recognized. If the threshold is met, the tax benefit that is recognized is the largest amount that is greater than 50% likely of being realized upon ultimate settlement. The analysis presumes the taxing authorities' full knowledge of the positions taken and all relevant facts, but does not consider the time value of money. The Company also accrues for interest and penalties on its uncertain tax positions and included such charges in its income tax provision in the Consolidated Statements of Operations.
Cash, cash equivalents and restricted cash
Cash and cash equivalents comprise bank balances, checks and cash on hand. They include all highly liquid investments with a maturity of three months or less at date of acquisition.
Restricted cash comprises cash which is not available for immediate use and may not be utilized for any purpose until a certain event or events take place. A designation for short-term or long-term restricted cash is made based on the expected time of release or distribution.
Cash, cash equivalents and restricted cash for December 31, 2019 and 2018 reconciles as follows:
| | | | | | | | | | | |
| December 31 | | |
| 2019 | | 2018 |
| (In thousands) | | |
| Cash and cash equivalents | $ | 63,726 | | | $ | 57,016 | |
| Restricted cash included in other assets and liabilities | 4,505 | | | 4,588 | |
| Total cash, cash equivalents and restricted cash shown in the statement of cash flows | $ | 68,231 | | | $ | 61,604 | |
Restrictions result from mandatory and voluntary pledges to secure certain guarantee amounts.
Accounts and notes receivables
Trade receivables are recorded at the invoiced amount and generally do not bear interest. Orion monitors and evaluates collectability of receivables on an ongoing basis and considers whether an allowance for doubtful accounts is necessary. Trade receivables in China may at certain times be settled with the receipt of bank issued non-interest bearing notes.
Financial instruments
Orion’s financial instruments consist primarily of cash and cash equivalents, trade receivables, loans, miscellaneous financial assets, term loan, local bank loans, trade payables and derivative instruments. The carrying values of Orion’s financial instruments approximate fair value with the exception of variable rate long-term debt, which is recorded at amortized cost. The fair values of the Company’s financial instruments are based on quoted market prices, if such prices are available. In situations where quoted market prices are not available, the Company relies on valuation models to derive fair value. Such valuation takes into account the ability of the financial counterparty to perform and the Company’s own credit risk.
The Company uses derivative financial instruments primarily for purposes of hedging the exposures to fluctuations in foreign currency exchange rates, which exist as part of its ongoing business operations. Orion does not enter into derivative contracts for speculative purposes, nor does it hold or issue any derivative contracts for trading purposes. All derivatives are recognized on the Consolidated Balance Sheets at fair value. Where the Company has a legal right to offset derivative settlements under a master netting agreement with a counterparty, derivatives with that counterparty are presented on a net basis. The changes in the fair value of derivatives are recorded in either earnings or AOCI, depending on whether or not the instrument is designated as part of a hedge transaction and, if designated as part of a hedge transaction, the type of hedge transaction. The gains or losses on derivative instruments reported in AOCI are reclassified to earnings in the period in which earnings are affected by the underlying hedged item. The ineffective portion of all hedges is recognized in earnings during the period in which the ineffectiveness occurs.
In accordance with Orion’s risk management strategy, the Company may enter into certain derivative instruments that may not be designated as hedges for hedge accounting purposes. Although these derivatives are not designated as hedges, the Company believes that such instruments are closely correlated with the underlying exposure, thus managing the associated risk. The Company records in earnings the gains or losses from changes in the fair value of derivative instruments that are not designated as hedges. Cash movements associated with these instruments are presented in the Consolidated Statements of Cash Flows as Cash Flows from Operating Activities because the derivatives are designed to mitigate risk to the Company’s cash flow from operations. The cash flows related to the principal amount of outstanding debt instruments are presented in the Cash Flows from Financing Activities section of the Consolidated Statements of Cash Flows.
Concentrations of credit risk
Credit risk is the risk of an unexpected loss if a customer or third party to a financial instrument fails to meet its contractual obligations. Financial instruments that potentially subject the Company to a concentration of credit risk consist primarily of cash and cash equivalents, accounts receivable, derivative instruments and undrawn amounts under the Revolving Credit Facility.
Cash and Cash Equivalents
Cash and cash equivalents are defined as cash on hand, demand deposits with financial institutions, and short-term liquid investments with an initial maturity date of less than three months. Our cash in demand deposit accounts may exceed federally insured limits and could be negatively impacted if the underlying financial institutions fail or are subject to other adverse conditions in the financial markets. Credit risk is mitigated as we place the cash mainly with our defined core banks which are major financial institutions enjoying investment grade long-term credit ratings. To date, we have not experienced a loss or diminished access to cash in our demand deposit accounts.
Accounts receivable
Our trade accounts receivable are subject to concentrations of credit risk with customers primarily in our Rubber Carbon Black segment. During 2019, sales to our ten largest customers within our Rubber Carbon Black segment accounted for approximately 66.1% of
total consolidated segment revenues. Sales to our ten largest customers within our Specialty Carbon Black segment accounted for approximately 27.7% of total consolidated segment revenues (alternatively, our top ten customers represent 52.7% of total Company's sales volume). A default in payment, a material reduction in purchases from these or any other large customers, or the loss of a large customer or customer groups could have a material adverse impact on our financial condition, results of operations and liquidity. In addition, trade receivables are subject to concentrations of credit risk with customers of specific industries which can be affected by a downturn in the economy. We estimate the receivables for which we do not expect full collection based on historical collection rates and ongoing evaluations of the creditworthiness of our customers including considerations of future macroeconomic expectations. An allowance is recorded in our consolidated financial statements for these estimated amounts. The concentration of customer credit risk is mitigated by the size and diversity of the customer base as well as its geographic dispersion.
Derivative instruments
By using derivative instruments, Orion is subject to credit risk. If a counterparty fails to fulfill its performance obligations under a derivative contract, Orion’s credit risk will equal the fair value of the derivative. Generally, when the fair value of a derivative contract is positive, the counterparty owes Orion, thus creating a payment risk for Orion. The Company minimizes counterparty credit (or repayment) risk by entering into transactions with major financial institutions enjoying investment grade long-term credit ratings. No significant concentration of credit risk existed as of December 31, 2019.
Undrawn amounts under the Revolving Credit Facility
The Company has a €175.0 million syndicated Revolving Credit Facility, originally dated July 25, 2014, in place to cover short-term Working Capital requirements. The Revolving Credit Facility syndicate is comprised of ten national and international banks. Currently a major part of the Revolving Credit Facility is still undrawn. If a Revolving Credit Facility lender fails to fulfill its performance obligations (especially with respect to making funds available) under the credit agreement, Orion’s credit risk comprises a potential cash shortage/refinancing risk amounting to the respective bank's commitment amount. With regard to the allocation of the total Revolving Credit Facility amount of €175.0 million to the ten major financial institutions (highest single commitment is €24.0 million), all with investment grade long-term credit ratings, there is no significant concentration of credit risk as of December 31, 2019.
Inventories
Inventories are stated at the lower of cost or net realizable value. The cost of inventories (raw materials, consumables and supplies) that have a similar nature or use is assigned by using the weighted average cost method. Amounts are removed from inventory using the average cost.
Inventory is reviewed for both potential obsolescence and potential declines in net realizable value periodically. In this review, assumptions are made about the future demand for, and market value of, the inventory and based on these assumptions the amount of any obsolete, slow moving, or overvalued inventory is estimated. Orion writes down the value of these inventories by an amount equal to the difference between the cost of the inventory and its estimated net realizable value.
Investments
The Company has an investment in DGW (Kommanditgesellschaft Deutsche Gasrußwerke GmbH & Co) and DGW GmbH (Kommanditgesellschaft Deutsche Gasrußwerke GmbH & Co) that is determined to not be a Variable Interest Entity and is accounted for using the equity method. The equity method is used to account for investments in affiliates in which the Company has the ability to exert significant influence over the affiliates’ operating and financial policies.
Intangible assets and goodwill
The Company records tangible and intangible assets acquired and liabilities assumed in business combinations under the acquisition method of accounting. Amounts paid for an acquisition are allocated to the assets acquired and liabilities assumed based on their fair values at the date of acquisition. The determination of the fair value of intangible assets requires the use of significant judgment with regard to assumptions used in the valuation model. The Company estimates the fair value of identifiable acquisition-related intangible assets principally based on projections of cash flows that will arise from these assets. The projected cash flows are discounted to determine the fair value of the assets at the dates of acquisition. Acquisition-related costs are expensed as incurred and included in other expenses, net.
When the Company acquires a business, it assesses the financial assets and liabilities assumed for appropriate classification and designation in accordance with the contractual terms, economic circumstances and pertinent conditions as at the acquisition date. This includes the separation of embedded derivatives in host contracts by the acquiree.
Any contingent consideration to be transferred by the acquirer is recognized at fair value at the acquisition date.
Goodwill is comprised of the purchase price of business acquisitions in excess of the fair value assigned to the net tangible and identifiable intangible assets acquired (being the excess of the aggregate of i) the consideration transferred, ii) the amount recognized for non-controlling interest and iii) any previous interest held over the net assets acquired, over the fair value of the identifiable assets acquired and liabilities assumed).
At the date of acquisition the goodwill is allocated to those reporting units that are expected to benefit from the synergies of the combination even if no other assets or liabilities of the acquiree are assigned to that reporting unit.
Intangible assets acquired separately are recognized initially at cost. The cost of intangible assets acquired in a business combination is their fair value at the date of acquisition.
Intangible assets with finite useful lives, which are comprised of trademarks, customer relationships and developed technologies, are amortized over their estimated useful lives and, if events or changes in circumstances indicate that the carrying amount of an asset may not be recoverable, tested for impairment, see below in this note under “Impairment test“. Intangible assets with indefinite useful lives are not amortized, but are tested for impairment at least once a year. The useful lives of intangible assets are also re-assessed once a year.
Technology and patents (including capitalized development costs), trademarks and other intangible assets are amortized straight line over a useful life of 15 years. Other intangible assets are amortized straight line over a useful life of 3 to 10 years.
Customer relationships acquired in business combinations in 2011 from Evonik and in 2018 from SN2A are amortized over their useful life. The useful life is estimated on the basis of contractual arrangements and historical values and is approximately 8 and 15 years, respectively. The amortization amount is based on the economic life and the probability of continuing the customer relationship in the form of a churn rate.
Impairment of Long-lived Assets and other intangible assets with finite useful lives
The Company assesses long-lived assets such as property, plant and equipment and other intangible assets with finite useful lives for impairment whenever events or changes in circumstances indicate that the carrying amount of an asset, an asset group or reporting units (“RU's”) may not be recoverable.
Long-lived assets to be held and used are assessed for possible impairment by comparing their carrying values with their associated undiscounted, future net cash flows. Events that can trigger assessments for possible impairments include significant decreases in the market value of an asset, significant change in the extent or manner of use of or a physical change in an asset, and a more-likely-than-not expectation that a long-lived asset or asset group will be sold or otherwise disposed of significantly sooner than the end of its previously estimated useful life.
To test for impairment of assets, Orion generally uses a probability-weighted estimate of the future undiscounted net cash flows of the related assets over their remaining lives to determine if the value of the asset is recoverable. Long-lived assets are grouped with other assets and liabilities at the lowest level for which independent identifiable cash flows are determinable.
An asset impairment is recognized when the carrying value of the asset is not recoverable based on the analysis described above, in which case the asset is written down to its fair value. Any write-downs are treated as permanent reductions in the carrying amount of the assets.
If the asset does not have a readily determinable market value, a discounted cash flow model may be used to determine the fair value of the asset. In circumstances when an asset does not have separate identifiable cash flows, an impairment charge is recorded when the Company no longer intends to use the asset. An impairment loss may not be reversed if the fair value of the impaired asset or asset group increases subsequently.
Impairment of goodwill
Goodwill represents the excess of the purchase price over the net amount of identifiable assets acquired and liabilities assumed in a business combination measured at fair value. Goodwill is not amortized, but instead tested for impairment annually in the fourth quarter based on September 30 actual results, as well as whenever there are events or changes in circumstances (triggering events) which suggest that the carrying amount exceeds the fair value.
Impairment of goodwill is tested at the reporting unit level. A reporting unit is an operating segment or one level below an operating segment (referred to as a component). A component of an operating segment is required to be identified as a reporting unit if the component is a business for which discrete financial information is available and segment management regularly reviews its operating results. At the date of the annual impairment test Orion had two reporting units to which the goodwill was allocated. Goodwill impairment test was performed at the level of the two reporting units, Rubber Carbon Black and Specialty Carbon Black representing the two operating segments. These two reporting units were defined as Orion has the possibility to switch capacities as well as products between its various locations.
Goodwill impairment is recorded only after performing a qualitative impairment test indicates a potential impairment. If the carrying amount of the reporting units to which the goodwill is allocated exceeds the reporting unit's fair value an impairment loss is recorded. An impairment loss is the excess of the reporting units carrying amount over its fair value.
Property, plant and equipment
Property, plant and equipment are recorded at cost less accumulated depreciation. Depreciation of property, plant and equipment is calculated using the straight-line method over the expected useful lives of the related assets. The depreciable lives for Buildings, Plant and machinery as well as Furniture, fixtures and office equipment are between 5 and 50 years, 3 and 25 years, and 3 and 25 years, respectively. The cost and accumulated depreciation for property, plant and equipment sold, retired, or otherwise disposed of are removed from the Consolidated Balance Sheets and resulting gains or losses are included in other expenses, net in the Consolidated Statements of Operations.
Expenditures for repairs and maintenance are charged to expenses as incurred. Expenditures for major renewals and betterments, which significantly extend the useful lives of the existing property, plant and equipment, are capitalized and depreciated.
Leases
In February 2016, the Financial Accounting Standards Board (“FASB”) issued ASU No. 2016-02, Leases (Topic 842), which requires lessees to recognize a right-of-use (“ROU”) asset and a lease liability for all leases with terms greater than 12 months and also requires disclosures by lessees and lessors about the amount, timing and uncertainty of cash flows arising from leases. Leases with terms of 12 month or less (i.e., short-term leases) were allowed to be exempted from Topic 842 through a recognition and measurement exemption, if elected. Orion does not have any short-term leases. Subsequent to the issuance of Topic 842, the FASB clarified the guidance through several ASUs; hereinafter, the collection of lease guidance is referred to as “ASC 842.”
A lease is an agreement whereby the lessor conveys to the lessee in return for a payment or series of payments the right to use an asset for an agreed period of time. Under ASC 842, leases are either finance leases or operating leases. The Company mainly acts as a lessee in operating leases. Operating leases are all leases that do not qualify as finance leases (leases where, in accordance with the contractual terms, the lessee substantially bears all the risks and rewards of ownership of the asset). Leases are recorded as assets by discounting the minimum future lease payments while this discounted minimum obligation is recorded as the associated lease liability.
On January 1, 2019, we adopted ASC 842 using the modified retrospective transition method. Results for the reporting period beginning January 1, 2019 are presented under ASC 842, while prior period amounts were not adjusted and continue to be reported in accordance with our historical accounting under ASC 840, Leases. Upon adoption of ASC 842, we increased our total assets and liabilities due to the recording of operating lease ROU assets and operating lease liabilities of approximately $30 million and $31 million, respectively, as of January 1, 2019. These increases did not have a material impact on our results of operations or cash flows.
For all leases that commenced before the effective date of ASC 842, we elected to apply the permitted “practical expedients” to not reassess the following: (1) whether any expired or existing contracts contain leases; (2) the lease classification for any expired or existing leases; and (3) initial direct costs for any existing leases.
We determine if an arrangement is a lease at inception of a contract. ROU assets represent our right to use an underlying asset for the lease term and lease liabilities represent our obligation to make lease payments arising from the lease. ROU assets and lease liabilities are recognized at the lease commencement date based on the present value of lease payments over the lease term. As most of our leases do not provide an implicit interest rate, we use our incremental borrowing rate based on the information available at commencement date in determining the present value of lease payments. The lease terms used to calculate the ROU asset and related lease liability include options to extend or terminate the lease when it is reasonably certain that we will exercise that option. Lease expense for operating leases is recognized on a straight-line basis over the lease term as an operating expense. We have lease agreements which require payments for lease and non-lease components and have elected to account for these as a single lease component related to our other operating facilities.
Under ASC 840, if certain conditions were met certain lease assets were recorded as asset-under-construction during the construction phase (“build-to-suit accounting”). Under ASC 842, these assets are de-recognized; as such, upon adoption of ASC 842 we de-recognized one asset previously recorded under build-to-suit accounting and its associated liability of $29 million. A right-of-use asset will be capitalized upon subsequent commencement of the lease.
Please see Note C. Leases for additional information.
Asset retirement obligations
Orion estimates incremental costs for special handling, removal and disposal of materials that may or will give rise to conditional asset retirement obligations (“ARO”) and then discounts the expected costs back to the current year using a credit adjusted risk free rate. Orion recognizes ARO liabilities and costs when the timing and/or settlement can be reasonably estimated. The ARO reserves were $2.9 million and $2.4 million at December 31, 2019 and 2018, respectively, and are included in Accrued liabilities (current) and Other Liabilities (non-current) on the Consolidated Balance Sheets.
Pension provisions
Pension provisions are measured in accordance with the projected unit credit method (Topic ASC 715). The Company recognizes the total actuarial gains or losses recorded in accumulated other comprehensive income exceeding 10% of the defined benefit obligation in the following year through profit and loss separately from its income from operations.
Defined contribution obligations arise from commitments and state pension schemes (statutory pension insurance). The Company accounts for its contributions to a defined contribution plan on an accrual basis. An asset or liability may result from advance payments or payments due, respectively, to a defined contribution fund.
Stock-based compensation
Orion recognizes stock-based compensation cost measured at the grant date based on the fair value of the award, and recognizes these costs as expense over the service period, which generally represents the vesting period, includes an estimate of the awards that will be forfeited and also includes an estimate of awards that expect to vest based on the anticipated achievement of performance conditions. Fair value of awards is determined by using a Monte-Carlo simulation.
Awards can be classified as either equity- or liability-settled dependent on the Company's obligation to the counterparty and the intended settlement method. The overarching principle focuses on whether an equity relationship is created through the award. Orion classified its awards as equity settled.
When the terms of an equity-settled award are modified, the minimum expense recognized is the expense had the terms not been modified, if those original terms of the award are met. An additional expense is recognized for any modification that increases the total fair value of the share-based compensation transaction, or is otherwise beneficial to the employee as measured at the date of modification. Any modifications are accounted for as a new award, which might result in a lower amount of compensation cost than the grant date fair value of the original award or a greater amount of compensation costs than the sum of the grant date fair value of the original award plus the incremental fair value.
Environmental provisions
Environmental provisions are distinct obligations that arise from the improper operation of an asset and obligations from the normal operation of an asset (asset retirement). Environmental obligations are recognized when there is a legal obligation to restore a site, the damage has already occurred, it is likely that restorations will be incurred and the costs can be reasonably estimated. Changes in environmental legislation are not taken into account until they are enacted. When a single liability amount cannot be reasonably estimated, but a range can be reasonably estimated, the amount that reflects the best estimate is accrued within that range or as for other provisions the low end of the range if no estimate within the range is better. Environmental provisions are usually recognized immediately in profit or loss.
Restructuring expenses
A restructuring is a program that is planned and controlled by management and materially changes either the scope of a business or the manner in which the business is conducted.
Orion accounts for a provision for restructuring costs when there is a formal plan and the details of the restructuring have been communicated to those affected by the plan. Costs are allocated to the following cost types; termination benefits, costs to terminate a contract and costs to close or consolidate facilities or to relocate employees. The different cost types contain separate recognition criteria.
A provision for costs associated with an exit or disposal activity shall be measured initially and recorded at its fair value in the period in which the liability is incurred.
Note B. Recent Accounting Pronouncements Not Yet Adopted
In January 2020, the FASB issued ASU No. 2020-01, Investments - Equity Securities (Topic 321), Investments - Equity Method and Joint Ventures (Topic 323), and Derivatives and Hedging (Topic 815). The amendments in this update clarify the interaction of the accounting for equity securities under Topic 321 and investments accounted for under the equity method of accounting in Topic 323 and the accounting for certain forward contracts and purchased options accounted for under Topic 815. The amendments in this update are effective for fiscal years beginning after December 15, 2020, and interim periods within those fiscal years. The Company is currently evaluating the potential impact the adoption of this standard will have on its financial statements.
In December 2019, the FASB issued ASU No. 2019-12, Income Taxes (Topic 740): Simplifying the Accounting for Income Taxes (ASU 2019-12), which is intended to simplify various aspects related to accounting for income taxes. ASU 2019-12 removes certain exceptions to the general principles in Topic 740 and also clarifies and amends existing guidance to improve consistent application. This guidance is effective for fiscal years, and interim periods within those fiscal years, beginning after December 15, 2020, with early adoption permitted. The Company is currently evaluating the impact of this standard on its consolidated financial statements and related disclosures.
In November 2019, the FASB issued ASU No. 2019-11, Codification Improvements to Topic 326, Financial Instruments - Credit Losses (ASU 2019-11). The amendments in this update represents changes to clarify, correct errors in, or improve the codification, and make the codification easier to understand and easier to apply by eliminating inconsistencies and providing clarifications. For entities that have adopted ASU 2016-13, the amendments in ASU 2019-11 are effective for fiscal years beginning after December 15, 2019, including interim periods within those fiscal years. Early adoption is permitted in any interim period after the issuance of ASU No. 2019-11 as long as the entity has adopted the amendments in ASU No. 2016-13. The Company is currently evaluating the potential impact the adoption of this standard will have on its financial statements.
In May 2019, the FASB issued ASU No. 2019-05, Financial Instruments - Credit Losses (Topic 326). The amendments in this ASU provide entities that have certain instruments within the scope of Subtopic 326-20, Financial Instruments - Credit Losses - Measured at Amortized Cost, with an option to irrevocably elect the fair value option in Subtopic 825-10, Financial Instruments - Overall, applied on an instrument-by-instrument basis for eligible instruments, upon adoption of Topic 326. For entities that have adopted the amendments in ASU No. 2016-13, the amendments in ASU No. 2019-05 are effective for fiscal years beginning after December 15, 2019, including interim periods within those fiscal years. Early adoption is permitted in any interim period after the issuance of ASU No. 2019-05 as long as the entity has adopted the amendments in ASU No. 2016-13. The adoption of this guidance will not have a significant impact on the Company's financial statements.
In April 2019, the FASB issued ASU No. 2019-04, Codification Improvements to Topic 326, Financial Instruments - Credit Losses, Topic 815, Derivatives and Hedging, and Topic 825, Financial Instruments. The updates contained in this ASU provide clarification and correction to ASU 2016-01, Financial Instruments - Overall (Subtopic 825-10): Recognition and Measurement of Financial Assets and Financial Liabilities, ASU 2016-13, Financial Instruments - Credit Losses (Topic 326): Measurement of Credit Losses on Financial Instruments, and ASU 2017-12, Derivatives and Hedging (Topic 815): Targeted Improvements to Accounting for Hedging Activities, and is intended to improve the Codification or correct its unintended application. The amendments in ASU No. 2019-04 related to ASU No. 2016-01 are effective for fiscal years beginning after December 15, 2019, including interim periods within those fiscal years. Early adoption is permitted in any interim period following the issuance of ASU No. 2019-04 as long as the entity has adopted all of the amendments in ASU No. 2016-01. For entities that have adopted the amendments in update 2016-13, the amendments in ASU No. 2019-04 are effective for fiscal years beginning after December 15, 2019, including interim periods within those fiscal years. Early adoption is permitted in any interim period after issuance of ASU No. 2019-04 as long as the entity has adopted the amendments in ASU No. 2016-13. For entities that have adopted the amendments in ASU No. 2017-12 as of the issuance date of ASU No. 2019-04, the effective date is as of the beginning of the first annual period beginning after the issuance of ASU No. 2019-04 (January 1, 2020 for Orion). For those entities, early adoption is permitted, including adoption on any date on or after the issuance of ASU No. 2019-04. The adoption of this guidance will not have a significant impact on the Company's financial statements.
In August 2018, the FASB issued ASU No 2018-14, Compensation - Retirement Benefits - Defined Benefit Plans - General (Subtopic 715-20): Disclosure Framework - Changes to the Disclosure Requirements for Defined Benefit Plans. The guidance changes the disclosure requirements for employers that sponsor defined benefit pension and/or other postretirement benefit plans. It eliminates requirements for certain disclosures that are no longer considered cost beneficial and requires new ones that the FASB considers pertinent. The guidance is effective for financial statements issued for fiscal years ending after December 15, 2020 for public business entities and fiscal years ending after December 15, 2021 for all other entities. Early adoption is permitted. Entities will apply the amendments retrospectively. The adoption of this guidance will not have a significant impact on the Company's financial statements.
Note C. Leases
Orion has entered into lease contracts as a lessee and is not acting as a lessor. On January 1, 2019, Orion adopted Topic 842 (Leases). Orion adopted ASUs 2016-02, 2018-11, 2018-10 and 2019-01 (“Lease ASUs”) using the optional transition method under ASU 2018-11 that allows for a cumulative-effect adjustment in the period of adoption without restating prior periods. Orion elected the optional practical expedient upon transition to retain the lease classification and initial direct costs for any leases that existed prior to adoption of the standard. We have not recorded an adjustment to retained earnings due to materiality. In addition, the adoption did not materially impact our consolidated net income and had no impact on our cash flows.
Orion’s vast majority of lease contracts are concerning operational items such as rail cars, company cars, offices, office equipment.
The recorded right-of-use assets as of December 31, 2019 amounted to $27.5 million, and the corresponding lease liabilities amounted to $29.1 million, of which $7.6 million were recorded within other current liabilities and $21.5 million as other liabilities.
The weighted remaining average minimum lease period is 2.6 years.
The undiscounted minimum lease payments are due in and reconcile to the discounted lease liabilities as follows:
| | | | | | | | |
| | December 31, |
| | 2019 |
| | (In thousands) |
| Next 12 months | | | $ | 7,598 | |
| 1 to 2 years | | | 6,359 | |
| 2 to 3 years | | | 5,638 | |
| 3 to 4 years | | 5,039 | |
| 4 to 5 years | | 4,339 | |
| More than 5 years | | 5,622 | |
| Total undiscounted minimum lease payments | | $ | 34,595 | |
| Discount | | (5,533) | |
| Lease liability (current and non-current) | | | $ | 29,061 | |
The weighted average discount rate applied to the lease liabilities is 6.93%.
Finance lease costs were immaterial for the year ended December 31, 2019, with segregated depreciation expenses of the right-of-use assets in the amount of $0.5 million, and interest on lease liabilities of $0.1 million. Operating lease costs amounted in total to $12.5 million for the year ended December 31, 2019 and were recorded as operating expenses under cost of sales, selling, general and administrative expenses and under research and development cost. Cash paid for amounts included in the measurement of lease liabilities from operating leases was $8.6 million for the year ended December 31, 2019 and was immaterial for finance leases during the same period.
In addition to the above, we entered into a forward-starting lease agreement in October 2016, for a district heating facility in Cologne, Germany, where we plan to operate the equipment to generate the required heat energy. The lessor, the public utility of our neighbor city and its agents, are currently constructing the facilities at our location, with the lease scheduled to commence by the end of 2020 after construction is completed. The lease agreement will have a total of approximately $35.0 million in undiscounted future lease payments over the 20 year term of the lease.
Note D. Inventories
Inventories, net of obsolete, unmarketable and slow moving reserves is as follows:
| | | | | | | | | | | | | | | | | | | |
| December 31 | | | | | | | | | | |
| 2019 | | 2018 | | | | | | | | |
| (In thousands) | | | | | | | | | | |
| Raw materials, consumables and supplies, net | $ | 69,168 | | | $ | 73,460 | | | | | | | | | |
| Work in process | 148 | | | 1,246 | | | | | | | | | |
| Finished goods, net | 95,483 | | | 108,923 | | | | | | | | | |
| Total | $ | 164,799 | | | $ | 183,629 | | | | | | | | | |
Orion periodically reviews inventories for both obsolescence and loss in value. In this review, Orion makes assumptions about the future demand for and the future market value of the inventory and, based on these assumptions, estimates the amount of obsolete, unmarketable or slow moving inventory. The inventory reserve for obsolete, unmarketable and slow moving assets as of December 31, 2019 and 2018 amounted to $6.7 million and $1.6 million, respectively.
In the periods ended December 31, 2019, 2018 and 2017 $6.0 million, $1.9 million and $2.7 million, respectively, were recognized as an expense for damaged and lost inventories.
As of December 31, 2019 and 2018, reserves to adjust inventories net realizable value in the amount of $1.4 million and $2.4 million, respectively, were recognized on raw materials, consumables and supplies and on finished goods.
Note E. Property, Plant and Equipment, and right-of-use assets
Property, plant and equipment consists of the following:
| | | | | | | | | | | |
| December 31, | | |
| 2019 | | 2018 |
| (In thousands) | | |
| Land | $ | 33,654 | | | $ | 26,108 | |
| Land rights and buildings | 94,157 | | | 92,495 | |
| Plant and machinery | 725,203 | | | 673,919 | |
| Other equipment, furniture and fixtures | 30,965 | | | 28,460 | |
| Prepayments and construction in progress | 138,374 | | | 98,096 | |
| Total property, plant and equipment | 1,022,354 | | | 919,078 | |
| Less: accumulated depreciation | 488,300 | | | 435,544 | |
| Net property, plant and equipment | $ | 534,054 | | | $ | 483,534 | |
Depreciation expense was $75.3 million, $78.2 million and $77.0 million for fiscal years 2019, 2018 and 2017, respectively.
Property, plant and equipment figures include remeasurements due to the finalization of purchase price accounting in the third quarter of 2019 for the acquisition of SN2A (see Note H. Business Combination, Goodwill and Intangible Assets).
Right-of-use assets' cost price amounts to $36.1 million as at December 31, 2019. With accumulated depreciation of $8.5 million, the net carrying amount is $27.5 million at December 31, 2019. Depreciation expense for fiscal year 2019 equals accumulated depreciation, since right-of-use assets were first recognized in 2019.
Note F. Prepaid and other assets
| | | | | | | | | | | | | | | | | | | | | | | | | | | | | | | | | | | |
| December 31 | | | | | | | | | | |
| 2019 | | | | | | 2018 | | | | |
| Total | | Thereof current | | Thereof non‑current | | Total | | Thereof current | | Thereof non‑current |
| (In thousands) | | | | | | | | | | |
| Miscellaneous other receivables | $ | 36,531 | | | $ | 36,189 | | | $ | 342 | | | $ | 34,052 | | | $ | 33,750 | | | $ | 302 | |
| Prepaid expenses | 4,529 | | | 1,170 | | | 3,359 | | | 3,814 | | | 1,188 | | | 2,626 | |
| Total | $ | 41,059 | | | $ | 37,358 | | | $ | 3,701 | | | $ | 37,866 | | | $ | 34,938 | | | $ | 2,928 | |
Miscellaneous other receivables in the financial year are mainly related to VAT ($21.5 million and $15.7 million as at December 31, 2019 and 2018, respectively), advance payments ($1.2 million and $5.3 million as at December 31, 2019, 2018, respectively), down payments ($3.1 million and $4.3 million as at December 31, 2019 and 2018, respectively), refundable environmental taxes prepaid ($3.2 million and $5.9 million as at December 31, 2019 and 2018, respectively) and guarantee deposits ($1.4 million and $1.7 million as at December 31, 2019 and 2018, respectively).
Prepaid expenses mainly include other unamortized transaction costs of $3.4 million and $2.4 million as at December 31, 2019 and 2018, respectively, (of which $2.8 million and $1.8 million, respectively, is non-current) incurred in connection with the revolving credit facility that has not been drawn by the respective reporting dates.
Note G. Debt and Other Obligations
The company had the following debt arrangements in place as of December 31, 2019 and 2018:
| | | | | | | | | | | |
| December 31 | | |
| 2019 | | 2018 |
| (In thousands) | | |
| Current | | | |
| Term loan | $ | 8,057 | | | $ | 8,149 | |
Deferred debt issuance costs - term loan(1) | $ | (1,409) | | | (1,472) | |
| Other short-term debt and obligations | 29,762 | | | 34,343 | |
| Current portion of long term debt and other financial liabilities | 36,410 | | | 41,020 | |
| Non-current | | | |
| Term loan | 634,994 | | | 650,014 | |
Deferred debt issuance costs - term loan(1) | (4,733) | | | (6,266) | |
| Other long-term debt and obligations | — | | | — | |
| Long-term debt, net | 630,261 | | | 643,748 | |
| Total | $ | 666,671 | | | $ | 684,768 | |
(1) According to ASU 2015-03, adopted on January 1, 2016, the Company presents debt issuance costs related to a recognized liability as a direct deduction from the carrying amount of that liability.
(a) Term Loan
On July 25, 2014, Orion entered into a refinancing of its indebtedness. The initial term loan credit facility in USD of $895.0 million was allocated to a term loan facility denominated in USD of $358.0 million and a term loan facility denominated in Euro of €399.0M with both having an original maturity date of July 25, 2021 (the “Term Loans”). Initial interest was calculated based on three-month EURIBOR (for the Euro denominated loan), or three-month USD-LIBOR (for the USD denominated loan) plus a 3.75% - 4.00% margin depending on leverage ratio. For both EURIBOR and USD-LIBOR a floor of 1.0% applied. At least 1% of the principal amount is required to be repaid per annum; Orion may make additional voluntary repayments. In the years 2015 to 2017 Orion executed several voluntary repayments totaling €56.0 million and $58.0 million.
After several amendments to the credit agreement Orion repriced its EUR- and USD-denominated outstanding term loans during the years 2016 to 2018 and achieved a significant reduction of both interest margins to currently 2.00% for the USD term loan and 2.25% for the Euro term loan. The margin is no longer linked to Orion's net leverage ratio. In addition the EURIBOR and USD-LIBOR floors were reduced to 0.00%. Moreover the duration of both term loans were extended by another 3 years resulting in a new maturity date of July 25, 2024 (previously July 25, 2021). Other provisions of this credit agreement remained unchanged.
Transaction costs incurred directly in connection with the incurrence of the Euro and U.S. Dollar denominated term loans, thereby reducing their carrying amount, are amortized as finance costs over the term of the loans. Transaction costs incurred in connection with the modifications of the term loan in the years 2016 to 2018 were directly expensed as incurred as the modified terms were not substantially different. In connection with the repricing described above further transaction costs of $0.7 million in 2018 and $3.5 million equivalent in 2017 and $2.1 million equivalent in 2016 were incurred and directly expensed. In 2019, an amount of $1.4 million equivalent related to capitalized transaction costs was amortized and recognized as finance costs in this regard (prior year: $1.4 million equivalent).
On May 11, 2018, Orion entered into a $235.0 million cross currency swap to virtually convert its US dollar liabilities into EUR as part of a new hedging approach. This swap transaction impacts both principal and interest payments associated with debt service and results in a further annual interest payments savings of approximately $4.7 million. The swap became effective on May 15, 2018 and will expire on July 25, 2024, in line with maturity of the term loan.
A portion of the USD-denominated term loan was designated as a hedge of the net investment in a foreign operation to reduce the Company's foreign currency exposure. Since January 1, 2015 the Company had designated $180.0 million of the total USD-denominated term loan held by a Germany based subsidiary as the hedging instrument to hedge the change in net assets of a US subsidiary, which is held by a Germany based subsidiary, to manage foreign currency risk. Due to the new hedging approach and the new cross currency swap as described above, hedge accounting for the net investment hedge was discontinued on May 15, 2018. An unrealized loss of $2.2 million remains within other comprehensive income until it is recycled through profit and loss upon divestment of the hedged item.
The carrying value as at December 31, 2019 includes the nominal amount of the Term Loans plus accrued unpaid interest less deferred debt issuance costs - term loan of $6.1 million (December 31, 2018: $7.7 million).
(b) Revolving credit facility
To generally safeguard the Company’s liquidity, the Company has entered into a revolving credit facility (“RCF”).
As part of July 25, 2014 refinancing the then-existing revolving facility was replaced by a €115.0 million multicurrency revolving credit facility with an original maturity date July 25, 2019. Interest is calculated based on EURIBOR (for EUR drawings), and USD-LIBOR (for USD drawings) plus 2.5% - 3.0% margin (depending on leverage ratio). The RCF has not been drawn on the respective reporting dates while certain local ancillary facilities reduced the available commitment. Transaction costs in the amount of $3.3 million originally incurred in connection with the RCF are also recorded as deferred expenses and are amortized as finance costs on a straight-line basis over the term of the facility (until July 25, 2019).
The amendment to the Credit Agreement entered into on May 5, 2017 (i) reduced the commitment fee paid on the unused commitments from 40% of the Applicable Rate (as defined in the Credit Agreement) to 35% of the Applicable Rate, (ii) extended the maturity date for the revolving credit facility to April 25, 2021 and (iii) increased the aggregate amount of revolving credit commitments to €175.0 million. All other terms of the Credit Agreement remained unchanged.
Additional Transaction costs in conjunction with the RCF in the amount of $2.3 million incurred in connection with the Amendment to the Credit Agreement are also recorded as deferred expenses and are amortized as finance costs on a straight-line basis over the term of the facility (until April 25, 2021).
On April 2, 2019, the Company entered into the eighth amendment (the “Eighth Amendment”) to the Credit Agreement, among the Company and certain of its subsidiaries, as Borrowers or Guarantors, the Lenders from time to time party thereto and Goldman Sachs Bank US, as administrative agent for the Lenders. The Amendment relates to the revolving credit facility (“RCF”) provided by the Credit Agreement. The Eighth Amendment became effective on April 10, 2019.
The Eighth Amendment:
(i) extended the maturity date for the RCF by three years to April 25, 2024,
(ii) increased the aggregate amount of revolving credit commitments in Euro by €75.0 million to EUR €250.0 million, and
(iii) reduced revolving credit interest expense by way of a new pricing grid that entitles an initial margin of 0.019 when the Company's leverage ratio is between 2.25x and 1.75x (formerly 2.5% when leverage ratio was < 2.30x);
All other terms of the Credit Agreement remain substantially unchanged, including commitment fee, which remains at 35% of applicable margin.
All other terms of the Credit Agreement remain substantially unchanged.
During 2019, transaction costs of $0.7 million were amortized (prior year: $0.8 million). Unamortized transaction costs that were incurred in conjunction with the RCF in July 2014, the Amendment on May 30, 2017 and the Amendment on April 2, 2019, amount to $3.4 million as at December 31, 2019. Unamortized transaction costs as at December 31, 2018 amount to $2.4 million and were incurred in conjunction with the RCF in July 2014 and the Amendment on May 30, 2017.
(c) Local bank loans and other short term borrowings
Orion has established additional local ancillary credit facilities for OEC GmbH and OEC LLC by using overall RCF commitments. As of December 31, 2019, the OEC GmbH facility had $26.4 million (prior year: $28.6 million) outstanding and the OEC LLC facility had $2.2 million (prior year: zero) outstanding.
Future Years Payment Schedule
The following table shows the residual terms of our Term Loan and its impact on our cash flows based on the agreed maturity date, the repayment schedule, and the total interest amounts. Implied three months EUR forward interest rates and implied USD forward interest rates as applicable on December 31, 2019 were used to calculate the repayment amounts.
| | | | | | | | | | | | | | | | | |
| Interest | | Scheduled Repayment | | Total |
| (In millions) | | | | | |
| 2020 | $ | 18.8 | | | $ | 8.1 | | | $ | 26.9 | |
| 2021 | 17.8 | | | 8.1 | | | 25.8 | |
| 2022 | 17.6 | | | 8.1 | | | 25.6 | |
| 2023 | 17.5 | | | 8.1 | | | 25.6 | |
| 2024 | 9.9 | | | 610.8 | | | 620.7 | |
| Total | | $ | 81.6 | | | $ | 643.1 | | | $ | 724.7 | |
Note H. Business Combination, Goodwill and Intangible Assets
Business Combination
On October 31, 2018, the acquisition for 100% of shares of the acetylene carbon black manufacturer Société du Noir d'Acétylène de l'Aubette, SAS (“SN2A”) from LyondellBasell Industries Holdings B.V. was completed. The acquisition was accounted for as a business combination. The acquisition had an aggregate purchase price of $36.8 million.
This acquisition is expected to strengthen the Company's position in the specialty carbon black market by adding acetylene carbon black to its product portfolio. In finalizing the purchase price accounting during the third quarter of 2019, the previously disclosed purchase price allocation as of the closing date was updated to reflect adjustments existing at the acquisition date and identified during the measurement period under ASC 805 - Business Combinations.
The following table summarizes the fair values of assets acquired and liabilities assumed as of the date of acquisition:
| | | | | |
| (in thousands) |
| Assets | |
| Cash | $ | 213 | |
| Other current assets | 176 | |
| Accounts receivables | 1,578 | |
| Inventories | 924 | |
| Property, plant and equipment | 5,317 | |
| Intangible assets | 12,766 | |
| Total assets acquired | $ | 20,974 | |
| |
| Liabilities | |
| Current liabilities | $ | 2,488 | |
| Deferred tax liabilities | 4,716 | |
| Total liabilities assumed | $ | 7,204 | |
| Net assets acquired | $ | 13,770 | |
| |
| Consideration: | |
| Cash consideration paid | $ | 36,784 | |
| Goodwill | $ | 23,014 | |
The acquisition was accounted for using the acquisition method. Tangible and identifiable intangible assets acquired and liabilities assumed are recorded at fair value as of the acquisition date.
During the quarter ended September 30, 2019, we completed the purchase accounting for the acquisition of SN2A and we reduced the total fair value of intangible assets acquired from $44.3 million to $12.8 million based on an improved understanding of the allocation of future expected cash flows since the date of acquisition including an adjustment to the applied discount rate aligned to target specific considerations. In addition, we reduced the fair value of acquired property, plant and equipment from $5.8 million to $5.3 million due to third party appraisals and we reduced the related deferred tax liabilities from $13.7 million by $9.0 million to $4.7 million accordingly to reflect the impact of changes in fair values of the tangible and intangible assets. These changes resulted in $23.0 million of goodwill being recorded and allocated to our Specialty Carbon Black Segment. We also recorded a reduction in depreciation and amortization expense of $1.0 million and an increase in net income of $0.7 million respectively, in the third quarter of fiscal 2019 related to prior periods as a result of the changes in fair values of tangible and intangible assets and the associated deferred tax liabilities.
The fair values of identifiable assets and liabilities acquired were developed with the assistance of a third-party valuation firm. The fair value of acquired property, plant and equipment is valued at its "value-in-use" as there are no known plans to dispose of any assets. The fair value of acquired identifiable intangible assets was determined using the "income approach" on an individual asset basis. The key assumptions used in the calculation of the discounted cash flows include projected revenues, gross margin, operating expenses, and discount rate. The valuations and the underlying assumptions have been deemed reasonable by the Company’s management. There are inherent uncertainties and management judgment required in these determinations.
Goodwill
Orion had goodwill balances of $77.3 million and $55.5 million at December 31, 2019 and December 31, 2018, respectively. The carrying amount of goodwill attributable to each reportable segment for period ended December 31, 2019 is as follows:
| | | | | | | | | | | | | | | | | |
| Goodwill | Rubber | | Specialty | | Total |
| (In thousands) | | | | |
| Balance at January 1, 2018 | $ | 33,037 | | | $ | 25,143 | | | $ | 58,180 | |
| Foreign currency impact | (1,487) | | | (1,147) | | | (2,634) | |
| Balance at December 31, 2018 | $ | 31,550 | | | $ | 23,996 | | | $ | 55,546 | |
| Addition Goodwill recorded in SN2A acquisition | — | | | 23,014 | | | 23,014 | |
| Foreign currency impact | (595) | | | (624) | | | (1,220) | |
| Balance at December 31, 2019 | $ | 30,955 | | | $ | 46,385 | | | $ | 77,341 | |
Qualitative impairment testing performed during the fiscal year for the Rubber and Specialty reporting units did not indicate a goodwill impairment.
Intangible Assets
The following table provides information regarding Orion's intangible assets:
| | | | | | | | | | | | | | | | | | | | | | | | | | | | | | | | | | | |
| December 31, | | | | | | | | | | |
| 2019 | | | | | | 2018 | | | | |
| Gross Carrying Value | | Accumulated Amortization | | Net Intangible Assets | | Gross Carrying Value | | Accumulated Amortization | | Net Intangible Assets |
| (In thousands) | | | | | | | | | | |
| Developed technology and patents | $ | 62,870 | | | $ | 37,402 | | | $ | 25,468 | | | $ | 82,007 | | | | $ | 34,348 | | | | $ | 47,660 | |
| Customer relationships | 76,531 | | | 69,514 | | | 7,017 | | | 78,263 | | | | 66,262 | | | | 12,001 | |
| Trademarks | 19,322 | | | 10,764 | | | 8,558 | | | 19,694 | | | | 9,782 | | | | 9,912 | |
| Long-term contracts | 7,430 | | | 630 | | | 6,800 | | | 22,396 | | | | 113 | | | | 22,283 | |
| Other intangible assets | 52,708 | | | 49,955 | | | 2,753 | | | 50,621 | | | | 47,232 | | | | 3,389 | |
| Total intangible assets | $ | 218,862 | | | $ | 168,266 | | | $ | 50,596 | | | $ | 252,982 | | | | $ | 157,737 | | | | $ | 95,245 | |
Intangible assets are amortized over their estimated useful lives, which range from 3 to 15 years. The weighted average amortization period for all intangible assets at December 31, 2019 and 2018 was 8.4 years and 10.8 years, respectively. Amortization expense for the years ended December 31, 2019, 2018 and 2017 was $12.9 million, $20.0 million and $21.4 million, respectively, and is included in Cost of sales and Selling, general and administrative expenses in the Consolidated Statements of Operations.
Intangible assets include remeasurements due to the purchase price adjustment in the third quarter of 2019 of SN2A acquisition (see Note H. Business Combination, Goodwill and Intangible Assets).
The estimated aggregate amortization expense for intangible assets for the fiscal years ending December 31, 2020 to 2024 and thereafter are as follows:
| | | | | |
| Year | (In thousands) |
| 2020 | $ | 8,161 | |
| 2021 | 7,041 | |
| 2022 | 6,588 | |
| 2023 | 6,252 | |
| 2024 | 6,204 | |
| Thereafter | 16,351 | |
| Total aggregated amortization | $ | 50,596 | |
Note I. Accruals and Other Liabilities
Current accrued liabilities consist of the following:
| | | | | | | | | | | |
| December 31 | | |
| 2019 | | 2018 |
| (In thousands) | | |
| Accrued employee compensation | $ | 24,746 | | | $ | 28,693 | |
| Accrued liabilities for sales and procurement | 3,274 | | | 3,580 | |
| Accrued liabilities for restructuring | 4,765 | | | 8,658 | |
| Other accrued liabilities | 12,145 | | | 15,366 | |
| Total | $ | 44,931 | | | $ | 56,297 | |
Other current liabilities consist of the following:
| | | | | | | | | | | |
| December 31 | | |
| 2019 | | 2018 |
| (In thousands) | | |
| Employee related liabilities | $ | 4,787 | | | $ | 3,037 | |
| Customer down payments | 1,018 | | | 421 | |
| Liabilities for environmental tax | 4,824 | | | 2,214 | |
| Liabilities for withholding tax | 1,417 | | | 1,941 | |
| Liabilities for VAT | 555 | | | 1,915 | |
| Liabilities for outstanding invoices | 5,902 | | | 8,637 | |
| Liabilities for leases | 7,598 | | | — | |
| Other current liabilities | 6,407 | | | 12,328 | |
| Total | $ | 32,509 | | | $ | 30,493 | |
Other long-term liabilities consist of the following:
| | | | | | | | | | | |
| December 31 | | |
| 2019 | | 2018 |
| (In thousands) | | |
| Employee related liabilities | $ | 5,740 | | | $ | 7,008 | |
| Liabilities for asset retirement obligation | 2,938 | | | 2,414 | |
| Environmental protection liabilities | 1,240 | | | 1,353 | |
| Liabilities from build-to-suit lease agreement | — | | | 28,657 | |
| Liabilities for leases | 21,463 | | | — | |
| Other non-current liabilities | 9,320 | | | 4,729 | |
| Total | $ | 40,701 | | | $ | 44,161 | |
For the years ended December 31, 2019 and 2018 no liabilities for ARO's were settled.
Note J. Financial Instruments and Fair Value Measurement
The Company measures financial instruments, such as derivatives, at fair value at each balance sheet date. Fair value is the price that would be received to sell an asset or paid to transfer a liability in an orderly transaction between market participants at the measurement date. The fair value of an asset or a liability is measured using the assumptions that market participants would use when pricing the asset or liability, assuming that market participants act in their economic best interest. The Company uses valuation techniques that are appropriate in the circumstances and for which sufficient data are available to measure fair value, maximizing the use of relevant observable inputs and minimizing the use of unobservable inputs.
All assets and liabilities for which fair value is measured or disclosed in the financial statements are categorized within the following fair value hierarchy based on the lowest level input that is significant to the fair value measurement as a whole:
Level 1 — Unadjusted quoted market prices in active markets for identical assets or liabilities that the entity can access at the measurement date.
Level 2 — Inputs other than quoted prices within Level 1 that are observable for the asset or liability, either directly (i.e., as prices) or indirectly (i.e., derived from prices such as quoted prices for similar items in active markets, quoted prices for identical or similar items in markets that are not active, inputs other than quoted prices that are observable such as interest rate and yield curves), and market-corroborated inputs.
Level 3 — Unobservable inputs for the asset or liability.
For financial assets and liabilities that are recognized in the financial statements on a recurring basis, the Company determines whether transfers have occurred between levels in the hierarchy by re-assessing categorization at the end of each reporting period.
For the years ended December 31, 2019 and 2018, the Company’s defined benefit pension plan assets were all Level 2 assets. See Note L. - "Employee Benefit Plans" herein for additional information.
The following table shows the fair value measurement at both year-ends December 31, 2019 and 2018. All measurements are based on observable inputs such as interest rates and are classified as Level 2 within the fair value hierarchy:
| | | | | | | | | | | | | | | | | |
| | | December 31 | | |
| Fair Value Hierarchy | | 2019 | | 2018 |
| | | (In thousands) | | |
| Receivables from hedges/ derivatives | | | | $ | 8,436 | | | $ | 9,949 | |
| Prepaid expenses and other current assets | Level 2 | | | 8,434 | | | 9,777 | |
| Other financial assets (non-current) | | Level 2 | | | 1 | | | 172 | |
| | | | | |
| Liabilities from derivatives | | | | $ | 9,425 | | | $ | 7,032 | |
| Other current liabilities | Level 2 | | | 109 | | | 2,302 | |
| Other liabilities (non-current) | | Level 2 | | | 9,316 | | | 4,730 | |
| | | | | |
| Term loan | | Level 2 | | | $ | 643,051 | | | $ | 658,163 | |
| Local bank loans | Level 2 | | | $ | 29,762 | | | $ | 28,618 | |
Note K. Accounting for Derivative Instruments and Hedging Activities
Cash flow hedge
The Company has designated, as of November 28, 2014 the entire interest rate caps entered in 2014 and denominated in Euro with an initial nominal amount of €375.0 million against the Term Loan tranches denominated in Euro with an initial nominal amount of €399.0 million, as well as the entire interest rate caps entered in 2014 and denominated in USD with an initial nominal amount of $350.0 million against Term Loan tranches denominated in USD with an initial nominal amount of $358.0 million with respect to quarterly interest payments exceeding a three months EURIBOR rate of 1.0% and a three months USD-LIBOR rate of 2.5% respectively. On November 14, 2017 the Company acquired floored forward interest rate swaps to hedge interest rate risk on current Euro-denominated term loan financing. On May 15, 2018 the Company entered into a $235.0 million cross-currency swap to hedge interest rate risk on current USD-denominated term loan financing which replaced the USD-denominated Caps terminated on May 14, 2018.
The Company designated the Euro-denominated interest rate caps, the Euro-denominated interest rate swap at closing in November 2017 and the cross-currency swaps at closing in May 2018 in the same manner. The Company has performed a hedge effectiveness test based on the critical terms match method (prospectively) and the dollar offset test (retrospectively), both on designation date and as of December 31, 2019, which confirmed hedge effectiveness.
Net Investment Hedge
To reduce the Company's foreign currency exposure a portion of the U.S. Dollar denominated Term Loan was designated as a hedge of net investment in a foreign operation. Since January 1, 2015 the Company had designated $180.0 million of the total USD denominated term loan held by a Germany-based subsidiary as the hedging instrument to hedge the change in net assets of a US subsidiary, which is held by a Germany-based subsidiary, to manage foreign currency risk. Due to the new hedging approach and the new cross currency swap as described above, hedge accounting for the net investment hedge was discontinued on May 15, 2018. An unrealized loss of $2.2 million remains within other comprehensive income until it is recycled through profit and loss upon divestment of the hedged item.
Changes in fair value of the effective portion of the hedging instrument's gains or losses are reported as foreign currency translation gains or losses in AOCI while changes in the ineffective portion are reported in earnings. Effectiveness is assessed based on the hypothetical derivative method. There was no ineffectiveness in either of the years ended December 31, 2018 or 2017. The gains or losses on derivative instruments reported in AOCI are reclassified to earnings in the period in which earnings are affected by the underlying item, such as a disposal or substantial liquidations of the entities being hedged.
Due to the new hedging approach and the new cross currency swap described above, hedge accounting for the net investment hedge was discontinued on May 15, 2018. Thus in 2018, with the change of the reporting currency, Orion decided to de-designate the net investment hedge. Foreign currency risk exposure is reduced by using a cross-currency-swap, designated as a cash flow hedge. Cumulative gains and losses recognized in AOCI from the net investment hedge will continue to be recorded in AOCI until disposal of the U.S. business.
Thus, an unrealized loss of $2.2 million remains within other comprehensive income until it is recycled through profit and loss upon divestment of the hedged item.
Note L. Employee Benefit Plans
Provisions for pensions are established to cover benefit plans for retirement, disability and surviving dependents’ pensions. The benefit obligations vary depending on the legal, tax and economic circumstances in the various countries in which the Company operates. Generally, the level of benefit depends on the length of service and the remuneration.
In 2019 and 2018, Germany accounted for approximately 91.8% and 90.1%, respectively, of provisions for projected benefit pension obligations. There are also defined contribution pension plans in Germany and the United States for which the Company makes regular contributions to off-balance sheet pension funds managed by third party insurance companies.
In South Korea, the company’s pension plan provides, at the option of employees for either projected benefit or defined contribution benefits. Plan assets relating to this plan reduce the pension provision disclosed.
Obligations and Funded Status
The following provides information about projected benefit obligations, plan assets, the funded status and weighted-average assumptions of the defined benefit pension plan:
| | | | | | | | | | | |
| Change in Projected Benefit Obligation | December 31 | | |
| 2019 | | 2018 |
| (In thousands) | | |
| Present value of projected benefit obligation at the beginning of the year | $ | 67,623 | | | | $ | 72,864 | |
| Actuarial (gain)/ loss | 11,983 | | | | (198) | |
| Service cost | 588 | | | | 604 | |
| Interest cost | 1,694 | | | | 1,758 | |
| Benefits paid | (1,346) | | | (925) | |
| Other | — | | | 126 | |
| Curtailments, settlements, special and contractual termination benefits | — | | | (2,154) | |
| Currency translation | (1,153) | | | (4,452) | |
| Present value of projected benefit obligation at the end of the year | $ | 79,389 | | | $ | 67,623 | |
Based on the weighted Macaulay method the projected benefit obligation has a duration of 21.0 years (prior year: 21.2 years).
| | | | | | | | | | | |
| Change in Plan Assets | December 31 | | |
| 2019 | | 2018 |
| (In thousands) | | |
| Fair value of plan assets at the beginning of the year | $ | 6,391 | | | $ | 7,474 | |
| Actual return on plan assets | 119 | | | (79) | |
| Employer contributions | 552 | | | 609 | |
| | | |
| Actuarial gain/(loss) | — | | | — | |
| Benefits paid | (277) | | | — | |
| Settlement | — | | | (1,467) | |
| Other adjustments | — | | | 174 | |
| Currency translation | (205) | | | (320) | |
| Fair value of plan assets at the end of the year | $ | 6,580 | | | $ | 6,391 | |
The plan assets are held by Orion Engineered Carbons Co. Ltd. Korea, Bupyeong-gu, South Korea, and relate to qualifying insurance policies. These insurance policies do not have a quoted market price. The actual return on plan assets amounted to $0.1 million and $0.1 million for the years ended December 31, 2019 and 2018, respectively.
| | | | | | | | | | | |
| Net Funded Status | December 31 | | |
| 2019 | | 2018 |
| (In thousands) | | |
| Projected benefit obligation | $ | 79,389 | | | $ | 67,623 | |
| Fair value of plan assets | 6,580 | | | 6,391 | |
| Net funded status | $ | 72,809 | | | $ | 61,232 | |
| | | | | | | | | | | |
| Amount Recognized in the Consolidated Balance Sheets | December 31 | | |
| 2019 | | 2018 |
| (In thousands) | | |
| Non-current assets | | $ | — | | | $ | — | |
| Current liabilities | | 908 | | | 855 | |
| Non-current liabilities | | 71,901 | | | 60,377 | |
| Net liability recognized - pension plans | $ | 72,809 | | | $ | 61,232 | |
Pension Assumptions and Strategy
The assumptions in the table below were used in the actuarial valuation of the underlying the obligations:
| | | | | | | | | | | |
| Assumptions | December 31 | | |
| 2019 | | 2018 |
| Discount rate | 1.0 | % | | 1.9 | % |
| Expected long-term rate of return on plan assets | 2.0 | % | | 2.0 | % |
| Rate of compensation/salary increase | 3.0 | % | | 3.0 | % |
| Future pension increase | 1.5 | % | | 1.5 | % |
| Mortality | Heubeck
2018G | | Heubeck
2018G |
Mortality is based on Heubeck guidelines, the generally accepted biometric calculation bases for the balance sheet valuation of pension obligations in Germany. A 0.5% increase or decrease in the discount rate or in the future pension increase would have impacted the projected benefit obligation as follows:
| | | | | | | | | | | | | | | | | | | | | | | |
| Sensitivities | December 31, 2019 | | | | | | |
| Discount rate | | | | Future pension increase | | |
| 0.5% decrease | | 0.5% increase | | 0.5% decrease | | 0.5% increase |
| (In thousands) | | | | | | |
| Impact on projected benefit obligation | | $ | 7,481 | | | $ | (6,485) | | | $ | (9,496) | | | $ | 10,526 | |
Net Periodic Pension Cost (Benefit)
| | | | | | | | | | | | | | | | | |
| Years Ended December 31, | | | | |
| 2019 | | 2018 | | 2017 |
| (In thousands) | | | | | |
| Service cost | $ | 588 | | | $ | 604 | | | $ | 772 | |
| Interest cost | 1,694 | | | 1,758 | | | 1,723 | |
| Expected return on plan assets | (119) | | | (174) | | | (180) | |
| Past service cost/(income) and other adjustments | — | | | 253 | | | 145 | |
| Net periodic pension cost | $ | 2,163 | | | $ | 2,441 | | | $ | 2,460 | |
Effective at the end of 2013, all defined benefit plans in Germany were modified to close access to new participants and freeze benefits accrued under these plans at December 31, 2013 levels. Interest expense on the frozen obligation relating to these plans will continue to accrue. In addition, one program during the year ended December 31, 2016 ceased due to the closure of our Ambès (France) plant.
The total expected pension contribution amounts to $1.3 million in 2020.
The Company paid $13.9 million, $12.8 million and $12.8 million for the years ended December 31, 2019, 2018 and 2017, respectively, for state defined contribution pension schemes (statutory pension insurance) in Germany and other countries. This amount is also recognized as personnel expenses (social security costs).
Estimated Future Benefit Payments
The Company expects that the following benefit payments will be made to plan participants in the years from 2019 to 2029:
| | | | | |
| Benefit payments | (In thousands) |
| 2020 | $ | 1,254 | |
| 2021 | $ | 1,471 | |
| 2022 | $ | 1,707 | |
| 2023 | $ | 1,902 | |
| 2024 | $ | 2,004 | |
| 2025 - 2029 | $ | 13,029 | |
The Company does not anticipate making funding contributions to the Pension Plan in 2020.
Amounts Recognized in Accumulated Other Comprehensive (Income)/Loss
Overall net actuarial loss amounts to $12.3 million and comprises $12.0 million pension-related and $0.3 million other personnel-related.
Amounts recognized in AOCI at December 31, 2019 and 2018 related to the Company's defined benefit pension plan were as follows:
| | | | | | | | | | | |
| Accumulated Other Comprehensive (Income) / Loss | December 31 | | |
| 2019 | | 2018 |
| (In thousands) | | |
| Net actuarial (gain) loss | $ | 11,983 | | | $ | (198) | |
| Net prior service cost | — | | | — | |
Balance in accumulated other comprehensive (income) / loss | $ | 11,983 | | | $ | (198) | |
The estimated amounts that will be amortized from accumulated other comprehensive loss into net periodic benefit cost in 2020:
| | | | | |
| 2020 |
| (In thousands) |
| Net actuarial (gain) loss | $ | 9,752 | |
| Prior service cost (credit) | — | |
| Net amount recognized | $ | 9,752 | |
Plan Assets
The fair value (all Level 2) of Orion's pension plan assets at December 31, 2019 and 2018, by asset category, is as follows:
| | | | | | | | | | | |
| December 31 | | |
| 2019 | | 2018 |
| (In thousands) | | |
| Equity securities | $ | — | | | $ | — | |
Debt securities | — | | | — | |
Other securities | 6,580 | | | 6,391 | |
Total pension plan assets | $ | 6,580 | | | $ | 6,391 | |
Note M. Stock-Based Compensation
On an annual basis since 2015, the Company has implemented a long-term incentive plan ("LTIP") which grants awards to employees and officers selected by the Compensation Committee of the Board of Directors (the “Compensation Committee”). PSU awards are earned based on achievement against one or more performance metrics established by the Compensation Committee in respect of a specified performance period. Earned PSUs range from zero to a specified maximum percentage of a participant’s target award based on the performance of applicable performance metrics, and are subject to vesting terms based on continued employment.
The first performance period ran from January 1, 2015 through December 31, 2017, with PSUs earned based on achievement of EBITDA metrics established by the Compensation Committee and total shareholder return relative to a peer group. Once earned and vested, PSUs were settled in one share of Company common stock per vested PSU (or, at the Company’s election, cash equal to the fair market value thereof). There is no exercise price. The first vesting period ran through March 31, 2018 (the “2015 Plan”). All PSUs are granted under, and are subject to the terms and conditions of, the Company’s 2014 Omnibus Incentive Compensation Plan, and do not increase the number of shares previously reserved for issuance under that plan. On August 2, 2016 the Compensation Committee established a consecutive LTIP (the “2016 Plan”) having consistent terms as compared to the 2015 Plan. On March 31, 2019 the vesting period ended for the “2016 Plan” and earned and vested PSUs settled in one common share of the Company per vested PSU - issued to participants on April 30, 2019, except for certain PSUs settled in cash at fair market value to cover wage taxes or as substitute for share transfer restrictions. On July 31, 2017 the Compensation Committee established another consecutive LTIP (the "2017 Plan") having consistent terms as compared to the 2015 and 2016 Plan. On July 12, 2018 the Compensation Committee established a consecutive LTIP (the "2018 Plan") and on July 16, 2019 the Compensation Committee established a consecutive LTIP (the “2019 Plan”). The achievement metrics have changed for the 2019 Plan from EBITDA performance to a 'return on capital employed' and a 'total shareholder return' target. All PSUs are granted under, and are subject to the terms and conditions of, the Company’s 2014 Omnibus Incentive Compensation Plan (the “Omnibus Plan”).
In its “2019 Plan” the company issued beside PSUs ("2019 Plan PSU") also a tranche of restricted share units (“RSUs”) for its selected employees and officers ("2019 Plan RSU"). RSUs vest by one-third on each of the first, second and third anniversary of the grant date. The RSUs are subject to certain further restrictions after vesting. Settlement of selected employees and officer RSUs is within 75 days following the third anniversary of the grant date.
Specific Members of our Executive Committee received RSUs upon signing. These sign-on RSUs are split into three parts each with service periods of one year and therefore vest on year one, two or three after the grant date.
In April 2018 the Compensation Committee established a stock compensation plan for the Board of Directors under the existing Omnibus Incentive Compensation Plan.
The following table provides detail as to expenses recorded within operating income with respect to stock based compensation:
| | | | | | | | | | | | | | | | | |
| Years Ended December 31, | | | | |
| 2019 | | 2018 | | 2017 |
| (In thousands) | | | | | |
2015 Plan | $ | — | | | $ | 777 | | | $ | 2,736 | |
2016 Plan | 1,083 | | | 4,566 | | | 4,053 | |
2017 Plan | 3,016 | | | 5,052 | | | 2,046 | |
Stock compensation plan for Board of Directors | 561 | | | 563 | | | — | |
2018 Plan | 3,435 | | | 2,961 | | | — | |
Sign on RSU incentive | 453 | | | — | | | — | |
2019 Plan | 891 | | | — | | | — | |
Total expenses | $ | 9,438 | | | $ | 13,919 | | | $ | 8,835 | |
In the following table summarizes the activity of our PSUs within year ended December 31, 2019:
| | | | | | | | | | | | | | | | | | | | | | | | | | | | | | | | | | | | | | | | | | | | | | | | | | | | | | | | |
| Period granted | | Performance period | | PSUs outstanding at January 1, | | PSUs granted | | Performance based adjustment | | PSUs settled | | PSUs forfeited | | PSUs outstanding at December 31, | | PSUs expected to vest | | Weighted average grant date fair value |
| 2016 | | 2016 - 2019 | | 677,607 | | | — | | | 299,499 | | | (977,106) | | | — | | | — | | | — | | | $ | 17.21 | |
| 2017 | | 2017 - 2020 | | 467,349 | | | — | | | — | | | — | | | (49,097) | | | 418,252 | | | 401,904 | | | $ | 24.89 | |
| 2018 | | 2018 - 2021 | | 450,034 | | | — | | | — | | | — | | | (94,268) | | | 355,766 | | | 299,418 | | | $ | 39.24 | |
| 2019 | | 2019 - 2022 | | — | | | 332,891 | | | — | | | — | | | (103,164) | | | 229,727 | | | 215,933 | | | $ | 11.48 | |
| | Total 2019 | | 1,594,990 | | | 332,891 | | | 299,499 | | | (977,106) | | | (246,529) | | | 1,003,745 | | | 917,255 | | | | |
| | Total 2018 | | 1,610,894 | | | 450,977 | | | 110,215 | | | (557,337) | | | (19,759) | | | 1,594,990 | | | 1,556,011 | | | | |
| | Total 2017 | | 1,145,238 | | | 474,660 | | | — | | | — | | | (9,004) | | | 1,610,894 | | | 1,433,440 | | | |
In the following table summarizes the activity of our RSUs within year ended December 31, 2019:
| | | | | | | | | | | | | | | | | | | | | | | | | | | | | | | | | | | | | | | | | | | | | | | | | | | | | | | | |
| Period granted | | Vesting period | | RSUs outstanding January 1, | | RSUs granted | | Performance based adjustment | | RSUs settled | | RSUs forfeited | | RSUs outstanding at December 31, | | RSUs expected to vest | | Weighted average grant date fair value |
| Sign-on RSUs: | | | | | | | | | | | | | | | | | | |
| 2018 | | 2018 - 2021 | | 35,817 | | | — | | | — | | | (11,939) | | | — | | | | 23,878 | | | 23,878 | | | | $ | 25.81 | |
| 2019 | | 2019 - 2022 | | — | | | 45,257 | | | — | | | — | | | — | | | | 45,257 | | | 45,257 | | | | $ | 15.89 | |
| 2019 Plan: | | | | | | | | | | | | | | | | | | |
| 2019 | | 2019 - 2022 | | — | | | 173,940 | | | — | | | — | | | (45,493) | | | | 128,447 | | | 128,447 | | | | $ | 14.74 | |
| | Total 2019 | | 35,817 | | | 219,197 | | | — | | | (11,939) | | | (45,493) | | | | 197,582 | | | 197,582 | | | | |
| | Total 2018 | | — | | | 35,817 | | | — | | | — | | | — | | | | 35,817 | | | 35,817 | | | | |
| | Total 2017 | | — | | | — | | | — | | | — | | | — | | | | — | | | — | | | | |
Certain members of our Board of Directors receive compensation in form of restricted shares (“RSs”) in accordance with the 2014 Non-employee Director Plan. Under this plan 24,080 RSs are currently outstanding. The RSs will vest and become non-forfeitable on April 30, 2020, the first anniversary of the grant date.
At December 31, 2019, we had unrecognized compensation cost of $9.5 million, based on the target amounts, related to unvested PSUs, RSUs and RSs, which is expected to be recognized over a weighted average period of 1.6 years.
The closing price of the Company's shares and therefore the intrinsic value of one PSU or RSU outstanding was $19.30 as of December 31, 2019, $25.28 as of December 31, 2018 and $25.60 as of December 31, 2017. Total intrinsic value of PSUs and RSUs amounted to $23.2 million as of December 31, 2019, $41.2 million as of December 31, 2018 and $41.2 million as of December 31, 2017.
The following table lists the inputs to the valuation model used for calculating the grant date fair values under the 2019, 2018 and 2017 Plans:
| | | | | | | | | | | | | | | | | | | | | | | |
| | | | | 2017 Plan | | 2018 Plan | | 2019 Plan PSU |
| Expected term (in years) | | | | | 3 | | 3 | | 3 |
| Dividend yield (%) | | | | | 1.88% | | | 1.94% | | | 4.65% | |
| Expected volatility OEC (%) | | | | | 33.77% | | | 30.22% | | | 33.30% | |
| Expected volatility peer group (%) | | | | | 17.30% | | | 20.09% | | | 17.62% | |
| Correlation | | | | | 0.4574 | | | 0.3659 | | | 0.5205 | |
| Risk-free interest rate (%) | | | | | 1.45% | | | 1.46% | | | 1.83% | |
| Model used | | | | | Monte Carlo | | Monte Carlo | | Monte Carlo |
| Weighted average fair value of PSUs granted | | | | | $24.89 | | | $39.24 | | | $11.48 | |
In April 2019, 977,106 PSUs (including performance adjustment of 299,499 PSUs) were exercised for the 2016 Plan. In April 2018, 557,337 PSUs (including performance adjustment of 110,215 PSUs) were exercised for the 2015 Plan. The expected term of share awards represents the weighted average period the share awards are expected to remain outstanding. The remaining contractual terms of share units outstanding is April 2020 for the 2017 Plan, April 2021 for the 2018 Plan and April 2022 for the 2019 Plan.
The Company used a combination of historical and implied volatility of its traded shares, or blended volatility, in deriving the expected volatility assumption. The risk-free interest rate assumption is based upon observed interest rates appropriate for the term of stock options. The dividend yield assumption is based on the Company's history.
Stock-based compensation expense is compromised of the following line items:
| | | | | | | | | | | | | | | | | |
| Years Ended December 31, | | | | |
| 2019 | | 2018 | | 2017 |
| (In thousands) | | | | | |
Cost of sales | $ | 139 | | | $ | 55 | | | $ | 73 | |
Selling expenses | 1,412 | | | 2,711 | | | 1,637 | |
General and administrative expenses | 7,364 | | | 10,394 | | | 6,658 | |
Research and development costs | 523 | | | 759 | | | 467 | |
Stock-based compensation expense | $ | 9,438 | | | $ | 13,919 | | | $ | 8,835 | |
| | | | | |
| | | | | |
The assumption for estimating expected forfeitures is based on previous experience and based on 3% leavers rate per year. Actual forfeitures are in addition recorded as they occur.
Note N. Restructuring Expenses
Details of all restructuring activities and the related reserves for December 31, 2019, 2018 and 2017 were as follows:
| | | | | | | | | | | | | | | | | | | | | | | | | | | | | |
| Personnel
expenses | | Demolition and
Removal costs | | Ground
remediation
costs | | Other | | Total |
| (In thousands) | | | | | | | | | |
| Provision at January 1, 2017 | $ | 6,453 | | | $ | 4,880 | | | $ | 3,795 | | | $ | 1,547 | | | $ | 16,675 | |
| Charges | 2,975 | | | 1,440 | | | — | | | 2,076 | | | 6,492 | |
| Cost charged against liabilities (assets) | — | | | (153) | | | — | | | (114) | | | (267) | |
| Cash paid | (9,295) | | | (3,849) | | | — | | | (2,474) | | | (15,618) | |
| Foreign currency translation adjustment | 513 | | | 505 | | | 522 | | | (105) | | | 1,435 | |
| Provision at December 31, 2017 | 646 | | | 2,824 | | | 4,317 | | | 930 | | | 8,717 | |
| Charges | 7,586 | | | 1,978 | | | 2,919 | | | 3,137 | | | 15,620 | |
| Cost charged against liabilities (assets) | (324) | | | (14) | | | (833) | | | (8) | | | (1,180) | |
| Cash paid | (5,825) | | | (2,182) | | | (3,259) | | | (3,202) | | | (14,468) | |
| Foreign currency translation adjustment | 252 | | | (64) | | | (206) | | | (13) | | | (32) | |
| Provision at December 31, 2018 | 2,334 | | | 2,541 | | | 2,939 | | | 844 | | | 8,658 | |
| Charges | 2,801 | | | 9 | | | 268 | | | 2 | | | 3,080 | |
| Cost charged against liabilities (assets) | — | | | — | | | — | | | — | | | — | |
| Cash paid | (1,727) | | | (1,953) | | | (2,610) | | | (508) | | | (6,798) | |
| Foreign currency translation adjustment | (9) | | | (36) | | | (109) | | | (20) | | | (175) | |
| Provision at December 31, 2019 | $ | 3,400 | | | $ | 561 | | | $ | 488 | | | $ | 317 | | | $ | 4,765 | |
Orion's reserves for restructuring are reflected in accrued liabilities on the Consolidated Balance Sheets.
The expenses relate to the Company’s effort to restructure its Rubber segment. As a first step the Company's German operating subsidiary terminated with effect as of December 31, 2016, the Contract Manufacturing Agreement then in place between the Company's German operating subsidiary and the Company's French subsidiary, Orion Engineered Carbons SAS ("OEC SAS"), which has a plant in Ambès with a maximum capacity of mostly standard rubber grades of 50 kmt per year. Consequently, the management of OEC SAS concluded consultations with the local Works Council at this facility to implement a restructuring and down staffing with a cessation of production at the site by the end of 2016. Impairment charges of $10.3 million related to the property, plant and equipment of OEC SAS were calculated based on an estimated recoverable amount of zero and are fully charged to the Rubber Carbon Black segment.
The restructuring of the South Korean footprint concluded in the second quarter of 2018 resulting in cessation of production at the Bupyeong plant and the sale of the land to a third party. Restructuring income of $40.3 million reflects the proceeds of the land sale less the remaining book value of the land. Restructuring expenses comprise required costs for land restoration of $7.2 million and cost to consolidate the two South Korean production sites into one remaining site, including in particular personnel related termination costs of $4.4 million incurred in fiscal year 2018.
In the periods ending December 31, 2019, 2018 and 2017 restructuring expense, net amounted to $3.6 million as compared to restructuring income, net of $24.6 million and restructuring expense, net of $6.5 million, respectively.
Note O. Accumulated Other Comprehensive Income (Loss)
Changes in each component of AOCI, net of tax, are as follows for fiscal 2019, 2018 and 2017:
| | | | | | | | | | | | | | | | | | | | | | | |
| Currency Translation Adjustments | | Hedging Activities Adjustments | | Pension and Other Postretirement Benefit Liability Adjustment | | Total |
| (In thousands) | | | | | | |
| Balance at January 1, 2017 | $ | 4,378 | | | $ | (15,262) | | | $ | (7,064) | | | $ | (17,948) | |
| Other comprehensive income (loss) before reclassifications | (4,077) | | | 20,970 | | | 670 | | | 17,563 | |
| Income tax effects before reclassifications | (855) | | | (7,216) | | | (217) | | | (8,288) | |
| Amounts reclassified from AOCI | — | | | — | | | 9,687 | | | 9,687 | |
| Income tax effects on reclassifications | — | | | — | | | (3,131) | | | (3,131) | |
| Currency translation AOCI | — | | | (293) | | | (2,910) | | | (3,203) | |
| Balance at December 31, 2017 | (554) | | | (1,801) | | | (2,965) | | | (5,320) | |
| Other comprehensive income (loss) before reclassifications | (8,918) | | | (6,349) | | | 198 | | | (15,069) | |
| Income tax effects before reclassifications | (1,178) | | | 1,719 | | | (64) | | | 477 | |
| Amounts reclassified from AOCI | — | | | — | | | — | | | — | |
| Income tax effects on reclassifications | — | | | — | | | — | | | — | |
| Currency translation AOCI | — | | | 284 | | | — | | | 284 | |
| Balance at December 31, 2018 | (10,650) | | | (6,147) | | | (2,831) | | | (19,628) | |
| Other comprehensive income (loss) before reclassifications | (1,454) | | | (7,283) | | | (12,288) | | | (21,026) | |
| Income tax effects before reclassifications | (177) | | | 2,454 | | | 4,020 | | | 6,297 | |
| Amounts reclassified from AOCI | — | | | — | | | — | | | — | |
| Income tax effects on reclassifications | — | | | — | | | — | | | — | |
| Currency translation AOCI | — | | | 85 | | | (90) | | | (5) | |
| Balance at December 31, 2019 | $ | (12,281) | | | $ | (10,891) | | | $ | (11,189) | | | $ | (34,362) | |
The amounts reclassified out of AOCI and into the Consolidated Statement of Operations for the fiscal years ended December 31, 2019, 2018 and 2017 are as follows:
| | | | | | | | | | | | | | | | | | | | | | | |
| | | Years Ended December 31, | | | | |
| | | 2019 | | 2018 | | 2017 |
| | | (In thousands) | | | | |
| Amortization of actuarial losses (gains) | (recorded in interest and other finance expense, net) | | $ | — | | | $ | — | | | $ | 9,687 | |
| Total before tax | | | — | | | — | | | 9,687 | |
| Tax impact | | | — | | | — | | | (3,131) | |
| Total after tax | | | $ | — | | | $ | — | | | $ | 6,556 | |
Note P. Earnings Per Share
Basic EPS is calculated by dividing the profit for the year attributable to ordinary equity holders of the parent by the weighted average number of ordinary shares outstanding during the year.
Diluted EPS is calculated by dividing the profit for the year (numerator) attributable to ordinary equity holders of the parent by the weighted average number of ordinary shares outstanding during the year plus the weighted average number of ordinary shares arising from exercising all dilutive ordinary shares (denominator).
The following table reflects the income and share data used in the basic and diluted EPS computations:
| | | | | | | | | | | | | | | | | | | | |
| | Years Ended December 31, | | | | |
| | 2019 | | 2018 | | 2017 |
| Net income for the period - attributable to ordinary equity holders of the parent (in thousands) | | $ | 86,920 | | | $ | 121,310 | | | $ | 64,860 | |
| Weighted average number of ordinary shares (in thousands of shares) | | 59,986 | | | 59,567 | | | 59,320 | |
| Basic EPS | | $ | 1.45 | | | $ | 2.04 | | | $ | 1.09 | |
| Dilutive effect of share based payments (in thousands of shares) | | 1,313 | | | 1,482 | | | 1,354 | |
| Weighted average number of diluted ordinary shares (in thousands of shares) | | 61,300 | | | 61,049 | | | 60,674 | |
| Diluted EPS | | $ | 1.42 | | | $ | 1.99 | | | $ | 1.07 | |
For 2017 the weighted average number of shares equals the outstanding number of shares. In 2018 repurchases of treasury shares were taken into account on a daily basis. In 2018 and 2019 new shares were generated and transferred for settlement of stock based compensation ("2015 Plan", "2016 Plan", and "RSU Plan"), which was also included in the weighted number of shares. The dilutive effect of the share-based payment transaction is the weighted number of shares considering the grant date, forfeitures and executions during the respective fiscal years. The effect is determined by using the treasury stock method.
Note Q. Income Taxes
Tax provision (benefit) for income taxes consisted of the following:
| | | | | | | | | | | | | | | | | |
| Years Ended December 31, | | | | |
| 2019 | | 2018 | | 2017 |
| (In thousands) | | | | | |
| Current | | | | | |
Domestic (1) | $ | 16,250 | | | $ | 9,166 | | | $ | 12,775 | |
| Foreign | 1,140 | | | 41,412 | | | 14,628 | |
| Total | 17,390 | | | 50,578 | | | 27,403 | |
| Deferred | | | | | |
Domestic (1) | $ | 7,412 | | | $ | 6,164 | | | $ | 5,853 | |
| Foreign | 8,414 | | | (9,798) | | | (13,520) | |
| Total | 15,826 | | | (3,634) | | | (7,667) | |
| Provision for income taxes | $ | 33,216 | | | $ | 46,944 | | | $ | 19,736 | |
(1) Domestic refers to Germany.
Income before income taxes for fiscal years 2019, 2018 and 2017 is as follows:
| | | | | | | | | | | | | | | | | |
| Years Ended December 31, | | | | |
| 2019 | | 2018 | | 2017 |
| (In thousands) | | | | | |
Domestic (1) | $ | 112,427 | | | $ | 115,594 | | | $ | 121,061 | |
| Foreign | 7,710 | | | 52,660 | | | (36,465) | |
| Income before income taxes | $ | 120,137 | | | $ | 168,254 | | | $ | 84,596 | |
(1) Domestic refers to Germany.
A corporate income tax rate of 15.00% was used to calculate the current and deferred taxes for the German entities. A solidarity surcharge of 0.825% (calculated as 5.5% on the corporate income tax rate) and a trade tax rate of 16.18%, for the years ended December 31, 2019, 2018 and 2017, respectively, were also taken into account in the calculation. As a result, the overall tax rate for the German entities was 32.00%, for the years ended December 31, 2019, 2018 and 2017 respectively. The current and deferred taxes for the non-German entities were calculated using their respective country-specific tax rates.
The following tax reconciliation shows the difference between the expected income taxes using the German overall tax rate of 32.0% and the effective income taxes in the income statement, for the years ended December 31, 2019, 2018 and 2017, respectively. The German tax rate is applied due to the fact that the primary operating entity is located in Germany and this entity holds all non-German operations.
| | | | | | | | | | | | | | | | | |
| Years Ended December 31, | | | | |
| 2019 | | 2018 | | 2017 |
| (In thousands) | | | | | |
| Income before income taxes | $ | 120,137 | | | $ | 168,254 | | | $ | 84,596 | |
| Expected income tax thereon | $ | 38,444 | | | $ | 53,841 | | | $ | 27,071 | |
| Tax rate differential | (3,517) | | | (6,695) | | | (2,249) | |
| Change in valuation allowance on deferred tax assets and for losses without recognition of deferred taxes | 450 | | | (204) | | | (3,689) | |
| Change in the tax rate and tax laws | 115 | | | (802) | | | (9,543) | |
| Income taxes for prior years | (3,247) | | | 876 | | | 561 | |
| Tax on non-deductible interest expenses | 1,232 | | | 1,096 | | | 1,522 | |
| Taxes on other non-deductible expenses, and non-deductible taxes | 745 | | | (893) | | | 6,216 | |
| Effects of changes in permanent differences | (45) | | | 96 | | | (879) | |
| Tax effect on tax-free income | (898) | | | (532) | | | (1,033) | |
| | | | | |
| Other tax effects | (63) | | | 161 | | | 1,759 | |
| Effective income taxes as reported | $ | 33,216 | | | $ | 46,944 | | | $ | 19,736 | |
| Effective tax rate | 27.65 | % | | 27.90 | % | | 23.33 | % |
Change in the tax rate and tax laws in an amount of $8.8 million are related to the effect of the U.S. tax reform enacted in December 2017 reducing the corporate income tax rate from 35.0% to 21.0% in the USA. As a result the net deferred tax liabilities for the US entities are now based on the new tax rate of 21.0%.
Other non-deductible expenses, and non-deductible taxes include taxes for Brazil (treated as a disregarded entity for U.S. tax purposes) which are non-creditable in the U.S. were $2.3 million, $1.6 million, and $1.4 million for the years ended December 31, 2019, 2018 and 2017, respectively, in connection with the reduced corporate income tax rate from 35.0% to 21.0% in the USA (U.S. tax reform enacted in December 2017).
Tax rate differential for the year ended December 31, 2018 are mainly driven by a benefit $6.3 million from taxable income resulting from a land sale completed in Korea during 2018.
Income taxes for prior years ended December 31, 2019 are mainly driven by a the result of the conclusion of a tax audit in Poland. The amounts set in accruals for this purpose were released accordingly in 2019.
Income tax expense recognized in the consolidated statements of operations were $33.2 million in 2019, $46.9 million in 2018 and $19.7 million in 2017. Tax expenses/(benefit) recognized directly into the equity were $6.2 million in 2019, $0.3 million in 2018 and $(8.5) million in 2017.
Significant components of deferred income taxes were as follows:
| | | | | | | | | | | |
| Deferred tax assets | December 31 | | |
| 2019 | | 2018 |
| (In thousands) | | |
| Assets | | | |
| Intangible assets | $ | 197 | | | $ | 842 | |
| Property, plant and equipment | 8,363 | | | 8,963 | |
| Financial assets | 7,004 | | | 7,044 | |
| Inventories | 2,817 | | | 4,131 | |
| Receivables, other assets | 3,212 | | | 1,207 | |
| Liabilities | | | |
| Provisions | 20,662 | | | 18,825 | |
| Liabilities | 41,434 | | | 31,093 | |
| Other | | | |
| Loss carryforwards | 39,595 | | | 43,753 | |
| Interest carryforwards | 9,967 | | | 9,041 | |
| Tax credits | 3,185 | | | 1,022 | |
| Other | 2,028 | | | 2,750 | |
| Total deferred tax assets (gross) | 138,463 | | | 128,671 | |
| Valuation allowance | (41,994) | | | (40,905) | |
| Total deferred tax assets (net) | $ | 96,468 | | | $ | 87,766 | |
| | | | | | | | | | | |
| Deferred tax liabilities | December 31 | | |
| 2019 | | 2018 |
| (In thousands) | | |
| Assets | | | |
| Intangible assets | $ | 3,673 | | | $ | 12,973 | |
| Property, plant and equipment | 33,040 | | | 30,628 | |
| Financial assets | 7,649 | | | 6,719 | |
| | | |
| Receivables, other assets | 11,883 | | | 12,157 | |
| Liabilities | | | |
| Provisions | 8,203 | | | 6,441 | |
| Liabilities | 12,568 | | | 3,953 | |
| Other | 14,039 | | | 8,005 | |
| Total deferred tax liabilities | $ | 91,057 | | | $ | 80,876 | |
The following table illustrates the gross and net deferred tax positions after the application of jurisdictional netting.
| | | | | | | | | | | |
| Net deferred tax position | December 31 | | |
| 2019 | | 2018 |
| (In thousands) | | |
| Deferred tax assets | | | |
| Gross deferred tax assets | $ | 96,468 | | | $ | 87,766 | |
| Net deferred tax assets | 48,720 | | | 52,395 | |
| Deferred tax liabilities | | | |
| Gross deferred tax liabilities | 91,057 | | | 80,876 | |
| Net deferred tax liabilities | 43,308 | | | 45,504 | |
| Net deferred tax asset / (liability) positions | $ | 5,412 | | | $ | 6,891 | |
Management assesses the recoverability of deferred tax assets. The assessment depends on future taxable profits being generated during the periods in which tax measurement differences reverse and tax loss carryforwards can be claimed. Orion expects that sufficient taxable income will be available to recover deferred tax assets due to the tax group in place.
As of December 31, 2019 and 2018, certain loss carryforwards were subject to restrictions with respect to the offsetting of losses. No deferred tax assets were recorded on these loss carryforwards if it is not likely that they will be used by future taxable income.
The following tax loss and interest carryforwards were recognized as at December 31, 2019 and 2018 (gross amounts):
| | | | | | | | | | | |
| December 31 | | |
| 2019 | | 2018 |
| (In thousands) | | |
| Corporate income tax loss carryforwards | $ | 41,334 | | | $ | 71,904 | |
| | | |
| Interest carryforwards for tax purposes | 31,463 | | | 28,562 | |
| Total | $ | 72,797 | | | $ | 100,466 | |
The change between the recognized tax loss and interest carryforwards as at December 31, 2019 compared to 2018 is mainly driven by the taxable income of our German Tax Group.
No deferred tax assets were recognized for the following items (gross amounts):
| | | | | | | | | | | |
| December 31 | | |
| 2019 | | 2018 |
| (In thousands) | | |
| Deductible temporary differences | $ | 41,994 | | | $ | 40,905 | |
| Corporate income tax loss carryforwards | 107,110 | | | 105,287 | |
| | | |
| Interest carryforwards for tax purposes | 31,463 | | | 28,562 | |
| Total | $ | 180,567 | | | $ | 174,754 | |
The following table provides detail surrounding the expiration dates of the gross amount of tax loss carryforwards and tax credits:
| | | | | | | | | | | |
| Net operating loss carryforwards | | Tax Credits |
| (In thousands) | | |
| 2020 to 2026 | $ | — | | | $ | — | |
| 2027 and thereafter | 31,207 | | | 3,164 | |
| Indefinite carryforwards | 75,903 | | | 21 | |
| Total | $ | 107,110 | | | $ | 3,185 | |
As of December 31, 2019, the company's net operating loss carryforwards primarily relate to net operating losses which are due to expire at various dates, but not later than 2036.
No deferred taxes were recognized on a taxable temporary difference of $14.8 million (prior years: 2018: $11.8 million, 2017: $17.8 million) in connection with subsidiaries.
Deferred tax liabilities amounting $1.7 million (2018: $1.8 million, 2017: $2.2 million) were recognized for subsidiaries for which a dividend distribution is expected in the near future.
Deferred tax liabilities in the USA were reduced by $8.8 million, deferred tax assets were reduced by $0.4 million mainly reflecting the changes following the U.S. tax reform and the future corporate tax rate of 21.0% for the year ended December 31, 2017.
We are not aware about events which would cause temporary differences, for which a deferred tax liability has not been recognized.
Tax uncertainties
A reconciliation of the beginning and ending amount of unrecognized tax benefits for fiscal years 2019, 2018 and 2017 is as follows:
| | | | | | | | | | | | | | | | | |
| 2019 | | 2018 | | 2017 |
| (In thousands) | | | | |
| Balance at beginning of the year | $ | 14,771 | | | $ | 13,155 | | | $ | 10,660 | |
| Additions based on tax positions related to the current year | 246 | | | 4 | | | 1,590 | |
| Additions for tax positions of prior year | — | | | 2,982 | | | 1,663 | |
| Reductions of tax positions of prior year | (3,401) | | | (1,370) | | | (759) | |
| Reductions related to settlements | — | | | — | | | — | |
| Reductions from lapse of statute of limitations | — | | | — | | | — | |
| Balance at end of the year | $ | 11,616 | | | $ | 14,771 | | | $ | 13,155 | |
We recognize interest related to unrecognized tax benefits and penalties as income tax expense. During 2019 we accrued penalties of zero and interest of $0.5 million to the unrecognized tax benefits (noted above). As of December 31, 2019 we have a total of $4.0 million of accrued penalties and interest. We recognized no liabilities for penalties and accrued interest of $0.5 million during 2018 and had a total accrual of $3.4 million as of December 31, 2018 for penalties and interest while we recognized no liabilities for penalties and accrued interest of $0.9 million during 2017. Accrued penalties and interest totaled $2.9 million as of December 31, 2017.
Orion and certain subsidiaries are under audit in a number of jurisdictions, and in particular in Germany for the initial three years of incorporation (fiscal years 2011-2013). It cannot be excluded that a further change in the unrecognized tax benefits may occur within the next twelve months related to the settlement of one or more of these audits or the lapse of applicable statutes of limitations; however, an estimated range of the impact on the unrecognized tax benefits cannot be quantified at this time.
Note R. Commitments and Contingencies
Other Long-Term Commitments
To safeguard the supply of raw materials, contractual purchase commitments under long-term supply agreements for raw materials, primarily oil and gas, are in place with the following maturities:
| | | | | |
| Maturity | December 31, 2019 |
| (In thousands) |
| 2020 | $ | 137,190 | |
| 2021 to 2024 | 204,997 | |
| 2025 and thereafter | — | |
| Total | $ | 342,188 | |
Environmental Matters
EPA Action
During 2008 and 2009, the U.S. Environmental Protection Agency (“EPA”) contacted all U.S. carbon black producers as part of an industry-wide EPA initiative, requesting extensive and comprehensive information under Section 114 of the U.S. Clean Air Act. The EPA used that information to determine, for each facility, that either: (i) the facility has been in compliance with the Clean Air Act; (ii) violations have occurred and enforcement litigation may be undertaken; or (iii) violations have occurred and a settlement of an enforcement case is appropriate. In response to information requests received by the Company’s U.S. facilities, the Company furnished information to the EPA on each of its U.S. facilities. EPA subsequently sent notices under Section 113(a) of the Clean Air Act in 2010 alleging violations of Prevention of Significant Deterioration (“PSD”) and Title V permitting requirements under the Clean Air Act at the Company’s Belpre (Ohio) facility. In October 2012, the Company received a corresponding notice and finding of violation (a “NOV”) alleging the failure to obtain PSD and Title V permits reflecting Best Available Control Technology (“BACT”) at several units of the Company’s Ivanhoe (Louisiana) facility, and in January 2013 the Company also received a NOV issued by the EPA for its facility in Borger (Texas) alleging the failure to obtain PSD and Title V permits reflecting BACT during the years 1996 to 2008. A comparable NOV for the Company’s U.S. facility in Orange (Texas) was issued by the EPA in February 2013; and EPA issued an additional NOV in March 2016 alleging more recent non-PSD air emissions violations primarily at the dryers and the incinerator of the Orange facility.
In 2013, Orion began discussions with the EPA and the U.S. Department of Justice about a potential settlement to resolve the NOVs received, which ultimately led to a consent decree executed between Orion Engineered Carbons LLC (for purpose of this note Q.
“Orion”) and the United States (on behalf of the EPA), as well as the Louisiana Department of Environmental Quality. The consent decree (the “EPA CD”) became effective on June 7, 2018. The consent decree resolves and settles the EPA’s claims of noncompliance set forth in the NOVs and in a respective complaint filed in court against Orion by the United States immediately prior to the filing of the consent decree.
All five U.S. carbon black producers have settled with the U.S. government.
Under Orion’s EPA CD, Orion will install certain pollution control technology in order to further reduce emissions at its four U.S. manufacturing facilities in Ivanhoe (Louisiana), Belpre (Ohio), Borger (Texas), and Orange (Texas) over approximately six years. The EPA CD also requires the continuous monitoring of emissions reductions that Orion will need to comply with over a number of years. Orion has commenced the installation works for its Ivanhoe facility, and expects to complete the installation in this facility over the next one year. Under the EPA CD, Orion can choose either its Belpre or Borger facilities as the next site for installation of pollution control equipment with comparable effectiveness. We expect the capital expenditures for installation of pollution control equipment in the remaining Orion facilities to decrease due to economies of scale and synergies from prior installations. We also expect that the third and fourth plants will require significantly less costly pollution control equipment given the requirements of the EPA CD. We estimate the installations of monitoring and pollution control equipment at all four Orion plants in the U.S. will require capital expenditures of approximately $190.0 million, subject to the results of further scope design and estimation efforts presently underway. However, the actual total capital expenditures we might need to incur in order to fulfill the requirements of the EPA CD remain uncertain. The EPA CD allows some flexibility for Orion to choose among different technology solutions for reducing emissions and the locations where these solutions are implemented. The solutions Orion ultimately chooses to implement at its facilities other than Ivanhoe (Louisiana), may differ in scope and operation from those it currently anticipates (including those discussed in the next paragraph) and, for any and all of its four facilities, factors, such as timing, locations, target levels, changing cost estimates and local regulations, could cause actual capital expenditures to significantly exceed current expectations or affect Orion’s ability to meet the agreed target emission levels or target dates for installing required equipment as anticipated or at all. Orion also agreed to and paid a civil penalty of $0.8 million and agreed to perform environmental mitigation projects totaling $0.6 million. Noncompliance with applicable emissions limits could lead to further penalty payments to the EPA.
As part of Orion’s compliance plan under the EPA CD, in April 2018 Orion signed a contract with Haldor Topsoe group to install its SNOXTM emissions control technology to remove SO2, NOx and dust particles from tail gases at Orion’s Ivanhoe, Louisiana Carbon Black production plant. The SNOXTM technology has not been used previously in the carbon black industry.
Orion’s Share Purchase Agreement with Evonik in connection with the Acquisition provides for a partial indemnity from Evonik against various exposures, including, but not limited to, capital investments, fines and costs arising in connection with Clean Air Act violations that occurred prior to July 29, 2011. Except for certain less relevant allegations contained in the second NOV received for the Company’s facility in Orange (Texas) in March 2016, all of the other allegations made by the EPA with regard to all four of the Company’s U.S. facilities - as discussed above - relate to alleged violations before July 29, 2011. The indemnity provides for a recovery from Evonik of a share of the costs (including fines), expenses (including reasonable attorney’s fees, but excluding costs for maintenance and control in the ordinary course of business and any internal cost of monitoring the remedy), liabilities, damages and losses suffered and is subject to various contractual provisions including provisions set forth in the Share Purchase Agreement with Evonik, such as a de minimis clause, a basket, overall caps (which apply to all covered exposures and all covered environmental exposures, in the aggregate), damage mitigation and cooperation requirements, as well as a statute of limitations provision. Due to the cost-sharing and cap provisions in Evonik’s indemnity, the Company expects that substantial costs it has already incurred and will incur in this EPA enforcement initiative and the EPA CD likely will exceed the scope of the indemnity in the tens of millions of US dollars. In addition, Evonik signaled that it is not honoring Orion’s claims under the indemnity. In June 2019, Orion initiated arbitration proceedings to enforce its rights against Evonik. Evonik in turn has submitted certain counterclaims related to a tax indemnity and cost reimbursement against Orion, which counterclaims we do not believe to be material. Although Orion believes that it is entitled to the indemnity and that its rights thereunder are enforceable, there is no assurance that the Company will be able to recover costs or expenditures incurred under the indemnity as it expects or at all.
Pledges and guarantees
The pledge serves as collateral for claims arising under the finance documents, including the credit agreement dated July 25, 2014 as amended from time to time. The current principal amounts of the outstanding term loans under the Credit Agreement are $281.3 million (U.S. Dollar Term Loan), and €361.8 million (Euro Term Loan).
As at December 31, 2019 Orion Engineered Carbons GmbH has three guarantees issued by Euler Hermes S.A. with a total volume of $9.2 million (in prior year four guarantees by Euler Hermes S.A. of $15.2 million); one guarantee insurance issued by Deutsche Bank AG with a volume of $2.2 million (prior year one guarantee issued by Deutsche Bank AG with a volume of $2.9 million). None of these guarantees reduce the possible utilization limit of the current RCF.
Note S. Financial Information by Segment & Geographic Area
Segment information
The Company’s business is organized by its two carbon black product types. For corporate management purposes and all periods presented the Company had Rubber Carbon Black and Specialty Carbon Black as reportable operating segments. Rubber carbon black is used in the reinforcement of rubber in tires and mechanical rubber goods, Specialties are used as pigments and performance additives in coatings, polymers, printing and special applications.
The following table shows the relative size of the revenue recognized in each of the Company’s reportable segment:
| | | | | | | | | | | | | | | | | |
| 2019 | | 2018 | | 2017 |
| Rubber | | 66 | % | | 65 | % | | 64 | % |
| Specialty | | 34 | % | | 35 | % | | 36 | % |
The senior management team, which is composed of the CEO, CFO and certain other senior management members is the chief operating decision maker (“CODM”). The senior management team monitors the operating segments’ results separately in order to facilitate decisions regarding the allocation of resources and determine the segments’ performance. Orion uses Adjusted EBITDA as the segments' performance measure. The CODM does not review reportable segment asset or liability information for purposes of assessing performance or allocating resources.
Adjustment items are not allocated to the individual segments as they are managed on a group basis.
Segment reconciliation for the years ended December 31, 2019, 2018 and 2017:
| | | | | | | | | | | | | | | | | | | | | | | |
| Rubber | | Specialties | | Corporate and other | | Total segments |
| (In thousands) | | | | | | | |
| 2019 | | | | | | | |
| Net sales from external customers | $ | 967,899 | | | $ | 508,454 | | | $ | — | | | $ | 1,476,353 | |
| Adjusted EBITDA | $ | 145,170 | | | $ | 122,167 | | | $ | — | | | $ | 267,337 | |
| Corporate charges | — | | | — | | | (22,916) | | | (22,916) | |
| Depreciation and amortization of intangible assets and property, plant and equipment | (58,645) | | | (38,067) | | | — | | | (96,713) | |
| Excluding equity in earnings of affiliated companies, net of tax | (558) | | | — | | | — | | | (558) | |
| Income from operations before income tax expense and finance costs | 85,967 | | | 84,100 | | | (22,916) | | | 147,151 | |
| Interest and other financial expense, net | — | | | — | | | (27,572) | | | (27,572) | |
| | | | | | | |
| Income tax expense | — | | | — | | | (33,216) | | | (33,216) | |
| Equity in earnings of affiliated companies, net of tax | 558 | | | — | | | — | | | 558 | |
| Net income | | | | | | | | | | $ | 86,920 | |
| Assets | $ | 696,516 | | | $ | 417,834 | | | $ | 143,043 | | | $ | 1,257,394 | |
| Total expenditures for additions to long-lived assets | $ | 132,556 | | | $ | 26,147 | | | $ | — | | | $ | 158,703 | |
| 2018 | | | | | | | |
| Net sales from external customers | $ | 1,032,818 | | | $ | 545,385 | | | $ | — | | | $ | 1,578,203 | |
| Adjusted EBITDA | $ | 144,887 | | | $ | 149,255 | | | $ | — | | | $ | 294,142 | |
| Corporate charges | — | | | — | | | 910 | | | 910 | |
| Depreciation and amortization of intangible assets and property, plant and equipment | (57,127) | | | (41,029) | | | — | | | (98,156) | |
| Excluding equity in earnings of affiliated companies, net of tax | (591) | | | — | | | — | | | (591) | |
| Income from operations before income tax expense and finance costs | 87,169 | | | 108,226 | | | 910 | | | 196,305 | |
| Interest and other financial expense, net | — | | | — | | | (28,642) | | | (28,642) | |
| | | | | | | |
| Income tax expense | — | | | — | | | (46,944) | | | (46,944) | |
| Equity in earnings of affiliated companies, net of tax | 591 | | | — | | | — | | | 591 | |
| Net income | | | | | | | | | | $ | 121,310 | |
| Assets | $ | 685,243 | | | $ | 436,337 | | | $ | 151,442 | | | $ | 1,273,022 | |
| Total expenditures for additions to long-lived assets | $ | 67,885 | | | $ | 43,171 | | | $ | — | | | $ | 111,057 | |
| 2017 | | | | | | | |
| Net sales from external customers | $ | 849,410 | | | $ | 478,887 | | | $ | — | | | $ | 1,328,297 | |
| Adjusted EBITDA | $ | 111,490 | | | $ | 145,488 | | | $ | — | | | $ | 256,978 | |
| Corporate charges | — | | | — | | | (20,204) | | | (20,204) | |
| Depreciation and amortization of intangible assets and property, plant and equipment | (60,403) | | | (37,953) | | | — | | | (98,356) | |
| Excluding equity in earnings of affiliated companies, net of tax | (547) | | | — | | | — | | | (547) | |
| Income from operations before income tax expense and finance costs | 50,540 | | | 107,535 | | | (20,204) | | | 137,871 | |
| Interest and other financial expense, net | — | | | — | | | (44,135) | | | (44,135) | |
| Reclassification of actuarial losses from AOCI | — | | | — | | | (9,687) | | | (9,687) | |
| Income tax expense | — | | | — | | | (19,736) | | | (19,736) | |
| Equity in earnings of affiliated companies, net of tax | 547 | | | — | | | — | | | 547 | |
| Net income | | | | | | | | | | $ | 64,860 | |
| Assets | $ | 610,782 | | | $ | 357,492 | | | $ | 196,092 | | | $ | 1,164,366 | |
| Total expenditures for additions to long-lived assets | $ | 52,584 | | | $ | 46,397 | | | $ | — | | | $ | 98,981 | |
The sales information noted above relates to external customers only. ‘Corporate and other’ includes income and expense that cannot be directly allocated to the business segments or are managed on corporate level and includes finance income and expenses, taxes and items with less bearing on the underlying core business.
Income from operations before income taxes and finance costs of the segment 'Corporate and other' comprises the following:
| | | | | | | | | | | | | | | | | |
| 2019 | | 2018 | | 2017 |
| (In thousands) | | | | | |
| Restructuring expenses/(income) | $ | 3,628 | | | $ | (24,633) | | | $ | 6,492 | |
| Consulting fees related to Company strategy | 3,005 | | | 4,804 | | | 2,807 | |
| Long Term Incentive Plan | 9,438 | | | 13,919 | | | 8,835 | |
| Other non-operating | 6,844 | | | 5,000 | | | 2,070 | |
| Expenses/(income) from operations before income taxes and finance costs | $ | 22,916 | | | $ | (910) | | | $ | 20,204 | |
Geographic information
| | | | | | | | | | | | | | | | | |
| Net sales | Years Ended December 31, | | | | |
| 2019 | | 2018 | | 2017 |
| (In thousands) | | | | | |
| Germany | $ | 593,769 | | | $ | 628,709 | | | $ | 524,065 | |
| United States | 394,349 | | | 401,935 | | | 330,424 | |
| South Korea | 241,235 | | | 279,016 | | | 246,551 | |
| Brazil | 94,541 | | | 95,611 | | | 80,143 | |
| China | 63,149 | | | 75,638 | | | 64,645 | |
| South Africa | 54,746 | | | 56,373 | | | 46,844 | |
| Other | 23,601 | | | 24,293 | | | 23,129 | |
Rest of Europe (1) | 10,964 | | | 16,628 | | | 12,496 | |
| Total | $ | 1,476,353 | | | $ | 1,578,203 | | | $ | 1,328,297 | |
(1) Only a holding company is located in Luxembourg, accordingly no revenue is generated in the country of domicile.
Revenue generated for the year ended December 31, 2019 from the largest customer in the “Rubber” segment amounted to $195.6 million. Revenue from the largest customer in the “Rubber” segment for the year ended December 31, 2018 was $201.7 million and for the year ended December 31, 2017 revenue from the largest customer in the “Rubber” segment was $144.4 million, respectively. There is each another customer with more than, or equal to 10% of revenue for the period 2019 and 2018.
| | | | | | | | | | | |
Long-lived tangible assets(1) | December 31 | | |
| 2019 | | 2018 |
| (In thousands) | | |
| Germany | $ | 81,388 | | | $ | 104,823 | |
| Sweden | 26,419 | | 26,351 |
| Italy | 43,547 | | 29,586 |
| Poland | 12,148 | | 12,964 |
Rest of Europe (2) | 6,179 | | 5,815 |
| Subtotal Europe | 169,681 | | 179,539 |
| United States | 220,200 | | 139,929 |
| South Korea | 112,303 | | 115,036 |
| South Africa | 15,983 | | 16,894 |
| Brazil | 23,662 | | 21,395 |
| China | 19,655 | | 10,719 |
| Other | 100 | | 22 |
| Total | $ | 561,585 | | | $ | 483,534 | |
(1) Long-lived assets include property. plant and equipment, net.
(2) Only a holding company is located in Luxembourg, accordingly no revenue is generated in the country of domicile.
Note T. Related Parties
As of December 31, 2019 related parties include one associate of Orion that is accounted for using the equity method, namely "Deutsche Gaßrußwerke" (DGW) and one principal owner of more than 10%.
Related parties include key management personnel having authority and responsibility for planning, directing and monitoring the activities of the Company directly or indirectly and their close family members.
In the normal course of business Orion from time to time receives services from, or sells products to, related unconsolidated parties, in transactions that are either not material or approved in accordance with our Related Party Transaction Approval Policy.
| | | | | | | | | | | |
| December 31, | | |
| 2019 | | 2018 |
| (In thousands) | | |
| Trade receivables from DGW KG | $ | 537 | | | $ | 651 | |
| Trade payables to DGW KG | $ | 17,671 | | | $ | 18,615 | |
| | | | | | | | | | | | | | | | | |
| Years Ended December 31, | | | | |
| 2019 | | 2018 | | 2017 |
| (In thousands) | | | | | |
| Purchased carbon black products from DGW KG | | $ | 89,404 | | | $ | 93,536 | | | $ | 79,270 | |
| Sales and services provided to DGW KG | | $ | 2,724 | | | $ | 6,464 | | | $ | 2,627 | |
Note U. Quarterly Financial Information (Unaudited)
Unaudited financial results by quarter for fiscal 2019 and 2018 are summarized below:
| | | | | | | | | | | | | | | | | | | | | | | | | | | | | |
| Quarters Ended | | | | | | | | Year Ended |
| March 31, 2019 | | June 30, 2019 | | September 30, 2019 | | December 31, 2019 | | December 31, 2019 |
| (In thousands, except per share amounts) | | | | | | | | | |
| Net sales | $ | 384,714 | | | $ | 399,016 | | | $ | 370,195 | | | $ | 322,428 | | | $ | 1,476,353 | |
| Gross profit | $ | 97,969 | | | $ | 104,038 | | | $ | 98,714 | | | $ | 88,987 | | | $ | 389,708 | |
| Income from operations | $ | 34,699 | | | $ | 41,470 | | | $ | 38,386 | | | $ | 32,596 | | | $ | 147,151 | |
| Income from operations before income tax expense and equity in earnings of affiliated companies | $ | 28,256 | | | $ | 33,904 | | | $ | 31,886 | | | $ | 25,533 | | | $ | 119,579 | |
| Net income | $ | 18,954 | | | $ | 24,748 | | | $ | 24,253 | | | $ | 18,965 | | | $ | 86,920 | |
| Earnings per Share (USD per share), basic | $ | 0.32 | | | $ | 0.41 | | | $ | 0.40 | | | $ | 0.32 | | | $ | 1.45 | |
| Earnings per Share (USD per share), diluted | $ | 0.32 | | | $ | 0.40 | | | $ | 0.39 | | | $ | 0.31 | | | $ | 1.42 | |
| | | | | | | | | | | | | | | | | | | | | | | | | | | | | |
| Quarters Ended | | | | | | | | Year Ended |
| March 31, 2018 | | June 30, 2018 | | September 30, 2018 | | December 31, 2018 | | December 31, 2018 |
| (In thousands, except per share amounts) | | | | | | | | | |
| Net sales | $ | 406,699 | | | $ | 391,586 | | | $ | 393,954 | | | $ | 385,964 | | | $ | 1,578,203 | |
| Gross profit | $ | 112,403 | | | $ | 112,773 | | | $ | 109,156 | | | $ | 95,639 | | | $ | 429,971 | |
| Income from operations | $ | 45,333 | | | $ | 82,457 | | | $ | 41,843 | | | $ | 26,672 | | | $ | 196,305 | |
| Income from operations before income tax expense and equity in earnings of affiliated companies | $ | 36,951 | | | $ | 73,680 | | | $ | 35,653 | | | $ | 21,379 | | | $ | 167,663 | |
| Net income | $ | 26,754 | | | $ | 53,081 | | | $ | 25,817 | | | $ | 15,658 | | | $ | 121,310 | |
| Earnings per Share (USD per share), basic | $ | 0.45 | | | $ | 0.89 | | | $ | 0.43 | | | $ | 0.27 | | | $ | 2.04 | |
| Earnings per Share (USD per share), diluted | $ | 0.44 | | | $ | 0.87 | | | $ | 0.43 | | | $ | 0.25 | | | $ | 1.99 | |
Note V. Subsequent Events
The Company has evaluated events from December 31, 2019 through the date the financial statements were issued. There were no subsequent events that need disclosure.
Item 9. Changes in and Disagreements with Accountants on Accounting and Financial Disclosure
None.
Item 9A. Controls and Procedures
Disclosure Controls and Procedures
An evaluation was carried out, under the supervision and with the participation of management, including the Chief Executive Officer (“CEO”) and Chief Financial Officer (“CFO”), of the effectiveness of the design and operation of our disclosure controls and procedures as defined in Rule 13a-15(e) and 15d-15(e) of the Securities Exchange Act of 1934 as of December 31, 2019. Based on that evaluation, the CEO and the CFO have concluded that our disclosure controls and procedures are effective in ensuring that material information that is required to be disclosed in our reports filed under the Exchange Act is recorded, processed, summarized and reported within the time periods specified in the SEC’s rules and forms, and that such information is accumulated and communicated to our management, including our CEO and CFO, as appropriate, to allow timely decisions regarding required disclosure.
Management’s Annual Report on Internal Control over Financial Reporting
Management is responsible for establishing and maintaining adequate internal control over financial reporting (as such term is defined in Rules 13a-15(f) and 15d-15(f) under the Exchange Act). The Company’s internal control over financial reporting was designed to provide reasonable assurance regarding the reliability of financial reporting and the preparation and fair presentation of the Company’s financial statements for external purposes in accordance with GAAP.
Because of its inherent limitations, internal control over financial reporting may not prevent or detect all misstatements or omissions. In addition, projections of any evaluation of effectiveness to future periods are subject to the risk that controls may become inadequate because of changes in conditions, or that the degree of compliance with the policies or procedures may deteriorate.
Management conducted its assessment of the effectiveness of our internal control over financial reporting as of December 31, 2019 based on the framework in Internal Control-Integrated Framework (2013) issued by the Committee of Sponsoring Organizations of the Treadway Commission (COSO). Based on that assessment and discussion with the Company's Audit Committee, management has concluded that, as of December 31, 2019, the Company’s internal control over financial reporting was effective.
Attestation Report of the Independent Registered Public Accounting Firm
The Company’s independent registered public accounting firm, Ernst & Young GmbH Wirtschaftsprüfungsgesellschaft, has issued an attestation report on management’s internal control over financial reporting which appears below.
Changes in Control over Financial Reporting
No change in internal control over financial reporting as such term is defined in Exchange Act Rule 13a-15(f) occurred during the year ended December 31, 2019 that has materially affected, or is reasonably likely to materially affect, our internal control over financial reporting.
REPORT OF INDEPENDENT REGISTERED PUBLIC ACCOUNTING FIRM
The Board of Directors and Stockholders of Orion Engineered Carbons S.A.
Opinion on Internal Control over Financial Reporting
We have audited Orion Engineered Carbons S.A.’s internal control over financial reporting as of December 31, 2019, based on criteria established in Internal Control-Integrated Framework issued by the Committee of Sponsoring Organizations of the Treadway Commission (2013 framework) (the COSO criteria). In our opinion, Orion Engineered Carbons S.A. (the Company) maintained, in all material respects, effective internal control over financial reporting as of December 31, 2019, based on the COSO criteria.
We also have audited, in accordance with the standards of the Public Company Accounting Oversight Board (United States) (PCAOB), the 2019 consolidated financial statements of the Company, and our report dated February 20, 2020 expressed an unqualified opinion thereon.
Basis for Opinion
The Company’s management is responsible for maintaining effective internal control over financial reporting and for its assessment of the effectiveness of internal control over financial reporting included in the accompanying Management’s Report on Internal Control Over Financial Reporting. Our responsibility is to express an opinion on the Company’s internal control over financial reporting based on our audit. We are a public accounting firm registered with the PCAOB and are required to be independent with respect to the Company in accordance with the U.S. federal securities laws and the applicable rules and regulations of the Securities and Exchange Commission and the PCAOB.
We conducted our audit in accordance with the standards of the PCAOB. Those standards require that we plan and perform the audit to obtain reasonable assurance about whether effective internal control over financial reporting was maintained in all material respects.
Our audit included obtaining an understanding of internal control over financial reporting, assessing the risk that a material weakness exists, testing and evaluating the design and operating effectiveness of internal control based on the assessed risk, and performing such other procedures as we considered necessary in the circumstances. We believe that our audit provides a reasonable basis for our opinion.
Definition and Limitations of Internal Control Over Financial Reporting
A company’s internal control over financial reporting is a process designed to provide reasonable assurance regarding the reliability of financial reporting and the preparation of financial statements for external purposes in accordance with generally accepted accounting principles. A company’s internal control over financial reporting includes those policies and procedures that (1) pertain to the maintenance of records that, in reasonable detail, accurately and fairly reflect the transactions and dispositions of the assets of the company; (2) provide reasonable assurance that transactions are recorded as necessary to permit preparation of financial statements in accordance with generally accepted accounting principles, and that receipts and expenditures of the company are being made only in accordance with authorizations of management and directors of the company; and (3) provide reasonable assurance regarding prevention or timely detection of unauthorized acquisition, use, or disposition of the company’s assets that could have a material effect on the financial statements.
Because of its inherent limitations, internal control over financial reporting may not prevent or detect misstatements. Also, projections of any evaluation of effectiveness to future periods are subject to the risk that controls may become inadequate because of changes in conditions, or that the degree of compliance with the policies or procedures may deteriorate.
| | | | | | | | |
| /s/Tobias Schlebusch | | /s/Titus Zwirner |
| Wirtschaftsprüfer | | Wirtschaftsprüfer |
| (German Public Auditor) | | (German Public Auditor) |
Ernst & Young GmbH Wirtschaftsprüfungsgesellschaft
Cologne, Germany
February 20, 2020
Item 9B. Other Information
None
PART III
Item 10. Directors, Executive Officers and Corporate Governance
Directors
The Company is overseen by a board of directors (conseil d’administration) (the “Board of Directors”), composed of eight members.
| | | | | | | | | | | | | | | | | | | | |
Name | | Age | | Years in Office | | Title |
Dan F. Smith | | 73 | | 5 | | Chairman of the Board |
Corning F. Painter | | 57 | | 1 | | Director and Chief Executive Officer |
Jack L. Clem | | 66 | | 1 | | Director |
Marc Jean Pierre Faber | | 61 | | 2 | | Director |
Paul Huck | | 70 | | 5 | | Director |
Kerry A. Galvin | | 59 | | 1 | | Director |
Didier Miraton | | 61 | | 5 | | Director |
Hans-Dietrich Winkhaus | | 82 | | 5 | | Director |
The following is a brief summary of the business experience of the directors.
Dan F. Smith. Mr. Smith serves as chairman of the board of Kraton Corp., He is also a director of Nexeo Solutions, Inc. and, since May 2017, TPG Pace Energy Holdings Corp. During the past five years, Mr. Smith served on the board of directors of Cooper Industries plc. He began his career with ARCO (Atlantic Richfield Company) in 1968 as an engineer. He was elected president of Lyondell Chemical Company in August 1994, chief executive officer in December 1996 and chairman of the board of directors in May 2007. Mr. Smith retired in December 2007 as chairman, president and chief executive officer of Lyondell Chemical Company following the acquisition of Lyondell by Basell. Mr. Smith also serves as a member of the College of Engineering Advisory Council at Lamar University. Mr. Smith is a graduate of Lamar University with a B.S. degree in chemical engineering.
Corning F. Painter. Mr. Painter began his career at Air Products in 1984 as part of the company’s career development program. He rose through the ranks, progressing through a variety of commercial and operations positions in the U.S. and overseas, and was rapidly promoted several times over the last several years, holding leadership positions in operations, supply chain, corporate strategy and technology. He held the position of Executive Vice President, Industrial Gases until he left Air Products at the end of June, 2018 to become Orion Engineered Carbons group’s Chief Executive Officer starting from September 2018.
Jack L. Clem. Mr. Clem has been the Chief Executive Officer (CEO) of Orion Engineered Carbons Group between July 2011 and September 2018 and manager of the Company since May 2014 and had been the head of Evonik Degussa GmbH`s global Carbon Black business since August 2009. He joined Degussa in 2001 and shortly after was named CEO of their joint venture in Carbon Black with a U.S.-based private equity firm. He has over 35 years of experience in the performance and specialty minerals and chemicals industry. Prior to joining Degussa, he held various senior management positions in North America and Europe at J.M. Huber Corporation and started his career in engineering and plant management at Occidental Chemical Corporation.
Marc Jean Pierre Faber. Mr. Faber has been a daily manager of the Company since 2014. Mr. Faber holds various directorship positions, amongst others at AXA Real Estate Investments Corporation. Between 2003 and 2010, Mr. Faber served as chief executive officer of BIP Investment Partners S.A. Previously, he was the Chief Financial Officer of Cerametal Sarl, Luxembourg between 2001 and 2002, after various other functions within that company since 1991. Mr. Faber holds an MBA from INSEAD (Fontainbleau, France) and a civil engineer degree from the University of Liege, Belgium.
Paul Huck. Mr. Huck previously served for nine years as the chief financial officer and senior vice president of Air Products and Chemicals, Inc., a global $10 billion industrial gas and chemical company. Prior to this he served for ten years at Air Products and Chemicals as a vice president and corporate controller. He served as a director of NewPage Corporation and as a member of NewPage’s audit committee from 2012 until its sale in 2015. He also is a director of AdvanSix Inc. since 2016. In addition, he serves on the boards of
numerous charities. Mr. Huck holds a B.S. in mathematics from the United States Naval Academy and an MBA from the Johnson Graduate School of Management at Cornell University.
Kerry A. Galvin. Ms. Galvin has been practicing law for 30 years, including 26 years as in-house counsel. She spent 18 years at Lyondell Chemical Co., a publicly traded chemical company in the Fortune 200, including the last eight years as General Counsel. Later she became General Counsel at Axip Energy Services LP, a privately held oil field services company, serving for more than five years until her retirement. She has been a board member of the American Corporate Counsel Association, the Alumni Association of The University of Michigan and The Georgetown University Board of Regents. Ms. Galvin earned a B.S. in Foreign Service from Georgetown University and a J.D from the University of Michigan.
Didier Miraton. Mr. Miraton is currently an adviser to several senior executives and a professor in the MBA program at the Collège des Ingénieurs (CDI) in Paris. He was the chief executive officer of Almérys SAS, a French information technology company operating in the health insurance data sphere, until late 2015. He is the former chief executive officer of the Laboratoires Pierre Fabre, a leading French pharmaceutical company. He also served as a managing partner of the Compagnie Generale des Etablissements Michelin SCA from May 11, 2007 to June 30, 2011. During his time at Michelin, Mr. Miraton also acted as president of Michelin’s worldwide Research & Technology group and was a member of the Michelin Group Executive Council. Mr. Miraton has been an independent director of Vilmorin Clause & Cie SA since November 2007. He holds a civil engineering degree from the École Nationale des Ponts-et-Chaussées.
Hans-Dietrich Winkhaus. Mr. Winkhaus previously served as chief executive officer of Henkel KGaA. He served also as Chairman of the Board of Deutsche Telekom AG and Schwarz Pharma AG. He was a board member at BMW AG, Lufthansa AG, ERGO AG, Degussa AG and Galeria Kaufhof AG. He is engaged in the CARE organization in Germany. Mr. Winkhaus studied Business Administration at and received a Ph.D. from Ludwig Maximilian University, Munich.
Senior Management
The following table sets forth certain information concerning our senior management:
| | | | | | | | | | | | | | |
Name | | Age | | Title |
| Corning F. Painter | | 57 | | Chief Executive Officer |
| Lorin Crenshaw | | 44 | | Chief Financial Officer |
| Lixing Min | | 59 | | Senior Vice President and General Manager–Asia Pacific Region |
| Sandra Niewiem | | 43 | | Senior Vice President, Global Specialty Carbon Black and EMEA Region |
| Pedro Riveros | | 49 | | Senior Vice President, Global Rubber Carbon Black and Americas Region |
| David Deters | | 61 | | Senior Vice President, Innovation |
| Sungdo Gong | | 57 | | Senior Vice President, Strategic Development |
| André Schulze Isfort | | 45 | | Chief Accounting Officer, Head of Consolidation & Reporting |
Corning F. Painter. Mr. Painter began his career at Air Products in 1984 as part of the company’s career development program. He rose through the ranks, progressing through a variety of commercial and operations positions in the U.S. and overseas, and was rapidly promoted several times over the last several years, holding leadership positions in operations, supply chain, corporate strategy and technology. He held the position of Executive Vice President, Industrial Gases until he left Air Products at the end of June, 2018 to become Orion Engineered Carbons group’s new Chief Executive Officer starting from September 2018.
Lorin Crenshaw. Mr. Crenshaw joined Orion in November 2019 and has over 20 years of diversified financial experience, including more than 10 years in senior leadership positions with global chemical companies. Immediately prior to Orion, he served as Chief Financial Officer of Albemarle Corporation’s global lithium business and also earlier served in several key management roles including Treasurer and Head of Investor Relations while at Albemarle. Mr. Crenshaw also has over ten years of experience with investment management firms Citigroup Asset Management and Prudential Capital Group. Mr. Crenshaw holds an MBA from Columbia University and a BS in Business Administration from Florida A&M University.
Lixing Min. Dr. Min has been our Senior Vice President and General Manager–Asia-Pacific Region since April 2013. He has over 23 years of experience in the chemical industry, including positions of general management of the Asia-Pacific region for both American- and German-based chemical companies. Dr. Min holds a bachelor’s degree in chemistry from Fudan University in China and master’s and doctoral degrees in chemistry from the University of Rochester.
Sandra Niewiem. Dr. Niewiem was appointed Senior Vice President Global Specialty Carbon Black and EMEA Region in September 2019. Dr. Niewiem joined Orion in December 2013 and previously held the position of Vice President Global Product Management and Business Development Specialty Carbon Black. She has over 19 years of experience in process industries, engineering
and industrial goods, thereof more than 13 years in management consulting at a global consulting firm. Dr. Niewiem holds an economics doctorate from European Business School and a master’s in business administration from James Madison University, Virginia.
Pedro Riveros. Mr. Riveros joined Orion Engineered Carbons in the current role in June 2019. He has 25 years of experience in varied general management and business management roles in the industrial gas and chemicals area both in North and South America. Mr. Riveros held several business leadership roles at Air Products, prior to joining Orion, where his key areas of expertise included Business Strategy, Margin Enhancement, Productivity and Supply Chain Management. Mr. Riveros holds a bachelor’s degree in mechanical engineering from Rensselaer Polytechnic Institute.
David Deters. David Deters has been the Senior Vice President–Innovation and a member of the executive management team since August 2015. He has over 30 years of global experience within coatings, printing inks and specialty chemical sectors. Prior to joining Orion, he held executive management positions at Hempel as GVP R&D and Marine Marketing and King Industries as VPGM Specialty Chemicals. He worked for 20 years at DuPont holding various Technical Director and Global Product Management positions throughout the world. Mr. Deters holds a Bachelor of Science Degree in Engineering from Michigan State University.
Sungdo Gong. Mr. Gong joined Orion on March 2014, as Country Manager, Korea, and was promoted to his current position in May 2018. He has over twenty-seven years of professional experience. Immediately prior to Orion, he was with GE Healthcare and GE Energy in Korea where he held several leadership roles. His earlier career included service at Hyosung, BP, the Korean Ministry of Planning and Budget, the International Monetary Fund in the US and the law firms of Kim & Chang in Korea and Akin Gump Strauss Hauer & Feld in the US. Mr. Gong holds a Master of Laws (LL.M.) degree from Georgetown University Law Center in Washington, D.C., a juris doctorate from Pepperdine University Law of School, California, and a bachelor’s degree in international affairs from The George Washington University, Washington, D.C. He is a member (inactive) of the State Bar of California.
André Schulze Isfort. André Schulze Isfort has been Head of Consolidation & Reporting since August 2011, also serving as Principal Accounting Officer. He has almost 10 years of experience in the chemical industry including as head of a restructuring project and as head of internal audit. Prior to joining the industry he worked for five years at Deloitte. Mr. Schulze Isfort holds a master’s degree in business administration from the University of Applied Science of Münster, Germany.
Corporate Governance
Orion has adopted a Code of Ethics that applies to all of the Company’s employees and directors, including the Chief Executive Officer, the Chief Financial Officer, senior management, the Controller and other senior financial officers. The Code of Ethics is posted on our website, www.orioncarbons.com (under “Investors” then “Governance” section). We intend to satisfy the disclosure requirement regarding any amendment to, or waiver of, a provision of the Code of Ethics applicable to the Chief Executive Officer, the Chief Financial Officer, senior management, the Controller or other senior financial officers by posting such information on our website.
The other information required by this item will be included in our Proxy Statement for the 2020 Annual Meeting of Stockholders (“Proxy Statement”) and is herein incorporated by reference.
Item 11. Executive Compensation
The information required by this item will be included in our Proxy Statement and is incorporated herein by reference.
Item 12. Security Ownership of Certain Beneficial Owners and Management and Related Stockholder Matters
The information relating to security ownership of certain beneficial owners of our common stock and information relating to the security ownership of our management required by this item will be included in our Proxy Statement and is incorporated herein by reference.
Item 13. Certain Relationships and Related Transactions, and Director Independence
The information required by this item will be included in our Proxy Statement and is incorporated herein by reference.
Item 14. Principal Accounting Fees and Services
The information required by this item will be included in our Proxy Statement and is incorporated herein by reference.
PART IV
Item 15. Exhibits, Financial Statement Schedules
(a) Financial Statements.
See Item 8 of this Form 10-K.
(b) Schedules.
The Schedules have been omitted since the required information is not applicable or is not present in amounts sufficient to require submission of the schedule, or because the information required is included in the consolidated financial statements and notes thereto included in this Form 10-K.
(c) Exhibits. (Certain exhibits not included in copies of the Form 10-K sent to stockholders.)
The exhibit numbers in the Exhibit Index correspond to the numbers assigned to such exhibits in the Exhibit Table of Item 601 of Regulation S-K. Orion will furnish to any stockholder, upon written request, any exhibit listed in the Exhibit Index, upon payment by such stockholder of the Company’s reasonable expenses in furnishing such exhibit.
Item 16. 10-K Summary
None applicable.
| | | | | | | | |
Exhibit Number | | Description |
| 3.1 | | |
| | |
| 4.1 | | |
| | |
| 4(b) | | |
| | |
| 10.1 | | Credit Agreement, dated as of July 25, 2014, among the Company, Orion Engineered Carbons Holdings GmbH, Orion Engineered Carbons Bondco GmbH, Orion Engineered Carbons GmbH, OEC Finance US LLC, the revolving borrowers named therein, the guarantors named on the signature page thereto, the lenders named therein, and Goldman Sachs Bank USA as administrative agent (incorporated by reference to Exhibit 99.1 to the Current Report on Form 6-K furnished on July 31, 2014 (File No. 001-36563) |
| | |
| 10.2 | | First Amendment, dated as of August 7, 2014, to the Credit Agreement, by and among Orion Engineered Carbons S.A., Orion Engineered Carbons Holdings GmbH, Orion Engineered Carbons BondCo GmbH, Orion Engineered Carbons GmbH, OEC Finance US LLC, the Revolving Borrowers named therein, the Guarantors party thereto, the Lenders party thereto, Goldman Sachs Bank USA, in its capacity as administrative agent for the Lenders |
| | |
| 10.3 | | Second Amendment, dated as of September 29, 2016, to the Credit Agreement, by and among Orion Engineered Carbons S.A., Orion Engineered Carbons Holdings GmbH, Orion Engineered Carbons BondCo GmbH, Orion Engineered Carbons GmbH, OEC Finance US LLC, the Revolving Borrowers named therein, the Guarantors party thereto, the Lenders party thereto, Goldman Sachs Bank USA, as Assuming Lender with respect to the Initial Dollar Term Loans and Initial Euro Term Loans |
| | |
| 10.4 | | Third Amendment, dated as of May 5, 2017, to the Credit Agreement, by and among Orion Engineered Carbons S.A., Orion Engineered Carbons Holdings GmbH, Orion Engineered Carbons BondCo GmbH, Orion Engineered Carbons GmbH, OEC Finance US LLC, the Revolving Borrowers named therein, the Guarantors party thereto, the Lenders party thereto, Goldman Sachs Bank USA, as Assuming Lender with respect to the Initial Dollar Term Loans and Initial Euro Term Loans |
| | |
| 10.5 | | Fourth Amendment, dated as of May 31, 2017, to the Credit Agreement, by and among Orion Engineered Carbons S.A., Orion Engineered Carbons Holdings GmbH, Orion Engineered Carbons BondCo GmbH, Orion Engineered Carbons GmbH, OEC Finance US LLC, the Revolving Borrowers named therein, the Guarantors party thereto, the Lenders party thereto, Goldman Sachs Bank USA, in its capacity as administrative agent for the Lenders, and UniCredit Bank AG, as arranger with respect to the Amendment (incorporated by reference to Exhibit 99.1 to the Current Report on Form 6-K furnished on July 25, 2017 (File No. 001-36563)) |
| | |
| 10.6 | | Fifth Amendment, dated as of November 2, 2017, to the Credit Agreement, by and among Orion Engineered Carbons S.A., Orion Engineered Carbons Holdings GmbH, Orion Engineered Carbons BondCo GmbH, Orion Engineered Carbons GmbH, OEC Finance US LLC, the Revolving Borrowers named therein, the Guarantors party thereto, the Lenders party thereto, Goldman Sachs Bank USA, as administrative agent for the Lenders. |
| | |
| 10.7 | | Sixth Amendment, dated as of May 3, 2018, to the Credit Agreement, by and among Orion Engineered Carbons S.A., Orion Engineered Carbons Holdings GmbH, Orion Engineered Carbons BondCo GmbH, Orion Engineered Carbons GmbH, OEC Finance US LLC, the Revolving Borrowers named therein, the Guarantors party thereto, the Lenders party thereto, Goldman Sachs Bank USA, as administrative agent for the Lenders. |
| | |
| | | | | | | | |
| 10.8 | | Seventh Amendment, dated as of October 29, 2018, to the Credit Agreement, by and among Orion Engineered Carbons S.A., Orion Engineered Carbons Holdings GmbH, Orion Engineered Carbons BondCo GmbH, Orion Engineered Carbons GmbH, OEC Finance US LLC, the Revolving Borrowers named therein, the Guarantors party thereto, the Lenders party thereto, Goldman Sachs Bank USA, as administrative agent for the Lenders. |
| | |
| 10.9 | | Eights Amendment, dated as of April 2, 2019, to the Credit Agreement, by and among Orion Engineered Carbons S.A., Orion Engineered Carbons Holdings GmbH, Orion Engineered Carbons BondCo GmbH, Orion Engineered Carbons GmbH, OEC Finance US LLC, the Revolving Borrowers named therein, the Guarantors party thereto, the Lenders party thereto, Goldman Sachs Bank USA, as administrative agent for the Lenders. |
| | |
| 21.1 | | |
| | |
| 23.1 | | |
| | |
| 31.1 | | |
| | |
| 31.2 | | |
| | |
| 32.1 | | |
| | |
| 32.2 | | |
| | |
| 101.0 | | XBRL |
SIGNATURES
Pursuant to the requirements of Section 13 or 15(d) of the Securities Exchange Act of 1934, the registrant has duly caused this report to be signed on its behalf by the undersigned, thereunto duly authorized.
| | | | | | | | |
| ORION ENGINEERED CARBONS S.A. | |
| | |
| February 20, 2020 | By | /s/ Corning F. Painter |
| | Name: Corning F. Painter |
| | Title: Chief Executive Officer |
Pursuant to the requirements of the Securities Exchange Act of 1934, this report has been signed below by the following persons on behalf of the registrant and in the capacities and on the dates indicated.
| | | | | | | | | | | |
| Signature | | Title | Date |
| | | |
| /s/ Corning F. Painter | | Chief Executive Officer (Principal Executive Officer) | |
| Corning F. Painter | | | February 20, 2020 |
| | | |
| /s/ Lorin Crenshaw | | Chief Financial Officer (Principal Financial Officer) | |
| Lorin Crenshaw | | | February 20, 2020 |
| | | |
| /s/ Andre Schulze Isfort | | Chief Accounting Officer (Principal Accounting Officer) | |
| Andre Schulze Isfort | | | February 20, 2020 |
| | | |
| /s/ Jack L. Clem | | Director | |
| Jack L. Clem | | | February 20, 2020 |
| | | |
| /s/ Marc Jean Pierre Faber | | Director | |
| Marc Jean Pierre Faber | | | February 20, 2020 |
| | | |
| /s/ Kerry A. Galvin | | Director | |
| Kerry A. Galvin | | | February 20, 2020 |
| | | |
| /s/ Paul Huck | | Director | |
| Paul Huck | | | February 20, 2020 |
| | | |
| /s/ Didier Miraton | | Director | |
| Didier Miraton | | | February 20, 2020 |
| | | |
| /s/ Dan F. Smith | | Director | |
| Dan F. Smith | | | February 20, 2020 |
| | | |
| /s/ Hans Dietrich Winkhaus | | Director | |
| Hans Dietrich Winkhaus | | | February 20, 2020 |