UNITED STATES
SECURITIES AND EXCHANGE COMMISSION
Washington, D.C. 20549
_____________________________________________________________
Form 10-K
_____________________________________________________________
(Mark One)
For the fiscal year ended October 31, 2019
or
For the transition period from to
Commission File Number: 001-36334
_____________________________________________________________
(Exact name of registrant as specified in its charter)
State or other jurisdiction of Incorporation or organization | I.R.S. Employer Identification No. | |
Address of principal executive offices: 1400 Fountaingrove Parkway , Santa Rosa , CA 95403
Registrant's telephone number, including area code: (800) 829-4444
Securities registered pursuant to Section 12(b) of the Act:
Title of each class | Trading Symbol | Name of each exchange on which registered |
par value $0.01 per share | ||
Securities registered pursuant to Section 12(g) of the Act: None
_____________________________________________________________
Indicate by check mark if the registrant is a well-known seasoned issuer, as defined in Rule 405 of the Securities Act. Yes ☒ No ☐
Indicate by check mark if the registrant is not required to file reports pursuant to Section 13 or Section 15(d) of the Act. Yes ☐ No ☒
Indicate by check mark whether the registrant (1) has filed all reports required to be filed by Section 13 or 15(d) of the Securities Exchange Act of 1934 during the preceding 12 months (or for such shorter period that the registrant was required to file such reports), and (2) has been subject to such filing requirements for the past 90 days. Yes ☒ No ☐
Indicate by check mark whether the registrant has submitted electronically every Interactive Data File required to be submitted pursuant to Rule 405 of Regulation S-T (§232.405 of this chapter) during the preceding 12 months (or for such shorter period that the registrant was required to submit and post such files). Yes ☒ No ☐
Indicate by check mark whether the registrant is a large accelerated filer, an accelerated filer, a non-accelerated filer, or a smaller reporting company. See the definitions of "large accelerated filer," "accelerated filer," "smaller reporting company," and "emerging growth company" in Rule 12b-2 of the Exchange Act.
☒ | Accelerated filer ☐ | |||
Non-accelerated filer | ☐ | Smaller reporting company | ||
Emerging growth company | ||||
If an emerging growth company, indicate by check mark if the registrant has elected not to use the extended transition period for complying with any new or revised financial accounting standards provided pursuant to Section 13(a) of the Exchange Act. o
Indicate by check mark whether the registrant is a shell company (as defined in Rule 12b-2 of the Exchange Act). Yes ☐ No ☒
The aggregate market value of common equity held by non-affiliates as of April 30, 2019 was approximately $11 billion, based upon the closing price of the Registrant's common stock as quoted on New York Stock Exchange on such date. Shares of stock held by officers, directors and 5 percent or more stockholders have been excluded in that such persons may be deemed to be affiliates. This determination of affiliate status is not necessarily a conclusive determination for other purposes.
As of December 16, 2019, there were 188,447,566 shares of our common stock outstanding.
_____________________________________________________________
DOCUMENTS INCORPORATED BY REFERENCE
Document Description | 10-K Part | |
Portions of the Proxy Statement for the Annual Meeting of Stockholders (the "Proxy Statement") to be held on March 19, 2020 and to be filed pursuant to Regulation 14A within 120 days after registrant's fiscal year ended October 31, 2019 are incorporated by reference into Part III of this Report. | III | |
TABLE OF CONTENTS
Page | ||
2
Forward-Looking Statements
This report contains forward-looking statements including, without limitation, statements regarding trends, seasonality, cyclicality and growth in, and drivers of, the markets we sell into, our strategic direction, our future effective tax rate and tax valuation allowance, earnings from our foreign subsidiaries, remediation activities, new solution and service introductions, the ability of our solutions to meet market needs, changes to our manufacturing processes, the use of contract manufacturers, the impact of local government regulations on our ability to pay vendors or conduct operations, our liquidity position, our ability to generate cash from operations, growth in our businesses, our investments, the potential impact of adopting new accounting pronouncements, our financial results, our purchase commitments, our contributions to our pension plans, the selection of discount rates and recognition of any gains or losses for our benefit plans, our cost-control activities, savings and headcount reduction recognized from our restructuring programs and other cost saving initiatives, and other regulatory approvals, the integration of our completed acquisitions and other transactions, our transition to lower-cost regions, the existence of political or economic instability, and our and the combined group's estimated or anticipated future results of operations, that involve risks and uncertainties. Our actual results could differ materially from the results contemplated by these forward-looking statements due to various factors, including but not limited to those risks and uncertainties discussed in Item 1A and elsewhere in this Form 10-K.
PART I
Item 1. Business
Overview
Keysight Technologies, Inc. ("we," "us," "Keysight" or the "company"), incorporated in Delaware on December 6, 2013, is a technology company that helps enterprises, service providers and governments accelerate innovation to connect and secure the world by providing electronic design and test solutions that are used in the simulation, design, validation, manufacture, installation, optimization and secure operation of electronics systems in the communications, networking and electronics industries. We also offer customization, consulting and optimization services throughout the customer's product lifecycle, including start-up assistance, asset management, up-time services, application services and instrument calibration and repair.
We generated $4.3 billion, $3.9 billion and $3.2 billion of net revenue in 2019, 2018 and 2017, respectively. Net revenue, income from operations and assets by business segment as of and for the fiscal years ended October 31, 2019, 2018 and 2017 are provided in Note 20, "Segment Information," to our consolidated financial statements. As of October 31, 2019, we had approximately 13,600 employees worldwide. We had more than 17,500 direct customers for our solutions and services in fiscal year 2019 and greater than 32,000 customers including indirect channels. No single customer represented 10 percent or more of our net revenue.
Strategies
With a focus on electronic design, test and optimization, we deliver market-leading solutions across a wide range of industries, including commercial communications, networking, aerospace, defense and government, automotive, energy, semiconductor, general electronics and education. Our software and hardware solutions support our customers' design and test challenges across the entire product lifecycle. We provide simulation, prototype development and validation solutions for R&D, high-volume manufacturing test solutions, as well as handheld and other solutions for operational optimization post-deployment in the field. Our objective is to increase the productivity of our customers and reduce their time to market. Keysight's solutions utilize a common portfolio of market-leading software and hardware technologies along with a suite of valued-added services. This broad portfolio of solutions enables our customers to efficiently develop and deploy their products to address the most rapidly evolving new technologies and market opportunities. The following strategies are significant:
• | Expanding our software portfolio |
◦ | PathWave, a new software platform: PathWave software is designed to provide customers with a breakthrough design and test solution that accelerates the overall workflow from simulation of early concepts through manufacturing and optimization of deployed systems. PathWave is expected to integrate Keysight’s expanding portfolio of software solutions, including design software, measurement applications and instrument control. It provides an open and flexible development environment with common data formats and a consistent user interface in an open, scalable and predictive platform. The platform is in the early stages of a multi-year development timeline and is designed to be the foundation for many Keysight solutions going forward. |
• | Providing complete solutions with services |
◦ | The breadth of our service offerings enables Keysight to provide customers with complete solutions that incorporate both leading product capabilities and the appropriate services and support. We have expanded and deepened our service offerings |
3
beyond a strong foundation of calibration and repair to include customization, consulting, and optimization services. Support offerings such as KeysightCare, asset optimization, technology refresh and other value-added services enable us to provide complete customer solutions across a broad set of communications and electronics markets, technologies and industries.
• | Investing early to achieve first-to-market solutions |
◦ | Wireless communication measurement solutions. We are investing in the development of new wireless communications test solutions to satisfy the commercial communications end market, which is being driven by growth in mobile data, IoT and evolving wireless standards, particularly 5G. The acquisition of Anite in fiscal 2015 strengthened our wireless software design and test portfolio and expanded our served addressable market. With our technical breadth and expertise and strategic engagement with market-leading customers and partners around the world, we have leading-edge solutions for 5G applications available and have been first to market with many 5G solutions. With the acquisition of Prisma Telecom Testing ("Prisma") in fiscal 2019, we enhanced our ability to deliver total solutions to the designers of cellular base stations. |
◦ | Automotive design and measurement solutions. We are investing in the development of new automotive test solutions to address the rapidly emerging electric, hybrid electric, connected and autonomous vehicle segments. Over the prior three years, we have introduced new solutions covering vehicle intelligence, connectivity, power and security. The Automotive Cybersecurity Program validates the resiliency of connected components of a vehicle, individually or as an entirely functioning automobile. In addition, security solutions developed by Ixia, acquired in fiscal 2017, enables Keysight to deliver extensive security validations of the 4G/5G radio access network (RAN) infrastructure that connects vehicles with the back-end data centers. With the acquisition of ScienLab in fiscal 2017, we significantly enhanced our ability to deliver application-optimized, customer-specific test solutions for the development and production of charging technology and infrastructure, energy storage, battery management systems, inverters and DC/DC converters. |
◦ | Network test solutions. The rapidly growing number of high-speed, connected devices requires service providers and data center operators to continuously update their networks to deliver higher levels of data transfer performance, improve quality of service and enhance network security. The acquisition of Ixia established Keysight as a market leader in next-generation network test and network visibility solutions. |
• | Developing solutions for network transformation |
◦ | Network Transformation Requires New Solutions. Market drivers are leading to a transformation of both wireless and wired network technologies. In particular, the low-latency and high bandwidth requirements to make 5G a reality are transforming the entire network. Our organic investments and acquisitions to enable the next generation of networks and beyond is illustrated by the graphic below. We provide both wireless and wired network communications design and test solutions that address all seven layers of the communications stack. In addition, these solutions address customer needs across the entire communications ecosystem, from chipsets to devices to network access and then into the core network, data centers and the cloud. |

4
Strengths
Our electronic measurement business originated in 1939. Our legacy encompasses 80 years of innovation, measurement science expertise and deep customer relationships. We conduct business annually with over 32,000 customers around the world, including most Fortune 1000 companies who are developing new electronic technologies, networks, systems, devices and components. The following strengths are significant:
• | Industry-Focused Organization Structure to Support Customer Success: In 2016, Keysight transformed the company structure from product-focused divisions to industry-focused solution organizations, enabling closer customer alignment. This allows us to partner closely with market leaders to enable new technologies and provide first-to-market solutions for emerging applications. Our solution-centric industry groups provide end-to-end design, test and optimization solutions driven by customer specifications and timetables. Keysight is viewed as a trusted adviser and partner across industries. |
• | Technology Leadership as a Competitive Differentiator. Proprietary software and hardware technologies unavailable on the commercial market and developed by our research and development technology centers around the world enable many Keysight products to deliver the best design and measurement solution capability available for our customers’ engineering requirements. Some of Keysight’s hardware technologies are designed and manufactured in our own in-house integrated circuit fabrication facilities, which were purpose-built and optimized to deliver leading-edge performance and capabilities across the broad portfolio of Keysight instruments. This differentiation enables Keysight to be recognized as a leader in six core measurement platforms: RF and Microwave Design Simulation software, Network Test, Network Analyzers, Oscilloscopes, Signal Analyzers and Signal Sources. Keysight’s technology leadership supports our strategy to deliver first-to-market solutions for our customers, which in turn enables them to be first to market with their products and gain a competitive advantage. |
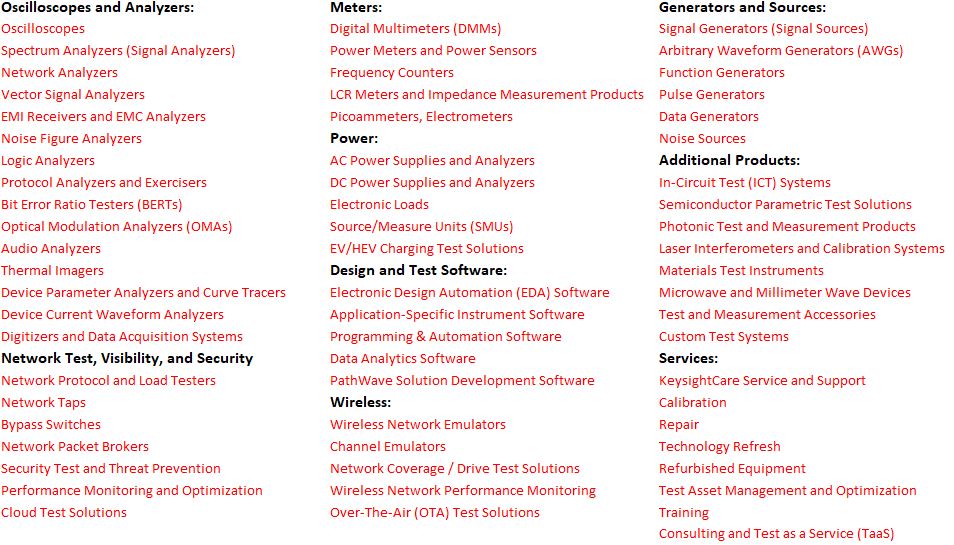
• | Broad Portfolio of Solutions and Products to Address Customer Needs. Keysight has a broad portfolio of electronic design and test solutions and products, which we continue to expand. Our hardware product portfolio spans many technologies and price points. Products are available in various physical form factors, such as benchtop instruments, handheld units, custom or industry-standard modular formats, and others. We address time and frequency domain applications with radio-frequency ("RF"), microwave, high-speed digital and general instrumentation. We also address network test, visibility, and security applications. In addition, we have a broad portfolio of software solutions and products to enable our customers' success, including electronic design automation ("EDA") software for RF and high-speed digital design, software tools for programming, automation, and data analysis, and a broad range of application-specific software for our instruments. Our PathWave software platform incorporates some of these software elements. Finally, we offer an expanding set of services and support delivered under our KeysightCare offering. Our broad portfolio of solutions and products includes, among others, the following: |
5
• | Industry-Leading Commitment to Product Quality and Reliability. Keysight has a reputation in the industry for high-quality and high-reliability electronic measurement instrumentation and software. Ensuring quality and reliability is an integral part of our new product development processes. |
• | Sales Channel with Global Reach. We have a comprehensive sales channel. We have experienced management teams and highly technical sales and application engineers in all parts of the world, including a strong local presence in emerging markets. As a part of our sales channel strategy, we have increased our direct sales capacity by more than 50% since the beginning of fiscal 2017. This global direct channel is focused on selling high performance products and industry solutions to global and geographic accounts. Approximately 75 percent of our business comes from customer interactions with our direct sales organization. In countries with low sales volumes, sales are made through various representatives and channel partners. To ensure broad geographic coverage and further drive growth, we maintain a network of over 650 channel partners to complement our direct sales force. |
• | Large Installed Base. We have a large worldwide installed base of equipment because of the breadth of our solutions portfolio and our long history of producing high-performance and high-quality solutions. This installed base enables a strong and growing services solutions portfolio, which provides a wide range of calibration and repair services, on both a per incident and contract basis, and provides opportunities as loyal customers refresh or upgrade their equipment. |
• | Centralized Order Fulfillment. Our order fulfillment organization allows us to leverage the scale and scope of our business to provide high-quality, market-leading instrument solutions to our customers while generating competitive gross margins. Keysight has a central order fulfillment organization that supplies solutions to customers across geographies. Our Penang, Malaysia site is our largest manufacturing facility, with a proven track record of operational excellence, technology capability and quality. We have an established network of suppliers and subcontractors, especially in Asia, that complements our in-house capabilities. |
• | Business Model. Our operating model incorporates a substantial amount of cost structure flexibility with the intent to be materially profitable across a range of economic and market conditions. Our variable compensation programs, sales channel strategy and the outsourced components of our supply chain have been implemented to improve the flexibility of our cost structure. |
The Keysight Leadership Model
Keysight's Leadership Model (“KLM”) is the company's framework to continuously deliver value to our customers, stockholders and employees. KLM provides the structure to execute Keysight's strategy. This model encompasses seven interlinked areas of focus centered around our customers, including: Customer Success, Market Insight, Capital Allocation, First-to-Market Solutions, Operational Excellence, Employee Growth and Keysight Values.

Customer Success is the heart of everything we do, embodying our relentless drive to deeply understand our customers challenges and help them achieve positive, sustained outcomes through the application of new insights and the use of Keysight solutions.
6
• | Market Insight is enabled by our deep customer relationships and focuses our product and solution roadmaps, informs our merger and acquisition ("M&A") priorities, and factors into our hiring priorities and talent development plans. Our market insight allows us to move with speed and focus delivering first-to-market solutions that enable customers to address their engineering challenges. |
• | Capital Allocation is how we direct our financial and human capital to business opportunities, projects and processes that align with our strategy to generate financial returns, which create value for the company, shareholders and employees. The threshold for our capital allocation is an expected return on invested capital that is above our cost to procure that capital. |
• | First-to-Market Solutions is what we strive to deliver to our customers across the industries we serve. By being first-to-market with the right solutions we enable our customers to also be first-to-market with their products. |
• | Operational Excellence across all functions is a relentless focus. It allows us to accelerate R&D by developing common technology platforms, maximize margins through cost reductions and supply optimization, implement LEAN+ processes for continuous improvement and leverage general and administrative spend as the company grows. We believe this focus drives long-term competitive advantage and growth, while building customer loyalty. |
• | Employee Growth is enabled in a dynamic work environment where employees are encouraged to be innovative and act with speed. This environment supports employees throughout their careers, with the goal of connecting their passions to business results. |
• | Keysight Values of speed and courage, uncompromising integrity, high performance and social responsibility foster a dynamic and inspiring environment conducive to innovation and experimentation. Our values help us attract and retain top talent and guide how we work with each other and engage with our customers, suppliers and communities. |
More information on the KLM can be found at https://about.keysight.com/en/companyinfo/leadership.shtml.
Operating Segments
In 2019 we completed an organizational change to align our services business with our customer-solutions-oriented, go-to-market strategy as reflected by our Keysight Leadership Model ("KLM"). This change was made to fully reflect our services delivery within the markets served and further enable the growth of our services solutions portfolio. Prior period segment results were revised to conform to the presentation. As a result, Keysight has three segments: Communications Solutions Group, Electronic Industrial Solutions Group and Ixia Solutions Group. The organizational structure continues to include centralized enterprise functions that provide support across the groups.
Communications Solutions Group
The Communications Solutions Group serves customers spanning the worldwide commercial communications and aerospace, defense and government end markets. The group provides electronic design and test software, instruments and systems and related services used in the simulation, design, validation, manufacturing, installation and optimization of electronic equipment. This business generated revenue of $2.7 billion in fiscal 2019, $2.4 billion in fiscal 2018 and $2.1 billion in fiscal 2017.
Communications Solutions Group Markets
Our Communications Solutions Group serves the following two markets:
Commercial Communications Market
We market our electronic design and test solutions to chipset providers, network equipment manufacturers (“NEMs”), wireless device providers and component providers within the supply chain for these customers and communications service providers. Growth in mobile data traffic and increasing complexity in semiconductors and components are driving test demand across the communications market. We provide end-to-end solutions for mobile chipsets, connected smart sensors/devices (IoT), wireless base stations, networks, data centers and cloud. Our leading-edge solutions enable new technology waves, including 5G wireless, Wi-Fi 6, 400G+ telecom and optical test and PCIe Gen5 high speed digital. Our ability to design and deliver first-to-market solutions is enabled by our technical expertise as well as our strategic engagements with market-leading customers across the commercial communications ecosystem.
NEMs and chipset providers, design and manufacture products to enable the transmission of voice, data and video traffic. The NEMs’ customers are communications service providers that deploy and operate the networks and deliver services, as well as distribute end‑user subscriber devices, including wireless smart phones, tablets and other connected devices. To meet their
7
customers’ demands, NEMs require test and measurement instruments, systems and solutions for the development, production and installation of each optical, electrical and wireless network technology.
Wireless device providers require design and test solutions for the design, development, manufacture and repair of a variety of mobile and connected devices, including both smart phones and tablets. These mobile devices are used for voice, data and video delivery to individuals who connect wirelessly to the service provider’s network. The device manufacturers’ customers are large and small service providers, enterprises and consumers who purchase directly from retailers. Wireless device manufacturers require design and test solutions that enable technology development that conforms to the latest standards.
Component providers design, develop and manufacture electronic and optical components and modules used in network equipment and mobile devices. The component providers require test and measurement products to verify that the performance of their components and modules meets the specifications of their customers.
Communications service providers require reliable data center and network equipment that enables new service offerings and allows their networks to operate with ever‑increasing capacities. To achieve this, communications service providers require a range of sophisticated test instruments and systems to ensure conformance to communication standards and network requirements and to evaluate network performance.
Aerospace, Defense and Government Market
We market our electronic design and test solutions to manufacturers and research laboratories within the aerospace and defense industries. This market includes commercial and government customers and their contracted suppliers. Electronic warfare, digital transformation and modernization of satellites, radars and surveillance systems worldwide are the drivers of test demand within the aerospace and defense market.
Government customers include departments or ministries of defense and related agencies around the world. Prime contractors, sub-contractors and component manufacturers support the government customers by providing design and manufacturing capabilities for a variety of programs. Commercial customers include aerospace and satellite equipment manufacturers and related component suppliers.
Customers use our electronic design and test solutions to develop and manufacture a wide variety of electronic components and systems used in aerospace and defense industries, including commercial and military aircraft, space, satellite, electronic warfare, radar, signal monitoring and public safety. Customers test the electrical parameters of a broad spectrum of components and assemblies and final products and often require large systems containing multiple electronic instruments.
Communications Solutions Group Solutions
Our software-driven electronic design and test solutions include software design tools, software-driven RF and microwave (“uW”) instruments, digital instruments and various other general purpose test instruments and targeted test solutions. Our technical breadth and expertise enables leading-edge solutions across commercial and government communications.
Electronic Design Automation (EDA) Software
Our EDA software models, simulates and analyzes product designs at the circuit and system levels, across RF/uW, high-speed digital, power electronics and semiconductor markets. R&D engineers use the software to predict the behavior of designs prior to building a prototype. They identify and correct issues with the design and optimize performance in a virtual environment, thus reducing the number of design iterations, reducing both time to market and cost.
RF and Microwave Solutions
Our software-driven RF and microwave test solutions and related software tools are used mainly in commercial, wireless and aerospace and defense applications. These solutions are required for the design and production of wireless network products, communications links, mobile devices and base stations. RF and microwave test instruments include signal analyzers, signal generators, network analyzers, network emulation tools and power meters. Our measurement application software is an integrated extension of our hardware solutions and enables a wide range of measurement capability used across all end markets to design and manufacture next-generation electronic components and products. Software tools are used to design and test the software portion of wireless devices and test the performance of networks.
Digital Solutions
Our software-driven digital test solutions are used by research and development engineers across a broad range of customers to validate the function and performance of their digital product and system designs. These designs include a wide range of products
8
from simple digital control circuits to complex high-speed systems such as computer servers. The test solutions offered include oscilloscopes, logic and serial protocol analyzers, logic‑signal sources, arbitrary waveform generators and bit error rate testers. Our customers also use our high‑frequency EDA software tools to model signal integrity problems in digital design applications as digital speeds continue to increase.
Other Measurement Solutions
Our suite of fiber optic test solutions measures and analyzes a wide variety of critical optical and electrical parameters in fiber optic networks and their components. Components that can be tested with our solutions include source lasers, optical amplifiers, filters and other passive components. Test solutions include optical modulation analyzers, optical component analyzers, optical power meters and optical laser source solutions.
Service Solutions
Our services solutions include repair, calibration and consulting services, and resale of refurbished used Keysight equipment. Customer demand is fulfilled by trained technicians and engineers through regional service centers, located in close proximity to customers at more than 70 Keysight service locations in 34 countries. Our global presence, with localized service proximity, is an important factor in sustaining our customers’ equipment uptime and utilization requirements. In addition to providing repair and calibration support for Keysight equipment, we repair and calibrate non-Keysight equipment. We also provide industry-specific services to deliver complete Keysight solutions and help customers reduce their total cost of ownership for their design and test equipment. Services solutions include the following general types of solutions and services:
• | Accredited Product Support Services. Comprehensive support services that include repair, parts, and accredited calibrations of Keysight and non-Keysight test equipment. |
• | Professional Services. Training and engineering services to optimize equipment adoption, utilization, and design and test processes. |
• | KeysightCare. Beyond the basic warranty, KeysightCare is a for-pay service that provides dedicated, proactive support through a single point of contact for instruments, software, and solutions. |
• | Re-manufactured Equipment. Refurbished used equipment, including Keysight Premium Used, that ensures the same high quality as our new equipment. |
Communications Solutions Group Customers
Our customers include commercial companies and government agencies around the world. We have customers across the product lifecycle that design, develop, manufacture, install and monitor a variety of commercial and government communications equipment. Commercial customers include original equipment and contract manufacturers of chipsets, wireless devices, network equipment, electronic components and semiconductors as well as network service providers that implement, maintain and manage communication networks and services. Other communications customers include defense contractors and sub-contractors. Government customers include departments or ministries of defense, government agencies and related research institutes. Our customers use our solutions to conduct research and development to manufacture, and to install and maintain radio frequency, microwave frequency, digital, semiconductor and optical products and systems.
No single customer represented 10 percent or more of the group's net revenue.
Communications Solutions Group Competition
The market for electronic design and test solutions is highly competitive across our targeted markets. In the commercial communications market, our primary competitors are Rohde & Schwarz GmbH & Co. KG, Anritsu Corporation, Fortive Corporation, Teledyne Technologies, National Instruments Corporation, Teradyne, Inc. and VIAVI Solutions Inc. In the aerospace, defense and government market, our primary competitors are Rohde & Schwarz GmbH & Co. KG, Teledyne Technologies, Fortive Corporation and VIAVI Solutions Inc.
We offer complete solutions that include a wide range of products, related software and services that compete primarily on the basis of differentiated capability, first-to-market leading-edge technology, product quality and long-term value to our customers.
9
Electronic Industrial Solutions Group
The Electronic Industrial Solutions Group provides test and measurement solutions and related services across a broad set of electronic industrial end markets, focusing on high-value applications in the automotive and energy industry and measurement solutions for consumer electronics, education, general electronics design and manufacturing, and semiconductor design and manufacturing. The group provides electronic design and test software, instruments and systems and related services used in the simulation, design, validation, manufacturing, installation and optimization of electronic equipment. This business generated revenue of $1,135 million in fiscal 2019, $1,071 million in fiscal 2018 and $929 million in fiscal 2017.
Electronic Industrial Solutions Group Markets
We market our electronic design and test solutions to customers incorporating significant electronic content in their products across a broad set of electronic industrial end markets. These customers design, develop and manufacture a wide range of products, including those produced in high volumes, such as computers, computer peripherals, electronic components, consumer electronics, enterprise servers, storage networks and automotive electronics. The components, printed circuit assemblies and functional devices for these products may be designed, developed and manufactured by electronic components companies, original equipment manufacturers ("OEMs") or contract manufacturers, all of whom are potential customers for Keysight. Other industrial applications for our electronic industrial solutions include power, energy, automotive, medical, and university research and teaching labs.
Customers use our test solutions in developing, manufacturing and operating a wide variety of electronic components and systems. Customer requirements include testing the electrical parameters of digital, radio frequency, and microwave frequency semiconductors, components and assemblies; testing multiple parameters of the printed circuit boards used in almost every electronic device; testing of the final product; and testing of systems containing multiple electronic devices.
Electronic Industrial Solutions Group Solutions
Our software-driven electronic industrial solutions include design and design verification tools, a broad range of electronic test and measurement instruments, comprehensive manufacturing test systems, material analysis and education solutions to teach and train the next generation of engineers and scientists and solutions to enable scientific discovery in university research labs in a variety of fields.
Design tools include design-for-test (“DFT”) software for printed circuit assemblies and automotive radar, and EDA software for the design and simulation of wireless and wired communication links in industrial, automotive and power semiconductor devices.
Design verification solutions include physical signal characterization and protocol compliance, notably for those communication links used in industrial, energy and automotive devices and products. Major automotive and battery manufacturers are electrifying transportation and changing how electrical energy is generated, stored and controlled. Examples of verification solutions include those that help design engineers qualify and characterize power semiconductor devices, photo-voltaic/electrical vehicle/storage inverters, AC power analysis, DC battery cells/modules and automotive body/safety/engine electronic modules. High-precision and higher-bandwidth power analysis products address the increased power efficiency required with the proliferation of battery-powered and energy-efficient devices. We also provide the solutions required to test the components in the electrified drive train.
We offer a broad portfolio of general-purpose precision measurement solutions in the market, from handheld test tools to bench measurement instruments and measurement solutions. Many of these products are designed for demanding industrial environments and provide high performance capabilities and include Digital Multimeters, Function Generators, Frequency Counters, Data Acquisition Systems, Audio Analyzers, LCR Meters, Thermal Imagers, precision SMU (“Source Measure Units”), ultra-high precision device current analyzers, test executive software platforms and a wide variety of power supplies ranging from bench to highly scalable AC/DC modular supplies and electronically programmable loads. These instruments are increasingly integrated with solution-specific software that enables our customers to dramatically accelerate and improve the effectiveness of their product design, design validation, manufacturing and support activities. Our solutions also support fundamental measurement science for voltage, current, frequency, signal pulse width, sub-nanometer distance and other complex electronic measurements. This enables industry and government customers to measure fundamental electrical parameters.
Comprehensive manufacturing test systems include: printed-circuit-board-assembly testers that ensure complex boards and components are assembled properly, Integrated Circuit (“IC”) parametric testers that ensure semiconductor wafers are processed consistently with high-precision and sub-nano-meter positioning sub-assemblies for semiconductor wafer manufacturing. We provide effective and efficient manufacturing test solutions for complex transportation electronic control/safety systems that include radar, autonomous driving capability, and state-of-the-art wired and wireless components that enable advanced communications
10
capability. Our flexible and scalable manufacturing systems offer the best-in-class value to enable our manufacturing customers to deliver outstanding yield, quality and productivity resulting in lower overall cost of test.
Our highly regarded test and measurement products and software have a long history of broad adoption and use in universities and research centers that teach the next generation of engineers and scientists and enable basic research to flourish. Increasing global competition in education is driving the need for efficient and timely education solutions, and we are making those available in areas such as the Internet of Things ("IoT"), 5G communications technology and smart devices.
Service Solutions
Our services solutions include repair, calibration and consulting services, and resale of refurbished used Keysight equipment. Customer demand is fulfilled by trained technicians and engineers through regional service centers, located in close proximity to customers at more than 70 Keysight service locations in 34 countries. Our global presence, with localized service proximity, is an important factor in sustaining our customers’ equipment uptime and utilization requirements. In addition to providing repair and calibration support for Keysight equipment, we repair and calibrate non-Keysight equipment. We also provide industry-specific services to deliver complete Keysight solutions and help customers reduce their total cost of ownership for their design and test equipment. Services solutions include the following general types of solutions and services:
• | Accredited Product Support Services. Comprehensive support services that include repair, parts, and accredited calibrations of Keysight and non-Keysight test equipment. |
• | Professional Services. Training and engineering services to optimize equipment adoption, utilization, and design and test processes. |
• | KeysightCare. Beyond the basic warranty, KeysightCare is a for pay service which provides dedicated, proactive support through a single point of contact for instruments, software, and solutions. |
• | Re-manufactured Equipment. Refurbished used equipment, including Keysight Premium Used, which ensures the same high quality as our new equipment. |
Electronic Industrial Solutions Group Customers
Our customers include semiconductor and component manufacturers, original equipment manufacturers and contract manufacturers of electronic industrial products and services. These customers use our solutions to perform research and development and to design, manufacture and support their products and services. Customer products include semiconductor equipment and devices, printed circuit assemblies, electronic modules and systems that go into a wide range of electronic industrial products such as electric/autonomous vehicles, connected consumer and industrial devices and digital healthcare in the IoT domain. Our customers range from the largest multi-national global companies to the smallest start-ups and include universities and government agencies around the world. Our automotive customers use Keysight's solutions to develop, test and manufacture the electrified drive train, battery management systems, e-mobility and advanced vehicle-to-everything ("V2X") communications that will enable electric and hybrid-electric vehicles to be fully autonomous.
In order to address the growing needs of customers involved in the design and development of the latest automotive electronic technologies, we have opened four automotive application centers in Boeblingen, Germany; Novi, Michigan, United States; Shanghai, China; and Nagoya, Japan. These centers enable us to collaborate with and serve customers on a local basis and in close proximity to the world’s major automotive development ecosystems. They include electronic test and measurement labs, technical experts, and state-of-the-art design and test software and hardware, as well as a customer training facility for hands-on workshops and seminars. These centers address the next-generation technology needs of the automotive industry, including OEMs, electronic components suppliers, semiconductor chipset manufacturers, battery and charging infrastructure providers and compliance labs, where we provide solutions across the entire ecosystem for the connected “smart” vehicle.
No single customer represented 10 percent or more of the group's net revenue.
Electronic Industrial Solutions Group Competition
The market for electronic industrial design and test solutions is highly competitive across our targeted markets. In the electronic industrial test market, our primary competitors are Rohde & Schwarz GmbH & Co. KG, Ametek, Inc., Fortive Corporation,Teledyne Technologies, National Instruments Corporation, and Teradyne, Inc.
Our electronic industrial design and test solutions offer a wide range of products and related software, and these compete primarily on the basis of differentiated capability, first-to-market leading edge technology, product quality and long-term value to our customers.
11
Ixia Solutions Group
The Ixia Solutions Group helps customers design, validate and optimize the performance and security resilience of their networks and associated components and applications both pre and post go live. Network test, network visibility and security solutions help organizations and their customers strengthen their physical and virtual networks. The group’s solutions consist of software applications and services, including warranty and maintenance offerings, and high-performance hardware platforms. This business generated revenue of $489 million in 2019, $451 million in fiscal 2018 and $256 million in fiscal 2017. The Ixia Solutions Group revenues in fiscal 2019 and 2018 are not comparable with fiscal 2017, which only includes activity from the date of acquisition, April 18, 2017, through October 31, 2017.
Ixia Solutions Group Markets
Our Ixia Solutions Group serves the network test and network visibility markets.
Network Test
We market our network test solutions and services to network equipment manufacturers, service providers, enterprises and governments worldwide. Our network test customers use our solutions to evaluate the performance of their equipment and networks primarily during the design, manufacturing and pre-deployment stages.
We offer a comprehensive suite of solutions consisting of software applications in conjunction with our network test hardware platforms that provide customers with the ability to perform a broad range of testing for layers 2-7 of the network stack. These solutions measure and analyze the performance, functionality, interoperability, service quality and conformance of network equipment and networks as well as applications and services that run on these networks. Our technology-specific application test solutions are targeted at a wide range of critical performance and conformance requirements across various protocols, interfaces and types of devices. These include data center, routing and switching, Software Defined Networking ("SDN"), security, encryption and applications, services like voice, video and wireless technologies including 4G and 5G as well as Wi-Fi. Our data center test solution includes the world’s first 400 Gigabit Ethernet test products that enable the roll-out of next generation data centers. For security, our security solutions enable the testing of new technologies like Transport Layer Security as well as providing a comprehensive suite of tools to test and detect malware and Distributed Denial of Service. Our wireless test solutions include 5G and 4G as well as IoT and Wi-Fi 802.11ax. These test solutions are both hardware-based and virtual. For the hardware-based solutions, our purpose-built hardware allows us to provide the industry’s best precision, performance and scale. Our virtual solutions offer a comprehensive feature set as well as the flexibility to operate in various virtual environments.
Network Visibility
We market our network visibility solutions to network equipment manufacturers, service providers, enterprises and governments worldwide. Our network visibility solutions improve the way our customers manage their data centers, save valuable IT time and maximize return on IT investments.
Keysight's network visibility solutions provide real-time, end-to-end visibility, insight and security into physical, virtual, SDN and Network Functions Virtualization networks, delivering the control, coverage, intelligence and performance customers need in a seamless fashion to protect and improve crucial networking, data center and cloud business assets. Our comprehensive network visibility platform ranges from network test access points to high-density, high-availability, cutting edge solutions designed for large and complex data centers and networks. Our proprietary software includes patented filtering and content handling technology that ensures each monitoring tool gets exactly the right data needed for analysis, all powered by an easy to use, drag-and-drop management system. Our advanced processing technologies enable additional intelligence and functionality, including de-duplication, packet slicing, time-stamping, real-time application and threat data, network flow, and session aware mobility load balancing.
Ixia Solutions Group Customers
Our customers include NEMs, service providers, enterprises and governments. These customers seek to optimize networks and data centers in order to accelerate, secure and scale the delivery of their services. NEMs, including chipset providers, deliver voice, video, and data and service infrastructure equipment to customer network operators, service providers and network users. Such users require high standards of functionality, performance, security and reliability and must ensure the quality of their products during development and manufacturing (prior to deployment). Service providers seek to deliver a growing variety of high quality, advanced network services ranging from traditional telecommunications and internet services to social networking, cloud storage and entertainment streaming. Enterprise and government organizations depend on their networks and data centers to get business done, and they devote significant resources to ensure applications and services run optimally and securely. These enterprise and
12
government customers rely on our solutions to help evaluate equipment during selection, optimize and harden their network designs in labs prior to roll-out, and once rolled out, continuously monitor the production network to ensure optimal performance and security of the contents flowing through it. Our security solutions are also used by major organizations to address the new generation of cyber warfare and defend against massive cyber-attacks.
No single customer represented 10 percent or more of the group’s net revenue.
Ixia Solutions Group Competition
The market for providing network test and monitoring systems is highly competitive. We currently compete with network test and monitoring solution vendors such as Spirent Communications, Gigamon and NetScout. We also compete either directly or indirectly with large Ethernet switch vendors and network management, analysis, compliance and test tool vendors that offer point solutions that address a subset of the issues that we solve. Additionally, some of our significant customers have developed or may develop competitive in-house products for their own use or for sale to others.
Within our network test and visibility solutions, we offer a wide range of products and related software. We compete with these solutions primarily on the basis of differentiated capability, first-to-market leading-edge technology, product quality and long-term value to our customers.
The following discussions of Research and Development, Sales, Manufacturing, Marketing, Backlog, Intellectual Property, Materials, Environmental and Acquisition of Material Assets include information common to each of our businesses.
Research and Development
We are committed to investing in research and development ("R&D") and have focused our development efforts on key strategic opportunities in order to align our business with available markets and position the company for growth. Our R&D efforts focus on development of first-to-market solutions with differentiated technology to support new software and hardware product introductions and improvements to existing software and hardware products to provide complete customer solutions aligned to our industry. We conduct R&D in four principal areas: enabling technologies, system design, simulation and measurement. Our R&D seeks to improve on various technical competencies in software and hardware systems, electronics and solution delivery. R&D investments are focused on delivering technology and first-to-market solutions, as well as building a strong foundation for future solutions over a longer time horizon. Our primary technology development centers are in California, Colorado, Georgia and Texas in the United States and in China, Finland, Germany, India, Italy, Japan, Malaysia, Romania, Singapore, Spain and U.K. We anticipate that we will continue to have significant R&D expenditures in order to maintain our competitive position with a continuous flow of innovative, high-quality software, customer solutions, products and services.
Sales
Our direct sales force focuses on addressing the needs of our global and regional customers by selling Keysight products, systems, solutions and services. Keysight’s direct sales force consists of sales and application engineers who have in‑depth knowledge of the customers’ business and technology needs. Our direct sellers concentrate on providing more complex, end-to-end solutions where customers require strategic consultation. Our application engineers bring deep solution and application expertise to provide a combination of consulting, systems integration and software engineering services that span all stages of the sale, deployment and support of our complex systems and solutions. Our direct sales organizations serve customers globally across the commercial communications, aerospace, defense and government, automotive and energy, semiconductor, general electronics, network test and network visibility markets.
To complement our direct sales force, we have an extensive network of channel partners around the world. These channel partners include resellers, manufacturer’s representatives and distributors. They serve thousands of customers across a wide range of end-user markets. They are expected to provide the same level of service and support as our direct sales force for the products they sell and generate new sales opportunities to extend our reach. Electronic commerce and tele‑sales channels are also in place for transactional, lower-touch sales.
For certain verticals such as network monitoring and performance management, our go-to-market solution strategy is based on strategic relationships with technical partners to provide the customer with a complete solution. In these cases, we work with technical partners in two main ways: (i) through customer referrals and recommendations and (ii) through automation integration/interoperability that provides a differentiated solution for our customers.
13
Manufacturing
To maximize our productivity and our ability to respond to market conditions, we have significant in-house manufacturing capabilities that are supplemented by contract manufacturers. Our in-house manufacturing efforts are focused on the highest value added, more complex and highly technical aspects of production, and we use contract manufacturers for assembly, printed circuit board production, metal die-casting and plastic moulding. Our largest manufacturing facility in Penang, Malaysia focuses on the final assembly of our most sophisticated instruments and, on final tuning, calibration and test of instruments across the broader portfolio. We also operate three technology centers in Santa Rosa, California; Colorado Springs, Colorado; and Boeblingen, Germany that collectively provide key components and sub‑systems for our instruments, including microwave monolithic integrated circuits, thick and thin film circuits, optical components, high-speed probes and precision machining. Our technology centers provide a competitive advantage by developing and manufacturing differentiated technology components with performance levels that are not available commercially.
We have manufacturing facilities in California and Colorado in the United States. Outside of the United States, we have manufacturing centralized in Malaysia with other manufacturing facilities in China, Germany, Japan and Finland.
We generally manufacture products after we have received firm orders for delivery and do not generally hold large stocks of finished inventory.
Marketing
We have several ongoing programs to support the sale and distribution of our solutions and to inform existing and potential customers, partners and distributors about the capabilities and benefits of our expansive solutions and services portfolio. We are modernizing our marketing platforms to increase focus on lead generation for top growth segments, including broad territory customers. We continue to invest in improving the Keysight brand recognition in strategic industries, such as automotive and commercial communications, and geographies, including the greater San Francisco area, Germany, Shanghai, and Nagoya. Our marketing efforts promote the Keysight business through participating in industry trade shows and technical conferences, sponsoring technical seminars and webinars that highlight our solutions, and advertising in digital media publications and physical locations. Additionally, we write and distribute various forms of marketing collateral including brochures, white papers, application notes, solutions briefs and articles for online and print journals. Finally, we communicate to our existing and potential customers through our corporate website and various social media outlets, such as LinkedIn, Facebook, Twitter and our corporate blog.
Backlog
Backlog represents the amount of revenue expected from orders that have already been booked, including orders for goods and services that have not been delivered to customers, orders invoiced but not yet recognized as revenue, and orders for goods that were shipped but not invoiced, awaiting acceptance by customers and/or completion of a commitment to a customer.
At October 31, 2019, our unfilled backlog was approximately $1,380 million, as compared to approximately $1,311 million at October 31, 2018. Our unfilled backlog as of October 31, 2019 reflects the impact of the deferred revenue adjustment related to the adoption of Accounting Standards Update 2014-09, Revenue From Contracts With Customers ("ASC 606"). See Note 2, "New Accounting Pronouncements," to the consolidated financial statements for additional information. Consistent with our strategy, we are seeing an increase in solution sales, which have a longer order-to-revenue conversion cycle; however, we expect that the majority of unfilled backlog will be recognized as revenue within six months. While backlog on any particular date can be an indicator of short-term revenue performance, it is not necessarily a reliable indicator of medium or long-term revenue performance.
Intellectual Property
We generate patent and other intellectual property rights covering significant inventions and other innovations in order to create a competitive advantage. Although we believe that our licenses, patents and other intellectual property rights have value, in general no single license, patent or other intellectual property right is in itself material, other than the Keysight mark.
Materials
Our manufacturing operations employ a wide variety of semiconductors, electromechanical components and assemblies and raw materials, such as plastic resins and sheet metal. We purchase materials from thousands of suppliers on a global basis. Some of the parts that require custom design work are not readily available from alternate suppliers due to their unique design or the length of time necessary for design work. Our long-term relationships with suppliers allow us to proactively manage technology road maps and product discontinuance plans and monitor their financial health. To address the potential disruption in, and other risks related to, our supply chain, we use a number of techniques, including qualifying multiple sources of supply and redesign of
14
solutions for alternative components. In addition, while we generally attempt to keep our inventory at minimal levels, we do purchase incremental inventory as circumstances warrant to protect the supply chain. For a further discussion of risks related to the materials and components required for our operations, please refer to “Item 1A. Risk Factors.”
Environmental
Our R&D, manufacturing and distribution operations involve the use of hazardous substances and are regulated under international, federal, state and local laws governing health and safety and the environment. We apply strict standards for protection of the environment and occupational health and safety to sites inside and outside the United States, even if not subject to regulation imposed by foreign governments. We believe that our properties and operations at our facilities comply in all material respects with applicable environmental laws and occupational health and safety laws. However, the risk of environmental liabilities cannot be completely eliminated, and there can be no assurance that the application of environmental and health and safety laws will not require us to incur significant expenditures. We are also regulated under a number of international, federal, state and local laws regarding recycling, product packaging and product content requirements. The environmental, product content/disposal and recycling laws are gradually becoming more stringent and may cause us to incur significant expenditures in the future.
Some of our properties are undergoing remediation by HP Inc. ("HP") for subsurface contaminations that were known at the time of Agilent’s separation from HP in 1999. In connection with Agilent’s separation from HP, HP and Agilent entered into an agreement pursuant to which HP agreed to retain the liability for this subsurface contamination, perform the required remediation and indemnify Agilent with respect to claims arising out of that contamination. Agilent has assigned its rights and obligations under this agreement to Keysight in respect of facilities transferred to Keysight in our separation from Agilent on November 1, 2014 (the "Separation"). As a result, HP has access to a limited number of our properties to perform remediation. Although HP agreed to minimize interference with on-site operations at such properties, remediation activities and subsurface contamination may require us to incur unreimbursed costs and could harm on-site operations and the future use and value of the properties. In connection with the Separation, Agilent will indemnify us directly for any liabilities related thereto. We cannot be sure that HP will continue to fulfill its remediation obligations or that Agilent will continue to fulfill its indemnification obligations.
In connection with the Separation, Agilent also agreed to indemnify us for any liability associated with contamination from past operations at all properties transferred from Agilent to us. We cannot be sure that Agilent will fulfill its indemnification obligations.
We maintain a comprehensive environmental site liability insurance policy that may cover certain clean-up costs or legal claims related to environmental contamination. This policy covers specified active, inactive and divested locations.
Acquisition of Material Assets
On April 18, 2017, pursuant to the terms of an Agreement and Plan of Merger dated January 30, 2017, between Keysight and Ixia (the "Merger Agreement"), we acquired all of the outstanding common stock of Ixia for $1,622 million, net of $72 million of cash acquired, pursuant to an exchange offer for $19.65 per share (the "Merger Consideration").
15
Executive Officers of the Registrant
The names of our executive officers and their ages, titles and biographies as of December 1, 2019 appear below:
Ronald S. Nersesian, 60, has served as President and Chief Executive Officer of Keysight since December 2013 and, prior to the Separation, served as Executive Vice President of Agilent. Mr. Nersesian served as President of Agilent from November 2012 to September 2013 and as Chief Operating Officer, Agilent from November 2011 to September 2013. From November 2011 to November 2012, Mr. Nersesian served as Agilent’s Executive Vice President and Chief Operating Officer. Mr. Nersesian serves on the Board of Directors of Trimble Inc. Mr. Nersesian has served as a Director on our Board of Directors since our separation from Agilent, and as Chairman of our Board of Directors since November 2019.
Neil Dougherty, 50, has served as Senior Vice President and Chief Financial Officer of Keysight since December 2013 and, prior to the Separation, served as Vice President and Treasurer of Agilent since 2012. He served as Senior Director in Agilent’s Corporate Development Group from 2010 to 2012, and from 2006 to 2010, he served as Agilent’s Assistant Treasurer.
Jay Alexander, 56, has served as Senior Vice President and Chief Technology Officer of Keysight since May 2014. Prior to the Separation, he served as Vice President and General Manager for the Oscilloscope and Protocol Division of Agilent since October 2009.
Satish Dhanasekaran, 47, has served as Senior Vice President and President of the Communications Solutions Group since July 2017. Previously, he served as Keysight's Vice President and General Manager, Wireless Devices and Operators business segment, as well as a variety of customer-facing leadership positions.
Ingrid Estrada, 55, has served as Senior Vice President, Chief People & Administrative Officer and Chief of Staff since August 2017. Previously, she served as Keysight’s Senior Vice President, Human Resources from December 2013 until August 2017. Prior to the Separation, she served as Vice President and General Manager of Global Sourcing of Agilent from 2011.
Soon Chai Gooi, 58, has served as Senior Vice President and President of the Electronic Industrial Solutions Group since November 2015. From December 2013 to November 2015, Mr. Gooi served as Senior Vice President of Order Fulfillment and Infrastructure for Keysight. Prior to the Separation, Mr. Gooi served as President, from November 2012 to September 2013, and as Senior Vice President, from December 2011 to November 2012, of Agilent's Order Fulfillment and Supply Chain.
Jeffrey Li, 50, has served as Senior Vice President, General Counsel, and Secretary since July 2019. Before that, Mr. Li served as Vice President, Assistant General Counsel, and Assistant Secretary, and prior to the Separation, as Senior Counsel of Agilent since 2011.
John Page, 55, has served as Senior Vice President and President of Global Services since November 2015 and most recently served as Vice President of business finance of Keysight from February 2014 to November 2015. Prior to joining Keysight, Mr. Page served as the Chief Financial Officer of Nanosys, Inc. from 2010 to 2014.
John Skinner, 57, has served as Vice President, Corporate Controller and Principal Accounting Officer of Keysight since December 2013, and prior to the Separation, Mr. Skinner served as Vice President, Agilent and Controller of Global Infrastructure and Enterprise Financial Planning and Analysis from April 2012 to December 2013.
Mark Wallace, 54, has served as Senior Vice President of Worldwide Sales since November 2016. From November 2014 to November 2016, Mr. Wallace served as Vice President and General Manager of Americas Field Operations and, prior to the Separation, as Americas Field Operations Vice President of Agilent's Electronic Measurement Group since November 2011.
Investor Information
We are subject to the informational requirements of the Securities Exchange Act of 1934 (“Exchange Act”). Therefore, we file periodic reports, proxy statements and other information with the Securities and Exchange Commission (“SEC”). The SEC maintains an internet site (http://www.sec.gov) that contains reports, proxy and information statements and other information regarding issuers.
You can access financial and other information at our Investor Relations website at www.investor.keysight.com. We make available, free of charge, copies of our annual report on Form 10-K, current reports on Form 8-K and amendments to those reports filed or furnished pursuant to Section 13(a) or 15(d) of the Exchange Act as soon as reasonably practicable after filing such material electronically or otherwise furnishing it to the SEC.
Our Corporate Governance Guidelines, the charters of our Audit and Finance Committee, Compensation Committee, Nominating and Corporate Governance Committee, Executive Committee as well as our Standards of Business Conduct are
16
available on our website at www.investor.keysight.com under “Corporate Governance.” These items are also available in print to any stockholder in the United States and Canada who requests them by calling (800) 829-4444. This information is also available by writing to the company at the address on the cover of this Annual Report on Form 10-K.
Item 1A. Risk Factors
Risks, Uncertainties and Other Factors That May Affect Future Results
Risks Related to Our Business
Failure to introduce successful new solutions and services in a timely manner to address increased competition, rapid technological changes, and changing industry standards could result in our solutions and services becoming obsolete.
We generally sell our solutions in industries that are characterized by increased competition through frequent new solution and service introductions, rapid technological changes and changing industry standards. In addition, many of the markets in which we operate are seasonal and cyclical. Without the timely introduction of new solutions, services and enhancements, our solutions and services will become technologically obsolete over time, in which case our revenue and operating results would suffer. Our ability to offer new solutions and services and to deploy them in a timely manner depend on several factors, including but not limited to our ability to:
• | properly identify customer needs; |
• | innovate and develop new technologies, services and applications; |
• | successfully commercialize new technologies in a timely manner; |
• | manufacture and deliver our solutions in sufficient volumes and on time; |
• | differentiate our offerings from our competitors' offerings; |
• | price our solutions competitively; |
• | anticipate our competitors' development of new solutions, services or technological innovations; and |
• | control product quality in our manufacturing process. |
Our future operating results may fluctuate significantly if our investments in innovative technologies are not as profitable as we anticipate.
On a regular basis, we review the existing technologies available in the market and identify strategic new technologies to develop and invest in. We are currently devoting significant resources to the 5G technology and other new technologies in the automotive, battery, Internet of Things, and mobile industries. We are investing in R&D, developing relationships with customers and suppliers, and re-directing our corporate and operational resources to grow within these innovative technologies. Our income could be harmed if we fail to gain sufficient market share, if demand for our solutions is lower than we expect, or if our income related to the innovative technologies is lower than we anticipate. For example, when the 5G standards are published, we may not be able to produce a satisfactory return on investment if our strategic vision and the resources that we are spending on developing our presence in the 5G technology industry turn out to be misaligned with such standards. We provide solutions for the design, development, and manufacturing stages of our customers’ workflow. Our customers who currently use our solutions in one stage of their workflow may not use our solutions in other aspects of their manufacturing process.
Uncertainty in general economic conditions may adversely affect our operating results and financial condition.
Our business is sensitive to negative changes in general economic conditions, both inside and outside the United States. Global and regional economic uncertainty or depression may impact our business, resulting in:
• | reduced demand for our solutions, delays in the shipment of orders or increases in order cancellations; |
• | increased risk of excess and obsolete inventories; |
• | increased price pressure for our solutions and services; and |
• | greater risk of impairment to the value, and a detriment to the liquidity, of our future investment portfolio. |
17
In addition, global and regional macroeconomic developments, such as increased unemployment, decreased income, reduced access to credit, volatility in capital markets, decreased liquidity, uncertain or destabilizing national election results in the U.S., Europe, and Asia, and negative changes or volatility in general economic conditions in the U.S., Europe, and Asia could negatively affect our ability to conduct business in those territories. Financial difficulties experienced by our suppliers and customers, including distributors, due to economic volatility or negative changes could result in product delays and inventory issues. Economic risks related to accounts receivable could result in delays in collection and greater bad debt expense.
Our operating results and financial condition could be harmed if the markets into which we sell our solutions decline or do not grow as anticipated.
Visibility into our markets is limited. Our quarterly sales and operating results are highly dependent on the volume and timing of technology-related spending and orders received during the fiscal quarter, which are difficult to forecast and may be cancelled by our customers. In addition, our revenues and earnings forecasts for future fiscal quarters are often based on the expected seasonality or cyclicality of our markets. However, the markets we serve do not always experience the seasonality or cyclicality that we expect. Any decline in our customers' markets would likely result in a reduction in demand for our solutions and services. The broader semiconductor market is one of the drivers for our business, and therefore, a decrease in the semiconductor market could harm our business. Also, if our customers' markets decline, we may not be able to collect on outstanding amounts due to us. Such declines could harm our financial position, results of operations, cash flows and stock price, and could limit our profitability. Also, in such an environment, pricing pressures could intensify. Since a significant portion of our operating expenses is relatively fixed in nature due to sales, R&D and manufacturing costs, if we were unable to respond quickly enough, these pricing pressures could further reduce our operating margins.
Failure to adjust our purchases due to changing market conditions or failure to estimate our customers' demand could adversely affect our income.
Our income could be harmed if we are unable to adjust our purchases to market fluctuations, including those caused by the seasonal or cyclical nature of the markets in which we operate. The sale of our solutions and services are dependent, to a large degree, on customers whose industries are subject to seasonal or cyclical trends in the demand for their products. For example, the consumer electronics market is particularly volatile, making demand difficult to anticipate. During a market upturn, we may not be able to purchase sufficient supplies or components to meet increasing product demand, which could materially affect our results. In the past, we have seen a shortage of parts for some of our products. In addition, some of the parts that require custom design are not readily available from alternate suppliers due to their unique design or the length of time necessary for design work. Should a supplier cease manufacturing such a component, we would be forced to re-engineer our solution. In addition to discontinuing parts, suppliers may also extend lead times, limit supplies or increase prices due to capacity constraints or other factors. In order to secure components for the production of products, we may continue to enter into non-cancellable purchase commitments with vendors, or at times make advance payments to suppliers, which could impact our ability to adjust our inventory to declining market demands. Prior commitments of this type have resulted in an excess of parts when demand for electronic products has decreased. If demand for our solutions is less than we expect, we may experience additional excess and obsolete inventories and be forced to incur additional charges.
Economic and political policies favoring national interests could adversely affect our results of operations.
Nationalistic economic policies and political trends in the United States, the United Kingdom, the European Union, Singapore, Malaysia and China among other countries, such as opposition to globalization and free trade, sanctions or trade restrictions, withdrawal from or re-negotiation of global trade agreements, tax policies that favor domestic industries and interests, the anticipated exit of the United Kingdom from the European Union (known as Brexit), the distancing or potential exit of other countries from the European Union, and other similar actions may result in increased transaction costs, reduced ability to hire employees, reduced access to supplies and materials, reduced demand or access to customers in international markets, and inability to conduct our operations as they have been conducted historically. Each of these factors may adversely affect our business.
International trade disputes and increased tariffs between the United States and such jurisdictions could substantially change our expectations and ability to operate in such jurisdictions as we have done historically. Many of our suppliers, vendors, customers, partners, and other entities with whom we do business have strong ties to doing business in China. Their ability to supply materials to us, buy products or services from us, or otherwise work with us is affected by their ability to do business in China. If the U.S.’s relationship with China deteriorates or results in trade disputes, trade protection measures, retaliatory actions, tariffs and increased barriers, policies that favor domestic industries, or increased import or export licensing requirements or restrictions, then our deployment of resources in jurisdictions affected by such measures could be misaligned and our operations may be adversely affected due to such changes in the economic and political ecosystem in which our suppliers, vendors, customers, partners, and other entities with whom we do business operate.
18
A decreased demand for our customers’ products or trade restrictions could adversely affect our results of operations.
Our business depends on our customers’ ability to manufacture, design, and sell their products in the marketplace. International trade disputes affecting our customers could adversely affect our business. Tariffs on imports to or from China could increase the cost of our customers’ components and raw materials, which could make our customers’ products and services more expensive and could reduce demand for our customers’ products. Protectionist and retaliatory trade measures by either China or the United States could limit our customers’ ability to sell their products and services and could reduce demand of our customers’ products. Our customers and other entities in our customer chain could decide to take actions in response to international trade disputes that we could not foresee. A decrease in demand or significant change in operations from our customers due to international trade disputes could adversely affect our operating results and financial condition.
In addition to the above, our customers and suppliers could become subject to U.S. export restrictions and sanctions, such as, being added to the U.S. Department of Commerce’s “Lists of Parties of Concern” and having U.S. export privileges denied or suspended. In the event that a customer or supplier of ours becomes subject to such sanctions, we will suspend our business with such customer or supplier. Because of the increasingly tense political and economic relationship between the United States and China, such sanctions could be imposed with little notice, which could leave us without an adequate alternative solution to compensate for our inability to continue to do business with such customer or supplier. Some of our suppliers and customers in the supply chain are working on unique solutions and products in the market, and it may be difficult if not impossible to replace them, especially with short notice. We cannot predict what impact future sanctions could have on our customers or suppliers, and therefore, our business. Any export restrictions or sanctions and any tariffs or other trade restriction imposed on our customers or suppliers could adversely affect our financial condition and business.
Economic, political, and other risks associated with international sales and operations could adversely affect our results of operations.
Because we sell our solutions worldwide, our business is subject to risks associated with doing business internationally. We anticipate that revenue from international operations will continue to represent a majority of our total revenue. However, there can be no assurances that our international sales will continue at existing levels or grow in accordance with our effort to increase foreign market penetration. In addition, many of our employees, contract manufacturers, suppliers, job functions and manufacturing facilities are located outside the United States. Accordingly, our future results could be harmed by a variety of factors, including but not limited to:
• | changes in a specific country's or region's political, economic or other conditions, including but not limited to changes that favor national interests and economic volatility; |
• | negative consequences from changes in tax laws; |
• | difficulty in protecting intellectual property; |
• | interruption to transportation flows for delivery of parts to us and finished goods to our customers; |
• | changes in foreign currency exchange rates; |
• | difficulty in staffing and managing foreign operations; |
• | local competition; |
• | differing labor regulations; |
• | unexpected changes in regulatory requirements; |
• | inadequate local infrastructure; |
• | potential incidences of corruption and fraudulent business practices; and |
• | volatile geopolitical turmoil, including popular uprisings, regional conflicts, terrorism, and war. |
We centralize most of our accounting processes at two locations: India and Malaysia. These processes include general accounting, inventory cost accounting, accounts payable and accounts receivables functions. If conditions change in those countries, it may adversely affect operations, including impairing our ability to pay our suppliers. Our results of operations, as well as our liquidity, may be adversely affected and possible delays may occur in reporting financial results.
19
Further, even if we are able to successfully manage the risks of international operations, our business may be adversely affected if our business partners are not able to successfully manage similar risks.
Dependence on contract manufacturing and outsourcing other portions of our supply chain may adversely affect our ability to bring solutions to market and damage our reputation. Dependence on outsourced information technology and other administrative functions may impair our ability to operate effectively.
As part of our efforts to streamline operations and to cut costs, we outsource aspects of our manufacturing processes and other functions and continue to evaluate additional outsourcing. If our contract manufacturers or other outsourcers fail to perform their obligations in a timely manner or at satisfactory quality levels, our ability to bring solutions to market and our reputation could suffer. For example, during a market upturn, our contract manufacturers may be unable to meet our demand requirements, which may preclude us from fulfilling our customers' orders on a timely basis. The ability of these manufacturers to perform is largely outside of our control. Additionally, changing or replacing our contract manufacturers or other outsourcees could cause disruptions or delays. In addition, we outsource significant portions of our information technology ("IT") and other administrative functions. Since IT is critical to our operations, any failure of our IT providers to perform could impair our ability to operate effectively. In addition to the risks outlined above, problems with manufacturing or IT outsourcing could result in lower revenues and unrealized efficiencies, and could impact our results of operations and stock price. Much of our outsourcing takes place in developing countries and, as a result, may be subject to geopolitical uncertainty.
Our operating results may suffer if our manufacturing capacity does not match the demand for our solutions.
Because we cannot immediately adapt our production capacity and related cost structures to rapidly changing market conditions, when demand does not meet our expectations, our manufacturing capacity will likely exceed our production requirements. During a general market upturn or an upturn in our business, we cannot increase our manufacturing capacity to meet product demand, we will not be able to fulfill orders in a timely manner, which could lead to order cancellations, contract breaches or indemnification obligations. This inability could materially and adversely limit our ability to improve our income, margin and operating results. By contrast, if, during an economic downturn, we had excess manufacturing capacity, then our fixed costs associated with excess manufacturing capacity would adversely affect our income, margins and operating results.
Key customers or large orders may expose us to additional business and legal risks that could have a material adverse impact on our operating results and financial condition.
Certain key customers have substantial purchasing power and leverage in negotiating contractual arrangements with us. These customers may demand contract terms that differ considerably from our standard terms and conditions. Large orders may also include severe contractual liabilities for us if we fail to provide the quantity and quality of product at the required delivery times. While we attempt to contractually limit our potential liability under such contracts, we may have to agree to some or all of these types of provisions to secure these orders and to continue to grow our business. Such actions expose us to significant additional risks, which could result in a material adverse impact on our operating results and financial condition.
Industry consolidation and consolidation among our customer base may lead to increased competition and may harm our operating results.
There is potential for industry consolidation in our markets. As companies attempt to strengthen or hold their market positions in an evolving industry, companies could be acquired or may be unable to continue operations. Companies that are strategic alliance partners in some areas of our business may acquire or form alliances with our competitors, thereby reducing their business with us. We believe that industry consolidation may result in stronger competitors and could lead to more variability in our operating results and could have a material adverse effect on our business, operating results, and financial condition. Furthermore, particularly in the communications market, rapid consolidation would lead to fewer customers, with the effect that loss of a major customer could have a material impact on results not anticipated in a customer marketplace composed of more numerous participants.
Additionally, if there is consolidation among our customer base, our customers may be able to command increased leverage in negotiating prices and other terms of sale, which could adversely affect our profitability. In addition, if, as a result of increased leverage, customer pressures require us to reduce our pricing such that our gross margins are diminished, we could decide not to sell our solutions under such less favorable terms, which would decrease our revenue. Consolidation among our customer base may also lead to reduced demand for our solutions, replacement of our products by the combined entity with those of our competitors and cancellations of orders, each of which could harm our operating results.
20
Our acquisitions, strategic alliances, joint ventures, internal reorganizations and divestitures may result in financial results that are different than expected.
In the normal course of business, we may engage in discussions with third parties relating to possible acquisitions, strategic alliances, joint ventures and divestitures. Additionally, we occasionally make changes to our internal structure to align business products, services and solutions with market demands and to obtain cost synergies and operational efficiencies. As a result of such transactions, our financial results may differ from our own or the investment community's expectations in a given fiscal quarter, or over the long term. If market conditions or other factors lead us to change our strategic direction, we may not realize the expected value from such transactions or reorganizations. Further, such third-party transactions often have post-closing arrangements, including, but not limited to, post-closing adjustments, transition services, escrows or indemnifications, the financial results of which can be difficult to predict. In addition, acquisitions and strategic alliances may require us to integrate a different company culture, management team, employees and business infrastructure into our existing operations without impacting the business operations of the newly acquired company. We may have difficulty developing, manufacturing and marketing the products of a newly acquired company in a way that enhances performance and expands the markets of the newly acquired company. The acquired company may not enhance the performance of our businesses or product lines such that we do not realize the value from expected synergies. Depending on the size and complexity of an acquisition, the successful integration of the entity depends on a variety of factors, including but not limited to:
• | the achievement of anticipated cost savings, synergies, business opportunities and growth prospects from combining the acquired company; |
• | the scalability of production, manufacturing and marketing of products of a newly acquired company to broader adjacent markets; |
• | the ability to cohesively integrate operations, product definitions, price lists, delivery, and technical support for products and solutions of a newly acquired company into our existing operations; |
• | the compatibility of our infrastructure, operations, policies and organizations with those of the acquired company; |
• | the retention of key employees and/or customers; |
• | the management of facilities and employees in different geographic areas; and |
• | the management of relationships with our strategic partners, suppliers, and customer base. |
If we do not realize the expected benefits or synergies of such transactions, our consolidated financial position, results of operations, cash flows and stock price could be negatively impacted. Additionally, we may record significant goodwill and other assets as a result of acquisitions or investments, and we may be required to incur impairment charges, which could adversely affect our consolidated financial position and results of operations.
Any inability to complete acquisitions on acceptable terms could negatively impact our growth rate and financial performance.
Our ability to grow revenues, earnings and cash flow depends in part upon our ability to identify and successfully acquire and integrate businesses at appropriate prices and realize anticipated synergies and business performance. Appropriate targets for acquisition are difficult to identify and complete for a variety of reasons, including but not limited to, limited due diligence, high valuations, business and intellectual property evaluations, other interested parties, negotiations of the definitive documentation, satisfaction of closing conditions, the need to obtain antitrust or other regulatory approvals on acceptable terms, and availability of funding. The inability to close appropriate acquisitions on acceptable terms could adversely impact our growth rate, revenue, and financial performance.
We may need additional financing in the future to meet our capital needs or to make opportunistic acquisitions, and such financing may not be available on terms favorable to us, if at all, and may be dilutive to existing shareholders.
We may need to seek additional financing for our general corporate purposes. For example, we may need to increase our investment in R&D activities or need funds to make acquisitions. We may be unable to obtain any desired additional financing on terms favorable to us, if at all. If adequate funds are not available on acceptable terms, we may be unable to fund our expansion, successfully develop or enhance solutions or respond to competitive pressures, any of which could negatively affect our business. If we finance acquisitions by issuing additional convertible debt or equity securities, our existing stockholders may experience share dilution, which could affect the market price of our stock. If we raise additional funds through the issuance of equity securities, our shareholders will experience dilution of their ownership interest. If we raise additional funds by issuing debt, we may be subject to further limitations on our operations and ability to pay dividends due to restrictive covenants.
21
We have outstanding debt and may incur other debt in the future, which could adversely affect our financial condition, liquidity and results of operations.
We currently have outstanding debt as well as availability to borrow under a revolving credit facility. We may borrow additional amounts in the future and use the proceeds from any future borrowing for general corporate purposes, future acquisitions, expansion of our business or repurchases of our outstanding shares of common stock.
Our incurrence of this debt, and increases in our aggregate levels of debt, may adversely affect our operating results and financial condition by, among other things:
• | requiring a portion of our cash flow from operations to make interest payments on this debt; |
• | increasing our vulnerability to general adverse economic and industry conditions; |
• | reducing the cash flow available to fund capital expenditures and other corporate purposes and to grow our business; and |
• | limiting our flexibility in planning for, or reacting to, changes in our business and the industry. |
Our current revolving credit facility and term loan imposes restrictions on us, including restrictions on our ability to create liens on our assets and the ability of our subsidiaries to incur indebtedness, and requires us to maintain compliance with specified financial ratios. Our ability to comply with these ratios may be affected by events beyond our control. In addition, the indenture governing our senior notes contains covenants that may adversely affect our ability to incur certain liens or engage in certain types of sale and leaseback transactions. If we breach any of the covenants and do not obtain a waiver from the lenders, then, subject to applicable cure periods, our outstanding indebtedness could be declared immediately due and payable.
If currency exchange rates fluctuate substantially in the future, our financial results could be adversely affected.
A substantial amount of our solutions are priced and paid for in U.S. Dollars, although many of our solutions are priced in local currencies and a significant amount of certain types of expenses, such as payroll, utilities, tax and marketing expenses, are paid in local currencies. Our hedging programs are designed to reduce, but not entirely eliminate, within any given 12-month period, the impact of currency exchange rate movements, including those caused by currency controls, which could impact our business, operating results and financial condition by resulting in lower revenue or increased expenses. However, for expenses beyond a 12-month period, our hedging strategy will not mitigate our exchange rate risk. In addition, our currency hedging programs involve third-party financial institutions as counterparties. The weakening or failure of these counterparties may adversely affect our hedging programs and our financial condition through, among other things, a reduction in the number of available counterparties, increasingly unfavorable terms or the failure of counterparties to perform under hedging contracts.
Third parties may claim that we are infringing their intellectual property rights, and we could suffer significant litigation or licensing expenses or be prevented from selling solutions or services.
Third parties may claim that one or more of our solutions or services infringe their intellectual property rights. We analyze and take action in response to such claims on a case-by-case basis. Any dispute or litigation regarding patents or other intellectual property could be costly and time-consuming due to the complexity of our technology and the uncertainty of intellectual property litigation and could divert our management and key personnel from business operations. A claim of intellectual property infringement could cause us to enter into a costly or restrictive license agreement (which may not be available under acceptable terms, or at all), require us to redesign certain of our solutions (which would be costly and time-consuming) and/or subject us to significant damages or an injunction against the development and sale of certain solutions or services. In certain of our businesses, we rely on third-party intellectual property licenses, and we cannot ensure that these licenses will be available to us in the future on terms favorable to us or at all.
Third parties may infringe our intellectual property rights, and we may suffer competitive injury or expend significant resources enforcing our intellectual property rights.
Our success depends in part on our proprietary technology, including technology we obtained through acquisitions. We rely on various intellectual property rights, including patents, copyrights, trademarks and trade secrets, as well as confidentiality provisions and licensing arrangements, to establish our proprietary rights. If we do not enforce our intellectual property rights successfully, our competitive position may suffer, which could harm our operating results.
Our pending patent, copyright and trademark registration applications may not be allowed or competitors may challenge the validity or scope of our patents, copyrights or trademarks. In addition, our patents, copyrights, trademarks and other intellectual property rights may not provide us with a significant competitive advantage. In preparation for the separation and distribution, we have applied for trademarks related to our new global brand name in various jurisdictions worldwide. Any successful opposition
22
to our applications in material jurisdictions could impose material costs on us or make it more difficult to protect our brand. Different jurisdictions vary widely in the level of protection and priority they give to trademark and other intellectual property rights.
We may be required to spend significant resources monitoring our intellectual property rights, and we may or may not be able to detect infringement of such rights by third parties. Our competitive position may be harmed if we cannot detect infringement and enforce our intellectual property rights in a timely manner, or at all. In some circumstances, we may choose to not pursue enforcement due to a variety of reasons. In addition, competitors may avoid infringement by designing around our intellectual property rights or by developing non-infringing competing technologies. Intellectual property rights and our ability to enforce them may be unavailable or limited in some countries, which could make it easier for competitors to capture market share and could result in lost revenues to the company. Furthermore, some of our intellectual property is licensed to others, which allows them to compete with us using that intellectual property.
If we experience a significant cybersecurity attack or disruption in our IT systems, our business, reputation, and operating results could be adversely affected.
We rely on several centralized IT systems to provide solutions and services, maintain financial records, retain sensitive data such as intellectual property, proprietary business information, and data related to customers, suppliers, and business partners, process orders, manage inventory, process shipments to customers and operate other critical functions. The ongoing maintenance and security of this information is pertinent to the success of our business operations and our strategic goals.
Despite our implementation of network security measures, our network may be vulnerable to cybersecurity attacks, computer viruses, break-ins and similar disruptions. Our network security measures include, but are not limited to, the implementation of firewalls, antivirus protection, patches, log monitors, routine backups, offsite storage, network audits, and routine updates and modifications. Despite our efforts to create these security barriers, we may not be able to keep pace as new threats emerge and it is virtually impossible for us to entirely eliminate this risk. Cybersecurity attacks are evolving and include, but are not limited to, malicious software, attempts to gain unauthorized access to data, and other electronic security breaches that could lead to disruptions in systems, unauthorized release of confidential or otherwise protected information and corruption of data. Any such event could have a material adverse effect on our business, reputation, operating results and financial condition, and no assurance can be given that our efforts to reduce the risk of such attacks will be successful.
In addition, our IT systems may be susceptible to damage, disruptions or shutdowns due to power outages, hardware failures, telecommunication failures, user errors, implementation of new operational systems or software or upgrades to existing systems and software, or catastrophes or other unforeseen events. Such events could result in the disruption of business processes, network degradation and system downtime, along with the potential that a third party will exploit our critical assets such as intellectual property, proprietary business information and data related to our customers, suppliers and business partners. Further, such events could result in loss of revenue, loss of or reduction in purchase orders, inability to report financial information, litigation, regulatory fines and penalties, and other damage that could have a material impact on our business operations. To the extent that such disruptions occur, our customers and partners may lose confidence in our solutions and we may lose business or brand reputation, resulting in a material and adverse effect on our business operating results and financial condition.
We are or will be subject to ongoing tax examinations of our tax returns by the IRS and other tax authorities. An adverse outcome of any such audit or examination by the IRS or other tax authority could have a material adverse effect on our results of operations, financial condition and liquidity.
We are or will be subject to ongoing tax examinations of our tax returns by the IRS and other tax authorities in various jurisdictions. We regularly assess the likelihood of adverse outcomes resulting from ongoing tax examinations to determine the adequacy of our provision for income taxes. These assessments can require considerable estimates and judgments. Intercompany transactions associated with the sale of inventory, services, intellectual property and cost sharing arrangements are complex and affect our tax liabilities. The calculation of our tax liabilities involves uncertainties in the application of complex tax laws and regulations in multiple jurisdictions. The outcomes of these tax examinations could have an adverse effect on our operating results and financial condition. Due to the complexity of tax contingencies, the ultimate resolution of any tax matters related to operations may result in payments greater or less than amounts accrued.
Our operations may be adversely impacted by changes in our business mix or changes in the tax legislative landscape.
Our effective tax rate may be adversely impacted by, among other things, changes in the mix of our earnings among countries with differing statutory tax rates, changes in the valuation allowance of deferred tax assets, and changes in tax laws. We cannot give any assurance as to what our effective tax rate will be in the future because, among other things, there is uncertainty regarding the tax policies of the jurisdictions where we operate. Changes in tax laws, such as tax reform in the United States or changes in
23
tax laws resulting from the Organization for Economic Co-operation and Development’s (“OECD”) multi-jurisdictional plan of action to address “base erosion and profit shifting” and the taxation of the “Digital Economy” could impact our effective tax rate.
If tax laws or incentives change or cease to be in effect, our income taxes could increase significantly.
We are subject to federal, state, and local taxes in the United States and numerous foreign jurisdictions. We devote significant resources to evaluating our tax positions and our worldwide provision for taxes. Our financial results and tax treatment are susceptible to changes in tax, accounting, and other laws, regulations, principles, and interpretations in the United States and in other jurisdictions where we do business. With the rise of economic and political policies that favor domestic interests, it is possible that more countries will enact tax laws that either increase the tax rates, or reduce or change the tax incentives available to multinational companies like ours. Upon a change in tax laws in any territory where we do significant business, such as the U.S., the European Union, or Singapore, we may not be able to maintain our current tax rate or qualify for or maintain the benefits of any tax incentives offered, to the extent such incentives are offered.
We currently benefit from tax incentives extended to certain of our foreign subsidiaries to encourage investment or employment, the most significant of which being Singapore. The Singapore tax incentives require that specific conditions be satisfied, which include achieving thresholds of employment, ownership of certain assets, as well as specific types of investment activities within Singapore. Based on the current tax environment, we believe that we will satisfy such conditions in the future as needed, but cannot guarantee that the tax environment will not change or that such conditions will be satisfied.
Our Singapore tax incentives are due for renewal in fiscal 2024, but we cannot guarantee that Singapore will not revoke the tax incentives earlier. Our taxes could increase if the existing Singapore incentives are not renewed upon revocation or expiration. We cannot guarantee that we will qualify for any new incentive regime that may exist in fiscal 2024, or that such conditions will be satisfied. If we cannot or do not wish to satisfy all or portions of the tax incentives conditions, we may lose the related tax incentives and could be required to refund the benefits that the tax incentives previously provided. As a result, our effective tax rate could be higher than it would have been had we maintained the benefits of the tax incentives and could harm our operating results.
Our business will suffer if we are not able to retain and hire key personnel.
Our future success depends partly on the continued service of our key research, engineering, sales, marketing, manufacturing, executive and administrative personnel, including personnel joining our company through acquisitions. The markets in which we operate are dynamic, and we may need to respond with reorganizations, workforce reductions and site closures from time to time. We believe our pay levels are competitive within the regions that we operate. However, there is also intense competition for certain highly technical specialties in geographic areas in which we operate, and it may become more difficult to retain key employees. If we fail to retain and hire a sufficient number of these personnel, we may not be able to meet key objectives, such as launching effective product innovations and meeting financial goals, and maintain or expand our business.
If we suffer a loss to our factories, facilities or distribution system due to a catastrophic event, our operations could be significantly harmed.
Our factories, facilities and distribution system are subject to catastrophic loss due to fire, flood, terrorism or other natural or man-made disasters. In particular, several of our facilities could be subject to a catastrophic loss caused by earthquake or other natural disasters due to their locations. For example, our production facilities, headquarters and laboratories in California and our production facilities in Japan are all located in areas with above-average seismic activity. If any of these facilities were to experience a catastrophic loss, it could disrupt our operations, delay production, shipments and revenue and result in large expenses to repair or replace the facility. If such a disruption were to occur, we could breach our agreements, our reputation could be harmed and our business and operating results could be adversely affected. In addition, since we have consolidated our manufacturing facilities, we are more likely to experience an interruption to our operations in the event of a catastrophe in any one location. Although we carry insurance for property damage and business interruption, we do not carry insurance or financial reserves for interruptions or potential losses arising from earthquakes or terrorism. Also, our third-party insurance coverage will vary from time to time in both type and amount depending on availability, cost and our decision with respect to risk retention. Economic conditions and uncertainties in global markets may adversely affect the cost and other terms upon which we are able to obtain third-party insurance. If our third-party insurance coverage is adversely affected, or to the extent we have elected to self-insure, we may be at a greater risk that our operations will be harmed by a catastrophic loss.
If we fail to maintain satisfactory compliance with certain regulations, we may be subject to substantial negative financial consequences and civil or criminal penalties.
We and our customers are subject to various significant international, federal, state and local regulations, including, but not limited to, health and safety, packaging, data privacy, product content, labor and import/export regulations. These regulations are
24
complex, change frequently and have tended to become more stringent over time. We may be required to incur significant expenses to comply with these regulations or to remedy violations of these regulations. Any failure by us to comply with applicable government regulations could also result in cessation of our operations or portions of our operations, high financial penalties, product recalls or impositions of fines, and restrictions on our ability to carry on or expand our operations. If demand for our solutions is adversely affected or our costs increase, our business would suffer.
We have developed internal data handling policies and practices to comply with the General Data Protection Regulation (“GDPR”) in the European Union and data privacy regulations similar to GDPR in other jurisdictions. Our existing business strategy does not rely on aggregating or selling personally identifiable information, and as a general matter Keysight does not process personally identifiable information on behalf of our customers. We devote resources to keep up with the changing regulatory environment on data privacy in the jurisdictions where we do business. Despite our efforts, no assurance can be given that we will be compliant with data privacy regulations. New laws, amendments, or interpretations of regulations, industry standards, and contractual obligations relating to data privacy may require us to incur additional costs and restrict our business operations. If we fail to comply with GDPR or other data privacy regulation, we may be subject to significant financial fines and civil or criminal penalties, and may suffer damage to our reputation or brand, which could adversely affect our business and financial results.
In addition, our products and operations are also often subject to the rules of industrial standards bodies, like the International Standards Organization, as well as regulation by other agencies such as the U.S. Federal Communications Commission. We also must comply with work safety rules. If we fail to adequately address any of these regulations, our businesses could be harmed.
Failure to comply with anti-corruption laws could adversely affect our business and result in financial penalties.
Because we have extensive international operations, we must comply with complex foreign and U.S. laws and regulations, such as the U.S. Foreign Corrupt Practices Act, the U.K. Bribery Act and other local laws prohibiting corrupt payments to governmental officials, and anti-competition regulations. Although we actively maintain policies and procedures designed to ensure ongoing compliance with these laws and regulations, there can be no assurance that our employees, contractors or agents will not violate these policies and procedures. Violations of these laws and regulations could result in fines and penalties, criminal sanctions, restrictions on our business conduct and on our ability to offer our solutions in one or more countries, and could also materially affect our brand, ability to attract and retain employees, international operations, business and operating results.
Our business and financial results may be adversely affected by various legal and regulatory proceedings.
We are subject to legal proceedings, lawsuits and other claims in the normal course of business and could become subject to additional claims in the future, some of which could be material. The outcome of existing proceedings, lawsuits and claims may differ from our expectations because the outcomes of litigation are often difficult to reliably predict. Various factors or developments can lead us to change current estimates of liabilities and related insurance receivables where applicable, or permit us to make such estimates for matters previously not susceptible to reasonable estimates, such as a significant judicial ruling or judgment, a significant settlement, significant regulatory developments or changes in applicable law. A future adverse ruling, settlement or unfavorable development could result in charges that could adversely affect our business, operating results or financial condition.
Our internal controls may be determined to be ineffective, which may adversely affect investor confidence in our company, the value of our stock, and our access to capital.
The Sarbanes-Oxley Act of 2002 requires us to furnish a report by management on the effectiveness of our internal control over financial reporting, among other things. We are devoting significant resources and time to comply with such internal control over financial reporting requirements. However, we cannot be certain that these measures will ensure that we design, implement and maintain adequate control over our financial processes and reporting in the future, especially in the context of acquisitions of other businesses. Any difficulties in the assimilation of acquired businesses into our control system could harm our operating results or cause us to fail to meet our financial reporting obligations. Inferior internal controls could also cause investors to lose confidence in our reported financial information, which could have a negative effect on the trading price of our stock or on our access to capital, or cause us to be subject to investigation or sanctions by the SEC.
Adverse conditions in the global banking industry and credit markets may adversely impact the value of our cash investments or impair our liquidity.
Our cash and cash equivalents are invested or held in a mix of money market funds, time deposit accounts and bank demand deposit accounts. Disruptions in the financial markets may, in some cases, result in an inability to access assets such as money market funds that traditionally have been viewed as highly liquid. Any failure of our counterparty financial institutions or funds in which we have invested may adversely impact our cash and cash equivalent positions and, in turn, our results and financial condition.
25
Future investment returns on pension assets may be lower than expected or interest rates may decline, requiring us to make significant additional cash contributions to our future plans.
We sponsor several defined benefit pension plans that cover many of our salaried and hourly employees. The Federal Pension Protection Act of 2006 requires that certain capitalization levels be maintained in each of the U.S. plans, and there may be similar funding requirements in the plans outside the United States. Because it is unknown what the investment return on and the fair value of our pension assets will be in future years or what interest rates and discount rates may be at any point in time, no assurances can be given that applicable law will not require us to make future material plan contributions. Any such contributions could adversely affect our financial condition.
Environmental contamination from past operations could subject us to unreimbursed costs and could harm on-site operations and the future use and value of the properties involved, and environmental contamination caused by ongoing operations could subject us to substantial liabilities in the future.
Some of our properties are undergoing remediation by HP Inc. ("HP") for subsurface contaminations that were known at the time of Agilent's separation from HP in 1999. In connection with Agilent's separation from HP, HP and Agilent entered into an agreement pursuant to which HP agreed to retain the liability for this subsurface contamination, perform the required remediation and indemnify Agilent with respect to claims arising out of that contamination. Agilent has assigned its rights and obligations under this agreement to Keysight in respect of facilities transferred to us in the separation. As a result, HP will have access to a limited number of our properties to perform remediation. Although HP agreed to minimize interference with on-site operations at such properties, remediation activities and subsurface contamination may require us to incur unreimbursed costs and could harm on-site operations and the future use and value of the properties. In connection with the separation, Agilent will indemnify us directly for any liabilities related thereto. We cannot be sure that HP will continue to fulfill its remediation obligations or that Agilent will continue to fulfill its indemnification obligations.
In connection with the separation from Agilent, Agilent also agreed to indemnify us for any liability associated with contamination from past operations at all properties transferred from Agilent to Keysight. We cannot be sure that Agilent will fulfill its indemnification obligations.
Our current manufacturing processes involve the use of substances regulated under various international, federal, state and local laws governing the environment. As a result, we may become subject to liabilities for environmental contamination, and these liabilities may be substantial. Although our policy is to apply strict standards for environmental protection at our sites inside and outside the United States, even if the sites outside the United States are not subject to regulations imposed by foreign governments, we may not be aware of all conditions that could subject us to liability.
Risks Related to Our Common Stock
Our share price may fluctuate significantly.
Our common stock is listed on NYSE under the ticker symbol “KEYS.” The market price of our common stock may fluctuate widely, depending on many factors, some of which may be beyond our control, including but not limited to:
• | actual or anticipated fluctuations in our operating results due to factors related to our business; |
• | success or failure of our business strategy; |
• | our quarterly or annual earnings, or those of other companies in our industry; |
• | our ability to obtain third-party financing as needed; |
• | announcements by us or our competitors of significant acquisitions or dispositions; |
• | changes in accounting standards, policies, guidance, interpretations or principles; |
• | the failure of securities analysts to cover our common stock; |
• | changes in earnings estimates by securities analysts or our ability to meet those estimates; |
• | the operating and share price performance of other comparable companies; |
• | investor perception of our company; |
• | natural or other disasters that investors believe may affect us; |
26
• | overall market fluctuations; |
• | results from any material litigation or government investigations; |
• | changes in laws or regulations affecting our business; and |
• | general economic conditions and other external factors. |
Stock markets in general have experienced volatility that has often been unrelated to the operating performance of a particular company. These broad market fluctuations could adversely affect the trading price of our common stock.
In addition, when the market price of a company’s shares drops significantly, shareholders often institute securities class action lawsuits against the company. A lawsuit against us could cause us to incur substantial costs and could divert the time and attention of management and other resources.
We do not currently pay dividends on our common stock.
We do not currently pay dividends on our common stock. The payment of any dividends in the future, and the timing and amount thereof, to our stockholders fall within the discretion of our board of directors. The board's decisions regarding the payment of dividends will depend on many factors, such as our financial condition, earnings, capital requirements, debt service obligations, restrictive covenants in our debt, industry practice, legal requirements, regulatory constraints and other factors that the board deems relevant. We cannot guarantee that we will pay a dividend in the future or continue to pay any dividends if we commence paying dividends.
Certain provisions in our amended and restated certificate of incorporation and bylaws, and of Delaware law, may prevent or delay an acquisition of the company, which could decrease the trading price of our common stock.
Our amended and restated certificate of incorporation and amended and restated bylaws contain, and Delaware law contains, provisions that are intended to deter coercive takeover practices and inadequate takeover bids by making such practices or bids unacceptably expensive to the bidder and to encourage prospective acquirers to negotiate with our board of directors rather than to attempt a hostile takeover. These provisions include but are not limited to:
• | the inability of our shareholders to call a special meeting; |
• | the inability of our shareholders to act without a meeting of shareholders; |
• | rules regarding how shareholders may present proposals or nominate directors for election at shareholder meetings; |
• | the right of our board to issue preferred stock without shareholder approval; |
• | the division of our board of directors into three classes of directors, with each class serving a staggered three-year term, and this classified board provision could have the effect of making the replacement of incumbent directors more time consuming and difficult; |
• | a provision that shareholders may only remove directors with cause; |
• | the ability of our directors, and not shareholders, to fill vacancies on our board of directors; and |
• | the requirement that the affirmative vote of shareholders holding at least 80 percent of our voting stock is required to amend certain provisions in our amended and restated certificate of incorporation (relating to the number, term and removal of our directors, the filling of our board vacancies, the advance notice to be given for nominations for elections of directors, the calling of special meetings of shareholders, shareholder action by written consent, the ability of the board of directors to amend the bylaws, elimination of liability of directors to the extent permitted by Delaware law, exclusive forum for certain types of actions and proceedings that may be initiated by our shareholders and amendments of the certificate of incorporation) and certain provisions in our amended and restated bylaws (relating to the calling of special meetings of shareholders, the business that may be conducted or considered at annual or special meetings, the advance notice of shareholder business and nominations, shareholder action by written consent, the number, tenure, qualifications and removal of our directors, the filling of our board vacancies, director and officer indemnification and amendments of the bylaws). |
In addition, because we have not chosen to be exempt from Section 203 of the Delaware General Corporation Law (the "DGCL"), this provision could also delay or prevent a change of control that some shareholders may favor. Section 203 provides that, subject to limited exceptions, persons that acquire, or are affiliated with a person that acquires, more than 15 percent of the outstanding voting stock of a Delaware corporation (an "interested stockholder") shall not engage in any business combination
27
with that corporation, including by merger, consolidation or acquisitions of additional shares, for a three-year period following the date on which the person became an interested stockholder, unless (i) prior to such time, the board of directors of such corporation approved either the business combination or the transaction that resulted in the stockholder becoming an interested stockholder; (ii) upon consummation of the transaction that resulted in the stockholder becoming an interested stockholder, the interested stockholder owned at least 85 percent of the voting stock of such corporation at the time the transaction commenced (excluding for purposes of determining the voting stock outstanding (but not the outstanding voting stock owned by the interested stockholder) the voting stock owned by directors who are also officers or held in employee benefit plans in which the employees do not have a confidential right to tender or vote stock held by the plan); or (iii) on or subsequent to such time the business combination is approved by the board of directors of such corporation and authorized at a meeting of shareholders by the affirmative vote of at least two-thirds of the outstanding voting stock of such corporation not owned by the interested stockholder.
We believe these provisions will protect our shareholders from coercive or otherwise unfair takeover tactics by requiring potential acquirers to negotiate with our board of directors and by providing our board of directors with more time to assess any acquisition proposal. These provisions are not intended to make us immune from takeovers. However, these provisions will apply even if the offer may be considered beneficial by some shareholders and could delay or prevent an acquisition that our board of directors determines is not in the best interests of the company and our shareholders. These provisions may also prevent or discourage attempts to remove and replace incumbent directors.
Our amended and restated certificate of incorporation designates that the state courts in the State of Delaware or, if no state court located within the State of Delaware has jurisdiction, the federal court for the District of Delaware, as the sole and exclusive forum for certain types of actions and proceedings that may be initiated by our shareholders, which could discourage lawsuits against the company and our directors and officers.
Our amended and restated certificate of incorporation provide that unless the board of directors otherwise determines, the state courts in the State of Delaware or, if no state court located within the State of Delaware has jurisdiction, the federal court for the District of Delaware, will be the sole and exclusive forum for any derivative action or proceeding brought on our behalf, any action asserting a claim of breach of a fiduciary duty owed by any of our directors or officers to the company or our shareholders, any action asserting a claim against us or any of our directors or officers arising pursuant to any provision of the DGCL or Keysight's amended and restated certificate of incorporation or bylaws, or any action asserting a claim against us or any of our directors or officers governed by the internal affairs doctrine. This exclusive forum provision may limit the ability of our shareholders to bring a claim in a judicial forum that such shareholders find favorable for disputes with us or our directors or officers, which may discourage such lawsuits against us and our directors and officers.
Item 1B. Unresolved Staff Comments
None.
Item 2. Properties
Our executive offices are located in the United States in an owned facility in Santa Rosa, California. We own or lease a total of approximately 134 operating facilities located throughout the world that handle manufacturing production, research and development, administration, assembly, sales, quality, assurance testing, distribution and packaging of our products. These facilities are primarily located in the following countries: United States, Malaysia, Japan, China, Germany, India, United Kingdom, Taiwan, Romania, Spain and Singapore. As of October 31, 2019, we own or lease approximately 6.2 million square feet of space worldwide, of which we own approximately 4.1 million square feet and lease 2.1 million square feet. Our sales facilities occupy a total of approximately 0.3 million square feet. Our manufacturing plants, R&D facilities and warehouse and administrative facilities occupy approximately 5.9 million square feet. All of these facilities are well maintained and suitable for the operations conducted in them.
Item 3. Legal Proceedings
We are involved in lawsuits, claims, investigations and proceedings, including, but not limited to, patent, commercial and environmental matters, which arise in the ordinary course of business. There are no matters pending that we currently believe are reasonably possible of having a material impact to our business, consolidated financial condition, results of operations or cash flows.
Item 4. Mine Safety Disclosures
Not applicable.
28
PART II
Item 5. Market for the Registrant's Common Equity, Related Stockholder Matters and Issuer Purchases of Equity Securities
Our common stock is listed on the New York Stock Exchange ("NYSE") with the ticker symbol "KEYS.’’
There were 19,924 shareholders of record of Keysight common stock as of December 16, 2019.
We have not paid any dividends, and we do not anticipate paying any cash dividends in the foreseeable future. All decisions regarding the declaration and payment of dividends and stock repurchases are at the discretion of our Board of Directors and will be evaluated regularly in light of our financial condition, earnings, growth prospects, funding requirements, applicable law, and any other factors that our Board deems relevant.
The information required by this item with respect to equity compensation plans will be included under the caption Equity Compensation Plans in our proxy statement for the 2020 annual meeting of stockholders, to be filed with the Securities and Exchange Commission pursuant to Regulation 14A, and is incorporated herein by reference.
ISSUER PURCHASES OF EQUITY SECURITIES
The table below summarizes information about the company’s purchases, based on trade date; of its equity securities registered pursuant to Section 12 of the Exchange Act during the quarterly period ended October 31, 2019. The total number of shares of common stock purchased by the company during the fiscal year ended October 31, 2019 is 2,093,570 shares.
Period | Total Number of Shares of Common Stock Purchased (1) | Weighted Average Price Paid per Share of Common Stock (2) | Total Number of Shares of Common Stock Purchased as Part of Publicly Announced Plans or Programs (1) | Maximum Approximate Dollar Value of Shares of Common Stock that May Yet Be Purchased Under the Program (1) | ||||||||
August 1, 2019 through August 31, 2019 | 51,900 | $95.67 | 51,900 | $ | 435,049,814 | |||||||
September 1, 2019 through September 30, 2019 | 151,000 | $98.83 | 151,000 | $ | 420,126,205 | |||||||
October 1, 2019 through October 31, 2019 | 100,250 | $98.79 | 100,250 | $ | 410,222,249 | |||||||
Total | 303,150 | 303,150 | ||||||||||
(1) | On May 29, 2019, the Board of Directors approved a new stock repurchase program authorizing the purchase of up to $500 million of the company’s common stock, replacing a previously approved 2018 program authorizing the purchase of up to $350 million of the company’s common stock, of which $160 million remained. Under the new program, shares may be purchased from time to time, subject to general business and market conditions and other investment opportunities, through open market purchases, privately negotiated transactions or other means. All such shares and related costs are held as treasury stock and accounted for at trade date using the cost method. |
(2) | The weighted average price paid per share of common stock does not include the cost of commissions. |
29
Item 6. Selected Financial Data (Unaudited)
The following table presents the selected consolidated financial data, which should be read in conjunction with our consolidated financial statements and related notes and Management's Discussion and Analysis of Financial Condition and Results of Operations included elsewhere in this Form 10-K. We derived the selected financial data as of October 31, 2019 and for each of the fiscal years in the three-year period ended October 31, 2019 from our audited consolidated financial statements included elsewhere in this Form 10-K. We derived the selected financial data as of October 31, 2016 and October 31, 2015 from audited consolidated financial statements that are not included in this Form 10-K.
Years Ended October 31, | |||||||||||||||||||
2019 | 2018 | 2017 | 2016 | 2015 | |||||||||||||||
(in millions, except per share data) | |||||||||||||||||||
Consolidated Statement of Operations Data:(a) | |||||||||||||||||||
Net revenue | $ | 4,303 | $ | 3,878 | $ | 3,189 | $ | 2,918 | $ | 2,856 | |||||||||
Income (loss) before taxes | $ | 715 | $ | (411 | ) | $ | 179 | $ | 366 | $ | 388 | ||||||||
Net income | $ | 621 | $ | 165 | $ | 102 | $ | 335 | $ | 513 | |||||||||
Net income per share | |||||||||||||||||||
Basic | $ | 3.31 | $ | 0.88 | $ | 0.57 | $ | 1.97 | $ | 3.04 | |||||||||
Diluted | $ | 3.25 | $ | 0.86 | $ | 0.56 | $ | 1.95 | $ | 3.00 | |||||||||
Weighted average shares used in computing net income per share: | |||||||||||||||||||
Basic | 188 | 187 | 180 | 170 | 169 | ||||||||||||||
Diluted | 191 | 191 | 182 | 172 | 171 | ||||||||||||||
(a) Fiscal years 2019, 2018 and 2017 financial data includes our acquisition of Ixia on April 18, 2017.
October 31, | |||||||||||||||||||
2019 | 2018 | 2017 | 2016 | 2015 | |||||||||||||||
(in millions) | |||||||||||||||||||
Consolidated Balance Sheet Data:(a) | |||||||||||||||||||
Cash and cash equivalents | $ | 1,598 | $ | 913 | $ | 818 | $ | 783 | $ | 483 | |||||||||
Working capital | $ | 2,212 | $ | 916 | $ | 1,358 | $ | 1,210 | $ | 893 | |||||||||
Total assets | $ | 6,623 | $ | 5,824 | $ | 5,933 | $ | 3,796 | $ | 3,501 | |||||||||
Long-term debt | $ | 1,788 | $ | 1,291 | $ | 2,038 | $ | 1,093 | $ | 1,092 | |||||||||
Stockholders' equity | $ | 3,004 | $ | 2,433 | $ | 2,310 | $ | 1,513 | $ | 1,302 | |||||||||
(a) Fiscal years 2019, 2018 and 2017 financial data reflect the impact of our acquisition of Ixia on April 18, 2017.
30
Item 7. Management's Discussion and Analysis of Financial Condition and Results of Operations
The following discussion should be read in conjunction with the consolidated financial statements and notes thereto included elsewhere in this Annual Report on Form 10-K. This report contains forward-looking statements including, without limitation, statements regarding trends, seasonality, cyclicality and growth in, and drivers of, the markets we sell into, our strategic direction, our future effective tax rate and tax valuation allowance, earnings from our foreign subsidiaries, remediation activities, new solution and service introductions, the ability of our solutions to meet market needs, changes to our manufacturing processes, the use of contract manufacturers, the impact of local government regulations on our ability to pay vendors or conduct operations, our liquidity position, our ability to generate cash from operations, growth in our businesses, our investments, the potential impact of adopting new accounting pronouncements, our financial results, our purchase commitments, our contributions to our pension plans, the selection of discount rates and recognition of any gains or losses for our benefit plans, our cost-control activities, savings and headcount reduction recognized from our restructuring programs and other cost saving initiatives, and other regulatory approvals, the integration of our completed acquisitions and other transactions, our transition to lower-cost regions, the existence of political or economic instability, and our and the combined group's estimated or anticipated future results of operations, that involve risks and uncertainties. Our actual results could differ materially from the results contemplated by these forward-looking statements due to various factors, including but not limited to those risks and uncertainties discussed in Part II Item 1A and elsewhere in this Form 10-K.
Overview and Executive Summary
Keysight Technologies, Inc. ("we," "us," "Keysight" or the "company"), incorporated in Delaware on December 6, 2013, is a technology company that helps enterprises, service providers and governments accelerate innovation to connect and secure the world by providing electronic design and test solutions that are used in the simulation, design, validation, manufacture, installation, optimization and secure operation of electronics systems in the communications, networking and electronics industries. We also offer customization, consulting and optimization services throughout the customer's product lifecycle, including start-up assistance, asset management, up-time services, application services and instrument calibration and repair.
In 2019 we completed an organizational change to align our services business with our customer-solutions-oriented, go-to-market strategy as reflected by our Keysight Leadership Model ("KLM"). This change enables us to provide our customers with complete solutions that incorporate both leading product capabilities and the appropriate services and support. Our services delivery is now fully reflected within the markets served, which is a further catalyst of the growth of our services solutions portfolio. Prior period segment results were revised to conform to the presentation. As a result, Keysight has three segments: Communications Solutions Group, Electronic Industrial Solutions Group and Ixia Solutions Group. The organizational structure continues to include centralized enterprise functions that provide support across the groups.
To more effectively and efficiently address customer solution needs across the communications ecosystem as the network transforms, in the first quarter of fiscal 2020, we completed an organizational change to manage our Ixia Solutions Group within our Communications Solutions Group. We believe this realignment will create improved go-to-market and product development alignment, as well as accelerate solution synergies in 5G as this new technology is deployed globally. As a result, beginning with our first quarter of fiscal 2020, we will have two reportable operating segments, Communications Solutions Group (“CSG”) and Electronic Industrial Solutions Group (“EISG”).
Years ended October 31, 2019, 2018 and 2017
Total orders for the year ended October 31, 2019 were $4,441 million, an increase of 9 percent when compared to 2018. Foreign currency movements had an unfavorable impact of 1 percentage point on the year-over-year comparison. Orders associated with acquisitions and divestitures had a net neutral impact on the order growth for the year ended October 31, 2019 when compared to 2018. Order growth in Asia Pacific and the Americas was partially offset by a decline in Europe. Total orders for the year ended October 31, 2018 were $4,082 million, an increase of 20 percent when compared to 2017. Foreign currency movements had a favorable impact of 1 percentage point on the year-over-year comparison. Orders associated with acquisitions accounted for 7 percentage points of order growth for the year ended October 31, 2018 when compared to 2017. Orders grew across all regions.
Net revenue of $4,303 million for the year ended October 31, 2019 increased 11 percent when compared to 2018. Foreign currency movements had an unfavorable impact of 1 percentage point on the year-over-year comparison. Revenue associated with acquisitions and divestitures had a net neutral impact on the revenue growth for the year ended October 31, 2019 when compared to 2018. The Communications Solutions Group led overall revenue growth with strong growth in the commercial communications market, complemented by growth in the Ixia Solutions Group and the Electronic Industrial Solutions Group. Revenue from the Communications Solutions Group, Electronic Industrial Solutions Group and Ixia Solutions Group represented approximately 63 percent, 26 percent and 11 percent respectively, of the total revenue for the year ended October 31, 2019. Net revenue of $3,878 million for the year ended October 31, 2018 increased 22 percent when compared to 2017. Foreign currency movements
31
had a favorable impact of 2 percentage points on the year-over-year comparison. Revenue associated with acquisitions accounted for 6 percentage points of revenue growth for the year ended October 31, 2018 when compared to 2017. For the same period, revenue excluding acquisitions and foreign currency movements grew 14% year over year, with growth in all our operating segments and across all our markets. Revenue from the Communications Solutions Group, Electronic Industrial Solutions Group and Ixia Solutions Group represented approximately 62 percent, 27 percent and 11 percent, respectively, of the total revenue for the year ended October 31, 2018 and approximately 65 percent, 29 percent and 6 percent, respectively, of the total revenue for the year ended October 31, 2017. Ixia Solutions Group revenue for 2017 included activity from the date of acquisition, April 18, 2017, through October 31, 2017.
Net income was $621 million in 2019 compared to net income of $165 million and $102 million in 2018 and 2017, respectively. The increase in net income for the year ended October 31, 2019 when compared to 2018 was driven by a significant non-recurring goodwill impairment charge in 2018, higher revenue volume, highly differentiated solutions, favorable mix, and lower acquisition and integration costs, partially offset by a favorable income tax benefit in the prior period from new U.S. tax legislation and higher research and development investments in leading-edge technologies and key growth opportunities in our end markets. The increase in net income for the year ended October 31, 2018 when compared to 2017 was driven by higher revenue volume and a favorable tax impact from the new U.S. tax legislation and Singapore tax incentives, partially offset by an unfavorable impact from a goodwill impairment charge and increases in variable people-related costs. In 2019, 2018 and 2017, we generated operating cash flows of $998 million, $555 million and $328 million, respectively.
Impact of Northern California Wildfires
During the week of October 8, 2017, wildfires in northern California adversely impacted the Keysight corporate headquarters site in Santa Rosa, CA. While direct damage to our core facilities was limited, our buildings did experience some smoke and other fire-related impacts. Keysight is insured for the damage caused by the fire.
In 2019, 2018 and 2017, we recognized operating expenses of $3 million, $97 million and $18 million, respectively, offset by income of $3 million, $90 million and $2 million, respectively, for expected insurance recoveries. Expenses were primarily for cleaning and restoration activities, write-off of damaged fixed assets and other direct costs related to recovery from this event.
In 2019 and 2018, we received insurance proceeds of $22 million and $68 million, respectively, which has substantially covered our total fire-related expenses in excess of our $10 million self-insured retention amount. At October 31, 2019, we had a receivable of $5 million for losses and expenses for which insurance reimbursement is probable. The receivable is included in other current assets in the consolidated balance sheet.
In addition, in 2019 and 2018, we made investments in property, plant and equipment related to fire recovery of $7 million and $27 million, respectively, that are expected to be covered by insurance.
Subsequent to October 31, 2019, we received $37 million of insurance proceeds primarily related to replacement of capital and recovery of fire-related expenses. These proceeds will result in an other operating gain of approximately $32 million in the first quarter of fiscal 2020. No additional insurance proceeds or material expenses related to the 2017 northern California wildfires are expected.
Outlook
Our strategy of bringing solutions to market that help customers develop new technologies and accelerate innovation provides a platform for long-term growth. We expect to continue to see our customers make R&D investments in certain next-generation technologies. We are still in the early market stages for these emerging technologies, such as 5G, next-generation automotive, internet of things ("IoT") and defense modernization and expect technology investments to continue. Internally, we are working to improve operational efficiency across all functions. We continue to closely monitor the current macro environment related to trade, tariffs, monetary and fiscal policies. We have complied and will continue to comply with recent U.S. Department of Commerce export control regulations regarding China. While short-term uncertainties exist, we remain confident in our strategy and believe we are well-positioned to capture future growth opportunities.
32
Currency Exchange Rate Exposure
Our revenues, expenses, and monetary assets and liabilities are exposed to changes in foreign currency exchange rates as a result of our global operating and financing activities. We hedge revenues, expenses and balance sheet exposures that are not denominated in the functional currencies of our subsidiaries on a short-term and anticipated basis. The result of the hedging has been included in our consolidated statement of operations. We experience some fluctuations within individual lines of the consolidated balance sheet and consolidated statement of operations because our hedging program is not designed to offset the currency movements in each category of revenues, expenses, monetary assets and liabilities. Our hedging program is designed to hedge currency movements on a relatively short-term basis of up to twelve months in advance. Therefore, we are exposed to currency fluctuations over the longer term. To the extent that we are required to pay for all, or portions, of an acquisition price in foreign currencies, we may enter into foreign exchange contracts to reduce the risk that currency movements will impact the U.S. dollar cost of the transaction.
Results from Operations - Years ended October 31, 2019, 2018 and 2017
Net Revenue
Revenue is recognized upon transfer of control of the promised products or services to customers in an amount that reflects the consideration we expect to receive in exchange for those products or services. Cancellations are recorded in the period received from the customer and historically have not been material.
Year Ended October 31, | 2019 over 2018 % Change | 2018 over 2017 % Change | |||||||||||||
2019 | 2018 | 2017 | |||||||||||||
(in millions) | |||||||||||||||
Net revenue: | |||||||||||||||
Products | $ | 3,554 | $ | 3,229 | $ | 2,664 | 10% | 21% | |||||||
Services and other | 749 | 649 | 525 | 15% | 24% | ||||||||||
Total net revenue | $ | 4,303 | $ | 3,878 | $ | 3,189 | 11% | 22% | |||||||
Year Ended October 31, | 2019 over 2018 % Change | 2018 over 2017 % Change | ||||||||||
2019 | 2018 | 2017 | ||||||||||
% of total net revenue: | ||||||||||||
Products | 83 | % | 83 | % | 84 | % | — | (1) ppt | ||||
Services and other | 17 | % | 17 | % | 16 | % | — | 1 ppt | ||||
Total | 100 | % | 100 | % | 100 | % | ||||||
The following table provides the percent change in revenue for the years ended October 31, 2019 and 2018 by geographic region, including and excluding the impact of foreign currency movements, as compared to the respective prior year.
Year over Year % Change | |||||||||||
2019 over 2018 | 2018 over 2017 | ||||||||||
Geographic Region | actual | currency adjusted | actual | currency adjusted | |||||||
Americas | 12 | % | 12 | % | 28 | % | 28 | % | |||
Europe | (2 | )% | 1 | % | 29 | % | 25 | % | |||
Asia Pacific | 16 | % | 17 | % | 13 | % | 12 | % | |||
Total revenue | 11 | % | 12 | % | 22 | % | 20 | % | |||
Net revenue for the year ended October 31, 2019 was $4,303 million, an increase of 11 percent when compared to 2018. Foreign currency movements had an unfavorable impact of 1 percentage point on the year-over-year comparison. Revenue associated with acquisitions and divestitures had a net neutral impact on revenue growth for the year ended October 31, 2019 when compared to 2018. Currency had an unfavorable impact of 3 percentage points and 1 percentage point on revenue growth in Europe and Asia Pacific, respectively, for the year ended October 31, 2019.
Net revenue for the year ended October 31, 2018 was $3,878 million, an increase of 22 percent when compared to 2017. Foreign currency movements had a favorable impact of 2 percentage points on the year-over-year comparison. Revenue associated with acquisitions accounted for 6 percentage points of revenue growth for the year ended October 31, 2018 when compared to
33
2017. Currency had a favorable impact of 4 percentage points and 1 percentage point on revenue growth in Europe and Asia Pacific, respectively, for the year ended October 31, 2018.
Backlog
Backlog represents the amount of revenue expected from orders that have already been booked, including orders for goods and services that have not been delivered to customers, orders invoiced but not yet recognized as revenue, and orders for goods that were shipped but not invoiced, awaiting acceptance by customers and/or completion of a commitment to a customer.
At October 31, 2019, our unfilled backlog was approximately $1,380 million as compared to approximately $1,311 million at October 31, 2018. Our unfilled backlog as of October 31, 2019 reflects the impact of the deferred revenue adjustment related to the adoption of Accounting Standards Update 2014-09, Revenue From Contracts With Customers ("ASC 606"). See Note 2, "New Accounting Pronouncements," for additional information. Consistent with our strategy, we are seeing an increase in solution sales, which have a longer order-to-revenue conversion cycle; however, we expect that the majority of unfilled backlog will be recognized as revenue within six months. While backlog on any particular date can be an indicator of short-term revenue performance, it is not necessarily a reliable indicator of medium or long-term revenue performance.
Costs and Expenses
Year Ended October 31, | 2019 over 2018 % Change | 2018 over 2017 % Change | ||||||||||
2019 | 2018 | 2017 | ||||||||||
Gross margin on products | 59.5 | % | 55.1 | % | 54.6 | % | 4 ppts | — | ||||
Gross margin on services and other | 56.0 | % | 51.1 | % | 46.3 | % | 5 ppts | 5 ppts | ||||
Total gross margin | 58.9 | % | 54.4 | % | 53.2 | % | 5 ppts | 1 ppt | ||||
Operating margin | 16.5 | % | (10.2 | )% | 4.6 | % | 27 ppts | (15) ppts | ||||
(in millions) | |||||||||||||||
Research and development | $ | 688 | $ | 624 | $ | 507 | 10% | 23% | |||||||
Selling, general and administrative | $ | 1,155 | $ | 1,205 | $ | 1,058 | (4)% | 14% | |||||||
Goodwill impairment | $ | — | $ | 709 | $ | — | — | — | |||||||
Other operating expense (income), net | $ | (20 | ) | $ | (33 | ) | $ | (16 | ) | (40)% | 105% | ||||
Gross margin increased 5 percentage points in 2019 compared to 2018, primarily driven by higher revenue volume, highly differentiated solutions, favorable mix and a decline in warranty costs. Gross margin increased 1 percentage point in 2018 compared to 2017, primarily driven by gains related to revenue volume and favorable mix, partially offset by increases in variable people-related costs and amortization of acquisition-related balances.
Excess and obsolete inventory charges were $27 million in 2019, $25 million in 2018 and $16 million in 2017. Sales of previously written-down inventory were $2 million in 2019, $2 million in 2018 and $1 million in 2017.
Research and development expense increased 10 percent in 2019 compared to 2018, primarily driven by greater investment in key growth opportunities in our end markets, leading-edge technologies, people and infrastructure. Research and development expense increased 23 percent in 2018 compared to 2017, primarily driven by the addition of acquired companies to our cost structure, an increase in variable people-related costs and our continued investment in research and development programs, partially offset by non-recurring acquisition-related compensation expense in 2017. Research and development expenses as a percent of total revenue were 16 percent in each of the three years 2019, 2018 and 2017.
Selling, general and administrative expenses decreased 4 percent in 2019 compared to 2018, primarily driven by a decline in litigation and restructuring costs and acquisition and integration costs, partially offset by an increase in people- related costs. Selling, general and administrative expenses increased 14 percent for 2018 compared to 2017, primarily driven by the addition of acquired companies to our cost structure and increases in variable people-related, litigation and restructuring costs, partially offset by the elimination of non-recurring acquisition-related compensation expense, separation and related costs, acquisition and integration costs and the unfavorable impact from northern California wildfire-related costs.
In 2018 we recorded a goodwill impairment charge of $709 million for the Ixia Solutions Group based on the results of our annual impairment test of goodwill. See Note 11, "Goodwill and Other Intangible Assets," to our consolidated financial statements for additional information.
34
Other operating expense (income), net primarily includes property rental income and was income of $20 million, $33 million and $16 million for 2019, 2018 and 2017, respectively. Other operating expense (income), net for 2018 also includes income from business divestitures.
Operating margin increased 27 percentage points in 2019 when compared to 2018, primarily driven by a non-recurring goodwill impairment charge in 2018, higher revenue volume, highly differentiated solutions, favorable mix, lower acquisition and integration costs, and lower litigation and restructuring-related costs, partially offset by an increase in people-related costs. Operating margin decreased 15 percentage points in 2018 when compared to 2017, primarily driven by goodwill impairment and an increase in variable people-related costs, partially offset by gains related to revenue volume and favorable mix.
Our headcount was approximately 13,600 at October 31, 2019 compared to 12,900 at October 31, 2018.
Interest Income and Expense
Interest income for the years ended October 31, 2019, 2018 and 2017 was $23 million, $12 million and $7 million, respectively, and primarily relates to interest earned on our cash balances. Interest expense for the years ended October 31, 2019, 2018 and 2017 was $80 million, $83 million and $80 million, respectively, and primarily relates to interest on our senior notes.
Other income (expense), net
Other income (expense), net for the years ended October 31, 2019, 2018 and 2017 was income of $61 million, $54 million and $104 million, respectively, and primarily includes income related to our defined benefit and post-retirement benefit plans (interest cost, expected return on assets and amortization of net actuarial loss and prior service credits) and the change in fair value of our equity investments. Other income for 2017 also includes a $68 million gain from a settlement related to our Japan pension fund.
Income Taxes
Year Ended October 31, | |||||||||||
2019 | 2018 | 2017 | |||||||||
(in millions) | |||||||||||
Provision (benefit) for income taxes | $ | 94 | $ | (576 | ) | $ | 77 | ||||
For 2019, the effective tax rate was 13 percent, which is lower than the U.S. statutory rate primarily due to a higher percentage of earnings in the non-U.S. jurisdictions taxed at lower statutory tax rates.
For 2018, the effective tax rate was 140 percent, which is higher than the U.S. statutory rate primarily due to the net impact of U.S. tax law changes, the Singapore restructuring and tax incentive modifications completed in 2018 in response to Singapore tax law changes, and the tax impact of goodwill impairment.
For 2017, the effective tax rate was 43 percent, which is higher than the U.S. statutory rate primarily due to the payment of a prior year Malaysia tax assessment of $68 million, including tax and penalties, which we are currently in the process of appealing to the Special Commissioners of Income Tax (“SCIT”) in Malaysia.
We benefit from tax incentives in several different jurisdictions, most significantly in Singapore, that have granted tax incentives that require renewal at various times in the future. The tax incentives provide lower rates of taxation on certain classes of income and require various thresholds of investment and employment or specific types of income in those jurisdictions. The tax incentives are due for renewal between 2024 and 2025. The impact of the tax incentives decreased income taxes by $47 million, $567 million and $49 million in 2019, 2018 and 2017, respectively. The decrease in the tax benefit from 2018 to 2019 is primarily due to the one-time impacts of the Singapore restructuring and tax incentive modifications that were completed in 2018 in response to Singapore tax law changes.
The calculation of our tax liabilities involves uncertainties in the application of complex tax law and regulations in a multitude of jurisdictions. Although the guidance on the accounting for uncertainty in income taxes prescribes the use of a recognition and measurement model, the determination of whether an uncertain tax position has met those thresholds will continue to require significant judgment by management. In accordance with the guidance on the accounting for uncertainty in income taxes, for all U.S. and other tax jurisdictions, we recognize potential liabilities for anticipated tax audit issues based on our estimate of whether, and the extent to which, additional taxes and interest will be due. The ultimate resolution of tax uncertainties may differ from what is currently estimated, which could result in a material impact on income tax expense. If our estimate of income tax liabilities proves to be less than the ultimate assessment, a further charge to expense would be required. If the payment of these additional
35
amounts ultimately proves to be unnecessary, the reversal of the liabilities would result in tax benefits being recognized in the period when we determine the liabilities are no longer necessary. We include interest and penalties related to unrecognized tax benefits within the provision for income taxes in the consolidated statements of operations. Accrued interest and penalties are included on the related tax liability line in the consolidated balance sheet.
The open tax years for the IRS and most states are from November 1, 2015 through the current tax year. For the majority of our foreign entities, the open tax years are from November 1, 2014 through the current tax year. For certain foreign entities, the tax years remain open, at most, back to 2008. Given the number of years and numerous matters that remain subject to examination in various tax jurisdictions, we are unable to estimate the range of possible changes to the balance of our unrecognized tax benefits.
The company is being audited in Malaysia for the 2008 tax year. Although this tax year pre-dates our separation from Agilent, pursuant to the agreement between Agilent and Keysight pertaining to tax matters, as finalized at the time of separation, for certain entities, including Malaysia, any historical tax liability is the responsibility of Keysight. In the fourth quarter of fiscal 2017, Keysight paid income taxes and penalties of $68 million on gains related to intellectual property rights, although we are currently in the process of appealing to the SCIT in Malaysia. The company believes there are numerous defenses to the current assessment; the statute of limitations for the 2008 tax year in Malaysia was closed, and the income in question is exempt from tax in Malaysia. The company is disputing this assessment and pursuing all avenues to resolve this issue favorably for the company.
Segment Overview
In 2019 we completed an organizational change to align our services business with our customer-solutions-oriented, go-to-market strategy as reflected by our Keysight Leadership Model ("KLM"). This change was made to fully reflect our services delivery within the markets served and further enable the growth of our services solutions portfolio. Prior period segment results were revised to conform to the presentation. As a result, Keysight has three segments: Communications Solutions Group, Electronic Industrial Solutions Group and Ixia Solutions Group. The organizational structure continues to include centralized enterprise functions that provide support across the groups. The Communications Solutions Group provides electronic design and test software, instruments, systems, services and solutions that span both the global commercial communications and aerospace, defense and government end markets. The Electronic Industrial Solutions Group provides electronic design and test software, instruments, systems, services and solutions across a broad range of electronic industrial end markets, which include automotive and energy, semiconductor, general electronics and education markets. The Ixia Solutions Group provides network testing, visibility and security solutions, strengthening applications across physical and virtual networks for enterprises, service providers, network equipment manufacturers and governments.
The profitability of each of the segments is measured after excluding share-based compensation expense, restructuring and related costs, amortization of acquisition-related balances, acquisition and integration costs, acquisition-related compensation expense, separation and related costs, pension curtailment and settlement loss (gain), northern California wildfire-related costs, goodwill impairment, legal settlement, gain on divestitures, interest income, interest expense and other items.
Communications Solutions Group
The Communications Solutions Group serves customers spanning the worldwide commercial communications and aerospace, defense and government end markets. The group provides electronic design and test software, instruments, systems and related services used in the simulation, design, validation, manufacturing, installation and optimization of electronic equipment.
Net Revenue
Year Ended October 31, | 2019 over 2018 % Change | 2018 over 2017 % Change | |||||||||||||
2019 | 2018 | 2017 | |||||||||||||
(in millions) | |||||||||||||||
Total net revenue | $ | 2,688 | $ | 2,392 | $ | 2,064 | 12% | 16% | |||||||
The Communications Solutions Group's revenue in 2019 increased 12 percent when compared to 2018, primarily driven by strong growth in the commercial communications market, while the aerospace, defense and government market was flat. Revenue growth in the Asia Pacific and the Americas was partially offset by a decline in Europe. The Communications Solutions Group's revenue in 2018 increased 16 percent when compared to 2017, primarily driven by strong growth in the commercial communications and the aerospace, defense and government markets. Revenue grew across all geographies and all markets.
Revenue from the commercial communications market represented approximately 64 percent of total Communications Solutions Group revenue in 2019 and increased 21 percent year over year, with growth across all geographies. This revenue growth was primarily driven by increased 5G investment across the wireless ecosystem and growth in data-center-related next-generation 400 gigabit Ethernet and higher digital test. Revenue from the commercial communications market represented approximately 59
36
percent of total Communications Solutions Group revenue in 2018 and increased 17 percent compared to 2017, growing across all geographies. In 2018 the revenue growth was primarily driven by growth in our 5G-related solutions across the wireless ecosystem, with strong demand for network access applications and steady investments in the network and data center markets.
Revenue from the aerospace, defense and government market represented approximately 36 percent of total Communications Solutions Group revenue in 2019 and was flat when compared to 2018. In 2019 revenue grew in the Americas and Asia Pacific, partially offset by a decline in Europe. Revenue from the aerospace, defense and government market represented approximately 41 percent of total Communications Solutions Group revenue in 2018 and increased 15 percent compared to 2017, growing across all geographies. The growth was primarily driven by higher global defense spending and overall improvement in the global economy.
Gross Margin and Operating Margin
The following table provides Communications Solutions Group margins, expenses and income from operations for 2019 versus 2018, and 2018 versus 2017.
Year Ended October 31, | 2019 over 2018 % Change | 2018 over 2017 % Change | ||||||||||
2019 | 2018 | 2017 | ||||||||||
Total gross margin | 62.6 | % | 58.5 | % | 58.1 | % | 4 ppts | — | ||||
Operating margin | 26.6 | % | 19.8 | % | 16.8 | % | 7 ppts | 3 ppts | ||||
(in millions) | |||||||||||||||
Research and development | $ | 385 | $ | 345 | $ | 310 | 12% | 11% | |||||||
Selling, general and administrative | $ | 592 | $ | 590 | $ | 551 | — | 7% | |||||||
Other operating expense (income), net | $ | (9 | ) | $ | (9 | ) | $ | (9 | ) | (3)% | 5% | ||||
Income from operations | $ | 714 | $ | 474 | $ | 347 | 51% | 36% | |||||||
Gross margin for the Communications Solutions Group in 2019 increased 4 percentage points compared to 2018, primarily driven by higher revenue volume, highly differentiated solutions, favorable mix, and lower warranty costs. Gross margin for the Communications Solutions Group in 2018 was flat compared to 2017, as gains from higher revenue volume were offset by an increase in people-related costs.
Research and development expense in 2019 and 2018 increased 12 percent and 11 percent, respectively when compared to 2018 and 2017, primarily driven by greater investment in key growth opportunities in our end markets, leading-edge technologies, people and infrastructure.
Selling, general and administrative expense in 2019 was flat when compared to 2018, as higher marketing-related investments were offset by declines in selling costs and infrastructure-related costs. Selling, general and administrative expense in 2018 increased 7 percent when compared to 2017, primarily driven by higher infrastructure-related costs, variable people-related costs and investment in sales resources.
Other operating expense (income), net primarily includes property rental income and was income of $9 million in 2019, 2018 and 2017.
Income from Operations
Income from operations for 2019 increased $240 million on corresponding revenue growth of $296 million. Income from operations for 2018 increased $127 million on corresponding revenue growth of $328 million.
Operating margin in 2019 increased 7 percentage points when compared to 2018 driven by higher revenue volume, highly differentiated solutions and favorable mix, while selling, general and administrative expense was flat. Operating margin in 2018 increased 3 percentage points when compared to 2017 as gains from revenue growth were partially offset by increases in variable people-related costs, infrastructure-related costs and investments in sales resources.
Electronic Industrial Solutions Group
The Electronic Industrial Solutions Group provides test and measurement solutions and related services across a broad set of electronic industrial end markets, focusing on high-value applications in the automotive and energy industry and measurement solutions for consumer electronics, education, general electronics design and manufacturing, and semiconductor design and manufacturing. The group provides electronic design and test software, instruments and systems and related services used in the simulation, design, validation, manufacturing, installation and optimization of electronic equipment.
37
Net Revenue
Year Ended October 31, | 2019 over 2018 % Change | 2018 over 2017 % Change | |||||||||||||
2019 | 2018 | 2017 | |||||||||||||
(in millions) | |||||||||||||||
Total net revenue | $ | 1,135 | $ | 1,071 | $ | 929 | 6% | 15% | |||||||
The Electronic Industrial Solutions Group's revenue in 2019 increased 6 percent when compared to 2018, driven by strong growth in general electronics solutions and automotive and energy, while semiconductor measurement solutions remained flat when compared to 2018. Revenue grew across all regions. The Electronic Industrial Solutions Group's revenue in 2018 increased 15 percent when compared to 2017, driven by strong growth in general electronics, automotive and energy and semiconductor solutions. Revenue associated with acquisitions accounted for 3 percentage points of revenue growth for the year ended October 31, 2018 when compared to 2017. Revenue grew across all regions.
Gross Margin and Operating Margin
The following table provides Electronic Industrial Solutions Group margins, expenses and income from operations for 2019 versus 2018, and 2018 versus 2017.
Year Ended October 31, | 2019 over 2018 % Change | 2018 over 2017 % Change | ||||||||||
2019 | 2018 | 2017 | ||||||||||
Total gross margin | 61.1 | % | 58.9 | % | 59.0 | % | 2 ppts | — | ||||
Operating margin | 25.9 | % | 22.9 | % | 22.5 | % | 3 ppts | — | ||||
(in millions) | |||||||||||||||
Research and development | $ | 159 | $ | 145 | $ | 123 | 10% | 17% | |||||||
Selling, general and administrative | $ | 244 | $ | 245 | $ | 219 | — | 11% | |||||||
Other operating expense (income), net | $ | (4 | ) | $ | (4 | ) | $ | (4 | ) | (11)% | 5% | ||||
Income from operations | $ | 294 | $ | 245 | $ | 209 | 20% | 18% | |||||||
Gross margin in 2019 increased 2 percentage points as compared to 2018, primarily driven by higher revenue volume, highly differentiated solutions, favorable mix and lower warranty costs. Gross margin in 2018 was flat when compared to 2017 as gains from higher revenue were offset by unfavorable revenue mix.
Research and development expense in 2019 increased 10 percent when compared to 2018, primarily driven by continued investments in key growth opportunities in our end markets, leading-edge technologies and infrastructure. Research and development expense in 2018 increased 17 percent when compared to 2017, primarily driven by increased investments in key growth opportunities in our end markets and leading-edge technologies, the addition of an acquired company and higher variable people-related costs.
Selling, general and administrative expense in 2019 was flat when compared to 2018, primarily driven by increases in marketing-related investments and selling costs, offset by a decrease in infrastructure-related costs. Selling, general and administrative expense in 2018 increased 11 percent when compared to 2017, primarily driven by the addition of an acquired company and higher infrastructure-related costs, investments in sales resources and variable people-related costs.
Other operating expense (income), net primarily includes property rental income and was income of $4 million in 2019, 2018 and 2017.
Income from Operations
Income from operations for 2019 increased $49 million on corresponding revenue growth of $64 million. Income from operations for 2018 increased $36 million on corresponding revenue growth of $142 million.
Operating margin increased 3 percentage points in 2019 compared to 2018, driven by higher revenue volume, highly differentiated solutions and favorable mix, while the selling general and administrative expenses remained flat. Operating margin was flat in 2018 compared to 2017 as gains from higher revenue were offset by increases in infrastructure-related costs, investments in sales resources and variable people-related costs.
38
Ixia Solutions Group
The Ixia Solutions Group helps customers design, validate and optimize the performance and security resilience of their networks and associated components and applications both pre and post go live. Network test, network visibility and security solutions help organizations and their customers strengthen their physical and virtual networks. The group’s solutions consist of software applications and services, including warranty and maintenance offerings, and high-performance hardware platforms.
Net Revenue
Year Ended October 31, | 2019 over 2018 % Change | 2018 over 2017 % Change | |||||||||||||
2019 | 2018 | 2017 | |||||||||||||
(in millions) | |||||||||||||||
Total net revenue | $ | 489 | $ | 451 | $ | 256 | 9% | n/a | |||||||
The Ixia Solutions Group's revenue in 2019 increased 9 percent when compared to 2018, driven by strong growth in both visibility network and network test solutions. Revenue growth in Asia Pacific and the Americas was partially offset by a decline in Europe. The Ixia Solutions Group's operating results in 2019 and 2018 are not comparable with 2017, which only includes activity from the date of acquisition, April 18, 2017, through October 31, 2017.
The following table provides Ixia Solutions Group margins, expenses and income from operations for 2019 versus 2018, and 2018 versus 2017. The Ixia Solutions Group's operating results in 2019 and 2018 are not comparable with 2017, which only includes activity from the date of acquisition.
Years Ended October 31, | 2019 over 2018 % Change | 2018 over 2017 % Change | |||||||||||||
2019 | 2018 | 2017 | |||||||||||||
Total gross margin | 71.7 | % | 74.2 | % | 76.5 | % | (3) ppts | n/a | |||||||
Operating margin | 5.9 | % | 3.6 | % | 16.3 | % | 2 ppts | n/a | |||||||
(in millions) | |||||||||||||||
Research and development | $ | 126 | $ | 119 | $ | 51 | 6% | n/a | |||||||
Selling, general and administrative | $ | 198 | $ | 199 | $ | 103 | — | n/a | |||||||
Other operating expense (income), net | $ | (2 | ) | $ | — | $ | — | — | n/a | ||||||
Income from operations | $ | 29 | $ | 16 | $ | 42 | 75% | n/a | |||||||
Gross margin in 2019 decreased 3 percentage points as compared to 2018, primarily due to a higher allocation of company infrastructure-related costs after integration.
Research and development expense in 2019 increased 6 percent when compared to 2018, primarily driven by higher people-related costs and continued investments in leading-edge technologies and key growth opportunities in our end markets.
Selling, general and administrative expense in 2019 was flat when compared to 2018, primarily driven by declines in selling and marketing-related costs and synergies derived from integration, offset by an increase in infrastructure-related costs.
Other operating expense (income), net primarily includes property rental income and was income of $2 million in 2019 and zero in both 2018 and 2017.
Income from Operations
Income from operations for 2019 increased $13 million on a corresponding revenue increase of $38 million.
Operating margin increased 2 percentage points in 2019 compared to 2018, driven by higher revenue volume and cost synergies resulting from integration, partially offset by higher allocation of company infrastructure-related costs after integration.
Financial Condition
Liquidity and Capital Resources
Our financial position as of October 31, 2019 consisted of cash, cash equivalents and restricted cash of $1,600 million as compared to $917 million as of October 31, 2018.
As of October 31, 2019, approximately $1,108 million of our cash, cash equivalents and restricted cash was held outside of the U.S. in our foreign subsidiaries. Our cash and cash equivalents mainly consist of short-term deposits held at major global
39
financial institutions, investments in institutional money market funds, and similar short duration instruments with original maturities of 90 days or less. We continuously monitor the creditworthiness of the financial institutions in which we invest our funds. We utilize a variety of funding strategies in an effort to ensure that our worldwide cash is available in the locations in which it is needed. Most significant international locations have access to internal funding through an offshore cash pool for working capital needs. In addition, a few locations that are unable to access internal funding have access to temporary local overdraft and short-term working capital lines of credit.
We believe our cash and cash equivalents, cash generated from operations, and ability to access capital markets and credit lines will satisfy, for at least the next twelve months, our liquidity requirements, both globally and domestically, including the following: working capital needs, capital expenditures, business acquisitions, contractual obligations, commitments, principal and interest payments on debt, and other liquidity requirements associated with our operations.
Net Cash Provided by Operating Activities
Cash flows from operating activities can fluctuate significantly from period to period as working capital needs and the timing of payments for income taxes, restructuring activities, pension funding, variable pay and other items impact reported cash flows.
Net cash provided by operating activities was $998 million for the year ended October 31, 2019 as compared to $555 million provided in 2018 and $328 million provided in 2017.
• | Net income in 2019 increased by $456 million as compared to 2018. Non-cash adjustments in 2019 increased $102 million compared to 2018, driven by a $787 million decrease in the adjustment for deferred tax benefits due to the 2018 impact of U.S. and Singapore tax law changes and the tax impact of goodwill impairment, a $23 million increase in share-based compensation expense, a $19 million reduction in the gain on sales of assets and divestitures and a $5 million increase in amortization expense, partially offset by a $709 million reduction in the goodwill impairment, a $7 million decrease in depreciation expense and a $16 million decrease from other miscellaneous non-cash activities. |
Net income in 2018 increased by $63 million as compared to 2017. Non-cash adjustments in 2018 increased $111 million compared to 2017 due to a $709 million goodwill impairment, a $74 million increase in amortization expense, a $70 million increase from a prior-period pension curtailment and settlement gain, an $11 million increase in depreciation expense and $1 million from other miscellaneous non-cash activities, partially offset by a $742 million increase in the adjustment for deferred tax benefits due to the 2018 impact of U.S. and Singapore tax law changes and the tax impact of goodwill impairment, and a $12 million gain on the sale of assets and divestitures.
• | The aggregate of accounts receivable, inventory and accounts payable used net cash of $105 million during 2019, compared to net cash used of $128 million in 2018 and zero in 2017. The amount of cash flow generated from or used by the aggregate of accounts receivable, inventory and accounts payable depends on the cash conversion cycle, which represents the number of days that elapse from the day we pay for the purchase of raw materials and components to the collection of cash from our customers and can be significantly impacted by the timing of shipments and purchases, as well as collections and payments in a period. |
• | The aggregate of employee compensation and benefits, income taxes payable, deferred revenue, and other assets and liabilities provided net operating cash of $107 million during 2019 as compared to net cash provided of $335 million and $42 million in 2018 and 2017, respectively. The difference between 2019 and 2018 activities is primarily driven by an increase in income taxes payable due to the establishment of a long-term transition tax liability resulting from new U.S. tax legislation that was enacted in 2018 and higher variable compensation payments, partially offset by lower cash outflow for fire-related recovery. In 2019 and 2018, we received insurance proceeds of $37 million and $94 million, respectively, associated with recovery from the northern California wildfires and a 2016 Singapore warehouse fire. |
• | Net cash used for retirement and post-retirement benefits was $37 million, $127 million and $15 million in 2019, 2018 and 2017, respectively. In 2019 we made no contributions to our U.S. Defined Benefit Plans as compared to an accelerated contribution of $85 million in 2018 to secure tax deductibility prior to new tax legislation taking effect and no contributions in 2017. We contributed $26 million to our non-U.S. defined benefit plans during 2019 compared to $33 million in 2018 and $34 million in 2017. We did not contribute to the U.S. Post-Retirement Benefit Plan in 2019, 2018 and 2017. |
Net Cash Used in Investing Activities
Net cash used in investing activities was $196 million, $108 million and $1,722 million in 2019, 2018 and 2017, respectively. Investments in property, plant and equipment were $120 million, $132 million and $72 million in 2019, 2018 and 2017, respectively. Capital spending in 2019 and 2018 includes $7 million and $27 million, respectively, related to recovery from the northern California wildfires.
40
In 2019 we paid $88 million, net of $56 million of cash acquired, for the acquisition of Prisma Telecom Testing, a global provider of radio access network test solutions. We also received $7 million of proceeds from the sale of investments and $2 million from divestitures. In 2018 we paid $5 million for acquisitions and received proceeds of $29 million from divestitures. In 2017 we paid $1,622 million, net of $72 million of cash acquired, for the acquisition of Ixia, $60 million, net of $2 million of cash acquired for the acquisition of ScienLab, and $20 million, net, for other acquisition activity. We also received $8 million of proceeds from the sale of land and $45 million of proceeds from the sale of investments in 2017.
Net Cash Used in Financing Activities
Net cash used in financing activities was $122 million in 2019 compared to $341 million used in 2018 and $1,425 million provided in 2017.
In 2019 we used net cash of $122 million, primarily for a $500 million repayment of short-term debt, $159 million for treasury stock purchases and $26 million of tax payments related to net share settlement of equity awards, partially offset by proceeds from issuance of long-term debt of $496 million, net of issuance costs, and $67 million from issuance of common stock under employee stock plans.
On May 29, 2019, the Board of Directors approved a new stock repurchase program authorizing the purchase of up to $500 million of the company’s common stock, replacing a previously approved 2018 program authorizing the purchase of up to $350 million of the company’s common stock. The stock repurchase program may be commenced, suspended or discontinued at any time at the company’s discretion and does not have an expiration date. See "Issuer Purchases of Equity Securities" under Item 5 for additional information.
In 2018 we used $341 million for financing activities, primarily for a $260 million repayment of term loan borrowings, $120 million for treasury stock purchases, $18 million of tax payments related to net share settlement of equity awards and $6 million for acquisition-related contingent consideration, partially offset by proceeds of $64 million from issuance of common stock under employee stock plans.
In 2017 net cash provided by financing activities was $1,425 million primarily due to proceeds used to fund the acquisition of Ixia, including the issuance of long-term debt of $1,069 million, short-term borrowings of $212 million, and the issuance of common stock under public offering of $444 million, net of issuance costs. We repaid $323 million of the borrowings in 2017, including $182 million of the revolving facility, $140 million of the term loan and a $1 million short-term loan acquired with the acquisition of ScienLab. In addition, during 2017, we issued common stock under employee stock plans of $51 million and made $12 million of tax payments related to net share settlement of equity awards.
Short-term debt
Revolving Credit Facility
On February 15, 2017, we entered into an amended and restated credit agreement (the “Revolving Credit Facility”) that replaced our existing $450 million unsecured credit facility dated September 15, 2014. The Revolving Credit Facility provides for a $450 million, five-year unsecured revolving credit facility that will expire on February 15, 2022 and bears interest at an annual rate of LIBOR + 1.10%. In addition, the Revolving Credit Facility permits us to increase the total commitments under this credit facility by up to $150 million in the aggregate on one or more occasions upon request. We may use amounts borrowed under the facility for general corporate purposes. As of October 31, 2019, we had no borrowings outstanding under the Revolving Credit Facility. We were in compliance with the covenants of the Revolving Credit Facility during the year ended October 31, 2019. During fiscal 2018, we borrowed and repaid $40 million under the Revolving Credit Facility.
Bridge Facility
On January 30, 2017, we entered into a commitment letter, pursuant to which certain lenders agreed to provide a senior unsecured 364-day bridge loan facility of up to $1.684 billion (“the Bridge Facility”) for the purpose of providing the financing to support Keysight's acquisition of Ixia. Under the terms of the commitment letter, the Bridge Facility was automatically terminated upon the acquisition of Ixia on April 18, 2017. For the year ended October 31, 2017, we incurred costs in connection with the Bridge Facility of $9 million that were amortized to interest expense.
2019 Senior Notes
In October 2014, the company issued an aggregate principal amount of $500 million in senior notes ("2019 Senior Notes"). These notes matured on October 30, 2019, and were fully repaid.
41
Long-term debt
The below senior notes are unsecured and rank equally in right of payment with all of our other senior unsecured indebtedness.
2024 Senior Notes
In October 2014, the company issued an aggregate principal amount of $600 million in senior notes ("2024 Senior Notes"). The 2024 Senior Notes were issued at 99.966 percent of their principal amount. The notes will mature on October 30, 2024, and bear interest at a fixed rate of 4.55 percent per annum. The interest is payable semi-annually on April 30 and October 30 of each year.
2027 Senior Notes
In April 2017, the company issued an aggregate principal amount of $700 million in senior notes ("2027 Senior Notes"). The 2027 Senior Notes were issued at 99.873 percent of their principal amount. The notes will mature on April 6, 2027 and bear interest at a fixed rate of 4.60 percent per annum. The interest is payable semi-annually on April 6 and October 6 of each year, commencing on October 6, 2017. We incurred issuance costs of $6 million in connection with the 2027 Senior Notes that, along with the debt discount, are being amortized to interest expense over the term of the senior notes.
2029 Senior Notes
In October 2019, the company issued an aggregate principal amount of $500 million in unsecured senior notes ("2029 Senior Notes"). The 2029 Senior Notes were issued at 99.914 percent of their principal amount. The notes will mature on October 30, 2029 and bear interest at a fixed rate of 3.00 percent per annum. The interest is payable semi-annually on April 30 and October 30 of each year, commencing on April 30, 2020. We incurred issuance costs of $4 million in connection with the 2029 Senior Notes that, along with the debt discount, are being amortized to interest expense over the term of the senior notes.
Senior Unsecured Term Loan
On February 15, 2017, we entered into a term credit agreement that provided for a three-year $400 million senior unsecured term loan that bore interest at an annual rate of LIBOR + 1.50%. The term loan was drawn upon the closing of the Ixia acquisition. On February 27, 2018, we fully repaid the borrowings outstanding under the term loan of $260 million and terminated the term credit agreement. We had previously repaid $140 million of the term loan during the year ended October 31, 2017.
Off Balance Sheet Arrangements and Other
We have contractual commitments for non-cancellable operating leases. See Note 17, "Commitments and Contingencies," to our consolidated financial statements for further information on our non-cancellable operating leases.
Our liquidity is affected by many factors, some of which are based on normal ongoing operations of our business and some of which arise from fluctuations related to global economics and markets. Our cash balances are generated and held in many locations throughout the world. Local government regulations may restrict our ability to move cash balances to meet cash needs under certain circumstances. We do not currently expect such regulations and restrictions to impact our ability to pay vendors and conduct operations throughout our global organization.
Contractual Commitments
Our cash flows from operations are dependent on a number of factors, including fluctuations in our operating results, accounts receivable collections, inventory management, and the timing of tax and other payments. As a result, the impact of contractual obligations on our liquidity and capital resources in future periods should be analyzed in conjunction with such factors.
42
The following table summarizes our total contractual obligations at October 31, 2019. The amounts presented in the table do not reflect $130 million of liabilities for uncertain tax positions as of October 31, 2019. We are unable to accurately predict when these amounts will be realized or released. However, it is reasonably possible that there could be significant changes to our unrecognized tax benefits in the next 12 months due to either the expiration of a statute of limitations or a tax audit settlement.
Total | Less than one year | One to three years | Three to five years | More than five years | |||||||||||||||
(in millions) | |||||||||||||||||||
Senior notes obligations | $ | 1,800 | $ | — | $ | — | $ | 600 | $ | 1,200 | |||||||||
Interest payments on senior notes | 526 | 75 | 149 | 149 | 153 | ||||||||||||||
Operating lease commitments | 196 | 48 | 71 | 31 | 46 | ||||||||||||||
Capital lease commitments | 4 | — | 1 | 2 | 1 | ||||||||||||||
Commitments to contract manufacturers and suppliers | 410 | 408 | 2 | — | — | ||||||||||||||
Retirement plans | 11 | 11 | — | — | — | ||||||||||||||
US transition tax liability | 68 | — | 9 | 20 | 39 | ||||||||||||||
Other purchase commitments | 69 | 69 | — | — | — | ||||||||||||||
Total | $ | 3,084 | $ | 611 | $ | 232 | $ | 802 | $ | 1,439 | |||||||||
Interest on senior notes. We have contractual obligations for interest payments on our senior notes. Interest rates and payment dates are detailed above under "Short-term debt" and "Long-term debt".
Operating leases. Commitments under operating leases relate primarily to leasehold property. See Note 17, "Commitments and Contingencies."
Commitments to contract manufacturers and suppliers. We purchase components from a variety of suppliers and use several contract manufacturers to provide manufacturing services for our products. During the normal course of business, we issue purchase orders with estimates of our requirements several months ahead of the delivery dates. The reported purchase commitments represent the commitments under open purchase orders with our suppliers that have not been received. However, our agreements with these suppliers usually provide us with the option to cancel, reschedule, and adjust our requirements based on business needs prior to firm orders being placed. We expect to fulfill most of our purchase commitments for inventory within one year.
In addition to the commitments to contract manufacturers and suppliers referenced above, we record a liability for firm, non-cancellable and unconditional purchase commitments for quantities in excess of our future demand forecasts consistent with our policy relating to excess inventory. As of October 31, 2019, the liability for our excess firm, non-cancellable and unconditional purchase commitments was $21 million, compared to $17 million as of October 31, 2018. These amounts are included in other accrued liabilities in our consolidated balance sheet.
Retirement plans. Commitments under the retirement plans relate to expected contributions to be made to our non-U.S. defined benefit plans for the next year only. Contributions beyond the next year are impractical to estimate.
We also have benefit payments due under our defined benefit retirement plans and post-retirement benefit plan that are not required to be funded in advance, but are paid in the same period that benefits are provided. See Item 8-Financial Statements and Supplementary Data, Note 15, "Retirement Plans and Post-Retirement Benefit Plans," for additional information.
U.S. transition tax liability. The obligation for the U.S. transition tax liability relates to the one-time U.S. tax on those earnings which have not previously been repatriated to the U.S. (the “Transition Tax”). Keysight has elected to pay the Transition Tax over 8 years. See Item 7. Management's Discussion and Analysis, “Income Taxes,” for additional information on the Transition Tax.
Other purchase commitments. Other purchase commitments relate to contracts with professional services suppliers. We can typically cancel these contracts within 90 days without penalties. For those contracts that are not cancellable within 90 days without penalties, we disclose the amounts we are obligated to pay to a supplier under each contract in that period before such contract can be canceled. As of October 31, 2019, our contractual obligations with these suppliers was approximately $69 million within the next fiscal year, as compared to approximately $59 million as of October 31, 2018.
We had no material off-balance sheet arrangements as of October 31, 2019 or October 31, 2018.
Critical Accounting Policies and Estimates
The preparation of financial statements in accordance with accounting principles generally accepted in the United States requires management to make estimates and assumptions that affect the amounts reported in our consolidated financial statements and accompanying notes. Management bases its estimates on historical experience and various other assumptions believed to be reasonable. Although these estimates are based on management's best knowledge of current events and actions that may impact
43
the company in the future, actual results may be different from the estimates. An accounting policy is deemed to be critical if it requires an accounting estimate to be made based on assumptions about matters that are highly uncertain at the time the estimate is made, and if different estimates that reasonably could have been used or changes in the accounting estimate that are reasonably likely to occur could materially change the financial statements. Our critical accounting policies are those that affect our financial statements materially and involve difficult, subjective or complex judgments by management. Those policies are revenue recognition, inventory valuation, share-based compensation, retirement and post-retirement plan assumptions, valuation of goodwill and other intangible assets, warranty, loss contingencies, restructuring and accounting for income taxes.
Revenue recognition. In May 2014, the Financial Accounting Standards Board issued Accounting Standard Update 2014-09, Revenue from Contracts with Customers, which became effective for us beginning November 1, 2018. For additional information on the new revenue recognition guidance and the impact of adoption, see Note 1, “Overview, Basis of Presentation and Summary of Significant Accounting Policies,” Note 2, “New Accounting Pronouncements,” and Note 4, “Revenue” to the consolidated financial statements.
Revenue is recognized upon transfer of control of the promised products or services to customers in an amount that reflects the consideration we expect to receive in exchange for those products or services. We primarily generate revenue from the sale of products (hardware and/or software), services, or a combination thereof. We enter into contracts that may involve multiple performance obligations, and we allocate the transaction price between each performance obligation on the basis of relative standalone selling price (“SSP”). We recognize revenue following the five-step model.
1. | Identify the contract with a customer: Generally, we consider customer purchase orders which, in some cases are governed by master sales or other purchase agreements, to be the customer contract. All of the following criteria must be met before we consider an agreement to qualify as a contract with a customer under the revenue standard: (i) it must be approved by all parties; (ii) each party’s rights regarding the goods and services to be transferred can be identified; (iii) the payment terms for the goods and services can be identified; (iv) the agreement has commercial substance; and, (v) the customer has the ability and intent to pay and collection of substantially all of the consideration is probable. We exercise reasonable judgment to determine the customer’s ability and intent to pay, which is based upon various factors including the customer’s historical payment experience or credit and financial information and credit risk management measures that we implement. |
2. | Identify the performance obligations in the contract: We assess whether each promised good or service is distinct for the purpose of identifying the various performance obligations in each contract. Promised goods and services are considered distinct provided that: (i) the customer can benefit from the good or service either on its own or together with other resources that are readily available to the customer; and, (ii) our promise to transfer the good or service to the customer is separately identifiable or distinct from other promises in the contract. |
3. | Determine the transaction price: Transaction price reflects the amount of consideration to which we expect to be entitled in exchange for transferring goods or services. Our contracts may include terms that could cause variability in the transaction price including rebates, rights of return, trade-in credits, and discounts. Variable consideration is generally accounted for at the portfolio level and estimated based on historical information. |
4. | Allocate the transaction price to performance obligations in the contract: If the contract contains a single performance obligation, the entire transaction price is allocated to that performance obligation. Many of our contracts include multiple performance obligations with a combination of distinct products and services, maintenance and support, professional services and/or training. For contracts with multiple performance obligations, we allocate the total transaction value to each distinct performance obligation based on relative SSP. Judgment is required to determine the SSP for each distinct performance obligation. The best evidence of SSP is the observable price of a good or service when we sell that good or service separately under similar circumstances to similar customers. Since most contracts contain multiple performance obligations, we use information that may include market conditions and other observable inputs to estimate SSP when we don’t have standalone transactions. |
5. | Recognize revenue when (or as) performance obligations are satisfied: Revenue is recognized at the point in time control is transferred to the customer. For hardware sales, transfer of control to the customer typically occurs at the point the product is shipped or delivered to the customer’s designated location. For software license sales transfer of control to the customer typically occurs upon shipment, electronic delivery, or when the software is available for download by the customer. For sales of implementation service and custom solutions or in instances where products are sold along with essential installation services, transfer of control occurs and revenue is typically recognized upon customer acceptance. For fixed-price support and extended warranty contracts, or certain software arrangements which provide customers with a right to access over a discrete period, control is deemed to transfer over time and revenue is recognized on a straight-line basis over the contract term due to the stand-ready nature of the performance obligation. Revenue from hardware repairs and calibration services outside of an extended warranty or support contract is recognized at the time of completion |
44
of the related service. For other professional services or time-based labor contracts, revenue is recognized as we perform the services and the customers receive and/or consume the benefits.
Inventory valuation. We assess the valuation of our inventory on a periodic basis and make adjustments to the value for estimated excess and obsolete inventory based upon estimates about future demand and actual usage. Such estimates are difficult to make under most economic conditions. The excess balance determined by this analysis becomes the basis for our excess inventory charge. Our excess inventory review process includes analysis of sales forecasts, managing product rollovers and working with manufacturing to maximize recovery of excess inventory. If actual market conditions are less favorable than those projected by management, additional write-downs may be required. If actual market conditions are more favorable than anticipated, inventory previously written down may be sold to customers, resulting in lower cost of sales and higher income from operations than expected in that period.
Share-based compensation. We account for share-based awards in accordance with the provisions of the authoritative accounting guidance, which requires the measurement and recognition of compensation expense for all share-based payment awards made to our employees and directors. The fair value of share-based awards for employee stock option awards was estimated using the Black-Scholes option pricing model. Awards granted under the Keysight Technologies, Inc. Long-Term Performance ("LTP") Program are based on a variety of targets, such as total shareholder return ("TSR") or financial metrics such as operating margin, cost synergies and others. The awards based on TSR were valued using a Monte Carlo simulation model and those based on financial metrics were valued based on the market price of Keysight’s common stock on the date of grant. Both the Black-Scholes and Monte Carlo simulation fair value models require the use of highly subjective and complex assumptions, including the option’s expected life and the price volatility of the underlying stock. The estimated fair value of restricted stock awards is determined based on the market price of Keysight’s common stock on the date of grant. We did not grant any option awards in 2019, 2018 and 2017.
Retirement and post-retirement benefit plan assumptions. Retirement and post-retirement benefit plan costs are a significant cost of doing business. They represent obligations that will ultimately be settled sometime in the future and therefore are subject to estimation. Pension accounting is intended to reflect the recognition of future benefit costs over the employees' average expected future service to Keysight based on the terms of the plans and investment and funding decisions. To estimate the impact of these future payments and our decisions concerning funding of these obligations, we are required to make assumptions using actuarial concepts within the framework of accounting principles generally accepted in the U.S. Two critical assumptions are the discount rate and the expected long-term return on plan assets. Other important assumptions include, expected future salary increases, expected future increases to benefit payments, expected retirement dates, employee turnover, retiree mortality rates, and investment portfolio composition. We evaluate these assumptions at least annually.
The discount rate is used to determine the present value of future benefit payments at the measurement date, which is October 31 for both U.S. and non-U.S. plans. The U.S. discount rates as of October 31, 2019 and 2018 were determined based on the results of matching expected plan benefit payments with cash flows from a hypothetically constructed bond portfolio. The non-U.S. discount rates as of October 31, 2019 and 2018 were determined using spot rates along the yield curve to calculate disaggregated discount rates. In addition, we used this method to calculate two components of the periodic benefit cost: service cost and interest cost. If we changed our discount rate by 1 percent, the impact would be $6 million on U.S. net periodic benefit cost and $11 million on non-U.S. net periodic benefit cost. Lower discount rates increase the present value of the liability and subsequent year pension expense; higher discount rates decrease the present value of the liability and subsequent year pension expense.
The company uses alternate methods of amortization, as allowed by the authoritative guidance, that amortizes the actuarial gains and losses on a consistent basis for the years presented. For U.S. plans, gains and losses are amortized over the average future working lifetime. For most non-U.S. plans and U.S. post-retirement benefit plans, gains and losses are amortized using a separate layer for each year's gains and losses. The expected long-term return on plan assets is estimated using current and expected asset allocations as well as historical and expected returns. Plan assets are valued at fair value. If we changed our estimated return on assets by 1 percent, the impact would be $7 million on U.S. net periodic benefit cost and $14 million on non-U.S. net periodic benefit cost.
Goodwill and other intangible assets. We review goodwill for impairment annually during our fourth fiscal quarter and whenever events or changes in circumstances indicate the carrying value may not be recoverable. As defined in the authoritative guidance, a reporting unit is an operating segment, or one level below an operating segment. At the time of an acquisition, we assign goodwill to the reporting unit that is expected to benefit from the synergies of the combination.
Companies have the option to perform a qualitative assessment to determine whether performing a quantitative test is necessary. If an entity believes, as a result of its qualitative assessment, that it is more-likely-than-not that the fair value of a reporting unit is less than its carrying amount, the quantitative impairment test will be required. Otherwise, no further testing will be required.
45
The quantitative impairment test involves a comparison of the estimated fair value of a reporting unit to its carrying amount, including goodwill. We determine the fair value of a reporting unit using the results derived using the market approach, when available and appropriate, or the income approach, or a combination of both. If multiple valuation methodologies are used, the results are weighted accordingly. The income approach is estimated through the discounted cash flow (“DCF”) analysis. Determining fair value requires the exercise of significant judgment, including judgments about appropriate discount rates, revenue growth rates, and the amount and timing of expected future cash flows. Discount rates are based on a weighted average cost of capital (“WACC”), which represents the average rate a business must pay its providers of debt and equity, plus a risk premium. The WACC used to test goodwill is derived from a group of comparable companies. The cash flows employed in the DCF analysis are derived from internal forecasts and external market forecasts. The market approach estimates the fair value of the reporting unit by utilizing the market comparable method which is based on revenue and earnings multiples from comparable companies. If the estimated fair value of a reporting unit exceeds its carrying amount, goodwill of the reporting unit is not impaired. If the carrying amount of a reporting unit exceeds its estimated fair value, then an impairment charge is recorded for the amount by which the carrying amount exceeds the reporting unit's fair value up to a maximum amount of the goodwill balance for the reporting unit.
In 2019 we performed our annual impairment test for all our reporting units. Based on the results of our testing, the fair value of each of our reporting units exceeded the carrying value. In 2018 we recorded impairment losses of $709 million for our Ixia Solutions Group. See Note 11, "Goodwill and Other Intangible Assets," to the consolidated financial statements for additional information. There was no impairment of goodwill during the year ended October 31, 2017.
Other intangible assets consist primarily of developed technologies, proprietary know-how, trademarks, customer relationships, non-compete agreements, and backlog and are amortized using the straight-line method over estimated useful lives ranging from 6 months to 10 years. We review other intangible assets for impairment whenever events or changes in business circumstances indicate that the carrying amount of the assets may not be fully recoverable or that the useful lives of these assets are no longer appropriate. No impairments of purchased intangible assets were recorded during the years ended October 31, 2019, 2018 and 2017.
We review indefinite-lived intangible assets for impairment whenever events or changes in business circumstances indicate that the carrying amount of the assets may not be fully recoverable or that the useful lives of these assets are no longer appropriate. The authoritative accounting guidance allows a qualitative approach for testing indefinite-lived intangible assets for impairment, similar to the impairment testing guidance for goodwill. It allows the option to first assess qualitative factors (events and circumstances) that could have affected the significant inputs used in determining the fair value of the indefinite-lived intangible asset. The qualitative factors assist in determining whether it is more-likely-than-not that the indefinite-lived intangible asset is impaired. An organization may choose to bypass the qualitative assessment for any indefinite-lived intangible asset in any period and proceed directly to calculating its fair value. Our indefinite-lived intangible assets are in-process research and development ("IPR&D") intangible assets. In 2019, 2018 and 2017, we assessed impairment by performing a qualitative test. No impairment of indefinite-lived intangible assets was recorded in 2019. In 2018 and 2017, we recorded impairment charges of $5 million and $7 million, respectively, related to cancellations of IPR&D projects.
Warranty. Keysight warranties on products sold through direct sales channels are primarily for one year. Warranties for products sold through distribution channels are primarily for three years. We accrue for standard warranty costs based on historical trends in warranty charges. The accrual is reviewed regularly and periodically adjusted to reflect changes in warranty cost estimates. Estimated warranty charges are recorded within cost of products at the time related product revenue is recognized.
We also sell extended warranties that provide warranty coverage beyond the standard warranty term. Revenue associated with extended warranties is deferred and recognized over the extended coverage period.
Loss Contingencies. As discussed in Note 16 and 17 to the consolidated financial statements, we are, from time to time, subject to a variety of litigation and similar contingent liabilities incidental to our business (or the business operations of previously owned entities). We recognize a liability for any contingency that is known or probable of occurrence and reasonably estimable. These assessments require judgments concerning matters such as litigation developments and outcomes, the anticipated outcome of negotiations, the number of future claims and the cost of both pending and future claims. In addition, because most contingencies are resolved over long periods of time, liabilities may change in the future due to various factors. Changes in these factors could materially impact our financial position or our results of operation.
Restructuring. The main component of our restructuring plan is related to workforce reductions and site restructuring. Workforce reduction charges are accrued when payment of benefits becomes probable and the amounts can be estimated. If the amounts and timing of cash flows from restructuring activities are significantly different from what we have estimated, the actual amount of restructuring and other related charges could be materially different, either higher or lower, than those we have recorded.
Accounting for income taxes. We must make certain estimates and judgments in determining income tax expense for financial
46
statement purposes. These estimates and judgments occur in the calculation of tax credits, benefits and deductions, and in the calculation of certain tax assets and liabilities which arise from differences in the timing of recognition of revenue and expense for tax and financial statement purposes, as well as interest and penalties related to uncertain tax positions. Significant changes to these estimates may result in an increase or decrease to our tax provision in a subsequent period.
Significant management judgment is also required in determining whether deferred tax assets will be realized in full or in part. When it is more-likely-than-not that all or some portion of specific deferred tax assets such as net operating losses or foreign tax credit carryforwards will not be realized, a valuation allowance must be established for the amount of the deferred tax assets that cannot be realized. We consider all available positive and negative evidence on a jurisdiction-by-jurisdiction basis when assessing whether it is more likely than not that deferred tax assets are recoverable. We consider evidence such as our past operating results, the existence of losses in recent years and our forecast of future taxable income. At October 31, 2019, the company maintains a valuation allowance mainly related to capital losses in the U.K., net operating losses in the Netherlands and U.K., and California research credits. We intend to maintain a valuation allowance in these jurisdictions until sufficient positive evidence exists to support their reversal.
The calculation of our tax liabilities involves dealing with uncertainties in the application of complex tax law and regulations in a multitude of jurisdictions. Although the guidance on the accounting for uncertainty in income taxes prescribes the use of a recognition and measurement model, the determination of whether an uncertain tax position has met those thresholds will continue to require significant judgment by management. In accordance with the guidance on the accounting for uncertainty in income taxes, for all U.S. and other tax jurisdictions, we recognize potential liabilities for anticipated tax audit issues based on our estimate of whether, and the extent to which, additional taxes and interest will be due. The ultimate resolution of tax uncertainties may differ from what is currently estimated, which could result in a material impact on income tax expense. If our estimate of income tax liabilities proves to be less than the ultimate assessment, a further charge to expense would be required. If events occur and the payment of these amounts ultimately proves to be unnecessary, the reversal of the liabilities would result in tax benefits being recognized in the period when we determine the liabilities are no longer necessary. We include interest and penalties related to unrecognized tax benefits within the provision for income taxes in the consolidated statements of operations.
New Accounting Standards
See Note 2, "New Accounting Pronouncements," to the consolidated financial statements for a description of new accounting pronouncements.
Item 7A. Quantitative and Qualitative Disclosures About Market Risk
At various times, we use derivative financial instruments to limit exposure to changes in foreign currency exchange rates and interest rates. Because derivative instruments are used solely as hedges and not for speculative trading purposes, fluctuations in the market values of such derivative instruments are generally offset by reciprocal changes in the underlying economic exposures that the instruments are intended to hedge. For further discussion of derivative financial instruments, refer to Note 14, "Derivatives."
Currency exchange rate risk
We are exposed to foreign currency exchange rate risks inherent in our sales commitments, anticipated sales, and assets and liabilities denominated in currencies other than the functional currency of our subsidiaries. We hedge future cash flows denominated in currencies other than the functional currency using sales and expense forecasts up to twelve months in advance. Our exposure to exchange rate risks is managed on an enterprise-wide basis. This strategy utilizes derivative financial instruments, including option and forward contracts, to hedge certain foreign currency exposures with the intent of offsetting gains and losses that occur on the underlying exposures with gains and losses on the derivative contracts hedging them. We do not currently and do not intend to utilize derivative financial instruments for speculative trading purposes.
Our operations generate non-functional currency cash flows such as revenue, third-party vendor payments and inter-company payments. In anticipation of these foreign currency cash flows and in view of the volatility of the currency market, we enter into such foreign exchange contracts as described above to substantially mitigate our currency risk. In 2019, 2018 and 2017, approximately 74 percent, 76 percent and 71 percent of our revenues were generated in U.S. dollars.
We performed a sensitivity analysis assuming a hypothetical 10 percent adverse movement in foreign exchange rates to the hedging contracts and the underlying exposures described above. As of October 31, 2019 and 2018, the analysis indicated that these hypothetical market movements would not have a material effect on our consolidated financial position, results of operations or cash flows.
47
Interest rate risk
As of October 31, 2019, we had $1.8 billion in principal amount of senior debt outstanding. The carrying amount of the fixed-rate senior notes was $1.8 billion, and the related fair value based on quoted prices was $1.9 billion. A change in interest rates on long-term debt impacts the fair value of the company’s fixed-rate long-term debt but not the company’s earnings or cash flow because the interest on such debt is fixed. Generally, the fair market value of fixed-rate debt will increase as interest rates fall and decrease as interest rates rise.
As of October 31, 2019, a hypothetical 10 percent increase in interest rates would have decreased the fair value of the company’s fixed-rate long-term debt by approximately $33 million. However, since the company currently has no plans to repurchase its outstanding fixed-rate instruments before their maturity nor do the investors in our fixed-rate debt obligations have the right to demand we pay off these obligations prior to maturity, the impact of market interest rate fluctuations on the company’s fixed-rate long-term debt does not affect the company’s results of operations or stockholders’ equity.
48
Item 8. Financial Statements and Supplementary Data
Index to Consolidated Financial Statements | Page | |
Consolidated Financial Statements: | ||
49
REPORT OF INDEPENDENT REGISTERED PUBLIC ACCOUNTING FIRM
To the Stockholders and Board of Directors of Keysight Technologies, Inc.:
Opinions on the Financial Statements and Internal Control over Financial Reporting
We have audited the accompanying consolidated balance sheets of Keysight Technologies, Inc. and its subsidiaries (the “Company”) as of October 31, 2019 and 2018, and the related consolidated statements of operations, of comprehensive income, of equity and of cash flows for each of the three years in the period ended October 31, 2019, including the related notes and financial statement schedule of valuation and qualifying accounts for each of the three years in the period ended October 31, 2019 appearing under Item 15(a)(2) (collectively referred to as the “consolidated financial statements”). We also have audited the Company’s internal control over financial reporting as of October 31, 2019 based on criteria established in Internal Control - Integrated Framework (2013) issued by the Committee of Sponsoring Organizations of the Treadway Commission (COSO).
In our opinion, the consolidated financial statements referred to above present fairly, in all material respects, the financial position of the Company as of October 31, 2019 and 2018, and the results of its operations and its cash flows for each of the three years in the period ended October 31, 2019 in conformity with accounting principles generally accepted in the United States of America. Also in our opinion, the Company maintained, in all material respects, effective internal control over financial reporting as of October 31, 2019, based on criteria established in Internal Control - Integrated Framework (2013) issued by the COSO.
Changes in Accounting Principles
As discussed in Note 2 to the consolidated financial statements, the Company changed the manner in which it accounts for pension costs and the manner in which it accounts for revenues from contracts with customers in 2019.
Basis for Opinions
The Company’s management is responsible for these consolidated financial statements, for maintaining effective internal control over financial reporting, and for its assessment of the effectiveness of internal control over financial reporting, included in Management’s Report on Internal Control over Financial Reporting appearing under Item 9A. Our responsibility is to express opinions on the Company’s consolidated financial statements and on the Company’s internal control over financial reporting based on our audits. We are a public accounting firm registered with the Public Company Accounting Oversight Board (United States) (PCAOB) and are required to be independent with respect to the Company in accordance with the U.S. federal securities laws and the applicable rules and regulations of the Securities and Exchange Commission and the PCAOB.
We conducted our audits in accordance with the standards of the PCAOB. Those standards require that we plan and perform the audits to obtain reasonable assurance about whether the consolidated financial statements are free of material misstatement, whether due to error or fraud, and whether effective internal control over financial reporting was maintained in all material respects.
Our audits of the consolidated financial statements included performing procedures to assess the risks of material misstatement of the consolidated financial statements, whether due to error or fraud, and performing procedures that respond to those risks. Such procedures included examining, on a test basis, evidence regarding the amounts and disclosures in the consolidated financial statements. Our audits also included evaluating the accounting principles used and significant estimates made by management, as well as evaluating the overall presentation of the consolidated financial statements. Our audit of internal control over financial reporting included obtaining an understanding of internal control over financial reporting, assessing the risk that a material weakness exists, and testing and evaluating the design and operating effectiveness of internal control based on the assessed risk. Our audits also included performing such other procedures as we considered necessary in the circumstances. We believe that our audits provide a reasonable basis for our opinions.
Definition and Limitations of Internal Control over Financial Reporting
A company’s internal control over financial reporting is a process designed to provide reasonable assurance regarding the reliability of financial reporting and the preparation of financial statements for external purposes in accordance with generally accepted accounting principles. A company’s internal control over financial reporting includes those policies and procedures that (i) pertain to the maintenance of records that, in reasonable detail, accurately and fairly reflect the transactions and dispositions of the assets of the company; (ii) provide reasonable assurance that transactions are recorded as necessary to permit preparation of financial statements in accordance with generally accepted accounting principles, and that receipts and
50
expenditures of the company are being made only in accordance with authorizations of management and directors of the company; and (iii) provide reasonable assurance regarding prevention or timely detection of unauthorized acquisition, use, or disposition of the company’s assets that could have a material effect on the financial statements.
Because of its inherent limitations, internal control over financial reporting may not prevent or detect misstatements. Also, projections of any evaluation of effectiveness to future periods are subject to the risk that controls may become inadequate because of changes in conditions, or that the degree of compliance with the policies or procedures may deteriorate.
Critical Audit Matters
The critical audit matters communicated below are matters arising from the current period audit of the consolidated financial statements that were communicated or required to be communicated to the audit committee and that (i) relate to accounts or disclosures that are material to the consolidated financial statements and (ii) involved our especially challenging, subjective, or complex judgments. The communication of critical audit matters does not alter in any way our opinion on the consolidated financial statements, taken as a whole, and we are not, by communicating the critical audit matters below, providing separate opinions on the critical audit matters or on the accounts or disclosures to which they relate.
Goodwill Impairment Assessment - Ixia Solutions Group (“ISG”) Reporting Unit
As described in Notes 1 and 11 to the consolidated financial statements, the Company’s consolidated goodwill balance was $1,209 million as of October 31, 2019, and the goodwill associated with the ISG reportable segment, which only includes the ISG reporting unit, was $407 million. Goodwill is assessed for impairment on a reporting unit basis at least annually in the fourth quarter, as of September 30, or more frequently when events or circumstances occur indicating that the recorded goodwill may be impaired. The impairment test compares the fair value of a reporting unit with its carrying value, with an impairment charge recorded for the amount by which the carrying amount exceeds the reporting unit’s fair value up to a maximum amount of the goodwill balance for the reporting unit. Management determined the fair value of the ISG reporting unit based on the income and market approaches, weighted at 60 and 40 percent, respectively. With respect to the income approach, the discounted cash flow method was used, which included an eight year future cash flow projection and an estimated terminal value. As disclosed by management, determining fair value requires the exercise of significant judgment, including judgments about appropriate discount rates, revenue growth rates, and the amount and timing of expected future cash flows.
The principal considerations for our determination that performing procedures relating to the goodwill impairment assessment of the ISG reporting unit is a critical audit matter are there was significant judgment by management when determining the fair value measurement of the ISG reporting unit. This in turn led to a high degree of auditor judgment, subjectivity, and effort in performing procedures and evaluating evidence related to management’s cash flow projections and significant assumptions related to the revenue growth rates and the discount rate. In addition, the audit effort involved the use of professionals with specialized skill and knowledge to assist in performing these procedures and evaluating the audit evidence obtained from these procedures.
Addressing the matter involved performing procedures and evaluating audit evidence in connection with forming our overall opinion on the financial statements. These procedures included testing the effectiveness of controls relating to management’s goodwill impairment assessment, including controls over the valuation of the Company’s reporting units. These procedures also included, among others, (i) testing management’s process for developing the fair value estimate, (ii) evaluating the appropriateness of the income approach, (iii) testing the completeness, accuracy, and relevance of underlying data used in the income approach, and (iv) evaluating the significant assumptions used by management, including the revenue growth rates and the discount rate. Evaluating management’s assumptions related to the revenue growth rates involved evaluating whether the assumptions used by management were reasonable considering (i) the current and past performance of the reporting unit, (ii) the consistency with external market and industry data, and (iii) whether these assumptions were consistent with evidence obtained in other areas of the audit. Professionals with specialized skill and knowledge were used to assist in the evaluation of the Company’s income approach and certain significant assumptions, including the discount rate.
Income Tax Reserves - Unrecognized Tax Benefits
As described in Note 6 to the consolidated financial statements, as of October 31, 2019, the total amount of gross unrecognized tax benefits was $226 million. The calculation of the tax liabilities involves dealing with uncertainties in the application of complex tax law and regulations in a multitude of jurisdictions. Potential liabilities for anticipated tax audit issues are recognized based on management’s estimate of whether, and the extent to which, additional taxes and interest will be due, and
51
management applies significant judgment in determining whether an uncertain tax position has met the recognition and measurement thresholds.
The principal considerations for our determination that performing procedures relating to unrecognized tax benefits is a critical audit matter are there was significant judgment by management when determining the uncertain tax positions that met the recognition and measurement thresholds, including a high degree of estimation uncertainty relative to the complex tax law and regulations in a multitude of jurisdictions, and the potential for significant adjustments as a result of tax audits. This in turn led to a high degree of auditor judgment, subjectivity, and effort in performing procedures to evaluate management’s assessment of the identified uncertain tax positions that met the recognition and measurement thresholds.
Addressing the matter involved performing procedures and evaluating audit evidence in connection with forming our overall opinion on the consolidated financial statements. These procedures included testing the effectiveness of controls relating to recognition of unrecognized tax benefits. These procedures also included, among others, (i) testing the information used in the calculation of the liability for unrecognized tax benefits, (ii) testing the calculation of the liability for unrecognized tax benefits by jurisdiction, including management’s assessment of the technical merits of uncertain tax positions, (iii) testing the completeness of management’s assessment of both the identification of uncertain tax positions and possible outcomes of each uncertain tax position, and (iv) evaluating the status and results of tax audits with the relevant tax authorities. Procedures were also performed to evaluate the reasonableness of management’s assessment of whether tax positions are more-likely-than-not of being sustained and the amount of potential benefit to be realized, and the application of relevant tax laws.
/s/ PricewaterhouseCoopers LLP
San Francisco, California
December 18, 2019
We have served as the Company’s auditor since 2013.
52
KEYSIGHT TECHNOLOGIES, INC.
CONSOLIDATED STATEMENT OF OPERATIONS
(in millions, except per share data)
Year Ended October 31, | |||||||||||
2019 | 2018 | 2017 | |||||||||
Net revenue: | |||||||||||
Products | $ | $ | $ | ||||||||
Services and other | |||||||||||
Total net revenue | |||||||||||
Costs and expenses: | |||||||||||
Cost of products | |||||||||||
Cost of services and other | |||||||||||
Total costs | |||||||||||
Research and development | |||||||||||
Selling, general and administrative | |||||||||||
Goodwill impairment | |||||||||||
Other operating expense (income), net | ( | ) | ( | ) | ( | ) | |||||
Total costs and expenses | |||||||||||
Income (loss) from operations | ( | ) | |||||||||
Interest income | |||||||||||
Interest expense | ( | ) | ( | ) | ( | ) | |||||
Other income (expense), net | |||||||||||
Income (loss) before taxes | ( | ) | |||||||||
Provision (benefit) for income taxes | ( | ) | |||||||||
Net income | $ | $ | $ | ||||||||
Net income per share: | |||||||||||
Basic | $ | $ | $ | ||||||||
Diluted | $ | $ | $ | ||||||||
Weighted average shares used in computing net income per share: | |||||||||||
Basic | |||||||||||
Diluted | |||||||||||
The accompanying notes are an integral part of these consolidated financial statements.
53
KEYSIGHT TECHNOLOGIES, INC.
CONSOLIDATED STATEMENT OF COMPREHENSIVE INCOME
(in millions)
Year Ended October 31, | |||||||||||
2019 | 2018 | 2017 | |||||||||
Net income | $ | $ | $ | ||||||||
Other comprehensive income (loss): | |||||||||||
Unrealized gain (loss) on investments, net of tax benefit (expense) of zero, $3 and $(1) | ( | ) | |||||||||
Unrealized gain (loss) on derivative instruments, net of tax benefit (expense) of $1, zero and $(2) | ( | ) | |||||||||
Amounts reclassified into earnings related to derivative instruments, net of tax benefit (expense) of zero, $1 and $(1) | ( | ) | |||||||||
Foreign currency translation, net of tax benefit (expense) of zero | ( | ) | ( | ) | |||||||
Net defined benefit pension cost and post retirement plan costs: | |||||||||||
Change in actuarial net gain (loss), net of tax benefit (expense) of $28, $(7) and $(68) | ( | ) | |||||||||
Change in net prior service credit, net of tax benefit of $4, $6 and $9 | ( | ) | ( | ) | ( | ) | |||||
Other comprehensive income (loss) | ( | ) | ( | ) | |||||||
Total comprehensive income | $ | $ | $ | ||||||||
The accompanying notes are an integral part of these consolidated financial statements.
54
KEYSIGHT TECHNOLOGIES, INC.
CONSOLIDATED BALANCE SHEET
(in millions, except par value and share data)
October 31, | |||||||
2019 | 2018 | ||||||
ASSETS | |||||||
Current assets: | |||||||
Cash and cash equivalents | $ | $ | |||||
Accounts receivable, net | |||||||
Inventory | |||||||
Other current assets | |||||||
Total current assets | |||||||
Property, plant and equipment, net | |||||||
Goodwill | |||||||
Other intangible assets, net | |||||||
Long-term investments | |||||||
Long-term deferred tax assets | |||||||
Other assets | |||||||
Total assets | $ | $ | |||||
LIABILITIES AND EQUITY | |||||||
Current liabilities: | |||||||
Short-term debt | $ | $ | |||||
Accounts payable | |||||||
Employee compensation and benefits | |||||||
Deferred revenue | |||||||
Income and other taxes payable | |||||||
Other accrued liabilities | |||||||
Total current liabilities | |||||||
Long-term debt | |||||||
Retirement and post-retirement benefits | |||||||
Long-term deferred revenue | |||||||
Other long-term liabilities | |||||||
Total liabilities | |||||||
Commitments and contingencies (Note 17) | |||||||
Stockholders' equity: | |||||||
Preferred stock; $0.01 par value; 100 million shares authorized; none issued and outstanding | |||||||
Common stock; $0.01 par value; 1 billion shares authorized; 194 million shares at October 31, 2019, and 191 million shares at October 31, 2018 issued | |||||||
Treasury stock at cost; 6.5 million shares at October 31, 2019 and 4.4 million shares at October 31, 2018 | ( | ) | ( | ) | |||
Additional paid-in-capital | |||||||
Retained earnings | |||||||
Accumulated other comprehensive loss | ( | ) | ( | ) | |||
Total stockholders' equity | |||||||
Total liabilities and equity | $ | $ | |||||
The accompanying notes are an integral part of these consolidated financial statements.
55
KEYSIGHT TECHNOLOGIES, INC.
CONSOLIDATED STATEMENT OF CASH FLOWS
(in millions)
Year Ended October 31, | |||||||||||
2019 | 2018 | 2017 | |||||||||
Cash flows from operating activities: | |||||||||||
Net income | $ | $ | $ | ||||||||
Adjustments to reconcile net income to net cash provided by operating activities: | |||||||||||
Depreciation | |||||||||||
Amortization | |||||||||||
Share-based compensation | |||||||||||
Debt issuance expense | |||||||||||
Deferred tax benefit | ( | ) | ( | ) | ( | ) | |||||
Excess and obsolete inventory related charges | |||||||||||
Gain on sale of assets and divestitures | ( | ) | ( | ) | ( | ) | |||||
Goodwill impairment | |||||||||||
Pension curtailment and settlement loss (gain) | ( | ) | |||||||||
Other non-cash expenses, net | ( | ) | |||||||||
Changes in assets and liabilities: | |||||||||||
Accounts receivable | ( | ) | ( | ) | ( | ) | |||||
Inventory | ( | ) | ( | ) | ( | ) | |||||
Accounts payable | |||||||||||
Employee compensation and benefits | ( | ) | |||||||||
Deferred revenue | |||||||||||
Income taxes payable | ( | ) | |||||||||
Retirement and post-retirement benefits | ( | ) | ( | ) | ( | ) | |||||
Other assets and liabilities | ( | ) | |||||||||
Net cash provided by operating activities | |||||||||||
Cash flows from investing activities: | |||||||||||
Purchases of property, plant and equipment | ( | ) | ( | ) | ( | ) | |||||
Proceeds from the sale of assets and divestitures | |||||||||||
Acquisitions of businesses and intangible assets, net of cash acquired | ( | ) | ( | ) | ( | ) | |||||
Proceeds from the sale of investments | |||||||||||
Other investing activities | ( | ) | |||||||||
Net cash used in investing activities | ( | ) | ( | ) | ( | ) | |||||
Cash flows from financing activities: | |||||||||||
Issuance of common stock under employee stock plans | |||||||||||
Issuance of common stock under public offering | |||||||||||
Payment of taxes related to net share settlement of equity awards | ( | ) | ( | ) | ( | ) | |||||
Treasury stock repurchases | ( | ) | ( | ) | |||||||
Proceeds from issuance of long-term debt | |||||||||||
Debt issuance costs | ( | ) | ( | ) | |||||||
Proceeds from short-term borrowings | |||||||||||
Repayment of debt and credit facility | ( | ) | ( | ) | ( | ) | |||||
Payment of acquisition-related contingent consideration | ( | ) | |||||||||
Other financing activities | ( | ) | |||||||||
Net cash provided by/(used in) financing activities | ( | ) | ( | ) | |||||||
Effect of exchange rate movements | ( | ) | |||||||||
Net increase in cash, cash equivalents, and restricted cash | |||||||||||
Cash, cash equivalents, and restricted cash at beginning of year | |||||||||||
Cash, cash equivalents, and restricted cash at end of year | $ | $ | $ | ||||||||
The accompanying notes are an integral part of these consolidated financial statements.
56
KEYSIGHT TECHNOLOGIES, INC.
CONSOLIDATED STATEMENT OF EQUITY
(in millions, except number of shares in thousands)
Common Stock | Treasury Stock | ||||||||||||||||||||||||||||
Number of Shares | Par Value | Additional Paid-in Capital | Number of Shares | Treasury Stock at Cost | Retained Earnings | Accumulated Other Comprehensive Income/(Loss) | Total Stockholders' Equity | ||||||||||||||||||||||
Balance as of October 31, 2016 | $ | $ | ( | ) | $ | ( | ) | $ | $ | ( | ) | $ | |||||||||||||||||
Adjustment due to adoption of new accounting standards | — | — | — | — | — | ( | ) | — | ( | ) | |||||||||||||||||||
Net income | — | — | — | — | — | — | |||||||||||||||||||||||
Other comprehensive income, net of tax | — | — | — | — | — | — | |||||||||||||||||||||||
Issuance of common stock | — | — | — | — | — | ||||||||||||||||||||||||
Public offering of common stock | — | — | — | — | — | ||||||||||||||||||||||||
Share-based compensation | — | — | — | — | — | — | |||||||||||||||||||||||
Tax benefits from share-based awards issued | — | — | — | — | — | — | |||||||||||||||||||||||
Balance as of October 31, 2017 | ( | ) | ( | ) | ( | ) | |||||||||||||||||||||||
Adjustment due to adoption of new accounting standards | — | — | — | — | — | — | |||||||||||||||||||||||
Net income | — | — | — | — | — | — | |||||||||||||||||||||||
Other comprehensive loss, net of tax | — | — | — | — | — | — | ( | ) | ( | ) | |||||||||||||||||||
Issuance of common stock | — | — | — | — | — | ||||||||||||||||||||||||
Share-based compensation | — | — | — | — | — | — | |||||||||||||||||||||||
Repurchase of common stock | — | — | — | ( | ) | ( | ) | — | — | ( | ) | ||||||||||||||||||
Balance as of October 31, 2018 | ( | ) | ( | ) | ( | ) | |||||||||||||||||||||||
Adjustment due to adoption of new accounting standards | — | — | — | — | — | — | |||||||||||||||||||||||
Net income | — | — | — | — | — | — | |||||||||||||||||||||||
Other comprehensive loss, net of tax | — | — | — | — | — | — | ( | ) | ( | ) | |||||||||||||||||||
Issuance of common stock | — | — | — | — | |||||||||||||||||||||||||
Share-based compensation | — | — | — | — | — | ||||||||||||||||||||||||
Repurchase of common stock | — | — | — | ( | ) | ( | ) | — | — | ( | ) | ||||||||||||||||||
Balance as of October 31, 2019 | $ | $ | ( | ) | $ | ( | ) | $ | $ | ( | ) | $ | |||||||||||||||||
The accompanying notes are an integral part of these consolidated financial statements.
57
KEYSIGHT TECHNOLOGIES, INC.
NOTES TO CONSOLIDATED FINANCIAL STATEMENTS
1. | OVERVIEW, BASIS OF PRESENTATION AND SUMMARY OF SIGNIFICANT ACCOUNTING POLICIES |
Overview. Keysight Technologies, Inc. ("we," "us," "Keysight" or the "company"), incorporated in Delaware on December 6, 2013, is a technology company that helps enterprises, service providers and governments accelerate innovation to connect and secure the world by providing electronic design and test solutions that are used in the simulation, design, validation, manufacture, installation, optimization and secure operation of electronics systems in the communications, networking and electronics industries. We also offer customization, consulting and optimization services throughout the customer's product lifecycle, including start-up assistance, asset management, up-time services, application services and instrument calibration and repair.
Basis of Presentation. We have prepared the accompanying financial statements pursuant to the rules and regulations of the Securities and Exchange Commission (“SEC”) and in conformity with generally accepted accounting principles in the U.S. ("GAAP"). Our fiscal year end is October 31. Unless otherwise stated, all years and dates refer to our fiscal year.
Management is responsible for the fair presentation of the accompanying consolidated financial statements, prepared in accordance with GAAP, and has full responsibility for their integrity and accuracy. In the opinion of management, the accompanying consolidated financial statements contain all normal and recurring adjustments necessary to present fairly our consolidated balance sheet and our consolidated statement of operations, statement of comprehensive income, statement of cash flows and statement of equity.
Principles of consolidation. The consolidated financial statements include the accounts of the company and our wholly- and majority-owned subsidiaries. All significant inter-company transactions have been eliminated.
Use of Estimates. The preparation of financial statements in accordance with GAAP requires management to make estimates and assumptions that affect the amounts reported in our consolidated financial statements and accompanying notes. Management bases its estimates on historical experience and various other assumptions believed to be reasonable. Although these estimates are based on management's knowledge of current events and actions that may impact the company in the future, actual results may be different from the estimates. Our critical accounting policies are those that affect our financial statements materially and involve difficult, subjective or complex judgments by management. Those policies are revenue recognition, inventory valuation, share-based compensation, retirement and post-retirement plan assumptions, valuation of goodwill and other intangible assets, warranty, loss contingencies, restructuring and accounting for income taxes.
Revenue recognition. We adopted Accounting Standards Codification (“ASC”) 606, Revenue from Contracts with Customers on November 1, 2018 using the modified retrospective method for all contracts not completed as of the date of adoption. The reported results for 2019 reflect the application of ASC 606 while the reported results for 2018 and 2017 were prepared under the guidance of ASC 605, Revenue Recognition. For additional information on the new revenue recognition guidance and the impact of adoption, see Note 2, "New Accounting Pronouncements."
Revenue is recognized upon transfer of control of the promised products or services to customers in an amount that reflects the consideration we expect to receive in exchange for those products or services. We primarily generate revenue from the sale of products (hardware and/or software), services, or a combination thereof. We enter into contracts that may involve multiple performance obligations, and we allocate the transaction price between each performance obligation on the basis of relative standalone selling price. Revenue is recognized net of allowances for returns and any taxes collected from customers, which are subsequently remitted to governmental authorities.
Nature of Goods and Services
Product revenues are generated predominantly from the sale of various types of design and test software and hardware. Products consist of standalone software and hardware, generally with installed software applications that are licensed on a perpetual and term basis. Our hardware products generally do not have any substantive acceptance terms that would otherwise preclude the transfer of control. Performance obligations related to our software licenses, including the license portion of our software subscriptions, grant the customer the right to use our software via electronic delivery.
58
Service revenues consist of repair and calibration services, extended warranties, technical support for hardware and software, when-and-if available software updates and upgrades, and professional services, including installation and implementation, consulting, and training. Services include both hardware and software services. Repair and calibration services for hardware products are sold both as per-incident customer services and as customer agreements to provide such services over the contractual period. Extended warranties are optional to the customer and provide warranty on hardware products for additional years beyond the standard one-year warranty. Technical support for software and when-and-if available software updates and upgrades are sold either together with our software licenses and software subscriptions, or separately as part of our customer support programs. These are considered stand-ready performance obligations where customers benefit from the services evenly throughout the license or service period. These performance obligations provide the customer access evenly over the contract period. Our professional services may be sold on a time and material basis (e.g., consulting) or on a fixed-fee basis (e.g., non-recurring engineering).
We also generate revenues from a combination of products and services ("custom solutions"), including combinations of hardware, software, installation or other start-up services, software subscriptions, and/or software support services. Custom solutions provide the customer with a combination of hardware, software and professional services to meet customers' unique specifications.
For our contracts with customers, we account for individual performance obligations separately if they are distinct. Our standard payment terms are net 30 to 90 days, and we generally do not offer extended payment terms beyond one year. Our contracts typically contain various forms of variable consideration, including trade discounts, trade-in credits, rebates, and rights of return. The transaction price is allocated to the separate performance obligations on a relative standalone selling price basis. Standalone selling prices for a majority of our products and services are estimated based on our established pricing practices and maximize the use of observable inputs. We have elected to exclude from the measurement of the transaction price all taxes assessed by a governmental authority that are both imposed on and concurrent with a specific revenue-producing transaction and collected by Keysight from a customer (e.g., sales, use, value added, and some excise taxes). We have also elected to account for shipping and handling activities that occur after control of the related good transfers as fulfillment activities instead of assessing such activities as performance obligations.
59
Our typical performance obligations include the following:
Performance obligation | When performance obligation is typically satisfied | When payment is typically due | How standalone selling price is typically determined |
Product Revenues | |||
Hardware | When customer obtains control of the product, typically at delivery (point in time) | Within 30-90 days of shipment | Estimated based on established pricing practices or observable based on standalone sales for certain hardware products |
Software licenses | Upon electronic delivery of the software, and the applicable license period has begun (point in time) | Within 30-90 days of the beginning of license period | Estimated based on established pricing practices or observable based on standalone sales for certain software products |
Threat intelligence solutions | Ratably over the subscription period (over time) | Within 30-90 days of the beginning of subscription period | Estimated based on established pricing practices |
Service Revenues | |||
Calibration contracts | Ratably over the service contract period (over time) | Within 30-90 days of the beginning of service contract period | Estimated based on established pricing practices |
Repair and calibration (per- incident) | As services are performed (point in time) | Within 30-90 days of invoicing for services rendered | Estimated based on established pricing practices |
Extended hardware warranty | Ratably over the warranty period (over time) | Within 30-90 days of invoicing | Estimated based on established pricing practices or observable based on standalone sales of certain hardware warranty contracts |
Technical support and when-and-if-available software updates | Ratably over the license service contract period (over time) | Within 30-90 days of the beginning of license or service contract period | Estimated based on established pricing practices or observable based on standalone sales for certain support contracts |
Professional services | As services are performed based on measures of progress (over time) or at a point in time | Within 30-90 days of invoicing for services rendered | Estimated based on established pricing practices |
Custom Solutions | |||
Custom solutions (milestone-based) | As milestones are achieved based on transfer of control to customer (over time) | Within 30-90 days of milestone achievement | Transaction price, as pricing is custom and can vary significantly from contract to contract |
Custom solutions (point in time) | When customer obtains control of the solution, typically at delivery (point in time) | Within 30-90 days of delivery of solution | Transaction price, as pricing is custom and can vary significantly from contract to contract |
Significant Judgments
Judgment is required to determine the standalone selling price for each distinct performance obligation. As most of our products and services are not sold on a standalone basis, we typically estimate the standalone selling price. In doing so, we consider our internal price list for each product and service, which reflects our desired profitability, based on an expected level of sales, and adjust for factors such as competition, customer relationship, discount provided in the contract, geographic location, and the products and services purchased in the arrangement. We use a range based on actual historical sales to determine whether the calculated standalone selling price for a product or service is a fair representation of the standalone selling price.
60
For capitalized contract costs, we use judgment in determining the capitalized amount.
Our products are generally sold with a right of return and we may provide other credits, discounts, or incentives, which are accounted for as variable consideration when estimating the amount of revenue to recognize. Returns, credits, and discounts are estimated at contract inception and updated at the end of each reporting period as additional information becomes available to the extent that it is probable a significant reversal of the cumulative amount of revenue recognized will not occur once the variability is subsequently resolved.
Shipping and handling costs. Our shipping and handling costs charged to customers are included in net revenue, and the associated expense is recorded in cost of products for all periods presented.
Deferred revenue. We recognize contract liabilities in our consolidated balance sheet as deferred revenue which represents the amount of service and software revenue deferred and recognized over the contractual period or as services are rendered and accepted by the customer. In addition, it includes the amount allocated to undelivered performance obligations.
Inventory. Inventory is valued at standard cost, which approximates actual cost computed on a first-in, first-out basis, not in excess of market value. We assess the valuation of our inventory on a periodic basis and make adjustments to the value for estimated excess and obsolete inventory based on estimates about future demand and actual usage. The excess balance determined by this analysis becomes the basis for our excess inventory charge. Our excess inventory review process includes analysis of sales unit forecasts, managing product rollovers and working with manufacturing to maximize recovery of excess inventory.
Warranty. Keysight warranties on products sold through direct sales channels are primarily for one year. Warranties for products sold through distribution channels are primarily for three years . We accrue for standard warranty costs based on historical trends in warranty charges. The accrual is reviewed regularly and periodically adjusted to reflect changes in warranty cost estimates. Estimated warranty charges are recorded within cost of products at the time related product revenue is recognized. See Note 16, "Guarantees."
We also sell extended warranties that provide warranty coverage beyond the standard warranty term. Revenue associated with extended warranties is deferred and recognized over the extended coverage period.
Taxes on income. Income tax expense is based on income or loss before taxes. Deferred income taxes reflect the effect of temporary differences between asset and liability amounts that are recognized for financial reporting purposes and the amounts that are recognized for income tax purposes. These deferred taxes are measured by applying currently enacted tax laws. Valuation allowances are recognized to reduce deferred tax assets to the amount that is more likely than not to be realized.
We account for uncertainty in income taxes using a two-step approach to recognize and measure uncertain tax positions. The first step is to evaluate the tax position for recognition by determining if the weight of available evidence indicates that it is more likely than not that the position will be sustained on audit, including resolution of related appeals or litigation processes, if any. The second step is to measure the tax benefit as the largest amount that is more than 50 percent likely of being realized upon settlement. We make adjustments to these reserves when facts and circumstances change, such as the closing of a tax audit or the refinement of an estimate due to new information. We classify the liability for unrecognized tax benefits as current to the extent
61
that the company anticipates payment (or receipt) of cash within one year. Interest and penalties related to uncertain tax positions are recognized in the provision for income taxes. Given the number of years and numerous matters that remain subject to examination in various tax jurisdictions, we are unable to estimate the range of possible changes to the balance of our unrecognized tax benefits.
As defined in the authoritative guidance, a reporting unit is an operating segment or one level below an operating segment. During the fourth quarter of 2019, we performed our annual impairment test for all our reporting units. Based on the results of our testing, the fair value of each of our reporting units exceeded the carrying value. We recorded an impairment loss of $709 million for the ISG reporting unit for the year ended October 31, 2018. There were no impairments of goodwill during the years ended October 31, 2019 and 2017. Refer to Note 3, “Acquisitions,” and Note 11, “Goodwill and Other Intangible Assets,” for additional information about our goodwill and other intangible assets.
Other intangible assets consist primarily of developed technologies, proprietary know-how, trademarks, customer relationships, non-compete agreements, and acquired backlog and are amortized using the straight-line method over estimated useful lives ranging from 6 months to 10 years. We review other intangible assets for impairment whenever events or changes in business circumstances indicate that the carrying amount of the assets may not be fully recoverable or that the useful lives of these assets are no longer appropriate. No impairments of purchased intangible assets were recorded during the years ended October 31, 2019, 2018 and 2017.
The authoritative accounting guidance allows a qualitative approach for testing indefinite-lived intangible assets for impairment, similar to the impairment testing guidance for goodwill. It allows the option to first assess qualitative factors (events and circumstances) that could have affected the significant inputs used in determining the fair value of the indefinite-lived intangible asset. The qualitative factors assist in determining whether it is more-likely-than-not that the indefinite-lived intangible asset is impaired. An organization may choose to bypass the qualitative assessment for any indefinite-lived intangible asset in any period and proceed directly to calculating its fair value. Our indefinite-lived intangible assets are in-process research and development ("IPR&D") intangible assets. In 2019 we assessed impairment by performing a qualitative test and concluded that no impairment of indefinite-lived intangible assets was required. As a result of the cancellations of IPR&D projects in 2018 and 2017, we recorded impairment charges of $5 million and $7 million, respectively.
Research and development. Costs related to the research, design and development of our products are charged to research and development expense as they are incurred.
Net income per share. Basic net income per share is computed by dividing net income by the weighted average number of common shares outstanding during the period excluding the dilutive effect of stock options and other employee stock plans. Diluted net income per share gives effect to all potentially dilutive common stock equivalents outstanding during the period. The dilutive effect of share-based awards is reflected in diluted net income per share by application of the treasury stock method, which includes consideration of unamortized share-based compensation expense, and the dilutive effect of in-the-money options and non-vested
62
restricted stock units. Under the treasury stock method, the amount the employee must pay for exercising stock options and unamortized share-based compensation expense are assumed proceeds to be used to repurchase hypothetical shares.
Cash, cash equivalents and short-term investments. We classify investments as cash equivalents if their original maturity or remaining maturity at the time of purchase is three months or less at the date of purchase. Cash equivalents are stated at cost, which approximates fair value.
As of October 31, 2019, approximately $1.1 billion of our cash, cash equivalents and restricted cash was held outside of the U.S. in our foreign subsidiaries. Our cash and cash equivalents mainly consist of short-term deposits held at major global financial institutions, investments in institutional money market funds, and similar short duration instruments with original maturities of 90 days or less. We continuously monitor the creditworthiness of the financial institutions in which we invest our funds. We utilize a variety of funding strategies in an effort to ensure that our worldwide cash is available in the locations in which it is needed. Most significant international locations have access to internal funding through an offshore cash pool for working capital needs. In addition, a few locations that are unable to access internal funding have access to temporary local overdraft and short-term working capital lines of credit.
We classify investments as short-term investments if their original maturities are greater than three months and their remaining maturities are one year or less.
Concentration of credit risk. Financial instruments that potentially subject us to significant concentration of credit risk include money market fund investments, time deposits and demand deposit balances. These investments are categorized as cash and cash equivalents and long-term investments. In addition, we have credit risk from derivative financial instruments used in hedging activities and accounts receivable. We invest in a variety of financial instruments and limit the amount of credit exposure with any one financial institution. We have a comprehensive credit policy in place and credit exposure is monitored on an ongoing basis.
Credit risk with respect to our accounts receivable is diversified due to the large number of entities comprising our customer base and their dispersion across many different industries and geographies. Credit evaluations are performed on customers requiring credit over a certain amount.
Credit risk is mitigated through collateral, such as letters of credit, bank guarantees or payment terms like cash in advance. No single customer accounted for more than 10 percent of accounts receivable as of October 31, 2019 or 2018.
Derivative instruments. We are exposed to global foreign currency exchange rate risk in the normal course of business. We enter into foreign exchange hedging contracts, primarily forward contracts to manage financial exposures resulting from changes in foreign currency exchange rates. Foreign currency exposures include committed and anticipated revenue and expense transactions (cash flow exposure) and assets and liabilities that are denominated in currencies other than the functional currency of the subsidiary (balance sheet exposure). For cash flow hedges, contracts are designed at inception as hedges of the related foreign currency exposures. We formally document all relationships between hedging instruments and hedged items, as well as our risk-management objective and strategy for undertaking various hedge transactions at the inception of the hedge. This process includes linking all derivatives that are designated as cash flow hedges to specific forecasted transactions. We also formally assess, both at the hedge’s inception and on an ongoing basis, whether the hedging instruments are highly effective in offsetting changes in cash flows of hedged items. Our foreign exchange hedging contracts generally mature within fourteen months. We do not use derivative financial instruments for speculative trading purposes.
All derivatives are recognized on the balance sheet at their fair values. For derivative instruments that are designated and qualify as a cash flow hedge, changes in the value of the effective portion of the derivative instrument is recognized in accumulated comprehensive income, a component of stockholders' equity. Amounts associated with cash flow hedges are reclassified and recognized in income when either the forecast transaction occurs or it becomes probable the forecast transaction will not occur.
63
Derivatives not designated as hedging instruments are recorded on the balance sheet at fair value, and changes in fair value are recorded in earnings in the current period. Derivative instruments are subject to master netting arrangements and qualify for net presentation in the balance sheet. Cash flows from derivative instruments are classified in the statement of cash flows in the same category as the cash flows from the hedged or economically hedged item, primarily in operating activities.
Foreign currency translation. We translate and remeasure balance sheet and statement of operations items into U.S. dollars. For those subsidiaries that operate in a local currency functional environment, all assets and liabilities are translated into U.S. dollars using current exchange rates at the balance sheet date; revenue and expenses are translated using monthly exchange rates that approximate average exchange rates in effect during each period. Resulting translation adjustments are reported as a separate component of accumulated other comprehensive income (loss) in stockholders' equity.
For those subsidiaries that operate in a U.S. dollar functional environment, foreign currency assets and liabilities are re-measured into U.S. dollars at current exchange rates except for non-monetary assets and capital accounts, which are remeasured at historical exchange rates. Revenue and expenses are generally remeasured at monthly exchange rates that approximate average exchange rates in effect during each period. Gains or losses from foreign currency re-measurement are included in net income. Net gains or losses resulting from foreign currency transactions are reported in other income (expense) and were a $2 million loss in 2019, a $4 million gain in 2018 and a $1 million gain in 2017.
Retirement plans and post-retirement benefit plan assumptions. Pension accounting is intended to reflect the recognition of future benefit costs over the employees' average expected future service to Keysight based on the terms of the plans and investment and funding decisions. To estimate the impact of these future payments and our decisions concerning funding of these obligations, we are required to make assumptions using actuarial concepts within the framework of GAAP. Two critical assumptions are the discount rate and the expected long-term return on plan assets. Other important assumptions include expected future salary increases, expected future increases to benefit payments, expected retirement dates, employee turnover, retiree mortality rates and investment portfolio composition. We evaluate these assumptions at least annually. See Note 15, "Retirement Plans and Post-Retirement Benefit Plans."
2. | N |
Accounting Standards Update ("ASU") 2014-09, Revenue From Contracts With Customers. In May 2014, the Financial Accounting Standards Board (“FASB”) issued ASU 2014-09 and has since modified the standard with several ASUs (collectively, the “new revenue standard” or "ASC 606"). The new revenue standard requires entities to recognize revenue through the application of a five-step model, which includes: identification of the contract, identification of the performance obligations, determination of the transaction price, allocation of the transaction price to the performance obligations, and recognition of revenue as the entity satisfies the performance obligations. We adopted the new revenue standard on November 1, 2018, using the modified retrospective
64
method with the cumulative effect of initially applying the guidance recognized at the date of adoption. Comparative information has not been restated and continues to be reported under the standards in effect for the prior periods presented. We have applied the new revenue standard only to contracts not completed as of the date of adoption, referred to as open contracts. We have elected the practical expedient that permits an entity to reflect the aggregate effect of all modifications (on a contract-by-contract basis) that occurred before the date of adoption in determining the transaction price, identifying the satisfied and unsatisfied performance obligations, and allocating the transaction price to the performance obligations.
The most significant impact of the new revenue standard was our accounting for software license revenue. Historically, we have deferred revenue for certain types of license arrangements and recognize the revenue ratably over the license term. Under the new revenue standard, we are no longer required to establish vendor-specific objective evidence to recognize software license revenue separately from the other elements, and we are required to recognize software license revenue once the customer obtains control of the license, which will generally occur at the start of each license term. The new revenue standard further requires certain costs, primarily sales-related commissions on contracts, to be capitalized rather than expensed. We reclassified our allowance for sales returns from accounts receivable, net to other accrued liabilities due to the adoption of the new revenue standard.
The cumulative effect of initially applying the new revenue standard to all open contracts as of November 1, 2018 was as follows:
October 31, 2018 | Adjustments Due to ASC 606 | November 1, 2018 | |||||||||
(in millions) | |||||||||||
Assets: | |||||||||||
Accounts receivable, net | $ | $ | $ | ||||||||
Inventory | |||||||||||
Other current assets | |||||||||||
Long-term deferred tax assets | ( | ) | |||||||||
Other assets | |||||||||||
Liabilities: | |||||||||||
Deferred revenue | $ | $ | ( | ) | $ | ||||||
Income and other taxes payable | |||||||||||
Other accrued liabilities | |||||||||||
Long-term deferred revenue | ( | ) | |||||||||
Other long-term liabilities | |||||||||||
Stockholders' equity: | |||||||||||
Retained earnings | $ | $ | $ | ||||||||
65
The following tables summarize the impact of ASC 606 on our condensed consolidated financial statements:
Year ended | |||||||||||
October 31, 2019 | |||||||||||
As Reported | Balances Without Adoption of ASC 606 | Effect of Change Higher/(Lower) | |||||||||
(in millions) | |||||||||||
Net revenue: | |||||||||||
Products | $ | $ | $ | ||||||||
Services and other | ( | ) | |||||||||
Total net revenue | |||||||||||
Costs and expenses: | |||||||||||
Cost of products | |||||||||||
Cost of services and other | |||||||||||
Total costs | |||||||||||
Research and development | |||||||||||
Selling, general and administrative | |||||||||||
Other operating expense (income), net | ( | ) | ( | ) | |||||||
Total costs and expenses | |||||||||||
Income from operations | |||||||||||
Interest income | |||||||||||
Interest expense | ( | ) | ( | ) | |||||||
Other income (expense), net | |||||||||||
Income before taxes | |||||||||||
Provision for income taxes | |||||||||||
Net income | $ | $ | $ | ||||||||
Net income per share: | |||||||||||
Basic | $ | $ | $ | ||||||||
Diluted | $ | $ | $ | ||||||||
October 31, 2019 | |||||||||||
As Reported | Balances Without Adoption of ASC 606 | Effect of Change Higher/(Lower) | |||||||||
(in millions) | |||||||||||
Assets: | |||||||||||
Accounts receivable, net | $ | $ | $ | ||||||||
Inventory | ( | ) | |||||||||
Other current assets | |||||||||||
Long-term deferred tax assets | ( | ) | |||||||||
Other assets | |||||||||||
Liabilities: | |||||||||||
Deferred revenue | $ | $ | $ | ( | ) | ||||||
Income and other taxes payable | |||||||||||
Other accrued liabilities | |||||||||||
Long-term deferred revenue | ( | ) | |||||||||
Other long-term liabilities | |||||||||||
Stockholders' equity: | |||||||||||
Retained earnings | $ | $ | $ | ||||||||
66
ASU 2016-01, Recognition and Measurement of Financial Assets and Financial Liabilities. In January 2016, the FASB issued guidance that amends various aspects of the recognition, measurement, presentation, and disclosure for financial instruments. Most prominent among the changes in the standard is the requirement for changes in the fair value of our equity investments, with certain exceptions, to be recognized in net income rather than other comprehensive income. We adopted the standard effective November 1, 2018 using a modified retrospective approach. We elected to prospectively measure equity investments without readily determinable fair values at cost with adjustments for observable changes in price or impairments. The adoption of this guidance did not have a material impact to our condensed consolidated financial statements.
ASU 2016-02, Leases. In February 2016, the FASB issued guidance that will require substantially all leases to be reported on the balance sheet as right-of-use assets and lease obligations. We expect our leases designated as operating leases in Note 17 will be reported in the consolidated balance sheet upon adoption. Consistent with current GAAP, the recognition, measurement, and presentation of expenses and cash flows arising from a lease by a lessee primarily will depend on its classification as a finance or operating lease. The standard is effective for fiscal years beginning after December 15, 2018 and interim periods within those fiscal years. We will adopt the new standard effective November 1, 2019 using the modified retrospective approach provided by ASU 2018-11, Leases: Targeted Improvements, that allows for a cumulative effect adjustment in the period of adoption. We expect to recognize right-of-use assets and corresponding lease obligations of approximately $145 million to $165 million. We elected the transition package of practical expedients, which among other things, allows us to carry forward the historical lease classification. We will not elect the practical expedient to use hindsight in determining the lease term and in assessing impairment of right-of-use assets. The company has implemented a leasing software solution and is finalizing changes to our business processes, systems, and controls to support adoption of the new standard.
ASU 2016-15, Classification of Certain Cash Receipts and Cash Payments. In August 2016, the FASB issued guidance that adds or clarifies guidance on eight cash flow classification issues that had been creating diversity in practice. We adopted this guidance during the first quarter of 2019 retrospectively to all periods presented, which resulted in the following change to our previously reported condensed consolidated statement of cash flows for the years ended October 31, 2018 and 2017 related to the classification of acquisition-related contingent consideration.
Year Ended October 31, | |||||||||||||||||||||||
2018 | 2017 | ||||||||||||||||||||||
As Originally Reported | As Adjusted | Change | As Originally Reported | As Adjusted | Change | ||||||||||||||||||
(in millions) | |||||||||||||||||||||||
Net cash provided by operating activities | $ | $ | $ | $ | $ | $ | |||||||||||||||||
Net cash used in investing activities | $ | ( | ) | $ | ( | ) | $ | $ | ( | ) | $ | ( | ) | $ | |||||||||
Net cash provided by/(used in) financing activities | $ | ( | ) | $ | ( | ) | $ | ( | ) | $ | $ | $ | |||||||||||
ASU 2016-18, Restricted Cash. In November 2016, the FASB issued guidance that requires an entity to include in its cash and cash equivalent balances in the statement of cash flows those amounts that are deemed to be restricted cash and restricted cash equivalents. We adopted this guidance during the first quarter of 2019 retrospectively to all periods presented. See Note 8, "Supplemental Cash Flow Information."
ASU 2017-07, Improving the Presentation of Net Periodic Pension Cost and Net Periodic Postretirement Benefit Cost. In March 2017, the FASB issued guidance that requires the service cost component of net periodic pension cost and net periodic post-retirement benefit cost to be included in operating expenses (together with other employee compensation costs) and the other components of the cost to be presented in the statement of operations separately from the service cost component and outside of income from operations. We retrospectively adopted this guidance during the first quarter of 2019. The interest cost, expected return on assets, amortization of prior service credits and other costs have been reclassified from cost of products, research and development, selling, general and administrative, and other operating expenses (income) to other income (expense).
67
We elected to apply the practical expedient, which allows us to reclassify amounts disclosed previously in our retirement plans and post-retirement benefit plans note as the basis for applying retrospective presentation for comparative periods as it is impractical to determine the disaggregation of the components for amounts capitalized and reclassified in those periods. On a prospective basis, the service cost component of net periodic pension and post-retirement benefit cost is presented with other current compensation costs in operating income. The remaining components are included in other income (expense) and will not be included in amounts capitalized in inventory or property, plant, and equipment. The effect of the retrospective presentation change related to the retirement plans and post-retirement benefit plans to our previously reported consolidated statement of operations for the years ended October 31, 2018 and 2017 was as follows:
Year Ended October 31, | |||||||||||||||||||||||
2018 | 2017 | ||||||||||||||||||||||
As Originally Reported | As Adjusted | Effect of Change Higher/(Lower) | As Originally Reported | As Adjusted | Effect of Change Higher/(Lower) | ||||||||||||||||||
(in millions) | |||||||||||||||||||||||
Cost of products | $ | $ | $ | $ | $ | $ | |||||||||||||||||
Cost of services and other | |||||||||||||||||||||||
Research and development | |||||||||||||||||||||||
Selling, general and administrative | |||||||||||||||||||||||
Other operating expense (income), net | ( | ) | ( | ) | ( | ) | ( | ) | |||||||||||||||
Other income (expense), net | |||||||||||||||||||||||
ASU 2017-12, Targeted Improvements to Accounting for Hedging Activities. In August 2017, the FASB issued guidance to enable entities to better portray the economics of their risk management activities in the financial statements and enhance transparency and understandability of hedge results. We adopted this guidance during the first quarter of 2019 and elected to continue to record changes in the fair value of components excluded from the effectiveness assessment of cash flow hedges in earnings. The adoption of this guidance did not have a material impact to our condensed consolidated financial statements.
ASU 2018-02, Reclassification of Certain Tax Effects from Accumulated Other Comprehensive Income. In February 2018, the FASB issued guidance that allows a reclassification from accumulated other comprehensive income to retained earnings for stranded tax effects resulting from the Tax Cuts and Jobs Act (the "Act") enacted in December 2017. The standard is effective for fiscal years beginning after December 15, 2018. Early adoption is permitted. We adopted this guidance on November 1, 2018. We elected to retain the income tax effects of the Tax Act as a component of accumulated other comprehensive income. Given this election, the adoption of this guidance did not have a material impact on our condensed consolidated financial statements.
ASU 2018-15, Customer's Accounting for Implementation Costs Incurred in a Cloud Computing Arrangement That Is a Service Contract. In August 2018, the FASB issued guidance that requires a customer in a cloud computing arrangement (i.e., hosting arrangement) that is a service contract to follow the internal-use software guidance to determine which implementation costs to defer and recognize as an asset and aligns the recognition of implementation costs to those incurred in an arrangement that includes an internal-use software license. Further, new disclosures about implementation costs for both internal-use software and hosting arrangements are required. The standard is effective for fiscal years beginning after December 15, 2019 and interim periods within those fiscal years. Early adoption is permitted. We are evaluating the impact of adopting this guidance on our consolidated financial statements.
Other amendments to GAAP that have been issued by the FASB or other standards-setting bodies that do not require adoption until a future date are not expected to have a material impact on our consolidated financial statements upon adoption.
3. | ACQUISITIONS |
Acquisition of Prisma
During the third quarter of fiscal 2019, we acquired Prisma Telecom Testing ("Prisma") for $88 million, net of $56 million cash acquired, and recognized additions to goodwill and other intangible assets of $30 million and $56 million, respectively, based on the preliminary allocation of the purchase price to the estimated fair values of the assets acquired and liabilities assumed. Prisma is a global provider of radio access network test solutions that is expected to expand Keysight’s comprehensive end-to-end 5G test portfolio for the commercial communications ecosystem. The identified intangible assets primarily consisted of developed technology of $42 million, with an estimated useful life of 4 years.
68
Acquisition of Ixia
On April 18, 2017 , pursuant to the terms of an Agreement and Plan of Merger dated January 30, 2017 between Keysight and Ixia (the "Merger Agreement"), we acquired all of the outstanding common stock of Ixia for $1,622 million, net of $72 million of cash acquired, pursuant to an exchange offer for $19.65 per share (the "Merger Consideration"). Pursuant to the Merger Agreement, any outstanding and unexercised Ixia stock options with an exercise price below the Merger Consideration and any outstanding Ixia restricted stock awards were cancelled and converted into the right to receive a cash payment equal to the merger consideration of $19.65 per share (minus the exercise price for the Ixia stock options). The vested portion of the awards associated with prior service of Ixia employees represented approximately $47 million of the total consideration. We funded the acquisition with a combination of cash and proceeds from debt and equity financings. As a result of the acquisition, Ixia has become a wholly-owned subsidiary of Keysight. Accordingly, the results of Ixia are included in Keysight's consolidated financial statements from the date of the acquisition and are reported in the Ixia Solutions Group operating segment.
The Ixia acquisition was accounted for in accordance with the authoritative accounting guidance. The acquired assets and assumed liabilities were recorded by Keysight at their estimated fair values. Keysight determined the estimated fair values with the assistance of appraisals or valuations performed by third party specialists, discounted cash flow analysis, and estimates made by management. At the time of acquisition, we expected to leverage and expand the existing sales channels and product development resources and utilize the assembled workforce. The acquisition also offered opportunities for growth through expanded geographic and customer segment diversity and the ability to leverage additional products and capabilities. These factors, among others, contributed to a purchase price in excess of the estimated fair value of Ixia's net identifiable assets acquired (see summary of net assets below), and, as a result, we have recorded goodwill in connection with this transaction.
All goodwill, approximately $48 million of which is deductible for tax purposes, was assigned to the Ixia Solutions Group.
A portion of the overall purchase price was allocated to acquired intangible assets. Amortization expense associated with acquired intangible assets is not deductible for tax purposes. Therefore, a deferred tax liability of approximately $186 million was established primarily for the future amortization of these intangibles and is included in "other long-term liabilities" in the table below.
The following table summarizes the allocation of the purchase price to the estimated fair values of the assets acquired and liabilities assumed on the closing date of April 18, 2017 (in millions):
Cash and cash equivalents | $ | ||
Short-term investments | |||
Accounts receivable | |||
Inventory | |||
Other current assets | |||
Property, plant and equipment | |||
Goodwill | |||
Other intangible assets | |||
Other assets | |||
Total assets acquired | |||
Accounts payable | ( | ) | |
Employee compensation and benefits | ( | ) | |
Deferred revenue | ( | ) | |
Income and other taxes payable | ( | ) | |
Other accrued liabilities | ( | ) | |
Other long-term liabilities | ( | ) | |
Net assets acquired | $ | ||
The fair values of cash and cash equivalents, short-term investments, accounts receivable, other current assets, accounts payable, employee compensation and benefits, and other accrued liabilities were generally determined using historical carrying values given the short-term nature of these assets and liabilities. The fair values for acquired inventory, property, plant and equipment, intangible assets, and deferred revenue were determined with the input from third-party valuation specialists. The fair values of certain other assets and certain other liabilities were determined internally using historical carrying values and estimates made by management.
69
Valuation of Intangible Assets Acquired
The components of intangible assets acquired in connection with the Ixia acquisition were as follows (in millions):
Estimated Fair Value | Estimated useful life | ||||
Developed product technology | $ | ||||
Customer relationships | |||||
Tradenames and trademarks | |||||
Backlog | |||||
Total intangible assets subject to amortization | |||||
In-process research and development | |||||
Total intangible assets | $ | ||||
As noted above, the intangible assets were valued with input from valuation specialists using the income approach, which includes the discounted cash flow, cost-savings, and relief from royalty methods. The in-process research and development was valued using the multi-period excess earnings method under the income approach by discounting forecasted cash flows directly related to the products expecting to result from the projects, net of returns on contributory assets. A discount rate of 14 % was used to value the research and development projects, adjusted to reflect additional risks inherent in the acquired projects. The primary in-process projects acquired relate to next generation products which will be released in the near future. Total costs to complete for all Ixia in-process research and development were estimated at approximately $12 million as of the close date.
Acquisition of ScienLab
On August 31, 2017, we acquired all of the outstanding common stock of ScienLab for $60 million, net of $2 million of cash acquired, and recognized additions to goodwill and other intangible assets of $23 million and $40 million, respectively. ScienLab is a Germany-based company that provides test solutions to automotive original equipment manufacturers and Tier 1 suppliers in the automotive and energy markets. This acquisition complements our solutions portfolio, allowing end-to-end solutions for hybrid electric vehicles, electric vehicles, and battery test solutions that address e-mobility market needs. The identified intangible assets preliminary consisted of developed technology of $33 million, with an estimated useful life of 6 years.
Supplemental Pro Forma Information (Unaudited)
The following represents pro forma operating results as if Ixia had been included in the company's consolidated statements of operations as of the beginning of fiscal 2017 (in millions, except per share amounts):
Year Ended | |||
October 31, | |||
2017 | |||
Net revenue | $ | ||
Net income | $ | ||
Net income per share - Basic | $ | ||
Net income per share - Diluted | $ | ||
The unaudited pro forma financial information for the year ended October 31, 2017 combine the historical results of Keysight and Ixia for the year ended October 31, 2017, assuming that the companies were combined as of November 1, 2016. The unaudited pro forma financial information includes business combination accounting effects from the acquisition including amortization and depreciation charges from acquired intangible assets, property plant and equipment, interest expense on the financing transactions used to fund the Ixia acquisition and acquisition-related transaction costs and tax-related effects. Pro forma results of operations for Prisma and ScienLab have not been presented because the effects of the acquisition were not material to the company’s financial results.
The pro forma information as presented above is for informational purposes only and is not indicative of the results of operations that would have been achieved if the acquisition had taken place at the beginning of fiscal 2017 for Ixia.
70
4. | REVENUE |
Disaggregation of Revenue
We disaggregate our revenue from contracts with customers by geographic region, end market, and timing of transfer of products and services to customers, as we believe these categories best depict how the nature, amount, timing and uncertainty of our revenue and cash flows are affected by economic factors. Disaggregated revenue is presented for each of our three reportable segments.
Year Ended October 31, 2019 | |||||||||||||||
Communications Solutions Group | Electronic Industrial Solutions Group | Ixia Solutions Group | Total | ||||||||||||
(in millions) | |||||||||||||||
Region | |||||||||||||||
Americas | $ | $ | $ | $ | |||||||||||
Europe | |||||||||||||||
Asia Pacific | |||||||||||||||
Total net revenue | $ | $ | $ | $ | |||||||||||
End Market | |||||||||||||||
Aerospace, Defense & Government | $ | $ | $ | $ | |||||||||||
Commercial Communications | |||||||||||||||
Electronic Industrial | |||||||||||||||
Ixia | |||||||||||||||
Total net revenue | $ | $ | $ | $ | |||||||||||
Timing of Revenue Recognition | |||||||||||||||
Revenue recognized at a point in time | $ | $ | $ | $ | |||||||||||
Revenue recognized over time | |||||||||||||||
Total net revenue | $ | $ | $ | $ | |||||||||||
The timing of revenue recognition, billings and cash collections results in billed accounts receivable, unbilled receivables (contract assets) and deferred revenue (contract liabilities) on our condensed consolidated balance sheet. In addition, we defer and capitalize certain costs incurred to obtain a contract (contract costs).
Contract assets - Contract assets represent unbilled amounts from arrangements for which we have performed by transferring goods or services to the customer in advance of receiving all or partial consideration for such goods and services from the customer. Contract assets arise primarily from service agreements and products delivered pending a formal customer acceptance, which generally occurs within 30 days. The contract assets balance was $34 million and $6 million at October 31, 2019 and November 1, 2018, respectively, and is included in "accounts receivables, net" in our condensed consolidated balance sheet.
Contract costs - We recognize an asset for the incremental costs of obtaining a contract with a customer. We have determined that certain employee and third-party representative commissions programs meet the requirements to be capitalized. Employee commissions are based on the achievement of order volume compared to a sales target. Third-party representative commission costs relate directly to a customer contract as the commission is tied to orders contracted through and contracts arranged by our third-party representatives. Without obtaining the contracts, the commissions would not be paid and, as such, are determined to be an incremental cost to obtaining a contract. We only defer these costs when we have determined the commissions are, in fact, incremental and would not have been incurred absent the customer contract.
Capitalized incremental costs are allocated to the individual performance obligations in proportion to the transaction price allocated to each performance obligation and amortized based on the pattern of performance for the underlying performance obligation. Contract costs related to initial contracts and renewals are amortized over the same period because the commissions paid on both the initial contract and renewals are commensurate with one another.
71
The following table provides a roll-forward of our capitalized contract costs, current and non-current:
Year Ended | |||
October 31, 2019 | |||
(in millions) | |||
Balance at October 31, 2018 | $ | ||
Costs capitalized on November 1, 2018 due to ASC 606 adoption | |||
Costs capitalized during the period | |||
Costs amortized during the period | ( | ) | |
Balance at October 31, 2019 | $ | ||
Contract liabilities - Our contract liabilities consist of deferred revenue that arises when we receive consideration in advance of providing the goods or services promised in the contract. Contract liabilities are primarily generated from customer deposits received in advance of shipments for products or rendering of services and are recognized as revenue when services are provided to the customer. We classify deferred revenue as current or non-current based on the timing of when we expect to recognize revenue. Contract liabilities are recognized as revenue when services are provided to the customer.
Changes in contract liabilities, current and non-current, during 2019 were as follows:
Year Ended | |||
October 31, 2019 | |||
(in millions) | |||
Balance at October 31, 2018 | $ | ||
Impact of adopting new revenue standard | ( | ) | |
Balance at November 1, 2018 | |||
Deferred revenue arising out of acquisitions | |||
Deferral of revenue billed in current period, net of recognition | |||
Revenue recognized that was deferred as of the beginning of the period | ( | ) | |
Balance at October 31, 2019 | $ | ||
Remaining Performance Obligations
Revenue expected to be recognized in any future period related to remaining performance obligations, excluding revenue pertaining to contracts that have an original expected duration of one year or less, was approximately $321 million as of October 31, 2019, and represents the company’s obligation to deliver products and services and obtain customer acceptance on delivered products. Since we typically invoice customers at contract inception, this amount is included in our current and long-term deferred revenue balances. As of October 31, 2019, we expect to recognize approximately 45 % of the revenue related to these unsatisfied performance obligations during 2020, 29 % in 2021 and 26 % thereafter.
Practical Expedients
As discussed in Note 2, "New Accounting Pronouncements," and previously in this note, we have elected the following practical expedients in accordance with ASC 606:
• | We do not disclose the value of remaining performance obligations for contracts with an original expected length of one year or less. |
• | We determine incremental costs of obtaining a contract for a portfolio of contracts with similar characteristics as we reasonably expect that the effects on the financial statements of applying this guidance to the portfolio would not differ materially from applying this guidance to the individual contracts within that portfolio. |
• | We exclude from the transaction price certain taxes (e.g., sales, use, value added, and some excise taxes). |
• | We do not adjust the promised amount of consideration for the effects of a significant financing component if we expect, at contract inception, that the period between when we transfer a promised good or service to a customer and when the customer pays for that good or service will be one year or less. |
• | We treat shipping and handling costs associated with outbound freight after control of a product has transferred to a customer as a fulfillment cost, included in cost of products. |
• | We have applied the guidance only to contracts that have not been completed as of the date of adoption (November 1, 2018). |
• | We did not evaluate individual modifications for those periods prior to the adoption date, but rather evaluated the aggregate effect of all modifications as of the adoption date. |
72
5. | SHARE-BASED COMPENSATION |
Keysight accounts for share-based awards in accordance with the provisions of the authoritative accounting guidance, which requires the measurement and recognition of compensation expense for all share-based payment awards made to our employees and directors, including Restricted Stock Units ("RSUs"), employee stock purchases made under our Employee Stock Purchase Plan (“ESPP”), employee stock option awards, and performance share awards granted to selected members of our senior management under the Long-Term Performance (“LTP”) Program, based on estimated fair values.
Description of Keysight’s Share-Based Plans
Incentive compensation plans. The 2014 Equity and Incentive Compensation Plan (the "2014 Stock Plan") was originally adopted by the Board of Directors ("the Board") on July 16, 2014, subsequently amended and restated by the Board on September 29, 2014 and on January 22, 2015 and became effective as of November 1, 2014 (the “Effective Date”). The Board initially reserved 25 million shares of company common stock that may be issued under the 2014 Stock Plan, plus any shares forfeited or cancelled under the 2014 Stock Plan and subsequently reduced the number to 17 million shares. The Plan was further amended and restated by the Board on November 16, 2017 to increase the maximum aggregate number of shares that may be issued under the Plan to 21.8 million shares. The 2014 Stock Plan provides for the grant of awards in the form of stock options, SARs, restricted stock, RSUs, performance shares and performance units with performance-based conditions on vesting or exercisability, and cash awards. The 2014 Stock Plan has a term of ten years . As of October 31, 2019, approximately 8 million shares were available for future awards under the 2014 Stock Plan.
Stock options granted under the 2014 Stock Plan may be either "incentive stock options," as defined in Section 422 of the Internal Revenue Code, or non-statutory. Options were granted prior to November 1, 2016 and generally vest at a rate of 25 percent per year over a period of four years from the date of grant with a maximum contractual term of ten years . The exercise price for stock options is generally not less than 100 percent of the fair market value of our common stock on the date the stock award is granted.
Effective November 1, 2014, the Compensation Committee of the Board of Directors approved the performance awards, part of the Long-Term Performance (“LTP”) Program administered under the 2014 Stock Plan, for the company's executive officers and other key employees. Participants in this program are entitled to receive unrestricted shares of the company's stock after the end of the contractual period if specified performance targets are met. The maximum contractual period for awards under the performance awards program is three years . These awards can be based on a variety of targets, such as total shareholder return ("TSR") or financial metrics, such as operating margin, cost synergies and others. The final award may vary from zero to 200 percent of the target award based on the actual performance. For TSR-based performance awards, the peer group comparisons are set at the beginning of the performance period. We consider the dilutive impact of this program in our diluted net income per share calculation only to the extent that the performance conditions are met.
Restricted stock units under our share-based plans are granted to directors, executives and employees. The estimated fair value of the restricted stock unit awards granted under the 2014 Stock Plan is determined based on the market price of Keysight common stock on the date of grant. Restricted stock units generally vest, with some exceptions, at a rate of 25 percent per year over a period of four years from the date of grant.
Effective November 1, 2014, the company adopted the Employee Stock Purchase Plan. The ESPP allows eligible employees to contribute up to ten percent of their base compensation to purchase shares of Keysight common stock at 85 percent of the closing market price at the purchase date. Shares authorized for issuance in connection with the ESPP are subject to an automatic annual increase of the lesser of one percent of the outstanding shares of Keysight common stock on November 1 or an amount determined by the Compensation Committee of our Board of Directors. Under the terms of the ESPP, in no event shall the number of shares issued under the ESPP exceed 75 million shares.
Under our ESPP, employees purchased 810,172 shares for $48 million in 2019, 885,110 shares for $36 million in 2018 and 1,085,382 shares for $32 million in 2017. As of October 31, 2019, common stock authorized and available for issuance under our ESPP was 20,491,958 shares, which includes shares issued in November 2019 to participants in consideration of the aggregate contribution of $26 million as of October 31, 2019.
Impact of Share-based Compensation Awards
Share-based compensation expense has been recognized using a straight-line amortization method. The impact of share-based compensation expense on our consolidated statement of operations was as follows:
73
Year Ended October 31, | |||||||||||
2019 | 2018 | 2017 | |||||||||
(in millions) | |||||||||||
Cost of products and services | $ | $ | $ | ||||||||
Research and development | |||||||||||
Selling, general and administrative | |||||||||||
Total share-based compensation expense | $ | $ | $ | ||||||||
The expense for the year ended October 31, 2019 includes a mark-to-market adjustment of $8 million for financial metrics-based performance awards. At October 31, 2019 and 2018, there was no share-based compensation expense capitalized within inventory. The income tax benefit (deficiency) realized from exercised stock options and similar awards recognized was $9 million in 2019 and $5 million in 2018 recorded as a component of income tax expense and $3 million in 2017 recorded as a component of equity.
Valuation Assumptions
The following assumptions were used to estimate the fair value of TSR-based performance awards.
Year Ended October 31, | |||||
2019 | 2018 | 2017 | |||
Volatility of Keysight shares | |||||
Volatility of index/peer group | |||||
Price-wise correlation with selected peers | |||||
The TSR-based performance awards were valued using a Monte Carlo simulation model, which requires the use of highly subjective and complex assumptions, including the price volatility of the underlying stock. The estimated fair value of restricted stock awards and the financial metrics-based performance awards is determined based on the market price of Keysight’s common stock on the grant date. The compensation cost for financial metrics-based performance awards reflect the cost of awards that are probable to vest at the end of the performance period.
Share-based Payment Award Activity
Employee Stock Options: The following table summarizes 2019 activity related to stock option awarded to our employees and directors:
Options Outstanding | Weighted Average Exercise Price | |||||
(in thousands) | ||||||
Outstanding at October 31, 2018 | $ | |||||
Granted | $ | |||||
Exercised | ( | ) | $ | |||
Forfeited and expired | $ | |||||
Outstanding at October 31, 2019 | $ | |||||
There were no forfeited or expired options in 2019.
74
Options Outstanding and Exercisable | ||||||||||||
Range of Exercise Prices | Number Outstanding | Weighted Average Remaining Contractual Life | Weighted Average Exercise Price | Aggregate Intrinsic Value | ||||||||
(in thousands) | (in years) | (in thousands) | ||||||||||
$0 - 25 | $ | $ | ||||||||||
$25.01 - 30 | $ | |||||||||||
$30.01 - 40 | $ | |||||||||||
$ | $ | |||||||||||
The aggregate intrinsic value provided above represents the total pre-tax intrinsic value, based on Keysight's closing stock price of $100.91 at October 31, 2019, that would have been received had all award holders exercised their awards that were in-the-money as of that date. The total number of in-the-money awards exercisable at October 31, 2019 was approximately 0.6 million.
The following table summarizes the aggregate intrinsic value of options exercised in 2019, 2018 and 2017:
Aggregate Intrinsic Value | Weighted Average Exercise Price | ||||||
(in thousands) | |||||||
Options exercised in fiscal 2017 | $ | $ | |||||
Options exercised in fiscal 2018 | $ | $ | |||||
Options exercised in fiscal 2019 | $ | $ | |||||
As of October 31, 2019, the unrecognized share-based compensation costs for outstanding stock option awards was zero . See Note 6, "Income Taxes," for the tax impact on share-based award exercises.
Non-vested Awards
The following table summarizes non-vested award activity in 2019 for our LTP Program and restricted stock unit awards:
Shares | Weighted Average Grant Date Fair Value | |||||
(in thousands) | ||||||
Non-vested at October 31, 2018 | $ | |||||
Granted | $ | |||||
Vested | ( | ) | $ | |||
Forfeited | ( | ) | $ | |||
LTP Program incremental | $ | |||||
Non-vested at October 31, 2019 | $ | |||||
6. | INCOME TAXES |
The domestic and foreign components of income (loss) before taxes are:
Year Ended October 31, | |||||||||||
2019 | 2018 | 2017 | |||||||||
(in millions) | |||||||||||
U.S. operations | $ | $ | ( | ) | $ | ( | ) | ||||
Non-U.S. operations | |||||||||||
Total income (loss) before taxes | $ | $ | ( | ) | $ | ||||||
75
The provision (benefit) for income taxes is comprised of:
Year Ended October 31, | |||||||||||
2019 | 2018 | 2017 | |||||||||
(in millions) | |||||||||||
U.S. federal taxes: | |||||||||||
Current | $ | $ | $ | ||||||||
Deferred | ( | ) | ( | ) | |||||||
Non-U.S. taxes: | |||||||||||
Current | |||||||||||
Deferred | ( | ) | |||||||||
State taxes, net of federal benefit: | |||||||||||
Current | ( | ) | |||||||||
Deferred | ( | ) | ( | ) | |||||||
Total provision (benefit) for income taxes | $ | $ | ( | ) | $ | ||||||
Due to the adoption of ASU 2016-09, excess tax benefits and deductions associated with our various share-based award plans are included as components of income tax expense for fiscal years 2019 and 2018. The income tax provision for fiscal year 2017 does not reflect potential future tax savings resulting from excess deductions associated with our various share-based award plans.
The significant components of deferred tax assets and deferred tax liabilities included in the consolidated balance sheet are:
October 31, | |||||||||||||||
2019 | 2018 | ||||||||||||||
Deferred Tax Assets | Deferred Tax Liabilities | Deferred Tax Assets | Deferred Tax Liabilities | ||||||||||||
(in millions) | |||||||||||||||
Inventory | $ | $ | ( | ) | $ | $ | |||||||||
Intangibles | ( | ) | ( | ) | |||||||||||
Property, plant and equipment | ( | ) | ( | ) | |||||||||||
Warranty reserves | ( | ) | ( | ) | |||||||||||
Pension benefits | ( | ) | ( | ) | |||||||||||
Employee benefits, other than retirement | ( | ) | ( | ) | |||||||||||
Net operating loss, capital loss, and credit carryforwards | |||||||||||||||
Unremitted earnings of foreign subsidiaries | ( | ) | ( | ) | |||||||||||
Share-based compensation | |||||||||||||||
Deferred revenue | ( | ) | ( | ) | |||||||||||
Other | ( | ) | ( | ) | |||||||||||
Subtotal | ( | ) | ( | ) | |||||||||||
Tax valuation allowance | ( | ) | ( | ) | |||||||||||
Total deferred tax assets or deferred tax liabilities | $ | $ | ( | ) | $ | $ | ( | ) | |||||||
The decrease in deferred tax assets in 2019 as compared to 2018 primarily relates to a decrease in intangible assets in Singapore due to amortization, partially offset by an increase in future pension liabilities in the U.S. and Germany. The increase in deferred tax liabilities in 2019 as compared to 2018 primarily relates an increase in future tax liabilities in Italy from a restructuring and a decrease in future pension liabilities in the U.K. and Japan, partially offset by a decrease in intangible assets in the U.S. due to amortization and a decrease in Germany due to a restructuring.
As of October 31, 2019, there was a deferred tax liability of $12 million for the tax liability expected to be imposed upon the repatriation of unremitted foreign earnings that are not considered indefinitely reinvested. As of October 31, 2019, the cumulative amount of undistributed earnings considered indefinitely reinvested was $88 million. No deferred tax liability has been recognized on the basis difference created by such earnings since it is our intention to indefinitely reinvest those earnings in the company’s foreign operations. The amount of the unrecognized deferred tax liability on the indefinitely reinvested earnings was $4 million.
Valuation allowances require an assessment of both positive and negative evidence when determining whether it is more likely than not that deferred tax assets are recoverable. Such assessment is required on a jurisdiction by jurisdiction basis.
The $73 million valuation allowance as of October 31, 2019 is mainly related to capital losses in the U.K., net operating losses in the Netherlands and U.K., and California research credits. The $79 million valuation allowance as of October 31, 2018 was
76
mainly related to California research credits, capital losses in the U.K., and net operating losses in the U.K. and Netherlands. The decrease in valuation allowance from October 31, 2018 to October 31, 2019 is primarily due to a reversal of valuation allowance on a portion of the California research credits. We will maintain a valuation allowance until sufficient positive evidence exists to support reversal.
At October 31, 2019, we had U.S. federal net operating loss carryforwards of approximately $8 million, acquired in the Ixia acquisition, and U.S. state net operating loss carryforwards, primarily acquired in the Ixia acquisition, of approximately $68 million. The U.S. federal net operating losses will expire in years beginning 2026 through 2029 , if not utilized. The U.S. state net operating loss carryforwards will begin to expire in 2025 , if not utilized. At October 31, 2019, we had California research credit carryforwards of approximately $20 million. The California research credits can be carried forward indefinitely. The U.S. federal and state net operating losses and tax credit carryforwards are subject to change of ownership limitations provided by the Internal Revenue Code and similar state provisions. At October 31, 2019, we also had foreign net operating loss carryforwards of approximately $305 million. Of this amount, $116 million will expire in years beginning 2023 through 2029 if not utilized. The remaining $189 million has an indefinite life. At October 31, 2019, we had foreign capital loss carryforwards of approximately $145 million, primarily acquired in the Anite acquisition, with an indefinite life and $3 million of tax credits in foreign jurisdictions with an indefinite life. Some of the foreign losses are subject to annual loss limitation rules. These annual loss limitations in foreign jurisdictions may result in the expiration or reduced utilization of the net operating losses.
Year Ended October 31, | |||||||||||
2019 | 2018 | 2017 | |||||||||
(in millions) | |||||||||||
Profit(loss) before tax times statutory rate | $ | $ | ( | ) | $ | ||||||
State income taxes, net of federal benefit | ( | ) | |||||||||
US tax on non-US entity income | |||||||||||
US benefit on foreign sales | ( | ) | |||||||||
U.S. research credits | ( | ) | ( | ) | ( | ) | |||||
Non-US income taxed at different rates | ( | ) | ( | ) | |||||||
Change in unrecognized tax benefits | ( | ) | |||||||||
Share-based compensation | ( | ) | ( | ) | |||||||
Singapore tax incentive and amortization | ( | ) | |||||||||
Reversal of deferred taxes on foreign earnings not considered indefinitely reinvested | ( | ) | |||||||||
Goodwill impairment | |||||||||||
U.S. federal statutory tax rate change | |||||||||||
Malaysia tax assessment | |||||||||||
Other, net | |||||||||||
Provision (benefit) for income taxes | $ | $ | ( | ) | $ | ||||||
Effective tax rate | % | % | % | ||||||||
We benefit from tax incentives in several jurisdictions, most significantly in Singapore, that have granted us tax incentives that require renewal at various times in the future. The tax incentives provide lower rates of taxation on certain classes of income and require thresholds of investments and employment or specific types of income in those jurisdictions. The tax incentives are due for renewal between 2024 and 2025. The impact of the tax incentives decreased income taxes by $47 million, $567 million and $49 million in 2019, 2018 and 2017, respectively. The benefit of the tax incentives on net income per share (diluted) was approximately $0.25 , $2.97 and $0.27 in 2019, 2018 and 2017, respectively. The decrease in the tax benefit from 2018 to 2019 is primarily due to the one-time impacts included in 2018 of the Singapore restructuring and tax incentive modifications that were completed in that year in response to Singapore tax law changes. Of the $2.97 benefit from the tax incentives on net income per share (diluted) in 2018, $2.75 relates to one-time items resulting from the Singapore restructuring.
For 2019, the effective tax rate was 13 percent, which is lower than the U.S. statutory rate primarily due a higher percentage of earnings in the non-US jurisdictions taxed at lower statutory rates.
For 2018, the effective tax rate was 140 percent, which is higher than the U.S. statutory rate primarily due to the impact of U.S. tax law changes, the Singapore restructuring and tax incentive modifications completed in 2018 in response to Singapore tax law changes, and the tax impact of goodwill impairment.
77
For 2017, the effective tax rate was 43 percent, which is higher than the U.S. statutory rate primarily due to the payment of a prior year Malaysia tax assessment of $68 million, including tax and penalties, which we are currently in the process of appealing to the Special Commissioners of Income Tax (“SCIT”) in Malaysia.
The breakdown between current and long-term income tax assets and liabilities, excluding deferred tax assets and liabilities, was as follows for the years 2019 and 2018:
October 31, | |||||||
2019 | 2018 | ||||||
(in millions) | |||||||
Current income tax assets (included within other current assets) | $ | $ | |||||
Current income tax liabilities (included within income and other taxes payable) | ( | ) | ( | ) | |||
Long-term income tax assets (included within other assets) | |||||||
Long-term income tax liabilities (included within other long-term liabilities) | ( | ) | ( | ) | |||
Total | $ | ( | ) | $ | ( | ) | |
The calculation of our tax liabilities involves uncertainties in the application of complex tax law and regulations in a multitude of jurisdictions. Although the guidance on the accounting for uncertainty in income taxes prescribes the use of a recognition and measurement model, the determination of whether an uncertain tax position has met those thresholds will continue to require significant judgment by management. In accordance with the guidance on the accounting for uncertainty in income taxes, for all U.S. and other tax jurisdictions, we recognize potential liabilities for anticipated tax audit issues based on our estimate of whether, and the extent to which, additional taxes and interest will be due. The ultimate resolution of tax uncertainties may differ from what is currently estimated, which could result in a material impact on income tax expense. If our estimate of income tax liabilities proves to be less than the ultimate assessment, a further charge to expense would be required. If the payment of these additional amounts ultimately proves to be unnecessary, the reversal of the liabilities would result in tax benefits being recognized in the period when we determine the liabilities are no longer necessary. We include interest and penalties related to unrecognized tax benefits within the provision for income taxes in the consolidated statements of operations. Accrued interest and penalties are included on the related tax liability line in the consolidated balance sheet.
The aggregate changes in the balances of our unrecognized tax benefits including all federal, state and foreign tax jurisdictions are as follows:
2019 | 2018 | 2017 | |||||||||
(in millions) | |||||||||||
Gross Balance, beginning of year | $ | $ | $ | ||||||||
Additions due to acquisition | |||||||||||
Additions for tax positions related to the current year | |||||||||||
Additions for tax positions from prior years | |||||||||||
Reductions for tax positions from prior years | ( | ) | ( | ) | ( | ) | |||||
Settlements with taxing authorities | ( | ) | |||||||||
Statute of limitations expirations | ( | ) | ( | ) | ( | ) | |||||
Gross Balance, end of year | $ | $ | $ | ||||||||
As of October 31, 2019, the total amount of gross unrecognized tax benefits was $226 million, that, if recognized, $216 million would impact our effective tax rate. However, approximately $9 million of the unrecognized tax benefits were related to acquisitions, which if recognized within certain agreed upon time periods, would be offset due to an indemnification asset recognized. As of October 31, 2018, the total amount of gross unrecognized tax benefits was $234 million, that, if recognized, $227 million would impact our effective tax rate.
We recognized tax expense of $2 million, $2 million, and $18 million of interest and penalties related to unrecognized tax benefits in 2019, 2018 and 2017, respectively. We recorded an additional $4 million of interest and penalties related to unrecognized tax benefits in 2019 through purchase accounting related to acquisitions. Cumulatively, interest and penalties accrued as of the end of October 31, 2019, 2018 and 2017 were $28 million, $22 million and $20 million, respectively.
The open tax years for the IRS and most states are from November 1, 2015 through the current tax year. For the majority of our foreign entities, the open tax years are from November 1, 2014 through the current tax year. For certain foreign entities, the tax years remain open, at most, back to the year 2008 . Given the number of years and numerous matters that remain subject to examination in various tax jurisdictions, we are unable to estimate the range of possible changes to the balance of our unrecognized tax benefits.
78
The company is being audited in Malaysia for the 2008 tax year. Although this tax year pre-dates our spin-off from Agilent, pursuant to the agreement between Agilent and Keysight pertaining to tax matters, as finalized at the time of separation, for certain entities including Malaysia, any historical tax liability is the responsibility of Keysight. In the fourth quarter of fiscal 2017, Keysight paid income taxes and penalties of $68 million on gains related to intellectual property rights, although we are currently in the process of appealing to the SCIT in Malaysia. The company believes there are numerous defenses to the current assessment; the statute of limitations for the 2008 tax year in Malaysia is closed and the income in question is exempt from tax in Malaysia. The company is disputing this assessment and pursuing all avenues to resolve this issue favorably for the company.
7. | NET INCOME PER SHARE |
The following is a reconciliation of the numerator and denominator of the basic and diluted net income per share computations.
Year Ended October 31, | |||||||||||
2019 | 2018 | 2017 | |||||||||
(in millions) | |||||||||||
Numerator: | |||||||||||
Net income | $ | $ | $ | ||||||||
Denominator: | |||||||||||
Basic weighted-average shares | |||||||||||
Potential common shares— stock options and other employee stock plans | |||||||||||
Diluted weighted-average shares | |||||||||||
The dilutive effect of share-based awards is reflected in diluted net income per share by application of the treasury stock method, which includes consideration of unamortized share-based compensation expense and the dilutive effect of in-the-money options and non-vested restricted stock units. Under the treasury stock method, the amount the employee must pay for exercising stock options and unamortized share-based compensation expense are collectively assumed to be used to repurchase hypothetical shares. The increase in diluted weighted average shares for the year ended October 31, 2018 includes 5 million shares attributed to the weighted impact of 13 million shares of common stock issued in March 2017.
We exclude stock options with exercise prices greater than the average market price of our common stock from the calculation of diluted earnings per share because their effect would be anti-dilutive. For the years ended 2019, 2018 and 2017, we excluded zero shares from the calculation of diluted earnings per share. In addition, we also exclude from the calculation of diluted earnings per share, stock options, ESPP, LTP Program and restricted stock awards, whose combined exercise price and unamortized fair value collectively were greater than the average market price of our common stock because their effect would also be anti-dilutive. The impact was immaterial in 2019, 2018 and 2017.
8. | SUPPLEMENTAL CASH FLOW INFORMATION |
Net cash paid for income taxes was $103 million in 2019, $27 million in 2018 and $121 million in 2017. Higher tax payments in 2019 were primarily due to increased net income and payments on the tax liability established in 2018 related to new U.S. tax legislation. The 2017 payments include $68 million paid to the Malaysia tax authority associated with a tax assessment on gains related to intellectual property transfers that we are currently in the process of appealing to the Special Commissioners of Income Tax in Malaysia.
Cash paid for interest was $76 million in 2019, $79 million in 2018 and $64 million in 2017. In 2017 we also paid fees of $9 million in connection with a bridge loan facility that were amortized to interest expense and classified as a financing activity in our consolidated statement of cash flows.
79
The following table summarizes our non-cash investing activities that are not reflected in the consolidated statement of cash flows:
Year Ended October 31, | |||||||||||
2019 | 2018 | 2017 | |||||||||
(in millions) | |||||||||||
Non-cash investing activities: | |||||||||||
Increase (decrease) in unpaid capital expenditures in accounts payable | $ | ( | ) | $ | $ | ( | ) | ||||
Increase in capital lease liabilities | |||||||||||
$ | ( | ) | $ | $ | |||||||
The following table provides a reconciliation of cash, cash equivalents and restricted cash reported within the consolidated balance sheet to the amount shown in the consolidated statement of cash flows:
October 31, 2019 | October 31, 2018 | ||||||
(in millions) | |||||||
Cash and cash equivalents | $ | $ | |||||
Restricted cash included in other current assets | |||||||
Restricted cash included in other assets | |||||||
Total cash, cash equivalents, and restricted cash shown in the statement of cash flows | $ | $ | |||||
Restricted cash consisted primarily of deposits held as collateral against bank guarantees.
9. | INVENTORY |
October 31, | |||||||
2019 | 2018 | ||||||
(in millions) | |||||||
Finished goods | $ | $ | |||||
Purchased parts and fabricated assemblies | |||||||
Total inventory | $ | $ | |||||
Inventory-related excess and obsolescence charges recorded in total cost of products were $27 million in 2019, $25 million in 2018 and $16 million in 2017. We record excess and obsolete inventory charges for inventory at our sites as well as inventory at our contract manufacturers and suppliers, where we have non-cancellable purchase commitments.
10. | PROPERTY, PLANT AND EQUIPMENT, NET |
October 31, | |||||||
2019 | 2018 | ||||||
(in millions) | |||||||
Land | $ | $ | |||||
Buildings and leasehold improvements | |||||||
Machinery and equipment | |||||||
Total property, plant and equipment | |||||||
Accumulated depreciation and amortization | ( | ) | ( | ) | |||
Property, plant and equipment, net | $ | $ | |||||
Asset impairments were zero in 2019, 2018 and 2017. Depreciation expense was $96 million in 2019, $103 million in 2018 and $92 million in 2017. Buildings and leasehold improvements include assets held under capital lease of $4 million and $4 million at October 31, 2019 and 2018, respectively.
In 2014 we entered into a binding contract to sell land in the United Kingdom that resulted in the transfers of three separate land tracts from 2014 through 2017 totaling approximately $34 million. In 2017 we recognized a gain of $8 million on the sale of the land tracts in other operating expense (income).
80
11. | GOODWILL AND OTHER INTANGIBLE ASSETS |
The goodwill balances as of October 31, 2019, 2018 and 2017 and the movements in 2019 and 2018 for each of our reportable segments were as follows:
Communications Solutions Group | Electronic Industrial Solutions Group | Ixia Solutions Group | Total | ||||||||||||
(in millions) | |||||||||||||||
Goodwill at October 31, 2017 | $ | $ | $ | $ | |||||||||||
Foreign currency translation impact | ( | ) | ( | ) | ( | ) | ( | ) | |||||||
Goodwill arising from acquisitions | |||||||||||||||
Impairment losses | ( | ) | ( | ) | |||||||||||
Divestitures | ( | ) | ( | ) | ( | ) | |||||||||
Goodwill at October 31, 2018 | |||||||||||||||
Foreign currency translation impact | |||||||||||||||
Goodwill arising from acquisitions | |||||||||||||||
Goodwill at October 31, 2019 | $ | $ | $ | $ | |||||||||||
Goodwill | $ | $ | $ | $ | |||||||||||
Accumulated impairment losses | ( | ) | ( | ) | |||||||||||
Goodwill at October 31, 2019 | $ | $ | $ | $ | |||||||||||
Other intangible assets as of October 31, 2019 and 2018 consisted of the following:
Other Intangible Assets as of October 31, 2019 | Other Intangible Assets as of October 31, 2018 | ||||||||||||||||||||||
Gross Carrying Amount | Accumulated Amortization | Net Book Value | Gross Carrying Amount | Accumulated Amortization | Net Book Value | ||||||||||||||||||
(in millions) | |||||||||||||||||||||||
Developed technology | $ | $ | $ | $ | $ | $ | |||||||||||||||||
Backlog | |||||||||||||||||||||||
Trademark/Tradename | |||||||||||||||||||||||
Customer relationships | |||||||||||||||||||||||
Non-compete agreements | |||||||||||||||||||||||
Total amortizable intangible assets | |||||||||||||||||||||||
In-Process R&D | — | — | |||||||||||||||||||||
Total | $ | $ | $ | $ | $ | $ | |||||||||||||||||
In 2019 we recorded additions to goodwill and other intangible assets of $30 million and $56 million, respectively, due to the acquisition of Prisma. For additional information on the acquisition of Prisma, see Note 3, "Acquisitions."
In 2018 we recorded additions to goodwill of $6 million due to an acquisition and a $3 million reduction due to divestiture-related activity. In 2018 we transferred $23 million from in-process R&D to developed technology as projects were successfully completed. In 2018 we recorded an impairment charge of $5 million related to the cancellation of an in-process R&D project.
There was a $1 million foreign exchange translation impact to other intangible assets in 2019 and 2018.
Amortization of other intangible assets was $210 million in 2019, $204 million in 2018 and $131 million in 2017. Estimated intangible assets amortization expense for each of the five succeeding fiscal years is as follows:
Amortization expense | |||
(in millions) | |||
2020 | $ | ||
2021 | |||
2022 | |||
2023 | |||
2024 | |||
Thereafter | |||
81
We test goodwill for impairment annually in the fourth quarter of each year, after the annual update to our long-term financial forecasts during our strategic planning cycle, using data as of September 30 of that year. The impairment test compares the fair value of a reporting unit with its carrying amount, with an impairment charge recorded for the amount by which the carrying amount exceeds the reporting unit’s fair value up to a maximum amount of the goodwill balance for the reporting unit. We determine fair values for each of the reporting units using the market approach, when available and appropriate, or the income approach, or a combination of both. If multiple valuation methodologies are used, the results are weighted accordingly.
Valuations using the market approach are derived from metrics of publicly traded comparable companies. The selections of comparable businesses are based on the markets in which our reporting units operate, giving consideration to risk profiles, size, geography, and diversity of products and services.
Under the income approach, fair value is determined based on the present value of estimated future cash flows, discounted at an appropriate risk-adjusted rate. We use our internal forecasts to estimate future cash flows and include an estimate of long-term future growth rates based on our most recent views of the long-term outlook for each business.
In 2018 we performed our annual impairment test of goodwill for all our reporting units using a qualitative approach, except for our Ixia Solutions Group ("ISG") reporting unit, which is the only reporting unit in the ISG reportable segment, for which the test was performed using a quantitative approach since their revenue and earnings had not been consistent with originally projected results, thus requiring a reduction of our long-term financial forecasts included in our revised strategic plan. The income and market approaches were used to determine the fair value of the ISG reporting unit. With respect to the income approach, the discounted cash flow method was used, which included an eight-year future cash flow projection and an estimated terminal value. The market approach used revenue and EBITDA multiples to develop an estimate of fair value. A weighting of 60 percent and 40 percent was applied to the income and market approaches, respectively, to determine the fair value of the ISG reporting unit. The income approach was given a larger weighting based on the underlying detailed financial projections prepared during the strategic planning cycle which reflect the financial and operational facts and circumstances specific to ISG as of the valuation date. Based on the results of our testing, the fair value of our ISG reporting unit did not exceed the carrying value. The primary factors contributing to a reduction in fair value of ISG were weaker-than-expected market growth rates since acquisition and significant integration efforts in 2018 resulting in lower revenue and profitability trends included in our long-term financial forecasts. As a result, we recorded an impairment loss of $709 million for ISG in 2018.
During the fourth quarter of 2019, we performed our annual impairment test of goodwill for all our reporting units using a qualitative approach, except for our ISG reporting unit, which is the only reporting unit in the ISG reportable segment, for which the test was performed using a quantitative approach. The income and market approaches were used to determine the fair value of the ISG reporting unit. With respect to the income approach, the discounted cash flow method was used, which included an eight-year future cash flow projection and an estimated terminal value. The market approach used revenue and EBITDA multiples to develop an estimate of fair value. A weighting of 60 percent and 40 percent was applied to the income and market approaches, respectively, to determine the fair value of the ISG reporting unit. The income approach was given a larger weighting based on the underlying detailed financial projections prepared during the strategic planning cycle that reflect the financial and operational facts and circumstances specific to ISG as of the valuation date. Based on the results of our annual impairment tests, the fair value of each of our reporting units exceeded the carrying value.
As of October 31, 2019, we determined that no goodwill impairment exists, and that the remaining goodwill is recoverable for all of our reporting units; however, there can be no assurance that additional goodwill will not be impaired in future periods. Estimating the fair value of reporting units requires the use of estimates and significant judgments that are based on a number of factors including actual operating results. It is possible that the judgments and estimates described above could change in future periods.
We review long-lived assets for impairment whenever events or changes in business circumstances indicate that the carrying amount of the assets may not be fully recoverable or that the useful lives of these assets are no longer appropriate. We performed an impairment test of ISG's intangible assets in 2019 and 2018 and concluded that no impairment charge was required.
82
12. | INVESTMENTS |
The net book value of investments as of October 31, 2019 and 2018 was as follows:
October 31, | |||||||
2019 | 2018 | ||||||
(in millions) | |||||||
Long-Term | |||||||
Equity investments | $ | $ | |||||
Equity investments - other | |||||||
Total | $ | $ | |||||
Equity investments are reported at fair value, with gains or losses resulting from changes in fair value recognized in earnings. Equity investments without readily determinable fair values that are measured at cost adjusted for observable changes in price or impairments are presented as "Equity investments - other" in the table above.
All of our investments are subject to periodic impairment review. The impairment analysis requires significant judgment to identify events or circumstances that would likely have a significant adverse effect on the future value of the investment. There was no impairment recognized in 2019, 2018 and 2017. Realized gains and losses from the sale of investments are recorded in earnings.
Net recognized gains (losses) on equity investments were as follows:
Year Ended October 31, | |||||||||||
2019 | 2018 | 2017 | |||||||||
(in millions) | |||||||||||
Net realized gains on investments sold | $ | $ | $ | ||||||||
Net unrealized gains on investments still held | |||||||||||
13. | FAIR VALUE MEASUREMENTS |
The authoritative guidance defines fair value as the price that would be received from selling an asset or paid to transfer a liability in an orderly transaction between market participants at the measurement date. When determining the fair value measurements for assets and liabilities required or permitted to be recorded at fair value, we consider the principal or most advantageous market and assumptions that market participants would use when pricing the asset or liability.
Fair Value Hierarchy
The guidance establishes a fair value hierarchy that prioritizes inputs used in valuation techniques into three levels. A financial instrument's categorization within the fair value hierarchy is based upon the lowest level of input that is significant to the fair value measurement. There are three levels of inputs that may be used to measure fair value:
Level 1 — applies to assets or liabilities for which there are quoted prices in active markets for identical assets or liabilities.
Level 2 — applies to assets or liabilities for which there are inputs other than quoted prices included within Level 1 that are observable, either directly or indirectly, for the asset or liability such as: quoted prices for similar assets or liabilities in active markets; quoted prices for identical or similar assets or liabilities in less active markets; or other inputs that can be derived principally from, or corroborated by, observable market data.
Level 3 — applies to assets or liabilities for which there are unobservable inputs to the valuation methodology that are significant to the measurement of the fair value of the assets or liabilities.
83
Financial Assets and Liabilities Measured at Fair Value on a Recurring Basis
Financial assets and liabilities measured at fair value on a recurring basis as of October 31, 2019 and 2018 were as follows:
Fair Value Measurements as of October 31, 2019 | Fair Value Measurements as of October 31, 2018 | ||||||||||||||||||||||||||||||||||||||
Total | Level 1 | Level 2 | Level 3 | Other | Total | Level 1 | Level 2 | Level 3 | Other | ||||||||||||||||||||||||||||||
(in millions) | |||||||||||||||||||||||||||||||||||||||
Assets: | |||||||||||||||||||||||||||||||||||||||
Short-term | |||||||||||||||||||||||||||||||||||||||
Cash equivalents | |||||||||||||||||||||||||||||||||||||||
Money market funds | $ | $ | $ | $ | $ | — | $ | $ | $ | $ | $ | — | |||||||||||||||||||||||||||
Derivative instruments (foreign exchange contracts) | — | — | |||||||||||||||||||||||||||||||||||||
Long-term | 16 | ||||||||||||||||||||||||||||||||||||||
Equity investments | — | — | |||||||||||||||||||||||||||||||||||||
Equity investments - other | |||||||||||||||||||||||||||||||||||||||
Total assets measured at fair value | $ | $ | $ | $ | $ | 9 | $ | $ | $ | $ | $ | 16 | |||||||||||||||||||||||||||
Liabilities: | — | ||||||||||||||||||||||||||||||||||||||
Short-term | |||||||||||||||||||||||||||||||||||||||
Derivative instruments (foreign exchange contracts) | $ | $ | $ | $ | $ | — | $ | $ | $ | $ | $ | — | |||||||||||||||||||||||||||
Long-term | — | ||||||||||||||||||||||||||||||||||||||
Deferred compensation liability | — | — | |||||||||||||||||||||||||||||||||||||
Total liabilities measured at fair value | $ | $ | $ | $ | $ | — | $ | $ | $ | $ | $ | — | |||||||||||||||||||||||||||
Equity investments including securities that are earmarked to pay the deferred compensation liability and the deferred compensation liability are reported at fair value, with gains or losses resulting from changes in fair value recognized in earnings. Certain derivative instruments are reported at fair value, with unrealized gains and losses, net of tax, included in accumulated other comprehensive income (loss).
Financial Assets and Liabilities Measured at Fair Value on a Non-Recurring Basis
Assets measured at fair value on a non-recurring basis consisted of goodwill and intangible assets for our Ixia Solutions Group reporting unit. Refer to Note 11, "Goodwill and Other Intangible Assets" for more information.
Goodwill
Fair value assessments of the reporting unit and the reporting unit's net assets, which are performed for goodwill impairments tests, are considered Level 3 measurements due to the significance of unobservable inputs developed using company-specific information. We considered a market approach as well as an income approach using the discounted cash flow model to determine the fair value of the reporting unit.
Intangible Assets
We utilized an income approach for estimating the fair value of intangible assets. The future cash flows used in the analysis are based on internal cash flow projections based on our long-range plans and include significant assumptions by management. Accordingly, the fair value assessment of the long-lived assets is considered a Level 3 fair value measurement.
84
14. | DERIVATIVES |
We are exposed to foreign currency exchange rate fluctuations and interest rate changes in the normal course of our business. As part of our risk management strategy, we use derivative instruments, primarily forward contracts to hedge economic and/or accounting exposures resulting from changes in foreign currency exchange rates.
Cash Flow Hedges
We enter into foreign exchange contracts to hedge our forecasted operational cash flow exposures resulting from changes in foreign currency exchange rates. These foreign exchange contracts, carried at fair value, have maturities between one and fourteen months. These derivative instruments are designated and qualify as cash flow hedges under the criteria prescribed in the authoritative guidance. The changes in the value of the derivative instrument included in the assessment of effectiveness are recognized in accumulated other comprehensive income and reclassified into earnings when the forecasted transaction occurs in the same financial statement line item in the consolidated statement of operations where the earnings effect of the hedged item is presented. If it becomes probable that the forecasted transaction will not occur, the hedge relationship will be de-designated and amounts accumulated in other comprehensive income will be reclassified into earnings in the current period. Gains and losses on the derivative instrument representing hedge components excluded from the assessment of effectiveness are recognized immediately in earnings and are presented in the same financial statement line of the consolidated statement of operations where the earnings effect of the hedged item is presented.
Other Hedges
Additionally, we enter into foreign exchange contracts to hedge monetary assets and liabilities that are denominated in currencies other than the functional currency of our subsidiaries. These foreign exchange contracts are carried at fair value and do not qualify for hedge accounting treatment and are not designated as hedging instruments. Changes in value of the derivative are recognized in other income (expense), net, in the consolidated statement of operations, in the current period, along with the offsetting foreign currency gain or loss on the underlying assets or liabilities.
Our use of derivative instruments exposes us to credit risk to the extent that the counterparties may be unable to meet the terms of the agreement. We do, however, seek to mitigate such risks by limiting our counterparties to major financial institutions which are selected based on their credit ratings and other factors. We have established policies and procedures for mitigating credit risk that include establishing counterparty credit limits, monitoring credit exposures, and continually assessing the creditworthiness of counterparties.
There were 201 and 60 foreign exchange forward contracts, designated as "cash flow hedges" and "not designated as hedging instruments", respectively, open as of October 31, 2019. The aggregated notional amounts by currency and designation as of October 31, 2019 were as follows:
Derivatives in Cash Flow Hedging Relationships | Derivatives Not Designated as Hedging Instruments | |||||||
Forward Contracts | Forward Contracts | |||||||
Currency | Buy/(Sell) | Buy/(Sell) | ||||||
(in millions) | ||||||||
Euro | $ | $ | ||||||
British Pound | ( | ) | ||||||
Singapore Dollar | ||||||||
Malaysian Ringgit | ||||||||
Japanese Yen | ( | ) | ( | ) | ||||
Other currencies | ( | ) | ||||||
$ | $ | ( | ) | |||||
85
Derivative instruments are subject to master netting arrangements and are disclosed gross in the consolidated balance sheet. The gross fair values and balance sheet presentation of derivative instruments held as of October 31, 2019 and 2018 were as follows:
Fair Values of Derivative Instruments | ||||||||||||||||||
Asset Derivatives | Liability Derivatives | |||||||||||||||||
Fair Value | Fair Value | |||||||||||||||||
Balance Sheet Location | October 31, 2019 | October 31, 2018 | Balance Sheet Location | October 31, 2019 | October 31, 2018 | |||||||||||||
(in millions) | ||||||||||||||||||
Derivatives designated as hedging instruments: | ||||||||||||||||||
Cash flow hedges | ||||||||||||||||||
Foreign exchange contracts | ||||||||||||||||||
Other current assets | $ | $ | Other accrued liabilities | $ | $ | |||||||||||||
Derivatives not designated as hedging instruments: | ||||||||||||||||||
Foreign exchange contracts | ||||||||||||||||||
Other current assets | Other accrued liabilities | |||||||||||||||||
Total derivatives | $ | $ | $ | $ | ||||||||||||||
The effect of derivative instruments for foreign exchange contracts designated as hedging instruments and not designated as hedging instruments in our consolidated statement of operations was as follows:
2019 | 2018 | 2017 | |||||||||
(in millions) | |||||||||||
Derivatives designated as hedging instruments: | |||||||||||
Cash flow hedges | |||||||||||
Foreign exchange contracts: | |||||||||||
Gain (loss) recognized in accumulated other comprehensive income | $ | ( | ) | $ | $ | ||||||
Gain (loss) reclassified from accumulated other comprehensive income into earnings: | |||||||||||
Cost of products | ( | ) | ( | ) | |||||||
Selling, general and administrative | ( | ) | |||||||||
Gain (loss) excluded from effectiveness testing recognized in earnings based on changes in fair value: | |||||||||||
Cost of products | |||||||||||
Derivatives not designated as hedging instruments: | |||||||||||
Gain (loss) recognized in other income (expense), net | $ | ( | ) | $ | $ | ||||||
The estimated amount at October 31, 2019 expected to be reclassified from accumulated other comprehensive income to earnings within the next twelve months is a loss of $2 million.
15. | RETIREMENT PLANS AND POST-RETIREMENT BENEFIT PLANS |
General. The majority of our employees are covered under various defined benefit and/or defined contribution retirement plans. Additionally, we sponsor post-retirement health care benefits for our eligible U.S. employees. We provide U.S. employees, who meet eligibility criteria under the Keysight Technologies, Inc. Retirement Plan ("RP"), defined benefits which are based on an employee's base or target pay during the years of employment and on length of service. For eligible employees' service through October 31, 1993, the benefit payable under the RP is reduced by any amounts due to the eligible employees' service under our defined contribution Deferred Profit-Sharing Plan ("DPSP"), which was closed to new participants as of November 1993. Employees hired on or after August 1, 2015 are not eligible to participate in the RP or the Keysight Technologies, Inc. Health Plan for Retirees ("U.S. Post-Retirement Benefit Plan").
In addition, in the U.S. we maintain the Supplemental Benefits Retirement Plan ("SBRP"), a supplemental unfunded non-qualified defined benefit plan to provide benefits that would be provided under the RP but for limitations imposed by the Internal Revenue Code. The RP and the SBRP comprise the "U.S. Plans."
86
As of October 31, 2019, the fair value of plan assets of the DPSP for U.S. employees was $266 million. The obligation for the DPSP eligible employees equals the fair value of the DPSP assets due to the benefit payable under the RP being the greater of the RP and DPSP.
Eligible employees outside the U.S. generally receive retirement benefits under various retirement plans ("Non-U.S. Plans") based on factors such as years of service and/or employee compensation levels. Eligibility is generally determined in accordance with local statutory requirements.
401(k) defined contribution plan. Eligible U.S. employees may participate in the Keysight Technologies, Inc. 401(k) Plan (the "401(k) Plan"). Enrollment in the 401(k) Plan is automatic for employees who meet eligibility requirements unless they decline participation. We provide matching contributions to these employees, and the 401(k) Plan employer expense included in income from operations was $25 million in 2019, $23 million in 2018 and $16 million in 2017.
Post-retirement medical benefit plans. In addition to receiving retirement benefits, U.S. employees who meet eligibility requirements as of their termination date may participate in the U.S. Post-Retirement Benefit Plan.
Components of net periodic benefit cost. The company uses alternate methods of amortization, as allowed by the authoritative guidance, which amortizes the actuarial gains and losses on a consistent basis for the years presented. For the U.S. Plans, gains and losses are amortized over the average future working lifetime. For most Non-U.S. Plans and the U.S. Post-Retirement Benefit Plan, gains and losses are amortized using a separate layer for each year's gains and losses.
On January 1, 2019, we transferred a portion of the assets and liabilities of our Switzerland defined benefit plan to an insurance company, resulting in the recognition of a settlement loss of $2 million, which is included in other income (expense) in the consolidated statement of operations.
On December 15, 2016, we transferred a portion of the assets and obligations of our Japanese Employees’ Pension Fund ("EPF") to the Japanese government. The remaining portion of the EPF was transferred to a new Keysight Japan corporate defined benefit pension plan. The difference between the obligations settled with the government of $142 million and the assets transferred to the government of $51 million resulted in an increase in the funded status of the new defined benefit pension plan of $91 million. The settlement resulted in a gain of $68 million which is included in other operating expense (income) in the consolidated statement of operations for 2017.
87
For the years ended October 31, 2019, 2018 and 2017, components of net periodic benefit cost (benefit) and other amounts recognized in other comprehensive income were comprised of:
Defined Benefit Plans | U.S. Post-Retirement Benefit Plan | ||||||||||||||||||||||||||||||||||
U.S. Plans | Non-U.S. Plans | ||||||||||||||||||||||||||||||||||
2019 | 2018 | 2017 | 2019 | 2018 | 2017 | 2019 | 2018 | 2017 | |||||||||||||||||||||||||||
(in millions) | |||||||||||||||||||||||||||||||||||
Net periodic benefit cost (benefit) | |||||||||||||||||||||||||||||||||||
Service cost — benefits earned during the period | $ | $ | $ | $ | $ | $ | $ | $ | $ | ||||||||||||||||||||||||||
Interest cost on benefit obligation | |||||||||||||||||||||||||||||||||||
Expected return on plan assets | ( | ) | ( | ) | ( | ) | ( | ) | ( | ) | ( | ) | ( | ) | ( | ) | ( | ) | |||||||||||||||||
Amortization: | |||||||||||||||||||||||||||||||||||
Net actuarial loss | |||||||||||||||||||||||||||||||||||
Prior service credit | ( | ) | ( | ) | ( | ) | ( | ) | ( | ) | ( | ) | ( | ) | ( | ) | ( | ) | |||||||||||||||||
Net periodic benefit cost (benefit) | ( | ) | ( | ) | ( | ) | ( | ) | ( | ) | |||||||||||||||||||||||||
Curtailments and settlements | ( | ) | |||||||||||||||||||||||||||||||||
Net periodic benefit cost (benefit) | $ | $ | $ | $ | ( | ) | $ | ( | ) | $ | ( | ) | $ | ( | ) | $ | ( | ) | $ | ||||||||||||||||
Other changes in plan assets and benefit obligations recognized in other comprehensive (income) loss | |||||||||||||||||||||||||||||||||||
Net actuarial loss (gain) | $ | $ | ( | ) | $ | $ | $ | $ | ( | ) | $ | $ | ( | ) | $ | ( | ) | ||||||||||||||||||
Amortization: | |||||||||||||||||||||||||||||||||||
Net actuarial loss | ( | ) | ( | ) | ( | ) | ( | ) | ( | ) | ( | ) | ( | ) | ( | ) | ( | ) | |||||||||||||||||
Prior service credit | |||||||||||||||||||||||||||||||||||
Settlement | ( | ) | ( | ) | ( | ) | |||||||||||||||||||||||||||||
Curtailment | |||||||||||||||||||||||||||||||||||
Foreign currency | ( | ) | ( | ) | |||||||||||||||||||||||||||||||
Total recognized in other comprehensive (income) loss | $ | $ | ( | ) | $ | ( | ) | $ | $ | $ | ( | ) | $ | $ | ( | ) | $ | ( | ) | ||||||||||||||||
Total recognized in net periodic benefit cost (benefit) and other comprehensive (income) loss | $ | $ | $ | $ | $ | ( | ) | $ | ( | ) | $ | $ | ( | ) | $ | ( | ) | ||||||||||||||||||
We record the service cost component of net periodic benefit cost (benefit) in the same line item as other employee compensation costs. We record the non-service components of net periodic benefit cost (benefit), such as interest cost, expected return on assets, amortization of prior service cost, and actuarial gains or losses, within other income (expense) in the consolidated statement of operations.
88
Funded status. As of October 31, 2019 and 2018, the funded status of the defined benefit and post-retirement benefit plans was as follows:
U.S. Defined Benefit Plans | Non-U.S. Defined Benefit Plans | U.S. Post-Retirement Benefit Plan | |||||||||||||||||||||
2019 | 2018 | 2019 | 2018 | 2019 | 2018 | ||||||||||||||||||
(in millions) | |||||||||||||||||||||||
Change in fair value of plan assets: | |||||||||||||||||||||||
Fair value — beginning of year | $ | $ | $ | $ | $ | $ | |||||||||||||||||
Actual return on plan assets | |||||||||||||||||||||||
Employer contributions | |||||||||||||||||||||||
Settlements | ( | ) | ( | ) | |||||||||||||||||||
Benefits paid | ( | ) | ( | ) | ( | ) | ( | ) | ( | ) | ( | ) | |||||||||||
Other | ( | ) | |||||||||||||||||||||
Currency impact | ( | ) | |||||||||||||||||||||
Fair value — end of year | $ | $ | $ | $ | $ | $ | |||||||||||||||||
Change in benefit obligation: | |||||||||||||||||||||||
Benefit obligation — beginning of year | $ | $ | $ | $ | $ | $ | |||||||||||||||||
Service cost | |||||||||||||||||||||||
Interest cost | |||||||||||||||||||||||
Settlements | ( | ) | ( | ) | |||||||||||||||||||
Curtailments | |||||||||||||||||||||||
Actuarial loss (gain) | ( | ) | ( | ) | ( | ) | |||||||||||||||||
Benefits paid | ( | ) | ( | ) | ( | ) | ( | ) | ( | ) | ( | ) | |||||||||||
Other | ( | ) | |||||||||||||||||||||
Currency impact | ( | ) | |||||||||||||||||||||
Benefit obligation — end of year | $ | $ | $ | $ | $ | $ | |||||||||||||||||
Overfunded (Underfunded) status of PBO | $ | ( | ) | $ | ( | ) | $ | $ | $ | ( | ) | $ | ( | ) | |||||||||
Amounts recognized in the consolidated balance sheet consist of: | |||||||||||||||||||||||
Other assets | $ | $ | $ | $ | $ | $ | |||||||||||||||||
Employee compensation and benefits | ( | ) | ( | ) | |||||||||||||||||||
Retirement and post-retirement benefits | ( | ) | ( | ) | ( | ) | ( | ) | ( | ) | ( | ) | |||||||||||
Net asset (liability)(a) | $ | ( | ) | $ | ( | ) | $ | $ | $ | ( | ) | $ | ( | ) | |||||||||
Amounts recognized in accumulated other comprehensive income (loss): | |||||||||||||||||||||||
Actuarial losses | $ | $ | $ | $ | $ | $ | |||||||||||||||||
Prior service credits | ( | ) | ( | ) | ( | ) | ( | ) | |||||||||||||||
Total | $ | $ | $ | $ | $ | $ | |||||||||||||||||
(a) Certain of our immaterial defined benefit plans are not included in these disclosures.
The amounts in accumulated other comprehensive income expected to be amortized into net periodic benefit cost (benefit) during 2020 are as follows:
U.S. Defined Benefit Plans | Non-U.S. Defined Benefit Plans | U.S. Post-Retirement Benefit Plan | |||||||||
(in millions) | |||||||||||
Amortization of net prior service credit | $ | $ | $ | ( | ) | ||||||
Amortization of actuarial net loss | $ | $ | $ | ||||||||
Investment policies and strategies as of October 31, 2019. In the U.S., our RP and U.S. Post-Retirement Benefit Plan target asset allocations are approximately 70 percent to equities and approximately 30 percent to fixed income investments. Our DPSP target asset allocation is approximately 60 percent to equities and approximately 40 percent to fixed income investments. The general investment objective for all our plan assets is to obtain the optimum rate of investment return on the total investment portfolio consistent with the assumption of a reasonable level of risk. Specific investment objectives for the plans' portfolios are to: maintain and enhance the purchasing power of the plans' assets; achieve investment returns consistent with the level of risk being taken; and earn performance rates of return in accordance with the benchmarks adopted for each asset class. Outside of the
89
U.S., our target asset allocation is from 10 to 60 percent to equities, from 40 to 90 percent to fixed income investments, and from zero to 11 percent to cash and other, depending on the plan. All plans' assets are broadly diversified. Due to fluctuations in capital markets, our actual allocations of plan assets as of October 31, 2019, differ from the target allocation. Our policy is to periodically bring the actual allocation in line with the target allocation.
Equity securities include exchange-traded common stock and preferred stock of companies from broadly diversified industries. Fixed income securities include a portfolio of corporate bonds of companies from diversified industries, government securities, mortgage-backed securities, asset-backed securities, derivative instruments and other. Portions of the cash and cash equivalent, equity, and fixed income investments are held in commingled funds. Investments in commingled funds are valued using the net asset value (“NAV”) method as a practical expedient. Investments valued using the NAV method are allocated across a broad array of funds and diversify the portfolio. The value of the plan assets directly affects the funded status of our pension and post-retirement benefit plans recorded in the financial statements.
Fair Value. The measurement of the fair value of pension and post-retirement plan assets uses the valuation methodologies and the inputs as described in Note 13, "Fair Value Measurements."
Cash and Cash Equivalents - Cash and cash equivalents consist of short-term investment funds that are invested in short-term domestic fixed income securities and other securities with debt-like characteristics, emphasizing short-term maturities and quality. Cash and cash equivalents are generally classified as Level 2 investments except when the cash and cash equivalents are held in commingled funds, which have a daily NAV derived from quoted prices for the underlying securities in active markets; these are classified as assets measured at NAV.
Equity - Some equity securities consisting of common and preferred stock are held in commingled funds, which have daily NAVs derived from quoted prices for the underlying securities in active markets; these are classified as assets measure at NAV. Commingled funds which have quoted prices in active markets are classified as Level 1 investments.
Fixed Income - Some of the fixed income securities are held in commingled funds, which have daily NAVs derived from the underlying securities; these are classified as assets measured at NAV. Commingled funds which have quoted prices in active markets are classified as Level 1 investments.
Other Investments - Other investments include property-based pooled vehicles which invest in real estate. Market NAVs are regularly published in the financial press or on corporate websites; therefore, these investments are classified as Level 3 investments or assets measured at NAV.
The following tables present the fair value of U.S. Defined Benefit Plans assets classified under the appropriate level of the fair value hierarchy as of October 31, 2019 and 2018:
Fair Value Measurement as of October 31, 2019 Using | |||||||||||||||||||
October 31, 2019 | Quoted Prices in Active Markets for Identical Assets (Level 1) | Significant Other Observable Inputs (Level 2) | Significant Unobservable Inputs (Level 3) | Assets Measured at NAV(b) | |||||||||||||||
(in millions) | |||||||||||||||||||
Cash and cash equivalents | $ | $ | $ | $ | $ | ||||||||||||||
Equity | |||||||||||||||||||
Fixed income | |||||||||||||||||||
Other investments | |||||||||||||||||||
Total assets measured at fair value | $ | $ | $ | $ | $ | ||||||||||||||
(b) Certain instruments that are measured at fair value using the NAV per share practical expedient have not been categorized in the fair value hierarchy. The fair value amounts presented in this table are intended to permit reconciliation of the fair value hierarchy to the total value of plan assets.
90
Fair Value Measurement as of October 31, 2018 Using | |||||||||||||||||||
October 31, 2018 | Quoted Prices in Active Markets for Identical Assets (Level 1) | Significant Other Observable Inputs (Level 2) | Significant Unobservable Inputs (Level 3) | Assets Measured at NAV(b) | |||||||||||||||
(in millions) | |||||||||||||||||||
Cash and cash equivalents | $ | $ | $ | $ | $ | ||||||||||||||
Equity | |||||||||||||||||||
Fixed income | |||||||||||||||||||
Other investments | |||||||||||||||||||
Total assets measured at fair value | $ | $ | $ | $ | $ | ||||||||||||||
(b) Certain instruments that are measured at fair value using the NAV per share practical expedient have not been categorized in the fair value hierarchy. The fair value amounts presented in this table are intended to permit reconciliation of the fair value hierarchy to the total value of plan assets.
For U.S. Defined Benefit Plans, there was no activity relating to assets measured at fair value using significant unobservable inputs (Level 3) during 2019 and 2018.
The following tables present the fair value of U.S. Post-Retirement Benefit Plan assets classified under the appropriate level of the fair value hierarchy as of October 31, 2019 and 2018:
Fair Value Measurement as of October 31, 2019 Using | |||||||||||||||||||
October 31, 2019 | Quoted Prices in Active Markets for Identical Assets (Level 1) | Significant Other Observable Inputs (Level 2) | Significant Unobservable Inputs (Level 3) | Assets Measured at NAV(b) | |||||||||||||||
(in millions) | |||||||||||||||||||
Cash and cash equivalents | $ | $ | $ | $ | $ | ||||||||||||||
Equity | |||||||||||||||||||
Fixed income | |||||||||||||||||||
Other investments | |||||||||||||||||||
Total assets measured at fair value | $ | $ | $ | $ | $ | ||||||||||||||
(b) Certain instruments that are measured at fair value using the NAV per share practical expedient have not been categorized in the fair value hierarchy. The fair value amounts presented in this table are intended to permit reconciliation of the fair value hierarchy to the total value of plan assets.
Fair Value Measurement as of October 31, 2018 Using | |||||||||||||||||||
October 31, 2018 | Quoted Prices in Active Markets for Identical Assets (Level 1) | Significant Other Observable Inputs (Level 2) | Significant Unobservable Inputs (Level 3) | Assets Measured at NAV(b) | |||||||||||||||
(in millions) | |||||||||||||||||||
Cash and cash equivalents | $ | $ | $ | $ | $ | ||||||||||||||
Equity | |||||||||||||||||||
Fixed income | |||||||||||||||||||
Other investments | |||||||||||||||||||
Total assets measured at fair value | $ | $ | $ | $ | $ | ||||||||||||||
(b) Certain instruments that are measured at fair value using the NAV per share practical expedient have not been categorized in the fair value hierarchy. The fair value amounts presented in this table are intended to permit reconciliation of the fair value hierarchy to the total value of plan assets.
For U.S. Post-Retirement Benefit Plan, there was no activity relating to assets measured at fair value using significant unobservable inputs (Level 3) during 2019 and 2018.
91
The following tables present the fair value of Non-U.S. Defined Benefit Plans assets classified under the appropriate level of the fair value hierarchy as of October 31, 2019 and 2018:
Fair Value Measurement as of October 31, 2019 Using | |||||||||||||||||||
October 31, 2019 | Quoted Prices in Active Markets for Identical Assets (Level 1) | Significant Other Observable Inputs (Level 2) | Significant Unobservable Inputs (Level 3) | Assets Measured at NAV(b) | |||||||||||||||
(in millions) | |||||||||||||||||||
Cash and cash equivalents | $ | $ | $ | $ | $ | ||||||||||||||
Equity | |||||||||||||||||||
Fixed income | |||||||||||||||||||
Other investments | |||||||||||||||||||
Total assets measured at fair value | $ | $ | $ | $ | $ | ||||||||||||||
(b) Certain instruments that are measured at fair value using the NAV per share practical expedient have not been categorized in the fair value hierarchy. The fair value amounts presented in this table are intended to permit reconciliation of the fair value hierarchy to the total value of plan assets.
Fair Value Measurement as of October 31, 2018 Using | |||||||||||||||||||
October 31, 2018 | Quoted Prices in Active Markets for Identical Assets (Level 1) | Significant Other Observable Inputs (Level 2) | Significant Unobservable Inputs (Level 3) | Assets Measured at NAV(b) | |||||||||||||||
(in millions) | |||||||||||||||||||
Cash and cash equivalents | $ | $ | $ | $ | $ | ||||||||||||||
Equity | |||||||||||||||||||
Fixed income | |||||||||||||||||||
Other investments | |||||||||||||||||||
Total assets measured at fair value | $ | $ | $ | $ | $ | ||||||||||||||
(b) Certain instruments that are measured at fair value using the NAV per share practical expedient have not been categorized in the fair value hierarchy. The fair value amounts presented in this table are intended to permit reconciliation of the fair value hierarchy to the total value of plan assets.
For Non-U.S. Defined Benefit Plans assets measured at fair value using significant unobservable inputs (Level 3), the following table summarizes the change in balances during 2019 and 2018:
Year Ended | |||||||
October 31, | |||||||
2019 | 2018 | ||||||
(in millions) | |||||||
Balance, beginning of year | $ | $ | |||||
Realized gains | |||||||
Unrealized gains/(losses) | |||||||
Purchases, sales, issuances, and settlements | ( | ) | |||||
Transfers in (out) | |||||||
Balance, end of year | $ | $ | |||||
92
2019 | 2018 | ||||||||||||||
Benefit Obligation | Fair Value of Plan Assets | Benefit Obligation | Fair Value of Plan Assets | ||||||||||||
PBO | PBO | ||||||||||||||
(in millions) | (in millions) | ||||||||||||||
U.S. defined benefit plans where PBO exceeds the fair value of plan assets | $ | $ | $ | $ | |||||||||||
U.S. defined benefit plans where fair value of plan assets exceeds PBO | |||||||||||||||
Total | $ | $ | $ | $ | |||||||||||
Non-U.S. defined benefit plans where PBO exceeds the fair value of plan assets | $ | $ | $ | $ | |||||||||||
Non-U.S. defined benefit plans where fair value of plan assets exceeds PBO | |||||||||||||||
Total | $ | $ | $ | $ | |||||||||||
ABO | ABO | ||||||||||||||
U.S. defined benefit plans where ABO exceeds the fair value of plan assets | $ | $ | $ | $ | |||||||||||
U.S. defined benefit plans where the fair value of plan assets exceeds ABO | |||||||||||||||
Total | $ | $ | $ | $ | |||||||||||
Non-U.S. defined benefit plans where ABO exceeds the fair value of plan assets | $ | $ | $ | $ | |||||||||||
Non-U.S. defined benefit plans where fair value of plan assets exceeds ABO | |||||||||||||||
Total | $ | $ | $ | $ | |||||||||||
U.S. Defined Benefit Plans | Non-U.S. Defined Benefit Plans | U.S. Post-Retirement Benefit Plan | |||||||||
(in millions) | |||||||||||
2020 | $ | $ | $ | ||||||||
2021 | $ | $ | $ | ||||||||
2022 | $ | $ | $ | ||||||||
2023 | $ | $ | $ | ||||||||
2024 | $ | $ | $ | ||||||||
2025 - 2029 | $ | $ | $ | ||||||||
93
Assumptions used to calculate the net periodic benefit cost (benefit) were as follows:
Year ended October 31, | |||
2019 | 2018 | ||
U.S. Defined Benefit Plans: | |||
Discount rate | |||
Average increase in compensation levels | |||
Expected long-term return on assets | |||
Non-U.S. Defined Benefit Plans: | |||
Discount rate | 0.54-2.83% | 0.59-2.52% | |
Average increase in compensation levels | 2.50-3.00% | 2.50-3.25% | |
Expected long-term return on assets | 4.00-6.50% | 4.00-6.50% | |
U.S. Post-Retirement Benefits Plan: | |||
Discount rate | |||
Expected long-term return on assets | |||
Current medical cost trend rate | |||
Ultimate medical cost trend rate | |||
Medical cost trend rate decreases to ultimate rate in year | |||
Assumptions used to calculate the benefit obligation as of October 31, 2019 and 2018 were as follows:
Year ended October 31, | ||||
2019 | 2018 | |||
U.S. Defined Benefit Plans: | ||||
Discount rate | % | |||
Average increase in compensation levels | % | |||
Non-U.S. Defined Benefit Plans: | ||||
Discount rate | 0.79-1.89% | 0.83-2.83% | ||
Average increase in compensation levels | 2.50-3.00% | 2.50-3.00% | ||
U.S. Post-Retirement Benefits Plan: | ||||
Discount rate | % | |||
Current medical cost trend rate | % | |||
Ultimate medical cost trend rate | % | |||
Medical cost trend rate decreases to ultimate rate in year | ||||
16. | GUARANTEES |
Standard Warranty
94
Activity related to the standard warranty accrual, which is included in other accrued and other long-term liabilities in our consolidated balance sheet, is as follows:
Year Ended October 31, | |||||||
2019 | 2018 | ||||||
(in millions) | |||||||
Beginning balance | $ | $ | |||||
Accruals for warranties, including change in estimates | |||||||
Settlements made during the period | ( | ) | ( | ) | |||
Ending balance | $ | $ | |||||
Accruals for warranties due within one year | $ | $ | |||||
Accruals for warranties due after one year | |||||||
Ending balance | $ | $ | |||||
Indemnification Obligations Related to Transactions
In connection with acquisitions, divestitures, mergers, spin-offs and other transactions, we have agreed to indemnify certain parties for damages, losses, expenses and liabilities arising in the future but which were incurred prior to or are related to such transactions. The liabilities covered by these indemnifications include but are not limited to tax, employment, benefits, intellectual property, environmental, and other liabilities. In our opinion, the fair value of these indemnification obligations is not material as of October 31, 2019.
Indemnifications to Officers and Directors
Our corporate by-laws require that we indemnify our officers and directors, as well as those who act as directors and officers of other entities at our request, against expenses, judgments, fines, settlements and other amounts actually and reasonably incurred in connection with any proceedings arising out of their services to Keysight and such other entities, including service with respect to employee benefit plans. In addition, we have entered into separate indemnification agreements with each director and each board-appointed officer of Keysight which provide for indemnification under similar and additional circumstances. The indemnification obligations are more fully described in the by-laws and the indemnification agreements. We purchase standard insurance to cover claims or a portion of the claims made against our directors and officers. Since a maximum obligation is not explicitly stated in our by-laws or in our indemnification agreements and will depend on the facts and circumstances that arise out of any future claims, the overall maximum amount of the obligations cannot be reasonably estimated. Historically, we have not made payments related to these obligations, and the fair value for these indemnification obligations was not material as of October 31, 2019.
Other Indemnifications
As is customary in our industry and as provided for in local law in the U.S. and other jurisdictions, many of our standard contracts provide remedies to our customers and others with whom we enter into contracts, such as defense, settlement, or payment of judgment for intellectual property claims related to the use of our products. From time to time, we indemnify customers, as well as our suppliers, contractors, lessors, lessees, companies that purchase our businesses or assets and others with whom we enter into contracts, against combinations of loss, expense, or liability arising from various triggering events related to the sale and the use of our products and services, the use of their goods and services, the use of facilities and state of our owned facilities, the state of the assets and businesses that we sell and other matters covered by such contracts, usually up to a specified maximum amount. In addition, from time to time we also provide protection to these parties against claims related to undiscovered liabilities, additional product liability or environmental obligations. In our experience, claims made under such indemnifications are rare and the associated estimated fair value of such liabilities was not material as of October 31, 2019.
17. | COMMITMENTS AND CONTINGENCIES |
Operating Lease Commitments. We lease certain real and personal property from unrelated third parties under non-cancellable operating leases. Future minimum lease payments under operating leases as of October 31, 2019 were $48 million in 2020, $40 million in 2021, $31 million in 2022, $19 million in 2023, $12 million in 2024 and $46 million thereafter. Certain leases require us to pay property taxes, insurance and routine maintenance, and include escalation clauses. Total rent expense was $70 million in 2019, $60 million in 2018 and $51 million in 2017.
Capital Lease Commitments. We had capital lease obligations of $4 million as of October 31, 2019 and $4 million as of October 31, 2018. The current portion of the total obligation is included in other accrued liabilities and the remaining long-term
95
portion is included in other long-term liabilities on the consolidated balance sheet. Assets held under capital leases are included in net property, plant, and equipment on the consolidated balance sheet.
Litigation and Contingencies. We are involved in lawsuits, claims, investigations and proceedings, including, but not limited to, patent, commercial and environmental matters, which arise in the ordinary course of business. There are no matters pending that we currently believe are reasonably possible of having a material impact to our business, consolidated financial condition, results of operations or cash flows.
18. | DEBT |
The following table summarizes the components of our long-term debt:
October 31, | |||||||
2019 | 2018 | ||||||
(in millions) | |||||||
2024 Senior Notes at 4.55% ($600 face amount less unamortized costs of $3 and $3) | $ | $ | |||||
2027 Senior Notes at 4.60% ($700 face amount less unamortized costs of $5 and $6) | |||||||
2029 Senior Notes at 3.00% ($500 face amount less unamortized costs of $4) | |||||||
$ | $ | ||||||
Short-Term Debt
Revolving Credit Facility
On February 15, 2017 , we entered into an amended and restated credit agreement (the “Revolving Credit Facility”) that replaced our existing $450 million unsecured credit facility dated September 15, 2014. The Revolving Credit Facility provides for a $450 million, five-year unsecured revolving credit facility that will expire on February 15, 2022 and bears interest at an annual rate of LIBOR + 1.10% . In addition, the Revolving Credit Facility permits us to increase the total commitments under this credit facility by up to $150 million in the aggregate on one or more occasions upon request. We may use amounts borrowed under the facility for general corporate purposes. As of October 31, 2019, we had no borrowings outstanding under the Revolving Credit Facility. We were in compliance with the covenants of the Revolving Credit Facility during the year ended October 31, 2019.
2019 Senior Notes
In October 2014, the company issued an aggregate principal amount of $500 million in unsecured senior notes ("2019 Senior Notes"). These notes matured on October 30, 2019 and were fully repaid.
Long-Term Debt
The below senior notes are unsecured and rank equally in right of payment with all of our other senior unsecured indebtedness.
2024 Senior Notes
In October 2014, the company issued an aggregate principal amount of $600 million in unsecured senior notes ("2024 Senior Notes"). The 2024 Senior Notes were issued at 99.966 percent of their principal amount. The notes will mature on October 30, 2024 , and bear interest at a fixed rate of 4.55 percent per annum. The interest is payable semi-annually on April 30 and October 30 of each year. We incurred issuance costs of $5 million in connection with the 2024 Senior Notes that are being amortized to interest expense over the term of the senior notes.
2027 Senior Notes
In April 2017, the company issued an aggregate principal amount of $700 million in unsecured senior notes ("2027 Senior Notes"). The 2027 Senior Notes were issued at 99.873 percent of their principal amount. The notes will mature on April 6, 2027 and bear interest at a fixed rate of 4.60 percent per annum. The interest is payable semi-annually on April 6 and October 6 of each year, commencing on October 6, 2017. We incurred issuance costs of $6 million in connection with the 2027 Senior Notes that, along with the debt discount, are being amortized to interest expense over the term of the senior notes.
96
2029 Senior Notes
In October 2019, the company issued an aggregate principal amount of $500 million in unsecured senior notes ("2029 Senior Notes"). The 2029 Senior Notes were issued at 99.914 percent of their principal amount. The notes will mature on October 30, 2029 and bear interest at a fixed rate of 3.00 percent per annum. The interest is payable semi-annually on April 30 and October 30 of each year, commencing on April 30, 2020. We incurred issuance costs of $4 million in connection with the 2029 Senior Notes that, along with the debt discount are being amortized to interest expense over the term of the senior notes.
Senior Unsecured Term Loan
On February 15, 2017 , we entered into a term credit agreement that provided for a three-year $400 million senior unsecured term loan that bore interest at an annual rate of LIBOR + 1.50% . The term loan was drawn upon the closing of the Ixia acquisition. On February 27, 2018, we fully repaid the borrowings outstanding under the term loan of $260 million and terminated the credit agreement. We had previously repaid $140 million of the term loan during the year ended October 31, 2017.
Letters of Credit
19. | STOCKHOLDERS' EQUITY |
Stock Repurchase Program
On May 29, 2019, the Board of Directors approved a new stock repurchase program authorizing the purchase of up to $500 million of the company’s common stock, replacing a previously approved 2018 program authorizing the purchase of up to $350 million of the company's common stock, of which $160 million remained. Under the new program, shares may be purchased from time to time, subject to general business and market conditions and other investment opportunities, through open market purchases, privately negotiated transactions or other means. All such shares and related costs are held as treasury stock and accounted for at trade date using the cost method. The stock repurchase program may be commenced, suspended or discontinued at any time at the company’s discretion and does not have an expiration date.
In 2019 we repurchased 2,093,570 shares of common stock for $160 million. In 2018 we repurchased 2,075,460 shares of common stock for $120 million. In 2017 we did not repurchase any shares of common stock under the stock repurchase program. All such shares and related costs are held as treasury stock and accounted for at trade date using the cost method.
Accumulated other comprehensive loss
The following table summarizes the components of our accumulated other comprehensive loss as of October 31, 2019 and 2018, net of tax effect:
October 31, | |||||||
2019 | 2018 | ||||||
(in millions) | |||||||
Unrealized gain on equity securities, net of tax (expense) of zero and $(2) | $ | $ | |||||
Foreign currency translation, net of tax (expense) of $(63) and $(63) | ( | ) | ( | ) | |||
Unrealized losses on defined benefit plans, net of tax benefit of $113 and $81 | ( | ) | ( | ) | |||
Unrealized losses on derivative instruments, net of tax (expense) of zero and $(1) | ( | ) | ( | ) | |||
Total accumulated other comprehensive loss | $ | ( | ) | $ | ( | ) | |
97
Changes in accumulated other comprehensive income (loss) by component and related tax effects for the years ended October 31, 2019 and 2018 were as follows:
Net defined benefit pension cost and post retirement plan costs: | |||||||||||||||||||||||
Unrealized gain (loss) on equity securities | Foreign currency translation | Actuarial Losses | Prior service credits | Unrealized gains (losses) on derivatives | Total | ||||||||||||||||||
(in millions) | |||||||||||||||||||||||
At October 31, 2017 | $ | $ | ( | ) | $ | ( | ) | $ | $ | $ | ( | ) | |||||||||||
Other comprehensive income (loss) before reclassifications | ( | ) | ( | ) | ( | ) | ( | ) | |||||||||||||||
Amounts reclassified out of accumulated other comprehensive income (loss) | ( | ) | ( | ) | |||||||||||||||||||
Tax (expense) benefit | ( | ) | |||||||||||||||||||||
Other comprehensive income (loss) for the twelve months ended October 31, 2018 | ( | ) | ( | ) | ( | ) | ( | ) | ( | ) | |||||||||||||
At October 31, 2018 | ( | ) | ( | ) | ( | ) | ( | ) | |||||||||||||||
Other comprehensive income (loss) before reclassifications | ( | ) | ( | ) | ( | ) | |||||||||||||||||
Amounts reclassified out of accumulated other comprehensive income (loss) | ( | ) | |||||||||||||||||||||
Tax (expense) benefit | |||||||||||||||||||||||
Other comprehensive income (loss) for the twelve months ended October 31, 2019 | ( | ) | ( | ) | ( | ) | ( | ) | |||||||||||||||
At October 31, 2019 | $ | $ | ( | ) | $ | ( | ) | $ | $ | ( | ) | $ | ( | ) | |||||||||
Reclassifications out of accumulated other comprehensive loss for the years ended October 31, 2019 and 2018 were as follows:
Details about accumulated other comprehensive loss components | Amounts reclassified from other comprehensive loss | Affected line item in statement of operations | ||||||||
Year Ended October 31, | ||||||||||
2019 | 2018 | |||||||||
(in millions) | ||||||||||
Unrealized gains (losses) on derivatives | $ | ( | ) | $ | Cost of products | |||||
( | ) | Selling, general and administrative | ||||||||
( | ) | Provision for income tax | ||||||||
( | ) | Net of Income Tax | ||||||||
Net defined benefit pension cost and post retirement plan costs: | ||||||||||
Net actuarial losses | ( | ) | ( | ) | ||||||
Prior service credits | ||||||||||
( | ) | ( | ) | Total before income tax | ||||||
Provision for income tax | ||||||||||
( | ) | ( | ) | Net of income tax | ||||||
Total reclassifications for the period | $ | ( | ) | $ | ( | ) | ||||
An amount in parentheses indicates a reduction to income and an increase to the accumulated other comprehensive income.
Reclassifications of prior service credits and net actuarial losses in respect of retirement plans and post retirement pension plans are included in the computation of net periodic cost (see Note 15, "Retirement Plans and Post Retirement Pension Plans").
98
20. | SEGMENT INFORMATION |
We provide electronic design and test instruments and systems and related software, software design tools, and related services that are used in the design, development, manufacture, installation, deployment and operation of electronics equipment. Related services include start-up assistance, instrument productivity and application services and instrument calibration and repair. Additionally, we provide test, security and visibility solutions that validate, secure and optimize networks and applications from engineering concept to live deployment. We also offer customization, consulting and optimization services throughout the customer's product life cycle.
To more effectively and efficiently address customer solution needs across the communications ecosystem as the network transforms, in the first quarter of fiscal 2020, we completed an organizational change to manage our Ixia Solutions Group within our Communications Solutions Group. We believe this realignment will create improved go-to-market and product development alignment, as well as accelerate solution synergies in 5G as this new technology is deployed globally. As a result, beginning with our first quarter of fiscal 2020, we will have two reportable operating segments, Communications Solutions Group (“CSG”) and Electronic Industrial Solutions Group (“EISG”).
Descriptions of our three reportable segments are as follows:
The Communications Solutions Group serves customers spanning the worldwide commercial communications and aerospace, defense and government end markets. The group provides electronic design and test software, instruments, systems and related services used in the simulation, design, validation, manufacturing, installation and optimization of electronic equipment.
The Electronic Industrial Solutions Group provides test and measurement solutions and related services across a broad set of electronic industrial end markets, focusing on high-value applications in the automotive and energy industry and measurement solutions for consumer electronics, education, general electronics design and manufacturing, and semiconductor design and manufacturing. The group provides electronic design and test software, instruments and systems and related services used in the simulation, design, validation, manufacturing, installation and optimization of electronic equipment.
The Ixia Solutions Group helps customers design, validate and optimize the performance and security resilience of their networks and associated components and applications. Network test, network visibility and security solutions help organizations and their customers strengthen their physical and virtual networks. The group’s solutions consist of software applications and services, including warranty and maintenance offerings, and high-performance hardware platforms.
A significant portion of the segments' expenses arise from shared services and infrastructure that we have historically provided to the segments in order to realize economies of scale and to efficiently use resources. These expenses, collectively called corporate charges, include legal, accounting, real estate, insurance services, information technology services, treasury and other corporate infrastructure expenses. Charges are allocated to the segments, and the allocations have been determined on a basis that we considered to be a reasonable reflection of the utilization of services provided to or benefits received by the segments.
The following tables reflect the results of our reportable segments under our management reporting system. These results are not necessarily in conformity with GAAP. The performance of each segment is measured based on several metrics, including income from operations. These results are used, in part, by the chief operating decision maker in evaluating the performance of, and in allocating resources to, each of the segments.
99
The profitability of each of the segments is measured after excluding share-based compensation expense, restructuring and related costs, amortization of acquisition-related balances, acquisition and integration costs, acquisition-related compensation expense, separation and related costs, pension curtailment and settlement loss (gain), northern California wildfire-related costs, goodwill impairment, legal settlement, gain on divestitures, interest income, interest expense and other items as noted in the reconciliations below.
Communications Solutions Group | Electronic Industrial Solutions Group | Ixia Solutions Group | Total Segments | ||||||||||||
(in millions) | |||||||||||||||
Year ended October 31, 2019: | |||||||||||||||
Total net revenue | $ | $ | $ | $ | |||||||||||
Amortization of acquisition-related balances | |||||||||||||||
Total segment revenue | $ | $ | $ | $ | |||||||||||
Segment income from operations | $ | $ | $ | $ | |||||||||||
Depreciation expense | $ | $ | $ | $ | |||||||||||
Year ended October 31, 2018: | |||||||||||||||
Total net revenue | $ | $ | $ | $ | |||||||||||
Amortization of acquisition-related balances | |||||||||||||||
Total segment revenue | $ | $ | $ | $ | |||||||||||
Segment income from operations | $ | $ | $ | $ | |||||||||||
Depreciation expense | $ | $ | $ | $ | |||||||||||
Year ended October 31, 2017: | |||||||||||||||
Total net revenue | $ | $ | $ | $ | |||||||||||
Amortization of acquisition-related balances | $ | ||||||||||||||
Total segment revenue | $ | $ | $ | $ | |||||||||||
Segment income from operations | $ | $ | $ | $ | |||||||||||
Depreciation expense | $ | $ | $ | $ | |||||||||||
The following table reconciles reportable segments' income from operations to our total enterprise income before taxes:
Year Ended October 31, | |||||||||||
2019 | 2018 | 2017 | |||||||||
(in millions) | |||||||||||
Total reportable segments' income from operations | $ | $ | $ | ||||||||
Share-based compensation expense | ( | ) | ( | ) | ( | ) | |||||
Restructuring and related costs | ( | ) | ( | ) | ( | ) | |||||
Amortization of acquisition-related balances | ( | ) | ( | ) | ( | ) | |||||
Acquisition and integration costs | ( | ) | ( | ) | ( | ) | |||||
Acquisition-related compensation expense | ( | ) | |||||||||
Separation and related costs | ( | ) | ( | ) | |||||||
Northern California wildfire-related costs | ( | ) | ( | ) | |||||||
Goodwill impairment | ( | ) | |||||||||
Legal settlement | ( | ) | |||||||||
Gain on divestitures | |||||||||||
Other | ( | ) | ( | ) | ( | ) | |||||
Income (loss) from operations, as reported | ( | ) | |||||||||
Interest income | |||||||||||
Interest expense | ( | ) | ( | ) | ( | ) | |||||
Other income (expense), net | |||||||||||
Income (loss) before taxes, as reported | $ | $ | ( | ) | $ | ||||||
Major customers. No customer represented 10 percent or more of our total net revenue in 2019, 2018 or 2017.
100
The following table presents assets and capital expenditures directly managed by each segment. Unallocated assets primarily consist of cash and cash equivalents, prepaid expenses, investments, long-term and other receivables and other assets.
Communications Solutions Group | Electronic Industrial Solutions Group | Ixia Solutions Group | Total Segments | ||||||||||||
(in millions) | |||||||||||||||
As of and for the year ended October 31, 2019: | |||||||||||||||
Assets | $ | $ | $ | $ | |||||||||||
Capital expenditures | $ | $ | $ | $ | |||||||||||
As of and for the year ended October 31, 2018: | |||||||||||||||
Assets | $ | $ | $ | $ | |||||||||||
Capital expenditures | $ | $ | $ | $ | |||||||||||
The following table reconciles segment assets to our total assets:
October 31, | |||||||
2019 | 2018 | ||||||
(in millions) | |||||||
Total reportable segments' assets | $ | $ | |||||
Cash and cash equivalents | |||||||
Prepaid expenses | |||||||
Other current assets | |||||||
Investments | |||||||
Long-term and other receivables | |||||||
Other | |||||||
Total assets | $ | $ | |||||
The other category primarily includes pension assets and also represents the difference between how segments report deferred taxes and intangible assets at the initial purchased amount.
The following table presents summarized information for net revenue and long-lived assets by geographic region. Revenues from external customers are generally attributed to countries based upon the location of the Keysight sales representative. Long lived assets consist of property, plant, and equipment, long-term receivables and other long-term assets excluding intangible assets. The rest of the world primarily consists of rest of Asia and Europe.
United States | China | Japan | Rest of the World | Total | |||||||||||||||
(in millions) | |||||||||||||||||||
Net revenue: | |||||||||||||||||||
Year ended October 31, 2019 | $ | $ | $ | $ | $ | ||||||||||||||
Year ended October 31, 2018 | $ | $ | $ | $ | $ | ||||||||||||||
Year ended October 31, 2017 | $ | $ | $ | $ | $ | ||||||||||||||
United States | Japan | Malaysia | UK | Rest of the World | Total | |||||||||||||||||
(in millions) | ||||||||||||||||||||||
Long-lived assets: | ||||||||||||||||||||||
October 31, 2019 | $ | $ | $ | $ | $ | $ | ||||||||||||||||
October 31, 2018 | $ | $ | $ | $ | $ | $ | ||||||||||||||||
101
21. | IMPACT OF NORTHERN CALIFORNIA WILDFIRES |
During the week of October 8, 2017, wildfires in northern California adversely impacted the Keysight corporate headquarters site in Santa Rosa, CA. While direct damage to our core facilities was limited, our buildings did experience some smoke and other fire-related impacts. Keysight is insured for the damage caused by the fire.
For the years ended October 31, 2019, 2018 and 2017, we recognized operating expenses of $3 million, $97 million and $18 million, respectively, offset by $3 million, $90 million and $2 million, respectively, of expected insurance recoveries. Expenses were primarily for cleaning and restoration activities, write-off of damaged fixed assets and other direct costs related to recovery from this event.
In 2019 and 2018, we received insurance proceeds of $22 million and $68 million, respectively, which has substantially covered our total fire-related expenses in excess of our $10 million self-insured retention amount. At October 31, 2019, we had a receivable of $5 million for losses and expenses for which insurance reimbursement is probable. The receivable is included in other current assets in the consolidated balance sheet.
In addition, in 2019 and 2018, we made investments in property, plant and equipment related to fire recovery of $7 million and $27 million, respectively, that are expected to be covered by insurance.
Subsequent to October 31, 2019, we received $37 million of insurance proceeds for replacement of capital and recovery of fire-related expenses. These proceeds will result in an other operating gain of approximately $32 million in the first quarter of fiscal 2020. No additional insurance proceeds or material expenses related to the 2017 northern California wildfires are expected.
QUARTERLY SUMMARY
(Unaudited)
Three Months Ended | |||||||||||||||
January 31, | April 30, | July 31, | October 31, | ||||||||||||
(in millions, except per share data) | |||||||||||||||
2019 | |||||||||||||||
Net revenue | $ | 1,006 | $ | 1,090 | $ | 1,087 | $ | 1,120 | |||||||
Gross profit | $ | 578 | $ | 648 | $ | 643 | $ | 665 | |||||||
Income from operations | $ | 121 | $ | 185 | $ | 197 | $ | 208 | |||||||
Net income | $ | 114 | $ | 153 | $ | 159 | $ | 195 | |||||||
Net income per share: | |||||||||||||||
Basic | $ | 0.61 | $ | 0.81 | $ | 0.85 | $ | 1.04 | |||||||
Diluted | $ | 0.60 | $ | 0.80 | $ | 0.83 | $ | 1.02 | |||||||
Weighted average shares used in computing net income per share: | |||||||||||||||
Basic | 187 | 188 | 188 | 187 | |||||||||||
Diluted | 190 | 191 | 191 | 191 | |||||||||||
2018 | |||||||||||||||
Net revenue | $ | 837 | $ | 990 | $ | 1,004 | $ | 1,047 | |||||||
Gross profit | $ | 425 | $ | 539 | $ | 562 | $ | 585 | |||||||
Income (loss) from operations | $ | (17 | ) | $ | 86 | $ | 117 | $ | (580 | ) | |||||
Net income (loss) | $ | 94 | $ | 64 | $ | 121 | $ | (114 | ) | ||||||
Net income (loss) per share: | |||||||||||||||
Basic | $ | 0.50 | $ | 0.34 | $ | 0.64 | $ | (0.61 | ) | ||||||
Diluted | $ | 0.50 | $ | 0.34 | $ | 0.63 | $ | (0.61 | ) | ||||||
Weighted average shares used in computing net income (loss) per share: | |||||||||||||||
Basic | 187 | 188 | 188 | 187 | |||||||||||
Diluted | 189 | 190 | 191 | 187 | |||||||||||
102
Item 9. Changes in and Disagreements with Accountants on Accounting and Financial Disclosure
None.
Item 9A. Controls and Procedures
Evaluation of Disclosure Controls and Procedures
Our management has evaluated, under the supervision and with the participation of our Chief Executive Officer and Chief Financial Officer, the effectiveness of our disclosure controls and procedures as of October 31, 2019, pursuant to and as required by Rule 13a-15(b) under the Securities Exchange Act of 1934 (“Exchange Act”). Based on that evaluation, our Chief Executive Officer and Chief Financial Officer have concluded that, as of October 31, 2019, the company's disclosure controls and procedures, as defined by Rule 13a-15(e) under the Exchange Act, were effective and designed to ensure that (i) information required to be disclosed in the company's reports filed under the Exchange Act is recorded, processed, summarized and reported within the time periods specified in the SEC's rules and forms, and (ii) information is accumulated and communicated to management, including the Chief Executive Officer and Chief Financial Officer, as appropriate to allow timely decisions regarding required disclosures.
Management's Report on Internal Control over Financial Reporting
Our management is responsible for establishing and maintaining adequate internal control over financial reporting, as such term is defined in Exchange Act Rule 13a-15(f). Under the supervision and with the participation of our management, including our Chief Executive Officer and Chief Financial Officer, we conducted an evaluation of the effectiveness of our internal control over financial reporting based on the framework in Internal Control - Integrated Framework (2013) issued by the Committee of Sponsoring Organizations of the Treadway Commission. Based on the results of this evaluation, our management concluded that our internal control over financial reporting was effective as of October 31, 2019.
The effectiveness of our internal control over financial reporting as of October 31, 2019 has been audited by PricewaterhouseCoopers LLP, an independent registered public accounting firm, as stated in their report which appears in Item 8 of this Annual Report on Form 10-K.
Changes in Internal Control Over Financial Reporting
Effective November 1, 2018, we adopted Accounting Standards Update ("ASU") 2014-09, Revenue From Contracts With Customers. Although the new revenue standard is expected to have an immaterial impact on our ongoing net income, we did implement changes to our processes and control activities related to revenue recognition, including changes to our information systems. These included the development of new policies based on the five-step model provided in the new revenue standard, new training, ongoing contract review requirements, and gathering of information provided for disclosures. There were no other changes in our internal control over financial reporting during the year ended October 31, 2019 that have materially affected, or are reasonably likely to materially affect, our internal control over financial reporting.
Item 9B. Other Information
None.
PART III
Item 10. Directors, Executive Officers and Corporate Governance
Information regarding our directors will appear under “Proposal No. 1 - Election of Directors” in our Proxy Statement for the Annual Meeting of Stockholders (“Proxy Statement”). That portion of the Proxy Statement is incorporated by reference into this report. Information regarding our executive officers appears in Item 1 of this report under “Executive Officers of the Registrant.” Information regarding our Audit and Finance Committee and our Audit and Finance Committee's financial expert appears under “Audit and Finance Committee Report” and “Board Structure and Compensation” in our Proxy Statement. That portion of the Proxy Statement is incorporated by reference into this report.
There were no material changes to the procedures by which security holders may recommend nominees to our Board of Directors. Information regarding our code of ethics (the company's Standards of Business Conduct) applicable to our principal executive officer, our principal financial officer, our controller and other senior financial officers appears in Item 1 of this report under “Investor Information.” We will post amendments to or waivers from a provision of the Standards of Business Conduct with respect to those persons on our website at www.investor.keysight.com.
103
In order for a stockholder proposal to be considered for inclusion in Keysight’s proxy statement for the 2020 annual meeting of stockholders, the written proposal must be received by Keysight no later than December 21, 2019 and should contain such information as is required under Keysight’s Bylaws. Such proposals will need to comply with the SEC’s regulations regarding the inclusion of stockholder proposals in Keysight sponsored proxy materials.
Compliance with Section 16(a) of the Exchange Act
Information about compliance with Section 16(a) of the Exchange Act appears under “Delinquent Section 16(a) Reports” in the Proxy Statement. That portion of the Proxy Statement is incorporated by reference into this report.
Item 11. Executive Compensation
Information about compensation of our named executive officers appears under “Executive Compensation,” “Compensation Committee Interlocks and Insider Participation” in the Proxy Statement. Information about compensation of our directors appears under “Director Compensation” and “Compensation Committee Report” and “Stock Ownership Guidelines” in the Proxy Statement. Those portions of the Proxy Statement are incorporated by reference into this report.
Item 12. Security Ownership of Certain Beneficial Owners and Management and Related Stockholder Matters
Information about security ownership of certain beneficial owners and management appears under "Common Stock Ownership of Certain Beneficial Owners and Management" in the Proxy Statement. That portion of the Proxy Statement is incorporated by reference into this report.
EQUITY COMPENSATION PLAN INFORMATION
The following table summarizes information about our equity compensation plans as of October 31, 2019. All outstanding awards relate to our common stock.
Plan Category | Number of Securities to be Issued upon Exercise of Outstanding Options, Warrants and Rights | Weighted-average Exercise Price of Outstanding Options, Warrants and Rights | Number of Securities Remaining Available for Future Issuance under Equity Compensation Plans (Excluding Securities Reflected in Column (a)) | ||||||
Equity compensation plans approved by security holders (1)(2)(3) | 7,612,225 | $ | 28 | 28,104,184 | |||||
Equity compensation plans not approved by security holders | — | $ | — | — | |||||
Total | 7,612,225 | 28,104,184 | |||||||
(1) | The number of securities remaining available for future issuance in column (c) includes 20,491,958 shares of common stock authorized and available for issuance under the Keysight Technologies, Inc. Employee Stock Purchase Plan ("423(b) Plan"). The number of shares authorized for issuance under the 423(b) Plan is subject to an automatic annual increase of the lesser of one percent of the outstanding common stock of Keysight or an amount determined by the Compensation Committee of our Board of Directors. Under the terms of the 423(b) Plan, in no event shall the aggregate number of shares issued under the Plan exceed 75 million shares. The number of securities remaining available for future issuance in column (c) is before the issuance of shares of common stock to participants in consideration of the aggregate participant contribution under 423(b) plan totaling $26 million as of October 31, 2019. |
(2) | We issue securities under our equity compensation plans in forms other than options, warrants or rights. Those are issued under the 2014 Equity and Incentive Compensation Plan which was originally adopted by the Board on July 16, 2014, subsequently amended and restated by the Board on September 29, 2014 and January 22, 2015 and became effective as of November 1, 2014 (the “Effective Date”). The Plan was further amended and restated by the Board on November 16, 2017. The 2014 Plan provides for the grant of awards in the form of stock options, stock appreciation rights, restricted stock, restricted stock units, performance shares and performance units with performance-based conditions to vesting or exercisability, and cash awards. The 2014 Plan has a term of ten years. |
104
(3) | We issue securities under our equity compensation plans in forms which do not require a payment by the recipient to us at the time of exercise or vesting, including restricted stock, restricted stock units and performance units. Accordingly, the weighted-average exercise price in column (b) does not take these awards into account. |
Item 13. Certain Relationships and Related Transactions, and Director Independence
Information about certain relationships and related transactions appears under "Related Person Transaction Policy and Procedures" in the Proxy Statement. Information about director independence appears under the heading "Board Structure and Compensation — Director Independence" in the Proxy Statement. Each of those portions of the Proxy Statement is incorporated by reference into this report.
Item 14. Principal Accounting Fees and Services
Information about principal accountant fees and services as well as related pre-approval policies appears under "Fees Paid to PricewaterhouseCoopers" and "Policy on Audit and Finance Committee Preapproval of Audit and Permissible Non-Audit Services of Independent Registered Auditors" in the Proxy Statement. Those portions of the Proxy Statement are incorporated by reference into this report.
PART IV
Item 15. Exhibits and Financial Statement Schedules
(a) | The following documents are filed as part of this report: |
1. | Financial Statements. |
See Index to Consolidated Financial Statements under Item 8 of this report.
2. | Financial Statement Schedule. |
The following additional financial statement schedule should be considered in conjunction with our consolidated financial statements. All other schedules have been omitted because the required information is either not applicable or not sufficiently material to require submission of the schedule.
SCHEDULE II
VALUATION AND QUALIFYING ACCOUNTS
Description | Balance at Beginning of Period | Additions Charged to Expenses or Other Accounts* | Deductions Credited to Expenses or Other Accounts** | Balance at End of Period | ||||||||||||
(in millions) | ||||||||||||||||
2019 | ||||||||||||||||
Tax valuation allowance | $ | $ | $ | ( | ) | $ | ||||||||||
2018 | ||||||||||||||||
Tax valuation allowance | $ | $ | $ | ( | ) | $ | ||||||||||
2017 | ||||||||||||||||
Tax valuation allowance | $ | $ | $ | ( | ) | $ | ||||||||||
* Additions include current-year additions charged to expense and current-year build due to increases in net deferred tax assets, return to provision true-ups, other adjustments and Other Comprehensive Income ("OCI") impact to deferred taxes.
** Deductions include current-year releases credited to expense and current-year reductions due to decreases in net deferred tax assets, return to provision true-ups, other adjustments and OCI impact to deferred taxes.
105
3. | Exhibits. |
Exhibits are incorporated herein by reference or are filed with this report as indicated below (numbered in accordance with Item 601 of Regulation S-K):
Incorporation by Reference | |||||||||||
Exhibit Number | Description | Form | Date | Exhibit Number | Filed Herewith | ||||||
2.1 | 10-12B/A | 8/13/2014 | 2.1 | ||||||||
2.2 | 8-K | 2/1/2017 | 2.1 | ||||||||
3.1 | 8-K | 11/3/2014 | 3.1 | ||||||||
3.2 | 8-K | 11/3/2014 | 3.2 | ||||||||
4.1 | 8-K | 10/17/2014 | 4.1 | ||||||||
4.2 | 8-K | 10/17/2014 | 4.2 | ||||||||
4.3 | 8-K | 4/6/2017 | 4.2 | ||||||||
4.4 | 8-K | 10/22/2019 | 4.2 | ||||||||
10.1 | 10-12B/A | 8/13/2014 | 10.1 | ||||||||
10.2 | 10-12B/A | 8/13/2014 | 10.2 | ||||||||
10.3 | 10-12B/A | 8/13/2014 | 10.3 | ||||||||
10.4 | 10-12B/A | 8/13/2014 | 10.4 | ||||||||
10.5 | 10-12B/A | 8/13/2014 | 10.5 | ||||||||
10.6 | 10-12B/A | 8/13/2014 | 10.6 | ||||||||
10.7 | 10-12B/A | 7/18/2014 | 10.7 | ||||||||
10.8 | 10-12B/A | 7/18/2014 | 10.8 | ||||||||
10.9 | 8-K | 11/3/2014 | 10.2 | ||||||||
10.10 | 10-12B/A | 7/18/2014 | 10.11 | ||||||||
106
10.11 | 10-12B/A | 7/18/2014 | 10.12 | ||||||||
10.12 | 10-12B/A | 7/18/2014 | 10.13 | ||||||||
10.13 | 10-12B/A | 7/18/2014 | 10.14 | ||||||||
10.14 | 10-12B/A | 7/18/2014 | 10.15 | ||||||||
10.15 | 10-12B/A | 7/18/2014 | 10.16 | ||||||||
10.16 | 10-12B/A | 7/18/2014 | 10.17 | ||||||||
10.17 | 10-12B/A | 7/18/2014 | 10.18 | ||||||||
10.18 | 8-K | 11/3/2014 | 10.1 | ||||||||
10.19 | 8-K | 11/3/2014 | 10.3 | ||||||||
10.20 | 8-K | 3/24/2015 | 10.1 | ||||||||
10.21 | DEF 14A | 2/6/2015 | APPENDIX B | ||||||||
10.22 | 10-K | 12/21/2015 | 10.27 | ||||||||
10.23 | 10-K | 12/21/2015 | 10.28 | ||||||||
10.24 | 10-K | 12/21/2015 | 10.29 | ||||||||
10.25 | 10-K | 12/21/2015 | 10.30 | ||||||||
10.26 | 10-K | 12/21/2015 | 10.31 | ||||||||
10.27 | 10-K | 12/19/2016 | 10.32 | ||||||||
10.28 | 8-K | 2/22/2017 | 10.1 | ||||||||
10.29 | DEF 14A | 2/9/2018 | APPENDIX A | ||||||||
13.1 | 8-K | 6/25/2019 | 99.1 | ||||||||
13.2 | 8-K | 6/25/2019 | 99.2 | ||||||||
13.3 | 8-K | 6/25/2019 | 99.3 | ||||||||
13.4 | 8-K | 6/25/2019 | 23.1 | ||||||||
11.1 | X | ||||||||||
21.1 | X | ||||||||||
23.1 | X | ||||||||||
107
24.1 | X | ||||||||||
31.1 | X | ||||||||||
31.2 | X | ||||||||||
32.1 | X | ||||||||||
32.2 | X | ||||||||||
101.INS | XBRL Instance Document - the instance document does not appear in the Interactive Data File because its XBRL tags are embedded within the Inline XBRL document. | X | |||||||||
101.SCH | XBRL Schema Document | X | |||||||||
101.CAL | XBRL Calculation Linkbase Document | X | |||||||||
101.LAB | XBRL Labels Linkbase Document | X | |||||||||
101.PRE | XBRL Presentation Linkbase Document | X | |||||||||
101.DEF | XBRL Definition Linkbase Document | X | |||||||||
99.1 | 8-K | 11/3/2014 | 99.1 | ||||||||
* | Indicates management contract or compensatory plan, contract or arrangement. |
** | Certain schedules and exhibits have been omitted pursuant to Item 601(b)(2) of Regulation S-K. Keysight will furnish supplemental copies of any such schedules or exhibits to the U.S. Securities and Exchange Commission upon request. |
108
SIGNATURES
Pursuant to the requirements of Section 13 or 15(d) of the Securities Exchange Act of 1934, the registrant has duly caused this report to be signed on its behalf by the undersigned, thereunto duly authorized.
KEYSIGHT TECHNOLOGIES, INC. | ||||
BY | /s/ Neil Dougherty | |||
Neil Dougherty | ||||
Senior Vice President and Chief Financial Officer | ||||
Date: December 18, 2019
109
POWER OF ATTORNEY
KNOW ALL PERSONS BY THESE PRESENTS, that each person whose signature appears below constitutes and appoints Jeffrey K. Li and JoAnn Juskie, or any of them, his or her attorneys-in-fact, for such person in any and all capacities, to sign any amendments to this report and to file the same, with exhibits thereto, and other documents in connection therewith, with the Securities and Exchange Commission, hereby ratifying and confirming all that any of said attorneys-in-fact, or substitute or substitutes, may do or cause to be done by virtue hereof. Pursuant to the requirements of the Securities Exchange Act of 1934, this report has been signed below by the following persons on behalf of the registrant and in the capacities and on the dates indicated.
Signature | Title | Date | ||
/s/ RONALD S. NERSESIAN | Chairman of the Board, President and Chief Executive Officer | December 18, 2019 | ||
Ronald S. Nersesian | (Principal Executive Officer) | |||
/s/ NEIL DOUGHERTY | Senior Vice President and Chief Financial Officer | December 18, 2019 | ||
Neil Dougherty | (Principal Financial Officer) | |||
/s/ JOHN C. SKINNER | Vice President and Corporate Controller | December 18, 2019 | ||
John C. Skinner | (Principal Accounting Officer) | |||
/s/ PAUL N. CLARK | Director | December 18, 2019 | ||
Paul N. Clark | ||||
/s/ JAMES G. CULLEN | Director | December 18, 2019 | ||
James G. Cullen | ||||
/s/ CHARLES J. DOCKENDORFF | Director | December 18, 2019 | ||
Charles J. Dockendorff | ||||
/s/ JEAN M. HALLORAN | Director | December 18, 2019 | ||
Jean M. Halloran | ||||
/s/ RICHARD HAMADA | Director | December 18, 2019 | ||
Richard Hamada | ||||
/s/ PAUL LACOUTURE | Director | December 18, 2019 | ||
Paul Lacouture | ||||
/s/ JOANNE B. OLSEN | Director | December 18, 2019 | ||
Joanne B. Olsen | ||||
/s/ ROBERT A. RANGO | Director | December 18, 2019 | ||
Robert A. Rango | ||||
110