UNITED STATES
SECURITIES AND EXCHANGE COMMISSION
Washington, D.C. 20549
FORM
CURRENT REPORT
Pursuant to Section 13 or 15(d) of the Securities Exchange Act of 1934
Date of Report
(Date of earliest event reported):
(Exact name of registrant as specified in charter)
(State or Other Jurisdiction of Incorporation) |
(Commission File Number) |
(I.R.S. Employer Identification No.) |
(Address of Principal Executive Offices) | (Zip Code) |
Registrant’s
telephone number, including area code: (
Check the appropriate box below if the Form 8-K filing is intended to simultaneously satisfy the filing obligation of the registrant under any of the following provisions:
Written communications pursuant to Rule 425 under the Securities Act (17 CFR 230.425) |
Soliciting material pursuant to Rule 14a-12 under the Exchange Act (17 CFR 240.14a-12) |
Pre-commencement communications pursuant to Rule 14d-2(b) under the Exchange Act (17 CFR 240.14d-2(b)) |
Pre-commencement communications pursuant to Rule 13e-4(c) under the Exchange Act (17 CFR 240.13e-4(c)) |
Securities registered pursuant to Section 12(b) of the Act:
Title of each class | Trading Symbol(s) | Name of each exchanged on which registered | ||
Indicate by check mark whether the registrant is an emerging growth company as defined in Rule 405 of the Securities Act of 1933 (§230.405 of this chapter) or Rule 12b-2 of the Securities Exchange Act of 1934 (§240.12b-2 of this chapter).
Emerging
growth company
If an emerging growth company, indicate by check mark if the registrant has elected not to use the extended transition period for complying with any new or revised financial accounting standards provided pursuant to Section 13(a) of the Exchange Act ¨
Item 2.02. Results of Operations and Financial Condition.
On March 3, 2022, GMS Inc. (the “Company” or “GMS”) issued a press release, a copy of which is furnished as Exhibit 99.1 hereto and incorporated herein by reference, announcing the Company’s financial results for the three and nine months ended January 31, 2022.
The information contained in Item 7.01 concerning the presentation to GMS investors is hereby incorporated into this Item 2.02 by reference.
In accordance with General Instruction B.2 of Form 8-K, the information in this Item 2.02 of this Current Report on Form 8-K, including Exhibits 99.1 and 99.2 attached hereto, shall not be deemed “filed” for the purposes of Section 18 of the Securities Exchange Act of 1934, as amended (the “Exchange Act”), or otherwise subject to the liabilities of that section, nor shall it be deemed incorporated by reference in any filing under the Securities Act of 1933, as amended (the “Securities Act”), or the Exchange Act, except as shall be expressly set forth by specific reference in such a filing.
Item 7.01. Regulation FD Disclosure.
The slide presentation furnished as Exhibit 99.2 hereto, and incorporated herein by reference, will be presented to certain investors of GMS on March 3, 2022, and may be used by GMS in various other presentations to investors on or after March 3, 2022.
In accordance with General Instruction B.2 of Form 8-K, the information in this Item 7.01 of this Current Report on Form 8-K, including Exhibit 99.2 attached hereto, shall not be deemed “filed” for the purposes of Section 18 of the Exchange Act, or otherwise subject to the liabilities of that section, nor shall it be deemed incorporated by reference in any filing under the Securities Act or the Exchange Act, except as shall be expressly set forth by specific reference in such a filing.
Item 9.01. Financial Statements and Exhibits.
(d) Exhibits.
Exhibit | Description |
99.1* | Press release, dated March 3, 2022. |
99.2* | GMS Inc. presentation to investors. |
104 | The cover page from this Current Report on Form 8-K, formatted in Inline XBRL. |
*Furnished herewith
SIGNATURES
Pursuant to the requirements of the Securities Exchange Act of 1934, the Registrant has duly caused this report to be signed on its behalf by the undersigned hereunto duly authorized.
GMS INC. | |||
Date: March 3, 2022 | By: | /s/ Scott M. Deakin | |
Name: | Scott M. Deakin | ||
Title: | Chief Financial Officer |
Exhibit 99.1
GMS REPORTS THIRD QUARTER FISCAL 2022 RESULTS
Net Sales of $1.15 Billion with Significant Year-Over-Year Growth
in Net Income and Adjusted EBITDA
Tucker, Georgia, March 3, 2022. GMS Inc. (NYSE: GMS), a leading North American specialty building products distributor, today reported financial results for the fiscal third quarter ended January 31, 2022.
Third Quarter Fiscal 2022 Highlights
(Comparisons are to the third quarter of fiscal 2021)
• | Net sales of $1,153.6 million increased 53.6%; organic net sales increased 41.5%. |
• | Net income of $61.4 million, or $1.40 per diluted share, compared to net income of $16.1 million, or $0.37 per diluted share; Adjusted net income of $76.5 million, or $1.74 per diluted share, compared to $25.9 million, or $0.60 per diluted share. |
• | Adjusted EBITDA of $135.1 million increased $72.5 million, or 115.8%; Adjusted EBITDA margin improved 340 basis points to 11.7% from 8.3%. |
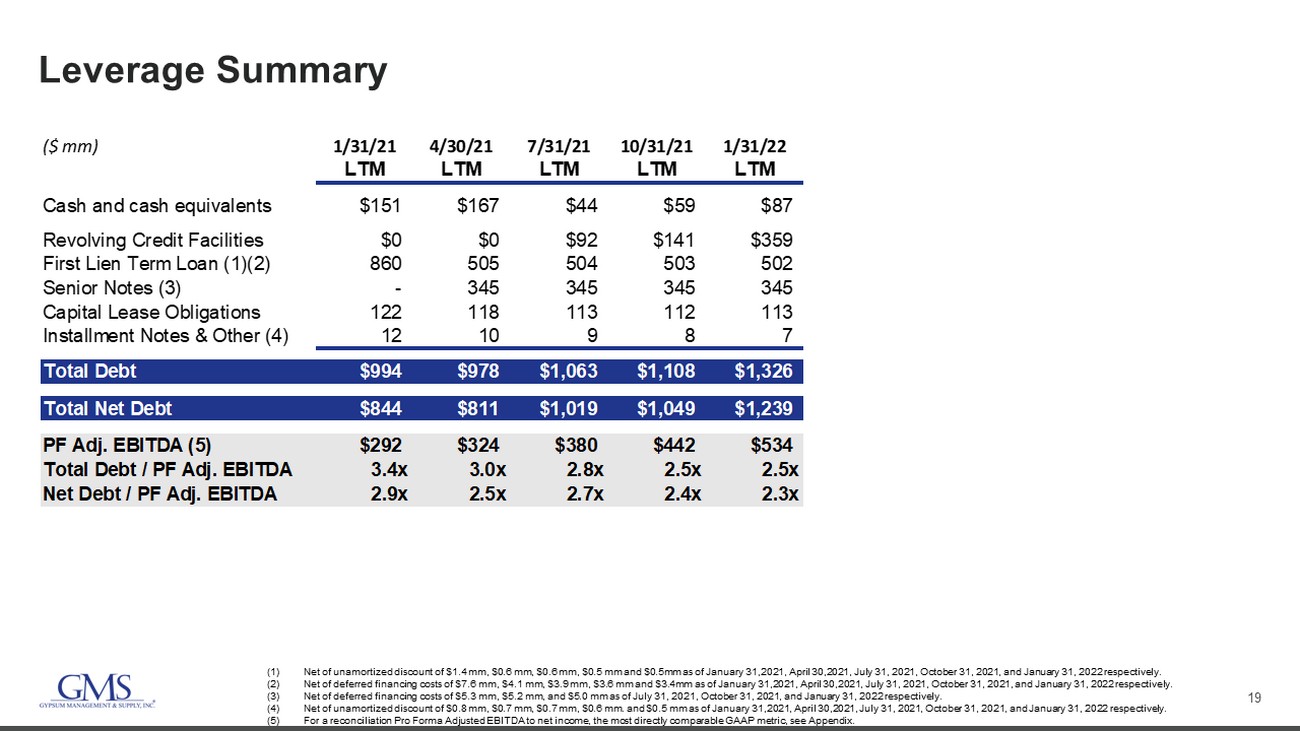
• | Net debt leverage was 2.3 times as of the end of the third quarter of fiscal 2022, down from 2.9 times a year ago. |
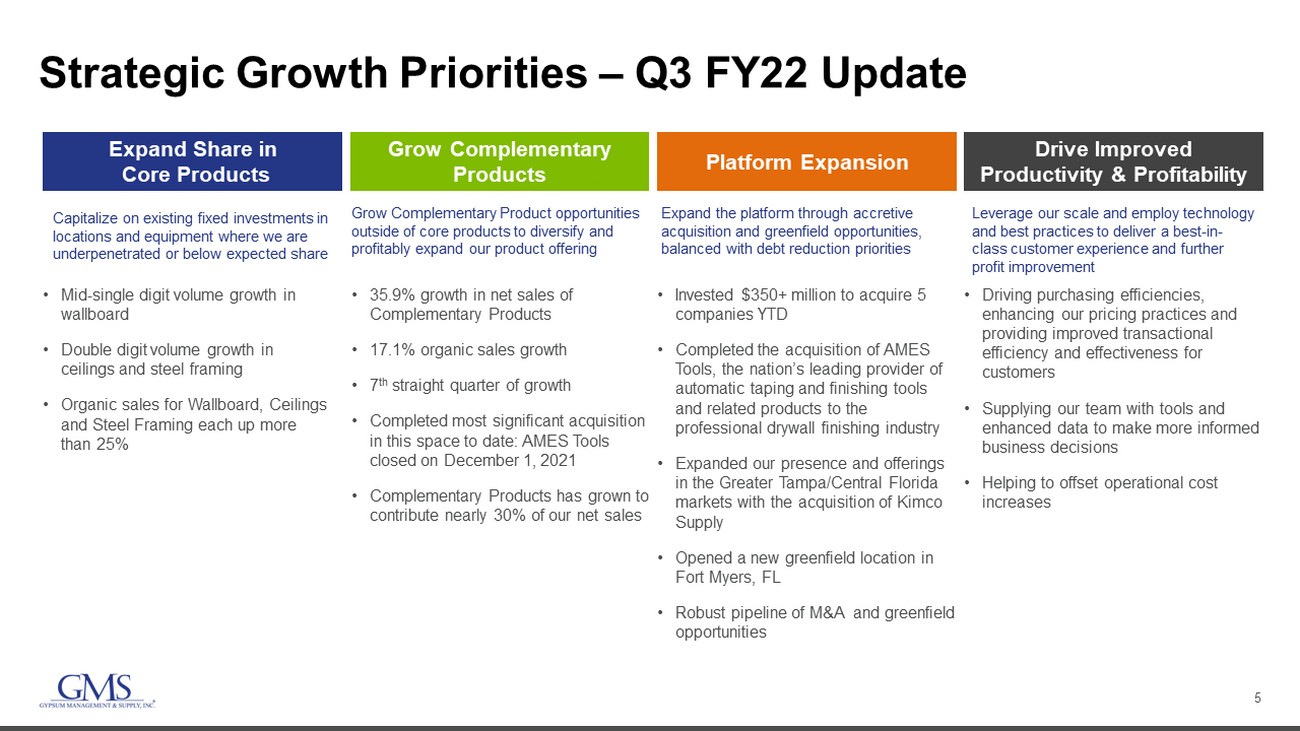
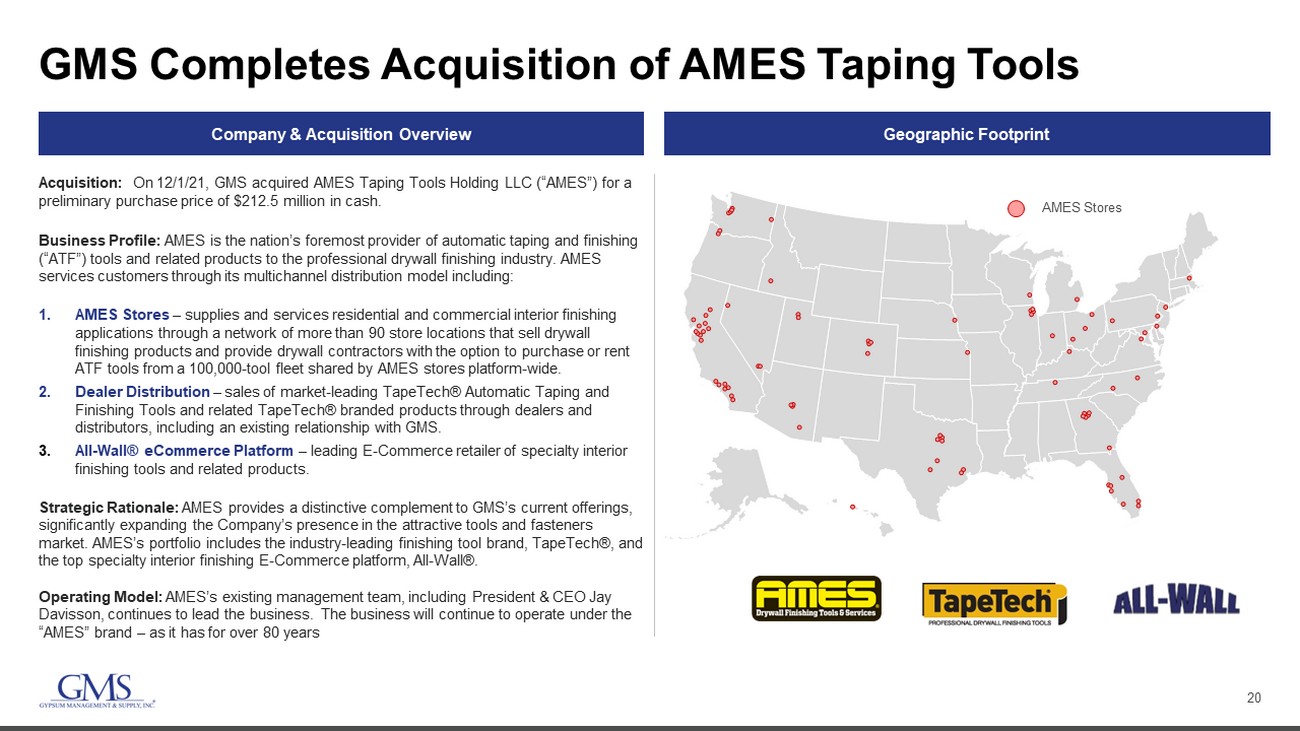
• | Completed the acquisition of AMES Taping Tools Holding LLC (“AMES”), the nation’s foremost provider of automatic taping and finishing tools to the professional drywall finishing industry. |
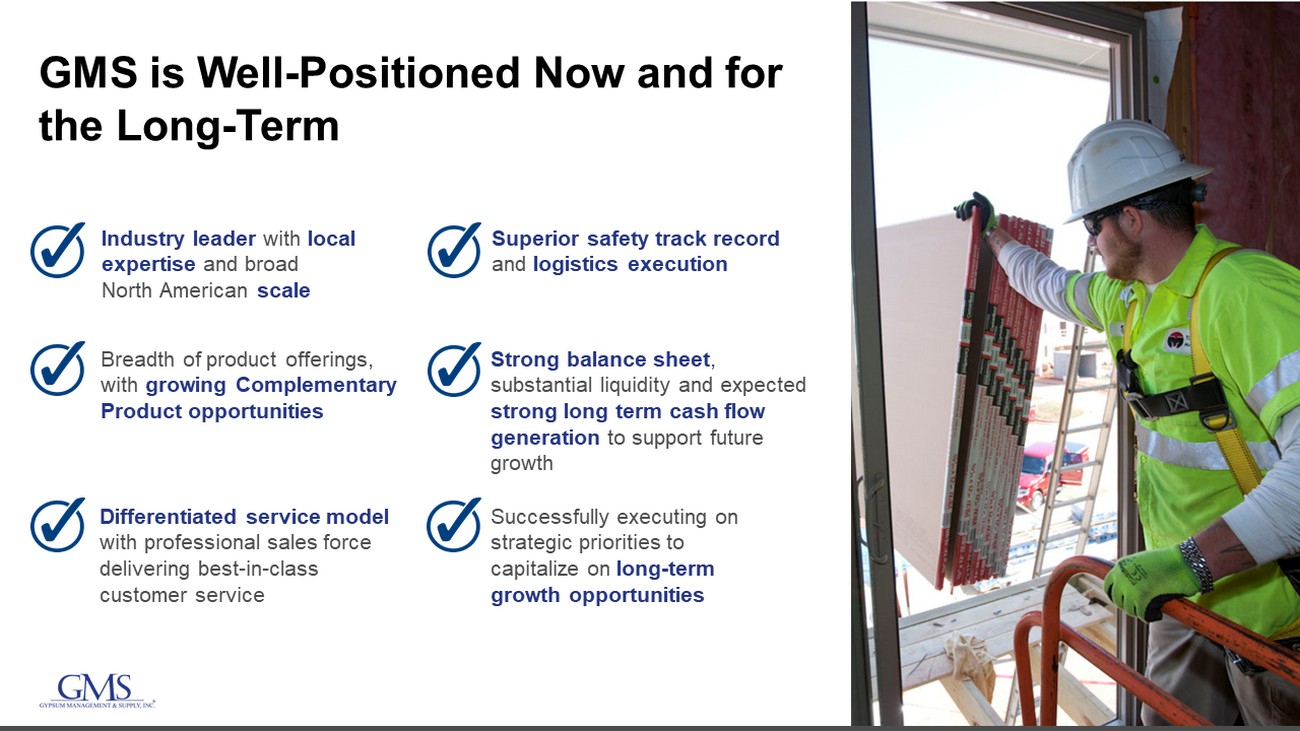
“Carrying our momentum into the new calendar year, we achieved record-setting results with higher levels of sales, net income and Adjusted EBITDA than we have ever recorded for our fiscal third quarter,” said John C. Turner, Jr., President and Chief Executive Officer of GMS. “Leveraging our significant scale advantages to deliver outstanding customer service in a solid residential market, coupled with an inflationary pricing environment and successful platform expansion activities, helped us more than triple our net income and double our Adjusted EBITDA as compared to the prior year quarter.”
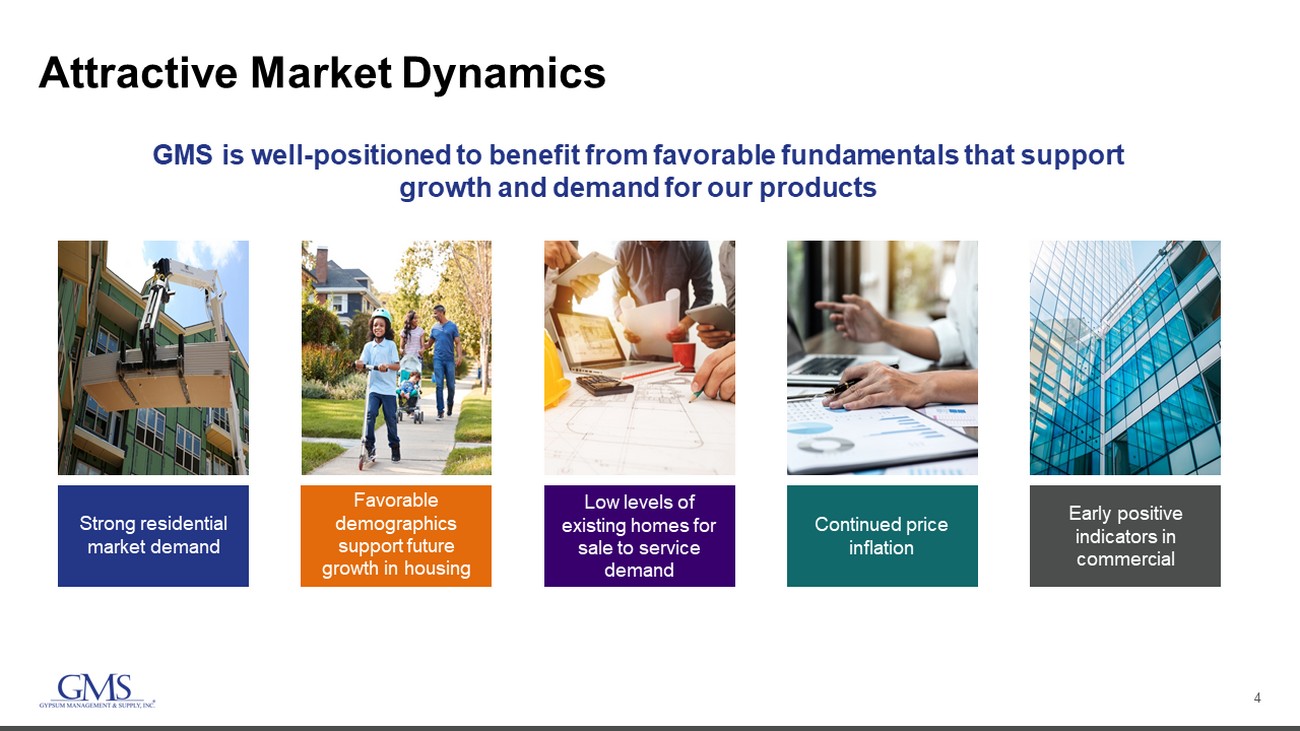
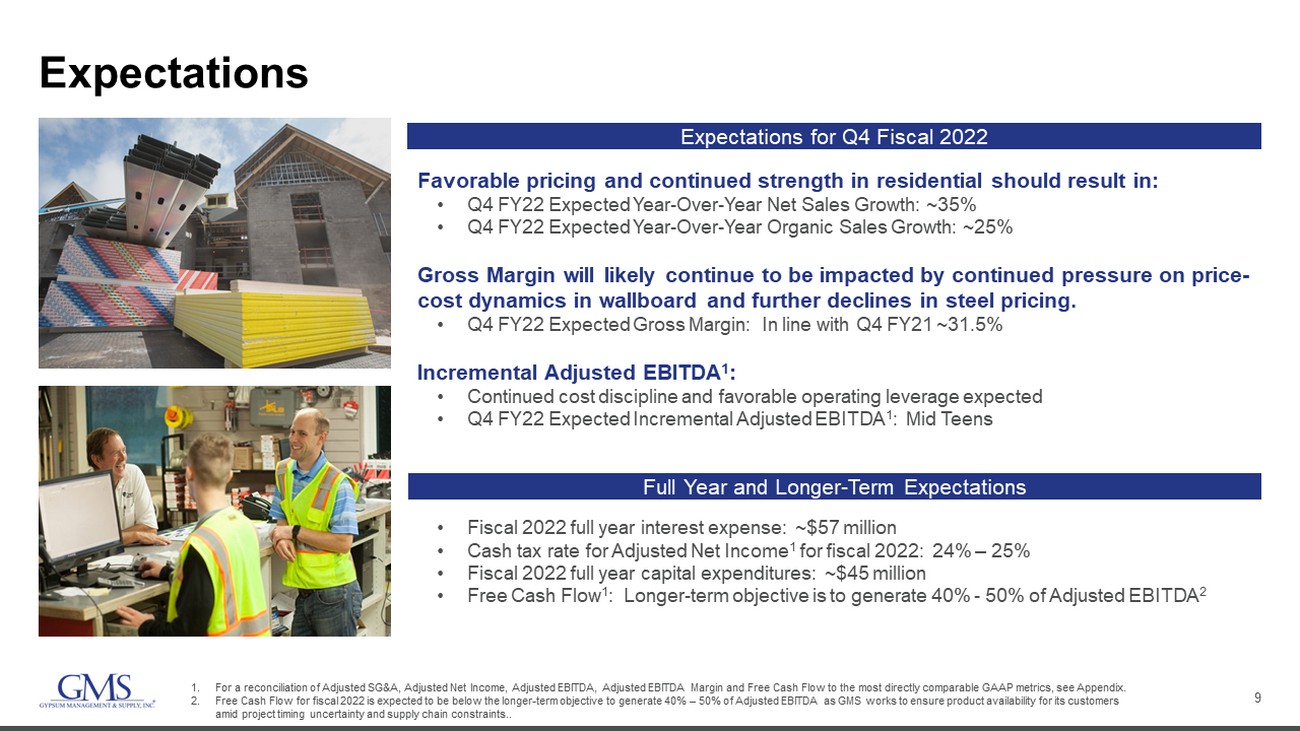
Turner continued, “The team remains fully focused on the continued execution of our strategic priorities. Looking ahead to close out our fiscal year in April, similar market dynamics as we experienced in the third quarter along with indications of improving levels of commercial activity, serve as a positive backdrop as we are confident we will continue to deliver exceptional levels of service to provide value to customers and to drive strong results for our stakeholders.”
Third Quarter Fiscal 2022 Results
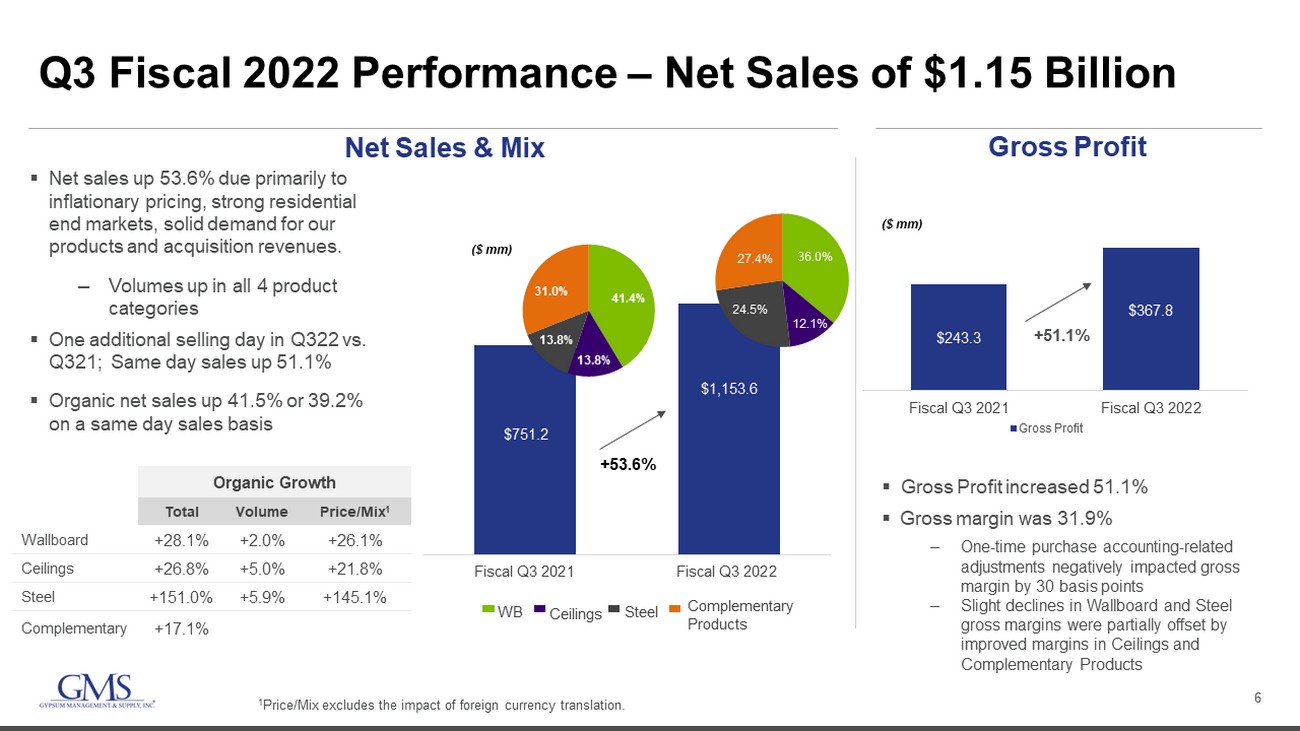
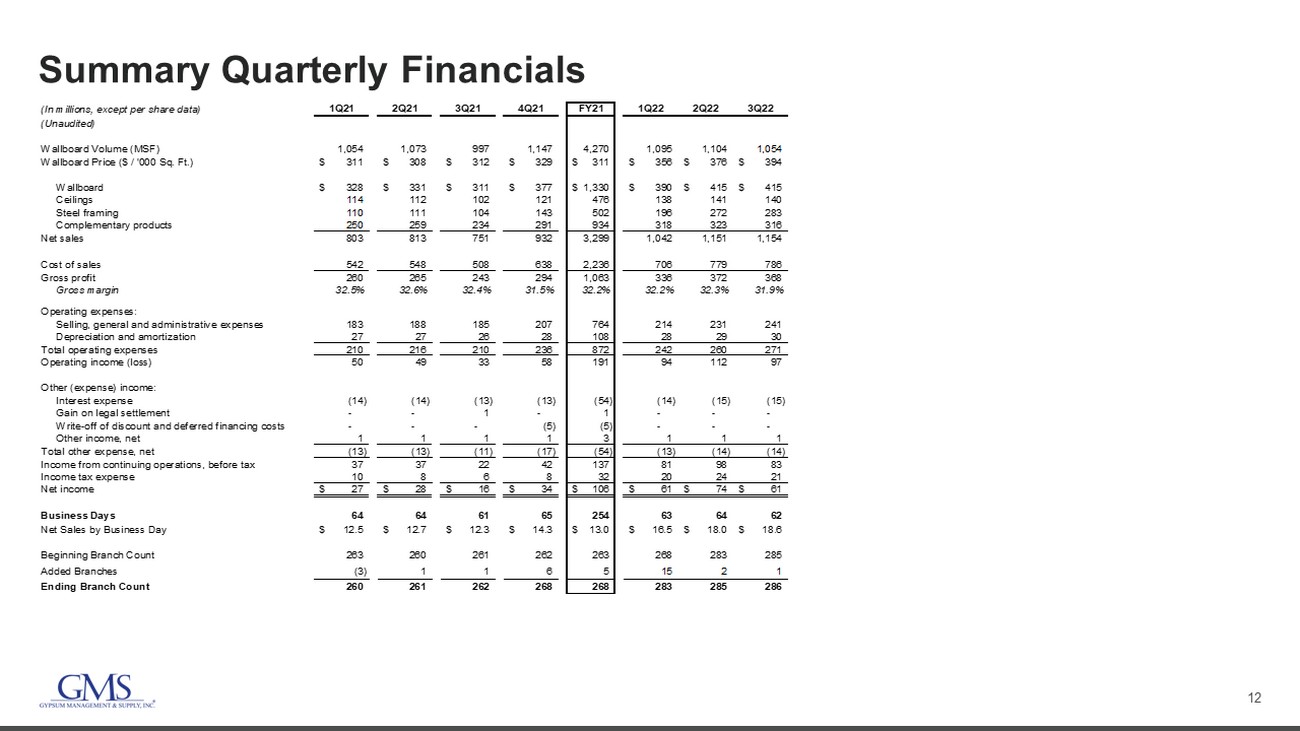
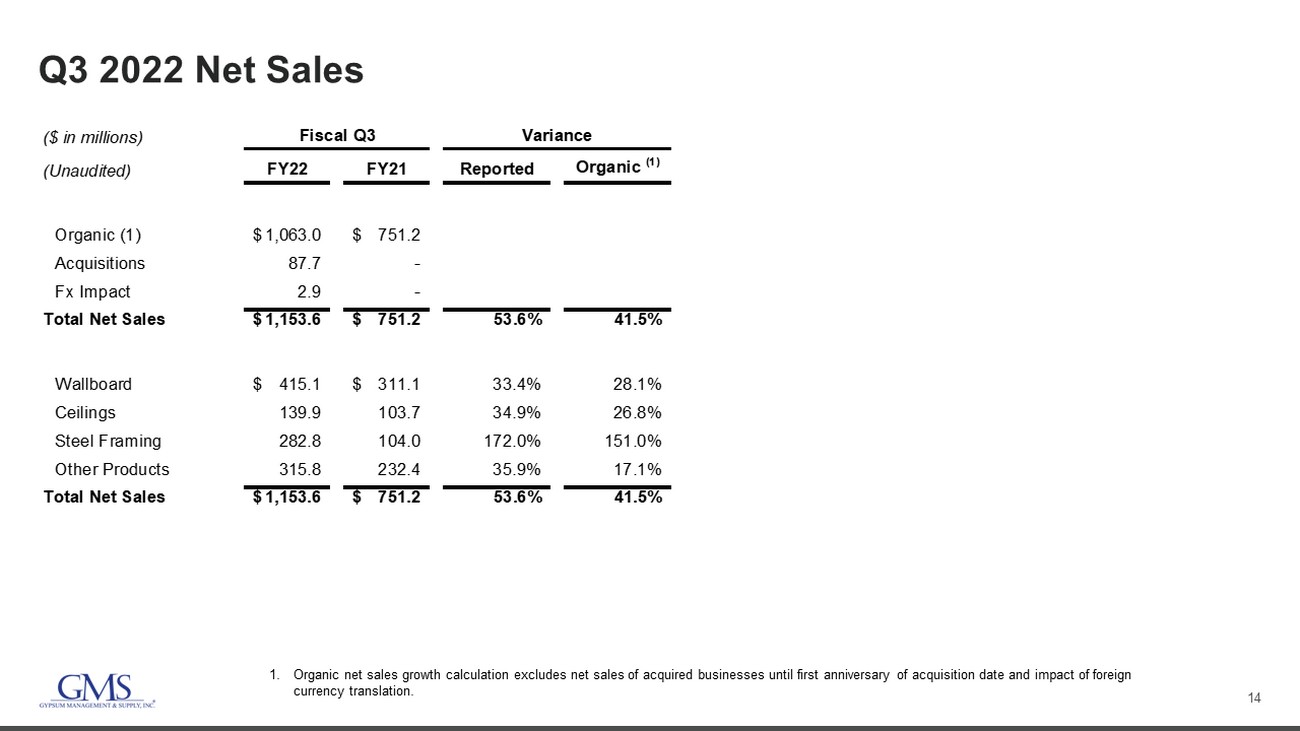
Net sales for the third quarter of fiscal 2022 of $1.15 billion increased 53.6% as compared with the prior year quarter, primarily due to inflationary pricing, healthy residential end markets, strong performance from our complementary products and the acquisitions of D.L. Building Materials, Westside Building Material and AMES Taping Tools. Organic net sales increased 41.5%.
1
Excluding the impact from one additional selling day in the third quarter of fiscal 2022 compared to the same period a year ago, net sales and organic net sales were up 51.1% and 39.2%, respectively. While the sales growth was, in large part, due to product inflation, the Company also achieved year-over-year volume growth in each of its four product categories.
Year-over-year sales increases by product category were as follows:
· Wallboard sales of $415.1 million increased 33.4% (up 28.1% on an organic basis).
· Ceilings sales of $139.9 million increased 34.9% (up 26.8% on an organic basis).
· Steel framing sales of $282.8 million increased 172.0% (up 151.0% on an organic basis).
· Complementary product sales of $315.8 million increased 35.9% (up 17.1% on an organic basis).
Gross profit of $367.8 million increased 51.1% compared to the third quarter of fiscal 2021 primarily due to the successful pass through of product inflation, continued strength in residential market demand and incremental gross profit from acquisitions. Gross margin of 31.9%, declined 50 basis points year-over-year primarily due to the timing and elasticity of inflationary price-cost dynamics in the market. On a product line basis, wallboard and steel margins were unfavorably impacted by these dynamics while complementary products and ceilings benefited.
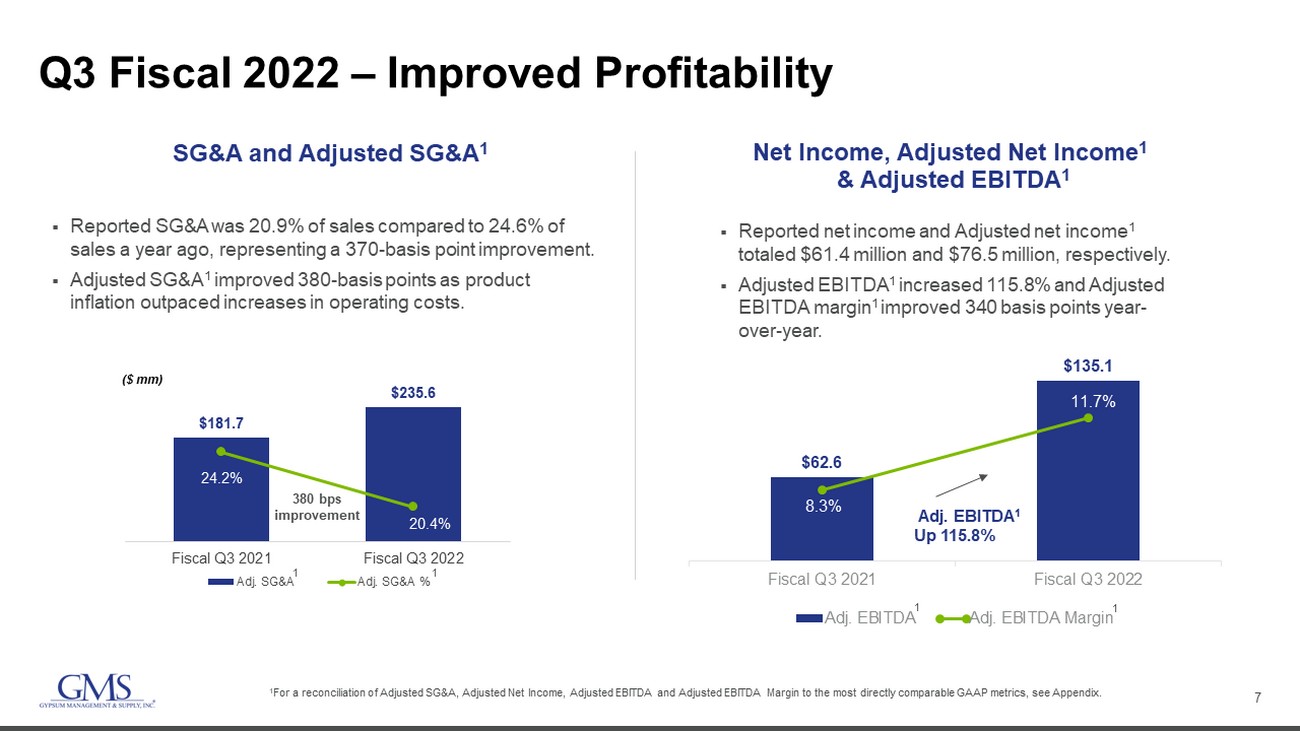
Selling, general and administrative (“SG&A”) expense as a percentage of net sales improved 370 basis points to 20.9% for the quarter compared to 24.6% in the third quarter of fiscal 2021. Adjusted SG&A expense as a percentage of net sales of 20.4% improved 380 basis points from 24.2% in the prior year quarter as product inflation outpaced increases in operating costs.
Net income increased 280.6% to $61.4 million, or $1.40 per diluted share, compared to net income of $16.1 million, or $0.37 per diluted share, in the third quarter of fiscal 2021. Adjusted net income was $76.5 million, or $1.74 per diluted share, compared to $25.9 million, or $0.60 per diluted share, in the third quarter of the prior fiscal year.
Adjusted EBITDA increased $72.5 million, or 115.8%, to $135.1 million compared to the prior year quarter. Adjusted EBITDA margin of 11.7% improved 340 basis points from 8.3% for the third quarter of fiscal 2021.
Balance Sheet, Liquidity and Cash Flow
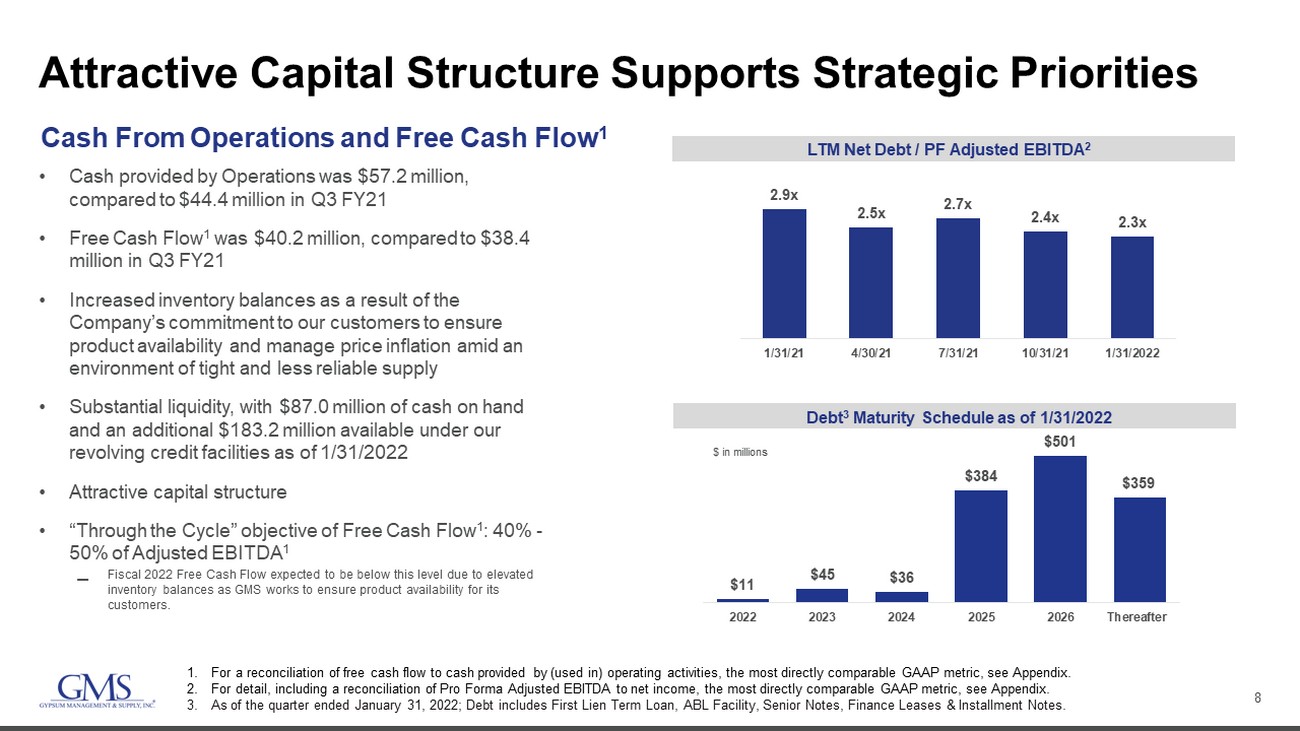
As of January 31, 2022, the Company had cash on hand of $87.0 million, total debt of $1.3 billion and $183.2 million of available liquidity under its revolving credit facilities. Net debt leverage was 2.3 times as of the end of the quarter, down from 2.9 times at the end of the third quarter of fiscal 2021.
The Company recorded cash provided by operating activities and free cash flow of $57.2 million and $40.2 million, respectively, for the quarter ended January 31, 2022. For the quarter ended January 31, 2021, the Company recorded cash provided by operating activities and free cash flow of $44.4 million and $38.4 million, respectively.
2
Platform Expansion Activities
During the third quarter of fiscal 2022, GMS acquired two companies.
On December 1, 2021, GMS completed the acquisition of AMES Taping Tools Holding LLC (“AMES”). With more than 90 company-owned AMES® stores and a fleet of approximately 100,000 automatic taping and finishing (“ATF”) tools available for rent, AMES is the nation’s leading provider of ATF tools and related products to the professional drywall finishing industry. Its portfolio provides a distinctive complement to GMS’s other product offerings and includes the industry-leading finishing tool brand, TapeTech®, as well as the country’s most widely used specialty interior finishing e-commerce platform, All-Wall.com®.
Also on December 1, 2021, the Company completed the acquisition of Kimco Supply Company (“Kimco”), a highly-respected distributor of drywall and related construction products and architectural elements with two locations in the Greater Tampa and Central Florida markets. Kimco adds density for the Company in the growing Tampa-St. Petersburg-Clearwater market for both core and complementary products.
Also, during the period, the Company opened a new greenfield location in Fort Myers, FL, bringing service to this Top 100 Metropolitan Statistical Area.
In addition, since acquiring AMES in early December, that business has continued to grow and execute against its growth strategy by adding two new stores in Pflugerville, TX and Greenville, SC during the Company’s fiscal third quarter.
Conference Call and Webcast
GMS will host a conference call and webcast to discuss its results for the third quarter of fiscal 2022 ended January 31, 2022 and other information related to its business at 8:30 a.m. Eastern Time on Thursday, March 3, 2022. Investors who wish to participate in the call should dial 877-407-3982 (domestic) or 201-493-6780 (international) at least 5 minutes prior to the start of the call. The live webcast will be available on the Investors section of the Company’s website at www.gms.com. There will be a slide presentation of the results available on that page of the website as well. Replays of the call will be available through April 3, 2022 and can be accessed at 844-512-2921 (domestic) or 412-317-6671 (international) and entering the pass code 13725846.
About GMS Inc.
Founded in 1971, GMS operates a network of nearly 300 distribution centers with extensive product offerings of wallboard, ceilings, steel framing and complementary construction products. In addition, GMS operates more than 90 tool sales, rental and service centers, providing a comprehensive selection of building products and solutions for its residential and commercial contractor customer base across the United States and Canada. The Company’s unique operating model combines the benefits of a national platform and strategy with a local go-to-market focus, enabling GMS to generate significant economies of scale while maintaining high levels of customer service.
Use of Non-GAAP Financial Measures
GMS reports its financial results in accordance with GAAP. However, it presents Adjusted net income, free cash flow, Adjusted SG&A, Adjusted EBITDA, and Adjusted EBITDA margin, which are not recognized financial measures under GAAP. GMS believes that Adjusted net income, free cash flow, Adjusted SG&A, Adjusted EBITDA, and Adjusted EBITDA margin assist investors and analysts in comparing its operating performance across reporting periods on a consistent basis by excluding items that the Company does not believe are indicative of its core operating performance. The Company’s management believes Adjusted net income, Adjusted SG&A, free cash flow, Adjusted EBITDA and Adjusted EBITDA margin are helpful in highlighting trends in its operating results, while other measures can differ significantly depending on long-term strategic decisions regarding capital structure, the tax jurisdictions in which the Company operates and capital investments. In addition, the Company utilizes Adjusted EBITDA in certain calculations in its debt agreements.
3
You are encouraged to evaluate each adjustment and the reasons GMS considers it appropriate for supplemental analysis. In addition, in evaluating Adjusted net income, Adjusted SG&A and Adjusted EBITDA, you should be aware that in the future, the Company may incur expenses similar to the adjustments in the presentation of Adjusted net income, Adjusted SG&A and Adjusted EBITDA. The Company’s presentation of Adjusted net income, Adjusted SG&A, Adjusted SG&A margin, Adjusted EBITDA, and Adjusted EBITDA margin should not be construed as an inference that its future results will be unaffected by unusual or non-recurring items. In addition, Adjusted net income, free cash flow, Adjusted SG&A and Adjusted EBITDA may not be comparable to similarly titled measures used by other companies in GMS’s industry or across different industries. Please see the tables at the end of this release for a reconciliation of Adjusted EBITDA, free cash flow, Adjusted SG&A and Adjusted net income to the most directly comparable GAAP financial measures.
When calculating organic net sales growth, the Company excludes from the calculation (i) net sales of acquired businesses until the first anniversary of the acquisition date, and (ii) the impact of foreign currency translation.
Forward-Looking Statements and Information
This press release includes “forward-looking statements” within the meaning of the Private Securities Litigation Reform Act of 1995. You can generally identify forward-looking statements by the Company’s use of forward-looking terminology such as “anticipate,” “believe,” “confident,” “continue,” “could,” “estimate,” “expect,” “intend,” “may,” “might,” “plan,” “potential,” “predict,” “seek,” or “should,” or the negative thereof or other variations thereon or comparable terminology. In particular, statements about the markets in which GMS operates, including in particular residential and commercial construction, and the economy generally, pricing, the demand for the Company’s products, supply chain issues and related project timing, the Company’s strategic priorities and the results thereof, service levels and the ability to drive value and results contained in this press release may be considered forward-looking statements. The Company has based forward-looking statements on its current expectations, assumptions, estimates and projections. While the Company believes these expectations, assumptions, estimates, and projections are reasonable, such forward-looking statements are only predictions and involve known and unknown risks and uncertainties, many of which are beyond its control, including current and future public health issues that may affect the Company’s business. Forward-looking statements involve risks and uncertainties, including, but not limited to, those described in the “Risk Factors” section in the Company’s most recent Annual Report on Form 10-K, and in its other periodic reports filed with the SEC. In addition, the statements in this release are made as of March 3, 2022. The Company undertakes no obligation to update any of the forward-looking statements made herein, whether as a result of new information, future events, changes in expectation or otherwise. These forward-looking statements should not be relied upon as representing the Company’s views as of any date subsequent to March 3, 2022.
Contact Information:
Investors:
Carey Phelps
ir@gms.com
770-723-3369
4
GMS Inc.
Condensed Consolidated Statements of Operations (Unaudited)
(in thousands, except per share data)
​ | Three Months Ended | Nine Months Ended | ||||||||||||||
January 31, | January 31, | |||||||||||||||
​ | 2022 | 2021 | 2022 | 2021 | ||||||||||||
Net sales | $ | 1,153,595 | $ | 751,191 | $ | 3,346,222 | $ | 2,366,620 | ||||||||
Cost of sales (exclusive of depreciation and amortization shown separately below) | 785,823 | 507,867 | 2,270,747 | 1,597,767 | ||||||||||||
Gross profit | 367,772 | 243,324 | 1,075,475 | 768,853 | ||||||||||||
Operating expenses: | ||||||||||||||||
Selling, general and administrative | 241,040 | 184,844 | 685,652 | 556,308 | ||||||||||||
Depreciation and amortization | 29,750 | 25,562 | 86,867 | 79,904 | ||||||||||||
Total operating expenses | 270,790 | 210,406 | 772,519 | 636,212 | ||||||||||||
Operating income | 96,982 | 32,918 | 302,956 | 132,641 | ||||||||||||
Other (expense) income: | ||||||||||||||||
Interest expense | (15,429 | ) | (13,454 | ) | (43,830 | ) | (41,060 | ) | ||||||||
Gain on legal settlement | — | 1,382 | — | 1,382 | ||||||||||||
Other income, net | 1,041 | 989 | 2,771 | 2,441 | ||||||||||||
Total other expense, net | (14,388 | ) | (11,083 | ) | (41,059 | ) | (37,237 | ) | ||||||||
Income before taxes | 82,594 | 21,835 | 261,897 | 95,404 | ||||||||||||
Provision for income taxes | 21,211 | 5,709 | 64,951 | 23,590 | ||||||||||||
Net income | $ | 61,383 | $ | 16,126 | $ | 196,946 | $ | 71,814 | ||||||||
Weighted average common shares outstanding: | ||||||||||||||||
Basic | 43,094 | 42,726 | 43,106 | 42,691 | ||||||||||||
Diluted | 43,945 | 43,361 | 43,937 | 43,184 | ||||||||||||
Net income per common share: | ||||||||||||||||
Basic | $ | 1.42 | $ | 0.38 | $ | 4.57 | $ | 1.68 | ||||||||
Diluted | $ | 1.40 | $ | 0.37 | $ | 4.48 | $ | 1.66 |
5
GMS Inc.
Condensed Consolidated Balance Sheets (Unaudited)
(in thousands, except per share data)
​ | January 31, 2022 | April 30, 2021 | ||||||
Assets | ||||||||
Current assets: | ​ | |||||||
Cash and cash equivalents | $ | 86,975 | $ | 167,012 | ||||
Trade accounts and notes receivable, net of allowances of $9,683 and $6,282, respectively | 700,255 | 558,661 | ||||||
Inventories, net | 585,351 | 357,054 | ||||||
Prepaid expenses and other current assets | 19,055 | 19,525 | ||||||
Total current assets | 1,391,636 | 1,102,252 | ||||||
Property and equipment, net of accumulated depreciation of $216,541 and $193,364, respectively | 342,995 | 311,326 | ||||||
Operating lease right-of-use assets | 146,762 | 118,413 | ||||||
Goodwill | 693,942 | 576,330 | ||||||
Intangible assets, net | 480,312 | 350,869 | ||||||
Deferred income taxes | 20,536 | 15,715 | ||||||
Other assets | 9,997 | 8,993 | ||||||
Total assets | $ | 3,086,180 | $ | 2,483,898 | ||||
Liabilities and Stockholders’ Equity | ||||||||
Current liabilities: | ||||||||
Accounts payable | $ | 293,485 | $ | 322,965 | ||||
Accrued compensation and employee benefits | 79,031 | 72,906 | ||||||
Other accrued expenses and current liabilities | 129,927 | 87,138 | ||||||
Current portion of long-term debt | 44,624 | 46,018 | ||||||
Current portion of operating lease liabilities | 40,413 | 33,474 | ||||||
Total current liabilities | 587,480 | 562,501 | ||||||
Non-current liabilities: | ||||||||
Long-term debt, less current portion | 1,281,737 | 932,409 | ||||||
Long-term operating lease liabilities | 107,002 | 90,290 | ||||||
Deferred income taxes, net | 47,174 | 12,728 | ||||||
Other liabilities | 59,511 | 63,508 | ||||||
Total liabilities | 2,082,904 | 1,661,436 | ||||||
Commitments and contingencies | ||||||||
Stockholders' equity: | ||||||||
Common stock, par value $0.01 per share, 500,000 shares authorized; 43,095 and 43,073 shares issued and outstanding as of January 31, 2022 and April 30, 2021, respectively | 431 | 431 | ||||||
Preferred stock, par value $0.01 per share, 50,000 shares authorized; 0 shares issued and outstanding as of January 31, 2022 and April 30, 2021 | — | — | ||||||
Additional paid-in capital | 536,635 | 542,737 | ||||||
Retained earnings | 471,481 | 274,535 | ||||||
Accumulated other comprehensive income (loss) | (5,271 | ) | 4,759 | |||||
Total stockholders' equity | 1,003,276 | 822,462 | ||||||
Total liabilities and stockholders' equity | $ | 3,086,180 | $ | 2,483,898 |
6
GMS Inc.
Condensed Consolidated Statements of Cash Flows (Unaudited)
(in thousands)
Nine Months Ended January 31, |
||||||||
2022 | 2021 | |||||||
Cash flows from operating activities: | ​ | |||||||
Net income | $ | 196,946 | $ | 71,814 | ||||
Adjustments to reconcile net income to net cash (used in) provided by operating activities: | ​ | ​ | ||||||
Depreciation and amortization | 86,867 | 79,904 | ||||||
Amortization of debt discount and debt issuance costs | 2,037 | 2,257 | ||||||
Equity-based compensation | 12,461 | 10,318 | ||||||
(Gain) loss on disposal and impairment of assets | (474 | ) | (529 | ) | ||||
Deferred income taxes | (1,740 | ) | (9,645 | ) | ||||
Other items, net | 5,357 | 105 | ||||||
Changes in assets and liabilities net of effects of acquisitions: | ​ | ​ | ||||||
Trade accounts and notes receivable | (109,948 | ) | (15,381 | ) | ||||
Inventories | (191,103 | ) | (24,391 | ) | ||||
Prepaid expenses and other assets | 2,215 | 1,040 | ||||||
Accounts payable | (46,310 | ) | (41,371 | ) | ||||
Accrued compensation and employee benefits | 3,618 | (11,932 | ) | |||||
Other accrued expenses and liabilities | 20,187 | 6,307 | ||||||
Cash (used in) provided by operating activities | (19,887 | ) | 68,496 | |||||
Cash flows from investing activities: | ||||||||
Purchases of property and equipment | (33,161 | ) | (17,857 | ) | ||||
Proceeds from sale of assets | 1,124 | 1,233 | ||||||
Acquisition of businesses, net of cash acquired | (345,376 | ) | (51 | ) | ||||
Cash used in investing activities | (377,413 | ) | (16,675 | ) | ||||
Cash flows from financing activities: | ||||||||
Repayments on revolving credit facilities | (823,583 | ) | (102,189 | ) | ||||
Borrowings from revolving credit facilities | 1,182,774 | 14,750 | ||||||
Payments of principal on long-term debt | (3,832 | ) | (7,476 | ) | ||||
Payments of principal on finance lease obligations | (23,154 | ) | (22,662 | ) | ||||
Repurchases of common stock | (17,858 | ) | (2,000 | ) | ||||
Proceeds from exercises of stock options | 4,024 | 3,656 | ||||||
Payments for taxes related to net share settlement of equity awards | (2,850 | ) | (807 | ) | ||||
Proceeds from issuance of stock pursuant to employee stock purchase plan | 2,332 | 2,076 | ||||||
Cash provided by (used in) financing activities | 317,853 | (114,652 | ) | |||||
Effect of exchange rates on cash and cash equivalents | (590 | ) | 2,495 | |||||
Decrease in cash and cash equivalents | (80,037 | ) | (60,336 | ) | ||||
Cash and cash equivalents, beginning of period | 167,012 | 210,909 | ||||||
Cash and cash equivalents, end of period | $ | 86,975 | $ | 150,573 | ||||
Supplemental cash flow disclosures: | ||||||||
Cash paid for income taxes | $ | 61,066 | $ | 31,942 | ||||
Cash paid for interest | 35,721 | 38,114 |
7
GMS Inc.
Net Sales by Product Group (Unaudited)
(dollars in thousands)
Three Months Ended | Nine Months Ended | |||||||||||||||||||||||||||||||
January 31, 2022 | % of Total | January 31, 2021 | % of Total | January 31, 2022 | % of Total | January 31, 2021 | % of Total | |||||||||||||||||||||||||
Wallboard | $ | 415,132 | 36.0 | % | $ | 311,122 | 41.4 | % | $ | 1,219,789 | 36.5 | % | $ | 969,722 | 41.0 | % | ||||||||||||||||
Ceilings | 139,894 | 12.1 | % | 103,711 | 13.8 | % | 418,831 | 12.5 | % | 330,480 | 14.0 | % | ||||||||||||||||||||
Steel framing | 282,764 | 24.5 | % | 103,957 | 13.8 | % | 751,040 | 22.4 | % | 325,782 | 13.8 | % | ||||||||||||||||||||
Complementary products | 315,805 | 27.4 | % | 232,401 | 31.0 | % | 956,562 | 28.6 | % | 740,636 | 31.2 | % | ||||||||||||||||||||
Total net sales | $ | 1,153,595 | $ | 751,191 | $ | 3,346,222 | $ | 2,366,620 |
8
GMS Inc.
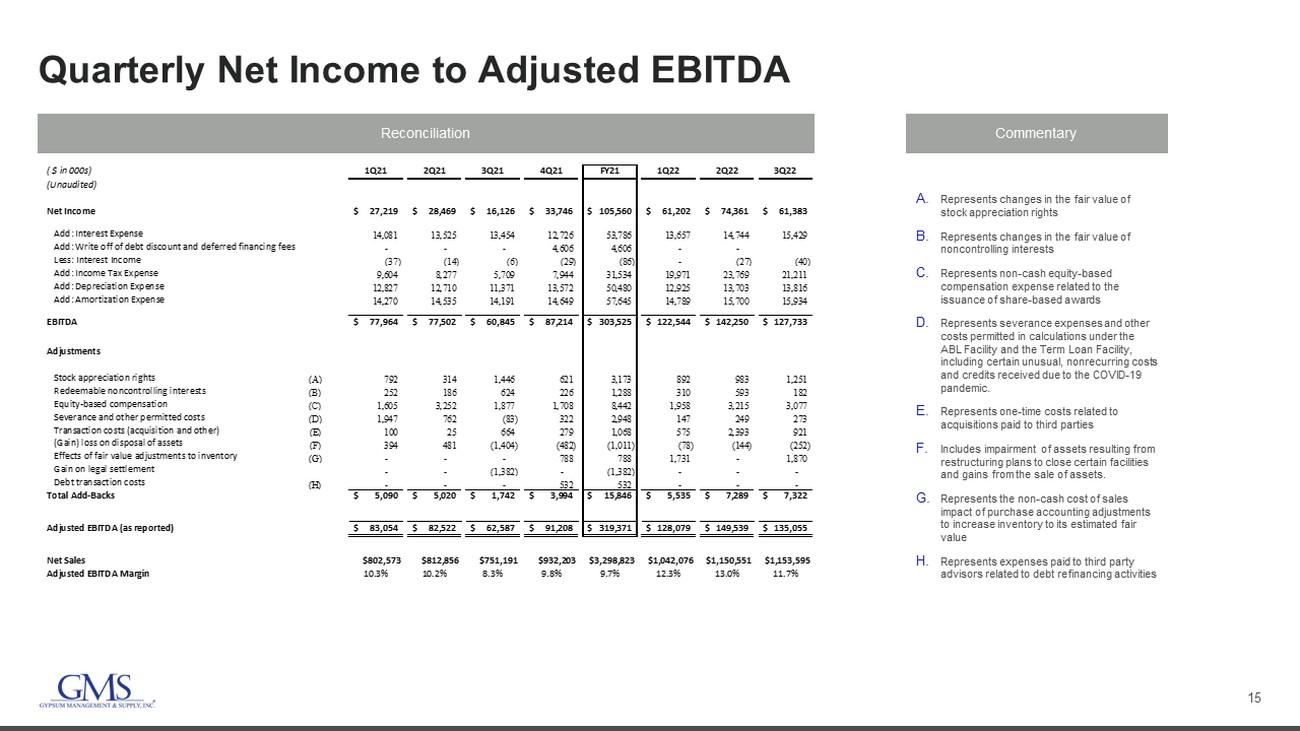
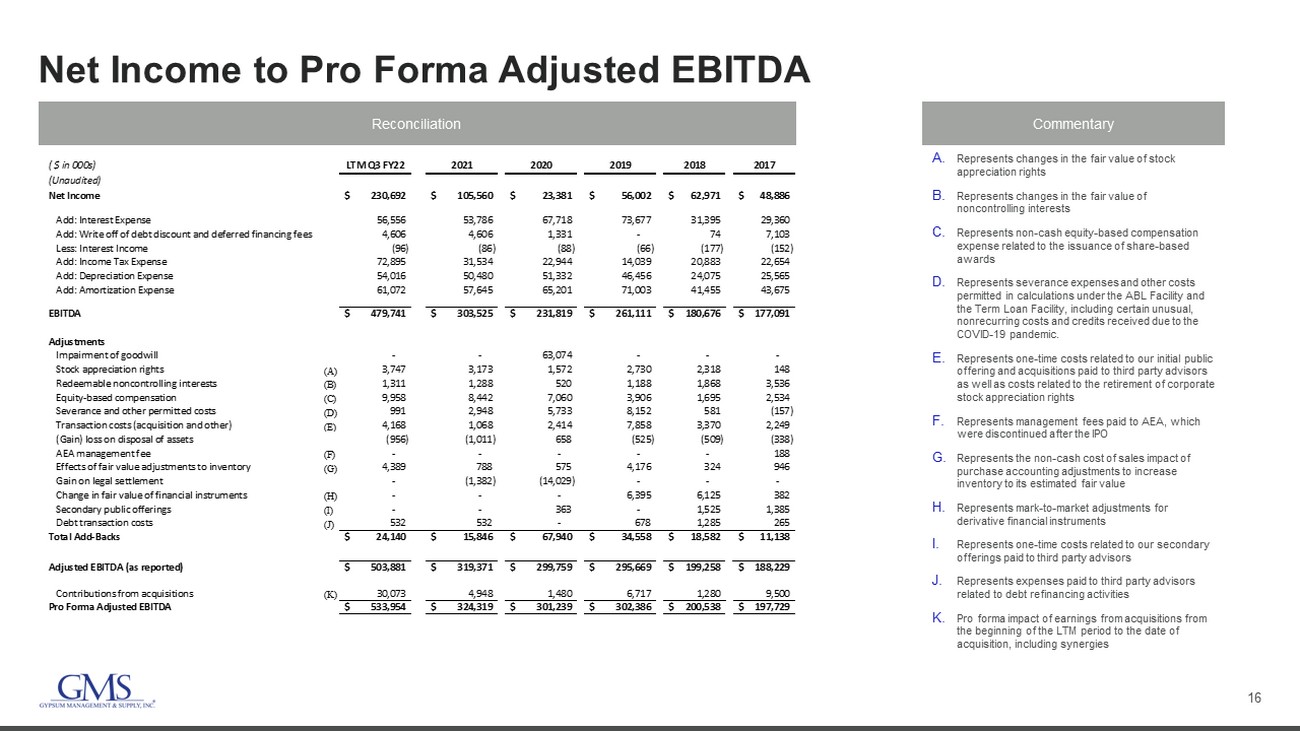
Reconciliation of Net Income to Adjusted EBITDA (Unaudited)
(in thousands)
Three Months Ended | Nine Months Ended | |||||||||||||||
January 31, | January 31, | |||||||||||||||
2022 | 2021 | 2022 | 2021 | |||||||||||||
Net income | $ | 61,383 | $ | 16,126 | $ | 196,946 | $ | 71,814 | ||||||||
Interest expense | 15,429 | 13,454 | 43,830 | 41,060 | ||||||||||||
Interest income | (40 | ) | (6 | ) | (67 | ) | (57 | ) | ||||||||
Provision for income taxes | 21,211 | 5,709 | 64,951 | 23,590 | ||||||||||||
Depreciation expense | 13,816 | 11,371 | 40,444 | 36,908 | ||||||||||||
Amortization expense | 15,934 | 14,191 | 46,423 | 42,996 | ||||||||||||
EBITDA | $ | 127,733 | $ | 60,845 | $ | 392,527 | $ | 216,311 | ||||||||
Stock appreciation expense(a) | 1,251 | 1,446 | 3,126 | 2,552 | ||||||||||||
Redeemable noncontrolling interests(b) | 182 | 624 | 1,085 | 1,062 | ||||||||||||
Equity-based compensation(c) | 3,077 | 1,877 | 8,250 | 6,734 | ||||||||||||
Severance and other permitted costs(d) | 273 | (83 | ) | 669 | 2,626 | |||||||||||
Transaction costs (acquisitions and other)(e) | 921 | 664 | 3,889 | 789 | ||||||||||||
Gain on disposal of assets(f) | (252 | ) | (1,404 | ) | (474 | ) | (529 | ) | ||||||||
Effects of fair value adjustments to inventory(g) | 1,870 | — | 3,601 | — | ||||||||||||
Gain on legal settlement | — | (1,382 | ) | — | (1,382 | ) | ||||||||||
EBITDA addbacks | 7,322 | 1,742 | 20,146 | 11,852 | ||||||||||||
Adjusted EBITDA | $ | 135,055 | $ | 62,587 | $ | 412,673 | $ | 228,163 | ||||||||
​ | ||||||||||||||||
Net sales | $ | 1,153,595 | $ | 751,191 | $ | 3,346,222 | $ | 2,366,620 | ||||||||
Adjusted EBITDA Margin | 11.7 | % | 8.3 | % | 12.3 | % | 9.6 | % |
(a) | Represents changes in the fair value of stock appreciation rights. | |
(b) | Represents changes in the fair values of noncontrolling interests. | |
(c) | Represents non-cash equity-based compensation expense related to the issuance of share-based awards. | |
(d) | Represents severance expenses and other costs permitted in the calculation of Adjusted EBITDA under the ABL Facility and the Term Loan Facility, including certain unusual, nonrecurring costs and credits due to COVID-19. | |
(e) | Represents costs related to acquisitions paid to third parties. | |
(f) | Includes gains from the sale of assets. | |
(g) | Represents the non-cash cost of sales impact of acquisition accounting adjustments to increase inventory to its estimated fair value. |
9
GMS Inc.
Reconciliation of Cash Provided By (Used In) Operating Activities to Free Cash Flow (Unaudited)
(in thousands)
Three Months Ended | Nine Months Ended | |||||||||||||||
January 31, | January 31, | |||||||||||||||
2022 | 2021 | 2022 | 2021 | |||||||||||||
Cash provided by (used in) operating activities | $ | 57,208 | $ | 44,448 | $ | (19,887 | ) | $ | 68,496 | |||||||
Purchases of property and equipment | (17,042 | ) | (6,012 | ) | (33,161 | ) | (17,857 | ) | ||||||||
Free cash flow (a) | $ | 40,166 | $ | 38,436 | $ | (53,048 | ) | $ | 50,639 |
(a) Free cash flow is a non-GAAP financial measure that we define as net cash provided by (used in) operations less capital expenditures.
GMS Inc.
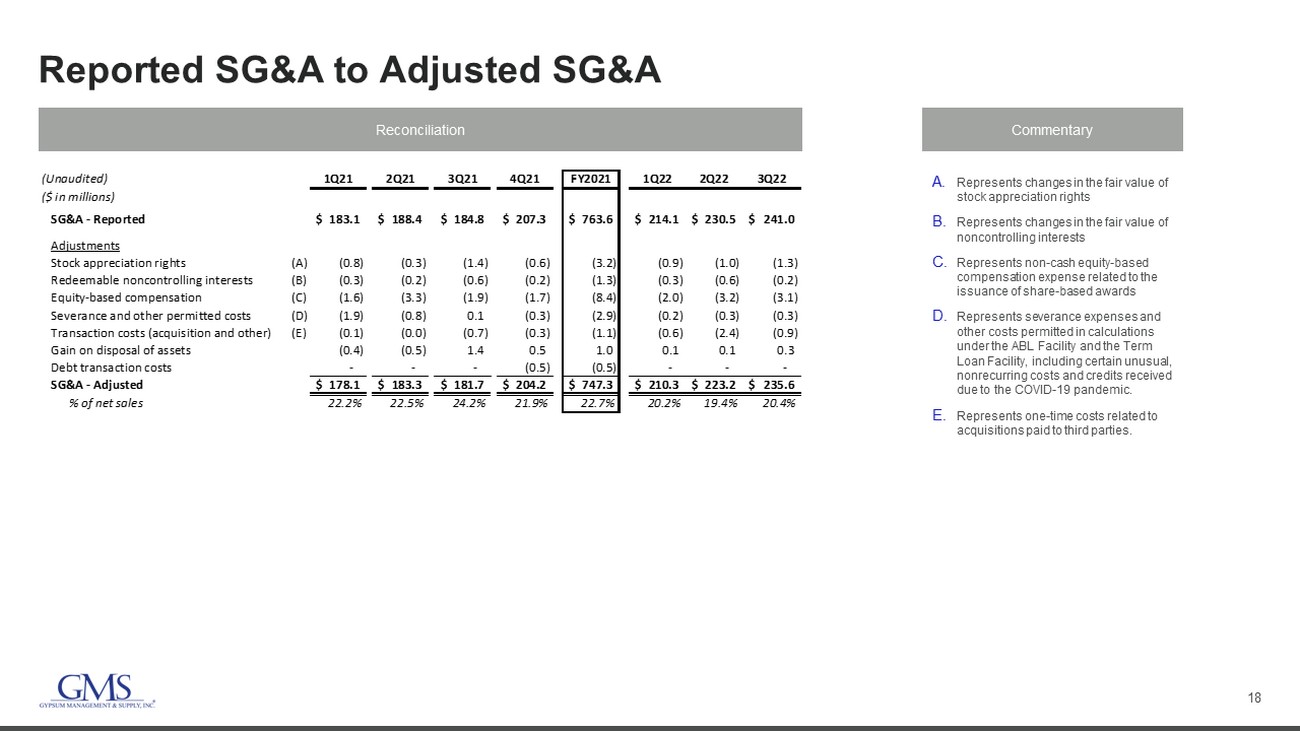
Reconciliation of Selling, General and Administrative Expense to Adjusted SG&A (Unaudited)
(in thousands)
Three Months Ended | Nine Months Ended | |||||||||||||||
January 31, | January 31, | |||||||||||||||
2022 | 2021 | 2022 | 2021 | |||||||||||||
Selling, general and administrative expense | $ | 241,040 | $ | 184,844 | $ | 685,652 | $ | 556,308 | ||||||||
Adjustments | ||||||||||||||||
Stock appreciation expense(a) | (1,251 | ) | (1,446 | ) | (3,126 | ) | (2,552 | ) | ||||||||
Redeemable noncontrolling interests(b) | (182 | ) | (624 | ) | (1,085 | ) | (1,062 | ) | ||||||||
Equity-based compensation(c) | (3,077 | ) | (1,877 | ) | (8,250 | ) | (6,734 | ) | ||||||||
Severance and other permitted costs(d) | (273 | ) | 104 | (685 | ) | (2,589 | ) | |||||||||
Transaction costs (acquisitions and other)(e) | (921 | ) | (664 | ) | (3,889 | ) | (789 | ) | ||||||||
Gain on disposal of assets(f) | 252 | 1,404 | 474 | 529 | ||||||||||||
Adjusted SG&A | $ | 235,588 | $ | 181,741 | $ | 669,091 | $ | 543,111 | ||||||||
Net sales | $ | 1,153,595 | $ | 751,191 | $ | 3,346,222 | $ | 2,366,620 | ||||||||
Adjusted SG&A margin | 20.4 | % | 24.2 | % | 20.0 | % | 22.9 | % |
(a) | Represents changes in the fair value of stock appreciation rights. |
(b) | Represents changes in the fair values of noncontrolling interests. |
(c) | Represents non-cash equity-based compensation expense related to the issuance of share-based awards. |
(d) | Represents severance expenses and other costs permitted in the calculation of Adjusted EBITDA under the ABL Facility and the Term Loan Facility, including certain unusual, nonrecurring costs and credits due to COVID-19. |
(e) | Represents costs related to acquisitions paid to third parties. |
(f) | Includes gains from the sale of assets. |
10
GMS Inc.
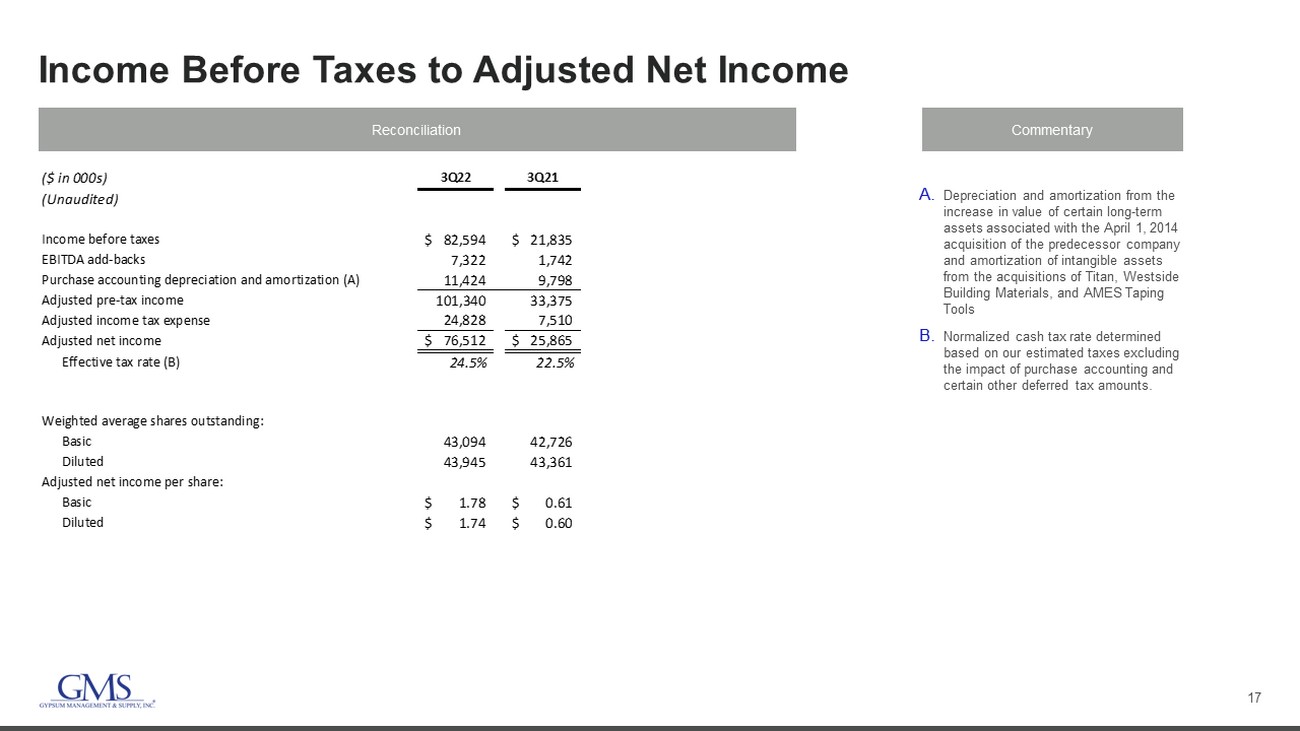
Reconciliation of Income Before Taxes to Adjusted Net Income (Unaudited)
(in thousands, except per share data)
Three Months Ended | Nine Months Ended | |||||||||||||||
January 31, | January 31, | |||||||||||||||
2022 | 2021 | 2022 | 2021 | |||||||||||||
Income before taxes | $ | 82,594 | $ | 21,835 | $ | 261,897 | $ | 95,404 | ||||||||
EBITDA add-backs | 7,322 | 1,742 | 20,146 | 11,852 | ||||||||||||
Acquisition accounting depreciation and amortization (1) | 11,424 | 9,798 | 32,553 | 30,054 | ||||||||||||
Adjusted pre-tax income | 101,340 | 33,375 | 314,596 | 137,310 | ||||||||||||
Adjusted income tax expense | 24,828 | 7,510 | 77,076 | 30,895 | ||||||||||||
Adjusted net income | $ | 76,512 | $ | 25,865 | $ | 237,520 | $ | 106,415 | ||||||||
Effective tax rate (2) | 24.5 | % | 22.5 | % | 24.5 | % | 22.5 | % | ||||||||
Weighted average shares outstanding: | ||||||||||||||||
Basic | 43,094 | 42,726 | 43,106 | 42,691 | ||||||||||||
Diluted | 43,945 | 43,361 | 43,937 | 43,184 | ||||||||||||
Adjusted net income per share: | ||||||||||||||||
Basic | $ | 1.78 | $ | 0.61 | $ | 5.51 | $ | 2.49 | ||||||||
Diluted | $ | 1.74 | $ | 0.60 | $ | 5.41 | $ | 2.46 |
(1) Depreciation and amortization from the increase in value of certain long-term assets associated with the April 1, 2014 acquisition of the predecessor company and amortization of intangible assets from the acquisitions of Titan, Westside Building Material and Ames Taping Tools.
(2) Normalized cash tax rate excluding the impact of acquisition accounting and certain other deferred tax amounts.
11
Exhibit 99.2
Q3 2022 Earnings Call March 3, 2022
2 Safe Harbor and B asis of Presentation Forward - Looking Statement Safe Harbor — This presentation includes “forward - looking statements” within the meaning of the Private Securities Litigation Reform Act of 1995. You can generally identify forward - looking statements by the Company’s use of forward - looking terminology such as “anticipate,” “bel ieve,” “confident,” “continue,” “could,” “estimate,” “expect,” “intend,” “may,” “might,” “plan,” “potential,” “predict,” “seek,” or “should,” or the negative thereof or other variations th ere on or comparable terminology. In particular, statements about the markets in which GMS operates and or our products, including potential growth in those markets, the economy generally, action s t aken to optimize our operations and align our business consistent with demand, our ability to continue successfully navigating the evolving operating environment and executing our bus iness, strategic initiatives and priorities and growth potential, product availability, our ability to manage price inflation, capital structure, pricing, net sales growth, organic sa les growth, gross margins, incremental EBITDA and Adjusted EBITDA, cost discipline, operating leverage, interest expense, tax rates, capital expenditures, and free cash flow, cash flow ge neration and working capital management, future financial performance and liquidity, the ability of the Company to grow stronger, and the ability to deliver growth, value creation and lo ng - term success contained in this presentation may be considered forward - looking statements. Statements about our expectations, beliefs, plans, strategies, objectives, prospects, ass umptions or future events or performance may be considered forward - looking statements. The Company has based forward - looking statements on its current expectations, assumptions , estimates and projections. While the Company believes these expectations, assumptions, estimates and projections are reasonable, such forward - looking statements are only pre dictions and involve known and unknown risks and uncertainties, many of which are beyond its control, including current public health issues that may affect the Company’s bus ine ss. Forward - looking statements involve risks and uncertainties, including, but not limited to, those described in the “Risk Factors” section in the Company’s most recent Annu al Report on Form 10 - K, and in its other periodic reports filed with the SEC. In addition, the statements in this release are made as of March 3, 2022. The Company undertakes no obligation to update any of the forward - looking statements made herein, whether as a result of new information, future events, changes in expectation or otherwise. These forward - looking statem ents should not be relied upon as representing the Company’s views as of any date subsequent to March 3, 2022. Use of Non - GAAP and Adjusted Financial Information — To supplement GAAP financial information, we use adjusted measures of operating results which are non - GAAP measures. This non - GAAP adjusted financial information is provided as additional information for investors. These adjusted results exclude certain costs, expenses, gains and losses, and we believe their exclusion can enhance an overall understanding of our past financial performance and also our prospects for the fu ture. These adjustments to our GAAP results are made with the intent of providing both management and investors a more complete understanding of our operating performance by excl udi ng non - recurring, infrequent or other non - cash charges that are not believed to be material to the ongoing performance of our business. The presentation of this additional inf ormation is not meant to be considered in isolation or as a substitute for GAAP measures of net income, diluted earnings per share or net cash provided by (used in) operating activities pr epared in accordance with generally accepted accounting principles in the United States. Please see the Appendix to this presentation for a further discussion on these non - GAAP measure s and a reconciliation of these non - GAAP measures to the most directly comparable GAAP measures.
3 Q3 Fiscal 2022 Highlights Highest Levels of Net Sales, Net Income and Adjusted EBITDA 1 Ever Recorded for our Fiscal 3rd Quarter ▪ Quarterly net sales of $1.15 billion, up 53.6% from Q321 ‒ Same day sales growth of 51.1% ▪ Sales growth of more than 30% in all four major product categories, including Wallboard, Steel Framing, Ceilings and Complementary Products; Steel remains a standout with 172% sales growth ‒ Sales growth driven by product inflation as well as year - over - year volume growth in each product category ‒ Organic revenue of more than 25% in each of our core product categories ▪ Gross profit up 51% Net Income Up 280.6%; Adjusted EBITDA 1 Up $72.5 million, or 115.8% Adjusted EBITDA Margin 1 Up 340 Basis Points Achieved Further Platform Expansion ▪ Enhanced our Complementary Product offerings with the purchase of AMES Taping Tools, the nation’s foremost provider of automatic taping and finishing tools to the professional drywall industry ▪ Acquired Kimco Supply Company, strengthening our presence and offerings in the Greater Tampa and Central Florida markets ▪ Entered the Fort Myers, FL market, a top 100 MSA, with a new greenfield 1 For a reconciliation of Adjusted SG&A, Adjusted Net Income, Adjusted EBITDA, and Adjusted EBITDA Margin to the most directly com parable GAAP metrics, see Appendix. $16.1 $25.9 $62.6 $61.4 $76.5 $135.1 $0 $50 $100 $150 Net Income Adj. Net Income Adj. EBITDA Net Income, Adj Net Income 1 & Adj EBITDA 1 Q3 FY21 Q3 FY22 Net Sales Gross Profit Net Income $1.15B $367.8M $61.4M 53.6% 51.1% 280.6%
4 Attractive Market Dynamics GMS is well - positioned to benefit from favorable fundamentals that support growth and demand for our products Strong residential market demand Low interest rate environment Favorable demographics support future growth in housing Low levels of existing homes for sale to service demand Continued price inflation Early positive indicators in commercial
5 Strategic Growth Priorities – Q3 FY22 Update Capitalize on existing fixed investments in locations and equipment where we are underpenetrated or below expected share Grow Complementary Product opportunities outside of core products to diversify and profitably expand our product offering Expand the platform through accretive acquisition and greenfield opportunities, balanced with debt reduction priorities Leverage our scale and employ technology and best practices to deliver a best - in - class customer experience and further profit improvement • Mid - single digit volume growth in wallboard • Double digit volume growth in ceilings and steel framing • Organic sales for Wallboard, Ceilings and Steel Framing each up more than 25% • 35.9% growth in net sales of Complementary Products • 17.1% organic sales growth • 7 th straight quarter of growth • Completed most significant acquisition in this space to date: AMES Tools closed on December 1, 2021 • Complementary Products has grown to contribute nearly 30% of our net sales • Invested $350+ million to acquire 5 companies YTD • Completed the acquisition of AMES Tools, the nation’s leading provider of automatic taping and finishing tools and related products to the professional drywall finishing industry • Expanded our presence and offerings in the Greater Tampa/Central Florida markets with the acquisition of Kimco Supply • Opened a new greenfield location in Fort Myers, FL • Robust pipeline of M&A and greenfield opportunities • Driving purchasing efficiencies, enhancing our pricing practices and providing improved transactional efficiency and effectiveness for customers • Supplying our team with tools and enhanced data to make more informed business decisions • Helping to offset operational cost increases Expand Share in Core Products Grow Complementary Products Platform Expansion Drive Improved Productivity & Profitability
6 $243.3 $367.8 $0 $50 $100 $150 $200 $250 $300 Fiscal Q3 2021 Fiscal Q3 2022 Gross Profit Q3 Fiscal 2022 Performance – Net Sales of $1.15 Billion Net Sales & Mix Gross Profit ▪ Gross Profit increased 51.1% ▪ Gross margin was 31.9% ‒ One - time purchase accounting - related adjustments negatively impacted gross margin by 30 basis points ‒ Slight declines in Wallboard and Steel gross margins were partially offset by improved margins in Ceilings and Complementary Products ▪ Net sales up 53.6% due primarily to inflationary pricing, strong residential end markets, solid demand for our products and acquisition revenues. ‒ Volumes up in all 4 product categories ▪ One additional selling day in Q322 vs. Q321; Same day sales up 51.1% ▪ Organic net sales up 41.5% or 39.2% on a same day sales basis Organic Growth Total Volume Price/Mix 1 Wallboard +28.1% +2.0% +26.1% Ceilings +26.8% +5.0% +21.8% Steel +151.0% +5.9% +145.1% Complementary +17.1% $751.2 $1,153.6 Fiscal Q3 2021 Fiscal Q3 2022 +53.6% 41.4% 13.8% 13.8% 31.0% 36.0% 12.1% 24.5% 27.4% WB Ceilings Steel Complementary Products ($ mm) ($ mm) 1 Price/Mix excludes the impact of foreign currency translation. +51.1%
7 $62.6 $135.1 8.3% 11.7% Fiscal Q3 2021 Fiscal Q3 2022 Adj. EBITDA Adj. EBITDA Margin $181.7 $235.6 24.2% 20.4% 18.0% 18.5% 19.0% 19.5% 20.0% 20.5% 21.0% 21.5% 22.0% 22.5% 23.0% 23.5% 24.0% 24.5% 25.0% 25.5% 26.0% 26.5% 27.0% 27.5% 28.0% $0 $50 $100 $150 $200 $250 Fiscal Q3 2021 Fiscal Q3 2022 Adj. SG&A Adj. SG&A % ($ mm) Q3 Fiscal 2022 – Improved Profitability 1 For a reconciliation of Adjusted SG&A, Adjusted Net Income, Adjusted EBITDA and Adjusted EBITDA Margin to the most directly c omp arable GAAP metrics, see Appendix. SG&A and Adjusted SG&A 1 ▪ Reported SG&A was 20.9% of sales compared to 24.6% of sales a year ago, representing a 370 - basis point improvement. ▪ Adjusted SG&A 1 improved 380 - basis points as product inflation outpaced increases in operating costs. Net Income, Adjusted Net Income 1 & Adjusted EBITDA 1 ▪ Reported net income and Adjusted net income 1 totaled $61.4 million and $76.5 million, respectively. ▪ Adjusted EBITDA 1 increased 115.8% and Adjusted EBITDA margin 1 improved 340 basis points year - over - year. Adj. EBITDA 1 Up 115.8% 1 1 1 380 bps improvement 1
8 Attractive Capital Structure Supports Strategic Priorities • Cash provided by Operations was $57.2 million, compared to $44.4 million in Q3 FY21 • Free Cash Flow 1 was $40.2 million, compared to $38.4 million in Q3 FY21 • Increased inventory balances as a result of the Company’s commitment to our customers to ensure product availability and manage price inflation amid an environment of tight and less reliable supply • Substantial liquidity, with $87.0 million of cash on hand and an additional $183.2 million available under our revolving credit facilities as of 1/31/2022 • Attractive capital structure • “Through the Cycle” objective of Free Cash Flow 1 : 40% - 50% of Adjusted EBITDA 1 ‒ Fiscal 2022 Free Cash Flow expected to be below this level due to elevated inventory balances as GMS works to ensure product availability for its customers. Cash From Operations and Free Cash Flow 1 $89.9 2.9 x 2.5 x 2.7 x 2.4 x 2.3 x 1/31/21 4/30/21 7/31/21 10/31/21 1/31/2022 $11 $45 $36 $384 $501 $359 2022 2023 2024 2025 2026 Thereafter LTM Net Debt / PF Adjusted EBITDA 2 Debt 3 Maturity Schedule as of 1/31/2022 $ in millions 1. For a reconciliation of free cash flow to cash provided by (used in) operating activities, the most directly comparable GAAP met ric, see Appendix. 2. For detail, including a reconciliation of Pro Forma Adjusted EBITDA to net income, the most directly comparable GAAP metric, see Appendix. 3. As of the quarter ended January 31, 2022; Debt includes First Lien Term Loan, ABL Facility, Senior Notes, Finance Leases & In sta llment Notes.
9 Expectations 1. For a reconciliation of Adjusted SG&A, Adjusted Net Income, Adjusted EBITDA, Adjusted EBITDA Margin and Free Cash Flow to the mo st directly comparable GAAP metrics, see Appendix. 2. Free Cash Flow for fiscal 2022 is expected to be below the longer - term objective to generate 40% – 50% of Adjusted EBITDA as GMS works to ensure product availability for its customers amid project timing uncertainty and supply chain constraints.. Expectations for Q4 Fiscal 2022 Favorable pricing and continued strength in residential should result in: • Q4 FY22 Expected Year - Over - Year Net Sales Growth: ~35% • Q4 FY22 Expected Year - Over - Year Organic Sales Growth: ~25% Gross Margin will likely continue to be impacted by continued pressure on price - cost dynamics in wallboard and further declines in steel pricing. • Q4 FY22 Expected Gross Margin: In line with Q4 FY21 ~31.5% Incremental Adjusted EBITDA 1 : • Continued cost discipline and favorable operating leverage expected • Q4 FY22 Expected Incremental Adjusted EBITDA 1 : Mid Teens • Fiscal 2022 full year interest expense: ~$57 million • Cash tax rate for Adjusted Net Income 1 for fiscal 2022: 24% – 25% • Fiscal 2022 full year capital expenditures: ~$45 million • Free Cash Flow 1 : Longer - term objective is to generate 40% - 50% of Adjusted EBITDA 2 Full Year and Longer - Term Expectations
10 GMS is Well - Positioned Now and for the Long - Term Industry leader with local expertise and broad North American scale Superior safety track record and logistics execution Breadth of product offerings, with growing Complementary Product opportunities Strong balance sheet , substantial liquidity and expected strong long term cash flow generation to support future growth Differentiated service model with professional sales force delivering best - in - class customer service Successfully executing on strategic priorities to capitalize on long - term growth opportunities Hein – can you please replace this picture with the one of the guy accepting drywall thru the window? Also – I’m not sure if I like the numbers off to the left on this slide. Do you think there’s some sort of icon or something that might look better?
11 Appendix
12 Summary Quarterly Financials (In millions, except per share data) 1Q21 2Q21 3Q21 4Q21 FY21 1Q22 2Q22 3Q22 (Unaudited) Wallboard Volume (MSF) 1,054 1,073 997 1,147 4,270 1,095 1,104 1,054 Wallboard Price ($ / '000 Sq. Ft.) 311$ 308$ 312$ 329$ 311$ 356$ 376$ 394$ Wallboard 328$ 331$ 311$ 377$ 1,330$ 390$ 415$ 415$ Ceilings 114 112 102 121 476 138 141 140 Steel framing 110 111 104 143 502 196 272 283 Complementary products 250 259 234 291 934 318 323 316 Net sales 803 813 751 932 3,299 1,042 1,151 1,154 Cost of sales 542 548 508 638 2,236 706 779 786 Gross profit 260 265 243 294 1,063 336 372 368 Gross margin 32.5% 32.6% 32.4% 31.5% 32.2% 32.2% 32.3% 31.9% Operating expenses: Selling, general and administrative expenses 183 188 185 207 764 214 231 241 Depreciation and amortization 27 27 26 28 108 28 29 30 Total operating expenses 210 216 210 236 872 242 260 271 Operating income (loss) 50 49 33 58 191 94 112 97 Other (expense) income: Interest expense (14) (14) (13) (13) (54) (14) (15) (15) Gain on legal settlement - - 1 - 1 - - - Write-off of discount and deferred financing costs - - - (5) (5) - - - Other income, net 1 1 1 1 3 1 1 1 Total other expense, net (13) (13) (11) (17) (54) (13) (14) (14) Income from continuing operations, before tax 37 37 22 42 137 81 98 83 Income tax expense 10 8 6 8 32 20 24 21 Net income 27$ 28$ 16$ 34$ 106$ 61$ 74$ 61$ Business Days 64 64 61 65 254 63 64 62 Net Sales by Business Day 12.5$ 12.7$ 12.3$ 14.3$ 13.0$ 16.5$ 18.0$ 18.6$ Beginning Branch Count 263 260 261 262 263 268 283 285 Added Branches (3) 1 1 6 5 15 2 1 Ending Branch Count 260 261 262 268 268 283 285 286
13 Quarterly Cash Flows (1) Free cash flow is a non - GAAP financial measure defined as net cash provided by (used in) operations less capital expenditures. D ifferences may occur due to rounding. ($ in millions) (Unaudited) 1Q21 2Q21 3Q21 3Q21 FY21 1Q22 2Q22 3Q22 Net income $ 27.2 $ 28.5 $ 16.1 $ 33.7 $ 105.5 $ 61.2 $ 74.4 $ 61.4 Non-cash changes & other changes (0.1) 46.4 31.5 52.8 130.6 28.8 57.8 43.9 Changes in primary working capital components: Trade accounts and notes receivable (41.5) (15.6) 41.7 (86.2) (101.6) (73.5) (73.9) 37.4 Inventories 14.0 (15.0) (23.4) (22.3) (46.7) (87.3) (81.2) (22.6) Accounts payable (15.4) (4.5) (21.5) 106.8 65.4 (4.3) 20.9 (62.9) Cash provided by (used in) operating activities (15.7) 39.8 44.4 84.8 153.3 (75.1) (2.0) 57.2 Purchases of property and equipment (4.7) (7.1) (6.0) (12.0) (29.9) (6.8) (9.3) (17.0) Proceeds from sale of assets 0.3 0.4 0.5 1.0 2.3 0.3 0.2 0.7 Acquisitions of businesses, net of cash acquired (0.2) 0.2 - (35.9) (36.0) (123.0) (1.9) (220.4) Cash (used in) investing activities (4.6) (6.6) (5.5) (46.9) (63.6) (129.6) (11.1) (236.8) Cash provided by (used in) financing activities (51.8) (55.1) (7.8) (22.0) (136.6) 81.4 28.7 207.8 Effect of exchange rates 0.9 0.3 1.2 0.5 3.0 (0.2) 0.1 (0.5) Increase (decrease) in cash and cash equivalents (71.2) (21.5) 32.4 16.4 (43.9) (123.4) 15.7 27.7 Balance, beginning of period 210.9 139.7 118.2 150.6 210.9 167.0 43.6 59.3 Balance, end of period $ 139.7 $ 118.2 $ 150.6 $ 167.0 $ 167.0 $ 43.6 $ 59.3 $ 87.0 Supplemental cash flow disclosures: Cash paid for income taxes $ 3.5 $ 16.7 $ 11.7 $ 14.5 $ 46.4 $ 1.0 $ 36.8 $ 23.3 Cash paid for interest $ 13.1 $ 12.6 $ 12.4 $ 11.5 $ 49.7 $ 8.6 $ 9.0 $ 18.1 Cash provided by (used in) operating activities $ (15.7) $ 39.8 $ 44.4 $ 84.8 $ 153.3 $ (75.1) $ (2.0) $ 57.2 Purchases of property and equipment (4.7) (7.1) (6.0) (12.0) (29.9) (6.8) (9.3) (17.0) Free cash flow (1) (20.5) 32.7 38.4 72.8 123.4 (81.9) (11.3) 40.2
14 Q3 2022 Net Sales 1. Organic net sales growth calculation excludes net sales of acquired businesses until first anniversary of acquisition date an d i mpact of foreign currency translation. ($ in millions) (Unaudited) FY22 FY21 Reported Organic (1) Organic (1) 1,063.0$ 751.2$ Acquisitions 87.7 - Fx Impact 2.9 - Total Net Sales 1,153.6$ 751.2$ 53.6% 41.5% Wallboard 415.1$ 311.1$ 33.4% 28.1% Ceilings 139.9 103.7 34.9% 26.8% Steel Framing 282.8 104.0 172.0% 151.0% Other Products 315.8 232.4 35.9% 17.1% Total Net Sales 1,153.6$ 751.2$ 53.6% 41.5% Fiscal Q3 Variance
15 Quarterly Net Income to Adjusted EBITDA Reconciliation Commentary A. Represents changes in the fair value of stock appreciation rights B. Represents changes in the fair value of noncontrolling interests C. Represents non - cash equity - based compensation expense related to the issuance of share - based awards D. Represents severance expenses and other costs permitted in calculations under the ABL Facility and the Term Loan Facility, including certain unusual, nonrecurring costs and credits received due to the COVID - 19 pandemic. E. Represents one - time costs related to acquisitions paid to third parties F. Includes impairment of assets resulting from restructuring plans to close certain facilities and gains from the sale of assets. G. Represents the non - cash cost of sales impact of purchase accounting adjustments to increase inventory to its estimated fair value H. Represents expenses paid to third party advisors related to debt refinancing activities ( $ in 000s) 1Q21 2Q21 3Q21 4Q21 FY21 1Q22 2Q22 3Q22 (Unaudited) Net Income 27,219$ 28,469$ 16,126$ 33,746$ 105,560$ 61,202$ 74,361$ 61,383$ Add: Interest Expense 14,081 13,525 13,454 12,726 53,786 13,657 14,744 15,429 Add: Write off of debt discount and deferred financing fees - - - 4,606 4,606 - - Less: Interest Income (37) (14) (6) (29) (86) - (27) (40) Add: Income Tax Expense 9,604 8,277 5,709 7,944 31,534 19,971 23,769 21,211 Add: Depreciation Expense 12,827 12,710 11,371 13,572 50,480 12,925 13,703 13,816 Add: Amortization Expense 14,270 14,535 14,191 14,649 57,645 14,789 15,700 15,934 EBITDA 77,964$ 77,502$ 60,845$ 87,214$ 303,525$ 122,544$ 142,250$ 127,733$ Adjustments Stock appreciation rights (A) 792 314 1,446 621 3,173 892 983 1,251 Redeemable noncontrolling interests (B) 252 186 624 226 1,288 310 593 182 Equity-based compensation (C) 1,605 3,252 1,877 1,708 8,442 1,958 3,215 3,077 Severance and other permitted costs (D) 1,947 762 (83) 322 2,948 147 249 273 Transaction costs (acquisition and other) (E) 100 25 664 279 1,068 575 2,393 921 (Gain) loss on disposal of assets (F) 394 481 (1,404) (482) (1,011) (78) (144) (252) Effects of fair value adjustments to inventory (G) - - - 788 788 1,731 - 1,870 Gain on legal settlement - - (1,382) - (1,382) - - - Debt transaction costs (H) - - - 532 532 - - - Total Add-Backs 5,090$ 5,020$ 1,742$ 3,994$ 15,846$ 5,535$ 7,289$ 7,322$ Adjusted EBITDA (as reported) 83,054$ 82,522$ 62,587$ 91,208$ 319,371$ 128,079$ 149,539$ 135,055$ Net Sales $802,573 $812,856 $751,191 $932,203 $3,298,823 $1,042,076 $1,150,551 $1,153,595 Adjusted EBITDA Margin 10.3% 10.2% 8.3% 9.8% 9.7% 12.3% 13.0% 11.7%
16 Net Income to Pro Forma Adjusted EBITDA Reconciliation Commentary A. Represents changes in the fair value of stock appreciation rights B. Represents changes in the fair value of noncontrolling interests C. Represents non - cash equity - based compensation expense related to the issuance of share - based awards D. Represents severance expenses and other costs permitted in calculations under the ABL Facility and the Term Loan Facility, including certain unusual, nonrecurring costs and credits received due to the COVID - 19 pandemic. E. Represents one - time costs related to our initial public offering and acquisitions paid to third party advisors as well as costs related to the retirement of corporate stock appreciation rights F. Represents management fees paid to AEA, which were discontinued after the IPO G. Represents the non - cash cost of sales impact of purchase accounting adjustments to increase inventory to its estimated fair value H. Represents mark - to - market adjustments for derivative financial instruments I. Represents one - time costs related to our secondary offerings paid to third party advisors J. Represents expenses paid to third party advisors related to debt refinancing activities K. Pro forma impact of earnings from acquisitions from the beginning of the LTM period to the date of acquisition, including synergies ( $ in 000s) LTM Q3 FY22 2021 2020 2019 2018 2017 (Unaudited) Net Income 230,692$ 105,560$ 23,381$ 56,002$ 62,971$ 48,886$ Add: Interest Expense 56,556 53,786 67,718 73,677 31,395 29,360 Add: Write off of debt discount and deferred financing fees 4,606 4,606 1,331 - 74 7,103 Less: Interest Income (96) (86) (88) (66) (177) (152) Add: Income Tax Expense 72,895 31,534 22,944 14,039 20,883 22,654 Add: Depreciation Expense 54,016 50,480 51,332 46,456 24,075 25,565 Add: Amortization Expense 61,072 57,645 65,201 71,003 41,455 43,675 EBITDA 479,741$ 303,525$ 231,819$ 261,111$ 180,676$ 177,091$ Adjustments Impairment of goodwill - - 63,074 - - - Stock appreciation rights (A) 3,747 3,173 1,572 2,730 2,318 148 Redeemable noncontrolling interests (B) 1,311 1,288 520 1,188 1,868 3,536 Equity-based compensation (C) 9,958 8,442 7,060 3,906 1,695 2,534 Severance and other permitted costs (D) 991 2,948 5,733 8,152 581 (157) Transaction costs (acquisition and other) (E) 4,168 1,068 2,414 7,858 3,370 2,249 (Gain) loss on disposal of assets (956) (1,011) 658 (525) (509) (338) AEA management fee (F) - - - - - 188 Effects of fair value adjustments to inventory (G) 4,389 788 575 4,176 324 946 Gain on legal settlement - (1,382) (14,029) - - - Change in fair value of financial instruments (H) - - - 6,395 6,125 382 Secondary public offerings (I) - - 363 - 1,525 1,385 Debt transaction costs (J) 532 532 - 678 1,285 265 Total Add-Backs 24,140$ 15,846$ 67,940$ 34,558$ 18,582$ 11,138$ Adjusted EBITDA (as reported) 503,881$ 319,371$ 299,759$ 295,669$ 199,258$ 188,229$ Contributions from acquisitions (K) 30,073 4,948 1,480 6,717 1,280 9,500 Pro Forma Adjusted EBITDA 533,954$ 324,319$ 301,239$ 302,386$ 200,538$ 197,729$
17 Income Before Taxes to Adjusted Net Income Reconciliation Commentary A. Depreciation and amortization from the increase in value of certain long - term assets associated with the April 1, 2014 acquisition of the predecessor company and amortization of intangible assets from the acquisitions of Titan, Westside Building Materials, and AMES Taping Tools B. Normalized cash tax rate determined based on our estimated taxes excluding the impact of purchase accounting and certain other deferred tax amounts. ($ in 000s) 3Q22 3Q21 (Unaudited) Income before taxes 82,594$ 21,835$ EBITDA add-backs 7,322 1,742 Purchase accounting depreciation and amortization (A) 11,424 9,798 Adjusted pre-tax income 101,340 33,375 Adjusted income tax expense 24,828 7,510 Adjusted net income 76,512$ 25,865$ Effective tax rate (B) 24.5% 22.5% Weighted average shares outstanding: Basic 43,094 42,726 Diluted 43,945 43,361 Adjusted net income per share: Basic 1.78$ 0.61$ Diluted 1.74$ 0.60$
18 Reported SG&A to Adjusted SG&A Reconciliation Commentary A. Represents changes in the fair value of stock appreciation rights B. Represents changes in the fair value of noncontrolling interests C. Represents non - cash equity - based compensation expense related to the issuance of share - based awards D. Represents severance expenses and other costs permitted in calculations under the ABL Facility and the Term Loan Facility, including certain unusual, nonrecurring costs and credits received due to the COVID - 19 pandemic. E. Represents one - time costs related to acquisitions paid to third parties. (Unaudited) 1Q21 2Q21 3Q21 4Q21 FY2021 1Q22 2Q22 3Q22 ($ in millions) SG&A - Reported 183.1$ 188.4$ 184.8$ 207.3$ 763.6$ 214.1$ 230.5$ 241.0$ Adjustments Stock appreciation rights (A) (0.8) (0.3) (1.4) (0.6) (3.2) (0.9) (1.0) (1.3) Redeemable noncontrolling interests (B) (0.3) (0.2) (0.6) (0.2) (1.3) (0.3) (0.6) (0.2) Equity-based compensation (C) (1.6) (3.3) (1.9) (1.7) (8.4) (2.0) (3.2) (3.1) Severance and other permitted costs (D) (1.9) (0.8) 0.1 (0.3) (2.9) (0.2) (0.3) (0.3) Transaction costs (acquisition and other) (E) (0.1) (0.0) (0.7) (0.3) (1.1) (0.6) (2.4) (0.9) Gain on disposal of assets (0.4) (0.5) 1.4 0.5 1.0 0.1 0.1 0.3 Debt transaction costs - - - (0.5) (0.5) - - - SG&A - Adjusted 178.1$ 183.3$ 181.7$ 204.2$ 747.3$ 210.3$ 223.2$ 235.6$ % of net sales 22.2% 22.5% 24.2% 21.9% 22.7% 20.2% 19.4% 20.4%
19 Leverage Summary (1) Net of unamortized discount of $1.4 mm, $0.6 mm, $0.6 mm , $0.5 mm and $0.5mm as of January 31,2021, April 30,2021, July 31, 2021, October 31, 2021, and January 31, 2022 respectively. (2) Net of deferred financing costs of $7.6 mm, $4.1 mm, $3.9 mm, $3.6 mm and $3.4mm as of January 31,2021, April 30,2021, July 31, 2021, October 31, 2021, and January 31, 2022 respectively. (3) Net of deferred financing costs of $5.3 mm, $5.2 mm, and $5.0 mm as of July 31, 2021, October 31, 2021, and January 31, 2022 res pectively. (4) Net of unamortized discount of $0.8 mm, $0.7 mm, $0.7 mm, $0. 6 mm. and $0.5 mm as of January 31,2021, April 30,2021, July 31, 2021, October 31, 2021, and January 31, 2022 respectively. (5) For a reconciliation Pro Forma Adjusted EBITDA to net income, the most directly comparable GAAP metric, see Appendix. ($ mm) 1/31/21 4/30/21 7/31/21 10/31/21 1/31/22 LTM LTM LTM LTM LTM Cash and cash equivalents $151 $167 $44 $59 $87 Revolving Credit Facilities $0 $0 $92 $141 $359 First Lien Term Loan (1)(2) 860 505 504 503 502 Senior Notes (3) - 345 345 345 345 Capital Lease Obligations 122 118 113 112 113 Installment Notes & Other (4) 12 10 9 8 7 Total Debt $994 $978 $1,063 $1,108 $1,326 Total Net Debt $844 $811 $1,019 $1,049 $1,239 PF Adj. EBITDA (5) $292 $324 $380 $442 $534 Total Debt / PF Adj. EBITDA 3.4x 3.0x 2.8x 2.5x 2.5x Net Debt / PF Adj. EBITDA 2.9x 2.5x 2.7x 2.4x 2.3x
20 Acquisition: On 12/1/21, GMS acquired AMES Taping Tools Holding LLC (“AMES”) for a preliminary purchase price of $212.5 million in cash. GMS Completes Acquisition of AMES Taping Tools Geographic Footprint Company & Acquisition Overview Business Profile: AMES is the nation’s foremost provider of automatic taping and finishing (“ATF”) tools and related products to the professional drywall finishing industry. AMES services customers through its multichannel distribution model including: 1. AMES Stores – supplies and services residential and commercial interior finishing applications through a network of more than 90 store locations that sell drywall finishing products and provide drywall contractors with the option to purchase or rent ATF tools from a 100,000 - tool fleet shared by AMES stores platform - wide. 2. Dealer Distribution – sales of market - leading TapeTech ® Automatic Taping and Finishing Tools and related TapeTech ® branded products through dealers and distributors, including an existing relationship with GMS. 3. All - Wall® eCommerce Platform – leading E - Commerce retailer of specialty interior finishing tools and related products. Strategic Rationale: AMES provides a distinctive complement to GMS’s current offerings, significantly expanding the Company’s presence in the attractive tools and fasteners market. AMES’s portfolio includes the industry - leading finishing tool brand, TapeTech ®, and the top specialty interior finishing E - Commerce platform, All - Wall®. Operating Model: AMES’s existing management team, including President & CEO Jay Davisson, continues to lead the business. The business will continue to operate under the “AMES” brand – as it has for over 80 years AMES Stores
U38.X]:R!MFD,A('8U$"7!.020< 5-NA2$ASL!D5#&W-Q*\
MBMG/\/I1BA785+MD.8V*''K2H[RYFD#M,2!L5-!2U HTL-2M]I>I] 'A,1PP!)_B!V8
M>Q[TI5 Z;_:O*/A=X_:MP$B:?K(DUW0/IQ( G:GYFN<.DCFB E%
M)]-M5AO[&RU1U&//;FB 3<[$TV
MP*-'!/M6U/;%:(*L, TL M$V'>D#)ZD4H#/I4(;-,[X\T#KUR"#3T@^
MU-+EE"Q^D;F('VK7ED4Z";5G+0L/2-2A K"M..4C
E5RY2+(TH,\GPX\M3V'2@6"&?5%0]&E0
M?_C"G**H4#.,= *SAZ)I-;AQ@@W,8W^]7X]Y(S2V1[512MM;)CZ847^E;"9-
M*92I48_@'^%:"D@>E?8DJV/ES=NS:G.WI1 /;:L"["M@4P!07)I8&!6(,"E*
MN6H4%&*,TKJ:VJY'6E!.PVH$->U+"#'YUL)M2P,&F(-]2TNRUS3KO2=2A%QI
MUY&8I4(Z9[CT(]:\O:UPIJU_X@Z9P+J-Q*M_I"N-*U(?5)%]48SWQTKU3R$^
MOVKE7C;?1<+<:>'W%!51-#=_AYI"-C&=L'[5Q_:6%3QK)=4TG\5:_3E'1T&5
MQR='-W7P=/\ 7N>5]>O[V_XFO)-0')?^84G7U<;$_P!*8SQ- K2GFV.0S>E=
M1^)+A.'A_P 3M2O++E_!7X6Y3E[%MR:H'$4\<\5C(A#(T>&Y>@(]:\)GA+%G
MG";MIL]A@FLF&$H\-)G>?AL\)=3$MCQQ>3PQZ3RLMO$GS,['U':O0FKZ58<2
M:=+I^KV4>HV$V>:"89*>ZMVKR_\ "UJE_?\ ',=@VMO;Z?;PL\>G,?DF.-P!
M7JP@$L>4J,DX/;VKVWLJ.*6D2A'9\WW?<\K[3EE6IN3W[5V_J>9O$GX8;_1"
MVJ\&R2:E9)EVL'.+B'_5/<52N%/%:^T&=K/5XY)(U/)*67EEB]F%>ST8JX="
MRL.A!WJF>(?@SPYXF(9KN(:9K"K\FIVRX.?[Z]Q6+5>R*;R:39^G;Z&O3>U+
M\FI^_P"Z.07G#.C\>VBZAI%Q%;7C#:2(_(_LP[&N=:WH][H=T;>_MS;R]GQ\
MDGV-.^*O#_C'P3U,7$L;FR+?)?VP+6\@_O#L:N'#/B9H_&-DNF<0P1AG& 7^
MDGV;M7E,F).34ETS78]'CR2C%23ZHON-]'O/C^_AR6X(*
;)W_BSM74.#O&G3>)+5=+XFAC#2CD6X*_NY3[C
ML:5Q5X,,T;:CPU(MS;L.8VCMD?\ 1-<.6':\>Z.O#+;Z9[,Y[::D44++\Z8Z
M_P"^LN](2X3SK1E5CN1VIG-%);W+PRQO;W"'YX91@@^E$AF>V8,I*D]5[&J$
MW%W%FAI25,8NK1,4=3')T*^M8N
O>DG
MI16P#0RX)QWH !LM#(Z@T9AOFAL,_>@% \>]92L^U92!/#5V0UTH!P![4J7]
MY>(%ZA=J
E'>1CCJU
M; KZ\^3Y@N$8@VI?Y5I5HBBH2C /84M!6Q2@M1[!1L=.E*4>O>L I2[]:A#:
M[ 42%>=F3^9&&?RI(^;RH9Y"0.2)F_H:FW<5[H\)ZMIHL]:UZVE(;ENY,
M$=]ZD>"=9M.'M)L]6M;^XM.(K+48WEM.8K'/;D[Y'7^8GO44;H2PHSIAQW(KY-#.\4WDCWOZ;GU+/B4HQQR[5]3JOQ)P6Y\5(M99
MDO\ 3=0LXIHTMW!YRN+BYM8BLUO+(4!NE]2"Q)7HPR.N*YG-K
MNHW%E
<4J,&DL.AHHZ42(2<@TH#/WK
M.E*48[5!@3*3S =Q5*XEE*7DD9W1@"0:O1V7.*I/%41&HHQZ,M68O?13E]QT
M08
?J/J3OA>I/H 2#^$7A)J_C!Q5'I.G+Y5NF)+R]=
87GYNXK2,[3%S]0_PKY@>Z%*I:Y.>HK48+"9B>GK2(^=VE