0001597934
false
N-CSR
abrdn ETFs
N-1A
2024-12-31
0001597934
aberdeen:C000176936Member
2024-01-01
2024-12-31
0001597934
2024-01-01
2024-12-31
0001597934
aberdeen:AberdeenIndexSP500Index14793BroadBasedIndexMember
2024-01-01
2024-12-31
0001597934
aberdeen:AberdeenIndexBCOM14793AdditionalIndexMember
2024-01-01
2024-12-31
0001597934
aberdeen:ABERDEENINDEXBloombergCommodityIndex3MonthForwardTotalReturn14793AdditionalIndexMember
2024-01-01
2024-12-31
0001597934
aberdeen:C000176936Member
2017-03-30
0001597934
aberdeen:AberdeenIndexSP500Index14793BroadBasedIndexMember
2017-03-30
0001597934
aberdeen:AberdeenIndexBCOM14793AdditionalIndexMember
2017-03-30
0001597934
aberdeen:ABERDEENINDEXBloombergCommodityIndex3MonthForwardTotalReturn14793AdditionalIndexMember
2017-03-30
0001597934
aberdeen:C000176936Member
2017-03-31
0001597934
aberdeen:AberdeenIndexSP500Index14793BroadBasedIndexMember
2017-03-31
0001597934
aberdeen:AberdeenIndexBCOM14793AdditionalIndexMember
2017-03-31
0001597934
aberdeen:ABERDEENINDEXBloombergCommodityIndex3MonthForwardTotalReturn14793AdditionalIndexMember
2017-03-31
0001597934
aberdeen:C000176936Member
2017-04-30
0001597934
aberdeen:AberdeenIndexSP500Index14793BroadBasedIndexMember
2017-04-30
0001597934
aberdeen:AberdeenIndexBCOM14793AdditionalIndexMember
2017-04-30
0001597934
aberdeen:ABERDEENINDEXBloombergCommodityIndex3MonthForwardTotalReturn14793AdditionalIndexMember
2017-04-30
0001597934
aberdeen:C000176936Member
2017-05-31
0001597934
aberdeen:AberdeenIndexSP500Index14793BroadBasedIndexMember
2017-05-31
0001597934
aberdeen:AberdeenIndexBCOM14793AdditionalIndexMember
2017-05-31
0001597934
aberdeen:ABERDEENINDEXBloombergCommodityIndex3MonthForwardTotalReturn14793AdditionalIndexMember
2017-05-31
0001597934
aberdeen:C000176936Member
2017-06-30
0001597934
aberdeen:AberdeenIndexSP500Index14793BroadBasedIndexMember
2017-06-30
0001597934
aberdeen:AberdeenIndexBCOM14793AdditionalIndexMember
2017-06-30
0001597934
aberdeen:ABERDEENINDEXBloombergCommodityIndex3MonthForwardTotalReturn14793AdditionalIndexMember
2017-06-30
0001597934
aberdeen:C000176936Member
2017-07-31
0001597934
aberdeen:AberdeenIndexSP500Index14793BroadBasedIndexMember
2017-07-31
0001597934
aberdeen:AberdeenIndexBCOM14793AdditionalIndexMember
2017-07-31
0001597934
aberdeen:ABERDEENINDEXBloombergCommodityIndex3MonthForwardTotalReturn14793AdditionalIndexMember
2017-07-31
0001597934
aberdeen:C000176936Member
2017-08-31
0001597934
aberdeen:AberdeenIndexSP500Index14793BroadBasedIndexMember
2017-08-31
0001597934
aberdeen:AberdeenIndexBCOM14793AdditionalIndexMember
2017-08-31
0001597934
aberdeen:ABERDEENINDEXBloombergCommodityIndex3MonthForwardTotalReturn14793AdditionalIndexMember
2017-08-31
0001597934
aberdeen:C000176936Member
2017-09-30
0001597934
aberdeen:AberdeenIndexSP500Index14793BroadBasedIndexMember
2017-09-30
0001597934
aberdeen:AberdeenIndexBCOM14793AdditionalIndexMember
2017-09-30
0001597934
aberdeen:ABERDEENINDEXBloombergCommodityIndex3MonthForwardTotalReturn14793AdditionalIndexMember
2017-09-30
0001597934
aberdeen:C000176936Member
2017-10-31
0001597934
aberdeen:AberdeenIndexSP500Index14793BroadBasedIndexMember
2017-10-31
0001597934
aberdeen:AberdeenIndexBCOM14793AdditionalIndexMember
2017-10-31
0001597934
aberdeen:ABERDEENINDEXBloombergCommodityIndex3MonthForwardTotalReturn14793AdditionalIndexMember
2017-10-31
0001597934
aberdeen:C000176936Member
2017-11-30
0001597934
aberdeen:AberdeenIndexSP500Index14793BroadBasedIndexMember
2017-11-30
0001597934
aberdeen:AberdeenIndexBCOM14793AdditionalIndexMember
2017-11-30
0001597934
aberdeen:ABERDEENINDEXBloombergCommodityIndex3MonthForwardTotalReturn14793AdditionalIndexMember
2017-11-30
0001597934
aberdeen:C000176936Member
2017-12-31
0001597934
aberdeen:AberdeenIndexSP500Index14793BroadBasedIndexMember
2017-12-31
0001597934
aberdeen:AberdeenIndexBCOM14793AdditionalIndexMember
2017-12-31
0001597934
aberdeen:ABERDEENINDEXBloombergCommodityIndex3MonthForwardTotalReturn14793AdditionalIndexMember
2017-12-31
0001597934
aberdeen:C000176936Member
2018-01-31
0001597934
aberdeen:AberdeenIndexSP500Index14793BroadBasedIndexMember
2018-01-31
0001597934
aberdeen:AberdeenIndexBCOM14793AdditionalIndexMember
2018-01-31
0001597934
aberdeen:ABERDEENINDEXBloombergCommodityIndex3MonthForwardTotalReturn14793AdditionalIndexMember
2018-01-31
0001597934
aberdeen:C000176936Member
2018-02-28
0001597934
aberdeen:AberdeenIndexSP500Index14793BroadBasedIndexMember
2018-02-28
0001597934
aberdeen:AberdeenIndexBCOM14793AdditionalIndexMember
2018-02-28
0001597934
aberdeen:ABERDEENINDEXBloombergCommodityIndex3MonthForwardTotalReturn14793AdditionalIndexMember
2018-02-28
0001597934
aberdeen:C000176936Member
2018-03-31
0001597934
aberdeen:AberdeenIndexSP500Index14793BroadBasedIndexMember
2018-03-31
0001597934
aberdeen:AberdeenIndexBCOM14793AdditionalIndexMember
2018-03-31
0001597934
aberdeen:ABERDEENINDEXBloombergCommodityIndex3MonthForwardTotalReturn14793AdditionalIndexMember
2018-03-31
0001597934
aberdeen:C000176936Member
2018-04-30
0001597934
aberdeen:AberdeenIndexSP500Index14793BroadBasedIndexMember
2018-04-30
0001597934
aberdeen:AberdeenIndexBCOM14793AdditionalIndexMember
2018-04-30
0001597934
aberdeen:ABERDEENINDEXBloombergCommodityIndex3MonthForwardTotalReturn14793AdditionalIndexMember
2018-04-30
0001597934
aberdeen:C000176936Member
2018-05-31
0001597934
aberdeen:AberdeenIndexSP500Index14793BroadBasedIndexMember
2018-05-31
0001597934
aberdeen:AberdeenIndexBCOM14793AdditionalIndexMember
2018-05-31
0001597934
aberdeen:ABERDEENINDEXBloombergCommodityIndex3MonthForwardTotalReturn14793AdditionalIndexMember
2018-05-31
0001597934
aberdeen:C000176936Member
2018-06-30
0001597934
aberdeen:AberdeenIndexSP500Index14793BroadBasedIndexMember
2018-06-30
0001597934
aberdeen:AberdeenIndexBCOM14793AdditionalIndexMember
2018-06-30
0001597934
aberdeen:ABERDEENINDEXBloombergCommodityIndex3MonthForwardTotalReturn14793AdditionalIndexMember
2018-06-30
0001597934
aberdeen:C000176936Member
2018-07-31
0001597934
aberdeen:AberdeenIndexSP500Index14793BroadBasedIndexMember
2018-07-31
0001597934
aberdeen:AberdeenIndexBCOM14793AdditionalIndexMember
2018-07-31
0001597934
aberdeen:ABERDEENINDEXBloombergCommodityIndex3MonthForwardTotalReturn14793AdditionalIndexMember
2018-07-31
0001597934
aberdeen:C000176936Member
2018-08-31
0001597934
aberdeen:AberdeenIndexSP500Index14793BroadBasedIndexMember
2018-08-31
0001597934
aberdeen:AberdeenIndexBCOM14793AdditionalIndexMember
2018-08-31
0001597934
aberdeen:ABERDEENINDEXBloombergCommodityIndex3MonthForwardTotalReturn14793AdditionalIndexMember
2018-08-31
0001597934
aberdeen:C000176936Member
2018-09-30
0001597934
aberdeen:AberdeenIndexSP500Index14793BroadBasedIndexMember
2018-09-30
0001597934
aberdeen:AberdeenIndexBCOM14793AdditionalIndexMember
2018-09-30
0001597934
aberdeen:ABERDEENINDEXBloombergCommodityIndex3MonthForwardTotalReturn14793AdditionalIndexMember
2018-09-30
0001597934
aberdeen:C000176936Member
2018-10-31
0001597934
aberdeen:AberdeenIndexSP500Index14793BroadBasedIndexMember
2018-10-31
0001597934
aberdeen:AberdeenIndexBCOM14793AdditionalIndexMember
2018-10-31
0001597934
aberdeen:ABERDEENINDEXBloombergCommodityIndex3MonthForwardTotalReturn14793AdditionalIndexMember
2018-10-31
0001597934
aberdeen:C000176936Member
2018-11-30
0001597934
aberdeen:AberdeenIndexSP500Index14793BroadBasedIndexMember
2018-11-30
0001597934
aberdeen:AberdeenIndexBCOM14793AdditionalIndexMember
2018-11-30
0001597934
aberdeen:ABERDEENINDEXBloombergCommodityIndex3MonthForwardTotalReturn14793AdditionalIndexMember
2018-11-30
0001597934
aberdeen:C000176936Member
2018-12-31
0001597934
aberdeen:AberdeenIndexSP500Index14793BroadBasedIndexMember
2018-12-31
0001597934
aberdeen:AberdeenIndexBCOM14793AdditionalIndexMember
2018-12-31
0001597934
aberdeen:ABERDEENINDEXBloombergCommodityIndex3MonthForwardTotalReturn14793AdditionalIndexMember
2018-12-31
0001597934
aberdeen:C000176936Member
2019-01-31
0001597934
aberdeen:AberdeenIndexSP500Index14793BroadBasedIndexMember
2019-01-31
0001597934
aberdeen:AberdeenIndexBCOM14793AdditionalIndexMember
2019-01-31
0001597934
aberdeen:ABERDEENINDEXBloombergCommodityIndex3MonthForwardTotalReturn14793AdditionalIndexMember
2019-01-31
0001597934
aberdeen:C000176936Member
2019-02-28
0001597934
aberdeen:AberdeenIndexSP500Index14793BroadBasedIndexMember
2019-02-28
0001597934
aberdeen:AberdeenIndexBCOM14793AdditionalIndexMember
2019-02-28
0001597934
aberdeen:ABERDEENINDEXBloombergCommodityIndex3MonthForwardTotalReturn14793AdditionalIndexMember
2019-02-28
0001597934
aberdeen:C000176936Member
2019-03-31
0001597934
aberdeen:AberdeenIndexSP500Index14793BroadBasedIndexMember
2019-03-31
0001597934
aberdeen:AberdeenIndexBCOM14793AdditionalIndexMember
2019-03-31
0001597934
aberdeen:ABERDEENINDEXBloombergCommodityIndex3MonthForwardTotalReturn14793AdditionalIndexMember
2019-03-31
0001597934
aberdeen:C000176936Member
2019-04-30
0001597934
aberdeen:AberdeenIndexSP500Index14793BroadBasedIndexMember
2019-04-30
0001597934
aberdeen:AberdeenIndexBCOM14793AdditionalIndexMember
2019-04-30
0001597934
aberdeen:ABERDEENINDEXBloombergCommodityIndex3MonthForwardTotalReturn14793AdditionalIndexMember
2019-04-30
0001597934
aberdeen:C000176936Member
2019-05-31
0001597934
aberdeen:AberdeenIndexSP500Index14793BroadBasedIndexMember
2019-05-31
0001597934
aberdeen:AberdeenIndexBCOM14793AdditionalIndexMember
2019-05-31
0001597934
aberdeen:ABERDEENINDEXBloombergCommodityIndex3MonthForwardTotalReturn14793AdditionalIndexMember
2019-05-31
0001597934
aberdeen:C000176936Member
2019-06-30
0001597934
aberdeen:AberdeenIndexSP500Index14793BroadBasedIndexMember
2019-06-30
0001597934
aberdeen:AberdeenIndexBCOM14793AdditionalIndexMember
2019-06-30
0001597934
aberdeen:ABERDEENINDEXBloombergCommodityIndex3MonthForwardTotalReturn14793AdditionalIndexMember
2019-06-30
0001597934
aberdeen:C000176936Member
2019-07-31
0001597934
aberdeen:AberdeenIndexSP500Index14793BroadBasedIndexMember
2019-07-31
0001597934
aberdeen:AberdeenIndexBCOM14793AdditionalIndexMember
2019-07-31
0001597934
aberdeen:ABERDEENINDEXBloombergCommodityIndex3MonthForwardTotalReturn14793AdditionalIndexMember
2019-07-31
0001597934
aberdeen:C000176936Member
2019-08-31
0001597934
aberdeen:AberdeenIndexSP500Index14793BroadBasedIndexMember
2019-08-31
0001597934
aberdeen:AberdeenIndexBCOM14793AdditionalIndexMember
2019-08-31
0001597934
aberdeen:ABERDEENINDEXBloombergCommodityIndex3MonthForwardTotalReturn14793AdditionalIndexMember
2019-08-31
0001597934
aberdeen:C000176936Member
2019-09-30
0001597934
aberdeen:AberdeenIndexSP500Index14793BroadBasedIndexMember
2019-09-30
0001597934
aberdeen:AberdeenIndexBCOM14793AdditionalIndexMember
2019-09-30
0001597934
aberdeen:ABERDEENINDEXBloombergCommodityIndex3MonthForwardTotalReturn14793AdditionalIndexMember
2019-09-30
0001597934
aberdeen:C000176936Member
2019-10-31
0001597934
aberdeen:AberdeenIndexSP500Index14793BroadBasedIndexMember
2019-10-31
0001597934
aberdeen:AberdeenIndexBCOM14793AdditionalIndexMember
2019-10-31
0001597934
aberdeen:ABERDEENINDEXBloombergCommodityIndex3MonthForwardTotalReturn14793AdditionalIndexMember
2019-10-31
0001597934
aberdeen:C000176936Member
2019-11-30
0001597934
aberdeen:AberdeenIndexSP500Index14793BroadBasedIndexMember
2019-11-30
0001597934
aberdeen:AberdeenIndexBCOM14793AdditionalIndexMember
2019-11-30
0001597934
aberdeen:ABERDEENINDEXBloombergCommodityIndex3MonthForwardTotalReturn14793AdditionalIndexMember
2019-11-30
0001597934
aberdeen:C000176936Member
2019-12-31
0001597934
aberdeen:AberdeenIndexSP500Index14793BroadBasedIndexMember
2019-12-31
0001597934
aberdeen:AberdeenIndexBCOM14793AdditionalIndexMember
2019-12-31
0001597934
aberdeen:ABERDEENINDEXBloombergCommodityIndex3MonthForwardTotalReturn14793AdditionalIndexMember
2019-12-31
0001597934
aberdeen:C000176936Member
2020-01-31
0001597934
aberdeen:AberdeenIndexSP500Index14793BroadBasedIndexMember
2020-01-31
0001597934
aberdeen:AberdeenIndexBCOM14793AdditionalIndexMember
2020-01-31
0001597934
aberdeen:ABERDEENINDEXBloombergCommodityIndex3MonthForwardTotalReturn14793AdditionalIndexMember
2020-01-31
0001597934
aberdeen:C000176936Member
2020-02-29
0001597934
aberdeen:AberdeenIndexSP500Index14793BroadBasedIndexMember
2020-02-29
0001597934
aberdeen:AberdeenIndexBCOM14793AdditionalIndexMember
2020-02-29
0001597934
aberdeen:ABERDEENINDEXBloombergCommodityIndex3MonthForwardTotalReturn14793AdditionalIndexMember
2020-02-29
0001597934
aberdeen:C000176936Member
2020-03-31
0001597934
aberdeen:AberdeenIndexSP500Index14793BroadBasedIndexMember
2020-03-31
0001597934
aberdeen:AberdeenIndexBCOM14793AdditionalIndexMember
2020-03-31
0001597934
aberdeen:ABERDEENINDEXBloombergCommodityIndex3MonthForwardTotalReturn14793AdditionalIndexMember
2020-03-31
0001597934
aberdeen:C000176936Member
2020-04-30
0001597934
aberdeen:AberdeenIndexSP500Index14793BroadBasedIndexMember
2020-04-30
0001597934
aberdeen:AberdeenIndexBCOM14793AdditionalIndexMember
2020-04-30
0001597934
aberdeen:ABERDEENINDEXBloombergCommodityIndex3MonthForwardTotalReturn14793AdditionalIndexMember
2020-04-30
0001597934
aberdeen:C000176936Member
2020-05-31
0001597934
aberdeen:AberdeenIndexSP500Index14793BroadBasedIndexMember
2020-05-31
0001597934
aberdeen:AberdeenIndexBCOM14793AdditionalIndexMember
2020-05-31
0001597934
aberdeen:ABERDEENINDEXBloombergCommodityIndex3MonthForwardTotalReturn14793AdditionalIndexMember
2020-05-31
0001597934
aberdeen:C000176936Member
2020-06-30
0001597934
aberdeen:AberdeenIndexSP500Index14793BroadBasedIndexMember
2020-06-30
0001597934
aberdeen:AberdeenIndexBCOM14793AdditionalIndexMember
2020-06-30
0001597934
aberdeen:ABERDEENINDEXBloombergCommodityIndex3MonthForwardTotalReturn14793AdditionalIndexMember
2020-06-30
0001597934
aberdeen:C000176936Member
2020-07-31
0001597934
aberdeen:AberdeenIndexSP500Index14793BroadBasedIndexMember
2020-07-31
0001597934
aberdeen:AberdeenIndexBCOM14793AdditionalIndexMember
2020-07-31
0001597934
aberdeen:ABERDEENINDEXBloombergCommodityIndex3MonthForwardTotalReturn14793AdditionalIndexMember
2020-07-31
0001597934
aberdeen:C000176936Member
2020-08-31
0001597934
aberdeen:AberdeenIndexSP500Index14793BroadBasedIndexMember
2020-08-31
0001597934
aberdeen:AberdeenIndexBCOM14793AdditionalIndexMember
2020-08-31
0001597934
aberdeen:ABERDEENINDEXBloombergCommodityIndex3MonthForwardTotalReturn14793AdditionalIndexMember
2020-08-31
0001597934
aberdeen:C000176936Member
2020-09-30
0001597934
aberdeen:AberdeenIndexSP500Index14793BroadBasedIndexMember
2020-09-30
0001597934
aberdeen:AberdeenIndexBCOM14793AdditionalIndexMember
2020-09-30
0001597934
aberdeen:ABERDEENINDEXBloombergCommodityIndex3MonthForwardTotalReturn14793AdditionalIndexMember
2020-09-30
0001597934
aberdeen:C000176936Member
2020-10-31
0001597934
aberdeen:AberdeenIndexSP500Index14793BroadBasedIndexMember
2020-10-31
0001597934
aberdeen:AberdeenIndexBCOM14793AdditionalIndexMember
2020-10-31
0001597934
aberdeen:ABERDEENINDEXBloombergCommodityIndex3MonthForwardTotalReturn14793AdditionalIndexMember
2020-10-31
0001597934
aberdeen:C000176936Member
2020-11-30
0001597934
aberdeen:AberdeenIndexSP500Index14793BroadBasedIndexMember
2020-11-30
0001597934
aberdeen:AberdeenIndexBCOM14793AdditionalIndexMember
2020-11-30
0001597934
aberdeen:ABERDEENINDEXBloombergCommodityIndex3MonthForwardTotalReturn14793AdditionalIndexMember
2020-11-30
0001597934
aberdeen:C000176936Member
2020-12-31
0001597934
aberdeen:AberdeenIndexSP500Index14793BroadBasedIndexMember
2020-12-31
0001597934
aberdeen:AberdeenIndexBCOM14793AdditionalIndexMember
2020-12-31
0001597934
aberdeen:ABERDEENINDEXBloombergCommodityIndex3MonthForwardTotalReturn14793AdditionalIndexMember
2020-12-31
0001597934
aberdeen:C000176936Member
2021-01-31
0001597934
aberdeen:AberdeenIndexSP500Index14793BroadBasedIndexMember
2021-01-31
0001597934
aberdeen:AberdeenIndexBCOM14793AdditionalIndexMember
2021-01-31
0001597934
aberdeen:ABERDEENINDEXBloombergCommodityIndex3MonthForwardTotalReturn14793AdditionalIndexMember
2021-01-31
0001597934
aberdeen:C000176936Member
2021-02-28
0001597934
aberdeen:AberdeenIndexSP500Index14793BroadBasedIndexMember
2021-02-28
0001597934
aberdeen:AberdeenIndexBCOM14793AdditionalIndexMember
2021-02-28
0001597934
aberdeen:ABERDEENINDEXBloombergCommodityIndex3MonthForwardTotalReturn14793AdditionalIndexMember
2021-02-28
0001597934
aberdeen:C000176936Member
2021-03-31
0001597934
aberdeen:AberdeenIndexSP500Index14793BroadBasedIndexMember
2021-03-31
0001597934
aberdeen:AberdeenIndexBCOM14793AdditionalIndexMember
2021-03-31
0001597934
aberdeen:ABERDEENINDEXBloombergCommodityIndex3MonthForwardTotalReturn14793AdditionalIndexMember
2021-03-31
0001597934
aberdeen:C000176936Member
2021-04-30
0001597934
aberdeen:AberdeenIndexSP500Index14793BroadBasedIndexMember
2021-04-30
0001597934
aberdeen:AberdeenIndexBCOM14793AdditionalIndexMember
2021-04-30
0001597934
aberdeen:ABERDEENINDEXBloombergCommodityIndex3MonthForwardTotalReturn14793AdditionalIndexMember
2021-04-30
0001597934
aberdeen:C000176936Member
2021-05-31
0001597934
aberdeen:AberdeenIndexSP500Index14793BroadBasedIndexMember
2021-05-31
0001597934
aberdeen:AberdeenIndexBCOM14793AdditionalIndexMember
2021-05-31
0001597934
aberdeen:ABERDEENINDEXBloombergCommodityIndex3MonthForwardTotalReturn14793AdditionalIndexMember
2021-05-31
0001597934
aberdeen:C000176936Member
2021-06-30
0001597934
aberdeen:AberdeenIndexSP500Index14793BroadBasedIndexMember
2021-06-30
0001597934
aberdeen:AberdeenIndexBCOM14793AdditionalIndexMember
2021-06-30
0001597934
aberdeen:ABERDEENINDEXBloombergCommodityIndex3MonthForwardTotalReturn14793AdditionalIndexMember
2021-06-30
0001597934
aberdeen:C000176936Member
2021-07-31
0001597934
aberdeen:AberdeenIndexSP500Index14793BroadBasedIndexMember
2021-07-31
0001597934
aberdeen:AberdeenIndexBCOM14793AdditionalIndexMember
2021-07-31
0001597934
aberdeen:ABERDEENINDEXBloombergCommodityIndex3MonthForwardTotalReturn14793AdditionalIndexMember
2021-07-31
0001597934
aberdeen:C000176936Member
2021-08-31
0001597934
aberdeen:AberdeenIndexSP500Index14793BroadBasedIndexMember
2021-08-31
0001597934
aberdeen:AberdeenIndexBCOM14793AdditionalIndexMember
2021-08-31
0001597934
aberdeen:ABERDEENINDEXBloombergCommodityIndex3MonthForwardTotalReturn14793AdditionalIndexMember
2021-08-31
0001597934
aberdeen:C000176936Member
2021-09-30
0001597934
aberdeen:AberdeenIndexSP500Index14793BroadBasedIndexMember
2021-09-30
0001597934
aberdeen:AberdeenIndexBCOM14793AdditionalIndexMember
2021-09-30
0001597934
aberdeen:ABERDEENINDEXBloombergCommodityIndex3MonthForwardTotalReturn14793AdditionalIndexMember
2021-09-30
0001597934
aberdeen:C000176936Member
2021-10-31
0001597934
aberdeen:AberdeenIndexSP500Index14793BroadBasedIndexMember
2021-10-31
0001597934
aberdeen:AberdeenIndexBCOM14793AdditionalIndexMember
2021-10-31
0001597934
aberdeen:ABERDEENINDEXBloombergCommodityIndex3MonthForwardTotalReturn14793AdditionalIndexMember
2021-10-31
0001597934
aberdeen:C000176936Member
2021-11-30
0001597934
aberdeen:AberdeenIndexSP500Index14793BroadBasedIndexMember
2021-11-30
0001597934
aberdeen:AberdeenIndexBCOM14793AdditionalIndexMember
2021-11-30
0001597934
aberdeen:ABERDEENINDEXBloombergCommodityIndex3MonthForwardTotalReturn14793AdditionalIndexMember
2021-11-30
0001597934
aberdeen:C000176936Member
2021-12-31
0001597934
aberdeen:AberdeenIndexSP500Index14793BroadBasedIndexMember
2021-12-31
0001597934
aberdeen:AberdeenIndexBCOM14793AdditionalIndexMember
2021-12-31
0001597934
aberdeen:ABERDEENINDEXBloombergCommodityIndex3MonthForwardTotalReturn14793AdditionalIndexMember
2021-12-31
0001597934
aberdeen:C000176936Member
2022-01-31
0001597934
aberdeen:AberdeenIndexSP500Index14793BroadBasedIndexMember
2022-01-31
0001597934
aberdeen:AberdeenIndexBCOM14793AdditionalIndexMember
2022-01-31
0001597934
aberdeen:ABERDEENINDEXBloombergCommodityIndex3MonthForwardTotalReturn14793AdditionalIndexMember
2022-01-31
0001597934
aberdeen:C000176936Member
2022-02-28
0001597934
aberdeen:AberdeenIndexSP500Index14793BroadBasedIndexMember
2022-02-28
0001597934
aberdeen:AberdeenIndexBCOM14793AdditionalIndexMember
2022-02-28
0001597934
aberdeen:ABERDEENINDEXBloombergCommodityIndex3MonthForwardTotalReturn14793AdditionalIndexMember
2022-02-28
0001597934
aberdeen:C000176936Member
2022-03-31
0001597934
aberdeen:AberdeenIndexSP500Index14793BroadBasedIndexMember
2022-03-31
0001597934
aberdeen:AberdeenIndexBCOM14793AdditionalIndexMember
2022-03-31
0001597934
aberdeen:ABERDEENINDEXBloombergCommodityIndex3MonthForwardTotalReturn14793AdditionalIndexMember
2022-03-31
0001597934
aberdeen:C000176936Member
2022-04-30
0001597934
aberdeen:AberdeenIndexSP500Index14793BroadBasedIndexMember
2022-04-30
0001597934
aberdeen:AberdeenIndexBCOM14793AdditionalIndexMember
2022-04-30
0001597934
aberdeen:ABERDEENINDEXBloombergCommodityIndex3MonthForwardTotalReturn14793AdditionalIndexMember
2022-04-30
0001597934
aberdeen:C000176936Member
2022-05-31
0001597934
aberdeen:AberdeenIndexSP500Index14793BroadBasedIndexMember
2022-05-31
0001597934
aberdeen:AberdeenIndexBCOM14793AdditionalIndexMember
2022-05-31
0001597934
aberdeen:ABERDEENINDEXBloombergCommodityIndex3MonthForwardTotalReturn14793AdditionalIndexMember
2022-05-31
0001597934
aberdeen:C000176936Member
2022-06-30
0001597934
aberdeen:AberdeenIndexSP500Index14793BroadBasedIndexMember
2022-06-30
0001597934
aberdeen:AberdeenIndexBCOM14793AdditionalIndexMember
2022-06-30
0001597934
aberdeen:ABERDEENINDEXBloombergCommodityIndex3MonthForwardTotalReturn14793AdditionalIndexMember
2022-06-30
0001597934
aberdeen:C000176936Member
2022-07-31
0001597934
aberdeen:AberdeenIndexSP500Index14793BroadBasedIndexMember
2022-07-31
0001597934
aberdeen:AberdeenIndexBCOM14793AdditionalIndexMember
2022-07-31
0001597934
aberdeen:ABERDEENINDEXBloombergCommodityIndex3MonthForwardTotalReturn14793AdditionalIndexMember
2022-07-31
0001597934
aberdeen:C000176936Member
2022-08-31
0001597934
aberdeen:AberdeenIndexSP500Index14793BroadBasedIndexMember
2022-08-31
0001597934
aberdeen:AberdeenIndexBCOM14793AdditionalIndexMember
2022-08-31
0001597934
aberdeen:ABERDEENINDEXBloombergCommodityIndex3MonthForwardTotalReturn14793AdditionalIndexMember
2022-08-31
0001597934
aberdeen:C000176936Member
2022-09-30
0001597934
aberdeen:AberdeenIndexSP500Index14793BroadBasedIndexMember
2022-09-30
0001597934
aberdeen:AberdeenIndexBCOM14793AdditionalIndexMember
2022-09-30
0001597934
aberdeen:ABERDEENINDEXBloombergCommodityIndex3MonthForwardTotalReturn14793AdditionalIndexMember
2022-09-30
0001597934
aberdeen:C000176936Member
2022-10-31
0001597934
aberdeen:AberdeenIndexSP500Index14793BroadBasedIndexMember
2022-10-31
0001597934
aberdeen:AberdeenIndexBCOM14793AdditionalIndexMember
2022-10-31
0001597934
aberdeen:ABERDEENINDEXBloombergCommodityIndex3MonthForwardTotalReturn14793AdditionalIndexMember
2022-10-31
0001597934
aberdeen:C000176936Member
2022-11-30
0001597934
aberdeen:AberdeenIndexSP500Index14793BroadBasedIndexMember
2022-11-30
0001597934
aberdeen:AberdeenIndexBCOM14793AdditionalIndexMember
2022-11-30
0001597934
aberdeen:ABERDEENINDEXBloombergCommodityIndex3MonthForwardTotalReturn14793AdditionalIndexMember
2022-11-30
0001597934
aberdeen:C000176936Member
2022-12-31
0001597934
aberdeen:AberdeenIndexSP500Index14793BroadBasedIndexMember
2022-12-31
0001597934
aberdeen:AberdeenIndexBCOM14793AdditionalIndexMember
2022-12-31
0001597934
aberdeen:ABERDEENINDEXBloombergCommodityIndex3MonthForwardTotalReturn14793AdditionalIndexMember
2022-12-31
0001597934
aberdeen:C000176936Member
2023-01-31
0001597934
aberdeen:AberdeenIndexSP500Index14793BroadBasedIndexMember
2023-01-31
0001597934
aberdeen:AberdeenIndexBCOM14793AdditionalIndexMember
2023-01-31
0001597934
aberdeen:ABERDEENINDEXBloombergCommodityIndex3MonthForwardTotalReturn14793AdditionalIndexMember
2023-01-31
0001597934
aberdeen:C000176936Member
2023-02-28
0001597934
aberdeen:AberdeenIndexSP500Index14793BroadBasedIndexMember
2023-02-28
0001597934
aberdeen:AberdeenIndexBCOM14793AdditionalIndexMember
2023-02-28
0001597934
aberdeen:ABERDEENINDEXBloombergCommodityIndex3MonthForwardTotalReturn14793AdditionalIndexMember
2023-02-28
0001597934
aberdeen:C000176936Member
2023-03-31
0001597934
aberdeen:AberdeenIndexSP500Index14793BroadBasedIndexMember
2023-03-31
0001597934
aberdeen:AberdeenIndexBCOM14793AdditionalIndexMember
2023-03-31
0001597934
aberdeen:ABERDEENINDEXBloombergCommodityIndex3MonthForwardTotalReturn14793AdditionalIndexMember
2023-03-31
0001597934
aberdeen:C000176936Member
2023-04-30
0001597934
aberdeen:AberdeenIndexSP500Index14793BroadBasedIndexMember
2023-04-30
0001597934
aberdeen:AberdeenIndexBCOM14793AdditionalIndexMember
2023-04-30
0001597934
aberdeen:ABERDEENINDEXBloombergCommodityIndex3MonthForwardTotalReturn14793AdditionalIndexMember
2023-04-30
0001597934
aberdeen:C000176936Member
2023-05-31
0001597934
aberdeen:AberdeenIndexSP500Index14793BroadBasedIndexMember
2023-05-31
0001597934
aberdeen:AberdeenIndexBCOM14793AdditionalIndexMember
2023-05-31
0001597934
aberdeen:ABERDEENINDEXBloombergCommodityIndex3MonthForwardTotalReturn14793AdditionalIndexMember
2023-05-31
0001597934
aberdeen:C000176936Member
2023-06-30
0001597934
aberdeen:AberdeenIndexSP500Index14793BroadBasedIndexMember
2023-06-30
0001597934
aberdeen:AberdeenIndexBCOM14793AdditionalIndexMember
2023-06-30
0001597934
aberdeen:ABERDEENINDEXBloombergCommodityIndex3MonthForwardTotalReturn14793AdditionalIndexMember
2023-06-30
0001597934
aberdeen:C000176936Member
2023-07-31
0001597934
aberdeen:AberdeenIndexSP500Index14793BroadBasedIndexMember
2023-07-31
0001597934
aberdeen:AberdeenIndexBCOM14793AdditionalIndexMember
2023-07-31
0001597934
aberdeen:ABERDEENINDEXBloombergCommodityIndex3MonthForwardTotalReturn14793AdditionalIndexMember
2023-07-31
0001597934
aberdeen:C000176936Member
2023-08-31
0001597934
aberdeen:AberdeenIndexSP500Index14793BroadBasedIndexMember
2023-08-31
0001597934
aberdeen:AberdeenIndexBCOM14793AdditionalIndexMember
2023-08-31
0001597934
aberdeen:ABERDEENINDEXBloombergCommodityIndex3MonthForwardTotalReturn14793AdditionalIndexMember
2023-08-31
0001597934
aberdeen:C000176936Member
2023-09-30
0001597934
aberdeen:AberdeenIndexSP500Index14793BroadBasedIndexMember
2023-09-30
0001597934
aberdeen:AberdeenIndexBCOM14793AdditionalIndexMember
2023-09-30
0001597934
aberdeen:ABERDEENINDEXBloombergCommodityIndex3MonthForwardTotalReturn14793AdditionalIndexMember
2023-09-30
0001597934
aberdeen:C000176936Member
2023-10-31
0001597934
aberdeen:AberdeenIndexSP500Index14793BroadBasedIndexMember
2023-10-31
0001597934
aberdeen:AberdeenIndexBCOM14793AdditionalIndexMember
2023-10-31
0001597934
aberdeen:ABERDEENINDEXBloombergCommodityIndex3MonthForwardTotalReturn14793AdditionalIndexMember
2023-10-31
0001597934
aberdeen:C000176936Member
2023-11-30
0001597934
aberdeen:AberdeenIndexSP500Index14793BroadBasedIndexMember
2023-11-30
0001597934
aberdeen:AberdeenIndexBCOM14793AdditionalIndexMember
2023-11-30
0001597934
aberdeen:ABERDEENINDEXBloombergCommodityIndex3MonthForwardTotalReturn14793AdditionalIndexMember
2023-11-30
0001597934
aberdeen:C000176936Member
2023-12-31
0001597934
aberdeen:AberdeenIndexSP500Index14793BroadBasedIndexMember
2023-12-31
0001597934
aberdeen:AberdeenIndexBCOM14793AdditionalIndexMember
2023-12-31
0001597934
aberdeen:ABERDEENINDEXBloombergCommodityIndex3MonthForwardTotalReturn14793AdditionalIndexMember
2023-12-31
0001597934
aberdeen:C000176936Member
2024-01-31
0001597934
aberdeen:AberdeenIndexSP500Index14793BroadBasedIndexMember
2024-01-31
0001597934
aberdeen:AberdeenIndexBCOM14793AdditionalIndexMember
2024-01-31
0001597934
aberdeen:ABERDEENINDEXBloombergCommodityIndex3MonthForwardTotalReturn14793AdditionalIndexMember
2024-01-31
0001597934
aberdeen:C000176936Member
2024-02-29
0001597934
aberdeen:AberdeenIndexSP500Index14793BroadBasedIndexMember
2024-02-29
0001597934
aberdeen:AberdeenIndexBCOM14793AdditionalIndexMember
2024-02-29
0001597934
aberdeen:ABERDEENINDEXBloombergCommodityIndex3MonthForwardTotalReturn14793AdditionalIndexMember
2024-02-29
0001597934
aberdeen:C000176936Member
2024-03-31
0001597934
aberdeen:AberdeenIndexSP500Index14793BroadBasedIndexMember
2024-03-31
0001597934
aberdeen:AberdeenIndexBCOM14793AdditionalIndexMember
2024-03-31
0001597934
aberdeen:ABERDEENINDEXBloombergCommodityIndex3MonthForwardTotalReturn14793AdditionalIndexMember
2024-03-31
0001597934
aberdeen:C000176936Member
2024-04-30
0001597934
aberdeen:AberdeenIndexSP500Index14793BroadBasedIndexMember
2024-04-30
0001597934
aberdeen:AberdeenIndexBCOM14793AdditionalIndexMember
2024-04-30
0001597934
aberdeen:ABERDEENINDEXBloombergCommodityIndex3MonthForwardTotalReturn14793AdditionalIndexMember
2024-04-30
0001597934
aberdeen:C000176936Member
2024-05-31
0001597934
aberdeen:AberdeenIndexSP500Index14793BroadBasedIndexMember
2024-05-31
0001597934
aberdeen:AberdeenIndexBCOM14793AdditionalIndexMember
2024-05-31
0001597934
aberdeen:ABERDEENINDEXBloombergCommodityIndex3MonthForwardTotalReturn14793AdditionalIndexMember
2024-05-31
0001597934
aberdeen:C000176936Member
2024-06-30
0001597934
aberdeen:AberdeenIndexSP500Index14793BroadBasedIndexMember
2024-06-30
0001597934
aberdeen:AberdeenIndexBCOM14793AdditionalIndexMember
2024-06-30
0001597934
aberdeen:ABERDEENINDEXBloombergCommodityIndex3MonthForwardTotalReturn14793AdditionalIndexMember
2024-06-30
0001597934
aberdeen:C000176936Member
2024-07-31
0001597934
aberdeen:AberdeenIndexSP500Index14793BroadBasedIndexMember
2024-07-31
0001597934
aberdeen:AberdeenIndexBCOM14793AdditionalIndexMember
2024-07-31
0001597934
aberdeen:ABERDEENINDEXBloombergCommodityIndex3MonthForwardTotalReturn14793AdditionalIndexMember
2024-07-31
0001597934
aberdeen:C000176936Member
2024-08-31
0001597934
aberdeen:AberdeenIndexSP500Index14793BroadBasedIndexMember
2024-08-31
0001597934
aberdeen:AberdeenIndexBCOM14793AdditionalIndexMember
2024-08-31
0001597934
aberdeen:ABERDEENINDEXBloombergCommodityIndex3MonthForwardTotalReturn14793AdditionalIndexMember
2024-08-31
0001597934
aberdeen:C000176936Member
2024-09-30
0001597934
aberdeen:AberdeenIndexSP500Index14793BroadBasedIndexMember
2024-09-30
0001597934
aberdeen:AberdeenIndexBCOM14793AdditionalIndexMember
2024-09-30
0001597934
aberdeen:ABERDEENINDEXBloombergCommodityIndex3MonthForwardTotalReturn14793AdditionalIndexMember
2024-09-30
0001597934
aberdeen:C000176936Member
2024-10-31
0001597934
aberdeen:AberdeenIndexSP500Index14793BroadBasedIndexMember
2024-10-31
0001597934
aberdeen:AberdeenIndexBCOM14793AdditionalIndexMember
2024-10-31
0001597934
aberdeen:ABERDEENINDEXBloombergCommodityIndex3MonthForwardTotalReturn14793AdditionalIndexMember
2024-10-31
0001597934
aberdeen:C000176936Member
2024-11-30
0001597934
aberdeen:AberdeenIndexSP500Index14793BroadBasedIndexMember
2024-11-30
0001597934
aberdeen:AberdeenIndexBCOM14793AdditionalIndexMember
2024-11-30
0001597934
aberdeen:ABERDEENINDEXBloombergCommodityIndex3MonthForwardTotalReturn14793AdditionalIndexMember
2024-11-30
0001597934
aberdeen:C000176936Member
2024-12-31
0001597934
aberdeen:AberdeenIndexSP500Index14793BroadBasedIndexMember
2024-12-31
0001597934
aberdeen:AberdeenIndexBCOM14793AdditionalIndexMember
2024-12-31
0001597934
aberdeen:ABERDEENINDEXBloombergCommodityIndex3MonthForwardTotalReturn14793AdditionalIndexMember
2024-12-31
0001597934
aberdeen:C000176936Member
oef:WithoutSalesLoadMember
2024-01-01
2024-12-31
0001597934
aberdeen:C000176936Member
oef:WithoutSalesLoadMember
2020-01-01
2024-12-31
0001597934
aberdeen:C000176936Member
oef:WithoutSalesLoadMember
2017-03-31
2024-12-31
0001597934
aberdeen:AberdeenIndexSP500Index14793BroadBasedIndexMember
2020-01-01
2024-12-31
0001597934
aberdeen:AberdeenIndexSP500Index14793BroadBasedIndexMember
2017-03-31
2024-12-31
0001597934
aberdeen:AberdeenIndexBCOM14793AdditionalIndexMember
2020-01-01
2024-12-31
0001597934
aberdeen:AberdeenIndexBCOM14793AdditionalIndexMember
2017-03-31
2024-12-31
0001597934
aberdeen:ABERDEENINDEXBloombergCommodityIndex3MonthForwardTotalReturn14793AdditionalIndexMember
2020-01-01
2024-12-31
0001597934
aberdeen:ABERDEENINDEXBloombergCommodityIndex3MonthForwardTotalReturn14793AdditionalIndexMember
2017-03-31
2024-12-31
0001597934
aberdeen:C000176936Member
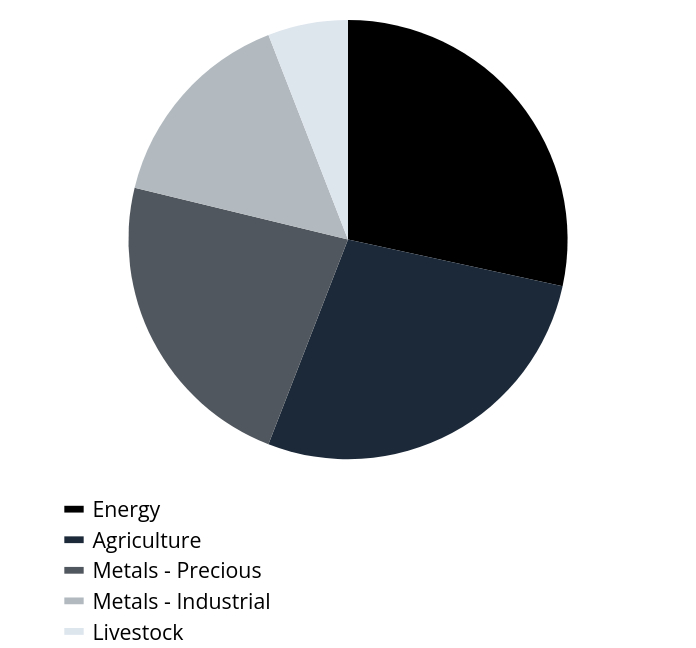
aberdeen:SectorEnergySectorMember
2024-12-31
0001597934
aberdeen:C000176936Member
aberdeen:SectorAgricultureSectorMember
2024-12-31
0001597934
aberdeen:C000176936Member
aberdeen:SectorMetalsMinusPreciousSectorMember
2024-12-31
0001597934
aberdeen:C000176936Member
aberdeen:SectorMetalsMinusIndustrialSectorMember
2024-12-31
0001597934
aberdeen:C000176936Member
aberdeen:SectorLivestockSectorMember
2024-12-31
0001597934
aberdeen:C000176936Member
aberdeen:FRTSRTop10GOLDCTIMember
2024-12-31
0001597934
aberdeen:C000176936Member
aberdeen:FRTSRTop10NATGASCTIMember
2024-12-31
0001597934
aberdeen:C000176936Member
aberdeen:FRTSRTOP10BRENTCTIMember
2024-12-31
0001597934
aberdeen:C000176936Member
aberdeen:FRTSRTOP10WTICTIMember
2024-12-31
0001597934
aberdeen:C000176936Member
aberdeen:FRTSRTop10COPPERCTIMember
2024-12-31
0001597934
aberdeen:C000176936Member
aberdeen:FRTSRTOP10CORNCTIMember
2024-12-31
0001597934
aberdeen:C000176936Member
aberdeen:FRTSRTOP10SILVERCTIMember
2024-12-31
0001597934
aberdeen:C000176936Member
aberdeen:FRTSRTOP10COFFEECTIMember
2024-12-31
0001597934
aberdeen:C000176936Member
aberdeen:FRTSRTOP10SOYBEANCTIMember
2024-12-31
0001597934
aberdeen:C000176936Member
aberdeen:FRTSRTOP10PRIALUMCTIMember
2024-12-31
0001597934
aberdeen:C000176935Member
2024-01-01
2024-12-31
0001597934
aberdeen:AberdeenIndexSP500Index14792BroadBasedIndexMember
2024-01-01
2024-12-31
0001597934
aberdeen:AberdeenIndexBCOM14792AdditionalIndexMember
2024-01-01
2024-12-31
0001597934
aberdeen:C000176935Member
2017-03-30
0001597934
aberdeen:AberdeenIndexSP500Index14792BroadBasedIndexMember
2017-03-30
0001597934
aberdeen:AberdeenIndexBCOM14792AdditionalIndexMember
2017-03-30
0001597934
aberdeen:C000176935Member
2017-03-31
0001597934
aberdeen:AberdeenIndexSP500Index14792BroadBasedIndexMember
2017-03-31
0001597934
aberdeen:AberdeenIndexBCOM14792AdditionalIndexMember
2017-03-31
0001597934
aberdeen:C000176935Member
2017-04-30
0001597934
aberdeen:AberdeenIndexSP500Index14792BroadBasedIndexMember
2017-04-30
0001597934
aberdeen:AberdeenIndexBCOM14792AdditionalIndexMember
2017-04-30
0001597934
aberdeen:C000176935Member
2017-05-31
0001597934
aberdeen:AberdeenIndexSP500Index14792BroadBasedIndexMember
2017-05-31
0001597934
aberdeen:AberdeenIndexBCOM14792AdditionalIndexMember
2017-05-31
0001597934
aberdeen:C000176935Member
2017-06-30
0001597934
aberdeen:AberdeenIndexSP500Index14792BroadBasedIndexMember
2017-06-30
0001597934
aberdeen:AberdeenIndexBCOM14792AdditionalIndexMember
2017-06-30
0001597934
aberdeen:C000176935Member
2017-07-31
0001597934
aberdeen:AberdeenIndexSP500Index14792BroadBasedIndexMember
2017-07-31
0001597934
aberdeen:AberdeenIndexBCOM14792AdditionalIndexMember
2017-07-31
0001597934
aberdeen:C000176935Member
2017-08-31
0001597934
aberdeen:AberdeenIndexSP500Index14792BroadBasedIndexMember
2017-08-31
0001597934
aberdeen:AberdeenIndexBCOM14792AdditionalIndexMember
2017-08-31
0001597934
aberdeen:C000176935Member
2017-09-30
0001597934
aberdeen:AberdeenIndexSP500Index14792BroadBasedIndexMember
2017-09-30
0001597934
aberdeen:AberdeenIndexBCOM14792AdditionalIndexMember
2017-09-30
0001597934
aberdeen:C000176935Member
2017-10-31
0001597934
aberdeen:AberdeenIndexSP500Index14792BroadBasedIndexMember
2017-10-31
0001597934
aberdeen:AberdeenIndexBCOM14792AdditionalIndexMember
2017-10-31
0001597934
aberdeen:C000176935Member
2017-11-30
0001597934
aberdeen:AberdeenIndexSP500Index14792BroadBasedIndexMember
2017-11-30
0001597934
aberdeen:AberdeenIndexBCOM14792AdditionalIndexMember
2017-11-30
0001597934
aberdeen:C000176935Member
2017-12-31
0001597934
aberdeen:AberdeenIndexSP500Index14792BroadBasedIndexMember
2017-12-31
0001597934
aberdeen:AberdeenIndexBCOM14792AdditionalIndexMember
2017-12-31
0001597934
aberdeen:C000176935Member
2018-01-31
0001597934
aberdeen:AberdeenIndexSP500Index14792BroadBasedIndexMember
2018-01-31
0001597934
aberdeen:AberdeenIndexBCOM14792AdditionalIndexMember
2018-01-31
0001597934
aberdeen:C000176935Member
2018-02-28
0001597934
aberdeen:AberdeenIndexSP500Index14792BroadBasedIndexMember
2018-02-28
0001597934
aberdeen:AberdeenIndexBCOM14792AdditionalIndexMember
2018-02-28
0001597934
aberdeen:C000176935Member
2018-03-31
0001597934
aberdeen:AberdeenIndexSP500Index14792BroadBasedIndexMember
2018-03-31
0001597934
aberdeen:AberdeenIndexBCOM14792AdditionalIndexMember
2018-03-31
0001597934
aberdeen:C000176935Member
2018-04-30
0001597934
aberdeen:AberdeenIndexSP500Index14792BroadBasedIndexMember
2018-04-30
0001597934
aberdeen:AberdeenIndexBCOM14792AdditionalIndexMember
2018-04-30
0001597934
aberdeen:C000176935Member
2018-05-31
0001597934
aberdeen:AberdeenIndexSP500Index14792BroadBasedIndexMember
2018-05-31
0001597934
aberdeen:AberdeenIndexBCOM14792AdditionalIndexMember
2018-05-31
0001597934
aberdeen:C000176935Member
2018-06-30
0001597934
aberdeen:AberdeenIndexSP500Index14792BroadBasedIndexMember
2018-06-30
0001597934
aberdeen:AberdeenIndexBCOM14792AdditionalIndexMember
2018-06-30
0001597934
aberdeen:C000176935Member
2018-07-31
0001597934
aberdeen:AberdeenIndexSP500Index14792BroadBasedIndexMember
2018-07-31
0001597934
aberdeen:AberdeenIndexBCOM14792AdditionalIndexMember
2018-07-31
0001597934
aberdeen:C000176935Member
2018-08-31
0001597934
aberdeen:AberdeenIndexSP500Index14792BroadBasedIndexMember
2018-08-31
0001597934
aberdeen:AberdeenIndexBCOM14792AdditionalIndexMember
2018-08-31
0001597934
aberdeen:C000176935Member
2018-09-30
0001597934
aberdeen:AberdeenIndexSP500Index14792BroadBasedIndexMember
2018-09-30
0001597934
aberdeen:AberdeenIndexBCOM14792AdditionalIndexMember
2018-09-30
0001597934
aberdeen:C000176935Member
2018-10-31
0001597934
aberdeen:AberdeenIndexSP500Index14792BroadBasedIndexMember
2018-10-31
0001597934
aberdeen:AberdeenIndexBCOM14792AdditionalIndexMember
2018-10-31
0001597934
aberdeen:C000176935Member
2018-11-30
0001597934
aberdeen:AberdeenIndexSP500Index14792BroadBasedIndexMember
2018-11-30
0001597934
aberdeen:AberdeenIndexBCOM14792AdditionalIndexMember
2018-11-30
0001597934
aberdeen:C000176935Member
2018-12-31
0001597934
aberdeen:AberdeenIndexSP500Index14792BroadBasedIndexMember
2018-12-31
0001597934
aberdeen:AberdeenIndexBCOM14792AdditionalIndexMember
2018-12-31
0001597934
aberdeen:C000176935Member
2019-01-31
0001597934
aberdeen:AberdeenIndexSP500Index14792BroadBasedIndexMember
2019-01-31
0001597934
aberdeen:AberdeenIndexBCOM14792AdditionalIndexMember
2019-01-31
0001597934
aberdeen:C000176935Member
2019-02-28
0001597934
aberdeen:AberdeenIndexSP500Index14792BroadBasedIndexMember
2019-02-28
0001597934
aberdeen:AberdeenIndexBCOM14792AdditionalIndexMember
2019-02-28
0001597934
aberdeen:C000176935Member
2019-03-31
0001597934
aberdeen:AberdeenIndexSP500Index14792BroadBasedIndexMember
2019-03-31
0001597934
aberdeen:AberdeenIndexBCOM14792AdditionalIndexMember
2019-03-31
0001597934
aberdeen:C000176935Member
2019-04-30
0001597934
aberdeen:AberdeenIndexSP500Index14792BroadBasedIndexMember
2019-04-30
0001597934
aberdeen:AberdeenIndexBCOM14792AdditionalIndexMember
2019-04-30
0001597934
aberdeen:C000176935Member
2019-05-31
0001597934
aberdeen:AberdeenIndexSP500Index14792BroadBasedIndexMember
2019-05-31
0001597934
aberdeen:AberdeenIndexBCOM14792AdditionalIndexMember
2019-05-31
0001597934
aberdeen:C000176935Member
2019-06-30
0001597934
aberdeen:AberdeenIndexSP500Index14792BroadBasedIndexMember
2019-06-30
0001597934
aberdeen:AberdeenIndexBCOM14792AdditionalIndexMember
2019-06-30
0001597934
aberdeen:C000176935Member
2019-07-31
0001597934
aberdeen:AberdeenIndexSP500Index14792BroadBasedIndexMember
2019-07-31
0001597934
aberdeen:AberdeenIndexBCOM14792AdditionalIndexMember
2019-07-31
0001597934
aberdeen:C000176935Member
2019-08-31
0001597934
aberdeen:AberdeenIndexSP500Index14792BroadBasedIndexMember
2019-08-31
0001597934
aberdeen:AberdeenIndexBCOM14792AdditionalIndexMember
2019-08-31
0001597934
aberdeen:C000176935Member
2019-09-30
0001597934
aberdeen:AberdeenIndexSP500Index14792BroadBasedIndexMember
2019-09-30
0001597934
aberdeen:AberdeenIndexBCOM14792AdditionalIndexMember
2019-09-30
0001597934
aberdeen:C000176935Member
2019-10-31
0001597934
aberdeen:AberdeenIndexSP500Index14792BroadBasedIndexMember
2019-10-31
0001597934
aberdeen:AberdeenIndexBCOM14792AdditionalIndexMember
2019-10-31
0001597934
aberdeen:C000176935Member
2019-11-30
0001597934
aberdeen:AberdeenIndexSP500Index14792BroadBasedIndexMember
2019-11-30
0001597934
aberdeen:AberdeenIndexBCOM14792AdditionalIndexMember
2019-11-30
0001597934
aberdeen:C000176935Member
2019-12-31
0001597934
aberdeen:AberdeenIndexSP500Index14792BroadBasedIndexMember
2019-12-31
0001597934
aberdeen:AberdeenIndexBCOM14792AdditionalIndexMember
2019-12-31
0001597934
aberdeen:C000176935Member
2020-01-31
0001597934
aberdeen:AberdeenIndexSP500Index14792BroadBasedIndexMember
2020-01-31
0001597934
aberdeen:AberdeenIndexBCOM14792AdditionalIndexMember
2020-01-31
0001597934
aberdeen:C000176935Member
2020-02-29
0001597934
aberdeen:AberdeenIndexSP500Index14792BroadBasedIndexMember
2020-02-29
0001597934
aberdeen:AberdeenIndexBCOM14792AdditionalIndexMember
2020-02-29
0001597934
aberdeen:C000176935Member
2020-03-31
0001597934
aberdeen:AberdeenIndexSP500Index14792BroadBasedIndexMember
2020-03-31
0001597934
aberdeen:AberdeenIndexBCOM14792AdditionalIndexMember
2020-03-31
0001597934
aberdeen:C000176935Member
2020-04-30
0001597934
aberdeen:AberdeenIndexSP500Index14792BroadBasedIndexMember
2020-04-30
0001597934
aberdeen:AberdeenIndexBCOM14792AdditionalIndexMember
2020-04-30
0001597934
aberdeen:C000176935Member
2020-05-31
0001597934
aberdeen:AberdeenIndexSP500Index14792BroadBasedIndexMember
2020-05-31
0001597934
aberdeen:AberdeenIndexBCOM14792AdditionalIndexMember
2020-05-31
0001597934
aberdeen:C000176935Member
2020-06-30
0001597934
aberdeen:AberdeenIndexSP500Index14792BroadBasedIndexMember
2020-06-30
0001597934
aberdeen:AberdeenIndexBCOM14792AdditionalIndexMember
2020-06-30
0001597934
aberdeen:C000176935Member
2020-07-31
0001597934
aberdeen:AberdeenIndexSP500Index14792BroadBasedIndexMember
2020-07-31
0001597934
aberdeen:AberdeenIndexBCOM14792AdditionalIndexMember
2020-07-31
0001597934
aberdeen:C000176935Member
2020-08-31
0001597934
aberdeen:AberdeenIndexSP500Index14792BroadBasedIndexMember
2020-08-31
0001597934
aberdeen:AberdeenIndexBCOM14792AdditionalIndexMember
2020-08-31
0001597934
aberdeen:C000176935Member
2020-09-30
0001597934
aberdeen:AberdeenIndexSP500Index14792BroadBasedIndexMember
2020-09-30
0001597934
aberdeen:AberdeenIndexBCOM14792AdditionalIndexMember
2020-09-30
0001597934
aberdeen:C000176935Member
2020-10-31
0001597934
aberdeen:AberdeenIndexSP500Index14792BroadBasedIndexMember
2020-10-31
0001597934
aberdeen:AberdeenIndexBCOM14792AdditionalIndexMember
2020-10-31
0001597934
aberdeen:C000176935Member
2020-11-30
0001597934
aberdeen:AberdeenIndexSP500Index14792BroadBasedIndexMember
2020-11-30
0001597934
aberdeen:AberdeenIndexBCOM14792AdditionalIndexMember
2020-11-30
0001597934
aberdeen:C000176935Member
2020-12-31
0001597934
aberdeen:AberdeenIndexSP500Index14792BroadBasedIndexMember
2020-12-31
0001597934
aberdeen:AberdeenIndexBCOM14792AdditionalIndexMember
2020-12-31
0001597934
aberdeen:C000176935Member
2021-01-31
0001597934
aberdeen:AberdeenIndexSP500Index14792BroadBasedIndexMember
2021-01-31
0001597934
aberdeen:AberdeenIndexBCOM14792AdditionalIndexMember
2021-01-31
0001597934
aberdeen:C000176935Member
2021-02-28
0001597934
aberdeen:AberdeenIndexSP500Index14792BroadBasedIndexMember
2021-02-28
0001597934
aberdeen:AberdeenIndexBCOM14792AdditionalIndexMember
2021-02-28
0001597934
aberdeen:C000176935Member
2021-03-31
0001597934
aberdeen:AberdeenIndexSP500Index14792BroadBasedIndexMember
2021-03-31
0001597934
aberdeen:AberdeenIndexBCOM14792AdditionalIndexMember
2021-03-31
0001597934
aberdeen:C000176935Member
2021-04-30
0001597934
aberdeen:AberdeenIndexSP500Index14792BroadBasedIndexMember
2021-04-30
0001597934
aberdeen:AberdeenIndexBCOM14792AdditionalIndexMember
2021-04-30
0001597934
aberdeen:C000176935Member
2021-05-31
0001597934
aberdeen:AberdeenIndexSP500Index14792BroadBasedIndexMember
2021-05-31
0001597934
aberdeen:AberdeenIndexBCOM14792AdditionalIndexMember
2021-05-31
0001597934
aberdeen:C000176935Member
2021-06-30
0001597934
aberdeen:AberdeenIndexSP500Index14792BroadBasedIndexMember
2021-06-30
0001597934
aberdeen:AberdeenIndexBCOM14792AdditionalIndexMember
2021-06-30
0001597934
aberdeen:C000176935Member
2021-07-31
0001597934
aberdeen:AberdeenIndexSP500Index14792BroadBasedIndexMember
2021-07-31
0001597934
aberdeen:AberdeenIndexBCOM14792AdditionalIndexMember
2021-07-31
0001597934
aberdeen:C000176935Member
2021-08-31
0001597934
aberdeen:AberdeenIndexSP500Index14792BroadBasedIndexMember
2021-08-31
0001597934
aberdeen:AberdeenIndexBCOM14792AdditionalIndexMember
2021-08-31
0001597934
aberdeen:C000176935Member
2021-09-30
0001597934
aberdeen:AberdeenIndexSP500Index14792BroadBasedIndexMember
2021-09-30
0001597934
aberdeen:AberdeenIndexBCOM14792AdditionalIndexMember
2021-09-30
0001597934
aberdeen:C000176935Member
2021-10-31
0001597934
aberdeen:AberdeenIndexSP500Index14792BroadBasedIndexMember
2021-10-31
0001597934
aberdeen:AberdeenIndexBCOM14792AdditionalIndexMember
2021-10-31
0001597934
aberdeen:C000176935Member
2021-11-30
0001597934
aberdeen:AberdeenIndexSP500Index14792BroadBasedIndexMember
2021-11-30
0001597934
aberdeen:AberdeenIndexBCOM14792AdditionalIndexMember
2021-11-30
0001597934
aberdeen:C000176935Member
2021-12-31
0001597934
aberdeen:AberdeenIndexSP500Index14792BroadBasedIndexMember
2021-12-31
0001597934
aberdeen:AberdeenIndexBCOM14792AdditionalIndexMember
2021-12-31
0001597934
aberdeen:C000176935Member
2022-01-31
0001597934
aberdeen:AberdeenIndexSP500Index14792BroadBasedIndexMember
2022-01-31
0001597934
aberdeen:AberdeenIndexBCOM14792AdditionalIndexMember
2022-01-31
0001597934
aberdeen:C000176935Member
2022-02-28
0001597934
aberdeen:AberdeenIndexSP500Index14792BroadBasedIndexMember
2022-02-28
0001597934
aberdeen:AberdeenIndexBCOM14792AdditionalIndexMember
2022-02-28
0001597934
aberdeen:C000176935Member
2022-03-31
0001597934
aberdeen:AberdeenIndexSP500Index14792BroadBasedIndexMember
2022-03-31
0001597934
aberdeen:AberdeenIndexBCOM14792AdditionalIndexMember
2022-03-31
0001597934
aberdeen:C000176935Member
2022-04-30
0001597934
aberdeen:AberdeenIndexSP500Index14792BroadBasedIndexMember
2022-04-30
0001597934
aberdeen:AberdeenIndexBCOM14792AdditionalIndexMember
2022-04-30
0001597934
aberdeen:C000176935Member
2022-05-31
0001597934
aberdeen:AberdeenIndexSP500Index14792BroadBasedIndexMember
2022-05-31
0001597934
aberdeen:AberdeenIndexBCOM14792AdditionalIndexMember
2022-05-31
0001597934
aberdeen:C000176935Member
2022-06-30
0001597934
aberdeen:AberdeenIndexSP500Index14792BroadBasedIndexMember
2022-06-30
0001597934
aberdeen:AberdeenIndexBCOM14792AdditionalIndexMember
2022-06-30
0001597934
aberdeen:C000176935Member
2022-07-31
0001597934
aberdeen:AberdeenIndexSP500Index14792BroadBasedIndexMember
2022-07-31
0001597934
aberdeen:AberdeenIndexBCOM14792AdditionalIndexMember
2022-07-31
0001597934
aberdeen:C000176935Member
2022-08-31
0001597934
aberdeen:AberdeenIndexSP500Index14792BroadBasedIndexMember
2022-08-31
0001597934
aberdeen:AberdeenIndexBCOM14792AdditionalIndexMember
2022-08-31
0001597934
aberdeen:C000176935Member
2022-09-30
0001597934
aberdeen:AberdeenIndexSP500Index14792BroadBasedIndexMember
2022-09-30
0001597934
aberdeen:AberdeenIndexBCOM14792AdditionalIndexMember
2022-09-30
0001597934
aberdeen:C000176935Member
2022-10-31
0001597934
aberdeen:AberdeenIndexSP500Index14792BroadBasedIndexMember
2022-10-31
0001597934
aberdeen:AberdeenIndexBCOM14792AdditionalIndexMember
2022-10-31
0001597934
aberdeen:C000176935Member
2022-11-30
0001597934
aberdeen:AberdeenIndexSP500Index14792BroadBasedIndexMember
2022-11-30
0001597934
aberdeen:AberdeenIndexBCOM14792AdditionalIndexMember
2022-11-30
0001597934
aberdeen:C000176935Member
2022-12-31
0001597934
aberdeen:AberdeenIndexSP500Index14792BroadBasedIndexMember
2022-12-31
0001597934
aberdeen:AberdeenIndexBCOM14792AdditionalIndexMember
2022-12-31
0001597934
aberdeen:C000176935Member
2023-01-31
0001597934
aberdeen:AberdeenIndexSP500Index14792BroadBasedIndexMember
2023-01-31
0001597934
aberdeen:AberdeenIndexBCOM14792AdditionalIndexMember
2023-01-31
0001597934
aberdeen:C000176935Member
2023-02-28
0001597934
aberdeen:AberdeenIndexSP500Index14792BroadBasedIndexMember
2023-02-28
0001597934
aberdeen:AberdeenIndexBCOM14792AdditionalIndexMember
2023-02-28
0001597934
aberdeen:C000176935Member
2023-03-31
0001597934
aberdeen:AberdeenIndexSP500Index14792BroadBasedIndexMember
2023-03-31
0001597934
aberdeen:AberdeenIndexBCOM14792AdditionalIndexMember
2023-03-31
0001597934
aberdeen:C000176935Member
2023-04-30
0001597934
aberdeen:AberdeenIndexSP500Index14792BroadBasedIndexMember
2023-04-30
0001597934
aberdeen:AberdeenIndexBCOM14792AdditionalIndexMember
2023-04-30
0001597934
aberdeen:C000176935Member
2023-05-31
0001597934
aberdeen:AberdeenIndexSP500Index14792BroadBasedIndexMember
2023-05-31
0001597934
aberdeen:AberdeenIndexBCOM14792AdditionalIndexMember
2023-05-31
0001597934
aberdeen:C000176935Member
2023-06-30
0001597934
aberdeen:AberdeenIndexSP500Index14792BroadBasedIndexMember
2023-06-30
0001597934
aberdeen:AberdeenIndexBCOM14792AdditionalIndexMember
2023-06-30
0001597934
aberdeen:C000176935Member
2023-07-31
0001597934
aberdeen:AberdeenIndexSP500Index14792BroadBasedIndexMember
2023-07-31
0001597934
aberdeen:AberdeenIndexBCOM14792AdditionalIndexMember
2023-07-31
0001597934
aberdeen:C000176935Member
2023-08-31
0001597934
aberdeen:AberdeenIndexSP500Index14792BroadBasedIndexMember
2023-08-31
0001597934
aberdeen:AberdeenIndexBCOM14792AdditionalIndexMember
2023-08-31
0001597934
aberdeen:C000176935Member
2023-09-30
0001597934
aberdeen:AberdeenIndexSP500Index14792BroadBasedIndexMember
2023-09-30
0001597934
aberdeen:AberdeenIndexBCOM14792AdditionalIndexMember
2023-09-30
0001597934
aberdeen:C000176935Member
2023-10-31
0001597934
aberdeen:AberdeenIndexSP500Index14792BroadBasedIndexMember
2023-10-31
0001597934
aberdeen:AberdeenIndexBCOM14792AdditionalIndexMember
2023-10-31
0001597934
aberdeen:C000176935Member
2023-11-30
0001597934
aberdeen:AberdeenIndexSP500Index14792BroadBasedIndexMember
2023-11-30
0001597934
aberdeen:AberdeenIndexBCOM14792AdditionalIndexMember
2023-11-30
0001597934
aberdeen:C000176935Member
2023-12-31
0001597934
aberdeen:AberdeenIndexSP500Index14792BroadBasedIndexMember
2023-12-31
0001597934
aberdeen:AberdeenIndexBCOM14792AdditionalIndexMember
2023-12-31
0001597934
aberdeen:C000176935Member
2024-01-31
0001597934
aberdeen:AberdeenIndexSP500Index14792BroadBasedIndexMember
2024-01-31
0001597934
aberdeen:AberdeenIndexBCOM14792AdditionalIndexMember
2024-01-31
0001597934
aberdeen:C000176935Member
2024-02-29
0001597934
aberdeen:AberdeenIndexSP500Index14792BroadBasedIndexMember
2024-02-29
0001597934
aberdeen:AberdeenIndexBCOM14792AdditionalIndexMember
2024-02-29
0001597934
aberdeen:C000176935Member
2024-03-31
0001597934
aberdeen:AberdeenIndexSP500Index14792BroadBasedIndexMember
2024-03-31
0001597934
aberdeen:AberdeenIndexBCOM14792AdditionalIndexMember
2024-03-31
0001597934
aberdeen:C000176935Member
2024-04-30
0001597934
aberdeen:AberdeenIndexSP500Index14792BroadBasedIndexMember
2024-04-30
0001597934
aberdeen:AberdeenIndexBCOM14792AdditionalIndexMember
2024-04-30
0001597934
aberdeen:C000176935Member
2024-05-31
0001597934
aberdeen:AberdeenIndexSP500Index14792BroadBasedIndexMember
2024-05-31
0001597934
aberdeen:AberdeenIndexBCOM14792AdditionalIndexMember
2024-05-31
0001597934
aberdeen:C000176935Member
2024-06-30
0001597934
aberdeen:AberdeenIndexSP500Index14792BroadBasedIndexMember
2024-06-30
0001597934
aberdeen:AberdeenIndexBCOM14792AdditionalIndexMember
2024-06-30
0001597934
aberdeen:C000176935Member
2024-07-31
0001597934
aberdeen:AberdeenIndexSP500Index14792BroadBasedIndexMember
2024-07-31
0001597934
aberdeen:AberdeenIndexBCOM14792AdditionalIndexMember
2024-07-31
0001597934
aberdeen:C000176935Member
2024-08-31
0001597934
aberdeen:AberdeenIndexSP500Index14792BroadBasedIndexMember
2024-08-31
0001597934
aberdeen:AberdeenIndexBCOM14792AdditionalIndexMember
2024-08-31
0001597934
aberdeen:C000176935Member
2024-09-30
0001597934
aberdeen:AberdeenIndexSP500Index14792BroadBasedIndexMember
2024-09-30
0001597934
aberdeen:AberdeenIndexBCOM14792AdditionalIndexMember
2024-09-30
0001597934
aberdeen:C000176935Member
2024-10-31
0001597934
aberdeen:AberdeenIndexSP500Index14792BroadBasedIndexMember
2024-10-31
0001597934
aberdeen:AberdeenIndexBCOM14792AdditionalIndexMember
2024-10-31
0001597934
aberdeen:C000176935Member
2024-11-30
0001597934
aberdeen:AberdeenIndexSP500Index14792BroadBasedIndexMember
2024-11-30
0001597934
aberdeen:AberdeenIndexBCOM14792AdditionalIndexMember
2024-11-30
0001597934
aberdeen:C000176935Member
2024-12-31
0001597934
aberdeen:AberdeenIndexSP500Index14792BroadBasedIndexMember
2024-12-31
0001597934
aberdeen:AberdeenIndexBCOM14792AdditionalIndexMember
2024-12-31
0001597934
aberdeen:C000176935Member
oef:WithoutSalesLoadMember
2024-01-01
2024-12-31
0001597934
aberdeen:C000176935Member
oef:WithoutSalesLoadMember
2020-01-01
2024-12-31
0001597934
aberdeen:C000176935Member
oef:WithoutSalesLoadMember
2017-03-31
2024-12-31
0001597934
aberdeen:AberdeenIndexSP500Index14792BroadBasedIndexMember
2020-01-01
2024-12-31
0001597934
aberdeen:AberdeenIndexSP500Index14792BroadBasedIndexMember
2017-03-31
2024-12-31
0001597934
aberdeen:AberdeenIndexBCOM14792AdditionalIndexMember
2020-01-01
2024-12-31
0001597934
aberdeen:AberdeenIndexBCOM14792AdditionalIndexMember
2017-03-31
2024-12-31
0001597934
aberdeen:C000176935Member
aberdeen:SectorEnergySectorMember
2024-12-31
0001597934
aberdeen:C000176935Member
aberdeen:SectorAgricultureSectorMember
2024-12-31
0001597934
aberdeen:C000176935Member
aberdeen:SectorMetalsMinusPreciousSectorMember
2024-12-31
0001597934
aberdeen:C000176935Member
aberdeen:SectorMetalsMinusIndustrialSectorMember
2024-12-31
0001597934
aberdeen:C000176935Member
aberdeen:SectorLivestockSectorMember
2024-12-31
0001597934
aberdeen:C000176935Member
aberdeen:FRTSRTop10GOLDCTIMember
2024-12-31
0001597934
aberdeen:C000176935Member
aberdeen:FRTSRTop10NATGASCTIMember
2024-12-31
0001597934
aberdeen:C000176935Member
aberdeen:FRTSRTOP10BRENTCTIMember
2024-12-31
0001597934
aberdeen:C000176935Member
aberdeen:FRTSRTOP10WTICTIMember
2024-12-31
0001597934
aberdeen:C000176935Member
aberdeen:FRTSRTop10COPPERCTIMember
2024-12-31
0001597934
aberdeen:C000176935Member
aberdeen:FRTSRTOP10SILVERCTIMember
2024-12-31
0001597934
aberdeen:C000176935Member
aberdeen:FRTSRTOP10CORNCTIMember
2024-12-31
0001597934
aberdeen:C000176935Member
aberdeen:FRTSRTOP10COFFEECTIMember
2024-12-31
0001597934
aberdeen:C000176935Member
aberdeen:FRTSRTOP10SOYBEANCTIMember
2024-12-31
0001597934
aberdeen:C000176935Member
aberdeen:FRTSRTOP10PRIALUMCTIMember
2024-12-31
0001597934
aberdeen:C000229118Member
2024-01-01
2024-12-31
0001597934
aberdeen:AberdeenIndexSP500Index15157BroadBasedIndexMember
2024-01-01
2024-12-31
0001597934
aberdeen:AberdeenIndexBCOM15157AdditionalIndexMember
2024-01-01
2024-12-31
0001597934
aberdeen:ABERDEENINDEXBloombergIndustrialMetalsTotalReturnSubindex15157AdditionalIndexMember
2024-01-01
2024-12-31
0001597934
aberdeen:C000229118Member
2021-09-22
0001597934
aberdeen:AberdeenIndexSP500Index15157BroadBasedIndexMember
2021-09-22
0001597934
aberdeen:AberdeenIndexBCOM15157AdditionalIndexMember
2021-09-22
0001597934
aberdeen:ABERDEENINDEXBloombergIndustrialMetalsTotalReturnSubindex15157AdditionalIndexMember
2021-09-22
0001597934
aberdeen:C000229118Member
2021-09-30
0001597934
aberdeen:AberdeenIndexSP500Index15157BroadBasedIndexMember
2021-09-30
0001597934
aberdeen:AberdeenIndexBCOM15157AdditionalIndexMember
2021-09-30
0001597934
aberdeen:ABERDEENINDEXBloombergIndustrialMetalsTotalReturnSubindex15157AdditionalIndexMember
2021-09-30
0001597934
aberdeen:C000229118Member
2021-10-31
0001597934
aberdeen:AberdeenIndexSP500Index15157BroadBasedIndexMember
2021-10-31
0001597934
aberdeen:AberdeenIndexBCOM15157AdditionalIndexMember
2021-10-31
0001597934
aberdeen:ABERDEENINDEXBloombergIndustrialMetalsTotalReturnSubindex15157AdditionalIndexMember
2021-10-31
0001597934
aberdeen:C000229118Member
2021-11-30
0001597934
aberdeen:AberdeenIndexSP500Index15157BroadBasedIndexMember
2021-11-30
0001597934
aberdeen:AberdeenIndexBCOM15157AdditionalIndexMember
2021-11-30
0001597934
aberdeen:ABERDEENINDEXBloombergIndustrialMetalsTotalReturnSubindex15157AdditionalIndexMember
2021-11-30
0001597934
aberdeen:C000229118Member
2021-12-31
0001597934
aberdeen:AberdeenIndexSP500Index15157BroadBasedIndexMember
2021-12-31
0001597934
aberdeen:AberdeenIndexBCOM15157AdditionalIndexMember
2021-12-31
0001597934
aberdeen:ABERDEENINDEXBloombergIndustrialMetalsTotalReturnSubindex15157AdditionalIndexMember
2021-12-31
0001597934
aberdeen:C000229118Member
2022-01-31
0001597934
aberdeen:AberdeenIndexSP500Index15157BroadBasedIndexMember
2022-01-31
0001597934
aberdeen:AberdeenIndexBCOM15157AdditionalIndexMember
2022-01-31
0001597934
aberdeen:ABERDEENINDEXBloombergIndustrialMetalsTotalReturnSubindex15157AdditionalIndexMember
2022-01-31
0001597934
aberdeen:C000229118Member
2022-02-28
0001597934
aberdeen:AberdeenIndexSP500Index15157BroadBasedIndexMember
2022-02-28
0001597934
aberdeen:AberdeenIndexBCOM15157AdditionalIndexMember
2022-02-28
0001597934
aberdeen:ABERDEENINDEXBloombergIndustrialMetalsTotalReturnSubindex15157AdditionalIndexMember
2022-02-28
0001597934
aberdeen:C000229118Member
2022-03-31
0001597934
aberdeen:AberdeenIndexSP500Index15157BroadBasedIndexMember
2022-03-31
0001597934
aberdeen:AberdeenIndexBCOM15157AdditionalIndexMember
2022-03-31
0001597934
aberdeen:ABERDEENINDEXBloombergIndustrialMetalsTotalReturnSubindex15157AdditionalIndexMember
2022-03-31
0001597934
aberdeen:C000229118Member
2022-04-30
0001597934
aberdeen:AberdeenIndexSP500Index15157BroadBasedIndexMember
2022-04-30
0001597934
aberdeen:AberdeenIndexBCOM15157AdditionalIndexMember
2022-04-30
0001597934
aberdeen:ABERDEENINDEXBloombergIndustrialMetalsTotalReturnSubindex15157AdditionalIndexMember
2022-04-30
0001597934
aberdeen:C000229118Member
2022-05-31
0001597934
aberdeen:AberdeenIndexSP500Index15157BroadBasedIndexMember
2022-05-31
0001597934
aberdeen:AberdeenIndexBCOM15157AdditionalIndexMember
2022-05-31
0001597934
aberdeen:ABERDEENINDEXBloombergIndustrialMetalsTotalReturnSubindex15157AdditionalIndexMember
2022-05-31
0001597934
aberdeen:C000229118Member
2022-06-30
0001597934
aberdeen:AberdeenIndexSP500Index15157BroadBasedIndexMember
2022-06-30
0001597934
aberdeen:AberdeenIndexBCOM15157AdditionalIndexMember
2022-06-30
0001597934
aberdeen:ABERDEENINDEXBloombergIndustrialMetalsTotalReturnSubindex15157AdditionalIndexMember
2022-06-30
0001597934
aberdeen:C000229118Member
2022-07-31
0001597934
aberdeen:AberdeenIndexSP500Index15157BroadBasedIndexMember
2022-07-31
0001597934
aberdeen:AberdeenIndexBCOM15157AdditionalIndexMember
2022-07-31
0001597934
aberdeen:ABERDEENINDEXBloombergIndustrialMetalsTotalReturnSubindex15157AdditionalIndexMember
2022-07-31
0001597934
aberdeen:C000229118Member
2022-08-31
0001597934
aberdeen:AberdeenIndexSP500Index15157BroadBasedIndexMember
2022-08-31
0001597934
aberdeen:AberdeenIndexBCOM15157AdditionalIndexMember
2022-08-31
0001597934
aberdeen:ABERDEENINDEXBloombergIndustrialMetalsTotalReturnSubindex15157AdditionalIndexMember
2022-08-31
0001597934
aberdeen:C000229118Member
2022-09-30
0001597934
aberdeen:AberdeenIndexSP500Index15157BroadBasedIndexMember
2022-09-30
0001597934
aberdeen:AberdeenIndexBCOM15157AdditionalIndexMember
2022-09-30
0001597934
aberdeen:ABERDEENINDEXBloombergIndustrialMetalsTotalReturnSubindex15157AdditionalIndexMember
2022-09-30
0001597934
aberdeen:C000229118Member
2022-10-31
0001597934
aberdeen:AberdeenIndexSP500Index15157BroadBasedIndexMember
2022-10-31
0001597934
aberdeen:AberdeenIndexBCOM15157AdditionalIndexMember
2022-10-31
0001597934
aberdeen:ABERDEENINDEXBloombergIndustrialMetalsTotalReturnSubindex15157AdditionalIndexMember
2022-10-31
0001597934
aberdeen:C000229118Member
2022-11-30
0001597934
aberdeen:AberdeenIndexSP500Index15157BroadBasedIndexMember
2022-11-30
0001597934
aberdeen:AberdeenIndexBCOM15157AdditionalIndexMember
2022-11-30
0001597934
aberdeen:ABERDEENINDEXBloombergIndustrialMetalsTotalReturnSubindex15157AdditionalIndexMember
2022-11-30
0001597934
aberdeen:C000229118Member
2022-12-31
0001597934
aberdeen:AberdeenIndexSP500Index15157BroadBasedIndexMember
2022-12-31
0001597934
aberdeen:AberdeenIndexBCOM15157AdditionalIndexMember
2022-12-31
0001597934
aberdeen:ABERDEENINDEXBloombergIndustrialMetalsTotalReturnSubindex15157AdditionalIndexMember
2022-12-31
0001597934
aberdeen:C000229118Member
2023-01-31
0001597934
aberdeen:AberdeenIndexSP500Index15157BroadBasedIndexMember
2023-01-31
0001597934
aberdeen:AberdeenIndexBCOM15157AdditionalIndexMember
2023-01-31
0001597934
aberdeen:ABERDEENINDEXBloombergIndustrialMetalsTotalReturnSubindex15157AdditionalIndexMember
2023-01-31
0001597934
aberdeen:C000229118Member
2023-02-28
0001597934
aberdeen:AberdeenIndexSP500Index15157BroadBasedIndexMember
2023-02-28
0001597934
aberdeen:AberdeenIndexBCOM15157AdditionalIndexMember
2023-02-28
0001597934
aberdeen:ABERDEENINDEXBloombergIndustrialMetalsTotalReturnSubindex15157AdditionalIndexMember
2023-02-28
0001597934
aberdeen:C000229118Member
2023-03-31
0001597934
aberdeen:AberdeenIndexSP500Index15157BroadBasedIndexMember
2023-03-31
0001597934
aberdeen:AberdeenIndexBCOM15157AdditionalIndexMember
2023-03-31
0001597934
aberdeen:ABERDEENINDEXBloombergIndustrialMetalsTotalReturnSubindex15157AdditionalIndexMember
2023-03-31
0001597934
aberdeen:C000229118Member
2023-04-30
0001597934
aberdeen:AberdeenIndexSP500Index15157BroadBasedIndexMember
2023-04-30
0001597934
aberdeen:AberdeenIndexBCOM15157AdditionalIndexMember
2023-04-30
0001597934
aberdeen:ABERDEENINDEXBloombergIndustrialMetalsTotalReturnSubindex15157AdditionalIndexMember
2023-04-30
0001597934
aberdeen:C000229118Member
2023-05-31
0001597934
aberdeen:AberdeenIndexSP500Index15157BroadBasedIndexMember
2023-05-31
0001597934
aberdeen:AberdeenIndexBCOM15157AdditionalIndexMember
2023-05-31
0001597934
aberdeen:ABERDEENINDEXBloombergIndustrialMetalsTotalReturnSubindex15157AdditionalIndexMember
2023-05-31
0001597934
aberdeen:C000229118Member
2023-06-30
0001597934
aberdeen:AberdeenIndexSP500Index15157BroadBasedIndexMember
2023-06-30
0001597934
aberdeen:AberdeenIndexBCOM15157AdditionalIndexMember
2023-06-30
0001597934
aberdeen:ABERDEENINDEXBloombergIndustrialMetalsTotalReturnSubindex15157AdditionalIndexMember
2023-06-30
0001597934
aberdeen:C000229118Member
2023-07-31
0001597934
aberdeen:AberdeenIndexSP500Index15157BroadBasedIndexMember
2023-07-31
0001597934
aberdeen:AberdeenIndexBCOM15157AdditionalIndexMember
2023-07-31
0001597934
aberdeen:ABERDEENINDEXBloombergIndustrialMetalsTotalReturnSubindex15157AdditionalIndexMember
2023-07-31
0001597934
aberdeen:C000229118Member
2023-08-31
0001597934
aberdeen:AberdeenIndexSP500Index15157BroadBasedIndexMember
2023-08-31
0001597934
aberdeen:AberdeenIndexBCOM15157AdditionalIndexMember
2023-08-31
0001597934
aberdeen:ABERDEENINDEXBloombergIndustrialMetalsTotalReturnSubindex15157AdditionalIndexMember
2023-08-31
0001597934
aberdeen:C000229118Member
2023-09-30
0001597934
aberdeen:AberdeenIndexSP500Index15157BroadBasedIndexMember
2023-09-30
0001597934
aberdeen:AberdeenIndexBCOM15157AdditionalIndexMember
2023-09-30
0001597934
aberdeen:ABERDEENINDEXBloombergIndustrialMetalsTotalReturnSubindex15157AdditionalIndexMember
2023-09-30
0001597934
aberdeen:C000229118Member
2023-10-31
0001597934
aberdeen:AberdeenIndexSP500Index15157BroadBasedIndexMember
2023-10-31
0001597934
aberdeen:AberdeenIndexBCOM15157AdditionalIndexMember
2023-10-31
0001597934
aberdeen:ABERDEENINDEXBloombergIndustrialMetalsTotalReturnSubindex15157AdditionalIndexMember
2023-10-31
0001597934
aberdeen:C000229118Member
2023-11-30
0001597934
aberdeen:AberdeenIndexSP500Index15157BroadBasedIndexMember
2023-11-30
0001597934
aberdeen:AberdeenIndexBCOM15157AdditionalIndexMember
2023-11-30
0001597934
aberdeen:ABERDEENINDEXBloombergIndustrialMetalsTotalReturnSubindex15157AdditionalIndexMember
2023-11-30
0001597934
aberdeen:C000229118Member
2023-12-31
0001597934
aberdeen:AberdeenIndexSP500Index15157BroadBasedIndexMember
2023-12-31
0001597934
aberdeen:AberdeenIndexBCOM15157AdditionalIndexMember
2023-12-31
0001597934
aberdeen:ABERDEENINDEXBloombergIndustrialMetalsTotalReturnSubindex15157AdditionalIndexMember
2023-12-31
0001597934
aberdeen:C000229118Member
2024-01-31
0001597934
aberdeen:AberdeenIndexSP500Index15157BroadBasedIndexMember
2024-01-31
0001597934
aberdeen:AberdeenIndexBCOM15157AdditionalIndexMember
2024-01-31
0001597934
aberdeen:ABERDEENINDEXBloombergIndustrialMetalsTotalReturnSubindex15157AdditionalIndexMember
2024-01-31
0001597934
aberdeen:C000229118Member
2024-02-29
0001597934
aberdeen:AberdeenIndexSP500Index15157BroadBasedIndexMember
2024-02-29
0001597934
aberdeen:AberdeenIndexBCOM15157AdditionalIndexMember
2024-02-29
0001597934
aberdeen:ABERDEENINDEXBloombergIndustrialMetalsTotalReturnSubindex15157AdditionalIndexMember
2024-02-29
0001597934
aberdeen:C000229118Member
2024-03-31
0001597934
aberdeen:AberdeenIndexSP500Index15157BroadBasedIndexMember
2024-03-31
0001597934
aberdeen:AberdeenIndexBCOM15157AdditionalIndexMember
2024-03-31
0001597934
aberdeen:ABERDEENINDEXBloombergIndustrialMetalsTotalReturnSubindex15157AdditionalIndexMember
2024-03-31
0001597934
aberdeen:C000229118Member
2024-04-30
0001597934
aberdeen:AberdeenIndexSP500Index15157BroadBasedIndexMember
2024-04-30
0001597934
aberdeen:AberdeenIndexBCOM15157AdditionalIndexMember
2024-04-30
0001597934
aberdeen:ABERDEENINDEXBloombergIndustrialMetalsTotalReturnSubindex15157AdditionalIndexMember
2024-04-30
0001597934
aberdeen:C000229118Member
2024-05-31
0001597934
aberdeen:AberdeenIndexSP500Index15157BroadBasedIndexMember
2024-05-31
0001597934
aberdeen:AberdeenIndexBCOM15157AdditionalIndexMember
2024-05-31
0001597934
aberdeen:ABERDEENINDEXBloombergIndustrialMetalsTotalReturnSubindex15157AdditionalIndexMember
2024-05-31
0001597934
aberdeen:C000229118Member
2024-06-30
0001597934
aberdeen:AberdeenIndexSP500Index15157BroadBasedIndexMember
2024-06-30
0001597934
aberdeen:AberdeenIndexBCOM15157AdditionalIndexMember
2024-06-30
0001597934
aberdeen:ABERDEENINDEXBloombergIndustrialMetalsTotalReturnSubindex15157AdditionalIndexMember
2024-06-30
0001597934
aberdeen:C000229118Member
2024-07-31
0001597934
aberdeen:AberdeenIndexSP500Index15157BroadBasedIndexMember
2024-07-31
0001597934
aberdeen:AberdeenIndexBCOM15157AdditionalIndexMember
2024-07-31
0001597934
aberdeen:ABERDEENINDEXBloombergIndustrialMetalsTotalReturnSubindex15157AdditionalIndexMember
2024-07-31
0001597934
aberdeen:C000229118Member
2024-08-31
0001597934
aberdeen:AberdeenIndexSP500Index15157BroadBasedIndexMember
2024-08-31
0001597934
aberdeen:AberdeenIndexBCOM15157AdditionalIndexMember
2024-08-31
0001597934
aberdeen:ABERDEENINDEXBloombergIndustrialMetalsTotalReturnSubindex15157AdditionalIndexMember
2024-08-31
0001597934
aberdeen:C000229118Member
2024-09-30
0001597934
aberdeen:AberdeenIndexSP500Index15157BroadBasedIndexMember
2024-09-30
0001597934
aberdeen:AberdeenIndexBCOM15157AdditionalIndexMember
2024-09-30
0001597934
aberdeen:ABERDEENINDEXBloombergIndustrialMetalsTotalReturnSubindex15157AdditionalIndexMember
2024-09-30
0001597934
aberdeen:C000229118Member
2024-10-31
0001597934
aberdeen:AberdeenIndexSP500Index15157BroadBasedIndexMember
2024-10-31
0001597934
aberdeen:AberdeenIndexBCOM15157AdditionalIndexMember
2024-10-31
0001597934
aberdeen:ABERDEENINDEXBloombergIndustrialMetalsTotalReturnSubindex15157AdditionalIndexMember
2024-10-31
0001597934
aberdeen:C000229118Member
2024-11-30
0001597934
aberdeen:AberdeenIndexSP500Index15157BroadBasedIndexMember
2024-11-30
0001597934
aberdeen:AberdeenIndexBCOM15157AdditionalIndexMember
2024-11-30
0001597934
aberdeen:ABERDEENINDEXBloombergIndustrialMetalsTotalReturnSubindex15157AdditionalIndexMember
2024-11-30
0001597934
aberdeen:C000229118Member
2024-12-31
0001597934
aberdeen:AberdeenIndexSP500Index15157BroadBasedIndexMember
2024-12-31
0001597934
aberdeen:AberdeenIndexBCOM15157AdditionalIndexMember
2024-12-31
0001597934
aberdeen:ABERDEENINDEXBloombergIndustrialMetalsTotalReturnSubindex15157AdditionalIndexMember
2024-12-31
0001597934
aberdeen:C000229118Member
oef:WithoutSalesLoadMember
2024-01-01
2024-12-31
0001597934
aberdeen:C000229118Member
oef:WithoutSalesLoadMember
2021-09-23
2024-12-31
0001597934
aberdeen:AberdeenIndexSP500Index15157BroadBasedIndexMember
2021-09-23
2024-12-31
0001597934
aberdeen:AberdeenIndexBCOM15157AdditionalIndexMember
2021-09-23
2024-12-31
0001597934
aberdeen:ABERDEENINDEXBloombergIndustrialMetalsTotalReturnSubindex15157AdditionalIndexMember
2021-09-23
2024-12-31
0001597934
aberdeen:C000229118Member
aberdeen:SectorCopperSectorMember
2024-12-31
0001597934
aberdeen:C000229118Member
aberdeen:SectorAluminumSectorMember
2024-12-31
0001597934
aberdeen:C000229118Member
aberdeen:SectorZincSectorMember
2024-12-31
0001597934
aberdeen:C000229118Member
aberdeen:SectorNickelSectorMember
2024-12-31
0001597934
aberdeen:C000229118Member
aberdeen:SectorLeadSectorMember
2024-12-31
0001597934
aberdeen:C000229118Member
aberdeen:FRTSRTop10COPPERCTIMember
2024-12-31
0001597934
aberdeen:C000229118Member
aberdeen:FRTSRTOP10PRIALUMCTIMember
2024-12-31
0001597934
aberdeen:C000229118Member
aberdeen:FRTSRTOP10ZINCCTIMember
2024-12-31
0001597934
aberdeen:C000229118Member
aberdeen:FRTSRTOP10NICKELCTIMember
2024-12-31
0001597934
aberdeen:C000229118Member
aberdeen:FRTSRTOP10LEADCTIMember
2024-12-31
iso4217:USD
xbrli:shares
iso4217:USD
xbrli:shares
xbrli:pure
utr:D
aberdeen:Holding
UNITED STATES
SECURITIES AND EXCHANGE COMMISSION
Washington, D.C. 20549
FORM N-CSR
CERTIFIED SHAREHOLDER REPORT OF REGISTERED
MANAGEMENT INVESTMENT COMPANIES
Investment Company Act file number: 811-22986
abrdn ETFs
(Exact name of registrant as specified in charter)
1900 Market Street, Suite 200
Philadelphia, PA 19103
(Address of principal executive offices) (Zip code)
The Corporation Service Company
251 Little Falls Drive
Wilmington, Delaware 19808
(Name and Address of Agent for Service)
Registrant’s telephone number, including area code: (844) 383-7289
Date of fiscal year end: December 31
Date of reporting period: December 31, 2024
Item 1. Reports to Stockholders.
|
(a) |
The following is a copy of the report transmitted to shareholders pursuant to Rule 30e-1 under the Investment Company Act of 1940 (17 CFR 270.30e-1). |
abrdn Bloomberg All Commodity Longer Dated Strategy K-1 Free ETF (BCD)
Principal Listing Exchange: NYSE Arca
Annual Shareholder Report - December 31, 2024
This annual shareholder report contains important information about the abrdn Bloomberg All Commodity Longer Dated Strategy K-1 Free ETF (the "Fund") for the period of January 1, 2024 to December 31, 2024. You can find additional information about the Fund at https://www.abrdn.com/en-us/us/investor/fund-centre#literature. You can also request this information by contacting us at 844-383-7289.
What were the Fund costs for the last year?
(based on a hypothetical $10,000 investment)
Fund Name |
Costs of a $10,000 investment |
Costs paid as a percentage of a $10,000 investment |
abrdn Bloomberg All Commodity Longer Dated Strategy K-1 Free ETF |
$31 |
0.30% |
How did the Fund perform last year and what affected its performance?
The abrdn Bloomberg All Commodity Longer Dated Strategy K-1 Free ETF (the “Fund”) seeks to provide investment results that closely correspond, before fees and expenses, to the performance of the Bloomberg Commodity Index 3 Month Forward Total ReturnSM (the “Index”). The Index is a three-month forward version of the Bloomberg Commodity Index Total ReturnSM (“BCOMTR”), which reflects the return on a fully collateralized investment in the Bloomberg Commodity IndexSM (“BCOM”). The Fund is called “Longer Dated” because the Index it seeks to track is designed to track commodity futures with a longer maturity than that of the BCOMTR and BCOM. For the fiscal year ended December 31, 2024, on a market price basis, the Fund returned (+6.20%). On a net asset value (“NAV”) basis, the Fund returned (+5.87%). During the same fiscal period, the Index returned (+6.20%). Differences between the return of the Fund and the return of the Index are attributable to, fees and operating expenses incurred by the Fund, slight position differences between the Index and the Fund, and the difference in the return on the collateral invested in U.S. Treasury Bills. While the Fund holds the U.S. Treasury Bills to maturity, the Index calculates the return on cash collateral using a hypothetical treasury bill that is based on the most recent weekly auction high rate for 13-week (3-month) U.S. Treasury Bills.
Over the fiscal period, the Precious Metals, Agricultural Softs and Livestock sectors contributed to performance. The largest contributors to total return were Gold, Coffee, Silver, Live Cattle and Lean Hogs.
Over the fiscal period, the Energy, Agricultural Grains and Industrial Metals sectors detracted from performance. The largest detractors to total return were Soybeans, Natural Gas, Corn, Soybean Meal and Wheat.
abrdn Bloomberg All Commodity Longer Dated Strategy K-1 Free ETF (BCD)
Investment Performance of $10,000
The following graph reflects a hypothetical $10,000 investment for the life of the Fund (Based on Net Asset Value "NAV") as compared to a broad-based securities market index and the Bloomberg Commodity Index 3 Month Forward Total Return, which is the index that the Fund seeks to track. The Fund changed its primary benchmark to the S&P 500 Total Return Index from the Bloomberg Commodity Index Total Return, to comply with a regulatory requirement to compare the performance to a broad based securities market.

|
abrdn Bloomberg All Commodity Longer Dated Strategy K-1 Free ETF (NAV) |
S&P 500 Index Total Return |
Bloomberg Commodity Index Total Return |
Bloomberg Commodity Index 3 Month Forward Total Return |
3/30/17 |
$10,000 |
$10,000 |
$10,000 |
$10,000 |
3/31/17 |
$10,000 |
$10,000 |
$10,000 |
$10,000 |
4/30/17 |
$9,872 |
$10,103 |
$9,849 |
$9,874 |
5/31/17 |
$9,676 |
$10,245 |
$9,719 |
$9,730 |
6/30/17 |
$9,660 |
$10,309 |
$9,700 |
$9,726 |
7/31/17 |
$9,904 |
$10,521 |
$9,919 |
$9,957 |
8/31/17 |
$9,932 |
$10,553 |
$9,959 |
$10,005 |
9/30/17 |
$9,920 |
$10,771 |
$9,944 |
$10,015 |
10/31/17 |
$10,112 |
$11,022 |
$10,158 |
$10,213 |
11/30/17 |
$10,224 |
$11,360 |
$10,111 |
$10,236 |
12/31/17 |
$10,308 |
$11,486 |
$10,413 |
$10,519 |
1/31/18 |
$10,656 |
$12,144 |
$10,619 |
$10,749 |
2/28/18 |
$10,568 |
$11,696 |
$10,436 |
$10,630 |
3/31/18 |
$10,404 |
$11,399 |
$10,371 |
$10,596 |
4/30/18 |
$10,716 |
$11,443 |
$10,639 |
$10,851 |
5/31/18 |
$10,916 |
$11,718 |
$10,790 |
$11,044 |
6/30/18 |
$10,494 |
$11,791 |
$10,412 |
$10,623 |
7/31/18 |
$10,304 |
$12,229 |
$10,190 |
$10,442 |
8/31/18 |
$10,119 |
$12,628 |
$10,010 |
$10,276 |
9/30/18 |
$10,308 |
$12,700 |
$10,202 |
$10,409 |
10/31/18 |
$10,079 |
$11,832 |
$9,982 |
$10,171 |
11/30/18 |
$9,635 |
$12,073 |
$9,925 |
$9,794 |
12/31/18 |
$9,417 |
$10,983 |
$9,242 |
$9,538 |
1/31/19 |
$9,913 |
$11,863 |
$9,745 |
$10,066 |
2/28/19 |
$10,015 |
$12,244 |
$9,844 |
$10,205 |
3/31/19 |
$9,991 |
$12,482 |
$9,826 |
$10,172 |
4/30/19 |
$9,931 |
$12,987 |
$9,785 |
$10,105 |
5/31/19 |
$9,567 |
$12,162 |
$9,455 |
$9,760 |
6/30/19 |
$9,790 |
$13,019 |
$9,709 |
$10,009 |
7/31/19 |
$9,683 |
$13,206 |
$9,644 |
$9,944 |
8/31/19 |
$9,439 |
$12,997 |
$9,420 |
$9,688 |
9/30/19 |
$9,594 |
$13,240 |
$9,531 |
$9,807 |
10/31/19 |
$9,779 |
$13,527 |
$9,724 |
$9,999 |
11/30/19 |
$9,612 |
$14,018 |
$9,475 |
$9,819 |
12/31/19 |
$10,108 |
$14,441 |
$9,952 |
$10,341 |
1/31/20 |
$9,449 |
$14,435 |
$9,220 |
$9,665 |
2/29/20 |
$8,987 |
$13,247 |
$8,756 |
$9,193 |
3/31/20 |
$8,049 |
$11,611 |
$7,634 |
$8,303 |
4/30/20 |
$8,072 |
$13,099 |
$7,517 |
$8,320 |
5/31/20 |
$8,417 |
$13,723 |
$7,843 |
$8,592 |
6/30/20 |
$8,662 |
$13,996 |
$8,022 |
$8,849 |
7/31/20 |
$9,239 |
$14,785 |
$8,480 |
$9,394 |
8/31/20 |
$9,779 |
$15,848 |
$9,053 |
$9,942 |
9/30/20 |
$9,573 |
$15,246 |
$8,750 |
$9,695 |
10/31/20 |
$9,580 |
$14,840 |
$8,873 |
$9,730 |
11/30/20 |
$10,034 |
$16,465 |
$9,185 |
$10,136 |
12/31/20 |
$10,590 |
$17,098 |
$9,642 |
$10,701 |
1/31/21 |
$10,820 |
$16,925 |
$9,895 |
$10,975 |
2/28/21 |
$11,477 |
$17,392 |
$10,535 |
$11,633 |
3/31/21 |
$11,268 |
$18,154 |
$10,309 |
$11,424 |
4/30/21 |
$12,147 |
$19,122 |
$11,163 |
$12,318 |
5/31/21 |
$12,582 |
$19,256 |
$11,468 |
$12,757 |
6/30/21 |
$12,933 |
$19,706 |
$11,680 |
$13,080 |
7/31/21 |
$13,176 |
$20,174 |
$11,895 |
$13,351 |
8/31/21 |
$13,117 |
$20,787 |
$11,860 |
$13,371 |
9/30/21 |
$13,763 |
$19,820 |
$12,450 |
$13,995 |
10/31/21 |
$14,134 |
$21,209 |
$12,772 |
$14,346 |
11/30/21 |
$13,414 |
$21,062 |
$11,838 |
$13,609 |
12/31/21 |
$13,951 |
$22,006 |
$12,255 |
$14,244 |
1/31/22 |
$15,031 |
$20,867 |
$13,331 |
$15,282 |
2/28/22 |
$15,880 |
$20,242 |
$14,162 |
$16,186 |
3/31/22 |
$17,291 |
$20,994 |
$15,386 |
$17,676 |
4/30/22 |
$18,017 |
$19,163 |
$16,023 |
$18,471 |
5/31/22 |
$18,398 |
$19,198 |
$16,268 |
$18,789 |
6/30/22 |
$16,383 |
$17,614 |
$14,515 |
$16,750 |
7/31/22 |
$17,014 |
$19,238 |
$15,134 |
$17,500 |
8/31/22 |
$17,078 |
$18,453 |
$15,147 |
$17,561 |
9/30/22 |
$15,766 |
$16,754 |
$13,919 |
$16,227 |
10/31/22 |
$16,011 |
$18,110 |
$14,196 |
$16,547 |
11/30/22 |
$16,706 |
$19,122 |
$14,585 |
$17,153 |
12/31/22 |
$16,522 |
$18,020 |
$14,228 |
$17,026 |
1/31/23 |
$16,593 |
$19,153 |
$14,158 |
$17,094 |
2/28/23 |
$15,867 |
$18,685 |
$13,493 |
$16,371 |
3/31/23 |
$15,829 |
$19,371 |
$13,465 |
$16,346 |
4/30/23 |
$15,667 |
$19,674 |
$13,364 |
$16,200 |
5/31/23 |
$14,764 |
$19,759 |
$12,610 |
$15,305 |
6/30/23 |
$15,237 |
$21,065 |
$13,120 |
$15,796 |
7/31/23 |
$16,168 |
$21,742 |
$13,941 |
$16,704 |
8/31/23 |
$16,039 |
$21,395 |
$13,834 |
$16,591 |
9/30/23 |
$15,800 |
$20,375 |
$13,738 |
$16,356 |
10/31/23 |
$15,901 |
$19,947 |
$13,774 |
$16,451 |
11/30/23 |
$15,619 |
$21,769 |
$13,464 |
$16,222 |
12/31/23 |
$15,268 |
$22,757 |
$13,102 |
$15,855 |
1/31/24 |
$15,293 |
$23,140 |
$13,154 |
$15,869 |
2/29/24 |
$15,128 |
$24,375 |
$12,960 |
$15,695 |
3/31/24 |
$15,747 |
$25,160 |
$13,389 |
$16,330 |
4/30/24 |
$16,166 |
$24,132 |
$13,750 |
$16,813 |
5/31/24 |
$16,491 |
$25,329 |
$13,991 |
$17,141 |
6/30/24 |
$16,181 |
$26,238 |
$13,776 |
$16,808 |
7/31/24 |
$15,687 |
$26,557 |
$13,220 |
$16,257 |
8/31/24 |
$15,615 |
$27,201 |
$13,226 |
$16,225 |
9/30/24 |
$16,311 |
$27,782 |
$13,869 |
$16,957 |
10/31/24 |
$16,131 |
$27,530 |
$13,612 |
$16,694 |
11/30/24 |
$16,092 |
$29,146 |
$13,667 |
$16,710 |
12/31/24 |
$16,215 |
$28,451 |
$13,807 |
$16,838 |
Average Annual Total Returns for the Periods Ended December 31, 2024 (%)
AATR |
1 Year |
5 Years |
Since Inception (3/30/17) |
abrdn Bloomberg All Commodity Longer Dated Strategy K-1 Free ETF (NAV) |
5.87% |
9.89% |
6.42% |
S&P 500 Index Total Return |
25.02% |
14.53% |
14.39% |
Bloomberg Commodity Index Total Return |
5.38% |
6.77% |
4.24% |
Bloomberg Commodity Index 3 Month Forward Total Return |
6.20% |
10.24% |
6.95% |
THE FUND'S PAST PERFORMANCE IS NOT A GOOD PREDICTOR OF THE FUND'S FUTURE PERFORMANCE.
Fund performance data shown above does not reflect the deduction of taxes that a shareholder would pay on Fund distributions or sale of Fund shares.
Key Fund Statistics as of December 31, 2024
Total Net Assets |
$233,205,164 |
Total Number of Portfolio Holdings |
66 |
Portfolio Turnover RateFootnote Reference* |
0% |
Total Advisory Fees Paid |
$640,218 |
| Footnote |
Description |
|
Footnote* |
Derivative instruments and instruments with a maturity of one year or less at the time of acquisition are excluded from the calculation of the portfolio turnover rate. If these instruments were included in the calculation, the Fund would have a higher portfolio turnover rate. In-Kind transactions are not included in the portfolio turnover. |
abrdn Bloomberg All Commodity Longer Dated Strategy K-1 Free ETF (BCD)
What did the Fund invest in?
The tables below show the investment makeup of the Fund as of December 31, 2024. The percentages indicated are based on the notional value of futures contracts held by the Fund.
Sector AllocationFootnote Reference* (%)
Value |
Value |
Energy |
28.4% |
Agriculture |
27.5% |
Metals - Precious |
22.9% |
Metals - Industrial |
15.3% |
Livestock |
5.9% |
| Footnote |
Description |
|
Footnote* |
Short-term investments held have been excluded. |
Top Ten Fund Holdings* (%)
Gold 100 oz. future |
17.6% |
Natural gas future |
9.0% |
Brent crude future |
6.6% |
WTI crude future |
6.5% |
Copper future |
5.3% |
Corn future |
5.3% |
Silver future |
5.3% |
Coffee 'C' future |
4.8% |
Soybean future |
4.5% |
PRI Aluminum future |
4.3% |
Availability of Additional Information
You can find additional information, including the Fund's prospectus, financial information, fund holdings, and proxy voting information at https://www.abrdn.com/en-us/us/investor/fund-centre#literature or call 844-383-7289. The QR code can be used to access the Fund's prospectus, financial information and holdings.
ALPS Distributors, Inc. is the distributor for the abrdn ETFs. ALPS is not affiliated with abrdn.
“Bloomberg®” and the indices and subindices of the “Bloomberg Commodity IndexSM” family, including the “Bloomberg Commodity Index Total ReturnSM”, are service marks of Bloomberg Finance L.P. and its affiliates, including Bloomberg Index Services Limited, the administrator of the indices, (collectively, “Bloomberg”) and have been licensed for use for certain purposes by the Fund's adviser or its affiliates. Bloomberg is not affiliated with the Fund's adviser or its affiliates, and Bloomberg does not approve, endorse, review, or recommend the Fund. Bloomberg does not guarantee the timeliness, accurateness, or completeness of any data or information relating to the indices or subindices of the Bloomberg Commodity Index.
abrdn Bloomberg All Commodity Longer Dated Strategy K-1 Free ETF (BCD)
abrdn Bloomberg All Commodity Strategy K-1 Free ETF (BCI)
Principal Listing Exchange: NYSE Arca
Annual Shareholder Report - December 31, 2024
This annual shareholder report contains important information about the abrdn Bloomberg All Commodity Strategy K-1 Free ETF (the "Fund") for the period of January 1, 2024 to December 31, 2024. You can find additional information about the Fund at https://www.abrdn.com/en-us/us/investor/fund-centre#literature. You can also request this information by contacting us at 844-383-7289.
What were the Fund costs for the last year?
(based on a hypothetical $10,000 investment)
Fund Name |
Costs of a $10,000 investment |
Costs paid as a percentage of a $10,000 investment |
abrdn Bloomberg All Commodity Strategy K-1 Free ETF |
$27 |
0.26% |
How did the Fund perform last year and what affected its performance?
The abrdn Bloomberg All Commodity Strategy K-1 Free ETF (the “Fund”) seeks to provide investment results that closely correspond, before fees and expenses, to the performance of the Bloomberg Commodity Index Total ReturnSM (the “Index”). The Index reflects the return on a fully collateralized investment in the Bloomberg Commodity IndexSM (“BCOM”), which is composed of futures contracts on physical commodities and is designed to be a highly liquid and broad-based benchmark for commodities futures investments. For the fiscal year ended December 31, 2024, on a market price basis, the Fund returned (+5.47%). On a net asset value (“NAV”) basis, the Fund returned (+5.08%). During the same fiscal period, the Index returned (+5.38%). Differences between the return of the Fund and the return of the Index are attributable to, fees and operating expenses incurred by the Fund, slight position differences between the Index and the Fund, and the difference in the return on the collateral invested in U.S. Treasury Bills. While the Fund holds the U.S. Treasury Bills to maturity, the Index calculates the return on cash collateral using a hypothetical treasury bill that is based on the most recent weekly auction high rate for 13-week (3-month) U.S. Treasury Bills.
Over the fiscal period, the Precious Metals, Agricultural Softs and Livestock sectors contributed to performance. The largest contributors to total return were Gold, Coffee, Silver, Live Cattle and Lean Hogs.
Over the fiscal period, the Energy, Agricultural Grains and Industrial Metals sectors detracted from performance. The largest detractors to total return were Natural Gas, Soybeans, Wheat, Corn and Soybean Oil.
abrdn Bloomberg All Commodity Strategy K-1 Free ETF (BCI)
Investment Performance of $10,000
The following graph reflects a hypothetical $10,000 investment for the life of the Fund (Based on Net Asset Value "NAV") as compared to a broad-based securities market index and the Bloomberg Commodity Index Total Return, which is the index that the Fund seeks to track. The Fund changed its primary benchmark to the S&P 500 Total Return Index from the Bloomberg Commodity Index Total Return, to comply with a regulatory requirement to compare the performance to a broad based securities market.
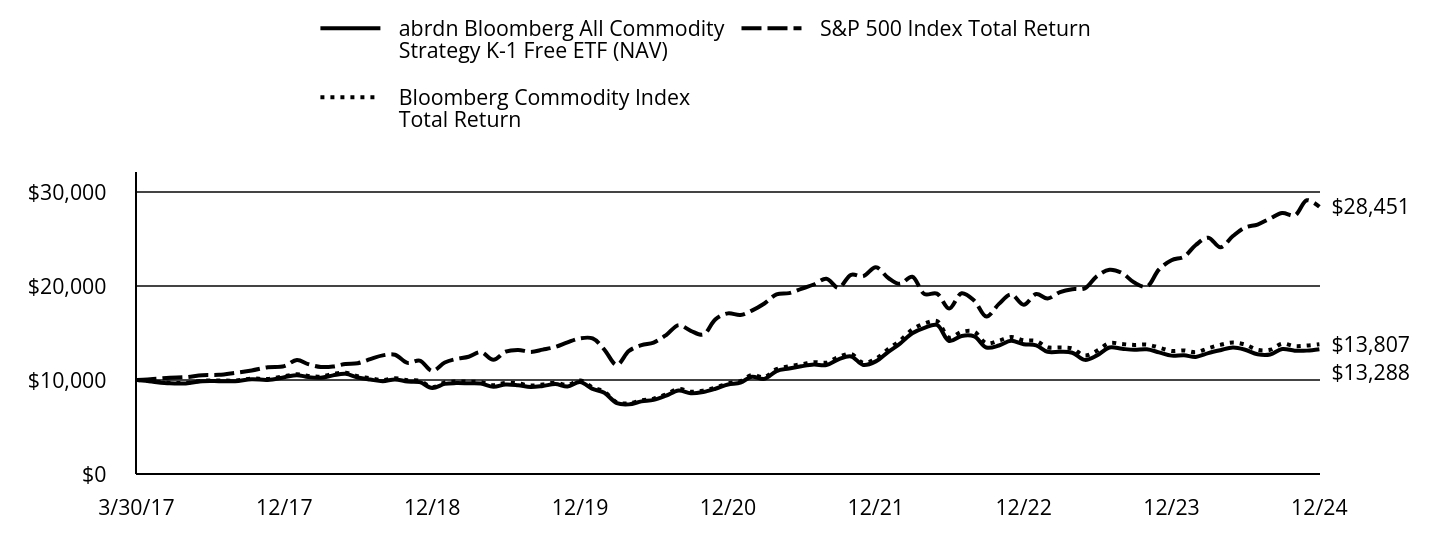
|
abrdn Bloomberg All Commodity Strategy K-1 Free ETF (NAV) |
S&P 500 Index Total Return |
Bloomberg Commodity Index Total Return |
3/30/17 |
$10,000 |
$10,000 |
$10,000 |
3/31/17 |
$10,012 |
$10,000 |
$10,000 |
4/30/17 |
$9,816 |
$10,103 |
$9,849 |
5/31/17 |
$9,652 |
$10,245 |
$9,719 |
6/30/17 |
$9,644 |
$10,309 |
$9,700 |
7/31/17 |
$9,872 |
$10,521 |
$9,919 |
8/31/17 |
$9,884 |
$10,553 |
$9,959 |
9/30/17 |
$9,872 |
$10,771 |
$9,944 |
10/31/17 |
$10,082 |
$11,022 |
$10,158 |
11/30/17 |
$10,016 |
$11,360 |
$10,111 |
12/31/17 |
$10,305 |
$11,486 |
$10,413 |
1/31/18 |
$10,524 |
$12,144 |
$10,619 |
2/28/18 |
$10,313 |
$11,696 |
$10,436 |
3/31/18 |
$10,246 |
$11,399 |
$10,371 |
4/30/18 |
$10,498 |
$11,443 |
$10,639 |
5/31/18 |
$10,663 |
$11,718 |
$10,790 |
6/30/18 |
$10,275 |
$11,791 |
$10,412 |
7/31/18 |
$10,052 |
$12,229 |
$10,190 |
8/31/18 |
$9,882 |
$12,628 |
$10,010 |
9/30/18 |
$10,069 |
$12,700 |
$10,202 |
10/31/18 |
$9,842 |
$11,832 |
$9,982 |
11/30/18 |
$9,774 |
$12,073 |
$9,925 |
12/31/18 |
$9,151 |
$10,983 |
$9,242 |
1/31/19 |
$9,597 |
$11,863 |
$9,745 |
2/28/19 |
$9,678 |
$12,244 |
$9,844 |
3/31/19 |
$9,657 |
$12,482 |
$9,826 |
4/30/19 |
$9,627 |
$12,987 |
$9,785 |
5/31/19 |
$9,278 |
$12,162 |
$9,455 |
6/30/19 |
$9,525 |
$13,019 |
$9,709 |
7/31/19 |
$9,444 |
$13,206 |
$9,644 |
8/31/19 |
$9,266 |
$12,997 |
$9,420 |
9/30/19 |
$9,376 |
$13,240 |
$9,531 |
10/31/19 |
$9,568 |
$13,527 |
$9,724 |
11/30/19 |
$9,322 |
$14,018 |
$9,475 |
12/31/19 |
$9,796 |
$14,441 |
$9,952 |
1/31/20 |
$9,060 |
$14,435 |
$9,220 |
2/29/20 |
$8,643 |
$13,247 |
$8,756 |
3/31/20 |
$7,537 |
$11,611 |
$7,634 |
4/30/20 |
$7,412 |
$13,099 |
$7,517 |
5/31/20 |
$7,730 |
$13,723 |
$7,843 |
6/30/20 |
$7,892 |
$13,996 |
$8,022 |
7/31/20 |
$8,345 |
$14,785 |
$8,480 |
8/31/20 |
$8,898 |
$15,848 |
$9,053 |
9/30/20 |
$8,600 |
$15,246 |
$8,750 |
10/31/20 |
$8,738 |
$14,840 |
$8,873 |
11/30/20 |
$9,079 |
$16,465 |
$9,185 |
12/31/20 |
$9,525 |
$17,098 |
$9,642 |
1/31/21 |
$9,734 |
$16,925 |
$9,895 |
2/28/21 |
$10,348 |
$17,392 |
$10,535 |
3/31/21 |
$10,126 |
$18,154 |
$10,309 |
4/30/21 |
$10,961 |
$19,122 |
$11,163 |
5/31/21 |
$11,239 |
$19,256 |
$11,468 |
6/30/21 |
$11,470 |
$19,706 |
$11,680 |
7/31/21 |
$11,644 |
$20,174 |
$11,895 |
8/31/21 |
$11,596 |
$20,787 |
$11,860 |
9/30/21 |
$12,209 |
$19,820 |
$12,450 |
10/31/21 |
$12,514 |
$21,209 |
$12,772 |
11/30/21 |
$11,609 |
$21,062 |
$11,838 |
12/31/21 |
$11,988 |
$22,006 |
$12,255 |
1/31/22 |
$13,010 |
$20,867 |
$13,331 |
2/28/22 |
$13,849 |
$20,242 |
$14,162 |
3/31/22 |
$14,976 |
$20,994 |
$15,386 |
4/30/22 |
$15,560 |
$19,163 |
$16,023 |
5/31/22 |
$15,862 |
$19,198 |
$16,268 |
6/30/22 |
$14,162 |
$17,614 |
$14,515 |
7/31/22 |
$14,699 |
$19,238 |
$15,134 |
8/31/22 |
$14,647 |
$18,453 |
$15,147 |
9/30/22 |
$13,469 |
$16,754 |
$13,919 |
10/31/22 |
$13,677 |
$18,110 |
$14,196 |
11/30/22 |
$14,173 |
$19,122 |
$14,585 |
12/31/22 |
$13,814 |
$18,020 |
$14,228 |
1/31/23 |
$13,695 |
$19,153 |
$14,158 |
2/28/23 |
$13,013 |
$18,685 |
$13,493 |
3/31/23 |
$13,007 |
$19,371 |
$13,465 |
4/30/23 |
$12,906 |
$19,674 |
$13,364 |
5/31/23 |
$12,149 |
$19,759 |
$12,610 |
6/30/23 |
$12,625 |
$21,065 |
$13,120 |
7/31/23 |
$13,464 |
$21,742 |
$13,941 |
8/31/23 |
$13,326 |
$21,395 |
$13,834 |
9/30/23 |
$13,220 |
$20,375 |
$13,738 |
10/31/23 |
$13,270 |
$19,947 |
$13,774 |
11/30/23 |
$12,950 |
$21,769 |
$13,464 |
12/31/23 |
$12,600 |
$22,757 |
$13,102 |
1/31/24 |
$12,645 |
$23,140 |
$13,154 |
2/29/24 |
$12,463 |
$24,375 |
$12,960 |
3/31/24 |
$12,866 |
$25,160 |
$13,389 |
4/30/24 |
$13,179 |
$24,132 |
$13,749 |
5/31/24 |
$13,465 |
$25,329 |
$13,991 |
6/30/24 |
$13,231 |
$26,238 |
$13,776 |
7/31/24 |
$12,743 |
$26,557 |
$13,220 |
8/31/24 |
$12,717 |
$27,201 |
$13,226 |
9/30/24 |
$13,302 |
$27,782 |
$13,869 |
10/31/24 |
$13,127 |
$27,530 |
$13,612 |
11/30/24 |
$13,133 |
$29,146 |
$13,667 |
12/31/24 |
$13,288 |
$28,451 |
$13,807 |
Average Annual Total Returns for the Periods Ended December 31, 2024 (%)
AATR |
1 Year |
5 Years |
Since Inception (3/30/17) |
abrdn Bloomberg All Commodity Strategy K-1 Free ETF (NAV) |
5.08% |
6.27% |
3.70% |
S&P 500 Index Total Return |
25.02% |
14.53% |
14.39% |
Bloomberg Commodity Index Total Return |
5.38% |
6.77% |
4.24% |
THE FUND'S PAST PERFORMANCE IS NOT A GOOD PREDICTOR OF THE FUND'S FUTURE PERFORMANCE.
Fund performance data shown above does not reflect the deduction of taxes that a shareholder would pay on Fund distributions or sale of Fund shares.
Key Fund Statistics as of December 31, 2024
Total Net Assets |
$1,267,907,145 |
Total Number of Portfolio Holdings |
58 |
Portfolio Turnover RateFootnote Reference* |
0% |
Total Advisory Fees Paid |
$2,583,221 |
| Footnote |
Description |
|
Footnote* |
Derivative instruments and instruments with a maturity of one year or less at the time of acquisition are excluded from the calculation of the portfolio turnover rate. If these instruments were included in the calculation, the Fund would have a higher portfolio turnover rate. In-Kind transactions are not included in the portfolio turnover. |
abrdn Bloomberg All Commodity Strategy K-1 Free ETF (BCI)
What did the Fund invest in?
The tables below show the investment makeup of the Fund as of December 31, 2024. The percentages indicated are based on the notional value of futures contracts held by the Fund.
Sector AllocationFootnote Reference* (%)
Value |
Value |
Energy |
28.5% |
Agriculture |
27.8% |
Metals - Precious |
22.7% |
Metals - Industrial |
15.4% |
Livestock |
5.6% |
| Footnote |
Description |
|
Footnote* |
Short-term investments held have been excluded. |
Top Ten Fund Holdings* (%)
Gold 100 oz. future |
17.4% |
Natural gas future |
8.9% |
Brent crude future |
6.8% |
WTI crude future |
6.7% |
Copper future |
5.3% |
Silver future |
5.3% |
Corn future |
5.3% |
Coffee 'C' future |
4.9% |
Soybean future |
4.5% |
PRI Aluminum future |
4.4% |
Availability of Additional Information
You can find additional information, including the Fund's prospectus, financial information, fund holdings, and proxy voting information at https://www.abrdn.com/en-us/us/investor/fund-centre#literature or call 844-383-7289. The QR code can be used to access the Fund's prospectus, financial information and holdings.
ALPS Distributors, Inc. is the distributor for the abrdn ETFs. ALPS is not affiliated with abrdn.
“Bloomberg®” and the indices and subindices of the “Bloomberg Commodity IndexSM” family, including the “Bloomberg Commodity Index Total ReturnSM”, are service marks of Bloomberg Finance L.P. and its affiliates, including Bloomberg Index Services Limited, the administrator of the indices, (collectively, “Bloomberg”) and have been licensed for use for certain purposes by the Fund's adviser or its affiliates. Bloomberg is not affiliated with the Fund's adviser or its affiliates, and Bloomberg does not approve, endorse, review, or recommend the Fund. Bloomberg does not guarantee the timeliness, accurateness, or completeness of any data or information relating to the indices or subindices of the Bloomberg Commodity Index.
abrdn Bloomberg All Commodity Strategy K-1 Free ETF (BCI)
abrdn Bloomberg Industrial Metals Strategy K-1 Free ETF (BCIM)
Principal Listing Exchange: NYSE Arca
Annual Shareholder Report - December 31, 2024
This annual shareholder report contains important information about the abrdn Bloomberg Industrial Metals Strategy K-1 Free ETF (the "Fund") for the period of January 1, 2024 to December 31, 2024. You can find additional information about the Fund at https://www.abrdn.com/en-us/us/investor/fund-centre#literature. You can also request this information by contacting us at 844-383-7289.
What were the Fund costs for the last year?
(based on a hypothetical $10,000 investment)
Fund Name |
Costs of a $10,000 investment |
Costs paid as a percentage of a $10,000 investment |
abrdn Bloomberg Industrial Metals Strategy K-1 Free ETF |
$41 |
0.40% |
How did the Fund perform last year and what affected its performance?
The abrdn Bloomberg Industrial Metals Strategy K-1 Free ETF (the “Fund”) seeks to provide investment results that closely correspond, before fees and expenses, to the performance of the Bloomberg Industrial Metals Total Return SubindexSM (the “Index”). The Index reflects the return on a fully collateralized investment in the Bloomberg Industrial Metals SubindexSM (“BCOMIN”), which is composed of futures contracts on certain industrial metals commodity futures contracts. For the fiscal year ended December 31, 2024, on a market price basis, the Fund returned (+3.36%). On a net asset value (“NAV”) basis, the Fund returned (+3.17%). During the same fiscal period, the Index returned (+3.54%). Differences between the return of the Fund and the return of the Index are attributable to, fees and operating expenses incurred by the Fund, slight position differences between the Index and the Fund, and the difference in the return on the collateral invested in U.S. Treasury Bills. While the Fund holds the U.S. Treasury Bills to maturity, the Index calculates the return on cash collateral using a hypothetical treasury bill that is based on the most recent weekly auction high rate for 13-week (3-month) U.S. Treasury Bills.
Over the fiscal period, the largest contributors to total return were Zinc, Copper and Aluminum.
Over the fiscal period, the largest detractors to total return were Nickel and Lead.
abrdn Bloomberg Industrial Metals Strategy K-1 Free ETF (BCIM)
Investment Performance of $10,000
The following graph reflects a hypothetical $10,000 investment for the life of the Fund (Based on Net Asset Value "NAV") as compared to a broad-based securities market index and the Bloomberg Industrial Metals Total Return Subindex, which is the index that the Fund seeks to track. The Fund changed its primary benchmark to the S&P 500 Total Return Index from the Bloomberg Commodity Index Total Return, to comply with a regulatory requirement to compare the performance to a broad based securities market.

|
abrdn Bloomberg Industrial Metals Strategy K-1 Free ETF (NAV) |
S&P 500 Index Total Return |
Bloomberg Commodity Index Total Return |
Bloomberg Industrial Metals Total Return Subindex |
9/22/21 |
$10,000 |
$10,000 |
$10,000 |
$10,000 |
9/30/21 |
$9,685 |
$10,000 |
$10,000 |
$10,000 |
10/31/21 |
$10,147 |
$10,701 |
$10,258 |
$10,451 |
11/30/21 |
$9,862 |
$10,626 |
$9,508 |
$10,208 |
12/31/21 |
$10,480 |
$11,103 |
$9,844 |
$10,861 |
1/31/22 |
$10,779 |
$10,528 |
$10,708 |
$11,182 |
2/28/22 |
$11,519 |
$10,213 |
$11,375 |
$11,894 |
3/31/22 |
$12,812 |
$10,592 |
$12,358 |
$13,329 |
4/30/22 |
$11,954 |
$9,668 |
$12,870 |
$12,488 |
5/31/22 |
$11,232 |
$9,686 |
$13,066 |
$11,682 |
6/30/22 |
$9,407 |
$8,887 |
$11,659 |
$9,817 |
7/31/22 |
$9,598 |
$9,706 |
$12,156 |
$9,977 |
8/31/22 |
$9,328 |
$9,310 |
$12,166 |
$9,712 |
9/30/22 |
$8,721 |
$8,453 |
$11,180 |
$9,103 |
10/31/22 |
$8,666 |
$9,137 |
$11,402 |
$9,052 |
11/30/22 |
$9,978 |
$9,648 |
$11,715 |
$10,368 |
12/31/22 |
$10,137 |
$9,092 |
$11,428 |
$10,600 |
1/31/23 |
$10,935 |
$9,663 |
$11,372 |
$11,460 |
2/28/23 |
$9,963 |
$9,427 |
$10,837 |
$10,413 |
3/31/23 |
$9,882 |
$9,774 |
$10,815 |
$10,378 |
4/30/23 |
$9,563 |
$9,926 |
$10,734 |
$10,022 |
5/31/23 |
$8,777 |
$9,969 |
$10,129 |
$9,184 |
6/30/23 |
$8,850 |
$10,628 |
$10,538 |
$9,289 |
7/31/23 |
$9,475 |
$10,969 |
$11,197 |
$9,932 |
8/31/23 |
$9,008 |
$10,795 |
$11,112 |
$9,467 |
9/30/23 |
$9,156 |
$10,280 |
$11,034 |
$9,616 |
10/31/23 |
$8,774 |
$10,064 |
$11,064 |
$9,226 |
11/30/23 |
$8,812 |
$10,983 |
$10,814 |
$9,258 |
12/31/23 |
$9,152 |
$11,482 |
$10,524 |
$9,631 |
1/31/24 |
$8,959 |
$11,675 |
$10,565 |
$9,448 |
2/29/24 |
$8,893 |
$12,298 |
$10,410 |
$9,396 |
3/31/24 |
$9,075 |
$12,694 |
$10,754 |
$9,560 |
4/30/24 |
$10,282 |
$12,176 |
$11,044 |
$10,891 |
5/31/24 |
$10,519 |
$12,779 |
$11,238 |
$11,088 |
6/30/24 |
$9,895 |
$13,238 |
$11,065 |
$10,496 |
7/31/24 |
$9,304 |
$13,399 |
$10,618 |
$9,784 |
8/31/24 |
$9,579 |
$13,724 |
$10,623 |
$10,117 |
9/30/24 |
$10,210 |
$14,017 |
$11,140 |
$10,807 |
10/31/24 |
$9,879 |
$13,890 |
$10,933 |
$10,406 |
11/30/24 |
$9,725 |
$14,705 |
$10,978 |
$10,282 |
12/31/24 |
$9,459 |
$14,355 |
$11,090 |
$9,972 |
Average Annual Total Returns for the Periods Ended December 31, 2024 (%)
AATR |
1 Year |
Since Inception (9/22/21) |
abrdn Bloomberg Industrial Metals Strategy K-1 Free ETF (NAV) |
3.17% |
(1.73%) |
S&P 500 Index Total Return |
25.02% |
10.59% |
Bloomberg Commodity Index Total Return |
5.38% |
4.01% |
Bloomberg Industrial Metals Total Return Subindex |
3.54% |
(1.15%) |
THE FUND'S PAST PERFORMANCE IS NOT A GOOD PREDICTOR OF THE FUND'S FUTURE PERFORMANCE.
Fund performance data shown above does not reflect the deduction of taxes that a shareholder would pay on Fund distributions or sale of Fund shares.
Key Fund Statistics as of December 31, 2024
Total Net Assets |
$17,994,813 |
Total Number of Portfolio Holdings |
36 |
Portfolio Turnover RateFootnote Reference* |
0% |
Total Advisory Fees Paid |
$91,804 |
| Footnote |
Description |
|
Footnote* |
Derivative instruments and instruments with a maturity of one year or less at the time of acquisition are excluded from the calculation of the portfolio turnover rate. If these instruments were included in the calculation, the Fund would have a higher portfolio turnover rate. In-Kind transactions are not included in the portfolio turnover. |
abrdn Bloomberg Industrial Metals Strategy K-1 Free ETF (BCIM)
What did the Fund invest in?
The tables below show the investment makeup of the Fund as of December 31, 2024. The percentages indicated are based on the notional value of futures contracts held by the Fund.
Sector AllocationFootnote Reference* (%)
Value |
Value |
Copper |
34.2% |
Aluminum |
28.1% |
Zinc |
17.9% |
Nickel |
14.9% |
Lead |
4.9% |
| Footnote |
Description |
|
Footnote* |
Short-term investments held have been excluded. |
Copper future |
34.2% |
PRI Aluminum future |
28.1% |
Zinc future |
17.9% |
Nickel future |
14.9% |
Lead future |
4.9% |
Availability of Additional Information
You can find additional information, including the Fund's prospectus, financial information, fund holdings, and proxy voting information at https://www.abrdn.com/en-us/us/investor/fund-centre#literature or call 844-383-7289. The QR code can be used to access the Fund's prospectus, financial information and holdings.
ALPS Distributors, Inc. is the distributor for the abrdn ETFs. ALPS is not affiliated with abrdn.
“Bloomberg®” and the indices and subindices of the “Bloomberg Commodity IndexSM” family, including the “Bloomberg Commodity Index Total ReturnSM”, are service marks of Bloomberg Finance L.P. and its affiliates, including Bloomberg Index Services Limited, the administrator of the indices, (collectively, “Bloomberg”) and have been licensed for use for certain purposes by the Fund's adviser or its affiliates. Bloomberg is not affiliated with the Fund's adviser or its affiliates, and Bloomberg does not approve, endorse, review, or recommend the Fund. Bloomberg does not guarantee the timeliness, accurateness, or completeness of any data or information relating to the indices or subindices of the Bloomberg Commodity Index.
abrdn Bloomberg Industrial Metals Strategy K-1 Free ETF (BCIM)
Item 2. Code of Ethics.
| (a) |
As of the end of the period, December 31, 2024, the Registrant has adopted a code of ethics that applies to its principal executive officer, principal financial officer, principal accounting officer or controller, or persons performing similar functions, regardless of whether these individuals are employed by the Registrant or a third party (the “Code of Ethics”). During the period covered by this report, the Registrant adopted a new Code of Ethics for consistency with the Code of Ethics adopted by other investment companies managed by the Registrant’s investment adviser or its affiliates, a copy of which is filed as an exhibit to this Form N-CSR. The Registrant has not granted any waivers, including an implicit waiver, from any provisions of its Code of Ethics during the period covered by this report. |
Item 3. Audit Committee Financial Expert.
The Registrant’s Board of Trustees has determined that the Registrant has at least two “audit committee financial experts” (as defined in Item 3 of Form N-CSR), serving on its audit committee. John Sievwright and William M. Thomas are the “audit committee financial experts” and each is “independent” (as each term is defined in Item 3 of Form N-CSR).
Under applicable securities laws and regulations, a person who is determined to be an audit committee financial expert will not be deemed an “expert” for any purpose, including without limitation for purposes of Section 11 of the Securities Act of 1933, as amended, as a result of being designated or identified as an audit committee financial expert. The designation or identification of a person as an audit committee financial expert does not impose on such person any duties, obligations, or liability that are greater than the duties, obligations, and liability imposed on such person as a member of the Registrant’s Audit Committee and Board of Trustees in the absence of such designation or identification. The designation or identification of a person as an audit committee financial expert does not affect the duties, obligations or liability of any other member of the Registrant’s Audit Committee or Board of Trustees.
Item 4. Principal Accountant Fees and Services.
(a) – (d) Below is a table reflecting the fee information requested in Items 4(a) through (d):
Fiscal Year
Ended |
(a)
Audit Fees1 |
(b)
Audit-Related Fees2 |
(c)
Tax Fees3 |
(d)
All Other Fees4 |
| December 31, 2024 |
|
|
|
|
Percentage approved pursuant to
pre-approval exception5 |
0% |
0% |
0% |
0% |
| December 31, 2023 |
$75,000 |
$0 |
$0 |
$0 |
Percentage approved pursuant to
pre-approval exception5 |
0% |
0% |
0% |
0% |
1 “Audit Fees” are the aggregate fees billed for professional services for the audit of the Registrant’s annual financial statements and services provided in connection with statutory and regulatory filings or engagements. These services include the audits of the financial statements of the Registrant, issuance of consents and assistance with review of documents filed with the SEC.
2 “Audit Related Fees” are the aggregate fees billed for assurance and related services reasonably related to the performance of the audit or review of financial statements that are not reported under “Audit Fees”.
3 “Tax Fees” are the aggregate fees billed for professional services for tax advice, tax compliance, and tax planning. These fees include: federal and state income tax returns, review of excise tax distribution calculations and federal excise tax return.
4 “All Other Fees” are the aggregate fees billed for products and services other than “Audit Fees”, “Audit-Related Fees” and “Tax Fees”.
5 Pre-approval exception under Rule 2-01 of Regulation S-X. The pre-approval exception for services provided directly to the Fund waives the pre-approval requirement for services other than audit, review or attest services if: (A) the aggregate amount of all such services provided constitutes no more than 5% of the total amount of revenues paid by the Fund to its accountant during the fiscal year in which the services are provided; (B) the Fund did not recognize the services as non-audit services at the time of the engagement; and (C) the services are promptly brought to the Audit Committee’s attention, and the Committee (or its delegate) approves the services before the audit is completed.
| (e)(1) |
The Registrant’s Audit Committee (the “Committee”) has adopted a Charter that provides that the Committee shall annually select, retain or terminate, and recommend to the Independent Directors for their ratification, the selection, retention or termination, the Registrant’s independent auditor and, in connection therewith, to evaluate the terms of the engagement (including compensation of the independent auditor) and the qualifications and independence of the independent auditor, including whether the independent auditor provides any consulting, auditing or tax services to the Registrant’s investment adviser (the “Adviser”) or any sub-adviser, and to receive the independent auditor’s specific representations as to their independence, delineating all relationships that may affect the independent auditor’s independence, including the disclosures required by PCAOB Rule 3526 or any other applicable auditing standard. PCAOB Rule 3526 requires that, at least annually, the auditor: (1) disclose to the Committee in writing all relationships between the auditor and its related entities and the Registrant and its related entities that in the auditor’s professional judgment may reasonably be thought to bear on independence; (2) confirm in the letter that, in its professional judgment, it is independent of the Registrant within the meaning of the Securities Acts administered by the SEC; and (3) discuss the auditor’s independence with the audit committee. The Committee is responsible for actively engaging in a dialogue with the independent auditor with respect to any disclosed relationships or services that may impact the objectivity and independence of the independent auditor and for taking, or recommending that the full Board take, appropriate action to oversee the independence of the independent auditor. The Committee Charter also provides that the Committee shall review in advance, and consider approval of, any and all proposals by Management or the Adviser that the Registrant, the Adviser or their affiliated persons, employ the independent auditor to render “permissible non-audit services” to the Registrant and to consider whether such services are consistent with the independent auditor’s independence. “Permissible non-audit services” include any professional services, including tax services, provided to the Registrant by the independent auditor, other than those provided to the Registrant in connection with an audit or a review of the financial statements of the Registrant. Permissible non-audit services may not include: (i) bookkeeping or other services related to the accounting records or financial statements of the Registrant; (ii) financial information systems design and implementation; (iii) appraisal or valuation services, fairness opinions or contribution-in-kind reports; (iv) actuarial services; (v) internal audit outsourcing services; (vi) management functions or human resources; (vii) broker or dealer, investment adviser or investment banking services; (viii) legal services and expert services unrelated to the audit; and (ix) any other service the PCAOB determines, by regulation, is impermissible. Pre-approval by the Committee of any permissible non-audit services is not required so long as: (i) the aggregate amount of all such permissible non-audit services provided to the Registrant constitutes not more than 5% of the total amount of revenues paid by the Registrant to its auditor during the fiscal year in which the permissible non-audit services are provided; (ii) the permissible non-audit services were not recognized by the Registrant at the time of the engagement to be non-audit services; and (iii) such services are promptly brought to the attention of the Committee and approved by the Committee or its Delegate(s) prior to the completion of the audit. The Committee may delegate to one or more of its members (“Delegates”) authority to pre-approve permissible non-audit services to be provided to the Registrant. Any pre-approval determination of a Delegate shall be presented to the full Committee at its next meeting. Any pre-approval determination of a Delegate shall be presented to the full Committee at its next meeting. Pursuant to this authority, the Registrant’s Committee delegates to the Committee Chair, subject to subsequent ratification by the full Committee, up to a maximum amount of $25,000, which includes any professional services, including tax services, provided to the Registrant by its independent registered public accounting firm other than those provided to the Registrant in connection with an audit or a review of the financial statements of the Registrant. The Committee shall communicate any pre-approval made by it or a Delegate to the Adviser, who will ensure that the appropriate disclosure is made in the Registrant’s periodic reports required by Section 30 of the Investment Company Act of 1940, as amended, (the “1940 Act”) and other documents as required under the federal securities laws. |
| |
|
| (e)(2) |
None of the services described in each of paragraphs (b) through (d) of this Item involved a waiver of the pre-approval requirement by the Audit Committee pursuant to Rule 2-01 (c)(7)(i)(C) of Regulation S-X. |
| |
|
| (f) |
Not Applicable. |
| (g) |
Non-Audit Fees |
| |
|
| |
The following table shows the amount of fees that Cohen & Company, Ltd., the Funds’ independent registered public accounting firm, billed during the last two fiscal years for non-audit services to the Registrant, and to the Registrant’s investment adviser (the “Adviser”) (not including any sub-adviser whose role is primarily portfolio management and is subcontracted with or overseen by another investment adviser), and any entity controlling, controlled by or under common control with the Adviser that provides ongoing services to the Funds (“Affiliated Fund Service Provider”): |
| Fiscal Year Ended |
|
Total Non-Audit Fees
Billed to Funds |
|
Total Non-Audit Fees
billed to Adviser and
Affiliated Fund Service
Providers (engagements
related directly to the
operations and financial
reporting of the Funds) |
|
Total Non-Audit Fees
billed to Adviser and
Affiliated Fund Service
Providers (all other
engagements) |
|
Total |
| December 31, 2024 |
|
|
|
|
|
|
|
|
| December 31, 2023 |
|
$0 |
|
$0 |
|
$0 |
|
$0 |
“Non-Audit Fees billed to Funds” for both fiscal years represent “Tax Fees” and “All Other Fees” billed to Funds in their respective amounts from the previous table.
| (h) |
Not applicable. |
| |
|
| (i) |
Not applicable. |
| |
|
| (j) |
Not applicable. |
Item 5. Audit Committee of Listed Registrants.
| (a) |
The Registrant is an issuer as defined in Section 10A-3 of the Securities Exchange Act of 1934 and has a separately-designated standing Audit Committee in accordance with Section 3(a)(58)(A) of the Securities Exchange Act of 1934. All of the Board’s independent Trustees, Rose DiMartino, William M. Thomas and John Sievwright are members of the Audit Committee. |
| |
|
| (b) |
Not Applicable. |
Item 6. Investments
| (a) |
Schedule I – Investments in Securities of Unaffiliated Issuers |
| |
|
| |
Included as part of the Financial Statements filed under Item 7 of this Form N-CSR. |
| |
|
| (b) |
Securities Divested of in accordance with Section 13(c) of the Investment Company Act of 1940. |
| |
|
| |
Not applicable. |
Item 7. Financial Statements and Financial Highlights for Open-End Management Investment Companies.
(a)
abrdn ETFs
Financial Statements and Other Information
December 31, 2024
abrdn Bloomberg All Commodity Strategy K-1 Free ETF | BCI | NYSE Arca
abrdn Bloomberg All Commodity Longer Dated Strategy K-1 Free ETF | BCD | NYSE Arca
abrdn Bloomberg Industrial Metals Strategy K-1 Free ETF | BCIM | NYSE Arca
abrdn ETFs
Table of Contents
|
|
|
1 |
|
1 |
|
3 |
|
5 |
|
7 |
|
8 |
|
9 |
|
10 |
|
12 |
|
26 |
|
27 |
|
28 |
|
29 |
|
30 |
Consolidated Schedule of Portfolio Investments
abrdn Bloomberg All Commodity Strategy K-1 Free ETF
December 31, 2024
| |
Shares or
Principal
Amount |
|
Value |
| SHORT-TERM INVESTMENTS—101.4% |
|
|
| MONEY MARKET FUNDS—10.9% |
|
|
| DWS Government Money Market Fund, Institutional Class, 4.42% (a) |
|
138,670,244 |
|
$ 138,670,244 |
| Total Money Market Funds |
|
|
138,670,244 |
| U.S. TREASURIES—90.5% |
|
|
| U.S. Treasury Bills |
|
|
|
|
| 4.51%, 01/02/2025 (b) |
$ |
56,000,000 |
|
56,000,000 |
| 4.48%, 01/07/2025 (b)(c) |
|
55,000,000 |
|
54,968,777 |
| 4.52%, 01/09/2025 (b) |
|
56,000,000 |
|
55,954,250 |
| 4.42%, 01/14/2025 (b) |
|
55,000,000 |
|
54,923,244 |
| 4.52%, 01/16/2025 (b)(c) |
|
56,000,000 |
|
55,907,924 |
| 4.46%, 01/21/2025 (b) |
|
55,000,000 |
|
54,876,977 |
| 4.48%, 01/23/2025 (b)(c) |
|
56,000,000 |
|
55,861,585 |
| 4.37%, 01/28/2025 (b) |
|
55,000,000 |
|
54,833,564 |
| 4.42%, 01/30/2025 (b)(c) |
|
40,000,000 |
|
39,868,633 |
| 4.29%, 02/04/2025 (b) |
|
56,000,000 |
|
55,785,059 |
| 4.43%, 02/06/2025 (b) |
|
55,000,000 |
|
54,774,782 |
| 4.26%, 02/11/2025 (b) |
|
56,000,000 |
|
55,740,087 |
| 4.40%, 02/13/2025 (b) |
|
55,000,000 |
|
54,728,358 |
| 4.25%, 02/18/2025 (b) |
|
56,000,000 |
|
55,694,267 |
| 4.42%, 02/20/2025 (b) |
|
55,000,000 |
|
54,688,185 |
| 4.20%, 02/25/2025 (b) |
|
57,000,000 |
|
56,641,327 |
| 4.35%, 02/27/2025 (b) |
|
55,000,000 |
|
54,639,383 |
| 4.30%, 03/06/2025 (b) |
|
55,000,000 |
|
54,597,675 |
| 4.34%, 03/13/2025 (b) |
|
56,000,000 |
|
55,545,389 |
| 4.22%, 03/20/2025 (b)(c) |
|
56,000,000 |
|
55,500,377 |
| 4.18%, 03/27/2025 (b) |
|
56,000,000 |
|
55,453,160 |
| Total U.S. Treasuries |
|
|
1,146,983,003 |
| Total Short-Term Investments |
|
|
1,285,653,247 |
Total Investments
(Cost $1,285,391,398)—101.4% |
|
1,285,653,247 |
| Liabilities in Excess of Other Assets—(1.4%) |
|
(17,746,102) |
| Net Assets—100.0% |
|
$1,267,907,145 |
|
| (a) |
The rate shown is the 7 day yield as of December 31, 2024. |
| (b) |
The rate shown is the discount yield at the time of purchase. |
| (c) |
All or a portion of the security pledged as collateral for Futures Contracts, with a total collateral value of $206,369,690. |
As of December 31, 2024, the gross unrealized appreciation (depreciation) of investments based on the aggregate cost of investment securities and derivative instruments for federal income tax purposes was as follows:
| Federal Tax Cost |
$1,285,391,554 |
| Unrealized Appreciation |
$47,935,599 |
| Unrealized Depreciation |
(47,415,043) |
| Net Unrealized Appreciation (Depreciation) |
$520,556 |
See accompanying notes to the consolidated financial statements.
1
Consolidated Schedule of Portfolio Investments
abrdn Bloomberg All Commodity Strategy K-1 Free ETF (concluded)
December 31, 2024
| As of December 31, 2024, the Fund held the following futures contracts: |
| Futures Contracts |
Number of
Contracts
Long/(Short) |
Expiration
Date |
Notional
Amount |
Fair
Value |
Unrealized
Appreciation/
(Depreciation) |
| Long Contract Positions |
|
|
|
|
|
| Aluminum LME * |
839 |
1/15/2025 |
$54,540,429 |
$53,202,668 |
$(1,337,761) |
| Aluminum LME * |
887 |
3/19/2025 |
57,639,395 |
56,656,460 |
(982,935) |
| Brent Crude Oil |
1,153 |
3/31/2025 |
83,633,372 |
86,059,920 |
2,426,548 |
| Coffee |
516 |
3/19/2025 |
51,524,002 |
61,871,625 |
10,347,623 |
| Copper |
662 |
3/27/2025 |
70,693,532 |
66,638,575 |
(4,054,957) |
| Corn |
2,923 |
3/14/2025 |
64,513,853 |
67,009,775 |
2,495,922 |
| Cotton |
466 |
3/07/2025 |
16,763,382 |
15,937,200 |
(826,182) |
| Gasoline |
293 |
3/31/2025 |
24,434,076 |
24,970,105 |
536,029 |
| Gold |
832 |
2/26/2025 |
221,717,026 |
219,731,200 |
(1,985,826) |
| KC Wheat |
689 |
3/14/2025 |
19,562,966 |
19,266,162 |
(296,804) |
| Lead LME * |
193 |
1/15/2025 |
10,121,365 |
9,325,229 |
(796,136) |
| Lead LME * |
203 |
3/19/2025 |
10,408,947 |
9,886,811 |
(522,136) |
| Lean Hog |
757 |
2/14/2025 |
25,929,998 |
24,617,640 |
(1,312,358) |
| Live Cattle |
604 |
2/28/2025 |
45,006,807 |
46,290,560 |
1,283,753 |
| Low Sulfur Gasoil |
440 |
3/12/2025 |
29,077,976 |
30,272,000 |
1,194,024 |
| Natural Gas |
3,623 |
3/31/2025 |
99,207,675 |
112,240,540 |
13,032,865 |
| New York Harbor Ultra Low Sulfur Diesel |
237 |
3/31/2025 |
21,834,487 |
22,838,458 |
1,003,971 |
| Nickel LME * |
306 |
1/15/2025 |
32,457,455 |
27,797,169 |
(4,660,286) |
| Nickel LME * |
323 |
3/19/2025 |
30,920,877 |
29,657,873 |
(1,263,004) |
| Silver |
457 |
3/27/2025 |
71,836,381 |
66,817,970 |
(5,018,411) |
| Soybean |
1,118 |
3/14/2025 |
55,867,441 |
56,486,950 |
619,509 |
| Soybean Meal |
1,140 |
3/14/2025 |
33,820,813 |
36,126,600 |
2,305,787 |
| Soybean Oil |
1,394 |
3/14/2025 |
35,860,430 |
33,757,104 |
(2,103,326) |
| Sugar |
1,412 |
3/31/2025 |
31,262,798 |
30,458,534 |
(804,264) |
| Wheat |
1,088 |
3/14/2025 |
31,195,030 |
30,001,600 |
(1,193,430) |
| WTI Crude Oil |
1,185 |
3/31/2025 |
81,101,238 |
84,431,250 |
3,330,012 |
| Zinc LME * |
451 |
1/15/2025 |
35,043,016 |
33,378,961 |
(1,664,055) |
| Zinc LME * |
476 |
3/19/2025 |
36,948,162 |
35,466,046 |
(1,482,116) |
| |
|
|
|
|
$8,272,056 |
| Short Contract Positions |
|
|
|
|
|
| Aluminum LME * |
(839) |
1/15/2025 |
(54,066,527) |
(53,202,668) |
863,859 |
| Aluminum LME * |
(25) |
3/17/2025 |
(1,579,191) |
(1,596,856) |
(17,665) |
| Lead LME * |
(193) |
1/15/2025 |
(9,827,952) |
(9,325,229) |
502,723 |
| Lead LME * |
(5) |
3/17/2025 |
(247,701) |
(243,518) |
4,183 |
| Nickel LME * |
(306) |
1/15/2025 |
(29,041,686) |
(27,797,169) |
1,244,517 |
| Nickel LME * |
(9) |
3/17/2025 |
(837,295) |
(826,380) |
10,915 |
| Zinc LME * |
(451) |
1/15/2025 |
(34,859,000) |
(33,378,961) |
1,480,039 |
| Zinc LME * |
(13) |
3/17/2025 |
(973,413) |
(968,611) |
4,802 |
| |
|
|
|
|
$4,093,373 |
| |
|
|
|
|
$12,365,429 |
|
| * |
London Metal Exchange (“LME”) futures contracts settle on their respective maturity date. See Note 2. |
See accompanying notes to the consolidated financial statements.
2
Consolidated Schedule of Portfolio Investments
abrdn Bloomberg All Commodity Longer Dated Strategy K-1 Free ETF
December 31, 2024
| |
Shares or
Principal
Amount |
|
Value |
| SHORT-TERM INVESTMENTS—102.7% |
|
|
| MONEY MARKET FUNDS—9.2% |
|
|
| DWS Government Money Market Fund, Institutional Class, 4.42% (a) |
|
21,407,883 |
|
$ 21,407,883 |
| Total Money Market Funds |
|
|
21,407,883 |
| U.S. TREASURIES—93.5% |
|
|
| U.S. Treasury Bills |
|
|
|
|
| 4.51%, 01/02/2025 (b) |
$ |
11,000,000 |
|
11,000,000 |
| 4.48%, 01/07/2025 (b)(c) |
|
11,000,000 |
|
10,993,755 |
| 4.52%, 01/09/2025 (b) |
|
11,000,000 |
|
10,991,014 |
| 4.42%, 01/14/2025 (b) |
|
11,000,000 |
|
10,984,649 |
| 4.52%, 01/16/2025 (b)(c) |
|
11,000,000 |
|
10,981,914 |
| 4.46%, 01/21/2025 (b) |
|
11,000,000 |
|
10,975,395 |
| 4.48%, 01/23/2025 (b) |
|
11,000,000 |
|
10,972,811 |
| 4.37%, 01/28/2025 (b) |
|
11,000,000 |
|
10,966,713 |
| 4.42%, 01/30/2025 (b)(c) |
|
11,000,000 |
|
10,963,874 |
| 4.29%, 02/04/2025 (b) |
|
11,000,000 |
|
10,957,779 |
| 4.43%, 02/06/2025 (b) |
|
11,000,000 |
|
10,954,956 |
| 4.26%, 02/11/2025 (b) |
|
11,000,000 |
|
10,948,946 |
| 4.40%, 02/13/2025 (b)(c) |
|
11,000,000 |
|
10,945,672 |
| 4.25%, 02/18/2025 (b) |
|
10,000,000 |
|
9,945,405 |
| 4.42%, 02/20/2025 (b)(c) |
|
11,000,000 |
|
10,937,637 |
| 4.20%, 02/25/2025 (b) |
|
10,000,000 |
|
9,937,075 |
| 4.35%, 02/27/2025 (b) |
|
11,000,000 |
|
10,927,877 |
| 4.30%, 03/06/2025 (b) |
|
11,000,000 |
|
10,919,535 |
| 4.34%, 03/13/2025 (b) |
|
11,000,000 |
|
10,910,701 |
| 4.22%, 03/20/2025 (b) |
|
2,000,000 |
|
1,982,156 |
| 4.18%, 03/27/2025 (b) |
|
10,000,000 |
|
9,902,350 |
| Total U.S. Treasuries |
|
|
218,100,214 |
| Total Short-Term Investments |
|
|
239,508,097 |
Total Investments
(Cost $239,458,807)—102.7% |
|
239,508,097 |
| Liabilities in Excess of Other Assets—(2.7%) |
|
(6,302,933) |
| Net Assets—100.0% |
|
$233,205,164 |
|
| (a) |
The rate shown is the 7 day yield as of December 31, 2024. |
| (b) |
The rate shown is the discount yield at the time of purchase. |
| (c) |
All or a portion of the security pledged as collateral for Futures Contracts, with a total collateral value of $40,879,485. |
As of December 31, 2024, the gross unrealized appreciation (depreciation) of investments based on the aggregate cost of investment securities and derivative instruments for federal income tax purposes was as follows:
| Federal Tax Cost |
$239,458,807 |
| Unrealized Appreciation |
$9,260,726 |
| Unrealized Depreciation |
(9,567,825) |
| Net Unrealized Appreciation (Depreciation) |
$(307,099) |
See accompanying notes to the consolidated financial statements.
3
Consolidated Schedule of Portfolio Investments
abrdn Bloomberg All Commodity Longer Dated Strategy K-1 Free ETF (concluded)
December 31, 2024
| As of December 31, 2024, the Fund held the following futures contracts: |
| Futures Contracts |
Number of
Contracts
Long/(Short) |
Expiration
Date |
Notional
Amount |
Fair
Value |
Unrealized
Appreciation/
(Depreciation) |
| Long Contract Positions |
|
|
|
|
|
| Aluminum LME * |
152 |
1/15/2025 |
$9,651,289 |
$9,638,624 |
$(12,665) |
| Aluminum LME * |
166 |
3/19/2025 |
10,214,551 |
10,603,126 |
388,575 |
| Aluminum LME * |
168 |
5/21/2025 |
10,970,776 |
10,730,916 |
(239,860) |
| Brent Crude Oil |
209 |
7/31/2025 |
14,933,998 |
15,309,250 |
375,252 |
| Coffee |
94 |
5/19/2025 |
9,145,554 |
11,098,462 |
1,952,908 |
| Copper |
120 |
5/28/2025 |
12,922,076 |
12,178,500 |
(743,576) |
| Corn |
529 |
5/14/2025 |
11,853,948 |
12,319,087 |
465,139 |
| Cotton |
84 |
5/07/2025 |
3,085,207 |
2,918,580 |
(166,627) |
| Gasoline |
53 |
5/31/2025 |
4,836,337 |
4,961,309 |
124,972 |
| Gold |
151 |
6/26/2025 |
41,525,269 |
40,650,710 |
(874,559) |
| KC Wheat |
125 |
5/14/2025 |
3,612,947 |
3,548,438 |
(64,509) |
| Lead LME * |
35 |
1/15/2025 |
1,964,458 |
1,691,104 |
(273,354) |
| Lead LME * |
38 |
3/19/2025 |
1,942,151 |
1,850,733 |
(91,418) |
| Lead LME * |
38 |
5/21/2025 |
1,955,487 |
1,869,154 |
(86,333) |
| Lean Hog |
137 |
6/13/2025 |
5,518,473 |
5,434,790 |
(83,683) |
| Live Cattle |
110 |
6/30/2025 |
8,183,470 |
8,343,500 |
160,030 |
| Low Sulfur Gasoil |
80 |
5/12/2025 |
5,297,969 |
5,428,000 |
130,031 |
| Natural Gas |
657 |
5/31/2025 |
18,380,123 |
20,741,490 |
2,361,367 |
| New York Harbor Ultra Low Sulfur Diesel |
43 |
5/31/2025 |
3,998,944 |
4,046,885 |
47,941 |
| Nickel LME * |
55 |
1/15/2025 |
5,721,053 |
4,996,223 |
(724,830) |
| Nickel LME * |
60 |
3/19/2025 |
5,900,646 |
5,509,202 |
(391,444) |
| Nickel LME * |
60 |
5/21/2025 |
5,903,131 |
5,566,954 |
(336,177) |
| Silver |
83 |
5/28/2025 |
13,166,369 |
12,265,325 |
(901,044) |
| Soybean |
203 |
5/14/2025 |
10,597,870 |
10,375,838 |
(222,032) |
| Soybean Meal |
207 |
5/14/2025 |
6,291,410 |
6,679,890 |
388,480 |
| Soybean Oil |
253 |
5/14/2025 |
7,245,336 |
6,176,742 |
(1,068,594) |
| Sugar |
256 |
5/31/2025 |
5,763,892 |
5,117,952 |
(645,940) |
| Wheat |
197 |
5/14/2025 |
5,765,536 |
5,540,625 |
(224,911) |
| WTI Crude Oil |
215 |
5/31/2025 |
14,687,350 |
15,157,500 |
470,150 |
| Zinc LME * |
81 |
1/15/2025 |
6,041,871 |
5,994,891 |
(46,980) |
| Zinc LME * |
89 |
3/19/2025 |
6,359,363 |
6,631,257 |
271,894 |
| Zinc LME * |
89 |
5/21/2025 |
6,667,312 |
6,642,871 |
(24,441) |
| |
|
|
|
|
$(86,238) |
| Short Contract Positions |
|
|
|
|
|
| Aluminum LME * |
(152) |
1/15/2025 |
(9,093,985) |
(9,638,624) |
(544,639) |
| Aluminum LME * |
(166) |
3/19/2025 |
(10,797,927) |
(10,603,126) |
194,801 |
| Aluminum LME * |
(12) |
5/19/2025 |
(770,912) |
(766,494) |
4,418 |
| Lead LME * |
(35) |
1/15/2025 |
(1,766,092) |
(1,691,104) |
74,988 |
| Lead LME * |
(38) |
3/19/2025 |
(1,933,740) |
(1,850,733) |
83,007 |
| Lead LME * |
(2) |
5/19/2025 |
(100,008) |
(98,377) |
1,631 |
| Nickel LME * |
(55) |
1/15/2025 |
(5,309,562) |
(4,996,223) |
313,339 |
| Nickel LME * |
(60) |
3/19/2025 |
(5,844,437) |
(5,509,202) |
335,235 |
| Nickel LME * |
(3) |
5/19/2025 |
(280,560) |
(278,348) |
2,212 |
| Zinc LME * |
(81) |
1/15/2025 |
(5,652,651) |
(5,994,891) |
(342,240) |
| Zinc LME * |
(89) |
3/19/2025 |
(6,656,473) |
(6,631,257) |
25,216 |
| Zinc LME * |
(5) |
5/19/2025 |
(375,216) |
(373,195) |
2,021 |
| |
|
|
|
|
$149,989 |
| |
|
|
|
|
$63,751 |
|
| * |
London Metal Exchange (“LME”) futures contracts settle on their respective maturity date. See Note 2. |
See accompanying notes to the consolidated financial statements.
4
Consolidated Schedule of Portfolio Investments
abrdn Bloomberg Industrial Metals Strategy K-1 Free ETF
December 31, 2024
| |
Shares or
Principal
Amount |
|
Value |
| SHORT-TERM INVESTMENTS—110.4% |
|
|
| MONEY MARKET FUNDS—10.8% |
|
|
| DWS Government Money Market Fund, Institutional Class, 4.42% (a) |
|
1,943,513 |
|
$ 1,943,513 |
| Total Money Market Funds |
|
|
1,943,513 |
| U.S. TREASURIES—99.6% |
|
|
| U.S. Treasury Bills |
|
|
|
|
| 4.51%, 01/02/2025 (b) |
$ |
1,000,000 |
|
1,000,000 |
| 4.48%, 01/07/2025 (b) |
|
1,000,000 |
|
999,432 |
| 4.52%, 01/09/2025 (b) |
|
1,000,000 |
|
999,183 |
| 4.42%, 01/14/2025 (b) |
|
1,000,000 |
|
998,604 |
| 4.52%, 01/16/2025 (b)(c) |
|
1,000,000 |
|
998,356 |
| 4.46%, 01/21/2025 (b) |
|
1,000,000 |
|
997,763 |
| 4.48%, 01/23/2025 (b)(c) |
|
1,000,000 |
|
997,528 |
| 4.37%, 01/28/2025 (b) |
|
1,000,000 |
|
996,974 |
| 4.42%, 01/30/2025 (b)(c) |
|
1,000,000 |
|
996,716 |
| 4.29%, 02/04/2025 (b) |
|
1,000,000 |
|
996,162 |
| 4.43%, 02/06/2025 (b)(c) |
|
1,000,000 |
|
995,905 |
| 4.4%, 02/13/2025 (b)(c) |
|
1,000,000 |
|
995,061 |
| 4.25%, 02/18/2025 (b) |
|
1,000,000 |
|
994,541 |
| 4.42%, 02/20/2025 (b) |
|
1,000,000 |
|
994,331 |
| 4.2%, 02/25/2025 (b) |
|
1,000,000 |
|
993,708 |
| 4.35%, 02/27/2025 (b) |
|
1,000,000 |
|
993,443 |
| 4.34%, 03/13/2025 (b)(c) |
|
1,000,000 |
|
991,882 |
| 4.18%, 03/27/2025 (b) |
|
1,000,000 |
|
990,235 |
| Total U.S. Treasuries |
|
|
17,929,824 |
| Total Short-Term Investments |
|
|
19,873,337 |
Total Investments
(Cost $19,869,306)—110.4% |
|
19,873,337 |
| Liabilities in Excess of Other Assets—(10.4%) |
|
(1,878,524) |
| Net Assets—100.0% |
|
$17,994,813 |
|
| (a) |
The rate shown is the 7 day yield as of December 31, 2024. |
| (b) |
The rate shown is the discount yield at the time of purchase. |
| (c) |
All or a portion of the security pledged as collateral for Futures Contracts, with a total collateral value of $5,080,781. |
As of December 31, 2024, the gross unrealized appreciation (depreciation) of investments based on the aggregate cost of investment securities and derivative instruments for federal income tax purposes was as follows:
| Federal Tax Cost |
$19,869,306 |
| Unrealized Appreciation |
$951,104 |
| Unrealized Depreciation |
(2,415,933) |
| Net Unrealized Appreciation (Depreciation) |
$(1,464,829) |
See accompanying notes to the consolidated financial statements.
5
Consolidated Schedule of Portfolio Investments
abrdn Bloomberg Industrial Metals Strategy K-1 Free ETF (concluded)
December 31, 2024
| As of December 31, 2024, the Fund held the following futures contracts: |
| Futures Contracts |
Number of
Contracts
Long/(Short) |
Expiration
Date |
Notional
Amount |
Fair
Value |
Unrealized
Appreciation/
(Depreciation) |
| Long Contract Positions |
|
|
|
|
|
| Aluminum LME * |
97 |
1/15/2025 |
$6,306,386 |
$6,150,964 |
$(155,422) |
| Aluminum LME * |
89 |
3/19/2025 |
5,789,054 |
5,684,808 |
(104,246) |
| Copper |
61 |
3/27/2025 |
6,485,636 |
6,140,413 |
(345,223) |
| Lead LME * |
21 |
1/15/2025 |
1,101,825 |
1,014,662 |
(87,163) |
| Lead LME * |
20 |
3/19/2025 |
1,027,046 |
974,070 |
(52,976) |
| Nickel LME * |
35 |
1/15/2025 |
3,708,151 |
3,179,415 |
(528,736) |
| Nickel LME * |
32 |
3/19/2025 |
3,068,120 |
2,938,241 |
(129,879) |
| Zinc LME * |
53 |
1/15/2025 |
4,116,699 |
3,922,583 |
(194,116) |
| Zinc LME * |
47 |
3/19/2025 |
3,652,960 |
3,501,900 |
(151,060) |
| |
|
|
|
|
$(1,748,821) |
| Short Contract Positions |
|
|
|
|
|
| Aluminum LME * |
(97) |
1/15/2025 |
(6,251,699) |
(6,150,964) |
100,735 |
| Aluminum LME * |
(10) |
3/19/2025 |
(631,677) |
(638,743) |
(7,066) |
| Lead LME * |
(21) |
1/15/2025 |
(1,070,118) |
(1,014,662) |
55,456 |
| Lead LME * |
(2) |
3/19/2025 |
(99,080) |
(97,407) |
1,673 |
| Nickel LME * |
(35) |
1/15/2025 |
(3,341,141) |
(3,179,415) |
161,726 |
| Nickel LME * |
(3) |
3/19/2025 |
(279,098) |
(275,460) |
3,638 |
| Zinc LME * |
(53) |
1/15/2025 |
(4,094,424) |
(3,922,583) |
171,841 |
| Zinc LME * |
(4) |
3/19/2025 |
(299,511) |
(298,034) |
1,477 |
| |
|
|
|
|
$489,480 |
| |
|
|
|
|
$(1,259,341) |
|
| * |
London Metal Exchange (“LME”) futures contracts settle on their respective maturity date. See Note 2. |
See accompanying notes to the consolidated financial statements.
6
Consolidated Statements of Assets and Liabilities
December 31, 2024
| |
abrdn
Bloomberg All
Commodity
Strategy K-1
Free ETF |
|
abrdn
Bloomberg
All
Commodity
Longer Dated
Strategy K-1
Free ETF |
|
abrdn
Bloomberg
Industrial
Metals
Strategy K-1
Free ETF |
| ASSETS: |
|
|
|
|
|
| Investments, at cost |
$1,285,391,398 |
|
$239,458,807 |
|
$19,869,306 |
| Investments, at value |
1,285,653,247 |
|
239,508,097 |
|
19,873,337 |
| Cash |
28 |
|
7 |
|
– |
| Deposits at broker for futures contracts |
26,917,151 |
|
3,676,515 |
|
391,355 |
| Interest and dividends receivable |
398,053 |
|
74,238 |
|
3,854 |
| Unrealized appreciation on open futures contracts |
42,687,081 |
|
8,173,607 |
|
496,546 |
| Total assets |
1,355,655,560 |
|
251,432,464 |
|
20,765,092 |
| LIABILITIES: |
|
|
|
|
|
| Payable for investments purchased |
56,640,686 |
|
9,936,963 |
|
993,696 |
| Unrealized depreciation on open futures contracts |
30,321,652 |
|
8,109,856 |
|
1,755,887 |
| Advisory fees payable |
761,628 |
|
175,729 |
|
20,208 |
| Legal fees |
24,449 |
|
4,752 |
|
488 |
| Total liabilities |
87,748,415 |
|
18,227,300 |
|
2,770,279 |
| NET ASSETS |
$1,267,907,145 |
|
$233,205,164 |
|
$17,994,813 |
| NET ASSETS CONSIST OF: |
|
|
|
|
|
| Paid in capital |
$1,267,763,011 |
|
$233,626,361 |
|
$19,491,792 |
| Distributable earnings/(accumulated loss) |
144,134 |
|
(421,197) |
|
(1,496,979) |
| NET ASSETS |
$1,267,907,145 |
|
$233,205,164 |
|
$17,994,813 |
| Shares (unlimited number of shares authorized, no par value) |
64,350,000 |
|
7,450,000 |
|
900,000 |
| Net Asset Value, per share |
$19.70 |
|
$31.30 |
|
$19.99 |
Amounts listed as “–” are $0 or round to $0.
See accompanying notes to the consolidated financial statements.
7
Consolidated Statements of Operations
For the Year Ended December 31, 2024
| |
abrdn
Bloomberg All
Commodity
Strategy K-1
Free ETF |
|
abrdn
Bloomberg
All
Commodity
Longer Dated
Strategy K-1
Free ETF |
|
abrdn
Bloomberg
Industrial
Metals
Strategy K-1
Free ETF |
| INVESTMENT INCOME: |
|
|
|
|
|
| Interest income |
$52,914,774 |
|
$11,381,239 |
|
$1,204,764 |
| Total Income |
52,914,774 |
|
11,381,239 |
|
1,204,764 |
| EXPENSES: |
|
|
|
|
|
| Advisory fee (See Note 4) |
3,082,514 |
|
776,111 |
|
118,031 |
| Legal fees and expenses |
112,942 |
|
22,915 |
|
2,624 |
| Total operating expenses before reimbursed/waived expenses |
3,195,456 |
|
799,026 |
|
120,655 |
| Expenses waived and/or reimbursed by Advisor (see Note 4) |
(499,293) |
|
(135,893) |
|
(26,227) |
| Total Net Expenses after Waivers |
2,696,163 |
|
663,133 |
|
94,428 |
| Net Investment Income |
50,218,611 |
|
10,718,106 |
|
1,110,336 |
| NET REALIZED AND UNREALIZED GAIN (LOSS): |
|
|
|
|
|
| Realized gain on investment transactions |
61,039 |
|
20,223 |
|
2,934 |
| Realized gain/(loss) on futures contracts |
(10,039,453) |
|
(6,270,294) |
|
1,453,221 |
| Net realized gain/(loss) from investments and future transactions |
(9,978,414) |
|
(6,250,071) |
|
1,456,155 |
| Net change in unrealized appreciation/(depreciation) on investment transactions |
140,406 |
|
18,114 |
|
746 |
| Net change in unrealized appreciation/(depreciation) on futures contracts |
10,468,035 |
|
5,812,499 |
|
(1,902,775) |
| Net change in unrealized appreciation/(depreciation) from investments and futures contracts |
10,608,441 |
|
5,830,613 |
|
(1,902,029) |
| Net realized/unrealized gain/(loss) from investments and future transactions |
630,027 |
|
(419,458) |
|
(445,874) |
| NET INCREASE/(DECREASE) IN NET ASSETS RESULTING FROM OPERATIONS |
$50,848,638 |
|
$10,298,648 |
|
$664,462 |
See accompanying notes to the consolidated financial statements.
8
Consolidated Statements of Changes in Net Assets
For the Periods Indicated
| |
abrdn Bloomberg All
Commodity Strategy K-1 Free
ETF |
|
abrdn Bloomberg All
Commodity Longer Dated
Strategy K-1 Free ETF |
|
abrdn Bloomberg
Industrial Metals
Strategy K-1 Free ETF |
| |
Year Ended
December 31, 2024 |
|
Year Ended
December 31, 2023 |
|
Year Ended
December 31, 2024 |
|
Year Ended
December 31, 2023 |
|
Year Ended
December 31, 2024 |
|
Year Ended
December 31, 2023 |
| FROM INVESTMENT ACTIVITIES: |
|
|
|
|
|
|
|
|
|
|
|
| OPERATIONS: |
|
|
|
|
|
|
|
|
|
|
|
| Net investment income |
$50,218,611 |
|
$40,722,311 |
|
$10,718,106 |
|
$12,320,619 |
|
$1,110,336 |
|
$1,223,924 |
| Net realized gain/(loss) from investments and future transactions |
(9,978,414) |
|
(110,366,191) |
|
(6,250,071) |
|
(25,368,900) |
|
1,456,155 |
|
(2,171,014) |
| Net change in unrealized appreciation/(depreciation) on investments and futures contracts |
10,608,441 |
|
(5,920,002) |
|
5,830,613 |
|
(7,424,755) |
|
(1,902,029) |
|
(2,003,042) |
| Net Increase/(Decrease) in Net Assets Resulting from Operations |
50,848,638 |
|
(75,563,882) |
|
10,298,648 |
|
(20,473,036) |
|
664,462 |
|
(2,950,132) |
| DISTRIBUTIONS TO SHAREHOLDERS FROM: |
|
|
|
|
|
|
|
|
|
|
|
| Distributable earnings |
(40,668,594) |
|
(31,685,215) |
|
(8,441,934) |
|
(9,635,199) |
|
(2,062,988) |
|
(797,588) |
| Return of Capital |
(96,508) |
|
(140,888) |
|
(75,750) |
|
(94,578) |
|
(3,988) |
|
– |
| Change in net assets from shareholder distributions |
(40,765,102) |
|
(31,826,103) |
|
(8,517,684) |
|
(9,729,777) |
|
(2,066,976) |
|
(797,588) |
| CAPITAL TRANSACTIONS: (a) |
|
|
|
|
|
|
|
|
|
|
|
| Proceeds from shares issued |
598,322,069 |
|
401,383,922 |
|
80,635,894 |
|
61,127,824 |
|
17,471,738 |
|
3,670,803 |
| Cost of shares redeemed |
(146,896,315) |
|
(361,337,240) |
|
(68,416,287) |
|
(90,111,350) |
|
(20,769,940) |
|
(8,144,538) |
| Change in net assets from capital transactions |
451,425,754 |
|
40,046,682 |
|
12,219,607 |
|
(28,983,526) |
|
(3,298,202) |
|
(4,473,735) |
| Change in net assets |
461,509,290 |
|
(67,343,303) |
|
14,000,571 |
|
(59,186,339) |
|
(4,700,716) |
|
(8,221,455) |
| NET ASSETS: |
|
|
|
|
|
|
|
|
|
|
|
| Beginning of year |
806,397,855 |
|
873,741,158 |
|
219,204,593 |
|
278,390,932 |
|
22,695,529 |
|
30,916,984 |
| End of year |
$1,267,907,145 |
|
$806,397,855 |
|
$233,205,164 |
|
$219,204,593 |
|
$17,994,813 |
|
$22,695,529 |
| SHARE TRANSACTIONS: |
|
|
|
|
|
|
|
|
|
|
|
| Beginning of year |
41,600,001 |
|
39,750,001 |
|
7,150,001 |
|
8,050,001 |
|
1,050,000 |
|
1,250,000 |
| Issued |
30,200,000 |
|
19,300,000 |
|
2,500,000 |
|
1,850,000 |
|
725,000 |
|
150,000 |
| Redeemed |
(7,450,001) |
|
(17,450,000) |
|
(2,200,001) |
|
(2,750,000) |
|
(875,000) |
|
(350,000) |
| Shares outstanding, end of year |
64,350,000 |
|
41,600,001 |
|
7,450,000 |
|
7,150,001 |
|
900,000 |
|
1,050,000 |
|
| (a) |
Capital transactions may include transaction fees associated with Creation and Redemption transactions which occurred during the period. See Note9 to the Financial Statements. |
Amounts listed as “–” are $0 or round to $0.
See accompanying notes to the consolidated financial statements.
9
Consolidated Financial Highlights
For the Periods Indicated
| |
|
|
|
|
|
|
|
|
|
|
|
|
|
| |
Selected Data For A Share Outstanding
Throughout The Periods Indicated |
| |
Per Share Operating Performance |
| |
Investment Operations |
|
Distributions |
| |
Net asset
value,
beginning
of year |
|
Net
investment
income
(loss)(b) |
|
Net realized
and
unrealized
gain
(loss) on
investments |
|
Total from
investment
operations |
|
Net
investment
income |
|
Tax
return
of Capital |
|
Total
distributions |
abrdn Bloomberg All Commodity
Strategy K-1 Free ETF |
|
|
|
|
|
|
|
|
|
|
|
|
|
| Year Ended December 31, 2024 |
$19.38 |
|
$0.97 |
|
$–(f) |
|
$0.97 |
|
$(0.65) |
|
$(–)(f) |
|
$(0.65) |
| Year Ended December 31, 2023 |
21.98 |
|
0.99 |
|
(2.83) |
|
(1.84) |
|
(0.76) |
|
(–)(f) |
|
(0.76) |
| Year Ended December 31, 2022 |
22.93 |
|
0.32 |
|
3.14 |
|
3.46 |
|
(2.89) |
|
(1.52) |
|
(4.41) |
| Year Ended December 31, 2021 |
21.77 |
|
(0.05) |
|
5.68 |
|
5.63 |
|
(4.47) |
|
– |
|
(4.47) |
| Year Ended December 31, 2020 |
22.64 |
|
0.05 |
|
(0.77)(g) |
|
(0.72) |
|
(0.15) |
|
– |
|
(0.15) |
abrdn Bloomberg All Commodity
Longer Dated Strategy K-1 Free ETF |
|
|
|
|
|
|
|
|
|
|
|
|
|
| Year Ended December 31, 2024 |
30.66 |
|
1.54 |
|
0.23(g) |
|
1.77 |
|
(1.12) |
|
(0.01) |
|
(1.13) |
| Year Ended December 31, 2023 |
34.58 |
|
1.56 |
|
(4.10) |
|
(2.54) |
|
(1.37) |
|
(0.01) |
|
(1.38) |
| Year Ended December 31, 2022 |
30.76 |
|
0.47 |
|
5.15 |
|
5.62 |
|
(1.74) |
|
(0.06) |
|
(1.80) |
| Year Ended December 31, 2021 |
25.20 |
|
(0.07) |
|
8.18 |
|
8.11 |
|
(2.55) |
|
– |
|
(2.55) |
| Year Ended December 31, 2020 |
24.48 |
|
0.03 |
|
1.02 |
|
1.05 |
|
(0.33) |
|
– |
|
(0.33) |
abrdn Bloomberg Industrial Metals
Strategy K-1 Free ETF |
|
|
|
|
|
|
|
|
|
|
|
|
|
| Year Ended December 31, 2024 |
21.61 |
|
1.07 |
|
(0.39) |
|
0.68 |
|
(2.30) |
|
(–)(f) |
|
(2.30) |
| Year Ended December 31, 2023 |
24.73 |
|
1.07 |
|
(3.46) |
|
(2.39) |
|
(0.73) |
|
– |
|
(0.73) |
| Year Ended December 31, 2022 |
25.75 |
|
0.29 |
|
(1.13) |
|
(0.84) |
|
(0.18) |
|
– |
|
(0.18) |
| Year Ended December 31, 2021 (h) |
25.00 |
|
(0.02) |
|
1.17 |
|
1.15 |
|
(0.40) |
|
– |
|
(0.40) |
| |
|
|
|
|
|
|
|
|
|
|
|
|
|
|
| (a) |
Annualized for periods less than one year. |
| (b) |
Per share net investment income (loss) has been calculated using the average daily shares method. |
| (c) |
Net asset value total return is calculated assuming an initial investment made at the net asset value at the beginning of the period, reinvestment of all dividends and distributions at net asset value during the period, if any, and redemption on the last day of the period at net asset value. This percentage is not an indication of the performance of a shareholder’s investment in the Fund based on market value due to differences between the market price of the shares and the net asset value per share of the Fund. |
| (d) |
Not Annualized for periods less than one year. |
| (e) |
Derivative instruments and instruments with a maturity of one year or less at the time of acquisition are excluded from the calculation of the portfolio turnover rate. If these instruments were included in the calculation, the Fund would have a higher portfolio turnover rate. In-Kind transactions are not included in the portfolio turnover. |
| (f) |
Less than $0.005 per share. |
| (g) |
The amount shown for a share outstanding throughout the period is not in accordance with the aggregate net realized and unrealized gain (loss) for that period because of the timing of sales and repurchases of the Fund shares in relation to fluctuating market value of the investments in the Fund. |
| (h) |
For the period from September 22, 2021 (commencement of operations) through December 31, 2021. |
Amounts listed as “–” are $0 or round to $0.
See accompanying notes to the consolidated financial statements.
10
| |
|
|
|
|
|
|
|
|
|
|
|
|
|
|
Selected Data For A Share Outstanding
Throughout The Periods Indicated |
|
|
|
|
|
|
|
|
|
|
|
|
| Per Share Operating Performance |
|
Ratios/Supplemental Data |
| |
|
Total Return |
|
Ratios To Average Net Assets(a) |
|
Supplemental Data |
Net asset
value, end
of year |
|
Net asset
value(c)(d) |
|
Expenses
before
expense
reductions |
|
Expenses
net of
waivers,
if any |
|
Net
investment
income
(loss) before
expense
reductions |
|
Net
investment
income
(loss) net
of waivers,
if any |
|
Net assets,
end of year
(000's) |
|
Portfolio
turnover
rate(d)(e) |
| |
|
|
|
|
|
|
|
|
|
|
|
|
|
|
| $19.70 |
|
5.08% |
|
0.31% |
|
0.26% |
|
4.82% |
|
4.87% |
|
$1,267,907 |
|
– |
| 19.38 |
|
(8.35%) |
|
0.32% |
|
0.26% |
|
4.71% |
|
4.77% |
|
806,398 |
|
– |
| 21.98 |
|
15.13% |
|
0.32% |
|
0.26% |
|
1.12% |
|
1.18% |
|
873,741 |
|
– |
| 22.93 |
|
26.27% |
|
0.30% |
|
0.25% |
|
(0.25%) |
|
(0.20%) |
|
639,804 |
|
– |
| 21.77 |
|
(3.17%) |
|
0.31% |
|
0.25% |
|
0.20% |
|
0.26% |
|
337,446 |
|
– |
| |
|
|
|
|
|
|
|
|
|
|
|
|
|
|
| 31.30 |
|
5.87% |
|
0.36% |
|
0.30% |
|
4.79% |
|
4.85% |
|
233,205 |
|
– |
| 30.66 |
|
(7.36%) |
|
0.37% |
|
0.30% |
|
4.67% |
|
4.73% |
|
219,205 |
|
– |
| 34.58 |
|
18.33% |
|
0.37% |
|
0.30% |
|
1.20% |
|
1.27% |
|
278,391 |
|
– |
| 30.76 |
|
32.40% |
|
0.35% |
|
0.29% |
|
(0.30%) |
|
(0.24%) |
|
87,653 |
|
– |
| 25.20 |
|
4.29% |
|
0.35% |
|
0.29% |
|
0.06% |
|
0.12% |
|
11,339 |
|
– |
| |
|
|
|
|
|
|
|
|
|
|
|
|
|
|
| 19.99 |
|
3.17% |
|
0.51% |
|
0.40% |
|
4.60% |
|
4.71% |
|
17,995 |
|
– |
| 21.61 |
|
(9.61%) |
|
0.54% |
|
0.41% |
|
4.55% |
|
4.68% |
|
22,696 |
|
– |
| 24.73 |
|
(3.25%) |
|
0.54% |
|
0.40% |
|
0.99% |
|
1.13% |
|
30,917 |
|
– |
| 25.75 |
|
4.66% |
|
0.47% |
|
0.39% |
|
(0.44%) |
|
(0.35%) |
|
27,035 |
|
– |
| |
|
|
|
|
|
|
|
|
|
|
|
|
|
|
Amounts listed as “-” are $0 or round to $0.
See accompanying notes to the consolidated financial statements.
11
Notes to Consolidated Financial Statements
December 31, 2024
1. Organization
abrdn ETFs (the “Trust”) was organized as a Delaware statutory trust on January 9, 2014 and is authorized to issue multiple series or portfolios. The Trust currently consists of three series: abrdn Bloomberg All Commodity Strategy K-1 Free ETF, abrdn Bloomberg All Commodity Longer Dated Strategy K-1 Free ETF and abrdn Bloomberg Industrial Metals Strategy K-1 Free ETF (each a “Fund” and collectively, the “Funds”). The Trust is an open-end management investment company, registered under the Investment Company Act of 1940, as amended (the “1940 Act”). The offering of the Trust’s shares is registered under the Securities Act of 1933, as amended (the “Securities Act”).
Each of the abrdn Bloomberg All Commodity Strategy K-1 Free ETF and abrdn Bloomberg All Commodity Longer Dated Strategy K-1 Free ETF commenced investment operations on March 30, 2017. The abrdn Bloomberg Industrial Metals Strategy K-1 Free ETF commenced investment operations on September 22, 2021.
Each Fund’s investment objective seeks to provide investment results that closely correspond, before fees and expenses, to the performance of an underlying index (respectively, an “Index” and collectively the “Indices”). Prior to August 3, 2021, each of the abrdn Bloomberg All Commodity Strategy K-1 Free ETF and abrdn Bloomberg All Commodity Longer Dated Strategy K-1 Free ETF operated under certain different investment policies in connection with a change from an actively-managed ETF to a passively-managed ETF. Prior to changing from an actively-managed ETF to a passively-managed ETF, however, each of the abrdn Bloomberg All Commodity Strategy K-1 Free ETF and abrdn Bloomberg All Commodity Longer Dated Strategy K-1 Free ETF generally sought to hold similar interests to those included in its respective Index and sought exposure to many of the commodities included in the Index under the same futures rolling schedule as the Index.
Basis of Consolidation
The accompanying Consolidated Schedules of Portfolio Investments, Consolidated Statements of Assets and Liabilities, Consolidated Statements of Operations, Consolidated Statements of Changes in Net Assets and Consolidated Financial Highlights of the Funds include the accounts of abrdn All Commodity Fund Limited, a wholly-owned controlled foreign corporation of the abrdn Bloomberg All Commodity Strategy K-1 Free ETF, abrdn All Commodity Longer Dated Fund Limited, a wholly-owned controlled foreign corporation of the abrdn Bloomberg All Commodity Longer Dated Strategy K-1 Free ETF and abrdn Industrial Metals Fund Limited, a wholly-owned controlled foreign corporation of the abrdn Bloomberg Industrial Metals Strategy K-1 Free ETF. Each of these subsidiaries is organized under the laws of the Cayman Islands (together, the “Subsidiaries” and, each, a “Subsidiary”). All intercompany balances and transactions between a Fund and its Subsidiary have been eliminated in consolidation.
Under normal market conditions, each Fund intends to invest in exchange traded commodity futures contracts through its Subsidiary. As a means to provide investment returns that are designed to track those of its underlying Index, the Subsidiary may also invest directly in commodity-linked instruments, including pooled investment vehicles (such as exchange traded funds and other investment companies), swaps and exchange traded options on futures contracts, to the extent permitted under the 1940 Act and any applicable exemptive relief (collectively, “Commodities-Related Assets” and, together with exchange traded commodities futures contracts, “Commodities Instruments”). Each Fund may invest up to 25% of its total assets in its Subsidiary. As of December 31, 2024, the net assets of the abrdn All Commodity Fund Limited were $245,511,385, which was 19% of the net assets of abrdn Bloomberg All Commodity Strategy K-1 Free ETF. As of December 31, 2024, the net assets of the abrdn All Commodity Longer Dated Fund Limited were $44,587,296, which was 19% of the net assets of abrdn Bloomberg All Commodity Longer Dated Strategy K-1 Free ETF. As of December 31, 2024, the net assets of the abrdn Industrial Metals Fund Limited were $4,207,978, which was 23% of the net assets of abrdn Bloomberg Industrial Metals Strategy K-1 Free ETF.
As noted previously, each Fund will not invest directly in commodity futures contracts but, instead, expects to gain exposure to these investments exclusively by investing in its respective Subsidiary. Each Fund’s investment in its respective Subsidiary is intended to enable such Fund to gain exposure to relevant commodity markets within the limits of current federal income tax laws applicable to investment companies such as the Fund, which limit the ability of investment companies to invest directly in commodity futures contracts. Each Fund and its respective Subsidiary have the same investment objective. However, the Subsidiaries may invest without limitation in the Commodities Instruments.
The remainder of each Fund’s assets that are not invested in its Subsidiary will be principally invested in: (1) short-term investment grade fixed-income securities that include U.S. government securities and money market instruments; and (2) cash and other cash equivalents. Each Fund will use such instruments to generate a total return and to provide liquidity, serve as margin or otherwise collateralize investment in Commodities Instruments.
Notes to Consolidated Financial Statements (continued)
December 31, 2024
2. Summary of Significant Accounting Policies
The Funds’ consolidated financial statements are prepared in conformity with accounting principles generally accepted in the United States of America which may require management to make estimates and assumptions that affect the reported amounts and disclosures and disclosure of contingent assets and liabilities in the financial statements. Actual results could differ from those estimates. The Funds are investment companies and, accordingly, follow the investment company accounting and reporting guidance of the Financial Accounting Standards Board Accounting Standards Codification Topic 946 – "Financial Services Investment Companies".
Investment Valuation
The net asset value (“NAV”) of each Fund is calculated each day the national securities exchanges are open for trading as of the close of regular trading on the New York Stock Exchange Arca (“NYSE Arca” or the “Listing Exchange”), generally 4:00 p.m. Eastern Standard Time (the “NAV Calculation Time”).
NAV per share is calculated by dividing a Fund’s NAV by the number of Fund shares outstanding.
In calculating each Fund’s NAV, Fund investments generally are valued using market valuations. The Funds value their securities at current market value or fair value, consistent with regulatory requirements. "Fair Value" is defined in the Funds' Valuation and Liquidity Procedures as the price that could be received to sell an asset or paid to transfer a liability in an orderly transaction between willing market participants without a compulsion to transact at the measurement date. Short-term debt securities with remaining maturities of sixty (60) days or less when originally acquired are valued on the basis of amortized cost, which approximates fair value. U.S. fixed income assets may be valued as of the announced closing time for such securities on any day that the Securities Industry and Financial Markets Association announces an early closing time. The values of any assets or liabilities of a Fund that are denominated in a currency other than the U.S. dollar are converted into U.S. dollars using an exchange rate deemed appropriate by the Fund. The Funds sweep available cash into the Invesco Government & Agency Portfolio, which has elected to qualify as a “government money market fund” pursuant to Rule 2a-7 under the 1940 Act, and has an objective, which is not guaranteed, to maintain a $1.00 per share NAV. Generally, these investment types are categorized as Level 1 investments.
Investments in futures are valued at market value, which is generally determined using the last reported official closing price or last trading price on the exchange or market on which the futures contract is primarily traded at the time of valuation.
Pursuant to Rule 2a-5 under the 1940 Act, the Board of Trustees (the "Board") designated abrdn ETFs Advisors LLC (abrdn Inc., effective July 31, 2024 - See Note 15) (the "Advisor") as the valuation designee ("Valuation Designee") for the Funds to perform the fair valuation determinations relating to Fund investments for which market quotations are not readily available. Securities that may be valued using fair value pricing may include, but are not limited to, securities for which there are no current market quotations or whose issuer is in default or bankruptcy, securities subject to corporate actions (such as mergers or reorganizations), securities subject to non-U.S. investment limits or currency controls, and securities affected by “significant events.” An example of a significant event is an event occurring after the close of the market in which a security trades but before the Funds’ NAV Calculation Time that may materially affect the value of the Funds’ investment (e.g., government action, natural disaster, or significant market fluctuation). Price movements in U.S. markets that are deemed to affect the value of foreign securities, or reflect changes to the value of such securities, also may cause securities to be “fair valued.”
When fair value pricing is employed, the prices of securities used by a Fund to calculate its NAV may differ from quoted or published prices for the same securities. Fair value pricing involves subjective judgments, and it is possible that a fair value determination for a security or other asset is materially different than the value that could be realized upon the sale of such security or asset. In addition, fair value pricing could result in a difference between the prices used to calculate a Fund’s NAV and the prices used by the Index. This may adversely affect a Fund’s ability to track its Index.
Various inputs are used in determining the fair value of each Fund’s investments. These inputs are summarized in three levels listed below:
| • |
Level 1— Unadjusted quoted prices in active markets for identical assets on the measurement date that the Funds have the ability to access. |
| • |
Level 2— Other significant observable inputs (including quoted prices for similar securities, interest rates, prepayment speeds, credit risk, etc.). |
Notes to Consolidated Financial Statements (continued)
December 31, 2024
| • |
Level 3— Significant unobservable inputs (including each Fund’s own assumptions in determining the fair value of investments). |
The inputs or methodology used for valuing securities are not necessarily an indication of the risk associated with investing in those securities. For example, short-term debt securities may be valued at amortized cost. Generally, amortized cost approximates the current fair value of a security, but since the valuation is not obtained from a quoted price in an active market, such securities are reflected as Level 2. For each of the Funds, there were no Level 3 investments held for the fiscal year ended December 31, 2024.
The following is a summary of the valuations as of December 31, 2024, for each Fund based upon the three levels defined above.
| Investments, at Value |
|
Level 1 – Quoted
Prices |
|
Level 2 – Other Significant
Observable Inputs |
|
Level 3 – Significant
Unobservable Inputs |
|
Total |
| abrdn Bloomberg All Commodity Strategy K-1 Free ETF |
| Assets |
|
|
|
|
| Investments in Securities |
|
|
|
|
|
|
| Short-Term Investments |
|
$138,670,244 |
|
$1,146,983,003 |
|
$– |
|
$1,285,653,247 |
| Total Investments |
|
$138,670,244 |
|
$1,146,983,003 |
|
$– |
|
$1,285,653,247 |
| Other Financial Instruments |
|
|
|
|
|
|
| Futures Contracts |
|
42,687,081 |
|
– |
|
– |
|
42,687,081 |
| Total Investment Assets |
|
$181,357,325 |
|
$1,146,983,003 |
|
$– |
|
$1,328,340,328 |
| Liabilities |
|
|
|
|
| Other Financial Instruments |
|
|
|
|
|
|
| Futures Contracts |
|
$(30,321,652) |
|
$– |
|
$– |
|
$(30,321,652) |
| Total Investment Liabilities |
|
$(30,321,652) |
|
$– |
|
$– |
|
$(30,321,652) |
| abrdn Bloomberg All Commodity Longer Dated Strategy K-1 Free ETF |
| Assets |
|
|
|
|
| Investments in Securities |
|
|
|
|
|
|
| Short-Term Investments |
|
$21,407,883 |
|
$218,100,214 |
|
$– |
|
$239,508,097 |
| Total Investments |
|
$21,407,883 |
|
$218,100,214 |
|
$– |
|
$239,508,097 |
| Other Financial Instruments |
|
|
|
|
|
|
| Futures Contracts |
|
8,173,607 |
|
– |
|
– |
|
8,173,607 |
| Total Investment Assets |
|
$29,581,490 |
|
$218,100,214 |
|
$– |
|
$247,681,704 |
| Liabilities |
|
|
|
|
| Other Financial Instruments |
|
|
|
|
|
|
| Futures Contracts |
|
$(8,109,856) |
|
$– |
|
$– |
|
$(8,109,856) |
| Total Investment Liabilities |
|
$(8,109,856) |
|
$– |
|
$– |
|
$(8,109,856) |
| abrdn Bloomberg Industrial Metals Strategy K-1 Free ETF |
| Assets |
|
|
|
|
| Investments in Securities |
|
|
|
|
|
|
| Short-Term Investments |
|
$1,943,513 |
|
$17,929,824 |
|
$– |
|
$19,873,337 |
| Total Investments |
|
$1,943,513 |
|
$17,929,824 |
|
$– |
|
$19,873,337 |
| Other Financial Instruments |
|
|
|
|
|
|
| Futures Contracts |
|
496,546 |
|
– |
|
– |
|
496,546 |
| Total Investment Assets |
|
$2,440,059 |
|
$17,929,824 |
|
$– |
|
$20,369,883 |
| Liabilities |
|
|
|
|
| Other Financial Instruments |
|
|
|
|
|
|
Notes to Consolidated Financial Statements (continued)
December 31, 2024
| Investments, at Value |
|
Level 1 – Quoted
Prices |
|
Level 2 – Other Significant
Observable Inputs |
|
Level 3 – Significant
Unobservable Inputs |
|
Total |
| Futures Contracts |
|
$(1,755,887) |
|
$– |
|
$– |
|
$(1,755,887) |
| Total Investment Liabilities |
|
$(1,755,887) |
|
$– |
|
$– |
|
$(1,755,887) |
Amounts listed as “–” are $0 or round to $0.
Money Market Instruments
Each Fund invests a portion of its assets in high-quality money market instruments on an ongoing basis to provide liquidity or for other reasons. The instruments in which a Fund may invest include: (i) short-term obligations issued by the U.S. Government; (ii) negotiable certificates of deposit (“CDs”), fixed time deposits and bankers’ acceptances of U.S. and foreign banks and similar institutions; (iii) commercial paper rated at the date of purchase “Prime-1” by Moody’s or “A-1+” or “A-1” by Standard & Poor’s (“S&P”) or, if unrated, of comparable quality as determined by the Fund; and (iv) repurchase agreements. U.S. government securities are obligations of, or guaranteed by, the U.S. government, its agencies or government-sponsored enterprises and such obligations may be short-, intermediate- or long-term. CDs are short-term negotiable obligations of commercial banks. Time deposits are non-negotiable deposits maintained in banking institutions for specified periods of time at stated interest rates. Banker’s acceptances are time drafts drawn on commercial banks by borrowers, usually in connection with international transactions.
Derivatives
Each Fund uses derivative instruments as part of its investment strategies. Generally, derivatives are financial contracts whose value depends upon, or is derived from, the value of an underlying asset, reference rate or index, and may relate to bonds, interest rates, currencies, commodities, and related indexes. Examples of derivative instruments include forward contracts, currency and interest rate swaps, currency options, futures contracts, options on futures contracts and swap agreements. The Funds’ use of derivative instruments will be underpinned by investments in short-term, high-quality instruments, such as U.S. money market securities.
Rule 18f-4 under the 1940 Act governs a registered investment company's use of derivatives and certain other instruments. Under Rule 18f-4, a fund must limit its derivatives exposure through a value-at-risk test, adopt and implement a derivatives risk management program, and comply with certain reporting requirements.
These requirements may limit the ability of a Fund to use derivatives and other relevant transactions as part of its investment strategies. These requirements may increase the cost of the Funds' investments and cost of doing business, which could adversely affect investors.
Commodity Futures
Each Fund, through its Subsidiary, invests in exchange traded commodity futures contracts as part of its principal investment strategies. Commodity futures contracts are an agreement to buy or sell a certain amount of a commodity at a specific price on a specific date (their expiry) which are negotiated and traded on futures exchanges. Commodity futures contracts are generally based upon commodities within the following commodity groups: energy, industrial metals, agriculture, precious metals, foods and fibers, and livestock.
Commodity futures contracts are traded on futures exchanges which provide a central marketplace to negotiate and transact futures contracts, a clearing corporation to process trades and a secondary market. Commodity futures exchanges provide standardization with regards to certain key features such as expiry dates, contract sizes and terms and conditions of delivery. Commodity futures exchanges set a maximum permissible price movement either up or down during a single trading day and when this limit has been reached, no trades may be placed that day at a price beyond that limit. This limit could prevent a Fund from trading when it may otherwise be advantageous to do so. Even with daily price limits, commodity futures contracts have historically experienced greater price volatility than traditional assets such as stocks or bonds. Accordingly, the NAV of a Fund’s shares may be subject to greater volatility than if the Fund only invested in stocks or bonds. Exchanges may also impose position limit rules limiting the value or number of contracts in one commodity that may be held by one market participant to ensure that the amount of futures contracts that any one party may hold in a particular commodity at any point in time to ensure that no one participant can control a significant portion of the market in a particular commodity. In order to comply with the position limits established by the CFTC and the relevant exchanges, the Advisor and/or Vident Advisory, LLC (d/b/a Vident Asset Management) (the "Sub-Advisor") could in the future reduce the size of positions that would otherwise be taken for a Fund or not trade in certain markets on behalf of a Fund in order to avoid exceeding such limits. A violation of position limits by the Advisor and/or Sub-Advisor could lead to regulatory action resulting in mandatory liquidation of certain
Notes to Consolidated Financial Statements (continued)
December 31, 2024
positions held by the Advisor and/or Sub-Advisor on behalf of a Fund. In addition, in October 2020, the CFTC adopted amendments to its position limits rules that established certain new and amended position limits for 25 specified physical commodity futures and related options contracts traded on exchanges, other futures contracts and related options directly or indirectly linked to such 25 specified contracts, and any OTC transactions that are economically equivalent to the 25 specified contracts. The limits may constrain the ability of the Funds to use such contracts. The amendments also modify the bona fide hedging exemption for which certain swap dealers were previously eligible, which could limit the amount of speculative OTC transaction capacity each such swap dealer would have available for the Funds going forward. There can be no assurance that the Advisor and/or Sub-Advisor will liquidate positions held on behalf of all the Advisor and/or Sub-Advisor's accounts in a proportionate manner or at favorable prices, which could result in substantial losses to a Fund. Such policies could affect the nature and extent of derivatives use by a Fund.
More commonly, as futures contracts near expiry, they are often replaced with a later dated contract in a process known as “rolling”. This involves selling the contracts before they expire and purchasing similar contacts that have a later expiry date. Any difference between the price for the nearer delivery month contract and the price for distant month contract is known as a ‘roll yield’ and this can be either a positive amount or a negative amount. Futures contracts may be satisfied at expiry by delivery of the relevant commodity from one party to the other.
Commodity futures contract prices are generally comprised of the price of the relevant commodity as well as the costs of storing the physical commodity. Storage costs include (i) the time value of money invested in the physical commodity, (ii) plus the costs of storing the commodity, (iii) less any benefits of owning the physical commodity not obtained by the holder of a futures contract (the “convenience yield”).
Due to the volatility of commodity futures and the risk of credit risk exposure to the counterparty to the contract, commodity futures exchanges each have clearing corporations which act as counterparty to all contracts by either buying or selling directly to the market participants. This means that when each Subsidiary purchases or sells commodity futures contracts, their obligations will be to the clearing house and it will be the clearing house that is obliged to satisfy the Subsidiaries’ rights under a commodity futures contract.
To ensure a party to a futures contract fulfills its obligations to the clearing house, all participants are required to post and maintain a level of collateral (the collateral is known as “margin”). An exchange will set the margin requirements for the contracts which trade there and these can be modified by the terms of the futures contract. Margin requirements range upward from less than 5% of the value of the futures contract being traded. Margin requirements can be offset by other opposing futures transactions, in which situation margin payments will continue to be required.
When the price of a particular futures contract increases (in the case of a sale) or decreases (in the case of a purchase) and any loss on the futures contract means that the margin already held does not satisfy margin requirements, further margin must be posted. Conversely, if there is a favorable price change in the futures contract any excess margin may be removed from the relevant deposit account. Any gain or loss on London Metal Exchange (“LME”) futures contracts is not realized until their respective maturity dates. At a reporting period end, the net unrealized appreciation and depreciation on LME futures contracts is included in unrealized appreciation and unrealized depreciation on open futures contracts on the Consolidated Statements of Assets and Liabilities. Any margin deposited by a Subsidiary should earn interest income.
For the year ended December 31, 2024, the average notional value of the Futures Contracts held by the Funds was as follows:
| Derivative |
|
abrdn
Bloomberg All
Commodity
Strategy K-1
Free ETF |
|
abrdn
Bloomberg
All
Commodity
Longer Dated
Strategy K-1
Free ETF |
|
abrdn
Bloomberg
Industrial
Metals
Strategy K-1
Free ETF |
| Long Futures Contracts |
|
$1,101,176,937 |
|
$267,073,321 |
|
$33,276,236 |
| Short Futures Contracts |
|
$(57,131,393) |
|
$(47,918,312) |
|
$(13,638,810) |
Notes to Consolidated Financial Statements (continued)
December 31, 2024
The following tables indicate the location of derivative instruments on the Consolidated Statements of Assets and Liabilities as well as the effect of derivative instruments on the Consolidated Statements of Operations during the reporting period.
abrdn Bloomberg All Commodity Strategy K-1 Free ETF
| |
Risk Exposure Category |
| |
Interest
Rate
Contracts |
|
Foreign
Currency
Contracts |
|
Credit
Contracts |
|
Equity
Contracts |
|
Commodity
Contracts |
|
Other |
|
Total |
| abrdn Bloomberg All Commodity Strategy K-1 Free ETF |
| Assets: |
| Unrealized appreciation on: |
| Futures Contracts |
$– |
|
$– |
|
$– |
|
$– |
|
$42,687,081 |
|
$– |
|
$42,687,081 |
| Total |
$– |
|
$– |
|
$– |
|
$– |
|
$42,687,081 |
|
$– |
|
$42,687,081 |
| Liabilities: |
| Unrealized depreciation on: |
| Futures Contracts |
$– |
|
$– |
|
$– |
|
$– |
|
$30,321,652 |
|
$– |
|
$30,321,652 |
| Total |
$– |
|
$– |
|
$– |
|
$– |
|
$30,321,652 |
|
$– |
|
$30,321,652 |
Amounts listed as “–” are $0 or round to $0.
| |
Risk Exposure Category |
| |
Interest
Rate
Contracts |
|
Foreign
Currency
Contracts |
|
Credit
Contracts |
|
Equity
Contracts |
|
Commodity
Contracts |
|
Total |
| abrdn Bloomberg All Commodity Strategy K-1 Free ETF |
Realized Gain/(Loss) on Derivatives Recognized
as a Result of Operations: |
| Futures Contracts |
$– |
|
$– |
|
$– |
|
$– |
|
$(10,039,453) |
|
$(10,039,453) |
| Total |
$– |
|
$– |
|
$– |
|
$– |
|
$(10,039,453) |
|
$(10,039,453) |
Net Change in Unrealized Appreciation/Depreciation on
Derivatives Recognized as a Result of Operations: |
| Futures Contracts |
$– |
|
$– |
|
$– |
|
$– |
|
$10,468,035 |
|
$10,468,035 |
| Total |
$– |
|
$– |
|
$– |
|
$– |
|
$10,468,035 |
|
$10,468,035 |
Amounts listed as “–” are $0 or round to $0.
abrdn Bloomberg All Commodity Longer Dated Strategy K-1 Free ETF
| |
Risk Exposure Category |
| |
Interest
Rate
Contracts |
|
Foreign
Currency
Contracts |
|
Credit
Contracts |
|
Equity
Contracts |
|
Commodity
Contracts |
|
Other |
|
Total |
| abrdn Bloomberg All Commodity Longer Dated Strategy K-1 Free ETF |
| Assets: |
| Unrealized appreciation on: |
| Futures Contracts |
$– |
|
$– |
|
$– |
|
$– |
|
$8,173,607 |
|
$– |
|
$8,173,607 |
| Total |
$– |
|
$– |
|
$– |
|
$– |
|
$8,173,607 |
|
$– |
|
$8,173,607 |
| Liabilities: |
| Unrealized depreciation on: |
| Futures Contracts |
$– |
|
$– |
|
$– |
|
$– |
|
$8,109,856 |
|
$– |
|
$8,109,856 |
| Total |
$– |
|
$– |
|
$– |
|
$– |
|
$8,109,856 |
|
$– |
|
$8,109,856 |
Amounts listed as “–” are $0 or round to $0.
Notes to Consolidated Financial Statements (continued)
December 31, 2024
| |
Risk Exposure Category |
| |
Interest
Rate
Contracts |
|
Foreign
Currency
Contracts |
|
Credit
Contracts |
|
Equity
Contracts |
|
Commodity
Contracts |
|
Total |
| abrdn Bloomberg All Commodity Longer Dated Strategy K-1 Free ETF |
Realized Gain/(Loss) on Derivatives Recognized
as a Result of Operations: |
| Futures Contracts |
$– |
|
$– |
|
$– |
|
$– |
|
$(6,270,294) |
|
$(6,270,294) |
| Total |
$– |
|
$– |
|
$– |
|
$– |
|
$(6,270,294) |
|
$(6,270,294) |
Net Change in Unrealized Appreciation/Depreciation on
Derivatives Recognized as a Result of Operations: |
| Futures Contracts |
$– |
|
$– |
|
$– |
|
$– |
|
$5,812,499 |
|
$5,812,499 |
| Total |
$– |
|
$– |
|
$– |
|
$– |
|
$5,812,499 |
|
$5,812,499 |
Amounts listed as “–” are $0 or round to $0.
abrdn Bloomberg Industrial Metals Strategy K-1 Free ETF
| |
Risk Exposure Category |
| |
Interest
Rate
Contracts |
|
Foreign
Currency
Contracts |
|
Credit
Contracts |
|
Equity
Contracts |
|
Commodity
Contracts |
|
Other |
|
Total |
| abrdn Bloomberg Industrial Metals Strategy K-1 Free ETF |
| Assets: |
| Unrealized appreciation on: |
| Futures Contracts |
$– |
|
$– |
|
$– |
|
$– |
|
$496,546 |
|
$– |
|
$496,546 |
| Total |
$– |
|
$– |
|
$– |
|
$– |
|
$496,546 |
|
$– |
|
$496,546 |
| Liabilities: |
| Unrealized depreciation on: |
| Futures Contracts |
$– |
|
$– |
|
$– |
|
$– |
|
$1,755,887 |
|
$– |
|
$1,755,887 |
| Total |
$– |
|
$– |
|
$– |
|
$– |
|
$1,755,887 |
|
$– |
|
$1,755,887 |
Amounts listed as “–” are $0 or round to $0.
| |
Risk Exposure Category |
| |
Interest
Rate
Contracts |
|
Foreign
Currency
Contracts |
|
Credit
Contracts |
|
Equity
Contracts |
|
Commodity
Contracts |
|
Total |
| abrdn Bloomberg Industrial Metals Strategy K-1 Free ETF |
Realized Gain/(Loss) on Derivatives Recognized
as a Result of Operations: |
| Futures Contracts |
$– |
|
$– |
|
$– |
|
$– |
|
$1,453,221 |
|
$1,453,221 |
| Total |
$– |
|
$– |
|
$– |
|
$– |
|
$1,453,221 |
|
$1,453,221 |
Net Change in Unrealized Appreciation/Depreciation on
Derivatives Recognized as a Result of Operations: |
| Futures Contracts |
$– |
|
$– |
|
$– |
|
$– |
|
$(1,902,775) |
|
$(1,902,775) |
| Total |
$– |
|
$– |
|
$– |
|
$– |
|
$(1,902,775) |
|
$(1,902,775) |
Amounts listed as “–” are $0 or round to $0.
Notes to Consolidated Financial Statements (continued)
December 31, 2024
Taxes and Distributions
Each Fund intends to continue to qualify as a regulated investment company (a "RIC") by complying with the requirements under Subchapter M of the Internal Revenue Code of 1986, as amended (the "Code"), which includes distributing substantially all of its net investment income and net capital gains to its shareholders. Accordingly, no federal income tax provision is required in the financial statements.
The Subsidiaries are exempted Cayman investment companies and as such are not subject to Cayman Island taxes at the present time. For U.S. income tax purposes, the Subsidiaries are controlled foreign corporations not subject to U.S. income taxes. As wholly- owned controlled foreign corporations, the Subsidiaries’ net income and capital gains, if any, will be included each year in the Funds’ investment company taxable income.
As of December 31, 2024, management of the Funds has reviewed all open tax years and major jurisdictions and concluded that there is no tax liability resulting from unrecognized tax benefits relating to uncertain income tax positions taken or expected to be taken in future tax returns. The Funds’ conclusions may be subject to future review based on changes in, or the interpretation of, the accounting standards or tax laws and regulations. The management of the Funds is also not aware of any tax positions for which it is reasonably possible that the total amounts of unrecognized tax benefits will significantly change in the next twelve months.
The Funds pay out dividends and distribute net capital gains, if any, to shareholders at least annually. Ordinarily, dividends from net investment income, if any, are declared and paid annually by each Fund. Each Fund also intends to distribute its net realized capital gains, if any, to shareholders annually. These distributions may be taxed as ordinary income or capital gains.
The tax character of the distributions paid for the tax years ended December 31, 2024 and December 31, 2023 were as follows:
| |
|
Year Ended December 31, 2024 |
|
Year Ended December 31, 2023 |
| |
|
Distributions
paid from
ordinary
income |
|
Distributions
paid from
net long term
capital gains |
|
Tax return
of captial |
|
Total
Distributions |
|
Distributions
paid from
ordinary
income |
|
Distributions
paid from
net long term
capital gains |
|
Tax return
of captial |
|
Total
Distributions |
| abrdn Bloomberg All Commodity Strategy K-1 Free ETF |
|
$40,668,594 |
|
$– |
|
$96,508 |
|
$40,765,102 |
|
$31,685,215 |
|
$– |
|
$140,888 |
|
$31,826,103 |
| abrdn Bloomberg All Commodity Longer Dated Strategy K-1 Free ETF |
|
8,441,934 |
|
– |
|
75,750 |
|
8,517,684 |
|
9,635,199 |
|
– |
|
94,578 |
|
9,729,777 |
| abrdn Bloomberg Industrial Metals Strategy K-1 Free ETF |
|
2,062,988 |
|
– |
|
3,988 |
|
2,066,976 |
|
797,588 |
|
– |
|
– |
|
797,588 |
| |
|
|
|
|
|
|
|
|
|
|
|
|
|
|
|
|
| |
|
|
|
|
|
|
|
|
|
|
|
|
|
|
|
|
Amounts listed as “–” are $0 or round to $0.
At December 31, 2024, the components of accumulated earnings (deficit) on tax basis were as follows:
| Fund |
|
Undistributed
Ordinary
Income |
|
Undistributed
Long-Term
Capital Gains |
|
Accumulated
Capital and
Other Losses |
|
Unrealized
Appreciation/
(Depreciation) |
| abrdn Bloomberg All Commodity Strategy K-1 Free ETF |
|
$– |
|
$– |
|
$(376,422) |
|
$520,556 |
| abrdn Bloomberg All Commodity Longer Dated Strategy K-1 Free ETF |
|
– |
|
– |
|
(114,098) |
|
(307,099) |
| abrdn Bloomberg Industrial Metals Strategy K-1 Free ETF |
|
– |
|
– |
|
(32,150) |
|
(1,464,829) |
Amounts listed as “–” are $0 or round to $0.
Notes to Consolidated Financial Statements (continued)
December 31, 2024
Permanent differences, primarily due to income and gain/loss from investments in the Subsidiaries, resulted in the following reclassifications as of December 31, 2024, among the Funds’ components of net assets:
| Fund |
|
Paid-in
Capital |
|
Distributable
Earnings/
(Accumulated
Loss) |
| abrdn Bloomberg All Commodity Strategy K-1 Free ETF |
|
$(2,069,731) |
|
$2,069,731 |
| abrdn Bloomberg All Commodity Longer Dated Strategy K-1 Free ETF |
|
(2,795,205) |
|
2,795,205 |
| abrdn Bloomberg Industrial Metals Strategy K-1 Free ETF |
|
1,086,345 |
|
(1,086,345) |
For the tax year ended December 31, 2024, following Funds had available capital loss carryforwards with no expiration date to offset future net capital gains to the extent provided by regulations:
| Fund |
|
Short-Term |
|
Total |
| abrdn Bloomberg All Commodity Strategy K-1 Free ETF |
|
$376,422 |
|
$376,422 |
| abrdn Bloomberg All Commodity Longer Dated Strategy K-1 Free ETF |
|
114,098 |
|
114,098 |
| abrdn Bloomberg Industrial Metals Strategy K-1 Free ETF |
|
32,150 |
|
32,150 |
Under current tax rules, Regulated Investment Companies can elect to treat certain post-October capital losses (capital losses realized after October 31) as arising on the first day of the following taxable year. As of December 31, 2024, none of the Funds had post-October capital losses.
3. Investment Transactions and Related Income and Expenses
Throughout the reporting period, investment transactions are recorded on trade date.
Interest income is recognized on an accrual basis. Dividend income is recorded on the ex-dividend date, or as soon as information is available. Gains or losses realized on sales of securities are determined using the specific identification method by comparing the identified cost of the security lot sold with the net sales proceeds. Discounts and premiums on securities purchased are accreted and amortized over the lives of the respective securities.
4. Transactions with Related Parties, Investment Advisory Fees
Under the terms of the Trust’s Investment Advisory Agreement (the “Investment Advisory Agreement”), the Advisor is subject to the supervision of the Board and is responsible for the day-to-day business of the Funds, including the day-to-day management of risk of the Funds in accordance with each Fund’s investment objectives and policies. As compensation for its advisory services and assumption of each Fund’s expenses, the Advisor is entitled to a management fee, computed daily and payable monthly, at an annual rate of 0.25% (abrdn Bloomberg All Commodity Strategy K-1 Free ETF), 0.29% (abrdn Bloomberg All Commodity Longer Dated Strategy K-1 Free ETF) and 0.39% (abrdn Bloomberg Industrial Metals Strategy K-1 Free ETF) of average daily net assets of the applicable Fund and its Subsidiary.
Pursuant to the Investment Advisory Agreement, the Advisor has agreed to pay all expenses of the Funds, including the fees payable to the Sub-Advisor, except for: (i) brokerage expenses and other fees, charges, taxes, levies or expenses (such as stamp taxes) incurred in connection with the execution of portfolio transactions or in connection with creation and redemption transactions (including without limitation any fees, charges, taxes, levies or expenses related to the purchase or sale of an amount of any currency, or the patriation or repatriation of any security or other asset, related to the execution of portfolio transactions or any creation or redemption transactions); (ii) legal fees or expenses in connection with any arbitration, litigation or pending or threatened arbitration or litigation, including any settlements in connection therewith; (iii) compensation and expenses of counsel to the Trustees of the Trust who are not officers, directors/trustees, partners or employees of the Advisor or its affiliates (the “Independent Trustees”); (iv) compensation and expenses of the Trust’s CCO (although, currently, the Advisor is voluntarily paying this expense); (v) extraordinary expenses (in each case as determined by a majority of the Independent Trustees); (vi) distribution fees and expenses paid by the Trust under any distribution plan adopted pursuant to Rule 12b-1 under the 1940 Act; (vii) interest and taxes of any kind or nature (including, but not limited to, income, excise, transfer and withholding taxes); (viii) any fees and expenses related to the provision of securities lending services; and (ix) the advisory fee payable to the Advisor. The expenses of the Funds for which the Advisor has agreed to pay pursuant to the Investment
Notes to Consolidated Financial Statements (continued)
December 31, 2024
Advisory Agreement are referred to as “Covered Expenses”. The internal expenses of pooled investment vehicles (such as exchange-traded funds and other unaffiliated investment companies) in which a Fund may invest (acquired fund fees and expenses) are not expenses of the Fund and are not paid by the Advisor.
The Advisor also serves as advisor to each Fund’s Subsidiary and each Subsidiary pays a proportion of the management fee of the Advisor. Pursuant to the investment advisory agreement between each Fund's Subsidiary and the Advisor, the Advisor has agreed to pay all expenses incurred by the Subsidiary except for: (i) brokerage expenses and other fees, charges, taxes, levies or expenses (such as stamp taxes) incurred in connection with the execution of portfolio transactions (including without limitation any fees, charges, taxes, levies or expenses related to the purchase or sale of an amount of any currency, or the patriation or repatriation of any security or other asset, related to the execution of portfolio transactions); (ii) extraordinary expenses (in each case as determined by a majority of the Independent Trustees); (iii) interest and taxes of any kind or nature (including, but not limited to, income, excise, transfer and withholding taxes); and (iv) the advisory fee payable by the Subsidiary to the Advisor. The advisory fee paid by each Fund is based on the Fund’s average daily net assets, which includes the net assets of the relevant Subsidiary. In recognition of this, the Advisor has contractually agreed to waive the management fees that it receives from the Funds in an amount equal to the management fees paid to the Advisor by the Subsidiaries. This undertaking will continue for so long as the Funds invest in the Subsidiaries and may be terminated only with the approval of the Board, except that it would terminate automatically if the Investment Advisory Agreement with the Trust terminates.
A Trustee and certain Officers of the Trust are employees of the Advisor or its affiliates, or the Administrator.
Under the sub-advisory agreement between the Advisor and the Sub-Advisor (the “Sub-Advisory Agreement”), the Sub-Advisor is responsible for trading portfolio securities on behalf of the Funds, including selecting broker-dealers to execute purchase and sale transactions or in connection with any rebalancing or reconstitution of the Index, subject to the supervision of the Advisor and the Board. Under the Sub-Advisory Agreement, the Advisor pays the Sub-Advisor a fee, calculated daily and paid monthly, at an annual rate based on a percentage of the average daily net assets of each Fund, subject to a minimum annual fee, as set forth below:
| Fund |
|
Annual Rate |
|
Minimum Annual Fee |
| abrdn Bloomberg Industrial Metals Strategy K-1 Free ETF |
|
0.055% on first $250 million |
|
$18,000 |
| 0.045% on next $250 million |
|
|
| 0.04% on assets over $500 million |
|
|
| abrdn Bloomberg All Commodity Strategy K-1 Free ETF |
|
0.04% |
|
$18,000 |
| abrdn Bloomberg All Commodity Longer Dated Strategy K-1 Free ETF |
|
0.04% |
|
$18,000 |
5. Administration Fees
abrdn Inc. (the “Administrator”) serves as the Funds’ administrator, and State Street Bank and Trust Company (the “Sub-Administrator”) serves as sub-administrator. The Sub-Administrator provides certain administrative services to the Funds. For these services, the Sub-Administrator is entitled to certain fees and reasonable out-of-pocket expenses. These fees and expenses are Covered Expenses that are paid by the Advisor as described above.
6. Custodian Fees
State Street Bank and Trust Company (the “Custodian”) serves as custodian for the Funds in accordance with a Master Custody Agreement. The Custodian holds cash, securities and other assets of the Funds as required by the 1940 Act. As compensation for the services rendered under the agreement, the Custodian is entitled to fees and reasonable out-of-pocket expenses. These fees and expenses are Covered Expenses that are paid by the Advisor as described above.
7. Trustees Fees
The Advisor pays the compensation for the Independent Trustees of the Trust. Effective January 1, 2024, each Independent Trustee receives an aggregate fee consisting of a $50,000 annual retainer and a $5,000 per meeting fee, payable quarterly, plus expenses, for his or her service as an Independent Trustee of the Trust and as a member of any Board committees. These fees and expenses are Covered Expenses that are paid by the Advisor as described above.
Notes to Consolidated Financial Statements (continued)
December 31, 2024
8. Distribution and Service Plan
ALPS Distributors, Inc. (the “Distributor”) serves as the Funds’ distributor and distributes Creation Units (as defined in Note 9). Each Fund has adopted a Distribution and Service Plan pursuant to Rule 12b-1 under the 1940 Act pursuant to which payment of up to 0.25% of average daily net assets may be made. However, no such fee is currently paid by the Funds. This fee is not a Covered Expense and therefore, if charged by the Distributor, it would be paid by the Funds.
9. Issuance and Redemption of Fund Shares
Each Fund issues and redeems shares only to Authorized Participants (typically market makers, large investors and institutions) that have entered into agreements with the Fund’s Distributor (“Authorized Participants” or, individually, an “Authorized Participant”) in exchange for the deposit or delivery of assets (securities and/or cash), in large blocks known as creation units ("Creation Units"), each of which is comprised of a specified number of shares. Retail investors may only purchase and sell Fund shares on a national securities exchange through a broker-dealer and such transaction may be subject to customary commission rates imposed by the broker-dealer. Information related to share transactions for each Fund during the reporting period is presented on the Consolidated Statements of Changes in Net Assets. The Funds each offer one class of shares, which has no front end sales load, no deferred sales charge and no redemption fee.
Creation/Redemption Transaction Fee. A transaction fee, as set forth in the table below, is imposed for the transfer and other transaction costs associated with the purchase or redemption of Creation Units, as applicable. Authorized Participants will be required to pay a fixed creation transaction fee and/or a fixed redemption transaction fee, as applicable, on a given day regardless of the number of Creation Units created or redeemed on that day. Each Fund may adjust the transaction fee from time to time, and a Fund may waive all or a portion of its applicable transaction fee(s). An additional charge or a variable charge (discussed below) will be applied to certain creation and redemption transactions, including non-standard orders and whole or partial cash purchases or redemptions. With respect to creation orders, Authorized Participants are responsible for the costs of transferring the securities constituting the Deposit Securities to the account of the applicable Fund and with respect to redemption orders, Authorized Participants are responsible for the costs of transferring the applicable Fund Securities from the Trust to their account or on their order. Investors who use the services of a broker or other such intermediary may also be charged a fee for such services. To the extent a Fund cannot recoup the amount of transaction costs incurred in connection with a purchase or redemption because of the 2% transaction fee cap or otherwise, those transaction costs will be borne by the Fund and negatively affect the Fund’s performance. Currently, the Funds only accept cash for the purchase or redemption of Creation Units.
Creation and Redemption Transaction Fees:
| Fund |
|
Transaction
Fee* |
|
Maximun
Transaction
Fee** |
| abrdn Bloomberg All Commodity Strategy K-1 Free ETF |
|
$100 |
|
2% |
| abrdn Bloomberg All Commodity Longer Dated Strategy K-1 Free ETF |
|
100 |
|
2 |
| abrdn Bloomberg Industrial Metals Strategy K-1 Free ETF |
|
100 |
|
2 |
|
| * |
An additional charge of up to three (3) times the standard transaction fee may be charged to the extent a transaction is outside of the clearing process. |
| ** |
In addition to the transaction fees listed above, a Fund may charge an additional variable fee for creations and redemptions in cash to offset brokerage and impact expenses associated with the cash transaction. The variable transaction fee will be calculated based on historical transaction cost data and the Advisor’s view of current market conditions; however, the actual variable fee charged for a given transaction may be lower or higher than the trading expenses incurred by a Fund with respect to that transaction. |
10. Investment Transactions
For the fiscal year ended December 31, 2024, there were no costs associated with securities purchased or proceeds from sales of securities as all of the operational Funds were invested in short-term securities only.
Notes to Consolidated Financial Statements (continued)
December 31, 2024
11. In-Kind Transactions
Each Fund may deliver its investment securities in exchange for the redemption of shares (redemptions-in-kind). Cash and securities can be transferred for redemptions at fair value. For financial reporting purposes, each Fund records net realized gains and losses in connection with each transaction. Each Fund may also receive securities in exchange for subscriptions of shares (subscriptions-in-kind). For the fiscal year ended December 31, 2024, there were no in-kind transactions.
12. Principal Risks
The Funds’ investments are subject to a variety of risks that may cause the Funds’ NAVs to fluctuate over time. Therefore, the value of an investment in the Funds could decline and an investor could lose money. Also, there is no assurance that the Advisor or the Sub-Advisor will achieve the Funds’ objectives. Below are some of the principal risks of investing in the Funds. Please refer to the Funds’ prospectus for a full discussion.
a. Market Risk
The prices of the assets in which the Funds invest may decline for a number of reasons, including in response to local, regional or global economic developments, war, acts of terrorism, the spread of infectious illness or other public health issues, or other events.
b. Commodity Price Risk
The NAV of a Fund will be affected by movements in commodity prices generally and by the way in which those prices and other factors affect the prices of the commodity futures contracts. Commodity prices generally may fluctuate widely and may be affected by numerous factors.
c. Commodity Sector Risks
The daily performance of the current, or "spot", price of certain commodities has a direct impact on Fund performance. To the extent that a Fund has significant exposure to a particular commodity sector, the Fund may be more susceptible to loss due to adverse occurrences affecting that sector, including a decline in the price of commodities in such sector.
| • |
Agricultural Sector Investment Risk. The daily performance of the spot price of certain agricultural commodities has a direct impact on Fund performance. Investments in the agriculture sector may be highly volatile and the market values of such commodities can change quickly and unpredictably due to a number of factors, such as the supply of, and demand for, each commodity, the strength of the domestic and global economy, legislative or regulatory developments relating to food safety, the imposition of tariffs and other restraints on trade, as well as other significant events, including public health, political, legal, financial, accounting and tax matters that are beyond the Fund’s control. In addition, increased competition caused by economic recession, labor difficulties and changing consumer tastes and spending can impact the demand for agricultural products and, in turn, the value of such investments. |
| • |
Energy Sector Investment Risk. The daily performance of the spot price of certain energy-related commodities has a direct impact on Fund performance. Energy commodities’ market values are significantly impacted by a number of factors, such as the supply of, and demand for, each commodity, the strength of the domestic and global economy, significant world events, wars or armed conflicts in geographic areas where energy infrastructures and resources are concentrated, capital expenditures on exploration and production, energy conservation efforts, government regulation and subsidization and technological advances. Investments in the energy sector may be cyclical and/or highly volatile and subject to swift price fluctuations. In addition, significant declines in the price of oil may contribute to significant market volatility, which may adversely affect the Fund’s performance. The energy sector has recently experienced significant volatility due to dramatic changes in the prices of energy commodities, and it is possible that such volatility will continue in the future. |
| • |
Metals Sector Investment Risk.The daily performance of the spot price of certain industrial and precious metals has a direct impact on Fund performance. Investments in metals may be highly volatile and the market values of such commodities can change quickly and unpredictably due to a number of factors, such as the supply of, and demand for, each metal, the strength of the domestic and global economy, international monetary policy, environmental or labor costs, as well as other significant events, including public health, war or armed conflict, political, legal, financial, accounting and tax matters that are beyond the Fund’s control. The United States or foreign governments may pass laws or regulations limiting metal investments for strategic or other policy reasons. Further, the principal supplies of metal industries may be concentrated in a small number of countries and regions. |
Notes to Consolidated Financial Statements (continued)
December 31, 2024
d. Passive Management Risk
Because the Funds are not “actively” managed, unless a specific security is removed from the Index, the Funds generally would not sell an investment because of the investment’s performance. Additionally, unusual market conditions may cause the Index provider to postpone a scheduled rebalance or reconstitution, which could cause the Index to vary from its normal or expected composition. Therefore, a Fund’s performance could be lower than funds that may actively shift their portfolio assets to take advantage of market opportunities or to lessen the impact of a market decline or a decline in the value of one or more investments. As the Fund may not fully replicate the Index, it is subject to the risk that the investment strategy of the Advisor or Sub-Advisor may not produce the intended results.
e. Index Tracking Risk
As with all index funds, the performance of a Fund and the Index may differ from each other for a variety of reasons. For example, the Fund incurs operating expenses and portfolio transaction costs not incurred by the Index. Index tracking risk may also occur because of differences between the investments held in the Fund’s portfolio and those included in the Index, pricing differences (including, as applicable, differences between a security’s price at the local market close and the Fund’s valuation of a security at the time of calculation of the Fund’s NAV), differences in transaction costs, the Fund’s holding of uninvested cash, differences in timing of the accrual of dividends or interest, the requirements to maintain pass-through tax treatment, portfolio transactions carried out to minimize the distribution of capital gains to shareholders, changes to the Index or the need to meet various new or existing regulatory requirements, among other reasons. Moreover, the Fund may be delayed in purchasing or selling investments included in the Index. In addition, the Fund may not be fully invested in the investments included in the Index at all times or may hold investments that are not included in the Index. In addition, the Fund’s use of a representative sampling approach may cause the Fund to not track the return of the Index as would be the case if the Fund purchased all of the instruments in the Index, or invested in them in the exact proportions in which they are represented in the Index. Index tracking risk may be heightened during times of increased market volatility or other unusual market conditions. Index ETFs that track indices with significant weight in futures contracts issuers may experience higher index tracking risk than other index ETFs that do not track such indices.
f. Index-Related Risk
There is no guarantee that a Fund’s investment results will closely correspond, before fees and taxes, to the performance of the Index or that the Fund will achieve its investment objective. Market disruptions and regulatory restrictions could have an adverse effect on the Fund’s ability to track the Index. Errors in index data, index computations or the construction of the Index in accordance with its methodology may occur from time to time and may not be identified and corrected by the Index Provider for a period of time or at all, which may have an adverse impact on the Fund and its shareholders. Unusual market conditions may cause the Index Provider to postpone a scheduled rebalance, which could cause the Index to vary from its normal or expected composition.
g. Fixed-Income Securities Risk
Fixed income securities fluctuate in price based on changes in an issuer’s financial condition and overall market and economic conditions, such as real or perceived adverse economic or political conditions, inflation, changes in interest or currency rates, lack of liquidity in the bond markets or adverse investor sentiment. The value of a security may also fall due to specific conditions that affect a particular sector of the securities market or a particular issuer. Fixed income securities are subject to, among other risks, credit risk, interest rate risk, inflation risk, market risk, liquidity risk, extension risk, and prepayment risk..
h. Money Market Risk
Money market instruments may be subject to market risk and credit risk. There is no guarantee that money market instruments will maintain their value.
i. Futures Contracts Risk
The primary risks associated with the use of futures contracts, or swaps or other derivatives referencing futures contracts, are: (i) an imperfect correlation between the value of the futures contract and the value of the underlying commodity; (ii) possible lack of a liquid secondary market for a futures contract; (iii) the inability to open or close a futures contract or cash commodity position when desired; (iv) losses caused by unanticipated market movement, which may result in losses in excess of the amount invested in the futures contract (and potentially may be unlimited); (v) in the event of adverse price movements, an obligation of the Fund to make daily cash payments to maintain its required margin, including at times when it may have insufficient cash and must sell securities from its
Notes to Consolidated Financial Statements (concluded)
December 31, 2024
portfolio to meet those margin requirements at a disadvantageous time; (vi) the possibility that a failure to close a position may result in delivery of an illiquid commodity to the Fund; and (vii) the possibility that rapid selling to avoid delivery of a commodity may result in unfavorable execution prices. Although it is intended that the Fund will only enter into futures contracts if there is an active market for such contracts, there is no assurance that an active market will exist for the contracts at any particular time.
j. Roll Yield
During situations where the cost of any futures contracts for delivery on dates further in the future is higher than those for delivery closer in time, the value of the Funds holding such contracts will decrease over time unless the spot price of that contract increases by the same rate as the rate of the variation in the price of the futures contract. The rate of variation could be quite significant and last for an indeterminate period of time, reducing the value of a Fund.
k. Small Fund Risk (abrdn Bloomberg Industrial Metals Strategy K-1 Free ETF)
There can be no assurance that the Fund will grow to or maintain a viable size. Due to the Fund's small asset base, certain of the Fund's expenses and its portfolio transaction costs may be higher than those of a fund with a larger asset base. To the extent that the Fund does not grow to or maintain a viable size, it may be liquidated, and the expenses, timing and tax consequences of such liquidation may not be favorable to some shareholders.
13. Indemnifications
Under the Trust’s organizational documents, the Trustees (and its directors, employees and agents) and the Advisor (and its members, managers, directors, officers, employees and affiliates) are indemnified by the Trust against any liability, cost or expense it incurs without gross negligence, bad faith or willful misconduct on its part and without reckless disregard on its part of its obligations and duties. The Trust’s maximum exposure under these arrangements is unknown as this would involve future claims that may be made against the Trust that have not yet occurred. However, the Funds expect the risk of loss to be remote.
14. Advisor Beneficial Ownership
A person who beneficially owns, directly or indirectly, 25% or more of the voting securities of a Fund may be deemed to “control” (as defined in the 1940 Act) that Fund, and may be able to exercise a controlling influence over any matter submitted to shareholders of that Fund. As of December 31, 2024, the Advisor or its affiliates owned 40.56% of the outstanding shares of the abrdn Bloomberg Industrial Metals Strategy K-1 Free ETF. Accordingly, the Advisor and its affiliates may be deemed to “control” the abrdn Bloomberg Industrial Metals Strategy K-1 Free ETF as of that date.
15. Segment Reporting
In this reporting period, the Trust adopted FASB Accounting Standards Update 2023-07, Segment Reporting (Topic 280) - Improvements to Reportable Segment Disclosures (“ASU 2023-07”). Adoption of the new standard impacted disclosures only and did not affect the Funds' financial position nor the results of its operations. Operating segments are components of a public entity that engage in business activities from which it may recognize revenues and incur expenses, have discrete financial information available, and have their operating results regularly reviewed by the public entity’s chief operating decision maker (“CODM”) when assessing segment performance and making decisions about segment resources. The Chief Financial Officer of the Funds acts as the Funds' CODM. The CODM monitors the operating results of the Funds as a whole, and the Funds' asset allocation is managed in accordance with its Prospectus. Each Fund operates as a single operating and reporting segment pursuant to its investment objective and principal investment strategy. Each Fund's portfolio composition, total returns, expense ratios and changes in net assets used by the CODM to assess segment performance and make resource allocations are consistent with the information presented within the Funds' financial statements. Segment assets are reflected on the Funds' Statement of Assets and Liabilities as “Total Assets” and significant segment expenses are listed on the Statement of Operations.
16. Subsequent Events
Management has evaluated subsequent events for the Funds through the date the financial statements were issued, and has concluded that there were no material subsequent events requiring adjustment to or disclosure in these consolidated financial statements.
Report of Independent Registered Public Accounting Firm
To the Shareholders and Board of Trustees of abrdn ETFs
Opinion on the Financial Statements
We have audited the accompanying consolidated statements of assets and liabilities, including the consolidated schedules of portfolio investments, of abrdn ETFs comprising the funds listed below (the “Funds”) as of December 31, 2024, the related consolidated statements of operations, the consolidated statements of changes in net assets, the consolidated financial highlights for each of the periods indicated below, and the related notes (collectively referred to as the “financial statements”). In our opinion, the financial statements present fairly, in all material respects, the financial position of each of the Funds as of December 31, 2024, the results of their operations, the changes in net assets, and the financial highlights for each of the periods indicated below in conformity with accounting principles generally accepted in the United States of America.
| Fund Name |
Consolidated Statements
of Operations |
Consolidated Statements
of Changes in Net Assets |
Consolidated
Financial Highlights |
| abrdn Bloomberg All Commodity Strategy K-1 Free ETF and abrdn Bloomberg All Commodity Longer Dated Strategy K-1 Free ETF |
For the year ended
December 31, 2024 |
For the years ended
December 31, 2024 and 2023 |
For the years ended December 31, 2024,
2023, 2022, 2021, and 2020 |
abrdn Bloomberg Industrial Metals
Strategy K-1 Free ETF |
For the year ended
December 31, 2024 |
For the years ended
December 31, 2024 and 2023 |
For the years ended December 31, 2024, 2023 and 2022 and for the period from September 22, 2021 (commencement of operations) through December 31, 2021 |
Basis for Opinion
These financial statements are the responsibility of the Funds’ management. Our responsibility is to express an opinion on the Funds’ financial statements based on our audits. We are a public accounting firm registered with the Public Company Accounting Oversight Board (United States) (“PCAOB”) and are required to be independent with respect to the Funds in accordance with the U.S. federal securities laws and the applicable rules and regulations of the Securities and Exchange Commission and the PCAOB.
We conducted our audits in accordance with the standards of the PCAOB. Those standards require that we plan and perform the audit to obtain reasonable assurance about whether the financial statements are free of material misstatement whether due to error or fraud.
Our audits included performing procedures to assess the risks of material misstatement of the financial statements, whether due to error or fraud, and performing procedures that respond to those risks. Such procedures included examining, on a test basis, evidence regarding the amounts and disclosures in the financial statements. Our procedures included confirmation of securities owned as of December 31, 2024, by correspondence with the custodian and brokers; when replies were not received from brokers, we performed other auditing procedures. Our audits also included evaluating the accounting principles used and significant estimates made by management, as well as evaluating the overall presentation of the financial statements. We believe that our audits provide a reasonable basis for our opinion.
We have served as the Funds’ auditor since 2017.
COHEN & COMPANY, LTD.
Milwaukee, Wisconsin
February 27, 2025
Tax Information
December 31, 2024 (Unaudited)
Treasury Income
For the year ended December 31, 2024, the percentage of income earned from direct U.S. Treasury obligations approximately amounted to the following:
| Fund |
|
Percentage |
| abrdn Bloomberg All Commodity Strategy K-1 Free ETF |
|
89.95% |
| abrdn Bloomberg All Commodity Longer Dated Strategy K-1 Free ETF |
|
89.06 |
| abrdn Bloomberg Industrial Metals Strategy K-1 Free ETF |
|
35.39 |
abrdn ETFs
Changes in and Disagreements with Accountants for Open-End Management Investment Companies (Unaudited)
There were no changes in or disagreements with accountants during the period covered by this report.
abrdn ETFs
Proxy Disclosures for Open-End Management Investment Companies (Unaudited)
There were no matters submitted to a vote of shareholders during the period covered by this report.
abrdn ETFs
Remuneration Paid to Directors, Officers, and Others of Open-End Management Investment Companies (Unaudited)
All fund expenses, including Trustee compensation, is paid by the Advisor pursuant to the Investment Advisory Agreement. Additional information related to those fees is available in the Funds’ Statement of Additional Information.
abrdn ETFs
c/o ALPS Distributors, Inc.
1290 Broadway, Suite 1100
Denver, Colorado 80203
Must be accompanied or preceded by a Prospectus.
Distributor: ALPS Distributors, Inc.
|
(b) |
Included in the response to Item 7(a) of this Form N-CSR. |
Item 8. Changes in and Disagreements with Accountants for Open-End Management Investment Companies.
Not applicable.
Item 9. Proxy Disclosures for Open-End Management Investment Companies.
Not applicable.
Item 10. Remuneration Paid to Directors, Officers, and Others of Open-End Management Investment Companies.
Included in the response to Item 7 of this Form N-CSR.
Item 11. Statement Regarding Basis for Approval of Investment Advisory Contract.
Not applicable.
Item 12. Disclosure of Proxy Voting Policies and Procedures for Closed-End Management Investment Companies.
Not applicable.
Item 13. Portfolio Managers of Closed-End Management Investment Companies.
Not applicable.
Item 14. Purchase of Equity Securities by Closed-End Management Investment Company and Affiliated Purchasers.
Not applicable.
Item 15. Submission of Matters to a Vote of Security Holders.
During the period ended December 31, 2024, there were no material changes to the procedures by which shareholders may recommend nominees to the Registrant’s Board of Trustees.
Item 16. Controls and Procedures.
| (a) |
The Registrant’s principal executive officer and principal financial officer, or persons performing similar functions, have concluded that the Registrant’s disclosure controls and procedures (as defined in Rule 30a-3(c) under the Investment Company Act of 1940 (the “1940 Act”)) are effective, based on the evaluation of these controls and procedures required by Rule 30a-3(b) under the 1940 Act and Rules 13a-15(b) or 15d-15(b) under the Securities Exchange Act of 1934 as of a date within 90 days of the filing date of this report. |
| |
|
| (b) |
There were no changes in the Registrant’s internal control over financial reporting (as defined in Rule 30a - 3(d) under the 1940 Act) that occurred during the period covered by this report that have materially affected, or are reasonably likely to materially affect, the Registrant’s internal control over financial reporting. |
Item 17. Disclosure of Securities Lending Activities for Closed-End Management Investment Companies
Not applicable.
Item 18. Recovery of Erroneously Awarded Compensation
Not applicable.
Item 19. Exhibits.
SIGNATURES
Pursuant to the requirements of the Securities Exchange Act of 1934 and the Investment Company Act of 1940, the registrant has duly caused this report to be signed on its behalf by the undersigned, thereunto duly authorized.
abrdn ETFs
| By: |
/s/ Alan Goodson |
|
| |
Alan Goodson |
|
| |
President |
|
| |
March 10, 2025 |
|
Pursuant to the requirements of the Securities Exchange Act of 1934 and the Investment Company Act of 1940, this report has been signed below by the following persons on behalf of the registrant and in the capacities and on the dates indicated.
| By: |
/s/ Alan Goodson |
|
| |
Alan Goodson |
|
| |
President |
|
| |
March 10, 2025 |
|
| |
|
|
| By: |
/s/ Michael Marsico |
|
| |
Michael Marsico |
|
| |
Treasurer and Principal Financial Officer |
|
| |
March 10, 2025 |
|