FALSE2023Q2Catalent, Inc.6/30FALSEFALSE00015967830.010.011,000,000,0001,000,000,000180,000,000179,000,000180,000,000179,000,0000.010.01100,000,000100,000,000————26291,4651,347SUBSEQUENT EVENTS00015967832022-07-012022-12-3100015967832023-01-31xbrli:shares00015967832022-12-31iso4217:USDxbrli:shares00015967832022-10-012022-12-31iso4217:USD00015967832021-10-012021-12-3100015967832021-07-012021-12-310001596783us-gaap:RetainedEarningsMember2021-10-012021-12-310001596783us-gaap:RetainedEarningsMember2021-07-012021-12-310001596783us-gaap:AccumulatedTranslationAdjustmentMember2022-10-012022-12-310001596783us-gaap:AccumulatedTranslationAdjustmentMember2022-07-012022-12-310001596783us-gaap:AccumulatedDefinedBenefitPlansAdjustmentMember2022-10-012022-12-310001596783us-gaap:AccumulatedDefinedBenefitPlansAdjustmentMember2022-07-012022-12-310001596783ctlt:ACOIAccumulatedGainLossMarketableSecuritiesMember2021-10-012021-12-310001596783ctlt:ACOIAccumulatedGainLossMarketableSecuritiesMember2022-07-012022-12-310001596783ctlt:ACOIAccumulatedGainLossMarketableSecuritiesMember2021-07-012021-12-3100015967832022-06-300001596783us-gaap:CommonStockMember2022-09-300001596783us-gaap:AdditionalPaidInCapitalMember2022-09-300001596783us-gaap:RetainedEarningsMember2022-09-300001596783us-gaap:AccumulatedOtherComprehensiveIncomeMember2022-09-3000015967832022-09-300001596783us-gaap:CommonStockMember2022-10-012022-12-310001596783us-gaap:AdditionalPaidInCapitalMember2022-10-012022-12-310001596783us-gaap:RetainedEarningsMember2022-10-012022-12-310001596783us-gaap:AccumulatedOtherComprehensiveIncomeMember2022-10-012022-12-310001596783us-gaap:CommonStockMember2022-12-310001596783us-gaap:AdditionalPaidInCapitalMember2022-12-310001596783us-gaap:RetainedEarningsMember2022-12-310001596783us-gaap:AccumulatedOtherComprehensiveIncomeMember2022-12-310001596783us-gaap:CommonStockMember2021-09-300001596783us-gaap:AdditionalPaidInCapitalMember2021-09-300001596783us-gaap:RetainedEarningsMember2021-09-300001596783us-gaap:AccumulatedOtherComprehensiveIncomeMember2021-09-3000015967832021-09-300001596783us-gaap:CommonStockMember2021-10-012021-12-310001596783us-gaap:AdditionalPaidInCapitalMember2021-10-012021-12-310001596783us-gaap:AccumulatedOtherComprehensiveIncomeMember2021-10-012021-12-310001596783us-gaap:CommonStockMember2021-12-310001596783us-gaap:AdditionalPaidInCapitalMember2021-12-310001596783us-gaap:RetainedEarningsMember2021-12-310001596783us-gaap:AccumulatedOtherComprehensiveIncomeMember2021-12-3100015967832021-12-310001596783us-gaap:CommonStockMember2022-06-300001596783us-gaap:AdditionalPaidInCapitalMember2022-06-300001596783us-gaap:RetainedEarningsMember2022-06-300001596783us-gaap:AccumulatedOtherComprehensiveIncomeMember2022-06-300001596783us-gaap:CommonStockMember2022-07-012022-12-310001596783us-gaap:AdditionalPaidInCapitalMember2022-07-012022-12-310001596783us-gaap:RetainedEarningsMember2022-07-012022-12-310001596783us-gaap:AccumulatedOtherComprehensiveIncomeMember2022-07-012022-12-310001596783us-gaap:CommonStockMember2021-06-300001596783us-gaap:AdditionalPaidInCapitalMember2021-06-300001596783us-gaap:RetainedEarningsMember2021-06-300001596783us-gaap:AccumulatedOtherComprehensiveIncomeMember2021-06-3000015967832021-06-300001596783us-gaap:CommonStockMember2021-07-012021-12-310001596783us-gaap:AdditionalPaidInCapitalMember2021-07-012021-12-310001596783us-gaap:AccumulatedOtherComprehensiveIncomeMember2021-07-012021-12-310001596783us-gaap:ProductAndServiceOtherMember2022-07-012022-12-310001596783ctlt:ManufacturingCommercialProductSupplyMemberctlt:BiologicsMember2022-10-012022-12-310001596783ctlt:ManufacturingCommercialProductSupplyMemberctlt:PharmaConsumerHealthMember2022-10-012022-12-310001596783ctlt:ManufacturingCommercialProductSupplyMemberctlt:TotalCatalentbeforeintersegmentrevenueeliminationMember2022-10-012022-12-310001596783ctlt:DevelopmentServicesMemberctlt:BiologicsMember2022-10-012022-12-310001596783ctlt:DevelopmentServicesMemberctlt:PharmaConsumerHealthMember2022-10-012022-12-310001596783ctlt:DevelopmentServicesMemberctlt:TotalCatalentbeforeintersegmentrevenueeliminationMember2022-10-012022-12-310001596783ctlt:BiologicsMember2022-10-012022-12-310001596783ctlt:PharmaConsumerHealthMember2022-10-012022-12-310001596783ctlt:TotalCatalentbeforeintersegmentrevenueeliminationMember2022-10-012022-12-310001596783ctlt:ManufacturingCommercialProductSupplyMemberctlt:BiologicsMember2021-10-012021-12-310001596783ctlt:ManufacturingCommercialProductSupplyMemberctlt:PharmaConsumerHealthMember2021-10-012021-12-310001596783ctlt:ManufacturingCommercialProductSupplyMemberctlt:TotalCatalentbeforeintersegmentrevenueeliminationMember2021-10-012021-12-310001596783ctlt:DevelopmentServicesMemberctlt:BiologicsMember2021-10-012021-12-310001596783ctlt:DevelopmentServicesMemberctlt:PharmaConsumerHealthMember2021-10-012021-12-310001596783ctlt:DevelopmentServicesMemberctlt:TotalCatalentbeforeintersegmentrevenueeliminationMember2021-10-012021-12-310001596783ctlt:BiologicsMember2021-10-012021-12-310001596783ctlt:PharmaConsumerHealthMember2021-10-012021-12-310001596783ctlt:TotalCatalentbeforeintersegmentrevenueeliminationMember2021-10-012021-12-310001596783ctlt:ManufacturingCommercialProductSupplyMemberctlt:BiologicsMember2022-07-012022-12-310001596783ctlt:ManufacturingCommercialProductSupplyMemberctlt:PharmaConsumerHealthMember2022-07-012022-12-310001596783ctlt:ManufacturingCommercialProductSupplyMemberctlt:TotalCatalentbeforeintersegmentrevenueeliminationMember2022-07-012022-12-310001596783ctlt:DevelopmentServicesMemberctlt:BiologicsMember2022-07-012022-12-310001596783ctlt:DevelopmentServicesMemberctlt:PharmaConsumerHealthMember2022-07-012022-12-310001596783ctlt:DevelopmentServicesMemberctlt:TotalCatalentbeforeintersegmentrevenueeliminationMember2022-07-012022-12-310001596783ctlt:BiologicsMember2022-07-012022-12-310001596783ctlt:PharmaConsumerHealthMember2022-07-012022-12-310001596783ctlt:TotalCatalentbeforeintersegmentrevenueeliminationMember2022-07-012022-12-310001596783ctlt:ManufacturingCommercialProductSupplyMemberctlt:BiologicsMember2021-07-012021-12-310001596783ctlt:ManufacturingCommercialProductSupplyMemberctlt:PharmaConsumerHealthMember2021-07-012021-12-310001596783ctlt:ManufacturingCommercialProductSupplyMemberctlt:TotalCatalentbeforeintersegmentrevenueeliminationMember2021-07-012021-12-310001596783ctlt:DevelopmentServicesMemberctlt:BiologicsMember2021-07-012021-12-310001596783ctlt:DevelopmentServicesMemberctlt:PharmaConsumerHealthMember2021-07-012021-12-310001596783ctlt:DevelopmentServicesMemberctlt:TotalCatalentbeforeintersegmentrevenueeliminationMember2021-07-012021-12-310001596783ctlt:BiologicsMember2021-07-012021-12-310001596783ctlt:PharmaConsumerHealthMember2021-07-012021-12-310001596783ctlt:TotalCatalentbeforeintersegmentrevenueeliminationMember2021-07-012021-12-310001596783ctlt:GeographicalMember2022-07-012022-12-310001596783srt:NorthAmericaMember2022-10-012022-12-310001596783srt:NorthAmericaMember2021-10-012021-12-310001596783srt:NorthAmericaMember2022-07-012022-12-310001596783srt:NorthAmericaMember2021-07-012021-12-310001596783srt:EuropeMember2022-10-012022-12-310001596783srt:EuropeMember2021-10-012021-12-310001596783srt:EuropeMember2022-07-012022-12-310001596783srt:EuropeMember2021-07-012021-12-310001596783ctlt:InternationalOtherMember2022-10-012022-12-310001596783ctlt:InternationalOtherMember2021-10-012021-12-310001596783ctlt:InternationalOtherMember2022-07-012022-12-310001596783ctlt:InternationalOtherMember2021-07-012021-12-310001596783ctlt:MetricsMember2022-10-012022-10-010001596783ctlt:MetricsMember2022-10-010001596783ctlt:MetricsMemberus-gaap:CustomerRelationshipsMember2022-10-010001596783ctlt:BiologicsMember2022-06-300001596783ctlt:PharmaConsumerHealthMember2022-06-300001596783ctlt:BiologicsMember2022-12-310001596783ctlt:PharmaConsumerHealthMember2022-12-310001596783ctlt:TermLoanThreeFacilityDollarDenominatedMember2022-12-310001596783ctlt:TermLoanThreeFacilityDollarDenominatedMember2022-06-300001596783ctlt:RevolvingCreditFacilityTwoMember2022-12-310001596783ctlt:RevolvingCreditFacilityTwoMember2022-06-300001596783ctlt:USDollarDenominated500SeniorNotesMemberus-gaap:CarryingReportedAmountFairValueDisclosureMemberus-gaap:FairValueInputsLevel2Member2022-12-310001596783ctlt:USDollarDenominated500SeniorNotesMemberus-gaap:CarryingReportedAmountFairValueDisclosureMemberus-gaap:FairValueInputsLevel2Member2022-06-300001596783us-gaap:CarryingReportedAmountFairValueDisclosureMemberctlt:A2375SeniorEuroDenominatedNotesMemberus-gaap:FairValueInputsLevel2Member2022-12-310001596783us-gaap:CarryingReportedAmountFairValueDisclosureMemberctlt:A2375SeniorEuroDenominatedNotesMemberus-gaap:FairValueInputsLevel2Member2022-06-300001596783us-gaap:CarryingReportedAmountFairValueDisclosureMemberctlt:A3125SeniorUSDenominatedNotesMemberus-gaap:FairValueInputsLevel2Member2022-12-310001596783us-gaap:CarryingReportedAmountFairValueDisclosureMemberctlt:A3125SeniorUSDenominatedNotesMemberus-gaap:FairValueInputsLevel2Member2022-06-300001596783us-gaap:CarryingReportedAmountFairValueDisclosureMemberctlt:A3500SeniorUSDenominatedNotesMemberus-gaap:FairValueInputsLevel2Member2022-12-310001596783us-gaap:CarryingReportedAmountFairValueDisclosureMemberctlt:A3500SeniorUSDenominatedNotesMemberus-gaap:FairValueInputsLevel2Member2022-06-300001596783us-gaap:CapitalLeaseObligationsMember2022-12-310001596783us-gaap:CapitalLeaseObligationsMember2022-06-300001596783ctlt:OtherObligationsMember2022-12-310001596783ctlt:OtherObligationsMember2022-06-300001596783us-gaap:CarryingReportedAmountFairValueDisclosureMemberctlt:DebtIssuanceCostsMember2022-12-310001596783us-gaap:CarryingReportedAmountFairValueDisclosureMemberctlt:DebtIssuanceCostsMember2022-06-300001596783ctlt:USDollarDenominated500SeniorNotesMemberus-gaap:EstimateOfFairValueFairValueDisclosureMemberus-gaap:FairValueInputsLevel2Member2022-12-310001596783ctlt:USDollarDenominated500SeniorNotesMemberus-gaap:EstimateOfFairValueFairValueDisclosureMemberus-gaap:FairValueInputsLevel2Member2022-06-300001596783ctlt:A2375SeniorEuroDenominatedNotesMemberus-gaap:EstimateOfFairValueFairValueDisclosureMemberus-gaap:FairValueInputsLevel2Member2022-12-310001596783ctlt:A2375SeniorEuroDenominatedNotesMemberus-gaap:EstimateOfFairValueFairValueDisclosureMemberus-gaap:FairValueInputsLevel2Member2022-06-300001596783us-gaap:EstimateOfFairValueFairValueDisclosureMemberctlt:A3125SeniorUSDenominatedNotesMemberus-gaap:FairValueInputsLevel2Member2022-12-310001596783us-gaap:EstimateOfFairValueFairValueDisclosureMemberctlt:A3125SeniorUSDenominatedNotesMemberus-gaap:FairValueInputsLevel2Member2022-06-300001596783ctlt:A3500SeniorUSDenominatedNotesMemberus-gaap:EstimateOfFairValueFairValueDisclosureMemberus-gaap:FairValueInputsLevel2Member2022-12-310001596783ctlt:A3500SeniorUSDenominatedNotesMemberus-gaap:EstimateOfFairValueFairValueDisclosureMemberus-gaap:FairValueInputsLevel2Member2022-06-300001596783ctlt:SeniorSecuredCreditFacilitiesOtherMemberus-gaap:CarryingReportedAmountFairValueDisclosureMemberus-gaap:FairValueInputsLevel2Member2022-12-310001596783ctlt:SeniorSecuredCreditFacilitiesOtherMemberus-gaap:EstimateOfFairValueFairValueDisclosureMemberus-gaap:FairValueInputsLevel2Member2022-12-310001596783ctlt:SeniorSecuredCreditFacilitiesOtherMemberus-gaap:CarryingReportedAmountFairValueDisclosureMemberus-gaap:FairValueInputsLevel2Member2022-06-300001596783ctlt:SeniorSecuredCreditFacilitiesOtherMemberus-gaap:EstimateOfFairValueFairValueDisclosureMemberus-gaap:FairValueInputsLevel2Member2022-06-300001596783us-gaap:CarryingReportedAmountFairValueDisclosureMember2022-12-310001596783us-gaap:EstimateOfFairValueFairValueDisclosureMember2022-12-310001596783us-gaap:CarryingReportedAmountFairValueDisclosureMember2022-06-300001596783us-gaap:EstimateOfFairValueFairValueDisclosureMember2022-06-300001596783us-gaap:EstimateOfFairValueFairValueDisclosureMemberctlt:DebtIssuanceCostsMember2022-12-310001596783us-gaap:EstimateOfFairValueFairValueDisclosureMemberctlt:DebtIssuanceCostsMember2022-06-3000015967832020-11-232020-11-2300015967832021-11-182021-11-180001596783srt:MinimumMember2022-10-012022-12-31ctlt:employees0001596783srt:MaximumMember2022-10-012022-12-310001596783srt:MinimumMember2022-12-310001596783srt:MaximumMember2022-12-310001596783ctlt:CorporateAndEliminationsMember2022-10-012022-12-310001596783ctlt:CorporateAndEliminationsMember2022-07-012022-12-310001596783ctlt:EuroDenominatedDebtOutstandingMember2022-12-310001596783ctlt:USDenominatedTermLoanMember2022-12-31xbrli:pure0001596783us-gaap:FairValueInputsLevel1Member2022-12-310001596783us-gaap:FairValueInputsLevel2Member2022-12-310001596783us-gaap:FairValueInputsLevel3Member2022-12-310001596783us-gaap:FairValueInputsLevel1Member2022-06-300001596783us-gaap:FairValueInputsLevel2Member2022-06-300001596783us-gaap:FairValueInputsLevel3Member2022-06-300001596783ctlt:ACOIAccumulatedGainLossMarketableSecuritiesMember2022-10-012022-12-310001596783us-gaap:AccumulatedTranslationAdjustmentMember2022-09-300001596783us-gaap:AccumulatedDefinedBenefitPlansAdjustmentMember2022-09-300001596783us-gaap:AociDerivativeQualifyingAsHedgeExcludedComponentParentMember2022-09-300001596783ctlt:ACOIAccumulatedGainLossMarketableSecuritiesMember2022-09-300001596783us-gaap:AccumulatedNetUnrealizedInvestmentGainLossMember2022-09-300001596783us-gaap:AociDerivativeQualifyingAsHedgeExcludedComponentParentMember2022-10-012022-12-310001596783ctlt:ACOIAccumulatedGainLossMarketableSecuritiesMember2020-10-012020-12-310001596783us-gaap:AccumulatedNetUnrealizedInvestmentGainLossMember2022-10-012022-12-310001596783us-gaap:AccumulatedTranslationAdjustmentMember2022-12-310001596783us-gaap:AccumulatedDefinedBenefitPlansAdjustmentMember2022-12-310001596783us-gaap:AociDerivativeQualifyingAsHedgeExcludedComponentParentMember2022-12-310001596783ctlt:ACOIAccumulatedGainLossMarketableSecuritiesMember2022-12-310001596783us-gaap:AccumulatedNetUnrealizedInvestmentGainLossMember2022-12-310001596783us-gaap:AccumulatedTranslationAdjustmentMember2021-09-300001596783us-gaap:AccumulatedDefinedBenefitPlansAdjustmentMember2021-09-300001596783us-gaap:AociDerivativeQualifyingAsHedgeExcludedComponentParentMember2021-09-300001596783ctlt:ACOIAccumulatedGainLossMarketableSecuritiesMember2021-09-300001596783us-gaap:AccumulatedNetUnrealizedInvestmentGainLossMember2021-09-300001596783us-gaap:AccumulatedTranslationAdjustmentMember2021-10-012021-12-310001596783us-gaap:AociDerivativeQualifyingAsHedgeExcludedComponentParentMember2021-10-012021-12-310001596783us-gaap:AccumulatedTranslationAdjustmentMember2021-12-310001596783us-gaap:AccumulatedDefinedBenefitPlansAdjustmentMember2021-12-310001596783us-gaap:AociDerivativeQualifyingAsHedgeExcludedComponentParentMember2021-12-310001596783ctlt:ACOIAccumulatedGainLossMarketableSecuritiesMember2021-12-310001596783us-gaap:AccumulatedNetUnrealizedInvestmentGainLossMember2021-12-310001596783us-gaap:AccumulatedTranslationAdjustmentMember2022-06-300001596783us-gaap:AccumulatedDefinedBenefitPlansAdjustmentMember2022-06-300001596783us-gaap:AociDerivativeQualifyingAsHedgeExcludedComponentParentMember2022-06-300001596783ctlt:ACOIAccumulatedGainLossMarketableSecuritiesMember2022-06-300001596783us-gaap:AccumulatedNetUnrealizedInvestmentGainLossMember2022-06-300001596783us-gaap:AociDerivativeQualifyingAsHedgeExcludedComponentParentMember2022-07-012022-12-310001596783us-gaap:AccumulatedTranslationAdjustmentMember2021-06-300001596783us-gaap:AccumulatedDefinedBenefitPlansAdjustmentMember2021-06-300001596783ctlt:ACOIAccumulatedGainLossMarketableSecuritiesMember2021-06-300001596783us-gaap:AccumulatedNetUnrealizedInvestmentGainLossMember2021-06-300001596783us-gaap:AccumulatedTranslationAdjustmentMember2021-07-012021-12-310001596783us-gaap:AociDerivativeQualifyingAsHedgeExcludedComponentParentMember2021-07-012021-12-310001596783us-gaap:AccumulatedDefinedBenefitPlansAdjustmentMember2021-07-012021-12-310001596783ctlt:TotalCatalentSubTotalOfSegmentReportingMember2022-10-012022-12-310001596783ctlt:TotalCatalentSubTotalOfSegmentReportingMember2021-10-012021-12-310001596783ctlt:TotalCatalentSubTotalOfSegmentReportingMember2022-07-012022-12-310001596783ctlt:TotalCatalentSubTotalOfSegmentReportingMember2021-07-012021-12-310001596783ctlt:CorporateAndEliminationsMember2022-12-310001596783ctlt:CorporateAndEliminationsMember2022-06-30
UNITED STATES
SECURITIES AND EXCHANGE COMMISSION
Washington, D.C. 20549
______________________________
FORM 10-Q
______________________________ | | | | | | | | | | | | | | |
| ý | QUARTERLY REPORT PURSUANT TO SECTION 13 OR 15(d) OF THE SECURITIES EXCHANGE ACT OF 1934 | | |
For the quarterly period ended December 31, 2022
or | | | | | | | | | | | | | | |
| ¨ | TRANSITION REPORT PURSUANT TO SECTION 13 OR 15(d) OF THE SECURITIES EXCHANGE ACT OF 1934 | | |
001-36587
(Commission File Number)
_____________________________
Catalent, Inc.
(Exact name of registrant as specified in its charter)
_____________________________ | | | | | | | | |
| Delaware | 20-8737688 |
| (State or other jurisdiction of incorporation or organization) | (I.R.S. Employer Identification No.) |
| | |
| 14 Schoolhouse Road | |
| Somerset, | New Jersey | 08873 |
(Address of principal executive offices)_______ | (Zip code) |
(732) 537-6200
Registrant's telephone number, including area code
____________________________________
Indicate by check mark whether the registrant (1) has filed all reports required to be filed by Section 13 or 15(d) of the Securities Exchange Act of 1934 during the preceding 12 months (or for such shorter period that the registrant was required to file such reports), and (2) has been subject to such filing requirements for the past 90 days. ☒ Yes ¨ No
Indicate by check mark whether the registrant has submitted electronically every Interactive Data File required to be submitted and posted pursuant to Rule 405 of Regulation S-T (§ 232.405 of this chapter) during the preceding 12 months (or for such shorter period that the registrant was required to submit such files). ☒ Yes ¨ No
Indicate by check mark whether the registrant is a large accelerated filer, an accelerated filer, a non-accelerated filer, a smaller reporting company or an emerging growth company. See the definitions of “large accelerated filer,” “accelerated filer,” “smaller reporting company,” and “emerging growth company” in Rule 12b-2 of the Exchange Act. | | | | | | | | | | | | | | | | | |
Large accelerated filer | ☒ | | Accelerated filer | | ¨ |
Non-accelerated filer | ¨ | | Smaller reporting company | ¨ |
| | | Emerging growth company | ¨ |
If an emerging growth company, indicate by check mark if the registrant has elected not to use the extended transition period for complying with any new or revised financial accounting standards provided pursuant to Section 13(a) of the Exchange Act. ¨ Indicate by check mark whether the registrant is a shell company (as defined in Rule 12b-2 of the Exchange Act). ¨ Yes ☒ No
Securities registered pursuant to Section 12(b) of the Act: | | | | | | | | |
| Title of each class | Trading symbols(s) | Name of each exchange on which registered |
| Common Stock | CTLT | New York Stock Exchange |
On January 31, 2023, there were 180,090,483 shares of the Registrant's common stock, par value $0.01 per share, issued and outstanding.
CATALENT, INC.
Index to Form 10-Q
For the Three and Six Months Ended December 31, 2022
| | | | | | | | |
| Item | | Page |
| | |
| Part I. | | |
| | |
| Item 1. | | |
| | |
| | |
| | |
| | |
| | |
| | |
| | |
| | |
| | |
| | |
| | |
| | |
| | |
| Item 2. | | |
| | |
| Item 3. | | |
| | |
| Item 4. | | |
| | |
| Part II. | | |
| | |
| Item 1. | | |
| | |
| Item 1A. | | |
| | |
| Item 2. | | |
| | |
| Item 3. | | |
| | |
| Item 4. | | |
| | |
| Item 5. | | |
| | |
| Item 6. | | |
| |
| |
Special Note Regarding Forward-Looking Statements
In addition to historical information, this Quarterly Report on Form 10-Q of Catalent, Inc. (“Catalent” or the “Company”) contains “forward-looking statements” within the meaning of Section 27A of the Securities Act of 1933, as amended, and Section 21E of the Securities Exchange Act of 1934, as amended (the “Exchange Act”), which are subject to the “safe harbor” created by those sections. All statements, other than statements of historical facts, included in this Quarterly Report on Form 10-Q are forward-looking statements. In some cases, you can identify these forward-looking statements by the use of words such as “outlook,” “believes,” “expects,” “potential,” “continues,” “may,” “will,” “should,” “could,” “seeks,” “approximately,” “predicts,” “intends,” “plans,” “estimates,” “anticipates” or the negative version of these words or other comparable words.
These statements are based on assumptions and assessments made by our management in light of their experience and their perception of historical trends, current conditions, expected future developments, and other factors they believe to be appropriate. Any forward-looking statement is subject to various risks and uncertainties. Accordingly, there are or will be important factors that could cause actual outcomes or results to differ materially from those indicated in these statements.
Some of the factors that may cause actual results, developments and business decisions to differ materially from those contemplated by such forward-looking statements include, but are not limited to, those described under the section entitled “Risk Factors” in our Annual Report on Form 10-K for the fiscal year ended June 30, 2022 (the “Fiscal 2022 10-K”) and others, which are summarized below:
Risks Relating to Our Business and the Industry in Which We Operate
•Our business, financial condition, and operations may be adversely affected by global health developments, including the pandemic resulting from the SARS-Co-V-2 strain of coronavirus and its variants (“COVID-19”).
•The continually evolving nature of the COVID-19 pandemic and the resulting public health response, including the changing demand for various COVID-19 vaccines and treatments from both patients and governments around the world, may affect sales of our products and services, including the COVID-19 products we manufacture.
•We participate in a highly competitive market, and increased competition may adversely affect our business.
•The demand for our offerings depends in part on our customers’ research and development and the clinical and market success of their products.
•We are subject to product and other liability risks that could exceed our anticipated costs or adversely affect our results of operations, financial condition, liquidity, and cash flows.
•We are a part of the highly regulated healthcare industry, subject to stringent regulatory standards and other applicable laws and regulations, which can change unexpectedly and may adversely impact our business.
•Any failure to implement fully, monitor, and improve our quality management strategy could lead to quality or safety issues and expose us to significant costs, potential liability, and adverse publicity.
•If we cannot keep pace with rapid technological advances, our services may become uncompetitive or obsolete.
•Any failure to protect or maintain our intellectual property may adversely affect our competitive edge and result in loss of revenue and reputation.
•Future price fluctuations, material shortages of raw materials, or changes in healthcare policies may have an adverse effect on our results of operations and financial conditions.
•Our ability to use our net operating loss carryforwards and certain other tax attributes may be limited.
•We may be unable to attract or retain key personnel.
•We may be unsuccessful in integrating our acquisitions, and we may expend substantial amounts of cash and incur debt in making acquisitions.
•Our global operations are subject to economic and political risks, including risks resulting from continuing inflation, from disruptions to global supply chains, or from the Ukrainian-Russian war, which could affect the profitability of our operations or require costly changes to our procedures.
•As a global enterprise, fluctuations in the exchange rates of the United States ("U.S.") dollar, our reporting currency, against other currencies could have a material adverse effect on our financial performance and results of operations.
•Tax legislative or regulatory initiatives, new interpretations or developments concerning existing tax laws, or challenges to our tax positions could adversely affect our results of operations and financial condition.
•We use advanced information and communication systems to run our operations, compile and analyze financial and operational data, and communicate among our employees, customers, and counter-parties, and the risks generally associated with information and communications systems could adversely affect our results of operations. We continuously work to install new, and upgrade existing systems and provide employee awareness training around phishing, malware, and other cyber security risks to enhance the protections available to us, but such protections may be inadequate to address malicious attacks or inadvertent compromises affecting data security or the operability of such systems.
•We provide services incorporating various advanced modalities, including protein and plasmid production and cell and gene therapies, and these modalities relate to relatively new modes of treatment that may be subject to changing public opinion, continuing research, and increased regulatory scrutiny, each of which may affect our customers' ability to conduct their businesses, or obtain regulatory approvals for their therapies, and thereby adversely affect these offerings.
Risks Relating to Our Indebtedness
•The size of our indebtedness and the obligations associated with it could limit our ability to operate our business and to finance future operations or acquisitions that would enhance our growth.
•Our interest expense on our variable-rate debt may continue to increase as policymakers combat inflation through interest-rate increases on benchmark financial products.
•Our debt agreements contain restrictions that may limit our flexibility in conducting certain current and future operations.
•We may not be able to pay our indebtedness when it becomes due.
•Our current and potential future use of derivative financial instruments may expose us to economic losses in the event of price or currency fluctuations.
Risks Relating to Ownership of Our Common Stock
•Our stock price has historically been and may continue to be volatile.
•Because we have no plan to pay cash dividends on our common stock, par value $0.01 (the “Common Stock”) for the foreseeable future, receiving a return on an investment in our Common Stock may require a sale for a net price greater than was paid for it.
•Provisions in our organizational documents could delay or prevent a change of control.
We caution you that the risks, uncertainties, and other factors referenced above may not contain all of the risks, uncertainties, and other factors that are important to you. In addition, we cannot assure you that we will realize the results, benefits, or developments that we expect or anticipate or, even if substantially realized, that they will result in the consequences or affect us or our business in the way expected. There can be no assurance that (i) we have correctly measured or identified all of the factors affecting our business or the extent of these factors’ likely impact, (ii) the available information with respect to these factors on which such analysis is based is complete or accurate, (iii) such analysis is correct, or (iv) our strategy, which is based in part on this analysis, will be successful. All forward-looking statements in this report apply only as of the date of this report or as of the date they were made and we undertake no obligation to publicly update or review any forward-looking statement, whether as a result of new information, future developments, or otherwise, except as required by law.
Social Media
We use our website (catalent.com), our corporate Facebook page (https://facebook.com/CatalentPharmaSolutions), and our corporate Twitter account (@catalentpharma) as channels for the distribution of information. The information we post through these channels may be deemed material. Accordingly, investors should monitor these channels, in addition to following our press releases, Securities and Exchange Commission (“SEC”) filings, and public conference calls and webcasts. The contents of our website and social media channels are not, however, a part of this report.
PART I. FINANCIAL INFORMATION
ITEM 1. FINANCIAL STATEMENTS
Catalent, Inc.
Consolidated Statements of Operations
(Unaudited; dollars in millions, except per share data)
| | | | | | | | | | | | | | | | | | | | | | | | | | | |
| Three Months Ended
December 31, | | Six Months Ended
December 31, | | | | |
| 2022 | | 2021 | | 2022 | | 2021 | | | | |
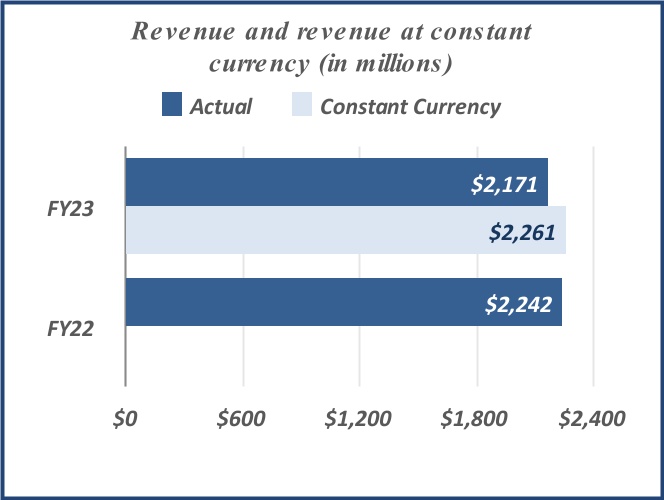
| Net revenue | $ | 1,149 | | | $ | 1,217 | | | $ | 2,171 | | | $ | 2,242 | | | | | |
| Cost of sales | 762 | | | 812 | | | 1,526 | | | 1,513 | | | | | |
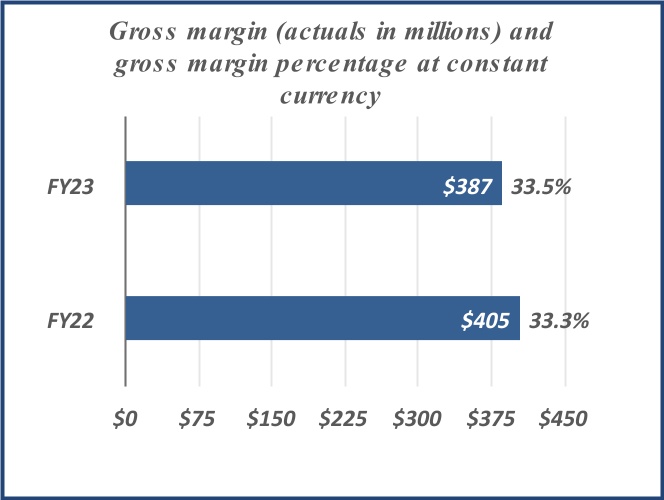
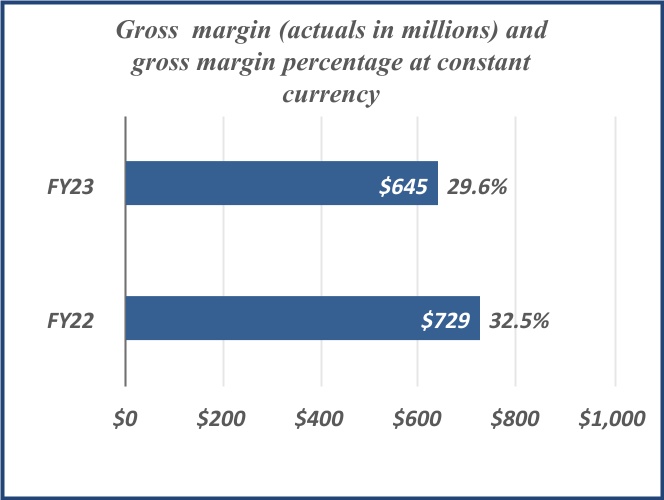
| Gross margin | 387 | | | 405 | | | 645 | | | 729 | | | | | |
| Selling, general, and administrative expenses | 226 | | | 228 | | | 422 | | | 411 | | | | | |
| Gain on sale of subsidiary | — | | | — | | | — | | | (1) | | | | | |
| Other operating expense, net | 23 | | | 16 | | | 25 | | | 20 | | | | | |
| Operating earnings | 138 | | | 161 | | | 198 | | | 299 | | | | | |
| Interest expense, net | 47 | | | 32 | | | 79 | | | 58 | | | | | |
| Other (income) expense, net | (23) | | | 14 | | | 2 | | | 23 | | | | | |
| Earnings before income taxes | 114 | | | 115 | | | 117 | | | 218 | | | | | |
| Income tax expense | 33 | | | 18 | | | 36 | | | 28 | | | | | |
| | | | | | | | | | | |
| | | | | | | | | | | |
| Net earnings | 81 | | | 97 | | | 81 | | | 190 | | | | | |
| | | | | | | | | | | |
| | | | | | | | | | | |
| Less: Net earnings attributable to preferred shareholders | — | | | (4) | | | — | | | (13) | | | | | |
| Net earnings attributable to common shareholders | $ | 81 | | | $ | 93 | | | $ | 81 | | | $ | 177 | | | | | |
| | | | | | | | | | | |
| | | | | | | | | | | |
| | | | | | | | | | | |
| | | | | | | | | | | |
| | | | | | | | | | | |
| Earnings per share: | | | | | | | | | | | |
| Basic | | | | | | | | | | | |
| | | | | | | | | | | |
| Net earnings | $ | 0.45 | | | $ | 0.53 | | | $ | 0.45 | | | $ | 1.02 | | | | | |
| Diluted | | | | | | | | | | | |
| | | | | | | | | | | |
| Net earnings | $ | 0.44 | | | $ | 0.52 | | | $ | 0.45 | | | $ | 1.01 | | | | | |
The accompanying notes are an integral part of these unaudited consolidated financial statements.
Catalent, Inc.
Consolidated Statements of Comprehensive Income
(Unaudited; dollars in millions)
| | | | | | | | | | | | | | | | | | | | | | | |
| Three Months Ended
December 31, | | Six Months Ended
December 31, |
| 2022 | | 2021 | | 2022 | | 2021 |
| Net earnings | $ | 81 | | | $ | 97 | | | $ | 81 | | | $ | 190 | |
| Other comprehensive (loss) income, net of tax | | | | | | | |
| Foreign currency translation adjustments | 118 | | | (18) | | | (17) | | | (32) | |
| Pension and other post-retirement adjustments | — | | | — | | | — | | | 1 | |
| Net change in marketable securities | 1 | | | (1) | | | 2 | | | (1) | |
| | | | | | | |
| | | | | | | |
| Derivatives and hedges | — | | | 3 | | | 14 | | | 4 | |
| Other comprehensive income (loss), net of tax | 119 | | | (16) | | | (1) | | | (28) | |
| Comprehensive income | $ | 200 | | | $ | 81 | | | $ | 80 | | | $ | 162 | |
| | | | | | | |
| | | | | | | |
The accompanying notes are an integral part of these unaudited consolidated financial statements.
Catalent, Inc.
Consolidated Balance Sheets
(Unaudited; in millions, except share and per share data)
| | | | | | | | | | | |
| December 31,
2022 | | June 30,
2022 |
| ASSETS | | | |
| Current assets: | | | |
| Cash and cash equivalents | $ | 442 | | | $ | 449 | |
Trade receivables, net of allowance for credit losses of $26 and $29, respectively | 916 | | | 1,051 | |
| Inventories | 818 | | | 702 | |
| Prepaid expenses and other | 714 | | | 625 | |
| Marketable securities | 28 | | | 89 | |
| Total current assets | 2,918 | | | 2,916 | |
Property, plant, and equipment, net of accumulated depreciation of $1,465 and $1,347, respectively | 3,579 | | | 3,127 | |
| Other assets: | | | |
| Goodwill | 3,215 | | | 3,006 | |
| Other intangibles, net | 1,045 | | | 1,060 | |
| Deferred income taxes | 55 | | | 49 | |
| Other long-term assets | 335 | | | 349 | |
| Total assets | $ | 11,147 | | | $ | 10,507 | |
| | | |
| LIABILITIES AND SHAREHOLDERS' EQUITY |
| Current liabilities: | | | |
| Current portion of long-term obligations and other short-term borrowings | $ | 632 | | | $ | 31 | |
| Accounts payable | 367 | | | 421 | |
| Other accrued liabilities | 527 | | | 620 | |
| Total current liabilities | 1,526 | | | 1,072 | |
| Long-term obligations, less current portion | 4,221 | | | 4,171 | |
| Pension liability | 103 | | | 103 | |
| Deferred income taxes | 221 | | | 202 | |
| Other liabilities | 164 | | | 164 | |
| Commitment and contingencies (see Note 14) | — | | | — | |
| | | |
| Total liabilities | 6,235 | | | 5,712 | |
| | | |
| Shareholders' equity: | | | |
Common stock, $0.01 par value; 1.00 billion shares authorized at December 31 and June 30, 2022; 180 million and 179 million issued and outstanding at December 31 and June 30, 2022, respectively | 2 | | | 2 | |
Preferred stock, $0.01 par value; 100 million shares authorized at December 31 and June 30, 2022;0 shares issued and outstanding at December 31 and June 30, 2022 | — | | | — | |
| | | |
| Additional paid in capital | 4,686 | | | 4,649 | |
| Retained earnings | 619 | | | 538 | |
| Accumulated other comprehensive loss | (395) | | | (394) | |
| | | |
| | | |
| Total shareholders' equity | 4,912 | | | 4,795 | |
| Total liabilities and shareholders' equity | $ | 11,147 | | | $ | 10,507 | |
The accompanying notes are an integral part of these unaudited consolidated financial statements.
Catalent, Inc.
Consolidated Statement of Changes in Shareholders' Equity
(Unaudited; dollars in millions, except share data in thousands)
Three Months Ended December 31, 2022
| | | | | | | | | | | | | | | | | | | | | | | | | | | | | | | | | | | | | | | | | | | | | |
| Shares of Common Stock | | Common Stock | | Additional Paid in Capital | | | | Retained Earnings | | Accumulated Other Comprehensive Loss | | | | Total Shareholders' Equity | | Redeemable Preferred Stock |
| Balance at September 30, 2022 | 179,901 | | | $ | 2 | | | $ | 4,674 | | | | | $ | 538 | | | $ | (514) | | | | | $ | 4,700 | | | $ | — | |
| | | | | | | | | | | | | | | | | |
| | | | | | | | | | | | | | | | | |
| | | | | | | | | | | | | | | | | |
Share issuances related to stock- based compensation | 87 | | | — | | | — | | | | | — | | | — | | | | | — | | | — | |
| | | | | | | | | | | | | | | | | |
| Stock-based compensation | — | | | — | | | 10 | | | | | — | | | — | | | | | 10 | | | — | |
Cash paid, in lieu of
equity, for tax withholding
obligations | — | | | — | | | (2) | | | | | — | | | — | | | | | (2) | | | — | |
| | | | | | | | | | | | | | | | | |
| Employee stock purchase plan | — | | | — | | | 4 | | | | | — | | | — | | | | | 4 | | | — | |
| | | | | | | | | | | | | | | | | |
| | | | | | | | | | | | | | | | | |
| Net earnings | — | | | — | | | — | | | | | 81 | | | — | | | | | 81 | | | — | |
Other comprehensive income, net
of tax | — | | | — | | | — | | | | | — | | | 119 | | | | | 119 | | | — | |
| Balance at December 31, 2022 | 179,988 | | | $ | 2 | | | $ | 4,686 | | | | | $ | 619 | | | $ | (395) | | | | | $ | 4,912 | | | $ | — | |
Three Months Ended December 31, 2021 | | | | | | | | | | | | | | | | | | | | | | | | | | | | | | | | | | | | | | | | | | | | | |
| Shares of Common Stock | | Common Stock | | Additional Paid in Capital | | | | Retained Earnings | | Accumulated Other Comprehensive Loss | | | | Total Shareholders' Equity | | Redeemable Preferred Stock |
| Balance at September 30, 2021 | 171,033 | | | $ | 2 | | | $ | 4,234 | | | | | $ | 114 | | | $ | (329) | | | | | $ | 4,021 | | | $ | 359 | |
| | | | | | | | | | | | | | | | | |
| | | | | | | | | | | | | | | | | |
| | | | | | | | | | | | | | | | | |
Share issuances related to stock- based compensation | 199 | | | — | | | — | | | | | — | | | — | | | | | — | | | — | |
Conversion of redeemable
preferred stock | 7,818 | | | — | | | 362 | | | | | — | | | — | | | | | 362 | | | (359) | |
| Stock-based compensation | — | | | — | | | 11 | | | | | — | | | — | | | | | 11 | | | — | |
Cash paid, in lieu of equity, for
tax withholding obligations | — | | | — | | | (5) | | | | | — | | | — | | | | | (5) | | | — | |
| Exercise of stock options | — | | | — | | | 11 | | | | | — | | | — | | | | | 11 | | | — | |
| Employee stock purchase plan | — | | | — | | | 2 | | | | | — | | | — | | | | | 2 | | | — | |
Preferred dividend ($12.50 per
share of redeemable preferred
stock) | — | | | — | | | — | | | | | (2) | | | — | | | | | (2) | | | — | |
| Net earnings | — | | | — | | | — | | | | | 97 | | | — | | | | | 97 | | | — | |
Other comprehensive loss, net of tax | — | | | — | | | — | | | | | — | | | (16) | | | | | (16) | | | — | |
| Balance at December 31, 2021 | 179,050 | | | $ | 2 | | | $ | 4,615 | | | | | $ | 209 | | | $ | (345) | | | | | $ | 4,481 | | | $ | — | |
| | | | | | | | | | | | | | | | | |
| | | | | | | | | | | | | | | | | |
The accompanying notes are an integral part of these unaudited consolidated financial statements.
Catalent, Inc.
Consolidated Statement of Changes in Shareholders' Equity
(Unaudited; dollars in millions, except share data in thousands)
Six months ended December 31, 2022 | | | | | | | | | | | | | | | | | | | | | | | | | | | | | | | | | | | | | | | | | | | | | |
| Shares of Common Stock | | Common Stock | | Additional Paid in Capital | | | | Retained Earnings | | Accumulated Other Comprehensive Loss | | | | Total Shareholders' Equity | | Redeemable Preferred Stock |
| Balance at June 30, 2022 | 179,302 | | | $ | 2 | | | $ | 4,649 | | | | | $ | 538 | | | $ | (394) | | | | | $ | 4,795 | | | $ | — | |
| | | | | | | | | | | | | | | | | |
| | | | | | | | | | | | | | | | | |
| | | | | | | | | | | | | | | | | |
| | | | | | | | | | | | | | | | | |
Share issuances related to stock- based compensation | 686 | | | — | | | — | | | | | — | | | — | | | | | — | | | — | |
| | | | | | | | | | | | | | | | | |
| Stock-based compensation | — | | | — | | | 29 | | | | | — | | | — | | | | | 29 | | | — | |
| | | | | | | | | | | | | | | | | |
| Exercise of stock options | — | | | — | | | 1 | | | | | — | | | — | | | | | 1 | | | — | |
| Employee stock purchase plan | — | | | — | | | 7 | | | | | — | | | — | | | | | 7 | | | — | |
| | | | | | | | | | | | | | | | | |
| Net earnings | — | | | — | | | — | | | | | 81 | | | — | | | | | 81 | | | — | |
Other comprehensive loss, net of
tax | — | | | — | | | — | | | | | — | | | (1) | | | | | (1) | | | — | |
| Balance at December 31, 2022 | 179,988 | | | $ | 2 | | | $ | 4,686 | | | | | $ | 619 | | | $ | (395) | | | | | $ | 4,912 | | | $ | — | |
Six Months Ended December 31, 2021
| | | | | | | | | | | | | | | | | | | | | | | | | | | | | | | | | | | | | | | | | | | | | |
| Shares of Common Stock | | Common Stock | | Additional Paid in Capital | | | | Accumulated Deficit | | Accumulated Other Comprehensive Loss | | | | Total Shareholders' Equity | | Redeemable Preferred Stock |
| Balance at June 30, 2021 | 170,549 | | | $ | 2 | | | $ | 4,205 | | | | | $ | 25 | | | $ | (317) | | | | | $ | 3,915 | | | $ | 359 | |
| | | | | | | | | | | | | | | | | |
| | | | | | | | | | | | | | | | | |
| | | | | | | | | | | | | | | | | |
| | | | | | | | | | | | | | | | | |
Share issuances related to stock- based compensation | 683 | | | — | | | — | | | | | — | | | — | | | | | — | | | — | |
Conversion of redeemable
preferred stock | 7,818 | | | — | | | 362 | | | | | — | | | — | | | | | 362 | | | (359) | |
| Stock-based compensation | — | | | — | | | 32 | | | | | — | | | — | | | | | 32 | | | — | |
Cash paid, in lieu of equity, for
tax withholding obligations | — | | | — | | | (9) | | | | | — | | | — | | | | | (9) | | | — | |
| Exercise of stock options | — | | | — | | | 19 | | | | | — | | | — | | | | | 19 | | | — | |
| Employee stock purchase plan | — | | | — | | | 6 | | | | | — | | | — | | | | | 6 | | | — | |
Preferred dividend ($12.50 per
share of redeemable preferred
stock) | — | | | — | | | — | | | | | (6) | | | — | | | | | (6) | | | — | |
| Net earnings | — | | | — | | | — | | | | | 190 | | | — | | | | | 190 | | | — | |
Other comprehensive income,
net of tax | — | | | — | | | — | | | | | — | | | (28) | | | | | (28) | | | — | |
| Balance at December 31, 2021 | 179,050 | | | $ | 2 | | | $ | 4,615 | | | | | $ | 209 | | | $ | (345) | | | | | $ | 4,481 | | | $ | — | |
The accompanying notes are an integral part of these unaudited consolidated financial statements.
Catalent, Inc.
Consolidated Statements of Cash Flows
(Unaudited; dollars in millions) | | | | | | | | | | | |
| Six Months Ended December 31, |
| 2022 | | 2021 |
| CASH FLOWS FROM OPERATING ACTIVITIES: | | | |
| Net earnings | $ | 81 | | | $ | 190 | |
| | | |
| | | |
Adjustments to reconcile net earnings to net cash from operations: | | | |
| Depreciation and amortization | 202 | | | 179 | |
| Non-cash foreign currency transaction loss, net | 1 | | | 25 | |
| Non-cash restructuring charges | 7 | | | — | |
Amortization of debt issuance costs | 4 | | | 4 | |
Impairments charges and loss/gain on sale of assets, net | (1) | | | 19 | |
| Gain on sale of subsidiary | — | | | (1) | |
| Financing-related charges | — | | | 4 | |
| Gain on derivative instrument | — | | | (2) | |
Stock-based compensation | 29 | | | 32 | |
| Provision for deferred income taxes | 13 | | | 1 | |
| Provision for bad debts and inventory | 67 | | | 9 | |
| Change in operating assets and liabilities: | | | |
| Decrease in trade receivables | 148 | | | 131 | |
| Increase in inventories | (180) | | | (148) | |
| (Decrease) increase in accounts payable | (68) | | | 3 | |
Other assets/accrued liabilities, net—current and non-current | (181) | | | (214) | |
| | | |
| | | |
| Net cash provided by operating activities | 122 | | | 232 | |
| CASH FLOWS USED IN INVESTING ACTIVITIES: | | | |
| Acquisition of property, equipment, and other productive assets | (317) | | | (277) | |
| Proceeds from sale of marketable securities | 61 | | | 4 | |
| Proceeds from sale of property and equipment | 7 | | | — | |
| Settlement on sale of subsidiaries, net | — | | | (3) | |
| | | |
| Payment for acquisitions, net of cash acquired | (474) | | | (1,020) | |
| Payment for investments | (1) | | | (3) | |
| | | |
| | | |
| | | |
| Net cash used in investing activities | (724) | | | (1,299) | |
| CASH FLOWS FROM FINANCING ACTIVITIES: | | | |
| | | |
| | | |
| Proceeds from borrowing | 625 | | | 1,100 | |
| Payments related to long-term obligations | (32) | | | (64) | |
Financing fees paid | (4) | | | (15) | |
| | | |
| Dividends paid | — | | | (4) | |
| | | |
| Cash paid, in lieu of equity, for tax-withholding obligations | — | | | (9) | |
| Exercise of stock options | 1 | | | 19 | |
| Other financing activities | 7 | | | 6 | |
| | | |
| | | |
| Net cash provided by financing activities | 597 | | | 1,033 | |
| Effect of foreign currency exchange on cash and cash equivalents | (2) | | | (13) | |
| NET DECREASE IN CASH AND CASH EQUIVALENTS | (7) | | | (47) | |
| CASH AND CASH EQUIVALENTS AT BEGINNING OF PERIOD | 449 | | | 896 | |
| CASH AND CASH EQUIVALENTS AT END OF PERIOD | $ | 442 | | | $ | 849 | |
| SUPPLEMENTARY CASH FLOW INFORMATION: | | | |
| Interest paid | $ | 83 | | | $ | 50 | |
| Income taxes paid, net | $ | 38 | | | $ | 27 | |
The accompanying notes are an integral part of these unaudited consolidated financial statements.
Catalent, Inc.
Notes to Unaudited Consolidated Financial Statements
1. BASIS OF PRESENTATION AND SUMMARY OF SIGNIFICANT ACCOUNTING POLICIES
Business
Catalent, Inc. (“Catalent” or the “Company”) directly and wholly owns PTS Intermediate Holdings LLC (“Intermediate Holdings”). Intermediate Holdings directly and wholly owns Catalent Pharma Solutions, Inc. (“Operating Company”). The financial results of Catalent are comprised of the financial results of Operating Company and its subsidiaries on a consolidated basis.
Basis of Presentation
The accompanying unaudited consolidated financial statements have been prepared in accordance with generally accepted accounting principles in the United States (“U.S. GAAP”) for interim financial information and with the instructions to Form 10-Q and Article 10 of Regulation S-X. Accordingly, they do not include all of the information and notes required by U.S. GAAP for complete financial statements. In the opinion of management, all adjustments (consisting of normal recurring adjustments) considered necessary for a fair presentation have been included. Operating results for the six months ended December 31, 2022 are not necessarily indicative of the results that may be expected for the year ending June 30, 2023. The consolidated balance sheet at June 30, 2022 has been derived from the audited consolidated financial statements at that date but does not include all of the information and footnotes required by U.S. GAAP for complete financial statements. For further information on the Company's accounting policies and footnotes, refer to the consolidated financial statements and footnotes thereto included in the Company’s Annual Report on Form 10-K for the year ended June 30, 2022 filed with the Securities and Exchange Commission (the “SEC”).
Reportable Segments
Effective July 1, 2022, in connection with the appointment of a new President and Chief Executive Officer, the Company changed its operating structure and reorganized its executive leadership team accordingly. This new organizational structure includes a shift from the four operating and reportable segments the Company disclosed during fiscal 2022 to two segments: (i) Biologics and (ii) Pharma and Consumer Health. Set forth below is a summary description of the Company's two current operating and reportable segments.
Biologics—The Biologics segment provides the same services as the Biologics segment the Company reported in fiscal 2022, with some organizational adjustments and the addition of analytical development and testing services for large molecules that were previously disclosed as part of the Company's prior Oral and Specialty Delivery segment. The Biologics segment as reorganized provides development and manufacturing for biologic proteins; cell, gene, and other nucleic acid therapies; plasmid DNA; induced pluripotent stem cells (iPSCs); and vaccines. It also provides formulation, development, and manufacturing for parenteral dose forms, including vials, prefilled syringes, and cartridges; and, as noted above, analytical development and testing services for large molecules.
Pharma and Consumer Health—The Pharma and Consumer Health segment encompasses, except as noted above, the offerings of three of the Company's prior reportable segments—Softgel and Oral Technologies, Oral and Specialty Delivery, and Clinical Supply Services—and comprises the Company’s market-leading capabilities for complex oral solids, softgel formulations, Zydis® fast-dissolve technologies, and gummy, soft chew, and lozenge dosage forms; formulation, development, and manufacturing platforms for oral, nasal, inhaled, and topical dose forms; and clinical trial development and supply services.
Each segment reports through a separate management team and ultimately reports to the Company's President and Chief Executive Officer, who is designated as the Chief Operating Decision Maker for segment reporting purposes. The Company's operating segments are the same as its reportable segments. All prior-period comparative segment information has been restated to reflect the current reportable segments in accordance with Accounting Standards Codification (“ASC”) 280, Segment Reporting, promulgated by the Financial Accounting Standards Board (the “FASB”).
Reclassifications
Consequent to the reorganization noted above, certain prior-period amounts were reclassified to conform to the current period presentation.
Foreign Currency Translation
The financial statements of the Company’s operations are generally measured using the local currency as the functional currency. Adjustments to translate the assets and liabilities of operations outside the United States (“U.S.”) into U.S. dollars are accumulated as a component of other comprehensive income utilizing period-end exchange rates. Since July 1, 2018, the Company has accounted for its Argentine operations as highly inflationary.
Concentrations of Credit Risk and Major Customers
Concentration of credit risk, with respect to accounts receivable, is limited due to the large number of customers and their dispersion across different geographic areas. The customers are primarily concentrated in the pharmaceutical and consumer products industries. The Company does not normally require collateral or any other security to support credit sales. The Company performs ongoing credit evaluations of its customers’ financial conditions and maintains reserves for credit losses. Such losses historically have been within the Company’s expectations. As of December 31, 2022, the Company had one customer that represented approximately 24% of its aggregate net trade receivables and current contract asset values, primarily associated with the Company's gene therapy offerings, and another customer that represented approximately 11% of its aggregate net trade receivables and current contract asset values. After performing a risk assessment of these customers, the Company has determined that a reserve is not warranted as of December 31, 2022. Additionally, the Company had one customer that represented approximately 13% of net revenue and another customer that represented approximately 10% of net revenue during the three months ended December 31, 2022, primarily in the Biologics segment.
Depreciation
Depreciation expense was $69 million and $64 million for the three months ended December 31, 2022 and 2021, respectively. Depreciation expense was $135 million and $122 million for the six months ended December 31, 2022 and 2021, respectively. Depreciation expense includes amortization of assets related to finance leases. The Company charges repairs and maintenance costs to expense as incurred.
Amortization
Amortization expense related to other intangible assets was $34 million and $34 million for the three months ended December 31, 2022 and 2021, respectively. Amortization expense related to other intangible assets was $67 million and $57 million for the six months ended December 31, 2022 and 2021, respectively.
Research and Development Costs
The Company expenses research and development costs as incurred. Research and development costs amounted to $4 million and $6 million for the three months ended December 31, 2022 and 2021, respectively. Research and development costs amounted to $9 million and $12 million for the six months ended December 31, 2022 and 2021, respectively.
Marketable Securities
The Company classifies its marketable securities as available-for-sale, because it may sell certain of its marketable securities prior to the stated maturity for various reasons, including management of liquidity, credit risk, duration, relative return, and asset allocation. The Company determines the fair value of each marketable security in its portfolio at each period end and recognizes gains and losses in the portfolio in other comprehensive income. As of December 31, 2022, the amortized cost basis of marketable securities approximates fair value and all outstanding marketable securities mature within one year.
Recent Financial Accounting Standards
New Accounting Standards Not Adopted as of December 31, 2022
In March 2020, the FASB issued Accounting Standards Update (“ASU”) 2020-04, Reference Rate Reform (Topic 848): Facilitation of the Effects of Reference Rate Reform on Financial Reporting, which provides optional guidance to ease the potential burden in accounting for the discontinuation of a reference rate such as LIBOR, formerly known as the London Interbank Offered Rate, because of reference rate reform. In December 2022, the FASB issued ASU 2022-06, Reference Rate Reform (Topic 848): Deferral of the Sunset Date of Topic 848, which delayed the effective date from December 31, 2022 to December 31, 2024. The Company is currently evaluating the impact of adopting this guidance on its consolidated financial statements.
2. REVENUE RECOGNITION
The Company recognizes revenue in accordance with ASC 606, Revenue from Contracts with Customers. The Company generally earns its revenue by supplying goods or providing services under contracts with its customers in two primary revenue streams: (i) manufacturing and commercial product supply, and (ii) development and clinical supply services. The Company measures the revenue from customers based on the consideration specified in its contracts, excluding any sales incentive or amount collected on behalf of a third party that the Company expects to be entitled in exchange for transferring the promised goods to and/or performing services for the customer (the “Transaction Price”). To the extent the Transaction Price includes variable consideration, the Company estimates the amount of variable consideration that should be included in the Transaction Price utilizing either the expected value method or the most likely amount method depending on which method is expected to better predict the amount of consideration to which the Company will be entitled. The value of variable consideration is included in the Transaction Price if, and to the extent, it is probable that a significant reversal of the amount of cumulative revenue recognized will not occur when the uncertainty associated with the variable consideration is subsequently resolved. These estimates are re-assessed each reporting period, as required, and any adjustments required are recorded on a cumulative catch-up basis, which affects revenue and net income in the period of adjustment.
The Company’s customer contracts generally include provisions entitling the Company to a termination penalty when the customer invokes its contractual right to terminate prior to the contract’s nominal end date. The termination penalties in the customer contracts vary but are generally considered substantive for accounting purposes and create enforceable rights and obligations throughout the stated duration of the contract. The Company accounts for a contract cancellation as a contract modification in the period in which the customer invokes the termination provision. The determination of the contract termination penalty is based on the terms stated in the relevant customer agreement. As of the modification date, the Company updates its estimate of the transaction price using the expected value method, subject to constraints, and to the extent that it is probable that a significant reversal in the amount of cumulative revenue recognized will not occur when the uncertainty associated with the variable consideration is subsequently resolved. These estimates are re-assessed each reporting period, as required, and any adjustments required are recorded on a cumulative catch-up basis, which would affect revenue and net income in the period of adjustment.
Manufacturing & Commercial Product Supply Revenue
Manufacturing and commercial product supply revenue consists of revenue earned by manufacturing products supplied to customers under long-term commercial supply arrangements. In these arrangements, the customer typically owns and supplies the active pharmaceutical ingredient, or API, that is used in the manufacturing process. The contract generally includes the terms of the manufacturing services and related product quality assurance procedures to comply with regulatory requirements. Due to the regulated nature of the Company’s business, these contract terms are highly interdependent and, therefore, are considered to be a single combined performance obligation. The transaction price is generally stated in the agreement as a fixed price per unit, with no contractual provision for a refund or price concession. Control is transferred to the customer over time, creating a corresponding right to recognize the related revenue, because there is no alternative use to the Company for the asset created and the Company has an enforceable right to payment for performance completed as of that date. Progress is measured based on the units of product that have successfully completed the contractually required product quality assurance process, as the conclusion of that process generally defines the time when the applicable contract and the related regulatory requirements permit the customer to exercise control over the product’s disposition. The customer is typically responsible for arranging the shipping and handling of product following completion of the quality assurance process. Payment is typically due 30 to 45 days after the goods are delivered as requested by the customer, based on the payment terms set forth in the applicable customer agreement.
Development Services and Clinical Supply Revenue
Development services and clinical supply contracts generally take the form of short-term, fee-for-service arrangements. Performance obligations vary, but frequently include biologic cell-line development, performing formulation, analytical stability, or other services related to product development, and providing manufacturing services for products that are under development or otherwise not intended for commercial sale. They can also include a combination of the following services: the manufacturing, packaging, storage, distribution, destruction, inventory management of customer clinical trial material and the sourcing of comparator drug products on behalf of customers to be used in clinical trials to compare performance with the drug under clinical investigation. The transaction prices for these arrangements are fixed and include amounts stated in the contracts for each promised service, and each service is generally considered to be a separate performance obligation. In most instances, the Company recognizes revenue over time because there is no alternative use to the Company for the asset created and the Company has an enforceable right to payment for performance completed as of that date.
The Company measures progress toward the completion of its performance obligations satisfied over time based on the nature of the services to be performed. For certain types of arrangements, revenue is recognized over time and measured using an output method based on the completion of tasks and activities that are performed to satisfy a performance obligation. For certain types of arrangements, revenue is recognized over time and measured using an input method based on effort expended. Each of these methods provides an appropriate depiction of the Company’s progress toward fulfilling its performance obligations for its respective arrangement. In certain development services arrangements that require a portion of the contract consideration to be received in advance at the commencement of the contract, such advance payment is initially recorded as a contract liability. In certain clinical supply arrangements, revenue is recognized at the point in time when control transfers, which occurs upon either the delivery of the related output of the service to the customer or the completion of quality testing with respect to the product, and the Company has an enforceable right to payment based on the terms of the arrangement.
The Company allocates consideration to each performance obligation using the “relative standalone selling price” as defined under ASC 606. Generally, the Company utilizes observable standalone selling prices in its allocations of consideration. If observable standalone selling prices are not available, the Company estimates the applicable standalone selling price using a cost-plus-margin approach or an adjusted market assessment approach, in each case, representing the amount that the Company believes the market is willing to pay for the applicable service. Payment is typically due 30 to 45 days following the completion of services provided to the customer, based on the payment terms set forth in the applicable customer agreement.
The Company records revenue for comparator sourcing arrangements on a net basis because it is acting as an agent that does not control the product or service before it is transferred to the customer. Payment for comparator sourcing activity is typically received in advance at the commencement of the contract and is initially recorded as a contract liability.
The Company generally expenses sales commissions as incurred because either the amortization period is one year or less, or the balance with an amortization period greater than one year is not material.
The following tables reflect net revenue for the three and six months ended December 31, 2022 and 2021, by type of activity and reportable segment (in millions):
| | | | | | | | | | | | | | | | | |
| Three Months Ended December 31, 2022 | Biologics | | Pharma and Consumer Health | | Total |
| Manufacturing & commercial product supply | $ | 75 | | | $ | 340 | | | $ | 415 | |
| Development services & clinical supply | 505 | | | 230 | | | 735 | |
| Total | $ | 580 | | | $ | 570 | | | $ | 1,150 | |
| Inter-segment revenue elimination | | (1) | |
| Combined net revenue | | $ | 1,149 | |
| | | | | | | | | | | | | | | | | |
| Three Months Ended December 31, 2021 | Biologics | | Pharma and Consumer Health | | Total |
| Manufacturing & commercial product supply | $ | 169 | | | $ | 359 | | | $ | 528 | |
| Development services & clinical supply | 472 | | | 218 | | | 690 | |
| Total | $ | 641 | | | $ | 577 | | | $ | 1,218 | |
| Inter-segment revenue elimination | (1) | |
| Combined net revenue | | $ | 1,217 | |
| | | | | | | | | | | | | | | | | |
Six Months Ended December 31, 2022 | Biologics | | Pharma and Consumer Health | | Total |
| Manufacturing & commercial product supply | $ | 169 | | | $ | 632 | | | $ | 801 | |
| Development services & clinical supply | 934 | | | 437 | | | 1,371 | |
| Total | $ | 1,103 | | | $ | 1,069 | | | $ | 2,172 | |
| Inter-segment revenue elimination | | (1) | |
| Combined net revenue | | $ | 2,171 | |
| | | | | | | | | | | | | | | | | |
Six Months Ended December 31, 2021 | Biologics | | Pharma and Consumer Health | | Total |
| Manufacturing & commercial product supply | $ | 303 | | | $ | 635 | | | $ | 938 | |
| Development services & clinical supply | 886 | | | 419 | | | 1,305 | |
| Total | $ | 1,189 | | | $ | 1,054 | | | $ | 2,243 | |
| Inter-segment revenue elimination | (1) | |
| Combined net revenue | | $ | 2,242 | |
The following table allocates revenue by the location where the goods were made or the service performed:
| | | | | | | | | | | | | | | | | | | | | | | | | | |
| | Three Months Ended
December 31, | | Six Months Ended
December 31, |
| (Dollars in millions) | | 2022 | | 2021 | | 2022 | | 2021 |
| | | | | | | | |
| United States | | $ | 734 | | | $ | 793 | | | $ | 1,432 | | | $ | 1,423 | |
| Europe | | 356 | | 370 | | 630 | | | 722 | |
| Other | | 88 | | 83 | | 169 | | | 155 | |
| Elimination of revenue attributable to multiple locations | | (29) | | (29) | | (60) | | | (58) | |
| Total | | $ | 1,149 | | | $ | 1,217 | | | $ | 2,171 | | | $ | 2,242 | |
Contract Liabilities
Contract liabilities relate to cash consideration that the Company receives in advance of satisfying the related performance obligations. The contract liabilities balances (current and non-current) as of December 31, 2022 and June 30, 2022 are as follows:
| | | | | | | | |
| (Dollars in millions) | | |
| | |
| Balance at June 30, 2022 | | $ | 194 | |
| | |
| | |
| | |
| | |
| Balance at December 31, 2022 | | $ | 186 | |
| Revenue recognized in the period from amounts included in contracts liability at the beginning of the period: | | $ | (113) | |
Contract liabilities that will be recognized within 12 months of December 31, 2022 are accounted for in Other accrued liabilities and those that will be recognized longer than 12 months after December 31, 2022 are accounted for within Other liabilities.
Contract Assets
Contract assets primarily relate to the Company's conditional right to receive consideration for services that have been performed for customers as of December 31, 2022 relating to the Company's development services but had not yet been invoiced as of December 31, 2022. Contract assets are transferred to trade receivables, net when the Company’s right to receive the consideration becomes unconditional. Contract assets totaled $513 million and $441 million as of December 31, 2022 and June 30, 2022, respectively. Contract assets expected to transfer to trade receivables within 12 months are accounted for within Prepaid expenses and other. Contract assets expected to transfer to trade receivables longer than 12 months are accounted for within Other long-term assets.
3. BUSINESS COMBINATIONS
Metrics Contract Services Acquisition
In October 2022, the Company acquired 100% of Metrics Contract Services (“Metrics”) from Mayne Pharma Group Limited for $474 million in cash, subject to customary adjustments. Metrics, based in Greenville, North Carolina, is an oral solids development and manufacturing business specializing in the manufacture of drugs containing highly potent active pharmaceutical ingredients. The operations and facility acquired have become part of the Company’s Pharma and Consumer Health segment.
The Company accounted for the Metrics transaction using the acquisition method in accordance with ASC 805, Business Combinations. The Company funded this acquisition with a portion of the proceeds of an October 2022 drawdown from its senior secured revolving credit facility. The Company estimated fair values at the date of acquisition for the preliminary allocation of consideration to the net tangible and intangible assets acquired and liabilities assumed. The Company has not completed its analysis regarding the assets acquired and liabilities assumed. Therefore, the allocation to property, plant, and equipment, intangible assets, goodwill, and income taxes are preliminary and subject to finalization. During the measurement period ending no later than one year after the acquisition date, the Company will continue to obtain information to assist in finalizing the fair values of the net assets acquired, which may differ materially from these preliminary estimates. If any measurement period adjustment is material, the Company will record such adjustment, including any related impact on net income, in the reporting period in which the adjustment is determined.
The preliminary purchase price allocation to assets acquired and liabilities assumed in the transaction, subject to finalization, is as follows:
| | | | | |
| (Dollars in millions) | Preliminary Purchase Price Allocation |
| |
| Trade receivables, net | $ | 15 | |
| Inventories | 6 | |
| |
| Property, plant, and equipment | 192 | |
| Other intangibles, net | 53 | |
| Other assets | 2 | |
| Current liabilities | (9) | |
| Goodwill | 215 | |
| Total assets acquired and liabilities assumed | $ | 474 | |
The carrying value of trade receivables, inventory, and trade payables, as well as certain other current and non-current assets and liabilities generally represented the fair value at the date of acquisition.
Other intangibles, net consists of customer relationships of $53 million, which were valued using the multi-period, excess-earnings method, a method that values the intangible asset using the present value of the after-tax cash flows attributable to the intangible asset only. The significant assumptions used in developing the valuation included the estimated annual net cash flows (including application of an appropriate margin to forecasted revenue, selling and marketing costs, return on working capital, contributory asset charges, and other factors), the discount rate that appropriately reflects the risk inherent in each future cash flow stream, and an assessment of the asset’s life cycle, as well as other factors. The assumptions used in the financial forecasts were based on historical data, supplemented by current and anticipated growth rates, management plans, and market-comparable information. Fair-value determinations require considerable judgment and are sensitive to changes in underlying assumptions and factors. Preliminary assumptions may change and may result in significant changes to the final valuation. The customer relationship intangible asset has a weighted average useful life of 12 years.
Property, plant, and equipment was valued using the cost approach, which is based on current replacement and/or reproduction cost of the asset as new, less depreciation attributable to physical, functional, and economic factors. The Company then determined the remaining useful life based on the anticipated life of the asset and Company policy for similar assets.
Goodwill has been allocated to the Pharma and Consumer Health segment as shown in Note 4, Goodwill. Goodwill is mainly comprised of the growth from an expected increase in capacity utilization and potential new customers. The goodwill resulting from the Metrics acquisition is not deductible for tax purposes.
Results of the business acquired were not material to the Company's consolidated statement of operations, financial position, or cash flows for the three and six months ended December 31, 2022.
Bettera Holdings, LLC Acquisition
In October 2021, the Company acquired 100% of the equity interest in Bettera Holdings, LLC (“Bettera Wellness”) for approximately $1 billion. Bettera Wellness is a manufacturer of nutraceuticals and nutritional supplements in gummy, soft chew, and lozenge delivery formats.
4. GOODWILL
The following table summarizes the changes between June 30, 2022 and December 31, 2022 in the carrying amount of goodwill in total and by segment:
| | | | | | | | | | | | | | | | | | | | | |
| (Dollars in millions) | Biologics | | Pharma and Consumer Health | | | | | | Total |
Balance at June 30, 2022 (1) | $ | 1,535 | | | $ | 1,471 | | | | | | | $ | 3,006 | |
Additions(2) | — | | | 215 | | | | | | | 215 | |
| | | | | | | | | |
| Reallocation | 16 | | | (16) | | | | | | | — | |
| | | | | | | | | |
| | | | | | | | | |
| Foreign currency translation adjustments | 1 | | | (7) | | | | | | | (6) | |
| Balance at December 31, 2022 | $ | 1,552 | | | $ | 1,663 | | | | | | | $ | 3,215 | |
(1) As of result of the organizational realignments which were effective July 1, 2022, (described in Note 1, Basis of Presentation and Summary of Significant Accounting Policies), beginning balances have been reclassified to conform with the current period presentation.
(2) The addition to goodwill is a result of the Metrics acquisition. For further details, see Note 3, Business Combinations.
As part of the business reorganization discussed in Note 1, Basis of Presentation and Summary of Significant Accounting Policies, the goodwill from the previous Biologics, Softgel and Oral Technologies, Oral and Specialty Delivery, and Clinical Supply Services segments was reallocated between the current Biologics and Pharma and Consumer Health segments.
As a result of this realignment, the Company performed an interim quantitative goodwill impairment test for all of its reporting units as of July 1, 2022, which did not result in any goodwill impairment charges.
5. LONG-TERM OBLIGATIONS AND SHORT-TERM BORROWINGS
Long-term obligations and short-term borrowings consisted of the following at December 31, 2022 and June 30, 2022:
| | | | | | | | | | | | | | | | | |
| (Dollars in millions) | Maturity | | December 31, 2022 | | June 30, 2022 |
| Senior secured credit facilities | | | | | |
| Term loan facility B-3 (6.375% as of December 31) | February 2028 | | $ | 1,426 | | | $ | 1,433 | |
Revolving credit facility (1) (6.032% as of December 31) | November 2027 | | 600 | | | — | |
| 5.000% senior notes due 2027 | July 2027 | | 500 | | | 500 | |
2.375% euro senior notes due 2028(2) | March 2028 | | 879 | | | 874 | |
| 3.125% senior notes due 2029 | February 2029 | | 550 | | | 550 | |
| 3.500% senior notes due 2030 | April 2030 | | 650 | | | 650 | |
| Financing lease obligations | 2022 to 2038 | | 289 | | | 234 | |
| Other obligations | 2022 to 2028 | | 2 | | | 2 | |
| Unamortized discount and debt issuance costs | | | (43) | | | (41) | |
| Total debt | | | $ | 4,853 | | | $ | 4,202 | |
Less: current portion of long-term obligations and other short-term borrowings (1) | | | 632 | | | 31 | |
| Long-term obligations, less current portion | | | $ | 4,221 | | | $ | 4,171 | |
(1) During the six months ended December 31, 2022, the Company drew down $625 million on its revolving credit facility to fund the acquisition of Metrics and supplement operating cash flows, of which $25 million was repaid during three months ended December 31, 2022. The Company has elected to classify the borrowing on its revolving credit facility as current as it intends to repay a portion of the borrowing using cash flow from operations and/or refinance the borrowing through a senior notes offering within the next twelve months.
(2) The change in euro-denominated debt was due to fluctuations in foreign currency exchange rates.
Seventh Amendment to the Credit Agreement
In November 2022, Operating Company entered into Amendment No. 7 (the “Seventh Amendment”) to its Amended and Restated Credit Agreement, dated May 20, 2014 (as subsequently amended, the “Credit Agreement”). Pursuant to the Seventh Amendment, Operating Company (i) terminated its existing revolving credit commitments (and the related outstanding revolving borrowings), which is part of its senior secured credit facilities, and (ii) obtained $1.10 billion aggregate amount of new revolving credit commitments, borrowing thereunder an amount equal to the previously outstanding borrowings under the terminated commitments (as amended, the “Revolving Credit Facility”). The Revolving Credit Facility has an interest rate margin, at Operating Company’s option, based on a (1) prime rate, plus a margin ranging from 0.75% to 1.25% based on Operating Company’s consolidated leverage ratio or (2) Secured Overnight Financing Rate, plus 0.10%, plus a margin ranging from 1.75% to 2.25% based on Operating Company’s consolidated leverage ratio. The Revolving Credit Facility has a maturity date that is the earlier of (A) five years after November 22, 2027, and (B) the 91st day prior to the maturity of Operating Company’s $500 million 5.000% senior unsecured notes due 2027 (the “2027 Notes”) or any permitted refinancing thereof, if on such 91st day, any of the 2027 Notes remains outstanding. Otherwise, the Revolving Credit Facility under the Seventh Amendment has the same principal terms as the previously existing revolving credit commitments under the Credit Agreement.
The availability of capacity under the Revolving Credit Facility is reduced by the aggregate value of all outstanding letters of credit under the Credit Agreement. As of December 31, 2022, Operating Company had $496 million of unutilized capacity under the Revolving Credit Facility due to $4 million of outstanding letters of credit.
Measurement of the Estimated Fair Value of Debt
The estimated fair value of the Company’s senior secured credit facilities and other senior indebtedness is classified as a Level 2 determination (see Note 10, Fair Value Measurements, for a description of the method by which fair value classifications are determined) in the fair-value hierarchy and is calculated by using a discounted cash flow model with a market interest rate as a significant input. The carrying amounts and the estimated fair values of the Company’s principal categories of debt as of December 31, and June 30, 2022 are as follows:
| | | | | | | | | | | | | | | | | | | | | | | | | | | | | |
| | | December 31, 2022 | | June 30, 2022 |
| (Dollars in millions) | Fair Value Measurement | | Carrying Value | | Estimated Fair Value | | Carrying Value | | Estimated Fair Value |
| | | | | | | | | |
| | | | | | | | | |
| 5.000% senior notes due 2027 | Level 2 | | $ | 500 | | | $ | 483 | | | $ | 500 | | | $ | 483 | |
| 2.375% Euro senior notes due 2028 | Level 2 | | 879 | | | 755 | | | 874 | | | 744 | |
| 3.125% senior notes due 2029 | Level 2 | | 550 | | | 469 | | | 550 | | | 476 | |
| 3.500% senior notes due 2030 | Level 2 | | 650 | | | 551 | | | 650 | | | 561 | |
| Senior secured credit facilities & other | Level 2 | | 2,317 | | | 2,111 | | | 1,669 | | | 1,575 | |
| Subtotal | | | $ | 4,896 | | | $ | 4,369 | | | $ | 4,243 | | | $ | 3,839 | |
| Unamortized discount and debt issuance costs | | | (43) | | | — | | | (41) | | | — | |
| Total debt | | | $ | 4,853 | | | $ | 4,369 | | | $ | 4,202 | | | $ | 3,839 | |
6. EARNINGS PER SHARE
Effective as of the first quarter of fiscal 2023, the Company computes earnings per share of the Company’s common stock, par value $0.01 (the “Common Stock”) using the treasury stock method. Prior to fiscal 2023, the Company computed earnings per share of the Common Stock using the two-class method required due to the participating nature of the previously outstanding Series A Preferred Stock (as defined and discussed in Note 13, Equity and Accumulated Other Comprehensive Loss).
Diluted net earnings per share is computed using the weighted average number of shares of Common Stock outstanding plus the weighted average number of shares of Common Stock that would be issued assuming exercise or conversion of all potentially dilutive instruments. Dilutive securities having an anti-dilutive effect on diluted net earnings per share are excluded from the calculation. The dilutive effect of the securities that are issuable under the Company’s equity incentive plans are reflected in diluted earnings per share by application of the treasury stock method. Prior to fiscal 2023, the Company applied the if-converted method to compute the potentially dilutive effect of the previously outstanding Series A Preferred Stock. The reconciliations between basic and diluted earnings per share attributable to Catalent common shareholders for the three and six months ended December 31, 2022 and 2021, respectively, are as follows:
| | | | | | | | | | | | | | | | | | | | | | | |
| Three Months Ended
December 31, | | Six Months Ended
December 31, |
| (In millions except per share data) | 2022 | | 2021 | | 2022 | | 2021 |
| | | | | | | |
| | | | | | | |
| Net earnings | $ | 81 | | | $ | 97 | | | $ | 81 | | | $ | 190 | |
| Less: Net earnings attributable to preferred shareholders | — | | | (4) | | | — | | | (13) | |
| Net earnings attributable to common shareholders | $ | 81 | | | $ | 93 | | | $ | 81 | | | $ | 177 | |
| | | | | | | |
| Weighted average shares outstanding - basic | 181 | | | 175 | | | 180 | | | 173 | |
| Weighted average dilutive securities issuable - stock plans | — | | | 2 | | | 1 | | | 2 | |
| Weighted average shares outstanding - diluted | 181 | | | 177 | | | 181 | | | 175 | |
| | | | | | | |
| Earnings per share: | | | | | | | |
| | | | | | | |
| | | | | | | |
| Basic | $ | 0.45 | | | $ | 0.53 | | | $ | 0.45 | | | $ | 1.02 | |
| | | | | | | |
| | | | | | | |
| | | | | | | |
| | | | | | | |
| Diluted | $ | 0.44 | | | $ | 0.52 | | | $ | 0.45 | | | $ | 1.01 | |
The Company's Series A Preferred Stock was deemed a participating security, meaning that it had the right to participate in undistributed earnings with the Company's Common Stock. On November 23, 2020, the holders of Series A Preferred Stock converted 265,223 shares of Series A Preferred Stock and $2 million of unpaid accrued dividends into shares of Common Stock. On November 18, 2021, the holders of Series A Preferred Stock converted the remaining 384,777 shares of Series A Preferred Stock and $2 million of unpaid accrued dividends into shares of Common Stock.
Shares with an antidilutive effect on the weighted average shares outstanding for the three and six months ended December 31, 2022 and 2021 were not material.
7. OTHER (INCOME) EXPENSE, NET
The components of other expense, net for the three and six months ended December 31, 2022 and 2021 are as follows:
| | | | | | | | | | | | | | | | | | | | | | | |
| Three Months Ended
December 31, | | Six Months Ended
December 31, |
| (Dollars in millions) | 2022 | | 2021 | | 2022 | | 2021 |
| | | | | | | |
| | | | | | | |
Debt financing costs (1) | $ | — | | | $ | — | | | $ | — | | | $ | 4 | |
| | | | | | | |
| | | | | | | |
Foreign currency (gains) losses (2) | (25) | | | 15 | | | (1) | | | 24 | |
Other (3) | 2 | | | (1) | | | 3 | | | (5) | |
| Total other (income) expense, net | $ | (23) | | | $ | 14 | | | $ | 2 | | | $ | 23 | |
(1) Debt financing costs for the six months ended December 31, 2021 includes $4 million of financing charges related to $450 million of U.S. dollar-denominated term loans borrowed in that period under the Company’s senior secured credit facilities.
(2) Foreign currency remeasurement gains/losses include both cash and non-cash transactions.
(3) Other, for the six months ended December 31, 2021, includes a gain of $2 million related to the fair value of the derivative liability associated with the formerly outstanding Series A Preferred Stock.
8. RESTRUCTURING COSTS
From time to time, the Company has implemented plans to restructure certain operations, both domestically and internationally. The restructuring plans focused on various aspects of operations, including closing and consolidating certain manufacturing operations, rationalizing headcount and aligning operations in a strategic and more cost-efficient structure. In addition, the Company may incur restructuring charges in the future in cases where a material change in the scope of operation with its business occurs. Employee-related costs consist primarily of severance costs and also include outplacement services provided to employees who have been involuntarily terminated and duplicate payroll costs during transition periods. Facility exit and other costs consist of equipment relocation costs and costs associated with planned facility expansions and closures to streamline Company operations.
During the three months ended December 31, 2022, the Company adopted plans to reduce costs, consolidate facilities, and optimize its infrastructure across the organization. In connection with these restructuring plans, the Company plans to reduce its headcount between 670 and 730 employees and incur cumulative employee-related charges between $14 million and $20 million, primarily associated with cash severance programs.
Restructuring costs for the three and six months ended December 31, 2022 and 2021 were recorded in Other Operating Expense in the Consolidated Statement of Operations.
The following table summarizes the charges recorded within restructuring costs:
| | | | | | | | | | | | | | | | | | | | | | | |
| Three Months Ended
December 31, | | Six Months Ended
December 31, |
(Dollars in millions) | 2022 | | 2021 | | 2022 | | 2021 |
| Restructuring costs: | | | | | | | |
| Employee-related reorganization | $ | 12 | | | $ | 1 | | | $ | 14 | | | $ | 2 | |
| Facility exit and other costs | 11 | | | — | | | 13 | | | — | |
| Total restructuring costs | $ | 23 | | | $ | 1 | | | $ | 27 | | | $ | 2 | |
The following table summarizes the charges recorded within restructuring costs by segment. These amounts are excluded from Segment EBITDA as described in Note 15, Segment Information.
| | | | | | | | | | | | | | | | | | | | | | | |
| Three Months Ended
December 31, | | Six Months Ended
December 31, |
(Dollars in millions) | 2022 | | 2021 | | 2022 | | 2021 |
| Restructuring costs: | | | | | | | |
| Biologics | $ | 18 | | | $ | — | | | $ | 18 | | | $ | — | |
| Pharma and Consumer Health | 1 | | | 1 | | | 4 | | | 2 | |
| Corporate | 4 | | | — | | | 5 | | | — | |
| Total restructuring costs | $ | 23 | | | $ | 1 | | | $ | 27 | | | $ | 2 | |
9. DERIVATIVE INSTRUMENTS AND HEDGING ACTIVITIES
Risk Management Objective of Using Derivatives
The Company is exposed to fluctuations in the currency exchange rates applicable to its investments in operations outside the U.S. While the Company does not actively hedge against changes in foreign currency, the Company has mitigated exposure from its investments in its European operations by denominating a portion of its debt in euros. At December 31, 2022, the Company had euro-denominated debt outstanding of $879 million (U.S. dollar equivalent), which is designated and qualifies as a hedge against its net investment in its European operations. For non-derivatives designated and qualifying as net investment hedges, the effective portion of translation gains or losses are reported in accumulated other comprehensive loss as part of the cumulative translation adjustment. The unhedged portions of the euro-denominated debt translation gains or losses are reported in the consolidated statements of operations. The following table summarizes net investment hedge activity during the three and six months ended December 31, 2022 and 2021.
| | | | | | | | | | | | | | | | | | | | | | | |
| Three Months Ended
December 31, | | Six Months Ended
December 31, |
| (Dollars in millions) | 2022 | | 2021 | | 2022 | | 2021 |
Unrealized foreign exchange gain (loss) within other comprehensive income | $ | (85) | | | $ | 40 | | | $ | (4) | | | $ | 62 | |
Unrealized foreign exchange gain (loss) within statement of operations | $ | — | | | $ | (8) | | | $ | — | | | $ | (11) | |
The net accumulated gain on the instrument designated as a hedge as of December 31, 2022 within other comprehensive loss was approximately $123 million. Amounts are reclassified out of accumulated other comprehensive loss into earnings when the entity to which the gains and losses relate is either sold or substantially liquidated.
Interest-Rate Swap
In April 2020, pursuant to its interest rate and risk management strategy, the Company entered into an interest-rate swap agreement with Bank of America N.A. (the “2020 Rate Swap”) as a hedge against the economic effect of a portion of the variable interest obligation associated with its U.S. dollar-denominated term loans under its senior secured credit facilities.
In February 2021, in connection with an amendment to the Credit Agreement, the Company paid $2 million in cash to Bank of America N.A to settle the 2020 Rate Swap. This loss is deferred in stockholders’ equity, net of income taxes, as a component of accumulated other comprehensive loss, and amortized as an adjustment to interest expense, net over the original
term of the formerly outstanding term loans. The net amount of deferred losses on cash flow hedges that is expected to be reclassified from accumulated other comprehensive loss into interest expense, net within the next twelve months is not material.
In February 2021, the Company entered into a new interest-rate swap agreement with Bank of America N.A. (the “2021 Rate Swap”) as a hedge against the economic effect of a portion of the variable interest obligation associated with its Term B-3 Loans. The 2021 Rate Swap effectively fixed the rate of interest payable on that portion of the Term B-3 Loans, thereby reducing the impact of future interest rate changes on future interest expense. As a result of the 2021 Rate Swap, the variable portion of the applicable interest rate on $500 million of the Term B-3 Loans is now effectively fixed at 0.9985%.
The 2021 Rate Swap qualifies for and is designated as a cash-flow hedge. The Company evaluates hedge effectiveness at the inception of the hedge and on an ongoing basis. The cash flows associated with the 2021 Rate Swap is reported in cash provided by operating activities in the consolidated statements of cash flows. The unrealized gain recorded in stockholder's equity from marking the 2021 Rate Swap to market during the six months ended December 31, 2022 was $18 million.
A summary of the estimated fair value of the 2021 Rate Swap reported in the consolidated balance sheets is stated in the table below:
| | | | | | | | | | | | | | | | | | | | | | | |
| December 31, 2022 | | June 30, 2022 |
| (Dollars in millions) | Balance Sheet Classification | | Estimated Fair Value | | Balance Sheet Classification | | Estimated Fair Value |
| Interest-rate swap | Other long-term assets | | $ | 54 | | | Other long-term assets | | $ | 36 | |
10. FAIR VALUE MEASUREMENTS
ASC 820, Fair Value Measurement, defines fair value as the exit price that would be received to sell an asset or paid to transfer a liability. Fair value is a market-based measurement that should be determined using assumptions that market participants would use in pricing an asset or liability. Valuation techniques used to measure fair value should maximize the use of observable inputs and minimize the use of unobservable inputs. To measure fair value, the Company uses the following fair value hierarchy based on three levels of inputs, of which Level 1 and Level 2 are considered observable and Level 3 is considered unobservable:
Level 1 – Quoted prices in active markets for identical assets or liabilities.
Level 2 – Inputs other than Level 1 that are observable for the asset or liability, either directly or indirectly, such as quoted prices for similar assets and liabilities in active markets; quoted prices for identical or similar assets or liabilities in markets that are not active; or other inputs that are observable or can be corroborated by observable market data by correlation or other means.
Level 3 – Unobservable inputs that are supported by little or no market activity and that are significant to the fair value of the assets or liabilities. Value is determined using pricing models, discounted cash flow methodologies, or similar techniques and also includes instruments for which the determination of fair value requires significant judgment or estimation.
Assets and Liabilities Measured at Fair Value on a Recurring Basis
The carrying amounts of cash and cash equivalents, accounts receivable, accounts payable and accrued expenses of the Company approximate fair value based on the short maturities of these instruments.
The Company evaluates its financial assets and liabilities subject to fair value measurements on a recurring basis to determine the appropriate level of classification as of the end of each reporting period. The following table sets forth the Company’s financial assets and liabilities that were measured at fair value on a recurring basis and the fair value measurement for such assets and liabilities at December 31, and June 30, 2022:
| | | | | | | | | | | | | | | | | | | | | | | | | | |
| (Dollars in millions) | | Basis of Fair Value Measurement |
| December 31, 2022 | | Total | | Level 1 | | Level 2 | | Level 3 |
| Assets: | | | | | | | | |
| Marketable securities | | $ | 28 | | | $ | 28 | | | $ | — | | | $ | — | |
| | | | | | | | |
| | | | | | | | |
| Interest-rate swap | | 54 | | | — | | | 54 | | | — | |
| Trading securities | | 1 | | | 1 | | | — | | | — | |
| | | | | | | | |
| | | | | | | | |
| | | | | | | | |
| | | | | | | | |
| | | | | | | | |
| June 30, 2022 | | | | | | | | |
| Assets: | | | | | | | | |
| | | | | | | | |
| Marketable securities | | $ | 89 | | | $ | 89 | | | $ | — | | | $ | — | |
| Interest-rate swap | | 36 | | | — | | | 36 | | | — | |
| Trading securities | | 2 | | | 2 | | | — | | | — | |
| | | | | | | | |
| | | | | | | | |
| | | | | | | | |
| | | | | | | | |
| | | | | | | | |
| | | | | | | | |
The fair value of the 2021 Rate Swap is determined at the end of each reporting period based on valuation models that use interest rate yield curves and discount rates as inputs. The discount rates are based on U.S. deposit or U.S. Treasury rates. The significant inputs used in the valuation models are readily available in public markets or can be derived from observable market transactions, and the valuation is therefore classified as Level 2 in the fair-value hierarchy.
Assets and Liabilities Measured at Fair Value on a Non-Recurring Basis
Long-lived assets, goodwill, and other intangible assets are subject to non-recurring fair value measurement for the evaluation of potential impairment. There was no non-recurring fair value measurement during the six months ended December 31, 2022.
11. INCOME TAXES
The Company accounts for income taxes in accordance with ASC 740, Income Taxes. Generally, fluctuations in the effective tax rate are due to changes in relative amounts of U.S. and non-U.S. pretax income, the tax impact of special items, and other discrete tax items. Discrete items include, but are not limited to, changes in non-U.S. statutory tax rates, amortization of certain assets, changes in the Company’s reserve for uncertain tax positions, and tax impact of certain equity compensation.
In the normal course of business, the Company is subject to examination by taxing authorities around the world. The Company is presently under audit in select jurisdictions in the United States and in Europe, but no material impact is expected to the financial results once these audits are completed.
ASC 740 provides guidance for the accounting of uncertain income tax positions recognized in the Company's tax filings. This guidance provides that a tax benefit from an uncertain tax position may be recognized when it is more likely than not that, based on technical merits, the position will be sustained upon examination, including resolution of any related appeal or litigation process. As of December 31, and June 30, 2022, the Company's reserve against uncertain income tax positions was $4 million and $5 million, respectively. The majority of the reduction is attributable to the expiration of the statute of limitations on certain of the reserves. Interest and penalties related to uncertain tax positions are recognized as a component of income tax expense.
The Company recorded a provision for income taxes for the three months ended December 31, 2022 of $33 million relative to earnings before income taxes of $114 million. The Company recorded a provision for income taxes for the three months ended December 31, 2021 of $18 million relative to earnings before income taxes of $115 million. The relatively higher income tax provision on lower earnings before income taxes is the result of decreased pretax income in tax jurisdictions with favorable tax rates, equity related compensation benefits in the prior-year quarter, and foreign tax credits claimed in the prior-year quarter resulting from amended returns. Generally, fluctuations in the effective tax rate are due to changes in the geographic distribution of the Company's pretax income resulting from its business mix, changes in the tax impact of permanent differences, restructuring, special items, certain equity related compensation, and other discrete tax items that may have unique tax implications depending on the nature of the item.
The Company recorded a provision for income taxes for the six months ended December 31, 2022 of $36 million relative to earnings before income taxes of $117 million. The Company recorded a provision for income taxes for the six months ended
December 31, 2021 of $28 million relative to earnings before income taxes of $218 million. The relatively higher income tax provision on lower earnings before income taxes is the result of decreased pretax income in tax jurisdictions with favorable tax rates and foreign tax credits claimed in the prior-year quarter resulting from amended returns. Generally, fluctuations in the effective tax rate are due to changes in the geographic distribution of the Company's pretax income resulting from its business mix, changes in the tax impact of permanent differences, restructuring, special items, certain equity related compensation, and other discrete tax items that may have unique tax implications depending on the nature of the item.
12. EMPLOYEE RETIREMENT BENEFIT PLANS
Components of the Company’s net periodic benefit costs are as follows:
| | | | | | | | | | | | | | | | | | | | | | | |
| Three Months Ended
December 31, | | Six Months Ended
December 31, |
| (Dollars in millions) | 2022 | | 2021 | | 2022 | | 2021 |
| Components of net periodic benefit cost: | | | | | | | |
| Selling, general, and administrative expenses: | | | | | | | |
| Service cost | $ | 1 | | | $ | 1 | | | $ | 2 | | | $ | 2 | |
| Other expense, net: | | | | | | | |
| Interest cost | 2 | | | 1 | | | 4 | | | 2 | |
| Expected return on plan assets | (2) | | | (3) | | | (4) | | | (5) | |
Amortization (1) | — | | | 1 | | | — | | | 2 | |
| Net amount recognized | $ | 1 | | | $ | — | | | $ | 2 | | | $ | 1 | |
(1) Amount represents the amortization of unrecognized actuarial losses.
As previously disclosed, the Company notified the trustees of a multi-employer pension plan of its withdrawal from participation in such plan in fiscal 2012. The actuarial review process administered by the plan trustees ended in fiscal 2015. The liability reported reflects the present value of the Company’s expected future long-term obligations. The estimated discounted value of the projected contributions related to such plans was $38 million as of December 31, 2022 and June 30, 2022, and is included within pension liability on the consolidated balance sheets. The annual cash impact associated with the Company’s obligations in such plan is approximately $2 million.
13. EQUITY AND ACCUMULATED OTHER COMPREHENSIVE LOSS
Description of Capital Stock
The Company is authorized to issue 1.00 billion shares of its Common Stock and 100 million shares of preferred stock, par value $0.01 per share. In accordance with the Company’s amended and restated certificate of incorporation, each share of Common Stock has one vote, and the Common Stock votes together as a single class. In 2019, the Company designated 1,000,000 shares of its preferred stock, par value $0.01, as its Series A Convertible Preferred Stock (the “Series A Preferred Stock”) and issued and sold 650,000 shares of the Series A Preferred Stock to affiliates of Leonard Green & Partners, L.P. In November 2021, the holders of the Series A Preferred Stock converted all then-outstanding shares of Series A Preferred Stock and $2 million of related unpaid accrued dividends into shares of Common Stock.
Accumulated Other Comprehensive Loss
The components of the changes in the cumulative translation adjustment, derivatives and hedges, minimum pension liability, and marketable securities for the three and six months ended December 31, 2022 and 2021 are presented below.
| | | | | | | | | | | | | | | | | | | | | | | |
| Three Months Ended
December 31, | | Six Months Ended
December 31, |
| (Dollars in millions) | 2022 | | 2021 | | 2022 | | 2021 |
| Foreign currency translation adjustments: | | | | | | | |
| Net investment hedge | $ | (85) | | | $ | 40 | | | $ | (4) | | | $ | 62 | |
| Long-term intercompany loans | 31 | | | (4) | | | (10) | | | (7) | |
| Translation adjustments | 155 | | | (45) | | | (5) | | | (73) | |
| Total foreign currency translation adjustment, pretax | 101 | | | (9) | | | (19) | | | (18) | |
| Tax (benefit) expense | (17) | | | 9 | | | (2) | | | 14 | |
| Total foreign currency translation adjustment, net of tax | $ | 118 | | | $ | (18) | | | $ | (17) | | | $ | (32) | |
| | | | | | | |
| Net change in derivatives and hedges: | | | | | | | |
| Net gain recognized during the period | $ | — | | | $ | 4 | | | $ | 18 | | | $ | 5 | |
| Total derivatives and hedges, pretax | — | | | 4 | | | 18 | | | 5 | |
| Tax expense | — | | | 1 | | | 4 | | | 1 | |
| Net change in derivatives and hedges, net of tax | $ | — | | | $ | 3 | | | $ | 14 | | | $ | 4 | |
| | | | | | | |
| Net change in minimum pension liability: | | | | | | | |
| | | | | | | |
| Net gain recognized during the period | $ | — | | | $ | — | | | $ | — | | | $ | 1 | |
| | | | | | | |
| Total pension liability, pretax | — | | | — | | | — | | | 1 | |
| Tax benefit | — | | | — | | | — | | | — | |
| Net change in minimum pension liability, net of tax | $ | — | | | $ | — | | | $ | — | | | $ | 1 | |
| | | | | | | |
| Net change in marketable securities: | | | | | | | |
| Net gain (loss) recognized during the period | $ | 1 | | | $ | (1) | | | $ | 1 | | | $ | (1) | |
Amounts reclassified from accumulated other
comprehensive loss | 1 | | | — | | | 2 | | | — | |
| Net change in marketable securities, pretax | 2 | | | (1) | | | 3 | | | (1) | |
| Tax expense | 1 | | | $ | — | | | 1 | | | $ | — | |
| Net change in marketable securities, net of tax | $ | 1 | | | $ | (1) | | | $ | 2 | | | $ | (1) | |
| | | | | | | |
For the three months ended December 31, 2022 and 2021, the changes in accumulated other comprehensive loss, net of tax by component are as follows:
| | | | | | | | | | | | | | | | | | | | | | | | | | | | | | | | | | | | | | |
| (Dollars in millions) | Foreign Exchange Translation Adjustments | | Pension and Liability Adjustments | | Derivatives and Hedges | | | | | Marketable Securities | | Other | | Total |
| Balance at September 30, 2022 | $ | (513) | | | $ | (38) | | | $ | 41 | | | | | | $ | (3) | | | $ | (1) | | | $ | (514) | |
Other comprehensive income before
reclassifications | 118 | | | — | | | — | | | | | | — | | | — | | | 118 | |
Amounts reclassified from accumulated other
comprehensive loss | — | | | — | | | — | | | | | | 1 | | | — | | | 1 | |
Net current period other comprehensive income | 118 | | | — | | | — | | | | | | 1 | | | — | | | 119 | |
| Balance at December 31, 2022 | $ | (395) | | | $ | (38) | | | $ | 41 | | | | | | $ | (2) | | | $ | (1) | | | $ | (395) | |
| | | | | | | | | | | | | | | | | | | | | | | | | | | | | | | | | | | | | | |
| (Dollars in millions) | Foreign Exchange Translation Adjustments | | Pension and Liability Adjustments | | Derivatives and Hedges | | | | | Marketable Securities | | Other | | Total |
| Balance at September 30, 2021 | $ | (282) | | | $ | (46) | | | $ | 1 | | | | | | $ | (1) | | | $ | (1) | | | $ | (329) | |
Other comprehensive (loss) income before
reclassifications | (18) | | | — | | | 3 | | | | | | (1) | | | — | | | (16) | |
Amounts reclassified from accumulated other
comprehensive loss | — | | | — | | | — | | | | | | — | | | — | | | — | |
Net current period other comprehensive (loss) income | (18) | | | — | | | 3 | | | | | | (1) | | | — | | | (16) | |
| Balance at December 31, 2021 | $ | (300) | | | $ | (46) | | | $ | 4 | | | | | | $ | (2) | | | $ | (1) | | | $ | (345) | |
For the six months ended December 31, 2022 and 2021, the changes in accumulated other comprehensive loss, net of tax by component are as follows:
| | | | | | | | | | | | | | | | | | | | | | | | | | | | | | | | | | | | | | |
| (Dollars in millions) | Foreign Exchange Translation Adjustments | | Pension and Liability Adjustments | | Derivatives and Hedges | | | | | Marketable Securities | | Other | | Total |
| Balance at June 30, 2022 | $ | (378) | | | $ | (38) | | | $ | 27 | | | | | | $ | (4) | | | $ | (1) | | | $ | (394) | |
Other comprehensive (loss) income before
reclassifications | (17) | | | — | | | 14 | | | | | | — | | | — | | | (3) | |
Amounts reclassified from accumulated other
comprehensive loss | — | | | — | | | — | | | | | | 2 | | | — | | | 2 | |
Net current period other comprehensive (loss) income | (17) | | | — | | | 14 | | | | | | 2 | | | — | | | (1) | |
| Balance at December 31, 2022 | $ | (395) | | | $ | (38) | | | $ | 41 | | | | | | $ | (2) | | | $ | (1) | | | $ | (395) | |
| | | | | | | | | | | | | | | | | | | | | | | | | | | | | | | | | | | | | | |
| (Dollars in millions) | Foreign Exchange Translation Adjustments | | Pension and Liability Adjustments | | Derivatives and Hedges | | | | | Marketable Securities | | Other | | Total |
| Balance at June 30, 2021 | $ | (268) | | | $ | (47) | | | $ | — | | | | | | $ | (1) | | | $ | (1) | | | $ | (317) | |
Other comprehensive (loss) income before
reclassifications | (32) | | | — | | | 4 | | | | | | (1) | | | — | | | (29) | |
Amounts reclassified from accumulated other
comprehensive loss | — | | | 1 | | | — | | | | | | — | | | — | | | 1 | |
Net current period other comprehensive (loss) income | (32) | | | 1 | | | 4 | | | | | | (1) | | | — | | | (28) | |
| Balance at December 31, 2021 | $ | (300) | | | $ | (46) | | | $ | 4 | | | | | | $ | (2) | | | $ | (1) | | | $ | (345) | |
14. COMMITMENTS AND CONTINGENCIES
From time to time, the Company may be involved in legal proceedings arising in the ordinary course of business, including, without limitation, inquiries and claims concerning environmental contamination as well as litigation and allegations in connection with acquisitions, product liability, manufacturing or packaging defects, and claims for reimbursement for the cost of lost or damaged active pharmaceutical ingredients, the cost of any of which could be significant. The Company intends to vigorously defend itself against any such litigation and does not currently believe that the outcome of any such litigation will have a material adverse effect on the Company’s consolidated financial statements. In addition, the healthcare industry is highly regulated and government agencies continue to scrutinize certain practices affecting government programs and otherwise.
From time to time, the Company receives subpoenas or requests for information relating to the business practices and activities of customers or suppliers from various governmental agencies or private parties, including from state attorneys general, the U.S. Department of Justice, and private parties engaged in patent infringement, antitrust, tort, and other litigation. The Company generally responds to such subpoenas and requests in a timely and thorough manner, which responses sometimes
require considerable time and effort and can result in considerable costs being incurred. The Company expects to incur costs in future periods in connection with future requests.
15. SEGMENT INFORMATION
The Company evaluates the performance of its segments based on segment earnings before other (expense) income, impairments, restructuring costs, interest expense, income tax expense, and depreciation and amortization (“Segment EBITDA”).
Segment EBITDA is subject to important limitations. These consolidated financial statements include information concerning Segment EBITDA (a) because Segment EBITDA is an operational measure used by management in the assessment of the operating segments, the allocation of resources to the segments, and the setting of strategic goals and annual goals for the segments, and (b) in order to provide supplemental information that the Company considers relevant for the readers of the consolidated financial statements. The Company’s presentation of Segment EBITDA may not be comparable to similarly titled measures used by other companies.
The following tables include Segment EBITDA for each of the Company's current reportable segments during the three and six months ended December 31, 2022 and 2021:
| | | | | | | | | | | | | | | | | | | | | | | |
| (Dollars in millions) | Three Months Ended
December 31, | | Six Months Ended
December 31, |
| 2022 | | 2021 | | 2022 | | 2021 |
| Segment EBITDA reconciled to net earnings: | | | | | | | |
| Biologics | $ | 181 | | | $ | 199 | | | $ | 294 | | | $ | 366 | |
| Pharma and Consumer Health | 135 | | | 147 | | | 243 | | | 246 | |
| | | | | | | |
| | | | | | | |
| Sub-Total | $ | 316 | | | $ | 346 | | | $ | 537 | | | $ | 612 | |
| Reconciling items to net earnings | | | | | | | |
Unallocated costs (1) | (52) | | | (101) | | | (139) | | | (157) | |
| Depreciation and amortization | (103) | | | (98) | | | (202) | | | (179) | |
| Interest expense, net | (47) | | | (32) | | | (79) | | | (58) | |
| Income tax expense | (33) | | | (18) | | | (36) | | | (28) | |
| | | | | | | |
| Net earnings | $ | 81 | | | $ | 97 | | | $ | 81 | | | $ | 190 | |
(1) Unallocated costs include restructuring and special items, stock-based compensation, gain on sale of subsidiary, impairment charges, certain other corporate directed costs, and other costs that are not allocated to the segments as follows:
| | | | | | | | | | | | | | | | | | | | | | | |
| (Dollars in millions) | Three Months Ended December 31, | | Six Months Ended
December 31, |
| 2022 | | 2021 | | 2022 | | 2021 |
Impairment charges and gain/loss on sale of assets(a) | $ | (1) | | | $ | (16) | | | $ | 1 | | | $ | (19) | |
| Stock-based compensation | (10) | | | (11) | | | (29) | | | (32) | |
Restructuring and other special items(b) | (33) | | | (23) | | | (42) | | | (31) | |
Gain on sale of subsidiary(c) | — | | | — | | | — | | | 1 | |
| | | | | | | |
| | | | | | | |
| | | | | | | |
Other income (expense), net(d) | 23 | | | (14) | | | (2) | | | (23) | |
| Unallocated corporate costs, net | (31) | | | (37) | | | (67) | | | (53) | |
| Total unallocated costs | $ | (52) | | | $ | (101) | | | $ | (139) | | | $ | (157) | |
(a) Impairment charges and gain/loss on sale of assets during the three and six months ended December 31, 2021 include fixed asset impairment charges associated with a product in the Pharma and Consumer Health segment.
(b) Restructuring and other special items during the three months ended December 31, 2022 include (i) restructuring charges associated with our plans to reduce costs, consolidate facilities, and optimize our infrastructure across the organization and (ii) transaction and integration costs associated with our Metrics acquisition. Restructuring and other special items for the six months ended December 31, 2022 also includes warehouse exit costs for a product the Company no longer manufactures in its Pharma and Consumer Health segment. For further details on restructuring charges, see Note 8, Restructuring Costs.
Restructuring and other special items during the three months ended December 31, 2021 include (a) transaction and integration costs primarily associated with the Bettera Wellness acquisition and (b) restructuring costs associated with the closure of the previously owned Bolton facility. Restructuring and other special items during the six months ended December 31, 2021 include (c) transaction and integration costs associated with the Delphi Genetics SA, Hepatic Cell Therapy Support SA, RheinCell Therapeutics GmbH, and Bettera Wellness acquisitions.
(c) Gain on sale of subsidiary for the six months ended December 31, 2021 was due to the sale of the Company's facility in Woodstock, Illinois and the associated business.
(d) Other income (expense), net during the three and six months ended December 31, 2022 and 2021 primarily includes foreign currency remeasurement losses/gains.
The following table includes total assets for each segment, as well as reconciling items necessary to total the amounts reported in the consolidated financial statements.
| | | | | | | | | | | |
| (Dollars in millions) | December 31,
2022 | | June 30,
2022 |
| Assets: | | | |
| Biologics | $ | 5,902 | | | $ | 5,770 | |
| Pharma and Consumer Health | 4,992 | | | 4,355 | |
| | | |
| | | |
| Corporate and eliminations | 253 | | | 382 | |
| Total assets | $ | 11,147 | | | $ | 10,507 | |
16. SUPPLEMENTAL BALANCE SHEET INFORMATION
Supplemental balance sheet information at December 31, 2022 and June 30, 2022 is detailed in the following tables.
Inventories
Work-in-process and inventories include raw materials, labor, and overhead. Total inventories consist of the following:
| | | | | | | | | | | |
| (Dollars in millions) | December 31,
2022 | | June 30,
2022 |
| Raw materials and supplies | $ | 803 | | | $ | 651 | |
| Work-in-process | 144 | | | 109 | |
| | | |
| Total inventories, gross | 947 | | | 760 | |
Inventory cost adjustment (1) | (129) | | | (58) | |
| Total inventories | $ | 818 | | | $ | 702 | |
(1) Increase in inventory cost adjustment is primarily associated with the settlement of certain take-or-pay arrangements.
Prepaid expenses and other
Prepaid expenses and other consist of the following: | | | | | | | | | | | |
| (Dollars in millions) | December 31,
2022 | | June 30,
2022 |
| Prepaid expenses | $ | 67 | | | $ | 61 | |
| | | |
| Short-term contract assets | 497 | | | 398 | |
| | | |
| Spare parts supplies | 23 | | | 22 | |
| Prepaid income tax | 31 | | | 26 | |
| | | |
| Non-U.S. value-added tax | 37 | | | 48 | |
| | | |
| | | |
| | | |
| Other current assets | 59 | | | 70 | |
| Total prepaid expenses and other | $ | 714 | | | $ | 625 | |
Other accrued liabilities
Other accrued liabilities consist of the following: | | | | | | | | | | | |
| (Dollars in millions) | December 31,
2022 | | June 30,
2022 |
| Contract liabilities | $ | 175 | | | $ | 185 | |
| Accrued employee-related expenses | 143 | | | 198 | |
| Accrued expenses | 123 | | | 140 | |
| Operating lease liabilities | 12 | | | 14 | |
| Restructuring accrual | 7 | | | 1 | |
| Accrued interest | 33 | | | 32 | |
| Accrued income tax | 34 | | | 50 | |
| Total other accrued liabilities | $ | 527 | | | $ | 620 | |
ITEM 2. MANAGEMENT’S DISCUSSION AND ANALYSIS OF FINANCIAL CONDITION AND RESULTS OF OPERATIONS
The Company
We provide differentiated development and manufacturing solutions for drugs, protein-based biologics, cell and gene therapies, vaccines, and consumer health products at over fifty facilities across four continents under rigorous quality and operational standards. Our oral, injectable, and respiratory delivery technologies, along with our state-of-the-art protein and cell and gene therapy manufacturing capacity, address a wide and growing range of modalities and therapeutic and other categories across the biopharmaceutical and consumer health industries. Through our extensive capabilities, growth-enabling capacity, and
deep expertise in product development, regulatory compliance, and clinical trial supply, we can help our customers take products to market faster, and have done so for nearly half of new drug products approved by the U.S. Food and Drug Administration (the “FDA”) in the last decade. Our development and manufacturing platforms, our proven formulation, supply, and regulatory expertise, and our broad and deep development and manufacturing know-how enable our customers to advance and then bring to market more products and better treatments for patients and consumers. Our commitment to reliably supply our customers’ and their patients’ needs is the foundation for the value we provide; annually, we produce more than 80 billion doses for nearly 8,000 customer products, or approximately 1 in every 23 doses of such products taken each year by patients and consumers around the world. We believe that through our investments in state-of-the-art facilities and capacity expansion, including investments in facilities focused on new treatment modalities and other attractive market segments, our continuous improvement activities devoted to operational and quality excellence, the sales of existing and introduction of new customer products, and, in some cases, our innovation activities and patents, we will continue to attract premium opportunities and realize the growth potential from these areas.
At the commencement of the first quarter of fiscal 2023, in connection with our change in Chief Executive Officer and Chief Operating Decision Maker, we adopted a new operating structure with two operating and reportable segments: (i) Biologics, and (ii) Pharma and Consumer Health. Our Biologics segment provides the same services as the segment we reported in fiscal 2022, with some organizational adjustments and the addition of analytical development and testing services for large molecules that we previously disclosed as part of our prior Oral and Specialty Delivery segment. The Biologics segment as reorganized provides development and manufacturing for biologic proteins; cell, gene, and other nucleic acid therapies; plasmid DNA; induced pluripotent stem cells (iPSCs); and vaccines. It also provides formulation, development, and manufacturing for parenteral dose forms, including vials, prefilled syringes, and cartridges; and, as noted above, analytical development and testing services for large molecules. Our Pharma and Consumer Health segment, except as noted above, comprises the offerings of three of our prior reportable segments—Softgel and Oral Technologies, Oral and Specialty Delivery and Clinical Supply Services—and comprises the Company’s market-leading capabilities for complex oral solids, softgel formulations, Zydis® fast-dissolve technologies, and gummy, soft chew, and lozenge dosage forms; formulation, development, and manufacturing platforms for oral, nasal, inhaled, and topical dose forms; and clinical trial development and supply services. Prior-period segment results were reclassified to conform to the current period presentation.
Critical Accounting Policies and Estimates
We prepare our financial statements in accordance with generally accepted accounting principles in the United States (“U.S. GAAP”). Management made certain estimates and assumptions during the preparation of the consolidated financial statements in accordance with U.S. GAAP. These estimates and assumptions affect the reported amount of assets and liabilities and disclosures of contingent assets and liabilities in the consolidated financial statements. These estimates also affect the reported amount of net earnings during the reporting periods. Actual results could differ from those estimates. Because of the size of the financial statement elements to which they relate, some of our accounting policies and estimates have a more significant impact on the consolidated financial statements than others.
There was no material change to our critical accounting policies or in the underlying accounting assumptions and estimates from those described in our Fiscal 2022 10-K.
Non-GAAP Metrics
EBITDA from operations
Management measures operating performance based on consolidated earnings from operations before interest expense, expense for income taxes, and depreciation and amortization, adjusted for the income or loss attributable to non-controlling interests (“EBITDA from operations”). EBITDA from operations is not defined under U.S. GAAP, is not a measure of operating income, operating performance, or liquidity presented in accordance with U.S. GAAP, and is subject to important limitations.
We believe that the presentation of EBITDA from operations enhances an investor’s understanding of our financial performance. We believe this measure is a useful financial metric to assess our operating performance from period to period by excluding certain items that we believe are not representative of our core business and use this measure for business planning purposes. In addition, given the significant historical investments that we have made in property, plant, and equipment, depreciation and amortization expenses represent a meaningful portion of our cost structure. We believe that EBITDA from operations will provide investors with a useful tool for assessing the comparability between periods of our ability to generate cash from operations sufficient to pay taxes, to service debt, and to undertake capital expenditures because it eliminates depreciation and amortization expense. We present EBITDA from operations in order to provide supplemental information that we consider relevant for the readers of our unaudited consolidated financial statements included elsewhere in this Quarterly Report on Form 10-Q (the “Consolidated Financial Statements”), and such information is not meant to replace or supersede
U.S. GAAP measures. Our definition of EBITDA from operations may not be the same as similarly titled measures used by other companies. The most directly comparable measure to EBITDA from operations defined under U.S. GAAP is net earnings. Included in this Management’s Discussion and Analysis is a reconciliation of net earnings to EBITDA from operations.
In addition, we evaluate the performance of our segments based on segment earnings before non-controlling interests, other expense (income), impairments, restructuring costs, interest expense, income tax expense, and depreciation and amortization (“Segment EBITDA”).
Use of Constant Currency
As exchange rates are an important factor in understanding period-to-period comparisons, we believe the presentation of results on a constant-currency basis in addition to reported results helps improve investors’ ability to understand our operating results and evaluate our performance in comparison to prior periods. Constant-currency information compares results between periods as if exchange rates had remained constant period-over-period. We use results on a constant-currency basis as one measure to evaluate our performance. In this Quarterly Report on Form 10-Q, we compute constant currency by calculating current-year results using prior-year foreign currency exchange rates. We generally refer to such amounts calculated on a constant-currency basis as excluding the impact of foreign currency exchange. These results should be considered in addition to, not as a substitute for, results reported in accordance with U.S. GAAP. Results on a constant-currency basis, as we present them, may not be comparable to similarly titled measures used by other companies and are not measures of performance presented in accordance with U.S. GAAP.
Other Non-GAAP Measures
Organic revenue growth and Segment EBITDA growth are measures we use to explain the underlying results and trends in the business. Organic revenue growth and Segment EBITDA growth are measures used to show current year sales and earnings from existing operations. Organic revenue growth and Segment EBITDA growth exclude the impact of foreign currency exchange, acquisitions of operating or legal entities, and divestitures within the year. These measures should be considered in addition to, not as a substitute for, performance measures reported in accordance with U.S. GAAP. These measures, as we present them, may not be comparable to similarly titled measures used by other companies and are not measures of performance presented in accordance with U.S. GAAP.
Restructuring Program
The pharmaceutical contract manufacturing industry is labor intensive. In addition, we incur significant fixed costs for facilities and other infrastructure required to obtain, manufacture, transport and test our products. Therefore, relatively small changes in demand can have a significant impact on short-term profitability.
In the second quarter of fiscal 2023, we engaged in a restructuring effort, which is designed to reduce our cost structure, consolidate facilities, and optimize our infrastructure across the organization. As the detailed plans of action were executed, it has resulted in charges to earnings. A material portion of the total estimated pre-tax charges expected to be incurred in fiscal 2023 are expected to result in cash expenditures. The actual charges incurred in connection with the course of action in 2023 could be materially different from these estimates.
In connection with these restructuring plans, we plan to reduce our headcount between 670 and 730 employees and incur cumulative employee-related charges between $14 and $20 million, primarily associated with cash severance programs. As a result of our restructuring plans, our goal is to deliver an annualized run-rate savings of $75 to $85 million as we exit fiscal 2023.
During the six months ended December 31, 2022, the cumulative charges recorded in connection with the adopted restructuring plans were $27 million of cumulative pre-tax employee separation costs and other restructuring related costs.
For further details regarding restructuring costs, see Note 8, Restructuring Costs, to the consolidated financial statements.
Three Months Ended December 31, 2022 Compared to the Three Months Ended December 31, 2021
The below tables summarize several financial metrics we use to measure performance for the three months ended December 31, 2022 and 2021. Refer to the discussions below regarding performance and use of key financial metrics.
Results for the three months ended December 31, 2022 compared to the three months ended December 31, 2021 were as follows:
| | | | | | | | | | | | | | | | | | | | | | | | | | | | | |
| | Three Months Ended
December 31, | | FX Impact | | Constant Currency Increase (Decrease) |
| (Dollars in millions) | 2022 | | 2021 | | | | Change $ | | Change % |
| Net revenue | $ | 1,149 | | | $ | 1,217 | | | $ | (42) | | | $ | (26) | | | (2) | % |
| Cost of sales | 762 | | | 812 | | | (30) | | | (20) | | | (2) | % |
| Gross margin | 387 | | | 405 | | | (12) | | | (6) | | | (2) | % |
| Selling, general, and administrative expenses | 226 | | | 228 | | | (3) | | | 1 | | | 1 | % |
| | | | | | | | | |
| | | | | | | | | |
| Other operating expense, net | 23 | | | 16 | | | (2) | | | 9 | | | 44 | % |
| | | | | | | | | |
| Operating earnings | 138 | | | 161 | | | (7) | | | (16) | | | (10) | % |
| Interest expense, net | 47 | | | 32 | | | (1) | | | 16 | | | 49 | % |
| Other (income) expense, net | (23) | | | 14 | | | (1) | | | (36) | | | (256) | % |
| Earnings before income taxes | 114 | | | 115 | | | (5) | | | 4 | | | 4 | % |
| Income tax expense | 33 | | | 18 | | | (2) | | | 17 | | | 102 | % |
| | | | | | | | | |
| | | | | | | | | |
| | | | | | | | | |
| | | | | | | | | |
| Net earnings | $ | 81 | | | $ | 97 | | | $ | (3) | | | $ | (13) | | | (13) | % |
Change % calculations are based on amounts prior to rounding
Net Revenue | | | | | | | |
| 2022 vs. 2021 | | |
| Year-Over-Year Change | Three Months Ended
December 31, |
| Net Revenue | | |
| Organic | (4) | % | | |
| Impact of acquisitions | 2 | % | | |
| | | |
| Constant-currency change | (2) | % | | |
| Foreign currency translation impact on reporting | (4) | % | | |
| Total % change | (6) | % | | |
Net revenue decreased $26 million, or 2%, excluding the impact of foreign exchange, compared to the three months ended December 31, 2021. Net revenue decreased 4% organically primarily due to a significant decline in demand for COVID-19 related programs and a decline in revenue from the manufacture of prescription products, partially offset by
amounts due under certain take-or-pay arrangements in our Biologics segment, strong growth in non-COVID programs, particularly, our gene therapy offerings, as well as growth in our clinical development services.
Net revenue increased 2% inorganically as a result of acquisitions. We acquired a cell therapy commercial manufacturing facility and operations near Princeton, New Jersey in April 2022 and Metrics Contract Services (“Metrics”) in October 2022.
Gross Margin
Gross margin decreased $6 million, or 2%, compared to the three months ended December 31, 2021, excluding the impact of foreign exchange, primarily due to an unfavorable shift in product mix, and inflationary pressures. On a constant-currency basis, gross margin, as a percentage of revenue, increased 20 basis points to 33.5% in the three months ended December 31, 2022, compared to 33.3% in the prior-year period, primarily due to amounts due under certain take-or-pay arrangements, partially offset by an unfavorable shift in product mix and inflationary pressures.
Selling, General, and Administrative Expenses
Selling, general, and administrative expenses increased $1 million, or 1%, compared to the three months ended December 31, 2021, excluding the impact of foreign exchange. The year-over-year increase in selling, general, and administrative expenses was primarily due to $7 million in net incremental expenses from acquired companies and a $4 million increase in our provision for bad debt, partially offset by a $10 million decline in acquisition, transaction, and integration costs.
Other Operating Expense, net
Other operating expense for the three months ended December 31, 2022 increased by $9 million, or 44%, compared to the three months ended December 31, 2021, when excluding the impact of foreign exchange. The year-over-year increase in other operating expense, net was primarily due to a $22 million increase in restructuring charges primarily associated with our plan to reduce costs, consolidate facilities and optimize infrastructure across the organization, partially offset by a $15 million decrease in asset impairment charges.
Interest Expense, net
Interest expense, net of $47 million for the three months ended December 31, 2022 increased $16 million, or 49%, compared to the three months ended December 31, 2021, excluding the impact of foreign exchange. The increase was primarily attributable to incremental interest expense on our most recent tranche of term loans and our borrowing on our revolving credit facility.
For additional information concerning our debt and financing arrangements, including the changing mix of debt and equity in our capital structure, see “Liquidity and Capital Resources” below and Note 5, Long-Term Obligations and Short-Term Borrowings to our Consolidated Financial Statements.
Other Income (Expense), net
Other income, net of $23 million for the three months ended December 31, 2022 was primarily driven by $25 million of foreign currency gains.
Other expense, net of $14 million for the three months ended December 31, 2021 was primarily driven by $15 million of foreign currency losses.
Income Tax Expense
Our provision for income taxes for the three months ended December 31, 2022 was $33 million relative to earnings before taxes of $114 million. Our provision for income taxes for the three months ended December 31, 2021 was $18 million relative to earnings before income taxes of $115 million. The relatively higher income tax provision on lower earnings before income taxes is the result of decreased pretax income in tax jurisdictions with favorable tax rates, equity related compensation benefits in the prior-year quarter, and foreign tax credits claimed in the prior-year quarter resulting from amended returns. Generally, fluctuations in the effective tax rate are due to changes in the geographic distribution of the Company's pretax income resulting from our business mix, changes in the tax impact of permanent differences, restructuring, special items, certain equity related compensation, and other discrete tax items that may have unique tax implications depending on the nature of the item.
Segment Review
The following charts depict the percentages of net revenue from each of our two reportable segments for the three months ended December 31, 2022 compared to the three months ended December 31, 2021. Refer below for discussions regarding each
segment’s net revenue and EBITDA performance and to “Non-GAAP Metrics” for a discussion of our use of Segment EBITDA, a measure that is not defined under U.S. GAAP.
Our results on a segment basis for the three months ended December 31, 2022 compared to the three months ended December 31, 2021 were as follows:
| | | | | | | | | | | | | | | | | | | | | | | | | | | | | |
| | Three Months Ended
December 31, | | FX Impact | | Constant Currency Increase (Decrease) |
| (Dollars in millions) | 2022 | | 2021 | | | | Change $ | | Change % |
| Biologics | | | | | | | | | |
| Net revenue | $ | 580 | | | $ | 641 | | | $ | (15) | | | $ | (46) | | | (7) | % |
| Segment EBITDA | 181 | | | 199 | | | (5) | | | (13) | | | (7) | % |
| Pharma Consumer Health | | | | | | | | | |
| Net revenue | 570 | | | 577 | | | (27) | | | 20 | | | 3 | % |
| Segment EBITDA | 135 | | | 147 | | | (8) | | | (4) | | | (3) | % |
| | | | | | | | | |
| | | | | | | | | |
| | | | | | | | | |
| | | | | | | | | |
| | | | | | | | | |
| | | | | | | | | |
| Inter-segment revenue elimination | (1) | | | (1) | | | — | | | — | | | 30 | % |
Unallocated Costs (1) | (52) | | | (101) | | | 5 | | | 44 | | | (44) | % |
| Combined totals | | | | | | | | | |
| Net revenue | $ | 1,149 | | | $ | 1,217 | | | $ | (42) | | | $ | (26) | | | (2) | % |
| | | | | | | | | |
| EBITDA from operations | $ | 264 | | | $ | 245 | | | $ | (8) | | | $ | 27 | | | 11 | % |
Change % calculations are based on amounts prior to rounding
(1) Unallocated costs include restructuring and special items, stock-based compensation, impairment charges, certain other corporate directed costs, and other costs that are not allocated to the segments as follows:
| | | | | | | | | | | |
| | Three Months Ended
December 31, |
| (Dollars in millions) | 2022 | | 2021 |
Impairment charges and gain/loss on sale of assets(a) | $ | (1) | | | $ | (16) | |
| Stock-based compensation | (10) | | | (11) | |
Restructuring and other special items (b) | (33) | | | (23) | |
| | | |
| | | |
| | | |
Other income (expense), net (c) | 23 | | | (14) | |
| Unallocated corporate costs, net | (31) | | | (37) | |
| Total unallocated costs | $ | (52) | | | $ | (101) | |
(a) Impairment charges and gain/loss on sale of assets during the three months ended December 31, 2021 were primarily due to fixed asset impairment charges associated with dedicated equipment for a product that we no longer manufacture in our Pharma and Consumer Health segment.
(b) Restructuring and other special items during the three months ended December 31, 2022 include (i) restructuring charges associated with our plans to reduce costs, consolidate facilities, and optimize infrastructure across the organization and (ii) transaction and integration costs associated with our Metrics acquisition. Restructuring and other special items during the three months ended December 31, 2021 include (a) transaction and integration costs primarily associated with the acquisition of Bettera Holdings, LLC (“Bettera Wellness”) in October 2021, and (b) restructuring costs associated with the closure of our former facility in Bolton, U.K.
(c) Refer to Note 7, Other (Income) Expense, Net for details recorded within other expense, net in our Consolidated Financial Statements.
Provided below is a reconciliation of net earnings to EBITDA from operations:
| | | | | | | | | | | |
| | Three Months Ended
December 31, |
| (Dollars in millions) | 2022 | | 2021 |
| Net earnings | $ | 81 | | | $ | 97 | |
| Depreciation and amortization | 103 | | | 98 | |
| Interest expense, net | 47 | | | 32 | |
| Income tax expense | 33 | | | 18 | |
| | | |
| EBITDA from operations | $ | 264 | | | $ | 245 | |
Biologics segment | | | | | | | | | | | |
| 2022 vs. 2021 |
| Year-Over-Year Change | Three Months Ended
December 31, |
| Net Revenue | | Segment EBITDA |
| Organic | (7) | % | | (5) | % |
| Impact of acquisitions | — | % | | (2) | % |
| Constant-currency change | (7) | % | | (7) | % |
| Foreign exchange translation impact on reporting | (3) | % | | (2) | % |
| Total % change | (10) | % | | (9) | % |
Biologics net revenue decreased by $46 million, or 7%, excluding the impact of foreign exchange, compared to the three months ended December 31, 2021. The decrease was primarily driven by a significant decline in demand for COVID-19 related programs, partially offset by amounts due under certain take-or-pay agreements and strong growth in non-COVID programs, particularly, our gene therapy offerings.
Biologics Segment EBITDA decreased by $13 million, or 7%, excluding the impact of foreign exchange, compared to the three months ended December 31, 2021. The decrease was primarily driven by a significant decline in demand for COVID-19 related programs, which was partially offset by (i) strong growth in non-COVID programs, particularly for our gene therapy offerings, and (ii) amounts due under certain take-or-pay agreements.
We completed the acquisition of our Princeton facility and operations in April 2022. For the three months ended December 31, 2022, this acquisition had an immaterial impact on our net revenue and Segment EBITDA.
Pharma and Consumer Health segment | | | | | | | | | | | |
| 2022 vs. 2021 |
| Year-Over-Year Change | Three Months Ended
December 31, |
| Net Revenue | | Segment EBITDA |
| Organic | — | % | | (7) | % |
| Impact of acquisitions | 3 | % | | 4 | % |
| Constant-currency change | 3 | % | | (3) | % |
| Foreign currency translation impact on reporting | (4) | % | | (5) | % |
| Total % change | (1) | % | | (8) | % |
Pharma and Consumer Health net revenue increased by $20 million, or 3%, excluding the impact of foreign exchange, compared to the three months ended December 31, 2021. Organic revenue was consistent with the prior-year period. Growth in our clinical development services was offset by a decline in revenue from the manufacture of prescription products.
Pharma and Consumer Health Segment EBITDA decreased $4 million, or 3%, excluding the impact of foreign exchange, compared to the three months ended December 31, 2021. The organic portion of the decrease was driven by inflationary pressures and a decline in prescription products revenue, partially offset by growth in our clinical development services.
We acquired Metrics in October 2022, which increased net revenue and Segment EBITDA on an inorganic basis by 3% and 4%, respectively, in the three months ended December 31, 2022, compared to the corresponding prior-year period.
Six Months Ended December 31, 2022 Compared to the Six Months Ended December 31, 2021
The below tables summarize several financial metrics we use to measure performance for the six months ended December 31, 2022 and six months ended December 31, 2021. Refer to the discussions below regarding performance and use of key financial metrics.
Results for the six months ended December 31, 2022 compared to the six months ended December 31, 2021 were as follows:
| | | | | | | | | | | | | | | | | | | | | | | | | | | | | |
| | Six Months Ended
December 31, | | FX Impact | | Constant Currency Increase (Decrease) |
| (Dollars in millions) | 2022 | | 2021 | | | | Change $ | | Change % |
| Net revenue | $ | 2,171 | | | $ | 2,242 | | | $ | (90) | | | $ | 19 | | | 1 | % |
| Cost of sales | 1,526 | | | 1,513 | | | (65) | | | 78 | | | 5 | % |
| Gross margin | 645 | | | 729 | | | (25) | | | (59) | | | (8) | % |
| Selling, general, and administrative expenses | 422 | | | 411 | | | (10) | | | 21 | | | 5 | % |
| Gain on sale of subsidiary | — | | | (1) | | | — | | | 1 | | | * |
| Other operating expense | 25 | | | 20 | | | (1) | | | 6 | | | 25 | % |
| Operating earnings | 198 | | | 299 | | | (14) | | | (87) | | | (29) | % |
| Interest expense, net | 79 | | | 58 | | | (1) | | | 22 | | | 39 | % |
| Other expense, net | 2 | | | 23 | | | (9) | | | (12) | | | (53) | % |
| Earnings before income taxes | 117 | | | 218 | | | (4) | | | (97) | | | (45) | % |
| Income tax expense | 36 | | | 28 | | | (3) | | | 11 | | | 42 | % |
| | | | | | | | | |
| | | | | | | | | |
| Net earnings | $ | 81 | | | $ | 190 | | | $ | (1) | | | $ | (108) | | | (57) | % |
| | | | | | | | | |
| | | | | | | | | |
* Not meaningful
Change % calculations are based on amounts prior to rounding
Net Revenue | | | | | | | |
| 2022 vs. 2021 |
| Year-Over-Year Change | Six Months Ended
December 31, | | |
| Net Revenue | | |
| Organic | (2) | % | | |
| Impact of acquisitions | 3 | % | | |
| | | |
| Constant-currency change | 1 | % | | |
| Foreign currency translation impact on reporting | (4) | % | | |
| Total % change | (3) | % | | |
Net revenue increased by $19 million, or 1%, excluding the impact of foreign exchange, compared to the six months ended December 31, 2021. Net revenue decreased 2% organically on a constant-currency basis, primarily related to a significant decline in demand for COVID-19 related programs and a decline in revenue from the manufacture of prescription products, partially offset by amounts due under certain take-or-pay arrangements in our Biologics segment, a strong growth in non-COVID programs, particularly, our gene therapy offerings, as well as growth in our clinical development services.
Net revenue increased 3% inorganically as a result of acquisitions. We acquired RheinCell Therapeutics GmbH (“RheinCell”) in August 2021, Bettera Wellness in October 2021, our Princeton facility and operations in April 2022 and Metrics in October 2022.
Gross Margin
Gross margin decreased by $59 million, or 8%, compared to the six months ended December 31, 2021, excluding the impact of foreign exchange, primarily due to an unfavorable shift in product mix, lower levels of utilization across the network, the impact from remediation-related activities at our Brussels facility, and inflationary pressures. On a constant-currency basis, gross margin, as a percentage of revenue, decreased 290 basis points to 29.6% in the six months ended December 31, 2022, compared to the corresponding prior-year period, primarily due to the factors described in the immediately preceding sentence.
Selling, General, and Administrative Expense
Selling, general, and administrative expense increased by $21 million, or 5%, compared to the six months ended December 31, 2021, excluding the impact of foreign exchange. The year-over-year increase in selling, general, and administrative expense was primarily due to $20 million in net incremental expenses from acquired companies and a $16 million increase for employee-related costs, partially offset by a $10 million decline in acquisition, transaction and integration costs and $11 million decrease of bad debt expense.
Other Operating Expense
Other operating expense of $25 million for the six months ended December 31, 2022 increased by $6 million, or 25%, compared to the six months ended December 31, 2021, excluding the impact of foreign exchange. The year-over-year increase was primarily due to a $25 million increase in restructuring charges, partially offset by $15 million decrease in fixed asset impairment charges and a $4 million gain from sale of our former facility in Bolton, U.K.
Interest Expense, net
Interest expense, net of $79 million for the six months ended December 31, 2022 increased by $22 million, or 39%, compared to the six months ended December 31, 2021, excluding the impact of foreign exchange. The increase was primarily attributable to incremental interest expense on our most recent tranche of term loans, our U.S. dollar-denominated 3.500% senior notes due 2030, and our borrowings on our revolving credit facility.
Other (Income) Expense, net
Other expense, net of $2 million for the six months ended December 31, 2022 includes miscellaneous non-operating expenses.
Other expense, net for the six months ended December 31, 2021 of $23 million was primarily driven by $24 million of foreign currency losses, $4 million of financing charges related to our outstanding term loans, partially offset by a $2 million gain related to the change in fair value of the derivative liability arising from the dividend-adjustment mechanism of our formerly outstanding series A preferred stock.
Income Tax Expense
Our provision for income taxes for the six months ended December 31, 2022 was $36 million relative to earnings before income taxes of $117 million. Our provision for income taxes for the six months ended December 31, 2021 was $28 million relative to earnings before income taxes of $218 million. The relatively higher income tax provision on lower earnings before income taxes is the result of decreased pretax income in tax jurisdictions with favorable tax rates and foreign tax credits claimed in the prior-year quarter resulting from amended returns. Generally, fluctuations in the effective tax rate are due to changes in the geographic distribution of our pretax income resulting from our business mix, changes in the tax impact of permanent differences, restructuring, special items, certain equity related compensation, and other discrete tax items that may have unique tax implications depending on the nature of the item.
Segment Review
The following charts depict the percentage of net revenue for each of our two reportable segments for the six months ended December 31, 2022 compared to the six months ended December 31, 2021. Refer below for discussions regarding each segment's net revenue and EBITDA performance and to “Non-GAAP Metrics” for discussions of our use of Segment EBITDA and EBITDA from operations, measures that are not defined under U.S. GAAP.
Our results on a segment basis for the six months ended December 31, 2022 compared to the six months ended December 31, 2021 were as follows:
| | | | | | | | | | | | | | | | | | | | | | | | | | | | | |
| | Six Months Ended
December 31, | | FX Impact | | Constant Currency Increase (Decrease) |
| (Dollars in millions) | 2022 | | 2021 | | | | Change $ | | Change % |
| Biologics | | | | | | | | | |
| Net revenue | $ | 1,103 | | | $ | 1,189 | | | $ | (29) | | | $ | (57) | | | (5) | % |
| Segment EBITDA | 294 | | | 366 | | | (4) | | | (68) | | | (19) | % |
| Pharma Consumer Health | | | | | | | | | |
| Net revenue | 1,069 | | 1,054 | | (61) | | | 76 | | | 7 | % |
| Segment EBITDA | 243 | | | 246 | | (18) | | | 15 | | | 6 | % |
| | | | | | | | | |
| | | | | | | | | |
| | | | | | | | | |
| | | | | | | | | |
| | | | | | | | | |
| | | | | | | | | |
| Inter-segment revenue elimination | (1) | | | (1) | | | — | | | — | | | * |
Unallocated Costs (1) | (139) | | | (157) | | | 10 | | | 8 | | | (5) | % |
| Combined totals | | | | | | | | | |
| Net revenue | $ | 2,171 | | | $ | 2,242 | | | $ | (90) | | | $ | 19 | | | 1 | % |
| | | | | | | | | |
| EBITDA from operations | $ | 398 | | | $ | 455 | | | $ | (12) | | | $ | (45) | | | (10) | % |
Change % calculations are based on amounts prior to rounding
*Percentage not meaningful
(1) Unallocated costs include restructuring and special items, stock-based compensation, gain on sale of subsidiary, impairment charges, certain other corporate-directed costs, and other costs that are not allocated to the segments as follows:
| | | | | | | | | | | |
| | Six Months Ended
December 31, |
| (Dollars in millions) | 2022 | | 2021 |
Impairment charges and gain/loss on sale of assets (a) | $ | 1 | | | $ | (19) | |
| Stock-based compensation | (29) | | | (32) | |
Restructuring and other special items (b) | (42) | | | (31) | |
Gain on sale of subsidiary (c) | — | | | 1 | |
| | | |
| | | |
Other expense, net (d) | (2) | | | (23) | |
| Non-allocated corporate costs, net | (67) | | | (53) | |
| Total unallocated costs | $ | (139) | | | $ | (157) | |
(a) Impairment charges and gain/loss on sale of assets during the six months ended December 31, 2021 include fixed asset impairment charges associated with a product we no longer manufacture in our Pharma and Consumer Health Segment.
(b) Restructuring and other special items during the six months ended December 31, 2022 include (i) restructuring charges associated with our plans to reduce costs, consolidate facilities, and optimize our infrastructure across the organization, (ii) transaction and integration costs associated with the Metrics acquisition and (iii) warehouse exit costs for a product we no longer manufacture in our Pharma and Consumer Health segment.
Restructuring and other special items during the six months ended December 31, 2021 include (i) transaction and integration costs associated with the acquisitions of Delphi Genetics SA, Hepatic Cell Therapy Support SA, RheinCell, and Bettera Wellness and (ii) restructuring costs associated with the closure of our former facility in Bolton U.K.
(c) For the six months ended December 31, 2021, gain on sale of subsidiary was due to the divestiture of our former facility in Woodstock, Illinois and the associated business.
(d) Refer to Note 7, Other (Income) Expense, Net for details of financing charges and foreign currency translation adjustments recorded within other expense, net in our Consolidated Financial Statements.
Provided below is a reconciliation of net earnings to EBITDA from operations: | | | | | | | | | | | |
| | Six Months Ended
December 31, |
| (Dollars in millions) | 2022 | | 2021 |
| Net earnings | $ | 81 | | | $ | 190 | |
| Depreciation and amortization | 202 | | | 179 | |
| Interest expense, net | 79 | | | 58 | |
| Income tax expense | 36 | | | 28 | |
| | | |
| EBITDA from operations | $ | 398 | | | $ | 455 | |
Biologics segment | | | | | | | | | | | |
| 2022 vs. 2021 |
| Year-Over-Year Change | Six Months Ended
December 31, |
| Net Revenue | | Segment EBITDA |
| Organic | (5) | % | | (17) | % |
| Impact of acquisitions | — | % | | (2) | % |
| Constant-currency change | (5) | % | | (19) | % |
| Foreign exchange translation impact on reporting | (2) | % | | (1) | % |
| Total % change | (7) | % | | (20) | % |
| | | |
Net revenue in our Biologics segment decreased by $57 million, or 5%, excluding the impact of foreign exchange, compared to the six months ended December 31, 2021. The decrease was primarily driven by a significant decline in demand for COVID-19 related programs, partially offset by strong growth in non-COVID programs, particularly, our gene therapy offerings.
Biologics Segment EBITDA decreased by $68 million, or 19%, excluding the impact of foreign exchange, compared to the six months ended December 31, 2021. Segment EBITDA decreased 17%, compared to the six months ended December 31, 2021, excluding the impact of acquisitions. The decrease was primarily driven by a significant decline in demand for COVID-19 related programs, lower levels of utilization across the Biologics network, as well as an unfavorable impact from remediation-related activities at our Brussels facility, which were partially offset by strong growth in non-COVID programs, particularly, for our gene therapy offerings.
We completed the acquisitions of RheinCell in August 2021 and our Princeton facility and operations in April 2022. For the six months ended December 31, 2022, these acquisitions decreased Segment EBITDA on an inorganic basis by 2% compared to the corresponding prior-year period and had an immaterial impact on our net revenue.
Pharma and Consumer Health segment
| | | | | | | | | | | |
| 2022 vs. 2021 |
| Year-Over-Year Change | Six Months Ended
December 31, |
| Net Revenue | | Segment EBITDA |
| Organic | — | % | | (1) | % |
| Impact of acquisitions | 7 | % | | 7 | % |
| | | |
| Constant-currency change | 7 | % | | 6 | % |
| Foreign exchange translation impact on reporting | (6) | % | | (7) | % |
| Total % change | 1 | % | | (1) | % |
Pharma and Consumer Health net revenue increased $76 million, or 7%, excluding the impact of foreign exchange, compared to the six months ended December 31, 2021. Net revenue was flat compared to the six months ended December 31, 2021, excluding the impact of acquisitions. Growth in our clinical development services was offset by a decline in revenue from the manufacture of prescription products.
Pharma and Consumer Health Segment EBITDA increased $15 million, or 6%, excluding the impact of foreign exchange, compared to the six months ended December 31, 2021. Segment EBITDA decreased 1%, compared to the six months ended December 31, 2021, excluding the impact of acquisitions. The decrease in organic Segment EBITDA was primarily driven by inflationary pressures and a decline in revenue from the manufacture of prescription products, which were partially offset by growth in our clinical development services.
We completed the Bettera Wellness acquisition in October 2021 and the Metrics acquisition in October 2022, which together increased net revenue and Segment EBITDA on an inorganic basis by 7% during the six months ended December 31, 2022, compared to the corresponding prior-year period.
Liquidity and Capital Resources
Sources and Uses of Cash
Our principal sources of liquidity have been cash flows generated from operations and occasional capital market activities. The principal uses of cash are to fund operating and capital expenditures, business or asset acquisitions, interest payments on our debt, and any mandatory or discretionary principal payment on our debt. As of December 31, 2022, Catalent Pharma Solutions, Inc., our principal operating subsidiary (“Operating Company”), following the November 2022 execution of Amendment No. 7 to the amended and restated credit agreement, dated as of May 20, 2014, governing our senior secured credit facilities (as amended, the “Credit Agreement”), which increased the capacity of our revolving credit facility to $1.10 billion and extended its maturity to November 2027, had available $496 million in borrowing capacity under our revolving credit facility, due to $600 million in short-term borrowings outstanding and $4 million in letters of credit outstanding as of December 31, 2022. We have elected to classify the borrowing on our revolving credit facility as current as we intend to repay a portion of the borrowing using cash flow from operations and/or refinance the borrowing through a senior notes offering within the next twelve months.
We believe that our cash on hand, cash from operations, and available borrowings under our revolving credit facility will be adequate to meet our liquidity needs for at least the next 12 months, as well as the amounts expected to become due with respect to our pending capital projects.
Cash Flows
The following table summarizes our consolidated statements of cash flows: | | | | | | | | | | | | | | | | | |
| | Six Months Ended
December 31, | | |
| (Dollars in millions) | 2022 | | 2021 | | $ Change |
| Net cash provided by (used in): | | | | | |
| Operating activities | $ | 122 | | | $ | 232 | | | $ | (110) | |
| Investing activities | $ | (724) | | | $ | (1,299) | | | $ | 575 | |
| Financing activities | $ | 597 | | | $ | 1,033 | | | $ | (436) | |
Operating Activities
For the six months ended December 31, 2022, cash provided by operations was $122 million compared to $232 million in cash provided by operating activities for the six months ended December 31, 2021. The year-over-year change was primarily due to a decrease in operating earnings, an unfavorable impact from the growth in inventory, an unfavorable timing impact on the disbursements of accounts payable, an increase in interest payments and an increase in severance payments related to our newly adopted restructuring plans, partially offset by a favorable impact from the collection of trade receivables.
Investing Activities
For the six months ended December 31, 2022, cash used in investing activities was $724 million, compared to $1.30 billion for the six months ended December 31, 2021. The decrease in cash used in investing activities was primarily driven by the decrease in payment for acquisitions and an increase in proceeds from the sale of marketable securities.
Financing Activities
For the six months ended December 31, 2022, cash provided by financing activities was $597 million, compared to cash provided by financing activities of $1.03 billion for the six months ended December 31, 2021. The decrease in cash provided by financing activities was primarily driven by a $475 million decline in proceeds from borrowings.
Debt Covenants
Senior Secured Credit Facilities
The Credit Agreement contains a number of covenants that, among other things, restrict, subject to certain exceptions, our (and our restricted subsidiaries’) ability to incur additional indebtedness or issue certain preferred shares; create liens on assets; engage in mergers and consolidations; sell assets; pay dividends and distributions or repurchase capital stock; repay subordinated indebtedness; engage in certain transactions with affiliates; make investments, loans, or advances; make certain acquisitions; enter into sale and leaseback transactions; amend material agreements governing our subordinated indebtedness; and change our lines of business.
The Credit Agreement also contains change-of-control provisions and certain customary affirmative covenants and events of default. The revolving credit facility requires compliance with a net leverage covenant when there is a 30% or more draw outstanding at a period end. As of December 31, 2022, we were in compliance with all material covenants under the Credit Agreement.
Subject to certain exceptions, the Credit Agreement permits us and our restricted subsidiaries to incur certain additional indebtedness, including secured indebtedness. None of our non-U.S. subsidiaries or our Puerto Rico subsidiary is a guarantor of the loans.
Under the Credit Agreement, our ability to engage in certain activities such as incurring certain additional indebtedness, making certain investments, and paying certain dividends is tied to ratios based on Adjusted EBITDA (which is defined as “Consolidated EBITDA” in the Credit Agreement). Adjusted EBITDA is based on the definitions in the Credit Agreement, is not defined under U.S. GAAP, and is subject to important limitations.
The Senior Notes
The several indentures governing each series of our outstanding senior notes (collectively, the “Indentures”) contain certain covenants that, among other things, limit our ability to incur or guarantee more debt or issue certain preferred shares; pay dividends on, repurchase, or make distributions in respect of their capital stock or make other restricted payments; make certain investments; sell certain assets; create liens; consolidate, merge, sell; or otherwise dispose of all or substantially all of their assets; enter into certain transactions with their affiliates, and designate their subsidiaries as unrestricted subsidiaries. These covenants are subject to a number of exceptions, limitations, and qualifications as set forth in the Indentures. The Indentures also contain customary events of default, including, but not limited to, nonpayment, breach of covenants, and payment or acceleration defaults in certain other indebtedness of Operating Company or certain of its subsidiaries. Upon an event of default, either the holders of at least 30% in principal amount of each of the then-outstanding series of Senior Notes, or the applicable Trustee under the Indentures, may declare the applicable senior notes immediately due and payable; or in certain circumstances, the applicable senior notes will become automatically immediately due and payable. As of December 31, 2022, Operating Company was in compliance with all material covenants under the Indentures.
Capital Resources
As market conditions warrant, we and our affiliates may from time to time seek to purchase our outstanding debt in privately negotiated or open-market transactions, by tender offer or otherwise. Subject to any applicable limitation contained in the Credit Agreement, any purchase made by us may be funded by the use of cash on hand or the incurrence of new secured or unsecured debt. The amounts involved in any such purchase transaction, individually or in the aggregate, may be material. Any such purchase may be with respect to a substantial amount of a particular class or series of debt, with the attendant reduction in the trading liquidity of such class or series. In addition, any such purchase made at prices below the “adjusted issue price” (as defined for U.S. federal income tax purposes) may result in taxable cancellation of indebtedness income to us, which amounts may be material, or in related adverse tax consequences to us.
Geographic Allocation of Cash
As of December 31, 2022 and June 30, 2022, our non-U.S. subsidiaries held cash and cash equivalents of $301 million and $377 million, respectively, out of the total consolidated cash and cash equivalents of $442 million and $449 million, respectively. These balances are dispersed across many locations around the world.
Interest Rate Risk Management
A portion of the debt used to finance our operations is exposed to interest-rate fluctuations. We may use various hedging strategies and derivative financial instruments to create an appropriate mix of fixed- and floating-rate assets and liabilities. In February 2021, we entered into an interest-rate swap agreement with Bank of America N.A. that acts as a hedge against the
economic effect of a portion of the variable-interest obligation associated with our U.S. dollar-denominated term loans under our senior secured credit facilities, so that the interest payable on that portion of the debt becomes fixed at a certain rate, thereby reducing the impact of future interest-rate changes on future interest expense. The applicable rate for the U.S. dollar-denominated term loan under the Credit Agreement was LIBOR (subject to a floor of 0.50%) plus 2.00% as of December 31, 2022; however, as a result of this interest-rate swap agreement, the variable portion of the applicable rate on $500 million of the term loan was effectively fixed at 0.9985% as of February 2021.
Currency Risk Management
We are exposed to fluctuations in the euro-U.S. dollar exchange rate on our investments in our operations in Europe. While we do not actively hedge against changes in foreign currency, we have mitigated the exposure of our investments in our European operations by denominating a portion of our debt in euros. At December 31, 2022, we had $879 million of euro-denominated debt outstanding that qualifies as a hedge of a net investment in European operations. Refer to Note 9, Derivative Instruments and Hedging Activities, to our Consolidated Financial Statements for further discussion of net investment hedge activity in the period.
From time to time, we may use forward foreign currency exchange contracts to manage our exposure to the variability of cash flows primarily related to the foreign exchange rate changes of future foreign currency transaction costs. In addition, we may use such contracts to protect the value of existing foreign currency assets and liabilities. Currently, we do not use any forward foreign currency exchange contracts. We continue to evaluate hedging opportunities for foreign currency in the future.
Off-Balance Sheet Arrangements
Other than short-term operating leases and outstanding letters of credit as discussed above, we do not have any material off-balance sheet arrangement as of December 31, 2022.
ITEM 3. QUANTITATIVE AND QUALITATIVE DISCLOSURES ABOUT MARKET RISK
For a discussion of our quantitative and qualitative disclosures about market risks, see the section titled Quantitative and Qualitative Disclosures About Market Risks in our Fiscal 2022 10-K. As of December 31, 2022, there has been no material change in this information.
ITEM 4. CONTROLS AND PROCEDURES
Disclosure Controls and Procedures
We maintain disclosure controls and procedures that are designed to ensure that information required to be disclosed in our reports under the Exchange Act is recorded, processed, summarized, and reported within the time periods specified in the SEC’s rules and forms, and that such information is accumulated and communicated to our management, including our Chief Executive Officer and our Senior Vice President and Chief Financial Officer, as appropriate, to allow timely decisions regarding required disclosures. Any control or procedures, no matter how well designed and operated, can provide only reasonable assurance of achieving the desired control objectives. Our management, with the participation of our Chief Executive Officer and our Senior Vice President and Chief Financial Officer, has evaluated the effectiveness of the design and operation of our disclosure controls and procedures as of the end of the period covered by this Quarterly Report on Form 10-Q. Based upon that evaluation, our Chief Executive Officer and our Senior Vice President and Chief Financial Officer concluded that, as of December 31, 2022, our disclosure controls and procedures were effective to accomplish their objectives at the reasonable assurance level.
Changes in Internal Control over Financial Reporting
There was no change that materially affected, or is reasonably likely to materially affect, Catalent’s internal control over financial reporting that occurred during the period covered by this Quarterly Report on Form 10-Q.
PART II. OTHER INFORMATION
ITEM 1. LEGAL PROCEEDINGS
From time to time, we may be involved in legal proceedings arising in the ordinary course of business, including, without limitation, inquiries and claims concerning environmental contamination as well as litigation and allegations in connection with acquisitions, product liability, manufacturing or packaging defects, and claims for reimbursement for the cost of lost or damaged active pharmaceutical ingredients, the cost of any of which could be significant. We intend to vigorously defend ourselves against any such litigation and do not currently believe that the outcome of any such litigation will have a material adverse effect on our consolidated financial statements. In addition, the healthcare industry is highly regulated, and government agencies continue to scrutinize certain practices affecting government programs and otherwise.
From time to time, we receive subpoenas or requests for information relating to the business practices and activities of customers or suppliers from various governmental agencies or private parties, including from state attorneys general, the U.S. Department of Justice, and private parties engaged in patent infringement, antitrust, tort, and other litigation. We generally respond to such subpoenas and requests in a timely and thorough manner, which responses sometimes require considerable time and effort and can result in considerable costs being incurred. We expect to incur costs in future periods in connection with future requests.
ITEM 1A. RISK FACTORS
In addition to the other information set forth in this report, you should carefully consider the factors discussed in the section entitled “Risk Factors” in our Fiscal 2022 10-K, which could materially affect our business, financial condition, or future results. The risks described in such report are not the only risks facing us. Additional risks and uncertainties not currently known to us or that we currently deem to be immaterial also may materially adversely affect our business, financial condition, or operating results.
Other than what was disclosed in the Special Note Regarding Forward-Looking Statements, there has been no material change to the risk factors disclosed in our Fiscal 2022 10-K.
ITEM 2. UNREGISTERED SALES OF EQUITY SECURITIES AND USE OF PROCEEDS
None.
Purchase of Equity Securities
None.
ITEM 3. DEFAULTS UPON SENIOR SECURITIES
None.
ITEM 4. MINE SAFETY DISCLOSURES
Not applicable.
ITEM 5. OTHER INFORMATION
Not applicable.
ITEM 6. EXHIBITS
Exhibits: | | | | | | | | |
| | |
| | |
| | |
| | |
| | |
| | |
| | Amendment No. 7 to Amended and Restated Credit Agreement, dated as of November 22, 2022, by and among Catalent Pharma Solutions, Inc., PTS Intermediate Holdings LLC, JP Morgan Chase Bank, N.A., as the administrative agent, collateral agent, swing line lender, and letter of credit issuer, and the lenders and other parties thereto, which amends that certain Amended and Restated Credit Agreement, dated as of May 20, 2014 (as amended), by and among Catalent Pharma Solutions, Inc., PTS Intermediate Holdings LLC, JP Morgan Chase Bank, N.A., as the successor administrative agent, collateral agent, swing line lender, and letter of credit issuer, and the lenders and other parties thereto (incorporated by reference to Exhibit 10.1 to the Company’s Current Report on Form 8-K filed on November 22, 2022). |
| | |
| | |
| | |
| | |
| | |
| | |
| | |
| | |
| | |
| | |
| | |
| | |
| | |
| | |
| | |
| | |
| | |
| | |
| | |
| | |
| | |
| | |
| | |
| | |
| | |
| | |
| | |
| | |
| | |
| | |
| | |
| | |
| | |
| | |
| | |
| | |
| | |
| | |
| | |
| | |
| | |
| | |
| | |
| | Certification of the Chief Executive Officer pursuant to Rule 13a-14(a) or Rule 15d-14(a) of the Securities Exchange Act of 1934, as amended. * |
| |
| | Certification of the Chief Financial Officer pursuant to Rule 13a-14(a) or Rule 15d-14(a) of the Securities Exchange Act of 1934, as amended. * |
| |
| | Certification of the Chief Executive Officer pursuant to 18 U.S.C. Section 1350, as adopted pursuant to Section 906 of the Sarbanes-Oxley Act of 2002. ** |
| |
| | Certification of the Chief Financial Officer pursuant to 18 U.S.C. Section 1350, as adopted pursuant to Section 906 of the Sarbanes-Oxley Act of 2002. ** |
| | |
| 101 | | The following financial information from Catalent, Inc.’s Quarterly Report on Form 10-Q for the quarter ended December 31, 2022 formatted in inline XBRL: (i) Consolidated Statements of Operations for the Three and Six Months Ended December 31, 2022 and 2021; (ii) Consolidated Statements of Comprehensive Income for the Three and Six Months Ended December 31, 2022 and 2021 (iii) Consolidated Balance Sheets as of December 31, 2022 and June 30, 2022; (iv) Consolidated Statement of Changes in Shareholders’ Equity for the Three and Six Months Ended December 31, 2022 and 2021; (v) Consolidated Statements of Cash Flows for the Six Months Ended December 31, 2022 and 2021; and (vi) Notes to Unaudited Consolidated Financial Statements. |
| | |
| 104 | | The cover page of this Quarterly Report on Form 10-Q, formatted as Inline XBRL and contained in Exhibit 101. |
| | | | | | | | |
| * | | Filed herewith |
| ** | | Furnished herewith |
| † | | Represents a management contract, compensatory plan or arrangement in which directors and/or executive officers are eligible to participate. |
| | |
SIGNATURES
Pursuant to the requirements of the Securities Exchange Act of 1934, the registrant has duly caused this report to be signed on its behalf by the undersigned, thereunto duly authorized.
| | | | | | | | | | | | | | |
| | CATALENT, INC. (Registrant) |
| | | |
| Date: | February 7, 2023 | By: | | /s/ KAREN SANTIAGO |
| | | | Karen Santiago |
| | | | Vice President and Chief Accounting Officer |