FALSE2022FY179895677.0008873--06-3000015967830.010.011,000,000,0001,000,000,000179,302,032162,788,0430.010.01100,000,000100,000,000384,777650000384,7776500002912P20YP3Yhttp://fasb.org/us-gaap/2022#DefinedBenefitPensionPlanLiabilitiesNoncurrenthttp://fasb.org/us-gaap/2022#DefinedBenefitPensionPlanLiabilitiesNoncurrenthttp://fasb.org/us-gaap/2022#DefinedBenefitPensionPlanLiabilitiesNoncurrenthttp://fasb.org/us-gaap/2022#DefinedBenefitPensionPlanLiabilitiesNoncurrenthttp://fasb.org/us-gaap/2022#DefinedBenefitPensionPlanLiabilitiesNoncurrenthttp://fasb.org/us-gaap/2022#DefinedBenefitPensionPlanLiabilitiesNoncurrenthttp://fasb.org/us-gaap/2022#OtherLiabilitieshttp://fasb.org/us-gaap/2022#OtherLiabilitieshttp://fasb.org/us-gaap/2022#PropertyPlantAndEquipmentNethttp://fasb.org/us-gaap/2022#PropertyPlantAndEquipmentNethttp://fasb.org/us-gaap/2022#OtherAssetsNoncurrent00015967832021-07-012022-06-3000015967832021-12-31iso4217:USD00015967832022-08-19xbrli:shares00015967832022-06-3000015967832021-06-300001596783us-gaap:FairValueInputsLevel1Member2022-06-30iso4217:USDxbrli:shares00015967832020-07-012021-06-3000015967832019-07-012020-06-300001596783us-gaap:AccumulatedDefinedBenefitPlansAdjustmentMember2021-07-012022-06-300001596783ctlt:ACOIAccumulatedGainLossMarketableSecuritiesMember2021-07-012022-06-300001596783ctlt:ACOIAccumulatedGainLossMarketableSecuritiesMember2020-07-012021-06-300001596783ctlt:ACOIAccumulatedGainLossMarketableSecuritiesMember2019-07-012020-06-300001596783us-gaap:CommonStockMember2019-06-300001596783us-gaap:AdditionalPaidInCapitalMember2019-06-300001596783us-gaap:RetainedEarningsMember2019-06-300001596783us-gaap:AccumulatedOtherComprehensiveIncomeMember2019-06-3000015967832019-06-300001596783us-gaap:CommonStockMember2019-07-012020-06-300001596783us-gaap:AdditionalPaidInCapitalMember2019-07-012020-06-300001596783us-gaap:RetainedEarningsMember2019-07-012020-06-300001596783us-gaap:AccumulatedOtherComprehensiveIncomeMember2019-07-012020-06-300001596783us-gaap:CommonStockMember2020-06-300001596783us-gaap:AdditionalPaidInCapitalMember2020-06-300001596783us-gaap:RetainedEarningsMember2020-06-300001596783us-gaap:AccumulatedOtherComprehensiveIncomeMember2020-06-3000015967832020-06-300001596783us-gaap:CommonStockMember2020-07-012021-06-300001596783us-gaap:AdditionalPaidInCapitalMember2020-07-012021-06-300001596783us-gaap:RetainedEarningsMember2020-07-012021-06-300001596783us-gaap:AccumulatedOtherComprehensiveIncomeMember2020-07-012021-06-300001596783us-gaap:CommonStockMember2021-06-300001596783us-gaap:AdditionalPaidInCapitalMember2021-06-300001596783us-gaap:RetainedEarningsMember2021-06-300001596783us-gaap:AccumulatedOtherComprehensiveIncomeMember2021-06-300001596783us-gaap:CommonStockMember2021-07-012022-06-300001596783us-gaap:AdditionalPaidInCapitalMember2021-07-012022-06-300001596783us-gaap:RetainedEarningsMember2021-07-012022-06-300001596783us-gaap:AccumulatedOtherComprehensiveIncomeMember2021-07-012022-06-300001596783us-gaap:CommonStockMember2022-06-300001596783us-gaap:AdditionalPaidInCapitalMember2022-06-300001596783us-gaap:RetainedEarningsMember2022-06-300001596783us-gaap:AccumulatedOtherComprehensiveIncomeMember2022-06-300001596783srt:MinimumMemberctlt:BuildingAndImprovementsMember2021-07-012022-06-300001596783ctlt:BuildingAndImprovementsMembersrt:MaximumMember2021-07-012022-06-300001596783srt:MinimumMemberus-gaap:MachineryAndEquipmentMember2021-07-012022-06-300001596783us-gaap:MachineryAndEquipmentMembersrt:MaximumMember2021-07-012022-06-300001596783srt:MinimumMemberus-gaap:FurnitureAndFixturesMember2021-07-012022-06-300001596783us-gaap:FurnitureAndFixturesMembersrt:MaximumMember2021-07-012022-06-300001596783ctlt:BiologicsMemberctlt:ManufacturingCommercialProductSupplyMember2021-07-012022-06-300001596783ctlt:SoftgelAndOralTechnologiesMemberctlt:ManufacturingCommercialProductSupplyMember2021-07-012022-06-300001596783ctlt:OralAndSpecialtyDeliveryMemberctlt:ManufacturingCommercialProductSupplyMember2021-07-012022-06-300001596783ctlt:ClinicalSupplyServicesMemberctlt:ManufacturingCommercialProductSupplyMember2021-07-012022-06-300001596783ctlt:TotalCatalentbeforeintersegmentrevenueeliminationMemberctlt:ManufacturingCommercialProductSupplyMember2021-07-012022-06-300001596783ctlt:BiologicsMemberctlt:DevelopmentServicesMember2021-07-012022-06-300001596783ctlt:SoftgelAndOralTechnologiesMemberctlt:DevelopmentServicesMember2021-07-012022-06-300001596783ctlt:OralAndSpecialtyDeliveryMemberctlt:DevelopmentServicesMember2021-07-012022-06-300001596783ctlt:ClinicalSupplyServicesMemberctlt:DevelopmentServicesMember2021-07-012022-06-300001596783ctlt:TotalCatalentbeforeintersegmentrevenueeliminationMemberctlt:DevelopmentServicesMember2021-07-012022-06-300001596783ctlt:BiologicsMemberctlt:ClinicalSupplyServicesMember2021-07-012022-06-300001596783ctlt:SoftgelAndOralTechnologiesMemberctlt:ClinicalSupplyServicesMember2021-07-012022-06-300001596783ctlt:OralAndSpecialtyDeliveryMemberctlt:ClinicalSupplyServicesMember2021-07-012022-06-300001596783ctlt:ClinicalSupplyServicesMemberctlt:ClinicalSupplyServicesMember2021-07-012022-06-300001596783ctlt:ClinicalSupplyServicesMemberctlt:TotalCatalentbeforeintersegmentrevenueeliminationMember2021-07-012022-06-300001596783ctlt:BiologicsMember2021-07-012022-06-300001596783ctlt:SoftgelAndOralTechnologiesMember2021-07-012022-06-300001596783ctlt:OralAndSpecialtyDeliveryMember2021-07-012022-06-300001596783ctlt:ClinicalSupplyServicesMember2021-07-012022-06-300001596783ctlt:TotalCatalentbeforeintersegmentrevenueeliminationMember2021-07-012022-06-300001596783ctlt:BiologicsMemberctlt:ManufacturingCommercialProductSupplyMember2020-07-012021-06-300001596783ctlt:SoftgelAndOralTechnologiesMemberctlt:ManufacturingCommercialProductSupplyMember2020-07-012021-06-300001596783ctlt:OralAndSpecialtyDeliveryMemberctlt:ManufacturingCommercialProductSupplyMember2020-07-012021-06-300001596783ctlt:ClinicalSupplyServicesMemberctlt:ManufacturingCommercialProductSupplyMember2020-07-012021-06-300001596783ctlt:TotalCatalentbeforeintersegmentrevenueeliminationMemberctlt:ManufacturingCommercialProductSupplyMember2020-07-012021-06-300001596783ctlt:BiologicsMemberctlt:DevelopmentServicesMember2020-07-012021-06-300001596783ctlt:SoftgelAndOralTechnologiesMemberctlt:DevelopmentServicesMember2020-07-012021-06-300001596783ctlt:OralAndSpecialtyDeliveryMemberctlt:DevelopmentServicesMember2020-07-012021-06-300001596783ctlt:ClinicalSupplyServicesMemberctlt:DevelopmentServicesMember2020-07-012021-06-300001596783ctlt:TotalCatalentbeforeintersegmentrevenueeliminationMemberctlt:DevelopmentServicesMember2020-07-012021-06-300001596783ctlt:BiologicsMemberctlt:ClinicalSupplyServicesMember2020-07-012021-06-300001596783ctlt:SoftgelAndOralTechnologiesMemberctlt:ClinicalSupplyServicesMember2020-07-012021-06-300001596783ctlt:OralAndSpecialtyDeliveryMemberctlt:ClinicalSupplyServicesMember2020-07-012021-06-300001596783ctlt:ClinicalSupplyServicesMemberctlt:ClinicalSupplyServicesMember2020-07-012021-06-300001596783ctlt:ClinicalSupplyServicesMemberctlt:TotalCatalentbeforeintersegmentrevenueeliminationMember2020-07-012021-06-300001596783ctlt:BiologicsMember2020-07-012021-06-300001596783ctlt:SoftgelAndOralTechnologiesMember2020-07-012021-06-300001596783ctlt:OralAndSpecialtyDeliveryMember2020-07-012021-06-300001596783ctlt:ClinicalSupplyServicesMember2020-07-012021-06-300001596783ctlt:TotalCatalentbeforeintersegmentrevenueeliminationMember2020-07-012021-06-300001596783ctlt:BiologicsMemberctlt:ManufacturingCommercialProductSupplyMember2019-07-012020-06-300001596783ctlt:SoftgelAndOralTechnologiesMemberctlt:ManufacturingCommercialProductSupplyMember2019-07-012020-06-300001596783ctlt:OralAndSpecialtyDeliveryMemberctlt:ManufacturingCommercialProductSupplyMember2019-07-012020-06-300001596783ctlt:ClinicalSupplyServicesMemberctlt:ManufacturingCommercialProductSupplyMember2019-07-012020-06-300001596783ctlt:TotalCatalentbeforeintersegmentrevenueeliminationMemberctlt:ManufacturingCommercialProductSupplyMember2019-07-012020-06-300001596783ctlt:BiologicsMemberctlt:DevelopmentServicesMember2019-07-012020-06-300001596783ctlt:SoftgelAndOralTechnologiesMemberctlt:DevelopmentServicesMember2019-07-012020-06-300001596783ctlt:OralAndSpecialtyDeliveryMemberctlt:DevelopmentServicesMember2019-07-012020-06-300001596783ctlt:ClinicalSupplyServicesMemberctlt:DevelopmentServicesMember2019-07-012020-06-300001596783ctlt:TotalCatalentbeforeintersegmentrevenueeliminationMemberctlt:DevelopmentServicesMember2019-07-012020-06-300001596783ctlt:BiologicsMemberctlt:ClinicalSupplyServicesMember2019-07-012020-06-300001596783ctlt:SoftgelAndOralTechnologiesMemberctlt:ClinicalSupplyServicesMember2019-07-012020-06-300001596783ctlt:OralAndSpecialtyDeliveryMemberctlt:ClinicalSupplyServicesMember2019-07-012020-06-300001596783ctlt:ClinicalSupplyServicesMemberctlt:ClinicalSupplyServicesMember2019-07-012020-06-300001596783ctlt:ClinicalSupplyServicesMemberctlt:TotalCatalentbeforeintersegmentrevenueeliminationMember2019-07-012020-06-300001596783ctlt:BiologicsMember2019-07-012020-06-300001596783ctlt:SoftgelAndOralTechnologiesMember2019-07-012020-06-300001596783ctlt:OralAndSpecialtyDeliveryMember2019-07-012020-06-300001596783ctlt:ClinicalSupplyServicesMember2019-07-012020-06-300001596783ctlt:TotalCatalentbeforeintersegmentrevenueeliminationMember2019-07-012020-06-300001596783ctlt:geographicalMember2021-07-012022-06-300001596783country:US2021-07-012022-06-300001596783country:US2020-07-012021-06-300001596783country:US2019-07-012020-06-300001596783srt:EuropeMember2021-07-012022-06-300001596783srt:EuropeMember2020-07-012021-06-300001596783srt:EuropeMember2019-07-012020-06-300001596783ctlt:InternationalOtherMember2021-07-012022-06-300001596783ctlt:InternationalOtherMember2020-07-012021-06-300001596783ctlt:InternationalOtherMember2019-07-012020-06-300001596783ctlt:SkeletalCellTherapySupportSAMember2020-11-162020-11-160001596783ctlt:AcordaTherapeuticsIncMember2021-02-112021-02-110001596783ctlt:AcordaTherapeuticsIncMember2021-02-110001596783ctlt:DelphiGeneticsSAMember2021-02-232021-02-230001596783ctlt:DelphiGeneticsSAMember2021-02-230001596783ctlt:HepaticCellTherapySupportSA2021-02-232021-02-230001596783ctlt:HepaticCellTherapySupportSAMember2021-03-310001596783ctlt:RheinCellTherapeuticsMember2021-08-012021-08-010001596783ctlt:RheinCellTherapeuticsMember2021-08-010001596783ctlt:BetteraHoldingsLLCMember2021-10-012021-10-010001596783ctlt:A3500SeniorUSDenominatedNotesMemberMemberus-gaap:CarryingReportedAmountFairValueDisclosureMemberus-gaap:FairValueInputsLevel2Member2022-06-300001596783ctlt:A3500SeniorUSDenominatedNotesMemberMember2022-06-30xbrli:pure0001596783ctlt:BetteraHoldingsLLCMember2021-10-010001596783ctlt:BetteraHoldingsLLCMember2021-10-012021-10-310001596783ctlt:CoreTechnologyMemberctlt:BetteraHoldingsLLCMember2021-10-010001596783us-gaap:CustomerRelationshipsMemberctlt:BetteraHoldingsLLCMember2021-10-010001596783ctlt:CoreTechnologyBetteraMember2021-07-012022-06-300001596783ctlt:VaccineManufacturingAndInnovationCentreMember2022-04-012022-04-300001596783ctlt:VaccineManufacturingAndInnovationCentreMember2022-04-300001596783ctlt:PrincetonCellTherapyMember2022-04-012022-04-300001596783ctlt:PrincetonCellTherapyMember2022-04-300001596783ctlt:BlowFillSealBusinessWoodstockMember2021-07-012022-06-300001596783ctlt:BlowFillSealBusinessWoodstockMember2022-06-300001596783ctlt:BlowFillSealBusinessWoodstockMember2022-01-012022-03-310001596783ctlt:BlowFillSealBusinessWoodstockMember2020-07-012021-06-300001596783ctlt:BiologicsMember2020-06-300001596783ctlt:SoftgelAndOralTechnologiesMember2020-06-300001596783ctlt:OralAndSpecialtyDeliveryMember2020-06-300001596783ctlt:ClinicalSupplyServicesMember2020-06-300001596783ctlt:BiologicsMember2021-06-300001596783ctlt:SoftgelAndOralTechnologiesMember2021-06-300001596783ctlt:OralAndSpecialtyDeliveryMember2021-06-300001596783ctlt:ClinicalSupplyServicesMember2021-06-300001596783ctlt:BiologicsMember2022-06-300001596783ctlt:SoftgelAndOralTechnologiesMember2022-06-300001596783ctlt:OralAndSpecialtyDeliveryMember2022-06-300001596783ctlt:ClinicalSupplyServicesMember2022-06-300001596783ctlt:CoreTechnologyMember2021-07-012022-06-300001596783ctlt:CoreTechnologyMember2022-06-300001596783us-gaap:CustomerRelationshipsMember2021-07-012022-06-300001596783us-gaap:CustomerRelationshipsMember2022-06-300001596783ctlt:ProductRelationshipsMember2021-07-012022-06-300001596783ctlt:ProductRelationshipsMember2022-06-300001596783us-gaap:OtherIntangibleAssetsMember2021-07-012022-06-300001596783us-gaap:OtherIntangibleAssetsMember2022-06-300001596783ctlt:CoreTechnologyMember2020-07-012021-06-300001596783ctlt:CoreTechnologyMember2021-06-300001596783us-gaap:CustomerRelationshipsMember2020-07-012021-06-300001596783us-gaap:CustomerRelationshipsMember2021-06-300001596783ctlt:ProductRelationshipsMember2020-07-012021-06-300001596783ctlt:ProductRelationshipsMember2021-06-300001596783us-gaap:OtherIntangibleAssetsMember2020-07-012021-06-300001596783us-gaap:OtherIntangibleAssetsMember2021-06-300001596783ctlt:BoltonCSMembersrt:MaximumMember2021-07-012022-06-30ctlt:employees0001596783ctlt:BoltonCSMembersrt:MaximumMember2022-06-300001596783ctlt:BoltonCSMember2021-07-012022-06-300001596783ctlt:TermLoanThreeFacilityDollarDenominatedMember2022-06-300001596783ctlt:TermLoanThreeFacilityDollarDenominatedMember2021-06-300001596783us-gaap:CarryingReportedAmountFairValueDisclosureMemberctlt:USDollarDenominated500SeniorNotesMemberus-gaap:FairValueInputsLevel2Member2022-06-300001596783us-gaap:CarryingReportedAmountFairValueDisclosureMemberctlt:USDollarDenominated500SeniorNotesMemberus-gaap:FairValueInputsLevel2Member2021-06-300001596783ctlt:A2375SeniorEuroDenominatedNotesMemberus-gaap:CarryingReportedAmountFairValueDisclosureMemberus-gaap:FairValueInputsLevel2Member2022-06-300001596783ctlt:A2375SeniorEuroDenominatedNotesMemberus-gaap:CarryingReportedAmountFairValueDisclosureMemberus-gaap:FairValueInputsLevel2Member2021-06-300001596783ctlt:A3125SeniorUSDenominatedNotesMemberus-gaap:CarryingReportedAmountFairValueDisclosureMemberus-gaap:FairValueInputsLevel2Member2022-06-300001596783ctlt:A3125SeniorUSDenominatedNotesMemberus-gaap:CarryingReportedAmountFairValueDisclosureMemberus-gaap:FairValueInputsLevel2Member2021-06-300001596783ctlt:A3500SeniorUSDenominatedNotesMemberMemberus-gaap:CarryingReportedAmountFairValueDisclosureMemberus-gaap:FairValueInputsLevel2Member2021-06-300001596783ctlt:SeniorUnsecuredTermLoanFacilityMember2022-06-300001596783ctlt:SeniorUnsecuredTermLoanFacilityMember2021-06-300001596783us-gaap:CapitalLeaseObligationsMember2022-06-300001596783us-gaap:CapitalLeaseObligationsMember2021-06-300001596783ctlt:OtherObligationsMember2022-06-300001596783ctlt:OtherObligationsMember2021-06-300001596783ctlt:DebtIssuanceCostsMemberus-gaap:CarryingReportedAmountFairValueDisclosureMember2022-06-300001596783ctlt:DebtIssuanceCostsMemberus-gaap:CarryingReportedAmountFairValueDisclosureMember2021-06-300001596783us-gaap:CarryingReportedAmountFairValueDisclosureMember2022-06-300001596783us-gaap:CarryingReportedAmountFairValueDisclosureMember2021-06-300001596783ctlt:TermLoanTwoFacilityDollarDenominatedMember2021-02-280001596783ctlt:TermLoanThreeFacilityDollarDenominatedMembersrt:MinimumMemberus-gaap:LondonInterbankOfferedRateLIBORMember2021-07-012022-06-300001596783ctlt:TermLoanThreeFacilityDollarDenominatedMemberus-gaap:LondonInterbankOfferedRateLIBORMember2021-07-012022-06-300001596783us-gaap:LondonInterbankOfferedRateLIBORMemberus-gaap:RevolvingCreditFacilityMember2021-07-012022-06-300001596783srt:MinimumMemberus-gaap:LondonInterbankOfferedRateLIBORMemberus-gaap:RevolvingCreditFacilityMember2021-07-012022-06-300001596783ctlt:USDollarDenominated500SeniorNotesMember2022-06-300001596783ctlt:A2375SeniorEuroDenominatedNotesMember2022-06-30iso4217:EUR0001596783ctlt:FourPointSevenFivePercentSeniorEuroDenominatedNotesMember2022-06-300001596783ctlt:A3125SeniorUSDenominatedNotesMember2022-06-300001596783ctlt:U.S.Dollardenominated4.875SeniorNotesMember2017-10-180001596783us-gaap:AccruedLiabilitiesMember2017-10-012017-10-2300015967832017-10-012017-10-230001596783ctlt:SeniorSecuredCreditFacilityMember2021-07-012022-06-300001596783us-gaap:EstimateOfFairValueFairValueDisclosureMemberctlt:USDollarDenominated500SeniorNotesMemberus-gaap:FairValueInputsLevel2Member2022-06-300001596783us-gaap:EstimateOfFairValueFairValueDisclosureMemberctlt:USDollarDenominated500SeniorNotesMemberus-gaap:FairValueInputsLevel2Member2021-06-300001596783ctlt:A2375SeniorEuroDenominatedNotesMemberus-gaap:EstimateOfFairValueFairValueDisclosureMemberus-gaap:FairValueInputsLevel2Member2022-06-300001596783ctlt:A2375SeniorEuroDenominatedNotesMemberus-gaap:EstimateOfFairValueFairValueDisclosureMemberus-gaap:FairValueInputsLevel2Member2021-06-300001596783ctlt:A3125SeniorUSDenominatedNotesMemberus-gaap:EstimateOfFairValueFairValueDisclosureMemberus-gaap:FairValueInputsLevel2Member2022-06-300001596783ctlt:A3125SeniorUSDenominatedNotesMemberus-gaap:EstimateOfFairValueFairValueDisclosureMemberus-gaap:FairValueInputsLevel2Member2021-06-300001596783ctlt:A3500SeniorUSDenominatedNotesMemberMemberus-gaap:EstimateOfFairValueFairValueDisclosureMemberus-gaap:FairValueInputsLevel2Member2022-06-300001596783us-gaap:CarryingReportedAmountFairValueDisclosureMemberus-gaap:FairValueInputsLevel2Memberctlt:SeniorSecuredCreditFacilitiesOtherMember2022-06-300001596783us-gaap:EstimateOfFairValueFairValueDisclosureMemberus-gaap:FairValueInputsLevel2Memberctlt:SeniorSecuredCreditFacilitiesOtherMember2022-06-300001596783us-gaap:CarryingReportedAmountFairValueDisclosureMemberus-gaap:FairValueInputsLevel2Memberctlt:SeniorSecuredCreditFacilitiesOtherMember2021-06-300001596783us-gaap:EstimateOfFairValueFairValueDisclosureMemberus-gaap:FairValueInputsLevel2Memberctlt:SeniorSecuredCreditFacilitiesOtherMember2021-06-300001596783us-gaap:EstimateOfFairValueFairValueDisclosureMember2022-06-300001596783us-gaap:EstimateOfFairValueFairValueDisclosureMember2021-06-300001596783ctlt:DebtIssuanceCostsMemberus-gaap:EstimateOfFairValueFairValueDisclosureMember2022-06-300001596783ctlt:DebtIssuanceCostsMemberus-gaap:EstimateOfFairValueFairValueDisclosureMember2021-06-3000015967832020-11-232020-11-2300015967832020-11-2300015967832021-11-182021-11-1800015967832021-11-180001596783us-gaap:SeriesAPreferredStockMember2021-07-012022-06-300001596783us-gaap:SeriesAPreferredStockMember2020-07-012021-06-300001596783us-gaap:SeriesAPreferredStockMember2019-07-012020-06-300001596783ctlt:USDenominatedTermLoanMember2022-06-300001596783us-gaap:FairValueInputsLevel2Member2022-06-300001596783us-gaap:FairValueInputsLevel3Member2022-06-300001596783us-gaap:FairValueInputsLevel1Member2021-06-300001596783us-gaap:FairValueInputsLevel2Member2021-06-300001596783us-gaap:FairValueInputsLevel3Member2021-06-300001596783us-gaap:DomesticCountryMember2022-06-300001596783us-gaap:StateAndLocalJurisdictionMember2022-06-300001596783us-gaap:StateAndLocalJurisdictionMember2021-07-012022-06-300001596783us-gaap:ForeignCountryMember2022-06-300001596783us-gaap:ForeignCountryMember2021-07-012022-06-300001596783ctlt:ForeignNetOperatingLossEstablishedMember2021-07-012022-06-300001596783us-gaap:PensionPlansDefinedBenefitMember2021-07-012022-06-300001596783us-gaap:PensionPlansDefinedBenefitMember2022-06-300001596783us-gaap:PensionPlansDefinedBenefitMember2021-06-300001596783us-gaap:OtherPostretirementBenefitPlansDefinedBenefitMember2022-06-300001596783us-gaap:OtherPostretirementBenefitPlansDefinedBenefitMember2021-06-300001596783us-gaap:PensionPlansDefinedBenefitMember2020-06-300001596783us-gaap:OtherPostretirementBenefitPlansDefinedBenefitMember2020-06-300001596783us-gaap:PensionPlansDefinedBenefitMember2020-07-012021-06-300001596783us-gaap:OtherPostretirementBenefitPlansDefinedBenefitMember2021-07-012022-06-300001596783us-gaap:OtherPostretirementBenefitPlansDefinedBenefitMember2020-07-012021-06-300001596783us-gaap:PensionPlansDefinedBenefitMemberus-gaap:EquitySecuritiesMember2022-06-300001596783us-gaap:PensionPlansDefinedBenefitMemberus-gaap:EquitySecuritiesMember2021-06-300001596783us-gaap:EquitySecuritiesMemberus-gaap:OtherPostretirementBenefitPlansDefinedBenefitMember2022-06-300001596783us-gaap:EquitySecuritiesMemberus-gaap:OtherPostretirementBenefitPlansDefinedBenefitMember2021-06-300001596783us-gaap:USGovernmentAgenciesDebtSecuritiesMemberus-gaap:PensionPlansDefinedBenefitMember2022-06-300001596783us-gaap:USGovernmentAgenciesDebtSecuritiesMemberus-gaap:PensionPlansDefinedBenefitMember2021-06-300001596783us-gaap:USGovernmentAgenciesDebtSecuritiesMemberus-gaap:OtherPostretirementBenefitPlansDefinedBenefitMember2022-06-300001596783us-gaap:USGovernmentAgenciesDebtSecuritiesMemberus-gaap:OtherPostretirementBenefitPlansDefinedBenefitMember2021-06-300001596783us-gaap:PensionPlansDefinedBenefitMemberus-gaap:CorporateDebtSecuritiesMember2022-06-300001596783us-gaap:PensionPlansDefinedBenefitMemberus-gaap:CorporateDebtSecuritiesMember2021-06-300001596783us-gaap:OtherPostretirementBenefitPlansDefinedBenefitMemberus-gaap:CorporateDebtSecuritiesMember2022-06-300001596783us-gaap:OtherPostretirementBenefitPlansDefinedBenefitMemberus-gaap:CorporateDebtSecuritiesMember2021-06-300001596783us-gaap:PensionPlansDefinedBenefitMemberus-gaap:RealEstateMember2022-06-300001596783us-gaap:PensionPlansDefinedBenefitMemberus-gaap:RealEstateMember2021-06-300001596783us-gaap:OtherPostretirementBenefitPlansDefinedBenefitMemberus-gaap:RealEstateMember2022-06-300001596783us-gaap:OtherPostretirementBenefitPlansDefinedBenefitMemberus-gaap:RealEstateMember2021-06-300001596783ctlt:InsuranceContractsMemberus-gaap:PensionPlansDefinedBenefitMember2022-06-300001596783ctlt:InsuranceContractsMemberus-gaap:PensionPlansDefinedBenefitMember2021-06-300001596783ctlt:InsuranceContractsMemberus-gaap:OtherPostretirementBenefitPlansDefinedBenefitMember2022-06-300001596783ctlt:InsuranceContractsMemberus-gaap:OtherPostretirementBenefitPlansDefinedBenefitMember2021-06-300001596783us-gaap:PensionPlansDefinedBenefitMemberus-gaap:OtherAssetsMember2022-06-300001596783us-gaap:PensionPlansDefinedBenefitMemberus-gaap:OtherAssetsMember2021-06-300001596783us-gaap:OtherPostretirementBenefitPlansDefinedBenefitMemberus-gaap:OtherAssetsMember2022-06-300001596783us-gaap:OtherPostretirementBenefitPlansDefinedBenefitMemberus-gaap:OtherAssetsMember2021-06-300001596783us-gaap:EquitySecuritiesMemberus-gaap:FairValueInputsLevel1Member2022-06-300001596783us-gaap:EquitySecuritiesMemberus-gaap:FairValueInputsLevel2Member2022-06-300001596783us-gaap:EquitySecuritiesMemberus-gaap:FairValueInputsLevel3Member2022-06-300001596783us-gaap:FairValueMeasuredAtNetAssetValuePerShareMemberus-gaap:EquitySecuritiesMember2022-06-300001596783us-gaap:EquitySecuritiesMember2022-06-300001596783us-gaap:FairValueInputsLevel1Memberus-gaap:DebtSecuritiesMember2022-06-300001596783us-gaap:DebtSecuritiesMemberus-gaap:FairValueInputsLevel2Member2022-06-300001596783us-gaap:DebtSecuritiesMemberus-gaap:FairValueInputsLevel3Member2022-06-300001596783us-gaap:FairValueMeasuredAtNetAssetValuePerShareMemberus-gaap:DebtSecuritiesMember2022-06-300001596783us-gaap:DebtSecuritiesMember2022-06-300001596783us-gaap:FairValueInputsLevel1Memberus-gaap:RealEstateMember2022-06-300001596783us-gaap:FairValueInputsLevel2Memberus-gaap:RealEstateMember2022-06-300001596783us-gaap:FairValueInputsLevel3Memberus-gaap:RealEstateMember2022-06-300001596783us-gaap:FairValueMeasuredAtNetAssetValuePerShareMemberus-gaap:RealEstateMember2022-06-300001596783us-gaap:RealEstateMember2022-06-300001596783us-gaap:FairValueInputsLevel1Memberus-gaap:OtherAssetsMember2022-06-300001596783us-gaap:OtherAssetsMemberus-gaap:FairValueInputsLevel2Member2022-06-300001596783us-gaap:OtherAssetsMemberus-gaap:FairValueInputsLevel3Member2022-06-300001596783us-gaap:FairValueMeasuredAtNetAssetValuePerShareMemberus-gaap:OtherAssetsMember2022-06-300001596783us-gaap:OtherAssetsMember2022-06-300001596783us-gaap:FairValueMeasuredAtNetAssetValuePerShareMember2022-06-300001596783us-gaap:FairValueInputsLevel2Memberus-gaap:HedgeFundsMember2022-06-300001596783us-gaap:EquitySecuritiesMemberus-gaap:FairValueInputsLevel1Member2021-06-300001596783us-gaap:EquitySecuritiesMemberus-gaap:FairValueInputsLevel2Member2021-06-300001596783us-gaap:EquitySecuritiesMemberus-gaap:FairValueInputsLevel3Member2021-06-300001596783us-gaap:FairValueMeasuredAtNetAssetValuePerShareMemberus-gaap:EquitySecuritiesMember2021-06-300001596783us-gaap:EquitySecuritiesMember2021-06-300001596783us-gaap:FairValueInputsLevel1Memberus-gaap:DebtSecuritiesMember2021-06-300001596783us-gaap:DebtSecuritiesMemberus-gaap:FairValueInputsLevel2Member2021-06-300001596783us-gaap:DebtSecuritiesMemberus-gaap:FairValueInputsLevel3Member2021-06-300001596783us-gaap:FairValueMeasuredAtNetAssetValuePerShareMemberus-gaap:DebtSecuritiesMember2021-06-300001596783us-gaap:DebtSecuritiesMember2021-06-300001596783us-gaap:FairValueInputsLevel1Memberus-gaap:RealEstateMember2021-06-300001596783us-gaap:FairValueInputsLevel2Memberus-gaap:RealEstateMember2021-06-300001596783us-gaap:FairValueInputsLevel3Memberus-gaap:RealEstateMember2021-06-300001596783us-gaap:FairValueMeasuredAtNetAssetValuePerShareMemberus-gaap:RealEstateMember2021-06-300001596783us-gaap:RealEstateMember2021-06-300001596783us-gaap:FairValueInputsLevel1Memberus-gaap:OtherAssetsMember2021-06-300001596783us-gaap:OtherAssetsMemberus-gaap:FairValueInputsLevel2Member2021-06-300001596783us-gaap:OtherAssetsMemberus-gaap:FairValueInputsLevel3Member2021-06-300001596783us-gaap:FairValueMeasuredAtNetAssetValuePerShareMemberus-gaap:OtherAssetsMember2021-06-300001596783us-gaap:OtherAssetsMember2021-06-300001596783us-gaap:FairValueMeasuredAtNetAssetValuePerShareMember2021-06-300001596783us-gaap:FairValueInputsLevel2Memberus-gaap:HedgeFundsMember2021-06-300001596783ctlt:EberbachPensionPromissoryNoteOrLoanMember2022-06-300001596783ctlt:InsuranceContractsMemberus-gaap:FairValueInputsLevel3Member2021-06-300001596783ctlt:OtherUnobservableAssetsMemberus-gaap:FairValueInputsLevel3Member2021-06-300001596783us-gaap:FairValueInputsLevel3Member2021-07-012022-06-300001596783ctlt:InsuranceContractsMemberus-gaap:FairValueInputsLevel3Member2021-07-012022-06-300001596783ctlt:OtherUnobservableAssetsMemberus-gaap:FairValueInputsLevel3Member2021-07-012022-06-300001596783ctlt:InsuranceContractsMemberus-gaap:FairValueInputsLevel3Member2022-06-300001596783ctlt:OtherUnobservableAssetsMemberus-gaap:FairValueInputsLevel3Member2022-06-300001596783us-gaap:OtherPostretirementBenefitPlansDefinedBenefitMemberctlt:Post65Member2022-06-300001596783us-gaap:OtherPostretirementBenefitPlansDefinedBenefitMemberctlt:Post65Member2021-06-300001596783us-gaap:OtherPostretirementBenefitPlansDefinedBenefitMemberctlt:Post65Member2021-07-012022-06-300001596783us-gaap:OtherPostretirementBenefitPlansDefinedBenefitMemberctlt:Post65Member2020-07-012021-06-3000015967832020-06-152020-06-1500015967832020-06-1500015967832020-02-062020-02-0600015967832020-02-060001596783ctlt:DesignatedSharesMember2020-06-3000015967832019-05-170001596783us-gaap:AdditionalPaidInCapitalMember2020-11-232020-11-230001596783us-gaap:AdditionalPaidInCapitalMember2022-01-012022-03-3100015967832021-07-012022-03-310001596783us-gaap:AccumulatedTranslationAdjustmentMember2019-06-300001596783us-gaap:AccumulatedDefinedBenefitPlansAdjustmentMember2019-06-300001596783us-gaap:AociDerivativeQualifyingAsHedgeExcludedComponentParentMember2019-06-300001596783ctlt:ACOIAccumulatedGainLossMarketableSecuritiesMember2019-06-300001596783us-gaap:AccumulatedNetUnrealizedInvestmentGainLossMember2019-06-300001596783us-gaap:AccumulatedTranslationAdjustmentMember2019-07-012020-06-300001596783us-gaap:AccumulatedDefinedBenefitPlansAdjustmentMember2019-07-012020-06-300001596783us-gaap:AociDerivativeQualifyingAsHedgeExcludedComponentParentMember2019-07-012020-06-300001596783us-gaap:AccumulatedNetUnrealizedInvestmentGainLossMember2019-07-012020-06-300001596783us-gaap:AccumulatedTranslationAdjustmentMember2020-06-300001596783us-gaap:AccumulatedDefinedBenefitPlansAdjustmentMember2020-06-300001596783us-gaap:AociDerivativeQualifyingAsHedgeExcludedComponentParentMember2020-06-300001596783ctlt:ACOIAccumulatedGainLossMarketableSecuritiesMember2020-06-300001596783us-gaap:AccumulatedNetUnrealizedInvestmentGainLossMember2020-06-300001596783us-gaap:AccumulatedTranslationAdjustmentMember2020-07-012021-06-300001596783us-gaap:AccumulatedDefinedBenefitPlansAdjustmentMember2020-07-012021-06-300001596783us-gaap:AociDerivativeQualifyingAsHedgeExcludedComponentParentMember2020-07-012021-06-300001596783us-gaap:AccumulatedNetUnrealizedInvestmentGainLossMember2020-07-012021-06-300001596783us-gaap:AccumulatedTranslationAdjustmentMember2021-06-300001596783us-gaap:AccumulatedDefinedBenefitPlansAdjustmentMember2021-06-300001596783us-gaap:AociDerivativeQualifyingAsHedgeExcludedComponentParentMember2021-06-300001596783ctlt:ACOIAccumulatedGainLossMarketableSecuritiesMember2021-06-300001596783us-gaap:AccumulatedNetUnrealizedInvestmentGainLossMember2021-06-300001596783us-gaap:AccumulatedNetUnrealizedInvestmentGainLossMember2021-07-012022-06-300001596783us-gaap:AccumulatedTranslationAdjustmentMember2022-06-300001596783us-gaap:AccumulatedDefinedBenefitPlansAdjustmentMember2022-06-300001596783us-gaap:AociDerivativeQualifyingAsHedgeExcludedComponentParentMember2022-06-300001596783ctlt:ACOIAccumulatedGainLossMarketableSecuritiesMember2022-06-300001596783us-gaap:AccumulatedNetUnrealizedInvestmentGainLossMember2022-06-300001596783ctlt:StockCompensationPlanOmnibusMember2021-07-012022-06-300001596783ctlt:StockCompensationPlanOmnibusMember2020-07-012021-06-300001596783ctlt:StockCompensationPlanOmnibusMember2019-07-012020-06-300001596783us-gaap:EmployeeStockOptionMembersrt:MinimumMember2021-07-012022-06-300001596783us-gaap:EmployeeStockOptionMembersrt:MinimumMember2020-07-012021-06-300001596783us-gaap:EmployeeStockOptionMembersrt:MinimumMember2019-07-012020-06-300001596783us-gaap:EmployeeStockOptionMembersrt:MaximumMember2019-07-012020-06-300001596783us-gaap:EmployeeStockOptionMembersrt:MaximumMember2021-07-012022-06-300001596783us-gaap:EmployeeStockOptionMembersrt:MaximumMember2020-07-012021-06-300001596783ctlt:TimeMember2021-06-300001596783ctlt:TimeMember2020-07-012021-06-300001596783ctlt:TimeMember2021-07-012022-06-300001596783ctlt:PerformanceMember2022-06-300001596783ctlt:TimeMember2022-06-300001596783ctlt:TimeBasedRestrictedStockUnitsMember2021-06-300001596783ctlt:TimeBasedRestrictedStockUnitsMember2021-07-012022-06-300001596783ctlt:TimeBasedRestrictedStockUnitsMember2022-06-300001596783us-gaap:PerformanceSharesMember2021-06-300001596783us-gaap:PerformanceSharesMember2021-07-012022-06-300001596783us-gaap:PerformanceSharesMember2022-06-300001596783us-gaap:PerformanceSharesMembersrt:MinimumMember2021-07-012022-06-300001596783us-gaap:PerformanceSharesMembersrt:MaximumMember2021-07-012022-06-300001596783us-gaap:PerformanceSharesMembersrt:MinimumMember2020-07-012021-06-300001596783us-gaap:PerformanceSharesMembersrt:MaximumMember2020-07-012021-06-300001596783ctlt:RTSRPerformanceShareUnitsMember2021-06-300001596783ctlt:RTSRPerformanceShareUnitsMember2021-07-012022-06-300001596783ctlt:RTSRPerformanceShareUnitsMember2022-06-300001596783us-gaap:RestrictedStockUnitsRSUMember2022-06-300001596783us-gaap:RestrictedStockUnitsRSUMember2021-07-012022-06-300001596783us-gaap:RestrictedStockUnitsRSUMember2020-07-012021-06-300001596783us-gaap:RestrictedStockUnitsRSUMember2019-07-012020-06-300001596783ctlt:TotalCatalentSubTotalOfSegmentReportingMember2021-07-012022-06-300001596783ctlt:TotalCatalentSubTotalOfSegmentReportingMember2020-07-012021-06-300001596783ctlt:TotalCatalentSubTotalOfSegmentReportingMember2019-07-012020-06-300001596783ctlt:CorporateAndEliminationsMember2022-06-300001596783ctlt:CorporateAndEliminationsMember2021-06-300001596783us-gaap:CorporateMember2021-07-012022-06-300001596783us-gaap:CorporateMember2020-07-012021-06-300001596783us-gaap:CorporateMember2019-07-012020-06-300001596783country:US2022-06-300001596783country:US2021-06-300001596783srt:EuropeMember2022-06-300001596783srt:EuropeMember2021-06-300001596783ctlt:RestofWorldMember2022-06-300001596783ctlt:RestofWorldMember2021-06-3000015967832022-10-012022-12-3100015967832022-08-092022-08-09
UNITED STATES
SECURITIES AND EXCHANGE COMMISSION
Washington, D.C. 20549
| | | | | | | | |
| ý | ANNUAL REPORT PURSUANT TO SECTION 13 OR 15(d) OF THE SECURITIES EXCHANGE ACT OF 1934 |
For the fiscal year ended June 30, 2022
or | | | | | | | | |
| ¨ | TRANSITION REPORT PURSUANT TO SECTION 13 OR 15(d) OF THE SECURITIES EXCHANGE ACT OF 1934 |
For the transition period from to
Commission File Number: 001-36587
| | | | | | | | |
| CATALENT, INC. | |
| (Exact name of registrant as specified in its charter) |
| | |
| | | | | | | | |
| Delaware | 20-8737688 |
| (State or other jurisdiction of incorporation or organization) | (I.R.S. Employer Identification No.) |
| | |
14 Schoolhouse Road | 08873 |
| Somerset, | New Jersey |
| (Address of principal executive offices) | (Zip Code) |
Registrant’s telephone number, including area code: (732) 537-6200
____________________________________________________________________________________________________________________________________________________________________________________________________________________________________________________
Securities registered pursuant to Section 12(b) of the Act: | | | | | | | | |
| Title of each class | Trading Symbol(s) | Name of each exchange on which registered |
| Common Stock, $0.01 par value per share | CTLT | New York Stock Exchange |
Securities registered pursuant to Section 12(g) of the Act: None
____________________________________________________________________________________________________________________________________________________________________________________________________________________________________________________
Indicate by check mark if the registrant is a well-known seasoned issuer, as defined in Rule 405 of the Securities Act. Yes ☒ No ¨
Indicate by check mark if the registrant is not required to file reports pursuant to Section 13 or Section 15(d) of the Act. Yes ¨ No ☒
Indicate by check mark whether the registrant (1) has filed all reports required to be filed by Section 13 or 15(d) of the Securities Exchange Act of 1934 during the preceding 12 months (or for such shorter period that the registrant was required to file such reports), and (2) has been subject to such filing requirements for the past 90 days. Yes ☒ No ¨
Indicate by check mark whether the registrant has submitted electronically every Interactive Data File required to be submitted pursuant to Rule 405 of Regulation S-T (§ 232.405 of this chapter) during the preceding 12 months (or for such shorter period that the registrant was required to submit such files). Yes ☒ No ¨
Indicate by check mark whether the registrant is a large accelerated filer, an accelerated filer, a non-accelerated filer, smaller reporting company, or an emerging growth company. See the definitions of “large accelerated filer,” “accelerated filer,” “smaller reporting company” and “emerging growth company” in Rule 12b-2 of the Exchange Act. | | | | | | | | | | | | | | | | | |
| Large accelerated filer | ý | | Accelerated filer | ¨ | |
| Non-accelerated filer | ¨ | | Smaller reporting company | ¨ | |
| | | Emerging growth company | ¨ | |
If an emerging growth company, indicate by check mark if the registrant has elected not to use the extended transition period for complying with any new or revised financial accounting standards provided pursuant to Section 13(a) of the Exchange Act. o
Indicate by check mark whether the registrant has filed a report on and attestation to its management’s assessment of the effectiveness of its internal control over financial reporting under Section 404(b) of the Sarbanes-Oxley Act (15 U.S.C. 7262(b)) by the registered public accounting firm that prepared or issued its audit report. ☒
Indicate by check mark whether the registrant is a shell company (as defined in Rule 12b-2 of the Act). ¨ Yes ☒ No
As of December 31, 2021, the aggregate market value of the registrant’s voting and non-voting common equity held by non-affiliates was $21.84 billion. On August 25, 2022, there were 179,895,677 shares of the Registrant’s Common Stock, par value $0.01 per share, issued and outstanding.
DOCUMENTS INCORPORATED BY REFERENCE
Portions of the Registrant's Proxy Statement relating to the 2022 Annual Meeting of Shareholders are incorporated by reference into Part III of this report.
CATALENT, INC.
INDEX TO ANNUAL REPORT ON FORM 10-K
For the Fiscal Year Ended June 30, 2022
| | | | | | | | |
| Item | | Page |
| PART I | |
| | |
| | |
| | |
| Item 1. | | |
| | |
| Item 1A. | | |
| | |
| Item 1B. | | |
| | |
| Item 2. | | |
| | |
| Item 3. | | |
| | |
| Item 4. | | |
| | |
| PART II | |
| | |
| Item 5. | | |
| | |
| Item 6. | | |
| | |
| Item 7. | | |
| | |
| Item 7A. | | |
| | |
| Item 8. | | |
| | |
| Item 9. | | |
| | |
| Item 9A. | | |
| | |
| Item 9B. | | |
| | |
| Item 9C. | | |
| | |
| PART III | |
| | |
| Item 10. | | |
| | |
| Item 11. | | |
| | |
| Item 12. | | |
| | |
| Item 13. | | |
| | |
| Item 14. | | |
| | |
| PART IV | |
| | |
| Item 15. | | |
| | |
| Item 16. | | |
| | |
| |
PART I
Special Note Regarding Forward-Looking Statements
In addition to historical information, this Annual Report on Form 10-K for the fiscal year ended June 30, 2022 (this “Annual Report”) of Catalent, Inc. (“Catalent” or the “Company”) contains “forward-looking statements” within the meaning of Section 27A of the Securities Act of 1933, as amended (the “Securities Act”), and Section 21E of the Securities Exchange Act of 1934, as amended (the “Exchange Act”), which are subject to the “safe harbor” created by those sections. All statements, other than statements of historical facts, included in this Annual Report are forward-looking statements. In some cases, you can identify these forward-looking statements by the use of words such as “outlook,” “believes,” “expects,” “potential,” “continues,” “may,” “will,” “should,” “could,” “seeks,” “predicts,” “intends,” “plans,” “estimates,” “anticipates,” “future,” “forward,” “sustain” or the negative version of these words or other comparable words.
These statements are based on assumptions and assessments made by our management in light of their experience and their perception of historical trends, current conditions, expected future developments, and other factors they believe to be appropriate. Any forward-looking statement is subject to various risks and uncertainties. Accordingly, there are or will be important factors that could cause actual outcomes or results to differ materially from those indicated in these statements.
Some of the factors that may cause actual results, developments, and business decisions to differ materially from those contemplated by such forward-looking statements include, but are not limited to, those described under the section entitled “Risk Factors” in this Annual Report, which are summarized below:
Summary of Principal Risk Factors
Any investment, including an investment in our common stock, par value $0.01 (the “Common Stock”), involves risk. The following summary highlights certain risks that an investor in our Common Stock should consider. The following should be read in conjunction with the fuller discussion of risk factors we face set forth in "Item 1A. Risk Factors."
Risks Relating to Our Business and the Industry in Which We Operate
•Our business, financial condition, and operations may be adversely affected by global health epidemics, including the pandemic resulting from the SARS-Co-V-2 strain of coronavirus and its variants (“COVID-19”).
•The continually evolving nature of the COVID-19 pandemic and the resulting public health response, including the changing demand for various COVID-19 vaccines and treatments from both patients and governments around the world, may affect sales of the COVID-19 products we manufacture.
•We participate in a highly competitive market, and increased competition may adversely affect our business.
•The demand for our offerings depends in part on our customers’ research and development and the clinical and market success of their products.
•We are subject to product and other liability risks that could exceed our anticipated costs or adversely affect our results of operations, financial condition, liquidity, and cash flows.
•We are a part of the highly regulated healthcare industry, subject to stringent regulatory standards and other applicable laws and regulations, which can change unexpectedly and may adversely impact our business.
•Any failure to implement fully, monitor, and improve our quality management strategy could lead to quality or safety issues and expose us to significant costs, potential liability and adverse publicity.
•If we cannot keep pace with rapid technological advances, our services may become uncompetitive or obsolete.
•Any failure to protect or maintain our intellectual property may adversely affect our competitive edge and result in loss of revenue and reputation.
•Future price fluctuations, material shortages of raw materials, or changes in healthcare policies may have an adverse effect on our results of operations and financial conditions.
•Our ability to use our net operating loss carryforwards and certain other tax attributes may be limited.
•We may be unable to attract or retain key personnel.
•We may be unsuccessful in integrating our acquisitions, and we may expend substantial amounts of cash and incur debt in making acquisitions.
•Our global operations are subject to economic and political risks that could affect the profitability of our operations or require costly changes to our procedures.
•As a global enterprise, fluctuations in the exchange rates of the United States ("U.S.") dollar, our reporting currency, against other currencies could have a material adverse effect on our financial performance and results of operations.
•Tax legislative or regulatory initiatives, new interpretations or developments concerning existing tax laws, or challenges to our tax positions could adversely affect our results of operations and financial condition.
•We use advanced information and communication systems to run our operations, compile and analyze financial and operational data, and communicate among our employees, customers, and counter-parties, and the risks generally associated with information and communications systems could adversely affect our results of operations. We continuously work to install new, and upgrade existing, systems and provide employee awareness training around phishing, malware, and other cybersecurity risks to enhance the protections available to us, but such protections may be inadequate to address malicious attacks or inadvertent compromises affecting data security or the operability of such systems.
•We provide services incorporating various advanced modalities, including protein and plasmid production and cell and gene therapies, and these modalities relate to relatively new modes of treatment that may be subject to changing public opinion, continuing research, and increased regulatory scrutiny, each of which may affect our customers' ability to conduct their businesses, or obtain regulatory approvals for their therapies, and thereby adversely affect these offerings.
Risks Relating to Our Indebtedness
•The size of our indebtedness and the obligations associated with it could limit our ability to operate our business and to finance future operations or acquisitions that would enhance our growth.
•Our debt agreements contain restrictions that may limit our flexibility in conducting certain current and future operations.
•We may not be able to pay our indebtedness when it becomes due.
•Our current and potential future use of derivative financial instruments may expose us to economic losses in the event of price or currency fluctuations.
Risks Relating to Ownership of Our Common Stock
•Our stock price has historically been and may continue to be volatile.
•Because we have no plan to pay cash dividends on our Common Stock for the foreseeable future, receiving a return on an investment in our Common Stock may require a sale for a net price greater than was paid for it.
•Provisions in our organizational documents could delay or prevent a change of control.
We caution you that the risks, uncertainties, and other factors referenced above may not contain all of the risks, uncertainties, and other factors that are important to you. In addition, we cannot assure you that we will realize the results, benefits, or developments that we expect or anticipate or, even if substantially realized, that they will result in the consequences or affect us or our business in the way expected. There can be no assurance that (i) we have correctly measured or identified all of the factors affecting our business or the extent of these factors’ likely impact, (ii) the available information with respect to these factors on which such analysis is based is complete or accurate, (iii) such analysis is correct, or (iv) our strategy, which is based in part on this analysis, will be successful. All forward-looking statements in this report apply only as of the date of this report or as of the date they were made, and we undertake no obligation to publicly update or review any forward-looking statement, whether as a result of new information, future developments, or otherwise, except as required by law.
We file annual, quarterly, and current reports and other information with and furnish additional information to the U.S. Securities and Exchange Commission (the “SEC”). Our filings with the SEC are available to the public on the SEC’s website at www.sec.gov. Those filings are also available to the public on, or accessible through, our website (catalent.com) for free via the “Investors” section as soon as reasonably practicable after we file such material, or furnish it to, the SEC. We also use our website, Facebook page (facebook.com/CatalentPharmaSolutions), LinkedIn page (linkedin.com/company/catalent-pharma-solutions/) and Twitter account (@catalentpharma) as channels of distribution of information concerning our activities, our offerings, our various businesses, and other related matters. The information we post through these channels may be deemed material. Accordingly, investors should monitor these channels, in addition to following our press releases, SEC filings, and public conference calls and webcasts. The information we file with or furnish to the SEC (other than the information set forth or incorporated in this Annual Report) or contained on or accessible through our website, our social media channels, or any other website that we may maintain is not a part of this Annual Report.
Catalent References and Fiscal Year
Unless the context otherwise requires, in this Annual Report, the terms “Catalent,” “the company,” “we,” “us,” and “our” refer to Catalent, Inc. and its subsidiaries. All references to years in this Annual Report, unless otherwise stated, refer to fiscal years beginning July 1 and ending June 30. All references to quarters, unless otherwise stated, refer to fiscal quarters. Fiscal years are referred to by the calendar year in which they end. For example, “fiscal 2022” refers to the fiscal year ended June 30, 2022.
Trademarks and Service Marks
We have U.S. or foreign registrations for the following marks, among others: Bettera®, Catalent®, Clinicopia®, CosmoPod®, Easyburst®, FastChain®, FlexDirect®, Follow the Molecule®, Galacorin®, GPEx®, GPEx® Boost, GPEx® Lightning, Graphicaps®, Liqui-Gels®, Manufacturing Miracles®, Micron Technologies®, OmegaZero®, OneBio®, OneXpres Solution®, OptiDose®, OptiForm®, OptiGel®, OptiGel® Bio, OptiGel® DR, OptiMelt®, OptiShell®, PEEL-ID®, Pharmatek®, RP Scherer®, Savorgel®, Scherer®, SMARTag®, Softdrop®, Staby®, StabyExpress®, SupplyFlex®, Vegicaps®, Zydis®, and Zydis Ultra®. This Annual Report also includes trademarks and trade names owned by other parties, and these trademarks and trade names are the property of their respective owners. We use certain other trademarks and service marks, including, FlexDose™, Catalent Xpress Pharmaceutics™, OptiPact™, StartScore™, and Uptempo Virtuoso™ and on an unregistered basis in the U.S. and abroad.
Solely for convenience, the trademarks, service marks, and trade names identified in this Annual Report may appear without the ®, SM, and ™ symbols, but such references are not intended to indicate, in any way, that we will not assert, to the fullest extent under applicable law, our rights or the rights of the applicable licensors to these trademarks, service marks, and trade names.
ITEM 1. BUSINESS
Overview
We provide differentiated development and manufacturing solutions for drugs, protein-based biologics, cell and gene therapies, vaccines, and consumer health products at over fifty facilities across four continents under rigorous quality and operational standards. Our oral, injectable, and respiratory delivery technologies, along with our state-of-the-art protein, plasmid, viral, and cell and gene therapy manufacturing capacity, address a wide and growing range of modalities and therapeutic and other categories across the biopharmaceutical and consumer health industries. Through our extensive capabilities, growth-enabling capacity, and deep expertise in product development, regulatory compliance, and clinical trial and commercial supply, we can help our customers take products to market faster, including more than half of new drug products approved by the U.S. Food and Drug Administration (the “FDA”) in the last decade. Our development and manufacturing platforms, our proven formulation, supply, and regulatory expertise, and our broad and deep development and manufacturing know-how enable our customers to advance and then bring to market more products and better treatments for patients and consumers. Our commitment to reliably supply our customers’ and their patients’ needs is the foundation for the value we provide; annually, we produce nearly 80 billion doses for nearly 8,000 customer products, or approximately 1 in every 23 doses of such products taken each year by patients and consumers around the world. We believe that, through our investments in state-of-the-art facilities and capacity expansion, including investments in facilities focused on new treatment modalities and other attractive market segments, our continuous improvement activities devoted to operational and quality excellence, the sales of existing and introduction of new customer products, and, in some cases, our innovation activities and patents, we will continue to attract premium opportunities and realize the growth potential from these areas.
We continue to invest in both our product and service offerings and our sales and marketing activities, leading to growth in the number of active commercial manufacturing and development programs for our customers. This has further enhanced our extensive, long-duration relationships and long-term contracts with a broad and diverse range of industry-leading customers. In fiscal 2022, we conducted business with 87 of the top 100 branded drug marketers, 21 of the top 25 generics marketers, 24 of the top 25 biologics marketers, and 21 of the top 25 consumer health marketers globally. Selected key customers include AstraZeneca, Bristol-Myers Squibb, GlaxoSmithKline, Johnson & Johnson, Moderna, Pfizer, and Sarepta Therapeutics. We have many long-standing relationships with our customers, particularly those with commercial products, as we provide support and reliable supply through each stage of a product's lifecycle. Our relationship with an innovator of a prescription pharmaceutical product will often last many years—in several cases, two decades or more—extending from pre-clinical development through more mature stages of the product's life cycle. We serve customers requiring some combination of innovative product development, superior quality, state-of-the-art manufacturing, and skilled technical services to support their development and marketed product needs. Our broad and diverse range of technologies closely integrates with all aspects of our customers’ final formulations and dose forms, and this generally results in the inclusion of our facilities as manufacturing and testing sites in our customers’ prescription product regulatory filings. Both factors frequently translate to long-duration supply relationships at an individual product level.
We believe our customers value us because our depth of development solutions and state-of-the-art manufacturing technologies, continuous innovations and improvements, consistent and reliable supply, geographic reach, and substantial expertise enable us to create a broad range of business and product solutions that can be customized to fit their individual needs. Today we employ more than 9,000 highly trained direct manufacturing associates, as well as more than 3,000 formulation, analytical development, and process scientists and technicians. Our customers can also benefit from more than 1,400 patents and patent applications in advanced delivery platforms, drug and biologics formulation, and manufacturing. The aim of our offerings is to reliably supply their commercial needs and also allow our customers to bring more products to market faster and develop and market differentiated products that improve patient outcomes. We believe our leading market position and diversity of customers, offerings, regulatory categories, products, and geographies reduce our exposure to potential strategic and product shifts within our industries.
We provide a wide variety of proprietary and non-proprietary, differentiated technologies, products, and service offerings to our customers across our development and manufacturing platforms, which we have advanced and grown over more than 90 years through internal development, strategic alliances, in-licensing, and acquisitions. We initially introduced our softgel capsule technologies in the 1930s and have continuously expanded our range of offerings. In recent years, we have launched more than a dozen internally developed new technology platform offerings. We have also augmented our portfolio through acquisitions. Among the technologies we currently offer are softgel capsules, including both gelatin and non-gelatin formulations, our Zydis orally disintegrating tablets, gummy and soft chew oral forms, protein production using advanced mammalian cell lines, adeno-associated virus (“AAV”) vectors, induced pluripotent stem cells (“iPSCs”), plasmid DNA (“pDNA”), and a range of other oral, injectable, and respiratory delivery technologies. The technologies and service offerings within our development solution platforms span the full drug development process, ranging from our OptiForm Solution Suite
for enhancement of bioavailability and other characteristics of early-stage small molecules, Gene Product Expression (“GPEx”), GPEx Boost, GPEx Lightning for advanced cell line development, pDNA development and production and SMARTag platforms for development of biologics and antibody-drug conjugates (“ADCs”), to formulation, analytical services, early-stage clinical development, drug-device combination development and supply, fill and finish operations for injectable products, and clinical trials supply, including our unique FlexDirect direct-to-patient and FastChain demand-led clinical supply solutions. Our offerings serve a critical need in the development and manufacture of products across a broad range of product types. We focus on serving as an accelerator for new therapeutic modalities and formulation, delivery, and manufacturing technologies. Our expertise enables us to bring advanced products to market at scale, faster.
In large part due to our recent acquisitions and their subsequent organic growth, the revenue contribution from our Biologics segment has grown from approximately 17% in fiscal 2016 to 53% in fiscal 2022. We believe our own internal innovation and investments, supplemented by current and future external partnerships and acquisitions, will continue to strengthen and extend our leadership positions in the development, reliable supply, and delivery of drugs, protein-based biologics, cell and gene therapies, and consumer health products.
History
We trace our history to the 1933 founding of the R.P. Scherer Corporation, which developed the first rotary die machine for the manufacture of soft gelatin capsules, and assumed our current form in April 2007. We regularly review our portfolio of offerings and operations in the context of our strategic growth plan, and, where appropriate, have added to or divested from our portfolio of offering and sites, which has led to significant growth of the overall business. In July 2014, we completed the initial public offering of our Common Stock, which is listed on the New York Stock Exchange (the “NYSE”) under the symbol “CTLT.”
We are a holding company that indirectly owns Catalent Pharma Solutions, Inc. (“Operating Company”), which owns, directly or indirectly, all of our operating assets.
Our Competitive Strengths
Available, State-of-the-art Manufacturing Capacity in Attractive Market Segments
We have invested several billion dollars over the last few years, and plan to continue to invest, to broaden our portfolio of offerings and expand our capacity with state-of-the-art manufacturing and development capabilities that focus on anticipating and meeting the needs of the evolving biopharmaceutical and consumer health industries. In addition, we have hired and trained thousands of new direct manufacturing associates in our rigorous, quality-focused culture of operational excellence. The capacity and capabilities we have built and purchased have enabled, and our further planned expansions will continue to enable, us to secure, along with our operational and quality excellence, attractive new business opportunities in the expanding market for outsourced product development and supply.
Vibrant, Patient First-Driven Culture
From the manufacturing line to the executive suite, for all our critical decisions, we ask the question, “What would the impact be to the patient?”, and our culture is built on our cornerstone value of Patient First. We believe this mindset, which aligns closely with our customers’ values, enables a pervasive focus on patient safety, impact, and outcomes, and an uncompromising approach to product quality and compliance, by reminding us of those who depend upon our vigilance concerning the safety, quality, reliability, and sustainability of our product supply. Along with other key cultural strengths, including our commitments to diversity and inclusion and to science-based environmental sustainability, we believe our culture brings us both a unique reputation and an operating capability that is difficult to replicate.
Diversified Operating Platform
We are diversified by virtue of our broad range of product and service offerings, our geographic scope, our large customer portfolio, the extensive range of products we produce, and our ability to provide solutions at every stage of a product’s lifecycle. In fiscal 2022, we produced nearly 8,000 distinct products across multiple categories. Our fiscal 2022 net revenue was distributed as follows: biologics 55%, branded drugs 28%, generic prescription drugs 3%, over-the-counter drugs 6%, and consumer health and other 8% combined. In fiscal 2022, our top 20 products represented approximately 44% of our total net revenue, with one customer accounting for greater than 10% of net revenue whose largest individual product accounted for less than 9% of our net revenue. We serve more than 1,200 customers in approximately 80 countries, with 36% of our fiscal 2022 net revenue coming from outside the U.S. This diversity, combined with long product lifecycles and close customer
relationships, has contributed to the stability of our business. It has also allowed us to reduce our exposure to the risks associated with potential strategic, customer, and product shifts as well as to payer-driven pricing pressures experienced by our drug and biologic customers.
Longstanding, Extensive Relationships with a Diverse Customer Portfolio
We have longstanding, extensive relationships with leading pharmaceutical, biotechnology, and consumer health customers. In fiscal 2022, we did business with 87 of the top 100 branded drug marketers, 21 of the top 25 generics marketers, 24 of the top 25 biologics marketers, and 21 of the top 25 consumer health marketers globally, as well as with more than 1,200 other customers, including emerging and specialty biotech and pharmaceutical companies, which are often more reliant on outside partners as a result of their more virtual business models. Regardless of size, our customers seek innovative product development, superior quality, advanced manufacturing, and skilled technical services to support their development and marketed product needs.
We believe our customers value us because our broad range of product and service offerings, expanding capacity in state-of-the-art manufacturing facilities, including facilities offering new treatment modalities, reliable supply, geographic reach, commitment to operational and quality excellence, and substantial expertise that enable us to create a broad range of tailored solutions, many of which are unavailable from other individual providers.
Deep, Broad, and Growing Advanced Technology Foundation
Our breadth of offerings employing advanced technologies and state-of-the-art manufacturing systems and long track record of innovation substantially differentiate us from other industry participants. Our leading softgel platforms, including Liqui-Gels, OptiShell, OptiGel DR, and Vegicaps capsules, our new gummy and soft chew oral forms, and our modified release technologies, including the Zydis family of orally disintegrating tablets, our spray drying capabilities, and our OptiPact and OptiMelt technologies, provide formulation expertise to solve complex delivery challenges for our customers. We offer advanced technologies for delivery of small molecules and biologics via oral, respiratory, and injectable routes and also provide advanced biologics formulation options, including GPEx, GPEx Boost, and GPEx Lightning mammalian cell lines for protein production, SMARTag ADC technology, AAV vectors for cell and gene therapies, and pDNA development and commercial manufacturing. We have a leadership position within respiratory delivery, including dry powder inhalers and intra-nasal forms. We have reinforced our leadership position in advanced technologies over the last three years, as we have launched more than a dozen new technology platforms and applications, and recently purchased or expanded our businesses developing and manufacturing consumer health products, protein-based biologics, fill and finish for injectable drugs and biologics, cell and gene therapies, and other new therapeutic modalities. Our culture of creativity, problem-solving, and innovation is grounded in our advanced technologies, the substantial expertise and experience of our scientists and engineers, and, in some cases, our patents and proprietary manufacturing processes. Our global product development and innovation teams drive a focused application of resources to opportunities for both new customer product introductions and platform technology development. As of June 30, 2022, we had more than 1,500 product development programs in active development across our businesses.
Long-Duration Relationships Provide Sustainability
Our broad and diverse range of technologies closely integrates with our customers’ molecules to yield safe and effective final formulations and dose forms, and this generally results in the inclusion of Catalent in our customers’ prescription product regulatory filings. Both factors translate to long-duration supply relationships at an individual product level, to which we apply our expertise in contracting to produce long-duration commercial supply agreements. These agreements typically have initial terms of three to seven years with regular renewals of one to three years (see “—Contractual Arrangements” for more detail). Approximately two-thirds of our fiscal 2022 net revenue from our product development and delivery offerings and related services were covered by such long-term contractual arrangements. We believe this base provides us with a sustainable competitive advantage.
Significant Recent Growth Investments
We have made over time, and expect to continue to make, significant investments in our manufacturing network, which is capable of serving customers and patients worldwide, and today employ approximately 8 million square feet of manufacturing, laboratory, and related space across four continents. We have deployed approximately $2.21 billion in the last five fiscal years in gross capital expenditures, not including approximately $4.06 billion spent in acquiring new facilities and businesses. Growth-related investments in facilities, capacity, and capabilities across our businesses have positioned us for future growth in areas aligned with anticipated future demand, including in pDNA, cell and gene therapies, fill and finish for injectable drugs and biologics, and other new therapeutic modalities. Through our focus on operational, quality, and regulatory excellence, we drive continuous improvements in safety, productivity, sustainability and reliable supply, which we believe further differentiate
us. Our manufacturing network and capabilities allow us the flexibility to reliably supply the changing needs of our customers while consistently meeting their quality, delivery, sustainability, and regulatory compliance expectations.
High Standards of Regulatory Compliance and Operational and Quality Excellence
We operate our plants in accordance with current good manufacturing practices (“cGMP”) or other applicable requirements, following our own high standards that are consistent with those of many of our large global pharmaceutical and biotechnology customers. We have approximately 1,900 employees around the globe focused on quality and regulatory compliance. All of our facilities are registered where required with the FDA or other applicable regulatory agencies, such as the European Medicines Agency (the “EMA”). In many cases, our facilities are registered with multiple food, drug, or biologics regulatory agencies around the world. In fiscal 2022, we were subject to 54 regulatory audits, and, over the last five fiscal years, we successfully completed approximately 300 regulatory audits. We also undergo more than 700 customer and internal audits annually. We believe our quality and regulatory track record to be a favorable competitive differentiator.
Strong and Experienced Management Team
Our executive leadership team collectively has approximately 600 years of combined and diverse experience within the pharmaceutical and healthcare industries. With an average of approximately 29 years of functional experience, this team possesses deep knowledge and a wide network of industry relationships.
Our Strategy
Our strategic ambition, guided by and operationalized through our values, is to power the innovation and growth of the life science industry by becoming its leading development and commercial partner in reliable supply, conventional and advanced technologies, first-to-scale innovation, and therapeutic modalities, and integrated solutions. To achieve this, we continue to pursue the following key growth initiatives:
Capabilities & Capacity — Continued Expansion in Biologics and Other Attractive Markets
Recognizing the strategic importance of protein-based biologics, cell and gene therapies, pDNA, and other new biopharmaceutical modalities, we began to build a differentiated biologics platform in 2002. Since 2017, we have invested over $4.23 billion in our biologics business, including capital investments and approximately $2.81 billion for acquisitions of biologics-focused businesses and sites. Today, we are a recognized leader in biologics, including AAV vectors for gene therapies; development and supply for cell therapies; advanced cell-line development; formulation and fill-finish into vials, pre-filled syringes, and cartridges; specialized manufacturing of biologic drug substances; and bioanalytical analysis. We have partnered with customers from around the world to develop advanced cell expression for more than 1,000 cell lines, many using our advanced GPEx, GPEx Boost, and GPEx Lightning technologies, and have actively collaborated on developing and scaling up more than 125 cell and gene therapies. In the last two fiscal years, we expanded our existing cell therapy development and manufacturing capabilities and began offering pDNA production services. In the same period, we acquired a commercial-scale cell therapy manufacturing facility in Princeton, New Jersey, a developer and manufacturer of iPSCs located near Dusseldorf, Germany, and a manufacturing facility for biologic therapies and vaccines near Oxford, U.K. We have also invested in a second-generation ADC technology, SMARTag, and see continued progress in this technology’s capabilities and our customers’ SMARTag product-development activities.
In addition to our expansion in biologics, we have invested additional capital in several other existing facilities in order to expand in attractive markets, including ongoing significant expansion of our oral solid controlled release production capacity in Winchester, Kentucky, and the scaling-up of commercial manufacturing capacity for our next-generation orally disintegrating tablet (“ODT”) technology, Zydis Ultra. We have also added specialized new capabilities and capacity in early development over the last several fiscal years. We acquired a leading position in consumer-preferred gummy and soft-chew formats for consumer health products with our acquisition of Bettera Holdings, LLC (“Bettera Wellness”) in fiscal 2022. We expanded our capacity for oral and injectable products via our fiscal 2020 acquisition of a facility in Anagni, Italy, and our capacity for spray dried dispersion and dry powder inhaler manufacturing via our fiscal 2021 acquisition of a facility located near Boston, Massachusetts.
Use Our Proprietary Technologies and Substantial Expertise to Help Our Customers Develop New Products
We have broad and diverse technology platforms that are supported by deep scientific expertise, extensive know-how, and more than 1,400 patents and patent applications in approximately 140 families across advanced delivery, drug and biologics formulation, and manufacturing. For example, we have significant softgel fill and formulation know-how, databases of formulated products, and substantial softgel regulatory approval expertise. As a result, approximately 90% of approvals by the FDA over the last 25 years of new chemical entities presented in a softgel format have been developed and supplied by us.
In addition to resolving delivery challenges for our customers’ products, we apply our technology platforms and development expertise to proactively develop proof-of-concept products, whether improved versions of existing drugs, new generic formulations, or innovative consumer health products. In the consumer health area, we file product dossiers with regulators in relevant jurisdictions for self-created products, which help contribute sustainable growth to our consumer health business. We expect to continue to seek proactive development opportunities and other non-traditional relationships to increase demand for and value realized from our technology platforms. These activities have provided us with opportunities to capture an increased share of end-market value through out-licensing, profit-sharing, and other arrangements.
Operational Leverage — Deploy Existing Infrastructure and Operational Discipline to Drive Profitable Growth
Through our existing infrastructure, including our global network of operating locations and programs, we promote operational discipline and drive margin expansion. With our active focus on continuous improvement and sustainability enhancement, global procurement function, and conversion cost productivity metrics in place, we have created a culture of functional excellence and cost accountability. Along with the ongoing increase in the share of revenues from higher margin biologics offerings, we expect this discipline to further leverage our operational network for profitable growth. Since fiscal 2017, we have expanded gross margin by 250 basis points and Adjusted EBITDA margin by over 400 basis points. Note that “Adjusted EBITDA” is a financial metric that is not prepared in accordance with the accounting principles generally accepted in the U.S. (“U.S. GAAP”), and that further explanations of this measure and comparisons to the most directly comparable U.S. GAAP measures are set forth below at “Management’s Discussion and Analysis of Financial Condition and Results of Operations—Non-GAAP Metrics.”
Strategic Acquisitions and Licensing — Build on our Existing Platform
We operate in the markets for outsourced development solutions and commercial supply, where we estimate current spending at approximately $70 billion globally. Our broad platform, global infrastructure, and diversified customer portfolio provide us with a strong foundation from which to consolidate within these markets, to enter new markets, and generate operating leverage through acquisitions. Since fiscal 2013, we have executed 21 transactions, investing approximately $4.44 billion, and have demonstrated an ability to efficiently and effectively integrate these acquisitions.
While we are rigorously focused on driving our organic growth, we have in recent years substantially increased our participation in biologics, including protein-based biologics, cell and gene therapies, pDNA production, and drug product fill and finish, via strategy-driven inorganic transactions. We intend to continue opportunistically to source and execute strategic acquisitions within our existing business areas, as well as to undertake transactions that provide us with expansion opportunities within emerging treatment modalities, new geographic markets, or related market segments. We have a dedicated corporate development team in place to identify these opportunities and have a rigorous and financially disciplined process for evaluating, executing, and integrating such acquisitions.
“Follow the Molecule”® by Providing Solutions to our Customers across all Phases of the Product Lifecycle
We intend to continue to use our development and manufacturing solutions across the entire lifecycle of our customers’ products to drive future growth. Our development solutions span the drug development process, starting with our platforms for early pre-clinical development of small molecules, protein-based biologics, and cell and gene therapies; through formulation and analytical services, development and manufacturing of clinical trial supplies, and fill and finish of injectable products; to regulatory consulting. Once a molecule is ready for clinical trials and subsequent commercialization, we provide our customers with a range of advanced technologies and expert, state-of-the-art manufacturing solutions that allow them to deliver their molecules to the end-users in safe, effective, and, in some cases, patient-preferred dosage forms, and to produce biologic drug substances needed for protein-based biologics and cell and gene therapies. Our relationship with a molecule typically starts with developing and manufacturing the innovator product and can extend throughout the molecule’s commercial life. For prescription products, we are typically the sole or primary outsourced provider and are frequently reflected in customers’ product approval applications. Our revenue from our development and manufacturing activities are primarily driven by volumes, and, as a result, the loss of an innovator drug’s market exclusivity may be mitigated if we supply customers offering generic or biosimilar equivalents.
An example of the long and mutually productive relationships we foster can be found in a leading over-the-counter anti-allergy brand, which today uses both our Zydis ODTs and our Liqui-Gels softgel technology. We originally began development of the prescription format of this product for our multinational pharmaceutical company partner in 1992 to address specific patient sub-segment needs. After four years of development, we then commercially supplied the prescription product in our Zydis ODT format for six years, and we have continued to provide the Zydis form since the switch to over-the-counter status in the U.S. and other markets in the early 2000s. Subsequently, we proactively brought a softgel product concept for the brand to
the customer, which the customer elected to develop and launch as well. By following this molecule, we have built a strong, 30-year-long relationship across multiple formats and markets.
Customer Product Pipeline — Continuing to Grow Through New Projects and Product Launches
We intend to continue to supplement our existing diverse base of commercialized customer products with new development programs. As of June 30, 2022, our product development teams were working on more than 1,500 active customer development programs. Our base of active development programs has expanded in recent years from growing market demand, as well as from our expanded capabilities and technology platforms. Although there are many complex factors that affect the development and commercialization of pharmaceutical, protein-based biologic, cell and gene therapy, and consumer health products, we expect that a portion of these programs will reach full development and market approval in the future and thereby add to our long-duration commercial revenues under long-term contracts and grow our existing product base. In fiscal 2022, we introduced 153 new products for our customers.
Catalent continues to be a leader in providing chemistry, manufacturing, and controls-based product development services to the global pharmaceutical, biotechnology, and consumer health industries, driven by thousands of projects annually. In fiscal 2022, we recognized $2.36 billion of net revenue related to the development of products, up 34% from the prior year. In addition, substantially all of the revenue associated with the Clinical Supply Services segment relates to our support of customer products in development.
Our Reporting Segments
In fiscal 2022, we operated in four operating segments, which also constitute our four reporting segments: Biologics, Softgel and Oral Technologies, Oral and Specialty Delivery, and Clinical Supply Services, as further described below. Immediately following the end of fiscal 2022, we adopted a new operating structure, with two operating segments: (1) Biologics, and (2) Pharma and Consumer Health (discussed further in Note 20, Subsequent Events to our Consolidated Financial Statements). Set forth below is a summary description of our four fiscal 2022 segments.
Biologics
Our Biologics segment provides development and manufacturing for protein, pDNA, mRNA, cell therapy, viral vaccines and viral-based gene therapies; formulation, development, and manufacturing for parenteral dose forms, including vials, prefilled syringes, and cartridges; and analytical development and testing services for large molecules. The business has extensive expertise in development, scale up, and commercial manufacturing. Representative customers of Biologics include Moderna, Johnson & Johnson, BMS, AstraZeneca, and Sarepta Therapeutics, along with a broad range of innovative small and mid-tier biopharmaceutical customers.
Our growing biologics offering includes cell-line development based on our advanced, patented GPEx suite of technologies, which are used to develop stable, high-yielding mammalian cell lines for both innovator and biosimilar biologic compounds. GPEx technology can provide rapid cell-line development, high biologics production yields, flexibility, and versatility. Our development and manufacturing facility in Madison, Wisconsin has the capability and capacity to produce cGMP quality biologics drug substance from 250L to 4000L scale using single-use technology to provide maximum efficiency and flexibility. Our Bloomington, Indiana facility brings additional biologics development, clinical, and commercial drug substance manufacturing, and formulation capabilities and capacity. Both Bloomington and our Anagni, Italy facility add substantial capacity for finished-dose biologics drug product manufacturing and packaging. We have continued to expand drug substance production capacity in Madison, bringing on-line fourth and fifth manufacturing suites, and have expanded drug product manufacturing and packaging capacity in Bloomington and Anagni. We recently acquired a new facility near Oxford, U.K., which will house development and manufacturing capabilities for proteins, nucleic acid therapeutics and other advanced modalities. Our SMARTag next-generation ADC technology, based in Emeryville, California, is a clinical-stage technology that enables development of ADCs and other protein conjugates with improved efficacy, safety, and manufacturability.
At our pDNA, cell therapy, and gene therapy global centers of excellence in Belgium, Maryland, New Jersey, and Texas, we develop and manufacture advanced therapeutics, including CAR-T, AAV, lentivirus, oncolytic virus and other cell or virus modalities together with critical pDNA biological starting material for cell, mRNA, and viral-based therapies and next-generation vaccines. Through continued inorganic investment in fiscal 2022, we acquired a fully operational, commercial-scale cell therapy campus in Princeton, New Jersey with 16 suites available for both autologous and allogeneic clinical and commercial manufacturing with potential further expansion. The Princeton, New Jersey campus works in conjunction with our Gosselies, Belgium cell therapy center of excellence, our iPSC manufacturing center of excellence in Dusseldorf Germany, and our clinical cell therapy center of excellence in Houston, further expanding our global cell therapy footprint. Additionally, we expanded our gene therapy flagship manufacturing campus in Harmans, Maryland with the addition of three commercial-scale viral vector suites, creating a total of 18 penthouse-style suites on the campus. At our gene therapy development campus in
Maryland, we expanded our portfolio with the release of the UpTempo Virtuoso™ AAV platform that reduces AAV development time by half, providing an advantage to our innovator customers across expanded gene therapy indications, enabling them to reach first-in-human studies faster. Our specialized expertise in AAV vectors, the most commonly used delivery system for gene therapies and iPSCs for next-generation allogeneic cell therapy manufacturing, together with our expanded global cell therapy manufacturing, capacity for clinical- through commercial-scale batches, and our expanded capabilities in mRNA and pDNA manufacturing, position us to capitalize on strong industry demand and expansions in treatment indications and the use of newer modalities in the cell and gene therapy market.
Our range of injectable manufacturing offerings includes manufacturing drug substance and filling small molecules or biologics into vials, syringes, and cartridges, with flexibility to accommodate other formats within our existing network. In addition to primary packaging, our network provides secondary packaging capabilities, including auto-injector and safety device assembly for commercial launch and life-cycle management. Our clinical supply services business provides a global network for clinical distribution, as well as labeling, packaging and cold-chain storage for clinical trial and commercial supply of biotherapeutics and cell and gene therapies. Our fill and finish services are largely focused on complex pharmaceuticals and biologics. With our range of technologies, we are able to meet a wide range of specifications, timelines, and budgets. We believe that the complexity of the manufacturing process, the importance of experience and know-how, regulatory compliance, and substantial capital requirements provide us with a meaningful competitive advantage in the market.
We also offer analytical development and testing services for large molecules, including bioassay, biophysical characterization, and cGMP release and stability testing. Our OneBio Suite provides customers the potential to seamlessly integrate drug substance, drug product, and clinical supply management for products in development, and for integrated commercial supply across both drug substance and drug product. We provide a broad range of technologies and services supporting the development and launch of new biologic entities, biosimilars, biobetters, and cell and gene therapies to bring a product from gene to commercialization, faster.
Our Biologics segment represented 53%, 48%, and 33% of our aggregate net revenue before inter-segment eliminations for fiscal 2022, 2021, and 2020, respectively.
Softgel and Oral Technologies
Through our Softgel and Oral Technologies segment, we provide formulation, development, and manufacturing services for soft capsules, or “softgels,” as well as large-scale manufacturing of oral solid dose forms for pharmaceutical and consumer health markets, along with supporting ancillary services. Following our fiscal 2022 acquisition of Bettera Wellness, we also provide formulation, development, and manufacturing of various experiential dose forms for the delivery of dietary supplements and other nutraceuticals.
Our softgel manufacturing technology was first commercialized by our predecessor in the 1930s, and we have continually enhanced the platform since then. We are the market leader in overall softgel development and manufacturing and hold the leading market position in innovator drug softgels. Our principal softgel technologies include traditional softgel capsules, in which the shell is made of animal-derived gelatin, and Vegicaps and OptiShell capsules, in which the shell is made from plant-derived materials. Softgel capsules are used in a broad range of customer products, including prescription drugs, over-the-counter medications, dietary supplements, unit-dose cosmetics, and animal health medicinal preparations. Softgel capsules encapsulate liquid, paste, or oil-based formulations of active compounds in solution or suspension within an outer shell. In the manufacturing process, the capsules are formed, filled, and sealed simultaneously. We typically perform encapsulation for a product within one of our softgel facilities, with active ingredients provided by customers or sourced directly by us. Softgels have historically been used to solve formulation challenges or technical issues for a specific drug, to help improve the clinical performance of compounds, to provide important market differentiation, particularly for over-the-counter medications, and to provide safe handling of hormonal, highly potent, and cytotoxic drugs. We also participate in the softgel vitamin, mineral, and supplement business in selected regions around the world. Our plant-derived softgel shells, available as Vegicaps and OptiShell capsules, allow innovators and consumer health customers to extend the softgel dose form to a broader range of active ingredients and serve patient and consumer populations that were previously inaccessible due to religious, dietary, or cultural preferences. Our Vegicaps and OptiShell capsules are protected by patents in most major global markets. Physician and patient studies we have conducted have demonstrated a preference for softgels versus traditional tablet and hard capsule dose forms in terms of ease of swallowing, real or perceived speed of delivery, ability to remove or eliminate unpleasant odor or taste, and, for physicians, perceived improved patient adherence with dosing regimens.
Our large-scale cGMP manufacturing of oral solid dose forms typically includes late-stage clinical trial supplies, registration batches, and commercial production across a broad range of formats, and may also involve finished dose packaging or advanced processing of intermediates to achieve the desired clinical performance of the prescription or over-the-counter pharmaceutical product. Finished dose forms include traditional and advanced complex oral solid-doses, including coated and uncoated tablets, pellet/bead/powder-filled two-piece hard capsules, granulated powders, and other immediate and modified
release forms. Advanced intermediate processing may include coating, extrusion, or spheronization to achieve specific functional outcomes, including site- or time-specific drug release, taste masking, or enhanced bioavailability. We have deep experience at managing complex technical transfers of clinical or commercial programs, whether from Catalent’s early development network in the Oral and Specialty Delivery segment, other contract development sites, or from customers directly.
We conduct formulation, development, and manufacturing of gummies, soft chews, and lozenges in a variety of sizes and shapes serving the dietary supplements market at four facilities in the United States. We use dietary and food ingredients provided by our customers or sourced directly by us, and we also provide ancillary services such as analytical testing and packaging.
Representative customers of Softgel and Oral Technologies include Pfizer, Novartis, Bayer, GlaxoSmithKline, and Procter & Gamble.
Our Softgel and Oral Technologies segment represented 26%, 25%, and 34% of our aggregate net revenue before inter-segment eliminations for fiscal 2022, 2021, and 2020, respectively.
Oral and Specialty Delivery
Our Oral and Specialty Delivery segment provides advanced analytical and formulation development and manufacturing across a range of technologies along with integrated downstream clinical development and commercial supply solutions. The technologies cover a broad range of oral (including our proprietary fast-dissolve Zydis tablets and many bioavailability enhancement technologies for both immediate and controlled-release tablets and capsules), respiratory and inhaled dose forms, including metered dose inhalers, dry powder inhalers, and nasal delivery devices.
Our oral delivery solutions platform provides comprehensive pre-clinical screening, formulation, and analytical development, and cGMP manufacturing at both clinical and commercial scale for both traditional and advanced complex oral solid-dose formats. We have substantial proven experience in developing and scaling up orphan and rare disease oral products, especially those requiring accelerated development timelines, solubility enhancement, specialized handling (e.g., potent or controlled substance materials), complex technology transfer and specialized manufacturing processes. We provide spray drying, hot melt extrusion, micronization, and lipid formulation capabilities, all of which are used to enhance a drug’s bioavailability and clinical performance. We offer comprehensive analytical method development and scientific capabilities, including stability testing and global regulatory services to support both fully integrated development programs or standalone fee-for-service work. In recent years, we have expanded our network of early development sites focused on earlier phase compounds (i.e., pre-clinical and Phase I) to engage with more customer molecules earlier in their development, with the intent to also support these molecules downstream as they progress towards commercial approval and supply. Demand for our offerings is driven by the need for scientific expertise, the depth and breadth of integrated services offered, as well as the reliability of our supply performance across quality and operational parameters.
Our ODT business began with the introduction of Zydis, a unique proprietary freeze-dried tablet that disintegrates in the mouth, without water, typically in less than three seconds. The platform is often used for drugs that benefit from rapid oral dissolution and buccal absorption and for drugs for specialized patient groups, including geriatric or pediatric populations, that have difficulty swallowing (dysphagia). We can adapt the Zydis technology to a wide range of molecules and indications, including prescription treatments for a variety of central nervous system-related conditions such as migraine, Parkinson’s disease, and schizophrenia, and also for a range of consumer healthcare products targeting broader indications such as pain or allergy relief. We continue to invest in and develop Zydis ODTs in different ways with our customers as we extend the application of the technology to new therapeutic categories, including immunotherapy, vaccines, and biologic molecule delivery.
Our respiratory platform provides integrated molecule screening, formulation development, and commercial manufacturing services for inhaled products delivered via metered dose inhalers, dry powder inhalers, and intra-nasal sprays. Delivery of these inhaled combination device products requires specialized capabilities to account for both the molecule and the device, to ensure accurate repeatable dose delivery.
Representative customers of Oral and Specialty Delivery include Johnson & Johnson, Pfizer, Bayer, AbbVie, and Biohaven, along with many small and mid-sized emerging biopharma companies involved in the clinical development space.
Our Oral and Specialty Delivery segment represented 13%, 17%, and 22% of our aggregate net revenue before inter-segment eliminations for fiscal 2022, 2021, and 2020, respectively.
Clinical Supply Services
Our Clinical Supply Services segment provides manufacturing, packaging, storage, distribution, and inventory management for small-molecule drugs, protein-based biologics, and cell and gene therapies in clinical trials. We offer customers flexible solutions for clinical supplies production and provide distribution and inventory management support for both simple and complex clinical trials. This includes over-encapsulation where needed; supplying placebos, comparator drug procurement, and clinical packages and kits for physicians and patients; inventory management; investigator kit ordering and fulfillment; and return supply reconciliation and reporting. We support trials in all regions of the world through our facilities and distribution network. In recent years, we have continued to expand and extend our network, with significant expansions at our Philadelphia, Pennsylvania and Shanghai China free trade zone locations and new facilities in California, China, and Japan. We also continue to develop new solutions for the evolving clinical trial environment, including FlexDirect direct-to-patient, CT Success clinical supply planning, and extensive cold chain investments. We are the leading provider of integrated development solutions and one of the leading providers of clinical trial supplies.
Representative customers of Clinical Supply Services include Eli Lilly, AbbVie, Beigene, Johnson & Johnson, and Incyte Corporation.
Our Clinical Supply Services segment represented 8%, 10%, and 11% of our aggregate net revenue before inter-segment eliminations for fiscal 2022, 2021, and 2020, respectively.
Integrated Development and Product Supply Chain Solutions
In addition to our proprietary offerings, we are also differentiated in the market by our ability to bring together our development solutions and state-of-the-art product manufacturing to offer integrated development and product supply solutions that can be combined or tailored in many ways to enable our customers to take their drugs, biologics, and consumer health products from laboratory to market, faster. Once a product is on the market, we can provide comprehensive, integrated product supply, from the sourcing or supply of the bulk active ingredient to comprehensive manufacturing and packaging, to the testing required for release, and to cold-chain or ambient temperature distribution. The customer- and product-specific solutions we develop are flexible, scalable, and creative, so that they meet the unique needs of both large and emerging biopharma and consumer health companies and are appropriate for products of all sizes. We believe that our development and product supply solutions, such as OptiForm Solution Suite and OneBio Suite, will continue to contribute to our future growth.
Sales and Marketing
Our target customers include large pharmaceutical and biotechnology companies, mid-size, emerging, and specialty pharmaceutical and biotechnology companies, and consumer health companies, along with companies in other selected healthcare market segments such as animal health and medical devices, and companies in adjacent industries, such as cosmetics. We have longstanding, extensive relationships with leading pharmaceutical, biotechnology, and consumer health customers. In fiscal 2022, we did business with 87 of the top 100 branded drug marketers, 21 of the top 25 generics marketers, 24 of the top 25 biologics marketers, and 21 of the top 25 consumer health marketers globally, as well as with more than 1,200 other customers. Faced with access, pricing, and reimbursement pressures as well as other market challenges, large pharmaceutical and biotechnology companies have increasingly sought partners to enhance the clinical competitiveness of their drugs and biologics and improve the productivity of their research and development activities, while reducing their fixed cost bases. Many mid-size, emerging, and specialty pharmaceutical and biotechnology companies, while facing the same pricing and market pressures, have chosen not to build a full infrastructure, but rather to partner with other companies through licensing agreements or outsourcing to access the critical skills, technologies, and services required to bring their products to market. Consumer health companies require rapidly developed, innovative dose forms and formulations to keep up with the fast-paced over-the-counter medication, dietary supplement, and personal care markets. These market segments are all important to our growth, but require distinct solutions, marketing and sales approaches, and market strategy.
We follow a hybrid demand-generation organization model, with strategic account teams offering the full breadth of Catalent’s solutions, and technical specialist teams providing the in-depth technical knowledge and practical experience essential for each individual offering, both supported by dedicated team of deeply experienced scientific advisors. Our sales organization currently consists of approximately 190 full-time, experienced sales professionals, supported by inside sales and sales operations. We also have built a dedicated strategic marketing team, providing strategic market and product planning and management for our offerings. As part of our marketing efforts, we participate in major trade shows relevant to our offerings globally and ensure adequate visibility to our offerings and solutions through a comprehensive print and on-line advertising and publicity program. We believe that Catalent is a strong brand with high overall awareness in our established markets and universe of target customers, and that our brand identity is a competitive advantage for us.
Global Accounts
We manage select accounts globally due to their substantial current business or growth potential. We recorded approximately 43% of our total net revenue in fiscal 2022 from these global accounts. Each global account is assigned a lead business development professional with substantial industry experience. These account leaders, along with other members of the sales and executive leadership teams, are responsible for managing and extending the overall account relationship. Account leaders work closely with the rest of the sales organization as well as operational, quality, and project management personnel to ensure alignment around critical priorities for the accounts.
Emerging, Specialty, and Virtual Accounts
Emerging, specialty, and virtual pharmaceutical and biotechnology companies are expected to be critical drivers of industry growth globally and account for more than three-quarters of the active drug and biologic development pipeline. Historically, many of these companies have chosen not to build a full infrastructure, but rather partner with other companies to formulate, develop, analyze, test, and manufacture their products. We expect them to continue to do so in the future, providing a critical source for future integrated solutions demand. We expect to continue to increase our penetration of geographic clusters of emerging companies in North America, Europe, Central and South America, and Asia. We regularly use active pipeline and product screening and customer targeting to identify the optimal candidates for partnering based on product profiles, funding status, and relationships, to ensure that our technical sales specialists and field sales representatives develop custom solutions designed to address the specific needs of these customers. In order to reach these emerging, specialty, and virtual companies, we actively partner with leading venture capital investors and biotech incubators.
Seasonality; Fluctuations in Operation Results
Our annual financial reporting period ends on June 30. Excluding the impact from COVID-19, as discussed further in "Item 7 - Management's Discussion and Analysis of Financial Condition and Results of Operations - Factors Affecting our Performance," our revenue and net earnings are generally higher in the third and fourth quarters of each fiscal year, with our first fiscal quarter typically generating our lowest revenue of any quarter, and our last fiscal quarter typically generating our highest revenue. These fluctuations are primarily the result of the timing of our, and our customers’, annual operational maintenance periods at locations in the U.S. and Europe, the seasonality associated with pharmaceutical and biotechnology budgetary spending decisions, clinical trial and research and development schedules, the timing of new product launches and length of time needed to obtain full market penetration, and, to a lesser extent, the time of the year some of our customers’ products are in higher demand.
Contractual Arrangements
We generally enter into a broad range of contractual arrangements with our customers, including agreements with respect to feasibility, development, supply, licenses, quality, and confidentiality. The terms of these contracts vary significantly depending on the offering and customer requirements. Some of our agreements may include a variety of revenue arrangements, such as fee-for-service, unit pricing in one or more tiers, minimum volume commitments, royalties, manufacturing preparation services, profit-sharing, and fixed fees. We generally secure pricing and other contract mechanisms in our supply agreements to allow for periodic resetting of pricing terms, and, in some cases, these agreements permit us to raise or renegotiate pricing in the event of certain price increases for the raw materials we use to make products. Our typical supply agreements include indemnification from our customers for product liability and intellectual property matters and caps on our contractual liabilities, subject in each case to negotiated exclusions. The terms of our manufacturing supply agreements range from three to seven years with regular renewals of one to three years, although some of our agreements are terminable upon much shorter notice periods, such as 30 or 45 days. For our development solutions offerings, we may enter into master service agreements, which provide for standardized terms and conditions and make it easier and faster for customers with multiple development needs to access our offerings.
Backlog
While we generally have long-term supply agreements that provide for a revenue stream over a period of years, our backlog represents, as of a point in time, future service revenues from work not yet completed. For our Softgel and Oral Technologies, Biologics, and Oral and Specialty Delivery segments, backlog represents firm orders for manufacturing services and includes minimum volumes, where applicable. For our Clinical Supply Services segment, backlog represents estimated future service revenues from work not yet completed under signed contracts. Using these methods of reporting backlog, as of June 30, 2022, our backlog was $2,850 million compared to $3,767 million as of June 30, 2021, including $549 million and $501 million, respectively, related to our Clinical Supply Services segment. We expect to recognize as revenue by the end of fiscal 2023 approximately 80% of the value of the backlog in existence as of June 30, 2022.
To the extent projects are delayed, the timing of our revenue could be affected. If a customer cancels an order, we may be reimbursed for the costs we have incurred. For orders that are placed inside a contractual firm period or that involve minimum volume commitments, we generally have a contractual right to payment in the event of cancellation. Fluctuations in our reported backlog levels also result from the timing and order pattern of our customers, which often seek to manage their level of inventory on hand. Because of customer ordering patterns, the matters discussed in this paragraph, and other factors, our backlog reported for certain periods may fluctuate and may not be indicative of future results.
Manufacturing Capabilities
We operate manufacturing facilities, development centers, and sales offices throughout the world. As of June 30, 2022, we had 58 facilities (5 geographical locations operate as multiple facilities because they support more than one reporting segment, with one location including both a manufacturing facility and our corporate headquarters) on four continents with approximately 8 million square feet of manufacturing, laboratory, office, and related space. Our manufacturing capabilities generally include the full suite of competencies relevant to the support of each site’s activities, including regulatory, quality assurance, and in-house validation.
We operate our manufacturing facilities and development centers in accordance with cGMP or other applicable requirements. All of these sites are registered where required with the FDA or other applicable regulatory agencies, such as the EMA. In some cases, our sites are registered with multiple regulatory agencies.
We have invested $1.81 billion in our manufacturing and development facilities since fiscal 2020 for improvements and expansions, including $660 million in capital expenditures during fiscal 2022. We believe that our sites and equipment are in good condition, are well maintained, and are able to operate at or above present levels for the foreseeable future, in all material respects.
Our manufacturing operations are focused on employee health and safety, regulatory compliance, operational excellence, continuous improvement, and process standardization across the organization. In fiscal 2022, we achieved approximately 95% on-time shipment delivery versus customer request date across our network as a result of this focus. Our manufacturing operations are structured around an enterprise management philosophy and methodology that utilizes principles and tools common to a number of quality management programs, including Lean Six Sigma and Lean Manufacturing.
Raw Materials
We use a broad and diverse range of raw materials in the design, development, and manufacture of our products. This includes, but is not limited to, key materials such as gelatin, starch, and iota carrageenan; packaging films; single-use production components for drug substance production, and glass vials and syringes for drug product. The raw materials that we use are sourced externally on a global basis. Globally, our supplier relationships could be interrupted due to natural disasters and international supply disruptions, including those caused by pandemics or geopolitical and other issues. For example, commercially usable gelatin is available from a limited number of sources. In addition, much of the gelatin we use is bovine-derived. Past concerns of contamination from Bovine Spongiform Encephalopathy (“BSE”) have narrowed the number of possible sources of particular types of gelatin. If there were a future disruption in the supply of gelatin from any one or more key suppliers, there can be no assurance that we could obtain an alternative supply from our other suppliers. Any future restriction that were to emerge on the use of bovine-derived gelatin from certain geographic sources due to concerns of contamination from BSE could hinder our ability to timely supply our customers with products and the use of alternative non-bovine-derived gelatin for specific customer products could be subject to lengthy formulation, testing and regulatory approval periods.
We work very closely with our suppliers to assure continuity of supply while maintaining excellence in material quality and reliability. We continually evaluate alternate sources of supply, although we do not frequently pursue regulatory qualification of alternative sources for key raw materials due to the strength of our existing supplier relationships, the reliability of our current supplier base, and the time and expense associated with the regulatory process, since regulators usually must approve changes to prescription product ingredient sources. Although a change in suppliers could require significant effort or investment by us in circumstances where the items supplied are integral to the performance of our products or incorporate specialized material such as gelatin, we do not believe that the loss of any existing supply arrangement would have a material adverse effect on our business. See “Risk Factors—Risks Relating to Our Business and the Industry in Which We Operate—Our future results of operations are subject to fluctuations in the costs, availability, and suitability of the components of the products we manufacture, including active pharmaceutical ingredients, excipients, purchased components, and raw materials. In addition, the COVID-19 pandemic and the ongoing supply-chain disruptions triggered by a combination of the pandemic and the Ukrainian-Russian war may interfere with the operations of certain of our direct or indirect suppliers or with
international trade for these supplies, which may either raise our costs or reduce the productivity or slow the timing of our operations."
Competition
We compete with multiple companies as to each of our offerings and in every region of the globe in which we operate, including with other companies that offer conventional and advanced technologies for the development, supply, and delivery of medicinal products, clinical trials support, outsourced dose form, protein-based biologics or cell or gene therapy manufacturing, or development services to pharmaceutical, biotechnology, and consumer health companies based in North America, Central and South America, Europe, and the Asia-Pacific region. We also compete in some cases with the internal operations of those pharmaceutical, biotechnology, and consumer health customers that also have manufacturing capabilities and choose to source these services internally. Some of our competitors are substantially larger than we are and have access to more substantial resources, which could be deployed to expand their range of offerings or capacity.
Competition is driven by proprietary technologies and know-how (where relevant), capabilities, consistency of operational performance, availability of equipment, quality, price, value, responsiveness, and speed. While we have competitors that compete with us in our individual offerings, and a few competitors that compete across many of our offerings, we do not believe we have competition from any directly comparable company.
Research and Development Costs
Our research activities are primarily directed toward the development of new offerings and manufacturing process improvements. Research and development costs amounted to $23 million, $21 million, and $21 million for fiscal 2022, 2021, and 2020, respectively.
Employees
As of June 30, 2022, we had approximately 19,000 individuals providing services to us at 58 facilities on 4 continents, of which certain employees at two of our 27 U.S. facilities are represented by a labor union, with their terms and conditions of employment being subject to collective bargaining agreements. Some combination of national works councils, labor unions, and other labor organizations is active at all of our European facilities consistent with labor environments and laws in European countries. Similar relationships with labor organizations or national works councils exist at our plants in Argentina, Brazil, and Canada. Our management believes that our relations with our workforce are satisfactory. Most of our individual service providers are full-time employees, while approximate 1,100 of our workers as of June 30, 2022 are contingent workers who are either self-employed or employed by external services organizations.
| | | | | | | | | | | | | | | | | |
| North America | Europe | South America | Asia Pacific | Total |
| Approximate number of workers as of June 30, 2022 | 11,700 | 5,700 | 1,000 | 600 | 19,000 |
Human Capital Management
Our employees share common goals: to put patients first and to help people around the world live better, healthier lives. Our global workforce is united by our values: Patient First, commitment to our people, customer dedication, innovation, integrity, and excellence. Together, our values provide the foundation for our culture. We believe that an engaged, diverse workforce, empowered by inclusive leaders, will unlock our full potential as a company and as a leader in our sector. Our employees’ success is Catalent’s success.
We focus on employee development, engagement, and diversity and inclusion (“D&I”) to hire, develop, and retain the best talent. As of June 30, 2022, we had nearly 19,000 individuals providing services to us globally, with women representing 44% of our employees and holding 39% of roles at the manager level or higher. In fiscal 2022, ethnically diverse talent represented 32% of our U.S. employees.
Catalent, like many others, experienced the effects of "the great resignation," in fiscal 2022. Our turnover rate increased to 19% as of June 30, 2022, including 15% voluntary turnover, substantially driven by voluntary turnover in the U.S. Reducing attrition is now one of our top priorities. We continue to implement initiatives to build upon our values-based and inclusive culture, improve our employees' experiences at Catalent, and better develop and engage internal talent. We continuously monitor local talent markets and provide differentiated pay arrangements and benefits to attract and retain talent. Additionally, we provide flexible work arrangements where possible, broader leadership development programs, an employee wellness program, and access to employee recognition programs at all levels.
We continue to take steps to assure that Catalent is a company where all employees can develop a fulfilling career with support from our leadership team. We believe that our diverse pool of internal talent and our employees’ passion for excellence make a difference in the way we grow and deliver results.
Talent Acquisition
We have strong human resources processes and practices in place to support our employees through their careers at Catalent. This starts with an aggressive recruiting strategy and a strong employer brand. We attracted more than 4,600 new employees in fiscal 2022, continuously working to reduce the time it takes to fill open positions and reduce our cost per hire, while striving for a best-in-class candidate experience.
We offer competitive compensation and a comprehensive suite of benefits, which, in the U.S., range from medical, dental, and vision coverage to retirement, disability, employee stock purchase, and life insurance programs, we also provide health promotion and wellness programs, remote work flexibility, tuition assistance, and employee assistance programs in several countries.
Our recruitment strategy aims to attract talent representing diverse backgrounds, perspectives, and ideas. This approach includes:
• engaging with potential top talent early in the career path through our college internship program;
• developing future leaders and enhancing their skills through several programs, including various mentoring programs and our Global Organization Leadership Development (“GOLD”), Next Generation Global Leaders, and General Manager Excellence programs, as discussed further below;
• providing competitive compensation and benefits;
• continuously improving recruitment processes and platforms;
• working with several recruitment partners to attract diverse profiles and advertise open positions; and
•incorporating unconscious bias workshops for hiring managers.
Catalent was recognized as a TOP EMPLOYER USA for 2020, 2021, and 2022 and as a TOP EMPLOYER in the U.K. in 2022. We differentiate ourselves as a preferred employer to candidates through our reputation as a great place to work, offering a fast-paced work environment, and as a result of our continued role as a critical part of the global biopharmaceutical effort to combat the COVID-19 pandemic.
Talent Development
We are also committed to the growth, development, and engagement of our people once they have joined our family. Through a strong learning and development culture, we provide opportunities for specialized technical training, leadership development, and high-potential growth opportunities to endow our employees with the knowledge and expertise needed to grow their careers here.
Our primary goal is to develop our people from within, thereby establishing a strong successor bench to help support company growth. In fiscal 2022, over 3,400 employees moved to a new role within the organization, (of which 47% were women) whether as a developmental move or a promotion to a more senior position. Our senior leaders are committed to talent development and dedicate time each fiscal quarter to perform formalized talent reviews to discuss the development of key talent and to update succession plans for critical roles.
We strongly believe that the combination of experience (70%), exposure (20%), and education (10%) is the best recipe for personal development and career progression here. We have a library of tools and resources available for our employees within that framework, including access to a variety of tools and resources to learn new or expand existing skills.
Given our growth and high volume of new hires, we continue to redesign our employee experience. We have upgraded our on-boarding experience to span employees' first twelve months with Catalent.
We also offer four formal development programs to employees. All programs aim to prepare our talent to fill critical internal leadership roles. Through these programs, we have created a bench of leaders who model our values and are ready to take on more responsibility.
(1) Entry-level GOLD program. The GOLD program is a two-year rotational program for recent graduates from universities around the world in which the employee participates in three rotations at different sites in our network
to learn about us and our varied offerings. GOLD employees receive assignments to perform strategic roles in key business initiatives. We provide them with coaching and opportunities to interact with senior executives, which both develop the skills and experience of our GOLD employees and provide a platform through which they contribute fresh ideas that challenge the status quo. The GOLD program operates in the U.S. and has been relaunched in Europe following a pause in the program during the U.K.'s withdrawal from the European Union ("E.U.").
(2) Manager-level Next Generation Global Leader program. Our Next Generation Global Leader program for employees at the manager level is a 15-month on-the-job program focused on preparing high-potential managers for director-level roles. In fiscal 2022, 39 employees graduated from this program and 47 new employees joined the program.
(3) Senior leader General Manager Excellence program. Our general managers run our operating sites and have substantial and wide-ranging responsibilities. This program enhances the skills of our general managers by giving them exposure to industry best practices and opportunities to network internally and receive personalized career coaching, including a 3-day business simulation. In fiscal 2022, 35 general managers were selected for this program and 24 additional general managers will start in fiscal 2023.
(4) Front-line leader level Lead Now program. Beginning in fiscal 2023, Lead Now is a Catalent-wide leadership offering targeted for those who are new to people leadership. During the first 3 months of a new leadership role, this program teaches employees the fundamentals of leadership and identifies tools to inspire their teams while role modeling Catalent values.
Diversity and Inclusion
At Catalent, we cultivate a workplace that respects and welcomes all people; celebrates the unique backgrounds and experiences of our workforce; encourages all employees to bring their true, authentic selves to work; and leverages our diversity to drive innovation, inclusion, and excellence in every aspect of our business. By closing diversity and inclusion gaps, we energize our people to do their best work.
Our commitment to D&I starts at the top with a diverse board of directors and an executive management team (representing 8 different countries around the world) that present a broad spectrum of backgrounds and perspectives. Our Global Office of Diversity & Inclusion (the “D&I Office”) oversees our D&I efforts globally, and reports to a Global D&I Council of executives and senior leaders from across Catalent. The work of the D&I Office is supported by regional D&I committees composed of leaders at a variety of levels who oversee the implementation of local programs around the world.
We are committed to identifying and acknowledging gaps in our D&I mission and taking action to address them. To drive progress within Catalent, we focus on four strategic initiatives:
• Strengthening our culture of inclusion, supported by our eight employee resource groups;
• Promoting inclusive leadership;
• Accelerating talent acquisition and development, including with support from external partners; and
• Activating a data- and accountability-driven strategy.
The D&I Office oversees our efforts, guided by our Global D&I Council. The Council coordinates with executive-led regional D&I committees to implement local programs. Our board of directors reviews our D&I strategy and progress at least twice a year.
Key D&I performance highlights are captured in our Corporate Responsibility and Environmental, Social, and Governance Strategy section below.
Engagement
Our employee-focused practices have made a clear impact on our employee engagement. Through increased engagement, we can grow our business by relying on strong, engaged leaders and professionals willing to ensure we can overcome and thrive during any challenge.
We periodically administer a company-wide engagement survey to garner direct feedback from our employees regarding how we can more deeply and meaningfully engage them, enabling us to focus on improving specific areas where we can
support our people. Our most recent engagement survey in fiscal 2021 showed overall improvement compared to the immediately prior survey taken two years earlier, with the most important improvement among the senior leadership and manager employee populations, and a notable increase in engagement as a result of our enhanced rewards and recognition programs.
We are changing our approach to employee engagement surveys and will launch a "pulse survey" approach in fiscal 2023, using artificial intelligence to deliver an updated engagement score at least every 6 months. The first pulse survey will be launched in the first half of fiscal 2023.
Our COVID-19 Response
We have continued to adapt our processes and policies during the COVID-19 pandemic in order to support our employees, customers, and our local communities.
We recognize that we have a unique responsibility to help respond to the COVID-19 pandemic and are committed to supporting and protecting our employees and their families, ensuring that our supply of COVID-19 related products and our other life-saving and life-enhancing products reach patients, contributing our scientific expertise to the continued development of COVID-19 treatments and vaccines, and supporting health care providers and the communities in which they serve. We continue to keep our employees safe by using the best-available expertise to modify our process flows and people movement, employing masks, physical barriers, and physical distancing when appropriate to minimize exposure. We communicate regularly with our leaders and operating personnel regarding our actions and motivations to assure transparency and the incorporation of useful suggestions from every level of the organization.
In response to the COVID-19 pandemic, we implemented virtual recruitment platforms and streamlined procedures to accelerate onboarding amid varying local guidelines and restrictions. We continue to ensure the safety of new hires through training on our COVID-19 protocols. We continue to provide employees with easy and regular access to information, including details regarding our COVID-19 tracking process, guidance around hygiene measures and travel, and best practices for working from home. We also provide extensive information to support our employees as they continue to make vaccination decisions.
Corporate Responsibility ("CR") and Environmental, Social, and Governance (“ESG”) Strategy
Our CR strategy, which includes our ESG strategy, is integrated into our company-wide strategic plan, ensuring that we operate in alignment with our values, meet our commitments to all our stakeholders, and contribute to the long-term success of the broader pharmaceutical, biopharmaceutical, and consumer health industries and the communities where we operate. Our approach to ESG focuses on three areas of society relevant to our business, prioritizing our impact on (i) people, (ii) the environment, and (iii) our communities. We focus on ESG areas that are the most significant to our business, and our strategy is informed by our employees, customers, investors, communities, and other key stakeholders. Our fiscal 2022 ESG performance, described below, demonstrates our contribution to the long-term success of the industries we serve and the communities where we operate, as we continue to invest in a corporate culture that understands and prioritizes our impact on people in our operations and employee-related decision-making.
Fiscal 2022 brought new and continued challenges for our operations, including the on-going response to global and local surges of the COVID-19 pandemic, the Ukrainian-Russian war, and the on-going supply chain challenges amid rising global inflation. Through it all, our mission and values continued to provide steady, critical orientation and focus. Amid these fiscal 2022 challenges, our business continued to expand as our workforce of nearly 19,000 across more than 50 sites worked hard, with our Patient First value guiding the way, to ensure that we met our commitments to our customers and their patients.
Our ESG performance demonstrates how we are contributing to the long-term success of the broader biopharmaceutical industry and the communities where we operate, as we continue to invest in a corporate culture that understands and prioritizes our impact on people in our operations and decision-making.
Governance
We are committed to ensuring strong corporate governance practices on behalf of our shareholders and other stakeholders. We believe strong corporate governance and an independent board of directors provide the foundation for financial integrity and shareholder confidence. More information about our corporate governance features can be found in our Proxy Statement for the 2022 Annual Meeting of Shareholders (the “Proxy Statement”), which will be filed within 120 days after June 30, 2022, the close of our fiscal year covered by this Annual Report.
In addition, we have established a CR council that reports to the CEO and is composed of senior leaders from various parts of our business. Our CR council guides our CR efforts and sets our overall CR strategy. Management, including members
of the CR Council, provide regular CR updates to our board of directors which regularly reviews material aspects of our CR strategy and performance as a full board and through its several committees, including a formal annual review of our overall CR strategy and performance.
Business Benefits
Beyond being the right thing to do, our focus on CR strengthens our business by reducing risks, meeting customer and investor expectations, and positioning us to attract top talent. CR performance is an important contributor to our business success. It informs our risk management process, protects our reputation, and alerts us to regulatory, environmental, and societal threats to our business. Our CR activities also align with many of our customers’ CR programs and strengthen our relationships.
Our future success depends on our highly skilled and dedicated global team of employees, who are passionate about improving health outcomes. We compete for top talent in our industry and recognize that our culture and reputation as a responsible company can be a differentiator for attracting job candidates and keeping and motivating our existing employees.
ESG progress in fiscal 2022
We made significant progress in several ESG focus areas in fiscal 2022.
•In March 2022, we published our third annual Corporate Responsibility report (covering fiscal 2021), which includes an evaluation of our performance against the standards set by the Sustainability Accounting Standards Board (SASB) for Biotechnology and Pharmaceuticals and, for the first time, the recommendations of the Task Force on Climate-Related Financial Disclosures (TCFD). Some highlights of our progress include:
•the achievement of our initial Scope 1 and 2 carbon reduction target and the establishment of a new science-based target to reduce Scope 1 and 2 emissions by 42% by 2030 (from a fiscal 2020 baseline);
•our commitment to new water efficiency and waste reduction targets for fiscal 2024;
•the initiation of a third-party human rights assessment, in line with the United Nations Guiding Principles on Business and Human Rights, and development of a follow-up plan to integrate key assessment recommendations into our operations and supply chain;
•philanthropic giving that exceeded $1 million, donated to communities and organizations supporting COVID-19 recovery and, our on-going commitment to science, technology, engineering, and math (STEM) education, and nonprofits that serve patients, with a focus on underserved communities;
•the launch and promotion of two new Catalent Cares programs: Employee Volunteer Grants and an Employee Relief Fund; and
•moderately increased diversity of Company leadership and expanded employee resource groups (ERGs), while recognizing that we have gaps that need to be closed.
•We experienced another year of philanthropic growth in fiscal 2022, inspired by our Company's and employees' response to the Ukrainian-Russian war. We also established a refugee working group that is mapping refugee communities to job opportunities at Catalent sites and further identifying more nonprofit partners to support relief and refugee efforts.
•We continued to drive D&I by (1) investing in the inclusive capabilities of our leaders, (2) working with partners who share our values and help enable our strategy, (3) accelerating diverse talent acquisition and development, and (4) curating an even more inclusive culture. Some highlights of our progress include:
•a significant increase in the number of employees of Latin or Hispanic heritage;
•an increase in the self-identification of employees with disability, non-binary genders, and veterans, demonstrating our increasingly inclusive and safe company culture;
•the completion of a new EDGE (women in the workplace (U.S.)) assessment and the integration of its findings into our D&I strategy, which assessment confirmed that Catalent has closed its gender pay gap in the U.S.;
•being named among the 2022 Best Places to Work for People with Disabilities, following submission to the Disability Equality Index;
•the growth of our strong ERG network by 25%;
•the publication of a supplier diversity policy; and
•the on-going rollout of our inclusive leadership workshops for site and functional leadership teams and conversations hosted by our leaders following challenging current events in the U.S.
Looking ahead
We are determined to play an integral role in moving our industry toward more responsible and sustainable business practices as we continue to be at the cutting edge of developing and reliably supplying drugs, biologics and consumer health products.
We continue to reduce our carbon emissions measured against our current Scope 1 and 2 science-based target reductions and will share our Scope 3 footprint and reduction plan by the end of fiscal 2023. We committed to new water and waste reduction goals by fiscal 2024, namely, to decrease water intensity to 500 cubic meters per $1 million in revenue, to eliminate waste sent to landfill at all of our facilities, and a bold goal to ensure no residual API above Predicted No Effect Concentration (PNEC) in our wastewater.
We will strengthen our supply chain by expanding our supplier assessment and auditing program, including continued use of our third-party vetting and due diligence platform in alignment with the Pharmaceutical Supply Chain Initiative (PSCI) principles and the U.N. Guiding Principles. Our diverse supplier network and spend will continue to increase, as outlined in our new Diverse Supplier Policy.
Measuring against our baseline D&I statistics, we will work to progress on our goal of recruiting, retaining and developing more diverse talent, including in leadership roles. In fiscal 2023, each of our sites will develop a D&I action plan, outlining localized strategies and goals to help us meet our targets. We will continue to participate in external benchmarks, including the Corporate Equality Index (LGBTQ+ inclusion), to guide our goals and progress. Through training, forums, and internal performance metrics, we will continue to combat our unconscious biases that can blind us from hiring and promoting diverse talent. Our employee surveys reveal that our employees are energized and engaged by our CR and D&I initiatives. In fiscal 2023, we will assess our employees’ overall engagement and inclusion in our next corporate engagement survey.
Further information on our CR program is available at catalent.com/cr, but this website is not part of our public disclosures and is not incorporated by reference into this Annual Report.
Intellectual Property
We use a combination of know-how, trade secrets, patents, copyrights, trademarks, and other intellectual property, nondisclosure and other contractual provisions, and technical measures to protect certain innovative aspects of our offerings, services, and intangible assets that we have developed. These proprietary rights can be important to aspects of our ongoing operations. Many of our operations and products are covered by intellectual property licenses from third parties, particularly our customers that provide licenses to their proprietary active ingredients or formulations as part of our development or supply agreements with them, and in certain instances we license our technology to third parties.
We also have a long track record of innovation across our lines of business, and, to further encourage active innovation, we have developed incentive compensation systems linked to patent filings and other recognition and reward programs for scientists and non-scientists alike. We have applied in the U.S. and certain other countries for registration of a number of trademarks, service marks, and patents, some of which have been registered and issued, and also hold common law rights in various trademarks and service marks. We hold more than 1,400 patents and patent applications worldwide relating to advanced drug delivery and biologics formulations and technologies, as well as manufacturing and other areas relevant to our business.
We hold patents and license rights relating to certain aspects of our formulations, pharmaceutical and nutritional dosage forms, mammalian cell engineering, antibody-drug conjugation, iPSCs, and plasmid DNA manufacturing. We also hold patents relating to certain processes and products. We have pending patent applications in the U.S. and certain other countries and intend to pursue additional patents as appropriate. We have enforced and will continue to enforce our intellectual property rights in the U.S. and worldwide in appropriate circumstances.
We do not consider any particular patent, trademark, license, franchise, or concession to be material to our overall business.
Regulatory Matters
The manufacture, distribution, and marketing of healthcare products and the provision of certain services for development-stage pharmaceutical and biotechnology products are subject to extensive ongoing regulation by the FDA, other U.S. governmental authorities, and similar regulatory authorities in other countries. Certain of our subsidiaries are required to register for permits or licenses with, and must comply with the operating, cGMP, quality, and security standards of, applicable domestic and foreign healthcare regulators, including the FDA, the U.S. Drug Enforcement Agency (the “DEA”), the U.S. Department of Health and Human Services (the “DHHS”), the equivalent agencies of the E.U. and its member states, and various state boards of pharmacy, state health departments, and comparable agencies in other jurisdictions, as well as various
accrediting bodies, each depending upon the type of operations and the locations of distribution and sale of the products manufactured or services provided by those subsidiaries.
In addition, certain of our subsidiaries are subject to other healthcare laws, including the U.S. Federal Food, Drug, and Cosmetic Act, the Public Health Service Act, the Controlled Substances Act, and comparable state and foreign laws and regulations in certain of their activities.
We are also subject to various federal, state, local, national, and transnational laws, regulations, and requirements, both in the U.S. and other countries, relating to safe working conditions, laboratory and distribution practices, and the use, transportation, and disposal of hazardous or potentially hazardous substances. In addition, applicable import and export laws and regulations require us to abide by certain standards relating to the cross-border transit of finished goods, raw materials, and supplies and the handling of information. We are also subject to various other laws and regulations concerning the conduct of our non-U.S. operations, including the U.S. Foreign Corrupt Practices Act, the U.K. Anti-Bribery Act, and other anti-bribery laws and laws pertaining to the accuracy of our internal books and records.
The costs associated with complying with the various applicable federal, state, local, national, and transnational regulations could be significant, and the failure to comply with such legal requirements could have an adverse effect on our results of operations and financial condition. See “Risk Factors—Risks Relating to Our Business and the Industry in Which We Operate—Failure to comply with existing and future regulatory requirements, including changing standards or changing interpretations of existing standards, could adversely affect our results of operations and financial condition or result in claims from customers. In addition, changes to our procedures or additional procedures, implemented to comply with public health orders or best practice guidelines as a result of the COVID-19 pandemic, may increase our costs or reduce our productivity and thereby affect our business, financial condition, or results of operations,” for additional discussion of the costs associated with complying with the various regulations.
In fiscal 2022, we were subject to 54 regulatory audits, and, over the last five fiscal years, we completed approximately 300 regulatory audits.
Quality Assurance
We are committed to ensuring and maintaining the highest standard of regulatory compliance while providing high quality products to our customers, supported by our core value of Patient First. To meet these commitments, we have developed and implemented a Catalent-wide quality management system. We have employees around the globe focusing on quality and regulatory compliance. Our senior management team is actively involved in setting quality policies, standards, and internal position papers as well as managing internal and external quality performance. Our quality assurance department provides quality leadership and supervises our quality systems programs. An internal audit program monitors compliance with applicable regulations, standards, and internal policies. In addition, our facilities are subject to periodic inspection by the FDA, the DEA, and other equivalent local, state, and foreign regulatory authorities as well as our customers. All FDA, DEA, and other regulatory inspection observations have been resolved or are on track to be completed at the prescribed timeframe provided in commitments to the applicable agency in all material respects. We believe that our operations are in compliance in all material respects with the regulations under which our facilities are governed.
Environmental, Health & Safety Matters
Our operations are subject to a variety of environmental, health, and safety laws and regulations, including those of the U.S. Environmental Protection Agency (the “EPA”), the U.S. Occupational Safety & Health Administration (“OSHA”), and equivalent state, local, and national regulatory agencies in each of the jurisdictions in which we operate. These laws and regulations govern, among other things, air emissions, wastewater discharges, the use, handling, and disposal of hazardous substances and wastes, soil and groundwater contamination, and employee health and safety. Our manufacturing facilities use, in varying degrees, hazardous substances in their processes. These substances include, among others, chlorinated solvents, and in the past chlorinated solvents were used at one or more of our facilities, including a number we no longer own or operate. As at our current facilities, contamination at such formerly owned or operated properties can result and has resulted in liability to us, for which we have recorded appropriate reserves as needed. We believe that our operations are in compliance in all material respects with the environment, health, and safety regulations applicable to our facilities.
ITEM 1A. RISK FACTORS
If any of the following risks actually occur, our business, financial condition, operating results, or cash flow could be materially and adversely affected. Additional risks or uncertainties not presently known to us, or that we currently believe are immaterial, may also impair our business operations.
Risks Relating to Our Business and the Industry in Which We Operate
Our business, financial condition, and results of operations may be adversely affected by global health epidemics, including the COVID-19 pandemic.
Any public health epidemic, including the COVID-19 pandemic, may affect our operations and those of third parties on which we rely, including our customers and suppliers. Our business, financial condition, and results of operations may be affected by: disruptions in our customers’ abilities to fund, develop, or bring to market products as anticipated; delays in or disruptions to the conduct of clinical trials; cancellations of contracts or confirmed orders from our customers; decreased demand for categories of products in certain affected regions; and inability, difficulty, or additional cost or delays in obtaining key raw materials, components, and other supplies from our existing supply chain; among other factors caused by a public health epidemic, including the COVID-19 pandemic.
While the COVID-19 pandemic has not had a material negative effect on our overall business, financial condition or results of operations to date, our customers and suppliers have in some cases experienced negative impacts due to disruptions in supply chains and disruptions to the operations of the FDA and other drug regulatory authorities, which resulted in, among other things, delays of inspections, reviews, and approvals of our customers’ products, as well as the volume and timing of orders from these customers. Such impacts may affect our business in the future. Governmental restrictions related to the COVID-19 pandemic, which continue to evolve, including travel restrictions, quarantines, shelter-in-place orders, business closures, new safety requirements or regulations, or restrictions on the import or export of certain materials, or other operational issues related to the COVID-19 pandemic may have an adverse effect on our business and results of operations.
We continue to monitor developments related to the COVID-19 pandemic and its effects on our business, operations, and financial condition. For purposes of our operational and financial planning, we have made, and update when appropriate, certain assumptions regarding the duration, severity, and global economic impact of the pandemic in different regions, and the need for continued manufacture and supply of COVID-19 vaccines and treatments, each of which remains uncertain. However, despite careful planning, our assumptions may not be accurate, as the extent to which COVID-19 may affect our future results will depend on future developments that are uncertain, including: the duration of the pandemic; emerging information concerning the severity and incidence of the virus and its variants; the emergence of additional virus variants; regional resurgences of the virus globally; the safety, efficacy, and availability of vaccines and treatments for COVID-19 (including its variants); the rate at which the population globally becomes vaccinated against COVID-19; the global economic impact of the pandemic; the actions of governments and regulatory authorities to contain the pandemic or control the supply of vaccines and treatments; and the actions the pharmaceutical industry, competitors, suppliers, customers, patients, and others may take to contain or address the pandemic’s direct and indirect effects.
Our Biologics segment, in particular, has reported substantial revenue from the testing, manufacturing, and packaging of COVID-19-related products for our customers. While this positive impact is expected to continue through at least the remainder of calendar 2022 and into calendar 2023, the duration and extent of future revenues from such testing, manufacturing, and packaging of COVID-19-related products is uncertain and dependent upon customer demand. See also "—Risks Related to Our Business and the Industry in Which We Operate—The continually evolving nature of the COVID-19 pandemic and the resulting public health response, including the changing demand for various COVID-19 vaccines and treatments from both patients and governments around the world, may affect sales of the COVID-19 products we manufacture."
In addition, the impact of the COVID-19 pandemic or any other public health epidemic could exacerbate other risks we face, including those described elsewhere in "Risk Factors."
The continually evolving nature of the COVID-19 pandemic and the resulting public health response, including the changing demand for various COVID-19 vaccines and treatments from both patients and governments around the world, may affect sales of the COVID-19 products we manufacture.
We manufacture or provide services for a variety of products intended for the prevention or treatment of COVID-19 and its symptoms and effects, including both vaccines and treatments. No single one of these products is material to our business. Certain of these products are subject to “take-or-pay” provisions that require the customer to either purchase a minimum
amount of product or pay any shortfall resulting from purchases not made. Such provisions should mitigate risks relating to any future uncertainty in the demand for these products.
The COVID-19-related products we develop and manufacture have not yet received full marketing approval from certain regulatory authorities around the world for certain patient populations, although some of these are being marketed and sold to such populations pursuant to an emergency use authorization (EUA) from the FDA or the equivalent authorization from non-U.S. regulatory authorities. Should any of these COVID-19-related products be denied any necessary regulatory approval, the demand for such product could decrease significantly and therefore decrease customer orders for additional development, manufacturing, or packaging of those products, although the financial effect on us may be mitigated by any take-or-pay provision in place with respect to that product. Additionally, the need for continued manufacture and supply of vaccines (including “booster” doses) and therapies to address the COVID-19 pandemic, including new and developing variants of COVID-19, is highly uncertain and subject to various political, economic, and regulatory factors that are outside of our control. Should the U.S. or other major regions worldwide determine that additional manufacture of COVID-19 vaccines, boosters, or therapies is no longer necessary, it could adversely affect our revenue and financial condition. In addition, highly-public political and social debate relating to the need for, efficacy of, or side effects related to one or more specific COVID-19 vaccines could contribute to changes in public perception of one or more COVID-19 vaccines manufactured by us, which could decrease demand for a COVID-19 related product we develop, manufacture, or package.
The demand for our offerings depends in part on our customers’ research and development and the clinical and market success of their products. Our business, financial condition, and results of operations may be harmed if our customers spend less on, or are less successful in, these activities. In addition, customer spending may be affected by, among other things, the COVID-19 pandemic or recessionary economic conditions caused in whole or in part by the pandemic, the Ukrainian-Russian war, or the rise in inflation worldwide.
Our customers are engaged in research, development, production, and marketing of pharmaceutical, biotechnology, and consumer health products. The amount of customer spending on research, development, production, and marketing, as well as the outcomes of such research, development, and marketing activities, have a large impact on our sales and profitability, particularly the amount our customers choose to spend on our offerings. Available resources, including funding for our biotechnology and other customers, the need to develop new products, and consolidation in the industries in which our customers operate may have an impact on such spending. Our customers and potential customers finance their research and development spending from private and public sources. A reduction in available financing for and spending by our customers, for these reasons or because of the direct or indirect effects of the COVID-19 pandemic, inflation, and the Ukrainian-Russian war or other regional or global conflicts, could have a material adverse effect on our business, financial condition, and results of operations. If our customers are not successful in attaining or retaining product sales due to market conditions, reimbursement issues, or other factors, our results of operations may be materially adversely affected.
We participate in a highly competitive market, and increased competition may adversely affect our business.
We operate in a market that is highly competitive. We compete with multiple companies as to each of our offerings and in every region of the globe in which we operate, including competing with other companies that offer advanced delivery technologies, outsourced dose form or biologics manufacturing, clinical trials support services, or development services to pharmaceutical, biotechnology, and consumer health companies globally. We also compete in some cases with the internal operations of those pharmaceutical, biotechnology, and consumer health customers that also have manufacturing capabilities and choose to source these services internally.
We face substantial competition in each of our markets. Competition is driven by proprietary technologies and know-how, capabilities, consistency of operational performance, quality, price, value, responsiveness, and speed. Some competitors have greater financial, research and development, operational, and marketing resources than we do. Competition may also increase as additional companies enter our markets or use their existing resources to compete directly with ours. Expanded competition from companies in low-cost jurisdictions, such as India and China, may in the future adversely affect our results of operations or limit our growth. Greater financial, research and development, operational, and marketing resources may allow our competitors to respond more quickly with strategic acquisitions, or with new, alternative, or emerging technologies. Changes in the nature or extent of our customers’ requirements may render our offerings obsolete or non-competitive and could adversely affect our results of operations and financial condition.
We are subject to product and other liability risks that could exceed our anticipated costs or adversely affect our results of operations, financial condition, liquidity, and cash flows.
We are subject to potentially significant product liability and other liability risks that are inherent in the design, development, manufacture, and marketing of our offerings. We may be named as a defendant in product liability lawsuits, which may allege that our offerings have resulted or could result in an unsafe condition or injury to consumers. Such lawsuits,
even those without merit, could be costly to defend and could result in reduced sales, significant liabilities, adverse publicity, and diversion of management’s time, attention, and resources.
Furthermore, product liability claims and lawsuits, regardless of their ultimate outcome, could have a material adverse effect on our business operations, financial condition, and reputation and on our ability to attract and retain customers. The availability of product liability insurance for companies in the pharmaceutical industry is generally more limited than insurance available to companies in other industries. We maintain product liability insurance with annual aggregate limits in excess of $25 million. There can be no assurance that a successful product liability or other claim would be adequately covered by our applicable insurance policies or by any applicable contractual indemnity or liability limitations.
Failure to comply with existing and future regulatory requirements, including changing regulatory standards or changing interpretations of existing standards, could adversely affect our results of operations and financial condition or result in claims from customers. In addition, changes to our procedures or additional procedures, implemented to comply with public health orders or best practice guidelines as a result of the COVID-19 pandemic, may increase our costs or reduce our productivity and thereby affect our business, financial condition, or results of operations.
The healthcare industry is highly regulated. We, and our customers, are subject to various local, state, federal, national, and transnational laws and regulations, which include the operating, quality, and security standards of the FDA, the DEA, various state boards of pharmacy, state health departments, the DHHS, similar bodies of the U.K., the E.U. and its member states, and other comparable agencies around the world, and, in the future, any change to such laws and regulations or the interpretation or application thereof could adversely affect us. Among other rules affecting us, we are subject to laws and regulations concerning cGMP and drug safety. As a result of the COVID-19 pandemic or other public health activity, new public health orders or best practice guidelines may increase our costs to operate or reduce our productivity, thereby affecting our business, financial condition, or results of operations.
Failure by us or by our customers to comply with the requirements of applicable laws and regulations or requests from regulatory authorities could result in warning letters, product recalls or seizures, monetary sanctions, injunctions to halt manufacture or distribution, restrictions on our operations, civil or criminal sanctions, or withdrawal of existing or denial of pending approvals, permits, or registrations, including those relating to products or facilities. In addition, any such failure relating to the products or services we provide could expose us to contractual or product liability claims as well as claims from our customers, including claims for reimbursement for lost or damaged active pharmaceutical ingredients, which cost could be significant.
In addition, any new offering or product classified as a pharmaceutical or medical device must undergo lengthy and rigorous clinical testing and other extensive, costly, and time-consuming procedures mandated by the FDA, the EMA, and other equivalent local, state, federal, national, and transnational regulatory authorities in the jurisdictions that regulate our offerings and products.
Although we believe that we comply in all material respects with applicable laws and regulations, there can be no assurance that a regulatory agency or tribunal would not reach a different conclusion concerning the compliance of our operations with applicable laws and regulations. In addition, there can be no assurance that we will be able to maintain or renew existing permits, licenses, or other regulatory approvals or obtain, without significant delay, future permits, licenses, or other approvals needed for the operation of our businesses. Any noncompliance by us or our customers with applicable law or regulation or the failure to maintain, renew, or obtain necessary permits and licenses could have an adverse effect on our results of operations and financial condition. Furthermore, loss of a permit, license, or other approval in any one portion of our business may have indirect consequences in another portion of our business if regulators or customers adjust their reviews of such other portion as a result or customers cease business with such other portion due to fears that such loss is a sign of broader concerns about our ability to deliver products or services of sufficient quality.
Failure to provide quality offerings to our customers could have an adverse effect on our business, and the market price of our Common Stock and may subject us to regulatory action or costly litigation.
Our results depend on our ability to execute and improve when necessary our quality management strategy and systems, and effectively train and maintain our workforce with respect to quality management. Quality management plays an essential role in determining and meeting customer requirements, preventing defects, and improving our offerings, and, despite our network of quality systems, a quality or safety issue, including with respect to a high-revenue product such as a COVID-19 vaccine or therapy, could have an adverse effect on our business, financial condition, stock price, or results of operations and may subject us to regulatory action, including a product recall, product seizure, injunction to halt manufacture or distribution, or restriction on our operations; monetary fines; or other civil or criminal sanctions. In addition, such an issue could subject us to
adverse publicity and costly litigation, including claims from our customers for reimbursement for the cost of lost or damaged active pharmaceutical ingredients or other related losses, the cost of which could be significant.
The services and offerings we provide are highly exacting and complex, and, if we encounter problems providing the services or support required, our business could suffer.
The offerings we provide are highly exacting and complex, due in part to complex and exacting manufacturing processes and strict regulatory requirements. From time to time, problems may arise in connection with facility operations or during preparation or provision of an offering, in both cases for a variety of reasons including, but not limited to, equipment malfunction, sterility variances or failures, failure to follow specific protocols and procedures, problems with raw materials, environmental factors, and damage to, or loss of, manufacturing operations due to fire, flood, or similar causes. Such problems could affect production of a particular batch or series of batches, require the destruction of or otherwise result in the loss of product or materials used in the production of product, or could halt facility production altogether. This could, among other things, lead to increased costs, lost revenue, damage to customer relations, reimbursement to customers for lost active pharmaceutical ingredients or other related losses, time and expense spent investigating the cause, lost production time, and, depending on the cause, similar losses with respect to other batches or products. Production problems in our biologic manufacturing operations could be particularly significant because the cost of raw materials is often appreciably higher than in our other businesses. If problems are not discovered before the product is released to the market, recall and product liability costs may also be incurred. In addition, such risks may be greater at facilities that are new or going through significant expansion or renovation. The risks associated with running a highly complex facility doing exacting work with substantial regulatory oversight are enhanced for our larger sites, like our Bloomington, Indiana, Harmans, Maryland, St. Petersburg, Florida, or Swindon U.K. sites, which generally generate much more revenue.
If we cannot keep pace with rapid technological advances, our services may become uncompetitive or obsolete, and our revenue and profitability may decline.
The healthcare industry is characterized by rapid technological change. Demand for our offerings may change in ways we may not anticipate because of evolving industry standards as well as a result of evolving customer needs that are increasingly sophisticated and varied and the introduction by others of new offerings and technologies that provide alternatives to our offerings. Several of our higher margin offerings are based on proprietary technologies. To the extent that such technologies are protected by patents, their related offerings may become subject to competition as the patents expire. Without the timely introduction of enhanced or new offerings and technologies, our offerings may become obsolete or uncompetitive over time, in which case our revenue and operating results would suffer. For example, if we are unable to respond to changes in the nature or extent of the technological or other needs of our pharmaceutical customers through enhancing our offerings, our competition may develop offerings that are more competitive than ours and we could find it more difficult to renew or expand existing agreements or obtain new agreements. Potential innovations intended to facilitate enhanced or new offerings generally will require a substantial investment before we can determine their commercial viability, and we may not obtain access to the innovations or have financial resources sufficient to fund all desired innovations.
Even if we succeed in creating or acquiring enhanced or new offerings from these innovations, they may still fail to result in commercially successful offerings or may not produce revenue in excess of the costs of development, and they may be rendered obsolete by changing customer preferences or the introduction by our competitors of offerings embodying new technologies or features. Finally, innovations may not be accepted quickly in the marketplace because of, among other things, entrenched patterns of clinical practice, the need for regulatory clearance, and uncertainty over market access or government or third-party reimbursement.
We and our customers depend on patents, copyrights, trademarks, know-how, trade secrets, and other forms of intellectual property protections, but these protections may not be adequate.
We rely on a combination of know-how, trade secrets, patents, copyrights, trademarks, and other intellectual property laws, nondisclosure and other contractual provisions, and technical measures to protect many of our offerings and intangible assets. These proprietary rights are important to our ongoing operations. There can be no assurance that these protections will provide uniqueness or meaningful competitive differentiation in our offerings or otherwise be commercially valuable or that we will be successful in obtaining additional intellectual property or enforcing our intellectual property rights against unauthorized users. Our exclusive rights under certain of our offerings are protected by patents, some of which will expire in the near term. When patents covering an offering expire, loss of exclusivity may occur, which may force us to compete with third parties, thereby negatively affecting our revenue and profitability.
Our proprietary rights may be invalidated, circumvented, or challenged. We may in the future be subject to proceedings seeking to oppose or limit the scope of our patent applications or issued patents. In addition, in the future, we may need to take legal actions to enforce our intellectual property rights, to protect our trade secrets, or to determine the validity or scope of the proprietary rights of others. Legal proceedings are inherently uncertain, and the outcome of such proceedings may be unfavorable to us. Any legal action regardless of outcome might result in substantial costs and diversion of resources and management attention.
There can be no assurance that our confidentiality agreements will not be breached, our trade secrets will not otherwise become known by competitors, or that we will have adequate remedies in the event of unauthorized use or disclosure of proprietary information. Even if the validity and enforceability of our intellectual property is upheld, an adjudicator might construe our intellectual property not to cover the alleged infringement. In addition, intellectual property enforcement may be unavailable or practically ineffective in some countries. There can be no assurance that our competitors will not independently develop technologies that are substantially equivalent or superior to our technology or that third parties will not design around our intellectual property claims to produce competitive offerings. The use of our technology or similar technology by others could reduce or eliminate any competitive advantage we have developed, cause us to lose sales, or otherwise harm our business.
While we continue to apply in the U.S. and certain other countries for registration of a number of trademarks, service marks, and patents, and also claim common law rights in various trademarks and service marks, there can be no assurance that third parties will not oppose our applications in the future. In addition, it is possible that in some cases we may be unable to obtain the registrations for trademarks, service marks, and patents for which we have applied, and a failure to obtain trademark and patent registrations in the U.S. or other countries could limit our ability to protect our trademarks and proprietary technologies and impede our marketing efforts in those jurisdictions.
License agreements with third parties control our rights to use certain patents, software, and information technology systems and proprietary technologies owned by third parties, some of which are important to our business. Termination of these license agreements for any reason could result in the loss of our rights to this intellectual property, causing an adverse change in our operations or the inability to commercialize certain offerings.
In addition, many of our branded pharmaceutical customers rely on patents to protect their products from generic competition. Because incentives exist in some countries, including the U.S., for generic pharmaceutical companies to challenge these patents, pharmaceutical and biotechnology companies are under the ongoing threat of challenges to their patents. If the patents on which our customers rely were successfully challenged and, as a result, the affected products become subject to generic competition, the market for our customers’ products could be significantly adversely affected, which could have an adverse effect on our results of operations and financial condition. We attempt to mitigate these risks by making our offerings available to generic as well as branded manufacturers and distributors, but there can be no assurance that we will be successful in marketing these offerings.
Our offerings or our customers’ products may infringe on the intellectual property rights of third parties.
From time to time, third parties have asserted intellectual property infringement claims against us and our customers, and there can be no assurance that third parties will not assert infringement claims against either us or our customers in the future. While we believe that our offerings do not infringe in any material respect upon proprietary rights of other parties, and that meritorious defenses would exist with respect to any assertion to the contrary, there can be no assurance that we could successfully avoid being found to infringe on the proprietary rights of others. Patent applications in the United States and certain other countries are generally not publicly disclosed until the patent is issued or published, and we and our customers may not be aware of currently filed patent applications that relate to our or their products, offerings, or processes. If patents later issue on these applications, we or they may be found liable for subsequent infringement. There has been substantial litigation in the pharmaceutical and biotechnology industries with respect to the manufacture, use, and sale of products that are the subject of conflicting patent rights.
Any claim that our offerings or processes infringe third-party intellectual property rights (including claims arising through our contractual indemnification of our customers), regardless of the claim’s merit or resolution, could be costly and may divert the efforts and attention of our management and technical personnel. We may not prevail against any such claim given the complex technical issues and inherent uncertainties in intellectual property matters. If any such claim results in an adverse outcome, we could, among other things, be required to: pay substantial damages (potentially including treble damages in the U.S.); cease the manufacture, use, or sale of the infringing offerings or processes; discontinue the use of the infringing technology; expend significant resources to develop non-infringing technology; license technology from the third party claiming infringement, which license may not be available on commercially reasonable terms or at all; and lose the opportunity
to license our technology to others or to collect royalty payments based upon successful protection and assertion of our intellectual property against others.
In addition, our customers’ products may be subject to claims of intellectual property infringement and such claims could materially affect our business if their products cease to be manufactured or they have to discontinue the use of the infringing technology.
Any of the foregoing could affect our ability to compete or have a material adverse effect on our business, financial condition, and results of operations.
Events that diminish, tarnish, or otherwise damage our brand may have an adverse effect on our future financial condition and results of operations.
We have built a strong brand in “Catalent,” with high overall and generally favorable awareness of the brand in our established markets and with target customers. Our brand identity is a competitive advantage for us in sales and marketing, which is evidenced by our customer mix among top branded drug, generics, biologics, and consumer health marketers. We have spent and continue to spend substantial time, money, and other resources to establish both our brand awareness and a favorable perception of our brand in relevant markets. Among other strategies, we participate in major international trade shows in our established markets and ensure visibility into our offerings through a comprehensive print and on-line advertising and publicity program. It is possible that a single event, or aggregation of several events, may diminish, tarnish, or otherwise damage our brand and adversely affect our future financial condition and results of operations.
For example, meaningful interruptions to our ability to reliably supply one or more customers with products on time, whether as a result of supply chain disruptions or manufacturing delays or defects, may diminish our customers’ confidence in our ability to timely meet our commitments, thereby damaging our brand. In addition, we are subject to various local, state, federal, national, and transnational laws and regulations, including the operating, quality, and security standards of the FDA, the DEA, and similar bodies of the U.K., the E.U., and other comparable agencies around the world. Highly public or significant negative reports or findings from a regulatory agency with respect to one or more manufacturing or quality defects in our operations, inspections of our facilities, or other routine reviews could cause negative public perception of our operations, negatively impacting our brand, and adversely affecting our financial condition and results of operations. In addition, many of the other risks we face, including those described elsewhere in "Risk Factors" could diminish, tarnish, or otherwise damage our brand.
Our future results of operations are subject to fluctuations in the costs, availability, and suitability of the components of the products we manufacture, including active pharmaceutical ingredients, excipients, purchased components, and raw materials. In addition, the COVID-19 pandemic and the ongoing supply-chain disruptions triggered by a combination of the pandemic and the Ukrainian-Russian war may interfere with the operations of certain of our direct or indirect suppliers or with international trade for these supplies, which may either raise our costs or reduce the productivity or slow the timing of our operations.
We depend on various active pharmaceutical ingredients, components, compounds, raw materials, and energy supplied primarily by third parties for our offerings. Our customers also frequently provide to us their active pharmaceutical or biologic ingredient for formulation or incorporation in the finished product and may supply other raw materials as well. It is possible that any of our or our customers’ supplier relationships could be interrupted due to changing regulatory requirements, import or export restrictions, natural disasters, international supply disruptions, including those caused by public health emergencies such as the COVID-19 pandemic, and the ongoing Ukrainian-Russian war, geopolitical issues, operational or quality issues at the suppliers’ facilities, and other events, or could be terminated in the future.
For example, gelatin, a critical component for manufacturing many of our softgel formats is only available from a limited number of sources. In addition, much of the gelatin we use is bovine-derived. Past concerns of contamination from bovine spongiform encephalopathy, or BSE, have narrowed the number of possible sources of particular types of gelatin. If there were a future disruption in the supply of gelatin, we may not be able to obtain an adequate alternative supply. If future restrictions were to emerge on the use of bovine-derived gelatin, any such restriction could hinder our ability to timely supply our customers with products and the use of alternative material could be subject to lengthy and uncertain formulation, testing, and regulatory approval.
In addition, certain of our inputs are currently sole-sourced, so any disruption related to such a supplier is more likely to have an impact on our operations. Replacing a sole-source supplier of a production input to a medicine requiring marketing approval may be impossible or time-consuming, due to the rigorous standards we are obliged to apply to any new supplier.
Any sustained interruption in our receipt of adequate supplies could have an adverse effect on our business and results of operations. In addition, while we have processes intended to reduce volatility in component and material pricing, we may not be able to successfully manage price fluctuations, and future price fluctuations or shortages may have an adverse effect on our results of operations.
Changes in market access or healthcare reimbursement for, or public sentiment towards our customers’ products in the United States or internationally, or other changes in applicable policies regarding the healthcare industry, could adversely affect our results of operations and financial condition by affecting demand for our offerings.
The healthcare industry has changed significantly over time, and we expect the industry to continue to evolve. Some of these changes, such as ongoing healthcare reform, including with respect to reforming drug pricing, adverse changes in governmental or private funding of healthcare products and services, legislation or regulations governing patient access to care and privacy, or the delivery, pricing, or reimbursement approval of pharmaceuticals and healthcare services or mandated benefits, may cause healthcare industry participants to change the amount of our offerings that they purchase or the price they are willing to pay for these offerings. In particular, it is possible that future legislation in the U.S. may affect or put a cap on future pricing of pharmaceutical and biotechnology products. While we are unable to predict the likelihood of changes to U.S. and other international laws affecting pharmaceutical and biotechnology products, any substantial revision of applicable healthcare legislation could have a material adverse effect on the demand for our customers’ products, which in turn could have a negative impact on our results of operations, financial condition, or business. Changes in the healthcare industry’s pricing, selling, inventory, distribution, or supply policies or practices, or in public or government sentiment for the industry as a whole, could also significantly reduce our revenue and results of operations. In particular, volatility in individual product demand may result from changes in public or private payer reimbursement or coverage.
Our ability to use our net operating loss carryforwards and certain other tax attributes may be limited.
We generated net operating losses (“NOLs”) in the past that have been, and continue to be, used to reduce taxable income. Utilization of our NOL carryforwards may be subject to a substantial limitation under Section 382 of the Internal Revenue Code of 1986, as amended (the “Internal Revenue Code”), and comparable provisions of state, local, and foreign tax laws due to changes in ownership of our company that may occur in the future. Under Section 382 of the Internal Revenue Code and comparable provisions of state, local, and foreign tax laws, if a corporation undergoes an “ownership change,” generally defined as a greater than 50% change by value in its equity ownership over a three-year period, the corporation’s ability to carry forward its pre-change NOLs to reduce its post-change income may be limited. In addition, we acquired companies that generated pre-acquisition NOLs for tax purposes that will also be subject to limitation under Section 382 and comparable provisions of state, local, and foreign tax laws. We may experience ownership changes in the future as a result of future changes in our stock ownership. As a result, our ability to use our pre-change NOL carryforwards to reduce U.S. federal, state, local, and foreign taxable income we produce in the future years may be subject to limitations, which could result in increased future tax liability to us.
Changes to the estimated future profitability of the business may require that we establish an additional valuation allowance against all or some portion of our net deferred tax assets.
We have deferred tax assets for NOL carryforwards and other temporary differences. We currently maintain a valuation allowance for a portion of our U.S. net deferred tax assets and certain foreign net deferred tax assets. It is possible we may experience a decline in U.S. taxable income resulting from a decline in profitability of our U.S. operations, an increased level of debt in the U.S., or other factors. In assessing our ability to realize our deferred tax assets, we may conclude that it is more likely than not that some additional portion or all our deferred tax assets will not be realized. As a result, we may be required to record an additional valuation allowance against our deferred tax assets, which could adversely affect our effective income tax rate and therefore our financial results.
We depend on key personnel.
We depend on our executive officers and other key personnel, including our technical personnel, to operate and grow our business and to develop new and enhanced offerings and technologies. The loss of any of these officers or other key personnel or a failure to attract and retain suitably skilled technical personnel could adversely affect our operations.
In addition to our executive officers, we rely on 190 senior employees to lead and direct our business. Our senior leadership team is comprised of our subsidiaries’ executive officers and other vice presidents and directors who hold critical positions and possess specialized talents and capabilities that give us a competitive advantage in the market.
We employ more than 3,000 scientists and technicians whose areas of expertise and specialization cover subjects such as advanced delivery, biologics and gene and cell therapy formulation and manufacturing. Many of our sites and laboratories are located in competitive labor markets; therefore, global and regional competitors and, in some cases, customers and suppliers compete for the same skills and talent as we do.
We may acquire businesses and offerings that complement or expand our business or divest non-strategic businesses or assets. We may not be able to complete desired transactions, and such transactions, if executed, pose significant risks, including risks relating to our ability to successfully and efficiently integrate acquisitions or execute on dispositions and realize anticipated benefits therefrom. The failure to execute or realize the full benefits from any such transaction could have a negative effect on our operations and profitability.
Our future success may depend in part on opportunities to buy or otherwise acquire rights to other businesses or technologies, enter into joint ventures or otherwise enter into strategic arrangements with business partners that could complement, enhance, or expand our current business or offerings and services or that might otherwise offer us growth opportunities, or divest assets or an ongoing business. We face competition from other companies in pursuing acquisitions and similar transactions in the pharmaceutical and biotechnology industry. Our ability to complete transactions may also be limited by applicable antitrust and trade laws and regulations in the U.S. and other jurisdictions in which we or the operations or assets we seek to acquire carry on business. To the extent that we are successful in making acquisitions, we expend substantial amounts of cash, incur debt, or assume loss-making divisions as consideration. We or the purchaser of a divested asset or business may not be able to complete a desired transaction for any number of reasons, including a failure to secure financing.
Any acquisition that we are able to identify and complete may involve a number of risks, including, but not limited to, the diversion of management’s attention to integrate the acquired businesses or joint ventures, the possible adverse effects on our operating results during the integration process, the potential loss of customers or employees in connection with the acquisition, delays or reduction in realizing expected synergies, unexpected liabilities, and our potential inability to achieve our intended objectives for the transaction. In addition, we may be unable to maintain uniform standards, controls, procedures, and policies, which may lead to operational inefficiencies.
To the extent that we are not successful in completing desired divestitures, we may have to expend cash, incur debt, or continue to absorb the costs of loss-making or under-performing divisions. Any divestiture, whether we complete it or not, may involve numerous risks, including diversion of management’s attention, a negative impact on our customer relationships, costs associated with maintaining its business during the disposition process, and the costs of closing and disposing of the affected business or transferring remaining portions of the operations of the business to other facilities.
We provide services incorporating various advanced modalities, including protein and plasmid production and cell and gene therapies, and these modalities relate to relatively new modes of treatment that may be subject to changing public opinion, continuing research, and increased regulatory scrutiny, each of which may affect our customers’ abilities to conduct their businesses or obtain regulatory approvals for their therapies, and thereby adversely affect these offerings.
Cell and gene therapy, with or without the use of iPSCs or plasmids, remain relatively new means for treating disease and other medical conditions, with only a few cell and gene therapies approved to date in the U.S., the E.U., or elsewhere. Public perception may be influenced by claims that cell or gene therapies are unsafe, and cell or gene therapy may not gain the acceptance of the public or the medical community. In addition, ethical, social, legal, and cost-benefit concerns about cell or gene therapy, genetic testing, genetic research, and the use of stem cells or materials derived from viruses could result in additional regulations or limitations or even outright prohibitions on certain cell or gene therapies or related products. Various regulatory and legislative bodies have expressed an interest in, or have taken steps towards, further regulation of various biotechnologies, including cell and gene therapies. More restrictive regulations or claims that certain cell or gene therapies are unsafe or pose a hazard could reduce our customers’ use of our services. We can provide no assurance whether legislative changes will be enacted, regulations, policies, or guidance changed, or interpretations of existing strictures by agencies or courts changed, or what the impact of such changes, if any, may be.
We are subject to environmental, health, and safety laws and regulations, which could increase our costs or restrict our operations in the future.
Our operations are subject to a variety of environmental, health, and safety laws and regulations, including those of the EPA, OSHA, and equivalent local, state, and national regulatory agencies in the jurisdictions in which we operate. Any failure by us to comply with environmental, health, and safety requirements could result in the limitation or suspension of production or subject us to monetary fines, civil or criminal sanctions, or other future liabilities in excess of our reserves. In particular, we are subject to laws and regulations governing the destruction and disposal of raw materials, byproducts of our manufacturing
operations, and non-compliant products, the handling of regulated material included in our offerings, and the disposal of our products or their components at the end of their useful lives. In addition, compliance with environmental, health, and safety requirements could restrict our ability to expand our facilities or require us to acquire costly environmental or safety control equipment, incur other significant expenses, or modify our manufacturing processes. Our manufacturing facilities may use, in varying degrees, hazardous substances in their processes. These substances include, among others, chlorinated solvents, and in the past chlorinated solvents were used at one or more of our facilities, including a number we no longer own or operate. As at our current facilities, contamination at such formerly owned or operated properties can result and has resulted in liability to us. In the event of the discovery of new or previously unknown contamination either at our facilities, facilities we acquire in the future, or at third-party locations, including facilities we formerly owned or operated, the issuance of additional requirements with respect to existing contamination, or the imposition of other cleanup obligations for which we are responsible, we may be required to take additional, unplanned remedial measures for which we have not recorded reserves. We are conducting monitoring and cleanup of contamination at certain facilities currently or formerly owned or operated by us, and such activities may result in unanticipated costs or management distraction.
We are subject to labor and employment laws and regulations, which could increase our costs and restrict our operations in the future.
We have nearly 19,000 individuals providing services for us worldwide, including approximately 11,700 service providers in North America, 5,700 in Europe, 1,000 in South America, and 600 in the Asia-Pacific region. Certain employees at one of our North American facilities are represented by a labor organization, and national works councils or labor organizations are active at our European facilities and certain of our other facilities consistent with local labor environments and laws. Our management believes that our employee relations are satisfactory. However, further organizing activities, collective bargaining, or changes in the regulatory framework for employment may increase our employment-related costs or may result in work stoppages or other labor disruptions. Moreover, as employers are subject to various employment-related claims, such as individual and class actions relating to alleged employment discrimination and wage-hour and labor standards issues, such actions, if brought against us and successful in whole or in part, may affect our ability to compete or have a material adverse effect on our business, financial condition, and results of operations.
Certain of our pension plans are underfunded, and additional cash contributions we may make to increase the funding level will reduce the cash available for our business, such as the payment of our interest expense.
Certain of our current and former employees in the U.S., the U.K., Germany, France, Japan, Belgium, and Switzerland are participants in defined benefit pension plans that we sponsor. As of June 30, 2022, the underfunded amount of our pension plans on a worldwide basis was $28 million, primarily related to our pension plans in the U.K. and Germany. In addition, we have an estimated obligation of $38 million, as of June 30, 2022, related to our withdrawal from a multiemployer pension plan in which we formerly participated. In general, the amount of future contributions to the underfunded plans will depend upon asset returns, applicable actuarial assumptions, prevailing and expected interest rates, and other factors, and, as a result, the amount we may be required to contribute in the future to fund the obligations associated with such plans may vary. Such cash contributions to the plans will reduce the cash available for our business, including the funds available to pursue strategic growth initiatives or the payment of interest expense on our indebtedness.
Our global operations are subject to economic and political risks, that could affect the profitability of our operations or require costly changes to our procedures.
We conduct our operations in various regions of the world, including North America, South America, Europe, and the Asia-Pacific region. Global and regional economic and political developments affect businesses such as ours in many ways. Our operations are subject to the effects of global and regional competition. Our global operations are also affected by local economic environments, including inflation and recession. Political changes, some of which may be disruptive, and related hostilities can interfere with our supply chain, our customers, and some or all of our activities in a particular location. While some of these risks can be hedged using derivatives or other financial instruments and some are insurable, such mitigating measures may be unavailable, costly, or unsuccessful.
Beginning in fiscal 2022, much of the world, including the U.S. and the E.U., began to experience inflation levels not seen in more than 30 years. As a result, prices for many of our inputs have risen, in some cases dramatically. If inflation stays at elevated levels or increases, we may not be able to mitigate the impact of the increased costs we will bear through corresponding price increases to our customers, which could have an impact on our results of operations and financial condition.
As a global enterprise, fluctuations in the exchange rates of the U.S. dollar, our reporting currency, against other currencies could have a material adverse effect on our financial performance and results of operations.
As a company with significant operations outside of the U.S., certain revenues, costs, assets, and liabilities, including our euro-denominated 2.375% Senior Notes due 2028 (the “2028 Notes”), are denominated in currencies other than the U.S. dollar, which is the currency that we use to report our financial results. As a result, changes in the exchange rates of these or any other applicable currency to the U.S. dollar will affect our revenues, earnings, and cash flows. There has been, and may continue to be, volatility in currency exchange rates affecting the various currencies in which we do business. Such volatility and other changes in exchange rates could result in unrealized and realized exchange losses, despite any effort we may undertake to manage or mitigate our exposure to fluctuations in the values of various currencies.
Tax legislative or regulatory initiatives, new interpretations or developments concerning existing tax laws, or challenges to our tax positions could adversely affect our results of operations and financial condition.
We are a large multinational enterprise with operations in the U.S. and more than a dozen other countries across North and South America, Europe, and the Asia-Pacific region, and we do business with suppliers and customers in many additional regions. As such, we are subject to the tax laws and regulations of the U.S. federal, state, and local governments and of many jurisdictions outside of the U.S. From time to time, various legislative initiatives may be proposed that could adversely affect our tax positions, and existing legislation may be subject to additional regulatory changes or new interpretations. There can be no assurance that our effective tax rate or tax payments will not be adversely affected by these initiatives.
In addition, U.S. federal, state, local, and foreign tax laws and regulations are extremely complex and subject to varying interpretations. We are subject to regular examination of our income tax returns by various tax authorities. Examinations or changes in laws, rules, regulations, or interpretations by taxing authorities could result in adverse impacts to tax years open under statute or to our operating structures currently in place. It is possible that the outcomes from these examinations or changes in laws, rules, regulations, or interpretations by taxing authorities will have a material adverse effect on our financial condition or results of operations.
We use advanced information and communication systems to run our operations, compile and analyze financial and operational data, and communicate among our employees, customers, and counter-parties, and the risks generally associated with information and communications systems could adversely affect our results of operations. We continuously work to install new, and upgrade existing, systems and provide employee awareness training around phishing, malware, and other cyber security risks to enhance the protections available to us, but such protections may be inadequate to address malicious attacks or inadvertent compromises affecting data security or the operability of such systems.
We rely on information systems in our business to obtain, process, analyze, and manage data to:
•facilitate the manufacture and distribution of thousands of inventory items in, to, and from our facilities;
•receive, process, and ship orders on a timely basis;
•manage the accurate billing and collections for more than one thousand customers;
•create, compile, and retain testing and other product-, manufacturing-, or facility-related data necessary for meeting our and our customers’ regulatory obligations.
•manage the accurate accounting and payment for thousands of vendors and our employees;
•schedule and operate our global network of development, manufacturing, and packaging facilities;
•document various aspects of our activities, including the agreements we make with suppliers and customers;
•compile financial and other operational data into reports necessary to manage our business and comply with various regulatory or contractual obligations, including obligations under our bank loans and other indebtedness, the federal securities laws, the Internal Revenue Code, and other applicable state, local, and ex-U.S. tax laws; and communicate among our nearly 19,000 workers spread across dozens of facilities over four continents.
We face various security threats on a regular basis, including ongoing cyber security threats to and attacks on our information technology infrastructure. We deploy defenses against such threats and attacks and work to secure the integrity of our data systems using techniques, hardware, and software typical of companies of our size and scope. Despite our security measures, however, our information technology and infrastructure may be vulnerable to attacks by increasingly sophisticated intruders or others who try to cause harm to or interfere with our normal use of our systems. They are also susceptible to breach due to employee error, malfeasance, or other disruptions. Our suppliers, contractors, service providers, and other third parties with whom we do business also experience cyber threats and attacks that are similar in frequency and sophistication. In many cases, we have to rely on the controls and safeguards put in place by our suppliers, contractors, service providers, and other third parties to defend against, respond to, and report these attacks. We cannot know the potential impact of future cyber incidents, which vary widely in severity and scale. There can be no assurance that the various procedures and controls we
utilize to mitigate these threats will be sufficient to prevent disruptions to our systems, in part because (i) cyber-attack techniques change frequently and, at times, new techniques are not recognized until launched, and (ii) cyber-attacks can originate from a wide variety of sources. Our results of operations could be adversely affected if these systems are interrupted or damaged or fail for any extended period.
Risks Relating to Our Indebtedness
The size of our indebtedness and the obligations associated with it could adversely affect our ability to raise additional capital to fund our operations, limit our ability to react to changes in the economy or in our industry or to deploy capital to grow our business, expose us to interest-rate risk to the extent of our variable-rate debt, or prevent us from meeting our obligations under our indebtedness. These risks may be increased in a recessionary environment, particularly as sources of capital may become less available or more expensive.
As of June 30, 2022, we had $4.20 billion (U.S. dollar equivalent) of total indebtedness outstanding, consisting of $1.43 billion of secured indebtedness under our senior secured credit facilities and $2.77 billion of senior unsecured indebtedness, including $500 million aggregate principal amount of 5.000% U.S. dollar-denominated Senior Notes due 2027 (the “2027 Notes”), €825 million aggregate principal amount of the 2028 Notes, $550 million aggregate principal amount of U.S. dollar-denominated 3.125% Senior Notes due 2029 (the “2029 Notes”), and $650 million aggregate principal amount of U.S. dollar-denominated 3.500% Senior Notes due 2030 (the “2030 Notes” and, together with the 2027 Notes, the 2028 Notes, and the 2029 Notes, the “Senior Notes”). As of June 30, 2022, we also held $234 million in finance lease obligations. In addition, we had $721 million of unutilized capacity under our $725 million secured revolving credit commitments due to $4 million of outstanding letters of credit, which is part of our senior secured credit facilities (the “Revolving Credit Facility”).
The multi-billion-dollar size of our indebtedness could have important consequences for us, including:
•increasing our vulnerability to adverse economic, industry, or competitive developments;
•exposing us to the risk of increased interest rates because certain of our borrowings, including borrowings under our senior secured credit facilities, are at variable rates of interest;
•exposing us to the risk of fluctuations in exchange rates because of our euro-denominated notes;
•making it more difficult for us to satisfy our obligations with respect to our indebtedness, and any failure to comply with the obligations of any of our debt instruments, including restrictive covenants and borrowing conditions, could result in one or more events of default under the agreements governing such indebtedness or, through cross-defaults, in agreements governing other indebtedness;
•restricting us from making strategic acquisitions or capital investments or causing us to make non-strategic divestitures;
•limiting our ability to obtain additional financing for working capital, capital expenditures, product development, debt service requirements, acquisitions, and general corporate or other purposes; and
•limiting our flexibility in planning for, or reacting to, changes in our business or market conditions and placing us at a competitive disadvantage compared to our competitors who have less indebtedness relative to their size and who, therefore, may be able to take advantage of opportunities that our higher level of indebtedness prevents us from exploiting.
Our total interest expense, net was $123 million, $110 million, and $126 million for fiscal 2022, 2021, and 2020, respectively. After taking into consideration our ratio of fixed-to-floating-rate debt, including as a result of our February 2021 interest-rate swap agreement with Bank of America N.A., and assuming that our Revolving Credit Facility is undrawn and LIBOR is above any applicable minimum floor, each change of 100 basis points in interest rates would result in a change of approximately $9 million in annual interest expense on the indebtedness under our senior secured credit facilities.
Our interest expense may continue to increase as policymakers combat the inflation that has taken hold since fiscal 2022 through interest-rate increases on benchmark financial products that can affect the interest rates on our variable-rate debt.
Despite our high indebtedness level, we and our subsidiaries are still capable of incurring significant additional debt, which could further exacerbate the risks associated with our substantial indebtedness.
We and our subsidiaries may be able to incur substantial additional indebtedness in the future. Although the agreements governing our indebtedness contain restrictions on the incurrence of additional indebtedness, these restrictions are subject to a number of significant qualifications and exceptions, and, under certain circumstances, the amount of indebtedness that we may incur while remaining in compliance with these restrictions could be substantial. In addition, as of June 30, 2022, we had approximately $721 million available to us for borrowing, subject to certain conditions, under our Revolving Credit Facility. If new debt is added to our subsidiaries’ existing debt levels, the risks associated with debt we currently face would increase.
Our debt agreements contain restrictions that limit our flexibility in operating our business.
The agreements governing our outstanding indebtedness contain various covenants that limit our ability to engage in specified types of transactions. These covenants limit the ability of Operating Company and those of its subsidiaries to which these covenants apply (which Operating Company’s Amended and Restated Credit Agreement, dated as of May 20, 2014 (as amended, the “Credit Agreement”) calls “restricted subsidiaries”) to, among other things:
•incur additional indebtedness and issue certain preferred stock;
•pay certain dividends on, repurchase, or make distributions in respect of capital stock or make other restricted payments;
•pay distributions from restricted subsidiaries;
•issue or sell capital stock of restricted subsidiaries;
•guarantee certain indebtedness;
•make certain investments;
•sell or exchange certain assets;
•enter into transactions with affiliates;
•create certain liens; and
•consolidate, merge, or transfer all or substantially all of our assets and the assets of our subsidiaries on a consolidated basis.
A breach of any of these covenants could result in a default under one or more of these agreements, including as a result of cross-default provisions, and, in the case of our Revolving Credit Facility, permit the lenders to cease making loans to us.
Despite the limitations in our debt agreements, we retain the ability to take certain actions that may interfere with our ability to timely pay our substantial indebtedness.
The covenants in the Credit Agreement and in the several indentures governing our Senior Notes (collectively, the "Indentures") contain various exceptions to the limitations they otherwise impose on our ability and the ability of our restricted subsidiaries to take the various actions described in the prior risk factor. For example, if the Senior Notes have investment-grade ratings and we are not in default under these agreements, certain of these covenants will not apply, including the covenants restricting certain dividends and other payments, the covenants concerning the incurrence of indebtedness, and the covenants limiting guarantees of indebtedness by our restricted subsidiaries. In addition, the covenants restricting dividends and other distributions by us, purchases or redemption of certain equity securities, and prepayment, redemption, or repurchase of any subordinated indebtedness are subject to various exceptions.
We are currently using and may in the future use derivative financial instruments to reduce our exposure to market risks from changes in interest rates on our variable-rate indebtedness or changes in currency exchange rates, and any such instrument may expose us to risks related to counterparty credit worthiness or non-performance of these instruments.
We have executed and may enter into additional or new interest-rate swap agreements, currency swap agreements, or other hedging transactions in an attempt to limit our exposure to adverse changes in variable interest rates and currency exchange rates. Such instruments may result in economic losses if, for example, prevailing interest rates decline to a point lower than any applicable fixed-rate commitment. Any such swap will expose us to credit-related risks that, if realized, could adversely affect our results of operations or financial condition.
Risks Relating to Ownership of Our Common Stock
Our stock price has historically been and may continue to be volatile, and a holder of shares of our Common Stock may not be able to resell such shares at or above the price such stockholder paid, or at all, and could lose all or part of such investment as a result.
The trading price of our Common Stock has been and continues to be volatile. For the three years ended June 30, 2022, our Common Stock price as quoted on the NYSE ranged from $36.95 to $142.35. The trading price of our Common Stock may be adversely affected by any one or more of several factors, such as those listed above in “—Risks Relating to Our Business and Industry in Which We Operate” and the following:
•results of operations that vary from the expectations of securities analysts or investors;
•results of operations that vary from those of our competitors;
•changes in expectations as to our future financial performance, including financial estimates and investment recommendations by securities analysts or investors;
•declines in the market prices of stocks generally, or those of pharmaceutical or other healthcare companies;
•strategic actions by us or our competitors;
•announcements by us or our competitors of significant contracts, new products, acquisitions, joint marketing relationships, joint ventures, other strategic relationships, or capital commitments;
•changes in general economic or market conditions or trends in our industry or markets, such as increased inflation;
•changes in business or regulatory conditions or regulatory actions taken with respect to our business or the business of any of our competitors or customers;
•future sales of our Common Stock or other securities we may issue in the future;
•investor perceptions of the investment opportunity associated with our Common Stock relative to other investment alternatives;
•any decision by securities analysts to not publish research or reports about our business or to downgrade our stock or our sector;
•the public response to press releases or other public announcements by us or third parties, including our filings with or information furnished to the SEC;
•announcements relating to or developments in litigation;
•guidance, if any, that we provide to the public, any change in this guidance, or any failure to meet this guidance;
•the availability of an active trading market for our Common Stock;
•public response to changes in the COVID-19 pandemic and public perceptions as to the need for manufacture of certain COVID-19-related products and our role in the successful manufacture of such products;
•changes in the accounting principles we use to record our results or our application of these principles to our business; and
•other events or factors, including those resulting from natural disasters, hostilities, acts of terrorism, geopolitical activity, public health crises, including pandemics, or responses to these events.
Broad market and industry fluctuations may adversely affect the market price of our Common Stock, regardless of our actual operating performance. In addition, price volatility may be greater if the public float or trading volume of our Common Stock is low, and the amount of public float on any given day can vary depending on the individual actions of our stockholders.
Following periods of market volatility, stockholders have been known to institute securities class action litigation in order to recover their resulting losses. If we become involved in securities litigation, it could have a substantial cost and divert resources and the attention of senior management from our business regardless of the outcome of such litigation.
Because we have no plan to pay cash dividends on our Common Stock for the foreseeable future, receiving a return on an investment in our Common Stock may require a sale for a net price greater than what was paid for it.
We currently intend to retain future earnings, if any, for future operations, expansion, and debt repayment and have no current plan to pay any cash dividend on our Common Stock for the foreseeable future. Any future decision to pay a dividend in respect of our Common Stock, and the amount and timing of any such dividend, will be at the sole discretion of our board of directors. Our board of directors may take into account, when deciding whether or how to pay a dividend, such factors as they may deem relevant, including general economic conditions, our financial condition and results of operations, our available cash and current and anticipated cash needs, possible future alternative deployments of our cash, our future capital requirements, and contractual, legal, tax, and regulatory restrictions and implications on the payment of dividends by us to our holders of shares of our Common Stock or by our subsidiaries to us. In addition, our ability to pay dividends is limited by covenants in the agreements governing our outstanding indebtedness and may be limited by covenants of any future indebtedness we or our subsidiaries incur. As a result, a holder of a share of our Common Stock may not receive any return on such investment unless it is sold for a price greater than that which was paid for it, taking into account any applicable commission or other costs of acquisition or sale.
Future sales, or the perception of future sales, of our Common Stock, by us or our existing stockholders could cause the market price for our Common Stock to decline.
The sale of shares of our Common Stock in the public market, or the perception that such sales could occur, could harm the prevailing market price of shares of our Common Stock. These sales, or the possibility that these sales may occur, also might make it more difficult for us to sell equity securities in the future at a time and at a price that we deem appropriate.
The market price of shares of our Common Stock could drop significantly if the holders of our Common Stock sell their shares or are perceived by the market as intending to sell them. These factors could also make it more difficult for us to raise additional funds through future offerings of shares of our equity securities that we wish to issue. In the future, we may also issue our securities in connection with investments or acquisitions. The number of shares of our Common Stock issued or issuable in connection with an investment or acquisition could constitute a material portion of then-outstanding shares of our
Common Stock, subject to limitations on issuance of new shares without stockholder approval imposed by the NYSE or to restrictions set forth in the agreements governing our indebtedness, or the Stockholders’ Agreement between the Company and holders of our formerly outstanding Series A convertible preferred stock, par value $0.01 (the “Series A Preferred Stock”). Any issuance of additional securities in connection with investments, acquisitions, or otherwise may result in dilution to the holders of shares of our Common Stock.
Anti-takeover provisions in our organizational documents could delay or prevent a change of control.
Certain provisions of our current certificate of incorporation and bylaws may have an anti-takeover effect and may delay, defer, or prevent a merger, acquisition, tender offer, takeover attempt, or other change of control transaction that may otherwise be in the best interests of our stockholders, including transactions that might otherwise result in the payment of a premium over the market price for the shares held by our stockholders.
These provisions provide for, among other things:
•the ability of our board of directors to issue one or more series of preferred stock;
•advance notice for nominations of directors by stockholders and for stockholders to include matters to be considered at our annual meetings (though our board of directors has implemented shareholder proxy access); and
•certain limitations on convening special stockholder meetings.
Provisions such as those just described, to the extent that they remain in effect, could make it more difficult for a third party to acquire us, even if the third-party’s offer may be considered beneficial by many of our stockholders. As a result, our stockholders may be limited in their ability to obtain a premium for their shares.
ITEM 1B. UNRESOLVED STAFF COMMENTS
None.
ITEM 2. PROPERTIES
Our principal executive offices are located at 14 Schoolhouse Road, Somerset, New Jersey. As of June 30, 2022, we had 58 facilities (5 geographical locations operate as multiple facilities because they support more than one reporting segment, with our Somerset location including both a manufacturing facility and our principal executive offices), comprising manufacturing operations, development centers, and sales offices contained in approximately 8 million square feet of manufacturing, laboratory, office and related space. Our manufacturing capabilities include all required regulatory, quality assurance and in-house validation space. The following table sets forth our facilities containing manufacturing, laboratory, office, and related space by reporting segment and geographic location as of June 30, 2022:
| | | | | | | | | | | | | | | | | | | | | | | | | | | | | | | | | | | | | | |
| Geographic Region | | Biologics | | Softgel and Oral Technologies | | Oral and Specialty Delivery (2) | | Clinical Supply Services | | Corporate | | Total (1) |
| North America | | 10 | | 9 | | 6 | | 3 | | 1 | | 29 |
| South America | | — | | 3 | | — | | — | | 1 | | 4 |
| Europe | | 6 | | 4 | | 5 | | 3 | | 1 | | 19 |
| Asia-Pacific | | — | | 2 | | — | | 4 | | — | | 6 |
| Total | | 16 | | 18 | | 11 | | 10 | | 3 | | 58 |
(1) Sites that are used by multiple segments are included once for each segment in this table.
(2) The facility in Somerset, New Jersey houses both an Oral and Specialty Delivery facility and our principal executive offices.
Two of our manufacturing facilities, located in Bloomington, Indiana and Harmans, Maryland, together generate a material portion of our net revenue. We believe these facilities are suitable for their intended purposes, with adequate capacity for current and projected demand for their contracted products.
We generally seek to own, rather than lease, our manufacturing facilities, although some facilities are leased. Our office space and warehouse facilities are often leased.
Additional information with respect to our leases and property, plant, and equipment is contained in Notes 16 and 19, respectively, to our Consolidated Financial Statements.
ITEM 3. LEGAL PROCEEDINGS
From time to time, we may be involved in legal proceedings arising in the ordinary course of business, including, without limitation, inquiries and claims concerning environmental contamination as well as litigation and allegations in connection with acquisitions, product liability, manufacturing or packaging defects, and claims for reimbursement for the cost of lost or damaged active pharmaceutical ingredients, the cost of any of which could be significant. We intend to vigorously defend ourselves against any such litigation and do not currently believe that the outcome of any such litigation will have a material adverse effect on our financial statements. In addition, the healthcare industry is highly regulated and government agencies continue to scrutinize certain practices affecting government programs and otherwise.
From time to time, we receive subpoenas or requests for information relating to the business practices and activities of customers or suppliers from various governmental agencies or private parties, including from state attorneys general, the U.S. Department of Justice, and private parties engaged in patent infringement, antitrust, tort, and other litigation. We generally respond to such subpoenas and requests in a timely and thorough manner, and responses sometimes require considerable time and effort and can result in considerable costs being incurred. We expect to incur costs in future periods in connection with future requests.
ITEM 4. MINE SAFETY DISCLOSURES
Not Applicable.
PART II
ITEM 5. MARKET FOR REGISTRANT’S COMMON EQUITY, RELATED STOCKHOLDER MATTERS AND ISSUER PURCHASES OF EQUITY SECURITIES
The principal market for trading of our Common Stock is the NYSE. Our Common Stock trades under the symbol “CTLT.”
As of August 25, 2022, we had 11 holders of record of outstanding shares of our Common Stock. This number does not include beneficial owners whose shares were held in street name.
We did not declare or pay any dividend on our Common Stock in fiscal 2022 or fiscal 2021. We have no current plan to pay any dividend on our Common Stock. Any decision to declare and pay dividends in the future will be made at the sole discretion of our board of directors and will depend on, among other things, our results of operations, cash requirements, financial condition, contractual restriction, and other factors that our board of directors may deem relevant. Because we are a holding company and have no direct operations, we will only be able to pay dividends from funds we receive from our subsidiaries. In addition, our ability to pay dividends will be limited by covenants in our existing indebtedness and may be limited by the agreements governing other indebtedness we or our subsidiaries incur in the future. See “Management’s Discussion and Analysis of Financial Condition and Results of Operations—Liquidity and Capital Resources—Debt and Financing Arrangements—Debt Covenants.”
Recent Sales of Unregistered Equity Securities
We did not sell any unregistered equity securities during the period covered by this Annual Report.
Purchases of Equity Securities
We did not purchase any of our equity securities during the period covered by this Annual Report.
Performance Graph
Set forth below is a line graph comparing the cumulative total shareholder return on our Common Stock from June 30, 2017 through June 30, 2022, based on the market price of our Common Stock and assuming reinvestment of dividends, with the cumulative total shareholder return of companies on the S&P 500 Index and S&P 500 Health Care Index. The graph assumes that $100 was invested in our Common Stock and in each index at the market close on June 30, 2017. The stock price performance of the following graph is not necessarily indicative of future stock performance.
ITEM 6. [RESERVED]
ITEM 7. MANAGEMENT’S DISCUSSION AND ANALYSIS OF FINANCIAL CONDITION AND RESULTS OF OPERATIONS
The following discussion and analysis of our financial condition and results of operations should be read in conjunction with our Consolidated Financial Statements and related notes, which appear elsewhere in this Annual Report. This section of the Annual Report generally discusses the fiscal years ended June 30, 2022 and 2021 and year-to-year comparisons between the fiscal years ended June 30, 2022 and 2021. The discussion of our results of operations for the fiscal year ended June 30, 2020 and a comparison of our results for the fiscal years ended June 30, 2021 and 2020 is included in Item 7. Management's Discussion and Analysis of Financial Condition and Results of Operations, of our Annual Report on Form 10-K for the fiscal year ended June 30, 2021, filed with the SEC on August 30, 2021 and is incorporated herein by reference. In addition to historical consolidated financial information, the following discussion contains forward-looking statements that reflect our plans, estimates, and beliefs. Our actual results could differ materially from those discussed in the forward-looking statements. You should carefully read “Special Note Regarding Forward-Looking Statements” in this Annual Report. Factors that could cause or contribute to these differences include those discussed below and elsewhere in this Annual Report, particularly in “Item 1A. Risk Factors.”
Overview
We provide differentiated development and manufacturing solutions for drugs, protein-based biologics, cell and gene therapies, vaccines, and consumer health products at over fifty facilities across four continents under rigorous quality and operational standards. Our oral, injectable, and respiratory delivery technologies, along with our state-of-the-art protein and cell and gene therapy manufacturing capacity, address a wide and growing range of modalities and therapeutic and other categories across the biopharmaceutical and consumer health industries. Through our extensive capabilities, growth-enabling capacity, and deep expertise in product development, regulatory compliance, and clinical trial and commercial supply, we can help our customers take products to market faster, including nearly half of new drug products approved by the FDA in the last decade. Our development and manufacturing platforms, our proven formulation, supply, and regulatory expertise, and our broad and deep development and manufacturing know-how enable our customers to advance and then bring to market more products and better treatments for patients and consumers. Our commitment to reliably supply our customers’ and their patients’ needs is the foundation for the value we provide; annually, we produce nearly 80 billion doses for nearly 8,000 customer products, or approximately 1 in every 23 doses of such products taken each year by patients and consumers around the world. We believe that through our investments in state-of-the-art facilities and capacity expansion, including investments in facilities focused on new treatment modalities and other attractive market segments our continuous improvement activities devoted to operational and quality excellence, the sales of existing and introduction of new customer products, and, in some cases, our innovation activities and patents, we will continue to attract premium opportunities and realize the growth potential from these areas.
In fiscal 2022, we operated in four segments, which also constitute the four reporting segments further described in "Business—Our Reporting Segments" contained elsewhere in this Annual Report: Biologics, Softgel and Oral Technologies, Oral and Specialty Delivery, and Clinical Supply Services. Immediately following the end of fiscal 2022, we adopted a new operating structure with two operating segments: (1) Biologics and (2) Pharma and Consumer Health (discussed further in Note 20, Subsequent Events to our Consolidated Financial Statements).
The COVID-19 Pandemic
Our response to COVID-19
Since the start of the COVID-19 pandemic, we have taken steps to protect our employees, ensure the integrity and quality of our products and services, and maintain business continuity for our customers and their patients who depend on us to manufacture and supply critical products to the market. To address the multiple dimensions of the pandemic, a senior, multi-disciplinary team regularly monitors the global situation, executing mitigation activities as required.
Among other things, we implemented measures to avoid or reduce infection or contamination in line with guidelines issued by the U.S. Centers for Disease Control and Prevention, the World Health Organization, and local authorities where we operate, re-emphasized good hygiene practices, reorganized our workflows where permitted to maximize physical distancing, required supervisor approval for employee travel, facilitated safer alternatives to travel to and from work, and employed in some cases remote-working strategies. We also frequently monitor our supply chain to identify risks, delays, and concerns that may affect our ability to deliver our services and products. During fiscal 2022, we did not identify any significant risk, delay, or concern that had a substantial effect on such delivery, in part because of our adoption of various procedures to minimize and manage supply disruptions to our ongoing operations, including through business continuity plans and careful attention to inventory levels to assure supply of needed inputs. Our existing procedures, which are consistent with cGMP and other
regulatory standards, are intended to assure the integrity of our supply against any contamination. We have a detailed response plan to manage impacts of the virus on employee health, site operations, and product supply, including immediate assessment of the health of employees reporting symptoms, comprehensive risk assessment of any impact to quality, additional cleaning protocols, and alternative shift patterns to compensate should fewer employees be available.
Continuing effects of the pandemic, combined with the Ukrainian-Russian war, are likely to result in further or more severe supply-chain disruptions in fiscal 2023 and potentially beyond. We continue to execute our mitigation strategies, but there can be no assurance of the continued effectiveness of these strategies.
Impact of COVID-19 on Our Business and Results of Operations
Throughout the pandemic, we have observed occasional customer delays and cancellations, increases in absenteeism of production employees in our facilities in certain affected regions, disruptions in certain clinical trials supported by our Clinical Supply Services segment, and delays in inspections and product approvals by the FDA and regulatory authorities globally.
We have also seen substantial demand and related revenue from COVID-19-related products, particularly in our Biologics segment. In part to meet this demand, we accelerated and enhanced certain of our capital improvement plans to expand capacity for manufacturing drug substance and drug product for protein-based biologics and cell and gene therapies, particularly at our drug product facilities in Bloomington, Indiana, Anagni, Italy, and our commercial-scale viral vector manufacturing facility in Harmans, Maryland and hired thousands of new employees. We also implemented various strategies to protect our financial condition and results of operations should we experience a reduction in demand for COVID-19 related products, such as inserting take-or-pay and minimum volume requirements in the contracts we executed for the manufacture of certain COVID-19 related products. However, the extent and duration of revenue associated with COVID-19-related products is uncertain and dependent, in important respects, on factors outside our control.
The future duration and extent of the COVID-19 pandemic and the future demand for COVID-19 vaccines and therapies is unknown. Public opinion regarding certain COVID-19 vaccines and therapies and the product owners and manufacturers continues to change and has affected the demand for certain products and services. In addition, the concentration of revenue from certain COVID-19 vaccine products enhances our operational risk with respect to quality, security, regulatory inspections and business disruption resulting from any unforeseen event that affects any of the facilities or communities in which we manufacture COVID-19 vaccines. We have implemented various mechanisms to protect our customers, their material and product, and our business continuity, including enhanced security measures at certain facilities and heightened cybersecurity controls.
See also “Risk Factors — Risks Related to Our Business and the Industry in Which We Operate — Our business, financial condition, and results of operations may be adversely affected by global health epidemics, including the COVID-19 pandemic” and “Risk Factors — Risks Related to Our Business and the Industry in Which We Operate — The continually evolving nature of the COVID-19 pandemic and the resulting public health response, including the changing demand for various COVID-19 vaccines and treatments from both patients and governments around the world, may affect sales of the COVID-19 products we manufacture” elsewhere in this Annual Report.
Critical Accounting Policies and Recent Accounting Pronouncements
The following disclosure supplements the descriptions of our accounting policies contained in Note 1 to our Consolidated Financial Statements regarding significant areas of judgment. Management made certain estimates and assumptions during the preparation of the Consolidated Financial Statements in accordance with U.S. GAAP. These estimates and assumptions affect the reported amount of assets and liabilities and disclosures of contingent assets and liabilities in the Consolidated Financial Statements. These estimates also affect the reported amount of net earnings during the reporting periods. Actual results could differ from those estimates. Because of the size of the financial statement elements to which they relate, some of our accounting policies and estimates have a more significant impact on the Consolidated Financial Statements than others.
Management has discussed the development and selection of these critical accounting policies and estimates with the audit committee of our board of directors. A discussion of some of our more significant accounting policies and estimates follows.
Revenue Recognition
We sell products and services directly to our pharmaceutical, biopharmaceutical, and consumer health customers. The majority of our business is conducted through manufacturing and commercial product supply, development services, and clinical supply services.
Our contracts with customers often include promises to transfer multiple products and services to a customer. Determining whether products and services are considered distinct performance obligations that should be accounted for separately versus together may require judgment. For our manufacturing and commercial product supply revenue, the contract generally includes the terms of the manufacturing services and related product quality assurance procedures to comply with regulatory requirements. Due to the regulated nature of our business, these contract terms are highly interdependent and, therefore, are considered to be a single combined performance obligation. For our development services and clinical supply services revenue, our performance obligations vary per contract and are accounted for as separate performance obligations. If a contract contains a single performance obligation, we allocate the entire transaction price to the single performance obligation. If a contract contains multiple performance obligations, we allocate consideration to each performance obligation using the “relative standalone selling price” as defined under Accounting Standards Codification (“ASC”) 606, Revenue from Contracts with Customers. Generally, we utilize observable standalone selling prices in our allocations of consideration. If observable standalone selling prices are not available, we estimate the applicable standalone selling price using an adjusted market assessment approach, representing the amount that we believe the market is willing to pay for the applicable service. Revenue is recognized over time using an appropriate method of measuring progress towards fulfilling our performance obligation for the respective arrangement. Determining the measure of progress that consistently depicts our satisfaction of performance obligations within each of our revenue streams across similar arrangements requires judgment.
Our customer contracts generally include provisions entitling us to a termination penalty when the customer terminates prior to the contract’s nominal end date. The termination penalties in these customer contracts vary but are generally considered substantive for accounting purposes and create enforceable rights and obligations throughout the stated duration of the contract. We account for a contract termination as a contract modification in the period in which the customer gives notice of termination. The determination of the contract termination penalty is based on the terms stated in the relevant customer agreement. As of the modification date, we update our estimate of the transaction price using the expected value method, subject to constraints, and recognize the amount over the remaining performance period under the contract. In the event of a contract termination, revenues are recognized to the extent that it is probable that a significant reversal will not occur when any uncertainty is subsequently resolved.
Long-lived and Other Definite-Lived Intangible Assets
We allocate the cost of an acquired company to the tangible and identifiable intangible assets and liabilities acquired, with the remaining cost recorded as goodwill. Intangible assets primarily include customer relationships, technology and trademarks. Valuing the identifiable intangible assets requires judgment. For example, we applied a multi-period, excess-earnings method to measure the core technology acquired in the Bettera Wellness acquisition, which included certain assumptions, such as (i) the estimated annual net cash flows (including application of an appropriate margin for forecasted revenue, revenue obsolescence rate, selling and marketing costs, return on working capital, contributory asset charges, and other factors), (ii) the discount rate that appropriately reflects the risk inherent in each future cash flow stream, and (iii) an assessment of the asset’s life cycle, (iv) as well as other factors. Intangible assets are generally amortized on a straight-line basis, reflecting the pattern in which the economic benefits are consumed, and are amortized over their estimated useful lives.
We assess the impairment of identifiable intangibles if events or changes in circumstances indicate that the carrying values of the assets may not be recoverable. Factors that could trigger an impairment review include the following:
•significant under-performance relative to historical or projected future operating results;
•significant changes in the manner of use of the acquired assets or the strategy of the overall business;
•significant negative industry or economic trends; and
•recognition of goodwill impairment charges.
If we determine that the carrying value of identifiable intangibles and/or long-lived assets may not be recoverable based on the existence of one or more of the above indicators of impairment, we measure recoverability of assets by comparing the respective carrying value of the assets to the current and expected future cash flows, on an un-discounted basis, to be generated from such assets. If such analysis indicates that the carrying value of these assets is not recoverable, we measure an impairment based on the amount in which the net carrying amount of the assets exceeds the fair values of the assets. See Notes 3, Business Combinations and Divestitures and 5, Other Intangibles, net to the Consolidated Financial Statements.
Goodwill and Indefinite-Lived Intangible Assets
We account for purchased goodwill and intangible assets with indefinite lives in accordance with ASC 350, Intangibles - Goodwill and Other. Under ASC 350, goodwill and intangible assets with indefinite lives are not amortized, but instead are tested for impairment at least annually. We perform an impairment evaluation of goodwill annually during the fourth quarter of our fiscal year or when circumstances otherwise indicate an evaluation should be performed. The evaluation may begin with a
qualitative assessment for each reporting unit to determine whether it is more-likely-than-not that the fair value of the reporting unit is less than its carrying value. If the qualitative assessment does not generate a positive response, or if no qualitative assessment is performed, a quantitative assessment, based upon discounted cash flows, is performed and requires management to estimate future cash flows, growth rates, and economic and market conditions. In fiscal 2022 and 2020, we proceeded immediately to the quantitative assessment, but in fiscal 2021 we began with the qualitative assessment. Accordingly, no sensitivity analysis was performed for fiscal 2021. The evaluations performed in fiscal 2020, 2021, and 2022 resulted in no impairment charge.
See Notes 4, Goodwill and 5, Other Intangibles, net to the Consolidated Financial Statements.
Income Taxes
In accordance with ASC 740, Income Taxes, we account for income taxes using the asset and liability method. The asset and liability method requires recognition of deferred tax assets and liabilities for expected future tax consequences of temporary differences that currently exist between tax bases and the corresponding financial reporting bases of our assets and liabilities. Deferred tax assets and liabilities are measured using enacted tax rates in the respective jurisdictions in which we operate. Deferred taxes are not provided on the undistributed earnings of subsidiaries outside of the U.S. when it is expected that these earnings will be permanently reinvested. In fiscal 2018, we recorded a provision for U.S. income taxes and foreign withholding taxes in relation to expected repatriations as a result of the 2017 U.S. Tax Cuts and Jobs Act (the ”2017 Tax Act”), but we have not made any provision for U.S. income taxes on the remaining undistributed earnings of foreign subsidiaries as those earnings are considered permanently reinvested in the operations of those foreign subsidiaries in the years after 2018.
The 2017 Tax Act imposed taxes on so-called “global intangible low-taxed income” (“GILTI”) earned by certain foreign subsidiaries of a U.S. company. In accordance with ASC 740, we made an accounting policy election to treat taxes due on future U.S. inclusions in taxable income related to GILTI as a current-period expense when incurred.
We assess the realizability of deferred tax assets by considering all available evidence, both positive and negative. We evaluate four possible sources of taxable income when assessing the realizability of deferred tax assets:
•carrybacks of existing NOLs (if and to the extent permitted by tax law);
•future reversals of existing taxable temporary differences;
•tax planning strategies; and
•future taxable income exclusive of reversing temporary differences and carryforwards.
We consider the need to maintain a valuation allowance on deferred tax assets based on management’s assessment of whether it is more likely than not that we would realize those deferred tax assets as a result of future reversals of existing taxable temporary differences and the ability to generate sufficient taxable income within the carryforward period available under the applicable tax law.
Unrecognized tax benefits are generated when there are differences between tax positions taken in a tax return and amounts recognized in the Consolidated Financial Statements. Tax benefits are recognized in the Consolidated Financial Statements when it is more likely than not that a tax position will be sustained upon examination. To the extent we prevail in matters for which liabilities have been established or are required to pay amounts in excess of our liabilities, our effective income tax rate in a given period could be materially affected. An unfavorable income tax settlement may require the use of cash and result in an increase in our effective income tax rate in the year it is resolved. A favorable income tax settlement would be recognized as a reduction in the effective income tax rate in the year of resolution.
Our accounting for income taxes involves the application of complex tax regulations in the U.S. and in each of the non-U.S. jurisdictions in which we operate, particularly European tax jurisdictions. The determination of income subject to taxation in each tax-paying jurisdiction requires us to review reported book income and the events occurring during the year in each jurisdiction in which we operate. In addition, the application of deferred tax assets and liabilities will have an effect on the tax expense in each jurisdiction. For those entities engaging in transactions with affiliates, we apply transfer-pricing guidelines relevant in many jurisdictions in which we operate and make certain informed and reasonable assumptions and estimates about the relative value of contributions by affiliates when assessing the allocation of income and deductions between consolidated entities in different jurisdictions. The estimates and assumptions used in these allocations can result in uncertainty in the measured tax benefit.
Factors Affecting our Performance
Fluctuations in Operating Results
Our annual financial reporting period ends on June 30. Excluding the impact from COVID-19, our revenue and net earnings are generally higher in the third and fourth quarters of each fiscal year, with our first fiscal quarter typically generating our lowest revenue of any quarter, and our last fiscal quarter typically generating our highest revenue. These fluctuations are primarily the result of the timing of our, and our customers’, annual operational maintenance periods at locations in Europe and the U.S., the seasonality associated with pharmaceutical and biotechnology budgetary spending decisions, clinical trial and research and development schedules, the timing of new product launches and length of time needed to obtain full market penetration, and, to a lesser extent, the time of the year some of our customers’ products are in higher demand.
Acquisition and Related Integration Efforts
Our growth and profitability are affected by the acquisitions we complete and the speed at which we integrate those acquisitions into our existing operating platforms. In fiscal 2020, we completed the acquisition of and integrated additional gene and cell therapy assets in the U.S. and Belgium. We also completed the acquisition of and integrated the Anagni facility in Italy. In fiscal 2021, we expanded our capacity and capabilities through five acquisitions for our Biologics segment and through the acquisition of a dry powder inhaler and spray dry manufacturing business from Acorda Therapeutics, Inc. (“Acorda”). In fiscal 2022, we acquired each of Bettera Wellness, a manufacturer of a consumer-preferred gummy and other formats for consumer health products, a commercial-scale cell therapy manufacturing facility in Princeton, New Jersey, and a manufacturing facility for biologic therapies and vaccines near Oxford, U.K.
Foreign Exchange Rates
Our operating network is global, and, as a result, we have substantial revenues and operating expenses that are denominated in currencies other than the U.S. dollar, the currency in which we report our financial results, and are therefore influenced by changes in currency exchange rates. In fiscal 2022, approximately 36% of our net revenue was generated from our operations outside the U.S. Foreign currencies for our operations include the British pound, European euro, Brazilian real, Argentine peso, Japanese yen, and the Canadian dollar.
Inflation
In fiscal 2022, we began to experience the effects of inflation, which increased to levels not seen in more than 30 years. In response, we began to implement various mitigation strategies, including in some cases increasing prices to customers or reducing other costs of operation, including through price renegotiations with suppliers. The effects of inflation, after accounting for these mitigation strategies, was immaterial to our financial results in fiscal 2022, but inflation is likely to continue for most or all of fiscal 2023, at least, and there can be no assurance that our mitigating strategies will continue to enjoy the same degree of success.
Trends Affecting Our Business
Industry
We participate in nearly every sector of the global pharmaceutical and biotechnology industry, which has been estimated to generate more than $1 trillion in annual revenue, including, but not limited to, the prescription drug and biologic sectors as well as consumer health, which includes the over-the-counter and vitamins and nutritional supplement sectors. Innovative pharmaceuticals, and biologics in particular, continue to play a critical role in the global market, while the share of revenue due to generic drugs and biosimilars is increasing in both developed and developing markets. Sustained developed market demand and rapid growth in emerging economies is driving consumer health product growth. Payors, both public and private, have sought to limit the economic impact of pharmaceutical and biologics product demand through greater use of generic and biosimilar drugs, access and spending controls, and health technology assessment techniques, favoring products that deliver truly differentiated outcomes.
New Molecule Development and R&D Sourcing
Continued strengthening in early-stage development pipelines for drugs and biologics, compounded by increasing clinical trial breadth and complexity, support our belief in the attractive growth prospects for development solutions. Large companies are in many cases reconfiguring their R&D resources, increasingly involving the use of strategic partners for important outsourced functions and new treatment modalities. Additionally, an increasing portion of compounds in development are from companies that do not have a full research and development infrastructure, and thus are more likely to need strategic development solutions partners.
Demographics
Aging population demographics in developed countries, combined with the global COVID-19 pandemic and health care reforms in many global markets that are expanding access to treatments to a greater proportion of the global population, will continue to drive increases in demand for pharmaceuticals, biologics, and consumer health products. Increasing economic affluence in developing regions will further increase demand for healthcare treatments, and we are taking active steps to allow us to participate effectively in these growth regions and product categories.
Finally, we believe the market access and payor pressures our customers face, global supply chain complexity, and the increasing demand for improved and new modality treatments will continue to escalate the need for advanced formulation and manufacturing, product differentiation, improved outcomes, and treatment cost reduction, all of which can often be addressed using our advanced delivery technologies.
Non-GAAP Metrics
As described in this section, management uses various financial metrics, including certain metrics that are not based on concepts defined in U.S. GAAP, to measure and assess the performance of our business, to make critical business decisions, and to assess our compliance with certain financial obligations. We therefore believe that presentation of certain of these non-GAAP metrics in this Annual Report will aid investors in understanding our business.
EBITDA from operations
Management measures operating performance based on consolidated earnings from operations before interest expense, expense for income taxes, and depreciation and amortization, adjusted for the income attributable to non-controlling interests (“EBITDA from operations”). EBITDA from operations is not defined under U.S. GAAP, is not a measure of operating income, operating performance, or liquidity presented in accordance with U.S. GAAP, and is subject to important limitations.
We believe that the presentation of EBITDA from operations enhances an investor’s understanding of our financial performance. We believe this measure is a useful financial metric to assess our operating performance across periods and use this measure for business planning purposes. In addition, given the significant investments that we have made in the past in property, plant, and equipment, depreciation and amortization expenses represent a meaningful portion of our cost structure. We believe that disclosing EBITDA from operations provides investors with a useful tool for assessing the comparability between periods of our ability to generate cash from operations sufficient to pay taxes, service debt, and undertake capital expenditures without consideration of non-cash depreciation and amortization expense. We present EBITDA from operations in order to provide supplemental information that we consider relevant for readers of the Consolidated Financial Statements, and such information is not meant to replace or supersede U.S. GAAP measures. Our definition of EBITDA from operations may not be the same as similarly titled measures used by other companies. The most directly comparable measure to EBITDA from operations defined under U.S. GAAP is net earnings. Included in this Management’s Discussion and Analysis is a reconciliation of net earnings to EBITDA from operations.
In addition, we evaluate the performance of our segments based on segment earnings before non-controlling interest, other (income) expense, impairments, restructuring costs, interest expense, income tax expense, stock-based compensation, gain (loss) on sale of subsidiary, and depreciation and amortization (“Segment EBITDA”).
Adjusted EBITDA
Under the Credit Agreement and in the Indentures, the ability of Operating Company to engage in certain activities, such as incurring certain additional indebtedness, making certain investments, and paying certain dividends, is tied to ratios based on Adjusted EBITDA (which is defined as “Consolidated EBITDA” in the Credit Agreement and “EBITDA” in the Indentures). Adjusted EBITDA is a covenant compliance measure in our Credit Agreement and Indentures, particularly those covenants governing debt incurrence and restricted payments. Adjusted EBITDA is based on the definitions in the Credit Agreement, is not defined under U.S. GAAP, is not a measure of operating income, operating performance, or liquidity presented in accordance with U.S. GAAP, and is subject to important limitations. Because not all companies use identical calculations, our presentation of Adjusted EBITDA may not be comparable to other similarly titled measures of other companies.
In addition, we use Adjusted EBITDA as a performance metric that guides management in its operation of and planning for the future of the business and drives certain management compensation programs. Management believes that Adjusted EBITDA provides a useful measure of our operating performance from period to period by excluding certain items that are not representative of our core business, including interest expense and non-cash charges like depreciation and amortization.
The measure under U.S. GAAP most directly comparable to Adjusted EBITDA is net earnings. In calculating Adjusted EBITDA, we add back certain non-cash, non-recurring, and other items that are deducted when calculating EBITDA from operations and net earnings, consistent with the requirements of the Credit Agreement. Adjusted EBITDA, among other things:
•does not include non-cash stock-based employee compensation expense and certain other non-cash charges;
•does not include cash and non-cash restructuring, severance, and relocation costs incurred to realize future cost savings and enhance operations;
•adds back any non-controlling interest expense, which represents minority investors’ ownership of non-wholly owned consolidated subsidiaries and is, therefore, not available; and
•includes estimated cost savings that have not yet been fully reflected in our results.
Adjusted Net Income and Adjusted Net Income per Share
We use Adjusted Net Income and Adjusted Net Income per share (which we sometimes refer to as “Adjusted EPS”) as performance metrics. Adjusted Net Income is not defined under U.S. GAAP, is not a measure of operating income, operating performance, or liquidity presented in accordance with U.S. GAAP, and is subject to important limitations. We believe that providing information concerning Adjusted Net Income and Adjusted Net Income per share enhances an investor’s understanding of our financial performance. We believe that these measures are useful financial metrics to assess our operating performance from period to period by excluding certain items that we believe are not representative of our core business, and we use these measures for business planning and executive compensation purposes. We define Adjusted Net Income as net earnings adjusted for (1) earnings or loss from discontinued operations, net of tax, (2) amortization attributable to purchase accounting, and (3) income or loss from non-controlling interest in majority-owned operations. We also make adjustments for other cash and non-cash items (as shown above, in “—Adjusted EBITDA”), partially offset by our estimate of the tax effect of such cash and non-cash items. Our definition of Adjusted Net Income may not be the same as similarly titled measures used by other companies. Adjusted Net Income per share is computed by dividing Adjusted Net Income by the weighted average diluted shares outstanding.
Use of Constant Currency
As exchange rates are an important factor in understanding period-to-period comparisons, we believe the presentation of results on a constant currency basis in addition to reported results helps improve investors’ ability to understand our operating results and evaluate our performance in comparison to prior periods. Constant currency information compares results between periods as if exchange rates had remained constant period-over-period. We use results on a constant currency basis as one measure to evaluate our performance. In this Annual Report, we calculate constant currency by calculating current-year results using prior-year foreign currency exchange rates. We generally refer to such amounts calculated on a constant currency basis as excluding the impact of foreign exchange. These results should be considered in addition to, not as a substitute for, results reported in accordance with U.S. GAAP. Results on a constant currency basis, as we present them, may not be comparable to similarly titled measures used by other companies and are not measures of performance presented in accordance with U.S. GAAP.
Summary Two-Year Key Financial Performance Metrics
Discussion of the year-over-year changes for the fiscal year ended June 30, 2021 compared to the fiscal year ended June 30, 2020 and the results of operations and cash flows for the fiscal year ended June 30, 2020, is included in Item 7, Management's Discussion and Analysis of Financial Condition and Result of Operations of our Annual Report on Form 10-K for the fiscal year ended June 30, 2021, filed with the SEC on August 30, 2021, and is incorporated herein by reference.
The below tables summarize our results in fiscal 2022 and 2021 with respect to several financial metrics we use to measure performance. Refer to the discussions below regarding performance and the use of key financial metrics and “—Non-GAAP Metrics—Use of Constant Currency” concerning the measurement of revenue at “constant currency.”
Fiscal Year Ended June 30, 2022 compared to the Fiscal Year Ended June 30, 2021
Results for the fiscal year ended June 30, 2022 compared to the fiscal year ended June 30, 2021 were as follows:
| | | | | | | | | | | | | | | | | | | | | | | | | | | | | |
| (Dollars in millions) | Fiscal Year Ended
June 30, | | FX Impact | | Constant Currency
Increase (Decrease) |
| 2022 | | 2021 | | | | Change $ | | Change % * |
| Net revenue | $ | 4,828 | | | $ | 3,998 | | | $ | (84) | | | $ | 914 | | | 23 | % |
| Cost of sales | 3,188 | | | 2,646 | | | (48) | | | 590 | | | 22 | % |
| Gross margin | 1,640 | | | 1,352 | | (36) | | | 324 | | | 24 | % |
| Selling, general, and administrative expenses | 844 | | | 687 | | | (6) | | | 163 | | | 24 | % |
| Gain on sale of subsidiary | (1) | | | (182) | | | — | | | 181 | | | (99) | % |
| Other operating expense | 41 | | | 19 | | | (1) | | | 23 | | | 110 | % |
| Operating earnings | 756 | | | 828 | | | (29) | | | (43) | | | (5) | % |
| Interest expense, net | 123 | | | 110 | | | (1) | | | 14 | | | 12 | % |
| Other expense, net | 28 | | | 3 | | | (7) | | | 32 | | | 1,227 | % |
| Earnings before income taxes | 605 | | | 715 | | | (21) | | | (89) | | | (12) | % |
| Income tax expense | 86 | | | 130 | | | (6) | | | (38) | | | (30) | % |
| | | | | | | | | |
| | | | | | | | | |
| Net earnings | $ | 519 | | | $ | 585 | | | $ | (15) | | | $ | (51) | | | (9) | % |
| | | | | | | | | |
| | | | | | | | | |
* Change % calculations are based on amounts prior to rounding.
Net Revenue
| | | | | | | | | | | | | | | |
| | 2022 vs. 2021 | |
| Year-Over-Year Change | | Fiscal Year Ended
June 30, | |
| | Net Revenue | |
| Organic | | 20 | % | |
| Impact of acquisitions | | 5 | % | |
| Impact of divestitures | | (2) | % | |
| Constant currency change | | 23 | % | |
| Foreign currency translation impact on reporting | | (2) | % | |
| Total % change | | 21 | % | |
| | | | | |
Net revenue increased by $914 million, or 23%, excluding the impact of foreign exchange, compared to the fiscal year ended June 30, 2021. Net revenue increased 20% organically on a constant-currency basis, primarily related to (i) broad-based strength across our Biologics offerings, in particular demand for our drug product and drug substance offerings for COVID-19 related programs, (ii) increased demand for our customers' prescription products, (iii) a continued rebound in our consumer health products, particularly in cough, cold, and over-the-counter pain relief products, and (iv) growth in development services in our Softgel and Oral Technologies segment.
Net revenue increased 5% inorganically as a result of acquisitions, which was partially offset by a 2% decrease in net revenue due to the sale of Catalent USA Woodstock, Inc. and related assets (collectively, the “Blow-Fill-Seal Business”) in fiscal 2021. Inorganic net revenue resulted from our acquisitions of Skeletal Cell Therapy Support SA (“Skeletal”), Delphi Genetics SA (“Delphi”) and the manufacturing and packaging assets of Acorda in fiscal 2021, as well as RheinCell Therapeutics GmbH (“RheinCell”), Bettera Wellness and a cell therapy commercial manufacturing facility and its operations in Princeton, New Jersey (“Princeton”) from Erytech Pharma S.A. (“Erytech”) in fiscal 2022.
Gross Margin
Gross margin increased by $324 million, or 24%, in fiscal 2022 compared to fiscal 2021, excluding the impact of foreign exchange, primarily as a result of the strong margin profile for all Biologics segment offerings, including demand across our drug product and drug substance offerings for COVID-19 related programs. Additional factors for such growth included increased demand for prescription products, a continued rebound in demand for consumer health products in our Softgel and Oral Technologies segment, and a favorable impact from prior-year recall charges in our Oral and Specialty Delivery segment. Margin growth was offset in part by a $47 million increase in depreciation expense, a one-time non-cash $7 million fair value inventory adjustment associated with our Bettera Wellness acquisition and an unfavorable impact from remediation activities at our Brussels facility.
On a constant-currency basis, gross margin, as a percentage of net revenue, increased 30 basis points to 34.1% in the fiscal year ended June 30, 2022, compared to 33.8% in the prior year, primarily due to the higher margin profile associated with our Biologics segment.
Selling, General, and Administrative Expense
Selling, general, and administrative expense increased by $163 million, or 24%, in fiscal 2022 compared to fiscal 2021, excluding the impact of foreign exchange, which includes $46 million in net incremental expenses from acquired and divested companies. The year-over-year increase in selling, general, and administrative expenses was primarily due to a $19 million increase in employee health and welfare costs, a $15 million increase in information technology spend, $14 million in employee-related costs primarily incurred for wages and bonuses, a $13 million increase in amortization and depreciation, $10 million of incremental bad debt expense, an $8 million increase in travel and entertainment, and a $5 million increase in integration costs associated with acquisitions.
Other Operating Expense
Other operating expense for the fiscal years ended June 30, 2022 and 2021 was $41 million and $19 million, respectively. The year-over-year increase was due to a $22 million increase in fixed asset impairment charges primarily associated with dedicated equipment for a product that we no longer manufacture in our respiratory and specialty platform and certain obsolete equipment in our Biologics segment.
Interest Expense, net
Interest expense, net, of $123 million in fiscal 2022 increased by $14 million, or 12%, compared to fiscal 2021, excluding the impact of foreign exchange. The savings from repayment of our formerly outstanding term loans and early redemption of our U.S. dollar-denominated 4.875% Senior Notes due 2026 (the “2026 Notes”) in fiscal 2021 were fully offset by increases in interest expense from our most recent tranche of term loans, the 2029 Notes, and the 2030 Notes.
For additional information concerning our debt and financing arrangements, including the changing mix of debt and equity in our capital structure, see “—Liquidity and Capital Resources—Debt and Financing Arrangements” and Note 7, Long-Term Obligations and Short-Term Borrowings to the Consolidated Financial Statements.
Other Expense, net
Other expense, net of $28 million for fiscal 2022 was primarily driven by $33 million of foreign currency losses and $4 million of financing charges related to our outstanding term loans, partially offset by a $2 million gain related to the change in fair value of the derivative liability arising from the dividend-adjustment mechanism of our formerly outstanding Series A Preferred Stock.
Other expense, net of $3 million for fiscal 2021 was primarily driven by an $11 million premium on early redemption of the 2026 Notes, a write-off of $4 million of previously capitalized financing charges related to our repayment of term loans and our redeemed 2026 Notes, $3 million of financing charges related to our outstanding term loans, and a net foreign currency translation loss of $5 million. Those losses were partially offset by a gain of $17 million related to the fair value of the derivative liability associated with our previously outstanding Series A Preferred Stock.
Provision for Income Taxes
Our provision for income taxes for the fiscal year ended June 30, 2022 was $86 million relative to earnings before income taxes of $605 million. Our provision for income taxes for the fiscal year ended June 30, 2021 was $130 million relative to earnings before income taxes of $715 million. The decreased income tax provision for the current-year period over the prior-year period was largely the result of a decrease in pretax income, a $69 million income tax benefit for U.S. foreign tax credits resulting from an amendment to prior-year returns, and the tax benefit associated with the establishment of a net deferred tax asset expected to arise as a result of recently enacted tax reform in Switzerland and related transition rules (collectively, “Swiss Tax Reform”). This decrease was partially offset by certain deemed income inclusion in the U.S., a $26 million income tax charge for establishing a valuation allowance against the net deferred tax assets of certain Belgian operations, and a $62 million valuation allowance against the aforementioned tax benefit related to Swiss Tax Reform. The provision for income taxes in each of fiscal 2022 and 2021 was also affected by the geographic distribution of our pretax income, the tax impact of permanent differences, restructuring, special items, and other discrete tax items that may have unique tax implications depending on the nature of the item.
Segment Review
The below charts depict the percentage of net revenue from each of our four reporting segments for the previous two years. Refer below for discussions regarding the segments’ net revenue and EBITDA performance and to “—Non-GAAP Metrics” for a discussion of our use of Segment EBITDA, a measure that is not defined under U.S. GAAP.
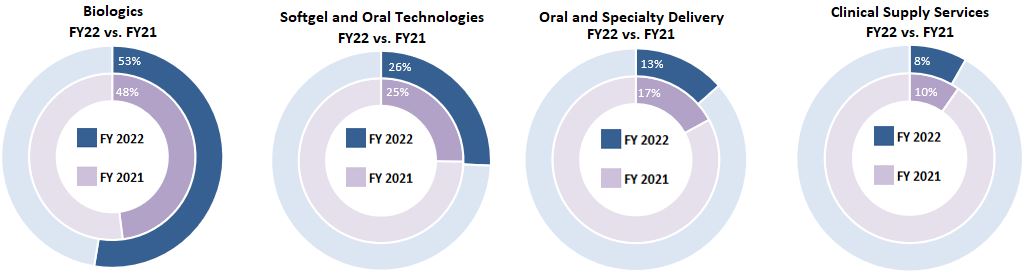
Our results on a segment basis for the fiscal year ended June 30, 2022 compared to the fiscal year ended June 30, 2021 were as follows: | | | | | | | | | | | | | | | | | | | | | | | | | | | | | |
| (Dollars in millions) | Fiscal Year Ended
June 30, | | FX Impact | | Constant Currency
Increase (Decrease) |
| 2022 | | 2021 | | | | Change $ | | Change % (1) |
| Biologics | | | | | | | | | |
| Net revenue | $ | 2,549 | | | $ | 1,928 | | | $ | (35) | | | $ | 656 | | | 34 | % |
| Segment EBITDA | 798 | | | 608 | | | (14) | | | 204 | | | 34 | % |
| Softgel and Oral Technologies | | | | | | | | | |
| Net revenue | 1,246 | | | 1,012 | | | (32) | | | 266 | | | 26 | % |
| Segment EBITDA | 292 | | | 237 | | | (8) | | | 63 | | | 27 | % |
| Oral and Specialty Delivery | | | | | | | | | |
| Net revenue | 650 | | | 686 | | | (12) | | | (24) | | | (3) | % |
| Segment EBITDA | 192 | | | 160 | | | (6) | | | 38 | | | 24 | % |
| Clinical Supply Services | | | | | | | | | |
| Net revenue | 400 | | | 391 | | | (6) | | | 15 | | | 4 | % |
| Segment EBITDA | 110 | | | 108 | | | (3) | | | 5 | | | 5 | % |
| Inter-segment revenue elimination | (17) | | | (19) | | | 1 | | | 1 | | | 3 | % |
Unallocated Costs(2) | (286) | | | 1 | | | 5 | | | (292) | | | * |
| Combined totals | | | | | | | | | |
| Net revenue | $ | 4,828 | | | $ | 3,998 | | | $ | (84) | | | $ | 914 | | | 23 | % |
| | | | | | | | | |
| EBITDA from operations | $ | 1,106 | | | $ | 1,114 | | | $ | (26) | | | $ | 18 | | | 2 | % |
(1) Change % calculations are based on amounts prior to rounding.
* Not meaningful
(2) Unallocated costs include restructuring and special items, stock-based compensation, gain (loss) on sale of subsidiary, impairment charges, certain other corporate-directed costs, and other costs that are not allocated to the segments as follows:
| | | | | | | | | | | |
| | Fiscal Year Ended
June 30, |
| (Dollars in millions) | 2022 | | 2021 |
Impairment charges and gain/loss on sale of assets(a) | $ | (31) | | | $ | (9) | |
| Stock-based compensation | (54) | | | (51) | |
Restructuring and other special items (b) | (55) | | | (31) | |
| | | |
| | | |
| | | |
Gain on sale of subsidiary (c) | 1 | | | 182 | |
Other expense, net (d) | (28) | | | (3) | |
| Non-allocated corporate costs, net | (119) | | | (87) | |
| Total unallocated costs | $ | (286) | | | $ | 1 | |
(a) For the fiscal year ended June 30, 2022, impairment charges are primarily due to fixed asset impairment charges associated with dedicated equipment for a product that we no longer manufacture in our respiratory and specialty platform and obsolete equipment in our Biologics platform.
(b) Restructuring and other special items for the fiscal year ended June 30, 2022 include (i) transaction and integration costs primarily associated with the Princeton acquisition, and the Bettera Wellness, Delphi, Hepatic Cell Therapy Support SA (“Hepatic”), Acorda and RheinCell transactions and (ii) unrealized losses on venture capital investments. Restructuring and other special items during the fiscal year ended June 30, 2021 include (1) transaction costs for the sale of our Blow-Fill-Seal Business, (2) transaction and integration costs associated with the acquisition of our facility in Anagni, Italy, the Acorda, Masthercell Global Inc. (“MaSTherCell”), Delphi, Hepatic, and Skeletal transactions and the acquisition of Société d’infrastructures, de services et d’énergies SA, and (3) restructuring costs associated with the closure of our Clinical Supply Services facility in Bolton, U.K. Refer to Note 3, Business Combinations and Divestitures for further details on the transactions listed above.
(c) For the fiscal years ended June 30, 2022 and 2021, gain on sale of subsidiary is due to the divestiture of our Blow-Fill-Seal Business, which was formerly part of our Oral and Specialty Delivery segment. Refer to Note 3, Business Combinations and Divestitures for further details on the sale of the Blow-Fill-Seal Business.
(d) Refer to Note 15, Other Expense, net for details of financing charges and foreign currency adjustments recorded within Other Expense, net in our Consolidated Financial Statements.
Provided below is a reconciliation of net earnings to EBITDA from operations:
| | | | | | | | | | | |
| | Fiscal Year Ended
June 30, |
| (Dollars in millions) | 2022 | | 2021 |
| Net earnings | $ | 519 | | | $ | 585 | |
| Depreciation and amortization | 378 | | | 289 | |
| Interest expense, net | 123 | | | 110 | |
| Income tax expense | 86 | | | 130 | |
| | | |
| EBITDA from operations | $ | 1,106 | | | $ | 1,114 | |
Biologics segment | | | | | | | | | | | |
| 2022 vs. 2021 |
| Year-Over-Year Change | Fiscal Year Ended
June 30, |
| Net Revenue | | Segment EBITDA |
| Organic | 34 | % | | 35 | % |
| Impact of acquisitions | — | % | | (1) | % |
| | | |
| Constant currency change | 34 | % | | 34 | % |
| Foreign exchange translation impact on reporting | (2) | % | | (2) | % |
| Total % change | 32 | % | | 32 | % |
Net revenue in our Biologics segment increased by $656 million, or 34%, excluding the impact of foreign exchange, compared to the fiscal year ended June 30, 2021. The increase was driven across all segment offerings by strong end-market demand for our global drug product, drug substance, and cell and gene therapy offerings, primarily related to demand for COVID-19-related programs.
Biologics Segment EBITDA increased by $204 million, or 34%, excluding the impacts of foreign exchange and acquisitions, compared to the fiscal year ended June 30, 2021, Excluding the impact of acquisitions, Segment EBITDA increased 35%, compared to the fiscal year end June 30, 2021. The increase was driven across all segment offerings by strong end-market demand for our drug product, drug substance, and cell and gene therapy offerings, primarily related to demand for COVID-19-related programs, and partially offset by an unfavorable impact from remediation activities at our Brussels facility.
We completed the acquisition of RheinCell in August 2021. In April 2022, we completed the acquisition of Princeton. For the fiscal year ended June 30, 2022, these acquisitions had an immaterial impact on our net revenue and decreased Segment EBITDA on an inorganic basis by 1% compared to the corresponding prior-year period.
Softgel and Oral Technologies segment
| | | | | | | | | | | |
| 2022 vs. 2021 |
| Year-Over-Year Change | Fiscal Year Ended
June 30, |
| Net Revenue | | Segment EBITDA |
| Organic | 10 | % | | 12 | % |
| Impact of acquisitions | 16 | % | | 15 | % |
| | | |
| Constant currency change | 26 | % | | 27 | % |
| Foreign exchange translation impact on reporting | (3) | % | | (4) | % |
| Total % change | 23 | % | | 23 | % |
Net revenue in our Softgel and Oral Technologies segment increased by $266 million, or 26%, excluding the impact of foreign exchange, compared to the fiscal year ended June 30, 2021. Net revenue increased 10%, compared to the fiscal year ended June 30, 2021, excluding the impact of acquisitions. The increase in organic revenue primarily relates to strong end-market demand for prescription products, a continued rebound in consumer health products, particularly in cough, cold, and over-the-counter pain relief products, and growth in development services.
Softgel and Oral Technologies Segment EBITDA increased by $63 million, or 27%, excluding the impact of foreign exchange, compared to the fiscal year ended June 30, 2021. Segment EBITDA increased 12%, compared to the fiscal year ended June 30, 2021, excluding the impact of acquisitions. The increase in organic Segment EBITDA, similar to that of net revenue, was primarily driven by an increase in demand for prescription products, a continued rebound in consumer health products, particularly in cough, cold, and over-the-counter pain relief products, and the margin generated from strong development revenue growth.
We completed the Bettera Wellness acquisition in October 2021, which increased net revenue and Segment EBITDA on an inorganic basis by 16% and 15%, respectively, during the fiscal year ended June 30, 2022, compared to the corresponding prior-year period. For the fiscal year ended June 30, 2022, we recorded a one-time non-cash inventory fair value adjustment for $7 million resulting from our Bettera Wellness purchase accounting, which unfavorably impacted Segment EBITDA.
Oral and Specialty Delivery segment | | | | | | | | | | | |
| 2022 vs. 2021 |
| Year-Over-Year Change | Fiscal Year Ended
June 30, |
| Net Revenue | | Segment EBITDA |
| Organic | 6 | % | | 43 | % |
| Impact of acquisitions | 1 | % | | (7) | % |
| Impact of divestitures | (10) | % | | (12) | % |
| Constant currency change | (3) | % | | 24 | % |
| Foreign exchange translation impact on reporting | (2) | % | | (4) | % |
| Total % Change | (5) | % | | 20 | % |
Net revenue in our Oral and Specialty Delivery segment decreased by $24 million, or 3%, excluding the impact of foreign exchange, compared to the fiscal year ended June 30, 2021. Net revenue increased 6%, compared to the fiscal year ended June 30, 2021, excluding the impact of acquisitions and divestitures, primarily driven by demand for the segment’s orally disintegrating Zydis commercial products and demand for early-phase development programs.
Oral and Specialty Delivery Segment EBITDA increased by $38 million, or 24%, excluding the impact of foreign exchange, compared to the fiscal year ended fiscal year ended June 30, 2021. Segment EBITDA increased 43%, compared to the fiscal year ended June 30, 2021, excluding the impact of acquisitions and divestitures. The increase in organic Segment EBITDA from the corresponding prior-year period was primarily driven by increased demand for the segment’s orally disintegrating Zydis commercial products and a favorable impact from prior-year recall charges in our respiratory and specialty platform.
We completed the Acorda transaction in February 2021. For the fiscal year ended June 30, 2022, this acquisition increased our net revenue by 1% and unfavorably impacted Segment EBITDA on an inorganic basis by 7% compared to the corresponding prior-year period.
We completed the Blow-Fill-Seal Business divestiture in March 2021. For the fiscal year ended June 30, 2022, this divestiture decreased our net revenue and Segment EBITDA on an inorganic basis by 10% and 12%, respectively, compared to the corresponding prior-year period.
Clinical Supply Services segment | | | | | | | | | | | |
| 2022 vs. 2021 |
| Fiscal Year Ended
June 30, |
| Year-Over-Year Change | Net Revenue | | Segment EBITDA |
| Organic | 4 | % | | 5 | % |
| | | |
| | | |
| Constant currency change | 4 | % | | 5 | % |
| Foreign exchange translation impact on reporting | (2) | % | | (3) | % |
| Total % Change | 2 | % | | 2 | % |
Net revenue in our Clinical Supply Services segment increased by $15 million, or 4%, excluding the impact of foreign exchange, compared to the fiscal year ended June 30, 2021. The increase was driven by growth in our manufacturing and packaging and storage and distribution offerings in the North America and Asia Pacific regions.
Clinical Supply Services Segment EBITDA increased by $5 million, or 5%, excluding the impact of foreign exchange, compared to the fiscal year ended June 30, 2021, primarily due to growth in the Asia Pacific region and operational efficiencies in our Western Europe facilities.
Liquidity and Capital Resources
Sources and use of Cash
Our principal source of liquidity has been cash flow generated from operations and the net proceeds of capital market activities. The principal uses of cash are to fund operating and capital expenditures, business or asset acquisitions, interest payments on debt, and any mandatory or discretionary principal payment on our debt. As of June 30, 2022, and following the September 2021 execution of Amendment No. 6 (the “Sixth Amendment”) to the Credit Agreement, we had available a $725 million Revolving Credit Facility that matures in May 2024, the capacity of which is reduced by the amount of all outstanding letters of credit issued under the senior secured credit facilities and those short-term borrowings referred to as swing-line borrowings. At June 30, 2022, we had $4 million of outstanding letters of credit and no outstanding borrowing under our Revolving Credit Facility.
We believe that our cash on hand, cash from operations, and available borrowings under our Revolving Credit Facility will be adequate to meet our future liquidity needs for at least the next twelve months, including the amounts expected to become due with respect to our pending capital projects. We have no significant maturity under any of our bank or note debt until the July 2027 maturity of our 2027 Notes.
On August 9, 2022, we entered into a purchase agreement to acquire Metrics Contract Services ("Metrics") and will pay approximately $475 million in cash, subject to customary adjustments. Metrics is an oral solids development and manufacturing business specializing in handling highly potent compounds at its facility in Greenville, North Carolina. We intend to fund this acquisition using a combination of cash on hand, existing senior secured credit facilities, and, depending on market conditions, potentially new debt financing. The closing of the acquisition is not contingent on any financing activity.
Cash Flows
Fiscal Year Ended June 30, 2022 Compared to the Fiscal Year Ended June 30, 2021
The following table summarizes our consolidated statements of cash flows for the fiscal year ended June 30, 2022 compared with the fiscal year ended June 30, 2021:
| | | | | | | | | | | | | | | | | |
| | Fiscal Year Ended
June 30, | | |
| (Dollars in millions) | 2022 | | 2021 | | Change $ |
| Net cash provided by (used in): | | | | | |
| Operating activities | $ | 439 | | | $ | 433 | | | $ | 6 | |
| Investing activities | $ | (1,884) | | | $ | (649) | | | $ | (1,235) | |
| Financing activities | $ | 1,031 | | | $ | 142 | | | $ | 889 | |
Operating Activities
For the fiscal year ended June 30, 2022, cash provided by operating activities was $439 million, an increase of $6 million compared to $433 million for the prior year. This increase in cash flow from operating activities was primarily due to an increase in operating income, excluding the gain derived from the sale of the Blow-Fill-Seal business in March 2021, a favorable impact from a decline in the rate of trade receivables growth, and a favorable impact from a decline in the rate of inventory growth, which was partially offset by an unfavorable impact from the increase in contract assets.
Investing Activities
For the fiscal year ended June 30, 2022, cash used in investing activities was $1.88 billion, compared to $649 million during fiscal 2021. The increase in cash used in investing activities was primarily driven by a $1.05 billion increase in cash used for business acquisition activities, partially offset by a $52 million decline in the purchase of marketable securities and a $26 million decrease in cash used for purchases of property, plant, and equipment compared to the prior year. Another key driver in the year-over-year change was the lack of proceeds from sale of any subsidiary, as no subsidiary was sold in the current year, compared to $290 million in proceeds from the sale of subsidiaries received in fiscal 2021.
Financing Activities
For the fiscal year ended June 30, 2022, cash provided by financing activities was $1.03 billion, which increased $889 million compared to cash provided by financing activities of $142 million during the fiscal year ended June 30, 2021. The increase in cash provided by financing activities was primarily driven by a $934 million year-over-year increase in cash received from the issuance of debt, partially offset by the July 2020 exercise of an over-allotment option on 1.2 million additional shares by the underwriter for the equity offering in June 2020, resulting in net proceeds of $82 million.
Debt and Financing Arrangements
Senior Secured Credit Facilities and Sixth Amendment to the Credit Agreement
In September 2021, we completed the Sixth Amendment to the Credit Agreement. Pursuant to the Sixth Amendment, we incurred an additional $450 million aggregate principal amount of U.S. dollar-denominated term loans (the “Incremental Term B-3 Loans”) and amended the quarterly amortization payments from 0.25% to 0.2506% of the principal amount outstanding for the Incremental Term B-3 Loans and the other term loans outstanding under the Credit Agreement, all of which are U.S. dollar-denominated (together with the Incremental Term B-3 Loans, the “Term B-3 Loans”). The Incremental Term B-3 Loans otherwise feature the same principal terms as the previously drawn Term B-3 Loans, including an interest rate of one-month LIBOR (subject to a floor of 0.50%) plus 2.00% per annum and a maturity date of February 2028. The proceeds of the Incremental Term B-3 Loans, after payment of the offering fees and expenses, were used in part to fund a portion of the consideration paid at the closing of the Bettera Wellness acquisition.
The Sixth Amendment also provided for incremental revolving credit commitments under the Revolving Credit Facility. The applicable rate for all loans drawn under the Revolving Credit Facility is one-month LIBOR plus 2.25%, and such rate can be reduced to one-month LIBOR plus 2.00% in future periods based on a measure of Operating Company's total leverage ratio. The maturity date for the Revolving Credit Facility is May 17, 2024.
Pursuant to the terms of the Credit Agreement, the interest rates under the Term B-3 Loans and loans drawn under the Revolving Credit Facility will be based on a replacement benchmark interest rate when LIBOR is no longer available.
The availability of capacity under the Revolving Credit Facility is reduced by the aggregate value of all outstanding letters of credit under the Credit Agreement. As of June 30, 2022, we had $721 million of unutilized capacity under the Revolving Credit Facility, due to $4 million of outstanding letters of credit.
Further information concerning the senior secured credit facilities, including the Term B-3 Loans and the Revolving Credit Facility, can be found in Note 7, Long-Term Obligations and Short-Term Borrowings to the Consolidated Financial Statements
5.000% Senior Notes due 2027
In June 2019, Operating Company completed a private offering of the 2027 Notes. The 2027 Notes are fully and unconditionally guaranteed, jointly and severally, by all of the wholly owned U.S. subsidiaries of Operating Company that guarantee its senior secured credit facilities. The 2027 Notes were offered in the U.S. to qualified institutional buyers in reliance on Rule 144A under the Securities Act and outside the U.S. only to non-U.S. investors pursuant to Regulation S under the Securities Act. The 2027 Notes will mature on July 15, 2027 and bear interest at the rate of 5.000% per annum. Interest is payable semi-annually in arrears on January 15 and July 15 of each year, beginning on January 15, 2020. The proceeds of the 2027 Notes after payment of the offering fees and expenses were used to repay in full the outstanding borrowings under Operating Company's then-outstanding term loans under its senior secured credit facilities that would otherwise have matured in May 2024.
2.375% Euro-denominated Senior Notes due 2028
In March 2020, Operating Company completed a private offering of the 2028 Notes. The 2028 Notes are fully and unconditionally guaranteed, jointly and severally, by all of the wholly owned U.S. subsidiaries of Operating Company that guarantee its senior secured credit facilities. The 2028 Notes were offered in the U.S. to qualified institutional buyers in reliance on Rule 144A under the Securities Act and outside the U.S. only to non-U.S. investors pursuant to Regulation S under the Securities Act. The 2028 Notes will mature on March 1, 2028 and bear interest at the rate of 2.375% per annum. Interest is payable semi-annually in arrears on March 1 and September 1 of each year, beginning on September 1, 2020. The proceeds of the 2028 Notes after payment of the offering fees and expenses were used to repay in full the outstanding borrowings under Operating Company's euro-denominated term loans under its senior secured credit facilities, that would otherwise have matured in May 2024, and repay in full our Euro-denominated 4.75% Senior Notes due 2024, which would otherwise have matured in December 2024, plus any accrued and unpaid interest thereon, with the remainder available for general corporate purposes.
3.125% Senior Notes due 2029
In February 2021, Operating Company completed a private offering of the 2029 Notes. The 2029 Notes are fully and unconditionally guaranteed, jointly and severally, by all of the wholly owned U.S. subsidiaries of Operating Company that guarantee its senior secured credit facilities. The 2029 Notes were offered in the U.S. to qualified institutional buyers in reliance on Rule 144A under the Securities Act and outside the U.S. only to non-U.S. investors pursuant to Regulation S under the Securities Act. The 2029 Notes will mature on February 15, 2029 and bear interest at the rate of 3.125% per annum payable semi-annually in arrears on February 15 and August 15 of each year, beginning on August 15, 2021. The proceeds of the 2029 Notes after payment of the offering fees and expenses were used to repay in full the outstanding borrowings under the 2026 Notes, plus any accrued and unpaid interest thereon, with the remainder available for general corporate purposes.
3.500% Senior Notes due 2030
In September 2021, Operating Company completed a private offering of the 2030 Notes. The 2030 Notes are fully and unconditionally guaranteed, jointly and severally, by all of the wholly owned U.S. subsidiaries of Operating Company that guarantee its senior secured credit facilities. The 2030 Notes were offered in the U.S. to qualified institutional buyers in reliance on Rule 144A under the Securities Act and outside the U.S. only to non-U.S. investors pursuant to Regulation S under the Securities Act. The 2030 Notes will mature on April 1, 2030 and bear interest at the rate of 3.500% per annum payable semi-annually in arrears on April 1 and October 1 of each year, beginning on April 1, 2022. The proceeds of the 2030 Notes, after payment of the offering fees and expenses, were used to fund a portion of the consideration paid at the closing of the Bettera Wellness acquisition.
Deferred Purchase Consideration
In connection with the acquisition of Catalent Indiana, LLC in October 2017, $200 million of the $950 million aggregate nominal purchase price was payable in $50 million installments on each of the first four anniversaries of the closing date. The Company made the installment payments in October 2018, October 2019, October 2020, and the final payment was made in October 2021.
Debt Covenants
Senior Secured Credit Facilities
The Credit Agreement contains covenants that, among other things, restrict, subject to certain exceptions, Operating Company’s (and Operating Company’s restricted subsidiaries’) ability to incur additional indebtedness or issue certain preferred shares; create liens on assets; engage in mergers and consolidations; sell assets; pay dividends and distributions or repurchase capital stock; repay subordinated indebtedness; engage in certain transactions with affiliates; make investments, loans, or advances; make certain acquisitions; enter into sale and leaseback transactions; amend material agreements governing Operating Company’s subordinated indebtedness; and change Operating Company’s lines of business.
The Credit Agreement also contains change-of-control provisions and certain customary affirmative covenants and events of default. The Revolving Credit Facility requires compliance with a net leverage covenant when there is a 30% or more draw outstanding at a period end. As of June 30, 2022, Operating Company was in compliance with all material covenants under the Credit Agreement.
Subject to certain exceptions, the Credit Agreement permits Operating Company and its restricted subsidiaries to incur certain additional indebtedness, including secured indebtedness. None of Operating Company’s non-U.S. subsidiaries nor its dormant Puerto Rico subsidiary is a guarantor of the loans.
Under the Credit Agreement, Operating Company’s ability to engage in certain activities such as incurring certain additional indebtedness, making certain investments, and paying certain dividends is tied to ratios based on Adjusted EBITDA (which is defined as “Consolidated EBITDA” in the Credit Agreement). Adjusted EBITDA is based on the definitions in the Credit Agreement, is not defined under U.S. GAAP, and is subject to important limitations. See “—Non-GAAP Metrics” for further details on Adjusted EBITDA.
As market conditions warrant, we may from time to time seek to purchase our outstanding debt in privately negotiated or open-market transactions, by tender offer or otherwise. Subject to any limitation contained in the Credit Agreement, any purchase made by us may be funded by the use of cash on hand or the incurrence of new secured or unsecured debt. The amount involved in any such purchase transaction, individually or in the aggregate, may be material. Any such purchase may involve a substantial amount of one particular class or series of debt, with the attendant reduction in the trading liquidity of such class or series.
The Senior Notes
The Indentures contain certain covenants that, among other things, limit the ability of Operating Company and its restricted subsidiaries to incur or guarantee more debt or issue certain preferred shares; pay dividends on, repurchase, or make distributions in respect of their capital stock or make other restricted payments; make certain investments; sell certain assets; create liens; consolidate, merge, sell; or otherwise dispose of all or substantially all of their assets; enter into certain transactions with their affiliates, and designate their subsidiaries as unrestricted subsidiaries. These covenants are subject to a number of exceptions, limitations, and qualifications as set forth in the Indentures. The Indentures also contain customary events of default including, but not limited to, nonpayment, breach of covenants, and payment or acceleration defaults in certain other indebtedness of Operating Company or certain of its subsidiaries. Upon an event of default, either the holders of at least 30% in principal amount of each of the then-outstanding Senior Notes or the applicable Trustee under the Indentures, may declare the applicable Senior Notes immediately due and payable; or in certain circumstances, the applicable Senior Notes will automatically become immediately due and payable. As of June 30, 2022, Operating Company was in compliance with all material covenants under the Indentures.
Liquidity in Foreign Subsidiaries
As of June 30, 2022 and 2021, the amounts of cash and cash equivalents held by foreign subsidiaries were $377 million and $351 million, respectively, out of total consolidated cash and cash equivalents of $449 million and $896 million, respectively. These balances are dispersed across many international locations around the world.
Adjusted EBITDA and Adjusted Net Income per Share
The below tables summarize our fiscal 2022 and 2021 results with respect to certain financial metrics we use to measure performance throughout the fiscal year. Refer to “Non-GAAP Metrics” for further details regarding Adjusted EBITDA and Adjusted net income per share.
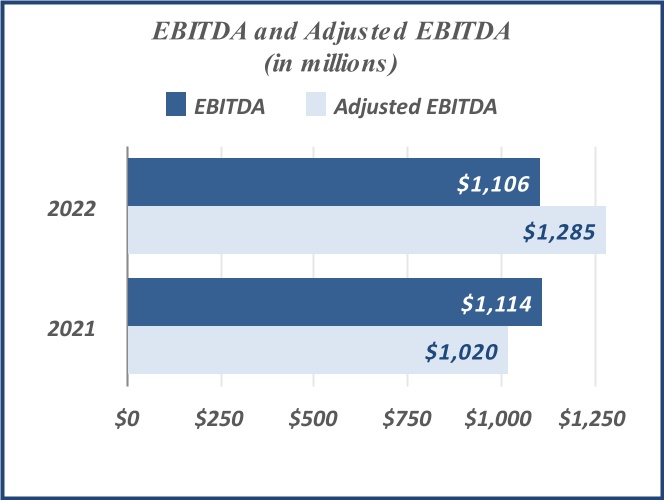
A reconciliation between Adjusted EBITDA and net earnings, the most directly comparable measure under U.S. GAAP, which also shows the adjustments from EBITDA from operations, follows: | | | | | | | | | | | |
| Fiscal Year Ended |
| (In millions) | June 30, 2022 | | June 30, 2021 |
| Net earnings | $ | 519 | | | $ | 585 | |
| Interest expense, net | 123 | | | 110 | |
Income tax expense | 86 | | | 130 | |
| Depreciation and amortization | 378 | | | 289 | |
| | | |
| EBITDA from operations | 1,106 | | | 1,114 | |
| Stock-based compensation | 54 | | | 51 | |
| Impairment charges and gain/loss on sale of assets | 31 | | | 9 | |
| Financing-related expenses and other | 4 | | | 18 | |
| Restructuring costs | 10 | | | 10 | |
| Acquisition, integration, and other special items | 46 | | | 21 | |
| Gain on sale of subsidiary | (1) | | | (182) | |
| | | |
Foreign exchange loss (gain) (included in other, net) (1) | 31 | | | (4) | |
| Inventory fair value step-up charges | 7 | | | — | |
Other adjustments (2) | (3) | | | (17) | |
| | | |
| | | |
| | | |
| Adjusted EBITDA | $ | 1,285 | | | $ | 1,020 | |
| Favorable (unfavorable) FX impact | (23) | | | |
| Adjusted EBITDA - constant currency | $ | 1,308 | | | |
(1) Foreign exchange loss of $31 million for the fiscal year ended June 30, 2022 includes: (a) $12 million of unrealized gains related to foreign trade receivables and payables, (b) $11 million of unrealized losses on the unhedged portion of our euro-denominated debt, and (c) $34 million of unrealized losses on inter-company loans. The foreign exchange adjustment was also affected by the exclusion of realized foreign currency exchange rate gains from the settlement of inter-company loans of $2 million. Inter-company loans exist between our subsidiaries and do not reflect the ongoing results of our trade operations.
Foreign exchange gain of $4 million for the fiscal year ended June 30, 2021 includes: (a) $13 million of unrealized losses related to foreign trade receivables and payables, (b) $3 million of unrealized losses on the unhedged portion
of the euro-denominated debt, and (c) $25 million of unrealized gains on inter-company loans. The foreign exchange adjustment was also affected by the exclusion of realized foreign currency exchange rate losses from the settlement of inter-company loans of $5 million. Inter-company loans exist between our subsidiaries and do not reflect the ongoing results of our trade operations.
(2) Primarily represents the gain recorded on the change in the estimated fair value of the derivative liability related to our formerly outstanding Series A Preferred Stock.
A reconciliation between Adjusted Net Income and net earnings, the most directly comparable measure under U.S. GAAP, follows. The table also provides a calculation of Adjusted Net Income per each basic share and each diluted share.

| | | | | | | | | | | |
| Fiscal Year Ended |
| (In millions, except per share data) | June 30, 2022 | | June 30, 2021 |
| Net earnings | 519 | | | $ | 585 | |
| | | |
| | | |
Amortization (1) | 123 | | | 93 | |
| | | |
| Stock-based compensation | 54 | | | 51 | |
| Impairment charges and gain/loss on sale of assets | 31 | | | 9 | |
| Financing-related expenses | 4 | | | 18 | |
| Restructuring costs | 10 | | | 10 | |
| Acquisition, integration, and other special items | 46 | | | 21 | |
| | | |
| (Gain) on sale of subsidiary | (1) | | | (182) | |
Foreign exchange loss (gain) (included in other expense, net) (2) | 31 | | | (4) | |
| Inventory fair value step-up charges | 7 | | | — | |
Other adjustments (3) | (4) | | | (17) | |
Estimated tax effect of adjustments (4) | (72) | | | 3 | |
Discrete income tax benefit items (5) | (54) | | | (38) | |
| | | |
| Adjusted net income (ANI) | $ | 694 | | | $ | 549 | |
| | | |
| | | |
| | | |
| | | |
| ANI per share: | | | |
ANI per share - basic (6) | $ | 3.93 | | | $ | 3.27 | |
ANI per share - diluted (7) | $ | 3.84 | | | $ | 3.04 | |
(1) Represents the amortization attributable to purchase accounting for previously completed business combinations.
(2) Foreign exchange loss of $31 million for the fiscal year ended June 30, 2022 includes: (a) $12 million of unrealized gains related to foreign trade receivables and payables, (b) $11 million of unrealized losses on the unhedged portion of the euro-denominated debt, and (c) $34 million of unrealized losses on inter-company loans. The foreign exchange adjustment was also affected by the exclusion of realized foreign currency exchange rate gains from the
settlement of inter-company loans of $2 million. Inter-company loans exist between our subsidiaries and do not reflect the ongoing results of our trade operations.
Foreign exchange gain of $4 million for the fiscal year ended June 30, 2021 includes: (a) $13 million of unrealized losses related to foreign trade receivables and payables, (b) $3 million of unrealized losses on the unhedged portion of the euro-denominated debt, and (c) $25 million of unrealized gains on inter-company loans. The foreign exchange adjustment was also affected by the exclusion of realized foreign currency exchange rate losses from the settlement of inter-company loans of $5 million. Inter-company loans exist between our subsidiaries and do not reflect the ongoing results of our trade operations.
(3) Primarily represents the gain recorded on the change in the estimated fair value of the derivative liability related to our formerly outstanding Series A Preferred Stock.
(4) We computed the tax effect of adjustments to net earnings by applying the statutory tax rate in the relevant jurisdictions to the income or expense items that are adjusted in the period presented. If a valuation allowance exists, the rate applied is zero.
(5) Discrete period income tax expense (benefit) items are unusual or infrequently occurring items, primarily including: changes in judgment related to the realizability of deferred tax assets in future years, changes in measurement of a prior-year tax position, deferred tax impact of changes in tax law, and purchase accounting.
(6) Represents Adjusted Net Income divided by the weighted average number of shares of Common Stock outstanding. For the fiscal year ended June 30, 2022 and 2021, the weighted average was 176 million and 168 million, respectively.
(7) Represents Adjusted Net Income divided by the weighted average sum of (a) the number of shares of Common Stock outstanding, plus (b) the number of shares of Common Stock that would be issued assuming exercise or vesting of all potentially dilutive instruments, plus (c) the number of shares of Common Stock equivalent to the shares of Series A Preferred Stock outstanding under the "if-converted" method. For the fiscal year ended June 30, 2022 and 2021, the weighted average was 181 million and 180 million, respectively.
Interest Rate Risk Management
A portion of the debt used to finance our operations is exposed to interest-rate fluctuations. We may use various hedging strategies and derivative financial instruments to create an appropriate mix of fixed-and floating-rate assets and liabilities. In February 2021, we replaced one interest-rate swap agreement with Bank of America N.A. with another, and each acts or acted as a hedge against the economic effect of a portion of the variable-interest obligation associated with our U.S dollar-denominated term loans under our senior secured credit facilities, so that the interest payable on that portion of the debt becomes fixed at a certain rate, thereby reducing the impact of future interest-rate changes on future interest expense. The applicable rate for the U.S. dollar-denominated term loan under the Credit Agreement was one-month LIBOR (subject to a floor of 0.50%) plus 2.00% as of June 30, 2021; however, as a result of the interest-rate swap agreement, the floating portion of the applicable rate on $500 million of the term loans was effectively fixed at 0.9985% as of February 2021.
Currency Risk Management
We are exposed to fluctuations in the euro-U.S. dollar exchange rate on our investments in our foreign operations in Europe. While we do not actively hedge against changes in foreign currency, we have mitigated the exposure of our investments in our European operations by denominating a portion of our debt in euros. At June 30, 2022, we had $874 million of euro-denominated debt outstanding that qualifies as a hedge on a net investment in foreign operations. Refer to Note 9, Derivative Instruments and Hedging Activities, to our Consolidated Financial Statements for further discussion of net investment hedge activity in the period.
From time to time, we may use forward currency exchange contracts to manage our exposure to the variability of cash flows primarily related to the foreign exchange rate changes of future foreign currency transaction costs. In addition, we may use foreign currency forward contracts to protect the value of existing foreign currency assets and liabilities. Currently, we do not use foreign currency exchange contracts. We expect to continue to evaluate hedging opportunities for foreign currency in the future.
ITEM 7A. QUANTITATIVE AND QUALITATIVE DISCLOSURES ABOUT MARKET RISK
We are exposed to cash flow and earnings fluctuations as a result of certain market risks. These market risks primarily relate to changes in interest rates associated with our long-term debt obligations and foreign exchange rate changes.
Interest Rate Risk
We have historically used interest-rate swaps to manage the economic effect of variable-rate interest obligations associated with our floating-rate term loans so that the interest payable on the term loans effectively becomes fixed at a certain rate, thereby reducing the impact of future interest-rate changes on our future interest expense.
In February 2021, we replaced one interest-rate swap agreement with Bank of America N.A. with another, and each acts or acted as a hedge against the economic effect of a portion of the variable-interest obligation associated with our term loans under our senior secured credit facilities, so that the interest payable on that portion of the debt becomes fixed at a certain rate, thereby reducing the impact of future interest-rate changes on future interest expense. The applicable rate for the term loans under our Credit Agreement was one-month LIBOR (subject to a floor of 0.50%) plus 2.00% as of June 30, 2022; however, as a result of the interest-rate swap agreement, the floating portion of the applicable rate on $500 million of the term loans was effectively fixed at 0.9985% as of February 2021.
Foreign Currency Exchange Risk
By the nature of our global operations, we are exposed to cash flow and earnings fluctuations resulting from foreign exchange-rate variation. These exposures are transactional and translational in nature. Since we manufacture and sell our products globally, our foreign-currency risk is diversified. Principal drivers of this diversified foreign-exchange exposure include the European euro, British pound, Argentinean peso, and Brazilian real. Our transactional exposure arises from the purchase and sale of goods and services in currencies other than the functional currency of our operational units. We also have exposure related to the translation of financial statements of our foreign divisions into U.S. dollars, our functional currency. The financial statements of our operations outside the U.S. are measured using the local currency as the functional currency, except in Argentina, a hyper-inflationary economy, where our results are measured in U.S. dollars. Adjustments to translate the assets and liabilities of these foreign operations in U.S. dollars are accumulated as a component of other comprehensive income utilizing period-end exchange rates. Foreign-currency transaction gains and losses calculated by utilizing weighted average exchange rates for the period are included in the statements of operations in other expense, net. Such foreign currency transaction gains and losses include inter-company loans denominated in non-U.S. dollar currencies.
ITEM 8. FINANCIAL STATEMENTS AND SUPPLEMENTARY DATA
INDEX TO FINANCIAL STATEMENTS
Consolidated Financial Statements as of June 30, 2022 and 2021 and for the years ended June 30, 2022, 2021 and 2020.
Report of Independent Registered Public Accounting Firm
To the Shareholders and the Board of Directors of Catalent, Inc.
Opinion on the Financial Statements
We have audited the accompanying consolidated balance sheets of Catalent, Inc. (the Company) as of June 30, 2022 and 2021, the related consolidated statements of operations, comprehensive income, changes in shareholders’ equity and cash flows for each of the three years in the period ended June 30, 2022, and the related notes and financial statement schedule listed in the Index at Item 15(a)(2) (collectively referred to as the “consolidated financial statements”). In our opinion, the consolidated financial statements present fairly, in all material respects, the financial position of the Company at June 30, 2022 and 2021, and the results of its operations and its cash flows for each of the three years in the period ended June 30, 2022, in conformity with U.S. generally accepted accounting principles.
We also have audited, in accordance with the standards of the Public Company Accounting Oversight Board (United States) (PCAOB), the Company's internal control over financial reporting as of June 30, 2022, based on criteria established in Internal Control-Integrated Framework issued by the Committee of Sponsoring Organizations of the Treadway Commission (2013 framework), and our report dated August 29, 2022, expressed an unqualified opinion thereon.
Basis for Opinion
These financial statements are the responsibility of the Company's management. Our responsibility is to express an opinion on the Company’s financial statements based on our audits. We are a public accounting firm registered with the PCAOB and are required to be independent with respect to the Company in accordance with the U.S. federal securities laws and the applicable rules and regulations of the Securities and Exchange Commission and the PCAOB.
We conducted our audits in accordance with the standards of the PCAOB. Those standards require that we plan and perform the audit to obtain reasonable assurance about whether the financial statements are free of material misstatement, whether due to error or fraud. Our audits included performing procedures to assess the risks of material misstatement of the financial statements, whether due to error or fraud, and performing procedures that respond to those risks. Such procedures included examining, on a test basis, evidence regarding the amounts and disclosures in the financial statements. Our audits also included evaluating the accounting principles used and significant estimates made by management, as well as evaluating the overall presentation of the consolidated financial statements. We believe that our audits provide a reasonable basis for our opinion.
Critical Audit Matters
The critical audit matters communicated below are matters arising from the current period audit of the financial statements that were communicated or required to be communicated to the audit committee of the Company’s Board of Directors and that: (1) relate to accounts or disclosures that are material to the financial statements and (2) involved our especially challenging, subjective or complex judgments. The communication of critical audit matters does not alter in any way our opinion on the consolidated financial statements, taken as a whole, and we are not, by communicating the critical audit matters below, providing separate opinions on the critical audit matters or on the accounts or disclosures to which they relate.
| | | | | |
| Valuation of core technology intangible assets in the Bettera acquisition |
| |
| Description of the Matter | During fiscal 2022, the Company completed its acquisition of Bettera Holdings, LLC (Bettera) for an aggregate nominal purchase price of $1 billion. As discussed in Note 3 to the consolidated Financial Statements, the transaction was accounted for using the acquisition method of accounting for business combinations in accordance with ASC 805. |
| |
| Auditing the Company's accounting for the Bettera acquisition was complex and required the involvement of specialists due to the significant estimation uncertainty involved in determining the $338.0 million fair value of the acquired core technology intangible assets. Estimating the fair value of the core technology intangible assets involved the application of a valuation methodology and models using assumptions including revenue growth rates, earnings before interest, taxes, depreciation and amortization (EBITDA) margins and revenue obsolescence rates. These significant assumptions are forward-looking and could be affected by future economic and market conditions. |
| |
| How We Addressed the Matter in Our Audit | We tested controls that address the risks of material misstatement relating to the measurement and valuation of the acquired core technology intangible assets, including testing controls over management’s review of the valuation models and the underlying assumptions used to develop such estimates. |
| |
| | | | | |
| To test the estimated fair value of the acquired core technology intangible assets, our audit procedures included, among others, evaluating the Company's selection of a valuation method and testing the models and significant assumptions used in the models, including the completeness and accuracy of the underlying data. For example, we compared the significant assumptions to current industry and market trends and to the historical results of the acquired business. We also performed sensitivity analyses of significant assumptions to evaluate the changes in the fair value of the acquired core technology that would result from changes in the assumptions. In addition, we involved internal valuation specialists to assist in our evaluation of the significant assumptions and methodologies used by the Company. |
| |
| Measurement of uncertain tax positions |
| |
| Description of the Matter | As discussed in Note 11 to the consolidated financial statements, the Company recorded income tax expense related to US and non-US tax paying jurisdictions totaling $87 million for the year ended June 30, 2022, and a liability for unrecognized tax benefits totaling $4.7 million at June 30, 2022. The Company’s accounting for income taxes involves the application of complex tax regulations in each of the international tax paying jurisdictions in which it operates. The determination of income subject to income tax in each tax paying jurisdiction requires management to apply transfer pricing guidelines for certain intercompany transactions related to certain European countries and make assumptions and estimates about the value of transactions when allocating income and deductions between consolidated entities in different tax paying jurisdictions. The estimates and assumptions used in these allocations can result in uncertainty in the measured tax benefit. |
| |
| Auditing the completeness and measurement of the liability for recognized tax benefits related to certain intercompany transactions was complex because the assumptions are based on the interpretation of tax laws and legal rulings in multiple tax paying jurisdictions and require significant judgment in determining whether a tax position’s technical merits are more-likely-than-not to be sustained and measuring the amount of tax benefit that qualifies for recognition. |
| |
| How We Addressed the Matter in Our Audit | We tested controls over the process to assess the technical merits of tax positions related to certain intercompany transactions, as well as management’s process to measure the benefit of those tax positions, including controls over the completeness and accuracy of the underlying data. For example, we tested controls over management’s review of the evaluation of matters identified by and discussed with various tax authorities. |
| |
| Our audit procedures with respect to the calculation of the liability for unrecognized tax benefits involved an assessment of the technical merits of the Company’s tax positions performed with the assistance of tax subject matter professionals with knowledge of and experience with the application of international and local income tax laws by the relevant income tax authorities. These procedures also included, among others, evaluating third-party advice obtained by the Company and making inquiries of its external tax advisers. We also evaluated the Company’s significant assumptions and the completeness and accuracy of the data used to determine the amount of tax benefits recognized and tested the accuracy of such calculations. |
| |
| |
| |
| |
| |
| |
| |
| |
| |
| |
| |
| |
| |
| |
| |
| |
| |
| |
|
|
/s/ Ernst & Young LLP
We have served as the Company’s auditor since 2007.
Iselin, New Jersey
August 29, 2022
Report of Independent Registered Public Accounting Firm
To the Shareholders and the Board of Directors of Catalent, Inc.
Opinion on Internal Control Over Financial Reporting
We have audited Catalent, Inc.’s internal control over financial reporting as of June 30, 2022, based on criteria established in Internal Control—Integrated Framework issued by the Committee of Sponsoring Organizations of the Treadway Commission (2013 framework) (the COSO criteria). In our opinion, Catalent, Inc. (the Company) maintained, in all material respects, effective internal control over financial reporting as of June 30, 2022, based on the COSO criteria.
We also have audited, in accordance with the standards of the Public Company Accounting Oversight Board (United States) (PCAOB), the consolidated balance sheets of the Company as of June 30, 2022 and 2021, the related consolidated statements of operations, comprehensive income, changes in shareholders’ equity and cash flows for each of the three years in the period ended June 30, 2022, and the related notes and financial statement schedule listed in the Index at Item 15(a)(2) and our report dated August 29, 2022 expressed an unqualified opinion thereon.
Basis for Opinion
The Company’s management is responsible for maintaining effective internal control over financial reporting and for its assessment of the effectiveness of internal control over financial reporting included in the accompanying Management’s Annual Report on Internal Control over Financial Reporting. Our responsibility is to express an opinion on the Company’s internal control over financial reporting based on our audit. We are a public accounting firm registered with the PCAOB and are required to be independent with respect to the Company in accordance with the U.S. federal securities laws and the applicable rules and regulations of the Securities and Exchange Commission and the PCAOB.
We conducted our audit in accordance with the standards of the PCAOB. Those standards require that we plan and perform the audit to obtain reasonable assurance about whether effective internal control over financial reporting was maintained in all material respects.
Our audit included obtaining an understanding of internal control over financial reporting, assessing the risk that a material weakness exists, testing and evaluating the design and operating effectiveness of internal control based on the assessed risk, and performing such other procedures as we considered necessary in the circumstances. We believe that our audit provides a reasonable basis for our opinion.
Definition and Limitations of Internal Control Over Financial Reporting
A company’s internal control over financial reporting is a process designed to provide reasonable assurance regarding the reliability of financial reporting and the preparation of financial statements for external purposes in accordance with generally accepted accounting principles. A company’s internal control over financial reporting includes those policies and procedures that (1) pertain to the maintenance of records that, in reasonable detail, accurately and fairly reflect the transactions and dispositions of the assets of the company; (2) provide reasonable assurance that transactions are recorded as necessary to permit preparation of financial statements in accordance with generally accepted accounting principles, and that receipts and expenditures of the company are being made only in accordance with authorizations of management and directors of the company; and (3) provide reasonable assurance regarding prevention or timely detection of unauthorized acquisition, use, or disposition of the company’s assets that could have a material effect on the financial statements.
Because of its inherent limitations, internal control over financial reporting may not prevent or detect misstatements. Also, projections of any evaluation of effectiveness to future periods are subject to the risk that controls may become inadequate because of changes in conditions, or that the degree of compliance with the policies or procedures may deteriorate.
/s/ Ernst & Young LLP
Iselin, New Jersey
August 29, 2022
Catalent, Inc.
Consolidated Balance Sheets
(Dollars in millions, except share and per share data) | | | | | | | | | | | |
| June 30,
2022 | | June 30,
2021 |
| ASSETS | | | |
| Current assets: | | | |
| Cash and cash equivalents | $ | 449 | | | $ | 896 | |
Trade receivables, net of allowance for credit losses of $29 and $12, respectively | 1,051 | | | 1,012 | |
| Inventories | 702 | | | 563 | |
| Prepaid expenses and other | 625 | | | 376 | |
| Marketable securities | 89 | | | 71 | |
| Total current assets | 2,916 | | | 2,918 | |
| Property, plant, and equipment, net | 3,127 | | | 2,524 | |
| Other assets: | | | |
| Goodwill | 3,006 | | | 2,519 | |
| Other intangibles, net | 1,060 | | | 817 | |
| Deferred income taxes | 49 | | | 66 | |
| Other long-term assets | 349 | | | 268 | |
| Total assets | $ | 10,507 | | | $ | 9,112 | |
| | | |
LIABILITIES AND SHAREHOLDERS’ EQUITY |
| Current liabilities: | | | |
| Current portion of long-term obligations and other short-term borrowings | $ | 31 | | | $ | 75 | |
| Accounts payable | 421 | | | 385 | |
| Other accrued liabilities | 620 | | | 736 | |
| Total current liabilities | 1,072 | | | 1,196 | |
| Long-term obligations, less current portion | 4,171 | | | 3,166 | |
| Pension liability | 103 | | | 137 | |
| Deferred income taxes | 202 | | | 164 | |
| Other liabilities | 164 | | | 175 | |
| Commitment and contingencies (see Note 17) | | | |
| Total liabilities | 5,712 | | | 4,838 | |
Redeemable preferred stock, $0.01 par value; 0 and 1 million shares authorized at June 30, 2022 and 2021, respectively; 0 and 384,777 shares issued and outstanding at June 30, 2022 and 2021, respectively | — | | | 359 | |
| | | |
| | | |
| Shareholders’ equity: | | | |
| Common stock, $0.01 par value; 1 billion shares authorized at June 30, 2022 and 2021; 179 million and 171 million shares issued and outstanding at June 30, 2022 and 2021, respectively | 2 | | | 2 | |
| | | |
| Preferred stock, $0.01 par value, other than redeemable preferred stock; 100 and 99 million shares authorized at June 30, 2022 and 2021, respectively; 0 shares issued and outstanding at June 30, 2022 and 2021 | — | | | — | |
| Additional paid in capital | 4,649 | | | 4,205 | |
| Retained earnings | 538 | | | 25 | |
| Accumulated other comprehensive loss | (394) | | | (317) | |
| | | |
| | | |
| Total shareholders’ equity | 4,795 | | | 3,915 | |
| Total liabilities, redeemable preferred stock, and shareholders’ equity | $ | 10,507 | | | $ | 9,112 | |
The accompanying notes are an integral part of these consolidated financial statements.
Catalent, Inc.
Consolidated Statements of Operations
(Dollars in millions, except per share data)
| | | | | | | | | | | | | | | | | |
| | Fiscal Year Ended June 30, |
| | 2022 | | 2021 | | 2020 |
| Net revenue | $ | 4,828 | | | $ | 3,998 | | | $ | 3,094 | |
| Cost of sales | 3,188 | | | 2,646 | | | 2,111 | |
| Gross margin | 1,640 | | | 1,352 | | | 983 | |
| Selling, general, and administrative expenses | 844 | | | 687 | | | 577 | |
| (Gain) loss on sale of subsidiary | (1) | | | (182) | | | 1 | |
| Other operating expense | 41 | | | 19 | | | 11 | |
| | | | | |
| Operating earnings | 756 | | | 828 | | | 394 | |
| Interest expense, net | 123 | | | 110 | | | 126 | |
| Other expense, net | 28 | | | 3 | | | 8 | |
| Earnings before income taxes | 605 | | | 715 | | | 260 | |
| Income tax expense | 86 | | | 130 | | | 39 | |
| | | | | |
| | | | | |
| | | | | |
| | | | | |
| Net earnings | 519 | | | 585 | | | 221 | |
| Less: Net earnings attributable to preferred shareholders | (16) | | | (56) | | | (48) | |
| Net earnings attributable to common shareholders | $ | 503 | | | $ | 529 | | | $ | 173 | |
| | | | | |
| | | | | |
| | | | | |
| | | | | |
| | | | |
| Earnings per share: | | | | | |
| Basic | | | | | |
| | | | | |
| Net earnings | $ | 2.85 | | | $ | 3.15 | | | $ | 1.16 | |
| Diluted | | | | | |
| | | | | |
| Net earnings | $ | 2.84 | | | $ | 3.11 | | | $ | 1.14 | |
The accompanying notes are an integral part of these consolidated financial statements.
Catalent, Inc.
Consolidated Statements of Comprehensive Income
(Dollars in millions)
| | | | | | | | | | | | | | | | | |
| Fiscal year ended June 30, |
| 2022 | | 2021 | | 2020 |
| Net earnings | $ | 519 | | | $ | 585 | | | $ | 221 | |
| Other comprehensive (loss) income, net of tax | | | | | |
| Foreign currency translation adjustments | (110) | | | 67 | | | (31) | |
| Defined benefit pension plan | 9 | | | — | | | 2 | |
| Net change in marketable securities | (3) | | | (1) | | | — | |
| | | | | |
| Derivatives and hedges | 27 | | | 3 | | | (3) | |
| | | | | |
| Other comprehensive (loss) income, net of tax | (77) | | | 69 | | | (32) | |
| Comprehensive income | $ | 442 | | | $ | 654 | | | $ | 189 | |
| | | | | |
| | | | | |
The accompanying notes are an integral part of these consolidated financial statements.
Catalent, Inc.
Consolidated Statement of Changes in Shareholders’ Equity
(Dollars in millions, except share data in thousands) | | | | | | | | | | | | | | | | | | | | | | | | | | | | | | | | | | | | | | | | | | | | |
| Columns may not foot due to rounding | Shares of Common Stock | | Common Stock | | Additional Paid in Capital | | Accumulated Earnings (Deficit) | | Accumulated Other Comprehensive Loss | | | | Total Shareholders’ Equity | | Redeemable Preferred Stock | |
| Balance at June 30, 2019 | 145,738 | | | $ | 2 | | | $ | 2,757 | | | $ | (723) | | | $ | (354) | | | | | $ | 1,682 | | | $ | 607 | | |
| Equity offering, sale of common stock | 16,196 | | | — | | | 1,042 | | | — | | | — | | | | | 1,042 | | | — | | |
| Share issuances related to stock-based compensation | 854 | | | — | | | — | | | — | | | — | | | | | — | | | — | | |
| Stock-based compensation | — | | | — | | | 48 | | | — | | | — | | | | | 48 | | | — | | |
| Cash paid, in lieu of equity, for tax withholding | — | | | — | | | (32) | | | — | | | — | | | | | (32) | | | — | | |
| Employee stock purchase plan | — | | | — | | | 3 | | | — | | | — | | | | | 3 | | | — | | |
| Preferred dividend ($12.50 per share of redeemable preferred stock) | — | | | — | | | — | | | (33) | | | — | | | | | (33) | | | — | | |
| Net earnings | — | | | — | | | — | | | 221 | | | — | | | | | 221 | | | — | | |
| Other comprehensive loss, net of tax | — | | | — | | | — | | | — | | | (32) | | | | | (32) | | | — | | |
| Balance at June 30, 2020 | 162,788 | | | 2 | | | 3,818 | | | (535) | | | (386) | | | | | 2,899 | | | 607 | | |
| Equity offering, sale of common stock | 1,163 | | | — | | | 82 | | | — | | | — | | | | | 82 | | | — | | |
| Share issuances related to stock-based compensation | 1,206 | | | — | | | — | | | — | | | — | | | | | — | | | — | | |
| Conversion of redeemable preferred stock | 5,392 | | | — | | | 253 | | | — | | | — | | | | | 253 | | | (248) | | |
| Stock-based compensation | — | | | — | | | 51 | | | — | | | — | | | | | 51 | | | — | | |
| Cash paid, in lieu of equity, for tax withholding | — | | | — | | | (46) | | | — | | | — | | | | | (46) | | | — | | |
| Exercise of stock options | — | | | — | | | 38 | | | — | | | — | | | | | 38 | | | — | | |
| Employee stock purchase plan | — | | | — | | | 9 | | | — | | | — | | | | | 9 | | | — | | |
| Preferred dividend ($12.50 per share of redeemable preferred stock) | — | | | — | | | — | | | (25) | | | — | | | | | (25) | | | — | | |
| Net earnings | — | | | — | | | — | | | 585 | | | — | | | | | 585 | | | — | | |
| Other comprehensive income, net of tax | — | | | — | | | — | | | — | | | 69 | | | | | 69 | | | — | | |
| Balance at June 30, 2021 | 170,549 | | | 2 | | | 4,205 | | | 25 | | | (317) | | | | | 3,915 | | | 359 | | |
| | | | | | | | | | | | | | | | |
| Share issuances related to stock-based compensation | 935 | | | — | | | — | | | — | | | — | | | | | — | | | — | | |
| Conversion of redeemable preferred stock | 7,818 | | | — | | | 362 | | | — | | | — | | | | | 362 | | | (359) | | |
| Stock-based compensation | — | | | — | | | 54 | | | — | | | — | | | | | 54 | | | — | | |
| Cash paid, in lieu of equity, for tax withholding | — | | | — | | | (10) | | | — | | | — | | | | | (10) | | | — | | |
| Exercise of stock options | — | | | — | | | 26 | | | — | | | — | | | | | 26 | | | — | | |
| Employee stock purchase plan | — | | | — | | | 12 | | | — | | | — | | | | | 12 | | | — | | |
| Preferred dividend ($12.50 per share of redeemable preferred stock) | — | | | — | | | — | | | (6) | | | — | | | | | (6) | | | — | | |
| Net earnings | — | | | — | | | — | | | 519 | | | — | | | | | 519 | | | — | | |
| Other comprehensive loss, net of tax | — | | | — | | | — | | | — | | | (77) | | | | | (77) | | | — | | |
| Balance at June 30, 2022 | 179,302 | | | 2 | | | 4,649 | | | 538 | | | (394) | | | | | 4,795 | | | — | | |
The accompanying notes are an integral part of these consolidated financial statements.
Catalent, Inc.
Consolidated Statements of Cash Flows
(Dollars in millions)
| | | | | | | | | | | | | | | | | |
| Fiscal Year Ended June 30, |
| 2022 | | 2021 | | 2020 |
| CASH FLOWS FROM OPERATING ACTIVITIES: | | | | | |
Net earnings | $ | 519 | | | $ | 585 | | | $ | 221 | |
| | | | | |
| | | | | |
Adjustments to reconcile net earnings to net cash from operations: | | | | | |
| Depreciation and amortization | 378 | | | 289 | | | 254 | |
| Non-cash foreign currency transaction losses (gains), net | 30 | | | (4) | | | 2 | |
Amortization and write-off of debt financing costs | 7 | | | 11 | | | 12 | |
| | | | | |
Asset impairments charges and gain/loss on sale of assets | 31 | | | 9 | | | 5 | |
| (Gain) loss on sale of subsidiary | (1) | | | (182) | | | 1 | |
Financing related charges | 4 | | | 18 | | | 10 | |
| Gain on derivative instrument | (2) | | | (17) | | | (3) | |
| Stock-based compensation | 54 | | | 51 | | | 48 | |
| Provision for deferred income taxes | 14 | | | 64 | | | 2 | |
| Provision for bad debts and inventory | 17 | | | 41 | | | 10 | |
| Change in operating assets and liabilities: | | | | | |
Increase in trade receivables | (73) | | | (186) | | | (151) | |
Increase in inventories | (128) | | | (260) | | | (76) | |
| Increase in accounts payable | 37 | | | 50 | | | 72 | |
Other assets/accrued liabilities, net - current and non-current | (448) | | | (36) | | | 33 | |
| | | | | |
| | | | | |
Net cash provided by operating activities | 439 | | | 433 | | | 440 | |
| CASH FLOWS FROM INVESTING ACTIVITIES: | | | | | |
| Acquisition of property and equipment and other productive assets | (660) | | | (686) | | | (466) | |
| Purchases of marketable securities | (20) | | | (72) | | | — | |
| | | | | |
| (Settlement on) proceeds from sale of subsidiaries | (3) | | | 287 | | | 21 | |
Payment for acquisitions, net of cash acquired | (1,199) | | | (147) | | | (379) | |
| Payment made for investments | (2) | | | (31) | | | (3) | |
| | | | | |
| | | | | |
Net cash used in investing activities | (1,884) | | | (649) | | | (827) | |
| CASH FLOWS FROM FINANCING ACTIVITIES: | | | | | |
| | | | | |
Proceeds from borrowings | 1,100 | | | 166 | | | 909 | |
| Payments related to long-term obligations | (78) | | | (67) | | | (860) | |
| | | | | |
Financing fees paid | (15) | | | (19) | | | (25) | |
| Dividends paid | (4) | | | (22) | | | (36) | |
| | | | | |
Proceeds from sale of common stock, net | — | | | 82 | | | 1,046 | |
| | | | | |
Exercise of stock options | 26 | | | 38 | | | — | |
| Cash paid, in lieu of equity, for tax withholding obligation | (10) | | | (46) | | | (32) | |
| Other financing activities | 12 | | | 10 | | | — | |
| | | | | |
| | | | | |
Net cash provided by financing activities | 1,031 | | | 142 | | | 1,002 | |
| | | | | |
| Effect of foreign currency on cash | (33) | | | 17 | | | (7) | |
| NET (DECREASE) INCREASE IN CASH AND EQUIVALENTS | (447) | | | (57) | | | 608 | |
| CASH AND EQUIVALENTS AT BEGINNING OF PERIOD | 896 | | | 953 | | | 345 | |
| CASH AND EQUIVALENTS AT END OF PERIOD | $ | 449 | | | $ | 896 | | | $ | 953 | |
| SUPPLEMENTARY CASH FLOW INFORMATION: | | | | | |
| Interest paid | $ | 116 | | | $ | 105 | | | $ | 98 | |
| Income taxes paid, net | $ | 53 | | | $ | 47 | | | $ | 43 | |
| SUPPLEMENTARY DISCLOSURE OF NON-CASH INVESTING AND FINANCING ACTIVITY: | | | | | |
| Issuance of Common Stock from partial conversion of redeemable preferred stock | $ | 362 | | | $ | 253 | | | $ | — | |
| Note receivable from sale of Blow-Fill-Seal Business | $ | — | | | $ | 47 | | | $ | — | |
The accompanying notes are an integral part of these consolidated financial statements.
Catalent, Inc.
Notes to Consolidated Financial Statements
1. BASIS OF PRESENTATION AND SUMMARY OF SIGNIFICANT ACCOUNTING POLICIES
Business
Catalent, Inc. (“Catalent” or the “Company”) directly and wholly owns PTS Intermediate Holdings LLC (“PTS Intermediate”). PTS Intermediate directly and wholly owns Catalent Pharma Solutions, Inc. (“Operating Company”). The financial results of Catalent are primarily comprised of the financial results of Operating Company and its subsidiaries on a consolidated basis.
Since the Company’s initial public offering in July 2014, its common stock, par value $0.01 (the “Common Stock”) has traded on the New York Stock Exchange under the symbol “CTLT”.
The Company provides differentiated development and manufacturing solutions for drugs, protein-based biologics, cell, and gene therapies, vaccines, and consumer health products at over fifty facilities across four continents under rigorous quality and operational standards. Its oral, injectable, and respiratory delivery technologies, along with its state-of-the-art protein, plasmid, viral, and cell and gene therapy manufacturing capacity address a wide and growing range of modalities and therapeutic and other categories across the biopharmaceutical and consumer health industries.
Reporting Segments
In fiscal 2022, the Company operated through four segments, each of which reported through a separate management team and ultimately to the Company's Chief Executive Officer, who was designated for fiscal 2022 as the Chief Operating Decision Maker for segment reporting purposes. The Company's fiscal 2022 operating segments were the same as its reporting segments. Immediately following the end of fiscal 2022, the Company announced a new operating structure with two operating and reporting segments: (1) Biologics and (2) Pharma and Consumer Health (see Note 20, Subsequent Events). Set forth below is a summary description of the Company’s four fiscal 2022 segments.
Biologics
The Company’s Biologics segment provides development and manufacturing for protein, plasmid DNA (pDNA), mRNA, cell therapy, viral vaccines and viral-based gene therapies; formulation, development, and manufacturing for parenteral dose forms, including vials, prefilled syringes, and cartridges; and analytical development and testing services for large molecules, including bioassay, biophysical characterization, and current good manufacturing practices (“cGMP”) release and stability testing.
Softgel and Oral Technologies
Through its Softgel and Oral Technologies segment, the Company provides formulation, development, and manufacturing services for soft capsules, or “softgels,” as well as large-scale manufacturing of oral solid dose forms for pharmaceutical and consumer health markets, along with supporting ancillary services. Following the Company’s fiscal 2022 acquisition of Bettera Holdings, LLC (“Bettera Wellness”), it also provides formulation, development, and manufacturing of experiential dose forms for the delivery of dietary supplements and other nutraceuticals.
Oral and Specialty Delivery
The Company’s Oral and Specialty Delivery segment provides advanced analytical and formulation development and manufacturing across a range of technologies along with integrated downstream clinical development and commercial supply solutions. The technologies cover a broad range of oral (including its proprietary fast-dissolve Zydis tablets and many bioavailability enhancement technologies for both immediate and controlled-release tablets and capsules), respiratory and inhaled dose forms (including metered dose inhalers, dry powder inhalers, and nasal delivery devices).
Clinical Supply Services
The Company’s Clinical Supply Services segment provides manufacturing, packaging, storage, distribution, and inventory management for small-molecule drugs, protein-based biologics, and cell and gene therapies in clinical trials. It offers customers flexible solutions for clinical supplies production and provide distribution and inventory management support for both simple and complex clinical trials. This includes over-encapsulation where needed; supplying placebos, comparator drug
procurement, and clinical packages and kits for physicians and patients; inventory management; investigator kit ordering and fulfillment; and return supply reconciliation and reporting.
Basis of Presentation
These financial statements include all of the Company’s subsidiaries, including those operating outside the United States (“U.S.”) and are prepared in accordance with U.S. generally accepted accounting principles (“U.S. GAAP”). All significant transactions among the Company’s subsidiaries and reporting segments have been eliminated, other than as noted.
Use of Estimates
The preparation of financial statements in conformity with U.S. GAAP requires the Company's management to make estimates and assumptions that affect amounts reported in the financial statements and accompanying notes. Such estimates include, but are not limited to, revenue recognition including determining the transaction price and associated constraint on variable consideration, allowance for credit losses, inventory and long-lived asset valuation, goodwill and other intangible asset valuation and impairment, equity-based compensation, income taxes, derivative valuation, and pension plan asset and liability valuation. Actual amounts may differ from these estimated amounts.
Reclassification
Certain prior-period amounts were reclassified to conform to the current period presentation. These reclassifications did not have a material impact on the consolidated statements of operations, consolidated balance sheets, consolidated statements of cash flows, or notes to the consolidated financial statements.
Foreign Currency Translation
The financial statements of the Company’s operations outside the U.S. are generally measured using the local currency as the functional currency. Adjustments to translate the assets and liabilities of the foreign operations into U.S. dollars are accumulated as a component of other comprehensive income utilizing period-end exchange rates. Since July 2018, the Company has accounted for its Argentine operations as highly inflationary, but this status has not had a material effect on the consolidated financial statements.
The currency fluctuation related to certain long-term inter-company loans where settlement is not planned or anticipated in the foreseeable future have been recorded within the cumulative translation adjustment, a component of other comprehensive income. In addition, the currency fluctuation associated with the portion of the Company’s euro-denominated debt designated as a net investment hedge is included as a component of other comprehensive income. Foreign currency transaction gains and losses calculated by utilizing weighted average exchange rates for the period are included in the statements of operations in “other expense, net.” Such foreign currency transaction gains and losses include inter-company loans that are repayable in the foreseeable future.
Cash and Cash Equivalents
All liquid investments purchased with original maturities of three months or less are considered cash equivalents. The carrying value of these cash equivalents approximates fair value.
Allowance for Credit Losses
Trade receivables, contract assets, and other amounts owed to the Company are presented net of an allowance that includes an assessment of expected credit losses. The Company determines its allowance methodology by considering various factors, including the Company’s previous loss history, aging of customer receivable balances, significant aspects of a geographic location's economic conditions, the current and anticipated future condition of the general economy and the industries in which the Company's primary customers operate. To the extent that the Company identifies that any individual customer's credit quality has deteriorated, the Company establishes allowances based on the individual risk characteristics of that customer. The Company makes concerted efforts to collect all outstanding balances due from customers; however, trade receivables and contract assets are written off against the allowance when the related balances are no longer deemed collectible.
Concentrations of Credit Risk and Major Customers
Concentration of credit risk, with respect to accounts receivable, is limited due to the large number of customers and their dispersion across different geographic areas. The customers are primarily concentrated in the pharmaceutical and consumer products industries. The Company does not normally require collateral or any other security to support credit sales. The Company performs ongoing credit evaluations of its customers’ financial conditions and maintains reserves for credit losses. Such losses historically have been within the Company’s expectations. For the fiscal year ended June 30, 2022, the Company had one customer that accounted for greater than 10% of its net revenue, which was primarily recorded in the Biologics segment. No single customer exceeded 10% of revenue during the fiscal years ended June 30, 2021, and 2020. As of June 30, 2021, the Company had one customer that accounted for approximately 15% or $155 million of its net trade receivable balances. No customer exceeded 10% of trade receivables as of June 30, 2022 or June 30, 2020. However, when considering aggregate trade receivable and contract asset values for significant customers as of June 30, 2022, the Company had one customer that accounted for approximately 14% of its aggregate trade receivable and contract asset values.
Inventories
Inventory is stated at the lower of cost or net realizable value, using the first-in, first-out (“FIFO”) method. The Company provides for cost adjustments for excess, obsolete, or slow-moving inventory based on changes in customer demand, technology developments or other economic factors. Inventory consists of costs associated with raw material, labor, and overhead.
Goodwill
The Company accounts for purchased goodwill and intangible assets with indefinite lives in accordance with Accounting Standards Codification (“ASC”) 350, Intangibles - Goodwill and Other. Under ASC 350, goodwill and intangible assets with indefinite lives are not amortized, but instead are tested for impairment at least annually. The Company performs an impairment evaluation of goodwill annually during the fourth quarter of its fiscal year or when circumstances otherwise indicate an evaluation should be performed.
The evaluation may begin with a qualitative assessment for each reporting unit to determine whether it is more-likely-than-not that the fair value of the reporting unit is less than its carrying value. Factors considered in a qualitative assessment include, among other things, macroeconomic conditions, industry and market considerations, financial performance of the respective reporting unit and other relevant entity and reporting-unit specific considerations. If the qualitative assessment does not generate a positive response, or if no qualitative assessment is performed, a quantitative assessment, based upon discounted cash flows, is performed and requires management to estimate future cash flows, growth rates, and macroeconomic, industry, and market conditions. In fiscal 2022 and 2020, the Company proceeded immediately to the quantitative assessment, but in fiscal 2021, the Company began its impairment evaluation with the qualitative assessment. The evaluations performed in fiscal 2020, 2021, and 2022 resulted in no impairment charge.
Based on its quantitative assessment conducted as of April 1, 2022, the Company determined for each reporting unit with goodwill that it was more likely than not that its respective fair value exceeded its carrying value, indicating there was no impairment. For more information regarding goodwill balances at June 30, 2022, see Note 4, Goodwill.
Property and Equipment and Other Definite-Lived Intangible Assets
Property and equipment are stated at cost. Depreciation expense is computed using the straight-line method over the estimated useful lives of the assets, including leasehold improvements and finance lease right-of-use assets that are amortized over the shorter of their useful lives or the terms of the respective leases. The Company generally uses the following range of useful lives for its property and equipment categories: buildings and improvements—5 to 50 years; machinery and equipment—3 to 10 years; and furniture and fixtures—3 to 7 years. Depreciation expense was $255 million for the fiscal year ended June 30, 2022, $196 million for the fiscal year ended June 30, 2021, and $165 million for the fiscal year ended June 30, 2020. Depreciation expense includes amortization of assets related to financing leases. The Company charges repairs and maintenance costs to expense as incurred. The amount of capitalized interest for fiscal 2022, 2021 and 2020 was $15 million, $17 million, and $11 million, respectively.
Intangible assets with finite lives, including customer relationships, core technology, patents, and trademarks, are amortized over their useful lives. The Company also capitalizes certain computer software and development costs in other intangibles, net, when incurred in connection with developing or obtaining computer software for internal use. Capitalized software costs are amortized over the estimated useful lives of the software, which generally range from 3 to 5 years. The Company evaluates the recoverability of its other long-lived assets, including amortizing intangible assets, if circumstances indicate impairment may have occurred pursuant to ASC 360, Property, Plant and Equipment. This analysis is performed by
comparing the respective carrying values of the assets to the current and expected future cash flows, on an un-discounted basis, to be generated from such assets. If such analysis indicates that the carrying value of these assets is not recoverable, the carrying value of such assets is reduced to fair value through a charge to the consolidated statements of operations. Fair value is determined based on assumptions the Company believes marketplace participants would utilize and comparable marketplace information in similar arm’s length transactions. The Company recorded impairment charges related to definite-lived intangible assets and property, plant, and equipment of $31 million, $9 million, and $5 million for the fiscal years ended June 30, 2022, 2021, and 2020, respectively.
Post-Retirement and Pension Plans
The Company sponsors various retirement and pension plans, including defined benefit and defined contribution retirement plans. The measurement of the related benefit obligations and the net periodic benefit costs recorded each year are based upon actuarial computations, which require management’s judgment as to certain assumptions. These assumptions include the discount rates used in computing the present value of the benefit obligations and the net periodic benefit costs, the expected future rate of salary increases (for pay-related plans) and the expected long-term rate of return on plan assets (for funded plans). The Company uses the corridor approach to amortize actuarial gains and losses.
The Company has elected to utilize an approach to estimate the service and interest components of net periodic benefit cost for benefit plans that discounts the individual expected cash flows using the applicable spot rates derived from the yield curve over the projected cash flow period. The expected long-term rate of return on plan assets is based on the target asset allocation and the average expected rate of growth for the asset classes invested. The average expected rate of growth is derived from a combination of historic returns, current market indicators, and the expected risk premium for each asset class. The Company uses a measurement date of June 30 for all its retirement and postretirement benefit plans.
Derivative Instruments, Hedging Activities, and Fair Value
Derivative Instruments and Hedging Activities
The Company is exposed to certain risks arising from both its business operations and economic conditions. The Company principally manages its exposures to a wide variety of business and operational risks through management of its core business activities. The Company manages economic risks, including interest-rate, liquidity, and credit risk primarily by managing the amount, sources, and duration of its debt funding and the use of derivative financial instruments. Specifically, the Company enters into derivative financial instruments from time to time to manage exposures that arise from business activities that result in the receipt or payment of future known and uncertain cash amounts, the values of which are determined by interest rates. The Company’s derivative financial instruments are used to manage differences in the amount, timing, and duration of the Company’s known or expected cash receipts and its known or expected cash payments principally related to the Company’s borrowings. The Company does not net any of its derivative positions under master netting arrangements.
Primarily, the Company is exposed to fluctuations in the euro-U.S. dollar exchange rate on its investments in foreign operations in Europe. While the Company does not actively hedge against changes in foreign currency, it has mitigated the exposure of investments in its European operations through a net-investment hedge by denominating a portion of its debt in euros. In addition, a portion of Operating Company's interest payment obligation on its U.S dollar-denominated term loans is exposed to interest rate variability. The Company has mitigated its exposure to this risk by entering into interest-rate swap agreements, which qualify for and are designated as cash-flow hedges. Also, as discussed in Note 9, Derivative Instruments and Hedging Activities, the Company determined that an aspect of the dividend-rate adjustment feature of the Company’s previously outstanding Series A Preferred Stock (as defined below, see Note 13, Equity, Redeemable Preferred Stock, and Accumulated Other Comprehensive Loss) should be accounted for as a derivative liability.
Fair Value
The Company is required to measure certain assets and liabilities at fair value, either upon initial measurement or for subsequent accounting or reporting. The Company uses fair value extensively, including in the initial measurement of net assets acquired in a business combination and when accounting for and reporting on certain financial instruments. The Company estimates fair value using an exit price approach, which requires, among other things, that it determine the price that would be received to sell an asset or paid to transfer a liability in an orderly market. The determination of an exit price is considered from the perspective of market participants, considering the highest and best use of assets and, for liabilities, assuming the risk of non-performance will be the same before and after the transfer. A single estimate of fair value results from a complex series of
judgments about future events and uncertainties and relies heavily on estimates and assumptions. When estimating fair value, depending on the nature and complexity of the assets or liability, the Company may use one or all of the following approaches:
•Market approach, which is based on market prices and other information from market transactions involving identical or comparable assets or liabilities.
•Cost approach, which is based on the cost to acquire or construct comparable assets less an allowance for functional and/or economic obsolescence.
•Income approach, which is based on the present value of the future stream of net cash flows.
Certain investments that are measured at fair value using the net asset value (“NAV”) per share (or its equivalent) practical expedient have not been classified in the fair value hierarchy.
Marketable Securities
The Company classifies its liquid debt investments with original maturities greater than ninety days as marketable securities. The Company invests in highly rated corporate debt securities, with the primary objective of minimizing the potential risk of principal loss. The Company’s investment policy generally requires securities to be investment grade and limits the amount of credit exposure to any single issuer. The Company regularly reviews its investments and utilizes quantitative and qualitative evidence to evaluate potential impairments. For available-for-sale debt securities in an unrealized loss position, the Company assesses whether it intends to sell or if it is more likely than not that the Company will be required to sell the security before recovery of its amortized cost basis. If either of the criteria regarding intent or requirement to sell is met, the security’s amortized cost basis is written down to fair value. If the criteria are not met, the Company evaluates whether the decline in fair value has resulted from a credit loss or other factors. In making this assessment, management considers, among other factors, the extent to which fair value is less than amortized cost, any changes to the rating of the security by a rating agency, and adverse conditions specifically related to the security. If this assessment indicates that a credit loss exists, the present value of cash flows expected to be collected from the security are compared to the amortized cost basis of the security. If the present value of the cash flows expected to be collected is less than the amortized cost basis, a credit loss exists and an allowance for credit losses is recorded for the credit loss, limited by the amount that the fair value is less than the amortized costs basis.
The Company classifies its marketable securities as available-for-sale, because it may sell certain of its marketable securities prior to the stated maturity for various reasons, including management of liquidity, credit risk, duration, relative return, and asset allocation. The Company determines the fair value of each marketable security in its portfolio at each period end and recognizes gains and losses in the portfolio in other comprehensive income. As of June 30, 2022, the amortized cost basis of marketable securities approximates fair value and all outstanding marketable securities mature within one year.
Self-Insurance
The Company is partially self-insured for certain employee health benefits and partially self-insured for property losses and casualty claims. The Company accrues for losses based upon experience and actuarial assumptions, including provisions for losses incurred but not reported.
Accumulated Other Comprehensive Loss
Accumulated other comprehensive loss, which is reported in the accompanying consolidated statements of changes in shareholders’ equity, consists of foreign currency translation, net change in marketable securities, and defined benefit pension plan changes.
Research and Development Costs
The Company expenses research and development costs as incurred. Research and development costs amounted to $23 million, $21 million, and $21 million for the fiscal years ended June 30, 2022, 2021, and 2020, respectively.
Earnings Per Share
The Company reports net earnings per share in accordance with ASC 260, Earnings per Share. The Company computes basic earnings per share for the Common Stock using the two-class method by dividing net income attributable to common stockholders by the weighted average number of common shares outstanding during the period. The Series A Preferred Stock, due to its convertible feature, was participating in nature; accordingly, the outstanding shares of Series A Preferred Stock were included in the two-class method. Diluted earnings per common share measures the performance of the Company over the reporting period while giving effect to all potential shares of Common Stock that were dilutive and outstanding during the period. The denominator includes the weighted average over the measurement period of the sum of the number of shares of
Common Stock outstanding and the number of additional such shares that would have been outstanding if the shares of Common Stock that were both potentially issuable and dilutive had been issued, and is calculated using the more dilutive of the two-class, treasury stock, and if-converted methods.
Income Taxes
In accordance with ASC 740, Income Taxes, the Company accounts for income taxes using the asset and liability method. The asset and liability method requires recognition of deferred tax assets and liabilities for expected future tax consequences of temporary differences that currently exist between tax bases and financial reporting bases of the Company’s assets and liabilities. The Company measures deferred tax assets and liabilities using enacted tax rates in the respective jurisdictions in which it operates. In assessing the ability to realize deferred tax assets, the Company considers whether it is more likely than not that the Company will be able to realize some or all of the deferred tax assets. The calculation of the Company’s tax liabilities involves dealing with uncertainties in the application of complex tax regulations in each of its tax jurisdictions. The number of years with open tax audits varies by tax jurisdiction. A number of years may lapse before a particular matter is audited and finally resolved. The Company applies ASC 740 to determine the accounting for uncertain tax positions. This standard prescribes a minimum recognition threshold a tax position is required to meet before the Company may recognize the position in its financial statements. The standard also provides guidance on derecognition, measurement, classification, interest and penalties, accounting in interim periods, and disclosure. The Company previously elected not to reclassify the income tax effects stranded in accumulated other comprehensive income to retained earnings.
Stock-Based Compensation
The Company accounts for its stock-based compensation in accordance with ASC 718, Compensation—Stock Compensation. Under ASC 718, companies recognize compensation expense using a fair-value-based method for costs related to share-based payments, including stock options and restricted stock units. The expense is measured based on the grant date fair value of the awards, and the expense is recorded over the applicable requisite service period. Forfeitures are recognized as and when they occur. In the absence of an observable market price for a share-based award, the fair value is based upon a valuation methodology that takes into consideration various factors, including the exercise price of the award, the expected term of the award, the current price of the underlying shares, the expected volatility of the underlying share price, the expected dividends on the underlying shares and the risk-free interest rate.
The terms of the Company’s stock-based compensation plans permit an employee holding vested stock options or restricted stock units to elect to have the Company use a portion of the shares otherwise issuable upon the employee’s exercise of the option or grant, a so-called “net settlement transaction,” as a means of paying the exercise price, meeting tax withholding requirements, or both.
Recent Financial Accounting Standards
Recently Adopted Accounting Standards
In December 2019, the Financial Accounting Standards Board (“FASB”) issued Accounting Standards Update (“ASU”) 2019-12, Income Taxes (Topic 740): Simplifying the Accounting for Income Taxes, which eliminates certain exceptions related to the incremental approach for intra-period allocation, deferred tax recognition requirement for changes in equity method investments and foreign subsidiaries, and methodology for calculating income taxes in an interim period. The guidance also simplifies certain aspects of the accounting for franchise taxes, the accounting for step-up in the tax basis of goodwill, and accounting for change in tax laws or rates. The Company adopted the guidance on July 1, 2021. The adoption of this standard did not have a material impact on the Company’s consolidated financial statements.
In August 2018, the FASB issued ASU 2018-14, Compensation—Retirement Benefits—Defined Benefit Plans—General (Subtopic 715-20): Disclosure Framework—Changes to the Disclosure Requirements for Defined Benefit Plan, which removes certain disclosures and added additional disclosures around weighted-average interest crediting rates for cash balance plans and explanation for significant gains and losses related to change in the benefit obligation for the period. The Company adopted the guidance on July 1, 2021. The adoption of this standard did not have a material impact on the Company’s consolidated financial statements.
New Accounting Standards Not Adopted as of June 30, 2022
In March 2020, the FASB issued ASU 2020-04, Reference Rate Reform (Topic 848): Facilitation of the Effects of Reference Rate Reform on Financial Reporting, which provides optional guidance to ease the potential burden in accounting for the discontinuation of a reference rate such as LIBOR, formerly known as the London Interbank Offered Rate, because of reference rate reform. The expedients and exceptions provided by the guidance do not apply to contract modifications made and hedging relationships entered into or evaluated after December 31, 2022. The ASU is effective for all entities as of March 12,
2020 through December 31, 2022. The Company is currently evaluating the impact of adopting this guidance on its consolidated financial statements.
2. REVENUE RECOGNITION
The Company recognizes revenue in accordance with ASC 606, Revenue from Contracts with Customers. The Company generally earns its revenue by supplying goods or providing services under contracts with its customers in three primary revenue streams: manufacturing and commercial product supply, development services, and clinical supply services. The Company measures the revenue from customers based on the consideration specified in its contracts, excluding any sales incentive or amount collected on behalf of a third party that the Company expects to be entitled in exchange for transferring the promised goods to and/or performing services for the customer (the “Transaction Price”). To the extent the Transaction Price includes variable consideration, the Company estimates the amount of variable consideration that should be included in the Transaction Price utilizing either the expected value method or the most likely amount method depending on which method is expected to better predict the amount of consideration to which the Company will be entitled. The value of variable consideration is included in the Transaction Price if, and to the extent, it is probable that a significant reversal of the amount of cumulative revenue recognized will not occur when the uncertainty associated with the variable consideration is subsequently resolved. These estimates are re-assessed each reporting period, as required, and any adjustments required are recorded on a cumulative catch-up basis, which affects revenue and net income in the period of adjustment.
The Company’s customer contracts generally include provisions entitling the Company to a termination penalty when the customer terminates prior to the contract’s nominal end date. The termination penalties in the customer contracts vary but are generally considered substantive for accounting purposes and create enforceable rights and obligations throughout the stated duration of the contract. The Company accounts for a contract termination as a contract modification in the period in which the customer gives notice of termination. The determination of the contract termination penalty is based on the terms stated in the relevant customer agreement. As of the modification date, the Company updates its estimate of the Transaction Price using the expected value method, subject to constraints, and to the extent that it is probable that a significant reversal in the amount of cumulative revenue recognized will not occur when the uncertainty associated with the variable consideration is subsequently resolved. These estimates are re-assessed each reporting period, as required, and any adjustments required are recorded on a cumulative catch-up basis, which would affect revenue and net income in the period of adjustment.
The Company generally expenses sales commissions as incurred because either the amortization period is one year or less, or the balance with an amortization period greater than one year is not material.
The following tables reflect net revenue for the fiscal years ended June 30, 2022, 2021, and 2020 by type of activity and reporting segment (in millions): | | | | | | | | | | | | | | | | | | | | | | | | | | | | | |
| Fiscal Year Ended June 30, 2022 | Biologics | | Softgel and Oral Technologies | | Oral and Specialty Delivery | | Clinical Supply Services | | Total |
| Manufacturing & commercial product supply | $ | 607 | | | $ | 1,081 | | | $ | 403 | | | $ | — | | | $ | 2,091 | |
| Development services | 1,942 | | | 165 | | | 247 | | | — | | | 2,354 | |
| Clinical supply services | — | | | — | | | — | | | 400 | | | 400 | |
| Total | $ | 2,549 | | | $ | 1,246 | | | $ | 650 | | | $ | 400 | | | $ | 4,845 | |
| | | Inter-segment revenue elimination | | (17) | |
| | | | | Combined net revenue | | $ | 4,828 | |
| | | | | | | | | | | | | | | | | | | | | | | | | | | | | |
| Fiscal Year Ended June 30, 2021 | Biologics | | Softgel and Oral Technologies | | Oral and Specialty Delivery | | Clinical Supply Services | | Total |
| Manufacturing & commercial product supply | $ | 533 | | | $ | 877 | | | $ | 455 | | | $ | — | | | $ | 1,865 | |
| Development services | 1,395 | | | 135 | | | 231 | | | — | | | 1,761 | |
| Clinical supply services | — | | | — | | | — | | | 391 | | | 391 | |
| Total | $ | 1,928 | | | $ | 1,012 | | | $ | 686 | | | $ | 391 | | | $ | 4,017 | |
| | | Inter-segment revenue elimination | | (19) | |
| | | | | Combined net revenue | | $ | 3,998 | |
| | | | | | | | | | | | | | | | | | | | | | | | | | | | | |
| Fiscal Year Ended June 30, 2020 | Biologics | | Softgel and Oral Technologies | | Oral and Specialty Delivery | | Clinical Supply Services | | Total |
| Manufacturing & commercial product supply | $ | 332 | | | $ | 955 | | | $ | 450 | | | $ | — | | | $ | 1,737 | |
| Development services | 689 | | | 107 | | | 226 | | | — | | | 1,022 | |
| Clinical supply services | — | | | — | | | — | | | 345 | | | 345 | |
| Total | $ | 1,021 | | | $ | 1,062 | | | $ | 676 | | | $ | 345 | | | $ | 3,104 | |
| | | Inter-segment revenue elimination | | (10) | |
| | | | | Combined net revenue | | $ | 3,094 | |
The following table reflects net revenue by the location where the goods were made or the service performed:
| | | | | | | | | | | | | | | | | | | | |
| (Dollars in millions) | | Fiscal Year Ended
June 30, 2022 | | Fiscal Year Ended
June 30, 2021 | | Fiscal Year Ended
June 30, 2020 |
| | | | | | |
| United States | | $ | 3,110 | | | $ | 2,462 | | | $ | 1,822 | |
| Europe | | 1,506 | | | 1,343 | | | 976 | |
| Other | | 327 | | | 288 | | | 376 | |
| Elimination of revenue attributable to multiple locations | | (115) | | | (95) | | | (80) | |
| Total | | $ | 4,828 | | | $ | 3,998 | | | $ | 3,094 | |
Manufacturing & Commercial Product Supply Revenue
Manufacturing and commercial product supply revenue consists of revenue earned by manufacturing products supplied to customers under long-term commercial supply arrangements. In these arrangements, the customer typically owns and supplies the active pharmaceutical ingredient, or API, that is used in the manufacturing process. The contract generally includes the terms of the manufacturing services and related product quality assurance procedures to comply with regulatory requirements. Due to the regulated nature of the Company’s business, these contract terms are highly interdependent and, therefore, are considered to be a single combined performance obligation. The transaction price is generally stated in the agreement as a fixed price per unit, with no contractual provision for a refund or price concession. Control is transferred to the customer over time, creating a corresponding right to recognize the related revenue, because there is no alternative use to the Company for the asset created and the Company has an enforceable right to payment for performance completed as of that date. Progress is measured based on the units of product that have successfully completed the contractually required product quality assurance process, as the conclusion of that process generally defines the time when the applicable contract and the related regulatory requirements permit the customer to exercise control over the product’s disposition. The customer is typically responsible for arranging the shipping and handling of product following completion of the quality assurance process.
Payment is typically due 30 to 45 days after the goods are delivered as requested by the customer, based on the payment terms set forth in the applicable customer agreement.
Development Services Revenue
Development services contracts generally take the form of short-term, fee-for-service arrangements. Performance obligations vary, but frequently include biologic cell-line development, performing formulation, analytical stability, or other services related to product development, and providing manufacturing services for products that are under development or otherwise not intended for commercial sale. The transaction prices for these arrangements are fixed and include amounts stated in the contracts for each promised service, and each service is generally considered to be a separate performance obligation. The Company recognizes revenue over time because there is no alternative use to the Company for the asset created and the Company has an enforceable right to payment for performance completed as of that date.
The Company measures progress toward the completion of its performance obligations satisfied over time based on the nature of the services to be performed. For certain types of arrangements, revenue is recognized over time and measured using an output method based on the completion of tasks and activities that are performed to satisfy a performance obligation. For all other types of arrangements, revenue is recognized over time and measured using an input method based on effort expended. Each of these methods provides an appropriate depiction of the Company’s progress toward fulfilling its performance obligations for its respective arrangement. In certain development services arrangements that require a portion of the contract consideration to be received in advance at the commencement of the contract, such advance payment is initially recorded as a contract liability.
The Company allocates consideration to each performance obligation using the “relative standalone selling price” as defined under ASC 606. Generally, the Company utilizes observable standalone selling prices in its allocations of consideration. If observable standalone selling prices are not available, the Company estimates the applicable standalone selling price using a cost-plus-margin approach or an adjusted market assessment approach, in each case, representing the amount that the Company believes the market is willing to pay for the applicable service. Payment is typically due 30 to 45 days following the completion of services provided to the customer, based on the payment terms set forth in the applicable customer agreement.
Clinical Supply Services Revenue
Clinical supply services contracts generally take the form of fee-for-service arrangements. Performance obligations for clinical supply services revenue typically include a combination of the following services: the manufacturing, packaging, storage, distribution, destruction, and inventory management of customer clinical trial material. Performance obligations can also include the sourcing of comparator drug products on behalf of customers to be used in clinical trials to compare performance with the drug under clinical investigation. In certain arrangements, the Company recognizes revenue over time when the Company satisfies performance obligations. Satisfaction of the performance obligations is measured using an input method measure of progress based on effort expended by the Company. In other arrangements, revenue is recognized at the point in time when control transfers, which occurs upon either the delivery of the related output of the service to the customer or the completion of quality testing with respect to the product, and the Company has an enforceable right to payment based on the terms of the arrangement.
Payment is typically due 30 to 45 days following the completion of services provided to the customer, based on the payment terms set forth in the applicable customer agreement.
The Company records revenue for comparator sourcing arrangements on a net basis because it is acting as an agent that does not control the product or service before it is transferred to the customer. Payment for comparator sourcing activity is typically received in advance at the commencement of the contract and is initially recorded as a contract liability.
Contract Liabilities
Contract liabilities relate to cash consideration that the Company receives in advance of satisfying the related performance obligations. The contract liabilities balances (current and non-current) as of June 30, 2022 and June 30, 2021 were as follows:
| | | | | | | | |
| (Dollars in millions) | | |
| | |
| Balance at June 30, 2021 | | $ | 321 | |
| | |
| | |
| | |
| | |
| Balance at June 30, 2022 | | $ | 194 | |
| Revenue recognized in the period from amounts included in contracts liability at the beginning of the period: | | $ | (272) | |
| | |
Contract liabilities that will be recognized within 12 months of June 30, 2022 are accounted for in Other accrued liabilities and those that will be recognized longer than 12 months after June 30, 2022 are accounted for within Other liabilities.
Contract Assets
Contract assets primarily relate to the Company's conditional right to receive consideration for development services that have been performed for a customer as of June 30, 2022 but had not yet been invoiced as of June 30, 2022. Contract assets are transferred to trade receivables, net when the Company’s right to receive the consideration becomes unconditional. Contract assets totaled $441 million and $181 million as of June 30, 2022 and 2021, respectively. Contract assets expected to transfer to trade receivables within 12 months are accounted for within Prepaid expenses and other. Contract assets expected to transfer to trade receivables longer than 12 months are accounted for within Other long-term assets.
As of June 30, 2022, the Company's aggregate contract asset balance was $441 million, an increase of $260 million compared to June 30, 2021. The majority of this increase is related to large development programs in the Biologics segment, such as manufacturing and development services for COVID-19 vaccines, where revenue is recorded over time and the ability to invoice customers is dictated by contractual terms. As of June 30, 2022, there were no reserves recorded against the Company's aggregate contract asset balance.
3. BUSINESS COMBINATIONS AND DIVESTITURES
Skeletal Cell Therapy Support SA Acquisition
In November 2020, the Company acquired 100% of the equity interest in Skeletal Cell Therapy Support SA (“Skeletal”) for $15 million, and entered into related supply agreements with the seller. Skeletal operates a cell therapy manufacturing facility in Gosselies, Belgium. The operations were assigned to the Company’s Biologics segment, expanding the Company’s cell therapy capacity for clinical and commercial supply. The acquisition, combined with the Company's other European-based facilities and capabilities in cell therapy, has resulted in an integrated European center of excellence in cell therapy.
The Company accounted for the Skeletal acquisition using the acquisition method in accordance with ASC 805, Business Combinations. The Company funded the entire purchase price with cash on hand and allocated the purchase price among the acquired assets, recognizing $9 million of goodwill. The Company allocated the remainder of the purchase price to trade receivables, property, plant, and equipment, and other current and non-current assets and liabilities assumed in the acquisition. Results for the fiscal years ended June 30, 2022 and 2021 were not material to the Company’s statement of operations, financial position, or cash flows.
Acorda Therapeutics, Inc. Transaction
In February 2021, the Company acquired the manufacturing and packaging operations of Acorda Therapeutics, Inc.'s (“Acorda”) dry powder inhaler and spray dry manufacturing business, including its manufacturing facility located near Boston, Massachusetts, for $83 million. In connection with the purchase, Acorda and the Company entered into a long-term supply agreement, under which the Company continues to manufacture and package an Acorda product at the facility. The facility and operations became part of the Company’s Oral and Specialty Delivery segment. Results of the business acquired were not material to the Company's statement of operations, financial position, or cash flows for the fiscal years ended June 30, 2022 and 2021.
The Company accounted for the Acorda transaction using the acquisition method in accordance with ASC 805. The Company funded the entire purchase price with cash on hand and allocated the purchase price among the acquired assets, recognizing property, plant, and equipment of $79 million, inventory of $2 million, and goodwill of $2 million. The remainder of the purchase price was allocated to other current and non-current assets and liabilities assumed in the acquisition.
Delphi Genetics SA Acquisition
In February 2021, the Company acquired 100% of the equity interest in Delphi Genetics SA (“Delphi”) for $50 million. Delphi is a pDNA cell and gene therapy contract development and manufacturing organization based in Gosselies, Belgium. The facility and operations acquired became part of the Company’s Biologics segment. Results of the business acquired were not material to the Company's statement of operations, financial position, or cash flows for the fiscal years ended June 30, 2022 and 2021.
The Company accounted for the Delphi transaction using the acquisition method in accordance with ASC 805. The Company funded the entire purchase price with cash on hand and allocated the purchase price among the acquired assets, recognizing property, plant, and equipment of $4 million, intangible assets of $7 million, other current assets of $3 million, assumed debt of $6 million, other current liabilities of $1 million and goodwill of $43 million.
Hepatic Cell Therapy Support SA Asset Acquisition
In April 2021, the Company acquired 100% of the equity interest in Hepatic Cell Therapy Support SA (“Hepatic”) for approximately $15 million, net of cash acquired and debt assumed. Hepatic operates a manufacturing facility at the same location where Skeletal operates a cell therapy manufacturing facility in Gosselies, Belgium. The facility acquired expands the Company’s cell therapy capacity for clinical and commercial supply in its Biologics segment.
The Company accounted for the Hepatic transaction as an asset acquisition in accordance with ASC 805. The Company funded the entire purchase price with cash on hand and allocated the purchase price to the assets acquired and liabilities assumed, recognizing property, plant, and equipment of $13 million, other current and non-current assets of $3 million, and assumed debt of $1 million.
RheinCell Therapeutics GmbH Acquisition
In August 2021, the Company acquired 100% of the equity interest in RheinCell Therapeutics GmbH (“RheinCell”) for approximately $26 million, net of cash acquired. RheinCell is a developer and manufacturer of development and cGMP-grade iPSCs based in Lagenfeld, Germany. The operations became part of the Company’s Biologics segment and builds upon Catalent’s existing custom cell therapy process development and manufacturing capabilities with proprietary cGMP cell lines for iPSC-based therapies.
The Company accounted for the RheinCell transaction using the acquisition method in accordance with ASC 805. The Company funded the entire purchase price with cash on hand and allocated the purchase price among the assets acquired, recognizing $4 million of current liabilities, $1 million of other liabilities, $14 million of intangible assets, and goodwill of $17 million. Results of this business were not material to the Company's statement of operations, financial position, or cash flows for the fiscal year ended June 30, 2022.
Bettera Holdings, LLC Acquisition
In October 2021, the Company acquired 100% of the equity interest in Bettera Wellness for approximately $1 billion, which was funded in part with net proceeds of the Company’s issuance of $650 million aggregate principal amount of 3.500% Senior Notes due 2030 (the “2030 Notes”) and in part with net proceeds from the Incremental Term B-3 Loans (as defined in Note 7, Long-Term Obligations and Short-Term Borrowings). Bettera Wellness is a manufacturer of nutraceuticals and nutritional supplements in gummy, soft chew, and lozenge delivery formats.
The Company accounted for the Bettera Wellness transaction using the acquisition method in accordance with ASC 805. The Company estimated fair values at the date of acquisition for the allocation of consideration to the net tangible and intangible assets acquired and liabilities assumed.
The final purchase price was allocated to assets acquired and liabilities assumed in the acquisition as follows:
| | | | | |
| (Dollars in millions) | Purchase Price Allocation |
| Cash and cash equivalents | $ | 23 | |
| Trade receivables, net | 16 | |
| Inventories | 31 | |
| Other current assets | 4 | |
| Property, plant, and equipment | 72 | |
Other intangibles, net (1) | 361 | |
| Other assets | 12 | |
| Current liabilities | (22) | |
| Other liabilities | (11) | |
| Goodwill | 531 | |
| Total assets acquired and liabilities assumed | $ | 1,017 | |
(1) Other intangibles, net includes core technology of $338 million and customer relationships of $23 million.
The carrying value of trade receivables, inventory, and trade payables, as well as certain other current and non-current assets and liabilities, generally represented the fair value at the date of acquisition.
Property, plant, and equipment assets were valued using the cost approach, which is based on current replacement and/or reproduction cost of the related asset as new, less depreciation attributable to physical, functional, and economic factors. The Company then determined the remaining useful life based on the anticipated life of the asset and Company policy for similar assets.
Core technology intangible assets of $338 million were valued using the multi-period, excess-earnings method, a method that values the intangible asset using the present value of the after-tax cash flows attributable to the intangible asset only. The significant assumptions used in developing the valuation included the estimated annual net cash flows (including application of an appropriate margin to forecasted revenue, revenue obsolescence rate, selling and marketing costs, return on working capital, contributory asset charges, and other factors), the discount rate that appropriately reflects the risk inherent in each future cash flow stream, and an assessment of the asset’s life cycle, as well as other factors. The assumptions used in the financial forecasts were based on historical data, supplemented by current and anticipated growth rates, management plans, and market-comparable information. Fair-value determinations require considerable judgment and are sensitive to changes in underlying assumptions and factors. The core technology intangible asset has a weighted average useful life of 10 years.
Goodwill has been allocated to the Softgel and Oral Technologies segment as shown in Note 4, Goodwill. Goodwill is mainly comprised of growth from expected increases in capacity utilization and new customers. The goodwill resulting from the Bettera Wellness acquisition is deductible for tax purposes.
Results of this business were not material to the Company's consolidated statement of operations, financial position, or cash flows for the fiscal year ended June 30, 2022.
Vaccine Manufacturing and Innovation Centre UK Limited Asset Acquisition
In April 2022, the Company, through its wholly owned subsidiary, Catalent Oxford Limited, acquired a development and manufacturing facility near Oxford, United Kingdom (“U.K.”) and certain related assets and liabilities from The Vaccine Manufacturing and Innovation Centre UK Limited for $134 million in cash, including $9 million of closing costs. The facility and related assets and liabilities became part of the Company’s Biologics segment.
The Company accounted for this transaction as an acquisition of assets in accordance with ASC 805. The Company funded this acquisition with cash on hand and allocated the purchase price among the net assets acquired, recognizing $1 million of current assets, $165 million of property, plant, and equipment, $18 million of current liabilities, and $14 million of other liabilities. Results of this business were not material to the Company's statement of operations, financial position, or cash flows for the fiscal year ended June 30, 2022.
Princeton Cell Therapy Development and Manufacturing Acquisition
In April 2022, the Company acquired a cell therapy commercial manufacturing facility and operations near Princeton, New Jersey (“Princeton”) from Erytech Pharma S.A. (“Erytech”) for $45 million in cash, subject to customary adjustments. In connection with the purchase, Erytech and the Company entered into a long-term supply agreement, under which the Company will continue to manufacture and package an Erytech product at the Princeton facility. The operations and facility acquired became part of the Company’s Biologics segment.
The Company accounted for this transaction using the acquisition method in accordance with ASC 805. The Company funded this acquisition with cash on hand and preliminarily allocated the purchase price among the assets acquired, recognizing $22 million of property, plant, and equipment, $10 million of other assets, $1 million of current liabilities, $10 million of other liabilities, and goodwill of $24 million. Results of this business were not material to the Company's statement of operations, financial position, or cash flows for the fiscal year ended June 30, 2022.
The Company has not completed its analysis regarding the assets acquired and liabilities assumed. Therefore, the allocation to property, plant and equipment is preliminary and subject to finalization. The Company expects to finalize its allocation over the next several months, but, in any event, within one year from the acquisition date.
Blow-Fill-Seal Divestiture
In March 2021, the Company sold 100% of the shares of Catalent USA Woodstock, Inc. and certain related assets (collectively, the “Blow-Fill-Seal Business”) for $300 million cash, a $50 million note receivable (estimated fair value of $47 million) as well as potential additional contingent consideration (up to $50 million) dependent upon the performance of aspects of the Blow-Fill-Seal Business. The Blow-Fill-Seal Business was part of the Oral and Specialty Delivery segment. The carrying value of the net assets sold was $149 million, which included goodwill of $54 million. As a result of the sale, the Company realized a gain from divestiture of $182 million, net of transaction costs, for the fiscal year ended June 30, 2021.
During the fiscal year ended June 30, 2022, the Company settled a post-closing purchase price adjustment, which resulted in a gain on sale of subsidiary of $1 million.
All consideration received was measured at its divestiture date fair value. The Company valued the total consideration received from divestiture of the Blow-Fill-Seal Business as follows:
| | | | | |
| (Dollars in millions) | Fair value of consideration received |
| Cash, gross | $ | 300 | |
Note receivable (1) | 47 | |
Contingent consideration (2) | — | |
Other (3) | (16) | |
| Total | $ | 331 | |
(1) The note receivable, which provides for interest at a rate of 5.0% paid in kind, had an estimated fair value of $47 million and $51 million at June 30, 2021 and June 30, 2022, respectively. The fair value at divestiture date consisted of a $50 million aggregate principal amount less a $3 million discount determined using a discounted cash flow model.
(2) The Company determined that the estimated fair value of the contingent consideration from the sale of the Blow-Fill-Seal Business at June 30, 2022 is zero, and therefore no contingent consideration was recorded at divestiture. If any contingent consideration is subsequently received, it will be recorded in the period in which it is received. The Company has elected an accounting policy to recognize increases in the carrying amount of the contingent consideration asset using the gain contingency guidance in ASC 450, Contingencies.
(3) Other includes $8 million of transaction expenses, a working capital adjustment of $6 million, and a $2 million assumption of liabilities resulting in net cash proceed of $284 million.
4. GOODWILL
The following table summarizes the changes from June 30, 2020 to June 30, 2021 and then to June 30, 2022 in the carrying amount of goodwill in total and by reporting segment:
| | | | | | | | | | | | | | | | | | | | | | | | | | | | | |
| (Dollars in millions) | Biologics | | Softgel and Oral Technologies | | Oral and Specialty Delivery | | Clinical Supply Services | | Total |
| Balance at June 30, 2020 | $ | 1,463 | | | $ | 505 | | | $ | 355 | | | $ | 148 | | | $ | 2,471 | |
Additions (1) | 54 | | | — | | | 2 | | | — | | | 56 | |
Divestitures (2) | — | | | — | | | (54) | | | — | | | (54) | |
| | | | | | | | | |
| | | | | | | | | |
| Foreign currency translation adjustments | 14 | | | 11 | | | 13 | | | 8 | | | 46 | |
| Balance at June 30, 2021 | 1,531 | | | 516 | | | 316 | | | 156 | | | 2,519 | |
Additions (3) | 41 | | | 531 | | | — | | | — | | | 572 | |
| | | | | | | | | |
| | | | | | | | | |
| | | | | | | | | |
| Foreign currency translation adjustments | (37) | | | (24) | | | (15) | | | (9) | | | (85) | |
| Balance at June 30, 2022 | $ | 1,535 | | | $ | 1,023 | | | $ | 301 | | | $ | 147 | | | $ | 3,006 | |
(1) The additions to goodwill arise from the Skeletal (Biologics), Delphi (Biologics) and Acorda (Oral and Specialty Delivery) transactions. For further details, see Note 3, Business Combinations and Divestitures.
(2) Represents goodwill associated with the divestiture of the Blow-Fill-Seal Business.
(3) The additions to goodwill arise from the Bettera Wellness (Softgel and Oral Technologies), Princeton (Biologics), RheinCell (Biologics), and Delphi (Biologics) acquisitions. For further details, see Note 3, Business Combinations and Divestitures.
The Company recorded no impairment charge to goodwill in fiscal 2022, 2021, or 2020.
5. OTHER INTANGIBLES, NET
The details of other intangible assets subject to amortization as of June 30, 2022 and June 30, 2021 are as follows (in millions):
| | | | | | | | | | | | | | | | | | | | | | | |
| June 30, 2022 | Weighted Average Life | | Gross Carrying Value | | Accumulated Amortization | | Net Carrying Value |
| Amortized intangibles: | | | | | | | |
| Core technology | 11 years | | $ | 480 | | | $ | (121) | | | $ | 359 | |
| Customer relationships | 13 years | | 1,020 | | | (366) | | | 654 | |
| Product relationships | 8 years | | 239 | | | (204) | | | 35 | |
| Other | 4 years | | 24 | | | (12) | | | 12 | |
| Total other intangibles | | | $ | 1,763 | | | $ | (703) | | | $ | 1,060 | |
| | | | | | | | | | | | | | | | | | | | | | | |
| June 30, 2021 | Weighted Average Life | | Gross Carrying Value | | Accumulated Amortization | | Net Carrying Value |
| Amortized intangibles: | | | | | | | |
| Core technology | 19 years | | $ | 140 | | | $ | (94) | | | $ | 46 | |
| Customer relationships | 14 years | | 1,024 | | | (306) | | | 718 | |
| Product relationships | 11 years | | 281 | | | (237) | | | 44 | |
| Other | 5 years | | 17 | | | (8) | | | 9 | |
| Total other intangibles | | | $ | 1,462 | | | $ | (645) | | | $ | 817 | |
Amortization expense was $123 million, $93 million, and $89 million for the fiscal years ended June 30, 2022, 2021, and 2020, respectively. Future amortization expense for the next five fiscal years is estimated to be:
| | | | | | | | | | | | | | | | | | | | | | | | | | | | | | | | | | | | | | | | | |
| (Dollars in millions) | 2023 | | 2024 | | 2025 | | 2026 | | 2027 | | Thereafter | | Total |
| Amortization | $ | 132 | | | $ | 131 | | | $ | 129 | | | $ | 121 | | | $ | 105 | | | $ | 442 | | | $ | 1,060 | |
6. RESTRUCTURING COSTS
From time to time, the Company has implemented plans to restructure certain operations, both domestically and internationally. The restructuring plans focused on various aspects of operations, including closing and consolidating certain manufacturing operations, rationalizing headcount and aligning operations in a strategic and more cost-efficient structure. In addition, the Company may incur restructuring charges in the future in cases where a material change in the scope of operation with its business occurs. Employee-related costs consist primarily of severance costs and also include outplacement services provided to employees who have been involuntarily terminated and duplicate payroll costs during transition periods. Facility exit and other costs consist of accelerated depreciation, equipment relocation costs, and costs associated with planned facility closures to streamline Company operations.
During the fiscal year ended June 30, 2022, no material restructuring plan was adopted.
During the fiscal year ended June 30, 2021, the Company adopted a plan to reduce costs and optimize its infrastructure in Europe by closing its Clinical Supply Services facility in Bolton, U.K. In connection with this restructuring plan, the Company reduced its headcount by approximately 170 employees and incurred cumulative charges of $10 million, primarily associated with employee severance benefits. For the fiscal year ended June 30, 2022, restructuring charges associated with the Bolton facility closure were $3 million. Restructuring costs for the fiscal years ended June 30, 2022, 2021, and 2020 were recorded in Other Operating Expense in the Consolidated Statement of Operations.
The following table summarizes the costs recorded within restructuring costs:
| | | | | | | | | | | | | | | | | |
| Fiscal Year Ended June 30, |
(Dollars in millions) | 2022 | | 2021 | | 2020 |
| Restructuring costs: | | | | | |
| Employee-related reorganization | $ | 9 | | | $ | 8 | | | $ | 6 | |
| Facility exit and other costs | 1 | | | 2 | | | — | |
| Total restructuring costs | $ | 10 | | | $ | 10 | | | $ | 6 | |
7. LONG-TERM OBLIGATIONS AND SHORT-TERM BORROWINGS
Long-term obligations and short-term borrowings consist of the following at June 30, 2022 and June 30, 2021:
| | | | | | | | | | | | | | | | | |
| (Dollars in millions) | Maturity as of June 30, 2022 | | June 30, 2022 | | June 30, 2021 |
| Senior secured credit facilities | | | | | |
| | | | | |
| Term loan facility B-3 | February 2028 | | 1,433 | | | 997 | |
| | | | | |
| | | | | |
| | | | | |
| 5.000% senior notes due 2027 | July 2027 | | 500 | | | 500 | |
2.375% euro senior notes due 2028(1) | March 2028 | | 874 | | | 984 | |
| 3.125% senior notes due 2029 | February 2029 | | 550 | | | 550 | |
| 3.500% senior notes due 2030 | April 2030 | | 650 | | | — | |
| Deferred purchase consideration | | | — | | | 50 | |
| | | | | |
| Financing lease obligations | 2022 to 2120 | | 234 | | | 193 | |
| Other obligations | 2022 to 2028 | | 2 | | | 3 | |
| Unamortized discount and debt issuance costs | | | (41) | | | (36) | |
| Total debt | | | 4,202 | | | 3,241 | |
Less: current portion of long-term obligations and other short-term
borrowings | | | 31 | | | 75 | |
| Long-term obligations, less current portion | | | $ | 4,171 | | | $ | 3,166 | |
(1) The decrease in euro-denominated debt at June 30, 2022 compared to the prior year is primarily due to fluctuations in foreign currency exchange rates.
Senior Secured Credit Facilities and Sixth Amendment to the Credit Agreement
In September 2021, Operating Company entered into Amendment No. 6 (the "Sixth Amendment") to its Amended and Restated Credit Agreement, dated as of May 20, 2014 (as subsequently amended, the "Credit Agreement"). Pursuant to the Sixth Amendment, Operating Company incurred an additional $450 million aggregate principal amount of U.S. dollar-denominated term loans (the "Incremental Term B-3 Loans") and amended the quarterly amortization payments from 0.25% to 0.2506% of the principal amount outstanding for the Incremental Term B-3 Loans and the other term loans outstanding under the Credit Agreement, all of which are U.S. dollar-denominated (together with the Incremental Term B-3 Loans, the “Term B-3 Loans”). The Incremental Term B-3 Loans otherwise feature the same principal terms as the drawn Term B-3 Loans, including an interest rate of one-month LIBOR (subject to a floor of 0.50%) plus 2.00% per annum and a maturity date of February 2028. The proceeds of the Incremental Term B-3 Loans, after payment of the offering fees and expenses, were used in part to fund a portion of the consideration paid at the closing of the Bettera Wellness acquisition.
The Sixth Amendment also provided for incremental revolving credit commitments under Operating Company’s secured revolving credit commitments, which is part of its senior secured credit facilities (as amended, the “Revolving Credit Facility”). The applicable rate for all loans drawn under the Revolving Credit Facility is one-month LIBOR plus 2.25% and such rate can be reduced to one-month LIBOR plus 2.00% in future periods based on a measure of Operating Company's total leverage ratio. The maturity date for the Revolving Credit Facility is May 17, 2024. In addition, pursuant to Amendment No. 5 to the Credit Agreement (the “Fifth Amendment”), certain modifications were made to the Credit Agreement in order to, among other things, provide for determination of a benchmark replacement interest rate when LIBOR is no longer available.
Pursuant to the terms of the Credit Agreement the interest rates under the Term B-3 Loans and loans drawn under the Revolving Credit Facility will be based on a replacement benchmark interest rate when LIBOR is no longer available.
The availability of capacity under the Revolving Credit Facility is reduced by the aggregate value of all outstanding letters of credit under the Credit Agreement. As of June 30, 2022, Operating Company had $721 million of unutilized capacity under the Revolving Credit Facility due to $4 million of outstanding letters of credit.
5.000% Senior Notes due 2027
In June 2019, Operating Company completed a private offering of $500 million aggregate principal amount of 5.000% Senior Notes due 2027 (the “2027 Notes”). The 2027 Notes are fully and unconditionally guaranteed, jointly and severally, by all of the wholly owned U.S. subsidiaries of Operating Company that guarantee its senior secured credit facilities. The 2027 Notes were offered in the U.S to qualified institutional buyers in reliance on Rule 144A under the Securities Act of 1933, as amended (the "Securities Act") and outside the U.S only to non-U.S. investors pursuant to Regulation S under the Securities Act. The 2027 Notes will mature on July 15, 2027 and bear interest at the rate of 5.000% per annum. Interest is payable semi-annually in arrears on January 15 and July 15 of each year, beginning on January 15, 2020. The proceeds of the 2027 Notes after payment of the offering fees and expenses were used to repay in full the borrowings under Operating Company’s then-outstanding term loans under its senior secured credit facilities that would otherwise have matured in May 2024.
2.375% Euro-denominated Senior Notes due 2028
In March 2020, Operating Company completed a private offering of €825 million aggregate principal amount of 2.375% Senior Notes due 2028 (the "2028 Notes"). The 2028 Notes are fully and unconditionally guaranteed, jointly and severally, by all of the wholly owned U.S. subsidiaries of Operating Company that guarantee its senior secured credit facilities. The 2028 Notes were offered in the U.S. to qualified institutional buyers in reliance on Rule 144A under the Securities Act and outside the U.S. only to non-U.S. investors pursuant to Regulation S under the Securities Act. The 2028 Notes will mature on March 1, 2028 and bear interest at the rate of 2.375% per annum. Interest is payable semi-annually in arrears on March 1 and September 1 of each year. The proceeds of the 2028 Notes after payment of the offering fees and expenses were used to repay in full the borrowings then outstanding under Operating Company's euro-denominated term loans under its senior secured credit facilities, which would have matured in May 2024, and repay in full Operating Company's euro-denominated 4.75% Senior Notes due 2024 (the “2024 Notes”), which would have matured in December 2024, plus any accrued and unpaid interest thereon, with the remainder available for general corporate purposes.
3.125% Senior Notes due 2029
In February 2021, Operating Company completed a private offering of $550 million aggregate principal amount of 3.125% Senior Notes due 2029 (the "2029 Notes"). The 2029 Notes are fully and unconditionally guaranteed, jointly and severally, by all of the wholly owned U.S. subsidiaries of Operating Company that guarantee its senior secured credit facilities. The 2029 Notes will mature on February 15, 2029 and bear interest at the rate of 3.125% per annum payable semi-annually in arrears on February 15 and August 15 of each year, beginning on August 15, 2021. The proceeds of the 2029 Notes after payment of the offering fees and expenses were used to repay in full the outstanding borrowings under Operating Company's 4.875% Senior Notes due 2026 (the "2026 Notes"), which would have matured in January 2026 plus any accrued and unpaid interest thereon, with the remainder available for general corporate purposes.
3.500% Senior Notes due 2030
In September 2021, Operating Company completed a private offering of the 2030 Notes (together with the 2027 Notes, the 2028 Notes, and the 2029 Notes, the "Senior Notes"). The 2030 Notes are fully and unconditionally guaranteed, jointly and severally, by all of the wholly owned U.S. subsidiaries of Operating Company that guarantee its senior secured credit facilities. The 2030 Notes were offered in the U.S. to qualified institutional buyers in reliance on Rule 144A under the Securities Act and outside the U.S. only to non-U.S. investors pursuant to Regulation S under the Securities Act. The 2030 Notes will mature on April 1, 2030 and bear interest at the rate of 3.500% per annum payable semi-annually in arrears on April 1 and October 1 of each year, beginning on April 1, 2022. The proceeds of the 2030 Notes, after payment of the offering fees and expenses, were used to fund a portion of the consideration paid at the closing of the Bettera Wellness acquisition.
Deferred Purchase Consideration
In connection with the acquisition of Cook Pharmica LLC (now Catalent Indiana, LLC) in October 2017, $200 million of the $950 million aggregate nominal purchase price was payable in $50 million installments, on each of the first four anniversaries of the closing date. The Company made installment payments in October 2018, October 2019, October 2020 and the final payment was made in October 2021.
Long-Term and Other Obligations
Other obligations consist primarily of finance leases for buildings and other loans for business and working capital needs. Maturities of long-term obligations, including finance leases of $234 million, and other short-term borrowings for future fiscal years are:
| | | | | | | | | | | | | | | | | | | | | | | | | | | | | | | | | | | | | | | | | |
| (Dollars in millions) | 2023 | | 2024 | | 2025 | | 2026 | | 2027 | | Thereafter | | Total |
| Maturities of long-term and other obligations | $ | 31 | | | $ | 31 | | | $ | 29 | | | $ | 26 | | | $ | 27 | | | $ | 4,099 | | | $ | 4,243 | |
Debt Issuance Costs
Debt issuance costs associated with the Credit Agreement (other than its Revolving Credit Facility component) and the Senior Notes are presented as a reduction to the carrying value of the related debt, while debt issuance costs associated with the Revolving Credit Facility are capitalized within other long-term assets on the consolidated balance sheet. All debt issuance costs are amortized over the life of the related obligation through charges to interest expense in the consolidated statements of operations. The unamortized total debt issuance costs, including the costs associated with the Revolving Credit Facility capitalized within other long-term assets, were $42 million and $39 million as of June 30, 2022 and 2021, respectively. Amortization of debt issuance costs totaled $7 million and $6 million for the fiscal years ended June 30, 2022 and 2021, respectively.
Guarantees and Security
Senior Secured Credit Facilities
All obligations under the Credit Agreement, and the guarantees of those obligations, are secured by substantially all of the following assets of Operating Company and each guarantor (Operating Company's parent entity, PTS Intermediate, and each of Operating Company's material domestic subsidiaries), subject to certain exceptions:
•a pledge of 100% of the capital stock of Operating Company and 100% of the equity interests directly held by Operating Company and each guarantor in any wholly owned material subsidiary of Operating Company or any guarantor (which pledge, in the case of any non-U.S. subsidiary of a U.S. subsidiary, will not include more than 65% of the voting stock of such non-U.S. subsidiary); and
•a security interest in, and mortgages on, substantially all tangible and intangible assets of Operating Company and of each guarantor, subject to certain limited exceptions.
The Senior Notes
All obligations under the Senior Notes are general, unsecured, and subordinated to all existing and future secured indebtedness of the guarantors to the extent of the value of the assets securing such indebtedness. Each of the Senior Notes is separately guaranteed by all of Operating Company's wholly owned U.S. subsidiaries that guarantee the senior secured credit facilities. None of the Senior Notes is guaranteed by either PTS Intermediate or the Company.
Debt Covenants
Senior Secured Credit Facilities
The Credit Agreement contains covenants that, among other things, restrict, subject to certain exceptions, Operating Company’s (and Operating Company’s restricted subsidiaries’) ability to incur additional indebtedness or issue certain preferred shares; create liens on assets; engage in mergers and consolidations; sell assets; pay dividends and distributions or repurchase capital stock; repay subordinated indebtedness; engage in certain transactions with affiliates; make investments, loans or advances; make certain acquisitions; enter into sale and leaseback transactions; amend material agreements governing Operating Company's subordinated indebtedness and change Operating Company's lines of business.
The Credit Agreement also contains change of control provisions and certain customary affirmative covenants and events of default. The Revolving Credit Facility requires compliance with a net leverage covenant when there is a 30% or more draw outstanding at a period end. As of June 30, 2022, the Company was in compliance with all material covenants under the Credit Agreement.
Subject to certain exceptions, the Credit Agreement permits Operating Company and its restricted subsidiaries to incur certain additional indebtedness, including secured indebtedness. None of Operating Company’s non-U.S. subsidiaries nor its dormant Puerto Rico subsidiary is a guarantor of the loans.
Under the Credit Agreement, Operating Company’s ability to engage in certain activities such as incurring certain additional indebtedness, making certain investments, and paying certain dividends is tied to ratios based on Adjusted EBITDA (which is defined as “Consolidated EBITDA” in the Credit Agreement). Adjusted EBITDA is based on the definitions in the Credit Agreement, is not defined under U.S. GAAP, and is subject to important limitations.
The Senior Notes
The various indentures governing the Senior Notes (collectively, the “Indentures”) contain covenants that, among other things, limit the ability of Operating Company and its restricted subsidiaries to incur or guarantee more debt or issue certain preferred shares; pay dividends on, repurchase, or make distributions in respect of their capital stock or make other restricted payments; make certain investments; sell certain assets; create liens; consolidate, merge, sell; or otherwise dispose of all or substantially all of their assets; enter into certain transactions with their affiliates, and designate their subsidiaries as unrestricted subsidiaries. These covenants are subject to a number of exceptions, limitations, and qualifications as set forth in the Indentures. The Indentures also contain customary events of default, including, but not limited to, nonpayment, breach of covenants, and payment or acceleration defaults in certain other indebtedness of Operating Company or certain of its subsidiaries. Upon an event of default, either the holders of at least 30% in principal amount of each of the then-outstanding Senior Notes or the applicable Trustee under the Indentures may declare the applicable notes immediately due and payable; or in certain circumstances, the applicable notes will automatically become immediately due and payable. As of June 30, 2022, Operating Company was in compliance with all material covenants under the Indentures.
Estimated Fair Value of Debt Measurements
The estimated fair values of the senior secured credit facilities and Senior Notes are classified as Level 2 (see Note 10, Fair Value Measurements for a description of the method by which fair value classifications are determined) in the fair value hierarchy and are calculated by using a discounted cash flow model with market interest rate as a significant input. The carrying amounts and the estimated fair values of financial instruments as of June 30, 2022 and June 30, 2021 are as follows:
| | | | | | | | | | | | | | | | | | | | | | | | | | | | | |
| | | June 30, 2022 | | June 30, 2021 |
| (Dollars in millions) | Fair Value Measurement | | Carrying Value | | Estimated Fair Value | | Carrying Value | | Estimated Fair Value |
| | | | | | | | | |
| | | | | | | | | |
| 5.000% Senior Notes due 2027 | Level 2 | | $ | 500 | | | $ | 483 | | | $ | 500 | | | $ | 539 | |
| 2.375% euro Senior Notes due 2028 | Level 2 | | 874 | | | 744 | | | 984 | | | 993 | |
| 3.125% Senior Notes due 2029 | Level 2 | | 550 | | | 476 | | | 550 | | | 524 | |
| 3.500% senior notes due 2030 | Level 2 | | 650 | | | 561 | | | — | | | — | |
| Senior secured credit facilities & other | Level 2 | | 1,669 | | | 1,575 | | | 1,243 | | | 1,209 | |
| Subtotal | | | $ | 4,243 | | | $ | 3,839 | | | $ | 3,277 | | | $ | 3,265 | |
| Debt issuance costs | | | (41) | | | — | | | (36) | | | — | |
| Total debt | | | $ | 4,202 | | | $ | 3,839 | | | $ | 3,241 | | | $ | 3,265 | |
8. EARNINGS PER SHARE
The Company computed earnings per share (“EPS”) of the Common Stock for fiscal 2020, 2021, and 2022 using the two-class method required due to the participating nature of the formerly outstanding Series A Preferred Stock (as noted and defined in Note 13, Equity, Redeemable Preferred Stock and Accumulated Other Comprehensive Loss). The weighted-average number of shares outstanding utilized in diluted earnings per share is computed using the weighted-average number of common shares outstanding plus the number of common shares that would be issued assuming exercise or conversion of all potentially dilutive instruments. Dilutive securities having an anti-dilutive effect on diluted net income per share are excluded from the calculation. The dilutive effect of the securities that are issuable under the Company’s equity incentive plans (see Note 14, Stock-Based Compensation) are reflected in diluted earnings per share by application of the treasury stock method. The Company applied the if-converted method to compute the potentially dilutive effect of the Series A Preferred Stock. The reconciliations between
basic and diluted earnings per share attributable to Catalent common shareholders for the fiscal years ended June 30, 2022, 2021, and 2020 are as follows:
| | | | | | | | | | | | | | | | | |
| | Fiscal year ended June 30, |
| (In millions, except per share data) | 2022 | | 2021 | | 2020 |
| Net earnings | $ | 519 | | | $ | 585 | | | $ | 221 | |
| Less: Net earnings attributable to preferred shareholders | (16) | | | (56) | | | (48) | |
| Net earnings attributable to common shareholders | $ | 503 | | | $ | 529 | | | $ | 173 | |
| | | | | |
| Weighted average shares outstanding - basic | 176 | | | 168 | | | 150 | |
Weighted average dilutive securities issuable - stock plans | 2 | | | 2 | | | 2 | |
| Total weighted average shares outstanding - diluted | 178 | | | 170 | | | 152 | |
| | | | | |
| Earnings per share: | | | | | |
| Basic | $ | 2.85 | | | $ | 3.15 | | | $ | 1.16 | |
| Diluted | $ | 2.84 | | | $ | 3.11 | | | $ | 1.14 | |
| | | | | |
| | | | | |
The Company's Series A Preferred Stock was deemed a participating security, meaning that it had the right to participate in undistributed earnings with the Company's Common Stock. On November 23, 2020 (the “Partial Conversion Date”), holders of Series A Preferred Stock converted 265,223 shares and $2 million of unpaid accrued dividends into shares of Common Stock (the “Partial Conversion”). The holders received 20.33 shares of Common Stock for each converted preferred share, resulting in the issuance of 5,392,280 shares of Common Stock. On November 18, 2021 (the “Final Conversion Date”), the holders of Series A Preferred Stock converted the remaining 384,777 shares of Series A Preferred Stock and $2 million of unpaid accrued dividends into shares of Common Stock (the “Final Conversion”). These holders received 20.32 shares of Common Stock for each converted share of Series A Preferred Stock, resulting in the aggregate issuance of 7,817,554 shares of Common Stock by the Company. See Note 13, Equity, Redeemable Preferred Stock and Accumulated Other Comprehensive Loss for further details.
The diluted weighted average number of shares outstanding for the fiscal years ended June 30, 2022, 2021 and 2020 did not include the following weighted average number of shares of Common Stock associated with the formerly outstanding Series A Preferred Stock or the weighted average number of shares of Common Stock associated with outstanding equity grants due to their antidilutive effect:
| | | | | | | | | | | | | | | | | |
| Fiscal year ended June 30, |
| (share counts in millions) | 2022 | | 2021 | | 2020 |
| | | | | |
| | | | | |
| | | | | |
| Series A Preferred Stock | 3 | | | 10 | | | 13 | |
| | | | | |
| | | | | |
| | | | | |
9. DERIVATIVE INSTRUMENTS AND HEDGING ACTIVITIES
Risk Management Objective of Using Derivatives
The Company is exposed to fluctuations in the currency exchange rates applicable to its investments in foreign operations. While the Company does not actively hedge against changes in foreign currency, the Company has mitigated the exposure arising from its investments in its European operations by denominating a portion of its Senior Notes in euros. At June 30, 2022, the Company had euro-denominated debt outstanding of $874 million (U.S. dollar equivalent), which qualifies as a hedge of a net investment in foreign operations. For non-derivatives designated and qualifying as net investment hedges, the effective portion of the translation gains or losses are reported in accumulated other comprehensive income (loss) as part of the cumulative translation adjustment. The unhedged portions of the translation gains or losses are reported in the consolidated statements of operations. The following table includes net investment hedge activity during the fiscal years ended June 30, 2022 and 2021, respectively:
| | | | | | | | | | | |
| (Dollars in millions) | June 30, 2022 | | June 30, 2021 |
| Unrealized foreign exchange gain (loss) within Other Comprehensive Income | $ | 121 | | | $ | (56) | |
| Unrealized foreign exchange loss within the Consolidated Statements of Operations | $ | (11) | | | $ | (3) | |
The net accumulated gain of this net investment hedge within accumulated other comprehensive loss was $127 million as of June 30, 2022. Amounts are reclassified out of accumulated other comprehensive loss into earnings when the entity in which the gains and losses reside is either sold or substantially liquidated.
Preferred Stock Derivative Liability
As discussed in Note 13, Equity, Redeemable Preferred Stock and Accumulated Other Comprehensive Loss, in May 2019, the Company issued shares of Series A Preferred Stock in exchange for net proceeds of $646 million after taking into account the $4 million issuance cost.
The dividend rate used to determine the amount of the quarterly dividend payable on shares of the Series A Preferred Stock was subject to adjustment so as to provide holders of shares of Series A Preferred Stock with certain protections against a decline in the trading price of shares of Common Stock. The Company determined that this feature should be accounted for as a derivative liability, since the feature fluctuates inversely to changes in the trading price and is also linked to the performance of the S&P 500 stock index. Accordingly, the Company bifurcated the adjustable dividend feature from the remainder of the Series A Preferred Stock and accounted for this feature as a derivative liability at fair value.
A portion of the derivative liability was settled on the Partial Conversion Date due to the Partial Conversion. The fair value of the derivative liability as of the Partial Conversion Date was $9 million, of which $4 million was related to the converted portion of the outstanding shares of Series A Preferred Stock. The remainder of the derivative liability was settled on the Final Conversion Date due to the Final Conversion. The fair value of the derivative liability as of the Final Conversion Date was $1 million. See Note 13, Equity, Redeemable Preferred Stock, and Accumulated Other Comprehensive Loss for details of the Partial Conversion.
Interest-Rate Swap
Pursuant to its interest rate and risk management strategy, in April 2020, the Company entered into an interest-rate swap agreement with Bank of America N.A. as a hedge against the economic effect of a portion of the variable interest obligation associated with its U.S dollar-denominated term loans under its senior secured credit facilities, so that the interest payable on that portion of the debt becomes fixed at a certain rate, thereby reducing the impact of future interest rate changes on future interest expense.
In February 2021, in connection with executing the Fifth Amendment, the Company settled the April 2020 interest-rate swap agreement with Bank of America N.A. The Company paid $2 million in cash to Bank of America N.A to settle the interest-rate swap agreement. This fiscal 2021 loss was deferred in shareholders’ equity as a component of accumulated other comprehensive loss, net of tax, and amortized as an adjustment to interest expense, net over the original term of the Company’s U.S dollar-denominated term loans repaid in February 2021 in connection with the Fifth Amendment.
In February 2021, the Company entered into a new interest-rate swap agreement with Bank of America N.A. as a hedge against the economic effect of a portion of the variable interest obligation associated with its Term B-3 Loans, so that the interest payable on that portion of the Term B-3 Loans becomes fixed at a certain rate, thereby reducing the impact of future
interest rate changes on future interest expense. As a result of entering into the interest-rate swap agreement, the floating portion of the applicable rate on $500 million of the Term B-3 Loans is now effectively fixed at 0.9985%.
The new interest-rate swap agreement qualifies for and is designated as a cash-flow hedge. The Company evaluates hedge effectiveness at the inception of the hedge and on an ongoing basis. The cash flows associated with the interest-rate swap are reported in net cash provided by operating activities in the consolidated statements of cash flows.
A summary of the estimated fair value of the interest-rate swap reported in the consolidated balance sheets is stated in the table below:
| | | | | | | | | | | | | | | | | | | | | | | | | | |
| | June 30, 2022 | | June 30, 2021 |
| (in millions) | | Balance Sheet Classification | | Estimated Fair Value | | Balance Sheet Classification | | Estimated Fair Value |
| Interest-rate swap | | Other long-term assets | | $ | 36 | | | Other long-term assets | | $ | 2 | |
10. FAIR VALUE MEASUREMENTS
ASC 820, Fair Value Measurement, defines fair value as the exit price that would be received to sell an asset or paid to transfer a liability. Fair value is a market-based measurement that should be determined using assumptions that market participants would use in pricing an asset or liability. Valuation techniques used to measure fair value should maximize the use of observable inputs and minimize the use of unobservable inputs. To measure fair value, the Company uses the following fair value hierarchy based on three levels of inputs, of which Level 1 and Level 2 are considered observable and Level 3 is considered unobservable:
Level 1 – Quoted prices in active markets for identical assets or liabilities.
Level 2 – Inputs other than Level 1 that are observable for the asset or liability, either directly or indirectly, such as quoted prices for similar assets and liabilities in active markets; quoted prices for identical or similar assets or liabilities in markets that are not active; or other inputs that are observable or can be corroborated by observable market data by correlation or other means.
Level 3 – Unobservable inputs that are supported by little or no market activity and that are significant to the fair value of the assets or liabilities. Value is determined using pricing models, discounted cash flow methodologies, or similar techniques and also includes instruments for which the determination of fair value requires significant judgment or estimation.
Assets and Liabilities Measured at Fair Value on a Recurring Basis
The carrying amounts of cash and cash equivalents, accounts receivable, accounts payable and accrued expenses of the Company approximate fair value based on the short maturities of these instruments.
The Company evaluates its financial assets and liabilities subject to fair value measurements on a recurring basis to determine the appropriate level of classification as of the end of each reporting period. The following table sets forth the Company’s financial assets and liabilities that were measured at fair value on a recurring basis and the fair value measurement for such assets and liabilities at June 30, 2022 and 2021, respectively:
| | | | | | | | | | | | | | | | | | | | | | | | | | |
| (Dollars in millions) | | Basis of Fair Value Measurement |
| June 30, 2022 | | Total | | Level 1 | | Level 2 | | Level 3 |
| Assets: | | | | | | | | |
| Marketable securities | | $ | 89 | | | $ | 89 | | | $ | — | | | $ | — | |
| | | | | | | | |
| Interest-rate swap | | 36 | | | — | | | 36 | | | — | |
| Trading securities | | $ | 2 | | | $ | 2 | | | $ | — | | | $ | — | |
| | | | | | | | |
| | | | | | | | |
| | | | | | | | |
| | | | | | | | |
| June 30, 2021 | | | | | | | | |
| Assets: | | | | | | | | |
| Marketable securities | | $ | 71 | | | $ | 71 | | | $ | — | | | $ | — | |
| Interest-rate swap | | 2 | | | — | | | 2 | | | — | |
| Trading securities | | $ | 1 | | | $ | 1 | | | $ | — | | | $ | — | |
| | | | | | | | |
| Liabilities: | | | | | | | | |
| Series A Preferred Stock derivative liability | | $ | 3 | | | $ | — | | | $ | — | | | $ | 3 | |
| | | | | | | | |
The fair value of the interest-rate swap agreement is determined at the end of each reporting period based on valuation models that use interest-rate yield curves and discount rates as inputs. The discount rates are based on U.S. deposit or U.S. Treasury rates. The significant inputs used in the valuation models are readily available in public markets or can be derived from observable market transactions, and the valuation is therefore classified as Level 2 in the fair-value hierarchy.
The estimated fair value of the derivative associated with the formerly outstanding Series A Preferred Stock was determined using an option pricing methodology, specifically both a Monte Carlo simulation and a binomial lattice model. The methodology incorporated the terms and conditions of the preferred stock arrangement, historical stock price volatility, the risk-free interest rate, a credit spread based on the yield indexes of high-yield bonds, and the trading price of shares of the Common Stock. The calculation of the estimated fair value of the derivative liability was highly sensitive to changes in unobservable inputs, such as the expected volatility and the Company’s credit spread. The estimated fair value of the Series A Preferred Stock derivative liability was classified as Level 3 in the fair-value hierarchy due to the significant management judgment required to make the assumptions underlying the calculation of value.
The following table sets forth a summary of changes in the estimated fair value of the Series A Preferred Stock derivative liability from June 30, 2021 to June 30, 2022:
| | | | | |
(Dollars in millions) | Fair Value Measurement of
Series A Preferred Stock
Derivative Liability
Using Significant
Unobservable Inputs (Level 3) |
| Balance at June 30, 2021 | $ | 3 | |
| Change in estimated fair value of Series A Preferred Stock derivative liability | (2) | |
| Settlement of derivative liability upon Final Conversion | (1) | |
| Balance at June 30, 2022 | $ | — | |
Assets and Liabilities Measured at Fair Value on a Non-Recurring Basis
Long-lived assets, goodwill, and other intangible assets are subject to non-recurring fair value measurement for the evaluation of potential impairment. Other than the fair value estimates disclosed in Note 3, Business Combinations and Divestitures, there was no non-recurring fair value measurement during the fiscal years ended June 30, 2022 and 2021.
11. INCOME TAXES
Earnings before income taxes are as follows for fiscal 2022, 2021, and 2020:
| | | | | | | | | | | | | | | | | |
| Fiscal Year Ended
June 30, |
| (Dollars in millions) | 2022 | | 2021 | | 2020 |
| U.S. operations | $ | 250 | | | $ | 457 | | | $ | 121 | |
| Non-U.S. operations | 355 | | | 258 | | | 139 | |
| Total | $ | 605 | | | $ | 715 | | | $ | 260 | |
The provision for income taxes consists of the following for fiscal 2022, 2021, and 2020:
| | | | | | | | | | | | | | | | | |
| | Fiscal Year Ended
June 30, |
| (Dollars in millions) | 2022 | | 2021 | | 2020 |
| Current: | | | | | |
| Federal | $ | (8) | | | $ | 8 | | | $ | 1 | |
| State and local | 15 | | | 20 | | | 1 | |
| Non-U.S. | 66 | | | 38 | | | 33 | |
| Total current expense | $ | 73 | | | $ | 66 | | | $ | 35 | |
| Deferred: | | | | | |
| Federal | $ | 11 | | | $ | 62 | | | $ | 11 | |
| State and local | (5) | | | 7 | | | 6 | |
| Non-U.S. | 7 | | | (5) | | | (13) | |
| Total deferred expense | $ | 13 | | | $ | 64 | | | $ | 4 | |
| | | | | |
| Total provision | $ | 86 | | | $ | 130 | | | $ | 39 | |
A reconciliation of the provision starting from the tax computed at the federal statutory income tax rate to the tax computed at the Company’s effective income tax rate is as follows for the fiscal years ended 2022, 2021, and 2020:
| | | | | | | | | | | | | | | | | |
| Fiscal Year Ended
June 30, |
| (Dollars in millions) | 2022 | | 2021 | | 2020 |
| Provision at U.S. federal statutory tax rate | $ | 127 | | | $ | 150 | | | $ | 55 | |
| State and local income taxes | 11 | | | 26 | | | 6 | |
| Foreign tax rate differential | (28) | | | (14) | | | (6) | |
| Global intangible low tax income | 6 | | | 3 | | | 3 | |
| Other permanent items | 2 | | | (5) | | | 2 | |
| Unrecognized tax positions | 1 | | | 3 | | | (1) | |
| Tax valuation allowance | 94 | | | (7) | | | (21) | |
| Foreign tax credit | (43) | | | (24) | | | (3) | |
| Withholding tax and other foreign taxes | 1 | | | 1 | | | 1 | |
| Change in tax rate | 1 | | | 2 | | | 4 | |
| | | | | |
| R&D tax credit | (2) | | | (5) | | | (2) | |
| Swiss tax reform | (83) | | | — | | | — | |
| Other | (1) | | | — | | | 1 | |
| Total provision | $ | 86 | | | $ | 130 | | | $ | 39 | |
The income tax provision for the fiscal year ended June 30, 2022 is not comparable to the provision in the prior year due to changes in the geographic mix of pretax income, changes in the tax impact of permanent differences and credits, and the tax
impact of discrete items. The lower effective tax rate for the fiscal year ended June 30, 2022 is primarily due to (i) increased income tax benefit resulting from a relative increase in non-U.S. earnings that are subject to more favorable tax rates than in the U.S., and (ii) an increased U.S. foreign tax credit due to amended prior-year returns. The Company also recognized a net deferred benefit of $21 million related to recently enacted tax reform in Switzerland and related transition rules (collectively, “Swiss Tax Reform”) presented in the table above in two components, a gross $83 million deferred tax benefit partially offset by a $62 million valuation allowance charge. The net deferred benefit of $21 million is the best estimate of the deferred tax benefit arising from Swiss Tax Reform. Swiss Tax Reform benefits were partially offset by certain deemed income inclusions in the U.S.and a deferred income tax charge for establishing valuation allowances against the net deferred tax assets of certain Belgian operations. The income tax provision for the fiscal year ended June 30, 2021 was higher than the income tax provision for the fiscal year ended June 30, 2020 due to the sale of the Blow-Fill-Seal Business and an increase in state taxes, offset by an increase in foreign tax credits due to amended prior year returns, as well as a reduction in the foreign valuation allowance.
The Company intends to repatriate foreign earnings taxed in prior fiscal years as a result of the changes imposed by the 2017 U.S. Tax Cuts and Jobs Act. In addition to these foreign earnings previously taxed, as of June 30, 2022, for purposes of ASC 740-10-25-3, the Company had $241 million of undistributed earnings from non-U.S. subsidiaries that it intends to reinvest permanently in its non-U.S. operations. As these ASC 740-10-25-3 earnings are considered permanently reinvested, no tax provision has been accrued. It is not feasible to estimate the amount of tax that might be payable on the eventual remittance of such earnings.
Deferred income taxes arise from temporary differences between the financial reporting and tax reporting bases of assets and liabilities, and operating loss and tax credit carryforwards for tax purposes. The components of the Company's deferred income tax assets and liabilities are as follows at June 30, 2022 and 2021:
| | | | | | | | | | | |
| Fiscal Year Ended
June 30, |
| (Dollars in millions) | 2022 | | 2021 |
| Deferred income tax assets: | | | |
| Accrued liabilities | $ | 33 | | | $ | 43 | |
| Equity compensation | 14 | | | 15 | |
| Loss and tax credit carryforwards | 225 | | | 187 | |
| Foreign currency | 19 | | | 12 | |
| Pension | 17 | | | 24 | |
| Interest-related | 14 | | | 14 | |
| Deferred revenue | 1 | | | 3 | |
| | | |
Lease liabilities | 39 | | | 35 | |
| Euro-denominated debt | — | | | 23 | |
| Other | 2 | | | — | |
| Total deferred income tax assets | $ | 364 | | | $ | 356 | |
| Valuation allowance | (149) | | | (65) | |
| Net deferred income tax assets | $ | 215 | | | $ | 291 | |
| | | |
| | | |
| Fiscal Year Ended
June 30, |
| (Dollars in millions) | 2022 | | 2021 |
| Deferred income tax liabilities: | | | |
| | | |
| | | |
| Euro-denominated debt | $ | (6) | | | $ | — | |
| Property-related | (227) | | | (171) | |
| Goodwill and other intangibles | (113) | | | (194) | |
| Right-of-use assets | (21) | | | (18) | |
| Other | (1) | | | (6) | |
| | | |
| Total deferred income tax liabilities | $ | (368) | | | $ | (389) | |
| | | |
| Net deferred tax liability | $ | (153) | | | $ | (98) | |
Deferred tax assets and liabilities in the preceding table are in the following captions in the consolidated balance sheets at June 30, 2022 and 2021: | | | | | | | | | | | |
| Fiscal Year Ended
June 30, |
| (Dollars in millions) | 2022 | | 2021 |
| Non-current deferred tax asset | $ | 49 | | | $ | 66 | |
| Non-current deferred tax liability | (202) | | | (164) | |
| Net deferred tax liability | $ | (153) | | | $ | (98) | |
At June 30, 2022, the Company had federal net operating loss (“NOL”) carryforwards of $532 million, $211 million of which are subject to limitations under Section 382 of the Internal Revenue Code of 1986, as amended (the “Internal Revenue Code”). The majority of the $211 million federal NOL carryforwards subject to Section 382 of the Internal Revenue Code are attributed to the Company's acquisitions of Pharmatek Laboratories, Inc., Juniper Pharmaceuticals, Inc., Paragon Bioservices, Inc., and MastherCell Global Inc. (“MaSTherCell”). As of June 30, 2022, $461 million of the Company's federal NOL carryforwards have an indefinite life and the remaining NOL carryforwards will expire in fiscal years 2023 through 2037.
At June 30, 2022, the Company had state tax NOL carryforwards of $431 million. Substantially all state NOL carryforwards have a twenty-year carryforward period. At June 30, 2022, the Company had non-U.S. tax NOL carryforwards of $240 million, a majority of which are available for at least three years or have an indefinite carryforward period.
The Company had valuation allowances of $149 million and $65 million as of June 30, 2022 and 2021, respectively, against its deferred tax assets. The Company considered all available evidence, both positive and negative, in assessing the need for a valuation allowance against tax assets. Four possible sources of taxable income were evaluated when assessing the realizability of deferred tax assets:
•carrybacks of existing NOLs (if and to the extent permitted under the tax law);
•future reversals of existing taxable temporary differences;
•tax planning strategies; and
•future taxable income exclusive of reversing temporary differences and carryforwards.
While the valuation allowance related to certain U.S. combined states was released during the fiscal year ended June 30, 2019, there remained as of June 30, 2022 a valuation allowance for the NOLs and deductible temporary differences in the remaining combined and separate states of $37 million. The state valuation allowance as of June 30, 2022 is due to the Company’s history of tax losses and anticipated loss utilization rates in separate filing status states as well as the difference in the rules related to allocated and apportioned income for separate filing status states versus combined filing status states.
The Company considered the need to maintain a valuation allowance on deferred tax assets based on management’s assessment of whether it is more likely than not that the Company would realize the value of its deferred tax assets based on future reversals of existing taxable temporary differences and the ability to generate sufficient taxable income within the carryforward period available under the applicable tax laws. During the fiscal year ended June 30, 2022, the Company established valuation allowances on NOLs and temporary differences related to certain Belgian operations in the aggregate amount of $26 million. In addition, the Company established valuation allowances on temporary differences related to intangibles in Switzerland in the amount of $62 million.
In the normal course of business, the Company's income taxes are subject to audits by federal, state, and foreign tax authorities, some of which are ongoing and may result in proposed assessments. Germany and the U.K. are among the jurisdictions where the Company has substantial tax positions. The Company is no longer subject to examinations by the relevant tax authorities for years prior to fiscal 2009. The Company’s estimate for the potential outcome for any uncertain tax issue is highly judgmental. The Company assesses its income tax positions and records benefits for all years subject to examination based upon management’s evaluation of the facts, circumstances, and information available at the reporting date. For those tax positions for which it is more likely than not that a tax benefit will be sustained, the Company records the amount that has a greater than 50% likelihood of being realized upon resolution with the taxing authority that has full knowledge of all relevant information based on the technical merit. Interest and penalties are accrued, where applicable.
As of June 30, 2022, the Company had a total of $5 million of unrecognized tax benefits. A reconciliation of unrecognized tax benefits, excluding accrued interest, as of June 30, 2022, 2021, and 2020 is as follows:
| | | | | |
| (Dollars in millions) |
| Balance at June 30, 2019 | $ | 4 | |
| |
| Additions for tax positions of prior years | 1 | |
| |
| |
| Lapse of the applicable statute of limitations | (1) | |
| Balance at June 30, 2020 | $ | 4 | |
| |
| Additions for tax positions of prior years | 3 | |
| |
| |
| Lapse of the applicable statute of limitations | (2) | |
| Balance at June 30, 2021 | $ | 5 | |
| Additions for tax positions related to the current year | 1 | |
| Additions for tax positions of prior years | 1 | |
| |
| Settlements | (1) | |
| Lapse of the applicable statute of limitations | (1) | |
| Balance at June 30, 2022 | $ | 5 | |
All of the unrecognized tax benefits as of June 30, 2022 and 2021 would, if subsequently recognized, favorably affect the effective income tax rate.
The Company recognizes interest and penalties related to uncertain tax positions in income tax expense. As of June 30, 2022, the Company has $1 million of accrued interest related to uncertain tax positions, with a reduction from the prior year, as a result of statute of limitations lapses and settlements. The Company had $1 million of accrued interest related to uncertain tax positions as of both June 30, 2021 and 2020.
12. EMPLOYEE RETIREMENT BENEFIT PLANS
The Company sponsors various retirement plans, including defined benefit pension plans and defined contribution plans. Substantially all of the Company’s domestic non-union employees are eligible to participate in employer-sponsored retirement savings plans, which include plans created under Section 401(k) of the Internal Revenue Code that provide for the Company to match a portion of contributions by participating U.S. employees. The Company’s contributions to the plans are discretionary but are subject to certain minimum requirements as specified in the plans. The Company uses a measurement date of June 30 for all of its retirement and postretirement benefit plans.
The Company records obligations related to its withdrawal from one multi-employer pension plan that covered former employees at three former sites. This withdrawal was classified as a mass withdrawal under the Multiemployer Pension Plan Amendments Act of 1980, as amended, and the Pension Protection Act of 2006 and resulted in the recognition of liabilities associated with the Company’s long-term obligations in prior years not presented, which were primarily recorded as an expense within discontinued operations. The estimated discounted value of the projected contributions related to these plans is $38 million as of June 30, 2022 and 2021. The annual cash impact associated with the Company’s long-term obligation arising from this plan is $2 million per year.
The following table provides a reconciliation of the change in projected benefit obligation and fair value of plan assets for the defined benefit retirement and other retirement plans, excluding the multi-employer pension plan liability:
| | | | | | | | | | | | | | | | | | | | | | | |
| Retirement Benefits | | Other Post-Retirement Benefits |
| June 30, | | June 30, |
| (Dollars in millions) | 2022 | | 2021 | | 2022 | | 2021 |
| Accumulated Benefit Obligation | $ | 262 | | | $ | 364 | | | $ | 2 | | | $ | 2 | |
| | | | | | | |
| Change in Benefit Obligation | | | | | | | |
| Benefit obligation at beginning of year | 372 | | | 358 | | | 2 | | | 3 | |
| Company service cost | 4 | | | 4 | | | — | | | — | |
| Interest cost | 5 | | | 4 | | | — | | | — | |
| | | | | | | |
| | | | | | | |
| | | | | | | |
| Settlements | (1) | | | — | | | — | | | — | |
| | | | | | | |
| | | | | | | |
| | | | | | | |
| Benefits paid | (9) | | | (13) | | | — | | | (1) | |
| | | | | | | |
Actuarial (gain) loss (1) | (71) | | | (9) | | | — | | | — | |
| Exchange rate (loss) gain | (32) | | | 28 | | | — | | | — | |
| Benefit obligation at end of year | $ | 268 | | | $ | 372 | | | $ | 2 | | | $ | 2 | |
| | | | | | | |
| Change in Plan Assets | | | | | | | |
| Fair value of plan assets at beginning of year | 318 | | | 295 | | | — | | | — | |
| Actual return on plan assets | (50) | | | (1) | | | — | | | — | |
| Company contributions | 10 | | | 11 | | | — | | | — | |
| | | | | | | |
| Settlements | (1) | | | — | | | — | | | — | |
| | | | | | | |
| | | | | | | |
| | | | | | | |
| Benefits paid | (9) | | | (13) | | | — | | | — | |
| | | | | | | |
| Exchange rate gain (loss) | (28) | | | 26 | | | — | | | — | |
| Fair value of plan assets at end of year | $ | 240 | | | $ | 318 | | | $ | — | | | $ | — | |
| | | | | | | |
| Funded Status | | | | | | | |
| Funded status at end of year | (28) | | | (54) | | | (2) | | | (2) | |
| | | | | | | |
| Net pension liability | $ | (28) | | | $ | (54) | | | $ | (2) | | | $ | (2) | |
(1) For the fiscal year ended June 30, 2022, the actuarial gain is driven by a large increase in the aggregate discount rate.
The following table provides a reconciliation of the net amount recognized in the consolidated balance sheets:
| | | | | | | | | | | | | | | | | | | | | | | |
| Retirement Benefits | | Other Post-Retirement Benefits |
| June 30, | | June 30, |
| (Dollars in millions) | 2022 | | 2021 | | 2022 | | 2021 |
| Amounts Recognized in Statement of Financial Position | | | | | | | |
| Noncurrent assets | $ | 37 | | | $ | 43 | | | $ | — | | | $ | — | |
| Current liabilities | (1) | | | (1) | | | — | | | — | |
| Noncurrent liabilities | (64) | | | (96) | | | (2) | | | (2) | |
| Total liability | (28) | | | (54) | | | (2) | | | (2) | |
| | | | | | | |
| Amounts Recognized in Accumulated Other Comprehensive Loss | | | | | | | |
| | | | | | | |
| Prior service cost | (1) | | | (1) | | | — | | | — | |
| Net loss (gain) | 49 | | | 62 | | | (1) | | | (1) | |
| Total accumulated other comprehensive loss (income) at the end of the fiscal year | 48 | | | 61 | | | (1) | | | (1) | |
| | | | | | | |
| Additional Information for Plan with ABO or PBO in Excess of Plan Assets | | | | | | | |
| Projected benefit obligation | 132 | | | 130 | | | 2 | | | 2 | |
| Accumulated benefit obligation | 128 | | | 124 | | | 2 | | | 2 | |
| Fair value of plan assets | 67 | | | 32 | | | — | | | — | |
| | | | | | | |
| | | | | | | |
| | | | | | | |
| | | | | | | |
| | | | | | | |
| | | | | | | |
| Components of Net Periodic Benefit Cost | | | | | | | |
| Service cost | 4 | | | 4 | | | — | | | — | |
| Interest cost | 5 | | | 4 | | | — | | | — | |
| Expected return on plan assets | (10) | | | (11) | | | — | | | — | |
| Amortization of unrecognized: | | | | | | | |
| | | | | | | |
| | | | | | | |
| Net loss | 2 | | | 3 | | | — | | | — | |
| | | | | | | |
| | | | | | | |
| Net periodic benefit cost | $ | 1 | | | $ | — | | | $ | — | | | $ | — | |
| | | | | | | | | | | | | | | | | | | | | | | |
| Retirement Benefits | | Other Post-Retirement Benefits |
| June 30, | | June 30, |
| (Dollars in millions) | 2022 | | 2021 | | 2022 | | 2021 |
| Other Changes in Plan Assets and Benefit Obligations Recognized in Other Comprehensive Income | | | | | | | |
| Net gain arising during the year | $ | (14) | | | $ | — | | | $ | — | | | $ | — | |
| | | | | | | |
| | | | | | | |
| | | | | | | |
| | | | | | | |
| Exchange rate loss recognized during the year | 1 | | | — | | | — | | | — | |
| Total recognized in other comprehensive income | $ | (13) | | | $ | — | | | $ | — | | | $ | — | |
| Total Recognized in Net Periodic Benefit Cost and Other Comprehensive Income | | | | | | | |
| Total recognized in net periodic benefit cost and other comprehensive income | $ | (12) | | | $ | — | | | $ | — | | | $ | — | |
| Estimated Amounts to be Amortized from Accumulated Other Comprehensive Income into Net Periodic Benefit Cost | | | | | | | |
| Amortization of: | | | | | | | |
| | | | | | | |
| | | | | | | |
| Net loss | $ | 1 | | | $ | 3 | | | $ | — | | | $ | — | |
| Financial Assumptions Used to Determine Benefit Obligations at the Balance Sheet Date | | | | | | | |
| Discount rate (%) | 3.6 | % | | 1.6 | % | | 4.0 | % | | 2.0 | % |
| Rate of compensation increases (%) | 2.7 | % | | 2.0 | % | | n/a | | n/a |
| Financial Assumptions Used to Determine Net Periodic Benefit Cost for Financial Year | | | | | | | |
| Discount rate (%) | 1.6 | % | | 1.4 | % | | 2.0 | % | | 1.8 | % |
| Rate of compensation increases (%) | 2.0 | % | | 2.0 | % | | n/a | | n/a |
| Expected long-term rate of return (%) | 3.4 | % | | 3.6 | % | | n/a | | n/a |
| Expected Future Contributions | | | | | | | |
| Fiscal year 2023 | $ | 7 | | | $ | 8 | | | $ | — | | | $ | — | |
| | | | | | | | | | | | | | | | | | | | | | | |
| Retirement Benefits | | Other Post-Retirement Benefits |
| June 30, | | June 30, |
| (Dollars in millions) | 2022 | | 2021 | | 2022 | | 2021 |
| Expected Future Benefit Payments | | | | | | | |
| Financial year | | | | | | | |
| 2023 | $ | 14 | | | $ | 13 | | | $ | — | | | $ | — | |
| 2024 | 13 | | | 14 | | | — | | | — | |
| 2025 | 14 | | | 15 | | | — | | | — | |
| 2026 | 16 | | | 15 | | | — | | | — | |
| 2027 | 14 | | | 15 | | | — | | | — | |
| 2028-2032 | $ | 80 | | | $ | 84 | | | $ | 1 | | | $ | 1 | |
| | | | | | | |
| Actual Asset Allocation (%) | | | | | | | |
| Equities | 4.1 | % | | 4.4 | % | | — | % | | — | % |
| Government bonds | 35.6 | % | | 30.6 | % | | — | % | | — | % |
| Corporate bonds | 18.3 | % | | 21.0 | % | | — | % | | — | % |
| Property | 4.9 | % | | 3.5 | % | | — | % | | — | % |
| Insurance contracts | 12.0 | % | | 9.6 | % | | — | % | | — | % |
| Other | 25.1 | % | | 30.9 | % | | — | % | | — | % |
| Total | 100.0 | % | | 100.0 | % | | — | % | | — | % |
| | | | | | | |
| Actual Asset Allocation (Amount) | | | | | | | |
| Equities | $ | 10 | | | $ | 14 | | | $ | — | | | $ | — | |
| Government bonds | 85 | | | 97 | | | — | | | — | |
| Corporate bonds | 44 | | | 67 | | | — | | | — | |
| Property | 12 | | | 11 | | | — | | | — | |
| Insurance contracts | 29 | | | 31 | | | — | | | — | |
| Other | 60 | | | 98 | | | — | | | — | |
| Total | $ | 240 | | | $ | 318 | | | $ | — | | | $ | — | |
| | | | | | | |
| Target Asset Allocation (%) | | | | | | | |
| Equities | 4.1 | % | | 4.5 | % | | — | % | | — | % |
| Government bonds | 35.6 | % | | 30.5 | % | | — | % | | — | % |
| Corporate bonds | 18.3 | % | | 21.1 | % | | — | % | | — | % |
| Property | 4.9 | % | | 3.5 | % | | — | % | | — | % |
| Insurance contracts | 12.0 | % | | 9.6 | % | | — | % | | — | % |
| Other | 25.1 | % | | 30.8 | % | | — | % | | — | % |
| Total | 100.0 | % | | 100.0 | % | | — | % | | — | % |
The Company's Investment Committee employs a building-block approach in determining the long-term rate of return for plan assets, with proper consideration of diversification and rebalancing. Historical markets are studied and long-term historical relationships between equities and fixed income are preserved consistent with the widely accepted capital market principle that assets with higher volatility generate a greater return over the long run. Current market factors such as inflation and interest rates are evaluated before long-term capital market assumptions are determined. Peer data are reviewed to check for reasonability and appropriateness.
Plan assets are recognized and measured at fair value in accordance with the accounting standards regarding fair value measurements. The following are valuation techniques used to determine the fair value of each major category of assets:
•Short-term investments, equity securities, fixed-income securities, and real estate are valued using quoted market prices or other valuation methods, and thus are classified within Level 1 or Level 2.
•Insurance contracts and other types of investments include investments with some observable and unobservable prices that are adjusted by cash contributions and distributions, and thus are classified within Level 2 or Level 3.
The following tables provide a summary of plan assets that are measured at fair value as of June 30, 2022 and 2021, aggregated by the level in the fair value hierarchy within which those measurements fall:
| | | | | | | | | | | | | | | | | | | | | | | | | | | | | |
| As of June 30, 2022 (dollars in millions) | Level 1 | | Level 2 | | Level 3 | | Investments Measured at Net Asset Value | | Total Assets |
|
| Equity securities | $ | — | | | $ | 10 | | | $ | — | | | $ | — | | | $ | 10 | |
| Debt securities | — | | | 129 | | | — | | | — | | | 129 | |
| Real estate | — | | | 10 | | | 2 | | | — | | | 12 | |
Other (1) | — | | | 64 | | | 25 | | | — | | | 89 | |
| Total | $ | — | | | $ | 213 | | | $ | 27 | | | $ | — | | | $ | 240 | |
(1) Other as of June 30, 2022, included $35 million of investments in hedge funds related to the Company's U.K. pension plan, which were classified as Level 2.
| | | | | | | | | | | | | | | | | | | | | | | | | | | | | |
| As of June 30, 2021 (dollars in millions) | Level 1 | | Level 2 | | Level 3 | | Investments Measured at Net Asset Value | | Total Assets |
|
| Equity securities | $ | — | | | $ | 14 | | | $ | — | | | $ | — | | | $ | 14 | |
| Debt securities | — | | | 164 | | | — | | | — | | | 164 | |
| Real estate | — | | | 11 | | | — | | | — | | | 11 | |
Other (1) | — | | | 106 | | | 23 | | | — | | | 129 | |
| Total | $ | — | | | $ | 295 | | | $ | 23 | | | $ | — | | | $ | 318 | |
(1) Other as of June 30, 2021, included $62 million of investments in hedge funds related to the Company's U.K. pension plan, which were classified as Level 2.
Level 3 other assets as of June 30, 2022 and 2021 consist of an insurance contract in the U.K. to fulfill the benefit obligations for a portion of the participant benefits. The value of this commitment is determined using the same assumptions and methods used to value the pension liability of the associated plan. Level 3 other assets for the same periods also include the partial funding of a pension liability relating to current and former employees of the Company’s Eberbach, Germany facility through a Company promissory note with an annual rate of interest of 5%. The value of this commitment fluctuates due to contributions and benefit payments in addition to loan interest.
The following table provides a reconciliation of the beginning and ending balances of Level 3 assets as well as the changes during the period attributable to assets held and those purchases, sales, settlements, contributions, and benefits that were paid:
| | | | | | | | | | | | | | | | | |
| Fair Value Measurement Using Significant Unobservable Inputs Total (Level 3) | | Fair Value Measurement Using Significant Unobservable Inputs Insurance Contracts | | Fair Value Measurement Using Significant Unobservable Inputs Other |
| Total (Level 3) | | |
| (Dollars in millions) | | |
| Beginning Balance at June 30, 2021 | $ | 23 | | | $ | 3 | | | $ | 20 | |
| Actual return on plan assets: | | | | | |
| Relating to assets still held at the reporting date | (2) | | | — | | | (2) | |
| | | | | |
| Purchases, sales, settlements, contributions and benefits paid | (5) | | | (3) | | | (2) | |
| Transfers in or out of Level 3, net | 11 | | | 9 | | | 2 | |
| Ending Balance at June 30, 2022 | $ | 27 | | | $ | 9 | | | $ | 18 | |
The Company's investment policy reflects the long-term nature of the plans’ funding obligations. The assets are invested to provide the opportunity for both income and growth of principal. This objective is pursued as a long-term goal designed to provide required benefits for participants without undue risk. It is expected that this objective can be achieved through a well-diversified asset portfolio. All equity investments are made within the guidelines of quality, marketability, and diversification mandated by the Employee Retirement Income Security Act of 1974, as amended (for plans subject to the act) and other
relevant legal requirements. Investment managers are directed to maintain equity portfolios at a risk level approximately equivalent to that of the specific benchmark established for that portfolio. Assets invested in fixed income securities and pooled fixed-income portfolios are managed actively to pursue opportunities presented by changes in interest rates, credit ratings, or maturity premiums.
| | | | | | | | | | | |
| Other Post-Retirement Benefits |
| Assumed Healthcare Cost Trend Rates at the Balance Sheet Date | 2022 | | 2021 |
| | | |
| | | |
| Healthcare cost trend rate – initial (%) | | | |
| Pre-65 | n/a | | n/a |
| Post-65 | 4.6 | % | | 7.3 | % |
| Healthcare cost trend rate – ultimate (%) | | | |
| Pre-65 | n/a | | n/a |
| Post-65 | 4.1 | % | | 4.4 | % |
| Year in which ultimate rates are reached | | | |
| Pre-65 | n/a | | n/a |
| Post-65 | 2040 | | | 2035 | |
| | | |
| | | |
| | | |
| | | |
| | | |
| | | |
| | | |
| | | |
| | | |
| | | |
| | | |
13. EQUITY, REDEEMABLE PREFERRED STOCK, AND ACCUMULATED OTHER COMPREHENSIVE LOSS
Description of Capital Stock
The Company is authorized to issue 1.00 billion shares of its Common Stock and 100 million shares of preferred stock, par value $0.01 per share. In accordance with the Company’s amended and restated certificate of incorporation, each share of Common Stock has one vote, and the Common Stock votes together as a single class.
Public Offerings of Common Stock
On June 15, 2020, the Company completed a public offering of its Common Stock (the “June 2020 Equity Offering”), in which the Company sold 8 million shares of Common Stock at a price of $70.72 per share, net of underwriting discounts and commissions. The Company obtained total net proceeds from the June 2020 Equity Offering of $548 million after the payment of associated offering expenses. The net proceeds of the June 2020 Equity Offering were used to repay $200 million of prophylactic borrowings from the third quarter of fiscal 2020 under Operating Company's Revolving Credit Facility, with the remainder available for general corporate purposes. On July 10, 2020, the underwriter for the June 2020 Equity Offering exercised its over-allotment option on 1 million additional shares, resulting in net proceeds of $82 million from the June 2020 Equity Offering, which was recorded in the fiscal year ended June 30, 2021.
On February 6, 2020, the Company completed a public offering of its Common Stock (the “February 2020 Equity Offering”), in which the Company sold 8 million shares of Common Stock at a price of $58.58 per share, net of underwriting discounts and commissions. The Company obtained total net proceeds from the February 2020 Equity Offering of $494 million. The net proceeds of the February 2020 Equity Offering were used to repay $100 million of borrowings earlier in the quarter under Operating Company's Revolving Credit Facility and the consideration for the MaSTherCell acquisition due at its closing, with the remainder available for general corporate purposes.
Redeemable Preferred Stock
In May 2019, the Company designated 1 million shares of its preferred stock, par value $0.01, as its “Series A Convertible Preferred Stock” (the “Series A Preferred Stock”), pursuant to a certificate of designation of preferences, rights, and limitations and issued and sold 650,000 shares of the Series A Preferred Stock for an aggregate price of $650 million, to affiliates of Leonard Green & Partners, L.P., each share having an stated value of $1,000.
Proceeds from the offering of the Series A Preferred Stock, net of stock issuance costs, were $646 million, of which $40 million was allocated to the dividend-adjustment feature at its issuance and separately accounted for as a derivative liability. Each change in the fair value of derivative liability during a fiscal quarter was recorded as a non-operating expense in the consolidated statement of operations.
As described in Note 8, Earnings per Share, on the Partial Conversion Date, holders of Series A Preferred Stock converted 265,223 shares (approximately 41% of their holdings) and $2 million of unpaid accrued dividends into shares of Common Stock. The holders received 20.33 shares of Common Stock for each converted preferred share, resulting in the issuance of 5,392,280 shares of Common Stock. The Company recognized no gain or loss upon the Partial Conversion.
As a result of the Partial Conversion, additional paid in capital increased $253 million, which included $4 million related to the fair value of the portion of the derivative liability that was settled upon the Partial Conversion and $2 million related to the unpaid accrued dividend.
On the Final Conversion Date, holders of Series A Preferred Stock converted the remaining 384,777 shares and $2 million of unpaid accrued dividends into shares of Common Stock. These holders received 20.32 shares of Common Stock for each converted share of Series A Preferred Stock, resulting in the issuance of 7,817,554 shares of Common Stock. The Company recognized no gain or loss upon the Final Conversion.
As a result of the Final Conversion, additional paid in capital increased $362 million, which included $1 million related to the fair value of the portion of the derivative liability that was settled upon the Final Conversion and $2 million related to the unpaid accrued dividend. See Note 10, Fair Value Measurements, for detail concerning the change in fair value during the fiscal year ended June 30, 2022.
Following the Final Conversion, no share of the Series A Preferred Stock remained outstanding, and the Company re-assigned all of the authorized shares of Series A Preferred Stock as undesignated shares of preferred stock.
The components of the changes in the cumulative translation adjustment, derivatives and hedges, minimum pension liability, and marketable securities for the fiscal years ended June 30, 2022, 2021, and 2020 consists of:
| | | | | | | | | | | | | | | | | |
| Fiscal Year Ended June 30, |
| (Dollars in millions) | 2022 | | 2021 | | 2020 |
| Foreign currency translation adjustments: | | | | | |
| Net investment hedge | $ | 121 | | | $ | (56) | | | $ | 3 | |
| Long-term inter-company loans | (37) | | | 39 | | | (9) | |
| Translation adjustments | (169) | | | 72 | | | (25) | |
| Total foreign currency translation adjustments, pretax | (85) | | | 55 | | | (31) | |
| Tax expense (benefit) | 25 | | | (12) | | | — | |
| Total foreign currency translation adjustments, net of tax | $ | (110) | | | $ | 67 | | | $ | (31) | |
| | | | | |
| Net change in derivatives and hedges: | | | | | |
| Net gain (loss) recognized during the year, pretax | $ | 36 | | | $ | 4 | | | $ | (4) | |
| | | | | |
| | | | | |
| | | | | |
| Tax expense (benefit) | 9 | | | 1 | | | (1) | |
| Net change in derivatives and hedges, net of tax | $ | 27 | | | $ | 3 | | | $ | (3) | |
| | | | | |
| Net change in minimum pension liability: | | | | | |
| Net gain recognized during the year, pretax | $ | 13 | | | $ | — | | | $ | 4 | |
| | | | | |
| | | | | |
| | | | | |
| | | | | |
| Tax expense | 4 | | | — | | | 2 | |
| Net change in minimum pension liability, net of tax | $ | 9 | | | $ | — | | | $ | 2 | |
| | | | | |
| Net change in marketable securities: | | | | | |
| Net loss recognized during the year, pretax | $ | (3) | | | $ | (1) | | | $ | — | |
| | | | | |
| | | | | |
| | | | | |
| Tax expense (benefit) | — | | | — | | | — | |
| Net change in marketable securities, net of tax | $ | (3) | | | $ | (1) | | | $ | — | |
Accumulated Other Comprehensive Loss
Accumulated other comprehensive loss by component and changes for the fiscal years ended June 30, 2022, 2021, and 2020 consist of:
| | | | | | | | | | | | | | | | | | | | | | | | | | | | | | | | | | | |
| (Dollars in millions) | Foreign Currency Translation Adjustment | | Pension Liability Adjustments | | Derivatives and Hedges | | Marketable Securities | | Other | | Total |
| | | | | | | | | | | |
| | | | | | | | | | | |
| | | | | | | | | | | |
| | | | | | | | | | | |
| | | | | | | | | | | |
| | | | | | | | | | | |
| Balance at June 30, 2019 | $ | (304) | | | $ | (49) | | | $ | — | | | $ | — | | | $ | (1) | | | $ | (354) | |
| Other comprehensive loss before reclassifications | (31) | | | — | | | (3) | | | — | | | — | | | (34) | |
| Amounts reclassified from other comprehensive loss | — | | | 2 | | | — | | | — | | | — | | | 2 | |
| Balance at June 30, 2020 | (335) | | | (47) | | | (3) | | | — | | | (1) | | | (386) | |
| Other comprehensive loss before reclassifications | 67 | | | — | | | 3 | | | (1) | | | — | | | 69 | |
| | | | | | | | | | | |
| Balance at June 30, 2021 | (268) | | | (47) | | | — | | | (1) | | | (1) | | | (317) | |
| Other comprehensive income (loss) before reclassifications | (110) | | | 8 | | | 27 | | | (3) | | | — | | | (78) | |
| Amounts reclassified from other comprehensive loss | — | | | 1 | | | — | | | — | | | — | | | 1 | |
| Balance at June 30, 2022 | $ | (378) | | | $ | (38) | | | $ | 27 | | | $ | (4) | | | $ | (1) | | | $ | (394) | |
14. STOCK-BASED COMPENSATION
The Company’s stock-based compensation is comprised of stock options, restricted stock units, performance-based restricted stock units, and restricted stock.
2014 and 2018 Omnibus Incentive Plans
In 2014, the Company’s board of directors adopted, and the holder of a majority of the shares approved, the 2014 Omnibus Incentive Plan (the “2014 Plan”). The 2014 Plan provided certain members of management, employees, and directors of the Company and its subsidiaries with the opportunity to obtain various incentives, including grants of stock options, restricted stock units (defined below), and restricted stock. In October 2018, the Company’s shareholders approved the 2018 Omnibus Incentive Plan (the “2018 Plan”), and, as a result, new awards may no longer be issued under the 2014 Plan, although it remains in effect as to any previously granted award. The 2018 Plan is substantially similar to the 2014 Plan, except that (a) a total of 15,600,000 shares of Common Stock (subject to adjustment) may be issued under the 2018 Plan, (b) each share of Common Stock issuable under the 2018 Plan pursuant to a restricted stock or restricted stock unit award will reduce the number of reserved shares by 2.25 shares, and (c) the 2018 Plan imposes a limit on the aggregate value of awards that may be made in a single year to a non-employee director. Both the 2014 Plan and the 2018 Plan permit “net settlement” of vested awards, pursuant to which the award holder forfeits a portion of the vested award to satisfy the purchase price (in the case of options), the holder’s withholding tax obligation, if any (in all cases), or both. Where the holder net-settles the tax obligation, the Company pays the amount of the withholding tax to the U.S. government in cash, which is accounted for as an adjustment to Additional Paid in Capital.
Stock Compensation Expense
Stock compensation expense recognized in the consolidated statements of operations was $54 million, $51 million, and $48 million in fiscal 2022, 2021, and 2020, respectively. Stock compensation expense is classified in selling, general, and administrative expenses as well as cost of sales. The Company has elected to account for forfeitures as they occur.
Stock Options
Stock options granted under the 2014 Plan or 2018 Plan, as applicable, during fiscal 2022, 2021, and 2020 represent approximately 183,000, 231,000, and 329,000 shares of Common Stock, respectively. Each stock option granted under the 2014 Plan or 2018 Plan vests in equal annual installments over a four-year period from the date of grant, contingent upon the participant’s continued employment with the Company, except for a small number of grants that vest based on the achievement of operating performance targets set forth in the award documents.
Methodology and Assumptions
All outstanding stock options have an exercise price per share equal to the fair market value of one share of Common Stock on the date of grant. All outstanding stock options have a contractual term of 10 years, subject to forfeiture under certain
conditions upon separation of employment. The grant-date fair value is recognized as expense on a graded-vesting basis over the vesting period. The fair value of stock options is determined using the Black-Scholes-Merton option pricing model for service and performance-based awards, and an adaptation of the Black-Scholes-Merton option valuation model, which takes into consideration the internal rate of return thresholds, for market-based awards. This model adaptation is essentially equivalent to the use of a path dependent-lattice model.
The weighted average of assumptions used in estimating the fair value of stock options granted during each year were as follows:
| | | | | | | | | | | | | | | | | | | | | | | | | | | | | | | | | | | |
| Fiscal Year Ended June 30, |
| 2022 | | 2021 | | 2020 |
| Expected volatility | 37% | | 27% | | 23 | % | - | 24% |
| Expected life (in years) | 3.7 | | 6.25 | | 6.25 |
| Risk-free interest rate | 0.7% | | 0.3% | | 1.7 | % | - | 1.9% |
| Dividend yield | None | | None | | None |
Public trading of the Common Stock commenced only in July 2014, and, as a result, there was only limited relevant historical volatility experience available; therefore, the expected volatility assumptions for fiscal year 2021 and 2020 were based on the historical volatility of the closing share prices of a comparable peer group. The Company selected peer companies from the pharmaceutical industry with similar characteristics, including market capitalization, number of employees and product focus. In addition, since the Company did not have a pattern of exercise behavior of option holders, for fiscal years 2021 and 2020, the Company used the simplified method to determine the expected life of each option, which is the mid-point between the vesting date and the end of the contractual term. Effective in fiscal year 2022, the expected volatility and expected holding period were based on the historical volatility and historical holding period of the Common Stock of the Company. The risk-free interest rate for the expected life of the option is based on the comparable U.S. Treasury yield curve in effect at the time of the grant. The weighted-average grant-date fair value of stock options in fiscal 2022, 2021, and 2020 was $32.07 per share, $24.36 per share, and $15.22 per share, respectively.
The following table summarizes stock option activity and shares subject to outstanding options for the fiscal year ended June 30, 2022:
| | | | | | | | | | | | | | | | | | | | | |
| | Time | | | |
| Weighted Average Exercise Price | Number of Shares | Weighted Average Contractual Term | Aggregate Intrinsic Value | | | | | | | |
| |
| |
| | | | | | | | | | | |
| | | | | | | | | | | |
| | | | | | | | | | | |
| | | | | | | | | | | |
| | | | | | | | | | | |
| Outstanding as of June 30, 2021 | $ | 49.77 | | 1,280,174 | | 4.92 | $ | 74,696,700 | | | | | | | | |
| Granted | 113.00 | | 182,751 | | — | | — | | | | | | | | |
| Exercised | 42.11 | | 386,456 | | — | | 29,329,353 | | | | | | | | |
| Forfeited | 39.43 | | 17,559 | | — | | — | | | | | | | | |
| Expired / Canceled | 36.97 | | 3,399 | | — | | — | | | | | | | | |
| Outstanding as of June 30, 2022 | 63.74 | | 1,055,511 | | 6.91 | 47,013,454 | | | | | | | | |
| Vest and expected to vest as of June 30, 2022 | 63.74 | | 1,055,511 | | 6.91 | 47,013,454 | | | | | | | | |
| Vested and exercisable as of June 30, 2022 | $ | 43.80 | | 437,034 | | 5.76 | $ | 27,748,162 | | | | | | | | |
The intrinsic value of the options exercised in fiscal 2022 was $29 million. The total fair value of options vested during the period was $6 million.
The intrinsic value of the options exercised in fiscal 2021 was $64 million. The total fair value of options vested during the period was $7 million.
As of June 30, 2022, $2 million of unrecognized compensation cost related to granted and not forfeited stock options is expected to be recognized as expense over a weighted-average period of approximately 2.6 years.
Restricted Stock and Restricted Stock Units
The Company may grant to employees and members of its board of directors under the 2018 Plan (and formerly granted under the 2014 Plan) shares of restricted stock and units each representing the right to one share of Common Stock (“restricted
stock units”). Since the IPO, the Company has granted to employees and directors restricted stock units and restricted stock that vest over specified periods as well as restricted stock units and restricted stock that have certain performance-related vesting requirements (“performance stock units” and “performance stock,” respectively). The restricted stock and restricted stock units granted during fiscal 2022 and 2021 had grant date fair values aggregating $57 million and $47 million, respectively, which represent approximately 535,000 and 502,000 shares of Common Stock, respectively. Under the 2014 Plan or 2018 Plan, as appropriate, the performance stock and performance stock units vest upon achieving Company financial performance metrics established at the outset of the three-year performance period associated with each grant. The metrics for the fiscal 2020, 2021, and 2022 performance stock and performance stock unit grants were based on performance against a mix of adjusted EPS targets and relative total shareholder return (“RTSR”) targets. Note that adjusted EPS is calculated as a quotient of tax-effected Adjusted EBITDA by the weighted average number of fully diluted shares, a financial measure that is not defined under U.S. GAAP and is subject to important limitations. The performance stock and performance stock units vest following the end of their respective three-year performance periods upon a determination of achievement relative to the targets. Each quarter during the period in which the performance stock and performance stock units are outstanding, the Company estimates the likelihood of such achievement by the end of the performance period in order to determine the probability of vesting. The number of shares actually earned at the end of the three-year period for the fiscal 2020, 2021 and 2022 grants will vary, based only on actual performance, from 0% to 200%, or from 0% to 150%, of the target number of performance stock or performance stock units specified on the date of grant, in the case of adjusted EPS and RTSR grants, respectively. Time-based restricted stock units and restricted stock generally vest on the second or third anniversary of the date of grant, subject to the participant’s continued employment with the Company.
Methodology and Assumptions - Expense Recognition and Grant Date Fair Value
The fair values of (a) time-based restricted stock units and restricted stock are recognized as expense on a cliff-vesting schedule over the applicable vesting period and (b) performance shares and performance share units are re-assessed quarterly as discussed above.
The grant date fair values of both time-based and performance-based shares and units are determined based on the number of shares subject to the grants and the fair value of the Common Stock on the dates of the grants, as determined by the closing market prices.
Time-Based Restricted Stock Units and Restricted Stock
The following table summarizes activity in unvested time-based restricted stock units and restricted stock for the fiscal year ended June 30, 2022: | | | | | | | | | | | |
| Time-Based Units and Shares | | Weighted Average Grant-Date Fair Value |
| | | |
| | | |
| | | |
| | | |
| Unvested as of June 30, 2021 | 764,356 | | | $ | 65.54 | |
| Granted | 324,091 | | | 117.52 | |
| Vested | 292,945 | | | 52.11 | |
| Cancelled/forfeited/adjusted | 73,064 | | | 96.04 | |
| Unvested as of June 30, 2022 | 722,438 | | | 91.42 | |
Adjusted EPS and RTSR-Based Performance Share Units and Performance Shares
The following table summarizes activity in unvested performance share units and performance shares for the fiscal year ended June 30, 2022: | | | | | | | | | | | |
| Performance-Based Units and Shares | | Weighted Average Grant-Date Fair Value |
| | | |
| | | |
| | | |
| | | |
| Target Number Unvested as of June 30, 2021 | 392,095 | | | $ | 58.16 | |
| Target Number Granted | 103,946 | | | 113.57 | |
| Target Number Vested | 168,325 | | | 43.84 | |
| Target Number Cancelled/forfeited/adjusted | 21,970 | | | 88.57 | |
| Target Number Unvested as of June 30, 2022 | 305,746 | | | $ | 83.75 | |
Valuation of RTSR Performance Shares and Performance Share Units
The fair value of each RTSR performance share unit and performance share is determined using the Monte Carlo pricing model because the number of shares to be awarded is subject to a market condition. The Monte Carlo simulation is a generally accepted statistical technique used to simulate a range of possible future outcomes. Because the valuation model considers a range of possible outcomes, compensation cost is recognized regardless of whether the market condition is actually satisfied.
The assumptions used in estimating the fair value of the RTSR performance share units and performance shares granted during each year were as follows: | | | | | | | | | | | | | | | | | | | | | | | |
| Fiscal Year Ended June 30, |
| 2022 | | 2021 |
| Expected volatility | 39 | % | - | 41% | | 39 | % | - | 42% |
| Expected life (in years) | 2.4 | - | 2.9 | | 2.4 | - | 2.9 |
| Risk-free interest rates | 0.3 | % | - | 1.5% | | 0.1 | % | - | 0.2% |
| Dividend yield | None | | None |
The following table summarizes activity in unvested RTSR performance share units and performance shares for the fiscal year ended June 30, 2022 | | | | | | | | | | | |
| RTSR Units and Shares | | Weighted Average Grant-Date Fair Value |
| | | |
| | | |
| | | |
| | | |
| Target Number Unvested as of June 30, 2021 | 327,028 | | | $ | 68.92 | |
| Target Number Granted | 107,197 | | | 110.34 | |
| Target Number Vested | 132,565 | | | 47.70 | |
| Target Number Cancelled/forfeited/adjusted | 20,345 | | | 95.70 | |
| Target Number Unvested as of June 30, 2022 | 281,315 | | | $ | 91.04 | |
As of June 30, 2022, $57 million of unrecognized compensation cost related to restricted stock and restricted stock units (including performance shares and performance share units, respectively) is expected to be recognized as expense over a weighted-average period of approximately 1.8 years. The weighted-average grant-date fair value of restricted stock and restricted stock units in fiscal 2022, 2021, and 2020 was $109.63 per share, $94.19 per share, and $57.17 per share, respectively. The fair value of restricted stock units vested in fiscal 2022, 2021, and 2020 was $33 million, $39 million, and $35 million, respectively.
15. OTHER EXPENSE, NET
The components of other expense, net for the fiscal years ended June 30, 2022, 2021, and 2020 are as follows:
| | | | | | | | | | | | | | | | | | | | | |
| | | Fiscal Year Ended
June 30, |
| (Dollars in millions) | | | | | 2022 | | 2021 | | 2020 |
| Other (income) expense, net | | | | | | | | | |
Debt refinancing costs (1) | | | | | $ | 4 | | | $ | 18 | | | $ | 16 | |
| | | | | | | | | |
| | | | | | | | | |
| | | | | | | | | |
Foreign currency losses (gains) (2) | | | | | 33 | | | 5 | | | (3) | |
Other (3) | | | | | (9) | | | (20) | | | (5) | |
| Total other expense, net | | | | | $ | 28 | | | $ | 3 | | | $ | 8 | |
(1) Debt refinancing costs for the fiscal year ended June 30, 2022 consists of $4 million of financing charges related to the Company's Incremental Term B-3 Loans.
Debt financing costs for the fiscal year ended June 30, 2021 includes (a) a write-off of $4 million of previously capitalized financing charges related to the Company’s repayment of U.S. dollar-denominated term loans and the 2026 Notes in February 2021, (b) $3 million of financing charges related to issuance of the Company’s initial tranche of Term B-3 Loans, and (c) an $11 million premium on early redemption of the 2026 Notes.
Debt financing costs for the fiscal year ended June 30, 2020 includes (x) a write-off of $6 million of previously capitalized financing charges related to the Company's repaid euro-denominated term loans under its senior secured credit facilities and the Company's redeemed 2024 Notes, and (y) a $10 million premium on early redemption of the 2024 Notes.
(2) Foreign currency losses (gains) include both cash and non-cash transactions.
(3) Other, for the fiscal years ended June 30, 2022, 2021 and 2020 includes, in part, total realized and unrealized gain of $2 million, $17 million, and $3 million, respectively, related to the fair value of the derivative liability associated with the formerly outstanding Series A Preferred Stock.
16. LEASES
The Company leases certain manufacturing and office facilities, land, vehicles, and equipment. The terms of these leases vary widely, although most have terms between 3 and 10 years.
In accordance with ASC 842, Leases, the Company recognizes a “right-of-use” asset and related lease liability at the commencement date of each lease based on the present value of the fixed lease payments over the expected lease term inclusive of any rent escalation provisions or incentives received. The lease term for this purpose will include any renewal period where the Company determines that it is reasonably certain that it will exercise the option to renew. While certain leases also permit the Company to terminate the lease in advance of the nominal term upon payment of an associated penalty, the Company generally does not take into account potential early termination dates in its determination of the lease term as it is reasonably certain not to exercise an early-termination option as of the lease commencement date.
The Company uses its incremental borrowing rate, which represents the interest rate the Company would expect to pay on a collateralized basis to borrow an amount equal to the lease payments under similar terms, in order to calculate the present value of a lease, when the implicit discount rate for its leases is not readily determinable.
For operating leases, fixed lease payments are recognized as operating lease expense on straight-line basis over the lease term. For finance leases, the Company recognizes depreciation expense associated with the leased asset acquired and interest expense related to the financing portion. Variable payments are recognized in the period incurred. As permitted by ASC 842, the Company has elected not to separate those components of a lease agreement not related to the leasing of an asset from those components that are related.
The Company does not record leases with an initial lease term of 12 months or less on its consolidated balance sheets. The Company recognizes lease expense for these short-term leases on a straight-line basis over the lease term.
Supplemental information concerning the leases recorded in the Company's consolidated balance sheet as of June 30, 2022 is detailed in the following table: | | | | | | | | |
| (Dollars in millions) | Line item in the consolidated balance sheet | Balance at
June 30, 2022 |
| Right-of-use assets: | | |
| Finance leases | Property, plant, and equipment, net | $ | 178 | |
| Operating leases | Other long-term assets | 93 | |
| | |
| Current lease liabilities: | | |
| Finance leases | Current portion of long-term obligations and other short-term borrowings | 17 | |
| Operating leases | Other accrued liabilities | 14 | |
| | |
| Non-current lease liabilities: | | |
| Finance leases | Long-term obligations, less current portion | 217 | |
| Operating leases | Other liabilities | $ | 85 | |
The components of the net lease costs for the fiscal year ended June 30, 2022 reflected in the Company's consolidated statement of operations were as follows: | | | | | | | | |
| (Dollars in millions) | | Fiscal Year Ended
June 30, 2022 |
| Financing lease costs: | | |
| Amortization of right-of-use assets | | $ | 17 | |
| Interest on lease liabilities | | 12 | |
| Total | | 29 | |
| | |
| Operating lease costs | | 28 | |
| Variable lease costs | | 8 | |
| Total lease costs | | $ | 65 | |
The short-term lease cost amounted to $8 million during the fiscal year ended June 30, 2022.
The weighted average remaining lease term and weighted average discount rate related to the Company's right-of-use assets and lease liabilities as of June 30, 2022 are as follows:
| | | | | |
| Weighted average remaining lease term (years): | |
| Finance leases | 17.7 |
| Operating leases | 13.7 |
| Weighted average discount rate: | |
| Finance leases | 6.1 | % |
| Operating leases | 4.3 | % |
Supplemental information concerning the cash-flow impact arising from the Company's leases for the fiscal year ended June 30, 2022 recorded in the Company's unaudited consolidated statement of cash flows is detailed in the following table (in
millions): | | | | | | | | | |
| | | Fiscal Year Ended
June 30, 2022 |
| Cash paid for amounts included in lease liabilities: | | | |
| Financing cash flows used for finance leases | | | $ | 15 | |
| Operating cash flows used for finance leases | | | 11 | |
| Operating cash flows used for operating leases | | | 19 | |
| | | |
| Non-cash transactions: | | | |
| Right-of-use assets obtained in exchange for new finance lease liabilities | | | 59 | |
| Right-of-use assets obtained in exchange for new operating lease liabilities | | | $ | 31 | |
As of June 30, 2022, the Company expects that its future minimum lease payments will become due and payable as follows:
| | | | | | | | | | | | | | | | | |
| (Dollars in millions) | Financing Leases | | Operating Leases | | Total |
| 2023 | $ | 29 | | | $ | 17 | | | $ | 46 | |
| 2024 | 28 | | | 14 | | | 42 | |
| 2025 | 25 | | | 11 | | | 36 | |
| 2026 | 22 | | | 11 | | | 33 | |
| 2027 | 22 | | | 11 | | | 33 | |
| Thereafter | 238 | | | 74 | | | 312 | |
| Total minimum lease payments | 364 | | | 138 | | | 502 | |
| Less: interest | 130 | | | 39 | | | 169 | |
| Total lease liabilities | $ | 234 | | | $ | 99 | | | $ | 333 | |
17. COMMITMENTS AND CONTINGENCIES
Contingent Losses
From time to time, the Company may be involved in legal proceedings arising in the ordinary course of business, including, without limitation, inquiries and claims concerning environmental contamination as well as litigation and allegations in connection with acquisitions, product liability, manufacturing or packaging defects, and claims for reimbursement for the cost of lost or damaged active pharmaceutical ingredients, the cost of any of which could be significant. The Company intends to vigorously defend itself against any such litigation and does not currently believe that the outcome of any such litigation will have a material adverse effect on the Company’s financial statements. In addition, the healthcare industry is highly regulated and government agencies continue to scrutinize certain practices affecting government programs and otherwise.
From time to time, the Company receives subpoenas or requests for information relating to the business practices and activities of customers or suppliers from various governmental agencies or private parties, including from state attorneys general, the U.S. Department of Justice, and private parties engaged in patent infringement, antitrust, tort, and other litigation. The Company generally responds to such subpoenas and requests in a timely and thorough manner, which responses sometimes require considerable time and effort and can result in considerable costs being incurred. The Company expects to incur costs in future periods in connection with future requests.
18. SEGMENT AND GEOGRAPHIC INFORMATION
As discussed in Note 1, Basis of Presentation and Summary of Significant Accounting Policies, the Company conducted its business within the following segments in fiscal 2022: Biologics, Softgel and Oral Technologies, Oral and Specialty Delivery, and Clinical Supply Services. The Company evaluates the performance of its segments based on segment earnings before other (income) expense, impairments, restructuring costs, interest expense, income tax expense, and depreciation and amortization (“Segment EBITDA”).
Segment EBITDA is subject to important limitations as it is not defined under U.S. GAAP and is not a measure of operating income, operating performance, or liquidity presented in accordance with U.S. GAAP. These consolidated financial
statements include information concerning Segment EBITDA (a) because Segment EBITDA is an operational measure used by management in the assessment of the operating segments, the allocation of resources to the segments, and the setting of strategic goals and annual goals for the segments, and (b) in order to provide supplemental information that the Company considers relevant for the readers of the consolidated financial statements. The Company’s presentation of Segment EBITDA may not be comparable to similarly titled measures used by other companies.
The following table includes Segment EBITDA for each of the Company's current reporting segments during the fiscal years ended June 30, 2022, 2021, and 2020:
| | | | | | | | | | | | | | | | | |
| (Dollars in millions) | Fiscal Year Ended June 30, |
| 2022 | | 2021 | | 2020 |
| Segment EBITDA reconciled to net earnings: | | | | | |
| Biologics | $ | 798 | | | $ | 608 | | | $ | 237 | |
| Softgel and Oral Technologies | 292 | | | 237 | | | 257 | |
| Oral and Specialty Delivery | 192 | | | 160 | | | 201 | |
| Clinical Supply Services | 110 | | | 108 | | | 91 | |
| Subtotal | $ | 1,392 | | | $ | 1,113 | | | $ | 786 | |
| Reconciling items to net earnings | | | | | |
Unallocated costs (1) | (286) | | | 1 | | | (146) | |
| Depreciation and amortization | (378) | | | (289) | | | (254) | |
| Interest expense, net | (123) | | | (110) | | | (126) | |
| Income tax expense | (86) | | | (130) | | | (39) | |
| | | | | |
| Net earnings | $ | 519 | | | $ | 585 | | | $ | 221 | |
(1) Unallocated costs include restructuring and special items, stock-based compensation, gain (loss) on sale of subsidiary, impairment charges, certain other corporate directed costs, and other costs that are not allocated to the segments as follows:
| | | | | | | | | | | | | | | | | |
| (Dollars in millions) | Fiscal Year Ended June 30, |
| 2022 | | 2021 | | 2020 |
Impairment charges and gain/loss on sale of assets(a) | $ | (31) | | | $ | (9) | | | $ | (5) | |
| Stock-based compensation | (54) | | | (51) | | | (48) | |
Restructuring and other special items (b) | (55) | | | (31) | | | (42) | |
Gain (loss) on sale of subsidiary (c) | 1 | | | 182 | | | (1) | |
| | | | | |
| | | | | |
| | | | | |
Other expense, net (e) | (28) | | | (3) | | | (8) | |
| Non-allocated corporate costs, net | (119) | | | (87) | | | (42) | |
| Total unallocated costs | $ | (286) | | | $ | 1 | | | $ | (146) | |
(a) For the fiscal year ended June 30, 2022, impairment charges are primarily due to fixed asset impairment charges associated with dedicated equipment for a product the Company no longer manufactures in its respiratory and specialty platform and obsolete equipment in its Biologics platform.
(b) Restructuring and other special items for the fiscal year ended June 30, 2022 include (i) transaction and integration costs primarily associated with the Princeton, Bettera Wellness, Delphi, Hepatic, Acorda and RheinCell transactions and (ii) unrealized losses on venture capital investments.
Restructuring and other special items for the fiscal year ended June 30, 2021 include transaction and integration costs associated with the Anagni, Italy facility acquisition and the MaSTherCell, Skeletal, Delphi, and Acorda transactions, in addition to restructuring costs associated with the closure of the Company's Clinical Supply Services facility in Bolton, U.K.
Restructuring and other special items during the fiscal year ended June 30, 2020 include transaction and integration costs associated with the Company’s cell and gene therapy acquisitions and the disposal of a facility in Australia.
(c) Gain on sale of subsidiary for the fiscal years ended June 30, 2022 and 2021 is affiliated with the sale of the Blow-Fill-Seal Business. Loss on sale of subsidiary for the fiscal year ended June 30, 2020 is affiliated with the disposal of a facility in Australia.
(d) Refer to Note 15, Other expense, net, for details of financing charges and foreign currency translation adjustments recorded within other expense, net.
The following table includes total assets for each segment, as well as reconciling items necessary to total the amounts reported in the consolidated balance sheets.
Total Assets | | | | | | | | | | | |
| (Dollars in millions) | June 30, 2022 | | June 30, 2021 |
| Biologics | $ | 5,734 | | | $ | 4,973 | |
| Softgel and Oral Technologies | 2,685 | | | 1,604 | |
| Oral and Specialty Delivery | 1,006 | | | 1,269 | |
| Clinical Supply Services | 700 | | | 483 | |
| Corporate and eliminations | 382 | | | 783 | |
| Total assets | $ | 10,507 | | | $ | 9,112 | |
Capital Expenditures | | | | | | | | | | | | | | | | | |
| Fiscal Year Ended June 30, |
| (Dollars in millions) | 2022 | | 2021 | | 2020 |
| Biologics | $ | 453 | | | $ | 516 | | | $ | 330 | |
| Softgel and Oral Technologies | 109 | | | 61 | | | 54 | |
| Oral and Specialty Delivery | 57 | | | 64 | | | 55 | |
| Clinical Supply Services | 17 | | | 26 | | | 10 | |
| Corporate | 30 | | | 19 | | | 17 | |
| Total capital expenditures | $ | 666 | | | $ | 686 | | | $ | 466 | |
The following table presents long-lived assets(1) by geographic area: | | | | | | | | | | | | | | | | | |
| | | Long-Lived Assets (1) |
| | | | | |
| (Dollars in millions) | | | | | | | June 30, 2022 | | June 30, 2021 |
| United States | | | | | | | $ | 2,267 | | | $ | 1,867 | |
| Europe | | | | | | | 747 | | | 541 | |
| Other | | | | | | | 113 | | | 116 | |
| | | | | | | | | |
| Total | | | | | | | $ | 3,127 | | | $ | 2,524 | |
(1) Long-lived assets include property, plant, and equipment, net of accumulated depreciation.
For further details on segment and geographic information, see Note 2, Revenue Recognition.
19. SUPPLEMENTAL BALANCE SHEET INFORMATION
Supplemental balance sheet information at June 30, 2022 and June 30, 2021 is detailed in the following tables.
Inventories
Work-in-process and inventories include raw materials, labor, and overhead. Total inventories consist of the following: | | | | | | | | | | | |
| (Dollars in millions) | June 30,
2022 | | June 30,
2021 |
| Raw materials and supplies | $ | 651 | | | $ | 469 | |
| Work-in-process | 109 | | | 151 | |
| | | |
| Total inventories, gross | 760 | | | 620 | |
| Inventory cost adjustment | (58) | | | (57) | |
| Total inventories | $ | 702 | | | $ | 563 | |
Prepaid expenses and other
Prepaid expenses and other current assets consist of the following: | | | | | | | | | | | |
| (Dollars in millions) | June 30,
2022 | | June 30,
2021 |
| Prepaid expenses | $ | 61 | | | $ | 46 | |
| Short-term contract assets | 398 | | | 181 | |
| Spare parts supplies | 22 | | | 30 | |
| Prepaid income tax | 26 | | | 22 | |
| Non-U.S. value-added tax | 48 | | | 50 | |
| | | |
| | | |
| | | |
| Other current assets | 70 | | | 47 | |
| Total prepaid expenses and other | $ | 625 | | | $ | 376 | |
Property, plant, and equipment, net
Property, plant, and equipment, net consist of the following: | | | | | | | | | | | |
| (Dollars in millions) | June 30,
2022 | | June 30,
2021 |
| Land, buildings, and improvements | $ | 1,687 | | | $ | 1,571 | |
| Machinery and equipment | 1,891 | | | 1,558 | |
| Furniture and fixtures | 48 | | | 31 | |
| Construction in progress | 848 | | | 543 | |
| Property and equipment, at cost | 4,474 | | | 3,703 | |
| Accumulated depreciation | (1,347) | | | (1,179) | |
| Property, plant, and equipment, net | $ | 3,127 | | | $ | 2,524 | |
Other long-term assets
Other long-term assets consist of the following: | | | | | | | | | | | |
| (Dollars in millions) | June 30,
2022 | | June 30,
2021 |
| Operating lease right-of-use-assets | $ | 93 | | | $ | 84 | |
| Note receivable | 51 | | | 47 | |
| | | |
| Pension assets | 37 | | | 43 | |
| Corporate-owned life insurance policies | 35 | | | 35 | |
| | | |
| Venture capital investments | 33 | | | 38 | |
| Interest rate swap | 36 | | | 2 | |
| Long-term contract assets | 43 | | | — | |
| Other | 21 | | | 19 | |
| Total other long-term assets | $ | 349 | | | $ | 268 | |
Other accrued liabilities
Other accrued liabilities consist of the following: | | | | | | | | | | | |
| (Dollars in millions) | June 30,
2022 | | June 30,
2021 |
| Contract liability | $ | 185 | | | $ | 305 | |
| Accrued employee-related expenses | 198 | | | 184 | |
| Accrued expenses | 140 | | | 170 | |
| Operating lease liabilities | 14 | | | 16 | |
| Restructuring accrual | 1 | | | 4 | |
| | | |
| Accrued interest | 32 | | | 27 | |
| | | |
| | | |
| Accrued income tax | 50 | | | 30 | |
| Total other accrued liabilities | $ | 620 | | | $ | 736 | |
20. SUBSEQUENT EVENTS
Change in Operating and Reporting Structure
Effective July 1, 2022, in connection with the appointment of a new President and Chief Executive Officer, who also serves as the Company's Chief Operating Decision Maker, the Company changed its operating structure and reorganized its executive leadership team. This new organizational structure includes a shift from four operating and reporting segments to two segments ((i) Biologics, and (ii) Pharma and Consumer Health), each of which represented approximately half of the Company's net revenue in fiscal 2022. The Company's revised operating and reporting segments are comprised of the following:
•Biologics - The Biologics segment provides the same services as the segment we reported in fiscal 2022, with some organizational adjustments and the addition of existing analytical development and testing services for large molecules that was previously offered by the Oral and Specialty Delivery segment. The Biologics segment now provides development and manufacturing for biologic proteins; cell, gene, and other nucleic acid therapies; plasmid DNA; iPSCs, and vaccines. It also provides formulation, development, and manufacturing for parenteral dose forms, including vials, prefilled syringes, and cartridges; and, as noted above, analytical development and testing services for large molecules.
•Pharma and Consumer Health - The Pharma and Consumer Health segment encompasses the offerings of three prior segments - Softgel and Oral Technologies, Oral and Specialty Delivery and Clinical Supply Services - and comprises the Company’s market-leading capabilities for complex oral solids, softgel formulations, Zydis® fast-dissolve technologies, and gummy, soft chew, and lozenge dosage forms; formulation, development, and manufacturing platforms for oral, nasal, inhaled, and topical dose forms; and clinical trial development and supply services.
The Chief Operating Decision Maker received information and assessed performance during the fiscal year ended June 30, 2022 based on our historic operating and reporting segments in place for the entirety of fiscal 2022. All future interim and annual reporting periods will disclose the Company's performance using its new operating structure and segments described above, with results from prior reporting periods restated to reflect the conversion.
Metrics Contract Services Purchase Agreement
On August 9, 2022, the Company entered into an agreement to acquire Metrics Contract Services (“Metrics”) from Mayne Pharma Group Limited for $475 million. Metrics is an oral solids development and manufacturing business specializing in handling highly potent compounds at its facility in Greenville, North Carolina. Upon closing, the operations and facility of Metrics will become part of the Company’s newly configured Pharma and Consumer Health segment described elsewhere in this Note 20, Subsequent Events. The agreement is subject to customary closing conditions and is expected to close before December 31, 2022.
ITEM 9. CHANGES IN AND DISAGREEMENTS WITH ACCOUNTANTS ON ACCOUNTING AND FINANCIAL DISCLOSURE
None.
ITEM 9A. CONTROLS AND PROCEDURES
Disclosure Controls and Procedures
We maintain disclosure controls and procedures that are designed to ensure that information required to be disclosed in our reports under the Exchange Act is recorded, processed, summarized and reported within the time periods specified in the SEC’s rules and forms, and that such information is accumulated and communicated to our management, including our Chief Executive Officer, and our Senior Vice President and Chief Financial Officer, as appropriate, to allow timely decisions regarding required disclosures. Any controls and procedures, no matter how well designed and operated, can provide only reasonable assurance of achieving the desired control objectives. Our management, with the participation of our Chief Executive Officer, and our Senior Vice President and Chief Financial Officer, has evaluated the effectiveness of the design and operation of our disclosure controls and procedures as of the end of the period covered by this Annual Report. Based upon that evaluation, our Chief Executive Officer and our Senior Vice President and Chief Financial Officer concluded that, as of June 30, 2022, our disclosure controls and procedures were effective to accomplish their objectives at the reasonable assurance level.
Management’s Annual Report on Internal Control Over Financial Reporting
Our management is responsible for establishing and maintaining adequate internal control over our financial reporting. Our internal control over financial reporting is designed to provide reasonable assurances regarding the reliability of financial reporting and the preparation of our consolidated financial statements in accordance with U.S. GAAP.
Our internal control over financial reporting includes those policies and procedures that:
•pertain to the maintenance of records that, in reasonable detail, accurately and fairly reflect the transactions and dispositions of our assets;
•provide reasonable assurance that transactions are recorded as necessary to permit preparation of financial statements in accordance with U.S. GAAP, and that receipts and expenditures are being made only in accordance with authorizations of our management and directors; and
•provide reasonable assurance regarding prevention or timely detection of unauthorized acquisition, use or disposition of our assets that could have a material effect on the financial statements.
Because of its inherent limitations, internal control over financial reporting may not prevent or detect misstatements. Also, projections of any evaluation of effectiveness to future periods are subject to the risk that controls may become inadequate because either conditions change or the degree of compliance with our policies and procedures may deteriorate.
Our management has assessed the effectiveness of our internal control over financial reporting as of June 30, 2022. In making this assessment, management used the framework set forth by the Committee of Sponsoring Organizations of the Treadway Commission (COSO) in Internal Control-Integrated Framework (2013). Based on this assessment, our management concluded that our internal control over financial reporting was effective as of June 30, 2022.
The effectiveness of our internal control over financial reporting as of June 30, 2022 has been audited by Ernst & Young LLP, an independent registered public accounting firm, as stated in its report, which is included in Item 8. Financial Statements and Supplementary Data in this Annual Report.
Changes in Internal Control over Financial Reporting
There was no change in our internal control over financial reporting (as such term is defined in Rules 13a-15(f) and 15d-15(f) under the Exchange Act) that occurred during our most recent fiscal quarter that has materially affected, or is reasonably likely to materially affect, our internal control over financial reporting.
ITEM 9B. OTHER INFORMATION
None.
ITEM 9C. DISCLOSURE REGARDING FOREIGN JURISDICTIONS THAT PREVENT INSPECTIONS
Not applicable.
PART III
ITEM 10. DIRECTORS, EXECUTIVE OFFICERS AND CORPORATE GOVERNANCE
Information concerning our Directors and Executive Officers, “Section 16(a) Beneficial Ownership Reporting Compliance,” definitive shareholder communications with our board of directors, and corporate governance may be found in our Proxy Statement, which will be filed within 120 days after June 30, 2022, the close of our fiscal year covered by this Annual Report. Such information is incorporated by reference.
ITEM 11. EXECUTIVE COMPENSATION
Information concerning executive compensation may be found in the Proxy Statement, which will be filed within 120 days after June 30, 2022, the close of our fiscal year covered by this Annual Report. Such information is incorporated herein by reference.
ITEM 12. SECURITY OWNERSHIP OF CERTAIN BENEFICIAL OWNERS AND MANAGEMENT AND RELATED STOCKHOLDER MATTERS
Information regarding security ownership of certain beneficial owners and management may be found in the Proxy Statement, which will be filed within 120 days after June 30, 2022, the close of our fiscal year covered by this Annual Report. Such information is incorporated herein by reference.
ITEM 13. CERTAIN RELATIONSHIPS AND RELATED TRANSACTIONS, AND DIRECTOR INDEPENDENCE
Information regarding certain relationships and related-party transactions and director independence may be found in the Proxy Statement, which will be filed within 120 days after June 30, 2022, the close of our fiscal year covered by this Annual Report. Such information is incorporated herein by reference.
ITEM 14. PRINCIPAL ACCOUNTANT FEES AND SERVICES
Information regarding the fees paid to and services performed by the independent accountants who conducted the audit of our Consolidated Financial Statements, as well as certain related information concerning the audit and of the Audit Committee of our Board of Directors, may be found in the Proxy Statement, which will be filed within 120 days after June 30, 2022, the close of our fiscal year covered by this Annual Report. Such information is incorporated herein by reference.
PART IV
ITEM 15. EXHIBIT AND FINANCIAL STATEMENT SCHEDULES
(a)(1) Financial Statements. The Financial Statements listed in the Index to Financial Statements are filed under Item 8. Financial Statements and Supplementary Data of this Annual Report.
(a)(2) Financial Statements Schedule. The valuation allowance for credit losses is not material to the Company's consolidated balance sheets.
Deferred Tax Assets - Valuation Allowance | | | | | | | | | | | | | | | | | | | | | | | |
| (Dollars in millions) | Beginning Balance | | Current Period (Charge) Benefit | | Deductions and Other | | Ending Balance |
| Fiscal year ended June 30, 2020 | | | | | | | |
| Tax valuation allowance | $ | (76) | | | $ | 21 | | | $ | 2 | | | $ | (53) | |
| | | | | | | |
| Fiscal year ended June 30, 2021 | | | | | | | |
| Tax valuation allowance | $ | (53) | | | $ | 6 | | | $ | (18) | | | $ | (65) | |
| | | | | | | |
| Fiscal year ended June 30, 2022 | | | | | | | |
| Tax valuation allowance | $ | (65) | | | $ | (94) | | | $ | 10 | | | $ | (149) | |
(b) Exhibits.
The agreements and other documents filed as exhibits to this report are not intended to provide factual information or other disclosure other than with respect to the terms of the agreements or other documents themselves and you should not rely on them for that purpose. In particular, any representation or warranty made by us in these agreements or other documents were made solely within the specific context of the relevant agreement or document and may not describe the actual state of affairs as of the date they were made or at any other time.
| | | | | | | | | | |
| Exhibit No. | Description | | |
| | Membership Interest Purchase Agreement, dated August 29, 2021, by and among Catalent Pharma Solutions, Inc., Bettera Holdings, LLC, the members of Bettera Holdings, LLC, and Highlander Partners Candy, LLC (incorporated by reference to Exhibit 2.1 to the Company’s Current Report on Form 8-K filed on August 30, 2021). | | |
| | | | |
| | Fourth Amended and Restated Certificate of Incorporation of Catalent, Inc., as filed with the Secretary of State of the State of Delaware on October 28, 2021 (incorporated by reference to Exhibit 3.1 to the Company’s Current Report on Form 8-K filed on November 2, 2021). | | |
| | | |
| | Bylaws of Catalent, Inc., effective January 27, 2022 (incorporated by reference to Exhibit 3.2 to the Company’s Current Report on Form 8-K filed on February 1, 2022). | | |
| | | | |
| | Indenture, dated June 27, 2019, by and among Catalent Pharma Solutions, Inc., the subsidiary guarantors named therein, and Deutsche Bank Trust Company Americas, as trustee (incorporated by reference to Exhibit 4.1 to the Company's Current Report on Form 8-K filed on June 27, 2019). | | |
| | | | |
| | Form of 5.00% Senior Notes due 2027 (included as part of Exhibit 4.1 above). | | |
| | | | |
| | Indenture, dated March 2, 2020, by and among Catalent Pharma Solutions, Inc., the subsidiary guarantors named therein, Deutsche Trustee Company Limited, as trustee, Deutsche Bank AG, London Branch, as principal paying agent, and Deutsche Bank Luxembourg S.A., as transfer agent and registrar (incorporated by reference to Exhibit 4.1 to the Company’s Current Report on Form 8-K filed on March 3, 2020). | | |
| | | | |
| | Form of 2.375% Senior Notes due 2028 (included as part of Exhibit 4.2 above). | | |
| | | | |
| | Indenture, dated February 22, 2021, by and among Catalent Pharma Solutions, Inc., the subsidiary guarantors named therein, and Deutsche Bank Trust Company Americas, as trustee (incorporated by reference to Exhibit 4.1 to the Company’s Current Report on Form 8-K filed on February 21, 2021). | | |
| | | | |
| | Form of 3.125% Senior Notes due 2029 (included as part of Exhibit 4.3 above). | | |
| | | | |
| | | | | | | | | | |
| | Indenture, dated September 29, 2021, by and among Catalent Pharma Solutions, Inc., the subsidiary guarantors named therein, and Deutsche Bank Trust Company Americas, as trustee (incorporated by reference to exhibit 4.1 to the Company’s Current Report on Form 8-K filed on September 29, 2021). | | |
| | | | |
| | Form of 3.500% Senior Notes due 2030 (included as part of Exhibit 4.4 above). | | |
| | | | |
| | Description of the Company’s Common Stock, par value $0.01 (incorporated by reference to Exhibit 4.7 to the Company’s Annual Report on Form 10-K filed on August 27, 2019). | | |
| | | | |
| | Catalent, Inc. 2014 Omnibus Incentive Plan (incorporated by reference to Exhibit 10.3 to the Company’s Current Report on Form 8-K filed on August 5, 2014). † | | |
| | | | |
| | Catalent, Inc. 2018 Omnibus Incentive Plan (incorporated by reference to Exhibit 10.2 to the Company’s Quarterly Report on Form 10-Q filed on November 11, 2021). † | | |
| | | | |
|
| Catalent Pharma Solutions, Inc. Deferred Compensation Plan as amended and restated effective January 1, 2016 (incorporated by reference to Exhibit 10.1 to the Company’s Quarterly Report on Form 10-Q filed on November 6, 2017). † | | |
| | | | |
| | Amendment to the Catalent Pharma Solutions, Inc. Deferred Compensation Plan effective January 1, 2017 (incorporated by reference to Exhibit 10.41 to the Company’s Annual Report on Form 10-K filed on August 28, 2017). † | | |
| | | | |
| | Amendment No. 2 to the Catalent Pharma Solutions, Inc. Deferred Compensation Plan effective October 16, 2017 (incorporated by reference to Exhibit 10.2 to the Company’s Quarterly Report on Form 10-Q filed on November 6, 2017). † | | |
| | | | |
| | Form of Restricted Stock Unit Agreement for U.S. Non-Employee Directors (incorporated by reference to Exhibit 10.5.4 to the Company’s Annual Report on Form 10-K filed on August 31, 2020). † | | |
| | | |
| | Form of 2018 Omnibus Incentive Plan Restricted Stock Unit Agreement for U.S. Employees (incorporated by reference to exhibit 10.40 to the Company's Quarterly Report on Form 10-Q filed on May 7, 2019). † | | |
| | | | |
| | Form of 2018 Omnibus Incentive Plan Restricted Stock Unit Agreement for non-U.S. Employees (incorporated by reference to exhibit 10.41 to the Company's Quarterly Report on Form 10-Q filed on May 7, 2019). † | | |
| | | | |
| | Form of 2018 Omnibus Incentive Plan Option Agreement for U.S. Employees (incorporated by reference to exhibit 10.44 to the Company's Quarterly Report on Form 10-Q filed on May 7, 2019). † | | |
| | | | |
| | Form of 2018 Omnibus Incentive Plan Option Agreement for non-U.S. Employees (incorporated by reference to exhibit 10.45 to the Company's Quarterly Report on Form 10-Q filed on May 7, 2019). † | | |
| | | | |
| | Form of the Performance Share Unit Agreement for U.S. Employees (incorporated by reference to Exhibit 10.1 to the Company’s Quarterly Report on Form 10-Q filed on November 5, 2019). † | | |
| | | | |
| | Form of the Performance Share Unit Agreement for Non-U.S. Employees (incorporated by reference to Exhibit 10.2 to the Company’s Quarterly Report on Form 10-Q filed on November 5, 2019). † | | |
| | | | |
| | Summary of Management Incentive Plan for the fiscal year ended June 30, 2021 (incorporated by reference to exhibit 10.1 to the Company's Quarterly Report on Form 10-Q filed on November 3, 2020). † | | |
| | | | |
| | Amended and Restated Credit Agreement, dated as of May 20, 2014, relating to the Credit Agreement, dated as of April 10, 2007, as amended, among Catalent Pharma Solutions, Inc., PTS Intermediate Holdings LLC, Morgan Stanley Senior Funding, Inc., as the administrative agent, collateral agent and swing line lender and other lenders as parties thereto (incorporated by reference to Exhibit 10.1 to Catalent Pharma Solutions, Inc.’s Current Report on Form 8-K filed on May 27, 2014). | | |
| | | | |
| | Amendment No. 1, dated December 1, 2014 to Amended and Restated Credit Agreement, dated as of May 20, 2014 among Catalent Pharma Solutions, Inc., PTS Intermediate Holdings LLC, Morgan Stanley Senior Funding, Inc., as the administrative agent, collateral agent and swing line lender and other lenders as parties thereto (incorporated by reference to Exhibit 10.1 to the Company’s Current Report on Form 8-K filed on December 2, 2014). | | |
| | | | |
| | Amendment No. 2 to Amended and Restated Credit Agreement, dated as of December 9, 2016, by and among Catalent Pharma Solutions, Inc., PTS Intermediate Holdings LLC, Morgan Stanley Senior Funding, Inc. as administrative agent, collateral agent and swing line lender and the lenders party thereto, which amends that certain Amended and Restated Credit Agreement, dated as of May 20, 2014 (as amended), by and among Catalent Pharma Solutions, Inc. PTS Intermediate Holdings LLC, Morgan Stanley Senior Funding, Inc. and JP Morgan Chase Bank, N.A. as L/C Issuers, the other lenders party thereto and the other agents party thereto (incorporated by reference to Exhibit 10.1 to the Company's Current Report on Form 8-K filed on December 12, 2016). | | |
| | | | |
| | | | | | | | | | |
| | Amendment No. 3 to Amended and Restated Credit Agreement, dated as of October 18, 2017, by and among Catalent Pharma Solutions, Inc., PTS Intermediate Holdings LLC, Morgan Stanley Senior Funding, Inc., as administrative agent, collateral agent and swing line lender and the lenders party thereto, which amends that certain Amended and Restated Credit Agreement, dated as of May 20, 2014 (as amended), by and among Catalent Pharma Solutions, Inc., PTS Intermediate Holdings LLC, Morgan Stanley Senior Funding, Inc. and JPMorgan Chase Bank, N.A., as L/C Issuers, the other lenders party thereto and the other agents party thereto (incorporated by reference to Exhibit 10.1 to the Company’s Current Report on Form 8-K filed on October 18, 2017). | | |
| | | | |
| | Amendment No. 4 to Amended and Restated Credit Agreement, dated as of May 17, 2019, by and among Catalent Pharma Solutions, Inc., PTS Intermediate Holdings LLC, Morgan Stanley Senior Funding, Inc., as administrative agent, collateral agent and swing line lender and the lenders party thereto, which amends that certain Amended and Restated Credit Agreement, dated as of May 20, 2014 (as amended), by and among Catalent Pharma Solutions, Inc., PTS Intermediate Holdings LLC, Morgan Stanley Senior Funding, Inc. and JPMorgan Chase Bank, N.A., as L/C Issuers, the other lenders party thereto and the other agents party thereto (incorporated by reference to Exhibit 10.4 to the Company’s Current Report on Form 8-K filed on May 22, 2019). | | |
| | | | |
| | Amendment No. 5 to Amended and Restated Credit Agreement, dated as of February 22, 2021, by and among Catalent Pharma Solutions, Inc., PTS Intermediate Holdings LLC, JP Morgan Chase Bank, N.A., as the administrative agent, collateral agent, swing line lender, and letter of credit issuer, and the lenders and other parties thereto, which amends that certain Amended and Restated Credit Agreement, dated as of May 20, 2014 (as amended), by and among Catalent Pharma Solutions, Inc., PTS Intermediate Holdings LLC, JP Morgan Chase Bank, N.A., as the successor administrative agent, collateral agent, swing line lender, and letter of credit issuer, and the lenders and other parties thereto (incorporated by reference to Exhibit 10.1 to the Company’s Current Report on Form 8-K filed on February 22, 2021). | | |
| | | | |
| | Amendment No. 6 to Amended and Restated Credit Agreement, dated as of September 29, 2021, by and among Catalent Pharma Solutions, Inc., PTS Intermediate Holdings LLC, JP Morgan Chase Bank, N.A., as the administrative agent, collateral agent, swing line lender, and letter of credit issuer, and the lenders and other parties thereto, which amends that certain Amended and Restated Credit Agreement, dated as of May 20, 2014 (as amended), by and among Catalent Pharma Solutions, Inc., PTS Intermediate Holdings LLC, JP Morgan Chase Bank, N.A., as the successor administrative agent, collateral agent, swing line lender, and letter of credit issuer, and the lenders and other parties thereto (incorporated by reference to Exhibit 10.1 to the Company’s Current Report on Form 8-K filed on September 29, 2021). | | |
| | | | |
| | Intellectual Property Security Agreement, dated as of April 10, 2007, among PTS Acquisition Corp., Cardinal Health 409, Inc., PTS Intermediate Holdings LLC, Certain Subsidiaries of Holdings Identified Therein and Morgan Stanley Senior Funding, Inc. (incorporated by reference to Exhibit 10.21 to Catalent Pharma Solutions, Inc.’s Registration Statement on Form S-4 filed on December 6, 2007). | | |
| | | | |
| | Intellectual Property Security Agreement Supplement, dated as of July 1, 2008, to the Intellectual Property Security Agreement, dated as of April 10, 2007, among PTS Acquisition Corp., Cardinal Health 409, Inc., PTS Intermediate Holdings LLC, Certain Subsidiaries of Holdings Identified Therein and Morgan Stanley Senior Funding, Inc. (incorporated by reference to Exhibit 10.28 to Catalent Pharma Solutions, Inc.’s Annual Report on Form 10-K filed on September 29, 2008). | | |
| | | | |
| | Stockholders’ Agreement, dated as of May 17, 2019, by and among Catalent, Inc., Green Equity Investors VII, L.P., Green Equity Investors Side VII, L.P., LGP Associates VII-A LLC and LGP Associates VII-B LLC (incorporated by reference to exhibit 10.1 to the Company's Current Report on Form 8-K filed on May 22, 2019). | | |
| | | | |
| | Registration Rights Agreement, dated as of May 17, 2019, by and among Catalent, Inc., Green Equity Investors VII, L.P., Green Equity Investors Side VII, L.P., LGP Associates VII-A LLC and LGP Associates VII-B LLC (incorporated by reference to exhibit 10.2 to the Company's Current Report on Form 8-K filed on May 22, 2019). | | |
| | | | |
| | Form of Severance Agreement between named executive officers and Catalent Pharma Solutions, Inc. (incorporated by reference to Exhibit 10.3 to Catalent Pharma Solutions, Inc.’s Annual Report on Form 10-K filed on September 17, 2010). † | | |
| | | | |
| | Employment Agreement, dated October 22, 2014 by and among Catalent, Inc. and John R. Chiminski (incorporated by reference to Exhibit 10.1 to the Company’s Current Report on Form 8-K filed on October 24, 2014). † | | |
| | | | |
| | Amendment to Employment Agreement, dated August 23, 2017, by and between Catalent, Inc. and John R. Chiminski (incorporated by reference to Exhibit 10.1 to the Company’s Current Report on Form 8-K filed on August 28, 2017). † | | |
| | | | |
| | Second Amendment to Employment Agreement, dated August 11, 2020, by and between Catalent, Inc. and John R. Chiminski (incorporated by reference to Exhibit 10.12.2 to the Company’s Annual Report on Form 10-K filed on August 31, 2020). † | | |
| | | | |
| | | | | | | | | | |
| | Amended and Restated Employment Agreement, dated January 4, 2022, by and between Catalent, Inc. and John R. Chiminski (incorporated by reference to Exhibit 10.2 to the Company’s Current Report on Form 8-K filed on January 5, 2022). † | | |
| | | | |
| | Offer letter, dated March 13, 2018, between Steven Fasman and Catalent Pharma Solutions Inc. (incorporated by reference to Exhibit 10.52 to the Company’s Annual Report on Form 10-K filed on August 27, 2019) † | | |
| | | | |
| | Offer letter, dated July 7, 2022, between Steven Fasman and Catalent, Inc. † * | | |
| | | | |
| | Offer letter, dated March 15, 2018, between Aristippos Gennadios and Catalent Pharma Solutions LLC † * | | |
| | | | |
| | Offer letter, dated July 7, 2022, between Aristippos Gennadios and Catalent, Inc. † * | | |
| | | | |
| | Terms and Conditions of Employment Statement, dated February 1, 2018, between Alessandro Maselli and Catalent Pharma Solutions (incorporated by reference to Exhibit 10.41 to the Company's Annual Report on Form 10-K filed on August 27, 2019). † | | |
| | | | |
| | Offer letter, dated January 31, 2019, between Alessandro Maselli and Catalent Pharma Solutions (incorporated by reference to Exhibit 10.40 to the Company's Annual Report on Form 10-K filed on August 27, 2019). † | | |
| | | | |
| | Employment Agreement, dated January 4, 2022, by and between Catalent, Inc. and Alessandro Maselli (incorporated by reference to Exhibit 10.1 to the Company’s Current Report on Form 8-K filed on January 5, 2022). | | |
| | | | |
| | Offer letter, dated May 10, 2021, between Thomas Castellano and Catalent Pharma Solutions, Inc. (incorporated by reference to Exhibit 10.1 to the Company's Current Report on Form 8-K filed on May 11, 2021). † | | |
| | | | |
| | Subsidiaries of the Registrant. * | | |
| | | | |
| | Consent of Ernst & Young LLP. * | | |
| | | | |
| | Certification of the Chief Executive Officer pursuant to Rule 13a-14(a) or Rule 15d-14(a) of the Securities Exchange Act of 1934, as amended. * | | |
| | | | |
| | Certification of the Chief Financial Officer pursuant to Rule 13a-14(a) or Rule 15d-14(a) of the Securities Exchange Act of 1934, as amended. * | | |
| | | | |
| | Certification of the Chief Executive Officer pursuant to 18 U.S.C. Section 1350, as adopted pursuant to Section 906 of the Sarbanes-Oxley Act of 2002. ** | | |
| | | | |
| | Certification of the Chief Financial Officer pursuant to 18 U.S.C. Section 1350, as adopted pursuant to Section 906 of the Sarbanes-Oxley Act of 2002. ** | | |
| | | | |
| 101.1 | | The following materials are formatted in inline XBRL (inline eXtensible Business Reporting Language): (i) the Consolidated Statements of Operations, (ii) the Consolidated Statements of Comprehensive Income, (iii) the Consolidated Balance Sheets, (iv) the Consolidated Statement of Changes in Shareholders’ Equity, (v) the Consolidated Statements of Cash Flows and (vi) Notes to Consolidated Financial Statements. * | | |
| | | | |
| 104 | | The cover page of this Annual Report on Form 10-K, formatted as Inline XBRL and contained in Exhibit 101.1. | | |
* Filed herewith
** Furnished herewith
† Represents a management contract, compensatory plan or arrangement in which directors and/or executive officers are eligible to participate.
ITEM 16. FORM 10-K SUMMARY
Registrants may voluntarily include a summary of information required by Form 10-K under this Item 16. We elect not to include such summary information.
SIGNATURES
Pursuant to the requirements of Section 13 or 15(d) of the Securities Exchange Act of 1934, the registrant has duly caused this report to be signed on its behalf by the undersigned, thereunto duly authorized.
| | | | | | | | | | | | | | |
| | CATALENT, INC. |
| | | |
| Date: | August 29, 2022 | By: | | /s/ THOMAS CASTELLANO |
| | | | Thomas Castellano |
| | | | Senior Vice President and Chief Financial Officer (Principal Accounting Officer) |
Pursuant to the requirements of the Securities Exchange Act of 1934, this report has been signed below by the following persons on behalf of the registrant and in the capacities and on the dates indicated.
| | | | | | | | | | | |
| Signature | | Title | Date |
| | | |
| /s/ ALESSANDRO MASELLI | | President and Chief Executive Officer (Principal Executive Officer) and Director | 8/29/2022 |
| Alessandro Maselli | | |
| | | |
| /s/ JOHN R. CHIMINSKI | | Executive Chair and Director | 8/29/2022 |
| John R. Chiminski | | | |
| | | |
| /s/ MADHAVAN BALACHANDRAN | | Director | 8/29/2022 |
| Madhavan Balachandran | | | |
| | | |
| /s/ MICHAEL J. BARBER | | Director | 8/29/2022 |
| Michael J. Barber | | | |
| | | |
| /s/ J. MARTIN CARROLL | | Director | 8/29/2022 |
| J. Martin Carroll | | | |
| | | |
| /s/ ROLF CLASSON | | Director | 8/29/2022 |
| Rolf Classon | | | |
| | | |
| /s/ ROSEMARY A. CRANE | | Director | 8/29/2022 |
| Rosemary A. Crane | | | |
| | | |
| /s/ JOHN J. GREISCH | | Director | 8/29/2022 |
| John J. Greisch | | | |
| | | |
| /s/ CHRISTA KREUZBURG | | Director | 8/29/2022 |
| Christa Kreuzburg | | | |
| | | |
| /s/ GREGORY T. LUCIER | | Director | 8/29/2022 |
| Gregory T. Lucier | | | |
| | | |
| /s/ DONALD E. MOREL, JR. | | Director | 8/29/2022 |
| Donald E. Morel, Jr. | | | |
| | | |
| /s/ JACK STAHL | | Director | 8/29/2022 |
| Jack Stahl | | | |
| | | |
| /s/ PETER ZIPPELIUS | | Director | 8/29/2022 |
| Peter Zippelius | | | |
| | | |
| /s/ THOMAS CASTELLANO | | Senior Vice President & Chief Financial Officer | 8/29/2022 |
Thomas Castellano | | (Principal Financial Officer) | |