2021-01-01truetruetrue2022-01-01--12-31trueFY0001590955false112024-12-312030-12-31http://fasb.org/us-gaap/2023#OtherAssetsNoncurrenthttp://fasb.org/us-gaap/2023#OtherAssetsNoncurrentthree yearsfour years2032-12-310001590955us-gaap:RestrictedStockUnitsRSUMembersrt:MinimumMember2022-01-012022-12-310001590955payc:RecurringMember2023-01-012023-12-310001590955srt:ScenarioForecastMemberpayc:TimeBasedRestrictedStockUnitsMemberpayc:TwoThousandAndTwentyThreeLongTermIncentivePlanMember2025-02-052025-02-050001590955payc:CostsToObtainContractMember2022-12-310001590955payc:LongTermIncentivePlanMemberus-gaap:PerformanceSharesMember2023-02-012023-02-280001590955payc:TwoThousandAndTwentyTwoRevolvingCreditAgreementMember2022-05-042022-05-040001590955us-gaap:RestrictedStockMembersrt:MinimumMember2021-01-012021-12-310001590955srt:MaximumMemberus-gaap:RestrictedStockUnitsRSUMember2021-01-012021-12-310001590955us-gaap:USTreasurySecuritiesMemberus-gaap:FairValueInputsLevel2Memberus-gaap:FairValueMeasurementsRecurringMember2023-12-310001590955us-gaap:RetainedEarningsMember2021-01-012021-12-310001590955us-gaap:GeneralAndAdministrativeExpenseMember2021-01-012021-12-310001590955us-gaap:RestrictedStockMemberpayc:NonExecutiveEmployeesMembersrt:MinimumMemberpayc:TimeBasedVestingMember2023-01-012023-12-310001590955us-gaap:AccumulatedOtherComprehensiveIncomeMember2022-01-012022-12-310001590955us-gaap:VehiclesMember2023-12-310001590955us-gaap:PropertyPlantAndEquipmentOtherTypesMember2022-12-310001590955srt:MaximumMemberpayc:StockRepurchasePlanMember2022-08-310001590955payc:FiftyPercentOfMatchingContributionMember2023-01-012023-12-310001590955payc:PropertyAndEquipmentNetExcludingLandAndConstructionInProgressMember2022-12-310001590955us-gaap:PerformanceSharesMember2023-12-3100015909552023-06-302023-06-300001590955us-gaap:FurnitureAndFixturesMember2023-12-310001590955us-gaap:GoodwillMember2022-12-310001590955srt:MinimumMemberpayc:FiftyPercentOfMatchingContributionMember2023-01-012023-12-310001590955payc:RecurringMember2022-01-012022-12-310001590955us-gaap:SellingAndMarketingExpenseMember2023-01-012023-12-310001590955us-gaap:CommonStockMember2023-12-310001590955us-gaap:LandImprovementsMember2023-12-310001590955us-gaap:LineOfCreditMemberpayc:SeniorSecuredTermCreditAgreementMember2017-12-072017-12-070001590955payc:RentalClocksMember2022-12-310001590955payc:OneHundredPercentMatchForPercentOfParticipantsContributionMember2023-01-012023-12-310001590955payc:LeverageRatioIsGreaterThanOrEqualToTwoPontZeroToOnePointZeroButLessThanThreePointZeroToOnePointZeroMemberpayc:ABRLoansMemberpayc:JulyTwoThousandAndTwentyTwoRevolvingCreditAgreementMember2023-01-012023-12-310001590955us-gaap:AccountingStandardsUpdate201815Member2023-12-310001590955payc:SOFRPlusMemberpayc:LeverageRatioIsGreaterThanOrEqualToThreePointZeroToOnePointZeroMemberpayc:JulyTwoThousandAndTwentyTwoRevolvingCreditAgreementMember2023-12-3100015909552024-02-080001590955us-gaap:AdditionalPaidInCapitalMember2022-01-012022-12-310001590955payc:TwoThousandTwentyTwoTermLoanFacilityMemberpayc:JulyTwoThousandAndTwentyTwoRevolvingCreditAgreementMember2023-07-282023-07-280001590955us-gaap:RestrictedStockUnitsRSUMember2023-12-310001590955us-gaap:PrimeRateMemberus-gaap:LineOfCreditMemberpayc:SeniorSecuredTermCreditAgreementMember2017-12-072017-12-070001590955us-gaap:BridgeLoanMemberpayc:TwoThousandAndTwentyTwoRevolvingCreditAgreementMember2022-05-040001590955us-gaap:ConstructionInProgressMember2022-12-310001590955us-gaap:InterestRateSwapMember2017-12-012017-12-310001590955payc:NonEmployeeMembersMemberus-gaap:RestrictedStockMemberpayc:TwoThousandAndTwentyThreeLongTermIncentivePlanMember2023-05-312023-05-310001590955us-gaap:RestrictedStockMembersrt:MinimumMember2023-01-012023-12-310001590955payc:LeverageRatioIsGreaterThanOrEqualToTwoPontZeroToOnePointZeroButLessThanThreePointZeroToOnePointZeroMemberpayc:JulyTwoThousandAndTwentyTwoRevolvingCreditAgreementMember2023-01-012023-12-310001590955us-gaap:RestrictedStockMember2023-12-310001590955us-gaap:RestrictedStockUnitsRSUMember2021-01-012021-12-310001590955us-gaap:TreasuryStockCommonMember2022-12-310001590955us-gaap:TreasuryStockCommonMember2023-12-310001590955payc:CostsToFulfillContractMember2021-12-310001590955payc:TimeBasedRestrictedStockUnitsMember2023-12-310001590955us-gaap:LoansPayableMemberpayc:SecuredRevolvingLineOfCreditMember2022-05-042022-05-040001590955payc:MarketBasedRestrictedSharesMember2023-01-012023-12-310001590955us-gaap:TreasuryStockCommonMember2021-12-310001590955payc:TwoThousandAndTwentyTwoRevolvingCreditAgreementMember2022-07-292022-07-290001590955us-gaap:CommonStockMember2023-01-012023-12-310001590955us-gaap:RetainedEarningsMember2023-12-310001590955us-gaap:GeneralAndAdministrativeExpenseMember2022-01-012022-12-310001590955payc:AdjustedLondonInterbankOfferedRateMemberus-gaap:LineOfCreditMemberpayc:SeniorSecuredTermCreditAgreementMember2017-12-072017-12-070001590955us-gaap:AdditionalPaidInCapitalMember2021-12-310001590955us-gaap:RestrictedStockMember2023-01-012023-12-310001590955payc:AfterTwoYearsOfEmploymentMember2023-01-012023-12-310001590955payc:CostsToObtainContractMember2021-12-310001590955payc:SOFRPlusMemberpayc:LeverageRatioIsGreaterThanOrEqualToTwoPontZeroToOnePointZeroButLessThanThreePointZeroToOnePointZeroMemberpayc:JulyTwoThousandAndTwentyTwoRevolvingCreditAgreementMember2023-12-310001590955us-gaap:AdditionalPaidInCapitalMember2023-01-012023-12-310001590955us-gaap:AvailableforsaleSecuritiesMember2022-12-310001590955payc:LeverageRatioIsLessThanOnePointZeroToOnePointZeroMemberpayc:ABRLoansMemberpayc:JulyTwoThousandAndTwentyTwoRevolvingCreditAgreementMember2023-01-012023-12-310001590955payc:FurnitureFixturesAndEquipmentMember2022-12-310001590955srt:ExecutiveOfficerMemberus-gaap:SubsequentEventMemberus-gaap:PerformanceSharesMember2024-02-052024-02-0500015909552021-01-012021-12-310001590955payc:MarketBasedRestrictedSharesMember2022-12-310001590955payc:CertainEmployeesMemberpayc:StockRepurchasePlanMember2022-01-012022-12-310001590955payc:ImplementationAndOtherMember2021-01-012021-12-310001590955payc:RentalClocksMember2023-12-310001590955payc:CostsToFulfillContractMember2022-01-012022-12-310001590955us-gaap:GeneralAndAdministrativeExpenseMember2023-01-012023-12-310001590955srt:ScenarioForecastMemberpayc:TimeBasedRestrictedStockUnitsMemberpayc:TwoThousandAndTwentyThreeLongTermIncentivePlanMember2027-02-052027-02-050001590955payc:TimeBasedRestrictedStockAwardsMember2023-12-310001590955us-gaap:LandMember2022-12-310001590955us-gaap:BuildingMember2023-12-310001590955payc:TwoThousandTwentyTwoRevolvingCreditAgreementLoanMemberpayc:TwoThousandAndTwentyTwoRevolvingCreditAgreementMemberpayc:BSBYRatePlusMember2022-05-042022-05-040001590955us-gaap:TreasuryStockCommonMember2023-01-012023-12-3100015909552025-01-012023-12-310001590955us-gaap:SellingAndMarketingExpenseMember2021-01-012021-12-310001590955us-gaap:SoftwareAndSoftwareDevelopmentCostsMember2021-01-012021-12-310001590955payc:TimeBasedRestrictedStockAwardsMember2022-12-310001590955payc:ExecutiveOfficersMemberpayc:TwoThousandAndTwentyThreeLongTermIncentivePlanMemberus-gaap:PerformanceSharesMember2023-05-020001590955us-gaap:SubsequentEventMemberpayc:TwoThousandAndTwentyThreeLongTermIncentivePlanMemberus-gaap:CommonStockMember2024-02-070001590955us-gaap:SoftwareAndSoftwareDevelopmentCostsMember2023-01-012023-12-310001590955us-gaap:RestrictedStockUnitsRSUMember2021-01-012021-12-310001590955payc:PropertyAndEquipmentNetExcludingLandAndConstructionInProgressMember2023-12-310001590955srt:MinimumMemberpayc:TwoThousandAndTwentyTwoRevolvingCreditAgreementMember2022-06-070001590955payc:ABRLoansMemberpayc:JulyTwoThousandAndTwentyTwoRevolvingCreditAgreementMember2023-01-012023-12-310001590955payc:AccruedExpensesAndOtherCurrentLiabilitiesMember2022-12-310001590955payc:TimeBasedRestrictedStockAwardsMember2022-01-012022-12-310001590955us-gaap:OperatingExpenseMember2021-01-012021-12-310001590955payc:LeverageRatioIsGreaterThanOrEqualToThreePointZeroToOnePointZeroMemberpayc:JulyTwoThousandAndTwentyTwoRevolvingCreditAgreementMember2023-01-012023-12-310001590955us-gaap:CommonStockMember2021-01-012021-12-310001590955payc:AccruedExpensesAndOtherCurrentLiabilitiesMember2023-12-310001590955us-gaap:LetterOfCreditMemberpayc:JulyTwoThousandAndTwentyTwoRevolvingCreditAgreementMember2023-12-310001590955payc:LongTermIncentivePlanMembersrt:ExecutiveOfficerMemberus-gaap:PerformanceSharesMember2023-01-012023-12-310001590955us-gaap:StateAndLocalJurisdictionMember2023-12-310001590955us-gaap:USTreasurySecuritiesMemberus-gaap:AvailableforsaleSecuritiesMember2023-12-310001590955us-gaap:EmployeeStockMember2023-12-310001590955us-gaap:PropertyPlantAndEquipmentMember2023-01-012023-12-310001590955us-gaap:OtherNoncurrentLiabilitiesMember2023-12-310001590955payc:TwoThousandTwentyCeoPerformanceAwardMemberus-gaap:RestrictedStockMemberus-gaap:SubsequentEventMember2024-02-072024-02-070001590955payc:ImplementationAndOtherMember2023-01-012023-12-310001590955us-gaap:TreasuryStockCommonMember2021-01-012021-12-310001590955payc:StockRepurchasePlanMember2022-01-012022-12-310001590955payc:TwoThousandAndFourteenAndTwoThusandAndTwentyThreeLongTermIncentivePlanMemberus-gaap:RestrictedStockMember2023-01-012023-12-310001590955us-gaap:CertificatesOfDepositMemberus-gaap:AvailableforsaleSecuritiesMember2023-12-310001590955us-gaap:RetainedEarningsMember2022-12-310001590955payc:JulyTwoThousandAndTwentyTwoRevolvingCreditAgreementMember2022-07-290001590955payc:JulyTwoThousandAndTwentyTwoRevolvingCreditAgreementMember2023-01-012023-12-310001590955payc:NamingRightsMember2023-12-310001590955us-gaap:SoftwareAndSoftwareDevelopmentCostsMember2023-12-310001590955srt:VicePresidentMemberus-gaap:EmployeeSeveranceMemberpayc:TimeBasedVestingMember2023-04-032023-04-030001590955payc:SOFRPlusMemberpayc:LeverageRatioIsGreaterThanOrEqualToOnePointZeroToOnePointZeroButLessThanTwoPointZeroToOnePointZeroMemberpayc:JulyTwoThousandAndTwentyTwoRevolvingCreditAgreementMember2023-12-3100015909552023-01-012023-12-310001590955payc:TwoThousandTwentyTwoTermLoanFacilityMember2022-07-292022-07-290001590955payc:NamingRightsMember2022-12-3100015909552022-01-012022-12-310001590955us-gaap:AdditionalPaidInCapitalMember2022-12-310001590955us-gaap:RestrictedStockMembersrt:MinimumMember2022-01-012022-12-310001590955payc:JulyTwoThousandAndTwentyTwoRevolvingCreditFacililtyMember2023-01-012023-12-310001590955us-gaap:TreasuryStockCommonMember2022-01-012022-12-310001590955us-gaap:CommonStockMember2022-01-012022-12-310001590955us-gaap:AvailableforsaleSecuritiesMember2023-12-310001590955us-gaap:CommonStockMember2022-12-310001590955payc:LeverageRatioIsLessThanOnePointZeroToOnePointZeroMemberpayc:JulyTwoThousandAndTwentyTwoRevolvingCreditAgreementMember2023-01-012023-12-310001590955payc:TwoThousandAndFourteenAndTwoThusandAndTwentyThreeLongTermIncentivePlanMemberus-gaap:RestrictedStockMemberpayc:TimeBasedVestingMember2023-01-012023-12-310001590955us-gaap:OtherNoncurrentLiabilitiesMember2022-12-310001590955srt:MaximumMemberpayc:AmendmentNumberTwoMemberpayc:JulyTwoThousandAndTwentyTwoRevolvingCreditAgreementMember2023-07-280001590955payc:NamingRightsMembersrt:MinimumMember2023-01-012023-12-310001590955payc:TwoThousandAndTwentyTwoRevolvingCreditAgreementMember2022-05-0400015909552023-10-012023-12-310001590955us-gaap:CertificatesOfDepositMemberus-gaap:FairValueMeasurementsRecurringMember2022-12-310001590955payc:LeverageRatioIsGreaterThanOrEqualToOnePointZeroToOnePointZeroButLessThanTwoPointZeroToOnePointZeroMemberpayc:JulyTwoThousandAndTwentyTwoRevolvingCreditAgreementMember2023-01-012023-12-310001590955us-gaap:ResearchAndDevelopmentExpenseMember2021-01-012021-12-310001590955us-gaap:SoftwareAndSoftwareDevelopmentCostsMember2022-01-012022-12-310001590955us-gaap:RestrictedStockUnitsRSUMembersrt:MinimumMember2021-01-012021-12-310001590955payc:SOFRPlusOneMonthInterestPeriodMemberpayc:JulyTwoThousandAndTwentyTwoRevolvingCreditAgreementMember2023-01-012023-12-3100015909552020-12-310001590955us-gaap:RetainedEarningsMember2021-12-310001590955us-gaap:RestrictedStockMember2021-01-012021-12-310001590955srt:MaximumMemberus-gaap:RestrictedStockMember2022-01-012022-12-310001590955srt:MaximumMemberus-gaap:RestrictedStockUnitsRSUMember2022-01-012022-12-310001590955payc:TwoThousandTwentyTwoTermLoanFacilityMemberpayc:JulyTwoThousandAndTwentyTwoRevolvingCreditAgreementMember2022-07-290001590955payc:MarketBasedRestrictedSharesMember2023-12-310001590955srt:MaximumMemberus-gaap:RestrictedStockUnitsRSUMember2023-01-012023-12-310001590955us-gaap:RetainedEarningsMember2022-01-012022-12-310001590955us-gaap:FairValueInputsLevel2Memberus-gaap:CertificatesOfDepositMemberus-gaap:FairValueMeasurementsRecurringMember2023-12-310001590955us-gaap:LandMember2023-12-310001590955us-gaap:RestrictedStockMember2022-01-012022-12-310001590955us-gaap:FairValueInputsLevel2Memberus-gaap:CertificatesOfDepositMemberus-gaap:FairValueMeasurementsRecurringMember2022-12-310001590955us-gaap:CommonStockMember2021-12-310001590955us-gaap:OperatingExpenseMember2022-01-012022-12-310001590955payc:AmendmentNumberTwoMembersrt:MinimumMemberpayc:JulyTwoThousandAndTwentyTwoRevolvingCreditAgreementMember2023-07-280001590955payc:SeniorSecuredTermCreditAgreementMember2022-05-042022-05-040001590955payc:JulyTwoThousandAndTwentyTwoRevolvingCreditFacililtyMember2022-12-310001590955us-gaap:InterestRateSwapMember2022-08-242022-08-240001590955payc:SOFRPlusMemberpayc:JulyTwoThousandAndTwentyTwoRevolvingCreditAgreementMember2023-01-012023-12-310001590955payc:JulyTwoThousandAndTwentyTwoRevolvingCreditAgreementMemberpayc:SeniorSecuredTermCreditAgreementMember2022-07-292022-07-290001590955payc:JulyTwoThousandAndTwentyTwoRevolvingCreditAgreementMember2023-07-282023-07-280001590955us-gaap:LeaseholdImprovementsMember2023-12-310001590955us-gaap:ConstructionInProgressMember2023-12-3100015909552022-12-310001590955us-gaap:ResearchAndDevelopmentExpenseMember2023-01-012023-12-310001590955srt:MaximumMember2023-01-012023-12-310001590955us-gaap:USTreasurySecuritiesMemberus-gaap:FairValueMeasurementsRecurringMember2022-12-310001590955us-gaap:AccumulatedOtherComprehensiveIncomeMember2023-12-310001590955payc:CostsToObtainContractMember2023-01-012023-12-310001590955us-gaap:GoodwillMember2023-12-310001590955us-gaap:AccountingStandardsUpdate201912Member2023-12-310001590955payc:ABRLoansMemberpayc:LeverageRatioIsGreaterThanOrEqualToThreePointZeroToOnePointZeroMemberpayc:JulyTwoThousandAndTwentyTwoRevolvingCreditAgreementMember2023-01-012023-12-310001590955payc:TimeBasedRestrictedStockUnitsMember2023-01-012023-12-310001590955payc:TwoThousandAndFourteenAndTwoThusandAndTwentyThreeLongTermIncentivePlanMemberpayc:ShareBasedCompensationAwardVwapEqualsOrExceedsFourZeroFourPerShareMemberus-gaap:RestrictedStockMember2023-01-012023-12-310001590955us-gaap:ComputerSoftwareIntangibleAssetMember2023-12-310001590955us-gaap:LetterOfCreditMemberpayc:TwoThousandAndTwentyTwoRevolvingCreditAgreementMember2022-05-040001590955payc:SponsorshipRightsMember2021-07-012021-07-310001590955us-gaap:RestrictedStockUnitsRSUMember2023-01-012023-12-3100015909552023-06-300001590955payc:SOFRPlusMemberpayc:LeverageRatioIsLessThanOnePointZeroToOnePointZeroMemberpayc:JulyTwoThousandAndTwentyTwoRevolvingCreditAgreementMember2023-12-310001590955us-gaap:ComputerEquipmentMember2023-12-310001590955payc:CostsToFulfillContractMember2022-12-310001590955us-gaap:SoftwareAndSoftwareDevelopmentCostsMember2022-12-310001590955payc:RecurringMember2021-01-012021-12-310001590955us-gaap:EmployeeStockMember2021-01-012021-12-310001590955payc:ImplementationAndOtherMember2022-01-012022-12-310001590955us-gaap:PerformanceSharesMember2022-12-310001590955us-gaap:EmployeeStockMember2023-01-012023-12-310001590955us-gaap:RestrictedStockUnitsRSUMember2022-01-012022-12-310001590955us-gaap:AccumulatedOtherComprehensiveIncomeMember2023-01-012023-12-310001590955us-gaap:PerformanceSharesMember2023-01-012023-12-310001590955us-gaap:PropertyPlantAndEquipmentMember2022-01-012022-12-310001590955us-gaap:CommonStockMember2020-12-310001590955us-gaap:AvailableforsaleSecuritiesMemberus-gaap:CertificatesOfDepositMember2022-12-310001590955us-gaap:USTreasurySecuritiesMemberus-gaap:FairValueInputsLevel2Memberus-gaap:FairValueMeasurementsRecurringMember2022-12-310001590955srt:MaximumMemberpayc:NamingRightsMember2023-01-012023-12-310001590955us-gaap:OperatingExpenseMember2023-01-012023-12-310001590955srt:MaximumMemberus-gaap:RestrictedStockMember2021-01-012021-12-310001590955payc:CostsToObtainContractMember2022-01-012022-12-310001590955payc:TimeBasedRestrictedStockAwardsMember2023-01-012023-12-310001590955us-gaap:SubsequentEventMemberus-gaap:PerformanceSharesMemberpayc:TwoThousandAndTwentyThreeLongTermIncentivePlanMember2024-02-070001590955us-gaap:RetainedEarningsMember2020-12-310001590955srt:MaximumMemberpayc:FiftyPercentOfMatchingContributionMember2023-01-012023-12-310001590955srt:MinimumMember2023-01-012023-12-310001590955srt:MaximumMemberus-gaap:RestrictedStockMember2023-01-012023-12-3100015909552023-12-310001590955us-gaap:BuildingMember2022-12-310001590955payc:StockRepurchasePlanMember2023-12-310001590955us-gaap:ResearchAndDevelopmentExpenseMember2022-01-012022-12-310001590955us-gaap:AdditionalPaidInCapitalMember2023-12-310001590955payc:JulyTwoThousandAndTwentyTwoRevolvingCreditAgreementMember2023-12-310001590955us-gaap:TreasuryStockCommonMember2020-12-310001590955us-gaap:ComputerEquipmentMember2022-12-310001590955payc:StockRepurchasePlanMember2023-01-012023-12-310001590955payc:MarketBasedRestrictedSharesMember2021-01-012021-12-310001590955payc:TwoThousandAndFourteenAndTwoThusandAndTwentyThreeLongTermIncentivePlanMemberpayc:ShareBasedCompensationAwardVwapEqualsOrExceedsFourSixtySixPerShareMemberus-gaap:RestrictedStockMember2023-01-012023-12-310001590955srt:MaximumMemberus-gaap:PerformanceSharesMember2023-01-012023-12-310001590955payc:TwoThousandTwentyCeoPerformanceAwardMember2023-01-012023-12-310001590955payc:TimeBasedRestrictedStockAwardsMember2021-01-012021-12-310001590955srt:ExecutiveOfficerMemberpayc:LongTermIncentivePlanMemberus-gaap:PerformanceSharesMember2023-02-012023-02-280001590955us-gaap:StateAndLocalJurisdictionMember2023-01-012023-12-310001590955us-gaap:FederalFundsEffectiveSwapRateMemberpayc:JulyTwoThousandAndTwentyTwoRevolvingCreditAgreementMember2023-01-012023-12-310001590955us-gaap:AdditionalPaidInCapitalMember2021-01-012021-12-310001590955us-gaap:RestrictedStockUnitsRSUMember2023-01-012023-12-310001590955us-gaap:PropertyPlantAndEquipmentOtherTypesMember2023-12-310001590955payc:CostsToObtainContractMember2023-12-310001590955srt:ScenarioForecastMemberpayc:TimeBasedRestrictedStockUnitsMemberpayc:TwoThousandAndTwentyThreeLongTermIncentivePlanMember2026-02-052026-02-050001590955us-gaap:RetainedEarningsMember2023-01-012023-12-310001590955payc:JulyTwoThousandAndTwentyTwoRevolvingCreditFacililtyMember2022-01-012022-12-310001590955us-gaap:PropertyPlantAndEquipmentMember2021-01-012021-12-310001590955payc:TwoThousandAndFourteenAndTwoThusandAndTwentyThreeLongTermIncentivePlanMemberus-gaap:RestrictedStockMemberpayc:MarketBasedVestingMember2023-01-012023-12-310001590955srt:MaximumMemberpayc:TwoThousandAndTwentyTwoRevolvingCreditAgreementMember2022-06-070001590955payc:CostsToFulfillContractMember2023-12-310001590955payc:StockRepurchasePlanMemberpayc:CertainEmployeesMember2023-01-012023-12-310001590955us-gaap:InterestRateSwapMember2017-12-310001590955payc:CostsToFulfillContractMember2023-01-012023-12-310001590955srt:MaximumMemberus-gaap:RestrictedStockMemberpayc:TimeBasedVestingMemberpayc:NonExecutiveEmployeesMember2023-01-012023-12-310001590955us-gaap:AccumulatedOtherComprehensiveIncomeMember2022-12-310001590955payc:TwoThousandAndTwentyThreeLongTermIncentivePlanMember2023-05-310001590955us-gaap:SellingAndMarketingExpenseMember2022-01-012022-12-3100015909552024-01-012023-12-310001590955us-gaap:CertificatesOfDepositMemberus-gaap:FairValueMeasurementsRecurringMember2023-12-310001590955us-gaap:RestrictedStockUnitsRSUMember2022-01-012022-12-310001590955payc:FurnitureFixturesAndEquipmentMember2023-12-3100015909552021-12-310001590955us-gaap:RestrictedStockUnitsRSUMembersrt:MinimumMember2023-01-012023-12-310001590955payc:TimeBasedRestrictedStockUnitsMember2022-12-310001590955payc:ExecutiveOfficersMemberpayc:TimeBasedRestrictedStockUnitsMemberpayc:TwoThousandAndTwentyThreeLongTermIncentivePlanMember2023-05-0200015909552026-01-012023-12-310001590955payc:TwoThousandTwentyCeoPerformanceAwardMemberpayc:CoChiefExecutiveOfficerMemberus-gaap:RestrictedStockMember2020-11-232020-11-230001590955us-gaap:AdditionalPaidInCapitalMember2020-12-310001590955payc:JulyTwoThousandAndTwentyTwoRevolvingCreditAgreementMemberus-gaap:BridgeLoanMember2023-12-310001590955us-gaap:SubsequentEventMemberpayc:TimeBasedRestrictedStockUnitsMemberpayc:TwoThousandAndTwentyThreeLongTermIncentivePlanMember2024-02-070001590955us-gaap:USTreasurySecuritiesMemberus-gaap:AvailableforsaleSecuritiesMember2022-12-310001590955payc:ExecutiveOfficersMemberpayc:TimeBasedVestingMemberpayc:TwoThousandAndTwentyThreeLongTermIncentivePlanMember2023-05-020001590955us-gaap:USTreasurySecuritiesMemberus-gaap:FairValueMeasurementsRecurringMember2023-12-310001590955us-gaap:EmployeeStockMember2022-01-012022-12-310001590955payc:NonEmployeeMembersMemberus-gaap:RestrictedStockMemberpayc:TimeBasedVestingMemberpayc:TwoThousandAndTwentyThreeLongTermIncentivePlanMember2023-01-012023-12-310001590955payc:SeniorSecuredTermCreditAgreementMember2017-12-072017-12-07payc:Segmentxbrli:purexbrli:sharespayc:TradingDaypayc:Companyiso4217:USD
UNITED STATES
SECURITIES AND EXCHANGE COMMISSION
Washington, D.C. 20549
FORM 10-K
(Mark One)
|
|
☒ |
ANNUAL REPORT PURSUANT TO SECTION 13 OR 15(d) OF THE SECURITIES EXCHANGE ACT OF 1934 |
For the fiscal year ended December 31, 2023
or
|
|
☐ |
TRANSITION REPORT PURSUANT TO SECTION 13 OR 15(d) OF THE SECURITIES EXCHANGE ACT OF 1934 |
For the transition period from to
Commission file number: 001-36393
Paycom Software, Inc.
(Exact name of registrant as specified in its charter)
|
|
|
|
|
|
Delaware |
|
80-0957485 |
(State or other jurisdiction of incorporation or organization) |
|
(I.R.S. Employer Identification No.) |
|
|
|
|
|
|
|
|
|
7501 W. Memorial Road Oklahoma City, Oklahoma |
|
73142 |
(Address of principal executive offices) |
|
(Zip Code) |
Registrant’s telephone number, including area code: (405) 722-6900
Securities registered pursuant to Section 12(b) of the Act:
|
|
|
|
|
Title of each class |
|
Trading Symbol(s) |
|
Name of each exchange on which registered |
Common Stock, $0.01 par value |
|
PAYC |
|
New York Stock Exchange |
Securities registered pursuant to Section 12(g) of the Act: None
Indicate by check mark if the registrant is a well-known seasoned issuer, as defined in Rule 405 of the Securities Act. Yes ☒ No ☐
Indicate by check mark if the registrant is not required to file reports pursuant to Section 13 or Section 15(d) of the Act. Yes ☐ No ☒
Indicate by check mark whether the registrant (1) has filed all reports required to be filed by Section 13 or 15(d) of the Securities Exchange Act of 1934 during the preceding 12 months (or for such shorter period that the registrant was required to file such reports), and (2) has been subject to such filing requirements for the past 90 days. Yes ☒ No ☐
Indicate by check mark whether the registrant has submitted electronically every Interactive Data File required to be submitted pursuant to Rule 405 of Regulation S-T (§ 232.405 of this chapter) during the preceding 12 months (or for such shorter period that the registrant was required to submit such files). Yes ☒ No ☐
Indicate by check mark whether the registrant is a large accelerated filer, an accelerated filer, a non-accelerated filer, a smaller reporting company, or an emerging growth company. See the definitions of “large accelerated filer,” “accelerated filer,” “smaller reporting company,” and “emerging growth company” in Rule 12b-2 of the Exchange Act.
|
|
|
|
|
|
|
|
Large accelerated filer |
|
☒ |
|
Accelerated filer |
|
☐ |
|
Non-accelerated filer |
|
☐ |
|
Smaller reporting company |
|
☐ |
|
|
|
|
|
Emerging growth company |
|
☐ |
|
If an emerging growth company, indicate by check mark if the registrant has elected not to use the extended transition period for complying with any new or revised financial accounting standards provided pursuant to Section 13(a) of the Exchange Act. ☐
Indicate by check mark whether the registrant has filed a report on and attestation to its management’s assessment of the effectiveness of its internal control over financial reporting under Section 404(b) of the Sarbanes-Oxley Act (15 U.S.C. 7262(b)) by the registered public accounting firm that prepared or issued its audit report. ☒
If securities are registered pursuant to Section 12(b) of the Act, indicate by check mark whether the financial statements of the registrant included in the filing reflect the correction of an error to previously issued financial statements. ☐
Indicate by check mark whether any of those error corrections are restatements that required a recovery analysis of incentive-based compensation received by any of the registrant’s executive officers during the relevant recovery period pursuant to §240.10D-1(b). ☐
Indicate by check mark whether the registrant is a shell company (as defined in Rule 12b-2 of the Act). Yes ☐ No ☒
As of February 8, 2024, 57,551,437 shares of the registrant’s common stock, $0.01 par value per share, were outstanding, including 994,817 shares of restricted stock. As of June 30, 2023, the aggregate market value of voting stock held by non-affiliates of the registrant was approximately $16.6 billion (based on the closing price for shares of the registrant’s common stock as reported by the New York Stock Exchange on that date).
DOCUMENTS INCORPORATED BY REFERENCE
Portions of the registrant’s Definitive Proxy Statement on Schedule 14A to be furnished to stockholders in connection with its 2024 Annual Meeting of Stockholders are incorporated by reference in Part III, Items 10-14 of this Annual Report on Form 10-K.
PAYCOM SOFTWARE, INC.
2023 ANNUAL REPORT ON FORM 10-K
TABLE OF CONTENTS
Unless we state otherwise or the context otherwise requires, the terms “Paycom,” “we,” “us,” “our” and the “Company” refer to Paycom Software, Inc., a Delaware corporation, and its consolidated subsidiaries.
CAUTIONARY STATEMENTS
Special Note Regarding Forward-Looking Statements
This Annual Report on Form 10-K (this “Form 10-K”) contains forward-looking statements within the meaning of Section 27A of the Securities Act of 1933, as amended (the “Securities Act”) and Section 21E of the Securities Exchange Act of 1934, as amended (the “Exchange Act”). Forward-looking statements are any statements that refer to our estimated or anticipated results, other non-historical facts or future events and include, but are not limited to, statements regarding our business strategy; anticipated future operating results and operating expenses, cash flows, capital resources, dividends and liquidity; competition; trends, opportunities and risks affecting our business, industry and financial results; future expansion or growth plans and potential for future growth, including internationally; our ability to attract new clients to purchase our solution; our ability to retain clients and induce them to purchase additional applications; our ability to accurately forecast future revenues and appropriately plan our expenses; market acceptance of our solution and applications; our expectations regarding future revenues generated by certain applications; the return on investment for users of our solution; our ability to attract and retain qualified employees and key personnel; future regulatory, judicial and legislative changes; how certain factors affecting our performance correlate to improvement or deterioration in the labor market; our plan to open additional sales offices and our ability to effectively execute such plan; the sufficiency of our existing cash and cash equivalents to meet our working capital and capital expenditure needs over the next 12 months; our plans regarding our capital expenditures and investment activity as our business grows, including with respect to research and development and the expansion of our corporate headquarters and other facilities; our plans to pay cash dividends; and our plans to repurchase shares of our common stock through a stock repurchase plan. In addition, forward-looking statements also consist of statements involving trend analyses and statements including such words as “anticipate,” “believe,” “could,” “estimate,” “expect,” “will,” “intend,” “may,” “might,” “plan,” “potential,” “should,” “would,” and similar expressions or the negative of such terms or other comparable terminology.
Forward-looking statements are neither historical facts nor assurances of future performance, and are based only on our current beliefs, expectations and assumptions regarding the future of our business, future plans and strategies, projections, anticipated events and trends, the economy and other future conditions. Because forward-looking statements relate to the future, they are subject to inherent uncertainties, risks and changes in circumstances that are difficult to predict and many of which are outside of our control. Therefore, you should not rely on any of these forward-looking statements. Important factors that could cause our actual results and financial condition to differ materially from those indicated in the forward-looking statements include, among others, the following:
•the possibility of security vulnerabilities, cyber-attacks and network disruptions, including breaches of data security and privacy leaks, data loss, and business interruptions;
•changes in laws, government regulations and policies and interpretations thereof;
•our compliance with data privacy laws and regulations;
•our ability to develop enhancements and new applications, keep pace with technological developments and respond to future disruptive technologies;
•our ability to compete effectively;
•our ability to maintain and expand existing client relationships and add new clients, including challenges related to attracting and retaining larger clients;
•the possibility that clients may not be satisfied with our deployment or technical support services, or that our solution fails to perform properly;
•our dependence on our key executives;
•our ability to attract and retain qualified personnel, including software developers, product managers and skilled IT, sales, marketing and operational personnel;
•our ability to manage our rapid growth and organizational change effectively;
•the impact of adverse economic and market conditions, including those related to global health crises and geopolitical conflicts;
•fluctuations in our financial results due to factors beyond our control;
•our failure to develop and maintain our brand cost-effectively;
•our ability to expand into international markets and manage risks associated with international operations and sales;
•our reliance on relationships with third parties;
•regulatory and compliance risks related to our background checks business;
•our failure to adequately protect our intellectual property rights;
•seasonality of certain operating results and financial metrics;
•the possibility that the Affordable Care Act may be modified, repealed or declared unconstitutional; and
•the other factors set forth in Part I, Item 1A, “Risk Factors” of this Form 10-K.
Forward-looking statements are based only on information currently available to us and speak only as of the date of this Form 10-K. We do not undertake any obligation to update or revise the forward-looking statements to reflect events that occur or circumstances that exist after the date on which such statements were made, except to the extent required by law.
Additional Information
The Vault Visa Payroll Card is issued by The Bancorp Bank, N.A., Member FDIC, pursuant to a license from Visa U.S.A Inc. and may be used everywhere Visa debit cards are accepted.
“Paycom,” the Paycom logo and other trademarks or service marks of Paycom appearing in this Form 10-K are the property of Paycom and are protected under applicable intellectual property laws. Google and Google Pay are registered trademarks of Google, LLC. Apple and Apple Pay are trademarks of Apple, Inc., registered in the United States and other countries. Samsung and Samsung Pay are trademarks owned by Samsung Electronics Co., Ltd. Visa is a registered trademark of Visa International Service Association. All other marks are the property of the respective owners of such marks. Solely for convenience, our trademarks and tradenames referred to in this Form 10-K may appear without the ® or ™ symbols, but such references are not intended to indicate in any way that we will not assert, to the fullest extent under applicable law, our rights to these trademarks and tradenames.
PART I
Item 1. Business
Overview
We are a leading provider of a comprehensive, cloud-based human capital management (“HCM”) solution delivered as Software-as-a-Service (“SaaS”). We provide functionality and data analytics that businesses need to manage the complete employment lifecycle, from recruitment to retirement. Our solution requires virtually no customization and is based on a core system of record maintained in a single database for all HCM functions, including talent acquisition, time and labor management, payroll, talent management and human resources (“HR”) management applications. Our user-friendly software allows for easy adoption of our solution by employees, enabling self-management of their HCM activities in the cloud, which reduces the administrative burden on employers and increases employee productivity.
We were founded in 1998 and became a publicly traded company through our initial public offering in 2014. Since our founding, we have focused on providing an innovative SaaS HCM solution. Organizations need sophisticated, flexible and intuitive applications that can quickly adapt to their evolving HCM requirements, streamline their HR processes and systems and enable them to control costs. We believe the HCM needs of most organizations are currently served by multiple providers in an attempt to replicate a comprehensive SaaS product. This approach often results in challenges with system integration and data integrity, low scalability, high costs and extended delivery times.
Because our solution was developed in-house and is based on a single platform, there is no need for our clients to integrate, update or access multiple databases, which are common issues with competitor offerings that use multiple third-party systems in order to link together their HCM offerings. Additionally, our solution maintains data integrity for accurate, actionable and real-time analytics and business intelligence and helps clients minimize the risks of compliance errors due to inaccurate or missing information. We deliver feature-rich applications while maintaining excellence in information security and quality management standards, as evidenced by our International Organization for Standardization (“ISO”) certifications.
We sell our solution directly through our internally trained, client-focused and highly skilled sales force based in offices across the United States. As a part of our client retention effort, a specialist within a dedicated team is assigned to each client to provide industry-leading, personalized service. We have approximately 36,800 clients, none of which constituted more than one-half of one percent of our revenues for the year ended December 31, 2023. We believe that as a result of our focus on client experience, we enjoy high client satisfaction as evidenced by an annual revenue retention rate of 90% and 91% for the years ended December 31, 2023 and 2022, respectively. We believe our revenue retention rate understates our client loyalty because this rate is decreased by former clients that were acquired or otherwise ceased operations.
We have historically generated the majority of our revenues from our payroll applications. We generally do not separately track our revenues across our other applications because we often sell applications in various groupings and configurations for a single price.
The Paycom Solution
We offer an end-to-end SaaS HCM solution that provides our clients and their employees with immediate access to accurate and secure information and analytics at any time from any location where internet service is available. We believe our solution delivers the following benefits:
Comprehensive HCM Solution
Our solution offers functionality that manages the entire employment lifecycle for employers and employees, from recruitment to retirement. Our user-friendly applications streamline client processes and provide clients and their employees with the ability to directly access and manage administrative processes, including applications that identify candidates, on-board employees, manage time and labor, administer payroll deductions and benefits, manage performance, terminate employees and administer post-termination health benefits such as COBRA. The widespread employee usage of our applications further integrates our solution into the administrative processes of our clients. Our solution also has the advantage of being built in-house by our highly trained and skilled team of software developers, thereby minimizing data integrity issues across applications.
Core System of Record
Our solution is based on a core system of record that contains payroll and HR information in one convenient database, thereby reducing costs and eliminating the need for multiple software products and vendors and the maintenance of employee data in numerous databases. This core system of record enables our clients to input employee data one time and enjoy seamless functionality across our applications. When a revision is made to the file of an employee, all appropriate personnel have access to the change in real time. In addition, our core system of record helps clients minimize the risk of compliance errors due to inaccurate or missing information that results from maintaining multiple databases. Through accurate tracking and management of employee payroll and other HR data, such information can be compiled for comprehensive and consistent reporting for our clients.
Data Analytics and Business Intelligence
Our solution’s core system of record allows clients to strategically analyze comprehensive and accurate employee information to make informed business decisions based upon actionable, real-time analytics provided through our client dashboard. This functionality allows our clients to operate with a more complete and accurate picture of their organization, as our solution’s embedded analytics capture the content and context of everyday business events, facilitating fast and informed decision-making from any location. Our industry-first employee usage management analytics tool, Direct Data Exchange® (DDX®), provides employers insights into efficiencies gained through employee usage of HR technology and generates a real-time estimate of the savings realized from that usage. We help clients reduce administrative and operational costs and better manage talent.
Enhanced Employee Experience
The employees of our clients also benefit from our HCM applications. As workforces transition from technology-savvy to technology-dependent, employees expect mobile technology and the resources necessary to readily access information and control their professional development. Through our employee self-service technology, employees can view real-time HR information, including pay stubs, W-2s and benefits information, as well as manage their schedules and vacation time and update W-4 contact information. Employees can even do their own payroll with our industry-first Beti® technology. Our mobile app makes it easier for employees to access their self-service information. Our app has fingerprint and facial recognition capabilities, aiding employers in their efforts to engage technology-dependent workers. Our system also allows employers to engage their workforce through learning management courses and training paths, surveys, and performance goals and reviews.
To further enhance the effectiveness of management throughout our clients’ organizations, we also offer easy to use software with Manager on-the-Go®. Built within our mobile app, this tool allows for 24/7 accessibility to essential manager-side functionality, giving supervisors and managers the ability to perform a variety of tasks — anytime, anywhere.
In addition to our self-service, app-based functionality, we also provide our clients with a strategy to drive usage among their employees. This strategy includes training clients’ employees how to use the Paycom app during implementation and providing additional training from our client relations representatives (“CRRs”). Allowing employees to make changes directly to our database creates efficiencies for both the employer and employee. Today’s employees have little tolerance for complexity, and with our solution, employees have become accustomed to having a direct relationship with their HR database. This relationship is directly correlated with our single-database that is key to increasing usage. Our strategy to promote employee usage of the Paycom system elevates HR personnel to focus on the human element of their jobs, creating a more positive culture and giving HR personnel more time to engage with their employees.
Personalized Support Provided by Trained Personnel
Our applications are supported by one-on-one personal assistance from trained specialists. Service specialists are assigned to specific clients and are trained across all of our applications, ensuring they provide comprehensive, expert-level service. Our client service is ISO 9001:2015 certified on the basis of its quality and consistency. We strive to provide our clients with high levels of service and support to ensure their continued use of our solution for all of their HCM needs.
Software-as-a-Service Delivery Model
Our SaaS delivery model allows clients with geographically dispersed and mobile workforces to operate more efficiently, and allows these clients to implement, access and use our client-oriented internet solution on demand and remotely through standard web browsers, smart phones, tablets and other web-enabled devices. Our SaaS solution reduces the time, risk, headcount and costs associated with installing and maintaining applications for on-premise products within the information technology (“IT”) infrastructure of our clients.
Secure Cloud-Based Architecture
Our cloud-based architecture allows our solution to be implemented remotely with minimal client interaction. Updates such as software enhancements and newly developed applications can be deployed without client interaction, disruption or involvement, allowing our clients to make a smaller investment in hardware, personnel, implementation time and consulting. Additionally, we own and maintain all of the infrastructure technology to host our solution and to maximize system availability for clients. Our focus on, and investment in, technology and data security has been recognized with ISO/IEC 27001:2013 certified security standards.
Scalability to Grow with our Clients
Our solution is highly scalable. We serve a diversified client base ranging in size from one employee to many thousands of employees. Historically, our target client size range has been organizations with 50 to 10,000 employees, and we recently expanded our target client size range to include organizations with more than 10,000 employees. For this purpose, we calculate the number of clients’ employees based on parent company grouping. Our clients are able to use the same solution while their businesses grow by deploying applications as needed in real-time. Pricing is determined based on employee headcount and the number of applications utilized, enabling our clients to align HCM spending with their evolving HCM needs as compared to traditional HCM products that require clients to migrate to new software as they grow but retain fixed costs even if the client’s employee headcount shrinks.
Efficient and Productive Research and Development
We believe we benefit from a competitive advantage with our research and development investments, people and processes. Early investments in our proprietary, cloud-based architecture enable us to develop and deploy applications in a timely and cost-effective manner. We have also chosen to base our research and development team in Oklahoma and Texas, which we believe provides us with high-quality talent at a lower cost compared to other locations in the United States where there is more competition for technology talent. These strategic decisions have enabled us to have a highly productive research and development function.
Our Strategy for Growth
Our strategy is to continue to establish our solution as the HCM industry standard by increasing our presence in existing markets and expanding into additional markets. We intend to continue to increase our domestic sales capacity and expand our offering to additional international markets. We will also execute our strategy for growth by targeting larger clients, capturing small business demand and strengthening and extending our solution.
Increase Our Presence in Existing Markets
We believe a significant market opportunity exists to increase our presence within markets where we currently have a sales office. Each outside sales office is typically staffed with one sales team, with each team consisting of a sales manager and approximately eight other sales professionals. We plan to further penetrate and more effectively capture existing markets through increased sales productivity as well as by adding sales capacity in such markets. Although we have a sales office in 40 of the 50 largest metropolitan statistical areas (“MSAs”) in the United States based on July 2022 U.S. Census Bureau estimates, only seven of these MSAs are currently served by multiple Paycom sales teams.
Expand Into Additional Markets
We plan to continue expanding our sales capability by opening sales offices in certain metropolitan areas where we currently have no sales teams. We have historically selected new locations based on potential client and employee demographics as well as business density. When opening a new sales office, we typically relocate a proven sales manager from an existing territory who then recruits a team of high-performing sales representatives. It typically takes a new sales office 24 months to reach maturity. In addition, as we enhance the global capabilities of our solution, our U.S.-based sales teams are expanding our reach into international markets by targeting global organizations with a U.S. presence.
Enlarge our Existing Client Relationships
We dedicate our resources to helping our clients facilitate their goals, whether through helping our clients execute better hiring decisions, manage compensation more effectively or simply operate more efficiently. We believe a significant growth opportunity exists in selling additional applications to our current clients. Many clients have subsequently deployed additional applications as they recognize the benefits of our comprehensive solution. Furthermore, with the launch of our Global HCM™ solution and expansion of payroll services into certain international markets, such as Canada, Mexico and the United Kingdom, we have the opportunity to capture additional revenue from existing clients with international employees. As we extend and enhance the functionality of our solution, we will continue to invest in initiatives to increase the adoption of our solution and maintain our high levels of client satisfaction.
Target Larger Clients and Capture Incremental Small Business Demand
The average size of our clients has grown significantly as we have organically grown our operations and increased the number of applications we offer. We expect that our ability to serve organizations with international employees makes our solution more attractive to larger companies, many of which have a global presence. We believe larger employers represent a substantial opportunity to increase our revenues per client, with limited incremental cost to us. To further capitalize on this opportunity, we intend to continue targeting larger businesses. We also receive inbound leads from businesses below our target client size range, who can be onboarded through our emerging markets group, which focuses on businesses with fewer than 50 employees.
Maintain Our Leadership in Innovation by Strengthening and Extending our Solution
Our ability to develop and deploy new applications and updates rapidly and cost-effectively has been integral to the results that we have achieved to date. We intend to continue extending the functionality and range of our solution in the future. Our development efforts are performed exclusively in-house and are heavily based upon proactive research and client input. We are focusing our investments on the development of new applications, enhancements and learning courses that are responsive to the needs of our clients, which are garnered through ongoing client interaction and collaboration.
Our Applications and Tools
Our HCM solution offers a full suite of applications and tools that generally fall within the following categories: talent acquisition, time and labor management, payroll, talent management and HR management. With Global HCM, a number of our HCM applications and tools are available in 15 languages and dialects and are accessible to users in more than 180 countries. We also offer native payroll in Canada, Mexico and the United Kingdom, and intend to add native payroll in other countries.
Talent Acquisition
|
|
|

|
|
Applicant Tracking. Our applicant tracking application simplifies the recruiting processes needed to hire the most qualified employees. By using our comprehensive software, our clients can move candidates from the application process through new employee onboarding without re-keying data. Organizations can maintain and easily access a list of potential employees from a talent pool with real-time candidate, recruiter and manager retrieval while eliminating manual redundancies. Clients can also distribute job openings and reach a wider candidate audience with tools to reach unlimited postings on a network of free job boards and manage fee-based job board accounts. The application’s enhanced career site analytics reveal which job boards and marketing efforts produce the best return on investment. It not only sends candidates automated job alerts to notify them of a client’s newly posted positions but also allows them to provide their availability up front to discuss potential job opportunities, thereby saving a step for recruiters. |
|
|
|

|
|
Candidate Tracker. Our candidate tracker application enables recruiters to track and stay connected to potential talent through an online database of top candidates. This application helps clients fill future positions faster and without the cost of professional recruiting firms. It also allows clients to assemble a contact history searchable by school, degree, skill set, previous employer, ZIP code radius and follow-up date. |
|
|
|

|
|
Enhanced Background Checks®. Our background check application helps clients easily screen prospective new hires or employees. Employers can choose the specific service or package of services desired for each individual, including verification of education, employment, driving history, criminal history, and drug and health screening, among others. Based on client research and feedback, the efficiencies in our system have produced faster turnaround times by as much as three days over our competitors’ offerings. |
|
|

|
|
Onboarding. Our onboarding application streamlines the hiring processes for employees of our clients by creating online checklists of tasks to be assigned to an employee or group of employees. This process can begin even before a new hire’s first day on the job, helping the new hire be more productive on his or her first day. |
|
|
|

|
|
E-Verify®. By allowing electronic signature verification and online storage, our E-Verify application automates employment verification and reduces our clients’ exposure to audits and penalties that could result from I-9 violations. |
|
|

|
|
Tax Credits. Our tax credits application helps employers process and calculate the available federal tax credits associated with hiring employees who meet various qualifications, ensuring organizations opting into this service receive their share of government-appropriated funds. This application also prescreens candidates to determine who is eligible for tax credits. |
Time and Labor Management
|
|
|

|
|
Time and Attendance. Our time and attendance application allows our clients to accurately and efficiently manage when, where and how employees report their hours worked. Clients can apply customized rules, use batch editing and use timecard management tools to manage complex time and attendance needs. Employees can clock in and out at their desks with web-based time clocks or by using finger scans, badge-swipe or other types of hardware terminals in a single or multi-clock environment. Our web time clock feature allows employees to clock in and out using their mobile device or any device with an internet connection, which automatically updates into the payroll application when approved, eliminating the need to manually calculate time sheets and re-key information into payroll systems. |
|
|
|
|
|

|
|
Scheduling. Our scheduling application helps managers with employee scheduling through automated functionality that provides a seamless workflow with the payroll and time and attendance applications. This application allows clients to create and edit templates for different pay classes. It also allows employees and managers access to their schedules at any time, and employees can approve, decline or swap their schedules and see what shifts are available for pickup. Email notifications are sent automatically to supervisors and employees when schedules are created, requests for shift exchanges are submitted or a shift change is approved or denied. |
|
|
|

|
|
Time-Off Requests with GONE™. Our time-off requests application automates and standardizes the time-off request process. GONE, an enhancement to Time-Off Requests, automates time-off decision-making. It allows clients to set criteria to fairly and consistently auto-resolve requests, which helps employers remain adequately staffed. GONE facilitates faster decisions for employees and reduces the burden on managers and HR teams to handle disputes. After setup, decisions flow seamlessly and accurately into payroll. Managers can also view an online time-off calendar to easily monitor time-off requests. Our Employee Self-Service® tool allows employees to view the time off they have available, submit requests, view blackout dates and view the status of requests and any manager comments. |
|
|

|
|
Labor Allocation. Our labor allocation application simplifies the process of setting up and tracking employee hours based on the job the employee is working. |
|
|

|
|
Labor Management Reports/Push Reporting®. Our labor management reports provide clients with up-to-the-minute information that they need to better manage their labor force, such as overtime and labor distribution. Our Push Reporting application also gives clients the ability to set up recurring reports and schedule them to be run automatically and sent to users on a daily, weekly, monthly, quarterly or yearly basis. |
|
|
|

|
|
Geofencing/Geotracking. Enhancing our time and attendance application, Paycom’s Geofencing and Geotracking location-based technology assists our clients in managing the whereabouts of employees while on the job. Geofencing allows employers to establish geographical boundaries within which their employees are authorized to clock in and out when using our web time clock on smartphones, tablets or other electronic devices. Once enabled, this time-theft-combatting tool supersedes IP address restrictions, meaning the system first checks for authorized geographical locations, rather than authorized IP addresses. In addition, the Geotracking tool empowers clients to track employees’ geographical locations upon clocking in and out. The collected coordinates can be entered into and viewed on a Google® display map. |
|
|
|

|
|
Microfence®. Microfence, our proprietary Bluetooth® beacon, is strategically placed in a client’s workplace, enabling employees to clock in or out on their Paycom mobile app as they move within a defined radius. It eliminates potential backlog from workers waiting in line at a communal hardware clock and allows them to avoid high-touch areas. Employees can track hourly worktime without access to a desktop or kiosk. By tracking employee data accurately and ensuring workers are paid for their hours worked, Microfence helps employers comply with labor laws. |
Payroll
|
|
|

|
|
Beti. Beti (Better Employee Transaction Interface™) is an industry-first technology that further automates and streamlines the payroll process by empowering employees to do their own payroll, which increases efficiencies and reduces errors. Employees already manage all other components of their paychecks, including timecards, expenses, PTO requests and benefits; now they have the convenience within Paycom to process their own payroll, too. By guiding employees to access, view, manage, troubleshoot and approve their paycheck before payroll is submitted, HR can focus on more strategic endeavors. |
|
|

|
|
Payroll and Tax Management. Our payroll application is the foundation of our solution, and all our clients are required to utilize this application to access our other applications. It is automatically updated with changes in employee information and offers other time-saving functionality such as batch editing and effective dating. Enhanced payroll grid functionality allows clients to automate and delegate payroll functions to accelerate the processes, giving clients repeatable, reliable payroll processing with additional controls. Our payroll application allows clients to customize the services to fit their specific needs. It can be accessed at any time to make changes, run payroll and generate custom reports. Our tax management tool helps clients handle their payroll taxes, deposits, regulatory correspondence and amendments, as well as assists with penalty and interest disputes. With this tool, Paycom also debits clients’ payroll taxes, deposits them on their due date and submits clients’ filings. |
|
|
|
|
|
|

|
|
Vault Visa® Payroll Card. The Vault Visa® Payroll Card gives employees the financial convenience of allowing them to deposit all or a portion of their wages on a secure pay card usable with mobile wallets like Apple Pay®, Google Pay® and Samsung Pay®. In certain circumstances, Vault card users also can have access to their pay up to two days earlier for greater financial flexibility. For clients, it minimizes the inconvenience of paper-based payroll and helps reduce check fraud through secure digital funding. |
|
|
|

|
|
Everyday™. Our daily payroll service, Everyday, allows employees to receive daily wages on a Vault Visa Payroll Card at no cost to the employees. This service provides employees greater financial flexibility and transparency to better meet life’s demands. It also provides employers a competitive edge in hiring and retaining employees with a benefit today’s employees want. Everyday is fully automated, calculating and withholding taxes, benefits and deductions first to protect against overpayment and help ensure compliance. |
|
|
|

|
|
Paycom Pay®. Paycom Pay eliminates the tedious, risky job of check reconciliation by issuing checks to our clients’ employees that clear from a Paycom bank account, thereby reducing the number of transactions on a client’s general ledger and simplifying bank statement balancing. |
|
|
|

|
|
Client Action Center™. Client Action Center makes it easier for payroll administrators to act on banking and tax-related information. Clients receive a comprehensive view of the data they need to make informed, accurate decisions — all centralized in one intuitive dashboard. With the Paycom mobile app, they can access quick views of wires, tax accounts and access to specialists for assistance. |
|
|

|
|
Expense Management. Our expense management application eliminates the manual, paper-based processes associated with employee expense reimbursement and allows employers to control and monitor expenses by setting clearly defined rules and parameters for employee reimbursement. Employees can upload or email photos of receipts for reimbursement and expenses are automatically parsed when submitted. Employees can then access an expense dashboard where they can view the status of their submitted expenses through Employee Self-Service. Expenses seamlessly flow through virtual approvals to payroll, and our application provides proper allocation of expenses to the general ledger, reducing manual work for accounting personnel. Organizations gain audit-ready reporting, which is critical when a client needs to know the critical attributes of the expense approval process. |
|
|
|

|
|
Mileage Tracker/FAVR. Our native mobile app includes mileage tracker capability, allowing employers to more accurately track, log and manage employees’ mileage reimbursements that are then automatically updated within our expense management applications. FAVR, which stands for Fixed and Variable Rate, allows our clients to customize their mileage reimbursement rate, according to IRS guidelines, to ensure accurate employee reimbursement for business miles without overpaying on reimbursements. |
|
|
|
 |
|
Garnishment Administration. Our garnishment administration application mitigates the risk of penalties and lawsuits from employees and agencies, allowing clients to handle communications with garnishment payees and agencies, as well as calculate and track garnishment payments. |
|
|
|

|
|
GL Concierge. Our GL concierge application offers organizations more control and transparency into their payroll general ledger and gives finance professionals intuitive reporting, enriched audit trails, customizable file layouts and real-time alerts. Clients of all sizes can use a wide variety of general ledger maps along with an action item alert system that improves the dynamics of their daily operations. With this simplified process, accounting departments can generate mapped GL reports for direct import into various accounting software packages. |
Talent Management
|
|
|

|
|
Employee Self-Service. Available in English or Spanish, our Employee Self-Service application improves employee engagement by empowering employees to self-manage certain transactions, obtain quick answers to frequent payroll and HR questions, access their pay history, view performance goals and reviews, and view total compensation reports that show their compensation and benefits package. Benefits information and paid time-off accruals also give employees the ability to make informed decisions regarding their benefit selections and time-off requests. Employees can access our self-service software through any device with an internet connection or by downloading the Paycom app on the Google Play® store and the App Store® online store. |
|
|
|
|
|
|
|
|
|
|
|
|
|

|
|
Compensation Budgeting. Our compensation budgeting application provides compensation and performance information in one system, providing clients valuable workforce insight to help manage and formulate salary budgets and establish merit-based compensation increases that automatically upload new rates to payroll once the merit increases are set. Having payroll linked with performance reviews is instrumental for compensation budgeting, which rewards employees fairly while staying within budget. |
|
|
|

|
|
Performance Management. Our performance management application allows employees to set performance goals and competencies for positions across an organization, helping align company goals with workforce goals. It also helps streamline the performance review process with online facilitation of the review process and links performance to pay. |
|
|
|

|
|
Position Management. Our position management application provides customizable tools to categorize personnel, increasing consistency and organization companywide. The system ties job attributes to a specific position within the organization, not an individual employee, which frees up time to focus on people instead of antiquated processes. |
|
|

|
|
My Analytics. The My Analytics dashboard offers powerful workforce insight in a variety of report formats. Because we offer a truly single software, the comprehensive report data provides the workforce intelligence needed to drive human capital decisions. We offer employment predictor reporting as part of the My Analytics dashboard. This sophisticated machine learning technology gives an employer greater insight into employees at risk of leaving the organization. |
|
|

|
|
Paycom Learning. Our learning management application delivers a smart, simple, data-driven experience that formalizes and standardizes our clients’ training processes, thereby allowing them to quickly adapt in an ever-changing business environment. It provides employees with “anytime, anywhere” access to a central knowledge base where they can access content, share expertise and measure their professional development progress, while its built-in video content creator allows subject-matter experts to share knowledge across the company by empowering them to create, upload and distribute engaging microlearning content quickly and easily. With performance evidence within Paycom Learning, our clients can create a lesson tool that allows their employees to demonstrate knowledge and mastery of a specific skill to confirm they are truly grasping the course material. Managers or trainers then can provide direct input about the employee’s performance, creating a true feedback loop that promotes employee development. In addition to providing the ability to create and upload custom content, we created and launched our own proprietary eLearning content. Paycom Learning clients have immediate access to a library of Paycom-created learning courses, which allows employers to educate their managers and employees quickly and consistently on foundational topics such as workplace violence, discrimination and harassment prevention. Paycom content subscriptions are also available with hundreds of courses in English and Spanish. These courses are tailored to organizations across multiple industries. |
HR Management
|
|
|

|
|
Manager on-the-Go. Our Manager on-the-Go tool gives supervisors and managers the ability to perform a variety of tasks, such as approving time-off requests and expense reimbursements — anytime, anywhere. It enhances usage patterns and the interactions within organizations among leaders and employees, while distributing the approval responsibilities more broadly, freeing HR personnel. This tool allows managers and supervisors to, among other things, view their team’s time-off calendar, edit and approve punch-change requests, manage employees’ schedules and respond to employee inquiries through Ask Here. Manager on-the-Go provides a seamless toggle between Manager on-the-Go, Employee Self-Service and Mileage Tracker. |
|
|
|

|
|
Direct Data Exchange. Our comprehensive management analytics tool gives employers insights into efficiencies gained through employee usage of HR technology and provides a real-time return on investment on that usage (based on findings by EY). Using our Direct Data Exchange (DDX) tool, employers not only can see the cost savings associated with changes made by employees, but they can also drill down into specific aspects of our software, including time and attendance, benefits, expenses, time-off requests, tax and payroll modifications, to determine exactly where additional savings can be achieved. This feature allows clients to see organizational employee usage trends arranged by their preferred time frame and total logins (filterable by individuals) to Employee Self-Service through any device. |
|
|
|

|
|
Ask Here. Our Ask Here tool gives all client employees a direct line of communication to ask work-related questions of their company representatives and receive timely answers, all through the convenience of our self-service technology. Ask Here’s functionality promotes increased engagement by ensuring all inquiries are addressed, any required actions are taken and no follow-ups are required by the employee. This central repository for employee questions has a convenient dashboard, guided inquiry template, ability to attach documents and photos, and auto-saved responses for commonly asked questions. |
|
|
|

|
|
Documents and Checklists. Our documents and checklists application is designed to manage employee files and allows employees to digitally sign and view company documents. Paycom securely stores client records to meet retention requirements and protect documents from unauthorized access and other disasters that can threaten businesses. Aside from expending fewer resources on paper, printing and file storage, our documents and checklists application protects sensitive information and documents by customizing user access levels. In addition, clients can assign checklists to employees for the completion of certain tasks associated with processes such as onboarding and off-boarding. |
|
|

|
|
Government and Compliance. Our government and compliance application helps clients reduce exposure to violations, audits and penalties with respect to the employment laws impacting their business, such as the Fair Labor Standards Act, Family Medical Leave Act, Equal Employment Opportunity Act, COBRA and other state and federal regulations. A single database keeps our clients’ employee data consistent and enhances reporting capabilities by providing better accuracy and real-time insight. |
|
|

|
|
Benefits Administration/Benefits to Carrier. Our benefits administration application allows clients to customize benefit plan setup, deduction amounts, enrollment dates and new-hire waiting periods. Employers are provided census and reconciliation reports to ensure they do not overpay for benefits. Employers can also update deduction amounts for all employees or groups of employees at once, which automatically updates all insurance carriers for any changes. This application also provides employees with online enrollment and helps educate them by allowing them to view per-pay-period deduction amounts and preview how these deductions would affect their take-home pay, driving better informed enrollment decisions for greater employee satisfaction. Our benefits to carrier application automatically updates insurance carriers regarding benefit deduction amounts, address changes, termination of benefits and qualifying events. |
|
|
|

|
|
Benefit Enrollment Service. Our benefit enrollment service provides our clients with a dedicated coordinator to help make open enrollment even easier by developing tailored strategies and setting up plans and features within our benefits software offering. The coordinator helps reconcile enrollment and deductions to prepare the client for a successful first payroll of the new plan year. |
|
|

|
|
COBRA Administration. Our COBRA administration application helps protect employers from COBRA violations and the associated fines and penalties by automatically initiating compliance measures upon entry of qualifying events into the application. In addition to sending required correspondence, this application also tracks important dates, collects and remits premiums, and reports on all COBRA activity. |
|
|

|
|
Personnel Action Forms and Performance Discussion Forms. Our personnel action forms (“PAF”) application helps our clients reduce the amount of time and paperwork required to make employee changes, such as pay rate, position and title changes, by allowing managers to complete and approve online personnel action forms, subject to necessary approvals from the HR department. This feature reduces errors, eliminates re-keying of data and automatically populates payroll with an effective date. Performance Discussion Forms, part of our PAF tool, allows clients to manage employee conversations related to a variety of topics, including workplace behavior, development opportunities and paths toward a promotion. |
|
|

|
|
Paycom Surveys. Our surveys application allows employers to conduct confidential email surveys of employees on workplace matters, providing employers with candid feedback that otherwise may go undisclosed. From exit interviews and benefits assessments to rate-the-boss questionnaires, this valuable information can be used to drive decisions and realize company goals. Clients can analyze results by the demographics of the workforce and compare how results change over time. |
|
|
|

|
|
401(k) Reporting. Our 401(k) reporting tool simplifies the process of transferring sensitive employee data to clients’ 401(k) provider. It customizes, maps and automates plan reports to meet each provider’s unique specifications. After each payroll is processed and finalized, 401(k) reports are automatically created and delivered to the provider and the secure client inbox within 24 hours. |
|
|
|

|
|
Report Center. Our easy-to-use reporting software allows clients to create custom reports on HR data within our software. Clients can filter through specifications according to their needs, use the advanced report writer to view visual data representations, such as charts and graphs, and build a detailed analysis of workforce and budget. Report Center provides insights on return on investment, overtime, payroll, job applications, salaries, compensation forecasting and more. |
|
|
|
|
|
|
|
|
|

|
|
Enhanced ACA. Our Affordable Care Act (“ACA”) application provides clients with access to a dashboard that tracks employee count, employee status, health care plan affordability and ACA periods. Plus, it enables Paycom to file IRS Forms 1094/1095-B and/or -C. Clients using this application also have access to additional real-time compliance reports, alerts and historical data for audit trail purposes. |
|
|
|

|
|
Clue®. Clue helps businesses securely collect, track and manage the vaccination and testing data of their workforce. Clue allows employees to easily and quickly enter their vaccination or testing information and also provides automatic reminders and push notifications to help affected employees stay on top of any necessary testing. Clue’s dashboard provides a single, intuitive platform that stores relevant, up-to-date vaccine information and enables organizations to create customized reports to meet different business-specific needs. |
Our Clients
We serve a diverse client base in terms of size and industry. We have approximately 36,800 clients, or nearly 19,500 clients based on parent company grouping, none of which constituted more than one-half of one percent of our revenues for the year ended December 31, 2023. We stored data for over 6.8 million persons employed by our clients during the year ended December 31, 2023.
Many small to mid-sized companies can typically make the decision to adopt our solution more quickly than larger companies, which we believe results in a shorter sales cycle and more closely corresponds to our target sales cycle of 30 to 90 days. As a result of the nature and size of our clientele, we maintain a diversified client base and very low revenue concentration among our clients. We believe, however, that larger employers represent a substantial opportunity to increase our revenues per client with limited incremental cost. As we pursue and attract larger clients, we may face longer sales cycles and less predictability in completing some of our sales.
Competition
The market for HCM solutions is rapidly evolving, highly competitive and subject to changing technology, shifting client needs and frequent introduction of new products and services. Our competitors range from small, regional firms to large, well-established international firms with multiple product offerings.
Our competitors offer HCM solutions that may overlap with one, several or all categories of the applications we offer. We compete with companies such as Automatic Data Processing, Inc., Cornerstone OnDemand, Inc., Dayforce, Inc., Gusto, Inc., Intuit, Inc., Insperity, Inc., Oracle Corporation, Paychex, Inc., Paylocity Holding Corporation, Paycor HCM, Inc., People Center, Inc. d/b/a Rippling, SAP SE, ServiceNow, Inc., Ultimate Kronos Group, Workday, Inc., and other international, national, regional, and local providers. Our competitors provide HCM solutions by various means. Although certain providers continue to deliver legacy enterprise software, many now offer cloud-based solutions, resulting in increased competition for clients seeking the greater flexibility and access to information provided by cloud-based offerings. Furthermore, the HCM industry has experienced an emergence of white label and embedded payroll offerings.
Competition in the HCM solutions market is primarily based on service responsiveness, product quality and reputation, breadth of service, application offering and price. The importance of these factors depends on the size of the business. Price tends to be the most important factor of competition for smaller businesses with fewer employees, while the scope of features and customization is more important to larger businesses. Regardless of a company’s size, another important factor is the implementation experience, as all organizations are seeking a streamlined and simplified process.
Sales and Marketing
We generate client leads and demo requests, accelerate sales opportunities and build brand awareness through our marketing programs that target senior finance and HR executives, technology professionals and senior business leaders of companies that perform HCM functions in-house or outsource these functions to one of our competitors. Our marketing programs include:
•Podcast episodes, webinars, blogs, white papers and infographics;
•National and local television advertising campaigns, personalized direct mail campaigns, email campaigns, social and digital media campaigns, industry-specific advertising and tradeshow exhibiting; and
•Search engine marketing methods that include site optimization and pay-per-click searches.
We sell our solution exclusively through our captive sales force, substantially all of whom have a four-year college degree. We typically recruit sales candidates who have sales experience in non-HCM industries or, with respect to candidates recruited directly from colleges and universities, who have demonstrated an aptitude for sales. Our sales force is comprised of field sales personnel, who are organized geographically, CRRs, who sell additional applications to existing clients, and our emerging markets representatives, who focus on businesses with fewer than 50 employees. As of the filing of this Form 10-K, we have 55 sales teams (including one team consisting of CRRs and emerging markets representatives) located in 28 states and plan to open additional sales offices to further expand our market presence.
When a new client processes payroll with us for an entire month, our sales representative receives a one-time commission based upon an estimate of future annual revenues from such client. Executive sales representatives receive a higher commission rate and base salary based upon both current year and career-to-date realized sales.
In addition to managing client relationships, our CRRs are focused on expanding the number of applications our clients purchase from us by introducing them to additional applications. When an existing client purchases and then utilizes a new application, a CRR receives a one-time commission based upon an estimate of future annual revenues from such client.
Technology, Operations and Security
Technology
Our multi-tenant architecture enables us to deliver our solution across our client base from a single platform, while securely partitioning access to our clients’ respective application data. Because a single version of our solution is developed, supported and deployed across all of our clients, the Paycom solution is seamlessly scalable.
Operations
We physically host our solution for our clients in three secure data center facilities located in Oklahoma and Texas. Each of these data centers is owned and managed by Paycom, and Paycom is the only tenant occupying the data centers. All of our critical systems are fully redundant and backed up at regular intervals to these facilities, and backups are monitored for success and failure status daily. Client data is backed up in real-time among the three data centers. We maintain redundant load-balanced internet lines serviced by multiple service providers to each data center, to ensure optimized client access to our solution and the clients’ stored data. Our server and database clusters are fully redundant to ensure continuous service in the event of a disk failure.
Physical security includes biometric and dedicated ID-oriented access control, redundant alarm systems and continuous camera monitoring by our security guards. The data centers also have environmental monitoring and extensive environmental controls such as heat and fire protection, moisture, temperature, and humidity sensors, backup power supply and exterior reinforced concrete walls.
Security
We maintain a formal and comprehensive security program designed to ensure the confidentiality, integrity and availability of our clients’ data. For a discussion of our information security program, see “Item 1C. Cybersecurity.”
Software Development
Our application development team works closely with our clients to enhance our existing application offerings and develop new applications. This process is led by experienced product managers, who oversee the evolution of their respective applications within a focused timeframe of innovation and cultivation in order to deliver the well-developed applications and enhancements desired by our clients. Our product managers are proactive in their approach to assigning development requests based on research, trends and user feedback. A key element of our development process is the one-on-one personal interaction between clients and our service team, through whom our clients personally suggest new applications and features.
We develop our solution from the “ground up” with our internal development and engineering teams. Our development and engineering teams, along with our employees, conceive new applications and enhancements, review requests, schedule development in order of priority and subsequently develop the applications or enhancements. Our new applications and enhancements are independently reviewed by the quality assurance team, in accordance with our software development process, before being fully implemented. Enhancements to our applications are typically released on a monthly scheduled release date to coordinate the communication and release to our clients.
Client Service
We are committed to providing industry-leading, client-centered service. For this reason, we assign each client a specialist within a dedicated team. This one-on-one service is a key part of our client service model and helps to ensure we are delivering an industry-leading solution and maintaining high client satisfaction. The primary elements of our client service model include the following:
Streamlined Setup and Onboarding
After electing to deploy our solution, a new client begins our onboarding process with assistance from a team of new client setup specialists and the sales representative responsible for obtaining the client’s business. In addition, we also have a team of transition specialists whose job it is to ensure that the process is performed smoothly, data is collected properly and all relevant employees are fully trained on the system. This team works closely with the client until the client is capable of managing our solution independently, at which time responsibility for the client relationship is transferred to our dedicated CRRs and service specialists. Unlike certain of our competitors, we do not outsource any of our onboarding efforts.
Dedicated Service Specialists
After completing the onboarding process, each client is assigned to a service specialist within a dedicated team. Clients can then contact their dedicated service specialist or a team member if any issues or questions arise. These specialists provide personalized service with a historical knowledge of the clients’ communicated business needs. In addition, our CRRs proactively contact our clients to ensure satisfaction with our solution and introduce additional applications.
Expert Level Service
Our service specialists are trained across all of our applications to ensure that they can provide comprehensive, expert-level service. Our client service is ISO 9001:2015 certified and helps support our high client retention rate.
Government Regulation
We are subject to varying degrees of regulations in each of the jurisdictions in which we provide services. Local laws and regulations, and their interpretation and enforcement, differ significantly among those jurisdictions. We are also subject to certain federal, state, local and foreign regulations based on the products we offer. For example, as a result of our background screening application, Enhanced Background Checks, we are subject to the Fair Credit Reporting Act and other federal and state background reporting laws. Further, our status as a government contractor subjects us to federal government contracting regulations including the adherence to heightened equal employment opportunity requirements, maintaining an affirmative action plan and other federal regulations.
Data privacy has become a significant issue in the United States and in other countries. The regulatory framework for privacy issues worldwide is rapidly evolving and is likely to remain uncertain for the foreseeable future. Many federal, state and foreign government bodies and agencies have adopted or are considering adopting laws and regulations affecting or regarding the collection, use and disclosure of personal information. In the United States, these include, for example, rules and regulations promulgated under the authority of the Federal Trade Commission, the Health Insurance Portability and Accountability Act of 1996, the Family Medical Leave Act of 1993, the ACA, the Financial Services Modernization Act of 1999, the Gramm-Leach-Bliley Act, state biometric privacy laws, including the Illinois Biometric Information Privacy Act (“IBIPA”), state breach notification laws and state consumer privacy laws, including the California Consumer Privacy Act (“CCPA”), as amended by the California Privacy Rights Act (“CPRA”). Further, because some of our clients have establishments internationally, the Canadian Personal Information Protection and Electronic Documents Act (“PIPEDA”), Mexico’s Federal Law on the Protection of Personal Data held by Private Parties, and the European Union’s General Data Protection Regulation (“GDPR”) and other foreign data privacy laws may impact our processing of certain client and employee information. In addition, regulatory and legislative authorities in the United States and the European Union have enacted or proposed legislation that imposes or would impose restrictions on the development of emerging technologies such as generative artificial intelligence (“generative AI”) and machine learning. The regulatory landscape related to generative AI and machine learning is rapidly evolving and is likely to remain uncertain for the foreseeable future. As we develop products that incorporate technologies such as generative AI and machine learning, we must comply with applicable laws and regulations.
Certifications
We voluntarily obtain third-party security examinations relating to our internal controls over financial reporting in accordance with System and Organization Controls Report, I (“SOC 1”). Our SOC 1 examination is conducted every six months by one of the four largest independent international auditing firms, and addresses, among other areas, our physical and environmental safeguards for production data centers, data availability and integrity procedures, change management procedures and logical security procedures. We also obtain third-party examinations relating to our internal controls over security and privacy in accordance with System and Organization Controls Report, II (“SOC 2”). Our SOC 2 examination is conducted every year and addresses, among other areas, internal controls around security, availability, processing integrity, confidentiality and privacy. We publish SOC 1 reports semiannually and SOC 2 and SOC 3 reports annually.
In April 2023, we renewed a certification based on ISO 9001:2015 criteria, a standard for the implementation of quality management processes published by ISO, covering our activities required to create and deliver our solution. This independent assessment of our conformity to the ISO 9001:2015 standard includes assessing the design and implementation of quality objectives to meet delivery standards on an ongoing basis. The certification is valid until April 2026, with continuing assessments taking place annually.
In October 2022, we renewed a certification based on ISO 22301:2019 criteria, a standard for implementing and managing an effective Business Continuity Management System (BCMS) published by ISO. This international standard for continuity management specifies requirements to plan, implement, operate and continually improve a documented management system to protect against, prepare for, respond to and recover from disruptive incidents when they arise. The certification is valid until January 2026, with continuing assessments taking place annually.
In November 2022, we renewed a certification based on ISO/IEC 27001:2013 criteria, a security standard for Information Security Management Systems published by ISO covering our production, quality assurance and implementation environments. This independent assessment of our conformity to the ISO 27001 standard includes assessing security risks, designing and implementing comprehensive security controls and adopting an information security management process to meet security needs on an ongoing basis. The certification is valid until October 2025, with continuing assessments taking place annually.
In November 2022, we renewed a certification based on ISO 27701:2019 criteria, a standard for establishing, implementing, maintaining and continually improving a Privacy Information Management System (PIMS) published by ISO. This international standard for PIMS specifies PIMS-related requirements and provides guidance for Personally Identifiable Information (PII) controllers and PII processors holding responsibility and accountability for PII processing. The certification is valid until February 2026, with continuing assessments taking place annually.
Intellectual Property
We rely on a combination of copyrights, trademarks, service marks, trade secret laws and contractual restrictions to establish and protect our intellectual property rights. We also have a number of registered and unregistered trademarks and will continue to evaluate the registration of additional trademarks as appropriate. We do not have any patents or patent applications pending.
Seasonality
Our revenues are seasonal in nature and generally we expect our first and fourth quarter revenues to be higher than other quarters during the year. Our first quarter recurring revenues are positively impacted by the annual processing of payroll tax filing forms and ACA form filing requirements. We anticipate that our revenues will continue to exhibit this seasonal pattern related to ACA form filings for so long as the ACA (or replacement legislation) includes employer reporting requirements. Additionally, our fourth quarter recurring revenues are positively impacted by processing unscheduled payroll runs (such as bonuses) for our clients. Nonetheless, we expect the magnitude of these seasonal fluctuations in our revenues to decrease to the extent clients utilize more of our non-payroll applications.
Human Capital
As of December 31, 2023, we employed 7,308 people, substantially all of whom are full-time employees. Our human capital objectives include attracting, developing and retaining the best talent in the industry. We have been recognized both locally and nationally for providing our employees with an excellent work environment. We strive to provide a workplace that is free from harassment or discrimination, including harassment or discrimination involving race, color, sex, religion, gender, age, national origin, disability, gender identity or expression, sexual orientation, veteran or marital status. We believe that creating this kind of work environment is fundamental to fostering diversity.
Culture and Values
Paycom’s purpose is to create technology that simplifies life for employees. Our purpose guides every aspect of our business and creates a culture that aligns our employees with the core values of our company:
These values further define us and drive our success. They steer how we work with our clients and each other. Paycom would not be the company it is today without a deep desire to win and innovate new ideas. Our focus on people — including our team members, our clients and their employees — and caring about their experience, health and success, is at the heart of our culture. Our can-do attitude helps us embrace uncertainty with optimism and believe we can achieve what others consider impossible.
Diversity and Inclusion
Our commitment to diversity, inclusion and belonging starts with our goal to attract, retain and develop a workforce that is diverse in background, knowledge, skill and experience. We recognize Paycom plays an important part in the lives of our employees and strive to create an inclusive workplace where employees feel heard, valued and appreciated for who they are. We continue to work toward a diverse workforce at all employee levels, from entry level to executive. The table below summarizes our workforce demographics as of December 31, 2023. The demographic workforce data within the table below, including race and ethnicity, gender
and job categories, aligns with the EEO-1 Component 1 data collection reporting requirements outlined by the U.S. Equal Employment Opportunity Commission, where applicable.
|
|
|
|
|
|
|
|
|
|
|
|
|
|
|
As of December 31, 2023 |
|
|
|
All Employees |
|
|
First/Mid Level Officials & Managers |
|
|
Executive/Sr. Level Officials & Managers |
|
Gender: |
|
|
|
|
|
|
|
|
|
Female |
|
|
48.8 |
% |
|
|
53.0 |
% |
|
|
38.1 |
% |
Male |
|
|
49.3 |
% |
|
|
45.4 |
% |
|
|
60.3 |
% |
Non-Binary |
|
|
0.7 |
% |
|
|
0.2 |
% |
|
|
— |
|
Not Specified |
|
|
1.2 |
% |
|
|
1.4 |
% |
|
|
1.6 |
% |
|
|
|
|
|
|
|
|
|
|
Race and Ethnicity: |
|
|
|
|
|
|
|
|
|
American Indian or Alaskan Native |
|
|
2.3 |
% |
|
|
2.5 |
% |
|
|
— |
|
Asian |
|
|
10.4 |
% |
|
|
5.8 |
% |
|
|
1.6 |
% |
Black or African American |
|
|
9.2 |
% |
|
|
2.9 |
% |
|
|
— |
|
Hispanic or Latino |
|
|
10.6 |
% |
|
|
3.7 |
% |
|
|
— |
|
Native Hawaiian or Pacific Islander |
|
|
0.3 |
% |
|
|
0.2 |
% |
|
|
— |
|
Two or more races |
|
|
4.1 |
% |
|
|
2.5 |
% |
|
|
— |
|
White |
|
|
58.7 |
% |
|
|
76.3 |
% |
|
|
96.8 |
% |
Not Specified |
|
|
4.4 |
% |
|
|
6.1 |
% |
|
|
1.6 |
% |
Training and Development
Through the use of our Paycom learning tool, we empower our employees by providing tailored learning paths in areas such as leadership, diversity and inclusion, technical skills and compliance. During 2023, our employees completed thousands of courses utilizing our Paycom learning tool.
We provide our sales force with intensive training courses. Our unique training program includes instruction in accounting, business metrics, application features and tax matters relevant to our target market and we believe it fosters loyalty and helps maintain our corporate culture. Our training continues for our sales force through weekly strategy sessions and leadership development training. Executive sales representatives are also required to attend quarterly conferences to share leading practices and receive legal and business updates.
Health, Safety and Wellness
We believe that our employees are the summation of our successes, which is why we offer an excellent health and benefits program to our employees and their families. We offer our employees comprehensive health insurance as well as optional dental and vision coverage. Additionally, we provide our employees several opportunities to focus on physical, mental and financial wellness by maintaining a fully equipped on-site gym, 401(k) matching, an employee stock purchase plan, and paid vacation, holiday, family leave and sick leave, with numerous other benefits offered to our employees.
Segment Information
We operate in a single operating segment and a single reporting segment. Operating segments are defined as components of an enterprise about which separate financial information is regularly evaluated by the chief operating decision maker function (which is fulfilled by our Co-Chief Executive Officers) in deciding how to allocate resources and in assessing performance. Our Co-Chief Executive Officers allocate resources and assess performance based upon financial information at the consolidated level. Because we operate in one operating segment, all required financial segment information is presented in the consolidated financial statements.
Available Information
Our internet address is www.paycom.com and our investor relations website is located at investors.paycom.com. Our Annual Reports on Form 10-K, Quarterly Reports on Form 10-Q, Current Reports on Form 8-K and amendments to those reports can be found on our investor relations website, free of charge, as soon as reasonably practicable after we electronically file such material with, or furnish it to, the SEC. Information contained on our website is not incorporated by reference into this Form 10-K. The SEC maintains a public website, www.sec.gov, which includes information about and the filings of issuers that file electronically with the SEC.
Item 1A. Risk Factors
The risk factors noted in this section and other factors noted throughout this Form 10-K, including those risks identified in Part II, Item 7, “Management’s Discussion and Analysis of Financial Condition and Results of Operations,” describe examples of risks, uncertainties and events that may cause our actual results to differ materially from those contained in any forward-looking statement. If one or more of these risks or uncertainties materialize, or if underlying assumptions prove incorrect, actual outcomes may vary materially from those included in this Form 10-K.
Risks Related to Our Business
If our security measures are breached, or unauthorized access to our clients’ or their employees’ or potential employees’ sensitive data is otherwise obtained, our solution may not be perceived as being secure, clients may reduce the use of or stop using our solution, our ability to attract new clients may be harmed and we may incur significant liabilities.
Our solution involves the collection, storage and transmission of clients’ and their employees’ and potential employees’ confidential and proprietary information, including personal identifying information, as well as financial and payroll data. HCM software is often targeted in cyber-attacks, including computer viruses, phishing attacks, malicious software programs and other information security breaches, which could result in unauthorized access to or release, gathering, monitoring, misuse, loss or destruction of our or our clients’ sensitive data or otherwise disrupt our or our clients’ business operations. If threat actors are able to circumvent our security measures and we are unable to detect or contain such intrusion into our system, our or our clients’ sensitive data (including client employees’ personal data) may be compromised. Further, in order to provide our services, certain of our employees have access to sensitive information about our clients’ employees. While we conduct background checks of our employees and limit access to systems and data, it is possible that one or more of these individuals may circumvent these controls, resulting in a security breach.
In certain limited circumstances, we utilize relationships with third parties to aid in data management and transaction processing. Certain third parties with which we do business have been subject to cyber-attacks, one of which resulted in unauthorized access to data of certain Company clients and their employees as well as Company data and employee records. These third parties may be sources of cybersecurity or other technological risks in the future, including operational errors, system interruptions or breaches, unauthorized disclosure of confidential information and misuse of intellectual property. Even without a direct breach of our systems, cyber-attacks on such third-party vendors or on our clients could adversely impact our business and reputation.
Although we have security measures in place to protect client information and prevent data loss and other security breaches, these measures have been in the past and in the future may be breached as a result of third-party action, employee error, third-party or employee malfeasance or otherwise. Globally, cybersecurity attacks are increasing in number and the threat actors are increasingly organized and well financed, or at times supported by state actors. In addition, geopolitical tensions or conflicts, such as Russia’s invasion of Ukraine, the ongoing conflict between Israel and Hamas, or increasing tension with China, may create a heightened risk of cybersecurity attacks. Because the techniques used to obtain unauthorized access or to sabotage systems change frequently, we may not be able to anticipate these techniques and implement adequate preventative or protective measures. While we currently maintain a cyber liability insurance policy, cyber liability insurance may be inadequate or may not be available in the future on acceptable terms, or at all. In addition, our cyber liability insurance policy may cover only a portion of losses incurred in investigating or remediating an incident, if at all, and may not cover all claims made against us. Undergoing a government investigation or defending a lawsuit, regardless of merit, could be costly and divert management’s attention from our business and operations.
Any actual or perceived breach of our security could damage our reputation, cause existing clients to discontinue the use of our solution, prevent us from attracting new clients, or subject us to third-party lawsuits, regulatory investigations and fines or other actions or liabilities, any of which could adversely affect our business, operating results or financial condition.
Any damage, failure or disruption of our SaaS network infrastructure or data centers could impair our ability to effectively provide our solution, harm our reputation and adversely affect our business.
Our SaaS network infrastructure is a critical part of our business operations. Our clients access our solution through standard web browsers, smart phones, tablets and other web-enabled devices and depend on us for fast and reliable access to our solution. We serve all of our clients from our three fully redundant data centers located in Oklahoma and Texas. Our SaaS network infrastructure and data centers are vulnerable to damage, failure and disruption.
In the future, we may experience issues with our computing and communications infrastructure or data centers caused by the following factors:
•telecommunications failures or outages from third-party providers;
•computer viruses or cyber-attacks;
•break-ins or other security breaches;
•acts of terrorism, sabotage, intentional acts of vandalism or other misconduct;
•tornadoes, fires, earthquakes, hurricanes, floods and other natural disasters;
•other unforeseen interruptions or damages.
If our SaaS network infrastructure or our clients’ ability to access our solution is interrupted, client and employee data from recent transactions may be permanently lost, and we could be exposed to significant claims by clients, particularly if the access interruption is associated with problems in the timely delivery of funds payable to employees or tax authorities. Further, any adverse changes in service levels at our data centers resulting from damage to or failure of our data centers could result in disruptions in our services. Any significant instances of system downtime or performance problems at our data centers could negatively affect our reputation and ability to attract new clients, prevent us from gaining new or additional business from our current clients, or cause our current clients to terminate their use of our solution, any of which would adversely impact our revenues. In addition, if our network infrastructure and data centers fail to support increased capacity due to growth in our business, our clients may experience interruptions in the availability of our solution. Such interruptions may reduce our revenues, cause us to issue refunds to clients or adversely affect our retention of existing clients, any of which could have a negative impact on our business, operating results or financial condition.
If we are not able to develop enhancements and new applications, keep pace with technological developments or respond to future disruptive technologies, we might not remain competitive and our business could be adversely affected.
Our continued success will depend on our ability to adapt and innovate. In order to attract new clients and increase revenues from existing clients, we need to enhance, add new features to and improve our existing applications and introduce new applications. The success of any enhancements or new features and applications depends on several factors, including timely completion and introduction and market acceptance. We may expend significant time and resources developing and pursuing sales of a particular enhancement or application that may not result in revenues in the anticipated time frame or at all, or may not result in revenue growth sufficient to offset increased expenses. Further, changing legal and regulatory requirements may delay the development or introduction of enhancements or new applications or render certain of our applications obsolete. If we are unable to successfully develop enhancements, new features or new applications to meet client needs, our business and operating results could be adversely affected.
In addition, because our applications are designed to operate on a variety of network, hardware and software platforms using internet tools and protocols, we must continuously modify and enhance our applications to keep pace with changes in internet-related hardware, software, communication, browser and database technologies. If we are unable to respond in a timely and cost-effective manner to these rapid technological developments, our current and future applications may become less marketable and less competitive or even obsolete.
Our success is also subject to the risk of future disruptive technologies, such as AI and machine learning. The failure to develop enhancements to our applications for, or that incorporate, technologies such as natural language processing, AI, machine learning, and blockchain may impact our ability to increase the efficiency of and reduce costs associated with our clients’ operations. If new technologies emerge that are able to deliver HCM solutions at lower prices, more efficiently or more conveniently, including but not limited to those that incorporate AI or machine learning or are created using AI or machine learning, such technologies could adversely impact our ability to compete. Furthermore, as we continue to use such new technologies in our own solution, developing, testing, and deploying resource-intensive AI systems will require additional investment and may increase our costs. There also may be real or perceived social harm, unfairness, or other outcomes that undermine public confidence in the use and deployment of AI. Any of the foregoing may result in decreased demand for our solution or harm to our business, results of operations or reputation.
The market in which we participate is highly competitive, and if we do not compete effectively, our business, operating results or financial condition could be adversely affected.
The market for HCM software is highly competitive, rapidly evolving and fragmented. If we are unable to compete effectively, our business, operating results or financial condition could be adversely affected. We expect competition to continue to intensify as new technologies and new market entrants emerge and increasingly aggressive pricing strategies persist. Competition in the HCM solutions market is primarily based on service responsiveness, application quality and reputation, breadth of service and product offering, and price. Certain competitors have access to larger clients and major distribution agreements with consultants, software vendors and distributors and a more established global presence than we do. Certain of our competitors have in the past or may in the future:
•adapt more rapidly to new or emerging technologies and changes in client requirements;
•develop superior products or services, gain greater market acceptance and expand their product and service offerings more efficiently or rapidly;
•offer products and services that we may not offer individually or at all, or bundle products and services in a manner that provides them with a price advantage;
•offer products that can be integrated with other software or systems, whereas our single software may not allow for such integration;
•develop and implement control processes that drive internal efficiencies, resulting in a better client experience;
•establish and maintain partnerships with third parties that enhance and expand their product offering to business clients and employees;
•take advantage of acquisition and other opportunities for expansion more readily;
•maintain a lower cost basis;
•secure contractual terms and implement other client retention strategies that increase our costs to acquire new clients;
•adopt more aggressive or desirable pricing policies;
•devote greater resources to the promotion, marketing and sale of their products and services; and
•devote greater resources to the research and development of their products and services.
Our competitors offer HCM solutions that may overlap with one, several or all categories of the applications we offer. We compete with companies such as Automatic Data Processing, Inc., Dayforce, Inc., Cornerstone OnDemand, Inc., Gusto, Inc., Intuit, Inc., Insperity, Inc., Oracle Corporation, Paychex, Inc., Paylocity Holding Corporation, Paycor HCM, Inc., People Center, Inc. d/b/a Rippling, SAP SE, ServiceNow, Inc., Ultimate Kronos Group, Workday, Inc., and other international, national, regional, and local providers. Our competitors provide HCM solutions by various means. Although certain providers continue to deliver legacy enterprise software, many now offer cloud-based solutions, resulting in increased competition for clients seeking the greater flexibility and access to information provided by cloud-based offerings. Furthermore, the HCM industry has experienced an emergence of white label and embedded payroll offerings. The proliferation of white label offerings and products and technologies utilizing embedded payroll systems may adversely affect our competitive position.
In addition, some of our principal competitors offer their products or services at a lower price, which has resulted in pricing pressures. Similarly, some competitors offer different billing terms, which has resulted in pressures on our billing terms. If we are unable to maintain our pricing levels and our billing terms, our operating results would be negatively impacted. In addition, pricing pressures and increased competition generally could hinder our ability to attract and retain clients and could result in reduced sales, reduced margins, losses or the failure of our solution to maintain widespread market acceptance, any of which could adversely affect our business, operating results or financial condition.
Our business depends on our clients’ continued use of our applications, their purchases of additional applications from us and our ability to add new clients. Any decline in our clients’ continued use of our applications or purchases of additional applications could adversely affect our business, operating results or financial condition.
In order for us to maintain or improve our operating results, it is important that our current clients continue to use our applications and purchase additional applications from us, and that we add new clients. Generally, our clients have no obligation to continue to use our applications and have the right to cancel their agreements with us for any or no reason by providing 30 days’ prior written notice. Moreover, from time to time, clients choose not to continue to use our applications at the same or higher level of service, if at all. Our annual revenue retention rate fluctuates as a result of a number of factors, including but not limited to the level of client satisfaction with our applications, pricing, the prices of competing products or services, mergers and acquisitions affecting our client base, reduced hiring by our clients or reductions in our clients’ spending levels. In addition, because our Beti technology is designed to eliminate payroll errors that lead to billable corrections and unscheduled payroll runs, we have experienced and expect to continue to experience a reduction in these activities that would otherwise generate additional revenue for us. If our clients do not continue to use our applications, renew on less favorable terms or fail to purchase additional applications, or if we fail to add new clients, our annual revenue retention rate may decline and our business, operating results or financial condition could be adversely affected.
Our business, operating results or financial condition could be adversely affected if our clients are not satisfied with our deployment or technical support services, or if our solution fails to perform properly.
Our business depends on our ability to satisfy our clients, both with respect to our applications and the technical support provided to help our clients use the applications that address the needs of their businesses. We use our in-house deployment personnel to implement and configure our solution and provide support to our clients. If a client is not satisfied with the quality of our solution, the applications delivered or the support provided, we could incur additional costs to address the situation, our profitability might be negatively affected, and the client’s dissatisfaction with our deployment or support service could harm our ability to sell additional applications to that client. In addition, our sales process is highly dependent on the reputation of our solution and applications and on positive recommendations from our existing clients. Any failure to maintain high-quality technical support, or a market perception that we do not maintain high-quality technical support, could adversely affect client retention, our reputation, our ability to sell our applications to existing and prospective clients, and, as a result, our business, operating results or financial condition.
Further, our solution is inherently complex and may in the future contain, or develop, undetected defects or errors. Any defects in our applications could adversely affect our reputation, impair our ability to sell our applications in the future and result in significant costs to us. The costs incurred in correcting any application defects may be substantial and could adversely affect our business, operating results or financial condition. Any defects in functionality or defects that cause interruptions in the availability of our applications could result in:
•loss or delayed market acceptance and sales of our applications;
•termination of service agreements or loss of clients;
•credits, refunds or other liability to clients, including reimbursements for any fees or penalties assessed by regulatory agencies;
•breach of contract, breach of warranty or indemnification claims against us, which may result in litigation;
•diversion of development and service resources;
•increased scrutiny of our solution from regulatory agencies; and
•injury to our reputation.
Because of the large amount of data that we collect and manage, it is possible that hardware failures or errors in our applications could result in data loss or corruption or cause the information that we collect to be incomplete or contain inaccuracies that our clients regard as significant. Our clients might assert claims against us in the future alleging that they suffered damages due to a defect, error, or other failure of our solution. Our errors and omissions insurance may be inadequate or may not be available in the future on acceptable terms, or at all. In addition, our policy may not cover all claims made against us, and defending a suit, regardless of its merit, could be costly and divert management’s attention. Any failures in the performance of our solution could harm our reputation and our ability to retain existing clients and attract new clients, which would have an adverse impact on our business, operating results or financial condition.
We face challenges related to attracting and retaining larger clients, including demand for customized features, longer sales cycles and less predictability in completing sales.
In some cases, prospective clients, especially larger companies, expect customized features and functions unique to their business processes, or are seeking to integrate our solutions with other products. If we do not meet the demands of such prospective clients, the market for our solution will be more limited and our business could be adversely affected. Furthermore, pursing larger clients may result in a longer sales cycle and, in some cases, we may devote a significant amount of support and service resources to attract and acquire larger prospective clients with no guarantee that these prospective clients will adopt our solution.
We are dependent on the continued service of our key executives and, if we fail to retain such key executives, our business could be adversely affected.
We believe that our success depends in part on the continued services of our key executives, consisting of Chad Richison, Chris Thomas, Craig Boelte, Jason Clark, Brad Smith and Holly Faurot. Our business could be adversely affected if we fail to retain these key executives. Although the employment arrangements of certain of our key executives contain restrictive covenants, our business could nonetheless be adversely affected if a key executive leaves Paycom and interferes with Paycom’s client, employee and/or other business relationships. In addition, we have not purchased key person life insurance on any of our key executives.
If we are unable to attract and retain qualified personnel, including software developers, product managers and skilled IT, sales, marketing and operational personnel, our ability to develop and market new and existing products and, in turn, increase our revenue and profitability could be adversely affected.
Our future success is dependent on our ability to continue to enhance and introduce new applications. As a result, we are heavily dependent on our ability to attract and retain qualified software developers, product managers and IT personnel with the requisite education, background and industry experience. In addition, to continue to execute our growth strategy, we must also attract and retain qualified sales, marketing and operational personnel capable of supporting a larger and more diverse client base. The technology industry is characterized by a high level of employee mobility and aggressive recruiting among competitors, and competition is particularly intense for qualified software developers, product managers and IT personnel. In addition, the nature of the office environment is changing as employers continue to offer various remote or hybrid work arrangements, which can be an important factor in a candidate’s decision on employment. We maintain an office-centric operational model. Certain companies with which we compete for talent offer work arrangements more flexible than ours, which may impact our ability to attract and retain qualified personnel if potential or current employees prefer such policies.
The competition for qualified personnel also may be amplified by new immigration laws or policies that could limit software companies’ ability to recruit internationally. Although we would not expect such changes in immigration laws or policies to have a significant direct impact on our workforce, the ensuing increase in demand for software developers and IT personnel could impair our ability to attract or retain skilled employees and/or significantly increase our costs to do so. Furthermore, identifying and recruiting qualified personnel and training them in the use of our applications requires significant time, expense and attention, and it can take a
substantial amount of time before our employees are fully trained and productive. The loss of the services of a significant number of employees could be disruptive to our development efforts, which may adversely affect our business by causing us to lose clients, increase operating expenses or divert management’s attention to recruit replacements for the departed employees.
Our business and operations are experiencing rapid growth and organizational change. If we fail to manage such growth and change effectively, we may be unable to execute our business plan, maintain high levels of service or adequately address competitive challenges.
We have experienced, and may continue to experience, rapid growth in our headcount and operations, which has placed, and may continue to place, significant demands on our management, operational and financial resources. We have also experienced significant growth in the number of clients and transactions and the amount of client and employee data that our infrastructure supports. As a result, our organizational structure and recording systems and procedures are becoming more complex as we improve our operational, financial and management controls. Our success depends, in part, on our ability to manage this growth and organizational change effectively. Moreover, our international expansion efforts are exacerbating many of these challenges. To manage the expected growth of our headcount and operations, we must continue to improve our operational, financial and management controls and our reporting systems and procedures. The failure to effectively manage growth could result in (i) declines in the quality of, or client satisfaction with, our applications or service delivery, (ii) increases in costs, (iii) difficulties or delays in introducing new applications or (iv) other operational difficulties, any of which could adversely affect our business by impairing our ability to retain and attract clients or sell additional applications to our existing clients.
Further, we need to continue to expand our sales force and support team members in order to grow our client base and increase our revenues. Our ability to expand our sales force may be constrained by the willingness and availability of qualified personnel to staff and manage new offices and our success in recruiting and training sales personnel. If our expansion efforts are unsuccessful, our business, operating results or financial condition could be adversely affected.
The failure to develop and maintain our brand cost-effectively could have an adverse effect on our business.
We believe that developing and maintaining widespread awareness of our brand in a cost-effective manner is critical to achieving widespread acceptance of our solution and is an important element in attracting new clients and retaining existing clients. Successful promotion of our brand depends largely on the effectiveness of our marketing efforts and on our ability to provide reliable and useful applications at competitive prices. Brand promotion activities, including increased spending on our national media campaigns, may not yield increased revenues, and even if they do, any increased revenues may not offset the expenses incurred in building our brand. If we fail to successfully promote and maintain our brand, or incur substantial expenses in an unsuccessful attempt to promote and maintain our brand, we may fail to attract enough new clients or retain our existing clients to the extent necessary to realize a sufficient return on our brand-building efforts, which could have an adverse effect on our business.
As we continue to enhance our solution to serve clients located outside of the United States, our business is subject to risks associated with international operations.
An element of our growth strategy is to expand our operations and client base and we have recently begun to expand our operations into markets outside of the United States. Launching into international markets and doing business internationally involves a number of risks, including but not limited to:
•multiple, conflicting and changing laws and regulations such as privacy regulations, tax laws, export and import restrictions, employment laws, regulatory requirements and other governmental approvals, permits, and licenses;
•failure to obtain and maintain regulatory approvals for the use of our products in various countries;
•lack of brand recognition, including greater brand recognition of local or other global competitors who have more established operations in the markets we are seeking to enter;
•lack of familiarity with local, regional or national politics, culture, economics, market conditions and commerce;
•complexities and difficulties in obtaining protection for and enforcing our intellectual property rights;
•difficulties in staffing and managing foreign operations;
•financial risks, such as the impact of local and regional financial crises on demand for our products and exposure to foreign currency exchange rate fluctuations;
•natural disasters, political and economic instability, including wars, terrorism and political unrest, outbreak of disease, boycotts, curtailment of trade and other business restrictions;
•certain expenses including, among others, expenses for travel, translation and insurance; and
•regulatory and compliance risks that relate to maintaining accurate information and control over sales and activities that may fall within the purview of the U.S. Foreign Corrupt Practices Act, its books and records provisions or its anti-bribery provisions.
Our expansion into international markets requires significant resources and management attention and subjects us to regulatory, economic and political risks that differ from those in the United States. Because of our inexperience with international operations, we
cannot ensure that our expansion into international markets will be successful, and the impact of such expansion may adversely affect our business, operating results or financial condition.
Our business depends in part on the success of our relationships with third parties.
We rely on third-party couriers to deliver payroll checks and tax forms and on financial and accounting processing systems and various financial institutions to perform financial services in connection with our applications, such as providing automated clearing house (“ACH”) and wire transfers as part of our payroll and tax payment services and facilitating our Vault Visa Payroll Card. We also rely on third parties to provide technology and content support, manufacture time clocks and process background checks. We anticipate that we will continue to depend on various third-party relationships in order to provide these and other services. Identifying, negotiating and documenting relationships with these third parties and integrating third-party content and technology requires significant time and resources. Our agreements with third parties typically are non-exclusive and do not prohibit them from working with our competitors. In addition, these third parties may not perform as expected under our agreements, which could hinder our ability to deliver certain services to our clients and negatively affect our brand and reputation. A global economic slowdown could also adversely affect the businesses of our third-party providers, hindering their ability to provide the services on which we rely. If we are unsuccessful in establishing or maintaining our relationships with these third parties, our ability to compete in the marketplace or to grow our revenues could be impaired and our business, operating results or financial condition could be adversely affected. Furthermore, due to our dependence on financial institutions for certain services, a systemic shutdown of the banking industry or a disruption of the Federal Reserve Bank’s services, including ACH processing, would impede our ability to provide our payroll and expense reimbursement services by delaying direct deposits and other financial transactions across the United States and could have an adverse impact on our financial results and liquidity.
We employ third-party licensed software for use in our applications and the inability to maintain these licenses or errors in the software we license could result in increased costs or reduced service levels, which could adversely affect our business.
Our applications incorporate certain third-party software obtained under licenses from other companies. For example, we rely on third-party software to support our background checks application. We anticipate that we will continue to rely on third-party software and development tools from third parties in the future. If the third-party software we currently license becomes unavailable, we may be unable to identify commercially reasonable alternatives without significant cost or difficulty, or available alternatives may not meet our internal cybersecurity requirements. In addition, incorporating the software used in our applications with new third-party software may require significant work and substantial investment of our time and resources. Also, to the extent that our applications depend upon the successful operation of third-party software in conjunction with our software, any undetected errors or defects in this third-party software could prevent the deployment or impair the functionality of our applications, delay new application introductions, result in a failure of our applications and harm our reputation.
If we fail to adequately protect our proprietary rights, our competitive advantage could be impaired and we may lose valuable assets, generate reduced revenues or incur costly litigation to protect our rights.
Our success is dependent in part upon our intellectual property. We rely on a combination of copyrights, trademarks, service marks, trade secret laws and contractual restrictions to establish and to protect our intellectual property rights in the United States and in foreign jurisdictions. However, the steps we take to protect our intellectual property may be inadequate. We will not be able to protect our intellectual property if we are unable to enforce our rights or if we do not detect unauthorized use of our intellectual property. Despite our precautions, it may be possible for unauthorized third parties to copy our applications and use information that we regard as proprietary to create products or services that compete with ours.
We may be required to spend significant resources to monitor and protect our intellectual property. We have been involved in litigation in the past and litigation may be necessary in the future to protect and enforce our intellectual property rights and to protect our trade secrets. Such litigation could be costly, time-consuming and distracting to management and could result in the impairment or loss of portions of our intellectual property. Furthermore, our efforts to enforce our intellectual property rights may be met with defenses, counterclaims and countersuits attacking the validity and enforceability of our intellectual property rights. We may not be able to secure, protect and enforce our intellectual property rights or control access to, and the distribution of, our solution and proprietary information, which could adversely affect our business.
We may be sued by third parties for alleged infringement of their proprietary rights.
Considerable intellectual property development activity exists in our industry, and we expect that companies will increasingly be subject to infringement claims as the number of applications and competitors grows and the functionality of applications in different industry segments overlaps. Our competitors, as well as a number of other entities and individuals, may own or claim to own intellectual property in technology areas relating to our solution or applications. In addition, we may increasingly be subject to trademark infringement claims as our presence grows in the marketplace. From time to time, third parties have asserted and may in the future assert that we are infringing on their intellectual property rights, and we may be found to be infringing upon such rights. A claim of infringement may also be made relating to technology that we acquire or license from third parties. However, we may be
unaware of the intellectual property rights of others that may cover, or may be alleged to cover, some or all of our solution, applications or brands.
The outcome of litigation is inherently unpredictable and, as a result, any future litigation or claim of infringement could (i) cause us to enter into an unfavorable royalty or license agreement, pay ongoing royalties or require that we comply with other unfavorable terms, (ii) require us to discontinue the sale of our solution or applications, (iii) require us to indemnify our clients or third-party service providers or (iv) require us to expend additional development resources to redesign our solution or applications. Any of these outcomes could harm our business. Even if we were to prevail, any litigation regarding our intellectual property could be costly and time consuming and divert the attention of our management and key personnel from our business and operations.
The use of open source software in our applications may expose us to additional risks and harm our intellectual property rights.
Some of our applications use software covered by open source licenses. From time to time, there have been claims challenging the ownership or use of certain types of open source software against companies that incorporate such software into their products or applications. As a result, we could be subject to suits by parties claiming ownership of what we believe to be open source software. Litigation could be costly for us to defend, have a negative effect on our operating results and financial condition or require us to devote additional development resources to change our applications. In addition, if we were to combine our applications with open source software in a certain manner, we could, under certain types of open source licenses, be required to release the source code of our applications. If we inappropriately use open source software, we may be required to redesign our applications, discontinue the sale of our applications or take other remedial actions, which could adversely impact our business, operating results or financial condition.
We may acquire other businesses, applications or technologies, which could divert our management’s attention, result in additional dilution to our stockholders and otherwise disrupt our operations and harm our operating results.
In the future, we may seek to acquire or invest in businesses, applications or technologies that we believe complement or expand our applications, enhance our technical capabilities or otherwise offer growth opportunities. The pursuit of potential acquisitions may divert the attention of management and cause us to incur expenses in identifying, investigating and pursuing suitable acquisitions, whether or not they are ultimately consummated.
We do not have any experience in acquiring other businesses. If we acquire additional businesses, we may not be able to integrate the acquired personnel, operations and technologies successfully or to effectively manage the combined business following the acquisition. We also may not achieve the anticipated benefits from the acquired business due to a number of factors, including:
•the inability to integrate or benefit from acquired applications or services in a profitable manner;
•unanticipated costs or liabilities associated with the acquisition;
•the incurrence of acquisition-related costs;
•difficulty integrating the accounting systems, operations and personnel of the acquired business;
•difficulty and additional expenses associated with supporting legacy products and hosting infrastructure of the acquired business;
•difficulty converting the clients of the acquired business onto our solution, including disparities in the revenues, licensing, support or services of the acquired company;
•diversion of management’s attention from other business concerns;
•harm to our existing relationships with clients as a result of the acquisition;
•the potential loss of key employees;
•the use of resources that are needed in other parts of our business; and
•the use of substantial portions of our available cash to consummate the acquisition.
In addition, a significant portion of the purchase price of any companies we acquire may be allocated to acquired goodwill and other intangible assets, which must be assessed for impairment at least annually. In the future, if our acquisitions do not yield expected returns, we may be required to take charges to our operating results based on this impairment assessment process, which could harm our results of operations. Acquisitions could also result in the incurrence of debt or issuances of equity securities, which would result in dilution to our stockholders.
Legal and Regulatory Risks
Changes in laws, government regulations and policies could have a material adverse effect on our business and results of operations.
Many of our applications are designed to assist our clients in complying with government regulations that continually change. The introduction of new regulatory requirements, or new interpretations of existing laws or regulations, could increase our cost of doing business, decrease our revenues and net income or require us to make changes to our applications. Moreover, changing regulatory requirements may make the introduction of new applications and enhancements more costly or more time-consuming than we currently anticipate or could prevent the introduction of new applications and enhancements by us altogether.
For example, a change in tax laws and regulations resulting in a decrease in the amount of taxes required to be withheld or accelerating the deadline to remit taxes to appropriate tax agencies would adversely impact our average balance of funds held for clients and, as a result, adversely impact the interest income we earn on such funds during the period between receipt and disbursement. Changes in laws, regulations or policies could also affect the extent and type of benefits employers are required, or may choose, to provide employees or the amount and type of taxes employers and employees are required to pay. Such changes could reduce or eliminate the need for certain of our existing applications or services, which would result in decreased revenues. For example, we generate ACA-related revenues (i) on an annual basis in connection with processing and filing Forms 1094 and 1095 on behalf of clients and (ii) from clients who have purchased our Enhanced ACA application as part of the fixed, bundled price charged per billing period. If the ACA is modified to eliminate the employer reporting requirements, or if the ACA is repealed and replaced with new legislation that does not include similar employer reporting requirements, we will no longer generate revenues in connection with processing and filing Forms 1094 and 1095 on behalf of clients. While we generally do not track our revenues on an application-by-application basis (because applications are often sold in various groupings and configurations for a single price), we estimate that, if the ACA is not modified or repealed, revenues from our Enhanced ACA application and ACA forms filings business will represent approximately 2% of total projected revenues for the year ending December 31, 2024.
Further, we may spend time and money developing new applications and enhancements that, due to regulatory changes, become unnecessary prior to being released. In addition, any failure to educate and assist our clients with respect to new or revised legislation that impacts them could have an adverse effect on our reputation, and any failure to modify our applications or develop new applications in a timely fashion in response to regulatory changes could have an adverse effect on our business and results of operations. Additionally, new regulations or changes to existing regulations could be unclear, difficult to interpret or conflict with other applicable regulations. Our or our clients’ failure to comply with new or modified laws or regulations could result in financial penalties, legal proceedings or reputational harm. Finally, a negative audit or other investigations by the U.S. Government could adversely affect our ability to receive U.S. Government contracts and our future operating performance, and could result in financial or reputational harm.
In addition, federal, state and foreign government bodies or agencies have in the past adopted, and may in the future adopt, laws or regulations affecting the use of the internet as a commercial medium. Changes in these laws or regulations could require us to modify our applications. Further, government agencies or private organizations may impose taxes, fees or other charges for accessing the internet or commerce conducted via the internet. These laws or charges could limit the growth of internet-related commerce or communications generally or could result in reductions in the demand for internet-based applications such as ours.
Failure to comply with privacy, data protection and cybersecurity laws and regulations could have a materially adverse effect on our reputation, results of operations or financial condition, or have other adverse consequences.
Our applications and services are subject to various complex laws and regulations on the federal, state, local, and foreign levels, including those governing data security and privacy, which have become significant issues globally. The regulatory framework for privacy issues is rapidly evolving and is likely to remain uncertain for the foreseeable future. Many federal, state and foreign government bodies and agencies have adopted or are considering adopting laws and regulations regarding the collection, use and disclosure of personal information. In the United States, these include numerous state-level consumer privacy laws, beginning with California’s CCPA, the IBIPA, rules and regulations promulgated under the authority of the Federal Trade Commission, the Health Insurance Portability and Accountability Act of 1996, the Family Medical Leave Act of 1993, the ACA, the Financial Services Modernization Act of 1999 (the “GLBA”), federal and state labor and employment laws, state data breach notification laws, and state cybersecurity laws, such as the New York Stop Hacks and Improve Electronic Data Security (SHIELD) Act. As we expand our operations outside the United States, our applications and services are or will be subject to additional laws governing data security and privacy in relevant jurisdictions, such as Canada’s PIPEDA and Mexico’s Federal Law on the Protection of Personal Data held by Private Parties, as well as the GDPR, which is applicable in the European Economic Area and the United Kingdom.
The CCPA provides California consumers with a private right of action if covered companies suffer a data breach related to their failure to implement reasonable security measures. The CCPA and other state-level consumer privacy laws give consumers located in those states certain rights to be informed of, opt-out of, and request deletion of the personal information that we hold, similar to those rights provided by the European Union’s GDPR. The IBIPA includes a private right of action for persons who are aggrieved by violations of the IBIPA. The GLBA is enforced under the authority of the Federal Trade Commission and requires our payment card services to adhere to a privacy notice and take certain measures to protect related personal information from unauthorized use and threats to data security. Because some of our clients are located in Mexico and other clients have establishments internationally, Canada’s PIPEDA, Mexico’s Federal Law on the Protection of Personal Data, and other foreign data privacy laws, such as the GDPR, may impact our processing of certain client and employee information. Failure to comply with data protection and privacy laws and regulations could result in regulatory scrutiny and increased exposure to the risk of litigation or the imposition of consent orders or civil and criminal penalties, including fines, which could have an adverse effect on our results of operations or financial condition. Moreover, allegations of non-compliance, whether or not true, could be costly, time consuming, distracting to management, and cause reputational harm.
The landscape of privacy laws applicable to our various products and services is evolving quickly. The California Privacy Rights Act (“CPRA”), which expands upon the CCPA, went into effect in 2023. Virginia, Colorado, Connecticut and Utah recently enacted their own consumer data privacy statutes, many of which are modeled on the CCPA. New data privacy statutes are slated to go into effect later this year in Delaware, Indiana, Iowa, Montana, Oregon, Tennessee, and Texas. In addition, there are a number of other legislative proposals worldwide, including in the United States at both the federal and state level, that could impose additional and potentially conflicting obligations in areas affecting our business. Newly-passed legislative and regulatory initiatives may adversely affect the ability of our clients to process, handle, store, use and transmit demographic and personal information from their employees, which could reduce demand for our solution.
In addition to government regulation, privacy advocates and industry groups may propose and adopt new and different self-regulatory standards. Because the interpretation and application of many privacy and data protection laws are still uncertain, it is possible that these laws may be interpreted and applied in a manner that is inconsistent with our existing data management practices or the features of our solution. Any failure to comply with government regulations that apply to our applications, including privacy and data protection laws, could subject us to liability. In addition to the possibility of fines, lawsuits and other claims, we could be required to fundamentally change our business activities and practices or modify our solution, which could have an adverse effect on our business, operating results or financial condition. Any inability to adequately address privacy concerns and claims, even if unfounded, or inability to comply with applicable privacy or data protection laws, regulations and policies, could result in additional cost and liability to us, damage to our reputation, reductions in our sales and other adverse effects on our business, operating results or financial condition.
Furthermore, privacy concerns may cause our clients’ employees to resist providing the personal data necessary to allow our clients and their employees to use our applications and services effectively. Even the perception of privacy concerns, whether or not valid, may inhibit market adoption of our applications and services in certain industries.
Certain of our products and services use data-driven insights to help our clients manage their businesses more efficiently. We believe that providing insights from aggregated data, including those insights derived from generative AI and machine learning, will become increasingly important to the value that our solutions and services deliver to our customers. Known risks of generative AI currently include accuracy, bias, privacy, security and data provenance. Regulatory and legislative authorities in the United States and the European Union have enacted or proposed legislation that imposes or would impose restrictions on the development of generative AI and machine learning. Our ability to provide data-driven insights using generative AI or machine learning may be constrained by current or future regulatory requirements, statutes or ethical considerations that could restrict or impose burdensome and costly requirements on our ability to leverage data in innovative ways. As we continue to pursue such new technologies, our failure to adequately address legal risks relating to the use of generative AI and machine learning in our applications could result in litigation regarding, among other things, intellectual property, privacy, employment, civil rights and other claims that could result in liability for the Company. The use of generative AI and machine learning may also result in new or increased governmental or regulatory scrutiny. Any actual or alleged noncompliance with applicable laws and regulations, or failure to meet client expectations with respect to the use of generative AI and machine learning, could result in negative publicity or harm to our reputation and subject us to investigations, claims or other remedies, and expose us to significant fines, penalties and other damages.
The adoption of new, or adverse interpretations of existing U.S. state, U.S. federal, or foreign money transmitter, money services business, or payment services statutes or regulations could subject us to additional regulation and related expenses and require changes to our business.
The adoption of new money transmitter, money services business, or payment services statutes or regulations in jurisdictions, changes in regulators’ interpretation of existing U.S. state, U.S. federal, or foreign money transmitter, money services business, or payments services statutes or regulations, or disagreements by regulatory authorities with our interpretation of such statutes or regulations, have subjected us to registration or licensing and could limit business activities until we are appropriately licensed. These occurrences could also require changes to the manner in which we conduct certain aspects of our business or invest client funds, which could adversely impact the amount of interest income we receive from investing client funds before such funds are remitted to the appropriate taxing authorities and accounts designated by our clients.
While we maintain that we are not a money services business or money transmitter in the United States and other jurisdictions, our operations in certain states and countries are or may be subject to anti-money laundering (“AML”) laws and regulations that require money services business or payment service business to, among other things, develop and implement risk-based anti-money laundering programs, report suspicious activity, and maintain transaction records. We have adopted an anti-money laundering compliance program to mitigate the risk of our application being used for illegal or illicit activity and to help detect and prevent fraud. Our AML compliance program is designed to foster trust in our application and services. Any violation of applicable AML laws or regulations could limit certain of our business activities until they are satisfactorily remediated and could result in civil and criminal penalties, including fines, which could damage our reputation and have a materially adverse effect on our results of operations and financial condition.
We are registered as a “money services business” in multiple jurisdictions and intend to apply for money services business or payment services licenses in other jurisdictions as applicable. Should other U.S. state, U.S. federal, or foreign regulators make a determination that we have operated as an unlicensed money services business, money transmitter, or payment services provider, we could be subject to civil and criminal fines, penalties, costs of registration, legal fees, reputational damage or other negative consequences, all of which may have an adverse effect on our business operating results or financial condition.
Further, bank regulators continue to impose additional and stricter requirements on banks to ensure they are meeting their Bank Secrecy Act/USA PATRIOT Act obligations, and banks are increasingly viewing money services businesses and third-party senders to be higher risk customers for money laundering. Thus, our banking partners that assist in processing our money movement transactions may limit the scope of services they provide to us or may impose additional material requirements on us. These regulatory restrictions on banks and changes to banks’ internal risk-based policies and procedures may result in a decrease in the number of banks willing to do business with us, may require us to materially change the manner in which we conduct some aspects of our business, may decrease our revenues and earnings and could have a material adverse effect on our results of operations or financial condition.
Adverse tax laws or regulations could be enacted or existing laws could be applied to us or our clients, which could increase the costs of our solution and applications and could adversely affect our business, operating results or financial condition.
As a vendor of services, we are ordinarily held responsible by taxing authorities for collecting and paying any applicable sales or other similar taxes. Additionally, the application of federal, state and local tax laws to services provided electronically like ours is evolving. New income, sales, use or other tax laws, statutes, rules, regulations or ordinances could be enacted at any time (possibly with retroactive effect), and could be applied solely or disproportionately to services and applications provided over the internet. These enactments could adversely affect our sales activity, due to the inherent cost increase the taxes would represent, and ultimately could adversely affect our business, operating results or financial condition.
Each state has different rules and regulations governing sales and use taxes, and these rules and regulations are subject to varying interpretations that change over time. We review these rules and regulations periodically and, when we believe we are subject to sales and use taxes in a particular state, we may voluntarily engage state tax authorities in order to determine how to comply with that state’s rules and regulations. We cannot ensure that we will not be subject to sales and use taxes or related penalties for past sales in states where we currently believe no such taxes are required.
In addition, existing tax laws, statutes, rules, regulations or ordinances could be interpreted, changed, modified or applied adversely to us (possibly with retroactive effect), which could require us or our clients to pay additional tax amounts, as well as require us or our clients to pay fines or penalties and substantial interest for past amounts. If we are unsuccessful in collecting such taxes from our clients, we could be held liable for such costs, thereby adversely affecting our business, operating results or financial condition. Additionally, the imposition of such taxes on us would effectively increase the cost of our software and services we provide to clients and would likely have a negative impact on our ability to retain existing clients or to gain new clients in the jurisdictions in which such taxes are imposed.
Compliance with employment-related laws and regulations could increase our cost of doing business and violations of such laws and regulations could subject us to fines and lawsuits.
Our operations are subject to a variety of federal, state, local and international employment-related laws and regulations, including, but not limited to, the U.S. Fair Labor Standards Act, which governs such matters as minimum wages, the Family Medical Leave Act, overtime pay, compensable time, recordkeeping and other working conditions, Title VII of the Civil Rights Act, the Employee Retirement Income Security Act, the Americans with Disabilities Act, the National Labor Relations Act, regulations of the Equal Employment Opportunity Commission, regulations of the Office of Civil Rights, regulations of the Department of Labor, regulations of state attorneys general, federal and state wage and hour laws, and a variety of similar laws enacted by the federal and state governments that govern these and other employment-related matters. As our employees are located in a number of states and we are beginning to hire internationally, compliance with evolving laws and regulations could substantially increase our cost of doing business. In recent years, companies have been subject to lawsuits, including class action lawsuits, alleging violations of federal and state law regarding workplace and employment matters, overtime wage policies, discrimination and similar matters, some of which have resulted in the payment of meaningful damages by the defendants. Similar lawsuits may be threatened or instituted against us from time to time, and we may incur damages and expenses resulting from lawsuits of this type, which could have a material adverse effect on our business, financial condition or results of operations. We are currently subject to employee-related legal proceedings in the ordinary course of business. While we believe that we have adequate reserves for those losses that we believe are probable and can be reasonably estimated, the ultimate results of legal proceedings and claims cannot be predicted with certainty.
While none of our employees are currently represented by a union, our employees have the right under the National Labor Relations Act to form or affiliate with a union. If a significant portion of our employees were to become unionized, our labor costs could increase and our business could be negatively affected by other requirements and expectations that could increase our costs, change our employee culture, impact corporate flexibility and disrupt our business. Additionally, our responses to any union
organizing efforts could negatively impact perception of our brand and have adverse effects on our business, including on our financial results. These responses could also expose us to legal risk, causing us to incur costs related to defending legal and regulatory actions, potential penalties and restrictions or reputational harm.
Our background check business is subject to significant governmental regulation, and changes in law or regulation, or a failure to correctly identify, interpret, comply with and reconcile the laws and regulations to which it is subject, could materially adversely affect our revenue or profitability.
We offer a background screening application called Enhanced Background Checks. In the course of providing background checks, we search and report public and non-public consumer information and records, including criminal records, employment and education history, credit history, driving records and drug screening results. Consequently, we are subject to extensive, evolving and often complex laws and governmental regulations, such as the Fair Credit Reporting Act (the “FCRA”), the Drivers’ Privacy Protection Act, state consumer reporting agency laws, state licensing and registration requirements, and various other foreign, federal, state and local laws and regulations. These laws and regulations set forth restrictions and process requirements concerning what may be reported about an individual, when, to whom, and for what purposes, and how the subjects of background checks are to be treated. Compliance with these laws and regulations requires significant expense and resources, which could increase significantly as these laws and regulations evolve. Such increase in restrictions and compliance costs could negatively affect our ability to provide other services expected by our clients and adversely affect our offerings and revenue.
Changes in law, regulation, or administrative enforcement and interpretations or other limitations and prohibitions related to the provision of consumer information and records could materially adversely affect our revenue and profitability. For example, numerous state and local authorities have implemented “ban the box” and “fair chance” hiring laws that limit or prohibit employers from inquiring or using a candidate’s criminal history to make employment decisions and many of these authorities have in recent years amended these laws to increase the restrictions on the use of such information. In addition, redaction of personal identifying information in criminal records (such as date of birth), and court rules or lawsuits that limit or restrict access to identifiers in criminal records, may negatively impact our ability to perform complete criminal background checks. The enactment of new restrictive legislation and the requirements, restrictions, and limitations imposed by changing interpretations and court decisions on such laws and regulations could prevent our customers from using the full functionality of our background screening application, which may reduce demand for such solution.
We could face liability from our background check services and the information we report or fail to report in our background checks, which may not be covered, in whole or in part, by insurance.
We face potential liability from individuals, classes of individuals, clients or regulatory bodies for claims based on the nature, content or accuracy of our background check services and the information we use and report. Our potential exposure to lawsuits or government investigations may increase depending in part on our clients’ compliance with these laws and regulations and applicable employment laws in their procurement and use of our background checks as part of their hiring process, which is generally outside of our control. Our potential liability includes claims of non-compliance with the FCRA, U.S. state consumer reporting agency laws or regulations, foreign regulations or applicable employment laws, as well as other claims of defamation, invasion of privacy, negligence, copyright, patent or trademark infringement. In some cases we may be subject to strict liability.
We also face potential liability from our clients, and possibly third parties, in the event we fail to report information, particularly criminal records or other potentially negative information, or wrongly report such information. From time to time, we have been subject to claims and lawsuits by current and potential employees of our clients, alleging that we provided to our clients inaccurate or improper information that negatively affected the clients’ hiring decisions. Although the resolutions of these lawsuits have not had a material adverse effect on us to date, the costs of such claims, including settlement amounts or punitive damages, could be material in the future, could cause adverse publicity and reputational damage, could divert the attention of our management, could subject us to equitable remedies relating to the operation of our business and provision of services and result in significant legal expenses, all of which could have a material adverse effect on our business, financial condition and results of operations and adverse publicity, and could result in the loss of existing clients and make it difficult to attract new clients. Insurance may not be adequate to cover us for all risks to which we are exposed or may not be available to cover these claims at all. Any imposition of liability, particularly liability that is not covered by insurance or is in excess of our insurance coverage, could have a material adverse effect on our business, financial condition or results of operations. Additionally, we cannot be certain that our insurance coverage, including any applicable deductibles, copays and other policy limits, will continue to be available to us at a reasonable cost or will be adequate to cover any claims or lawsuits we may face in the future or that we will be able to renew our insurance policies on favorable terms, or at all.
Industry and Financial Risks
Our financial results may fluctuate due to many factors, some of which may be beyond our control.
Our results of operations, including our revenues, costs of revenues, administrative expenses, operating income, cash flow and deferred revenue, may vary significantly in the future, and the results of any one period should not be relied upon as an indication of
future performance. Fluctuations in our financial results may negatively impact the value of our common stock. Our financial results may fluctuate as a result of a variety of factors, many of which are outside of our control, and as a result, may not fully reflect the underlying performance of our business. Factors that may cause our financial results to fluctuate from period to period include, without limitation:
•our ability to attract new clients or sell additional applications to our existing clients;
•the number of new clients and their employees, as compared to the number of existing clients and their employees in a particular period;
•the mix of clients between small, mid-sized and large organizations;
•the extent to which we retain existing clients and the expansion or contraction of our relationships with them;
•the mix of applications sold during a period;
•changes in our pricing policies or those of our competitors;
•seasonal factors affecting payroll processing, demand for our applications or potential clients’ purchasing decisions;
•the amount and timing of operating expenses, including those related to the maintenance and expansion of our business, operations and infrastructure;
•the timing and success of new applications introduced by us and the timing of expenses related to the development of new applications and technologies;
•the timing and success of current and new competitive products and services offered by our competitors;
•economic conditions affecting our clients, including their ability to outsource HCM solutions and hire employees;
•changes in laws, regulations or policies affecting our clients’ legal obligations and, as a result, demand for certain applications;
•changes in the competitive dynamics of our industry, including consolidation among competitors or clients;
•our ability to manage our existing business and future growth, including expenses related to our data centers and the expansion of such data centers and the addition of new offices;
•the effects and expenses of acquisition of third-party technologies or businesses and any potential future charges for impairment of goodwill resulting from those acquisitions;
•business disruptions caused by widespread public health crises (such as the COVID-19 pandemic), natural disasters, such as tornadoes, hurricanes, fires, earthquakes and floods (including as a result of climate change), acts of war, terrorism, or other catastrophic events;
•network outages or security breaches; and
•general economic, industry and market conditions.
Certain of our operating results and financial metrics may be difficult to predict as a result of seasonality.
We have historically experienced seasonality in our revenues. A significant portion of our recurring revenues relate to the annual processing of payroll tax filing forms such as Form W-2 and Form 1099 and the annual processing and filing of ACA-related forms. These forms are typically processed in the first quarter of the year and, as a result, positively impact first quarter recurring revenues. In addition, unscheduled payroll runs at the end of the year (such as bonuses) have a positive impact on our recurring revenues in the fourth quarter. Although we expect the magnitude of seasonal fluctuations in our revenues to decrease in the future to the extent clients utilize more of our non-payroll applications, seasonal fluctuations in certain of our operating results and financial metrics may make such results and metrics difficult to predict.
We are subject to certain operating and financial covenants that may restrict our business and financing activities and may adversely affect our cash flow and our ability to operate our business.
We maintain a senior secured revolving credit facility (the “Revolving Credit Facility”), which can be accessed as needed to supplement our operating cash flow and cash balances. Although we do not currently have any outstanding indebtedness, pursuant to the Credit Agreement (as defined herein) that governs the Revolving Credit Facility, we may not, subject to certain exceptions:
•create or permit the existence of additional liens on our assets;
•change the nature of our business;
•make investments in and acquisitions of (or acquisitions of substantially all of the assets of) any person;
•permit certain fundamental changes, including a merger;
•make any distributions during an event of default, or any other distributions in excess of $50 million in any fiscal year without demonstrating pro forma compliance with certain financial covenants;
•enter into transactions with affiliates other than in the ordinary course of business on an arm’s-length basis;
•enter into certain transactions, including swap agreements and sale and leaseback transactions; or
•pay dividends or distributions of our capital stock.
In addition, we are required to maintain as of the end of each fiscal quarter a consolidated interest coverage ratio of not less than 3.0 to 1.0 and a consolidated leverage ratio of not greater than 3.5 to 1.0, stepping down to 3.25 to 1.0 as of December 31, 2024 and 3.0 to 1.0 as of December 31, 2025, and thereafter. The operating and financial covenants in the Credit Agreement, as well as any future financing agreements that we may enter into, may restrict our ability to finance our operations, engage in business activities or expand or fully pursue our business strategies. If we borrow in the future, we may be required to use a substantial portion of our cash flows to pay principal and interest on our debt, which would reduce the amount of money available for operations, working capital, expansion, or other general corporate purposes.
Our ability to meet our expenses and debt obligations and comply with the operating and financial covenants may be affected by financial, business, economic, regulatory and other factors beyond our control. We may be unable to control many of these factors and comply with these covenants. A breach of any of the covenants under our Credit Agreement could result in an event of default, which could result in the acceleration of any outstanding indebtedness or foreclosure on our assets pledged to secure the indebtedness.
If our goodwill or other intangible assets become impaired, we may be required to record a significant charge to earnings.
We are required to test goodwill for impairment at least annually or earlier if events or changes in circumstances indicate the carrying value may not be recoverable. As of December 31, 2023, we had recorded a total of $51.9 million of goodwill and $50.1 million of other intangible assets, net. An adverse change in domestic or global market conditions, particularly if such change has the effect of changing one of our critical assumptions or estimates made in connection with the impairment testing of goodwill or intangible assets, could result in a change to the estimation of fair value that could result in an impairment charge to our goodwill or other intangible assets. Any such material charges may have a negative impact on our operating results or financial condition.
If we are unable to maintain effective internal control over financial reporting, investors may lose confidence in the accuracy and completeness of our financial reports and the market price of our common stock may be negatively affected.
As a public company, we are required to maintain internal control over financial reporting to provide reasonable assurance regarding the reliability of financial reporting and the preparation of financial statements. Management must evaluate and furnish a report on the effectiveness of our internal control over financial reporting as of the end of each fiscal year, and our auditors must attest to the effectiveness of our internal control over financial reporting.
If we have a material weakness in our internal control over financial reporting, we may not detect errors on a timely basis and our financial statements may be materially misstated. If we identify material weaknesses in our internal control over financial reporting or if our independent registered public accounting firm is unable to express an opinion as to the effectiveness of our internal control over financial reporting, investors may lose confidence in the accuracy and completeness of our financial reports and/or we could become subject to investigations by the New York Stock Exchange (the “NYSE”), the SEC, or other regulatory authorities and the market price of our common stock could be negatively affected.
Our actual operating results may differ significantly from our guidance.
We have released, and may continue to release, guidance in our earnings conference calls, earnings releases, or otherwise, regarding our future performance, which represents our estimates as of the date of release. This guidance, which includes forward-looking statements, has been and will be based on projections prepared by our management. These projections are not prepared with a view toward compliance with published guidelines of the American Institute of Certified Public Accountants, and neither our registered public accountants nor any other independent expert or outside party compiles or examines the projections. Accordingly, no such person expresses any opinion or any other form of assurance with respect to the projections.
Projections are based upon a number of assumptions and estimates that, while presented with numerical specificity, are inherently subject to significant business, economic, and competitive uncertainties and contingencies, many of which are beyond our control. Projections are also based upon specific assumptions with respect to future business decisions, some of which will change. The principal reason that we release guidance is to provide a basis for our management to discuss our business outlook with analysts and investors. We do not accept any responsibility for any projections or reports published by any third parties.
Guidance is necessarily speculative in nature, and it can be expected that some or all of the assumptions underlying the guidance furnished by us will vary significantly from actual results. Accordingly, our guidance is only an estimate of what management believes is realizable as of the date of release. Actual results have in the past, and may in the future, vary from our guidance and the variations may be material. In light of the foregoing, investors are urged not to rely upon our guidance in making an investment decision regarding our common stock.
Any failure to successfully implement our operating strategy or the occurrence of any of the events or circumstances set forth in this “Risk Factors” section in this Form 10-K could result in the actual operating results being different from our guidance, and the differences may be adverse and material.
Our reported financial results may be adversely affected by changes in accounting principles generally accepted in the United States.
Generally accepted accounting principles in the United States are subject to interpretation by the Financial Accounting Standards Board (“FASB”), the SEC and various bodies formed to promulgate and interpret appropriate accounting principles. A change in these principles or interpretations could have a significant effect on our reported financial results and could affect the reporting of transactions completed before the announcement of a change.
Risks Related to Ownership of Our Securities
The issuance of additional stock in connection with acquisitions, our stock incentive plans, warrants or otherwise will dilute all other stockholders.
Our certificate of incorporation authorizes us to issue up to one hundred million shares of common stock and up to ten million shares of preferred stock with such rights and preferences as may be determined by our board of directors. Subject to compliance with applicable rules and regulations, we may issue all of these shares that are not already outstanding without any action or approval by our stockholders. We intend to continue to evaluate strategic acquisitions in the future. We may pay for such acquisitions, in part or in full, through the issuance of additional equity securities.
Any issuance of shares in connection with an acquisition, the exercise of stock options or warrants, the award of shares of restricted stock or otherwise would dilute the percentage ownership held by our existing stockholders.
Anti-takeover provisions in our charter documents and Delaware law may delay or prevent an acquisition of our company.
Our certificate of incorporation, bylaws and Delaware law contain provisions that may have the effect of delaying or preventing a change in control of us or changes in our management. These provisions, alone or together, could delay or prevent hostile takeovers and changes in control or changes in our management.
Any provision of our certificate of incorporation, bylaws or Delaware law that has the effect of delaying or deterring a change in control could limit the opportunity for our stockholders to receive a premium for their shares of our common stock, and could affect the price that some investors are willing to pay for our common stock.
Our certificate of incorporation contains an exclusive forum provision that may discourage lawsuits against us and our directors and officers.
Our certificate of incorporation provides that, unless we consent in writing to the selection of an alternative forum, the Court of Chancery of the State of Delaware (or if no Court of Chancery located within the State of Delaware has jurisdiction, the Federal District Court for the District of Delaware) will be the sole and exclusive forum for any derivative action or proceeding brought on our behalf, any action asserting a claim of breach of fiduciary duty owed by any of our directors, officers or other employees to us or our stockholders, any action asserting a claim against us or any of our directors, officers or other employees arising pursuant to any provision of Delaware law or our certificate of incorporation or our bylaws (as either may be amended from time to time) or any action asserting a claim against us or any of our directors, officers or other employees governed by the internal affairs doctrine. This exclusive forum provision applies to state and federal law claims, although our stockholders will not be deemed to have waived our compliance with the federal securities laws and the rules and regulations thereunder. In addition, this exclusive forum selection provision will not apply to claims under the Exchange Act. Moreover, Section 22 of the Securities Act creates concurrent jurisdiction for federal and state courts over all suits brought to enforce any duty or liability created by the Securities Act or the rules and regulations thereunder. Accordingly, there is uncertainty as to whether a court would enforce our forum selection provision as written in connection with claims arising under the Securities Act. This forum selection provision may limit our stockholders’ ability to obtain a favorable judicial forum for disputes with us. It is also possible that, notwithstanding the forum selection clause included in our certificate of incorporation, a court could rule that such a provision is inapplicable or unenforceable.
We may not continue to pay dividends or to pay dividends at the same rate as announced in May 2023.
Our payment of dividends, as well as the rate at which we pay dividends, are solely at the discretion of our Board of Directors. Further, dividend payments, if any, are subject to our financial results and the availability of statutory surplus. These factors could result in a change to our recently adopted dividend policy.
General Risks
Adverse economic and market conditions could affect our business, operating results or financial condition.
Our business depends on the overall demand for HCM applications and on the economic health of our current and prospective clients. If economic conditions in the United States or in global markets deteriorate, clients may cease their operations, eliminate or reduce unscheduled payroll runs (such as bonuses), reduce headcount, delay or reduce their spending on HCM and other outsourcing services or attempt to renegotiate their contracts with us. In addition, global and regional macroeconomic developments, such as
increased unemployment, decreased income, uncertainty related to future economic activity, reduced access to credit, increased interest rates, inflation, volatility in capital markets, and decreased liquidity, among other possible factors, could negatively affect our ability to conduct business. Furthermore, the impact of such macroeconomic developments may be exacerbated by the COVID-19 pandemic or geopolitical events such as the ongoing military conflict in Ukraine and the ongoing conflict between Israel and Hamas. An economic decline could result in reductions in sales of our applications, decreased revenue from unscheduled payroll runs and fees charged on a per-employee basis, longer sales cycles, slower adoption of new technologies and increased price competition, any of which could adversely affect our business, operating results or financial condition. In addition, HCM spending levels may not increase following any recovery.
Further, as part of our payroll and tax filing application, we collect and then remit client funds to taxing authorities and accounts designated by our clients. During the interval between receipt and disbursement, we typically invest such funds in money market funds, demand deposit accounts, certificates of deposit, U.S. treasury securities and commercial paper. These investments are subject to general market, interest rate, credit and liquidity risks, and such risks may be exacerbated during periods of unusual financial market volatility. Any loss of or inability to access such funds could have an adverse impact on our cash position and results of operations and could require us to obtain additional sources of liquidity, which may not be available on terms that are acceptable to us, if at all. Furthermore, although increased interest rates may have a negative impact on certain clients, increased interest rates have resulted in increased interest earned on funds held for clients and additional income earned on our corporate funds. Changes in interest rates will impact potential earnings of future investments. A stable or rising interest rate environment would sustain the additional interest earned on funds held for clients and interest earned on our corporate funds, whereas a decreasing interest rate environment would compress the additional interest earnings and potentially adversely affect our operating results.
In recent years, there have been several instances when there has been uncertainty regarding the ability of Congress and the President collectively to reach agreement on federal budgetary and spending matters. A period of failure to reach agreement on these matters, particularly if accompanied by an actual or threatened government shutdown, may have an adverse impact on the U.S. economy. Additionally, because certain of our clients rely on government resources to fund their operations, a prolonged government shutdown may affect such clients’ ability to make timely payments to us, which could adversely affect our operations results or financial condition.
None.
Item 1C. Cybersecurity
Risk Management and Strategy
Overview
We recognize that our clients entrust us with highly sensitive data. We also recognize our attendant responsibility to safeguard the accessibility, confidentiality, and integrity of this data. Our information security program consists of policies, procedures, systems, controls and technology designed to help us prevent, identify, detect and mitigate cybersecurity risks. Our processes are informed by cybersecurity events we have observed within the Company, across our industry, and across the cybersecurity landscape. We utilize the risk management framework for risk assessments as defined by the ISO 27001 Information Security Management Standard. We have integrated cybersecurity risk management into our overall risk management framework by conducting annual enterprise risk management assessments and IT risk management assessments, implementing periodic key risk indicator tracking, and holding periodic meetings among multiple department stakeholders to address cybersecurity risks. We review our information security policies at least annually and in connection with certain process changes to ensure that they meet the needs of the organization and the goals and objectives of the information security program.
Prevention, Identification, Detection and Mitigation Activities
We routinely undertake activities to prevent, identify, detect and mitigate risks from cybersecurity threats, including but not limited to the following:
•Procedures and guidelines designed to ensure that information security is a key consideration in the requirements for both new information systems and enhancements to existing systems and assets;
•IT environment risk assessments conducted at regular intervals and in connection with certain events, such as implementation of a new system, service or vendor;
•Tabletop and simulation exercises to discuss roles and responsibilities of team members in the event of a cybersecurity incident and to test and modify the plan as needed;
•Ongoing security penetration testing and threat modeling of our network and web application;
•Automated tools and manual review processes to ensure ongoing compliance with technical standards and identify configuration issues and technical vulnerabilities;
•Encryption of all communications with our servers, which are configured to utilize only high-grade encryption algorithms; and
•Ongoing employee training related to information security and data privacy policies and standards, including periodic phishing, vishing, and social engineering exercises.
We also have implemented and continue to maintain policies, procedures, systems, controls and technology to oversee and identify the cybersecurity risks associated with our use of third-party service providers. For example, we conduct thorough cybersecurity risk assessments of all third-party service providers prior to engagement and ongoing monitoring to ensure compliance with our robust cybersecurity requirements. The monitoring includes periodic audits of third-party systems and vendors. We engage third-party consultants and auditors in connection with assessing, identifying and managing material risks from cybersecurity threats. Our collaboration with these third parties includes independent audits, threat assessments, and consultation on security enhancements.
Infrastructure; Network and Physical Security
Our IT infrastructure is secured and monitored using a number of leading practices and tools across physical and logical security. This security is also continually monitored by our information security department. We strictly regulate and limit all access to servers and networks at each of our facilities. Local network access is restricted by domain authentication, using stringent access control lists. Remote network access is restricted by a defense-in-depth approach that includes redundant firewalls, preventing unauthorized access from external networks to systems within our local network. We also employ (i) network and endpoint intrusion detection, intrusion prevention, and data loss prevention sensors throughout our infrastructure, (ii) systems that monitor our infrastructure and alert our continuously staffed security operations center of potential cybersecurity issues, and (iii) a seasoned process for managing and installing patches for third-party applications.
Incident Response
We maintain plans to address any cybersecurity incidents, including but not limited to Crisis Management Policies and Procedures, an Incident Response Plan, an Information Security Incident Management Policy and a Business Resiliency/Continuity Management Policy. Information security continuity is embedded in our business continuity management system to minimize the risk that continuity operations could result in a compromise to our security standards. We conduct business continuity, crisis communications and disaster recovery exercises at least annually to test and modify the plan, as needed. The activities related to the business continuity management system are routinely reported to executive management as part of our IT security team’s ongoing metrics reporting. In addition, reports related to activities and outcomes are provided to the audit committee on a quarterly basis.
Certifications and Audits
We maintain the following ISO certifications related to our information systems:
•ISO 22301:2019 (standard for implementing and managing an effective business continuity management system);
•ISO/IEC 27001:2013 (security standard for information security management systems, covering our production, quality assurance and implementation environments);
•ISO 27701:2019 (standard for establishing, implementing, maintaining and continually improving a privacy information management system); and
•ISO 9001:2015 (standard for the implementation of quality management processes).
We voluntarily obtain third-party security examinations relating to our internal controls over financial reporting in accordance with SOC 1. Our SOC 1 examination is conducted every six months by one of the four largest independent international auditing firms, and addresses, among other areas, our physical and environmental safeguards for production data centers, data availability and integrity procedures, change management procedures and logical security procedures. We also obtain third-party examinations relating to our internal controls over security and privacy in accordance with SOC 2. Our SOC 2 examination is conducted every year and addresses, among other areas, internal controls around security, availability, processing integrity, confidentiality and privacy. We publish SOC 1 reports semiannually and SOC 2 and SOC 3 reports annually.
Impact of Risks from Cybersecurity Threats
We have experienced cybersecurity incidents in the ordinary course of business and will continue to experience risks from cybersecurity threats that could have a material adverse effect on our business strategy, results of operations, or financial condition. Although prior cybersecurity incidents have not had a material adverse effect on our business strategy, results of operations, or financial condition to date, any actual or perceived breach of our security could damage our reputation, cause existing clients to discontinue the use of our solution, prevent us from attracting new clients, or subject us to third-party lawsuits, regulatory investigations and fines or other actions or liabilities, any of which could materially adversely affect our business strategy, results of operations, or financial condition.
Governance
Both management and the Board of Directors are actively involved in the oversight of risks from cybersecurity threats. Our information security program is designed to ensure that management and the Board of Directors are adequately informed about, and provided with the tools necessary to monitor, (i) material risks from cybersecurity threats and (ii) our efforts related to the prevention, detection, mitigation, and remediation of cybersecurity incidents.
Role of the Board of Directors
The Board of Directors has delegated to the audit committee primary responsibility for overseeing enterprise risk management, including oversight of risks from cybersecurity threats. The audit committee receives quarterly reports and updates from our Chief Information Officer and Executive Vice President of IT and Information Security with respect to cybersecurity risk management. Such reports cover the Company’s information security program, including its current status, capabilities, objectives and plans, as well as the evolving cybersecurity threat landscape.
Role of Management
The Chief Information Officer oversees the activities of our IT and information security teams. Our Chief Information Officer has been with Paycom since 2005 and has more than 30 years of IT and software development experience. The Executive Vice President of IT and Information Security, who reports to our Chief Information Officer, is responsible for ensuring that both new implementations and ongoing operations comply with the policies, procedures, and guidelines of our information security program. Our Executive Vice President of IT and Information Security has been with Paycom for over a decade and has worked in technology development, improvement, infrastructure, and security for over 25 years. The Executive Vice President of IT and Information Security is supported by our Director of IT Security, who has worked in technology development, improvement, infrastructure, and security for over a decade. The Director of IT Security is responsible for the growth and implementation of the information security and data privacy programs and oversees the operations of the information security team. The Director of IT Security also provides oversight for information security and privacy policies and controls, oversees compliance activities, and provides metrics and guidance to executive management regarding the program. The aforementioned leaders and teams have a breadth of experience and manage programs related to governance, risk, and compliance; data privacy and security; vulnerability management; security operations; and application security.
The Chief Information Officer is regularly informed about the latest developments in cybersecurity, including potential threats and innovative risk management techniques. This ongoing knowledge acquisition is crucial for the effective prevention, detection, mitigation, and remediation of cybersecurity incidents. As discussed above, our information systems are routinely reviewed for compliance with information security policies and standards. Outcomes of reviews and audits are reported to the Director of IT
Security, Executive Vice President of IT and Information Security, and the Chief Information Officer. Relevant information about security nonconformities, incidents, and events are reported to the working group described below and to the Board of Directors. As discussed above, the Chief Information Officer and Executive Vice President of IT and Information Security report to the audit committee and the Board of Directors on cybersecurity matters at least quarterly.
In addition, we have established a working group composed of senior leaders from various departments, including operations, finance, IT, information security, audit, and legal. This working group’s responsibilities include (i) ensuring that information security goals and objectives are identified, meet organizational and business requirements, and are integrated into relevant processes, (ii) reviewing the effectiveness of the information security program, (iii) providing clear direction and highly visible management support for security initiatives, (iv) providing resources required for information security projects and initiatives, (v) overseeing programs to maintain information security awareness, including training and team-specific guidance, and (vi) coordinating the information security aspects of supplier relationships.
Item 2. Properties
Our corporate headquarters is an approximately 500,000-square-foot campus located on over 150 acres of Company-owned property in Oklahoma City, Oklahoma. We are currently constructing a 315,000-square-foot building at our Oklahoma City headquarters. We also have an operations facility on approximately 14 acres of Company-owned property in Grapevine, Texas. In addition to housing two fully redundant data centers at our corporate headquarters in Oklahoma City, we operate another fully redundant data center at our Grapevine facility.
As of December 31, 2023, we lease offices in 28 states and in certain international locations. We believe that these facilities are suitable for our current operations and, upon the expiration of the terms of the leases, we believe we could renew these leases or find suitable space elsewhere on acceptable terms.
Item 3. Legal Proceedings
From time to time, we are involved in various disputes, claims, suits, investigations and legal proceedings arising in the ordinary course of business, including commercial, intellectual property and employment-related matters, as well as stockholder derivative actions, class action lawsuits and other matters. The litigation matters described below involve issues or claims that may be of particular interest to our stockholders, regardless of whether any of these matters are material to our business or financial condition based upon the standard set forth in the SEC’s rules. We believe we have substantial defenses in each matter and we intend to vigorously defend against the claims brought by plaintiffs in these lawsuits.
On August 22, 2023, an individual on behalf of herself and her two minor children filed a class action lawsuit against our wholly owned subsidiary, Paycom Payroll, LLC, in the District Court of Oklahoma County. See Carmen Johnson et al. v. Paycom, No. CJ-2023-4763. The complaint relates to the previously disclosed cybersecurity incident involving a third-party vendor, MOVEit, and alleges claims and damages resulting from that matter, including claims for negligence, breach of implied contract, invasion of privacy, unjust enrichment and a request for declaratory and injunctive relief.
On November 10, 2023, a stockholder filed a securities class action lawsuit against the Company, Chad Richison (in his capacity as Chief Executive Officer) and Craig Boelte (in his capacity as Chief Financial Officer), in the U.S. District Court, Western District of Oklahoma, on behalf of a class of acquirers of Company securities between May 3, 2023 and November 1, 2023. See Angelo Ventrillo Jr. v. Paycom Software, Inc., et al., Case Number CIV-23-1019-F. Similar securities class action lawsuits, involving substantially similar allegations, have also been filed. See Minarik v. Paycom Software, Inc., et al., Case Number 5:24-CV-00014-J in the United States District Court for the Western District of Oklahoma; Schoenrock v. Paycom Software, Inc., et al., Case Number 5:24-CV-00012-F in the United States District Court for the Western District of Oklahoma; and Caloto v. Paycom Software, Inc., et al., Case Number 5:24-cv-00019-R in the United States District Court for the Southern District of New York (transferred to the Western District of Oklahoma on January 9, 2024). The plaintiffs are currently seeking consolidation, designation as lead plaintiff and certification as class representative under Rule 23 of the Federal Rules of Civil Procedure. The plaintiffs have brought multiple claims, including for violations of the federal securities laws under the Exchange Act, on behalf of persons or entities who purchased or otherwise acquired publicly traded Paycom securities during a disputed class period. Plaintiffs claim they incurred losses based on materially false and misleading statements made by the defendants during the class period, which led plaintiffs to invest in Paycom securities. The plaintiffs are seeking remedies including, but not limited to, compensatory damages, reimbursement of out-of-pocket costs, and injunctive relief.
On January 12, 2024, a stockholder filed a stockholder derivative complaint in the U.S. District Court, District of Delaware, against the Company and the members of the Board of Directors, invoking the allegations set forth in the Ventrillo, Caloto, Schoenrock and Minarik lawsuits described above. The complaint alleges breaches of fiduciary duties and violations of federal law. The plaintiffs seek to recover unspecified monetary damages on behalf of the Company. See Chelsey Moon, Derivatively on Behalf of Nominal Defendant Paycom Software, Inc., v. Chad Richison, et al., Case No. 1:24-cv-00046-UNA.
We believe that the resolution of current pending legal matters will not have a material adverse effect on our business, financial condition, results of operations or cash flows. Nonetheless, we cannot predict the outcome of these proceedings, as legal matters are subject to inherent uncertainties, and there exists the possibility that the ultimate resolution of these matters could have a material adverse effect on our business, financial condition, results of operations or cash flows.
Item 4. Mine Safety Disclosures
None.
PART II
Item 5. Market for Registrant’s Common Equity, Related Stockholder Matters and Issuer Purchases of Equity Securities
Our common stock is traded on the NYSE under the symbol “PAYC.” As of February 8, 2024, there were approximately 3,209 holders of record of our common stock. This number is based on the actual number of holders registered at such date and does not include holders whose shares are held in “street name” by brokers and other nominees.
Dividends
In May 2023, our Board of Directors adopted a dividend policy under which we intend to pay quarterly cash dividends on our common stock.
The following table summarizes dividend activity during 2023.
|
|
|
|
|
|
|
|
|
|
|
|
|
|
Declaration Date |
|
Record Date |
|
Payment Date |
|
Per Share Dividend |
|
|
|
Total Cash Dividends Paid (in thousands)(1) |
|
October 30, 2023 |
|
November 27, 2023 |
|
December 11, 2023 |
|
$ |
0.375 |
|
|
|
$ |
21,471 |
|
July 31, 2023 |
|
August 28, 2023 |
|
September 11, 2023 |
|
$ |
0.375 |
|
|
|
$ |
21,636 |
|
May 15, 2023 |
|
May 30, 2023 |
|
June 12, 2023 |
|
$ |
0.375 |
|
|
|
$ |
21,731 |
|
(1)All unvested equity incentive awards currently outstanding are entitled to receive dividends or dividend equivalents, provided that such dividends or dividend equivalents are withheld by the Company and distributed to the applicable holder upon vesting of the award. Dividends declared, as reported in the consolidated statements of stockholders’ equity, includes dividends and dividend equivalents payable to holders of unvested equity incentive awards and, as a result, exceeds the amount of total cash dividends paid presented in this column.
On February 5, 2024, our Board of Directors declared a quarterly cash dividend of $0.375 per share of common stock payable on March 18, 2024 to stockholders of record at the close of business on March 4, 2024.
The declaration, timing and amount of each quarterly cash dividend are subject to the discretion and approval of the Board of Directors, including a determination that the dividend policy and the declaration of dividends thereunder are in the best interests of our stockholders and are in compliance with applicable law. The Board of Directors retains the power to modify, suspend, or cancel the dividend policy in any manner and at any time that it may deem necessary or appropriate.
Performance Graph
Notwithstanding any statement to the contrary in any of our filings with the SEC, the following performance graph shall not be deemed “filed” with the SEC for purposes of Section 18 of the Exchange Act or “soliciting material” under the Exchange Act and shall not be incorporated by reference into any such filings irrespective of any general incorporation language contained in such filing.
The following graph compares the cumulative total stockholder return on our common stock with the cumulative total return of the S&P 500 Index and the S&P 500 Software & Services Index during the five-year period commencing on December 31, 2018 and ending on December 31, 2023. The graph assumes that $100 was invested in our common stock and in each of the comparative indices at the beginning of the period, and assumes the reinvestment of any dividends. Historical stock price performance should not be relied upon as an indication of future stock price performance.
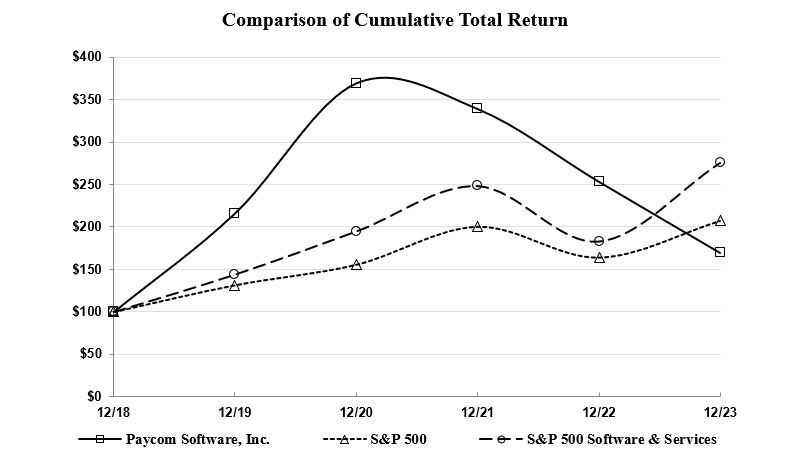
Purchases of Equity Securities
The number of shares of common stock repurchased by us during the three months ended December 31, 2023 is set forth below:
|
|
|
|
|
|
|
|
|
|
|
|
|
|
|
|
|
|
|
Total Number of Shares Purchased |
|
|
Average Price Paid per Share |
|
|
Total Number of Shares Purchased as Part of Publicly Announced Plans or Programs(1) |
|
|
Approximate Dollar Value of Shares that May Yet Be Purchased Under the Plans or Programs(1) |
|
October 1 - 31, 2023(2) |
|
|
27 |
|
|
$ |
268.26 |
|
|
|
27 |
|
|
$ |
1,012,011,000 |
|
November 1 - 30, 2023(3) |
|
|
708,197 |
|
|
$ |
172.81 |
|
|
|
708,197 |
|
|
$ |
889,625,000 |
|
December 1 - 31, 2023(4) |
|
|
484,127 |
|
|
$ |
187.01 |
|
|
|
484,127 |
|
|
$ |
799,088,000 |
|
Total |
|
|
1,192,351 |
|
|
|
|
|
|
1,192,351 |
|
|
|
|
(1)Pursuant to a stock repurchase plan announced on November 20, 2018, we were authorized to purchase (in the aggregate) up to $150.0 million of our common stock in open market purchases, privately negotiated transactions or by other means. On May 13, 2021, we announced that our Board of Directors increased the availability under the existing stock repurchase plan to $300.0 million and extended the expiration date to May 13, 2023. On June 7, 2022, we announced that our Board of Directors increased the availability under the existing stock repurchase plan to $550.0 million and extended the expiration
date to June 7, 2024. On August 15, 2022, we announced that our Board of Directors increased the availability under the existing stock repurchase plan to $1.1 billion and extended the expiration date to August 15, 2024.
(2)Consists of shares withheld to satisfy tax withholding obligations for certain employees upon the vesting of equity incentive awards.
(3)Includes 2,027 shares withheld to satisfy tax withholding for certain employees upon the vesting of equity incentive awards.
(4)Includes 5,174 shares withheld to satisfy tax withholding for certain employees upon the vesting of equity incentive awards.
Item 6. Reserved
Item 7. Management’s Discussion and Analysis of Financial Condition and Results of Operations
This Management’s Discussion and Analysis of Financial Condition and Results of Operations is intended to provide a reader of our financial statements with management’s perspective on our financial condition, results of operations, liquidity, and certain other factors that may affect our future results. The following discussion and analysis of our financial condition and results of operations should be read in conjunction with the audited consolidated financial statements (prepared in accordance with accounting principles generally accepted in the United States (“U.S. GAAP”) and related notes included elsewhere in this Annual Report on Form 10-K (this “Form 10-K”). The following discussion contains forward-looking statements that are subject to risks and uncertainties. See “Cautionary Statements” for a discussion of the uncertainties, risks, and assumptions associated with those statements. Actual results could differ materially from those discussed in or implied by forward-looking statements as a result of various factors, including those discussed below and elsewhere in this Form 10-K, particularly in the section entitled “Risk Factors.” Unless we state otherwise or the context otherwise requires, the terms “we,” “us,” “our” and the “Company” refer to Paycom Software, Inc. and its consolidated subsidiaries. All amounts presented in tables, other than per share amounts, are in thousands unless otherwise noted.
Overview
We are a leading provider of a comprehensive, cloud-based human capital management solution delivered as Software-as-a-Service. We provide functionality and data analytics that businesses need to manage the complete employment lifecycle, from recruitment to retirement. Our solution requires virtually no customization and is based on a core system of record maintained in a single database for all HCM functions, including talent acquisition, time and labor management, payroll, talent management and human resources management applications. Our user-friendly software allows for easy adoption of our solution by employees, enabling self-management of their HCM activities in the cloud, which reduces the administrative burden on employers and increases employee productivity.
We generate revenues from (i) fixed amounts charged per billing period plus a fee per employee or transaction processed and (ii) fixed amounts charged per billing period. We do not require clients to enter into long-term contractual commitments with us. Our billing period varies by client based on when each client pays its employees, which may be weekly, bi-weekly, semi-monthly or monthly. We serve a diverse client base in terms of size and industry. None of our clients constituted more than one-half of one percent of our revenues for the year ended December 31, 2023. Our revenues are primarily generated through our sales force that solicits new clients and our client relations representatives (“CRRs”) who sell new applications to existing clients.
Our continued growth depends on attracting new clients through further penetration of our existing markets and geographic expansion into new markets, targeting a high degree of client employee usage across our solution, and introducing new applications to our existing client base. We believe our ability to continue to develop new applications and to improve existing applications will enable us to increase revenues in the future, and the number of our new applications adopted by our clients has been a significant factor in our revenue growth. We plan to open additional sales offices in the future to further expand our market presence.
Our principal marketing efforts include national and local advertising campaigns, email campaigns, social and digital media campaigns, search engine marketing methods, sponsorships, tradeshows, print advertising and outbound marketing including personalized direct mail campaigns. In addition, we generate leads and build recognition of our brand and thought leadership with relevant and informative content, such as white papers, blogs, podcast episodes and webinars.
Throughout our history, we have built strong relationships with our clients. As the HCM needs of our clients evolve, we believe that we are well-positioned to expand the HCM spending of our clients and we believe this opportunity is significant. To be successful, we must continue to demonstrate the operational and economic benefits of our solution, as well as effectively hire, train, motivate and retain qualified personnel.
Growth Outlook, Opportunities and Challenges
As a result of our significant revenue growth and geographic expansion, we are presented with a variety of opportunities and challenges. Our payroll application is the foundation of our solution and all of our clients are required to utilize this application in order to access our other applications. Consequently, we have historically generated the majority of our revenues from our payroll applications, although our revenue mix has evolved and will continue to evolve as we develop and add new non-payroll applications to our solution. We believe our strategy of focusing on increased employee usage is an important differentiator for attracting new clients and is also key to long-term client satisfaction and client retention. For example, in 2021, we launched our industry-first Beti technology, which further automates and streamlines the payroll process by empowering employees to do their own payroll. Client adoption of new applications and, historically, client employee usage of both new and existing applications have been significant factors in our revenue growth. Nonetheless, because Beti is designed to eliminate payroll errors that lead to billable corrections and
unscheduled payroll runs, we have experienced and expect to continue to experience a reduction in these activities that would otherwise generate additional revenue for us.
In order to increase revenues and continue to improve our operating results, we must also attract new clients. We intend to obtain new clients by (i) continuing to leverage our sales force productivity within markets where we currently have existing sales offices, (ii) expanding our presence in markets where we currently have an existing sales office through adding sales teams or offices, thereby increasing the number of sales professionals within such markets, and (iii) opening sales offices in new markets.
The market for HCM software is highly competitive, rapidly evolving and fragmented, and we expect competition to continue to intensify as new market entrants and disruptive technologies emerge and increasingly aggressive pricing and client retention strategies persist.
Historically, our target client range has been organizations with 50 to 10,000 employees. In 2023, we expanded our target client size range to include organizations with more than 10,000 employees. While we continue to serve a diversified client base ranging in size from one employee to many thousands of employees, the average size of our clients has grown significantly as we have organically grown our operations and increased the number of applications we offer. Furthermore, with the launch of our Global HCM solution and expansion of payroll services into certain international markets, such as Canada and Mexico, we expect that our ability to serve organizations with international employees makes our solution more attractive to larger companies, many of which have a global presence. We believe larger employers represent a substantial opportunity to increase our revenues per client, with limited incremental cost to us. Because we charge our clients on a per employee basis for certain services we provide, any increase or decrease in the number of employees of our clients will have a positive or negative impact, respectively, on our results of operations. A multitude of macroeconomic pressures, such as inflation and rising interest rates, impact our clients’ hiring practices to varying degrees and, in turn, impact our revenues. Generally, we expect that changes in certain factors affecting our performance will correlate with improvement or deterioration in the labor market. For example, the performance of our pre-employment services offerings is sensitive to changes in hiring trends and we believe it will reflect the current slowdown in hiring among U.S. employers.
Based on our total revenues, we have grown at a 23% compound annual growth rate from January 1, 2020 through December 31, 2023. Growing our business has resulted in, and will continue to result in, substantial investments in sales professionals, operating expenses, system development and programming costs and general and administrative expenses, which have increased and will continue to increase our expenses. Specifically, our revenue growth and geographic expansion drive increases in our employee headcount, which in turn precipitates increases in (i) salaries and benefits, (ii) stock-based compensation expense and (iii) facility costs related to the expansion of our corporate headquarters and operations facilities and additional sales office leases.
We believe the challenges of managing the ever-changing complexity of payroll and human resources will continue to drive companies to turn to outsourced providers for help with their HCM needs. The HCM industry historically has been driven, in part, by legislation and regulatory action, including COBRA, changes to the minimum wage laws or overtime rules, and legislation from federal, state, or municipal taxation authorities. The implementation of the Affordable Care Act (the “ACA”) is an example of legislation that has created demand in the HCM industry. We generate ACA-related revenues (i) on an annual basis in connection with processing and filing Forms 1094 and 1095 on behalf of clients and (ii) from clients who have purchased our Enhanced ACA application as part of the fixed, bundled price charged per billing period. While we generally do not track our revenues on an application-by-application basis (because applications are often sold in various groupings and configurations for a single price), we estimate that, if the ACA is not modified or repealed, revenues from our Enhanced ACA application and ACA forms filings business will represent approximately 2% of total projected revenues for the year ending December 31, 2024.
For each of the years ended December 31, 2023, 2022 and 2021, our gross margins were approximately 84%, 85% and 85%, respectively. Although our gross margin may fluctuate from quarter to quarter due to seasonality and hiring trends, we expect that our gross margin will remain relatively consistent in future periods.
Key Metrics
In addition to the U.S. GAAP and non-GAAP metrics discussed elsewhere in this Form 10-K, we also monitor the following metrics to evaluate our business, measure our performance and identify trends affecting our business:
|
|
|
|
|
|
|
|
|
|
|
|
|
|
|
Year Ended December 31, |
|
|
|
2023 |
|
|
2022 |
|
|
2021 |
|
Key performance indicators: |
|
|
|
|
|
|
|
|
|
Clients |
|
|
36,820 |
|
|
|
36,561 |
|
|
|
33,875 |
|
Clients (based on parent company grouping) |
|
|
19,481 |
|
|
|
19,081 |
|
|
|
17,703 |
|
Sales teams |
|
|
55 |
|
|
|
55 |
|
|
|
51 |
|
Annual revenue retention rate(1) |
|
|
90 |
% |
|
|
91 |
% |
|
|
94 |
% |
(1)As described below, during 2023, we modified the method by which we calculate annual revenue retention rate. Amounts for 2022 and 2021 have been recast to reflect the new methodology.
•Clients. When we calculate the number of clients at period end, we treat client accounts with separate taxpayer identification numbers (or, in certain circumstances, separate client codes) as separate clients, which often separates client accounts that are affiliated with the same parent organization. We track the number of our clients to provide an accurate gauge of the size of our business. Unless we state otherwise or the context otherwise requires, references to clients throughout this Form 10-K refer to this metric.
•Clients (based on parent company grouping). When we calculate the number of clients based on parent company grouping at period end, we combine client accounts that have identified the same person(s) as their decision-maker regardless of whether the client accounts have separate taxpayer identification numbers (or, in certain circumstances, separate client codes), which often combines client accounts that are affiliated with the same parent organization. We track the number of our clients based on parent company grouping to provide an alternate measure of the size of our business and clients.
•Sales Teams. We monitor our sales professionals by the number of sales teams at period end. CRRs and emerging markets representatives are counted as one sales team. Each outside sales team typically consists of a sales manager and approximately eight sales professionals. Certain larger metropolitan areas can support more than one sales team. We believe the number of sales teams is an indicator of potential revenues for future periods.
•Annual Revenue Retention Rate. Our annual revenue retention rate tracks the percentage of revenues that we retain from our existing clients. We monitor this metric because it is an indicator of client satisfaction and revenues for future periods.
During the year ended December 31, 2023, we modified the method by which we calculate annual revenue retention rate. Prior period amounts have been recast to reflect the new methodology. We now calculate annual revenue retention rate for any 12-month period (a “Measurement Period”) as follows:
|
Total Revenues – Interest Earned on Funds Held for Clients – TTM Revenue Attrition |
Total Revenues – Interest Earned on Funds Held for Clients |
The trailing 12-month value of revenue from clients lost during the Measurement Period (“TTM Revenue Attrition”) is equal to the actual recurring fees paid by such lost clients during the 12 months preceding the respective dates on which they last processed payroll with us.
The point at which a client is deemed “lost” is determined based on the terms of our standard services agreement with clients. Beginning in July 2023, commensurate with operational changes related to how we mobilize our services department to manage relationships with clients that have missed a payroll, we amended our standard services agreement and, as a result, the point at which a client was deemed “lost” accelerated. Due to this change in methodology, the TTM Revenue Attrition for the year ended December 31, 2023 (i) includes revenue from certain former clients deemed lost in December 2023 that, under the historical methodology, may have been deemed lost in early 2024, and (ii) excludes revenue from certain former clients that, under the historical methodology, may have been deemed lost in early 2023 but was instead included in the TTM Revenue Attrition for the year ended December 31, 2022. In addition, due to rising interest rates and higher average balances of funds held for clients, we determined that interest earned on funds held for clients should be excluded from the annual revenue retention rate calculation beginning in 2023. In prior years, we did not believe that the interest earned on funds held for clients was material for purposes of this calculation.
Components of Results of Operations
Sources of Revenues
Revenues consist of recurring revenues, and implementation and other revenues. We expect our revenues to increase as we introduce new applications, expand our client base and renew and expand relationships with existing clients. As a percentage of total revenues, we expect our mix of recurring revenues, and implementation and other revenues to remain relatively constant.
Recurring Revenues
Recurring revenues are derived primarily from our talent acquisition, time and labor management, payroll, talent management and HR management applications as well as fees charged for form filings and delivery of client payroll checks and reports. We generate revenues from (i) fixed amounts charged per billing period plus a fee per employee or transaction processed and (ii) fixed amounts charged per billing period. We do not require clients to enter into long-term contractual commitments with us. Our billing period varies by client based on when each client pays its employees, which may be weekly, bi-weekly, semi-monthly or monthly. Because recurring revenues are based, in part, on fees for use of our applications and the delivery of checks and reports that are levied on a per-employee basis, our recurring revenues increase as our clients hire more employees. Recurring revenues are recognized in the period services are rendered.
Recurring revenues include revenues relating to the annual processing of payroll tax filing forms and ACA form filing requirements and revenues from processing unscheduled payroll runs (such as bonuses) for our clients. These payroll forms are typically processed in the first quarter of the year and many of our clients are subject to ACA form filing requirements in the first quarter, which positively impacts first quarter revenues and margins. We anticipate our revenues will continue to exhibit this seasonal pattern related to ACA form filings for so long as the ACA (or replacement legislation) includes employer reporting requirements. In addition, our recurring revenues during the fourth quarter are positively impacted by unscheduled payroll runs for our clients that occur before the end of the year. Nonetheless, we expect the magnitude of these seasonal fluctuations in our revenues to decrease to the extent clients utilize more of our non-payroll applications.
Recurring revenues also include interest earned on funds held for clients. We collect funds from clients in advance of either the applicable due date for payroll tax submissions or the applicable disbursement date for employee payment services. These collections from clients are typically disbursed from one to 30 days after receipt, with some funds being held for up to 120 days. We typically invest funds held for clients in money market funds, demand deposit accounts, certificates of deposit and commercial paper until they are paid to the applicable tax or regulatory agencies or to client employees. As we introduce new applications, expand our client base and renew and expand relationships with existing clients, we expect our average funds held for clients balance and, accordingly, interest earned on funds held for clients, will increase; however, the amount of interest we earn can be positively or negatively impacted by changes in interest rates.
Implementation and Other Revenues
Implementation and other revenues consist of implementation fees for the deployment of our solution and other revenues from sales of time clocks as part of our time and attendance services. Non-refundable implementation fees are charged to new clients at inception and upon the addition of certain incremental applications for existing clients. These fees generally range from 10% to 30% of the annualized value of the transaction. Implementation revenues are recognized as deferred revenue and amortized into income over the life of the client, which is estimated to be ten years, and other revenues are recognized upon shipment of time clocks. Implementation and other revenues comprised approximately 1.7% of our total revenues for each of the years ended December 31, 2023 and 2022.
Cost of Revenues
Cost of revenues consists of expenses related to hosting and supporting our applications, hardware costs, systems support and technology and depreciation and amortization. These costs include employee-related expenses (including non-cash stock-based compensation expenses) and other expenses related to client support, bank charges for processing ACH transactions, certain implementation expenses, delivery charges and paper costs. They also include our cost for time clocks sold and ongoing technology and support costs related to our systems. The amount of depreciation and amortization of property and equipment allocated to cost of revenues is determined based upon an estimate of assets used to support our operations.
Administrative Expenses
Administrative expenses consist of sales and marketing expenses, research and development expenses, general and administrative expenses and depreciation and amortization expenses. Sales and marketing expenses consist primarily of employee-related expenses for our direct sales and marketing staff (such as the amortization of commissions and bonuses and non-cash stock-based compensation expenses), marketing expenses and other related costs. Based on positive results from our advertising campaigns, we plan to continue to invest in our marketing program and may adjust spending levels in future periods as we see opportunities for favorable returns on our investments. Research and development expenses consist primarily of employee-related expenses (including
non-cash stock-based compensation expenses) for our development staff, net of capitalized software costs for internally developed software. We expect to grow our research and development efforts as we continue to broaden our payroll and HR solution offerings and extend our technological solutions by investing in the development of new applications and enhancements for existing applications. General and administrative expenses consist of employee-related expenses for finance and accounting, legal, human resources and management information systems personnel (including non-cash stock-based compensation expenses), legal costs, professional fees and other corporate expenses. Depreciation and amortization expenses consist of (i) the amount of depreciation and amortization of property and equipment allocated to administrative expenses (based upon an estimate of assets used to support our selling, general and administrative functions) and (ii) amortization of intangible assets.
Interest Expense
Interest expense includes interest on our long-term debt and settlements related to an interest rate swap prior to the termination of the interest rate swap agreement on August 24, 2022. Prior to the repayment of our long-term debt in November 2023, we capitalized interest costs incurred for indebtedness related to construction in progress. See “Note 6. Long-Term Debt” for discussion of the repayment of our debt.
Other Income (Expense), net
Other income (expense), net includes interest earned on our own funds, any gain or loss on the sale or disposal of fixed assets, costs associated with the early repayment of debt, loss on the extinguishment of debt, and the realized gain that resulted from the settlement of our interest rate swap agreement.
Provision for Income Taxes
Our consolidated financial statements include a provision for income taxes incurred for the anticipated tax consequences of the reported results of operations using the asset and liability method. Under this method, we recognize deferred tax assets and liabilities for the expected future tax consequences of temporary differences between the financial reporting and tax basis of assets and liabilities, as well as for any operating loss and tax credit carryforwards. Deferred tax assets and liabilities are measured using the tax rates expected to apply to taxable income for the years in which those tax assets and liabilities are expected to be realized or settled. We recognize a valuation allowance to reduce deferred tax assets to the net amount we believe is more likely than not to be realized.
Results of Operations
The following table sets forth selected consolidated statements of income data and such data as a percentage of total revenues for each of the periods indicated, as well as year-over-year changes with respect to each line item. Refer to “Item 7. Management’s Discussion and Analysis of Financial Condition and Results of Operations” in the Annual Report on Form 10-K for the year ended December 31, 2022, filed with the SEC on February 16, 2023, for a discussion of results for the year ended December 31, 2021, including a discussion of the changes in our results of operations for the year ended December 31, 2022 compared to the year ended December 31, 2021.
|
|
|
|
|
|
|
|
|
|
|
|
|
|
|
|
|
|
|
|
|
Year Ended December 31, |
|
|
|
|
|
2023 |
|
|
2022 |
|
|
% Change |
Revenues |
|
|
|
|
|
|
|
|
|
|
|
|
|
|
Recurring |
|
$ |
1,664,976 |
|
|
|
98.3 |
% |
|
$ |
1,351,856 |
|
|
|
98.3 |
% |
|
23.2% |
Implementation and other |
|
|
28,698 |
|
|
|
1.7 |
% |
|
|
23,362 |
|
|
|
1.7 |
% |
|
22.8% |
Total revenues |
|
|
1,693,674 |
|
|
|
100.0 |
% |
|
|
1,375,218 |
|
|
|
100.0 |
% |
|
23.2% |
Cost of revenues |
|
|
|
|
|
|
|
|
|
|
|
|
|
|
Operating expenses |
|
|
223,699 |
|
|
|
13.2 |
% |
|
|
169,806 |
|
|
|
12.4 |
% |
|
31.7% |
Depreciation and amortization |
|
|
52,591 |
|
|
|
3.1 |
% |
|
|
42,935 |
|
|
|
3.1 |
% |
|
22.5% |
Total cost of revenues |
|
|
276,290 |
|
|
|
16.3 |
% |
|
|
212,741 |
|
|
|
15.5 |
% |
|
29.9% |
Administrative expenses |
|
|
|
|
|
|
|
|
|
|
|
|
|
|
Sales and marketing |
|
|
417,617 |
|
|
|
24.7 |
% |
|
|
346,561 |
|
|
|
25.2 |
% |
|
20.5% |
Research and development |
|
|
198,951 |
|
|
|
11.7 |
% |
|
|
148,343 |
|
|
|
10.8 |
% |
|
34.1% |
General and administrative |
|
|
288,137 |
|
|
|
17.0 |
% |
|
|
239,130 |
|
|
|
17.4 |
% |
|
20.5% |
Depreciation and amortization |
|
|
61,357 |
|
|
|
3.6 |
% |
|
|
49,764 |
|
|
|
3.6 |
% |
|
23.3% |
Total administrative expenses |
|
|
966,062 |
|
|
|
57.0 |
% |
|
|
783,798 |
|
|
|
57.0 |
% |
|
23.3% |
Total operating expenses |
|
|
1,242,352 |
|
|
|
73.4 |
% |
|
|
996,539 |
|
|
|
72.5 |
% |
|
24.7% |
Operating income |
|
|
451,322 |
|
|
|
26.6 |
% |
|
|
378,679 |
|
|
|
27.5 |
% |
|
19.2% |
Interest expense |
|
|
(1,927 |
) |
|
|
-0.1 |
% |
|
|
(2,536 |
) |
|
|
-0.2 |
% |
|
-24.0% |
Other income (expense), net |
|
|
23,004 |
|
|
|
1.4 |
% |
|
|
13,435 |
|
|
|
1.0 |
% |
|
71.2% |
Income before income taxes |
|
|
472,399 |
|
|
|
27.9 |
% |
|
|
389,578 |
|
|
|
28.3 |
% |
|
21.3% |
Provision for income taxes |
|
|
131,611 |
|
|
|
7.8 |
% |
|
|
108,189 |
|
|
|
7.8 |
% |
|
21.6% |
Net income |
|
$ |
340,788 |
|
|
|
20.1 |
% |
|
$ |
281,389 |
|
|
|
20.5 |
% |
|
21.1% |
Revenues
The increase in total revenues for the year ended December 31, 2023 from the year ended December 31, 2022 was primarily the result of the addition of new clients in our target market range and productivity and efficiency gains across our sales offices, which were partially offset by a decrease in revenue generated by the sale of additional applications to our existing clients. We believe that the Beti-driven reduction in billable corrections and unscheduled payroll runs, as well as lower retention among smaller clients, also adversely impacted the magnitude of the year-over-year increase in revenues. The performance of our tax forms filing business in the first quarter of 2023 contributed to the increase in total revenues for the year ended December 31, 2023, as compared to the year ended December 31, 2022. Because we charge our clients on a per-employee basis for certain services we provide, the drivers of revenue for the year ended December 31, 2023 described above were impacted by the headcount fluctuations within our client base. Additionally, rising interest rates and a higher average funds held for clients balance during year ended December 31, 2023 as compared to the year ended December 31, 2022, resulted in increased interest earned on funds held for clients, which had a positive impact on recurring revenue. The average daily balance of funds held for clients was $2.2 million and $2.0 million the years ended December 31, 2023 and 2022, respectively.
The increase in implementation and other revenues for the year ended December 31, 2023 from the year ended December 31, 2022 was primarily the result of the increased non-refundable upfront conversion fees collected from the addition of new clients. These fees are deferred and recognized ratably over the ten-year estimated life of our clients.
Expenses
Cost of Revenues
During the year ended December 31, 2023, operating expenses increased from the prior year by $53.9 million primarily due to a $44.2 million increase in employee-related expenses attributable to growth in the number of operating personnel, a $5.0 million increase in shipping and supplies fees, and a $2.5 million increase in automated clearing house fees in connection with the increase in revenues. Depreciation and amortization expense increased $9.7 million, or 22%, primarily due to the development of additional technology and purchases of other related fixed assets.
Administrative Expenses
Sales and marketing
During the year ended December 31, 2023, sales and marketing expenses increased from the prior year by $71.1 million due to a $51.7 million increase in employee-related expenses, including commissions and bonuses, and a $19.4 million increase in marketing and advertising expense attributable to increased spending across many components of our marketing program.
Research and development
During the year ended December 31, 2023, research and development expenses increased $50.6 million from the prior year primarily due to an increase in employee-related expenses.
As we continue the ongoing development of our platform and product offerings, we generally expect research and development expenses (exclusive of stock-based compensation) to continue to increase, particularly as we hire more personnel to support our growth. While we expect this trend to continue on an absolute dollar basis and as a percentage of total revenues, we also anticipate the rate of increase to decline over time as we leverage our growth and realize additional economies of scale. As is customary for our business, we also expect fluctuations in research and development expense as a percentage of revenue on a quarter-to-quarter basis due to seasonal revenue trends, the introduction of new products, the amount and timing of research and development costs that may be capitalized and the timing of onboarding new hires and restricted stock vesting events.
Expenditures for software developed or obtained for internal use are capitalized and amortized over a three-year period on a straight-line basis. The nature of the development projects underway during a particular period, such as our international expansion, directly impacts the timing and extent of these capitalized expenditures and can affect the amount of research and development expenses in such period. The table below sets forth the amounts of capitalized and expensed research and development costs for the years ended December 31, 2023 and 2022:
|
|
|
|
|
|
|
|
|
|
|
|
|
Year Ended December 31, |
|
|
|
|
2023 |
|
|
2022 |
|
|
% Change |
Capitalized portion of research and development |
|
$ |
96,744 |
|
|
$ |
66,407 |
|
|
46% |
Expensed portion of research and development |
|
|
198,951 |
|
|
|
148,343 |
|
|
34% |
Total research and development costs |
|
$ |
295,695 |
|
|
$ |
214,750 |
|
|
38% |
General and administrative
During the year ended December 31, 2023, general and administrative expenses increased by $49.0 million from the prior year due to a $44.0 million increase in employee-related expenses and a $5.0 million increase in accounting and legal expenses.
Non-Cash Stock-Based Compensation Expense
The following table presents the non-cash stock-based compensation expense that is included within the specified line items in our consolidated statements of comprehensive income:
|
|
|
|
|
|
|
|
|
|
|
|
|
Year Ended December 31, |
|
|
|
|
2023 |
|
|
2022 |
|
|
% Change |
Operating expenses |
|
$ |
10,613 |
|
|
$ |
4,671 |
|
|
127% |
Sales and marketing |
|
|
23,870 |
|
|
|
18,659 |
|
|
28% |
Research and development |
|
|
22,273 |
|
|
|
11,063 |
|
|
101% |
General and administrative |
|
|
73,050 |
|
|
|
60,505 |
|
|
21% |
Total non-cash stock-based compensation expense |
|
$ |
129,806 |
|
|
$ |
94,898 |
|
|
37% |
Depreciation and Amortization
During the year ended December 31, 2023, depreciation and amortization expense increased from the prior year primarily due to the development of additional technology and purchases of other related fixed assets.
Interest Expense
The decrease in interest expense for the year ended December 31, 2023 was due to the timing and progress of construction of the expansion of our corporate headquarters, which resulted in a higher capitalization rate of interest in 2023. The increase in capitalized interest during 2023 was partially offset by increased costs due to the timing of our entrance into the Credit Agreement (as defined below) on July 29, 2022. Prior to the repayment of our long-term debt in November 2023, we capitalized interest costs incurred for indebtedness related to construction in progress. See “Note 6. Long-Term Debt” for discussion of the repayment of our debt.
Other Income (Expense), net
The increase in other income (expense), net for the year ended December 31, 2023 was primarily due to income earned on our corporate funds of $23.5 million. Additionally, as a result of the termination of the Term Loan Facility (as defined below), we incurred a loss on the extinguishment of debt of $1.2 million in the year ended December 31, 2023, which consisted of the write-off of unamortized debt issuance costs. See “Note 6. Long-Term Debt” for additional information.
Provision for Income Taxes
The provision for income taxes is based on a current estimate of the annual effective income tax rate adjusted to reflect the impact of discrete items. Our effective income tax rate was 28% for the years ended December 31, 2023 and 2022.
Liquidity and Capital Resources
Our principal sources of capital and liquidity are our operating cash flow and cash and cash equivalents. Our cash and cash equivalents consist primarily of demand deposit accounts, money market funds and certificates of deposit. Additionally, we maintain a $1.0 billion senior secured revolving credit facility (the “Revolving Credit Facility”), which can be accessed as needed to supplement our operating cash flow and cash balances. As of December 31, 2023, we did not have any outstanding borrowings under the Revolving Credit Facility.
We have historically funded our operations from cash flows generated from operations, cash from the sale of equity securities and debt financing. We are funding our current building expansion projects from available cash. Further, to date, all cash dividends and purchases under our stock repurchase plan have been funded from available cash. We believe our existing cash and cash equivalents, cash generated from operations and available sources of liquidity will be sufficient to maintain operations, make necessary capital expenditures, pay dividends and opportunistically repurchase shares for at least the next 12 months. In addition, based on our strong profitability and continued growth, we expect to meet our longer-term liquidity needs with cash flows from operations and, as needed, financing arrangements.
Credit Agreement. On July 29, 2022 , we entered into a new credit agreement (the “Credit Agreement”) with JPMorgan Chase Bank, N.A., as a lender, swingline lender and issuing bank, the lenders from time to time party thereto (collectively with JPMorgan Chase Bank, N.A., the “Lenders”), and JPMorgan Chase Bank, N.A., as the administrative agent. The Credit Agreement initially provided for the Revolving Credit Facility in the aggregate principal amount of up to $650.0 million, and the ability to request an incremental facility of up to an additional $500.0 million, subject to obtaining additional lender commitments and certain approvals and satisfying certain other conditions. The Credit Agreement includes a $25.0 million sublimit for swingline loans and a $6.5 million sublimit for letters of credit. The Credit Agreement also initially provided for a $750.0 million senior secured delayed draw term loan facility (the “Term Loan Facility”). As discussed below, the Term Loan Facility was terminated on July 28, 2023. All loans under the Credit Agreement will mature on July 29, 2027 (the “Scheduled Maturity Date”).
The borrowings under the Credit Agreement bear interest at a rate per annum equal to (i) the Alternate Base Rate (“ABR”) plus an applicable margin (“ABR Loans”) or (ii) (x) the term Secured Overnight Financing Rate (“SOFR”) plus 0.10% (the “Adjusted Term SOFR Rate”) or (y) the daily SOFR plus 0.10%, in each case plus an applicable margin (“SOFR Rate Loans”). ABR is calculated as the highest of (i) the rate of interest last quoted by The Wall Street Journal in the United States as the prime rate in effect, (ii) the federal funds rate plus 0.5% and (iii) the Adjusted Term SOFR Rate for a one-month interest period plus 1.00%; provided that, if the ABR as determined pursuant to the foregoing would be less than 1.00%, such rate shall be deemed to be 1.00%. The applicable margin for ABR Loans is (i) 0.25% if the Company’s consolidated leverage ratio is less than 1.0 to 1.0; (ii) 0.50% if the Company’s consolidated leverage ratio is greater than or equal to 1.0 to 1.0 but less than 2.0 to 1.0; (iii) 0.75% if the Company’s consolidated leverage ratio is greater than or equal to 2.0 to 1.0 but less than 3.0 to 1.0; or (iv) 1.00% if the Company’s consolidated leverage ratio is greater than or equal to 3.0 to 1.0. The applicable margin for SOFR Rate Loans is (i) 1.25% if the Company’s consolidated leverage ratio is less than 1.0 to 1.0; (ii) 1.5% if the Company’s consolidated leverage ratio is greater than or equal to 1.0 to 1.0 but less than 2.0 to 1.0; (iii) 1.75% if the Company’s consolidated leverage ratio is greater than or equal to 2.0 to 1.0 but less than 3.0 to 1.0; or (iv) 2.00% if the Company’s consolidated leverage ratio is greater than or equal to 3.0 to 1.0. We are required to pay a quarterly commitment fee on the daily amount of the undrawn portion of the revolving commitments under the Revolving Credit Facility and, prior to its termination, a quarterly ticking fee on the daily amount of the undrawn portion of the Term Loan Facility, in each case at a rate per annum of (i) 0.20% if the Company’s consolidated leverage ratio is less than 1.0 to 1.0; (ii) 0.225% if the Company’s consolidated leverage ratio is greater than or equal to 1.0 to 1.0 but less than 2.0 to 1.0; (iii) 0.25% if the Company’s consolidated leverage ratio is greater than or equal to 2.0 to 1.0 but less than 3.0 to 1.0; or (iv) 0.275% if the Company’s consolidated leverage ratio is greater than or equal to 3.0 to 1.0. We are also required to pay customary letter of credit fees upon drawing any letter of credit.
Under the Credit Agreement, we are required to maintain as of the end of each fiscal quarter a consolidated interest coverage ratio of not less than 3.0 to 1.0 and a consolidated leverage ratio of not greater than 3.5 to 1.0, stepping down to 3.25 to 1.0 as of December 31, 2024 and 3.0 to 1.0 as of December 31, 2025 and thereafter.
On July 29, 2022, we borrowed $29.0 million under the Revolving Credit Facility to repay the outstanding indebtedness under our prior credit facility, along with accrued interest, expenses and fees. The loan bore interest at the Adjusted Term SOFR Rate for the interest period in effect plus 1.25%.
On July 28, 2023, we entered into an amendment to the Credit Agreement (the “Credit Agreement Amendment”), pursuant to which the aggregate revolving commitments thereunder were increased from $650.0 million to $1.0 billion, the Term Loan Facility was terminated and the Credit Agreement was amended in contemplation of the formation and future operating activities of Paycom Client Trust (the “Client Trust”) and Paycom National Trust Bank, NA (the “Trust Bank”). We intend to form the Client Trust to hold client payroll and related funds and the Trust Bank to serve as trustee of the Client Trust. We did not make any draws under the Term Loan Facility prior to its termination.
On November 21, 2023, we fully repaid the outstanding indebtedness under the Revolving Credit Facility.
Stock Repurchase Plan and Withholding Shares to Cover Taxes. In May 2016, our Board of Directors authorized a stock repurchase plan allowing for the repurchase of shares of our common stock in open market transactions at prevailing market prices, in privately negotiated transactions or by other means in accordance with federal securities laws, including Rule 10b5-1 programs. Since the initial authorization of the stock repurchase plan, our Board of Directors has amended and extended and authorized new stock repurchase plans from time to time. Most recently, in August 2022, our Board of Directors authorized the repurchase of up to $1.1 billion of our common stock. As of December 31, 2023, there was $799.1 million available for repurchases under our stock repurchase plan. Our stock repurchase plan may be suspended or discontinued at any time. The actual timing, number and value of shares repurchased depends on a number of factors, including the market price of our common stock, general market and economic conditions, shares withheld for taxes associated with the vesting of equity incentive awards and other corporate considerations. The current stock repurchase plan will expire on August 15, 2024.
During the year ended December 31, 2023, we repurchased an aggregate of 1,495,752 shares of our common stock at an average cost of $200.93 per share, including 51,119 shares withheld to satisfy tax withholding obligations for certain employees upon the vesting of equity incentive awards. Our payment of the taxes on behalf of those employees resulted in an aggregate cash expenditure of $13.9 million and, as such, we generally subtract the amounts attributable to such withheld shares from the aggregate amount available for future purchases under our stock repurchase plan.
Dividends on Common Stock. For a discussion of our dividends, see “Item 5. Market for Registrant’s Common Equity, Related Stockholder Matters and Issuer Purchases of Equity Securities.”
Cash Flow Analysis
Our cash flows from operating activities have historically been significantly impacted by profitability, implementation revenues received but deferred, our investment in sales and marketing to drive growth, and research and development. Our ability to meet future liquidity needs will be driven by our operating performance and the extent of continued investment in our operations. Failure to generate sufficient revenues and related cash flows could have a material adverse effect on our ability to meet our liquidity needs and achieve our business objectives.
As our business grows, we expect our capital expenditures and our investment activity to continue to increase. For example, we estimate that the total cost of the current expansion project at our corporate headquarters will be between $87 million and $90 million. Capital expenditures related to this expansion began in the fourth quarter of 2021 and we expect construction to be completed in the first quarter of 2024. In addition, we purchased the naming rights to the downtown Oklahoma City arena that is home to the Oklahoma City Thunder National Basketball Association franchise. Under the terms of the naming rights agreement, we committed to make payments escalating annually from $4.0 million in 2021 to $6.1 million in 2035. The payments are due in the fourth quarter of each year. Upon the conclusion of the initial term, the agreement may be extended upon the mutual agreement of both parties for an additional five-year period. Depending on certain growth opportunities, we may choose to accelerate investments in sales and marketing, acquisitions, technology and services. Actual future capital requirements will depend on many factors, including our future revenues, cash from operating activities and the level of expenditures in all areas of our business.
As part of our payroll and payroll tax filing services, we collect funds from our clients for employment taxes, which we remit to the appropriate tax agencies. We typically invest these funds in money market funds, demand deposit accounts, certificates of deposit, commercial paper and U.S. treasury securities from which we earn interest income during the period between receipt and disbursement of such funds.
Our cash flows from investing and financing activities are influenced by the amount of funds held for clients, which can vary significantly from quarter to quarter. The balance of the funds we hold depends on our clients’ payroll calendars, and therefore such balance changes from period to period in accordance with the timing of each payroll cycle.
Our cash flows from financing activities are also affected by the extent to which we use available cash to purchase shares of common stock under our stock repurchase plan as well as equity incentive award vesting events that result in net share settlements and
the Company paying withholding taxes on behalf of certain employees. Additionally, we intend to continue to pay a quarterly cash dividend, subject to the discretion of the Board of Directors.
The following table summarizes the consolidated statements of cash flows for the years ended December 31, 2023 and 2022:
|
|
|
|
|
|
|
|
|
|
|
|
|
Year Ended December 31, |
|
|
|
|
2023 |
|
|
2022 |
|
|
% Change |
Net cash provided by (used in): |
|
|
|
|
|
|
|
|
Operating activities |
|
$ |
485,037 |
|
|
$ |
365,103 |
|
|
33% |
Investing activities |
|
|
(196,712 |
) |
|
|
(23,286 |
) |
|
745% |
Financing activities |
|
|
(274,660 |
) |
|
|
254,587 |
|
|
-208% |
Change in cash, cash equivalents, restricted cash and restricted cash equivalents |
|
$ |
13,665 |
|
|
$ |
596,404 |
|
|
-98% |
Operating Activities
Cash provided by operating activities for the year ended December 31, 2023 primarily consisted of payments received from our clients and interest earned on funds held for clients. Cash used in operating activities primarily consisted of personnel-related expenditures to support the growth and infrastructure of our business. These payments included costs of operations, advertising and other sales and marketing efforts, IT infrastructure development, product research and development and security and administrative costs. Compared to the year ended December 31, 2022, our operating cash flows for the year ended December 31, 2023 were positively impacted by the growth of our business.
Investing Activities
Cash used in investing activities for the year ended December 31, 2023 increased from the prior year due to a $357.2 million decrease in proceeds from investments from funds held for clients, a $59.9 million increase in purchases of property and equipment, and a $0.1 million increase in purchases of intangible assets, which were partially offset by a $243.7 million decrease in purchases of investments from funds held for clients and a $0.1 million increase in proceeds from the sale of property and equipment.
Financing Activities
Cash used in financing activities for the year ended December 31, 2023 increased from the prior year primarily due to the impact of a $240.8 million change related to the client funds obligation, which is due to the timing of receipts from our clients and payments made to our clients’ employees and applicable taxing authorities on their behalf, a $192.0 million increase in common stock repurchases, the payment of $64.8 million in cash dividends, a $29.0 million decrease in proceeds from the issuance of debt, and a $8.8 million increase in withholding taxes paid related to net share settlements. The increase in cash used in financing activities was partially offset by a $0.3 million decrease in payments on long-term debt and a $5.8 million decrease in payment of debt issuance costs.
Contractual Obligations
Our principal commitments primarily consist of leases for office space and the naming rights agreement. For additional information regarding our naming rights agreement, leases, and our commitments and contingencies, see “Note 4. Goodwill and Intangible Assets, Net”, “Note 5. Leases” and “Note 13. Commitments and Contingencies”.
We plan to continue to lease additional office space to support our growth. In addition, many of our existing lease agreements provide us with the option to renew. When applicable, our future operating lease obligations include payments due during any renewal period provided for in the lease where the lease imposes a penalty for failure to renew. Additional details on our leases, including the related future cash outflows, are included within “Note 5. Leases” in the notes to our consolidated financial statements included elsewhere within this Form 10-K.
Critical Accounting Policies and Estimates
Our consolidated financial statements and accompanying notes have been prepared in accordance with U.S. GAAP. The preparation of these consolidated financial statements requires us to make estimates, judgments and assumptions that affect the reported amounts of assets, liabilities, revenues, costs and expenses, and related disclosures. Estimates made in accordance with U.S. GAAP that involve a significant level of estimation uncertainty and have had or are reasonably likely to have a material impact on our financial condition are described below. On an ongoing basis, we evaluate our estimates and assumptions to ensure that management believes them to be reasonable under the then-current facts and circumstances. Actual amounts and results may materially differ from these estimates made by management under different assumptions and conditions.
Certain accounting policies that require significant management estimates, and are deemed critical to our results of operations or financial position, are described below. Accordingly, these are the policies we believe are the most critical to aid in fully understanding and evaluating our consolidated financial condition and results of operations.
Revenue Recognition
Revenues are recognized when control of the promised goods or services is transferred to our clients in an amount that reflects the consideration we expect to be entitled to for those goods or services. Substantially all of our revenues are revenues from contracts with clients. Sales and other applicable taxes are excluded from revenues.
Recurring revenues are derived primarily from our talent acquisition, time and labor management, payroll, talent management and HR management applications as well as fees charged for form filings and delivery of client payroll checks and reports. Talent acquisition includes our Applicant Tracking, Candidate Tracker, Enhanced Background Checks, Onboarding, E-Verify and Tax Credits applications. Time and labor management includes Time and Attendance, Scheduling, Time-Off Requests with GONE, Labor Allocation, Labor Management Reports/Push Reporting, Geofencing/Geotracking and Microfence tools and applications. Payroll includes Beti, Payroll and Tax Management, Vault, Everyday, Paycom Pay, Client Action Center, Expense Management, Mileage Tracker/FAVR, Garnishment Administration and GL Concierge applications. Talent management includes our Employee Self-Service, Compensation Budgeting, Performance Management, Position Management, My Analytics and Paycom Learning applications. HR management includes our Manager on-the-Go, Direct Data Exchange, Ask Here, Documents and Checklists, Government and Compliance, Benefits Administration/Benefits to Carrier, Benefit Enrollment Service, COBRA Administration, Personnel Action Forms and Performance Discussion Forms, Surveys, Enhanced ACA and Clue applications. With Global HCM, a number of our HCM applications and tools are available in 15 languages and dialects and are accessible to users in more than 180 countries.
The performance obligations related to recurring revenues are generally satisfied during each client’s payroll period, with the agreed-upon fee being charged and collected as part of our processing of the client’s payroll. Recurring revenues are recognized at the conclusion of processing of each client’s payroll period, when each respective payroll client is billed. Collectability is reasonably assured as the fees are generally collected through an automated clearing house as part of the client’s payroll cycle or through direct wire transfer, which minimizes the default risk.
The contract period for substantially all contracts associated with these revenues is one month due to the fact that both we and the client have the unilateral right to terminate a wholly unperformed contract without compensating the other party by providing 30 days’ notice of termination. Our payroll application is the foundation of our solution, and all of our clients are required to utilize this application in order to access our other applications. For clients who purchase multiple applications, due to the short-term nature of our contracts, we do not believe it is meaningful to separately assess and identify whether or not each application potentially represents its own, individual, performance obligation as the revenue generated from each application is recognized within the same month as the revenue from the core payroll application. Similarly, we do not believe it is meaningful to individually determine the standalone selling price for each application. We consider the total price charged to a client in a given period to be indicative of the standalone selling price, as the total amount charged is within a reasonable range of prices typically charged for our goods and services for comparable classes of client groups, which we periodically assess for price adjustments.
Interest income on funds held for clients is earned on funds that are collected from clients in advance of either the applicable due date for payroll tax submissions or the applicable disbursement date for employee payment services. The interest earned on these funds is included in recurring revenues in the consolidated statements of comprehensive income, as the collection, holding, and remittance of these funds are essential components of providing these services.
Implementation and other revenues consist of nonrefundable upfront conversion fees which are charged to new clients to offset the expense of new client set-up as well as revenues from the sale of time clocks as part of our time and attendance application. Although these revenues are related to our recurring revenues, they represent distinct performance obligations.
Implementation activities primarily represent administrative activities that allow us to fulfill future performance obligations for our clients and do not represent services transferred to the client. However, the nonrefundable upfront fee charged to our clients results in an implied performance obligation in the form of a material right to the client related to the client’s option to renew at the end of each 30-day contract period. Further, given that all other services within the contract are sold at a total price indicative of the standalone selling price, coupled with the fact that the upfront fees are consistent with upfront fees charged in similar contracts that we have with clients, the standalone selling price of the client’s option to renew the contract approximates the dollar amount of the nonrefundable upfront fee. The nonrefundable upfront fee is typically included on the client’s first invoice, and is deferred and recognized ratably over the estimated renewal period (i.e. ten-year estimated client life).
Revenues from the sale of time clocks are recognized when control is transferred to the client upon delivery of the product. We estimate the standalone selling price for the time clocks by maximizing the use of observable inputs such as our specific pricing practices for time clocks.
Goodwill and Other Intangible Assets
Goodwill is not amortized, but we are required to test the carrying value of goodwill for impairment at least annually, or earlier if, at the reporting unit level, an indicator of impairment arises. Our business is largely homogeneous and, as a result, goodwill is
associated with one reporting unit. We have selected June 30 as our annual goodwill impairment testing date. A review of goodwill may be initiated before or after conducting the annual analysis if events or changes in circumstances indicate the carrying value of goodwill may no longer be recoverable. The Company performed a qualitative assessment to determine if it is more-likely-than-not that the fair value of the reporting units had declined below its carrying value. In the qualitative assessment, we consider the macroeconomic conditions, including any deterioration of general economic conditions, industry and market conditions, including any deterioration in the environment where the reporting unit operates, changes in the products/services and regulator and political developments; cost of doing business; overall financial performance; other relevant reporting unit specific facts, such as changes in management or key personnel or pending litigation. Based on our assessment, there was no impairment recorded as of June 30, 2023. For the years ended December 31, 2023, 2022 and 2021, there were no indicators of impairment. Intangible assets with definite lives are amortized on a straight-line basis over their estimated useful lives.
Impairment of Long-Lived Assets
Long-lived assets, including intangible assets with finite lives, are reviewed for impairment when events or changes in circumstances indicate that the carrying amount of an asset may not be recoverable. Recoverability of assets to be held and used is measured by a comparison of the carrying amount of an asset to estimated undiscounted future cash flows expected to be generated by the asset. If the carrying amount of an asset exceeds its estimated future cash flows, an impairment charge is recognized for the amount by which the carrying amount of the asset exceeds the estimated fair value of the asset. We have determined that there was no impairment of long-lived assets for the years ended December 31, 2023, 2022 and 2021.
Market-Based Restricted Stock Awards and Performance-Based Restricted Stock Units
We measure non-cash stock-based compensation expense based on the fair value of the award on the date of grant. We determine the fair value of stock and unit awards issued by using a Monte Carlo simulation model. This model considers various subjective assumptions as inputs, and represent our best estimates, which involve inherent uncertainties and the application of our judgment as it relates to market volatilities, the historical volatility of our stock price, risk-free rates and expected life. The valuation model also incorporates exercise and forfeiture assumptions based on an analysis of historical data. Determining these assumptions is subjective and complex, and therefore, a change in the assumptions utilized could impact the calculation of the fair value of our market-based stock awards and performance-based restricted stock units and the associated compensation expense. Refer to Note 12 in the notes to our consolidated financial statements for further information regarding our stock-based compensation awards.
Recent Accounting Pronouncements
Refer to Note 2 in the notes to the consolidated financial statements for a full description of recent accounting pronouncements.
Non-GAAP Financial Measures
Management uses adjusted EBITDA and non-GAAP net income as supplemental measures to review and assess the performance of our core business operations and for planning purposes. We define (i) adjusted EBITDA as net income plus interest expense, taxes, depreciation and amortization, non-cash stock-based compensation expense, certain transaction expenses that are not core to our operations (if any), the change in fair value of our interest rate swap (if any) and any loss on the extinguishment of debt and (ii) non-GAAP net income as net income plus non-cash stock-based compensation expense, certain transaction expenses that are not core to our operations (if any), the change in fair value of our interest rate swap (if any) and any loss on the extinguishment of debt, all of which are adjusted for the effect of income taxes. Adjusted EBITDA and non-GAAP net income are metrics that provide investors with greater transparency to the information used by management in its financial and operational decision-making. We believe these metrics are useful to investors because they facilitate comparisons of our core business operations across periods on a consistent basis, as well as comparisons with the results of peer companies, many of which use similar non-GAAP financial measures to supplement results under U.S. GAAP. In addition, adjusted EBITDA is a measure that provides useful information to management about the amount of cash available for reinvestment in our business, paying dividends, repurchasing common stock and other purposes. Management believes that the non-GAAP measures presented in this Form 10-K, when viewed in combination with our results prepared in accordance with U.S. GAAP, provide a more complete understanding of the factors and trends affecting our business and performance.
Adjusted EBITDA and non-GAAP net income are not measures of financial performance under U.S. GAAP, and should not be considered a substitute for net income, which we consider to be the most directly comparable U.S. GAAP measure. Adjusted EBITDA and non-GAAP net income have limitations as analytical tools, and when assessing our operating performance, you should not consider adjusted EBITDA or non-GAAP net income in isolation, or as a substitute for net income or other consolidated statements of comprehensive income data prepared in accordance with U.S. GAAP. Adjusted EBITDA and non-GAAP net income may not be comparable to similarly titled measures of other companies and other companies may not calculate such measures in the same manner as we do.
The following tables reconcile net income to adjusted EBITDA, net income to non-GAAP net income and earnings per share to non-GAAP net income per share on a basic and diluted basis. Refer to “Item 7. Management’s Discussion and Analysis of Financial Condition and Results of Operations” in the Annual Report on Form 10-K for the year ended December 31, 2022, filed with the SEC on February 16, 2023, for a presentation of the amounts for the year ended December 31, 2021.
|
|
|
|
|
|
|
|
|
Year Ended December 31, |
|
|
2023 |
|
|
2022 |
|
Net income to adjusted EBITDA: |
|
|
|
|
|
Net income |
$ |
340,788 |
|
|
$ |
281,389 |
|
Interest expense |
|
1,927 |
|
|
|
2,536 |
|
Provision for income taxes |
|
131,611 |
|
|
|
108,189 |
|
Depreciation and amortization |
|
113,948 |
|
|
|
92,699 |
|
EBITDA |
|
588,274 |
|
|
|
484,813 |
|
Non-cash stock-based compensation expense |
|
129,806 |
|
|
|
94,898 |
|
Loss on extinguishment of debt |
|
1,222 |
|
|
|
— |
|
Adjusted EBITDA |
$ |
719,302 |
|
|
$ |
579,711 |
|
|
|
|
|
|
|
|
|
|
Year Ended December 31, |
|
|
2023 |
|
|
2022 |
|
Net income to non-GAAP net income: |
|
|
|
|
|
Net income |
$ |
340,788 |
|
|
$ |
281,389 |
|
Non-cash stock-based compensation expense |
|
129,806 |
|
|
|
94,898 |
|
Loss on extinguishment of debt |
|
1,222 |
|
|
|
— |
|
Income tax effect on non-GAAP adjustments |
|
(22,331 |
) |
|
|
(19,053 |
) |
Non-GAAP net income |
$ |
449,485 |
|
|
$ |
357,234 |
|
|
|
|
|
|
|
Weighted average shares outstanding: |
|
|
|
|
|
Basic |
|
57,707 |
|
|
|
57,928 |
|
Diluted |
|
57,974 |
|
|
|
58,175 |
|
|
|
|
|
|
|
Earnings per share, basic |
$ |
5.91 |
|
|
$ |
4.86 |
|
Earnings per share, diluted |
$ |
5.88 |
|
|
$ |
4.84 |
|
Non-GAAP net income per share, basic |
$ |
7.79 |
|
|
$ |
6.17 |
|
Non-GAAP net income per share, diluted |
$ |
7.75 |
|
|
$ |
6.14 |
|
|
|
|
|
|
|
|
|
|
Year Ended December 31, |
|
|
2023 |
|
|
2022 |
|
Earnings per share to non-GAAP net income per share, basic: |
|
|
|
|
|
Earnings per share, basic |
$ |
5.91 |
|
|
$ |
4.86 |
|
Non-cash stock-based compensation expense |
|
2.25 |
|
|
|
1.64 |
|
Loss on extinguishment of debt |
|
0.02 |
|
|
|
— |
|
Income tax effect on non-GAAP adjustments |
|
(0.39 |
) |
|
|
(0.33 |
) |
Non-GAAP net income per share, basic |
$ |
7.79 |
|
|
$ |
6.17 |
|
|
|
|
|
|
|
|
Year Ended December 31, |
|
|
2023 |
|
|
2022 |
|
Earnings per share to non-GAAP net income per share, diluted: |
|
|
|
|
|
Earnings per share, diluted |
$ |
5.88 |
|
|
$ |
4.84 |
|
Non-cash stock-based compensation expense |
|
2.24 |
|
|
|
1.63 |
|
Loss on extinguishment of debt |
|
0.02 |
|
|
|
— |
|
Income tax effect on non-GAAP adjustments |
|
(0.39 |
) |
|
|
(0.33 |
) |
Non-GAAP net income per share, diluted |
$ |
7.75 |
|
|
$ |
6.14 |
|
Item 7A. Quantitative and Qualitative Disclosures about Market Risk
Interest rate sensitivity
As of December 31, 2023, we had corporate cash and cash equivalents totaling $294.0 million and funds held for clients cash and cash equivalents totaling $2.3 billion. These amounts are invested primarily in demand deposit accounts and money market funds. We consider all highly liquid debt instruments with an original maturity of three months or less and SEC-registered money market mutual funds to be cash equivalents. Additionally, we had available-for-sale securities totaling $198.6 million included within funds held for clients on the consolidated balance sheets as of December 31, 2023. Our available-for-sale securities consisted of U.S. treasury securities with an original maturity greater than one year and certificates of deposit. The primary objectives of our investing activities are capital preservation, meeting our liquidity needs and, with respect to investing client funds, generating interest income while maintaining the safety of principal. We do not enter into investments for trading or speculative purposes.
Our investments are subject to market risk due to changes in interest rates. The market value of fixed rate securities may be adversely affected due to a rise in interest rates, while floating rate securities may produce less income than expected if interest rates fall. Due in part to these factors, our future investment income may fall short of expectations due to changes in interest rates, or we may suffer losses in principal if we are forced to sell securities that decline in market value due to changes in interest rates. We classify all debt securities as available-for-sale and, as a result, no gains or losses are recognized due to changes in interest rates until such securities are sold or decreases in fair value are determined to be nonrecoverable. To date, we have not recorded any credit impairment losses on our portfolio.
As of December 31, 2023, a hypothetical increase or decrease in interest rates of 100 basis points would result in an approximately $19.2 million increase or decrease, respectively, in interest earned on funds held for clients over the ensuing 12-month period. Interest earned on funds held for clients is included in recurring revenues in the consolidated statements of comprehensive income. There are no incremental costs of revenue associated with changes in interest earned on funds held for clients.
An immediate increase in interest rates of 100 basis points would have resulted in a $0.5 million reduction in the aggregate market value of our fixed rate securities as of December 31, 2023. An immediate decrease in interest rates of 100 basis points would have resulted in a $0.5 million increase in the aggregate market value of our fixed rate securities as of December 31, 2023. These estimates are based on a sensitivity model that measures market value changes when changes in interest rates occur.
As of December 31, 2023, we did not have any indebtedness outstanding under the Revolving Credit Facility. As of December 31, 2023, a hypothetical 100 basis point change in the applicable reference rates would not result in a change our interest expense over the ensuing 12-month period. Please refer to “Note 6. Long-Term Debt” for additional information.
Item 8. Financial Statements and Supplementary Data
INDEX TO CONSOLIDATED FINANCIAL STATEMENTS
|
|
|
Page |
Paycom Software, Inc. |
|
Consolidated Annual Financial Statements |
|
Report of Independent Registered Public Accounting Firm (PCAOB ID Number 248) |
56 |
Consolidated Balance Sheets as of December 31, 2023 and 2022 |
58 |
Consolidated Statements of Comprehensive Income, Years Ended December 31, 2023, 2022 and 2021 |
59 |
Consolidated Statements of Stockholders’ Equity, Years Ended December 31, 2023, 2022 and 2021 |
60 |
Consolidated Statements of Cash Flows, Years Ended December 31, 2023, 2022 and 2021 |
61 |
Notes to the Consolidated Financial Statements |
63 |
REPORT OF INDEPENDENT REGISTERED PUBLIC ACCOUNTING FIRM
Board of Directors and Stockholders
Paycom Software, Inc.
Opinion on the financial statements
We have audited the accompanying consolidated balance sheets of Paycom Software, Inc. (a Delaware corporation) and subsidiaries (the “Company”) as of December 31, 2023 and 2022, the related consolidated statements of comprehensive income, changes in stockholders’ equity, and cash flows for each of the three years in the period ended December 31, 2023, and the related notes (collectively referred to as the “financial statements”). In our opinion, the financial statements present fairly, in all material respects, the financial position of the Company as of December 31, 2023 and 2022, and the results of its operations and its cash flows for each of the three years in the period ended December 31, 2023, in conformity with accounting principles generally accepted in the United States of America.
We also have audited, in accordance with the standards of the Public Company Accounting Oversight Board (United States) (“PCAOB”), the Company’s internal control over financial reporting as of December 31, 2023, based on criteria established in the 2013 Internal Control—Integrated Framework issued by the Committee of Sponsoring Organizations of the Treadway Commission (“COSO”), and our report dated February 15, 2024 expressed an unqualified opinion.
Basis for opinion
These financial statements are the responsibility of the Company’s management. Our responsibility is to express an opinion on the Company’s financial statements based on our audits. We are a public accounting firm registered with the PCAOB and are required to be independent with respect to the Company in accordance with the U.S. federal securities laws and the applicable rules and regulations of the Securities and Exchange Commission and the PCAOB.
We conducted our audits in accordance with the standards of the PCAOB. Those standards require that we plan and perform the audit to obtain reasonable assurance about whether the financial statements are free of material misstatement, whether due to error or fraud. Our audits included performing procedures to assess the risks of material misstatement of the financial statements, whether due to error or fraud, and performing procedures that respond to those risks. Such procedures included examining, on a test basis, evidence regarding the amounts and disclosures in the financial statements. Our audits also included evaluating the accounting principles used and significant estimates made by management, as well as evaluating the overall presentation of the financial statements. We believe that our audits provide a reasonable basis for our opinion.
Critical audit matter
The critical audit matter communicated below is a matter arising from the current period audit of the financial statements that was communicated or required to be communicated to the audit committee and that: (1) relates to accounts or disclosures that are material to the financial statements and (2) involved our especially challenging, subjective, or complex judgments. The communication of critical audit matters does not alter in any way our opinion on the financial statements, taken as a whole, and we are not, by communicating the critical audit matter below, providing a separate opinion on the critical audit matter or on the accounts or disclosures to which it relates.
Deferred implementation revenue and contract costs amortization period
As described further in Note 2 to the financial statements, the Company capitalizes costs associated with obtaining and fulfilling revenue contracts when it expects the amortization period to be longer than one year. The resulting assets are amortized over the expected period of benefit of ten years, which the Company has determined to be the estimated life of a client relationship. The Company also uses the estimated client relationship period in recognizing deferred implementation revenue. We identified the amortization period of both the deferred contract costs as well as the deferred implementation revenue as a critical audit matter.
The principal considerations for our determination that the amortization period of both the deferred contract costs as well as the deferred implementation revenue is a critical audit matter are as follows. Given the materiality of the balances of deferred contract costs and deferred implementation revenue, this assumption is considered sensitive as a change could yield a material impact on the financial statements. Auditing the estimated life of the Company’s client relationships required significant auditor judgment in planning and executing the appropriate audit procedures.
Our audit procedures related to the estimated life of the Company’s client relationships included the following, among others. We tested the design and operating effectiveness of controls relating to management’s annual review of the reasonableness of the estimated life of a client relationship, including controls over the completeness of key inputs in the calculation and the review of the methodology applied by the Company’s third-party specialist. With the assistance of a valuation specialist, we tested the methodologies used in determining the appropriateness of the estimated life by evaluating the relationship between the average life of a client and the associated attrition rate for reasonableness. This included reperforming the calculation and verifying that all provided historical data was utilized in the analysis. We also performed procedures over the data utilized in the analysis, including comparing a sample of historical data to previously audited information.
/s/ GRANT THORNTON LLP
We have served as the Company’s auditor since 2009.
Oklahoma City, Oklahoma
February 15, 2024
Paycom Software, Inc.
Consolidated Balance Sheets
(in thousands, except per share amounts)
|
|
|
|
|
|
|
|
|
|
|
December 31, 2023 |
|
|
December 31, 2022 |
|
Assets |
|
|
|
|
|
|
Current assets: |
|
|
|
|
|
|
Cash and cash equivalents |
|
$ |
294,025 |
|
|
$ |
400,730 |
|
Accounts receivable |
|
|
16,442 |
|
|
|
22,843 |
|
Prepaid expenses |
|
|
37,613 |
|
|
|
34,056 |
|
Inventory |
|
|
1,383 |
|
|
|
1,607 |
|
Income tax receivable |
|
|
18,391 |
|
|
|
5,583 |
|
Deferred contract costs |
|
|
118,206 |
|
|
|
96,378 |
|
Current assets before funds held for clients |
|
|
486,060 |
|
|
|
561,197 |
|
Funds held for clients |
|
|
2,327,366 |
|
|
|
2,202,975 |
|
Total current assets |
|
|
2,813,426 |
|
|
|
2,764,172 |
|
Property and equipment, net |
|
|
498,197 |
|
|
|
402,448 |
|
Intangible assets, net |
|
|
50,112 |
|
|
|
54,017 |
|
Goodwill |
|
|
51,889 |
|
|
|
51,889 |
|
Long-term deferred contract costs |
|
|
680,272 |
|
|
|
567,974 |
|
Other assets |
|
|
103,643 |
|
|
|
62,013 |
|
Total assets |
|
$ |
4,197,539 |
|
|
$ |
3,902,513 |
|
Liabilities and Stockholders’ Equity |
|
|
|
|
|
|
Current liabilities: |
|
|
|
|
|
|
Accounts payable |
|
$ |
13,875 |
|
|
$ |
16,054 |
|
Accrued commissions and bonuses |
|
|
30,492 |
|
|
|
28,439 |
|
Accrued payroll and vacation |
|
|
56,086 |
|
|
|
45,023 |
|
Deferred revenue |
|
|
22,812 |
|
|
|
19,825 |
|
Accrued expenses and other current liabilities |
|
|
83,302 |
|
|
|
59,990 |
|
Current liabilities before client funds obligation |
|
|
206,567 |
|
|
|
169,331 |
|
Client funds obligation |
|
|
2,328,076 |
|
|
|
2,207,706 |
|
Total current liabilities |
|
|
2,534,643 |
|
|
|
2,377,037 |
|
Deferred income tax liabilities, net |
|
|
143,750 |
|
|
|
141,033 |
|
Long-term deferred revenue |
|
|
107,657 |
|
|
|
97,591 |
|
Long-term debt |
|
|
— |
|
|
|
29,000 |
|
Other long-term liabilities |
|
|
108,453 |
|
|
|
75,245 |
|
Total long-term liabilities |
|
|
359,860 |
|
|
|
342,869 |
|
Total liabilities |
|
|
2,894,503 |
|
|
|
2,719,906 |
|
Commitments and contingencies |
|
|
|
|
|
|
Stockholders’ equity: |
|
|
|
|
|
|
Common stock, $0.01 par value (100,000 shares authorized, 62,675 and 62,518 shares issued at December 31, 2023 and December 31, 2022, respectively; 56,528 and 57,867 shares outstanding at December 31, 2023 and December 31, 2022, respectively) |
|
|
627 |
|
|
|
625 |
|
Additional paid-in capital |
|
|
724,493 |
|
|
|
576,622 |
|
Retained earnings |
|
|
1,469,981 |
|
|
|
1,196,968 |
|
Accumulated other comprehensive earnings (loss) |
|
|
(1,039 |
) |
|
|
(3,703 |
) |
Treasury stock, at cost (6,147 and 4,651 shares at December 31, 2023 and December 31, 2022, respectively) |
|
|
(891,026 |
) |
|
|
(587,905 |
) |
Total stockholders’ equity |
|
|
1,303,036 |
|
|
|
1,182,607 |
|
Total liabilities and stockholders’ equity |
|
$ |
4,197,539 |
|
|
$ |
3,902,513 |
|
See accompanying notes to the consolidated financial statements.
Paycom Software, Inc.
Consolidated Statements of Comprehensive Income
(in thousands, except per share amounts)
|
|
|
|
|
|
|
|
|
|
|
|
|
|
|
Year Ended December 31, |
|
|
|
2023 |
|
|
2022 |
|
|
2021 |
|
Revenues |
|
|
|
|
|
|
|
|
|
Recurring |
|
$ |
1,664,976 |
|
|
$ |
1,351,856 |
|
|
$ |
1,036,691 |
|
Implementation and other |
|
|
28,698 |
|
|
|
23,362 |
|
|
|
18,833 |
|
Total revenues |
|
|
1,693,674 |
|
|
|
1,375,218 |
|
|
|
1,055,524 |
|
Cost of revenues |
|
|
|
|
|
|
|
|
|
Operating expenses |
|
|
223,699 |
|
|
|
169,806 |
|
|
|
130,475 |
|
Depreciation and amortization |
|
|
52,591 |
|
|
|
42,935 |
|
|
|
31,411 |
|
Total cost of revenues |
|
|
276,290 |
|
|
|
212,741 |
|
|
|
161,886 |
|
Administrative expenses |
|
|
|
|
|
|
|
|
|
Sales and marketing |
|
|
417,617 |
|
|
|
346,561 |
|
|
|
275,994 |
|
Research and development |
|
|
198,951 |
|
|
|
148,343 |
|
|
|
118,426 |
|
General and administrative |
|
|
288,137 |
|
|
|
239,130 |
|
|
|
209,840 |
|
Depreciation and amortization |
|
|
61,357 |
|
|
|
49,764 |
|
|
|
35,811 |
|
Total administrative expenses |
|
|
966,062 |
|
|
|
783,798 |
|
|
|
640,071 |
|
Total operating expenses |
|
|
1,242,352 |
|
|
|
996,539 |
|
|
|
801,957 |
|
Operating income |
|
|
451,322 |
|
|
|
378,679 |
|
|
|
253,567 |
|
Interest expense |
|
|
(1,927 |
) |
|
|
(2,536 |
) |
|
|
— |
|
Other income (expense), net |
|
|
23,004 |
|
|
|
13,435 |
|
|
|
2,395 |
|
Income before income taxes |
|
|
472,399 |
|
|
|
389,578 |
|
|
|
255,962 |
|
Provision for income taxes |
|
|
131,611 |
|
|
|
108,189 |
|
|
|
60,002 |
|
Net income |
|
$ |
340,788 |
|
|
$ |
281,389 |
|
|
$ |
195,960 |
|
Earnings per share, basic |
|
$ |
5.91 |
|
|
$ |
4.86 |
|
|
$ |
3.39 |
|
Earnings per share, diluted |
|
$ |
5.88 |
|
|
$ |
4.84 |
|
|
$ |
3.37 |
|
Weighted average shares outstanding: |
|
|
|
|
|
|
|
|
|
Basic |
|
|
57,707 |
|
|
|
57,928 |
|
|
|
57,885 |
|
Diluted |
|
|
57,974 |
|
|
|
58,175 |
|
|
|
58,191 |
|
Comprehensive earnings (loss): |
|
|
|
|
|
|
|
|
|
Net income |
|
$ |
340,788 |
|
|
$ |
281,389 |
|
|
$ |
195,960 |
|
Unrealized net gains (losses) on available-for-sale securities |
|
|
3,501 |
|
|
|
(4,757 |
) |
|
|
— |
|
Tax effect |
|
|
(837 |
) |
|
|
1,054 |
|
|
|
— |
|
Other comprehensive income (loss), net of tax |
|
|
2,664 |
|
|
|
(3,703 |
) |
|
|
— |
|
Comprehensive earnings (loss) |
|
$ |
343,452 |
|
|
$ |
277,686 |
|
|
$ |
195,960 |
|
See accompanying notes to the consolidated financial statements.
Paycom Software, Inc.
Consolidated Statements of Stockholders’ Equity
(in thousands)
|
|
|
|
|
|
|
|
|
|
|
|
|
|
|
|
|
|
|
|
|
|
|
|
|
|
|
|
|
|
|
|
|
Common Stock |
|
|
Additional |
|
|
Retained |
|
|
Accumulated Other |
|
|
Treasury Stock |
|
|
Total |
|
|
Shares |
|
|
Amount |
|
|
Paid-in Capital |
|
|
Earnings |
|
|
Comprehensive Loss |
|
|
Shares |
|
|
Amount |
|
|
Stockholders’ Equity |
|
Balances at December 31, 2020 |
|
61,861 |
|
|
$ |
618 |
|
|
$ |
357,908 |
|
|
$ |
719,619 |
|
|
$ |
— |
|
|
|
4,122 |
|
|
$ |
(422,502 |
) |
|
$ |
655,643 |
|
Vesting of restricted stock |
|
437 |
|
|
|
5 |
|
|
|
(5 |
) |
|
|
— |
|
|
|
— |
|
|
|
— |
|
|
|
— |
|
|
|
— |
|
Stock-based compensation |
|
— |
|
|
|
— |
|
|
|
107,691 |
|
|
|
— |
|
|
|
— |
|
|
|
— |
|
|
|
— |
|
|
|
107,691 |
|
Repurchases of common stock |
|
— |
|
|
|
— |
|
|
|
— |
|
|
|
— |
|
|
|
— |
|
|
|
164 |
|
|
|
(65,580 |
) |
|
|
(65,580 |
) |
Net income |
|
— |
|
|
|
— |
|
|
|
— |
|
|
|
195,960 |
|
|
|
— |
|
|
|
— |
|
|
|
— |
|
|
|
195,960 |
|
Other comprehensive earnings (loss), net of tax |
|
— |
|
|
|
— |
|
|
|
— |
|
|
|
— |
|
|
|
— |
|
|
|
— |
|
|
|
— |
|
|
|
— |
|
Balances at December 31, 2021 |
|
62,298 |
|
|
$ |
623 |
|
|
$ |
465,594 |
|
|
$ |
915,579 |
|
|
$ |
— |
|
|
|
4,286 |
|
|
$ |
(488,082 |
) |
|
$ |
893,714 |
|
Vesting of restricted stock |
|
220 |
|
|
|
2 |
|
|
|
(2 |
) |
|
|
— |
|
|
|
— |
|
|
|
— |
|
|
|
— |
|
|
|
— |
|
Stock-based compensation |
|
— |
|
|
|
— |
|
|
|
111,030 |
|
|
|
— |
|
|
|
— |
|
|
|
— |
|
|
|
— |
|
|
|
111,030 |
|
Repurchases of common stock |
|
— |
|
|
|
— |
|
|
|
— |
|
|
|
— |
|
|
|
— |
|
|
|
365 |
|
|
|
(99,823 |
) |
|
|
(99,823 |
) |
Net income |
|
— |
|
|
|
— |
|
|
|
— |
|
|
|
281,389 |
|
|
|
— |
|
|
|
— |
|
|
|
— |
|
|
|
281,389 |
|
Other comprehensive earnings (loss), net of tax |
|
— |
|
|
|
— |
|
|
|
— |
|
|
|
— |
|
|
|
(3,703 |
) |
|
|
— |
|
|
|
— |
|
|
|
(3,703 |
) |
Balances at December 31, 2022 |
|
62,518 |
|
|
$ |
625 |
|
|
$ |
576,622 |
|
|
$ |
1,196,968 |
|
|
$ |
(3,703 |
) |
|
|
4,651 |
|
|
$ |
(587,905 |
) |
|
$ |
1,182,607 |
|
Vesting of restricted stock |
|
157 |
|
|
|
2 |
|
|
|
(1 |
) |
|
|
— |
|
|
|
— |
|
|
|
— |
|
|
|
— |
|
|
|
1 |
|
Stock-based compensation |
|
— |
|
|
|
— |
|
|
|
147,872 |
|
|
|
— |
|
|
|
— |
|
|
|
— |
|
|
|
— |
|
|
|
147,872 |
|
Dividends declared ($0.375 per share) |
|
— |
|
|
|
— |
|
|
|
— |
|
|
|
(67,775 |
) |
|
|
— |
|
|
|
— |
|
|
|
— |
|
|
|
(67,775 |
) |
Repurchases of common stock |
|
— |
|
|
|
— |
|
|
|
— |
|
|
|
— |
|
|
|
— |
|
|
|
1,496 |
|
|
|
(303,121 |
) |
|
|
(303,121 |
) |
Net income |
|
— |
|
|
|
— |
|
|
|
— |
|
|
|
340,788 |
|
|
|
— |
|
|
|
— |
|
|
|
— |
|
|
|
340,788 |
|
Other comprehensive earnings (loss), net of tax |
|
— |
|
|
|
— |
|
|
|
— |
|
|
|
— |
|
|
|
2,664 |
|
|
|
— |
|
|
|
— |
|
|
|
2,664 |
|
Balances at December 31, 2023 |
|
62,675 |
|
|
$ |
627 |
|
|
$ |
724,493 |
|
|
$ |
1,469,981 |
|
|
$ |
(1,039 |
) |
|
|
6,147 |
|
|
$ |
(891,026 |
) |
|
$ |
1,303,036 |
|
See accompanying notes to the consolidated financial statements.
Paycom Software, Inc.
Consolidated Statements of Cash Flows
(in thousands)
|
|
|
|
|
|
|
|
|
|
|
|
|
|
|
Year Ended December 31, |
|
|
|
2023 |
|
|
2022 |
|
|
2021 |
|
Cash flows from operating activities |
|
|
|
|
|
|
|
|
|
Net income |
|
$ |
340,788 |
|
|
$ |
281,389 |
|
|
$ |
195,960 |
|
Adjustments to reconcile net income to net cash provided by operating activities: |
|
|
|
|
|
|
|
|
|
Depreciation and amortization |
|
|
113,948 |
|
|
|
92,699 |
|
|
|
67,222 |
|
Accretion of discount on available-for-sale securities |
|
|
(520 |
) |
|
|
(1,020 |
) |
|
|
(452 |
) |
Non-cash marketing expense |
|
|
1,658 |
|
|
|
1,734 |
|
|
|
1,051 |
|
Loss (Gain) on disposition of property and equipment |
|
|
23 |
|
|
|
(150 |
) |
|
|
146 |
|
Amortization of debt issuance costs |
|
|
1,225 |
|
|
|
847 |
|
|
|
36 |
|
Stock-based compensation expense |
|
|
129,806 |
|
|
|
94,898 |
|
|
|
97,506 |
|
Loss on extinguishment of debt |
|
|
1,222 |
|
|
|
— |
|
|
|
— |
|
Cash paid for derivative settlement |
|
|
— |
|
|
|
205 |
|
|
|
(741 |
) |
Gain on derivative |
|
|
— |
|
|
|
(1,559 |
) |
|
|
(662 |
) |
Deferred income taxes, net |
|
|
2,557 |
|
|
|
(3,210 |
) |
|
|
32,906 |
|
Other |
|
|
122 |
|
|
|
(206 |
) |
|
|
— |
|
Changes in operating assets and liabilities: |
|
|
|
|
|
|
|
|
|
Accounts receivable |
|
|
6,401 |
|
|
|
(13,353 |
) |
|
|
(360 |
) |
Prepaid expenses |
|
|
(6,617 |
) |
|
|
(6,497 |
) |
|
|
(5,875 |
) |
Inventory |
|
|
224 |
|
|
|
(224 |
) |
|
|
481 |
|
Other assets |
|
|
(43,431 |
) |
|
|
(13,907 |
) |
|
|
(7,862 |
) |
Deferred contract costs |
|
|
(127,657 |
) |
|
|
(122,440 |
) |
|
|
(103,356 |
) |
Accounts payable |
|
|
(5,155 |
) |
|
|
11,676 |
|
|
|
(660 |
) |
Income taxes, net |
|
|
(12,808 |
) |
|
|
10,830 |
|
|
|
(5,966 |
) |
Accrued commissions and bonuses |
|
|
2,053 |
|
|
|
6,082 |
|
|
|
8,654 |
|
Accrued payroll and vacation |
|
|
11,063 |
|
|
|
10,764 |
|
|
|
9,730 |
|
Deferred revenue |
|
|
13,053 |
|
|
|
15,990 |
|
|
|
14,600 |
|
Accrued expenses and other current liabilities |
|
|
57,082 |
|
|
|
555 |
|
|
|
17,004 |
|
Net cash provided by operating activities |
|
|
485,037 |
|
|
|
365,103 |
|
|
|
319,362 |
|
Cash flows from investing activities |
|
|
|
|
|
|
|
|
|
Purchases of investments from funds held for clients |
|
|
(25,000 |
) |
|
|
(268,718 |
) |
|
|
(398,819 |
) |
Proceeds from investments from funds held for clients |
|
|
25,000 |
|
|
|
382,230 |
|
|
|
267,341 |
|
Purchases of intangible assets |
|
|
(4,244 |
) |
|
|
(4,120 |
) |
|
|
(5,500 |
) |
Purchases of property and equipment |
|
|
(192,587 |
) |
|
|
(132,678 |
) |
|
|
(120,692 |
) |
Proceeds from sale of property and equipment |
|
|
119 |
|
|
|
— |
|
|
|
— |
|
Net cash used in investing activities |
|
|
(196,712 |
) |
|
|
(23,286 |
) |
|
|
(257,670 |
) |
Cash flows from financing activities |
|
|
|
|
|
|
|
|
|
Proceeds from the issuance of debt |
|
|
— |
|
|
|
29,000 |
|
|
|
— |
|
Repurchases of common stock |
|
|
(286,618 |
) |
|
|
(94,652 |
) |
|
|
— |
|
Withholding taxes paid related to net share settlements |
|
|
(13,927 |
) |
|
|
(5,171 |
) |
|
|
(65,580 |
) |
Payments on long-term debt |
|
|
(29,000 |
) |
|
|
(29,287 |
) |
|
|
(1,775 |
) |
Dividends paid |
|
|
(64,838 |
) |
|
|
— |
|
|
|
— |
|
Net change in client funds obligation |
|
|
120,370 |
|
|
|
361,133 |
|
|
|
233,079 |
|
Payment of debt issuance costs |
|
|
(647 |
) |
|
|
(6,436 |
) |
|
|
— |
|
Net cash (used in) provided by financing activities |
|
|
(274,660 |
) |
|
|
254,587 |
|
|
|
165,724 |
|
Increase in cash, cash equivalents, restricted cash and restricted cash equivalents |
|
|
13,665 |
|
|
|
596,404 |
|
|
|
227,416 |
|
Cash, cash equivalents, restricted cash and restricted cash equivalents |
|
|
|
|
|
|
|
|
|
Cash, cash equivalents, restricted cash and restricted cash equivalents, beginning of period |
|
|
2,409,095 |
|
|
|
1,812,691 |
|
|
|
1,585,275 |
|
Cash, cash equivalents, restricted cash and restricted cash equivalents, end of period |
|
$ |
2,422,760 |
|
|
$ |
2,409,095 |
|
|
$ |
1,812,691 |
|
See accompanying notes to the consolidated financial statements.
Paycom Software, Inc.
Consolidated Statements of Cash Flows, continued
(in thousands)
|
|
|
|
|
|
|
|
|
|
|
|
|
|
|
Year Ended December 31, |
|
|
|
2023 |
|
|
2022 |
|
|
2021 |
|
Reconciliation of cash, cash equivalents, restricted cash and restricted cash equivalents |
|
|
|
|
|
|
|
|
|
Cash and cash equivalents |
|
$ |
294,025 |
|
|
$ |
400,730 |
|
|
$ |
277,978 |
|
Restricted cash included in funds held for clients |
|
|
2,128,735 |
|
|
|
2,008,365 |
|
|
|
1,534,713 |
|
Total cash, cash equivalents, restricted cash and restricted cash equivalents, end of period |
|
$ |
2,422,760 |
|
|
$ |
2,409,095 |
|
|
$ |
1,812,691 |
|
|
|
|
|
|
|
|
|
|
|
Supplemental disclosures of cash flow information: |
|
|
|
|
|
|
|
|
|
Cash paid for interest, net of amounts capitalized |
|
$ |
985 |
|
|
$ |
507 |
|
|
$ |
2 |
|
Cash paid for income taxes |
|
$ |
139,914 |
|
|
$ |
100,578 |
|
|
$ |
33,068 |
|
Non-cash investing and financing activities: |
|
|
|
|
|
|
|
|
|
Purchases of property and equipment, accrued but not paid |
|
$ |
9,025 |
|
|
$ |
5,899 |
|
|
$ |
7,581 |
|
Stock-based compensation for capitalized software |
|
$ |
14,657 |
|
|
$ |
8,965 |
|
|
$ |
7,141 |
|
Right of use assets obtained in exchange for operating lease liabilities |
|
$ |
50,315 |
|
|
$ |
21,467 |
|
|
$ |
14,141 |
|
See accompanying notes to the consolidated financial statements.
Paycom Software, Inc.
Notes to the Consolidated Financial Statements
(tabular dollars and shares in thousands, except per share and per unit amounts)
1.ORGANIZATION AND DESCRIPTION OF BUSINESS
Description of Business
Paycom Software, Inc. (“Software”), together with its wholly owned subsidiaries (collectively, the “Company”), is a leading provider of a comprehensive, cloud-based human capital management solution delivered as Software-as-a-Service. Unless we state otherwise or the context otherwise requires, the terms “we,” “our,” “us” and the “Company” refer to Software and its consolidated subsidiaries.
We provide functionality and data analytics that businesses need to manage the complete employment lifecycle, from recruitment to retirement. Our solution requires virtually no customization and is based on a core system of record maintained in a single database for all HCM functions, including talent acquisition, time and labor management, payroll, talent management and human resources management applications.
2.SUMMARY OF SIGNIFICANT ACCOUNTING POLICIES
Basis of Presentation
Our consolidated financial statements include the financial results of Software and its wholly owned subsidiaries and have been prepared in accordance with accounting principles generally accepted in the United States of America (“U.S. GAAP”) and applicable rules and regulations of the Securities and Exchange Commission (“SEC”). Intercompany balances and transactions have been eliminated in consolidation. In the opinion of management, the accompanying consolidated financial statements include all adjustments necessary for the fair presentation for the periods presented.
Recently Adopted Accounting Pronouncements
In March 2020, the Financial Accounting Standards Board (“FASB”) issued ASU No. 2020-04, “Reference Rate Reform (Topic 848) Facilitation of the Effects of Reference Rate Reform on Financial Reporting” (“ASU 2020-04”). ASU 2020-04 provides temporary optional expedients and exceptions for applying U.S. GAAP to contracts, hedging relationships and other transactions affected by reference rate reform. Prior to August 24, 2022, our floating-to-fixed interest rate swap was outstanding to offset the rate variability associated with our outstanding indebtedness. As discussed in Note 7, the interest rate swap was terminated on August 24, 2022. As a result, the adoption of ASU 2020-04 had no material impact on our consolidated financial statements.
In January 2021, the FASB issued ASU No. 2021-01, “Reference Rate Reform (Topic 848) Scope” (“ASU 2021-01”), which clarifies that certain optional expedients and exceptions in Topic 848 for contract modifications and hedge accounting apply to derivative instruments that are affected by the discounting transition. ASU 2021-01 amends the expedients and exceptions in Topic 848 to capture the incremental consequences of the scope clarification and to tailor the existing guidance to derivative instruments affected by the discounting transition. As discussed in Note 7, the interest rate swap was terminated on August 24, 2022. As a result, the adoption of ASU 2021-01 had no material impact on our consolidated financial statements.
Use of Estimates
The preparation of consolidated financial statements in conformity with U.S. GAAP requires management to make estimates and assumptions that affect the amounts reported in the financial statements and accompanying notes. Significant estimates include income taxes, loss contingencies, the useful life of property and equipment and intangible assets, the life of our client relationships, the fair value of our stock-based awards and the fair value of our financial instruments, intangible assets and goodwill. These estimates are based on historical experience, where applicable, and other assumptions that management believes are reasonable under the circumstances. Actual results could materially differ from these estimates.
Segment Information
We operate in a single operating segment and a single reporting segment. Operating segments are defined as components of an enterprise about which separate financial information is evaluated regularly by the chief operating decision maker function (which is fulfilled by the Co-Chief Executive Officers) in deciding how to allocate resources and assessing performance. Our Co-Chief Executive Officers allocate resources and assess performance based upon financial information at the consolidated level. As we operate in one operating segment, all required financial segment information is presented in the consolidated financial statements.
Cash Equivalents
We consider all highly liquid instruments with an original maturity of three months or less and SEC-registered money market mutual funds to be cash equivalents. We maintain cash and cash equivalents in demand deposit accounts, money market funds, and certificates of deposit, which may not be federally insured. The fair value of our cash and cash equivalents approximates carrying
Paycom Software, Inc.
Notes to the Consolidated Financial Statements
(tabular dollars and shares in thousands, except per share and per unit amounts)
value. We have not experienced any losses in such accounts and do not believe there is exposure to any significant credit risk on such accounts.
Accounts Receivable
We generally collect revenues from our clients through an automatic deduction from the clients’ bank accounts at the time payroll processing occurs. Accounts receivable on our consolidated balance sheets generally consists of revenue-related receivables, including processing fees, interest income receivable, and revenue fees related to the last business day of the year, which are collected on the following business day. As accounts receivable are collected via automatic deduction on the following business day, the Company has not recognized an allowance for doubtful accounts.
Property and Equipment
Property and equipment is stated at cost, net of accumulated depreciation and amortization. Depreciation is computed using the straight line method over the estimated useful lives of the assets as follows:
|
|
Furniture, fixtures and equipment |
5 years |
Computer equipment |
3 years |
Software and capitalized software |
3 years |
Buildings |
30 years |
Leasehold improvements |
5 years |
Rental clocks |
5 years |
Land improvements |
15 years |
Vehicles |
3 years |
Costs incurred during construction of long-lived assets are recorded as construction in progress and are not depreciated until the asset is placed in service.
Prior to the repayment of our debt on November 21, 2023, we capitalized interest costs incurred for indebtedness related to construction in progress. For the years ended December 31, 2023, 2022 and 2021, we incurred interest costs of $5.3 million, $3.4 million and $1.4 million, respectively. For the years ended December 31, 2023, 2022 and 2021, interest costs of $3.4 million, $0.9 million and $1.4 million, respectively, were capitalized. See Note 6 for discussion of repayment of our indebtedness.
Leases
Our leases primarily consist of noncancellable operating leases for office space. We recognize a right-of-use asset and operating lease liability on the lease commencement date based on the present value of the lease payments over the lease term. Operating lease liabilities are measured by discounting future lease payments at an estimated incremental borrowing rate. Right-of-use assets are amortized over the lease term and include adjustments related to prepaid rent.
Internal Use Software
Capitalized costs include costs for services associated with developing or obtaining internal use computer software and certain payroll and payroll-related costs for employees who are directly associated with internal use computer software projects. The amount of payroll costs that are capitalized with respect to these employees is limited to the time directly spent on such projects. Expenditures for software purchases and software developed or obtained for internal use are capitalized and amortized over a three-year period on a straight-line basis. Costs associated with preliminary project stage activities, training, maintenance and all other post-implementation stage activities are expensed as incurred. We also expense internal costs related to minor upgrades and enhancements, as it is impractical to separate these costs from normal maintenance activities.
The total capitalized payroll costs related to internal use computer software projects were $96.7 million and $66.4 million during the years ended December 31, 2023 and 2022, respectively, and are included in property and equipment. Amortization expense of capitalized software costs was $61.9 million, $47.3 million and $36.5 million for the years ended December 31, 2023, 2022 and 2021, respectively.
Derivatives
In December 2017, we entered into a floating-to-fixed interest rate swap agreement to limit the exposure to floating interest rate risk related to the 2017 Term Loans (as defined in Note 6). We do not hold derivative instruments for trading or speculative purposes. The interest rate swap agreement effectively converted a portion of the variable interest rate payments to fixed interest rate payments. We account for our derivatives under ASC Topic 815, “Derivatives and Hedging,” and recognize all derivative instruments in the consolidated balance sheets at fair value as either short-term or long-term assets or liabilities based on their anticipated settlement
Paycom Software, Inc.
Notes to the Consolidated Financial Statements
(tabular dollars and shares in thousands, except per share and per unit amounts)
date. See Note 9, “Fair Value of Financial Instruments”. We elected not to designate our interest rate swap as a hedge; therefore, changes in the fair value of the derivative instrument were recognized in our consolidated statements of comprehensive income within Other income (expense), net. As further discussed in Note 7, on August 24, 2022, we terminated the interest rate swap by settling the contract.
Goodwill and Other Intangible Assets
Goodwill is not amortized, but we are required to test the carrying value of goodwill for impairment at least annually, or earlier if, at the reporting unit level, an indicator of impairment arises. Our business is largely homogeneous and, as a result, goodwill is associated with one reporting unit. We have selected June 30 as our annual goodwill impairment testing date. A review of goodwill may be initiated before or after conducting the annual analysis if events or changes in circumstances indicate the carrying value of goodwill may no longer be recoverable. The Company performed a qualitative assessment to determine if it is more-likely-than-not that the fair value of the reporting unit had declined below its carrying value. In the qualitative assessment, we consider macroeconomic conditions, including any deterioration of general economic conditions; industry and market conditions, including any deterioration in the environment where the reporting unit operates; changes in the products/services; regulatory and political developments; cost of doing business; overall financial performance; and other relevant reporting unit specific facts, such as changes in management or key personnel or pending litigation. Based on our assessment, there was no impairment recorded as of June 30, 2023. For the years ended December 31, 2023, 2022 and 2021, there were no indicators of impairment. Intangible assets with definite lives are amortized on a straight-line basis over their estimated useful lives.
Impairment of Long-Lived Assets
Long-lived assets, including intangible assets with definite lives, are reviewed for impairment when events or changes in circumstances indicate that the carrying amount of an asset may not be recoverable. Recoverability of assets to be held and used is measured by a comparison of the carrying amount of an asset to estimated undiscounted future cash flows expected to be generated by the asset. If the carrying amount of an asset exceeds its estimated future cash flows, an impairment charge is recognized for the amount by which the carrying amount of the asset exceeds the estimated fair value of the asset. We have determined that there was no impairment of long-lived assets including intangible assets with definite lives, for the years ended December 31, 2023, 2022 and 2021.
Funds Held for Clients and Client Funds Obligation
As part of our payroll and tax filing services, we (i) collect client funds to satisfy their respective employment tax obligations, (ii) remit such funds to the appropriate taxing authorities and accounts designated by our clients, and (iii) manage client tax filings and any related correspondence with taxing authorities. Amounts collected by us from clients for their employment taxes are invested by us, and we earn interest on these funds during the interval between receipt and disbursement.
These investments are shown in our consolidated balance sheets as funds held for clients, and the associated liability for the tax filings is shown as client funds obligation. The liability is recorded in the accompanying consolidated balance sheets at the time we obtain the funds from clients. The client funds obligation represents liabilities that will be repaid within one year of the consolidated balance sheet date. As of December 31, 2023 and December 31, 2022, the funds held for clients were invested in money market funds, demand deposit accounts and certificates of deposit. Additionally, the funds held for clients were invested in U.S. treasury securities with an original maturity of greater than one year. Historically, we have also invested funds held for clients in commercial paper. Short-term investments in instruments with an original maturity greater than three months, including certificates of deposit, commercial paper and U.S. treasury securities, are classified as available for-sale securities, and are also included within the funds held for clients line item in the consolidated balance sheets. These available-for-sale securities are recorded in the consolidated balance sheets at fair value, with the difference between the amortized cost and fair value of these available-for-sale securities recorded as unrealized net gains (losses) on available-for-sale securities, and are included within comprehensive earnings (loss) in the consolidated statements of comprehensive income. Funds held for clients are classified as a current asset in the consolidated balance sheets because the funds are held solely to satisfy the client funds obligation. Additionally, the funds held for clients is classified as restricted cash and restricted cash equivalents and presented within the reconciliation of cash, cash equivalents, restricted cash and restricted cash equivalents on the consolidated statements of cash flows.
Stock Repurchase Plan
In May 2016, our Board of Directors authorized a stock repurchase plan allowing for the repurchase of shares of our common stock in open market transactions at prevailing market prices, in privately negotiated transactions or by other means in accordance with federal securities laws, including Rule 10b5-1 programs. Since the initial authorization of the stock repurchase plan, our Board of Directors has amended and extended and authorized new stock repurchase plans from time to time. Most recently, in August 2022, our Board of Directors authorized the repurchase of up to $1.1 billion of our common stock. As of December 31, 2023, there was $799.1 million available for repurchases under our stock repurchase plan. Our stock repurchase plan may be suspended or discontinued at any
Paycom Software, Inc.
Notes to the Consolidated Financial Statements
(tabular dollars and shares in thousands, except per share and per unit amounts)
time. The actual timing, number and value of shares repurchased depends on a number of factors, including the market price of our common stock, general market and economic conditions, shares withheld for taxes associated with the vesting of restricted equity incentive awards and other corporate considerations. The current stock repurchase plan will expire on August 15, 2024.
During the year ended December 31, 2023, we repurchased an aggregate of 1,495,752 shares of our common stock at an average cost of $200.93 per share, including 51,119 shares withheld to satisfy tax withholding obligations for certain employees upon the vesting of equity incentive awards. During the year ended December 31, 2022, we repurchased an aggregate of 364,667 shares of our common stock at an average cost of $273.74 per share, including 17,355 shares withheld to satisfy tax withholding obligations for certain employees upon the vesting of the restricted stock.
Revenue Recognition
Revenues are recognized when control of the promised goods or services is transferred to our clients in an amount that reflects the consideration we expect to be entitled to for those goods or services. Substantially all of our revenues are revenues from contracts with clients. Sales taxes and other applicable taxes are excluded from revenues.
Recurring Revenues
Recurring revenues are derived primarily from our talent acquisition, time and labor management, payroll, talent management and HR management applications as well as fees charged for form filings and delivery of client payroll checks and reports. Talent acquisition includes our Applicant Tracking, Candidate Tracker, Enhanced Background Checks, Onboarding, E-Verify and Tax Credits applications. Time and labor management includes Time and Attendance, Scheduling, Time-Off Requests with GONE, Labor Allocation, Labor Management Reports/Push Reporting, Geofencing/Geotracking and Microfence tools and applications. Payroll includes Beti, Payroll and Tax Management, Vault, Everyday, Paycom Pay, Client Action Center, Expense Management, Mileage Tracker/FAVR, Garnishment Administration and GL Concierge applications. Talent management includes our Employee Self-Service, Compensation Budgeting, Performance Management, Position Management, My Analytics and Paycom Learning applications. HR management includes our Manager on-the-Go, Direct Data Exchange, Ask Here, Documents and Checklists, Government and Compliance, Benefits Administration/Benefits to Carrier, Benefit Enrollment Service, COBRA Administration, Personnel Action Forms and Performance Discussion Forms, Surveys, Enhanced ACA and Clue applications. With Global HCM, a number of our HCM applications and tools are available in 15 languages and dialects and are accessible to users in more than 180 countries.
The performance obligations related to recurring revenues are generally satisfied during each client’s payroll period, with the agreed-upon fee being charged and collected as part of our processing of the client’s payroll. Recurring revenues are recognized at the conclusion of processing of each client’s payroll period, when each respective payroll client is billed. Collectability is reasonably assured as the fees are generally collected through an automated clearing house as part of the client’s payroll cycle or through direct wire transfer, which minimizes the default risk.
The contract period for substantially all contracts associated with these revenues is one month due to the fact that both we and the client have the unilateral right to terminate a wholly unperformed contract without compensating the other party by providing 30 days’ notice of termination. Our payroll application is the foundation of our solution, and all of our clients are required to utilize this application in order to access our other applications. For clients who purchase multiple applications, due to the short-term nature of our contracts, we do not believe it is meaningful to separately assess and identify whether or not each application potentially represents its own, individual, performance obligation as the revenue generated from each application is recognized within the same month as the revenue from the core payroll application. Similarly, we do not believe it is meaningful to individually determine the standalone selling price for each application. We consider the total price charged to a client in a given period to be indicative of the standalone selling price, as the total amount charged is within a reasonable range of prices typically charged for our goods and services for comparable classes of client groups, which we periodically assess for price adjustments.
Interest income on funds held for clients is earned on funds that are collected from clients in advance of either the applicable due date for payroll tax submissions or the applicable disbursement date for employee payment services. The interest earned on these funds is included in recurring revenues in the consolidated statements of comprehensive income as the collection, holding, and remittance of these funds are essential components of providing these services.
Implementation and Other Revenues
Implementation and other revenues consist of nonrefundable upfront conversion fees which are charged to new clients to offset the expense of new client set-up as well as revenues from the sale of time clocks as part of our time and attendance application. Although these revenues are related to our recurring revenues, they represent distinct performance obligations.
Paycom Software, Inc.
Notes to the Consolidated Financial Statements
(tabular dollars and shares in thousands, except per share and per unit amounts)
Implementation activities primarily represent administrative activities that allow us to fulfill future performance obligations for our clients and do not represent services transferred to the client. However, the nonrefundable upfront fee charged to our clients results in an implied performance obligation in the form of a material right to the client related to the client’s option to renew at the end of each 30-day contract period. Further, given that all other services within the contract are sold at a total price indicative of the standalone selling price, coupled with the fact that the upfront fees are consistent with upfront fees charged in similar contracts that we have with clients, the standalone selling price of the client’s option to renew the contract approximates the dollar amount of the nonrefundable upfront fee. The nonrefundable upfront fee is typically included on the client’s first invoice, and is deferred and recognized ratably over the estimated renewal period (i.e., ten-year estimated client life).
Revenues from the sale of time clocks are recognized when control is transferred to the client upon delivery of the product. We estimate the standalone selling price for the time clocks by maximizing the use of observable inputs such as our specific pricing practices for time clocks.
Contract Balances
The timing of revenue recognition for recurring services is consistent with the invoicing of clients as they both occur during the respective client payroll period for which the services are provided. Therefore, we do not recognize a contract asset or liability resulting from the timing of revenue recognition and invoicing.
Changes in deferred revenue related to material rights for the years ended December 31, 2023 and 2022 were as follows:
|
|
|
|
|
|
|
|
|
|
|
Year Ended December 31, |
|
|
|
2023 |
|
|
2022 |
|
Balance, beginning of period |
|
$ |
117,416 |
|
|
$ |
101,426 |
|
Recognition of revenue included in beginning of period balance |
|
|
(19,089 |
) |
|
|
(15,949 |
) |
Contract balance, net of revenue recognized during the period |
|
|
32,142 |
|
|
|
31,939 |
|
Balance, end of period |
|
$ |
130,469 |
|
|
$ |
117,416 |
|
We expect to recognize $22.8 million of deferred revenue related to material rights in 2024, $21.9 million in 2025, and $85.8 million of such deferred revenue thereafter.
Assets Recognized from the Costs to Obtain and Costs to Fulfill Revenue Contracts
We recognize an asset for the incremental costs of obtaining a contract with a client if we expect the amortization period to be longer than one year. We also recognize an asset for the costs to fulfill a contract with a client if such costs are specifically identifiable, generate or enhance resources used to satisfy future performance obligations, and are expected to be recovered. We have determined that substantially all costs related to implementation activities are administrative in nature and also meet the capitalization criteria under ASC 340-40. These capitalized costs to fulfill principally relate to upfront direct costs that are expected to be recovered through margin and that enhance our ability to satisfy future performance obligations.
The assets related to both costs to obtain, and costs to fulfill, contracts with clients are accounted for utilizing a portfolio approach, and are capitalized and amortized ratably over the expected period of benefit, which we have determined to be the estimated life of the client relationship of ten years. The expected period of benefit has been determined to be the estimated life of the client relationship primarily because we incur no new costs to obtain, or costs to fulfill, a contract upon renewal of such contract. Additional commission costs may be incurred when an existing client purchases additional applications; however, these commission costs relate solely to the additional applications purchased and are not related to contract renewal. Furthermore, additional fulfillment costs associated with existing clients purchasing additional applications are minimized by our seamless single-database platform. These assets are presented as deferred contract costs in the accompanying consolidated balance sheets. Amortization expense related to costs to obtain and costs to fulfill a contract are included in the “sales and marketing” and “general and administrative” line items in the accompanying consolidated statements of comprehensive income.
Paycom Software, Inc.
Notes to the Consolidated Financial Statements
(tabular dollars and shares in thousands, except per share and per unit amounts)
The following tables present the asset balances and related amortization expense for these contract costs:
|
|
|
|
|
|
|
|
|
|
|
|
|
|
|
|
|
|
|
As of and for the Year Ended December 31, 2023 |
|
|
|
Beginning Balance |
|
|
Capitalization of Costs |
|
|
Amortization |
|
|
Ending Balance |
|
Costs to obtain a contract |
|
$ |
325,457 |
|
|
$ |
107,796 |
|
|
$ |
(54,786 |
) |
|
$ |
378,467 |
|
Costs to fulfill a contract |
|
$ |
338,895 |
|
|
$ |
133,723 |
|
|
$ |
(52,607 |
) |
|
$ |
420,011 |
|
|
|
|
|
|
|
|
|
|
|
|
|
|
|
|
As of and for the Year Ended December 31, 2022 |
|
|
|
Beginning Balance |
|
|
Capitalization of Costs |
|
|
Amortization |
|
|
Ending Balance |
|
Costs to obtain a contract |
|
$ |
272,919 |
|
|
$ |
97,978 |
|
|
$ |
(45,440 |
) |
|
$ |
325,457 |
|
Costs to fulfill a contract |
|
$ |
265,657 |
|
|
$ |
114,152 |
|
|
$ |
(40,914 |
) |
|
$ |
338,895 |
|
Cost of Revenues
Our costs and expenses applicable to total revenues represent operating expenses and systems support and technology costs, including labor and related expenses, bank fees, shipping fees and costs of paper stock, envelopes, etc. In addition, costs included to derive gross margins are comprised of support labor and related expenses, related hardware costs and applicable depreciation and amortization costs.
Advertising Costs
Advertising costs are expensed the first time that advertising takes place. Advertising costs for the years ended December 31, 2023, 2022 and 2021 were $106.8 million, $90.6 million and $71.6 million, respectively.
Sales Taxes
We collect and remit sales tax on sales of time and attendance clocks and on payroll services in certain states. These taxes are recognized on a net basis, and therefore, excluded from revenues. For the years ended December 31, 2023, 2022 and 2021, sales taxes collected were $17.6 million, $15.5 million and $11.9 million, respectively.
Employee Stock-Based Compensation
Time-based stock compensation awards to employees are recognized on a straight-line basis over the applicable service period as compensation costs in the consolidated statements of comprehensive income based on their fair values measured as of the date of grant. Market-based stock compensation awards to employees are recognized on a straight-line basis over the applicable estimated service period as compensation costs in the consolidated statements of comprehensive income based on their fair value as of the date of the grant unless vesting occurs sooner at which time the remaining respective unrecognized compensation cost is recognized. Performance-based stock compensation awards are recognized on a straight-line basis over the applicable service period as compensation costs in the consolidated statements of comprehensive income based on their fair values measured as of the date of grant. Forfeitures related to our stock-based compensation awards are recognized as they occur.
Employee Stock Purchase Plan
An award issued under the Paycom Software, Inc. Employee Stock Purchase Plan (the “ESPP”) is classified as a share-based liability and recognized at the fair value of the award. Expense is recognized, net of estimated forfeitures, on a straight-line basis over the requisite service period.
Income Taxes
Our consolidated financial statements include a provision for income taxes incurred for the anticipated tax consequences of the reported results of operations using the asset and liability method. Under this method, we recognize deferred tax assets and liabilities for the expected future tax consequences of temporary differences between the financial reporting and tax basis of assets and liabilities, as well as for operating loss and tax credit carryforwards. Deferred tax assets and liabilities are measured using the tax rates that are expected to apply to taxable income for the years in which those tax assets and liabilities are expected to be realized or settled. We recognize a valuation allowance to reduce our deferred tax assets to the net amount that we believe is more likely than not to be realized.
Paycom Software, Inc.
Notes to the Consolidated Financial Statements
(tabular dollars and shares in thousands, except per share and per unit amounts)
We file income tax returns with the United States federal government and various state jurisdictions. We evaluate tax positions taken or expected to be taken in the course of preparing our tax returns and disallow the recognition of tax positions not deemed to meet a “more-likely-than-not” threshold of being sustained by the applicable tax authority. We believe there is one tax position taken within the consolidated financial statements that does not meet this threshold. Our policy is to recognize interest and penalties, if any, related to uncertain tax positions as a component of general and administrative expenses. With few exceptions, we are no longer subject to U.S. federal, state and local income tax examinations by tax authorities for years prior to 2020.
Seasonality
Our revenues are seasonal in nature and generally we expect our first and fourth quarter recurring revenues to be higher than other quarters during the year. Recurring revenues include revenues relating to the annual processing of payroll tax filing forms and ACA form filing requirements revenues from processing unscheduled payroll runs (such as bonuses) for our clients. As payroll tax forms are typically processed in the first quarter of the year, first quarter recurring revenues and margins are positively impacted. In addition, unscheduled payroll runs at the end of the year often result in increased recurring revenues in the fourth quarter. These seasonal fluctuations in revenues can also have an impact on gross profits. Historical results impacted by these seasonal trends should not be considered a reliable indicator of our future results of operations.
Recently Issued Accounting Pronouncements
Accounting pronouncements issued, but not effective until after December 31, 2023, are not expected to have a significant impact on our consolidated financial position or results of operations.
Property and equipment and accumulated depreciation and amortization were as follows:
|
|
|
|
|
|
|
|
|
|
|
December 31, 2023 |
|
|
December 31, 2022 |
|
Property and equipment |
|
|
|
|
|
|
Software and capitalized software development costs |
|
$ |
371,665 |
|
|
$ |
270,645 |
|
Buildings |
|
|
179,874 |
|
|
|
177,765 |
|
Computer equipment |
|
|
164,856 |
|
|
|
133,715 |
|
Rental clocks |
|
|
42,364 |
|
|
|
35,846 |
|
Furniture, fixtures and equipment |
|
|
32,413 |
|
|
|
28,414 |
|
Other |
|
|
18,500 |
|
|
|
17,321 |
|
|
|
|
809,672 |
|
|
|
663,706 |
|
Less: accumulated depreciation and amortization |
|
|
(437,291 |
) |
|
|
(331,340 |
) |
|
|
|
372,381 |
|
|
|
332,366 |
|
Construction in progress |
|
|
92,020 |
|
|
|
36,286 |
|
Land |
|
|
33,796 |
|
|
|
33,796 |
|
Property and equipment, net |
|
$ |
498,197 |
|
|
$ |
402,448 |
|
We capitalize computer software development costs related to software developed for internal use in accordance with ASC 350-40. For the years ended December 31, 2023 and 2022, we capitalized $96.7 million and $66.4 million, respectively, of computer software development costs related to software developed for internal use.
Rental clocks included in property and equipment, net represent time clocks issued to clients under month-to-month operating leases. As such, these items are transferred from inventory to property and equipment and depreciated over their estimated useful lives.
Prior to the repayment of our debt on November 21, 2023, we capitalized interest costs incurred for indebtedness related to construction in progress. For the years ended December 31, 2023, 2022 and 2021, we incurred interest costs of $5.3 million, $3.4 million and $1.4 million, respectively. For the years ended December 31, 2023, 2022 and 2021, interest costs of $3.4 million, $0.9 million and $1.4 million, respectively, were capitalized. Included in the construction in progress balance at December 31, 2023 and 2022 was $4.2 million and $2.0 million in retainage, respectively. See Note 6 for discussion of repayment of our indebtedness.
Depreciation and amortization expense for property and equipment, net was $110.0 million, $88.7 million and $64.7 million for the years ended December 31, 2023, 2022 and 2021, respectively.
Paycom Software, Inc.
Notes to the Consolidated Financial Statements
(tabular dollars and shares in thousands, except per share and per unit amounts)
4.GOODWILL AND INTANGIBLE ASSETS, NET
As of both December 31, 2023 and 2022, goodwill totaled $51.9 million. We have selected June 30 as our annual goodwill impairment testing date. We performed a qualitative impairment test of our goodwill and concluded that, as of June 30, 2023, it was more likely than not that the fair value exceeded the carrying value and therefore goodwill was not impaired. As of December 31, 2023 and 2022, there were no indicators of impairment.
In connection with our marketing initiatives, we purchased the naming rights to the downtown Oklahoma City arena that is home to the Oklahoma City Thunder National Basketball Association franchise. Under the terms of the naming rights agreement, we committed to make payments escalating annually from $4.0 million in 2021 to $6.1 million in 2035. We also made a $1.5 million one-time payment in July 2021 to cover sponsorship rights leading up to the 2021-2022 season. Upon the conclusion of the initial term, the agreement may be extended upon the mutual agreement of both parties for an additional five-year period. The cost of the naming rights has been recorded as an intangible asset with an offsetting liability as of the date of the contract. The intangible asset is being amortized over the life of the agreement on a straight line basis that commenced in June 2021. The difference between the present value of the offsetting liability and actual cash payments is being relieved through sales and marketing expense using the effective interest method over the life of the agreement.
All of our intangible assets other than goodwill are considered to have definite lives and, as such, are subject to amortization. The following tables present the components of intangible assets within our consolidated balance sheets:
|
|
|
|
|
|
|
|
|
|
|
|
|
|
|
|
|
December 31, 2023 |
|
|
|
Weighted Average Remaining |
|
|
|
|
Accumulated |
|
|
|
|
|
|
Useful Life |
|
Gross |
|
|
Amortization |
|
|
Net |
|
|
|
(Years) |
|
|
|
|
|
|
|
|
|
Intangibles: |
|
|
|
|
|
|
|
|
|
|
|
Naming rights |
|
12.8 |
|
$ |
60,199 |
|
|
$ |
(10,087 |
) |
|
$ |
50,112 |
|
Total |
|
|
|
$ |
60,199 |
|
|
$ |
(10,087 |
) |
|
$ |
50,112 |
|
|
|
|
|
|
|
|
|
|
|
|
|
|
|
|
|
|
December 31, 2022 |
|
|
|
Weighted Average Remaining |
|
|
|
|
Accumulated |
|
|
|
|
|
|
Useful Life |
|
Gross |
|
|
Amortization |
|
|
Net |
|
|
|
(Years) |
|
|
|
|
|
|
|
|
|
Intangibles: |
|
|
|
|
|
|
|
|
|
|
|
Naming rights |
|
13.8 |
|
$ |
60,199 |
|
|
$ |
(6,182 |
) |
|
$ |
54,017 |
|
Total |
|
|
|
$ |
60,199 |
|
|
$ |
(6,182 |
) |
|
$ |
54,017 |
|
Amortization of intangible assets for the years ended December 31, 2023, 2022 and 2021 was $3.9 million, $4.0 million and $2.5 million, respectively. We estimate the aggregate amortization expense will be $3.9 million in 2024, and $3.9 million for each of 2025, 2026, 2027 and 2028, respectively.
The Company’s leases primarily consist of noncancellable operating leases for office space with contractual terms expiring from 2024 to 2030. All of our leases are operating leases and, as a lessee, we have not entered into any sublease agreements. The lease term is defined as the fixed noncancellable term of the lease plus all periods, if any, for which failure to renew the lease imposes a penalty on us in an amount that appears, at the inception of the lease, to be reasonably assured. While some of our leases include an option to extend the lease up to five years, it is not reasonably certain that any such options will be exercised due, in part, to the dynamic nature of our sales force and rate of growth. Some of our leases contain a termination option that is not reasonably certain to be exercised. If a termination option is exercised, we remeasure the lease asset in the consolidated balance sheets using the updated lease period. None of our leases contain residual value guarantees, substantial restrictions or covenants.
The table below presents the lease assets and liabilities as of December 31, 2023 and December 31, 2022.
|
|
|
|
|
|
|
|
|
Balance Sheet location |
|
December 31, 2023 |
|
|
December 31, 2022 |
|
Other assets |
|
$ |
73,762 |
|
|
$ |
39,776 |
|
Lease liabilities: |
|
|
|
|
|
|
Accrued expenses and other current liabilities |
|
$ |
19,236 |
|
|
$ |
14,986 |
|
Other long-term liabilities |
|
$ |
56,713 |
|
|
$ |
26,026 |
|
Paycom Software, Inc.
Notes to the Consolidated Financial Statements
(tabular dollars and shares in thousands, except per share and per unit amounts)
Rent expense under operating leases for the years ended December 31, 2023, 2022 and 2021 was $18.1 million, $12.3 million and $11.9 million, respectively. Cash paid for amounts relating to our operating leases was $20.5 million for the year ended December 31, 2023.
Because no implicit discount rates for our leases could be readily determined, we elected to use an estimated incremental borrowing rate to determine the present value of our leases. The weighted average discount rate related to our portfolio of leases at December 31, 2023 was 4.6%. The average remaining lease term for our leases was 4.7 years as of December 31, 2023.
The undiscounted cash flows for the future annual maturities of our operating lease liabilities and the reconciliation of those total undiscounted cash flows to our lease liabilities as of December 31, 2023 were as follows:
|
|
|
|
|
2024 |
|
$ |
19,721 |
|
2025 |
|
|
18,363 |
|
2026 |
|
|
17,154 |
|
2027 |
|
|
13,421 |
|
2028 |
|
|
10,827 |
|
Thereafter |
|
|
5,303 |
|
Total undiscounted cash flows |
|
$ |
84,789 |
|
Present value discount |
|
|
(8,840 |
) |
Lease liabilities |
|
$ |
75,949 |
|
The table above does not include any legally binding minimum lease payments for leases signed but not yet commenced. As of December 31, 2023, the present value of the operating lease liabilities that had not yet commenced was $11.6 million.
Long-term debt consisted of the following:
|
|
|
|
|
|
|
|
|
|
|
December 31, 2023 |
|
|
December 31, 2022 |
|
July 2022 Revolving Credit Facility due July 29, 2027 |
|
$ |
— |
|
|
$ |
29,000 |
|
Total long-term debt |
|
$ |
— |
|
|
$ |
29,000 |
|
On December 7, 2017, we entered into a senior secured term credit agreement (as amended from time to time, the “2017 Term Credit Agreement”), pursuant to which JPMorgan Chase Bank, N.A., Bank of America, N.A. and Kirkpatrick Bank made certain term loans to us (the “2017 Term Loans”). Our obligations under the 2017 Term Loans were secured by a mortgage and first priority security interest in our corporate headquarters property. The 2017 Term Loans were due to mature on September 7, 2025 and bore interest, at our option, at either (a) a prime rate plus 1.0% or (b) an adjusted LIBOR rate for the interest period in effect for such 2017 Term Loan plus 1.5%.
As discussed below, the 2017 Term Loans were repaid in full on May 4, 2022 and the 2017 Term Credit Agreement was terminated. At the time of payoff, unamortized debt issuance costs totaling $0.1 million were written off. On May 4, 2022 (the “May 2022 Facility Closing Date”), Paycom Payroll, LLC (the “Borrower”), Software, and certain other subsidiaries of Software (collectively, the “Guarantors,” and collectively with the Borrower, the “Loan Parties”), entered into a credit agreement (as amended from time to time, the “May 2022 Revolving Credit Agreement”) with Bank of America, N.A., as a lender, swingline lender and letters of credit issuer, the lenders from time to time party thereto and Bank of America, N.A., as the administrative agent.
The May 2022 Revolving Credit Agreement provided for a senior secured revolving credit facility (the “May 2022 Facility”) in the initial aggregate principal amount of up to $250.0 million, and the ability to request an incremental facility of up to an additional $100.0 million, subject to obtaining additional lender commitments and certain approvals and satisfying certain other conditions. The May 2022 Facility included a $25.0 million sublimit for swingline loans and a $2.5 million sublimit for letters of credit. On June 7, 2022, the aggregate commitments under the May 2022 Revolving Credit Agreement were increased from $250.0 million to $350.0 million. Our obligations under the May 2022 Facility were secured by a senior security interest in all personal property of the Loan Parties. The May 2022 Facility was scheduled to mature on May 4, 2027.
On the May 2022 Facility Closing Date, we borrowed $29.0 million under the May 2022 Facility to repay the 2017 Term Loans, along with accrued interest, expenses and fees. The loan on the May 2022 Facility Closing Date bore interest at the BSBY rate plus 1.125%. In connection with the repayment of the 2017 Term Loans, the 2017 Term Credit Agreement was terminated on May 4, 2022.
As discussed below, the May 2022 Facility was repaid in full on July 29, 2022 and the May 2022 Revolving Credit Agreement was terminated.
Paycom Software, Inc.
Notes to the Consolidated Financial Statements
(tabular dollars and shares in thousands, except per share and per unit amounts)
On July 29, 2022 (the “July 2022 Facility Closing Date”), the Borrower, Software, and certain other subsidiaries of Software entered into a new credit agreement (the “July 2022 Credit Agreement”) with JPMorgan Chase Bank, N.A., as a lender, swingline lender and issuing bank, the lenders from time to time party thereto (collectively with JPMorgan Chase Bank, N.A., the “July 2022 Lenders”), and JPMorgan Chase Bank, N.A., as the administrative agent.
The July 2022 Credit Agreement initially provided for a senior secured revolving credit facility (the “July 2022 Revolving Credit Facility”) in the aggregate principal amount of up to $650.0 million, and the ability to request an incremental facility of up to an additional $500.0 million, subject to obtaining additional lender commitments and certain approvals and satisfying certain other conditions. The July 2022 Credit Agreement includes a $25.0 million sublimit for swingline loans and a $6.5 million sublimit for letters of credit. The July 2022 Credit Agreement also initially provided for a senior secured delayed draw term loan (the “July 2022 Term Loan Facility”) in the aggregate amount of up to $750.0 million. As discussed below, the July 2022 Term Loan Facility was terminated on July 28, 2023. All loans under the July 2022 Credit Agreement will mature on July 29, 2027 (the “Scheduled Maturity Date”). Unamortized debt issuance costs of $4.0 million as of December 31, 2023, are included in “Other assets” on our consolidated balance sheets.
The borrowings under the July 2022 Credit Agreement bear interest at a rate per annum equal to (i) the Alternate Base Rate (“ABR”) plus an applicable margin (“ABR Loans”) or (ii) (x) the term Secured Overnight Financing Rate (“SOFR”) plus 0.10% (the “Adjusted Term SOFR Rate”) or (y) the daily SOFR plus 0.10%, in each case plus an applicable margin (“SOFR Rate Loans”). ABR is calculated as the highest of (i) the rate of interest last quoted by The Wall Street Journal in the United States as the prime rate in effect, (ii) the federal funds rate plus 0.5% and (iii) the Adjusted Term SOFR Rate for a one-month interest period plus 1.00%; provided that, if the ABR as determined pursuant to the foregoing would be less than 1.00%, such rate shall be deemed to be 1.00%. The applicable margin for ABR Loans is (i) 0.25% if the Company’s consolidated leverage ratio is less than 1.0 to 1.0; (ii) 0.50% if the Company’s consolidated leverage ratio is greater than or equal to 1.0 to 1.0 but less than 2.0 to 1.0; (iii) 0.75% if the Company’s consolidated leverage ratio is greater than or equal to 2.0 to 1.0 but less than 3.0 to 1.0; or (iv) 1.00% if the Company’s consolidated leverage ratio is greater than or equal to 3.0 to 1.0. The applicable margin for SOFR Rate Loans is (i) 1.25% if the Company’s consolidated leverage ratio is less than 1.0 to 1.0; (ii) 1.5% if the Company’s consolidated leverage ratio is greater than or equal to 1.0 to 1.0 but less than 2.0 to 1.0; (iii) 1.75% if the Company’s consolidated leverage ratio is greater than or equal to 2.0 to 1.0 but less than 3.0 to 1.0; or (iv) 2.00% if the Company’s consolidated leverage ratio is greater than or equal to 3.0 to 1.0. We are required to pay a quarterly commitment fee on the daily amount of the undrawn portion of the revolving commitments under the July 2022 Revolving Credit Facility and, prior to its termination, a quarterly ticking fee on the daily amount of the undrawn portion of the July 2022 Term Loan Facility, in each case at a rate per annum of (i) 0.20% if the Company’s consolidated leverage ratio is less than 1.0 to 1.0; (ii) 0.225% if the Company’s consolidated leverage ratio is greater than or equal to 1.0 to 1.0 but less than 2.0 to 1.0; (iii) 0.25% if the Company’s consolidated leverage ratio is greater than or equal to 2.0 to 1.0 but less than 3.0 to 1.0; or (iv) 0.275% if the Company’s consolidated leverage ratio is greater than or equal to 3.0 to 1.0. We are also required to pay customary letter of credit fees upon drawing any letter of credit.
The July 2022 Revolving Credit Facility provides for no scheduled principal amortization prior to the Scheduled Maturity Date. Subject to certain conditions set forth in the July 2022 Credit Agreement, we may borrow, prepay and reborrow under the July 2022 Revolving Credit Facility and terminate or reduce the July 2022 Lenders’ commitments at any time prior to the Scheduled Maturity Date.
The proceeds of the loans and letters of credit under the July 2022 Credit Agreement are to be used for ongoing working capital and general corporate purposes, permitted acquisitions, share repurchases and refinancing the May 2022 Facility. On the July 2022 Facility Closing Date, we borrowed $29.0 million under the July 2022 Revolving Credit Facility to repay the outstanding indebtedness under the May 2022 Facility, along with accrued interest, expenses and fees. The loan bore interest at the Adjusted Term SOFR Rate for the interest period in effect plus 1.25%. In connection with the repayment of the May 2022 Facility, the May 2022 Revolving Credit Agreement was terminated on July 29, 2022.
Under the July 2022 Credit Agreement, we are required to maintain as of the end of each fiscal quarter a consolidated interest coverage ratio of not less than 3.0 to 1.0 and a consolidated leverage ratio of not greater than 3.5 to 1.0, stepping down to 3.25 to 1.0 as of December 31, 2024 and 3.0 to 1.0 as of December 31, 2025, and thereafter. Additionally, the July 2022 Credit Agreement contains customary affirmative and negative covenants, including covenants limiting our ability to, among other things, grant liens, incur debt, effect certain mergers, make investments, dispose of assets, enter into certain transactions, including swap agreements and sale and leaseback transactions, pay dividends or distributions on our capital stock, and enter into transactions with affiliates, in each case subject to customary exceptions. As of December 31, 2023, we were in compliance with these covenants. Our obligations under the July 2022 Credit Agreement are secured by a senior security interest in all personal property of the Loan Parties.
The events of default under the July 2022 Credit Agreement include, among others, payment defaults, breaches of covenants, defaults under the related loan documents, material misrepresentations, cross defaults with certain other material indebtedness,
Paycom Software, Inc.
Notes to the Consolidated Financial Statements
(tabular dollars and shares in thousands, except per share and per unit amounts)
bankruptcy and insolvency events, judgment defaults, certain events related to plans subject to the Employee Retirement Income Security Act of 1974, as amended, invalidity of the July 2022 Credit Agreement or the related loan documents and change in control events. The occurrence of an event of default could result in the acceleration of our obligations under the July 2022 Credit Agreement, the requirement to post cash collateral with respect to letters of credit, the termination of the July 2022 Lenders’ commitments and a 2.0% increase in the rate of interest.
On July 28, 2023, the Borrower, Software, and certain other subsidiaries of Software entered into Amendment No. 2 to Credit Agreement (“Amendment No. 2”) with the July 2022 Lenders, pursuant to which, among other things, (i) the aggregate revolving commitments under the July 2022 Revolving Credit Facility were increased from $650.0 million to $1.0 billion, (ii) the July 2022 Term Loan Facility was terminated and (iii) the July 2022 Credit Agreement was amended in contemplation of the formation and future operating activities of the Paycom Client Trust (the “Client Trust”) and Paycom National Trust Bank, NA (the “Trust Bank”). The Company intends to form the Client Trust to hold client payroll and related funds and the Trust Bank to serve as trustee of the Client Trust. We did not make any draws under the July 2022 Term Loan Facility prior to its termination on July 28, 2023. At the time of termination, unamortized debt issuance costs totaling $1.2 million were written off and recognized as a loss on extinguishment of debt, which is included in Other income, net in the consolidated statements of comprehensive income.
On November 21, 2023, we fully repaid the outstanding indebtedness under the Revolving Credit Facility.
As of December 31, 2023 and 2022, the carrying value of our total long-term debt approximated its fair value as of such date. The fair value of our long-term debt is estimated based on the borrowing rates currently available to us for bank loans with similar terms and maturities.
In December 2017, we entered into a floating-to-fixed interest rate swap agreement to limit the exposure to floating interest rate risk related to the 2017 Term Loans. We do not hold derivative instruments for trading or speculative purposes. The interest rate swap agreement effectively converted a portion of the variable interest rate payments to fixed interest rate payments. We account for our derivatives under ASC Topic 815, “Derivatives and Hedging,” and recognize all derivative instruments in the consolidated balance sheets at fair value as either short-term or long-term assets or liabilities based on their anticipated settlement date. See Note 9, “Fair Value of Financial Instruments”. We have elected not to designate our interest rate swap as a hedge; therefore, changes in the fair value of the derivative instrument were recognized in our consolidated statements of comprehensive income within Other income (expense), net.
The objective of the interest rate swap was to reduce the variability in the forecasted interest payments of the 2017 Term Loans, which was based on a one-month USD LIBOR rate versus a fixed interest rate of 2.54% on a notional value of $35.5 million. Under the terms of the interest rate swap agreement, we received quarterly variable interest payments based on the LIBOR rate and paid interest at a fixed rate. As further discussed in Note 6, on May 4, 2022, we repaid the 2017 Term Loans and terminated the 2017 Term Credit Agreement. The interest rate swap agreement had a maturity date of September 7, 2025. On August 24, 2022, we terminated the interest rate swap by settling the contract, which resulted in a cash receipt of $0.5 million. The realized gain from the settlement of the interest rate swap contract is included in Other income (expense), net in the consolidated statements of comprehensive income.
Paycom Software, Inc.
Notes to the Consolidated Financial Statements
(tabular dollars and shares in thousands, except per share and per unit amounts)
8.CORPORATE INVESTMENTS AND FUNDS HELD FOR CLIENTS
The tables below present our cash and cash equivalents, the funds held for clients cash and cash equivalents as well as the investments that were included within funds held for clients on the consolidated balance sheets:
|
|
|
|
|
|
|
|
|
|
|
|
|
|
|
|
|
|
|
December 31, 2023 |
|
Type of issue |
|
Amortized cost |
|
|
Gross unrealized gains |
|
|
Gross unrealized losses |
|
|
Fair value |
|
Cash and cash equivalents |
|
$ |
294,025 |
|
|
$ |
— |
|
|
$ |
— |
|
|
$ |
294,025 |
|
Funds held for clients cash and cash equivalents |
|
|
2,128,735 |
|
|
|
— |
|
|
|
— |
|
|
|
2,128,735 |
|
Available-for-sale securities(1): |
|
|
|
|
|
|
|
|
|
|
|
|
Certificates of deposit |
|
|
25,000 |
|
|
|
— |
|
|
|
— |
|
|
|
25,000 |
|
U.S. treasury securities |
|
|
174,887 |
|
|
|
— |
|
|
|
(1,256 |
) |
|
|
173,631 |
|
Total investments |
|
$ |
2,622,647 |
|
|
$ |
— |
|
|
$ |
(1,256 |
) |
|
$ |
2,621,391 |
|
|
|
|
|
|
|
|
|
|
|
|
|
|
|
|
|
|
|
|
|
|
|
|
|
|
|
|
|
December 31, 2022 |
|
Type of issue |
|
Amortized cost |
|
|
Gross unrealized gains |
|
|
Gross unrealized losses |
|
|
Fair value |
|
Cash and cash equivalents |
|
$ |
400,730 |
|
|
$ |
— |
|
|
$ |
— |
|
|
$ |
400,730 |
|
Funds held for clients cash and cash equivalents |
|
|
2,008,365 |
|
|
|
— |
|
|
|
— |
|
|
|
2,008,365 |
|
Available-for-sale securities(1): |
|
|
|
|
|
|
|
|
|
|
|
|
Certificates of deposit |
|
|
25,000 |
|
|
|
— |
|
|
|
— |
|
|
|
25,000 |
|
U.S. treasury securities |
|
|
174,367 |
|
|
|
— |
|
|
|
(4,757 |
) |
|
|
169,610 |
|
Total investments |
|
$ |
2,608,462 |
|
|
$ |
— |
|
|
$ |
(4,757 |
) |
|
$ |
2,603,705 |
|
(1)All available-for-sale securities were included within the funds held for clients.
The unrealized losses and fair values of available-for-sale securities that have been in an unrealized loss position for a period of less than and greater than 12 months as of December 31, 2023, are as follows:
|
|
|
|
|
|
|
|
|
|
|
|
|
|
|
|
|
|
|
|
|
|
|
|
|
|
|
December 31, 2023 |
|
|
|
Securities in unrealized loss position for less than 12 months |
|
|
Securities in unrealized loss position for greater than 12 months |
|
|
Total |
|
Type of issue |
|
Gross unrealized losses |
|
|
Fair value |
|
|
Gross unrealized losses |
|
|
Fair value |
|
|
Gross unrealized losses |
|
|
Fair value |
|
U.S. treasury securities |
|
$ |
— |
|
|
$ |
— |
|
|
$ |
(1,256 |
) |
|
$ |
173,631 |
|
|
$ |
(1,256 |
) |
|
$ |
173,631 |
|
Total |
|
$ |
— |
|
|
$ |
— |
|
|
$ |
(1,256 |
) |
|
$ |
173,631 |
|
|
$ |
(1,256 |
) |
|
$ |
173,631 |
|
The unrealized losses and fair values of available-for-sale securities that have been in an unrealized loss position for a period of less than and greater than 12 months as of December 31, 2022, are as follows:
|
|
|
|
|
|
|
|
|
|
|
|
|
|
|
|
|
|
|
|
|
|
|
|
|
|
|
December 31, 2022 |
|
|
|
Securities in unrealized loss position for less than 12 months |
|
|
Securities in unrealized loss position for greater than 12 months |
|
|
Total |
|
Type of issue |
|
Gross unrealized losses |
|
|
Fair value |
|
|
Gross unrealized losses |
|
|
Fair value |
|
|
Gross unrealized losses |
|
|
Fair value |
|
U.S. treasury securities |
|
$ |
(4,757 |
) |
|
$ |
169,610 |
|
|
$ |
— |
|
|
$ |
— |
|
|
$ |
(4,757 |
) |
|
$ |
169,610 |
|
Total |
|
$ |
(4,757 |
) |
|
$ |
169,610 |
|
|
$ |
— |
|
|
$ |
— |
|
|
$ |
(4,757 |
) |
|
$ |
169,610 |
|
We did not make any reclassification adjustments out of accumulated other comprehensive income for realized gains or losses on the sale or maturity of available-for-sale securities for the years ended December 31, 2023 or 2022. There were no realized gains or losses on the sale of available-for-sale securities for the years ended December 31, 2023 or 2022.
We regularly review the composition of our investment portfolio and did not recognize any credit impairment losses during the years ended December, 2023 or 2022. As of December 31, 2023, all of our U.S. treasury securities held a rating of AA+.
Paycom Software, Inc.
Notes to the Consolidated Financial Statements
(tabular dollars and shares in thousands, except per share and per unit amounts)
Expected maturities of available-for-sale securities at December 31, 2023 are as follows:
|
|
|
|
|
|
|
|
|
Expected maturity |
|
Amortized cost |
|
|
Fair value |
|
One year or less |
|
$ |
199,887 |
|
|
$ |
198,631 |
|
One year to five years |
|
$ |
— |
|
|
$ |
— |
|
Total available-for-sale securities |
|
$ |
199,887 |
|
|
$ |
198,631 |
|
9.FAIR VALUE OF FINANCIAL INSTRUMENTS
Our financial instruments consist primarily of cash and cash equivalents, accounts receivable, accounts payable, funds held for clients, client funds obligation and long-term debt. The carrying amount of cash and cash equivalents, accounts receivable, accounts payable, funds held for clients and client funds obligation approximates fair value due to the short-term nature of the instruments. See Note 6 for discussion of the fair value of our debt.
Our corporate investments consist primarily of money market funds and demand deposit accounts and are classified as cash and cash equivalents on the consolidated balance sheets.
As discussed in Note 2, we typically invest the funds held for clients in money market funds, demand deposit accounts, certificates of deposit and commercial paper with an original maturity of less than three months and classify these items as cash and cash equivalents within the funds held for clients line item in the consolidated balance sheets. Short-term investments in certificates of deposit and commercial paper with an original maturity greater than three months are classified as available-for-sale securities and are also included within the funds held for clients line item. These available-for-sale securities are recognized in the consolidated balance sheets at fair value, with the difference between the amortized cost and fair value of these available-for-sale securities recorded as unrealized net gains (losses) within comprehensive earnings (loss) in our consolidated statements of comprehensive income. See Note 8 for additional information.
We also invest funds held for clients in U.S. treasury securities with initial maturity durations greater than one year. These U.S. treasury securities are classified as available-for-sale securities and included within the funds held for clients line item. The unrealized gains and losses associated with these available-for-sale securities are included within comprehensive earnings (loss) in our consolidated statements of comprehensive income. See Note 8 for additional information.
As discussed in Note 7, during the year ended December 31, 2017, we entered into an interest rate swap. While outstanding, the interest rate swap was measured on a recurring basis based on quoted prices for similar financial instruments and other observable inputs recognized at fair value. We terminated the interest rate swap on August 24, 2022.
The accounting standard for fair value measurements establishes a three-level fair value hierarchy, which prioritizes the inputs used in measuring fair value as follows:
•Level 1 – Observable inputs such as quoted prices in active markets
•Level 2 – Inputs other than quoted prices in active markets for identical assets or liabilities that are observable either directly or indirectly or quoted prices that are not active
•Level 3 – Unobservable inputs in which there is little or no market data
Included in the following tables are the Company’s major categories of assets and liabilities measured at fair value on a recurring basis as of December 31, 2023 and 2022:
|
|
|
|
|
|
|
|
|
|
|
|
|
|
|
|
|
|
|
December 31, 2023 |
|
|
|
Level 1 |
|
|
Level 2 |
|
|
Level 3 |
|
|
Total |
|
Assets: |
|
|
|
|
|
|
|
|
|
|
|
|
Certificates of deposit |
|
$ |
— |
|
|
$ |
25,000 |
|
|
$ |
— |
|
|
$ |
25,000 |
|
U.S. treasury securities |
|
$ |
— |
|
|
$ |
173,631 |
|
|
$ |
— |
|
|
$ |
173,631 |
|
|
|
|
|
|
|
|
|
|
|
|
|
|
|
|
|
|
|
|
|
|
|
|
|
|
|
|
|
December 31, 2022 |
|
|
|
Level 1 |
|
|
Level 2 |
|
|
Level 3 |
|
|
Total |
|
Assets: |
|
|
|
|
|
|
|
|
|
|
|
|
Certificates of deposit |
|
$ |
— |
|
|
$ |
25,000 |
|
|
$ |
— |
|
|
$ |
25,000 |
|
U.S. treasury securities |
|
$ |
— |
|
|
$ |
169,610 |
|
|
$ |
— |
|
|
$ |
169,610 |
|
Paycom Software, Inc.
Notes to the Consolidated Financial Statements
(tabular dollars and shares in thousands, except per share and per unit amounts)
10.EMPLOYEE SAVINGS PLAN AND EMPLOYEE STOCK PURCHASE PLAN
Employees over the age of 18 who have completed ninety days of service are eligible to participate in our 401(k) plan. We have made a Qualified Automatic Contribution Arrangement (“QACA”) election, whereby the Company matches the contribution of our employees equal to 100% of the first 1% of salary deferrals and 50% of salary deferrals between 2% and 6%, up to a maximum matching contribution of 3.5% of an employee’s salary each plan year. We are allowed to make additional discretionary matching contributions and discretionary profit sharing contributions. Employees are 100% vested in amounts attributable to salary deferrals and rollover contributions. The QACA matching contributions as well as the discretionary matching and profit sharing contributions vest 100% after two years of employment from the date of hire. Matching contributions were $15.9 million, $12.7 million and $11.6 million for the years ended December 31, 2023, 2022 and 2021, respectively.
The ESPP has overlapping offering periods, with each offering period lasting approximately 24 months. At the beginning of each offering period, eligible employees may elect to contribute, through payroll deductions, up to 10% of their compensation, subject to an annual per employee maximum of $25,000. Eligible employees purchase shares of the Company’s common stock at a price equal to 85% of the fair market value of the shares on the exercise date. The maximum number of shares that may be purchased by a participant during each offering period is 2,000 shares, subject to limits specified by the Internal Revenue Service. The shares reserved for purposes of the ESPP are shares we purchase in the open market. The maximum aggregate number of shares of the Company’s common stock that may be purchased by all participants under the ESPP is 2.0 million shares. During the years ended December 31, 2023, 2022 and 2021, eligible employees purchased 72,942, 54,059 and 40,699 shares, respectively, of the Company’s common stock under the ESPP. Compensation expense related to the ESPP is recognized on a straight-line basis over the requisite service period. Our compensation expense related to the ESPP was $3.5 million, $2.8 million and $2.7 million for the years ended December 31, 2023, 2022 and 2021, respectively.
Basic earnings per share is computed by dividing net income by the weighted average number of shares of common stock outstanding for the period. Diluted earnings per share is computed in a similar manner to basic earnings per share after assuming the issuance of shares of common stock for all potentially dilutive equity incentive awards.
The following is a reconciliation of net income and the shares of common stock used in the computation of basic and diluted earnings per share:
|
|
|
|
|
|
|
|
|
|
|
|
|
|
|
Year Ended December 31, |
|
|
|
2023 |
|
|
2022 |
|
|
2021 |
|
Numerator: |
|
|
|
|
|
|
|
|
|
Net income |
|
$ |
340,788 |
|
|
$ |
281,389 |
|
|
$ |
195,960 |
|
Denominator: |
|
|
|
|
|
|
|
|
|
Basic weighted average shares outstanding |
|
|
57,707 |
|
|
|
57,928 |
|
|
|
57,885 |
|
Dilutive effect of unvested restricted stock and restricted stock units |
|
|
267 |
|
|
|
247 |
|
|
|
306 |
|
Diluted weighted average shares outstanding |
|
|
57,974 |
|
|
|
58,175 |
|
|
|
58,191 |
|
Earnings per share: |
|
|
|
|
|
|
|
|
|
Basic |
|
$ |
5.91 |
|
|
$ |
4.86 |
|
|
$ |
3.39 |
|
Diluted |
|
$ |
5.88 |
|
|
$ |
4.84 |
|
|
$ |
3.37 |
|
12.STOCK-BASED COMPENSATION
Restricted Stock Awards
In May 2023, the stockholders of the Company approved the Paycom Software, Inc. 2023 Long-Term Incentive Plan (the “2023 LTIP”), which provides for the granting of equity-based awards to the Company’s employees, contractors and outside directors. Subject to certain adjustments, the maximum number of shares of common stock that may be delivered pursuant to awards under the 2023 LTIP is 3,600,000, subject to increase by any awards under the Paycom Software, Inc. 2014 Long-Term Incentive Plan (as amended, the “2014 LTIP”) (i) that are outstanding on or after May 1, 2023, and that, on or after such date, are forfeited, expire or are canceled (but excluding the 1,610,000 shares of restricted stock granted to Mr. Richison on November 23, 2020 (the “2020 CEO Performance Award”)); and (ii) any shares subject to awards relating to common stock under the 2014 LTIP that are settled in cash on or after May 1, 2023.
We have historically issued shares of restricted stock that are subject to either market-based vesting conditions (“Market-Based Shares”) or time-based or no vesting conditions (“Time-Based Shares”). The market-based vesting conditions are based on the Company’s total enterprise value (“TEV”) or volume weighted average stock price over a specific period exceeding certain specified
Paycom Software, Inc.
Notes to the Consolidated Financial Statements
(tabular dollars and shares in thousands, except per share and per unit amounts)
thresholds. Compensation expense related to the issuance of Market-Based Shares is measured based upon the fair value of the award on the grant date and recognized on a straight-line basis over the service period based upon the probability that the vesting conditions will be met. Compensation expense related to the issuance of Time-Based Shares is measured based on the fair value of the award on the grant date and recognized over the requisite service period on a straight-line basis.
During the year ended December 31, 2023, we issued an aggregate of 754,815 restricted shares of common stock under the 2014 LTIP and the 2023 LTIP, consisting of 87,618 Market-Based Shares and 667,197 Time-Based Shares. Market-Based Shares will vest 50% on the first date, if any, that the arithmetic average of the Company’s volume weighted average price on each of the twenty consecutive trading days immediately preceding such date (the “VWAP Value”) equals or exceeds $404 per share and 50% on the first date, if any, that the Company’s VWAP Value equals or exceeds $466 per share, in each case provided that (i) such date occurs on or before the eighth anniversary of the grant date and (ii) the recipient is employed by, or providing services to, the Company on the applicable vesting date, and subject to the terms and conditions of the 2014 LTIP or the 2023 LTIP, as applicable, and the applicable restricted stock award agreement. The Time-Based Shares granted to non-executive employees will vest over periods ranging from three to four years, provided that the recipient is employed by, or providing services to, the Company on the applicable vesting date, and subject to the terms and conditions of the 2014 LTIP or the 2023 LTIP, as applicable, and the applicable restricted stock award agreement.
The Time-Based Shares mentioned above include an aggregate of 5,523 Time-Based Shares issued to the non-employee members of our Board of Directors in May 2023 under the 2023 LTIP. Such shares of restricted stock will cliff-vest on the seventh day following the first anniversary date of the grant, provided that such director is providing services to the Company through the applicable vesting date, and subject to the terms and conditions of the 2023 LTIP and the applicable restricted stock award agreement.
The following table presents a summary of the grant date fair values of restricted stock granted during the years ended December 31, 2023, 2022 and 2021 and the related assumptions:
|
|
|
|
|
|
|
|
|
Year Ended December 31, |
|
|
2023 |
|
2022 |
|
2021 |
Grant date fair value of restricted stock |
|
$167.76 - $337.44 |
|
$259.65 - $348.19 |
|
$315.95 - $521.17 |
Risk-free interest rate |
|
3.58% |
|
1.75% |
|
0.95% |
Estimated volatility |
|
40.9% |
|
40.0% |
|
33.0% |
Expected life (in years) |
|
2.3 |
|
2.5 |
|
2.3 |
The following table summarizes restricted stock awards activity for the year ended December 31, 2023:
|
|
|
|
|
|
|
|
|
|
|
|
|
|
|
|
|
|
|
Time-Based |
|
|
Market-Based |
|
|
|
Restricted Stock Awards |
|
|
Restricted Stock Awards |
|
|
|
Shares |
|
|
Weighted Average
Grant Date Fair
Value |
|
|
Shares |
|
|
Weighted Average
Grant Date Fair
Value |
|
Unvested shares of restricted stock outstanding at December 31, 2022 |
|
|
479.1 |
|
|
$ |
315.04 |
|
|
|
1,677.0 |
|
|
$ |
116.36 |
|
Granted |
|
|
667.2 |
|
|
$ |
279.85 |
|
|
|
87.6 |
|
|
$ |
316.12 |
|
Vested |
|
|
(151.7 |
) |
|
$ |
286.10 |
|
|
|
— |
|
|
$ |
— |
|
Forfeited |
|
|
(90.6 |
) |
|
$ |
316.90 |
|
|
|
(19.1 |
) |
|
$ |
299.36 |
|
Unvested shares of restricted stock outstanding at December 31, 2023 |
|
|
904.0 |
|
|
$ |
293.74 |
|
|
|
1,745.5 |
|
|
$ |
124.38 |
|
The following table presents the aggregate fair value of awards that vested during the indicated period.
|
|
|
|
|
|
|
|
|
|
|
|
|
|
|
Year Ended December 31, |
|
|
|
2023 |
|
|
2022 |
|
|
2021 |
|
Time-Based Restricted Stock Awards |
|
$ |
42,991 |
|
|
$ |
63,970 |
|
|
$ |
97,242 |
|
Market-Based Restricted Stock Awards |
|
$ |
— |
|
|
$ |
— |
|
|
$ |
76,153 |
|
Paycom Software, Inc.
Notes to the Consolidated Financial Statements
(tabular dollars and shares in thousands, except per share and per unit amounts)
Restricted Stock Units
In February 2023, we issued, in the aggregate, 5,232 shares of common stock upon the vesting of performance-based restricted stock units (“PSUs”) awarded to certain executive officers in February 2021. The number of shares delivered upon vesting of the PSUs was determined based on the Company’s achievement of a Relative Total Stockholder Return (“Relative TSR”) performance goal, which compared the Company’s Total Stockholder Return (“TSR”) to the TSR of a peer group for the two-year performance period that commenced on January 1, 2021 and ended on December 31, 2022.
For purposes of the PSU awards granted in 2021 (the “2021 PSUs”), TSR was determined by dividing (i) the sum of (A) the average VWAP of a share of the Company’s common stock or the common stock of a peer company, as applicable, during the final 60 trading day period of the applicable performance period, less (ii) the average VWAP of a share of the Company’s common stock or the common stock of a peer company, as applicable, during the 60 trading day period ending on December 31, 2020, plus (iii) the sum of all dividends which are paid by the Company (or the member of the peer group) to its stockholders, assuming such dividends are reinvested in the applicable company through the applicable performance period, by (ii) the average VWAP of a share of the Company’s common stock or the common stock of a peer company, as applicable, during the 60 trading day period ending on December 31, 2020. For purposes of the 2021 PSUs, the Company’s peer group includes 34 publicly traded companies, which were reflective of the S&P 500 Software & Services index on the grant date.
On April 3, 2023, the Company announced the resignation of Justin Long from the position of Vice President of Operations of the Company, effective March 28, 2023. In connection with Mr. Long’s resignation, the Company, Paycom Payroll, LLC and Mr. Long entered into a Severance and Release Agreement (the “Severance Agreement”), which became effective on April 8, 2023, pursuant to which 1,505 Time-Based Shares previously granted to Mr. Long accelerated in vesting.
On May 2, 2023, the Company issued the following awards to executive officers under the 2023 LTIP: (i) an aggregate of 39,131 PSUs; (ii) an aggregate of 8,695 time-based restricted stock units (“RSUs”); and (iii) an aggregate of 142,000 Time-Based Shares. The number of shares deliverable upon vesting of such PSUs will be determined based on achievement of pre-established performance goals. The performance goals vary for each executive officer but are based on the Company’s revenue, adjusted EBITDA, the daily volume weighted average price of the Company’s common stock and annual revenue retention rate, in each case for the one-year performance period from January 1, 2023 to December 31, 2023. The PSUs were eligible to vest following the performance period, but no later than February 29, 2024, provided that the recipient was employed by, or providing services to, the Company on the applicable vesting date, and subject to the terms and conditions of the 2023 LTIP and the applicable restricted stock unit award agreement. For a discussion of the PSU vesting and related forfeitures that occurred on February 5, 2024, see “Note 15. Subsequent Events”. The RSUs vest in three equal annual tranches over a period of approximately two and a half years, provided that the recipient is employed by, or providing services to, the Company on the applicable vesting date, and subject to the terms and conditions of the 2023 LTIP and the applicable restricted stock unit award agreement. The Time-Based Shares vest in four tranches over a period of approximately three and a half years, provided that the recipient is employed by, or providing services to, the Company on the applicable vesting date, and subject to the terms and conditions of the 2023 LTIP and the applicable restricted stock award agreement.
The following table presents a summary of the grant date fair values of restricted stock units granted during the years ended December 31, 2023, 2022 and 2021 and the related assumptions:
|
|
|
|
|
|
|
|
|
Year Ended December 31, |
|
|
2023 |
|
2022 |
|
2021 |
Grant date fair value of restricted stock |
|
$55.83 - $297.55 |
|
$252.16 - $377.01 |
|
$382.78 - $587.97 |
Risk-free interest rate |
|
4.89% |
|
1.25% - 1.51% |
|
0.11% - 0.34% |
Estimated volatility |
|
42.5% |
|
49.2% |
|
50.3% - 51.2% |
Expected life (in years) |
|
1.0 |
|
2.7 |
|
2.6 |
Paycom Software, Inc.
Notes to the Consolidated Financial Statements
(tabular dollars and shares in thousands, except per share and per unit amounts)
The following table summarizes restricted stock unit activity for the year ended December 31, 2023:
|
|
|
|
|
|
|
|
|
|
|
|
|
|
|
|
|
|
|
Time RSUs |
|
|
PSUs |
|
|
|
Units |
|
|
Weighted Average
Grant Date Fair
Value Per Unit |
|
|
Units |
|
|
Weighted Average
Grant Date Fair
Value Per Unit |
|
Unvested restricted stock units outstanding at December 31, 2022 |
|
|
0.5 |
|
|
$ |
377.01 |
|
|
|
77.8 |
|
|
$ |
409.13 |
|
Granted |
|
|
8.8 |
|
|
$ |
297.49 |
|
|
|
39.1 |
|
|
$ |
244.39 |
|
Vested |
|
|
(0.1 |
) |
|
$ |
377.01 |
|
|
|
(5.2 |
) |
|
$ |
526.66 |
|
Forfeited |
|
|
— |
|
|
$ |
— |
|
|
|
(74.5 |
) |
|
$ |
364.82 |
|
Unvested restricted stock units outstanding at December 31, 2023(1) |
|
|
9.2 |
|
|
$ |
300.74 |
|
|
|
37.2 |
|
|
$ |
308.05 |
|
(1)A maximum of 81,843 shares could be delivered upon settlement of PSUs based upon the Company’s achievement of the applicable performance goals over the applicable performance periods.
The following table presents the unrecognized compensation cost and the related weighted average recognition period associated with unvested restricted stock awards and unvested restricted stock unit awards as of December 31, 2023:
|
|
|
|
|
|
|
|
|
|
|
Restricted Stock |
|
|
Restricted Stock |
|
|
|
Awards |
|
|
Units |
|
Unrecognized compensation cost |
|
$ |
258,518 |
|
|
$ |
5,592 |
|
Weighted average period for recognition (years) |
|
|
2.3 |
|
|
|
0.7 |
|
The following table presents our total non-cash stock-based compensation expense resulting from restricted stock awards and restricted stock unit awards in the aggregate, which is included in the following line items in the accompanying consolidated statements of comprehensive income:
|
|
|
|
|
|
|
|
|
|
|
|
|
|
|
Year Ended December 31, |
|
|
|
2023 |
|
|
2022 |
|
|
2021 |
|
Operating expenses |
|
$ |
10,613 |
|
|
$ |
4,671 |
|
|
$ |
4,570 |
|
Sales and marketing |
|
|
23,870 |
|
|
|
18,659 |
|
|
|
13,801 |
|
Research and development |
|
|
22,273 |
|
|
|
11,063 |
|
|
|
7,527 |
|
General and administrative |
|
|
73,050 |
|
|
|
60,505 |
|
|
|
71,608 |
|
Total non-cash stock-based compensation expense |
|
$ |
129,806 |
|
|
$ |
94,898 |
|
|
$ |
97,506 |
|
We capitalized stock-based compensation costs related to software developed for internal use of $14.7 million, $9.0 million and $7.1 million for the years ended December 31, 2023, 2022 and 2021, respectively.
In May 2023, our Board of Directors adopted a dividend policy under which we intend to pay quarterly cash dividends on our common stock. All unvested shares of restricted stock, RSUs and PSUs currently outstanding are entitled to receive dividends or dividend equivalents, provided that such dividends or dividend equivalents are withheld by the Company and distributed to the applicable holder upon the release of restrictions on such shares of restricted stock, RSUs or PSUs (i.e., upon vesting).
13.COMMITMENTS AND CONTINGENCIES
Employment Agreements
We have employment agreements with certain of our executive officers. The agreements allow for annual compensation, participation in executive benefit plans, and performance-based cash bonuses.
Legal Proceedings
We are involved in various legal proceedings in the ordinary course of business. Although we cannot predict the outcome of these proceedings, legal matters are subject to inherent uncertainties and there exists the possibility that the ultimate resolution of these matters could have a material adverse effect on our business, financial condition, results of operations and cash flows.
Paycom Software, Inc.
Notes to the Consolidated Financial Statements
(tabular dollars and shares in thousands, except per share and per unit amounts)
The items comprising income tax expense are as follows:
|
|
|
|
|
|
|
|
|
|
|
|
|
|
|
Year Ended December 31, |
|
|
|
2023 |
|
|
2022 |
|
|
2021 |
|
Provision for current income taxes |
|
|
|
|
|
|
|
|
|
Federal |
|
$ |
94,068 |
|
|
$ |
81,348 |
|
|
$ |
17,557 |
|
State |
|
|
31,952 |
|
|
|
30,051 |
|
|
|
9,539 |
|
Total provision for current income taxes |
|
|
126,020 |
|
|
|
111,399 |
|
|
|
27,096 |
|
Provision for deferred income taxes |
|
|
|
|
|
|
|
|
|
Federal |
|
|
5,428 |
|
|
|
(2,823 |
) |
|
|
26,579 |
|
State |
|
|
163 |
|
|
|
(387 |
) |
|
|
6,327 |
|
Total provision for deferred income taxes |
|
|
5,591 |
|
|
|
(3,210 |
) |
|
|
32,906 |
|
Total provision for income taxes |
|
$ |
131,611 |
|
|
$ |
108,189 |
|
|
$ |
60,002 |
|
The following schedule reconciles the statutory Federal tax rate to the effective income tax rate:
|
|
|
|
|
|
|
|
|
|
|
|
|
|
|
Year Ended December 31, |
|
|
|
2023 |
|
|
2022 |
|
|
2021 |
|
Federal statutory tax rate |
|
|
21 |
% |
|
|
21 |
% |
|
|
21 |
% |
Increase (decrease) resulting from: |
|
|
|
|
|
|
|
|
|
State income taxes, net of Federal income tax benefit |
|
|
6 |
% |
|
|
6 |
% |
|
|
8 |
% |
Nondeductible expenses |
|
|
3 |
% |
|
|
4 |
% |
|
|
6 |
% |
Research credit, Federal benefit |
|
|
(3 |
%) |
|
|
(2 |
%) |
|
|
(3 |
%) |
Stock-based compensation |
|
|
0 |
% |
|
|
(1 |
%) |
|
|
(7 |
%) |
Remeasurement of state deferred tax liabilities |
|
|
0 |
% |
|
|
0 |
% |
|
|
(2 |
%) |
Uncertain Tax Position |
|
|
1 |
% |
|
|
0 |
% |
|
|
0 |
% |
Effective income tax rate |
|
|
28 |
% |
|
|
28 |
% |
|
|
23 |
% |
Our effective income tax rate was 28% for the years ended December 31, 2023 and 2022.
Deferred income taxes reflect the net tax effects of temporary differences between the carrying amounts of assets and liabilities for financial reporting purposes and the amounts used for income tax purposes. The significant components of our deferred tax assets and liabilities were as follows:
|
|
|
|
|
|
|
|
|
|
|
December 31, |
|
|
|
2023 |
|
|
2022 |
|
Deferred income tax assets (liabilities): |
|
|
|
|
|
|
Mark-to-market investments - OCI |
|
$ |
301 |
|
|
$ |
1,260 |
|
Stock-based compensation |
|
|
15,063 |
|
|
|
4,425 |
|
Investment in Paycom Payroll Holdings, LLC |
|
|
(159,184 |
) |
|
|
(146,907 |
) |
Net operating losses |
|
|
70 |
|
|
|
189 |
|
Noncurrent deferred income tax liabilities, net |
|
$ |
(143,750 |
) |
|
$ |
(141,033 |
) |
At December 31, 2023, we had net operating loss carryforwards for state income tax purposes of approximately $0.1 million, which are available to offset future state taxable income that begin expiring in 2032.
The following table presents a reconciliation of the total unrecognized tax benefits as of the years ended December 31, 2023, 2022 and 2021.
|
|
|
|
|
|
|
|
|
|
|
|
|
|
|
Year Ended December 31, |
|
|
|
2023 |
|
|
2022 |
|
|
2021 |
|
Balance at January 1 |
|
|
|
|
|
|
|
|
|
Tax positions related to current year: |
|
$ |
— |
|
|
$ |
— |
|
|
$ |
— |
|
Additions |
|
|
3,834 |
|
|
|
— |
|
|
|
— |
|
Reductions |
|
|
— |
|
|
|
— |
|
|
|
— |
|
Balance at December 31 |
|
$ |
3,834 |
|
|
$ |
— |
|
|
$ |
— |
|
Paycom Software, Inc.
Notes to the Consolidated Financial Statements
(tabular dollars and shares in thousands, except per share and per unit amounts)
As of December 31, 2023, 2022 and 2021, there were $3.8 million, $0.0 million and $0.0 million, respectively, of unrecognized tax benefits that, if recognized, would affect the annual effective tax rate.
Where applicable, we classify income tax-related interest and penalties as interest expense and other expense, respectively. During the years ended December 31, 2023, 2022 and 2021, we recorded interest and penalties with regard to uncertain tax positions of $0.8 million, $0.0 million and $0.0 million respectively.
We recognize tax benefits from an uncertain tax position only if it is more likely than not the tax position will be sustained on examination by taxing authorities based on the technical merits of the position. The tax benefits in the financial statements from such positions are then measured based on the largest benefit that has a greater than 50 percent likelihood of being realized on settlement.
We file income tax returns with the United States federal government and various state jurisdictions. With few exceptions, we are no longer subject to U.S. federal, state and local income tax examinations by tax authorities for years prior to 2020.
PSU Vesting and Forfeitures
In the aggregate, 75,464 PSUs were eligible to vest based on the Company’s performance during a performance period ended December 31, 2023, consisting of PSUs granted to certain executive officers in 2021, 2022 and 2023. On February 5, 2024, we issued 4,472 shares of common stock upon the vesting of PSUs awarded to Mr. Boelte in May 2023. The number of shares delivered upon vesting of such PSUs was determined based on the Company’s achievement of an adjusted EBITDA performance goal. With respect to all other PSUs eligible to vest based on the Company’s performance during a performance period ended December 31, 2023, the relevant performance goals were not achieved and, as a result, none of such PSUs vested and all were forfeited effective February 5, 2024.
Co-Chief Executive Officer Equity Awards
On February 7, 2024, the Board of Directors appointed Christopher G. Thomas as Co-Chief Executive Officer of the Company. In connection with his promotion, the Compensation Committee of the Board of Directors approved the grant of the following equity awards to Mr. Thomas, in each case effective February 7, 2024: (i) an award of 17,209 time-based RSUs, subject to the terms and conditions of the 2023 LTIP and an award agreement that provides that 4,104 RSUs will vest on February 5, 2025, 4,105 RSUs will vest on February 5, 2026 and 9,000 RSUs will vest on February 5, 2027; (ii) an award of 15,000 PSUs, subject to the terms and conditions of the 2023 LTIP and an award agreement that provides for performance-based vesting based on a revenue performance goal; and (iii) an award of 4,104 shares of common stock of the Company, subject to the terms and conditions of the 2023 LTIP and an award agreement that provides for immediate vesting of such shares.
Forfeiture of 2020 CEO Performance Award
On February 7, 2024, the Company and Mr. Richison entered into a letter agreement pursuant to which, among other things, Mr. Richison acknowledged and agreed that the change in his position from Chief Executive Officer to Co-Chief Executive Officer triggered the termination and forfeiture of the 2020 CEO Performance Award in accordance with its terms. As a result, on February 7, 2024, 1,610,000 shares of restricted stock were forfeited to the Company. In accordance with ASC 718, when the requisite service period is not met at the time of forfeiture, the total previously recognized compensation cost of a particular award generally would be reversed to the financial statement captions where the compensation expense was recorded. Previously recognized compensation cost related to the 2020 CEO Performance Award was approximately $117.5 million as of December 31, 2023 and was recorded to additional paid-in capital in the consolidated balance sheets.
Item 9. Changes in and Disagreements with Accountants on Accounting and Financial Disclosure
None.
Item 9A. Controls and Procedures
Evaluation of Disclosure Controls and Procedures
The term “disclosure controls and procedures,” as defined in Rules 13a-15(e) and 15d-15(e) under the Exchange Act, refers to controls and procedures that are designed to ensure that information required to be disclosed by a company in the reports that it files or submits under the Exchange Act is recorded, processed, summarized and reported, within the time periods specified in the SEC’s rules and forms. Disclosure controls and procedures include, without limitation, controls and procedures designed to ensure that such information is accumulated and communicated to a company’s management, including its principal executive and principal financial officers, as appropriate to allow timely decisions regarding required disclosure. We believe, however, that any controls and procedures, no matter how well designed and operated, can only provide reasonable assurance of achieving desired control objectives, and no evaluation of controls can provide absolute assurance that all control issues and instances of fraud or error within a company, if any, have been detected.
Our management, with the participation of our Co-Chief Executive Officers and Chief Financial Officer, has evaluated the effectiveness of our disclosure controls and procedures as of December 31, 2023, the end of the period covered by this Form 10-K. Based upon such evaluation, our Co-Chief Executive Officers and Chief Financial Officer have concluded that our disclosure controls and procedures were effective as of such date.
Management’s Report on Internal Control Over Financial Reporting
Our management is responsible for establishing and maintaining adequate internal control over financial reporting. Our management, under the supervision and with the participation of our Co-Chief Executive Officers and Chief Financial Officer, assessed the effectiveness of our internal control over financial reporting based on criteria established in the 2013 Internal Control—Integrated Framework issued by the Committee of Sponsoring Organizations of the Treadway Commission (COSO). Based on this evaluation, management concluded that our internal control over financial reporting was effective as of December 31, 2023.
The effectiveness of our internal control over financial reporting as of December 31, 2023, has been audited by Grant Thornton LLP, an independent registered public accounting firm, as stated in its attestation report included on the following page.
Changes in Internal Control Over Financial Reporting
There have been no material changes in our internal control over financial reporting that occurred during the quarter ended December 31, 2023 that have materially affected, or are reasonably likely to materially affect, our internal control over financial reporting.
Item 9B. Other Information
Insider Trading Arrangements
During the quarter ended December 31, 2023, no director or officer (as defined in Rule 16a-1(f) of the Exchange Act) of the Company adopted, modified, or terminated any “Rule 10b5-1 trading arrangement” or “non-Rule 10b5-1 trading arrangement” (in each case, as defined in Item 408(a) of Regulation S-K).
Item 9C. Disclosure Regarding Foreign Jurisdictions that Prevent Inspections
Not applicable.
REPORT OF INDEPENDENT REGISTERED PUBLIC ACCOUNTING FIRM
Board of Directors and Stockholders
Paycom Software, Inc.
Opinion on internal control over financial reporting
We have audited the internal control over financial reporting of Paycom Software, Inc. (a Delaware corporation) and subsidiaries (the “Company”) as of December 31, 2023, based on criteria established in the 2013 Internal Control—Integrated Framework issued by the Committee of Sponsoring Organizations of the Treadway Commission (“COSO”). In our opinion, the Company maintained, in all material respects, effective internal control over financial reporting as of December 31, 2023, based on criteria established in the 2013 Internal Control—Integrated Framework issued by COSO.
We also have audited, in accordance with the standards of the Public Company Accounting Oversight Board (United States) (“PCAOB”), the consolidated financial statements of the Company as of and for the year ended December 31, 2023, and our report dated February 15, 2024 expressed an unqualified opinion on those financial statements.
Basis for opinion
The Company’s management is responsible for maintaining effective internal control over financial reporting and for its assessment of the effectiveness of internal control over financial reporting, included in the accompanying Management’s Report on Internal Control Over Financial Reporting. Our responsibility is to express an opinion on the Company’s internal control over financial reporting based on our audit. We are a public accounting firm registered with the PCAOB and are required to be independent with respect to the Company in accordance with the U.S. federal securities laws and the applicable rules and regulations of the Securities and Exchange Commission and the PCAOB.
We conducted our audit in accordance with the standards of the PCAOB. Those standards require that we plan and perform the audit to obtain reasonable assurance about whether effective internal control over financial reporting was maintained in all material respects. Our audit included obtaining an understanding of internal control over financial reporting, assessing the risk that a material weakness exists, testing and evaluating the design and operating effectiveness of internal control based on the assessed risk, and performing such other procedures as we considered necessary in the circumstances. We believe that our audit provides a reasonable basis for our opinion.
Definition and limitations of internal control over financial reporting
A company’s internal control over financial reporting is a process designed to provide reasonable assurance regarding the reliability of financial reporting and the preparation of financial statements for external purposes in accordance with generally accepted accounting principles. A company’s internal control over financial reporting includes those policies and procedures that (1) pertain to the maintenance of records that, in reasonable detail, accurately and fairly reflect the transactions and dispositions of the assets of the company; (2) provide reasonable assurance that transactions are recorded as necessary to permit preparation of financial statements in accordance with generally accepted accounting principles, and that receipts and expenditures of the company are being made only in accordance with authorizations of management and directors of the company; and (3) provide reasonable assurance regarding prevention or timely detection of unauthorized acquisition, use, or disposition of the company’s assets that could have a material effect on the financial statements.
Because of its inherent limitations, internal control over financial reporting may not prevent or detect misstatements. Also, projections of any evaluation of effectiveness to future periods are subject to the risk that controls may become inadequate because of changes in conditions, or that the degree of compliance with the policies or procedures may deteriorate
/s/ GRANT THORNTON LLP
Oklahoma City, Oklahoma
February 15, 2024
PART III
Item 10. Directors, Executive Officers and Corporate Governance
The information required in response to this Item 10 is incorporated herein by reference to our Definitive Proxy Statement to be filed with the SEC pursuant to Regulation 14A of the Exchange Act not later than 120 days after the end of the fiscal year covered by this Annual Report on Form 10-K.
Item 11. Executive Compensation
The information required in response to this Item 11 (except for the information required by Item 402(v) of Regulation S-K) is incorporated herein by reference to our Definitive Proxy Statement to be filed with the SEC pursuant to Regulation 14A of the Exchange Act not later than 120 days after the end of the fiscal year covered by this Annual Report on Form 10-K.
Item 12. Security Ownership of Certain Beneficial Owners and Management and Related Stockholder Matters
The information required in response to this Item 12 is incorporated herein by reference to our Definitive Proxy Statement to be filed with the SEC pursuant to Regulation 14A of the Exchange Act not later than 120 days after the end of the fiscal year covered by this Annual Report on Form 10-K.
Item 13. Certain Relationships and Related Transactions, and Director Independence
The information required in response to this Item 13 is incorporated herein by reference to our Definitive Proxy Statement to be filed with the SEC pursuant to Regulation 14A of the Exchange Act not later than 120 days after the end of the fiscal year covered by this Annual Report on Form 10-K.
Item 14. Principal Accounting Fees and Services
The information required in response to this Item 14 is incorporated herein by reference to our Definitive Proxy Statement to be filed with the SEC pursuant to Regulation 14A of the Exchange Act not later than 120 days after the end of the fiscal year covered by this Annual Report on Form 10-K.
PART IV
Item 15. Exhibits, Financial Statement Schedules
(a)Documents filed as part of this Form 10-K
(1)Consolidated Financial Statements: The following consolidated financial statements of Paycom Software, Inc., together with the report thereon, of Grant Thornton LLP, our Independent Registered Public Accounting Firm, are included in Part II, Item 8 of this Form 10-K:
Consolidated Balance Sheets as of December 31, 2023 and 2022
Consolidated Statements of Comprehensive Income, Years Ended December 31, 2023, 2022 and 2021
Consolidated Statements of Stockholders’ Equity, Years Ended December 31, 2023, 2022 and 2021
Consolidated Statements of Cash Flows, Years Ended December 31, 2023, 2022 and 2021
Notes to the Consolidated Financial Statements
(2)Financial Statement Schedules: Financial statement schedules have been omitted as information required is inapplicable or the information is presented in the consolidated financial statements and the related notes.
The following exhibits are included herein or incorporated herein by reference:
|
|
|
Exhibit No. |
|
Description |
|
|
|
3.1 |
|
Amended and Restated Certificate of Incorporation of Paycom Software, Inc. (incorporated by reference to Exhibit 3.1 to the Company’s Amendment No. 1 to the Registration Statement on Form S-1/A dated March 31, 2014, filed with the SEC on March 31, 2014). |
|
|
|
3.2 |
|
Amended and Restated Bylaws of Paycom Software, Inc. (incorporated by reference to Exhibit 3.1 to the Company’s Current Report on Form 8-K dated February 7, 2024, filed with the SEC on February 7, 2024). |
|
|
|
4.1 |
|
Form of Common Stock Certificate (incorporated by reference to Exhibit 4.1 to the Company’s Amendment No. 1 to the Registration Statement on Form S-1/A dated March 31, 2014, filed with the SEC on March 31, 2014). |
|
|
|
4.2 |
|
Description of Securities (incorporated by reference to Exhibit 4.11 to the Company’s Annual Report on Form 10-K for the year ended December 31, 2019, filed with the SEC on February 13, 2020). |
|
|
|
10.1+ |
|
Form of Indemnification Agreement between Paycom Software, Inc. and each of its directors and executive officers (incorporated by reference to Exhibit 10.1 to the Company’s Registration Statement on Form S-1 dated March 10, 2014, filed with the SEC on March 10, 2014). |
|
|
|
10.2+ |
|
Paycom Software, Inc. 2014 Long-Term Incentive Plan (incorporated by reference to Exhibit 10.2 to the Company’s Registration Statement on Form S-1 dated March 10, 2014, filed with the SEC on March 10, 2014). |
|
|
|
10.2.1+ |
|
First Amendment to the Paycom Software, Inc. 2014 Long-Term Incentive Plan (incorporated by reference to Exhibit 10.1 to the Company’s Current Report on Form 8-K dated May 1, 2017, filed with the SEC on May 4, 2017). |
|
|
|
10.2.2+ |
|
Form of Time and Market-Based Vesting Restricted Stock Award Agreement (CEO) under the Paycom Software, Inc. 2014 Long-Term Incentive Plan (incorporated by reference to Exhibit 10.1 to the Company’s Current Report on Form 8-K dated April 26, 2017, filed with the SEC on April 27, 2017). |
|
|
|
10.2.3+ |
|
Form of Time and Market-Based Vesting Restricted Stock Award Agreement (Executive) under the Paycom Software, Inc. 2014 Long-Term Incentive Plan (incorporated by reference to Exhibit 10.2 to the Company’s Current Report on Form 8-K dated April 26, 2017, filed with the SEC on April 27, 2017). |
|
|
|
10.2.4+ |
|
Form of Time and Market-Based Vesting Restricted Stock Award Agreement under the Paycom Software, Inc. 2014 Long-Term Incentive Plan (incorporated by reference to Exhibit 99.5 to the Company’s Registration Statement on Form S-8, dated January 15, 2019, filed with the SEC on January 15, 2019). |
|
|
|
10.2.5+ |
|
Form of Time-Based Vesting Restricted Stock Award Agreement under the Paycom Software, Inc. 2014 Long-Term Incentive Plan (incorporated by reference to Exhibit 99.6 to the Company’s Registration Statement on Form S-8, dated January 15, 2019, filed with the SEC on January 15, 2019). |
|
|
|
10.2.6+ |
|
Form of CEO Market-Based Vesting Restricted Stock Award Agreement under the Paycom Software, Inc. 2014 Long-Term Incentive Plan, approved January 30, 2020 (incorporated by reference to Exhibit 10.1 to the Company’s Current Report on Form 8-K dated January 30, 2020, filed with the SEC on February 5, 2020). |
|
|
|
10.2.7+ |
|
Form of Market-Based Vesting Restricted Stock Award Agreement under the Paycom Software, Inc. 2014 Long-Term Incentive Plan, approved January 30, 2020 (incorporated by reference to Exhibit 10.2 to the Company’s Current Report on Form 8-K dated January 30, 2020, filed with the SEC on February 5, 2020). |
|
|
|
|
|
|
Exhibit No. |
|
Description |
|
|
|
10.2.8+ |
|
Form of Time-Based Vesting Restricted Stock Award Agreement (Non-Executives) under the Paycom Software, Inc. 2014 Long-Term Incentive Plan (incorporated by reference to Exhibit 10.6 to the Company’s Quarterly Report on Form 10-Q for the quarter ended March 31, 2020, filed with the SEC on April 30, 2020). |
|
|
|
10.2.9+ |
|
Form of Market-Based Vesting Restricted Stock Award Agreement (Non-Executives) under the Paycom Software, Inc. 2014 Long-Term Incentive Plan (incorporated by reference to Exhibit 10.7 to the Company’s Quarterly Report on Form 10-Q for the quarter ended March 31, 2020, filed with the SEC on April 30, 2020). |
|
|
|
10.2.10+ |
|
Form of Restricted Stock Award Agreement (Directors) under the Paycom Software, Inc. 2014 Long-Term Incentive Plan (incorporated by reference to Exhibit 10.8 to the Company’s Quarterly Report on Form 10-Q for the quarter ended March 31, 2020, filed with the SEC on April 30, 2020). |
|
|
|
10.2.11+ |
|
Restricted Stock Award Agreement (Market Based Vesting – CEO), dated November 23, 2020, under the Paycom Software, Inc. 2014 Long-Term Incentive Plan (incorporated by reference to Exhibit 10.1 to the Company’s Current Report on Form 8-K dated November 23, 2020, filed with the SEC on November 23, 2020). |
|
|
|
10.2.12+ |
|
Form of Time-Based Restricted Stock Award Agreement (Non-Executives – 2021) under the Paycom Software, Inc. 2014 Long-Term Incentive Plan (incorporated by reference to Exhibit 10.2.12 to the Company’s Annual Report on Form 10-K for the year ended December 31, 2020, filed with the SEC on February 18, 2021). |
|
|
|
10.2.13+ |
|
Form of Market-Based Restricted Stock Award Agreement (Non-Executives – 2021) under the Paycom Software, Inc. 2014 Long-Term Incentive Plan (incorporated by reference to Exhibit 10.2.13 to the Company’s Annual Report on Form 10-K for the year ended December 31, 2020, filed with the SEC on February 18, 2021). |
|
|
|
10.2.14+ |
|
Form of Restricted Stock Unit Award Agreement – Performance-Based Vesting under the Paycom Software, Inc. 2014 Long-Term Incentive Plan (incorporated by reference to Exhibit 10.1 to the Company’s Current Report on Form 8-K dated February 10, 2021, filed with the SEC on February 17, 2021). |
|
|
|
10.3+ |
|
Paycom Software, Inc. 2023 Long-Term Incentive Plan (incorporated by reference to Exhibit 99.1 to the Company’s Registration Statement on Form S-8 dated May 1, 2023, filed with the SEC on May 1, 2023). |
|
|
|
10.3.1+ |
|
Form of Restricted Stock Unit Award Agreement – Performance-Based Vesting (Boelte) under the Paycom Software, Inc. 2023 Long Term Incentive Plan (incorporated by reference to Exhibit 10.2 to the Company’s Quarterly Report on Form 10-Q for the quarter ended March 31, 2023, filed with the SEC on May 4, 2023). |
|
|
|
10.3.2+ |
|
Form of Restricted Stock Unit Award Agreement – Performance-Based Vesting (Faurot) under the Paycom Software, Inc. 2023 Long Term Incentive Plan (incorporated by reference to Exhibit 10.3 to the Company’s Quarterly Report on Form 10-Q for the quarter ended March 31, 2023, filed with the SEC on May 4, 2023). |
|
|
|
10.3.3+ |
|
Form of Restricted Stock Unit Award Agreement – Performance-Based Vesting (Smith/Thomas) under the Paycom Software, Inc. 2023 Long Term Incentive Plan (incorporated by reference to Exhibit 10.4 to the Company’s Quarterly Report on Form 10-Q for the quarter ended March 31, 2023, filed with the SEC on May 4, 2023). |
|
|
|
10.3.4+ |
|
Form of Restricted Stock Unit Award Agreement – Time-Based Vesting (Executive) under the Paycom Software, Inc. 2023 Long Term Incentive Plan (incorporated by reference to Exhibit 10.5 to the Company’s Quarterly Report on Form 10-Q for the quarter ended March 31, 2023, filed with the SEC on May 4, 2023). |
|
|
|
10.3.5+ |
|
Form of Restricted Stock Award Agreement – Time-Based Vesting (Executive) under the Paycom Software, Inc. 2023 Long Term Incentive Plan (incorporated by reference to Exhibit 10.6 to the Company’s Quarterly Report on Form 10-Q for the quarter ended March 31, 2023, filed with the SEC on May 4, 2023). |
|
|
|
10.3.6+ |
|
Form of Stock Award Agreement – Sign-On Award (Clark) under the Paycom Software, Inc. 2023 Long Term Incentive Plan (incorporated by reference to Exhibit 10.3 to the Company’s Current Report on Form 8-K dated November 17, 2023, filed with the SEC on November 21, 2023). |
|
|
|
10.3.7+ |
|
Form of Restricted Stock Unit Award Agreement – Performance-Based Vesting (incorporated by reference to Exhibit 10.2 to the Company’s Current Report on Form 8-K dated February 7, 2024, filed with the SEC on February 7, 2024). |
|
|
|
10.3.8+ |
|
Form of Stock Award Agreement (incorporated by reference to Exhibit 10.3 to the Company’s Current Report on Form 8-K dated February 7, 2024, filed with the SEC on February 7, 2024). |
|
|
|
10.4+ |
|
Second Amended and Restated Executive Employment Agreement by and between Paycom Software, Inc. and Chad Richison, dated March 9, 2020 (incorporated by reference to Exhibit 10.1 to the Company’s Quarterly Report on Form 10-Q for the quarter ended March 31, 2020, filed with the SEC on April 30, 2020). |
|
|
|
Exhibit No. |
|
Description |
|
|
10.4.1 |
|
Unanimous Written Consent of the Compensation Committee of the Board of Directors of Paycom Software, Inc. dated October 28, 2019 (incorporated by reference to Exhibit 10.3 to the Company’s Quarterly Report on Form 10-Q for the quarter ended September 30, 2019, filed with the SEC on October 31, 2019). |
|
|
|
10.4.2+ |
|
Letter Agreement, by and between Paycom Software, Inc. and Chad Richison, dated February 7, 2024 (incorporated by reference to Exhibit 10.5 to the Company’s Current Report on Form 8-K dated February 7, 2024, filed with the SEC on February 7, 2024). |
|
|
|
10.5+ |
|
Amended and Restated Executive Employment Agreement by and between Paycom Software, Inc. and Craig E. Boelte, dated March 9, 2020 (incorporated by reference to Exhibit 10.2 to the Company’s Quarterly Report on Form 10-Q for the quarter ended March 31, 2020, filed with the SEC on April 30, 2020). |
|
|
|
10.6+ |
|
Offer Letter by and between Paycom Software, Inc. and Jason D. Clark, dated November 17, 2023 (incorporated by reference to Exhibit 10.1 to the Company’s Current Report on Form 8-K dated November 17, 2023, filed with the SEC on November 21, 2023). |
|
|
|
10.7+ |
|
Letter Agreement, by and between Paycom Software, Inc. and Christopher G. Thomas, dated February 7, 2024 (incorporated by reference to Exhibit 10.4 to the Company’s Current Report on Form 8-K dated February 7, 2024, filed with the SEC on February 7, 2024). |
|
|
|
10.8+ |
|
Severance and Release Agreement by and among Paycom Software, Inc., Paycom Payroll, LLC and Justin Long, dated March 31, 2023 (incorporated by reference to Exhibit 10.1 to the Company’s Current Report on Form 8-K dated March 28, 2023, filed with the SEC on April 3, 2023). |
|
|
|
10.9+ |
|
Paycom Software, Inc. Annual Incentive Plan (incorporated by reference to Exhibit 10.2 to the Company’s Current Report on Form 8-K dated May 5, 2015, filed with the SEC on May 8, 2015). |
|
|
|
10.9.1+ |
|
First Amendment to Paycom Software, Inc. Annual Incentive Plan (incorporated by reference to Exhibit 10.6.1 to the Company’s Annual Report on Form 10-K for the year ended December 31, 2018, filed with the SEC on February 14, 2019). |
|
|
|
10.10 |
|
Paycom Software, Inc. Employee Stock Purchase Plan (incorporated by reference to Exhibit 10.1 to the Company’s Current Report on Form 8-K dated May 5, 2015, filed with the SEC on May 8, 2015). |
|
|
10.11 |
|
Credit Agreement, dated July 29, 2022, by and among Paycom Software, Inc., Paycom Payroll, LLC, certain other subsidiaries of Paycom Software, In. as guarantors, JPMorgan Chase Bank, N.A., as a lender, swingline lender, and issuing bank, the lenders party thereto, and JPMorgan Chase Bank, N.A. as the administrative agent (incorporated by reference to Exhibit 10.1 to the Company’s Current Report on Form 8-K dated July 29, 2022, filed with the SEC on August 2, 2022). |
|
|
|
10.11.1 |
|
Amendment No. 1 to Credit Agreement, dated May 17, 2023, by and among Paycom Software, Inc., Paycom Payroll, LLC, certain other subsidiaries of Paycom Software, Inc. as guarantors, JPMorgan Chase Bank, N.A., as a lender, swingline lender, and issuing bank, the lenders party thereto, and JPMorgan Chase Bank, N.A. as the administrative agent (incorporated by reference to Exhibit 10.7 to the Company’s Quarterly Report on Form 10-Q for the quarter ended June 30, 2023, filed with the SEC on August 3, 2023). |
|
|
|
10.11.2 |
|
Amendment No. 2 to Credit Agreement, dated July 28, 2023, by and among Paycom Software, Inc., Paycom Payroll, LLC, certain other subsidiaries of Paycom Software, Inc. as guarantors, JPMorgan Chase Bank, N.A., as a lender, swingline lender and issuing bank, the other lenders party thereto, and JPMorgan Chase Bank, N.A., as the administrative agent (incorporated by reference to Exhibit 10.1 to the Company’s Current Report on Form 8-K dated July 28, 2023, filed with the SEC on August 1, 2023). |
|
|
|
21.1* |
|
List of subsidiaries of the Company. |
|
|
|
23.1* |
|
Consent of Independent Registered Public Accounting Firm. |
|
|
|
31.1* |
|
Certification of the Co-Chief Executive Officer of the Company, pursuant to the Section 302 of the Sarbanes-Oxley Act of 2002. |
|
|
|
31.2* |
|
Certification of the Co-Chief Executive Officer of the Company, pursuant to the Section 302 of the Sarbanes-Oxley Act of 2002. |
|
|
|
31.3* |
|
Certification of the Chief Financial Officer of the Company, pursuant to Section 302 of the Sarbanes-Oxley Act of 2002. |
|
|
|
|
|
|
|
|
|
+ Management contract or compensatory plan or arrangement.
* Filed herewith.
** The certifications attached as Exhibit 32.1 are not deemed “filed” with the SEC and are not to be incorporated by reference into any filing of Paycom Software, Inc. under the Securities Act or the Exchange Act, whether made before or after the date of this Annual Report on Form 10-K, irrespective of any general incorporation language contained in such filing.
Item 16. Form 10-K Summary
Not applicable.
SIGNATURES
Pursuant to the requirements of Section 13 or 15(d) of the Securities Exchange Act of 1934, the registrant has duly caused this report to be signed on its behalf by the undersigned thereunto duly authorized.
Date: February 15, 2024
|
|
|
|
|
PAYCOM SOFTWARE, INC. |
|
|
|
|
|
By: |
|
/s/ Chad Richison |
|
|
|
Chad Richison |
|
|
|
Co-Chief Executive Officer and President |
|
|
|
|
|
By: |
|
/s/ Christopher G. Thomas |
|
|
|
Christopher G. Thomas |
|
|
|
Co-Chief Executive Officer |
Pursuant to the requirements of the Securities Exchange Act of 1934, this report has been signed below by the following persons on behalf of the registrant and in the capacities and on the date indicated.
Date: February 15, 2024
|
|
|
/s/ Chad Richison |
|
|
Chad Richison |
|
|
Co-Chief Executive Officer, President and Chairman of the Board of Directors (Co-Principal Executive Officer) |
|
|
|
|
|
/s/ Christopher G. Thomas |
|
|
Christopher G. Thomas |
|
|
Co-Chief Executive Officer |
|
|
(Co-Principal Executive Officer) |
|
|
|
|
|
/s/ Craig E. Boelte |
|
|
Craig E. Boelte |
|
|
Chief Financial Officer (Principal Accounting Officer and Principal Financial Officer) |
|
|
|
|
|
/s/ Henry C. Duques |
|
|
Henry C. Duques Director |
|
|
|
|
|
/s/ Robert J. Levenson |
|
|
Robert J. Levenson Director |
|
|
|
|
|
/s/ Frederick C. Peters II |
|
|
Frederick C. Peters II Director |
|
|
|
|
|
/s/ Sharen J. Turney |
|
|
Sharen J. Turney Director |
|
|
|
|
|
/s/ J.C. Watts, Jr. |
|
|
J.C. Watts, Jr. Director |
|
|
|
|
|
/s/ Felicia Williams |
|
|
Felicia Williams Director |
|
|