0001585689true12/31/20212021FYFALSE--12-31279,139,0827930 Jones Branch DriveSuite 1100McLeanVAP2Y0M0DP03Y0M0DP3Y0M0DP3Y0M0Dhttp://fasb.org/us-gaap/2021-01-31#AccountsPayableAndAccruedLiabilitiesCurrenthttp://fasb.org/us-gaap/2021-01-31#AccountsPayableAndAccruedLiabilitiesCurrenthttp://fasb.org/us-gaap/2021-01-31#PropertyPlantAndEquipmentNethttp://fasb.org/us-gaap/2021-01-31#PropertyPlantAndEquipmentNethttp://fasb.org/us-gaap/2021-01-31#LongTermDebtAndCapitalLeaseObligationsCurrenthttp://fasb.org/us-gaap/2021-01-31#LongTermDebtAndCapitalLeaseObligationsCurrenthttp://fasb.org/us-gaap/2021-01-31#LongTermDebtAndCapitalLeaseObligationshttp://fasb.org/us-gaap/2021-01-31#LongTermDebtAndCapitalLeaseObligations00015856892021-01-012021-12-3100015856892021-06-30iso4217:USD00015856892022-02-09xbrli:shares00015856892021-12-3100015856892020-12-310001585689hlt:ManagementandFranchiseAgreementsMember2021-12-310001585689hlt:ManagementandFranchiseAgreementsMember2020-12-310001585689us-gaap:OtherIntangibleAssetsMember2021-12-310001585689us-gaap:OtherIntangibleAssetsMember2020-12-310001585689hlt:GuestLoyaltyProgramMember2021-12-310001585689hlt:GuestLoyaltyProgramMember2020-12-31iso4217:USDxbrli:shares0001585689hlt:FranchiseandlicensingfeesMember2021-01-012021-12-310001585689hlt:FranchiseandlicensingfeesMember2020-01-012020-12-310001585689hlt:FranchiseandlicensingfeesMember2019-01-012019-12-310001585689us-gaap:ManagementServiceBaseMember2021-01-012021-12-310001585689us-gaap:ManagementServiceBaseMember2020-01-012020-12-310001585689us-gaap:ManagementServiceBaseMember2019-01-012019-12-310001585689us-gaap:ManagementServiceIncentiveMember2021-01-012021-12-310001585689us-gaap:ManagementServiceIncentiveMember2020-01-012020-12-310001585689us-gaap:ManagementServiceIncentiveMember2019-01-012019-12-310001585689us-gaap:HotelOwnedMember2021-01-012021-12-310001585689us-gaap:HotelOwnedMember2020-01-012020-12-310001585689us-gaap:HotelOwnedMember2019-01-012019-12-310001585689us-gaap:HotelOtherMember2021-01-012021-12-310001585689us-gaap:HotelOtherMember2020-01-012020-12-310001585689us-gaap:HotelOtherMember2019-01-012019-12-310001585689hlt:TotalrevenuesexcludingreimbursablerevenuesMember2021-01-012021-12-310001585689hlt:TotalrevenuesexcludingreimbursablerevenuesMember2020-01-012020-12-310001585689hlt:TotalrevenuesexcludingreimbursablerevenuesMember2019-01-012019-12-310001585689hlt:ReimbursementRevenueMember2021-01-012021-12-310001585689hlt:ReimbursementRevenueMember2020-01-012020-12-310001585689hlt:ReimbursementRevenueMember2019-01-012019-12-3100015856892020-01-012020-12-3100015856892019-01-012019-12-310001585689hlt:FranchiseAndLicensingFeesAndBaseAndOtherManagementFeesMember2021-01-012021-12-310001585689hlt:FranchiseAndLicensingFeesAndBaseAndOtherManagementFeesMember2020-01-012020-12-310001585689hlt:FranchiseAndLicensingFeesAndBaseAndOtherManagementFeesMember2019-01-012019-12-310001585689hlt:GuestLoyaltyProgramMember2021-01-012021-12-310001585689hlt:GuestLoyaltyProgramMember2020-01-012020-12-310001585689hlt:GuestLoyaltyProgramMember2019-01-012019-12-3100015856892019-12-3100015856892018-12-310001585689us-gaap:CommonStockMember2018-12-310001585689us-gaap:TreasuryStockMember2018-12-310001585689us-gaap:AdditionalPaidInCapitalMember2018-12-310001585689us-gaap:RetainedEarningsMember2018-12-310001585689us-gaap:AccumulatedOtherComprehensiveIncomeMember2018-12-310001585689us-gaap:NoncontrollingInterestMember2018-12-310001585689us-gaap:RetainedEarningsMember2019-01-012019-12-310001585689us-gaap:NoncontrollingInterestMember2019-01-012019-12-310001585689us-gaap:AccumulatedOtherComprehensiveIncomeMember2019-01-012019-12-310001585689us-gaap:CommonStockMember2019-01-012019-12-310001585689us-gaap:TreasuryStockMember2019-01-012019-12-310001585689us-gaap:AdditionalPaidInCapitalMember2019-01-012019-12-310001585689srt:CumulativeEffectPeriodOfAdoptionAdjustmentMemberus-gaap:RetainedEarningsMemberus-gaap:AccountingStandardsUpdate201602Member2019-12-310001585689srt:CumulativeEffectPeriodOfAdoptionAdjustmentMemberus-gaap:AccountingStandardsUpdate201602Member2019-12-310001585689us-gaap:CommonStockMember2019-12-310001585689us-gaap:TreasuryStockMember2019-12-310001585689us-gaap:AdditionalPaidInCapitalMember2019-12-310001585689us-gaap:RetainedEarningsMember2019-12-310001585689us-gaap:AccumulatedOtherComprehensiveIncomeMember2019-12-310001585689us-gaap:NoncontrollingInterestMember2019-12-310001585689us-gaap:RetainedEarningsMember2020-01-012020-12-310001585689us-gaap:NoncontrollingInterestMember2020-01-012020-12-310001585689us-gaap:AccumulatedOtherComprehensiveIncomeMember2020-01-012020-12-310001585689us-gaap:CommonStockMember2020-01-012020-12-310001585689us-gaap:TreasuryStockMember2020-01-012020-12-310001585689us-gaap:AdditionalPaidInCapitalMember2020-01-012020-12-310001585689us-gaap:AccountingStandardsUpdate201613Membersrt:CumulativeEffectPeriodOfAdoptionAdjustmentMemberus-gaap:RetainedEarningsMember2020-12-310001585689us-gaap:AccountingStandardsUpdate201613Membersrt:CumulativeEffectPeriodOfAdoptionAdjustmentMember2020-12-310001585689us-gaap:CommonStockMember2020-12-310001585689us-gaap:TreasuryStockMember2020-12-310001585689us-gaap:AdditionalPaidInCapitalMember2020-12-310001585689us-gaap:RetainedEarningsMember2020-12-310001585689us-gaap:AccumulatedOtherComprehensiveIncomeMember2020-12-310001585689us-gaap:NoncontrollingInterestMember2020-12-310001585689us-gaap:RetainedEarningsMember2021-01-012021-12-310001585689us-gaap:NoncontrollingInterestMember2021-01-012021-12-310001585689us-gaap:AccumulatedOtherComprehensiveIncomeMember2021-01-012021-12-310001585689us-gaap:CommonStockMember2021-01-012021-12-310001585689us-gaap:TreasuryStockMember2021-01-012021-12-310001585689us-gaap:AdditionalPaidInCapitalMember2021-01-012021-12-310001585689us-gaap:CommonStockMember2021-12-310001585689us-gaap:TreasuryStockMember2021-12-310001585689us-gaap:AdditionalPaidInCapitalMember2021-12-310001585689us-gaap:RetainedEarningsMember2021-12-310001585689us-gaap:AccumulatedOtherComprehensiveIncomeMember2021-12-310001585689us-gaap:NoncontrollingInterestMember2021-12-31hlt:Hotelhlt:Roomhlt:Countryutr:Rate0001585689hlt:ReimbursableThirdPartyExpenses2020-01-012020-12-310001585689hlt:InternationalManagementContractsMember2021-01-012021-12-310001585689srt:MinimumMemberhlt:ManagementcontractacquisitioncostsMember2021-01-012021-12-310001585689hlt:ManagementcontractacquisitioncostsMembersrt:MaximumMember2021-01-012021-12-310001585689srt:MinimumMemberhlt:FranchisecontractacquisitioncostsMember2021-01-012021-12-310001585689hlt:FranchisecontractacquisitioncostsMembersrt:MaximumMember2021-01-012021-12-310001585689srt:MinimumMemberus-gaap:LeaseAgreementsMember2021-01-012021-12-310001585689us-gaap:LeaseAgreementsMembersrt:MaximumMember2021-01-012021-12-310001585689hlt:HiltonHonorsIntangibleMember2021-01-012021-12-310001585689us-gaap:SoftwareAndSoftwareDevelopmentCostsMember2021-01-012021-12-310001585689srt:MinimumMemberus-gaap:BuildingAndBuildingImprovementsMember2021-01-012021-12-310001585689srt:MaximumMemberus-gaap:BuildingAndBuildingImprovementsMember2021-01-012021-12-310001585689srt:MinimumMemberhlt:FurnitureandEquipmentMember2021-01-012021-12-310001585689hlt:FurnitureandEquipmentMembersrt:MaximumMember2021-01-012021-12-310001585689srt:MinimumMemberus-gaap:ComputerEquipmentMember2021-01-012021-12-310001585689srt:MaximumMemberus-gaap:ComputerEquipmentMember2021-01-012021-12-310001585689srt:MinimumMemberus-gaap:RestrictedStockUnitsRSUMember2021-01-012021-12-310001585689srt:MaximumMemberus-gaap:RestrictedStockUnitsRSUMember2021-01-012021-12-310001585689us-gaap:EmployeeStockOptionMember2021-01-012021-12-310001585689us-gaap:PerformanceSharesMember2021-01-012021-12-310001585689us-gaap:PerformanceSharesMemberhlt:MinimumAchievementPercentageMember2021-01-012021-12-310001585689us-gaap:PerformanceSharesMemberhlt:MaximumAchievementPercentageMember2021-01-012021-12-310001585689hlt:TargetMemberus-gaap:PerformanceSharesMember2021-01-012021-12-31iso4217:JPY00015856892020-04-300001585689hlt:LoyaltyProgramRevenuesMember2021-12-310001585689hlt:LoyaltyProgramRevenuesMember2021-01-012021-12-310001585689hlt:PerformanceObligationForCoBrandedCreditCardArrangementsMember2021-12-310001585689hlt:ApplicationinitiationandotherfeesMember2021-12-31hlt:Entity0001585689us-gaap:VariableInterestEntityPrimaryBeneficiaryMember2021-12-310001585689us-gaap:VariableInterestEntityPrimaryBeneficiaryMember2020-12-310001585689hlt:VIERevolvingCreditFacilityMember2021-12-310001585689hlt:VIERevolvingCreditFacilityMember2021-08-310001585689hlt:VIERevolvingCreditFacilityMember2020-12-310001585689hlt:VIELoanAggregateAmountMember2021-12-310001585689us-gaap:GoodwillMember2020-01-012020-12-310001585689hlt:ManagementandFranchiseMember2020-12-310001585689hlt:ManagementandFranchiseMember2021-12-310001585689hlt:ManagementContractsRecordedAtMergerMember2021-12-310001585689us-gaap:ContractBasedIntangibleAssetsMember2021-12-310001585689us-gaap:CapitalizedContractCostDomain2021-12-310001585689us-gaap:SoftwareAndSoftwareDevelopmentCostsMember2021-12-310001585689us-gaap:LeaseAgreementsMember2021-12-310001585689hlt:HiltonHonorsIntangibleMember2021-12-310001585689hlt:ManagementContractsRecordedAtMergerMember2020-12-310001585689us-gaap:ContractBasedIntangibleAssetsMember2020-12-310001585689us-gaap:CapitalizedContractCostDomain2020-12-310001585689us-gaap:SoftwareAndSoftwareDevelopmentCostsMember2020-12-310001585689us-gaap:LeaseAgreementsMember2020-12-310001585689hlt:HiltonHonorsIntangibleMember2020-12-310001585689us-gaap:ContractBasedIntangibleAssetsMember2021-01-012021-12-310001585689us-gaap:LeaseAgreementsMember2020-01-012020-12-310001585689hlt:DepreciationandamortizationMember2021-01-012021-12-310001585689hlt:DepreciationandamortizationMember2020-01-012020-12-310001585689hlt:DepreciationandamortizationMember2019-01-012019-12-310001585689hlt:IntangibleassetsrecordedatfairvalueatthetimeoftheMergerMemberhlt:DepreciationandamortizationMember2021-01-012021-12-310001585689hlt:IntangibleassetsrecordedatfairvalueatthetimeoftheMergerMemberhlt:DepreciationandamortizationMember2020-01-012020-12-310001585689hlt:IntangibleassetsrecordedatfairvalueatthetimeoftheMergerMemberhlt:DepreciationandamortizationMember2019-01-012019-12-310001585689hlt:DepreciationandamortizationMember2021-12-310001585689us-gaap:PropertyPlantAndEquipmentMember2021-01-012021-12-310001585689us-gaap:PropertyPlantAndEquipmentMember2020-01-012020-12-310001585689us-gaap:PropertyPlantAndEquipmentMember2019-01-012019-12-310001585689us-gaap:PropertyPlantAndEquipmentMember2020-01-012020-12-310001585689hlt:PropertySubjectToAFinanceLeaseMember2020-01-012020-12-310001585689hlt:SeniorsecuredrevolvingcreditfacilityMember2021-12-310001585689hlt:SeniorsecuredrevolvingcreditfacilityMember2020-12-310001585689hlt:Seniorsecuredtermloanfacilitydue2026Member2021-12-310001585689hlt:Seniorsecuredtermloanfacilitydue2026Member2020-12-310001585689hlt:A5375SeniorNotesDue2025Member2021-12-310001585689hlt:A5375SeniorNotesDue2025Member2020-12-310001585689hlt:Seniornotesdue2026Member2021-12-310001585689hlt:Seniornotesdue2026Member2020-12-310001585689hlt:Seniornotesdue2027Member2021-12-310001585689hlt:Seniornotesdue2027Member2020-12-310001585689hlt:SeniorNotesDue2028Member2021-12-310001585689hlt:SeniorNotesDue2028Member2020-12-310001585689hlt:SeniorNotesDue2029Member2021-12-310001585689hlt:SeniorNotesDue2029Member2020-12-310001585689hlt:SeniorNotesdue2030Member2021-12-310001585689hlt:SeniorNotesdue2030Member2020-12-310001585689hlt:SeniorNotesDue2031Member2021-12-310001585689hlt:SeniorNotesDue2031Member2020-12-310001585689hlt:SeniorNotesDue2032Member2021-12-310001585689hlt:SeniorNotesDue2032Member2020-12-310001585689hlt:FinanceLeaseObligationMember2021-12-310001585689us-gaap:CapitalLeaseObligationsMember2020-12-310001585689us-gaap:OtherDebtSecuritiesMember2021-12-310001585689us-gaap:OtherDebtSecuritiesMember2020-12-310001585689hlt:SeniorNotesDue2032Member2021-02-280001585689hlt:Seniornotesdue2026Member2021-02-280001585689hlt:Seniornotesdue2026Member2021-01-012021-12-310001585689hlt:SeniorNotesIssuedInDecember2020Member2020-12-310001585689hlt:Seniornotesdue2024Member2020-12-310001585689hlt:Seniornotesdue2025Member2020-12-310001585689hlt:SeniorNotesRedeemedInDecember2020Member2020-01-012020-12-310001585689hlt:A5375SeniorNotesDue2025Member2020-04-300001585689hlt:SeniorNotesDue2028Member2020-04-300001585689hlt:SeniorNotesIssuedInApril2020Member2020-04-300001585689hlt:SeniorNotesdue2030Member2019-06-300001585689hlt:Seniorsecuredtermloanfacilitydue2026Member2019-01-012019-12-310001585689hlt:SeniorsecuredrevolvingcreditfacilityMember2019-01-012019-12-310001585689hlt:SeniorsecuredrevolvingcreditfacilityMemberus-gaap:LetterOfCreditMember2021-12-310001585689hlt:SeniorsecuredrevolvingcreditfacilityMember2021-01-012021-12-310001585689hlt:VIELoanMember2021-12-310001585689us-gaap:CarryingReportedAmountFairValueDisclosureMember2021-12-310001585689us-gaap:FairValueInputsLevel2Member2021-12-310001585689hlt:LongTermDebtExcludingFinanceLeaseLiabilitiesAndOtherDebtMemberus-gaap:CarryingReportedAmountFairValueDisclosureMember2021-12-310001585689hlt:LongTermDebtExcludingFinanceLeaseLiabilitiesAndOtherDebtMemberus-gaap:FairValueInputsLevel1Member2021-12-310001585689hlt:LongTermDebtExcludingFinanceLeaseLiabilitiesAndOtherDebtMemberus-gaap:FairValueInputsLevel3Member2021-12-310001585689us-gaap:CarryingReportedAmountFairValueDisclosureMember2020-12-310001585689us-gaap:FairValueInputsLevel2Member2020-12-310001585689hlt:LongTermDebtExcludingFinanceLeaseLiabilitiesAndOtherDebtMemberus-gaap:CarryingReportedAmountFairValueDisclosureMember2020-12-310001585689hlt:LongTermDebtExcludingFinanceLeaseLiabilitiesAndOtherDebtMemberus-gaap:FairValueInputsLevel1Member2020-12-310001585689hlt:LongTermDebtExcludingFinanceLeaseLiabilitiesAndOtherDebtMemberus-gaap:FairValueInputsLevel3Member2020-12-310001585689hlt:OtherIntangibleAssetsLeaseRightOfUseAssetsAndPropertyAndEquipmentMember2020-01-012020-12-310001585689us-gaap:PropertySubjectToOperatingLeaseMember2020-01-012020-12-310001585689us-gaap:StateAndLocalJurisdictionMember2021-12-310001585689us-gaap:DomesticCountryMember2021-12-310001585689us-gaap:ForeignCountryMember2021-12-310001585689us-gaap:ForeignCountryMember2021-01-012021-12-310001585689country:US2020-12-310001585689country:US2019-12-310001585689hlt:U.K.PlanMember2020-12-310001585689hlt:U.K.PlanMember2019-12-310001585689us-gaap:ForeignPlanMember2020-12-310001585689us-gaap:ForeignPlanMember2019-12-310001585689country:US2021-01-012021-12-310001585689country:US2020-01-012020-12-310001585689hlt:U.K.PlanMember2021-01-012021-12-310001585689hlt:U.K.PlanMember2020-01-012020-12-310001585689us-gaap:ForeignPlanMember2021-01-012021-12-310001585689us-gaap:ForeignPlanMember2020-01-012020-12-310001585689country:US2021-12-310001585689hlt:U.K.PlanMember2021-12-310001585689us-gaap:ForeignPlanMember2021-12-310001585689country:USus-gaap:OtherNoncurrentAssetsMember2021-12-310001585689country:USus-gaap:OtherNoncurrentAssetsMember2020-12-310001585689hlt:U.K.PlanMemberus-gaap:OtherNoncurrentAssetsMember2021-12-310001585689hlt:U.K.PlanMemberus-gaap:OtherNoncurrentAssetsMember2020-12-310001585689us-gaap:ForeignPlanMemberus-gaap:OtherNoncurrentAssetsMember2021-12-310001585689us-gaap:ForeignPlanMemberus-gaap:OtherNoncurrentAssetsMember2020-12-310001585689country:USus-gaap:OtherLiabilitiesMember2021-12-310001585689country:USus-gaap:OtherLiabilitiesMember2020-12-310001585689hlt:U.K.PlanMemberus-gaap:OtherLiabilitiesMember2021-12-310001585689hlt:U.K.PlanMemberus-gaap:OtherLiabilitiesMember2020-12-310001585689us-gaap:ForeignPlanMemberus-gaap:OtherLiabilitiesMember2021-12-310001585689us-gaap:ForeignPlanMemberus-gaap:OtherLiabilitiesMember2020-12-310001585689country:US2019-01-012019-12-310001585689hlt:U.K.PlanMember2019-01-012019-12-310001585689us-gaap:ForeignPlanMember2019-01-012019-12-31xbrli:pure0001585689us-gaap:EquitySecuritiesMembercountry:US2021-12-310001585689us-gaap:EquitySecuritiesMembercountry:US2020-12-310001585689us-gaap:DebtSecuritiesMembercountry:US2021-12-310001585689us-gaap:DebtSecuritiesMembercountry:US2020-12-310001585689hlt:DebtandequitysecuritiesMemberhlt:UKandforeignplanMember2020-12-310001585689hlt:DebtandequitysecuritiesMemberhlt:UKandforeignplanMember2021-12-310001585689us-gaap:BondsMemberhlt:UKandforeignplanMember2021-12-310001585689us-gaap:BondsMemberhlt:UKandforeignplanMember2020-12-310001585689us-gaap:CashMemberhlt:U.K.PlanMemberus-gaap:FairValueInputsLevel1Member2021-12-310001585689us-gaap:CashMemberus-gaap:ForeignPlanMemberus-gaap:FairValueInputsLevel1Member2021-12-310001585689us-gaap:ForeignPlanMemberus-gaap:EquityFundsMemberus-gaap:FairValueInputsLevel1Member2021-12-310001585689us-gaap:BondsMemberus-gaap:FairValueInputsLevel1Membercountry:US2021-12-310001585689us-gaap:BondsMemberhlt:U.K.PlanMemberus-gaap:FairValueInputsLevel1Member2021-12-310001585689us-gaap:ForeignPlanMemberus-gaap:EquityFundsMemberus-gaap:FairValueInputsLevel2Member2021-12-310001585689us-gaap:BondsMemberhlt:U.K.PlanMemberus-gaap:FairValueInputsLevel2Member2021-12-310001585689us-gaap:BondsMemberus-gaap:ForeignPlanMemberus-gaap:FairValueInputsLevel2Member2021-12-310001585689us-gaap:FairValueMeasuredAtNetAssetValuePerShareMemberus-gaap:CashEquivalentsMemberhlt:U.K.PlanMember2021-12-310001585689us-gaap:FairValueMeasuredAtNetAssetValuePerShareMemberhlt:U.K.PlanMemberus-gaap:EquityFundsMember2021-12-310001585689us-gaap:BondsMemberus-gaap:FairValueMeasuredAtNetAssetValuePerShareMemberhlt:U.K.PlanMember2021-12-310001585689us-gaap:FairValueMeasuredAtNetAssetValuePerShareMembercountry:UShlt:CommonCollectiveTrustMember2021-12-310001585689us-gaap:ForeignPlanMemberus-gaap:FairValueMeasuredAtNetAssetValuePerShareMemberhlt:CommonCollectiveTrustMember2021-12-310001585689us-gaap:FairValueMeasuredAtNetAssetValuePerShareMemberhlt:U.K.PlanMemberhlt:AlternativeinvestmentsMember2021-12-310001585689us-gaap:OtherInvestmentsMemberus-gaap:FairValueMeasuredAtNetAssetValuePerShareMemberhlt:U.K.PlanMember2021-12-310001585689hlt:U.K.PlanMemberus-gaap:FairValueInputsLevel1Memberus-gaap:CashAndCashEquivalentsMember2020-12-310001585689us-gaap:ForeignPlanMemberus-gaap:FairValueInputsLevel1Memberus-gaap:CashAndCashEquivalentsMember2020-12-310001585689hlt:U.K.PlanMemberus-gaap:EquityFundsMemberus-gaap:FairValueInputsLevel1Member2020-12-310001585689us-gaap:ForeignPlanMemberus-gaap:EquityFundsMemberus-gaap:FairValueInputsLevel1Member2020-12-310001585689us-gaap:BondsMemberus-gaap:FairValueInputsLevel1Membercountry:US2020-12-310001585689us-gaap:BondsMemberhlt:U.K.PlanMemberus-gaap:FairValueInputsLevel1Member2020-12-310001585689hlt:U.K.PlanMemberus-gaap:FairValueInputsLevel1Memberhlt:AlternativeinvestmentsMember2020-12-310001585689us-gaap:ForeignPlanMemberus-gaap:EquityFundsMemberus-gaap:FairValueInputsLevel2Member2020-12-310001585689us-gaap:BondsMemberus-gaap:ForeignPlanMemberus-gaap:FairValueInputsLevel2Member2020-12-310001585689us-gaap:BondsMemberus-gaap:FairValueMeasuredAtNetAssetValuePerShareMemberhlt:U.K.PlanMember2020-12-310001585689us-gaap:FairValueMeasuredAtNetAssetValuePerShareMembercountry:UShlt:CommonCollectiveTrustMember2020-12-310001585689us-gaap:ForeignPlanMemberus-gaap:FairValueMeasuredAtNetAssetValuePerShareMemberhlt:CommonCollectiveTrustMember2020-12-310001585689us-gaap:FairValueMeasuredAtNetAssetValuePerShareMemberhlt:U.K.PlanMemberhlt:AlternativeinvestmentsMember2020-12-310001585689us-gaap:OtherInvestmentsMemberus-gaap:FairValueMeasuredAtNetAssetValuePerShareMemberhlt:U.K.PlanMember2020-12-310001585689us-gaap:RestrictedStockUnitsRSUMember2021-01-012021-12-310001585689us-gaap:RestrictedStockUnitsRSUMember2020-01-012020-12-310001585689us-gaap:RestrictedStockUnitsRSUMember2019-01-012019-12-310001585689us-gaap:RestrictedStockUnitsRSUMember2020-12-310001585689us-gaap:RestrictedStockUnitsRSUMember2021-12-310001585689us-gaap:EmployeeStockOptionMember2020-01-012020-12-310001585689us-gaap:EmployeeStockOptionMember2019-01-012019-12-310001585689us-gaap:EmployeeStockOptionMember2020-12-310001585689us-gaap:EmployeeStockOptionMember2021-12-310001585689us-gaap:PerformanceSharesMember2020-01-012020-12-310001585689us-gaap:PerformanceSharesMember2022-01-012022-12-310001585689us-gaap:PerformanceSharesMember2019-01-012019-12-310001585689hlt:A2020AwardsMemberus-gaap:PerformanceSharesMember2020-01-012020-12-310001585689us-gaap:PerformanceSharesMemberhlt:A2019AwardsMember2019-01-012019-12-310001585689us-gaap:PerformanceSharesMember2020-12-310001585689us-gaap:PerformanceSharesMember2021-12-310001585689srt:ScenarioPreviouslyReportedMember2020-01-012020-12-310001585689srt:RestatementAdjustmentMember2020-01-012020-12-310001585689us-gaap:AccumulatedTranslationAdjustmentMember2018-12-310001585689us-gaap:AccumulatedDefinedBenefitPlansAdjustmentMember2018-12-310001585689us-gaap:AccumulatedNetGainLossFromDesignatedOrQualifyingCashFlowHedgesMember2018-12-310001585689us-gaap:AccumulatedTranslationAdjustmentMember2019-01-012019-12-310001585689us-gaap:AccumulatedDefinedBenefitPlansAdjustmentMember2019-01-012019-12-310001585689us-gaap:AccumulatedNetGainLossFromDesignatedOrQualifyingCashFlowHedgesMember2019-01-012019-12-310001585689us-gaap:AccumulatedTranslationAdjustmentMember2019-12-310001585689us-gaap:AccumulatedDefinedBenefitPlansAdjustmentMember2019-12-310001585689us-gaap:AccumulatedNetGainLossFromDesignatedOrQualifyingCashFlowHedgesMember2019-12-310001585689us-gaap:AccumulatedTranslationAdjustmentMember2020-01-012020-12-310001585689us-gaap:AccumulatedDefinedBenefitPlansAdjustmentMember2020-01-012020-12-310001585689us-gaap:AccumulatedNetGainLossFromDesignatedOrQualifyingCashFlowHedgesMember2020-01-012020-12-310001585689us-gaap:AccumulatedTranslationAdjustmentMember2020-12-310001585689us-gaap:AccumulatedDefinedBenefitPlansAdjustmentMember2020-12-310001585689us-gaap:AccumulatedNetGainLossFromDesignatedOrQualifyingCashFlowHedgesMember2020-12-310001585689us-gaap:AccumulatedTranslationAdjustmentMember2021-01-012021-12-310001585689us-gaap:AccumulatedDefinedBenefitPlansAdjustmentMember2021-01-012021-12-310001585689us-gaap:AccumulatedNetGainLossFromDesignatedOrQualifyingCashFlowHedgesMember2021-01-012021-12-310001585689us-gaap:AccumulatedTranslationAdjustmentMember2021-12-310001585689us-gaap:AccumulatedDefinedBenefitPlansAdjustmentMember2021-12-310001585689us-gaap:AccumulatedNetGainLossFromDesignatedOrQualifyingCashFlowHedgesMember2021-12-31hlt:Segment0001585689hlt:OwnershipMember2021-12-310001585689hlt:ManagementandFranchiseMemberhlt:FranchiseandlicensingfeesMember2021-01-012021-12-310001585689hlt:ManagementandFranchiseMemberhlt:FranchiseandlicensingfeesMember2020-01-012020-12-310001585689hlt:ManagementandFranchiseMemberhlt:FranchiseandlicensingfeesMember2019-01-012019-12-310001585689hlt:ManagementandFranchiseMemberhlt:BaseandothermanagementfeesinsegmentrevenuesMember2021-01-012021-12-310001585689hlt:ManagementandFranchiseMemberhlt:BaseandothermanagementfeesinsegmentrevenuesMember2020-01-012020-12-310001585689hlt:ManagementandFranchiseMemberhlt:BaseandothermanagementfeesinsegmentrevenuesMember2019-01-012019-12-310001585689hlt:ManagementandFranchiseMemberhlt:IncentivemanagementfeesinsegmentrevenuesMember2021-01-012021-12-310001585689hlt:ManagementandFranchiseMemberhlt:IncentivemanagementfeesinsegmentrevenuesMember2020-01-012020-12-310001585689hlt:ManagementandFranchiseMemberhlt:IncentivemanagementfeesinsegmentrevenuesMember2019-01-012019-12-310001585689hlt:ManagementandFranchiseMember2021-01-012021-12-310001585689hlt:ManagementandFranchiseMember2020-01-012020-12-310001585689hlt:ManagementandFranchiseMember2019-01-012019-12-310001585689hlt:OwnershipMember2021-01-012021-12-310001585689hlt:OwnershipMember2020-01-012020-12-310001585689hlt:OwnershipMember2019-01-012019-12-310001585689us-gaap:OperatingSegmentsMember2021-01-012021-12-310001585689us-gaap:OperatingSegmentsMember2020-01-012020-12-310001585689us-gaap:OperatingSegmentsMember2019-01-012019-12-310001585689hlt:ReimbursementrevenuedirectMember2021-01-012021-12-310001585689hlt:ReimbursementrevenuedirectMember2020-01-012020-12-310001585689hlt:ReimbursementrevenuedirectMember2019-01-012019-12-310001585689hlt:ReimbursementrevenueindirectMember2021-01-012021-12-310001585689hlt:ReimbursementrevenueindirectMember2020-01-012020-12-310001585689hlt:ReimbursementrevenueindirectMember2019-01-012019-12-310001585689us-gaap:IntersegmentEliminationMember2021-01-012021-12-310001585689us-gaap:IntersegmentEliminationMember2020-01-012020-12-310001585689us-gaap:IntersegmentEliminationMember2019-01-012019-12-310001585689hlt:OwnershipMember2020-12-310001585689us-gaap:CorporateNonSegmentMember2021-12-310001585689us-gaap:CorporateNonSegmentMember2020-12-310001585689country:US2021-01-012021-12-310001585689country:US2020-01-012020-12-310001585689country:US2019-01-012019-12-310001585689hlt:TotalofAllOtherCountriesMember2021-01-012021-12-310001585689hlt:TotalofAllOtherCountriesMember2020-01-012020-12-310001585689hlt:TotalofAllOtherCountriesMember2019-01-012019-12-310001585689country:US2021-12-310001585689country:US2020-12-310001585689country:GB2021-12-310001585689country:GB2020-12-310001585689country:JP2021-12-310001585689country:JP2020-12-310001585689hlt:TotalofAllOtherCountriesMember2021-12-310001585689hlt:TotalofAllOtherCountriesMember2020-12-310001585689us-gaap:PerformanceGuaranteeMember2021-01-012021-12-310001585689us-gaap:PerformanceGuaranteeMember2021-12-310001585689us-gaap:PerformanceGuaranteeMember2020-12-310001585689us-gaap:GuaranteeOfIndebtednessOfOthersMember2021-12-310001585689us-gaap:GuaranteeOfIndebtednessOfOthersMember2021-01-012021-12-310001585689us-gaap:LetterOfCreditMember2021-12-31
UNITED STATES
SECURITIES AND EXCHANGE COMMISSION
Washington, D.C. 20549
Form 10-K
(Mark One) | | | | | |
| ☒ | ANNUAL REPORT PURSUANT TO SECTION 13 OR 15(d) OF THE SECURITIES EXCHANGE ACT OF 1934 |
For the fiscal year ended December 31, 2021
or | | | | | |
| ☐ | TRANSITION REPORT PURSUANT TO SECTION 13 OR 15(d) OF THE SECURITIES EXCHANGE ACT OF 1934 |
For the transition period from to
Commission File Number 001-36243
Hilton Worldwide Holdings Inc.
(Exact name of registrant as specified in its charter) | | | | | | | | |
| Delaware | | 27-4384691 |
| (State or other jurisdiction of incorporation or organization) | | (I.R.S. Employer Identification No.) |
| | |
7930 Jones Branch Drive, Suite 1100, McLean, VA | | 22102 |
| (Address of Principal Executive Offices) | | (Zip Code) |
Registrant’s telephone number, including area code: (703) 883-1000
Securities registered pursuant to Section 12(b) of the Act: | | | | | | | | | | | | | | |
| Title of each class | | Trading symbol(s) | | Name of each exchange on which registered |
| Common Stock, $0.01 par value per share | | HLT | | New York Stock Exchange |
Securities registered pursuant to Section 12(g) of the Act: None
Indicate by check mark if the registrant is a well-known seasoned issuer, as defined in Rule 405 of the Securities Act. Yes ☒ No ☐
Indicate by check mark if the registrant is not required to file reports pursuant to Section 13 or Section 15(d) of the Act. Yes ☐ No ☒
Indicate by check mark whether the registrant (1) has filed all reports required to be filed by Section 13 or 15(d) of the Securities Exchange Act of 1934 during the preceding 12 months (or for such shorter period that the registrant was required to file such reports), and (2) has been subject to such filing requirements for the past 90 days. Yes ☒ No ☐
Indicate by check mark whether the registrant has submitted electronically every Interactive Data File required to be submitted pursuant to Rule 405 of Regulation S-T during the preceding 12 months (or for such shorter period that the registrant was required to submit such files). Yes ☒ No ☐
Indicate by check mark whether the registrant is a large accelerated filer, an accelerated filer, a non-accelerated filer, a smaller reporting company or emerging growth company. See the definitions of "large accelerated filer," "accelerated filer," "smaller reporting company" and "emerging growth company" in Rule 12b-2 of the Exchange Act.
Large accelerated filer ☒ Accelerated filer ☐
Non-accelerated filer ☐ Smaller reporting company ☐
Emerging growth company ☐
If an emerging growth company, indicate by check mark if the registrant has elected not to use the extended transition period for complying with any new or revised financial accounting standards provided pursuant to Section 13(a) of the Exchange Act. ☐
Indicate by check mark whether the registrant has filed a report on and attestation to its management's assessment of the effectiveness of its internal control over financial reporting under Section 404(b) of the Sarbanes-Oxley Act (15 U.S.C. 7262(b)) by the registered public accounting firm that prepared or issued its audit report. ☒
Indicate by check mark whether the registrant is a shell company (as defined in Rule 12b-2 of the Exchange Act). Yes ☐ No ☒
As of June 30, 2021, the last business day of the registrant's most recently completed second fiscal quarter, the aggregate market value of the registrant’s common stock held by non-affiliates of the registrant was approximately $32,816 million (based upon the closing sale price of the common stock on that date on the New York Stock Exchange). The number of shares of common stock outstanding on February 9, 2022 was 279,139,082.
DOCUMENTS INCORPORATED BY REFERENCE
Items 10, 11, 12, 13 and 14 of Part III incorporate information by reference from the registrant's definitive proxy statement relating to its 2022 annual meeting of stockholders to be filed with the Securities and Exchange Commission within 120 days after the close of the registrant's fiscal year.
HILTON WORLDWIDE HOLDINGS INC.
FORM 10-K TABLE OF CONTENTS
YEAR ENDED DECEMBER 31, 2021
| | | | | | | | |
| | Page No. |
| PART I | | |
| | |
| | |
| | |
| Item 1. | | |
| Item 1A. | | |
| Item 1B. | | |
| Item 2. | | |
| Item 3. | | |
| Item 4. | | |
| | |
| PART II | | |
| Item 5. | | |
| | |
| Item 6. | | |
| Item 7. | | |
| Item 7A. | | |
| Item 8. | | |
| Item 9. | | |
| Item 9A. | | |
| Item 9B. | | |
| Item 9C. | | |
| | |
| PART III | | |
| Item 10. | | |
| Item 11. | | |
| Item 12. | | |
| | |
| Item 13. | | |
| Item 14. | | |
| | |
| PART IV | | |
| Item 15. | | |
| Item 16. | | |
| | |
PART I
Forward-Looking Statements
This Annual Report on Form 10-K contains forward-looking statements within the meaning of Section 27A of the Securities Act of 1933, as amended (the "Securities Act") and Section 21E of the Securities Exchange Act of 1934, as amended (the "Exchange Act"). These statements include, but are not limited to, statements related to our expectations regarding the impact of the coronavirus ("COVID-19") pandemic, the performance of our business, our financial results, our liquidity and capital resources and other non-historical statements. In some cases, you can identify these forward-looking statements by the use of words such as "outlook," "believes," "expects," "potential," "continues," "may," "will," "should," "could," "seeks," "projects," "predicts," "intends," "plans," "estimates," "anticipates" or the negative version of these words or other comparable words. Such forward-looking statements are subject to various risks and uncertainties that could cause actual outcomes or results to differ materially from those indicated in these statements, including, among others, those described under "Part I—Item 1A. Risk Factors" and under "Summary of Risk Factors" below. These factors should not be construed as exhaustive and should be read in conjunction with the other cautionary statements that are included in this Annual Report on Form 10-K. We undertake no obligation to publicly update or review any forward-looking statement, whether as a result of new information, future developments or otherwise, except as required by law.
Summary of Risk Factors
In addition to the other information in this Annual Report on Form 10-K, the following risk factors should be considered carefully in evaluating our company and our business. A summary of the principal factors that create risk in investing in our securities and might cause actual results to differ is set forth below:
•The ongoing global COVID-19 pandemic has negatively affected and will continue to negatively affect our business, financial condition and results of operations;
•We are subject to the business, financial and operating risks inherent to the hospitality industry, any of which could reduce our revenues and limit opportunities for growth;
•Macroeconomic and other factors beyond our control can adversely affect and reduce demand for our products and services;
•Because we operate in a highly competitive industry, our revenues or profits could be harmed if we are unable to compete effectively;
•Our business is subject to risks related to doing business with third-party property owners that could adversely affect our reputation, operational results or prospects for growth;
•Failures in, material damage to or interruptions in our information technology systems, software or websites, including as a result of cyber-attacks on our systems or systems operated by third parties that provide operational and technical services to us, costs associated with protecting the integrity and security of personal data and other sensitive information and difficulties in updating our existing software or developing or implementing new software could have a material adverse effect on our business or results of operations;
•The growth of internet reservation channels could adversely affect our business and profitability;
•Because we derive a portion of our revenues from operations outside the United States ("U.S."), the risks of doing business internationally could lower our revenues, increase our costs, reduce our profits or disrupt our business;
•Labor shortages could restrict our ability to operate our properties or grow our business or result in increased labor costs that could adversely affect our results of operations; and
•Our substantial indebtedness and other contractual obligations could adversely affect our financial condition, our ability to raise additional capital to fund our operations, our ability to operate our business, our ability to react to changes in the economy or our industry and our ability to pay our debts, and could divert our cash flow from operations for debt payments.
These risk factors do not identify all risks that we face, and our business, financial condition and results of operations could also be affected by factors, events or uncertainties that are not presently known to us or that we currently do not consider to present material risks.
Terms Used and Basis of Presentation in this Annual Report on Form 10-K
Except where the context requires otherwise, references in this Annual Report on Form 10-K to "Hilton," "the Company," "we," "us" and "our" refer to Hilton Worldwide Holdings Inc., together with all of its consolidated subsidiaries. Except where the context requires otherwise, references to our "properties" refer to the hotels, resorts and timeshare properties that are managed, franchised, owned or leased by us, while references to "hotels" exclude timeshare properties.
On January 3, 2017, we completed the spin-offs of a portfolio of hotels and resorts, as well as our timeshare business, into two independent, publicly traded companies: Park Hotels & Resorts Inc. ("Park") and Hilton Grand Vacations Inc. ("HGV"), respectively, (the "spin-offs"). Hilton did not retain any interest in Park or HGV, but did enter into long-term management and franchise contracts with Park for the portfolio of hotels and resorts that it held at the time of the spin-offs and a 100-year license agreement with HGV for the timeshare business.
Refer to "Part II—Item 7. Management's Discussion and Analysis of Financial Condition and Results of Operations—Key Business and Financial Metrics Used by Management" for additional information on our financial and performance metrics.
Social Media
We use our website at newsroom.hilton.com, our Facebook page at facebook.com/hiltonnewsroom and our corporate Twitter account at twitter.com/hiltonnewsroom as channels of distribution of company information. The information we post through these channels may be deemed material. Accordingly, investors should monitor these channels, in addition to following our press releases, our filings with the U.S. Securities and Exchange Commission (the "SEC") and our webcasts. The contents of our website and social media channels are not, however, part of this report.
Item 1. Business
Overview
Hilton is one of the largest hospitality companies in the world, with 6,837 properties comprising 1,074,791 rooms in 122 countries and territories as of December 31, 2021. Founded in 1919, Hilton has been an innovator in the industry for more than 100 years, driven by the vision of founder Conrad Hilton, "to fill the earth with the light and warmth of hospitality." Our premier brand portfolio includes: our luxury hotel brands, Waldorf Astoria Hotels & Resorts, LXR Hotels & Resorts and Conrad Hotels & Resorts; our emerging lifestyle hotel brands, Canopy by Hilton, Tempo by Hilton and Motto by Hilton; our full service hotel brands, Signia by Hilton, Hilton Hotels & Resorts, Curio Collection by Hilton, DoubleTree by Hilton and Tapestry Collection by Hilton; our focused service hotel brands, Hilton Garden Inn, Hampton by Hilton and Tru by Hilton; our all-suites hotel brands, Embassy Suites by Hilton, Homewood Suites by Hilton and Home2 Suites by Hilton; and our timeshare brand, Hilton Grand Vacations. As of December 31, 2021, we had 128 million members in our award-winning guest loyalty program, Hilton Honors, a 13 percent increase from December 31, 2020; refer to "—Our Brand Portfolio" and "—Our Guest Loyalty Program" below for additional information on our brands, including Hilton Honors.
The COVID-19 pandemic has significantly impacted the global economy and strained the hospitality industry since the beginning of 2020. The pervasiveness and severity of resulting travel restrictions and stay-at-home directives, which have varied by country and state and fluctuated based on a number of factors, resulted in cancellations and significantly reduced travel around the world, particularly during 2020. This resulted in the complete and partial suspensions of hotel operations in many areas where our hotels are located throughout 2020 and during parts of 2021. As of December 31, 2021, however, nearly all of our hotels that had suspended operations for some period of time as a result of the pandemic were open. Further, during 2021, the distribution of COVID-19 vaccinations and overall easing of travel and other restrictions generated a renewed interest in travel and tourism activities around the globe. Although the economic recovery from 2020 began in 2021, the COVID-19 pandemic had a material adverse effect on our results for both the years ended December 31, 2021 and 2020, and we cannot predict when our performance and results of operations will return to the levels that we experienced prior to the onset of the pandemic.
We operate our business through: (i) a management and franchise segment and (ii) an ownership segment, each of which is reported as a segment based on (i) delivering a similar set of products and services and (ii) being managed separately given its
distinct economic characteristics. The management and franchise segment includes all of the hotels we manage for third-party owners, as well as all franchised hotels that license our intellectual property ("IP"), including our brand names, trademarks and service marks, and where we provide other contracted services to third-party owners, but the day-to-day services of the hotels are operated or managed by someone other than us. The management and franchise segment generates its revenue from: (i) management and franchise fees charged to third-party hotel owners; (ii) licensing fees from HGV's 60 resorts, consisting of 9,378 rooms, as well as strategic partnerships, including co-branded credit card arrangements, for the right to use our IP; and (iii) fees for managing hotels in our ownership segment. The ownership segment primarily derives earnings from nightly hotel room sales, food and beverage sales and sales of other services at our consolidated owned and leased hotels. For more information regarding our segments, refer to "—Our Business—Management and Franchise" and "—Our Business—Ownership" below.
In addition to our current hotel portfolio, we are focused on the growth of our business by expanding our share of the global hospitality industry through our development pipeline. Despite the adverse effects of the COVID-19 pandemic, we continued to open new hotels and expand our development pipeline in 2020 and continuing throughout 2021, including:
| | | | | | | | | | | |
| As of or for the Year Ended December 31, 2021 |
| Hotels | | Rooms(1) |
| Hotel system | | | |
Additions | 414 | | | 67,100 | |
Net additions(2) | 355 | | | 55,100 | |
| | | |
Development pipeline(3) | | | |
Additions | 645 | | | 96,200 | |
Count as of period end(4) | 2,668 | | | 407,900 | |
____________
(1)Rounded to the nearest hundred.
(2)Represents net unit growth for the year ended December 31, 2021 of 5.6 percent.
(3)Hotels in our system are under development throughout 115 countries and territories, including 28 countries and territories where we do not currently have any existing hotels.
(4)In our development pipeline, as of December 31, 2021, 198,000 of the rooms were under construction and 249,600 of the rooms were located outside of the U.S. Nearly all of the rooms in our development pipeline are within our management and franchise segment. We do not consider any individual development project to be material to us.
Despite the challenges associated with the COVID-19 pandemic, we maintain the belief that our experience in the hospitality industry, which spans more than a century of customer service and entrepreneurship, and continues to evolve for the tastes, preferences and demands of our hotel guests; our strong, well-defined brands that operate throughout the hospitality industry chain scales; our diverse, inclusive workforce, built to focus on providing exceptional customer experiences; and our commercial service offerings will continue to drive customer loyalty, including participation in our Hilton Honors guest loyalty program. We believe that satisfied customers will generate additional business at our properties, yielding strong overall hotel performance for us and our hotel owners. Strong results at our existing properties will encourage further development of additional hotels under our brands and conversions of existing hotels to our brands with both existing and new hotel owners, which further supports our growth and future financial performance. We believe that our existing hotel system and development pipeline, which will require minimal capital investment from us, positions us to further improve our business, allocate capital effectively and meet our customers' demands and preferences in the future.
Our Brand Portfolio
The goal of each of our brands is to deliver exceptional customer experiences and superior operating performance. | | | | | | | | | | | | | | | | | | | | | | | | | | | | | | | | | | | | | | |
| | | | December 31, 2021 | | |
Brand(1) | | Chain Scale | | Countries/ Territories | | Properties | | Rooms | | Percentage of Total Rooms | | Selected Competitors(1) |
| | Luxury | | 15 | | 31 | | 8,640 | | 0.8% | | Four Seasons, Mandarin Oriental, Peninsula, Ritz Carlton,
Rosewood Hotels & Resorts, St. Regis |
| | Luxury | | 7 | | 9 | | 1,274 | | 0.1% | | Leading Hotels of the World,
Legend Preferred Hotels & Resorts,
Small Luxury Hotels of The World,
The Luxury Collection |
| | Luxury | | 21 | | 42 | | 15,085 | | 1.4% | | Fairmont, Intercontinental,
JW Marriott, Park Hyatt, Sofitel |
| | Upper Upscale | | 10 | | 35 | | 6,034 | | 0.6% | | 25hours Hotels, Hyatt Centric,
Joie de Vivre, Kimpton,
Le Meridien, Renaissance |
| | Upper Upscale | | 1 | | 1 | | 1,009 | | 0.1% | | Grand Hyatt, JW Marriott |
| | Upper Upscale | | 94 | | 598 | | 221,782 | | 20.6% | | Hyatt, Hyatt Regency, Marriott,
Omni, Sheraton |
| | Upper Upscale | | 28 | | 116 | | 23,205 | | 2.2% | | Autograph Collection, Design Hotels,
Destination Hotels,
The Unbound Collection |
| | Upscale | | 50 | | 635 | | 144,901 | | 13.5% | | Courtyard by Marriott, Crowne Plaza, Delta, Holiday Inn, Radisson, Sheraton, Wyndham |
| | Upscale | | 9 | | 73 | | 8,638 | | 0.8% | | Joie de Vivre, Tribute Portfolio |
| | Upper Upscale | | 5 | | 258 | | 59,651 | | 5.6% | | Hyatt Regency, Marriott, Sheraton, Westin |
| | Upscale | | — | | — | | — | | —% | | AC Hotels, Aloft, Cambria, Hotel Indigo |
| | Upper Midscale | | 1 | | 3 | | 871 | | 0.1% | | CitizenM, Freehand, Generator,
Hoxton, Moxy, tommie, Yotel |
| | Upscale | | 55 | | 940 | | 137,867 | | 12.8% | | Aloft, Courtyard by Marriott, Four Points,
Holiday Inn, Hyatt Place |
| | Upper Midscale | | 33 | | 2,765 | | 297,830 | | 27.7% | | Comfort Suites, Courtyard by Marriott,
Fairfield Inn, Holiday Inn Express, Springhill Suites |
| | Midscale | | 2 | | 214 | | 20,843 | | 1.9% | | Avid, Best Western, Comfort Inn & Suites,
La Quinta, Quality Inn, Sleep Inn, Wingate by Wyndham |
| | Upscale | | 4 | | 526 | | 60,085 | | 5.6% | | Element, Hyatt House, Residence Inn, Staybridge Suites |
| | Upper Midscale | | 3 | | 523 | | 54,834 | | 5.1% | | Candlewood Suites, Comfort Suites, TownePlace Suites |
| | Timeshare(2) | | 6 | | 60 | | 9,378 | | 0.9% | | Bluegreen Vacations, Disney Vacation Club, Holiday Inn Club Vacations,
Marriott Vacations Worldwide,
Travel & Leisure Co. |
___________
(1)The table above excludes 8 unbranded properties with 2,864 rooms, representing approximately 0.2 percent of total rooms, and the selected competitors exclude lesser-known regional competitors.
(2)HGV has the exclusive right to use our Hilton Grand Vacations brand, subject to the terms of a license agreement with us.
Waldorf Astoria Hotels & Resorts: What began as an iconic hotel in New York City is today an extensive portfolio of best-in-class hotels and resorts in landmark destinations around the world. Each Waldorf Astoria property provides a unique sense of place with a relentless commitment to personal service and culinary expertise, enabling guests to create truly unforgettable moments. Waldorf Astoria hotels deliver graceful service from the moment a guest books through checkout. In addition to the brand's renowned hotel offerings, Waldorf Astoria boasts a best-in-class residential portfolio that provides the comfort of a private home combined with the superior amenities and legendary service of Waldorf Astoria.
LXR Hotels & Resorts: Found in some of the world's most alluring destinations, LXR Hotels & Resorts is a collection of independent luxury properties that each represent their unique location and offer a singular travel experience native to its place, history and tradition. LXR connects legendary properties into an exclusive network of hotels that are set apart by an unrivaled commitment to personalized service and elegant, yet locally immersive experiences for their guests. Each of the hotels in the collection remains steadfastly true to its heritage and culture, providing a luxurious base of exploration for the passionate, yet discerning, adventurer.
Conrad Hotels & Resorts: Conrad is a global luxury brand offering guests service and style on their own terms—all while connecting with the local and global culture. Conrad has created a seamless connection between contemporary design, leading innovation and curated art to inspire the entrepreneurial spirit of the globally connected traveler. Properties feature convenient and relaxing wellness facilities; innovative bars and restaurants; intuitive room service; multi-purpose meeting and business facilities; and special event and concierge services. Conrad was named the World Travel Awards' "World's Leading Luxury Hotel Brand" for 2021.
Canopy by Hilton: Canopy by Hilton is an energizing lifestyle hotel in neighborhood settings. Our guests are explorers who seek uncomplicated comfort, thoughtful details, an energizing atmosphere and a uniquely local experience. Each property is designed as a natural extension of its neighborhood, with local design, food and drink and culture delivering an authentic neighborhood experience with a boutique hotel feel.
Signia by Hilton: Signia by Hilton is a new portfolio of premier hotels in highly sought-after urban and resort destinations, offering sophisticated business and leisure travelers an elevated hotel experience combined with exceptional full-service amenities and premium meetings and events spaces.
Hilton Hotels & Resorts: For more than 100 years, Hilton Hotels & Resorts, Hilton’s flagship brand and one of the most globally recognized hotel brands, has set the benchmark for hospitality around the world, providing new product innovations and services to meet guests' evolving needs. With hotels on six continents, Hilton Hotels & Resorts properties are located in the world’s most sought-after destinations and offer exceptional travel experiences to every guest. Hilton Hotels & Resorts are full service properties that offer advanced meeting and event spaces and services; trend-forward restaurants, lobby bars and grab-and-go options; mindful fitness/wellness facilities; and other services.
Curio Collection by Hilton: Curio Collection by Hilton is a global portfolio of handpicked, one-of-a-kind hotels in top urban markets and premier resort destinations. These properties offer travelers authentic, curated experiences through distinctly local offerings and elevated amenities, while providing the many benefits of Hilton and its award-winning guest loyalty program.
DoubleTree by Hilton: DoubleTree by Hilton is a fast-growing, global portfolio of upscale hotels. For more than 50 years, DoubleTree is the unpretentious brand that indulges you with a double dose of comfortable, including welcoming guests with its signature, warm DoubleTree cookie. DoubleTree by Hilton invites business and leisure travelers in key economic centers and tourist spots to experience the brand’s comfortable and contemporary accommodations and thoughtful amenities, including diverse food and beverage experiences, state-of-the-art fitness offerings and meetings and event spaces.
Tapestry Collection by Hilton: Tapestry Collection by Hilton is a global portfolio of original hotels that offers guests unique style and vibrant personality and encourages guests to explore the local destination. Every property is united by the trust and reliability that comes with the Hilton name.
Embassy Suites by Hilton: Embassy Suites by Hilton offers both leisure and business travelers an approachable, upscale experience with best-in-class customer service that anticipates travelers' needs and delivers what matters most to them. All guests are welcomed with a spacious two-room suite with separate areas to work and play, free made-to-order breakfast each morning and complimentary drinks and snacks every night.
Tempo by Hilton: Tempo by Hilton is a new, approachable lifestyle hotel brand dedicated to exceeding the expectations of an emerging, and discerning, class of traveler: the modern achiever. Pioneering a new hospitality category, Tempo by Hilton offers accommodations thoughtfully designed to help guests relax and recharge; inspiring public spaces, including an open lobby concept with dedicated spaces to relax, work and dine; and elevated, yet approachable, culinary options, including the brand’s signature coffee & tea fuel bar, a casual breakfast café and an inviting evening bar experience with small plates and cocktails. Additional amenities include state-of-the-art fitness facilities and programs and flexible meeting and working spaces. As of December 31, 2021, Tempo by Hilton had 12 hotels in the pipeline.
Motto by Hilton: Motto by Hilton is a micro-hotel with an urban vibe in prime global locations. Motto caters to travelers looking for value and one-of-a-kind experiences by bringing together the best elements of a lifestyle hotel—efficient guest rooms, activated social spaces, centrally located destinations and locally inspired design and food and beverage. At its core, Motto delivers a flexible and innovative hospitality experience through elements like first-of-its-kind linking rooms for group travel and vibrant communal spaces for work and social use by guests and locals alike. As of December 31, 2021, Motto by Hilton had 15 hotels in the pipeline.
Hilton Garden Inn: Hilton Garden Inn is an award-winning brand where guests find an open, inviting atmosphere with warm, glowing service and simple, thoughtful touches that allow them to relax and recharge. As a recognized leader in food and beverage offerings, Hilton Garden Inn caters to guests' dining needs by serving cooked-to-order breakfast and offering handcrafted cocktails, shareable small plates and full meals at its on-site restaurants and bars. Flexible meeting space, free Wi-Fi, wireless printing and fitness centers are offered to help guests stay productive.
Hampton by Hilton: Hampton by Hilton is our largest brand and includes both Hampton Inn and Hampton Inn & Suites hotels, with properties located on four continents. Recognized as a leading upper midscale brand in the lodging industry, Hampton has been ranked the #1 lodging brand to franchise by Entrepreneur for 13 consecutive years. Hampton by Hilton hotels around the world provide guests high-quality and thoughtfully designed accommodations, friendly and authentic service and value-added amenities—like complimentary hot breakfast and free Wi-Fi—all backed by the 100% Hampton Guarantee.
Tru by Hilton: Tru by Hilton is a game-changing hotel brand where guests don't have to compromise between a consistent, fun and affordable hotel stay. Spirited, simplified and grounded in value, Tru by Hilton is designed for cross-generational appeal, with a large, reimagined public space where guests can work, play, lounge and eat. Efficiently designed modern guest rooms feature a rolling desk, oversized windows for natural light and bright, spacious bathrooms. Guests can enjoy complimentary amenities, including a build-your-own "Top It" hot breakfast, a multifunctional fitness center and fast Wi-Fi. Premium snacks, light meal options and single-serve wine and beer are available for purchase at the 24/7 Eat. & Sip. market. Tru by Hilton, only launched in 2016, had 243 hotels in the pipeline as of December 31, 2021.
Homewood Suites by Hilton: Homewood Suites by Hilton is the upscale extended-stay hotel brand that delivers the comforts of home for guests and their pets. Homewood Suites by Hilton offers inviting, generous-sized suites featuring separate living and sleeping areas and fully equipped kitchens with full-size refrigerators for guests seeking home-like accommodations when traveling for extended or quick overnight stays. Additional value-driven amenities include complimentary Wi-Fi and free breakfast.
Home2 Suites by Hilton: Home2 Suites by Hilton is a dynamic and savvy brand designed to make guests and their pets feel at home regardless of their length of stay. Our forward-thinking design strikes the perfect balance of being modern and playful, while at the same time remaining functional and comfortable. Our flexible spaces empower guests to maintain their lifestyle with just the right benefits of home and stylish nods to their spirit of adventure. We are committed to empowering our guests by supporting sustainable communities. By packaging amenities and services that enable wellness and environmental health, we create value where it matters for our guests, our communities and our planet.
Hilton Grand Vacations: A premier vacation ownership brand, Hilton Grand Vacations is known for delivering a consistently exceptional standard of service, maximum flexibility for owners and guests and elegant, family-friendly resorts in desirable locations around the world. Signature elements include spacious, well-appointed accommodations and best-in-class resorts with extensive on-site amenities. A special points-based reservation system gives owners the flexibility to vacation when, where and how they prefer.
Our Guest Loyalty Program
Hilton Honors is our award-winning guest loyalty program that supports our portfolio of 18 brands at our managed, franchised, owned and leased hotel and resort properties. The program generates significant repeat business by rewarding guests
with points for each stay at our properties, which are then redeemable for free room nights at our properties and other goods and services. Members can also use points earned to transact with many strategic partners, including credit card providers, such as American Express, airlines, rail and car rental companies, Amazon, Lyft and others. Hilton Honors members who book through preferred Hilton channels also have access to instant benefits, including a flexible payment slider that allows members to choose nearly any combination of points and money to book a stay, an exclusive member discount and free standard Wi-Fi. Members also have access to contactless technology exclusively through the Hilton Honors app, where members can check in, choose their room and access their room using Digital Key. The program provides targeted marketing, promotions and customized guest experiences to 128 million members. Affiliation with our loyalty programs encourages members to allocate more of their travel spend to our hotels. The percentage of travel spend we capture from loyalty members increases as they move up the tiers of our program. The program is funded by contributions from eligible revenues generated by Hilton Honors members and collected from properties in our system, as well as our strategic partnerships. The funds collected by the Hilton Honors program are subsequently applied to reimburse hotels and strategic partners for Hilton Honors points redemptions by loyalty members and to pay for administrative expenses and marketing initiatives that support the program.
Our Business
As of December 31, 2021, our system included the following properties and rooms, by type, brand and region:
| | | | | | | | | | | | | | | | | | | | | | | | | | | | | | | | | | | | | | | | | | | | | | | |
| Owned / Leased(1) | | Managed | | Franchised | | Total |
| Properties | | Rooms | | Properties | | Rooms | | Properties | | Rooms | | Properties | | Rooms |
| Waldorf Astoria Hotels & Resorts | | | | | | | | | | | | | | | |
| U.S. | — | | | — | | | 12 | | | 4,535 | | | — | | | — | | | 12 | | | 4,535 | |
| Americas (excluding U.S.) | — | | | — | | | 2 | | | 261 | | | — | | | — | | | 2 | | | 261 | |
| Europe | 2 | | | 463 | | | 4 | | | 898 | | | — | | | — | | | 6 | | | 1,361 | |
| Middle East and Africa | — | | | — | | | 5 | | | 1,224 | | | — | | | — | | | 5 | | | 1,224 | |
| Asia Pacific | — | | | — | | | 6 | | | 1,259 | | | — | | | — | | | 6 | | | 1,259 | |
| LXR Hotels & Resorts | | | | | | | | | | | | | | | |
| U.S. | — | | | — | | | — | | | — | | | 3 | | | 426 | | | 3 | | | 426 | |
| Americas (excluding U.S.) | — | | | — | | | — | | | — | | | 1 | | | 76 | | | 1 | | | 76 | |
| Europe | — | | | — | | | 2 | | | 383 | | | — | | | — | | | 2 | | | 383 | |
| Middle East and Africa | — | | | — | | | 1 | | | 41 | | | 1 | | | 234 | | | 2 | | | 275 | |
| Asia Pacific | — | | | — | | | — | | | — | | | 1 | | | 114 | | | 1 | | | 114 | |
| Conrad Hotels & Resorts | | | | | | | | | | | | | | | |
| U.S. | — | | | — | | | 6 | | | 2,211 | | | 1 | | | 1,496 | | | 7 | | | 3,707 | |
| Americas (excluding U.S.) | — | | | — | | | 3 | | | 787 | | | — | | | — | | | 3 | | | 787 | |
| Europe | — | | | — | | | 4 | | | 1,155 | | | — | | | — | | | 4 | | | 1,155 | |
| Middle East and Africa | 1 | | | 614 | | | 3 | | | 1,569 | | | — | | | — | | | 4 | | | 2,183 | |
| Asia Pacific | 1 | | | 164 | | | 22 | | | 6,430 | | | 1 | | | 659 | | | 24 | | | 7,253 | |
| Canopy by Hilton | | | | | | | | | | | | | | | |
| U.S. | — | | | — | | | — | | | — | | | 23 | | | 3,908 | | | 23 | | | 3,908 | |
| Americas (excluding U.S.) | — | | | — | | | 2 | | | 272 | | | — | | | — | | | 2 | | | 272 | |
| Europe | — | | | — | | | 1 | | | 123 | | | 4 | | | 917 | | | 5 | | | 1,040 | |
| Middle East and Africa | — | | | — | | | 1 | | | 200 | | | — | | | — | | | 1 | | | 200 | |
| Asia Pacific | — | | | — | | | 4 | | | 614 | | | — | | | — | | | 4 | | | 614 | |
| Signia by Hilton | | | | | | | | | | | | | | | |
| U.S. | — | | | — | | | 1 | | | 1,009 | | | — | | | — | | | 1 | | | 1,009 | |
| Hilton Hotels & Resorts | | | | | | | | | | | | | | | |
| U.S. | — | | | — | | | 59 | | | 44,137 | | | 187 | | | 59,017 | | | 246 | | | 103,154 | |
| Americas (excluding U.S.) | 1 | | | 405 | | | 28 | | | 10,682 | | | 26 | | | 7,826 | | | 55 | | | 18,913 | |
| Europe | 39 | | | 11,514 | | | 45 | | | 15,388 | | | 43 | | | 11,268 | | | 127 | | | 38,170 | |
| Middle East and Africa | 5 | | | 1,992 | | | 37 | | | 12,659 | | | 3 | | | 1,565 | | | 45 | | | 16,216 | |
| Asia Pacific | 5 | | | 2,999 | | | 113 | | | 39,481 | | | 7 | | | 2,849 | | | 125 | | | 45,329 | |
| Curio Collection by Hilton | | | | | | | | | | | | | | | |
| U.S. | — | | | — | | | 7 | | | 3,272 | | | 59 | | | 12,578 | | | 66 | | | 15,850 | |
| Americas (excluding U.S.) | — | | | — | | | 2 | | | 99 | | | 12 | | | 1,750 | | | 14 | | | 1,849 | |
| Europe | — | | | — | | | 4 | | | 360 | | | 20 | | | 2,827 | | | 24 | | | 3,187 | |
| Middle East and Africa | — | | | — | | | 4 | | | 741 | | | 2 | | | 557 | | | 6 | | | 1,298 | |
| Asia Pacific | — | | | — | | | 4 | | | 773 | | | 2 | | | 248 | | | 6 | | | 1,021 | |
| DoubleTree by Hilton | | | | | | | | | | | | | | | |
| U.S. | — | | | — | | | 34 | | | 11,450 | | | 339 | | | 76,905 | | | 373 | | | 88,355 | |
| Americas (excluding U.S.) | — | | | — | | | 3 | | | 587 | | | 34 | | | 6,745 | | | 37 | | | 7,332 | |
| Europe | — | | | — | | | 14 | | | 3,741 | | | 108 | | | 18,286 | | | 122 | | | 22,027 | |
| Middle East and Africa | — | | | — | | | 17 | | | 4,599 | | | 5 | | | 568 | | | 22 | | | 5,167 | |
| Asia Pacific | — | | | — | | | 76 | | | 20,625 | | | 5 | | | 1,395 | | | 81 | | | 22,020 | |
(continued on next page)
| | | | | | | | | | | | | | | | | | | | | | | | | | | | | | | | | | | | | | | | | | | | | | | |
| Owned / Leased(1) | | Managed | | Franchised | | Total |
| Properties | | Rooms | | Properties | | Rooms | | Properties | | Rooms | | Properties | | Rooms |
| Tapestry Collection by Hilton | | | | | | | | | | | | | | | |
| U.S. | — | | | — | | | — | | | — | | | 63 | | | 7,543 | | | 63 | | | 7,543 | |
| Americas (excluding U.S.) | — | | | — | | | 1 | | | 138 | | | 4 | | | 354 | | | 5 | | | 492 | |
| Europe | — | | | — | | | — | | | — | | | 3 | | | 162 | | | 3 | | | 162 | |
| Asia Pacific | — | | | — | | | 1 | | | 266 | | | 1 | | | 175 | | | 2 | | | 441 | |
| Embassy Suites by Hilton | | | | | | | | | | | | | | | |
| U.S. | — | | | — | | | 40 | | | 10,585 | | | 210 | | | 47,063 | | | 250 | | | 57,648 | |
| Americas (excluding U.S.) | — | | | — | | | 3 | | | 667 | | | 5 | | | 1,336 | | | 8 | | | 2,003 | |
| Motto by Hilton | | | | | | | | | | | | | | | |
| U.S. | — | | | — | | | — | | | — | | | 3 | | | 871 | | | 3 | | | 871 | |
| Hilton Garden Inn | | | | | | | | | | | | | | | |
| U.S. | — | | | — | | | 4 | | | 425 | | | 728 | | | 100,542 | | | 732 | | | 100,967 | |
| Americas (excluding U.S.) | — | | | — | | | 11 | | | 1,571 | | | 51 | | | 7,664 | | | 62 | | | 9,235 | |
| Europe | — | | | — | | | 19 | | | 3,642 | | | 60 | | | 9,727 | | | 79 | | | 13,369 | |
| Middle East and Africa | — | | | — | | | 16 | | | 3,400 | | | 3 | | | 474 | | | 19 | | | 3,874 | |
| Asia Pacific | — | | | — | | | 47 | | | 10,245 | | | 1 | | | 177 | | | 48 | | | 10,422 | |
| Hampton by Hilton | | | | | | | | | | | | | | | |
| U.S. | — | | | — | | | 27 | | | 3,519 | | | 2,281 | | | 224,999 | | | 2,308 | | | 228,518 | |
| Americas (excluding U.S.) | — | | | — | | | 13 | | | 1,644 | | | 109 | | | 13,305 | | | 122 | | | 14,949 | |
| Europe | — | | | — | | | 16 | | | 2,697 | | | 96 | | | 14,795 | | | 112 | | | 17,492 | |
| Middle East and Africa | — | | | — | | | 4 | | | 1,238 | | | — | | | — | | | 4 | | | 1,238 | |
| Asia Pacific | — | | | — | | | — | | | — | | | 219 | | | 35,633 | | | 219 | | | 35,633 | |
| Tru by Hilton | | | | | | | | | | | | | | | |
| U.S. | — | | | — | | | — | | | — | | | 212 | | | 20,664 | | | 212 | | | 20,664 | |
| Americas (excluding U.S.) | — | | | — | | | — | | | — | | | 2 | | | 179 | | | 2 | | | 179 | |
| Homewood Suites by Hilton | | | | | | | | | | | | | | | |
| U.S. | — | | | — | | | 10 | | | 1,172 | | | 489 | | | 55,819 | | | 499 | | | 56,991 | |
| Americas (excluding U.S.) | — | | | — | | | 3 | | | 406 | | | 24 | | | 2,688 | | | 27 | | | 3,094 | |
| Home2 Suites by Hilton | | | | | | | | | | | | | | | |
| U.S. | — | | | — | | | 2 | | | 210 | | | 512 | | | 53,596 | | | 514 | | | 53,806 | |
| Americas (excluding U.S.) | — | | | — | | | — | | | — | | | 7 | | | 753 | | | 7 | | | 753 | |
| Asia Pacific | — | | | — | | | — | | | — | | | 2 | | | 275 | | | 2 | | | 275 | |
| Other | — | | | — | | | 2 | | | 1,250 | | | 6 | | | 1,614 | | | 8 | | | 2,864 | |
| Total hotels | 54 | | | 18,151 | | | 745 | | | 234,640 | | | 5,978 | | | 812,622 | | | 6,777 | | | 1,065,413 | |
| Hilton Grand Vacations | — | | | — | | | — | | | — | | | 60 | | | 9,378 | | | 60 | | | 9,378 | |
| Total system | 54 | | | 18,151 | | | 745 | | | 234,640 | | | 6,038 | | | 822,000 | | | 6,837 | | | 1,074,791 | |
________(1)Includes hotels owned or leased by entities in which we own a noncontrolling financial interest.
Management and Franchise
We manage hotels and license our brands through our management and franchise segment, which included 745 managed hotels and 5,978 franchised hotels consisting of 1,047,262 total rooms, as of December 31, 2021. This segment generates its revenue primarily from fees charged to hotel owners under management and franchise contracts, as well as from fees associated with license agreements. We grow our management and franchise business by attracting owners to become a part of our system and participate in our commercial services to support their properties. These contracts require little or no capital investment to initiate on our part and provide significant return on investment for us as fees are earned and paid.
Hotel Management
Our core management services consist of operating hotels under management contracts for the benefit of third parties who either own or lease the hotels and the associated personal property. Often, particularly in the U.S., we employ the individuals working at these locations. Terms of our management contracts vary, but our fees generally consist of a base management fee, which is generally based on a percentage of the hotel’s monthly gross revenue, and, when applicable, an incentive management
fee, which is generally based on a percentage of the hotel's operating profits, normally over a one-year calendar period, and, in some cases, may be subject to a stated return threshold to the hotel owner. In general, the owner pays all operating and other expenses and reimburses our out-of-pocket expenses. In turn, our managerial discretion typically is subject to approval by the owner in certain major areas, including the approval of annual operating and capital expenditure budgets and the appointment of certain key personnel. Additionally, the owners generally pay a monthly program fee based on the underlying hotel's sales or usage, as reimbursement for the costs related to our: (i) advertising and marketing programs; (ii) internet, technology and reservation systems; and (iii) quality assurance programs. Owners are also responsible for various other fees and charges, including payments for participation in our Hilton Honors guest loyalty program, training, consultation and procurement of certain goods and services. As of December 31, 2021, we managed 745 hotels with 234,640 rooms, which does not include hotels in our ownership segment.
The initial terms of our management contracts are typically 20 to 30 years. In certain cases, we are both the franchisor and manager of the hotel, when we enter into a franchise contract in addition to the management contract, and, in these cases, we classify the hotel as managed in our system. Extension options for our management contracts are negotiated and vary, but typically are more prevalent in full service hotels. Generally, these contracts contain one or two extension options that are for either five or 10 years and can be exercised at our or the hotel owner's option or by mutual agreement, as specified by the contract.
Some of our management contracts provide early termination rights to hotel owners upon certain events, including the failure to meet certain financial or performance criteria. Performance test measures typically are based upon the hotel’s performance individually and/or in comparison to specified competitive hotels. We often have an optional cure right to pay an amount equal to the performance shortfall over a specified period, although in some cases our cure rights are limited.
Franchising
We license our IP, including our brand names, trademarks and service marks, and our operating systems to hotel owners under franchise contracts. We do not own, manage or operate franchised properties and do not employ the individuals working at these locations. We conduct periodic inspections of our franchised hotels to ensure that brand standards that we establish are maintained. For newly franchised hotels, including both new construction and conversions of existing hotels outside of our system, we approve the location, as well as the plans for the facilities, to ensure the hotels meet our brand standards. For existing franchised hotels, we provide franchisees with property improvement plans that must be completed to keep the hotels in compliance with our brand standards, so that they can remain in our hotel system. We also earn license fees from license agreements with HGV and strategic partners, including co-branded credit card providers, for the use of our IP.
Each franchisee pays us an application, initiation or other fee in conjunction with the inception of a franchise contract. Franchisees also pay a royalty fee, generally based on a percentage of the hotel’s monthly gross room revenue and, in some cases, may also include a percentage of gross food and beverage revenues and other revenues, as applicable. Additionally, the franchisees generally pay a monthly program fee based on the underlying hotel's sales or usage, which covers the costs of: (i) advertising and marketing programs; (ii) internet, technology and reservation systems; and (iii) quality assurance programs. Franchisees are also responsible for various other fees and charges, including payments for participation in our Hilton Honors guest loyalty program, training, consultation and procurement of certain goods and services. As of December 31, 2021, we franchised 6,038 hotels and resorts, including timeshare properties, with 822,000 rooms.
Our franchise contracts typically have initial terms of approximately 20 years for new hotels and approximately 10 to 20 years for hotels converting from hotels outside of our system. At the expiration of the initial term, we may have a contractual right or obligation to relicense the hotel to the franchisee for an additional term generally ranging from 10 to 15 years. We have the right to terminate a franchise contract upon specified events of default, including nonpayment of fees or noncompliance with brand standards. If a franchise contract is terminated by us because of a franchisee’s default, the franchisee is contractually required to pay us liquidated damages. We have no legal responsibility for the employees or the liabilities associated with operating franchised properties.
Ownership
As a hotel owner and lessee, we focus on maximizing cost efficiency and profitability of the owned and leased portfolio by, among other things, maximizing hotel revenues, implementing cost-effective labor management practices and systems and reducing fixed costs. Through our disciplined approach to hotel and asset management, we develop and execute on strategic plans for each of our hotels to enhance their competitive position and, at many of our hotels, we invest in renovating guest rooms and public spaces and adding or enhancing meeting and retail space to improve profitability. As of December 31, 2021,
the ownership segment included 54 hotels totaling 18,151 rooms, comprising 46 hotels that we leased, one hotel owned by a consolidated non-wholly owned entity, two hotels that were each leased by a consolidated variable interest entity ("VIE") and five hotels owned or leased by unconsolidated affiliates.
Environmental, Social and Governance ("ESG")
Hilton strives to create long-term value for all of our stakeholders through: (i) our resilient business model; (ii) our ESG efforts to support the viability of our business for the long-term; and (iii) our 101-year history of filling the earth with the light and warmth of hospitality and making the world a better place through travel and connection.
As one of the world’s largest hospitality companies, we recognize Hilton has a responsibility to protect the planet and support the communities we serve to ensure our hotel destinations remain vibrant and resilient for generations of travelers to come. Hilton drives positive environmental and social change across our corporate and hotel property operations, our global supply chain and the communities where our hotels are located through our ESG strategy, Travel with Purpose. We remain committed to our efforts to drive responsible travel and tourism globally and believe that the need for responsible leadership commensurate with our global scale will be greater than ever following the COVID-19 pandemic.
The components of our ESG platform include environmental impact, including climate action and destination stewardship; social and community impact, with a focus on human capital management, diversity, equity and inclusion ("DE&I") and human rights, and robust, transparent governance, ethics and regulatory compliance practices.
In 2018, we established our 2030 Goals to double our investment in social impact and cut our environmental footprint in half by 2030 at the hotels that we manage, including our owned and leased hotels. Our 2030 Goals, which align with the global Sustainable Development Goals ("SDGs") adopted by the United Nations in 2015, are guided by our evaluation of the social and environmental issues that are critical to our business and our long-term success. As our business recovers from the global pandemic, we have reaffirmed our commitment to these goals and taken further action to support these objectives, including reducing single use plastics at our hotels, supporting opportunity for youth through the launch of our new Passport to Success Concierge skill-building program and offering customers the opportunity to make their meetings and events at Hilton properties carbon neutral. In 2021, Hilton was named to the Dow Jones Sustainability Indices ("DJSI") for the fifth consecutive year, scoring in the 100th percentile in our industry, reflecting Hilton's continuous investment in building a leading ESG strategy.
Our ESG efforts are supported by a robust governance structure, designed to ensure our ESG objectives are an important part of our business priorities as we work towards our 2030 Goals. Our executive committee receives at least quarterly updates on our ESG programs and progress towards our 2030 Goals. The Nominating & ESG Committee, one of the three standing committees of Hilton's board of directors, reviews and assesses our ESG strategy and makes recommendations to the board and management as appropriate. The board also receives annual updates on progress towards our 2030 Goals.
Significant ESG risks, including risks related to climate change, environmental impact, social impact, health and safety, human rights and ethics, fraud and corruption, are integrated in Hilton's Enterprise Risk Management program as part of Hilton's annual Enterprise Risk assessment process. The results of this process are reviewed by our executive committee and our board of directors, including the Audit Committee, to inform enterprise-wide strategic planning. We also engage with stakeholders on an ongoing basis to continuously refine and enhance our strategy, to ensure we are aligning our programs with the issues that matter the most to our business and stakeholders. As part of this effort, we completed a thorough ESG materiality assessment in 2020, leveraging guidance from the Global Reporting Initiative ("GRI"), Sustainability Accounting Standards Board ("SASB") and the World Economic Forum. Of the more than 200 ESG issues considered, our stakeholders remain most focused on the following: climate action; employee development and well-being; DE&I; employee and guest health, safety and security; human rights; and ethical business practices and regulatory compliance. We used the results of this materiality assessment to ensure that our Travel with Purpose strategy remains aligned with these issues, inform management of ESG risks and drive long-term value for our business and our stakeholders.
The health, safety and security of our employees and guests have always been a priority, but due to increased risk exposure driven by the pandemic, growing threats from domestic and foreign violent extremists, increased conflicts and political instability in many developing countries, as well as escalating intensity of natural disasters, it has become one of our primary focuses. During the early months of the pandemic, we were successful in the launch of Hilton CleanStay, a program to deliver a new standard of cleanliness and disinfection to our properties worldwide, and Hilton EventReady, which focuses on cleanliness and customer service specific to meetings and events. We continue to adapt the programs as local mandates evolve and recovery from the pandemic continues to control the risk of viral outbreaks and provide assurance to guests. Additionally, we track and respond to travel restrictions and local mandates, such as face mask and vaccination requirements. To help ensure the
safety and security of our employees and guests, we constantly monitor threats and incidents around the world through online tools and external networks and partnerships; support our properties globally with crisis alert communications, crisis plans and area crisis teams; provide employees with safety and security training resources; and conduct safety and security audits annually using a risk-based approach.
Like our stakeholders, Hilton recognizes the significant impact that our environmental and social efforts have on our business, and we consider environmental sustainability and climate change to be among our key enterprise risks. As such, we remain committed to reducing our carbon and other greenhouse gas emissions in line with climate science. We were the first hospitality company to set science-based carbon reduction targets, which were verified by the Science Based Targets initiative ("SBTi"), a partnership of several worldwide environmental organizations, in May 2018. We also evaluate our climate change risks and report annually on our ESG performance, with our reporting prepared in accordance with the GRI Standards, while integrating the recommendations of the SASB and the Task Force on Climate-related Financial Disclosures ("TCFD").
LightStay, our proprietary and award-winning ESG management system that was launched in 2009, is aligned with the criteria of the Global Sustainable Tourism Council ("GSTC") and is used to measure, manage and report some of Hilton's key environmental and social performance metrics, including, but not limited to, carbon emissions, energy, water, waste, volunteer hours, in-kind donations and local partnerships. Our hotels and corporate offices use LightStay to track environmental and social data, assess performance and leverage the data collected to make business decisions and establish future goals and objectives relating to these areas.
We recognize that achieving meaningful progress towards our 2030 Goals and the SDGs requires deep collaboration across a wide range of partners and external stakeholders, including the Sustainable Hospitality Alliance ("SHA"), an organization that uniquely represents the hotel industry’s collective efforts to ensure destinations and communities are being supported and protected for future generations. Hilton leaders continue to actively engage with SHA and its membership and have participated in the development of SHA's Principles on Forced Labor, the Hotel Carbon Measurement Initiative and the Hotel Water Measurement Initiative methodologies to consistently measure and report on carbon emissions and water consumption in hotels.
The Hilton Effect Foundation (the "Foundation") supports mission-aligned nonprofits and local community organizations that serve as partners to amplify our environmental and social impact around the world. Launched in 2019, the Foundation is our primary global philanthropic arm and is registered as a U.S.-based 501(c)(3) charitable organization.
The Foundation is dedicated to creating a better world to travel, and in 2021, awarded nearly $2 million in grants to organizations globally supporting recovery, restoration and rebuilding in response to the COVID-19 pandemic, particularly for the populations and locations most severely impacted. Since its inception in 2019, the Foundation has awarded more than $5 million in grants to more than 70 nongovernmental and community-based organizations.
Environmental Impact
We are committed to cutting our environmental footprint in half by 2030, with 2008 as our baseline, through energy and carbon management, water stewardship, waste reduction and responsible sourcing. In 2021, we maintained our system-wide certification to ISO 9001 (Quality Management), ISO 14001 (Environmental Management) and ISO 50001 (Energy Management) standards, one of the largest ISO certified portfolios of buildings in the world.
In alignment with our science-based targets, we continue to take steps to increase our sourcing of renewable energy at our hotels around the world. In the EMEA region, one-third of the hotels we operate, including owned, leased and managed hotels, as well as our Watford and Glasgow offices, were supplied with 100 percent renewable energy during the year ended December 31, 2021, and, in the U.S., we continued to have a renewable energy option for our managed hotels. Further, we continued our focus on our food waste reduction and food donation initiatives, with all of our managed hotels in the U.S. and Canada required to have food donation programs in place. We also operate the industry’s largest soap recycling program, with over 5,500 of our hotels partnered with soap recycling organizations to donate new soap bars and other unused supplies from our hotels to those in need, consistent with our effort to reduce waste. Further, in 2021, we began to shift our hotels to bulk bath amenities in an effort to reduce plastic waste. Hotels have already begun switching to bulk products, with compliance required at all hotels by 2023. We also continue to work with our environmental partner, the World Wildlife Fund, to evolve our environmental strategy and implement our programs globally.
Our primary source of carbon emissions is from the operation of our hotels. In 2020, as a result of the COVID-19 pandemic, we experienced a significant decrease in utility consumption across our global portfolio, primarily as a result of reduced occupancy and the complete or partial suspensions of hotel operations. During 2021, we began to recover from the
negative impacts of the pandemic and, while some hotels were suspended for some period of time during the year, the majority of hotels that had suspended operations for some time during 2020 were reopened before or during 2021. As such, we experienced a year-over-year increase in consumption of energy, water and waste in 2021 as occupancy rates increased. However, consumption remained below 2019 levels, and we remain on track to achieve our 2030 Goals. As we implement ongoing efforts to optimize efficiency at our hotels, we are making significant efforts to support our hotels to keep consumption below pre-pandemic levels.
We have achieved the following reductions in environmental impact since 2008:
| | | | | |
| Percent Reduction Achieved Since 2008(1) |
Reduction in water consumption per square meter(2) | 39 | % |
Reduction in landfilled waste per square meter(2) | 70 | |
Reduction in carbon dioxide emissions per square meter(2) | 49 | |
Energy consumption per square meter(2) | 40 | |
____________
(1)Reflects data as of December 31, 2021 that has been reviewed by an independent third party. Continued progress in these measures during the year ended December 31, 2021 is attributable to occupancy fluctuations during the ongoing COVID-19 pandemic. Although consumption and waste generation were higher in 2021 than in 2020, correlated with the increase in occupancy, they remain below 2019 levels.
(2)Reflects performance across Hilton's managed, owned and leased properties, which totaled approximately 27.5 million square meters as of December 31, 2021.
The data in the following tables, which have been reviewed by an independent third party, reflect the key sustainability metrics for our managed, owned and leased properties, as well as recommendations of the SASB within their Hotel & Lodging and Restaurant Standards:
| | | | | | | | | | | | | | | | | |
| Year Ended December 31, |
| Metric | 2021(1) | | 2020(1) | | 2019 |
| Energy management | | | | | |
| Total energy consumed, in gigajoules per square meter | 0.81 | | 0.72 | | 1.03 |
| Percent total energy from grid electricity | 56.3 | % | | 56.3 | % | | 53.8 | % |
| Carbon emissions | | | | | |
Total emissions (Scope 1 and 2), in metric tons CO2e per square meter(2) | 0.079 | | 0.069 | | 0.101 |
| Water management | | | | | |
| Amount withdrawn, in cubic meters per square meter | 1.79 | | 1.55 | | 2.35 |
| Amount consumed, in cubic meters per square meter | 0.447 | | 0.388 | | 0.586 |
Percent in regions with high or extremely high baseline water stress(3) | 37 | % | | 37 | % | | 32 | % |
| Waste management | | | | | |
| Amount generated, in metric tons per square meter | 0.0042 | | 0.0039 | | 0.0080 |
| Percent diverted from landfills | 32.0 | % | | 33.9 | % | | 34.8 | % |
| | | | | | | | | | | | | | | | | |
| Year Ended December 31, |
Absolute Consumption(4) | 2021(1) | | 2020(1) | | 2019 |
| Total energy consumed, in million gigajoules | 22.2 | | 17.8 | | 24.6 |
Direct emissions (Scope 1), in million metric tons CO2e | 0.42 | | 0.33 | | 0.48 |
Indirect emissions (Scope 2), in million metric tons CO2e(2) | 1.76 | | 1.39 | | 1.93 |
Water withdrawn, in million cubic meters (m3) | 49.1 | | 38.7 | | 56.1 |
Water consumed, in million cubic meters (m3) | 12.3 | | 9.7 | | 14.0 |
| Waste generated, in million metric tons | 0.110 | | 0.097 | | 0.192 |
____________
(1)The decreases in consumption reflected in these measures during the year ended December 31, 2020 and then the increases in consumption reflected in these measures, if applicable, during the year ended December 31, 2021 were primarily attributable to the reduction in occupancy as a result of the COVID-19 pandemic during 2020, followed by Hilton's recovery from the impact of the pandemic during 2021 and the increase in occupancy. During the year ended December 31, 2020, the hotel operations at approximately 380 of our managed, owned and leased hotels were completely or partially suspended for some period of time, while only approximately 120 had suspended operations for some period of time during 2021. The changes in occupancy and the number of hotel suspensions were directly correlated with and impacted the consumption of energy, water and waste at our hotels around the world.
(2)Scope 2 market-based emissions as defined by The Greenhouse Gas Protocol: A Corporate Accounting and Reporting Standard (Revised Edition).
(3)As defined by the World Resources Institute ("WRI").
(4)Total floor area of Hilton's managed, owned and leased properties, for which absolute consumption is reflected, was 27.5 million square meters, 24.9 million square meters and 23.9 million square meters as of December 31, 2021, 2020 and 2019, respectively. Absolute consumption increased during the year ended December 31, 2021 due to our increased floor area and increased occupancy, as described above.
Social Impact
With a presence in 122 countries and territories, we use our global scale as an engine of opportunity, focusing on supporting our communities, creating career opportunities and ensuring responsible and compliant business practices across our entire value chain, all with deep consideration for human rights and diversity and inclusion. As part of our 2030 Goals, we committed to doubling our investment in social impact.
In addition to collaboration across our industry and within the business community, we are focused on achieving change by leveraging the scale of our value chain. We remain committed to doubling our sourcing from small, local and diverse-owned businesses globally, with a particular focus on helping these businesses recover from the economic impacts of the pandemic. We continue to engage women-, minority-, veteran-, disabled- and LGBTQ+- owned businesses through our award-winning Supplier Diversity Program.
Hilton also remains committed to combating human trafficking, and we require all hotel-based employees to complete an annual training on identifying signs of trafficking. We partner with expert organizations, including Vital Voices, It’s a Penalty and ECPAT, to help prevent and mitigate such risks, including at an industry level through the Sustainable Hospitality Alliance, World Travel and Tourism Council, American Hotel & Lodging Association and United Kingdom ("U.K.") Stop Slavery Hotel Industry Network.
We are focused on creating opportunities for youth and empowering potential future employees. In 2019, we achieved our goal of preparing and employing 1 million young people in underserved communities worldwide and we continue to invest in the development of soft skills and hospitality experience creating career and life-enriching experiences for young people. Further, during 2021, we achieved a new milestone in our partnership with the International Youth Foundation, launching Passport to Success Concierge, an online soft skills course that is free to youth around the globe who are interested in building the core skills for a career in travel and tourism. We also continued to support organizations such as Jobs for America’s Graduates and established a Pathways Program focused on career opportunities for youth and other target groups, such as refugees, minorities and veterans. We have reached over 25,000 refugees since 2015 through volunteering, in-kind donations, purchasing, training and employment. In 2021, we made progress on our 2020 pledge to directly mentor at least 50 LGBTQ+ refugees, by providing direct mentorship to 14 refugees and expanding the commitment to the U.K. We also joined the Tent Coalition for Afghan Refugees, a coalition of companies committed to training and hiring Afghans displaced by the humanitarian crisis in the country. The Foundation made a grant to The Memorial Foundation, which aims to support the next generation of social justice by teaching leadership and advocacy skills, personal development, community volunteerism and instilling Dr. Martin Luther King Jr.'s vision for our shared humanity.
During 2021, Hilton and the Foundation supported our hotel teams and surrounding communities through disasters and crises, including Hurricane Ida, flooding in Malaysia, evacuations of Afghan refugees and the COVID-19 pandemic. This approach included donating to organizations at the frontlines of the crises, supporting the delivery of meals, medical care and other basic needs, as well as support for the families of impacted employees through Hilton's third-party operated Team
Member Assistance Fund ("TMAF"). Hilton employees, as well as employees of franchised hotels who are not employed by Hilton, can apply for financial aid when impacted by disaster and extreme hardship. The TMAF provided more than $750,000 in financial aid to individuals in 2021, more than 95 percent of which was for individuals directly impacted by the COVID-19 pandemic.
Our employees around the world remain dedicated to creating a positive impact in their communities. This year, our employees continued to volunteer in their communities, including virtually, and, in December 2021, we held our annual Hilton Effect Week to drive further acts of service. During 2021, our employees around the world volunteered over 190,000 hours in their local communities.
Human Capital Management
As of December 31, 2021, we employed approximately 142,000 people at our managed, owned and leased properties and at our corporate locations. An additional 223,000 people were employed by third-party owners and franchisees of our properties.
Our founder, Conrad Hilton, believed that travel had the power to open minds and hearts and promote peace and understanding around the world and that belief has driven the vision for our enterprise. Now, over a century later, that dream lives on through the employees at our hotels and guides our actions every day. We strive to be the most hospitable company in the world, and we believe that an effective human capital management strategy is an essential component of that effort. Our strategy focuses on attracting, developing and retaining the best talent in the industry, and our executive committee reviews talent strategy and succession plans on a quarterly basis to assess current and future talent needs.
We have built and continue to cultivate a strong employee-centered culture that creates connectivity, camaraderie and trust among all employees, which then delivers positive experiences to guests at our hotels. Additionally, for our employees, guests, owners and the communities where we live, work and travel, we are committed to the following:
•Create the best, most inclusive home for our employees at their place of work;
•Deliver the most reliable and friendly experience each time our guests stay with us;
•Drive value to our owners while having a positive impact; and
•Make our communities better for those who live and travel there.
Even in one of our most challenging years, we chose to make strategic investments to continue to expand and enhance programs and initiatives that strengthen these commitments to our stakeholders.
DE&I
At Hilton, we are diverse by nature and inclusive by choice. We focus on a "for all" culture where diverse ideas and backgrounds are welcomed and celebrated. We know that a great place to work creates a sense of belonging and acceptance, regardless of background, ethnicity, age, ability, gender or sexual orientation. Guided by our values, we strive to make Hilton one of the world’s most inclusive workplaces. Over the last decade, and, in particular, the last year, we have been on an important journey to create inclusion at every point in our employees' experiences. As part of this journey, we announced new commitments to ensure our workforce truly represents the communities where we live and work. Hilton is committed to achieving global gender parity and 25 percent U.S. ethnic representation at our corporate leadership levels by the end of 2027. Our leaders are committed to our diversity and inclusion efforts, and we hold them accountable through our organizational objectives that measure their performance against our commitments.
Just as our guests represent significant diversity, so do our employees, representing over 170 nationalities, speaking more than 40 different languages, representing 122 countries and territories and spanning five generations. As of December 31, 2021, our global workforce, only including persons employed by Hilton, was 44 percent women. Globally, corporate leadership was 39 percent women and hotel leadership was 24 percent women. As of December 31, 2021, in the U.S., our workforce was 71 percent ethnically diverse, with U.S. corporate leadership being 19 percent ethnically diverse and U.S. hotel leadership being 21 percent ethnically diverse. As of December 31, 2021, our board of directors, excluding management directors, was 50 percent women and 25 percent ethnically diverse.
Hilton has a long legacy of supporting the military dating back to our founder, Conrad Hilton, a proud World War I veteran. Over the last six years, we have hired over 35,000 veterans, spouses, caregivers and dependents, whose shared values like leadership, integrity and teamwork are a natural fit with Hilton.
As part of our commitment to an inclusive environment, we offer the following resources to our employees:
•Team Member Resource Groups ("TMRG") – Our nine TMRGs have global reach and each one is sponsored by an executive committee leader. They provide members with opportunities for career development and the chance to share their unique perspectives and viewpoints with leadership and other colleagues to drive important conversations about inclusion and equity across the enterprise.
•Courageous Conversations – Launched in 2020, with eight conversations held through 2021, leaders throughout our business and experts in the fields of the relevant topics engage in tough conversations on topics including racism, allyship, mental health and women leaving the workforce. With a focus on transparency around difficult topics, these workshops are a safe place for employees to create their own personal reflection plan and speak out while driving awareness of the need for lasting change and helping us build a culture that creates a genuine sense of inclusion for employees.
•Annual trainings – We require all employees to complete training as part of our Inclusive and Respectful Workplace curriculum, which is based on the underlying principles of our Code of Conduct. This annual requirement includes training on unconscious bias, DE&I, preventing human trafficking and anti-harassment. Our Code of Conduct states that we do not tolerate any form of discrimination or harassment on the basis of any characteristic protected by applicable law. For our guest-facing employees, our mandatory DE&I training is scenario-driven training designed to promote positive, inclusive behaviors. Guided by thoughtful questions and real-life situations, employees examine how guests feel when subjected to unconscious bias and how they can ensure all guests feel welcome.
Thrive at Hilton
Thrive at Hilton is our value proposition that enables all employees to grow and flourish in both their professional and personal lives. To make that happen, we offer an entire ecosystem of programs throughout their career with Hilton to ensure they have the tools they need to excel in their roles. Their total well-being – mind, body and spirit – is central to our growth and continued success. At Hilton, we know that when we take care of our employees, they thrive and, in turn, create meaningful experiences for our guests and each other.
We offer a range of innovative benefits and programs that ensure our employees thrive in every aspect of their lives. Such benefits and programs include paid time off, parental leave, adoption assistance, subsidized health insurance, education assistance and flexible work arrangements, including remote work opportunities for our corporate employees, and Go Hilton Travel programs, which make discounted rooms available to hotel and corporate employees, as well as their families and friends.
Our employees are at the core of our success and we strive to provide medical and mental health care that is convenient, accessible and affordable for our employees; our programs include:
•Amazon Care – Hilton is proud to be the first hospitality company to partner with Amazon Care, which aims to increase access to care, allowing for more timely treatment of acute conditions and better management of chronic conditions for eligible U.S. employees beginning in 2022.
•Employee Assistance Program – Offers free and confidential services, such as counseling and recommending resources to find services such as child and eldercare, legal advice and apartment hunting and relocation.
•Thrive at Hilton - Mental Wellness – Our global initiative to grow and amplify our mental health support services provides employees with access to a dedicated counselor in the U.S. and features a global internal hub with a variety of mental health resources, including leader testimonials, tips on normalizing conversations around mental health, messages encouraging employees to manage their mental health and ways to seek clinical support if needed.
We also have various programs to show our appreciation and celebrate our employees, including our two largest programs: the CEO Light & Warmth Award and the Hospitality Heroes Award, both of which we expanded in 2021. The CEO Light & Warmth Award is our company’s highest honor, recognizing employees who have brought the light and warmth of hospitality to life through sustained, significant and life-changing actions for our guests, business, employees and the community. The Hospitality Heroes Award recognizes hotel and call center employees who go above and beyond to bring Hilton hospitality to life for guests or their Hilton teammates.
We also want our employees to share in our success and, as a result of employee feedback, we introduced an employee stock purchase plan ("ESPP") in 2019. Through our ESPP, eligible U.S. employees can purchase Hilton stock through after-tax payroll deductions at a 15 percent discount from the market stock price and benefit from the hard work they put into making Hilton a success.
We regularly survey our employees to gauge the level of job satisfaction and effective relationships with management, among other things. We strive to maximize employee retention and minimize attrition with these and other measures. Approximately 40 percent of our U.S. employees have been a part of the Hilton family for at least 10 years.
Compensation and Benefits
Hilton offers competitive pay and benefits to its employees, including a variety of compensation programs and comprehensive benefit programs. Hilton has hired consulting firms to independently evaluate the effectiveness of executive compensation and benefit programs and utilized their feedback to further our commitment to deliver competitive levels of compensation and benefits. We regularly review gender and diversity pay parity among our employees as part of our ongoing talent processes.
As of December 31, 2021, approximately 30 percent of our employees worldwide and approximately 45 percent of our employees in the U.S. were covered by various collective bargaining agreements that generally address pay rates, working hours, other terms and conditions of employment, certain employee benefits and orderly settlement of labor disputes.
Development and Training
Our focus on career development recognizes that each of our employees has unique talents, dreams and goals. Rather than a one-size-fits-all approach, we create custom-curated experiences so that employees can learn, develop, lead and thrive at Hilton by following a training and career path best suited to their goals and aspirations. Hilton University, our global learning platform, gives employees access to a robust library of learning resources to help them succeed. We partner with best-in-class educational institutions and content providers across the globe to deliver high-quality, relevant content to our employees, including a wide array of general business, industry or function-specific technical skills and leadership development courses and programs. We have invested in modernizing our approach to learning, positioning us to continue to deliver content virtually throughout the pandemic and across our growing global footprint. Our Hilton University platform provides flexible, accessible learning to help our employees learn and grow. Our new Job Skills Hubs and LinkedIn Learning Playlists help make it easy to find specific learnings that employees may be looking for, whenever they need them.
Our employees have the opportunity to grow their leadership skills and careers through our Lead@Hilton framework, which develops leaders throughout their careers and features the Hilton Leaders Teaching Leaders video series, as well as content from partners such as Cornell University and Harvard University. Curriculums were curated for each level of experience to provide employees with the foundational tools to start as learners and the coaching, mentoring and wellness resources to grow as leaders. To continue to grow and support our top hotel leaders, we launched GM Academy, which is centered on nine core General Manager ("GM") business capabilities including leadership and people management, asset management, customer engagement and commercial performance. With partners such as Cornell University, Harvard University and LinkedIn, we have curated learning paths for each core capability. GMs and their leaders can map their custom development plan with an online learning assessment. In addition to the information included as part of the Lead@Hilton framework, the GM Academy curriculum also includes resources such as executive reading recommendations and regional specific programming.
Awards and Recognition
We have consistently been recognized for our Hilton culture, and our awards for 2021 included: #1 in the DiversityInc Top 50 Companies for Diversity, Military Times Best for Vets #9 (Overall) and #1 (Hospitality), Military Friendly Employer with Gold distinction, Veteran Magazine Best of the Best Veteran Friendly Company, Great Place to Work Institute ("GPTW") #3 World’s Best Workplace, GPTW & Fortune #3 Best Place to Work in the U.S. and #1 Best Big Companies to Work For List, GPTW & Fortune #1 Best Place to Work for Women in the U.S. (for the third consecutive year) and recipient of the Secretary of Defense Employer Support Freedom Award (one of approximately 300 companies honored since 1996), which is the highest Department of Defense honor for employers of National Guard and Reserve Service Members. Additionally, we received a 100 percent rating in the Corporate Equality Index from the Human Rights Campaign for our commitment to corporate policies, practices and benefits pertinent to LGBTQ+ employees for the eighth consecutive year.
Governance, Ethics and Regulatory Compliance
As a core underpinning of our entire organization, our ethics and compliance program is overseen by our board of directors, which expects all Hilton employees to conduct themselves to a high standard. Our Code of Conduct establishes a set of global business principles, with our compliance organization, training, risk management and monitoring activities tailored to address unique risks by geography, business line, function and level. Our Code of Conduct is supported by a robust set of compliance policies addressing risk areas such as corruption, trade sanctions, insider trading, privacy, confidential information, antitrust and escalation of concerns. Our legal and compliance training program, which is an annual requirement for all of our employees, provides the ability to convey a consistent set of compliance standards across the organization in formats designed to target different knowledge levels, learning styles and functional needs. Our annual training calendar includes mandatory training and supplemental training that is supported by company-wide awareness campaigns highlighting Hilton-specific risks and scenarios. We also use passive communication channels, including electronic bulletin board screens in the employee break room areas of our hotels, and internal newsletters, including a publication that highlights real Hilton Compliance Hotline matters and their resolutions.
Our legal compliance team administers a third-party risk management program so that we understand the qualifications, reputation and associations of third parties with whom we transact, particularly third parties who interface with government officials and third parties who act in Hilton’s name, such as owners of our hotels. The third-party risk management program includes due diligence, education materials for third parties, ongoing monitoring of relationships and appropriate contract audit and termination rights. The Audit Committee of our board of directors receives regular updates from our compliance team.
Competition
We encounter active and robust competition as a hotel and resort manager, franchisor, owner and lessee. Competition in the hospitality industry is based on several criteria, generally including: the attractiveness of the facility; location; level of service; quality of accommodations; amenities; food and beverage options and outlets; public and meeting spaces and other guest services; consistency of service; room rate; brand reputation; and the ability to earn and redeem loyalty program points through a global system. Our properties and brands compete with other hotels, resorts, motels, inns and other accommodation rental services in their respective geographic markets or customer segments, including facilities owned by local interests, individuals, national and international chains, institutions, investment and pension funds and real estate investment trusts ("REITs"). We believe that our position as a multi-branded manager, franchisor, owner and lessee of hotels with an associated global, system-wide guest loyalty and commercial platform helps us continue to maintain our position as one of the largest and most geographically diverse hospitality companies in the world.
Our principal competitors include other branded and independent hotel operating companies, national and international hotel brands and ownership companies. While local and independent brand competitors vary, on a global scale, our primary competitors are Accor S.A., Choice Hotels International, Hongkong and Shanghai Hotels, Hyatt Hotels Corporation, Intercontinental Hotel Group, Marriott International, Radisson Hotel Group and Wyndham Hotels & Resorts.
Seasonality
The hospitality industry is seasonal in nature. The periods during which our properties experience higher or lower levels of demand vary from property to property, depending principally upon their location, type of property and competitive mix within the specific location. Based on historical results, we generally expect our revenues to be lower in the first quarter of each year than in each of the three subsequent quarters.
Cyclicality
The hospitality industry is cyclical, and demand generally follows, on a lagged basis, key macroeconomic indicators. There is a history of increases and decreases in the development and supply of and demand for hotel rooms, occupancy levels and room rates realized by hotel owners through economic cycles. The combination of changes in economic conditions and in the supply of hotel rooms can result in significant volatility in results for owners and managers of hotel properties. The costs of running a hotel, including personnel costs, rent, property taxes, insurance and utilities, tend to be more fixed than variable. As a result of such fixed costs, in a negative economic environment, the rate of decline in earnings can be higher than the rate of decline in revenues. In 2020, we and our hotel owners experienced a downturn in the current industry cycle driven by the COVID-19 pandemic, which continued into 2021. However, the level of travel in 2021 recovered substantially when compared to that of 2020.
Intellectual Property
In the highly competitive hospitality industry in which we operate, trademarks, service marks, trade names, logos and patents are very important to the success of our business. We have a significant number of trademarks, service marks, trade names, logos, patents and pending registrations and expend significant resources each year on surveillance, registration and protection of our IP, which we believe have become synonymous in the hospitality industry with a reputation for excellence in service and authentic hospitality.
Government Regulation
Our business is subject to various foreign and U.S. federal and state laws and regulations, including laws and regulations that govern the offer and sale of franchises, many of which impose substantive requirements on franchise contracts and require that certain materials be registered before franchises can be offered or sold in a particular jurisdiction.
In addition, a number of states regulate the activities of hospitality properties and restaurants, including safety and health standards, as well as the sale of liquor at such properties, by requiring licensing, registration, disclosure statements and compliance with specific standards of conduct. Operators of hospitality properties also are subject to laws governing their relationship with employees, including minimum wage requirements, overtime, working conditions and work permit requirements. Our franchisees are responsible for their own compliance with laws, including with respect to their employees, minimum wage requirements, overtime, working conditions and work permit requirements. Compliance with, or changes in, these laws could reduce the revenue and profitability of our properties and could otherwise adversely affect our operations.
We also manage hotels with casino gaming operations as part of or adjacent to the hotels. However, with the exception of casinos at certain properties in Puerto Rico and Egypt, third parties manage and operate the casinos. We hold and maintain the casino gaming license and manage the casinos located in Puerto Rico and Egypt and employ third-party compliance consultants and service providers. As a result, our business operations at these facilities are subject to the licensing and regulatory control of the local regulatory agency responsible for gaming licenses and operations in those jurisdictions.
For additional information on government regulation, including environmental regulations and requirements, refer to "Part I—Item 1A. Risk Factors."
Insurance
U.S. hotels that we manage are permitted to participate in certain of our insurance programs by mutual agreement with our hotel owners. If not participating in our programs, hotel owners must purchase insurance programs consistent with our requirements. Generally, U.S. franchised hotels are not permitted to participate in our insurance programs, but rather must purchase insurance programs consistent with our requirements. Foreign managed and franchised hotels are required to participate in certain of our insurance programs. In addition, our management and franchise contracts typically include provisions requiring the owner of any hotel to indemnify us against losses arising from the design, development and operation of such hotel.
Most of our insurance policies are written with self-insured retentions or deductibles that are common in the insurance market for similar risks, and we believe such risks are prudent for us to assume. Our third-party insurance policies provide coverage for claim amounts that exceed our self-insurance retentions or deductible obligations. We maintain insurance coverage for general liability, property, business interruption, terrorism and other risks with respect to our business for all of our owned and leased hotels, and we maintain workers' compensation or equivalent coverage for all of our employees. We also are self-insured for health coverage for some of our U.S. employees, which include those working at our corporate operations and managed hotels. In general, our insurance provides coverage related to any claims or losses arising out of the design, development and operation of our hotels.
Where You Can Find More Information
We file annual, quarterly and current reports, proxy statements and other information with the SEC. Our SEC filings are available to the public over the internet at the SEC's website at www.sec.gov. Our SEC filings are also available free of charge on our website at newsroom.hilton.com as soon as reasonably practicable after they are filed with or furnished to the SEC. Our website and the information contained on or connected to that site are not incorporated into this Annual Report on Form 10-K.
Item 1A. Risk Factors
In addition to the other information in this Annual Report on Form 10-K, the following risk factors should be considered carefully in evaluating our company and our business.
Risks Related to the COVID-19 Pandemic
The ongoing global COVID-19 pandemic has negatively affected and will continue to negatively affect our business, financial condition and results of operations.
The COVID-19 pandemic has significantly affected the global economy and strained the hospitality industry due to travel restrictions and advisories, stay-at-home directives, limitations on public gatherings and modified work arrangements, all of which have resulted in cancellations and reduced travel around the world, as well as complete and partial suspensions of certain hotel operations. Although distribution of approved vaccines for COVID-19 began in late 2020 and continued throughout 2021, access to and acceptance of vaccines has varied across regions and within individual countries. In addition, new strains of the virus have had increased transmissibility, complicating treatment and vaccination programs. As such, the COVID-19 pandemic had a material negative impact on our results for the year ended December 31, 2021 and will continue to negatively affect future results. The long-term effects of the COVID-19 pandemic on our business and the travel industry at large remain uncertain and will depend on future developments, including, but not limited to, the duration and severity of increases in serious illnesses, if any, the availability and public acceptance of vaccinations and other treatments to combat COVID-19 and the length of time it takes for demand and pricing to stabilize and normal economic and operating conditions to resume. The current and uncertain future impact of the COVID-19 pandemic, including its effect on the ability or desire of people to travel and use our hotel properties for lodging, food and beverage and other services, is expected to continue to negatively affect our results, operations, outlook, plans, growth, cash flows and liquidity.
During the pandemic, the U.S. and other national and local governments have imposed travel restrictions at various times and, in some countries and U.S. states, re-imposed such restrictions, and a number of our hotels fully or partially suspended operations, primarily during 2020, but also during 2021. We have been and expect to continue to be negatively affected by additional governmental regulations and travel restrictions or advisories to fight the pandemic, including recommendations by the U.S. Department of State, the Centers for Disease Control and Prevention and the World Health Organization, along with other governmental and health and safety authorities.
Although nearly all of our hotels that completely or partially suspended operations at some point during 2020 and 2021 have fully reopened, we cannot predict if any of our hotels will have to completely or partially suspend operations in the future. Moreover, even where travel advisories and restrictions have been lifted, travel demand has been weak for periods of time, and we cannot predict if or when our hotels and resorts will return to pre-pandemic demand or pricing. Although we have implemented enhanced hygiene and cleaning standards and other protocols to protect our guests and employees, we cannot fully predict their impact on public perception regarding travel-related COVID-19 risks. Adverse changes in the perceived or actual economic climate, including higher unemployment rates, inflation, declines in income levels and loss of personal wealth resulting from the impact of the COVID-19 pandemic, may also negatively affect travel demand. Conversely, rapid increases in demand also could pose challenges due to labor shortages.
The steps we took in 2020 to reduce operating costs, including temporarily reducing compensation, reducing our workforce and furloughing a substantial number of our employees, and further steps we may take in the future to reduce costs for us or our third-party hotel owners may negatively affect our brand reputation and ability to attract and retain employees. Some hotels have faced challenges restaffing to pre-pandemic levels, which may negatively affect hotel results, guest experience and loyalty. We also may face demands or requests from labor unions that represent employees at our hotels for additional compensation, healthcare benefits or other terms, including making payments to underfunded multi-employer pension plans for covered union employees, as a result of the pandemic that could increase costs, and we could experience labor issues if we have to implement further mitigation plans. Even after the COVID-19 pandemic subsides, we could still experience long-term impacts on our operating costs as a result of attempts to counteract future outbreaks of COVID-19 or other viruses through, for example, enhanced health and hygiene requirements or other such measures in one or more regions.
The COVID-19 pandemic has had a negative impact on our partners, including third-party owners of our properties, third-party service providers, travel agencies, suppliers and other vendors. In particular, third-party owners of our hotels have experienced financing difficulties and significant declines in revenues, thereby making it more difficult for them to maintain their hotels and service their indebtedness. This in turn makes it more likely that they could declare bankruptcy or face other difficulties with their lenders or other creditors. Bankruptcies, sales or foreclosures involving our hotels could, in some cases,
result in the termination of our management or franchise contracts and eliminate our anticipated income and cash flows, including amounts currently due to us under existing agreements, which would negatively affect our results of operations. Hotel owners with financial difficulties have been and may continue to be unable or unwilling to pay us amounts that we are entitled to under our existing contracts on a timely basis or at all. Current and ongoing economic conditions also could affect our ability to enter into management and franchise contracts with potential third-party owners of our hotels, who may be unable to obtain financing or face other delays or cost pressures in developing hotel projects. As a result, some properties in our development pipeline have entered our system later than we anticipated, and new hotels may enter our pipeline at a slower rate than in the past, thereby negatively affecting our overall growth. Likewise, if we or our hotel owners or franchisees are unable to access capital to make physical improvements to our hotels, the quality of our hotels may suffer, which may negatively impact our reputation and guest loyalty, and our market share may suffer as a result.
We may be required to raise additional capital in the future, and our access to and cost of financing will depend on, among other things, global economic conditions, conditions in the global financing markets, the availability of sufficient amounts of financing, our prospects and our credit ratings. Certain of our credit ratings have been downgraded or placed on credit watch, and if our credit ratings were to be further downgraded, or general market conditions were to ascribe higher risk to our credit rating levels, our industry or us, our access to capital and the cost of any debt financing would be negatively affected. In addition, the terms of future debt agreements could include more restrictive covenants, or require incremental collateral, which may further restrict our business operations. There is no guarantee that debt financings will be available in the future to fund our obligations, or that they will be available on terms consistent with our expectations. In addition, because of reduced travel demand, certain of our leased properties have or may not generate revenue sufficient to meet operating expenses, which may include rent due to the landlords of those properties. If or when we determine the value of our leased properties or the carrying value of other assets has significantly declined, we may recognize, as we did in 2020, significant non-cash impairment charges in our results of operations. Further, to the extent the COVID-19 pandemic significantly impacts spending patterns of Hilton Honors co-branded credit cardholders or the acquisition of new cardholders, we will receive lower license fees under our co-branded credit card arrangements.
The potential effects of the COVID-19 pandemic also could intensify or otherwise affect many of our other risk factors described below, including, but not limited to, risks inherent to the hospitality industry, macroeconomic factors beyond our control, such as challenges due to labor shortages and supply chain disruptions, competition for hotel guests and management and franchise contracts, risks related to doing business with third-party hotel owners, performance of our information technology systems, growth of reservation channels outside of our system, risks of doing business outside of the U.S. and risks related to our indebtedness. Because the COVID-19 situation is unprecedented and continuously evolving, the other potential impacts to our other risk factors below are uncertain.
Risks Related to Our Industry
We are subject to the business, financial and operating risks inherent to the hospitality industry, any of which could reduce our revenues and limit opportunities for growth.
Our business is subject to a number of business, financial and operating risks inherent to the hospitality industry, including:
•significant competition from multiple hospitality providers in all parts of the world;
•the financial condition of third-party property owners, developers and joint venture partners;
•relationships with third-party property owners, developers and joint venture partners, including the risk that owners may terminate our management, franchise or joint venture contracts;
•decreases in the frequency of business travel that may result from alternatives to in-person meetings, including virtual meetings hosted online or over private teleconferencing networks;
•changes in operating costs, including employee compensation and benefits, energy, insurance and food and beverage;
•increases in costs due to inflation or other factors that may not be fully offset by increases in revenues in our business, as well as increases in overall prices and the prices of our offerings due to inflation, which could weaken consumer demand for travel and the other products we offer and adversely affect our revenues;
•changes in taxes and governmental regulations that influence or set wages, prices, interest rates or construction and maintenance procedures and costs;
•the costs and administrative burdens associated with complying with applicable laws and regulations;
•the costs or desirability of complying with local practices and customs;
•significant increases in cost for health care coverage for employees and potential government regulation with respect to health care coverage;
•shortages of labor or labor disruptions;
•the ability of third-party internet and other travel intermediaries who sell our hotel rooms to guests to attract and retain customers;
•the quality of services provided by franchisees, including ability to comply with relevant requirements including environment, human rights and labor;
•the availability and cost of capital necessary for us and third-party hotel owners to fund investments, capital expenditures and service debt obligations;
•delays in or cancellations of planned or future development or refurbishment projects;
•cyclical over-building in the hospitality industry;
•changes in desirability of geographic regions of the hotels in our business, geographic concentration of our operations and customers and shortages of desirable locations for development;
•changes in the supply and demand for hotel services, including rooms, food and beverage and other products and services; and
•the costs required for climate change initiatives, including those resulting from regulatory changes or stakeholder or customer expectations.
Any of these factors could increase our costs or limit or reduce the prices we are able to charge for hospitality products and services, or otherwise affect our ability to maintain existing properties or develop new properties. As a result, any of these factors can reduce our revenues and limit opportunities for growth.
Macroeconomic and other factors beyond our control can adversely affect and reduce demand for our products and services.
Macroeconomic and other factors beyond our control can reduce demand for hospitality products and services, including demand for rooms at our hotels. These factors include, but are not limited to:
•changes in general economic conditions, including inflation, supply chain disruptions, low consumer confidence, increases in unemployment levels and depressed real estate prices resulting from the severity and duration of any downturn in the U.S. or global economy and financial markets;
•conditions that negatively shape public perception of travel or result in temporary closures or other disruption at our hotel properties, including travel-related accidents, outbreaks of pandemic or contagious diseases, such as COVID-19, Ebola, Zika, avian flu, severe acute respiratory syndrome ("SARS"), H1N1 (swine flu) and Middle East Respiratory Syndrome ("MERS");
•geo-political activity, political and social unrest and governmental action and uncertainty resulting from U.S. and global political and social trends and policies, including potential barriers to travel, trade and immigration;
•war, political instability or civil unrest, terrorist activities or threats and resulting heightened travel security measures, any of which may foreclose travel to certain locales or decrease the appeal of travel among the general population;
•decreased corporate or government travel-related budgets and spending, as well as cancellations, deferrals or renegotiations of group business, such as industry conventions;
•statements, actions or interventions by governmental officials related to travel and corporate travel-related activities and the resulting negative public perception of such travel and activities;
•the financial and general business condition of the airline, automotive and other transportation-related industries and its effect on travel, including decreased airline capacity and routes and increased travel costs;
•perceived negative impacts of tourism on local cultures, human rights and the environment;
•cyber-attacks;
•the impact of climate change or availability of natural resources;
•natural, climate-related or man-made disasters and extreme weather conditions, including earthquakes, tsunamis, tornadoes, hurricanes, typhoons, floods, wildfires, volcanic eruptions, oil spills and nuclear incidents;
•labor shortages, which could restrict our ability to efficiently operate or grow our business and/or increase our costs;
•organized labor activities, which could cause a diversion of business from hotels involved in labor negotiations and loss of business for our hotels generally as a result of certain labor tactics; and
•other changes in the overall demand for what we offer, including the desirability of particular locations or travel patterns of customers.
Any one or more of these factors could limit or reduce overall demand for our products and services or could negatively affect our revenue sources, which could adversely affect our business, financial condition and results of operations.
Contraction in the global economy or low levels of economic growth could adversely affect our revenues and profitability, as well as limit or slow our future growth.
Consumer demand for our services is closely linked to the performance of the general economy and is sensitive to business and personal discretionary spending levels. Decreased global or regional demand for hospitality products and services can be especially pronounced during periods of economic contraction or low levels of economic growth, and the recovery period in our industry may lag overall economic improvement. Declines in demand for our products and services due to general economic conditions could negatively affect our business by limiting the amount of fee revenues we are able to generate from our managed and franchised properties and decreasing the revenues and profitability of our owned and leased properties. In addition, many of the expenses associated with our business, including personnel costs, interest, rent, property taxes, insurance and utilities, are relatively fixed. During a period of overall economic weakness, if we are unable to meaningfully decrease these costs as demand for our hotels decreases, our business operations and financial performance and results may be adversely affected.
The hospitality industry is subject to seasonal and cyclical volatility, which may contribute to fluctuations in our results of operations and financial condition.
The hospitality industry is seasonal in nature. The periods during which our properties experience higher revenues vary from property to property, depending principally upon their location, type of property and competitive mix within the specific location and may change with changes in overall availability of lodging and hospitality options within a local market. Based on historical results, we generally expect our revenues to be lower in the first quarter of each year than in each of the three subsequent quarters, and this was the case in 2021, as our recovery from the effects of the COVID-19 pandemic progressed through the year as vaccines and treatments became more widely available. In addition, the hospitality industry is cyclical and demand generally follows the general economy on a lagged basis. The seasonality and cyclicality of our industry may contribute to fluctuations in our results of operations and financial condition.
Risks Related to Operating Our Business
Because we operate in a highly competitive industry, our revenues or profits could be harmed if we are unable to compete effectively.
The segments of the hospitality industry in which we operate are subject to intense competition. Our principal competitors are other operators of luxury, full-service and focused-service hotels, including other major hospitality chains with well-established and recognized brands. We also compete against smaller hotel chains, independent and local hotel owners and operators, home and apartment sharing services and timeshare operators. If we are unable to compete successfully, our revenues or profits may decline.
Competition for hotel guests
We face competition for individual guests, group reservations and conference business. We compete for these customers based primarily on brand name recognition and reputation, as well as location, rates for hotel rooms, food and beverage and other services, property size and availability of rooms and conference and meeting space, accommodations and technology, quality of the accommodations, customer satisfaction, amenities and the ability to earn and redeem loyalty program points. Our competitors may have greater commercial, financial and marketing resources and more efficient technology platforms, which could allow them to improve their properties and expand and improve their marketing efforts in ways that could affect our ability to compete for guests effectively, or they could offer a type of lodging product that customers find attractive but that we do not offer.
Competition for management and franchise contracts
We compete to enter into management and franchise contracts. Our ability to compete effectively is based primarily on the value and quality of our management services, brand name recognition and reputation, our access to and willingness to invest capital, availability of suitable properties in certain geographic areas, the overall economic terms of our contracts and the economic advantages to the property owner of retaining our management services and/or using our brands. If the properties that we manage or franchise perform less successfully than those of our competitors, if we are unable to offer terms as favorable as those offered by our competitors or if the availability of suitable properties is limited, we may not be able to compete effectively for new management or franchise contracts.
Any deterioration in the quality or reputation of our brands could have an adverse effect on our reputation, business, financial condition or results of operations.
Our brands and our reputation are among our most important assets. Our ability to attract and retain guests depends, in part, on the public recognition of our brands and their associated reputation. In addition, the success of our hotel owners’ businesses and the amount of payments to us for the assets and services we provide them may depend on the strength and reputation of our brands. If our brands become obsolete or consumers view them as unfashionable, unsustainable or lacking in consistency and quality, we may be unable to attract guests to our hotels, and may further be unable to attract or retain our hotel owners.
Changes in ownership or management practices, perceptions of our ESG practices, perception of guest or employee health or safety, the occurrence of accidents or injuries, cyber-attacks, security breaches, natural disasters, crime, failure of suppliers, franchisees or business partners to comply with relevant requirements (including environmental, human rights and labor requirements), individual guest, owner or employee notoriety or similar events at our hotels and resorts can harm our reputation, create adverse publicity and cause a loss of consumer confidence in our business. Because of the global nature of our brands and the broad expanse of our business and hotel locations, events occurring in one location could negatively affect the reputation and operations of otherwise successful individual locations. In addition, the expansion of social media has compounded the potential scope of negative publicity by increasing the speed and expanse of information dissemination. Many social media platforms publish content immediately and without filtering or verifying the accuracy of that content. A negative incident at one hotel could have far-reaching effects, including lost sales, customer boycotts, loss of development opportunities and employee difficulties. Such an incident also could subject us to legal actions, including litigation, governmental investigations or penalties, along with the resulting additional adverse publicity. A perceived decline in the quality of our brands or damage to our reputation could adversely affect our business, financial condition and results of operations.
Our business is subject to risks related to doing business with third-party property owners that could adversely affect our reputation, operational results or prospects for growth.
Unless we maintain good relationships with third-party hotel owners and renew or enter into new management and franchise contracts, we may be unable to maintain or expand our presence and our business, financial condition and results of operations may suffer.
Our business depends on our ability to: (i) establish and maintain long-term, positive relationships with third-party property owners and (ii) enter into new, and renew, management and franchise contracts. Although our management and franchise contracts are typically long-term arrangements, hotel owners may be able to terminate the contracts under certain circumstances, including the failure to meet specified financial or performance criteria. Our ability to meet these financial and performance criteria is subject to, among other things, risks common to the overall hospitality industry, including factors outside of our control. In addition, negative management and franchise pricing trends in the industry more broadly could adversely affect our ability to negotiate with hotel owners. If we fail to maintain and renew existing management and franchise contracts or enter into new contracts on favorable terms, we may be unable to expand our presence and our business, and our financial condition and results of operations may suffer.
Our business is subject to real estate investment risks for third-party owners that could adversely affect our operational results and our prospects for growth.
Growth of our business is affected, and may potentially be limited, by factors influencing real estate development generally, including site availability, financing, planning, zoning and other local approvals. In addition, market factors such as projected room occupancy, changes in growth in demand for customers compared to projected supply, geographic area restrictions in management and franchise contracts, costs and availability of construction labor and materials and anticipated room rate structure, if not managed effectively by our third-party owners could adversely affect the growth of our management and franchise business.
If our third-party property owners are unable to repay or refinance loans secured by properties, or to obtain financing adequate to fund current operations or growth plans, our revenues, profits and capital resources could be reduced and our business could be harmed.
Many of our third-party property owners pledged their properties as collateral for loans entered into at the time of development, purchase or refinancing. If our third-party property owners are unable to repay or refinance maturing indebtedness on favorable terms or at all, their lenders could declare a default, accelerate the related debt and repossess the property. While we maintain certain contractual protections, repossession could result in the termination of our management or franchise contract or eliminate revenues and cash flows from the property. In addition, the owners of managed and franchised hotels depend on financing to develop or buy and improve hotels and in some cases, fund operations during down cycles. Our hotel owners’ inability to obtain adequate funding could materially adversely affect the operation, maintenance and improvement plans of existing hotels, result in the delay or stoppage of the development of our existing development pipeline and limit additional development to further expand our hotel portfolio.
If our third-party property owners fail to make investments necessary to maintain or improve their properties, guest preference for Hilton brands, Hilton's reputation and performance results could suffer.
Substantially all of our management and franchise contracts, as well as our license agreement with HGV, require third-party property owners to comply with quality and reputation standards of our brands, which include requirements related to the physical condition, use of technology, safety standards and appearance of the properties, as well as the service levels provided by hotel employees. These standards may evolve with customer preference, or we may introduce new requirements over time. If our property owners fail to make investments necessary to maintain or improve the properties in accordance with our standards, or based on customer demand more broadly, guest preference for our brands could diminish. In addition, if third-party property owners fail to observe standards or meet their contractual requirements, we may elect to exercise our termination rights, which would eliminate revenues from these properties and cause us to incur expenses related to terminating these contracts. We may be unable to find suitable or offsetting replacements for any individually terminated hotels or broader third-party owner relationships.
Contractual and other disagreements with third-party property owners could make us liable to them or result in litigation costs or other expenses or termination of existing management or franchise contracts.
Our management and franchise contracts require us and our hotel owners to comply with operational and performance conditions that are subject to interpretation and could result in disagreements. Any dispute with a property owner could be very expensive for us, even if the outcome is ultimately in our favor. We cannot predict the outcome of any arbitration or litigation, the effect of any negative judgment against us or the amount of any settlement that we may enter into with any third party. Furthermore, specific to our industry, some courts have applied principles of agency law and related fiduciary standards to managers of third-party hotel properties, which means that property owners may assert the right to terminate contracts even where the contracts do not expressly provide for termination. Our fees from any terminated property would be eliminated, and accordingly, may negatively affect our results of operations.
Some of our existing development pipeline may not be developed into new hotels, which could materially adversely affect our growth prospects.
As of December 31, 2021, we had 2,668 hotels in our development pipeline, which we define as hotels under construction or approved for development under one of our brands. The commitments of owners and developers with whom we have contracts are subject to numerous conditions, and the eventual development and construction of our development pipeline, in particular for hotels not currently under construction, is subject to numerous risks, including, in certain cases, the owner's or developer's ability to obtain adequate financing and governmental or regulatory approvals. As a result, not every hotel in our development pipeline may develop into a new hotel that enters our system.
New hotel brands or non-hotel branded concepts that we launch in the future may not be as successful as we anticipate, which could have a material adverse effect on our business, financial condition or results of operations.
Since 2011, we have launched nine new brands: Home2 Suites by Hilton; Curio Collection by Hilton; Canopy by Hilton; Tru by Hilton; Tapestry Collection by Hilton; Motto by Hilton; LXR Hotels & Resorts; Signia by Hilton; and, most recently, Tempo by Hilton. We may continue to build our portfolio by launching new hotel and non-hotel brands in the future. In addition, the Hilton Garden Inn, DoubleTree by Hilton and Hampton by Hilton brands have been expanding into new jurisdictions outside the U.S. over the past several years. We may continue to expand existing brands into new international markets. New hotel products or concepts or brand expansions may not be accepted by hotel owners, franchisees or customers and we cannot guarantee the level of acceptance any new brand will have in the development and consumer marketplaces. If new branded hotel products, non-hotel branded concepts or brand expansions are not as successful as we anticipate, we may not recover the costs we incurred in their development or expansion, which could have a material adverse effect on our business, financial condition and results of operations.
The risks resulting from investments in owned and leased real estate could increase our costs, reduce our profits and limit our ability to respond to market conditions.
Our investments in owned and leased real property (including through joint ventures) subject us to various risks that may not be applicable to managed or franchised properties, including:
•governmental regulations relating to real estate ownership or operations, including tax, environmental, zoning and eminent domain laws;
•fluctuations or loss in value of real estate or potential impairments in the value of our assets, such as that which occurred in 2020 as a result of the COVID-19 pandemic, due to changes in market conditions in the area in which real estate or assets are located;
•increased potential civil liability for accidents or other occurrences on owned or leased properties;
•the ongoing need for capital improvements and expenditures funded by us to maintain or upgrade properties, some of which were constructed many years ago, and contractual requirements to deliver properties back to landlords in a particular state of repair and condition at the end of a lease term;
•construction delays, lack of availability of required construction materials or cost overruns (including labor and materials) related to necessary capital improvements of owned and leased properties;
•periodic total or partial closures due to renovations and facility improvements;
•risks associated with any mortgage debt, including the possibility of default, fluctuating interest rate levels and uncertainties in the availability of replacement financing;
•the inability to rebuild a property that has been damaged or destroyed by casualty, including a climate-related weather event, as a result of governmental regulations;
•the inability to renew our leases on favorable terms or at all;
•our limited ability to influence the decisions and operations of joint ventures in which we have a minority interest;
•force majeure events, including earthquakes, tornadoes, hurricanes, wildfires, floods, tsunamis, climate-related weather events, outbreaks of pandemic or contagious diseases or acts of terrorism;
•contingent liabilities that exist after we have exited a property;
•costs linked to the employment and management of staff to run and operate an owned or leased property; and
•the relative illiquidity of real estate compared to some other assets.
The negative effect on profitability and cash flow from declines in revenues is more pronounced in owned and leased properties because we, as the owner or lessee, bear the risk of the costs required to own and operate a hotel. Further, during times of economic distress, declining demand and declining earnings often result in declining asset values, and we may not be able to sell properties or exit leasing arrangements on favorable terms or at all. Accordingly, we may not be able to adjust our owned and leased property portfolio promptly in response to changes in economic or other conditions.
Failures in, material damage to or interruptions in our information technology systems, software or websites, including as a result of cyber-attacks on our systems or systems operated by third parties that provide operational and technical services to us, costs associated with protecting the integrity and security of personal data and other sensitive information and difficulties in updating our existing software or developing or implementing new software could have a material adverse effect on our business or results of operations.
We depend heavily upon our information technology systems in the conduct of our business. We develop, own and license or otherwise contract for sophisticated technology systems and services for property management, procurement, finance, human resources, reservations, distribution and the operation of the Hilton Honors guest loyalty program. Such systems are subject to, among other things, damage or interruption from power outages, computer and telecommunications failures, computer viruses, third-party criminal activity including "ransomware" or other malware and natural and man-made disasters. Although we have a cold disaster recovery site in a separate location and cloud backup processes to back up our core reservation, distribution and financial systems, our data center operations are currently located in a single facility or with a single cloud-based provider. Although we continue to renovate and migrate portions of our operations to cloud-based providers while simultaneously building and operating new applications and services with those cloud-based providers, any loss or damage to our primary physical or cloud-based facilities could result in operational disruption and data loss as we transfer production operations to our disaster recovery site or cloud providers. Damage or interruption to our information systems may require a significant investment to update, remediate or replace with alternate systems, and we may suffer interruptions in our operations as a result. In addition, costs and potential problems or interruptions associated with the implementation of new or upgraded systems and technology or with maintenance or support of existing systems could also disrupt or reduce the efficiency of our operations. Any material interruptions or failures in our systems, including those that may result from our failure to adequately develop, implement and maintain a robust disaster recovery plan and backup systems could severely affect our ability to conduct normal business operations and, as a result, have a material adverse effect on our business operations and financial performance.
We rely on third parties for the performance of a significant portion of our information technology functions worldwide. In particular, our loyalty platform and reservation and distribution system rely on data communications networks and systems operated by unaffiliated third parties and cloud providers. The success of our business depends in part on maintaining our relationships with these third parties and their continuing ability to perform these functions and services in a timely and satisfactory manner. If we experience a loss or disruption in the provision of any of these functions or services, or they are not performed in a satisfactory manner, we may have difficulty in finding alternate providers on terms favorable to us, in a timely manner or at all, and our business could be adversely affected.
We rely on certain software vendors to maintain and periodically upgrade many of these systems and applications so that they can continue to support our business. The software programs supporting many of our systems were licensed to us by independent software developers. The inability of these developers or us to continue to maintain and upgrade these information systems and software programs would disrupt or reduce the efficiency of our operations if we were unable to convert to alternate systems in an efficient and timely manner.
We are vulnerable to various risks and uncertainties associated with our websites and mobile applications, including changes in required technology interfaces, website and mobile application downtime and other technical failures, unexpected costs and changes and issues as we upgrade our website software and mobile applications. Additional risks include computer malware, changes in applicable federal, state and international regulations, security breaches, legal claims related to our website operations and e-commerce fulfillment and other consumer privacy concerns. Our failure to successfully respond to these risks and uncertainties could reduce website and mobile application sales and have a material adverse effect on our business or results of operations.
Cyber-attacks could have a disruptive effect on our business.
From time to time we and our third-party service providers experience cyber-attacks, attempted and actual breaches of our or their information technology systems and networks or similar events, which could result in a loss of sensitive business or customer information, systems interruption or the disruption of our operations. The techniques that are used to obtain unauthorized access, disable or degrade service or sabotage systems change frequently and may be difficult to detect for long periods of time, and despite our deployment of cyber-attack prevention and detection techniques, we are accordingly unable to anticipate and prevent all data security incidents. We have in the past been subject to cyber-attacks and expect that we will be subject to additional cyber-attacks in the future and may experience data breaches.
Even if we are fully compliant with legal standards and contractual or other requirements, we still may not be able to prevent security breaches involving sensitive data. The sophistication of efforts by hackers to gain unauthorized access to information systems has continued to increase in recent years and may continue to do so. Breaches, thefts, losses or fraudulent uses of customer, employee or company data could cause consumers to lose confidence in the security of our websites, mobile applications, point of sale systems and other information technology systems and, as a result of this loss in confidence, choose not to purchase from us. Such security breaches also could expose us to risks of data loss, business disruption, litigation, fines, regulatory charges and other costs or liabilities, any of which could adversely affect our business.
We are exposed to risks and costs associated with protecting the integrity and security of personal data and other sensitive information.
We are subject to various risks and costs associated with the collection, handling, storage and transmission of sensitive information, including costs related to compliance with U.S. and foreign data collection and privacy laws and other contractual obligations, as well as risks associated with the compromise of our systems collecting such information. Many jurisdictions, including the European Union ("E.U."), California and Nevada, have passed laws that require companies to meet specific requirements regarding the handling of personal data. We collect internal and customer data, including credit card numbers and other personally identifiable information for a variety of important business purposes, including managing our workforce, providing requested products and services and maintaining guest preferences to enhance customer service and for marketing and promotion purposes. We could be exposed to fines, penalties, restrictions, litigation, reputational harm or other expenses, or other adverse effects on our business, due to failure to protect personal data and other sensitive information or failure to maintain compliance with the various U.S. and foreign data collection and privacy laws or with credit card industry standards or other applicable data security standards.
In addition, U.S. states and the federal government have enacted additional laws and regulations to protect consumers against identity theft. These laws and similar laws in other jurisdictions have increased the costs of doing business, and failure on our part to implement appropriate safeguards or to detect and provide prompt notice of unauthorized access as required by some of these laws could subject us to potential claims for damages and other remedies. If we were required to pay any significant amounts in satisfaction of claims under these laws, or if we were forced to cease our business operations for any length of time as a result of our inability to comply fully with any such law, our business, operating results and financial condition could be adversely affected.
Failure to keep pace with developments in technology could adversely affect our operations or competitive position.
The hospitality industry demands the use of sophisticated technology and systems for property management, brand assurance and compliance, procurement, reservation systems, operation of our guest loyalty programs, distribution of hotel resources to current and future customers and guest amenities. These technologies may require refinements and upgrades, and third parties may cease support of systems that are currently in use. The development and maintenance of these technologies may require significant investment by us. As various systems and technologies become outdated or new technology is required, we may not be able to replace or introduce them as quickly as needed or in a cost-effective and timely manner. In some cases, hotel owners may refuse to upgrade systems or deploy new technology to replace aging or end-of-life software and/or hardware. As a result, our business operations could be disrupted and our competitive position could decline, adversely affecting our financial performance, or we may not achieve the benefits we may have been anticipating from any new technology or system.
Because third parties provide us with a number of operational and technical services, third-party security incidents could expose us to liability, harm our reputation, damage our competitiveness and adversely affect our financial performance.
Third parties provide us with certain operational and technical services. These third parties may have access to our systems, provide hosting services, or otherwise process data about us or our guests, employees or partners. Any third-party security incident could compromise the integrity or availability of or result in the theft of confidential or otherwise sensitive data, which could negatively impact our operations. Unauthorized access to data and other confidential or proprietary information may be obtained through break-ins, network breaches by unauthorized parties, employee theft or misuse, or other misconduct. We rely on the internal processes and controls of third-party software and application vendors to maintain the security of all software code provided to or used by Hilton. Should those vendors fail to follow security best practices to secure their products then we are at risk of unintentionally injecting malware into our systems via compromised software code they provide. The occurrence of any of the foregoing could negatively affect our reputation, our competitive position and our financial performance, and we could face lawsuits and potential liability.
Delays in service from third-party service providers could expose us to liability, harm our reputation, damage our competitiveness and adversely affect our financial performance.
From time to time, we may rely on a single or limited number of suppliers for the provision of various goods or services that we use in the operation of our business. The inability of such third parties to satisfy our or our guests' requirements could disrupt our business operations or make it more difficult for us to implement our business strategy. If any of these situations were to occur, our reputation could be harmed, we could be subject to third-party liability, including under data protection and privacy laws in certain jurisdictions, and our financial performance could be negatively affected.
We may seek to expand through acquisitions of and investments in other businesses and properties, or through alliances, and we may also seek to divest some of our properties and other assets. These acquisition and disposition activities may be unsuccessful or divert management’s attention.
We may consider strategic and complementary acquisitions of and investments in other hotel or hospitality brands, businesses, properties or other assets. Furthermore, we may pursue these opportunities in alliance with existing or prospective owners of managed or franchised hotels. In many cases, we could be competing for these opportunities with third parties that may have substantially greater financial resources than us. Acquisitions or investments in brands, businesses, properties or assets as well as third-party alliances may require us to issue additional shares of stock, incur debt, assume liabilities or incur additional expenses. In addition, the success of any acquisition or investment also will depend, in part, on our ability to integrate the acquisition or investment with our existing operations. If we divest properties or assets, such divestments may yield lower than expected returns or otherwise fail to achieve the benefits we expect. Finally, any acquisitions, investments or dispositions could demand significant attention from management that would otherwise be available for business operations, which could harm our business.
Failure to comply with marketing and advertising laws, including with regard to direct marketing, could result in fines or place restrictions on our business.
We rely on a variety of direct marketing techniques, including telemarketing, email and social media marketing and postal mailings, and we are subject to various laws and regulations in the U.S. and internationally that govern marketing and advertising practices. Any further restrictions in laws and court or agency interpretations of such laws, such as the Telephone Consumer Protection Act of 1991, the Telemarketing Sales Rule, CAN-SPAM Act of 2003, and various U.S. state laws, new laws or international data protection laws, such as the E.U. General Data Protection Regulation ("GDPR"), that govern these activities could adversely affect current or planned marketing activities and cause us to change our marketing strategy. If this
occurs, we may not be able to develop adequate alternative marketing strategies, which could affect our ability to maintain relationships with our customers and acquire new customers. We also obtain access to names of potential customers from travel service providers or other companies, and we market to some individuals on these lists directly or through other companies’ marketing materials. If access to these lists were prohibited or otherwise restricted, our ability to develop new customers and introduce them to products could be impaired.
The growth of internet reservation channels could adversely affect our business and profitability.
A significant percentage of hotel rooms for individual guests are booked through internet travel intermediaries, to whom we commit to pay various commissions and transaction fees for sales of our rooms through their systems. Search engines and peer-to-peer inventory sources also provide online travel services that compete with our business. If these bookings increase, these hospitality intermediaries may be able to obtain higher commissions or other significant concessions from us or our franchisees. These hospitality intermediaries also may reduce bookings at our hotel properties by de-ranking our hotels in search results on their platforms, and other online providers may divert business away from our hotels. Although our contracts with many hospitality intermediaries limit transaction fees for hotels, there can be no assurance that we will be able to renegotiate these contracts upon their expiration with terms as favorable as the provisions that existed before the expiration, replacement or renegotiation. Moreover, hospitality intermediaries generally employ aggressive marketing strategies, including expending significant resources for online and television advertising campaigns to drive consumers to their websites. As a result, consumers may develop brand loyalties to the intermediaries’ brands, websites and reservations systems rather than to the Hilton brands and systems. If this happens, our business and profitability may be significantly affected over time as shifting customer loyalties divert bookings away from our websites, which increases costs to hotels in our system. Internet travel intermediaries also have been subject to regulatory scrutiny, particularly in Europe. The outcome of this regulatory activity may affect our ability to compete for direct bookings through our own internet channels.
In addition, although internet travel intermediaries have traditionally competed to attract individual leisure consumers or "transient" business rather than "group" business for meetings and events, in recent years they have expanded their business to include marketing to group business and also to corporate transient business. If that growth continues, it could both divert group and corporate transient business away from our hotels and also increase our cost of sales for group and corporate transient business. Consolidation of internet travel intermediaries, or the entry of major internet companies into the internet travel bookings business, also could divert bookings away from our websites and increase our hotels' cost of sales.
Our reservation system is an important component of our business operations and a disruption to its functioning could have an adverse effect on our performance and results.
We manage a global reservation system that communicates reservations to our branded hotels when made by individuals directly, either online, by telephone to our call centers, through devices via our mobile application, or through intermediaries like travel agents, internet travel websites and other distribution channels. The cost, speed, efficacy and efficiency of the reservation system are important aspects of our business and are important considerations of hotel owners in choosing to affiliate with our brands. Any disruption to the continuity of our reservation system, including any failure to maintain or upgrade such system, may adversely affect our ability to serve customers effectively and support reservations at our hotels.
The cessation, reduction or taxation of program benefits of our Hilton Honors guest loyalty program could adversely affect the Hilton brands and guest loyalty.
We manage the Hilton Honors guest loyalty program for all of the brands that we operate. Program members accumulate points primarily based on eligible stays and hotel charges and redeem the points for a range of benefits including free rooms and other items of value. The program is an important aspect of our business and of the affiliation value for hotel owners under management and franchise contracts. System hotels, including, without limitation, third-party hotels under management and franchise contracts, contribute a percentage of the charges incurred by members of the loyalty program for each stay of a program member. In addition to the accumulation of points for future hotel stays at our brands, Hilton Honors arranges with third parties, such as airlines, other transportation services, online vendors, retailers and credit card companies, to sell Hilton Honors points for the use of their customers and/or to allow Hilton Honors members to use or exchange points for products or services made available to loyalty program members by those third parties. Currently, the program benefits are not taxed as income to members. If the program awards and benefits are materially altered, curtailed or taxed such that a material number of Hilton Honors members choose to no longer participate in the program, this could adversely affect our business.
Because we derive a portion of our revenues from operations outside the U.S., the risks of doing business internationally could lower our revenues, increase our costs, reduce our profits or disrupt our business.
We currently manage, franchise, own or lease hotels and resorts in 122 countries and territories around the world. Our rooms outside the U.S. represented approximately 30 percent, 28 percent and 28 percent of our system-wide rooms for the years ended December 31, 2021, 2020 and 2019, respectively. We expect that our international operations will continue to account for a material portion of our results. As a result, we are subject to the risks of doing business outside the U.S., including:
•rapid changes in governmental, economic or political policy, political or civil unrest, acts of terrorism or the threat of international boycotts or U.S. anti-boycott legislation;
•increases in anti-American sentiment and the identification of our licensed brands as an American brand;
•recessionary trends or economic instability in international markets;
•changes in foreign currency exchange rates or currency restructurings and hyperinflation or deflation in the countries in which we operate;
•the effect of disruptions, including the temporary closure of hotel properties, caused by severe weather or climate-related events, natural disasters (including as a result of climate change), outbreak of disease, such as COVID-19, or other events that make travel to a particular region less attractive or more difficult;
•the presence and acceptance of varying levels of business corruption in international markets and the effect of various anti-corruption and other laws;
•
•the imposition of restrictions on currency conversion or the transfer of funds or limitations on our ability to repatriate non-U.S. earnings in a tax-efficient manner;
•the ability to comply with or the effect of complying with complex and changing laws, regulations and policies of foreign governments that may affect investments or operations, including foreign ownership restrictions, import and export controls, tariffs, embargoes, increases in taxes paid and other changes in applicable tax laws;
•the ability to comply with or the effect of complying with developing laws, regulations and policies of foreign governments with respect to human rights, including in the supply chain;
•instability or changes in a country's or region's economic, regulatory or political conditions, including inflation, recession, interest rate fluctuations and actual or anticipated military or political conflicts or any other change;
•political, economic and other uncertainty resulting from the U.K.'s exit from the E.U. (commonly known as "Brexit"), the terms of which could adversely affect our business;
•uncertainties as to local laws regarding, and enforcement of, contract and IP rights;
•forced nationalization of our properties by local, state or national governments; and
•the difficulties involved in managing an organization doing business in many different countries.
These factors may adversely affect the revenues earned from our hotels and resorts (as well as the market value of properties that we own or lease) located in international markets. While these factors and the effect of these factors are difficult to predict, any one or more of them could lower our revenues, increase our costs, reduce our profits or disrupt our business operations.
Failure to comply with laws and regulations applicable to our international operations may increase costs, reduce profits, limit growth or subject us to broader liability.
Our business operations in countries outside the U.S. are subject to a number of laws and regulations, including restrictions imposed by the Foreign Corrupt Practices Act ("FCPA"), as well as trade sanctions administered by the Office of Foreign Assets Control ("OFAC"). Although we have policies in place designed to comply with applicable sanctions, rules and
regulations, it is possible that hotels we manage or own in the countries and territories in which we operate may provide services to or receive funds from persons subject to sanctions. Where we have identified potential violations in the past, we have taken appropriate remedial action including filing voluntary disclosures to OFAC. In addition, some of our operations may be subject to the laws and regulations of non-U.S. jurisdictions, including the U.K.’s Bribery Act 2010, which contains significant prohibitions on bribery and other corrupt business activities, and other local anti-corruption laws in the countries and territories in which we conduct operations.
If we fail to comply with these laws and regulations, we could be exposed to claims for damages, financial penalties, reputational harm and incarceration of employees or restrictions on our operation or ownership of hotels and other properties, including the termination of management, franchising and ownership rights. In addition, in certain circumstances, the actions of parties affiliated with us (including our owners, joint venture partners, employees and agents) may expose us to liability under the FCPA, U.S. sanctions or other laws. These restrictions could increase costs of operations, reduce profits or cause us to forgo development opportunities that would otherwise support growth.
The Iran Threat Reduction and Syria Human Rights Act of 2012 ("ITRSHRA") amended the Exchange Act to require SEC-reporting companies to disclose in their periodic reports specified dealings or transactions involving Iran or other individuals and entities targeted by certain OFAC sanctions engaged in by the reporting company or any of its affiliates. Under ITRSHRA, we are required to report if we or any of our "affiliates" knowingly engaged in certain specified activities during a period covered by one of our Annual Reports on Form 10-K or Quarterly Reports on Form 10-Q. We have engaged in, and may in the future engage in, activities that would require disclosure pursuant to Section 219 of ITRSHRA. Disclosure of such activities, even if such activities are permissible under applicable law, and any sanctions imposed on us or our affiliates as a result of these activities, could harm our reputation and brands and have a negative effect on our results of operations.
In addition, we are subject to a number of modern slavery, human trafficking and forced labor reporting, training and due diligence laws in various jurisdictions and expect additional statutory regimes to combat these crimes to be enacted in the future. The impact of laws, such as the U.K's Modern Slavery Act 2015, Australia's Modern Slavery Bill 2018, and similar legislation on hotel operations, as well as supply chain, could increase costs of operations and reduce profits.
Collective bargaining activity could disrupt our operations, increase our labor costs or interfere with the ability of our management to focus on executing our business strategies.
A significant number of our employees (approximately 30 percent) and employees of our hotel owners are covered by collective bargaining agreements and similar agreements. If relationships with our employees or employees of our hotel owners or the unions that represent them become adverse, the properties we manage, franchise, own or lease could experience labor disruptions such as strikes, lockouts, boycotts and public demonstrations. A number of our collective bargaining agreements are in the process of being renegotiated, and, if more employees become unionized, we may be required to negotiate additional collective bargaining agreements in the future. Labor disputes, which may be more likely when collective bargaining agreements are being negotiated, could harm our relationship with our employees or employees of our hotel owners, result in increased regulatory inquiries and enforcement by governmental authorities and deter guests. Further, adverse publicity related to a labor dispute could harm our reputation and reduce customer demand for our services. Labor regulation and the negotiation of new or existing collective bargaining agreements could lead to higher wage and benefit costs, changes in work rules that raise operating expenses, legal costs and limitations on our ability or the ability of our third-party property owners to take cost saving measures during economic downturns. We do not have the ability to influence the negotiations of collective bargaining agreements covering unionized labor employed by third-party property owners. Increased unionization of our workforce, new labor legislation or changes in regulations could disrupt our operations and our ability to promote services expected by customers, reduce our profitability or interfere with the ability of our management to focus on executing our business strategies.
Labor shortages could restrict our ability to operate our properties or grow our business or result in increased labor costs that could adversely affect our results of operations.
Our success depends in large part on our ability to attract, retain, train, manage and engage employees. The COVID-19 pandemic has negatively affected the labor market for employers. Labor shortages have affected the ability of our hotels to hire or re-hire employees during the ongoing recovery from the downturn caused by the pandemic. Among the factors causing the labor shortages are the relative reduced appeal of working in the hospitality industry in a downturn, alternatives available in other industries and perceived health and safety concerns. We employ or manage approximately 142,000 individuals at our managed, owned and leased hotels and corporate offices around the world. If we are unable to attract, retain, train, manage and engage skilled individuals, our ability to staff and operate the hotels that we manage, own and lease could be diminished, which could reduce customer satisfaction, and our ability to manage our corporate business could be adversely affected. In addition,
the inability of our franchisees to attract, retain, train, manage and engage skilled employees for the franchised hotels could adversely affect the reputation of our brands. Staffing shortages in various parts of the world also could hinder our ability to grow and expand our businesses. Because payroll costs are a major component of the operating expenses at our owned, leased and managed hotels, as well as our franchised hotels, a shortage of skilled labor could also require higher wages that would increase labor costs, which could adversely affect our results of operations and the results of hotels that we manage on behalf of third-party owners. Additionally, an increase in minimum wage rates could increase costs and reduce profits for us and our franchisees, which could, in turn, lower demand from third-party owners to add hotels to our system. We also face challenges with respect to retaining corporate employees. If we lost the services of one or more senior executives, this could adversely affect strategic relationships, including relationships with third-party property owners, significant customers, joint venture partners and vendors, and limit our ability to execute our business strategies.
Any failure to protect our trademarks and other IP could reduce the value of the Hilton brands and harm our business.
The recognition and reputation of our brands are important to our success. We have a significant number of trademark registrations in jurisdictions around the world for use in connection with our services, plus at any given time, a number of pending applications for trademarks and other IP. However, those trademark or other IP registrations may not be granted or the steps we take to use, control or protect our trademarks or other IP in the U.S. and other jurisdictions may not always be adequate to prevent third parties from copying or using the trademarks or other IP without authorization. We may also fail to obtain and maintain trademark protection for all of our brands in all jurisdictions. For example, in certain jurisdictions, third parties have registered or otherwise have the right to use certain trademarks that are the same as or similar to our trademarks, which could prevent us from registering trademarks and opening hotels in those jurisdictions. Third parties may also challenge our rights to certain trademarks or oppose our trademark applications. Defending against any such proceedings may be costly, and if unsuccessful, could result in the loss of important IP rights. Obtaining and maintaining trademark protection for multiple brands in multiple jurisdictions is also expensive, and we may therefore elect not to apply for or to maintain certain trademarks.
Our IP is also vulnerable to unauthorized copying or use in some jurisdictions outside the U.S., where local law, or lax enforcement of law, may not provide adequate protection. If our trademarks or other IP are improperly used, the value and reputation of the Hilton brands could be harmed. There are times where we may need to resort to litigation to enforce our IP rights. Litigation of this type could be unsuccessful, costly, force us to divert our resources, lead to counterclaims or other claims against us or otherwise harm our business or reputation. In addition, we license certain of our trademarks to third parties. For example, we have granted HGV the right to use certain of our IP in its timeshare business and we grant our franchisees a right to use certain of our IP in connection with their operation of the applicable property. If HGV, a franchisee or other licensee fails to maintain the quality of the goods and services used in connection with the licensed trademarks, our rights to, and the value of, our trademarks could be harmed. Failure to maintain, control and protect our trademarks and other IP could likely adversely affect our ability to attract guests or third-party owners, and could adversely affect our results.
In addition, we license the right to use certain IP from unaffiliated third parties, including the right to grant sublicenses to franchisees. If we are unable to use this IP, our ability to generate revenue from such properties may be diminished.
Third-party claims that we infringe IP rights of others could subject us to damages and other costs and expenses.
Third parties may make claims against us for infringing their patent, trademark, copyright or other IP rights or for misappropriating their trade secrets. We have been and are currently party to a number of such claims and may receive additional claims in the future. Any such claims, even those without merit, could:
•be expensive and time consuming to defend, and result in significant damages;
•force us to stop using the IP that is being challenged or to stop providing products or services that use the challenged IP;
•force us to redesign or rebrand our products or services;
•require us to enter into royalty, licensing, co-existence or other contracts to obtain the right to use a third party’s IP;
•limit our ability to develop new IP; and
•limit the use or the scope of our IP or other rights.
In addition, we may be required to indemnify third-party owners of the hotels that we manage for any losses they incur as a result of any infringement claims against them. All necessary royalty, licensing or other contracts may not be available to us on acceptable terms. Any adverse results associated with third-party IP claims could negatively affect our business.
Exchange rate fluctuations and foreign exchange hedging arrangements could result in significant foreign currency gains and losses that affect our business results.
Conducting business in currencies other than the U.S. dollar ("USD") subjects us to fluctuations in currency exchange rates that could have a negative effect on our financial results. We earn revenues and incur expenses in foreign currencies as part of our operations outside of the U.S. As a result, fluctuations in currency exchange rates may significantly increase the amount of USD required for foreign currency expenses or significantly decrease the USD received from foreign currency revenues. We also have exposure to currency translation risk because, generally, the results of our business outside of the USD are reported in local currency and then translated to USD for inclusion in our consolidated financial statements. As a result, changes between the foreign exchange rates and the USD will affect the recorded amounts of our foreign assets, liabilities, revenues and expenses and could have a negative effect on our financial results. Our exposure to foreign currency exchange rate fluctuations will grow if the relative contribution of our operations outside the U.S. increases.
To mitigate foreign currency exposure, we may enter into foreign exchange derivatives with financial institutions. However, these derivatives may not eliminate foreign currency risk entirely and involve costs and risks of their own in the form of transaction costs, credit requirements, interest rate differentials and counterparty risk.
If the insurance that we or our owners carry does not sufficiently cover damage or other potential losses or liabilities to third parties involving properties that we manage, franchise, own or lease, our profits could be reduced.
We operate in certain areas where the risk of natural or climate-related disaster or other catastrophic losses exists, and the occasional incidence of such an event could cause substantial damage to us, our owners or the surrounding area. We carry, and/or we require our owners to carry, insurance from solvent insurance carriers that we believe is adequate for foreseeable first-party and third-party losses and with terms and conditions that are reasonable and customary. Nevertheless, market forces beyond our control, such as the natural, climate-related and man-made disasters and infectious diseases that occurred in 2021, could limit the scope of the insurance coverage that we and our owners can obtain or may otherwise restrict our or our owners' ability to buy insurance coverage at reasonable rates. We anticipate increased costs of property, general liability and excess liability insurance across the portfolio in 2022 due to the significant losses that insurers suffered globally in 2021 and prior periods. In the event of a substantial loss, the insurance coverage that we and/or our owners carry may not be sufficient to pay the full value of our financial obligations, our liabilities or the replacement cost of any lost investment or property. Additionally, certain types of losses may be uninsurable or prohibitively expensive to insure. In addition, other types of losses or risks that we may face could fall outside of the general coverage terms and limits of our policies. The U.S. Terrorism Risk Insurance Program (the "Program") provides insurance capacity for terrorist acts and is currently authorized through December 31, 2027. If the Program is not extended or renewed upon its expiration in 2027, or if there are changes to the Program that would negatively affect insurance carriers, premiums for terrorism insurance coverage will likely increase and/or the terms of such insurance may be materially amended to increase stated exclusions or to otherwise effectively decrease the scope of coverage available, perhaps to the point where it is effectively unavailable.
In some cases, these factors could result in certain losses being completely uninsured. As a result, we or owners of hotels that we manage or franchise could lose some or all of the capital we have invested in a property, as well as the anticipated future revenues, profits, management fees or franchise fees from the property.
Legal and Regulatory Risks
Governmental regulation may adversely affect the operation of our properties.
In many jurisdictions, the hospitality industry is subject to extensive foreign or U.S. federal, state and local governmental regulations, including those relating to the service of alcoholic beverages, the preparation and sale of food and those relating to building and zoning requirements. We are also subject to licensing and regulation by foreign or U.S. state and local departments relating to health, sanitation, fire and safety standards, and to laws governing our relationships with employees, including minimum wage requirements, overtime, working conditions status and citizenship requirements. These requirements are complex and subject to frequent revision, with changes at the U.S. federal level often accompanying new U.S. presidential administrations. We or our third-party owners may be required to expend funds to meet foreign or U.S. federal, state and local regulations in connection with the construction, continued operation or remodeling of certain of our properties. The failure to
meet the requirements of applicable regulations and licensing requirements, or publicity resulting from actual or alleged failures, could have an adverse effect on our results of operations. For instance, in 2010, we entered into a settlement with the U.S. Department of Justice related to compliance with the Americans with Disabilities Act ("ADA"). Although the bulk of our obligations under this settlement expired in 2015, certain managed and franchised hotels remain under an obligation to remove architectural barriers at their facilities through March 15, 2022. We have an obligation to have an independent consultant to monitor those barrier removal efforts during this period. If we fail to comply with any of the requirements of the ADA, we could be subject to fines, penalties, injunctive action, reputational harm, guest, advocacy group or employee lawsuits, and other business effects that could materially and negatively affect our performance and results of operations.
Changes in U.S. federal, state and local or foreign tax law, interpretations of existing tax law or adverse determinations by tax authorities, could increase our tax burden or otherwise adversely affect our financial condition or results of operations.
We are subject to taxation at the federal, state or provincial and local levels in the U.S. and various other countries and jurisdictions. Our future effective tax rate could be affected by changes in the composition of earnings in jurisdictions with differing tax rates, changes in statutory rates and other legislative changes, changes in the valuation of our deferred tax assets and liabilities, or changes in determinations regarding the jurisdictions in which we are subject to tax. From time to time, the U.S. federal, state and local and foreign governments make substantive changes to tax rules and their application, which could result in materially higher corporate taxes than would be incurred under existing tax law and could adversely affect our financial condition or results of operations.
We are subject to ongoing and periodic tax audits and disputes in U.S. federal and various state, local and foreign jurisdictions. In particular, our consolidated U.S. federal income tax returns for the fiscal years ended December 31, 2011 through December 31, 2018 are actively under audit by the Internal Revenue Service ("IRS"). The IRS has previously proposed material increases to our income tax liability related to our Hilton Honors guest loyalty program through the tax year ended December 31, 2013, which we tentatively settled during 2021. The taxation of the Hilton Honors program continues to be subject to audit. We may in the future be assessed tax on issues similar to those which were resolved during 2021, and the amounts of any such future assessments may be material. An unfavorable outcome from any tax audit could result in higher tax costs, penalties and interest, thereby adversely affecting our financial condition or results of operations.
Foreign or U.S. environmental laws and regulations may cause us to incur substantial costs or subject us to potential liabilities.
We are subject to certain compliance costs and potential liabilities under various foreign and U.S. federal, state and local environmental, health and safety laws and regulations. These laws and regulations govern actions including air emissions, the use, storage and disposal of hazardous and toxic substances and wastewater disposal. Our failure to comply with such laws, including obtaining and maintaining any required permits or licenses, could result in substantial fines or possible revocation of our authority to conduct some of our operations. We could also be liable under such laws for the costs of investigation, removal or remediation of hazardous or toxic substances at our currently or formerly owned, leased or operated real property (including managed and franchised properties) or at third-party locations in connection with our waste disposal operations, regardless of whether or not we knew of, or caused, the presence or release of such substances. From time to time, we may be required to remediate such substances or remove, abate or manage asbestos, mold, radon gas, lead or other hazardous conditions at our properties. The presence or release of such toxic or hazardous substances could result in third-party claims for personal injury, property or natural resource damages, business interruption or other losses. Such claims and the need to investigate, remediate or otherwise address hazardous, toxic or unsafe conditions could adversely affect our operations, the value of any affected real property, or our ability to sell, lease or assign our rights in any such property, or could otherwise harm our business or reputation. Environmental, health and safety requirements have also become increasingly stringent, and our costs to comply with such requirements may increase as a result. New or revised laws and regulations or new interpretations of existing laws and regulations, such as those intended to lessen the impact of climate change, could affect the operation of our properties or result in significant additional expense and operating restrictions on us.
We are subject to risks from litigation filed by or against us.
Legal or governmental proceedings brought by or on behalf of franchisees, third-party owners of managed properties and landlords at leased properties, employees or customers may adversely affect our financial results. In recent years, we and other hospitality companies have been subject to lawsuits, including class action lawsuits, alleging violations of federal laws and regulations regarding workplace and employment matters, consumer protection claims and other commercial matters. A number of these lawsuits have resulted in the payment of substantial damages by the defendants. Similar lawsuits have been and may be instituted against us from time to time, and we may incur substantial damages and expenses resulting from lawsuits of this type,
which could have a material adverse effect on our business. At any given time, we may be engaged in lawsuits or disputes involving third-party owners of our hotels. Similarly, we may from time to time institute legal proceedings on behalf of ourselves or others, the ultimate outcome of which could cause us to incur substantial damages and expenses, which could have a material adverse effect on our business.
Risks Related to Our Spin-offs
The spin-offs could result in substantial tax liability to us and our stockholders.
We received a private letter ruling from the IRS on certain issues relevant to qualification of the spin-offs as tax-free distributions under Section 355 of the Internal Revenue Code of 1986, as amended (the "Code"). Although the private letter ruling generally is binding on the IRS, the continued validity of the private letter ruling will be based upon and subject to the accuracy of factual statements and representations made to the IRS by us. Further, the private letter ruling is limited to specified aspects of the spin-offs under Section 355 of the Code and does not represent a determination by the IRS that all of the requirements necessary to obtain tax-free treatment to holders of our common stock and to us have been satisfied. Moreover, if any statement or representation upon which the private letter ruling was based was incorrect or untrue in any material respect, or if the facts upon which the private letter ruling was based were materially different from the facts that prevailed at the time of the spin-offs, the private letter ruling could be invalidated. The opinion of tax counsel we received in connection with the spin-offs regarding the qualification of the spin-offs as tax-free distributions under Section 355 of the Code similarly relied on, among other things, the continuing validity of the private letter ruling and various assumptions and representations as to factual matters made by each of the spun-off companies and us which, if inaccurate or incomplete in any material respect, would jeopardize the conclusions reached by counsel in its opinion. The opinion is not binding on the IRS or the courts, and there can be no assurance that the IRS or the courts will not challenge the conclusions stated in the opinion or that any such challenge would not prevail. Additionally, recently enacted legislation denies tax-free treatment to a spin-off in which either the distributing corporation or the spun-off corporation is a REIT and prevents a distributing corporation or a spun-off corporation from electing REIT status for a 10-year period following a tax-free spin-off. Under an effective date provision, the legislation does not apply to distributions described in a ruling request initially submitted to the IRS before December 7, 2015. Because our initial request for the private letter ruling was submitted before that date and because we believe the distribution has been described in that initial request, we believe the legislation does not apply to the spin-off of Park. However, no ruling was obtained on that issue and thus no assurance can be given in that regard. In particular, the IRS or a court could disagree with our view regarding the effective date provision based on any differences that exist between the description in the ruling request and the actual facts relating to the spin-offs. If the legislation applied to the spin-off of Park, either the spin-off would not qualify for tax-free treatment or Park would not be eligible to elect REIT status for a 10-year period following the spin-off.
If the spin-offs and certain related transactions were determined to be taxable, the Company would be subject to a substantial tax liability that would have a material adverse effect on our financial condition, results of operations and cash flows. In addition, if the spin-offs were taxable, each holder of our common stock who received shares of Park and HGV would generally be treated as receiving a taxable distribution of property in an amount equal to the fair market value of the shares received.
Park or HGV may fail to perform under various transaction agreements that we executed as part of the spin-offs.
In connection with the spin-offs, we, Park and HGV entered into a distribution agreement and various other agreements, including a tax matters agreement, and, as to Park, management agreements, and, as to HGV, a license agreement. We are relying on Park and HGV to satisfy their performance and payment obligations under these agreements. In addition, it is possible that a court would disregard the allocation agreed to between us, Park and HGV and require that we assume responsibility for certain obligations allocated to Park and to HGV, particularly if Park or HGV were to refuse or were unable to pay or perform such obligations. In connection with the spin-offs, each of Park and HGV indemnified us with respect to such parties’ assumed or retained liabilities pursuant to the distribution agreement and breaches of the distribution agreement or other agreements related to the spin-offs. There can be no assurance that the indemnities from each of Park and HGV will be sufficient to protect us against the full amount of these and other liabilities. Third parties also could seek to hold us responsible for any of the liabilities that Park and HGV have agreed to assume. Even if we ultimately succeed in recovering from Park or HGV any amounts for which we are held liable, we may be temporarily required to bear those losses ourselves. Each of these risks could negatively affect our business, financial condition, results of operations and cash flows. In addition, we agreed to indemnify each of Park and HGV from certain liabilities. Indemnities that we may be required to provide Park and/or HGV may be significant and could negatively affect our business.
Risks Related to Our Indebtedness
Our substantial indebtedness and other contractual obligations could adversely affect our financial condition, our ability to raise additional capital to fund our operations, our ability to operate our business, our ability to react to changes in the economy or our industry and our ability to pay our debts, and could divert our cash flow from operations for debt payments.
We have a significant amount of indebtedness. As of December 31, 2021, our total indebtedness, excluding unamortized deferred financing costs and discount, was approximately $8.9 billion, and our contractual debt maturities of our long-term debt for the years ending December 31, 2022, 2023 and 2024 are $54 million, $26 million and $26 million, respectively. Our substantial debt and other contractual obligations could have important consequences, including:
•requiring a substantial portion of cash flow from operations to be dedicated to the payment of principal and interest on our indebtedness, thereby reducing our ability to use our cash flow to fund our operations, capital expenditures or dividends to stockholders and to pursue future business opportunities;
•increasing our vulnerability to adverse economic, industry or competitive developments;
•exposing us to increased interest expense, as our degree of leverage may cause the interest rates of any future indebtedness (whether fixed or floating rate interest) to be higher than they would be otherwise;
•exposing us to the risk of increased interest rates because certain of our indebtedness is at variable rates of interest;
•making it more difficult for us to satisfy our obligations with respect to our indebtedness, and any failure to comply with the obligations of any of our debt instruments, including restrictive covenants, could result in an event of default that accelerates our obligation to repay indebtedness;
•restricting us from making strategic acquisitions or causing us to make non-strategic divestitures;
•limiting our ability to obtain additional financing for working capital, capital expenditures, product development, satisfaction of existing debt service requirements, acquisitions and general corporate or other purposes; and
•limiting our flexibility in planning for, or reacting to, changes in our business or market conditions and placing us at a competitive disadvantage compared to our competitors who may be better positioned to take advantage of opportunities that our leverage prevents us from exploiting.
In addition, certain of our variable rate indebtedness uses London Interbank Offer Rate ("LIBOR") as a benchmark for establishing the rate of interest and may be hedged with LIBOR-based interest rate derivatives. On March 5, 2021, the U.K.’s Financial Conduct Authority, which regulates LIBOR, announced that all LIBOR settings will either cease to be provided by any administrator or no longer be representative: (a) immediately after December 31, 2021, in the case of the one week and two month USD settings; and (b) immediately after June 30, 2023, in the case of the remaining USD settings. The U.S. Federal Reserve (the "Federal Reserve") has also advised banks to cease entering into new contracts that use USD LIBOR as a reference rate. While all of our material financing arrangements indexed to LIBOR provide procedures for determining an alternative base rate in the event that LIBOR is discontinued, there can be no assurances as to whether such alternative base rate will be more or less favorable than LIBOR. The Federal Reserve, in conjunction with the Alternative Reference Rate Committee, a committee convened by the Federal Reserve that includes major market participants, has identified the Secured Overnight Financing Rate (“SOFR”), a new index calculated by short-term repurchase agreements, backed by U.S. Treasury securities, as its preferred alternative rate for LIBOR. At this time, it is not possible to predict how markets will respond to SOFR or other alternative reference rates as the transition away from the LIBOR benchmarks is anticipated in coming years. We intend to monitor developments with respect to the phasing out of LIBOR and will work to minimize the impact of any LIBOR transition. The consequences of these developments cannot be entirely predicted, but could include an increase in the cost of our variable rate indebtedness.
We are a holding company, and substantially all of our consolidated assets are owned by, and most of our business is conducted through, our subsidiaries. Revenues from these subsidiaries are our primary source of funds for debt payments and operating expenses. If our subsidiaries are restricted from making distributions to us, that may impair our ability to meet our debt service obligations or otherwise fund our operations. Moreover, there may be restrictions on payments by subsidiaries to their parent companies under applicable laws, including laws that require companies to maintain minimum amounts of capital
and to make payments to stockholders only from profits. As a result, although a subsidiary of ours may have cash, we may not be able to obtain that cash to satisfy our obligation to service our outstanding debt or fund our operations.
Certain of our debt agreements impose significant operating and financial restrictions on us and our subsidiaries, which may prevent us from capitalizing on business opportunities.
The indentures that govern our senior notes and the credit agreement that governs our senior secured credit facilities impose significant operating and financial restrictions on us. These restrictions limit our ability and/or the ability of our subsidiaries to, among other things:
•incur or guarantee additional debt or issue disqualified stock or preferred stock;
•pay dividends, including our subsidiaries paying dividends to us, and make other distributions on, or redeem or repurchase, capital stock;
•make certain investments;
•incur certain liens;
•enter into transactions with affiliates;
•merge or consolidate;
•enter into agreements that restrict the ability of restricted subsidiaries to make dividends or other payments to us;
•designate restricted subsidiaries as unrestricted subsidiaries; and
•transfer or sell assets.
In addition, the credit agreement requires us to maintain a consolidated secured net leverage ratio not to exceed 5.0 to 1.0 as of the last day of any period of four consecutive quarters.
As a result of these restrictions, we are limited as to how we conduct our business and we may be unable to raise additional debt or equity financing to compete effectively or to take advantage of new business opportunities. The terms of any future indebtedness we may incur could include more restrictive covenants. We may not be able to maintain compliance with these covenants in the future and, if we fail to do so, we may not be able to obtain waivers from the lenders and/or amend the covenants.
Our failure to comply with the restrictive covenants described above, as well as other terms of our other indebtedness and/or the terms of any future indebtedness from time to time, could result in an event of default, which, if not cured or waived, could result in our being required to repay these borrowings before their due date. If we are forced to refinance these borrowings on less favorable terms or are unable to refinance these borrowings, our results of operations and financial condition could be adversely affected.
Servicing our indebtedness will require a significant amount of cash. Our ability to generate sufficient cash depends on many factors, some of which are not within our control.
Our ability to make payments on our indebtedness, to fund planned capital expenditures and to pay future dividends, if any, to our stockholders will depend on our ability to generate cash in the future. To a certain extent, this is subject to general economic, financial, competitive, legislative, regulatory and other factors that are beyond our control. If we are unable to generate sufficient cash flow to service our debt and meet our other commitments, we may need to restructure or refinance all or a portion of our debt, sell material assets or operations or raise additional debt or equity capital. We may not be able to effect any of these actions on a timely basis, on commercially reasonable terms or at all, and these actions may not be sufficient to meet our capital requirements. In addition, the terms of our existing or future debt arrangements may restrict us from effecting any of these alternatives.
Despite our current level of indebtedness, we may be able to incur substantially more debt and enter into other transactions, which could further exacerbate the risks to our financial condition described above.
We may be able to incur significant additional indebtedness, including secured debt, in the future. Although the credit agreements and indentures that govern substantially all of our indebtedness contain restrictions on the incurrence of additional indebtedness and entering into certain types of other transactions, these restrictions are subject to a number of qualifications and exceptions. Additional indebtedness incurred in compliance with these restrictions could be substantial. These restrictions also do not prevent us from incurring obligations, such as trade payables, that do not constitute indebtedness as defined under our debt instruments. To the extent new debt is added to our current debt levels, the substantial leverage risks described in the preceding three risk factors would increase.
Risks Related to Ownership of Our Common Stock
Because we suspended our quarterly cash dividend to holders of our common stock during 2020, you may not receive any return on your investment unless you sell your common stock for a price greater than that which you paid for it.
As a result of the COVID-19 pandemic, we suspended payment of our quarterly cash dividend to holders of our common stock in 2020 and have not yet reinstated it. Our dividend policy may change at any time without notice to our stockholders. The declaration and payment of any future dividends is at the discretion of our board of directors in accordance with applicable law after taking into account various factors, including our financial condition, operating results, current and anticipated cash needs, limitations imposed by our indebtedness, legal requirements and other factors that our board of directors deems relevant. As a result, you may not receive any return on an investment in our common stock unless you sell your common stock for a price greater than that which you paid for it.
Anti-takeover provisions in our organizational documents and Delaware law might discourage or delay acquisition attempts for us that one might consider favorable.
Our amended and restated certificate of incorporation and amended and restated by-laws contain provisions that may make the merger or acquisition of our company more difficult without the approval of our board of directors. Among other things:
•although we do not have a stockholder rights plan, and would either submit any such plan to stockholders for ratification or cause such plan to expire within a year, these provisions would allow us to authorize the issuance of undesignated preferred stock in connection with a stockholder rights plan or otherwise, the terms of which may be established and the shares of which may be issued without stockholder approval, and which may include super voting, special approval, dividend or other rights or preferences superior to the rights of the holders of common stock;
•these provisions prohibit stockholder action by written consent unless such action is recommended by all directors then in office;
•these provisions provide that our board of directors is expressly authorized to make, alter or repeal our by-laws and that our stockholders may only amend our by-laws with the approval of 80 percent or more of all the outstanding shares of our capital stock entitled to vote; and
•these provisions establish advance notice requirements for nominations for elections to our board or for proposing matters that can be acted upon by stockholders at stockholder meetings.
Further, as a Delaware corporation, we are subject to provisions of Delaware law, which may impair a takeover attempt that our stockholders may find beneficial. These anti-takeover provisions and other provisions under Delaware law could discourage, delay or prevent a transaction involving a change in control of our company, including actions that our stockholders may deem advantageous, or negatively affect the trading price of our common stock. These provisions could also discourage proxy contests and make it more difficult for our stockholders to elect directors of their choosing and to cause us to take other corporate actions they desire.
Item 1B. Unresolved Staff Comments
None.
Item 2. Properties
Hotel Properties
Owned or Controlled Hotels
As of December 31, 2021, we owned a controlling financial interest, but less than a 100 percent interest, in the entity that owns the following property.
| | | | | | | | | | | | | | |
| Property | | Location | | Rooms |
| Hilton Hotels & Resorts | | | | |
Hilton Nairobi | | Nairobi, Kenya | | 287 |
Joint Venture Hotels
As of December 31, 2021, we had a minority or noncontrolling financial interest in the entities that own or lease the following five properties, representing 2,244 rooms, and we manage each of the hotels for these entities. We have a right of first refusal to purchase additional equity interests in certain of these joint ventures.
| | | | | | | | | | | | | | | | | | | | |
| Property | | Location | | Ownership | | Rooms |
| Conrad Hotels & Resorts | | | | | | |
| Conrad Cairo | | Cairo, Egypt | | 10% | | 614 |
| Hilton Hotels & Resorts | | | | | | |
| Hilton Tokyo Bay | | Urayasu-shi, Japan | | 24% | | 828 |
| Hilton Nagoya | | Nagoya, Japan | | 24% | | 460 |
| Hilton Mauritius Resort & Spa | | Flic-en-Flac, Mauritius | | 20% | | 193 |
| Hilton Imperial Dubrovnik | | Dubrovnik, Croatia | | 18% | | 149 |
Leased Hotels
As of December 31, 2021, we leased the following 48 hotels, representing 15,620 rooms.
| | | | | | | | | | | | | | |
| Property | | Location | | Rooms |
| Waldorf Astoria Hotels & Resorts | | | | |
| Rome Cavalieri, Waldorf Astoria Hotels & Resorts | | Rome, Italy | | 370 |
| Waldorf Astoria Amsterdam | | Amsterdam, Netherlands | | 93 |
| Conrad Hotels & Resorts | | | | |
| Conrad Osaka | | Osaka, Japan | | 164 |
| Hilton Hotels & Resorts | | | | |
Hilton Tokyo(1) | | (Shinjuku-ku) Tokyo, Japan | | 830 |
| Ramses Hilton | | Cairo, Egypt | | 811 |
| Hilton Vienna | | Vienna, Austria | | 663 |
| Hilton London Kensington | | London, United Kingdom | | 601 |
Hilton Osaka(1) | | Osaka, Japan | | 562 |
| Hilton Tel Aviv | | Tel Aviv, Israel | | 560 |
| Hilton Istanbul Bosphorus | | Istanbul, Turkey | | 500 |
| Hilton Munich Park | | Munich, Germany | | 484 |
| Hilton Munich City | | Munich, Germany | | 483 |
| London Hilton on Park Lane | | London, United Kingdom | | 453 |
| Hilton Diagonal Mar Barcelona | | Barcelona, Spain | | 433 |
| Hilton Mainz | | Mainz, Germany | | 431 |
| Hilton Trinidad & Conference Centre | | Port of Spain, Trinidad | | 405 |
| Hilton London Heathrow Airport | | London, United Kingdom | | 398 |
(continued on next page)
| | | | | | | | | | | | | | |
| Property | | Location | | Rooms |
| Hilton Addis Ababa | | Addis Ababa, Ethiopia | | 372 |
| Hilton Vienna Danube Waterfront | | Vienna, Austria | | 367 |
| Hilton Frankfurt | | Frankfurt, Germany | | 342 |
| Hilton Sandton | | Sandton, South Africa | | 329 |
| Hilton Glasgow | | Glasgow, United Kingdom | | 322 |
| Hilton Milan | | Milan, Italy | | 320 |
| Hilton Brisbane | | Brisbane, Australia | | 319 |
| The Waldorf Hilton, London | | London, United Kingdom | | 298 |
| Hilton Cologne | | Cologne, Germany | | 296 |
| Hilton Stockholm Slussen | | Stockholm, Sweden | | 289 |
| Hilton Madrid Airport | | Madrid, Spain | | 284 |
| Hilton London Canary Wharf | | London, United Kingdom | | 282 |
| Hilton Amsterdam | | Amsterdam, Netherlands | | 271 |
| Hilton Newcastle Gateshead | | Newcastle Upon Tyne, United Kingdom | | 254 |
| Hilton Vienna Plaza | | Vienna, Austria | | 254 |
| Hilton Bonn | | Bonn, Germany | | 252 |
| Hilton London Tower Bridge | | London, United Kingdom | | 248 |
| Hilton Antwerp Old Town | | Antwerp, Belgium | | 210 |
| Hilton Reading | | Reading, United Kingdom | | 210 |
| Hilton Leeds City | | Leeds, United Kingdom | | 208 |
| Hilton Watford | | Watford, United Kingdom | | 200 |
| Hilton Nottingham | | Nottingham, United Kingdom | | 176 |
| Hilton London Croydon | | Croydon, United Kingdom | | 168 |
| Hilton Cobham | | Cobham, United Kingdom | | 158 |
| Hilton Paris La Defense | | Paris, France | | 153 |
| Hilton East Midlands Airport | | Derby, United Kingdom | | 152 |
| Hilton Northampton | | Northampton, United Kingdom | | 139 |
| Hilton London Hyde Park | | London, United Kingdom | | 136 |
| Hilton York | | York, United Kingdom | | 131 |
| Hilton Mainz City | | Mainz, Germany | | 127 |
| Hilton Puckrup Hall, Tewkesbury | | Tewkesbury, United Kingdom | | 112 |
____________
(1)We own a controlling financial interest, but less than a 100 percent interest, in the entity that leases the property.
Corporate Headquarters and Regional Offices
Our corporate headquarters is located at 7930 Jones Branch Drive, McLean, Virginia 22102, which is under a lease agreement expiring in December 2023. We also own or lease corporate offices or centralized operations centers in Memphis, Tennessee; Carrollton, Texas; Glasgow, Scotland (Europe); Watford, England (Europe); Dubai, United Arab Emirates (Middle East and Africa); Singapore (Asia Pacific); Tokyo, Japan; Shanghai, China; and Mexico City, Mexico. Additionally, to support our operations, we have our Hilton Reservations and Customer Care, Hilton Honors and other commercial services at a leased office in Addison, Texas. We believe that our existing office properties are in good condition and are sufficient and suitable for the conduct of our business. In the event we need to expand our operations, or upon expiration of our current leases, we believe that suitable space will be available on commercially reasonable terms.
Item 3. Legal Proceedings
We are involved in various claims and lawsuits arising in the ordinary course of business, some of which include claims for substantial sums, including proceedings involving tort and other general liability claims, employee claims, consumer protection claims and claims related to our management of certain hotels. We recognize a liability when we believe the loss is probable and can be reasonably estimated. Most occurrences involving liability, claims of negligence and employees are covered by policies that we hold with solvent insurance carriers. The ultimate results of claims and litigation cannot be predicted with certainty. We believe we have adequate reserves against such matters. We currently believe that the ultimate outcome of such lawsuits and proceedings will not, individually or in the aggregate, have a material adverse effect on our consolidated financial position, results of operations or cash flows. However, depending on the amount and timing, an unfavorable resolution of some or all of these matters could materially affect our future results of operations in a particular period.
Item 4. Mine Safety Disclosures
Not applicable.
PART II
Item 5. Market for Registrant's Common Equity, Related Stockholder Matters and Issuer Purchases of Equity
Securities
Market Information and Dividends
Our common stock is listed for trading on the NYSE under the symbol "HLT." As of December 31, 2021, there were seven holders of record of our common stock, which does not include a substantially greater number of beneficial holders whose shares are held of record by banks, brokers and other financial institutions.
Prior to 2020, we historically paid cash dividends. However, we suspended the declaration and payment of dividends as part of certain proactive measures we took to secure our liquidity position in response to the COVID-19 pandemic. We expect to declare and pay dividends in the future subject to the sole discretion of our board of directors, whose decision will depend on, among other things, our results of operations, cash requirements, financial condition, contractual restrictions and other factors that our board of directors may deem relevant. Because we are a holding company and have no direct operations, we will only be able to pay dividends from funds we receive from our subsidiaries.
Performance Graph
The following graph compares Hilton's cumulative total stockholder return since December 31, 2016 with the S&P 500 Index ("S&P 500") and the S&P Hotels, Resorts & Cruise Lines Index ("S&P Hotel"). The graph assumes that the value of the investment in our common stock and each index was $100 on December 31, 2016 and that all dividends and other distributions, including the effect of the spin-offs, were reinvested. The comparisons in the graph below are based on historical data and are not indicative of, or intended to forecast, future performance of our common stock.
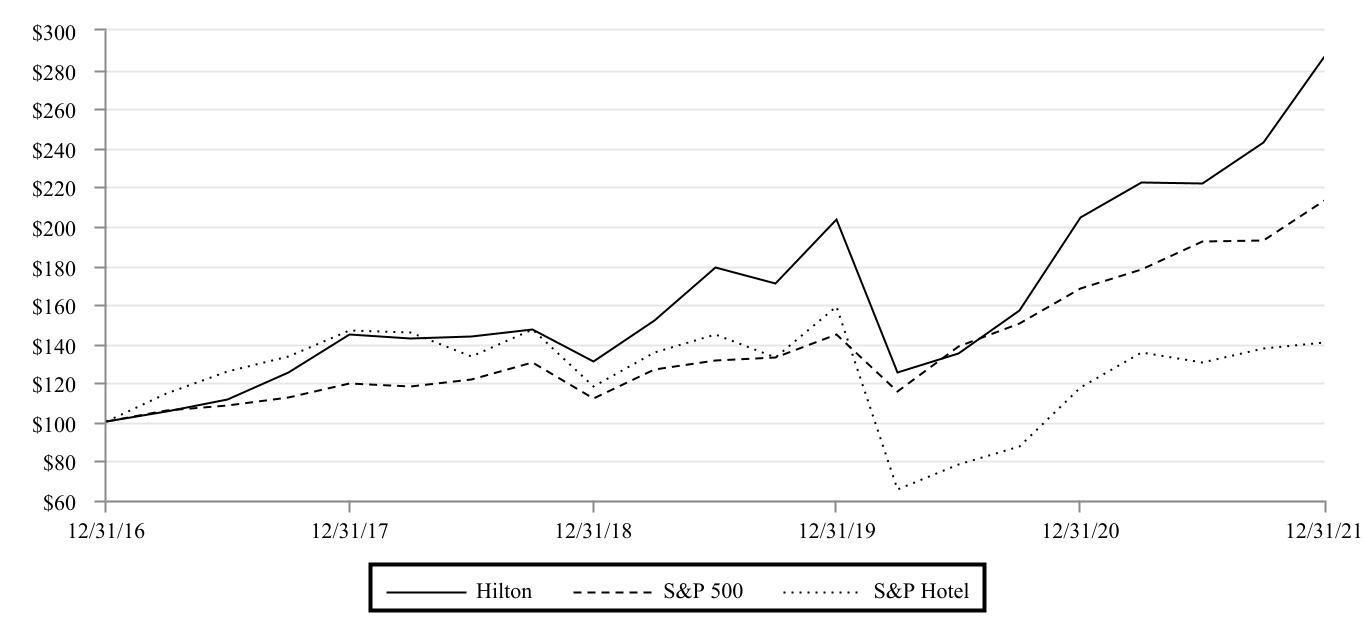
| | | | | | | | | | | | | | | | | | | | | | | | | | | | | | | | | | | |
| 12/31/2016 | | 12/31/2017 | | 12/31/2018 | | 12/31/2019 | | 12/31/2020 | | 12/31/2021 |
| Hilton | $ | 100.00 | | | $ | 144.37 | | | $ | 130.80 | | | $ | 203.30 | | | $ | 204.38 | | | $ | 286.54 | |
| S&P 500 | 100.00 | | | 119.42 | | | 111.97 | | | 144.31 | | | 167.77 | | | 212.89 | |
| S&P Hotel | 100.00 | | | 146.42 | | | 118.05 | | | 159.00 | | | 117.25 | | | 140.52 | |
Recent Sales of Unregistered Securities
None.
Issuer Purchases of Equity Securities
Our stock repurchase program was initially publicly announced in February 2017 and subsequently increased in November 2017, February 2019 and March 2020. As of December 31, 2021, approximately $2.2 billion remained available for share repurchases under the program. Under the program, we are authorized to repurchase shares through open market purchases, privately-negotiated transactions or otherwise in accordance with applicable federal securities laws, including through Rule 10b5-1 trading plans and under Rule 10b-18 of the Exchange Act. The repurchase program does not have an expiration date and may be suspended or discontinued at any time.
We formally suspended share repurchases in March 2020, given the economic environment and our efforts to preserve cash, and no share repurchases have been made since then. The stock repurchase program remains authorized by the board of directors, and we expect to resume share repurchases in the future, depending on market conditions, our capital needs and other factors.
Item 6. [Reserved]
Item 7. Management's Discussion and Analysis of Financial Condition and Results of Operations
The following discussion and analysis of our financial condition and results of operations should be read in conjunction with our consolidated financial statements and related notes included elsewhere in this Annual Report on Form 10-K.
For the discussion of the financial condition and results of operations for the year ended December 31, 2020 compared to the year ended December 31, 2019, refer to "Part II—Item 7. Management's Discussion and Analysis of Financial Condition and Results of Operations" in our Annual Report on Form 10-K for the fiscal year ended December 31, 2020 filed with the SEC on February 17, 2021, which is incorporated herein by reference.
COVID-19 Pandemic
The COVID-19 pandemic has significantly impacted the global economy and strained the hospitality industry since the beginning of 2020. Our Asia Pacific region began experiencing the effects of the COVID-19 pandemic in January 2020, while the pronounced negative results and suspensions of hotel operations in the Americas and Europe, Middle East and Africa ("EMEA") regions did not begin until mid-March 2020. Since the beginning of the pandemic, the pervasiveness and severity of travel restrictions and stay-at-home directives have varied by country and state and fluctuated based on a number of factors, including: (i) COVID-19 infection surges and contractions; (ii) the emergence of new strains and variants of the virus; and (iii) the distribution of COVID-19 vaccinations, which commenced in late 2020. The pandemic had a material adverse impact on our results for the years ended December 31, 2021 and 2020 when compared to periods prior to the onset of the pandemic, and although all periods were significantly impacted by the pandemic, none of these periods are considered comparable, and no periods affected by the pandemic are expected to be comparable to future periods. Although we have observed signs of economic recovery, we cannot determine when the global economy will fully recover. Accordingly, given the ongoing nature of the pandemic, the ultimate impact that it will have on the Company's business, financial performance and results of operations remains uncertain.
Although certain restrictions have been reinstated with the spread of new variants of the virus, the broader distribution of COVID-19 vaccinations beginning in early 2021 and the overall easing of travel and other restrictions generated renewed interest in travel and tourism activities in many markets around the globe in 2021. However, the continued spreading of COVID-19 and its related variants could result in travel and other restrictions being implemented or reinstated in the affected areas, where our hotels may be located, in future periods, yielding further negative effects on our operations.
While the restrictions and the reduction in travel resulted in the suspensions of operations at certain hotels throughout 2020, reopenings significantly outpaced new suspensions and resuspensions during 2021, with approximately 360 hotels suspended for some period of time during the year ended December 31, 2021. Nearly all of the hotels that suspended operations at some point since the start of the pandemic had reopened as of December 31, 2021.
Overview
Our Business
Hilton is one of the largest hospitality companies in the world, with 6,837 properties comprising 1,074,791 rooms in 122 countries and territories as of December 31, 2021. Our premier brand portfolio includes: our luxury hotel brands, Waldorf Astoria Hotels & Resorts, LXR Hotels & Resorts and Conrad Hotels & Resorts; our emerging lifestyle hotel brands, Canopy by Hilton, Tempo by Hilton and Motto by Hilton; our full service hotel brands, Signia by Hilton, Hilton Hotels & Resorts, Curio Collection by Hilton, DoubleTree by Hilton and Tapestry Collection by Hilton; our focused service hotel brands, Hilton Garden Inn, Hampton by Hilton and Tru by Hilton; our all-suites hotel brands, Embassy Suites by Hilton, Homewood Suites by Hilton and Home2 Suites by Hilton; and our timeshare brand, Hilton Grand Vacations. As of December 31, 2021, we had 128 million members in our award-winning guest loyalty program, Hilton Honors, a 13 percent increase from December 31, 2020.
Segments and Regions
We analyze our operations and business by both operating segments and geographic regions. Our operations consist of two reportable segments that are based on similar products or services: (i) management and franchise and (ii) ownership. The management and franchise segment provides services, including hotel management and licensing of our IP. This segment generates its revenue from: (i) management and franchise fees charged to third-party hotel owners; (ii) licensing fees from HGV and strategic partnerships, including co-branded credit card arrangements, for the right to use our IP; and (iii) fees for managing hotels in our ownership segment. As a manager of hotels, we typically are responsible for supervising or operating the hotel in
exchange for management fees. As a franchisor of hotels, we charge franchise fees in exchange for the use of one of our brand names and related commercial services, such as our reservation system, marketing and information technology services, while a third party manages or operates such franchised hotels. The ownership segment primarily derives earnings from providing nightly hotel room sales, food and beverage sales and other services at our consolidated owned and leased hotels.
Geographically, we conduct business through three distinct geographic regions: (i) the Americas; (ii) EMEA; and (iii) Asia Pacific. The Americas region includes North America, South America and Central America, including all Caribbean nations. Although the U.S., which represented 70 percent of our system-wide hotel rooms as of December 31, 2021, is included in the Americas region, it is often analyzed separately and apart from the Americas region and, as such, it is presented separately within the analysis herein. The EMEA region includes Europe, which represents the western-most peninsula of Eurasia stretching from Iceland in the west to Russia in the east, and the Middle East and Africa ("MEA"), which represents the Middle East region and all African nations, including the Indian Ocean island nations. Europe and MEA are often analyzed separately and, as such, are presented separately within the analysis herein. The Asia Pacific region includes the eastern and southeastern nations of Asia, as well as India, Australia, New Zealand and the Pacific Island nations.
System Growth and Development Pipeline
Our strategic objectives include the continued expansion of our global portfolio and fee-based business. As we enter into new management and franchise contracts, we expand our business with minimal or no capital investment by us as the manager or franchisor, since the capital required to build and maintain hotels is typically provided by the third-party owner of the hotel with whom we contract to provide management services or license our IP. Prior to approving the addition of new hotels to our management and franchise development pipeline, we evaluate the economic viability of the hotel based on its geographic location, the credit quality of the third-party owner and other factors. By increasing the number of management and franchise contracts with third-party owners, over time we expect to increase revenues, overall return on invested capital and cash available to support our business needs. While these objectives have not changed as a result of the COVID-19 pandemic, the current economic environment has posed certain challenges to the execution of our strategy, which have included and may continue to include delays in openings and new development. See further discussion on our cash management policy, as detailed in "—Liquidity and Capital Resources."
We are focused on the growth of our business by expanding our share of the global hospitality industry through our development pipeline, which includes hotels that we expect to add to our system in the future. The following table summarizes our development activity:
| | | | | | | | | | | |
| As of or for the Year Ended December 31, 2021 |
| Hotels | | Rooms(1) |
| Hotel system | | | |
Additions | 414 | | | 67,100 | |
Net additions(2) | 355 | | | 55,100 | |
| | | |
Development pipeline(3) | | | |
Additions | 645 | | | 96,200 | |
Count as of period end(4) | 2,668 | | | 407,900 | |
____________
(1)Rounded to the nearest hundred.
(2)Represents net unit growth for the year ended December 31, 2021 of 5.6 percent.
(3)Hotels in our system are under development throughout 115 countries and territories, including 28 countries and territories where we do not currently have any existing hotels.
(4)In our development pipeline, as of December 31, 2021, 198,000 of the rooms were under construction and 249,600 of the rooms were located outside of the U.S. Nearly all of the rooms in our development pipeline are within our management and franchise segment. We do not consider any individual development project to be material to us.
Brexit
In June 2016, the U.K. held a referendum in which voters approved an exit from the E.U. (commonly referred to as "Brexit"). In December 2020, the U.K. and the E.U. reached a new bilateral trade and cooperation deal governing their future relationship (the "EU-UK Trade and Cooperation Agreement"), which was fully implemented from May 1, 2021. While the EU-UK Trade and Cooperation Agreement provides clarity in respect of the intended future relationship between the U.K. and the E.U. and some detailed matters of trade and cooperation, it remains unclear what general long-term economic, financial,
trade and legal implications the U.K. withdrawal from the E.U. will have and how it will ultimately affect our business. While our results as of and for the year ended December 31, 2021 were not materially affected by Brexit specifically, we will continue to monitor the potential impact of Brexit on our business in future periods.
Principal Components and Factors Affecting our Results of Operations
Revenues
Principal Components
We primarily derive our revenues from the following sources:
•Franchise and licensing fees. Represents fees earned in connection with the licensing of one of our brands, as well as fees from licensing agreements to use our IP. Under our long-term franchise contracts with hotel owners, franchisees typically pay us franchise fees that include: (i) monthly royalty fees, generally based on a percentage of the hotel's monthly gross room revenue, and, in some cases, a percentage of gross food and beverage revenues and other revenues, as applicable and (ii) application, initiation and other fees for when new hotels enter the system, when there is a change of ownership of a hotel or when contracts with properties already in our system are extended. Consideration to incentivize hotel owners to enter into franchise contracts with us is amortized over the life of the applicable contract as a reduction to franchise and licensing fees. Our non-hotel licensing agreements are predominantly with HGV and strategic partners, including co-branded credit card providers.
•Base and incentive management fees. Represents fees earned in connection with the management of hotels. Terms of our management contracts vary, but our fees generally consist of a base fee, which is typically based on a percentage of the hotel's monthly gross revenue and, when applicable, an incentive fee, which is typically based on the hotel's operating profits, normally over a one-calendar year period, and, in some cases, may be subject to a stated return threshold to the hotel owner. Outside of the U.S., our fees are often more dependent on hotel profitability measures, either because of a single management fee structure where the entire fee is an incentive fee, or because our two-tier fee structure is more heavily weighted toward the incentive fee than the base fee. Consideration to incentivize hotel owners to enter into management contracts with us is amortized over the life of the applicable contract as a reduction to base and other management fees.
•Owned and leased hotels. Represents revenues derived from the operations of our consolidated owned and leased hotels, including hotel room sales, accommodations sold in conjunction with other services, food and beverage sales and other ancillary goods and services. These revenues are primarily derived from two categories of customers: transient and group. Transient guests are individual travelers who are traveling for business or leisure. Group guests are traveling for group events that reserve rooms for meetings, conferences or social functions, which may be sponsored by corporate, social, military, educational, religious or other organizations or associations. Group business usually includes a block of room accommodations, as well as other ancillary services, such as meetings facilities and catering and banquet services. A majority of our food and beverage sales and other ancillary goods and services are provided to customers who are also occupying rooms at our hotels. As a result, occupancy affects all components of our owned and leased hotel revenues.
•Other revenues. Represents revenues generated by the incidental support of hotel operations for owned, leased, managed and franchised hotels, including our purchasing operations, and other operating income.
•Other revenues from managed and franchised properties. Represents amounts that are contractually reimbursed to us by property owners, either directly as costs are incurred or indirectly through program fees billed and collected in advance related to certain costs and expenses supporting the operations of the related properties. The direct reimbursements by property owners are for payroll and related costs if the property employees are legally our responsibility, and certain other operating costs of the managed and franchised properties' operations. We have no legal responsibility for the employees or the liabilities associated with operating franchised properties or certain of our managed properties. Revenues and expenses for these direct reimbursements have no net effect on operating income (loss) or net income (loss). The monthly program fee that is paid by hotel franchisees and property owners of hotels that we manage is based on the underlying hotel's sales or usage and relates to the costs of our brands and shared services, including: (i) advertising and marketing programs; (ii) internet, technology and reservation systems; and (iii) quality assurance programs. Other revenues from managed and franchised properties also includes revenues related to our Hilton Honors guest loyalty program, which are primarily derived from payments from hotel franchisees and third-
party owners of hotels we manage that participate in the program, as well as co-branded credit card providers. We are contractually required to use these fees that we collect solely for these programs.
Factors Affecting our Revenues
The following factors affect the revenues we derive from our operations:
•Consumer demand and global economic conditions. Consumer demand for our products and services is closely linked to the performance of the general economy and is sensitive to business and personal discretionary spending levels. Among other factors, declines in consumer demand due to adverse general economic conditions, risks reducing or otherwise negatively affecting travel patterns, lower consumer confidence and adverse political conditions can reduce the amount of management and franchise fee revenues we are able to generate and/or reduce the revenues and profitability of the operations of our owned and leased hotels. Further, competition for hotel guests and the supply of hotel services affect our ability to sustain or increase rates charged to customers of our hotels. As a result of the COVID-19 pandemic, several of these factors, as well as health and safety concerns, had a significant effect on global economic conditions and consumer demand for our products and services. Also, declines in hotel profitability during an economic downturn directly affect the incentive portion of our management fees, which is based on hotel profitability measures. As a result, changes in consumer demand and general business cycles have historically subjected, are currently subjecting and could in the future subject our revenues to significant volatility.
•Contracts with third-party owners and franchisees and relationships with developers. We depend on our long-term management and franchise contracts with third-party hotel owners and hotel franchisees for our management and franchise fee revenues. The success and sustainability of our management and franchise business depends on our ability to perform under our management and franchise contracts and maintain good relationships with third-party owners and franchisees. Our relationships with these third parties allow us to maintain our current presence as contracts mature and also generate new incremental opportunities for property development that can support our growth. Growth and maintenance of our hotel system and earning fees related to hotels in development are dependent on the ability of developers and owners to access capital for the development, maintenance and renovation of properties. We believe that we have good relationships with our third-party owners, franchisees and developers and are committed to the continued growth and development of these relationships. These relationships exist with a diverse group of owners, franchisees and developers and are not significantly concentrated with any one particular third party.
Expenses
Principal Components
We primarily incur the following expenses:
•Owned and leased hotels. Reflects the operating expenses of our consolidated owned and leased hotels, including room expenses, food and beverage costs, other support costs and property expenses. Room expenses include compensation costs for housekeeping, laundry and front desk staff, as well as supply costs for guest room amenities and laundry. Food and beverage costs include costs for wait and kitchen staff and food and beverage inventory. Other support expenses include: costs associated with property-level management; utilities; sales and marketing; operating hotel spas; operating telephones, parking and other guest recreation; entertainment; and other services. Property expenses include property taxes, repairs and maintenance, rent and insurance.
•Depreciation and amortization. These are non-cash expenses that primarily consist of: (i) amortization of intangible assets that were recorded at their fair value at the time of the 2007 transaction whereby we became a wholly owned subsidiary of affiliates of Blackstone Inc. (the "Merger"), which primarily include values assigned to management and franchise contracts, leases and our Hilton Honors guest loyalty program intangible asset; (ii) amortization of capitalized software costs; and (iii) depreciation and amortization of property and equipment, including our finance lease right-of-use ("ROU") assets, such as buildings and furniture and equipment that are used in corporate operations or at our consolidated owned and leased hotels.
•General and administrative. Consists primarily of compensation costs for our corporate employees, including share-based compensation; professional fees, including consulting, audit and legal fees; travel and entertainment expenses; bad debt expenses for uncollectible management, franchise and other fees; and administrative and related expenses.
•Other expenses. Consists of expenses incurred by our purchasing operations and other ancillary businesses, along with other operating expenses of the business.
•Other expenses from managed and franchised properties. Represents certain costs and expenses that are contractually reimbursed to us by property owners for payroll and related costs for properties that we manage where the property employees are legally our responsibility, or paid from program fees collected from properties for certain other operating costs of the managed and franchised properties' operations, including those related to our brands and shared services programs. We are contractually required to use these fees solely for these programs. We have no legal responsibility for the employees or the liabilities associated with operating franchised properties or certain of our managed hotels. Other expenses from managed and franchised properties also includes expenses for the operation of our Hilton Honors guest loyalty program.
Factors Affecting our Costs and Expenses
The following are principal factors that affect the costs and expenses we incur in the course of our operations:
•Fixed expenses. Many of the expenses associated with owning and leasing hotels are relatively fixed. These expenses include personnel costs, rent, property taxes, insurance and utilities. If we are unable to decrease these costs significantly or rapidly when demand for our hotels decreases, the resulting decline in our revenues can have an adverse effect on our net cash flows, margins and profits. This effect can be especially pronounced during periods of economic contraction or slow economic growth, including that which resulted from the COVID-19 pandemic. Economic downturns generally affect the results of our ownership segment more significantly than the results of our management and franchise segment due to the high fixed costs associated with operating an owned or leased hotel. Employees at some of our owned and leased hotels are parties to collective bargaining agreements that may also limit our ability to make timely staffing or labor changes in response to declining revenues. In addition, any efforts to reduce costs, including the deferral or cancellation of capital improvements, could adversely affect the economic value of our hotels and brands. Additionally, the general and administrative expenses of operating a global business also include fixed personnel costs, rent, property taxes, insurance and utilities. The effectiveness of any cost-cutting efforts related to owning and leasing hotels or corporate operations is limited by the amount of inherent fixed costs. However, we have taken steps to reduce our fixed costs to levels we believe are appropriate to maximize profitability and respond to expected future market conditions, while continuing to optimize value for the experiences of our customers, owners and Hilton employees, supporting the long-term sustainability of our brands and business.
•Changes in depreciation and amortization expenses. We capitalize costs associated with certain software development projects and, as those projects are completed and placed into service, amortization expenses will increase. As the finite-lived intangible assets that were recorded at the Merger become fully amortized, amortization expenses will decrease. Additionally, changes in depreciation expenses may be driven by renovations of existing hotels, acquisition or development of new hotels, the disposition of existing hotels or corporate facilities through sale, closure or lease termination, lease renewals, expenditures related to our corporate facilities or changes in estimates of the useful lives of our assets. As we place new assets into service, we will be required to recognize additional depreciation expenses on those assets. If we are required to recognize impairment losses related to our depreciable assets or finite-lived intangible assets, the related depreciation or amortization expenses, respectively, will decrease.
Other Items
Effect of foreign currency exchange rate fluctuations
Significant portions of our operations are conducted in functional currencies other than our reporting currency, which is USD, and we have assets and liabilities, including those that are payable or receivable by consolidated subsidiaries, denominated in a variety of foreign currencies. As a result, we are required to translate the results of those operations, assets and liabilities from their functional currency into USD at market-based foreign currency exchange rates for each reporting period. When comparing our results of operations between periods, there may be material portions of the changes in our revenues or expenses that are derived from fluctuations in foreign currency exchange rates experienced between those periods. We hedge foreign currency exchange-based cash flow variability of certain of our fees using forward contracts designated as hedging instruments. We also hold short-term forward contracts to offset exposure to fluctuations in certain of our foreign currency denominated cash balances, primarily related to our intercompany financing arrangements, and we have not currently elected to designate these forward contracts as hedging instruments.
Seasonality
The hospitality industry is seasonal in nature. The periods during which our properties experience higher or lower levels of demand vary from property to property, depending principally upon their location, type of property and competitive mix within the specific location. Based on historical results, we generally expect our revenues to be lower in the first quarter of each year than in each of the three subsequent quarters.
Key Business and Financial Metrics Used by Management
Comparable Hotels
We define our comparable hotels as those that: (i) were active and operating in our system for at least one full calendar year as of the end of the current period, and open January 1st of the previous year; (ii) have not undergone a change in brand or ownership type during the current or comparable periods reported; and (iii) have not sustained substantial property damage, business interruption, undergone large-scale capital projects or for which comparable results were not available. Of the 6,777 hotels in our system as of December 31, 2021, 5,524 hotels were classified as comparable hotels. Our 1,253 non-comparable hotels included 70 hotels, or approximately one percent of the total hotels in our system, that were removed from the comparable group during the last twelve months because they sustained substantial property damage, business interruption, underwent large-scale capital projects or comparable results were otherwise not available.
When considering business interruption in the context of our definition of comparable hotels, no hotel that had completely or partially suspended operations on a temporary basis at any time as a result of the COVID-19 pandemic was excluded from the definition of comparable hotels on that basis alone. Despite these temporary suspensions of hotel operations, we believe that including these hotels within our hotel operating statistics of occupancy, average daily rate ("ADR") and revenue per available room ("RevPAR"), if they would have otherwise been included, reflects the underlying results of our business for the years ended December 31, 2021 and 2020.
Occupancy
Occupancy represents the total number of room nights sold divided by the total number of room nights available at a hotel or group of hotels for a given period. Occupancy measures the utilization of our hotels' available capacity. Management uses occupancy to gauge demand at a specific hotel or group of hotels in a given period. Occupancy levels also help us determine achievable ADR pricing levels as demand for hotel rooms increases or decreases.
ADR
ADR represents hotel room revenue divided by the total number of room nights sold for a given period. ADR measures the average room price attained by a hotel, and ADR trends provide useful information concerning the pricing environment and the nature of the customer base of a hotel or group of hotels. ADR is a commonly used performance measure in the industry, and we use ADR to assess pricing levels that we are able to generate by type of customer, as changes in rates charged to customers have different effects on overall revenues and incremental profitability than changes in occupancy, as described above.
RevPAR
RevPAR is calculated by dividing hotel room revenue by the total number of room nights available to guests for a given period. We consider RevPAR to be a meaningful indicator of our performance as it provides a metric correlated to two primary and key drivers of operations at a hotel or group of hotels, as previously described: occupancy and ADR. RevPAR is also a useful indicator in measuring performance over comparable periods for comparable hotels.
References to occupancy, ADR and RevPAR are presented on a comparable basis, based on the comparable hotels as of December 31, 2021, and references to ADR and RevPAR are presented on a currency neutral basis, unless otherwise noted. As such, comparisons of these hotel operating statistics for the years ended December 31, 2021 and 2020 or 2019, use the foreign currency exchange rates used to translate the results of the Company's foreign operations within its financial statements for the year ended December 31, 2021.
EBITDA and Adjusted EBITDA
EBITDA reflects net income (loss), excluding interest expense, a provision for income tax benefit (expense) and depreciation and amortization expenses. Adjusted EBITDA is calculated as EBITDA, as previously defined, further adjusted to exclude certain items, including gains, losses, revenues and expenses in connection with: (i) asset dispositions for both consolidated and unconsolidated equity investments; (ii) foreign currency transactions; (iii) debt restructurings and retirements; (iv) furniture, fixtures and equipment ("FF&E") replacement reserves required under certain lease agreements; (v) share-based compensation; (vi) reorganization, severance, relocation and other expenses; (vii) non-cash impairment; (viii) amortization of contract acquisition costs; (ix) the net effect of reimbursable costs included in other revenues and other expenses from managed and franchised properties; and (x) other items.
We believe that EBITDA and Adjusted EBITDA provide useful information to investors about us and our financial condition and results of operations for the following reasons: (i) these measures are among the measures used by our management team to evaluate our operating performance and make day-to-day operating decisions and (ii) these measures are frequently used by securities analysts, investors and other interested parties as a common performance measure to compare results or estimate valuations across companies in our industry. Additionally, these measures exclude certain items that can vary widely across different industries and among competitors within our industry. For instance, interest expense and income taxes are dependent on company specifics, including, among other things, capital structure and operating jurisdictions, respectively, and, therefore, could vary significantly across companies. Depreciation and amortization expenses, as well as amortization of contract acquisition costs, are dependent upon company policies, including the method of acquiring and depreciating assets and the useful lives that are used. For Adjusted EBITDA, we also exclude items such as: (i) FF&E replacement reserves for leased hotels to be consistent with the treatment of capital expenditures for property and equipment, where payments for such capitalized assets are depreciated over their useful lives; (ii) share-based compensation, as this could vary widely among companies due to the different plans in place and the usage of them; (iii) the net effect of our cost reimbursement revenues and reimbursed expenses, as we contractually do not operate the related programs to generate a profit over the terms of the respective contracts; and (iv) other items, such as amounts related to debt restructurings and debt retirements and reorganization and related severance costs, that are not core to our operations and are not reflective of our operating performance.
EBITDA and Adjusted EBITDA are not recognized terms under U.S. generally accepted accounting principles ("GAAP") and should not be considered as alternatives, either in isolation or as a substitute, for net income (loss) or other measures of financial performance or liquidity, including cash flows, derived in accordance with GAAP. Further, EBITDA and Adjusted EBITDA have limitations as analytical tools, including:
•EBITDA and Adjusted EBITDA do not reflect changes in, or cash requirements for, our working capital needs;
•EBITDA and Adjusted EBITDA do not reflect our interest expense, or the cash requirements necessary to service interest or principal payments, on our indebtedness;
•EBITDA and Adjusted EBITDA do not reflect income tax expenses or the cash requirements to pay our taxes;
•EBITDA and Adjusted EBITDA do not reflect historical cash expenditures or future requirements for capital expenditures or contractual commitments;
•EBITDA and Adjusted EBITDA do not reflect the effect on earnings or changes resulting from matters that we consider not to be indicative of our future operations;
•although depreciation and amortization are non-cash charges, the assets being depreciated and amortized will often have to be replaced in the future, and EBITDA and Adjusted EBITDA do not reflect any cash requirements for such replacements; and
•other companies in our industry may calculate EBITDA and Adjusted EBITDA differently, limiting their usefulness as comparative measures.
Because of these limitations, EBITDA and Adjusted EBITDA should not be considered as discretionary cash available to us to reinvest in the growth of our business or as measures of cash that will be available to us to meet our obligations.
Results of Operations
The hotel operating statistics by region for our system-wide comparable hotels were as follows:
| | | | | | | | | | | | | | |
| Year Ended | | Change |
| December 31, 2021 | | 2021 vs. 2020 |
| U.S. | | | | |
| Occupancy | 60.8 | % | | 18.8 | % | pts. |
| ADR | $ | 132.94 | | 13.8 | % | |
| RevPAR | $ | 80.88 | | 64.5 | % | |
| | | | |
| Americas (excluding U.S.) | | | | |
| Occupancy | 44.0 | % | | 15.8 | % | pts. |
| ADR | $ | 111.68 | | 3.7 | % | |
| RevPAR | $ | 49.17 | | 61.7 | % | |
| | | | |
| Europe | | | | |
| Occupancy | 41.9 | % | | 13.6 | % | pts. |
| ADR | $ | 121.84 | | 12.6 | % | |
| RevPAR | $ | 51.10 | | 66.7 | % | |
| | | | |
| MEA | | | | |
| Occupancy | 52.6 | % | | 18.1 | % | pts. |
| ADR | $ | 139.02 | | 10.0 | % | |
| RevPAR | $ | 73.08 | | 67.7 | % | |
| | | | |
| Asia Pacific | | | | |
| Occupancy | 50.5 | % | | 6.0 | % | pts. |
| ADR | $ | 101.08 | | 4.0 | % | |
| RevPAR | $ | 51.06 | | 18.1 | % | |
| | | | |
| System-wide | | | | |
| Occupancy | 57.2 | % | | 16.9 | % | pts. |
| ADR | $ | 128.82 | | 12.9 | % | |
| RevPAR | $ | 73.65 | | 60.4 | % | |
During the year ended December 31, 2021, while the COVID-19 pandemic continued to negatively impact our business and our hotel operating statistics, we experienced significant improvement in our results as compared to the prior year, due to an upward trend in travel and tourism with the easing of many COVID-19 restrictions and the distribution of COVID-19 vaccinations. All regions showed improvement in RevPAR during the year ended December 31, 2021 as compared to the year ended December 31, 2020. The U.S. experienced relatively consistent recovery throughout 2021, with occupancy for the year down 13.8 percentage points from 2019. While the recoveries of the Europe and Americas (excluding U.S.) regions were outpaced by other regions early in 2021, the easing of travel restrictions, and, in Europe, a more expansive vaccination program, accelerated their recovery later in the year, resulting in improvement in operating statistics consistent with system-wide results for the full year. Of all regions, MEA recovered the most during the year with regard to RevPAR when compared to 2019. In Asia Pacific, a fluctuating recovery due to prolonged COVID-19 and travel restrictions in certain countries on both domestic and international travel resulted in a more modest increase in RevPAR for the year when compared to the other regions. Our system-wide RevPAR and ADR for the year ended December 31, 2021 were down 30.0 percent and 9.9 percent, respectively, compared to the same period in 2019 on a comparable and currency neutral basis.
Further, as a result of the pandemic, certain hotels suspended operations at various times throughout 2020, but the majority of those hotels were reopened by the beginning of 2021. In line with our recovery, although some hotels did suspend operations during the year ended December 31, 2021, reopenings significantly outpaced suspensions. As such, the operations of only approximately 360 hotels, primarily located in the U.S. and Europe, were suspended for some period of time during the year ended December 31, 2021, as compared to approximately 1,280 hotels during the year ended December 31, 2020. Nearly all of the hotels that suspended operations at some point since the start of the pandemic had reopened as of December 31, 2021. Additionally, while most hotels, including those that reopened following suspensions of their operations, experienced significantly lower occupancy during 2020 and early 2021 as compared to periods prior to the onset of the pandemic, system-
wide occupancy improved during 2021 and system-wide occupancy during the three months ended December 31, 2021 increased 20.7 percentage points as compared to the same period in 2020.
The table below provides a reconciliation of net income (loss) to EBITDA and Adjusted EBITDA:
| | | | | | | | | | | |
| Year Ended December 31, |
| 2021 | | 2020 |
| (in millions) |
| Net income (loss) | $ | 407 | | | $ | (720) | |
| Interest expense | 397 | | | 429 | |
| Income tax expense (benefit) | 153 | | | (204) | |
| Depreciation and amortization expenses | 188 | | | 331 | |
| EBITDA | 1,145 | | | (164) | |
| Loss on sales of assets, net | 7 | | | — | |
| Loss on foreign currency transactions | 7 | | | 27 | |
| Loss on debt extinguishments | 69 | | | 48 | |
| FF&E replacement reserves | 48 | | | 57 | |
| Share-based compensation expense | 193 | | | 97 | |
| Reorganization costs | — | | | 41 | |
| Impairment losses | — | | | 258 | |
| Amortization of contract acquisition costs | 32 | | | 29 | |
| Net other expenses from managed and franchised properties | 110 | | | 397 | |
Other adjustments(1) | 18 | | | 52 | |
| Adjusted EBITDA | $ | 1,629 | | | $ | 842 | |
____________
(1)Amounts for the years ended December 31, 2021 and 2020 include costs recognized for certain legal settlements, severance not related to the reorganization activities undertaken in response to the COVID-19 pandemic and other items. The amount for the year ended December 31, 2020 also includes losses related to the disposal of an investment and the settlement of a debt guarantee for a franchised hotel and a gain related to the reimbursement by a third party for taxes owed resulting from the sale of a hotel in a prior period.
Revenues
| | | | | | | | | | | | | | | | | |
| Year Ended December 31, | | Percent Change |
| 2021 | | 2020 | | 2021 vs. 2020 |
| (in millions) | | |
| Franchise and licensing fees | $ | 1,493 | | | $ | 945 | | | 58.0 |
| | | | | |
Base and other management fees | $ | 176 | | | $ | 123 | | | 43.1 |
Incentive management fees | 98 | | | 38 | | | NM(1) |
| Total management fees | $ | 274 | | | $ | 161 | | | 70.2 |
____________
(1)Fluctuation in terms of percentage change is not meaningful.
The COVID-19 pandemic began to negatively affect our franchise and licensing fees and total management fees in March 2020. However, during 2021, we experienced increases in fees recognized, as compared to fees recognized during 2020, driven by an upward trend in travel and tourism resulting from increased desire to travel by our customers, as COVID-19 vaccinations were distributed more broadly and COVID-19 restrictions eased in many areas. Additionally, there were decreases in the number of hotels that had suspended operations as a result of the pandemic during the respective periods, with approximately 1,245 managed and franchised hotels with suspended operations for some period of time during the year ended December 31, 2020, compared to approximately 345 managed and franchised hotels during the year ended December 31, 2021. Nearly all of the managed and franchised hotels that suspended operations at some point since the start of the pandemic were reopened as of December 31, 2021.
For the year ended December 31, 2021, RevPAR increased 62.3 percent at our comparable franchised properties and 55.2 percent at our comparable managed properties as a result of increased occupancy of 18.3 percentage points and 12.7 percentage points, respectively, and increased ADR of 13.4 percent and 12.3 percent, respectively.
Including new development and ownership type transfers, from January 1, 2020 to December 31, 2021, we added over 730 managed and franchised properties on a net basis, providing an additional 105,000 rooms to our management and franchise segment. As new hotels were part of our system for full periods and were part of the recovery from the negative impact of the COVID-19 pandemic, such hotels increased our franchise and management fees during the periods, and we expect this trend to continue in future periods.
Additionally, licensing and other fees increased $97 million during the year ended December 31, 2021, primarily due to increases in licensing fees from our strategic partnerships and HGV, which were the result of increased co-branded credit cardholder spend and timeshare revenues, respectively, both resulting from the rise in consumer spending and travel and tourism during the period.
Incentive management fees increased during the period as they are based on hotels' operating profits, which have improved significantly from the prior year as a result of increased demand at our properties.
| | | | | | | | | | | | | | | | | |
| Year Ended December 31, | | Percent Change |
| 2021 | | 2020 | | 2021 vs. 2020 |
| (in millions) | | |
| Owned and leased hotels | $ | 598 | | | $ | 421 | | | 42.0 |
The increase in owned and leased hotel revenues during the year ended December 31, 2021 was primarily attributable to the ongoing recovery from the COVID-19 pandemic and the resulting increase in occupancy across our owned and leased hotels. Although the operations of approximately 15 and 35 of our owned and leased hotels were suspended for some period of time during the years ended December 31, 2021 and 2020, respectively, as a result of the COVID-19 pandemic, all of these hotels were reopened before December 31, 2021.
The increase in owned and leased hotel revenues during the year ended December 31, 2021 included a $7 million increase as a result of favorable fluctuations in foreign currency exchange rates and, on a currency neutral basis, a $130 million increase and $40 million increase from our comparable and non-comparable owned and leased hotels, respectively. The increase in revenues from our comparable owned and leased hotels was the result of increased RevPAR of 45.3 percent, primarily due to increased occupancy of 9.5 percentage points and ADR of 4.7 percent, as well as a $27 million increase in COVID-19 relief subsidies from international governments that were recognized as revenues. The increase in revenues from our non-comparable owned and leased hotels, which included five leased hotels that exited our system or transferred to our management and franchise segment on December 31, 2021, included a $10 million increase, on a currency neutral basis, in COVID-19 relief subsidies from international governments. Additionally, the overall increase, on a currency neutral basis, of $40 million in revenues from our non-comparable owned and leased hotels was net of an $11 million decrease from properties that were sold or for which the lease agreements were terminated in 2020 and mid-2021, with most of these properties transferring to our management and franchise segment.
| | | | | | | | | | | | | | | | | |
| Year Ended December 31, | | Percent Change |
| 2021 | | 2020 | | 2021 vs. 2020 |
| (in millions) | | |
| Other revenues | $ | 79 | | | $ | 73 | | | 8.2 |
The increase in other revenues during the year ended December 31, 2021 was primarily due to increased revenues from our purchasing operations related to improved hotel demand resulting from the rise in travel and tourism during 2021.
Operating Expenses
| | | | | | | | | | | | | | | | | |
| Year Ended December 31, | | Percent Change |
| 2021 | | 2020 | | 2021 vs. 2020 |
| (in millions) | | |
Owned and leased hotels | $ | 679 | | | $ | 620 | | | 9.5 |
The increase in owned and leased hotel expenses during the year ended December 31, 2021 included a $19 million increase as a result of unfavorable fluctuations in foreign currency exchange rates and, on a currency neutral basis, a $46 million
increase and a $6 million decrease from our comparable and non-comparable owned and leased hotels, respectively. Our owned and leased hotels had increases in certain operating expenses as a result of increased occupancy during 2021, including variable rent costs, which are generally based on a percentage of hotel revenues or profits, partially offset by decreased expenses related to FF&E replacement reserves due to timing of costs and spending on improvement projects incurred at our leased properties. The decrease in expenses from our non-comparable owned and leased hotels, which included five leased hotels that exited our system or transferred to our management and franchise segment on December 31, 2021, also included a $16 million decrease, on a currency neutral basis, from properties that were sold or for which the lease agreements were terminated in 2020 and mid-2021, with most of these properties transferring to our management and franchise segment.
| | | | | | | | | | | | | | | | | |
| Year Ended December 31, | | Percent Change |
| 2021 | | 2020 | | 2021 vs. 2020 |
| (in millions) | | |
| Depreciation and amortization expenses | $ | 188 | | | $ | 331 | | | (43.2) |
| General and administrative expenses | 405 | | | 311 | | | 30.2 |
| Reorganization costs | — | | | 41 | | | (100.0) |
| Impairment losses | — | | | 258 | | | (100.0) |
| Other expenses | 45 | | | 60 | | | (25.0) |
The decrease in depreciation and amortization expenses was due to a decrease in amortization expenses, primarily resulting from the full amortization of: (i) certain management and franchise contract intangible assets that were recorded at the time of the Merger during 2020 and (ii) certain capitalized software costs during both periods.
The increase in general and administrative expenses was primarily due to increased share-based compensation expense as a result of expenses recognized during the year ended December 31, 2021 for all of the outstanding performance shares, which were probable of achievement as of December 31, 2021. Share-based compensation expense recognized during the year ended December 31, 2020 included the reversal of expense recognized in prior years as a result of the determination that the performance conditions of our then-outstanding performance shares were no longer probable of achievement, partially offset by expense recorded in December 2020 as a result of the modification of our then-outstanding performance shares. See Note 15: "Share-Based Compensation" in our consolidated financial statements for additional information. Also, for the year ended December 31, 2021, payroll expenses for our corporate workforce increased, as furloughs and reduced pay in 2020 yielded lower comparable costs reflected in general and administrative expenses. Partially offsetting these increases was a decrease in bad debt expense, which was in line with the improvement we experienced with respect to the timing and volume of payments from hotel owners throughout 2021, as compared to 2020.
During the year ended December 31, 2020, we recognized reorganization costs related to activities undertaken in response to the COVID-19 pandemic, primarily relating to reductions in our workforce and the associated costs.
During the year ended December 31, 2020, we recognized $258 million of impairment losses, primarily related to our ownership segment, including $104 million on our ownership reporting unit's goodwill, along with certain assets associated with specific owned and leased hotels. Additionally, $15 million was on management contract acquisition costs as a result of actual and expected early terminations of the related management contracts.
Other expenses decreased primarily as a result of expenses related to the settlement of a dispute with an owner of a managed hotel and expenses related to performance guarantees that were recognized during the year ended December 31, 2020.
Non-operating Income and Expenses
| | | | | | | | | | | | | | | | | |
| Year Ended December 31, | | Percent Change |
| 2021 | | 2020 | | 2021 vs. 2020 |
| (in millions) | | |
| Interest expense | $ | (397) | | | $ | (429) | | | (7.5) |
Loss on foreign currency transactions | (7) | | | (27) | | | (74.1) |
| Loss on debt extinguishments | (69) | | | (48) | | | 43.8 |
Other non-operating income (loss), net | 23 | | | (2) | | | NM(1) |
| Income tax benefit (expense) | (153) | | | 204 | | | NM(1) |
____________
(1)Fluctuation in terms of percentage change is not meaningful.
The decrease in interest expense during the year ended December 31, 2021 included the decrease resulting from the issuances of new senior unsecured notes and the use of such proceeds for the redemptions of existing senior unsecured notes in December 2020 and February 2021, which reduced the weighted average interest rates on our outstanding senior unsecured notes. Additionally, we repaid the entire outstanding balance on the senior secured revolving credit facility (the "Revolving Credit Facility") by June 2021, while it was fully drawn for the period from March 2020 to December 2020. For the year ended December 31, 2021, our variable interest expense also decreased due to declines in the variable interest rate on our senior secured term loan facility (the "Term Loan"). These decreases in interest expense during the year ended December 31, 2021 were partially offset by an increase due to the issuances of new senior unsecured notes in April 2020. See Note 9: "Debt" in our consolidated financial statements for additional information on our indebtedness and the associated interest rates.
The loss on foreign currency transactions during both the years ended December 31, 2021 and 2020 included the impact of changes in foreign currency exchange rates related to our operations conducted in functional currencies other than our reported currency, as well as changes in foreign currency exchange rates on certain intercompany financing arrangements, including short-term cross-currency intercompany loans. Additionally, the loss recognized during the year ended December 31, 2020, included losses related to the liquidation of investments in foreign entities that were reclassified out of accumulated other comprehensive loss.
Loss on debt extinguishments for the years ended December 31, 2021 and 2020 related to the redemptions of senior notes and included redemption premiums of $55 million and $31 million, respectively, and the accelerated recognition of unamortized deferred financing costs of $14 million and $17 million, respectively. See Note 9: "Debt" in our consolidated financial statements for additional information on these redemptions.
Other non-operating income (loss), net consists of interest income, equity in earnings (losses) from unconsolidated affiliates, certain income and costs related to our defined employee benefit plans and other non-operating gains and losses. The change in other non-operating income (loss), net during the year ended December 31, 2021 included an $8 million increase related to our employee benefit plans, primarily as a result of a decrease in interest cost and an increase in the expected investment gains from our plan assets. The year ended December 31, 2020 included other non-operating losses related to a debt guarantee for a franchised hotel and the disposal of an investment, offset by a gain related to the reimbursement by a third party for taxes owed resulting from the sale of a hotel in a prior period.
The increase in income tax expense during the year ended December 31, 2021 was primarily attributable to the increase in income before income taxes, which was partially offset by benefits recognized as a result of tax rate changes. For additional information, see Note 13: "Income Taxes" in our consolidated financial statements.
Segment Results
Refer to Note 18: "Business Segments" in our consolidated financial statements for reconciliations of revenues for our reportable segments to consolidated amounts and of segment operating income to consolidated income (loss) before income taxes.
Refer to "—Revenues" for further discussion of the increase in revenues from our managed and franchised properties, which is correlated to our management and franchise segment revenues and segment operating income. Refer to "—Revenues" and "—Operating Expenses" for further discussion of the increases in revenues and operating expenses at our owned and leased hotels, which are correlated with our ownership segment revenues and segment operating losses. Although, we saw significant
improvement in revenues from our ownership segment during 2021 as compared to 2020, due to the nature of the fixed rent commitments and other fixed operating costs at our leased hotels, our ownership segment continued to experience an operating loss for the year ended December 31, 2021.
Liquidity and Capital Resources
Overview
As of December 31, 2021, we had total cash and cash equivalents of $1,512 million, including $85 million of restricted cash and cash equivalents. The majority of our restricted cash and cash equivalents is related to cash collateral and cash held for FF&E reserves.
In response to the global crisis resulting from the COVID-19 pandemic, we took certain proactive measures in 2020 to help our business withstand the negative impact on our business from the crisis. These measures included securing our liquidity position to be able to meet our obligations for the foreseeable future, including issuing senior notes, drawing down the available borrowing capacity of our $1.75 billion Revolving Credit Facility and consummating the April 2020 pre-sale of Hilton Honors points to American Express for $1.0 billion in cash (the "Honors Points Pre-Sale"). Further, in February 2021, we issued the 3.625% Senior Notes due 2032 to continue to extend debt maturities and reduce our cost of debt by repaying the outstanding 5.125% Senior Notes due 2026. Based on our continued recovery and expectations of the foreseeable demands on our available cash and our liquidity in future periods, we had fully repaid the outstanding debt balance on the Revolving Credit Facility by June 2021.
While our accounts receivable balance as of December 31, 2021 is somewhat less than periods prior to the start of the pandemic, we are generally experiencing slower payment of certain fees due to us and we have considered these payment trends in developing our estimates of expected future credit losses. However, during the year ended December 31, 2021, we experienced relative improvement with respect to the timing of customer payments and overall cash flow from operations when compared to 2020.
Our known short-term liquidity requirements primarily consist of funds necessary to pay for operating and other expenditures, including:
•costs associated with the management and franchising of hotels;
•costs, other than compensation and rent as noted separately below, associated with the operations of owned and leased hotels, including, but not limited to, utilities and operating supplies;
•corporate expenses;
•payroll and compensation costs;
•taxes and compliance costs;
•scheduled debt maturities and interest payments on our outstanding indebtedness, which, excluding finance lease liabilities, are estimated to be approximately $316 million in 2022;
•lease payments under our finance and operating leases, which include minimum lease payments that are estimated to be approximately $61 million and $177 million, respectively, in 2022;
•committed contract acquisition costs; and
•capital expenditures for required renovations and maintenance at the hotels within our ownership segment.
Our known long-term liquidity requirements primarily consist of funds necessary to pay for:
•scheduled debt maturities and interest payments on our outstanding indebtedness, which, excluding finance lease liabilities, are estimated to total an aggregate of $10.5 billion after December 31, 2022;
•lease payments under our finance and operating leases, which include minimum lease payments that are estimated to total an aggregate of $194 million and $1,081 million, respectively, after December 31, 2022;
•committed contract acquisition costs;
•capital improvements to the hotels within our ownership segment;
•corporate capital and information technology expenditures; and
•commitments to owners in our management and franchise segment made in the normal course of business for which we are reimbursed by these owners through program fees to operate our marketing, sales and brands programs.
Additionally, in circumstances where we have the opportunity to support our strategic objectives by growing our global footprint, we may provide performance or debt guarantees or loan commitments, as necessary, for hotels that we currently or plan to manage or franchise, as applicable, as well as letters of credit that support hotel financing or other obligations of hotel owners. See Note 19: "Commitments and Contingencies" in our consolidated financial statements for additional information on these commitments that were outstanding as of December 31, 2021.
We formally suspended share repurchases in March 2020, given the economic environment and our efforts to preserve cash, and no share repurchases have been made since then. However, the stock repurchase program remains authorized by our board of directors, with approximately $2.2 billion remaining available for share repurchases under the program, and we may resume share repurchases in the future at any time, depending on market conditions, our capital needs and other factors. Additionally, we suspended dividend payments in 2020, but we expect that both share repurchases and dividend payments will be reinstated in future periods and result in uses of liquidity.
Although the COVID-19 pandemic has caused us to temporarily change our cash management strategy, we have a long-term investment policy that is focused on the preservation of capital and maximizing the return on new and existing investments and returning available capital to stockholders through dividends and share repurchases, which we expect to reimplement at some time in the future. Within the framework of our investment policy, we currently intend to continue to finance our business activities primarily with cash on our balance sheet as of December 31, 2021, cash generated from our operations and, as needed, the use of the available capacity of our Revolving Credit Facility. Additionally, we have continued access to debt markets and expect to be able to obtain financing, if necessary.
After considering our approach to liquidity and our available sources of cash, we believe that our cash position and sources of liquidity will meet anticipated requirements for operating and other expenditures, including corporate expenses, payroll and other compensation costs, taxes and compliance costs and other commitments for the foreseeable future based on current conditions. The objectives of our cash management policy are to maintain the availability of liquidity while minimizing operational costs.
We may from time to time issue or incur or increase our capacity to incur new debt and/or purchase our outstanding debt through underwritten offerings, open market transactions, privately negotiated transactions or otherwise. Issuances or incurrence of new debt (or an increase in our capacity to incur new debt) and/or purchases or retirements of outstanding debt, if any, will depend on prevailing market conditions, liquidity requirements, contractual restrictions and other factors. The amounts involved may be material.
Sources and Uses of Our Cash and Cash Equivalents
The following table summarizes our net cash flows:
| | | | | | | | | | | | | | | | | |
| Year Ended December 31, | | Percent Change |
| 2021 | | 2020 | | 2021 vs. 2020 |
| (in millions) | | |
| Net cash provided by operating activities | $ | 109 | | | $ | 708 | | | NM(1) |
| Net cash used in investing activities | (57) | | | (107) | | | (46.7) |
| Net cash provided by (used in) financing activities | (1,793) | | | 2,032 | | | NM(1) |
____________
(1)Fluctuation in terms of percentage change is not meaningful; see additional details below.
Operating Activities
As we recover from the negative impacts of the pandemic and our system-wide RevPAR increases, we are returning to a position where cash flows are being generated from our operations.
The decrease in cash flows from operating activities during the year ended December 31, 2021 as compared to the year ended December 31, 2020, was primarily attributable to the $1.0 billion of cash received in connection with the Honors Points Pre-Sale during 2020. Excluding the impact of this transaction, cash flows from operating activities increased during the year ended December 31, 2021 when compared to 2020, primarily due to the increase in cash inflows generated from our management and franchise segment, largely as a result of an increase in managed and franchised RevPAR of 60.8 percent due to the recovery from the COVID-19 pandemic, as well as the decrease in cash paid for interest of $74 million, primarily as a result of the senior notes issuances and redemptions in December 2020 and February 2021; see Note 9: "Debt" in our consolidated financial statements for additional information. This increase was partially offset by a $150 million increase in payments of contract acquisition costs, which reflects our strategic investment in growing our system by adding hotels to our management and franchise segment, as well as an increase in cash paid for income taxes of $102 million, primarily due to an increase in income before income taxes.
Investing Activities
Net cash used in investing activities primarily related to capitalized software costs that were related to various systems initiatives for the benefit of both our hotel owners and our overall corporate operations and to capital expenditures for property and equipment related to our corporate facilities and the renovation of certain hotels in our ownership segment. Beginning in March 2020, we took steps to temporarily reduce such expenditures in response to the COVID-19 pandemic and continued to limit investment spending throughout 2021; however, we expect such costs to continue to increase in future periods, aligned to our recovery from the pandemic.
Financing Activities
The change in cash flows from financing activities was primarily attributable to our Revolving Credit Facility, which we fully drew down during the year ended December 31, 2020 in response to the COVID-19 pandemic, resulting in net cash inflows of $1.5 billion, while we fully repaid the $1.7 billion outstanding debt balance during the year ended December 31, 2021. Additionally, during the year ended December 31, 2020, we had a net additional $1.0 billion of senior notes borrowings, as compared to the year ended December 31, 2021. Further, cash outflows decreased $338 million in 2021 as a result of decreases in share repurchases and dividend payments, as both programs remained suspended after their suspension was initiated in 2020.
Debt and Borrowing Capacity
As of December 31, 2021, our total indebtedness, excluding unamortized deferred financing costs and discount, was approximately $8.9 billion, and we had letters of credit of $60 million outstanding on our Revolving Credit Facility. For additional information on our total indebtedness, including financing transactions executed during the years ended December 31, 2021 and 2020, availability under our Revolving Credit Facility and guarantees on our debt, refer to Note 9: "Debt" in our consolidated financial statements.
If we are unable to generate sufficient cash flow from operations in the future to service our debt, we may be required to reduce capital expenditures or issue additional equity securities. Our ability to make scheduled principal payments and to pay interest on our debt depends on our future operating performance, which is subject to general conditions in or affecting the hospitality industry that may be beyond our control. The COVID-19 pandemic negatively impacted our cash flows from operations as compared to periods prior to the onset of the pandemic, and is expected to continue to do so for an indeterminate period of time; however, during the year ended December 31, 2021, we returned to a position where we were generating cash flows from our core operations. During 2020, we took precautions to secure our cash position, as discussed above, and, with our business recovering during 2021, we were able to repay outstanding debt borrowings on our Revolving Credit Facility and we expect to be able to meet our current obligations. Furthermore, we do not have any material indebtedness outstanding that matures prior to May 2025.
Summarized Guarantor Financial Information
Hilton Domestic Operating Company Inc. ("HOC") is the issuer of the following senior notes, collectively referred to as the Senior Notes:
•5.375% Senior Notes due 2025;
•4.875% Senior Notes due 2027;
•5.750% Senior Notes due 2028;
•3.750% Senior Notes due 2029;
•4.875% Senior Notes due 2030;
•4.000% Senior Notes due 2031; and
•3.625% Senior Notes due 2032.
HOC is 100 percent owned directly by Hilton Worldwide Parent LLC ("HWP"), which, in turn, is 100 percent owned directly by Hilton Worldwide Holdings Inc. (the "Parent"). The Senior Notes are guaranteed jointly and severally on a senior unsecured basis by the Parent, HWP and substantially all of the Parent's direct and indirect wholly owned domestic restricted subsidiaries, except for HOC (together, the "Guarantors"). The indentures that govern the Senior Notes provide that any subsidiary of the Company that provides a guarantee of our senior secured credit facilities will guarantee the Senior Notes. As of December 31, 2021, none of our foreign subsidiaries or domestic subsidiaries owned by foreign subsidiaries or our non-wholly owned subsidiaries guaranteed the Senior Notes.
The guarantees are full and unconditional, subject to certain customary release provisions. The indentures that govern the Senior Notes provide that any Guarantor may be released from its guarantee so long as: (i) the subsidiary is sold or sells all of its assets; (ii) the subsidiary is released from its guarantee under our senior secured credit facilities; (iii) the subsidiary is declared "unrestricted" for covenant purposes; or (iv) the requirements for legal defeasance or covenant defeasance or to discharge the indenture have been satisfied, in each case in compliance with applicable provisions of the indentures.
Neither HOC nor any of the Guarantors has any reporting obligation under the Exchange Act in respect of the Senior Notes; however, we are supplementally providing the information set forth below. The following tables present summarized financial information for HOC, along with the Parent and all other Guarantors, on a combined basis:
| | | | | |
| As of
December 31, 2021 |
| (in millions) |
| (unaudited) |
| ASSETS | |
Total current assets | $ | 1,041 | |
| Intangible assets, net | 8,794 | |
Total intangibles and other assets | 9,301 | |
| TOTAL ASSETS | 10,342 | |
| |
| LIABILITIES AND EQUITY (DEFICIT) | |
Total current liabilities | 2,397 | |
| Long-term debt | 8,541 | |
Total liabilities | 14,176 | |
| Total Hilton stockholders' deficit | (3,834) | |
| TOTAL LIABILITIES AND EQUITY (DEFICIT) | 10,342 | |
| | | | | |
| Year Ended December 31, 2021 |
| (in millions) |
| (unaudited) |
| Revenues | |
| Revenues | $ | 1,483 | |
Other revenues from managed and franchised properties | 2,847 | |
| Total revenues | $ | 4,330 | |
| |
| Expenses | |
| Expenses | $ | 449 | |
Other expenses from managed and franchised properties | 3,039 | |
| Total expenses | $ | 3,488 | |
| |
| Operating income | $ | 844 | |
| Interest expense | (380) | |
| Income tax expense | (128) | |
| Net income | 285 | |
| Net income attributable to Hilton stockholders | 285 | |
Critical Accounting Estimates
The preparation of our consolidated financial statements in accordance with GAAP requires us to make estimates and assumptions that affect the reported amounts of assets and liabilities as of the date of the consolidated financial statements, the reported amounts of revenues and expenses during the reporting periods and the related disclosures in the consolidated financial statements and accompanying footnotes. On an ongoing basis, we evaluate these estimates and judgments based on historical experiences and various other factors that we believe reflect the current circumstances. While we believe our estimates, assumptions and judgments are reasonable, they are based on information presently available. Actual results may differ significantly from these estimates due to changes in judgments, assumptions and conditions as a result of unforeseen events or otherwise, which could have a material effect on our financial position or results of operations.
We believe that the following estimates, which are used in conjunction with our significant accounting policies, are critical because they involve a higher degree of judgment and are based on information that is inherently uncertain; refer to Note 2: "Basis of Presentation and Summary of Significant Accounting Policies" in our consolidated financial statements for information on our significant accounting policies. Management has discussed the development and selection of the following critical accounting estimates with the Audit Committee of the board of directors:
Impairment of Goodwill and Brands Intangible Assets
We evaluate goodwill and brands intangible assets for potential impairment on an annual basis or at other times during the year if indicators of impairment exist. Our reporting units are the same as our operating segments as described in Note 18: "Business Segments" in our consolidated financial statements.
As part of the evaluation of goodwill and brands intangible assets for potential impairment, we exercise judgment to:
•perform a qualitative assessment to determine whether it is more likely than not that the fair value of a reporting unit or brand intangible asset is less than its carrying value. Factors we consider when making this determination include assessing the overall effect of trends in the hospitality industry and the general economy, regional performance and expectations and historical experience;
•decide whether to bypass the qualitative assessment and perform a quantitative assessment. Factors we consider when making this determination include changes in the Company or general economic conditions since the previous quantitative assessment was performed, the amount by which the fair value exceeded the carrying value at that time and the period of time that has passed since such quantitative assessment; and
•perform a quantitative analysis to identify both the existence of impairment and the amount of the impairment loss. The estimated fair value is based on internal projections of expected future cash flows and operating plans, as well as market conditions relative to the operations of our reporting units and brands.
Changes in our estimates and assumptions, or changes in the factors that we consider that would affect them, such as those described above, that were used in our impairment testing could result in impairment losses, which could be material.
Impairment of Certain Finite-Lived Assets
We evaluate the carrying value of our specifically identifiable lease intangible assets, operating and finance lease ROU assets and property and equipment for indicators of impairment, and, if such indicators exist, we perform an analysis to determine the recoverability of the determined asset group, by comparing the expected undiscounted future cash flows to the net carrying value of the asset group.
As part of the process, we exercise judgment to:
•determine if there are indicators of impairment present. Factors we consider when making this determination include assessing the overall effect of trends in the hospitality industry and the general economy, regional performance and expectations, historical experience, capital costs and other asset-specific information;
•determine the projected undiscounted future cash flows when indicators of impairment are present. Judgment is required when developing projections of future revenues and expenses based on estimated performance over the expected useful life of the asset group. Forward-looking estimates of future performance are based on historical operating results, as well as various internal projections and external sources; and
•determine the asset group fair value when required. In determining the fair value, we often use internally-developed discounted cash flow models, appraisals, recent similar transactions in the market and, if appropriate and available for a specific asset group, current estimated net sales proceeds from pending offers. Assumptions used in the discounted cash flow models include estimating cash flows, which may require us to adjust for specific market conditions, as well as capitalization rates, which are based on location, property or asset type, market-specific dynamics and overall economic performance. The discount rate applied to forward-looking projections takes into account market-specific considerations.
Changes in our estimates and assumptions, or changes in the factors that we consider that would affect them, such as those described above, that were used in our impairment testing could result in impairment losses, which could be material.
Hilton Honors
We record a point redemption liability for amounts received from properties participating in our Hilton Honors guest loyalty program and strategic partners in an amount equal to the estimated cost per point of the future redemption obligation. We engage third-party actuaries annually to assist in determining the fair value of the future reward redemption obligation using statistical formulas that project future point redemptions based on factors that require judgment, including an estimate of points that will eventually be redeemed, which includes an estimate of breakage (i.e., points that will never be redeemed), and the cost of reimbursing properties and other third parties. The cost of the points expected to be redeemed includes further estimates of available room nights, occupancy rates, room rates and any changes to the program, including devaluation or appreciation of points based on changes in the number of points required to redeem a reward. Any amounts received from strategic partners related to the issuance of points that are in excess of the actuarial determined cost per point are recorded as deferred revenue in our consolidated balance sheets and recognized as revenue upon point redemption. We recognize revenue for point redemptions in the amount we expect to retain in excess of the cost per point, inclusive of estimated breakage, and limit the revenue recognized to an amount that is probable to not result in a significant reversal in the cumulative revenue recognized when breakage occurs.
In addition to the Hilton Honors fees we receive from hotel owners to operate the program, we earn fees from strategic partnerships, including co-branded credit card arrangements, for the use of our IP license and the issuance of Hilton Honors points. The allocation of the overall fees from the strategic partnerships between the IP license and the Hilton Honors points is based on their estimated standalone selling prices. The estimated standalone selling price of the IP license is determined using a relief-from-royalty valuation method incorporating statistical formulas based on factors that require significant judgment, including estimates of credit card usage, an appropriate royalty rate and a discount rate to be applied to the projected cash flows. The estimated standalone selling price of the future reward redemptions of Hilton Honors points under the strategic partnerships is calculated using a discounted cash flow analysis with the same assumptions as the point redemption liability discussed above, adjusted for an appropriate margin.
Due to the impact of the COVID-19 pandemic on our business and the extension of our temporary suspension of the expiration of Hilton Honors points through December 31, 2022, we reassessed the expected redemption rate of our Hilton Honors points. As a result, we adjusted our estimates of breakage to include, among other factors, the anticipated point expirations that will occur on December 31, 2022.
Changes in our estimates and assumptions that are used to determine our estimated cost per point could result in material changes in the balances of our liability for guest loyalty program and deferred revenues in our consolidated balance sheets, and changes in estimates and assumptions that are used to determine the allocation of the fees from strategic partnerships between the IP license fee and the Hilton Honors points and revenue recognized on point redemptions could result in material changes to our licensing fees and other revenues from managed and franchised properties recognized during the period in our consolidated statements of operations.
Income Taxes
We recognize deferred tax assets and liabilities based on the differences between the financial statement carrying values and the tax basis of assets and liabilities using currently enacted tax rates. We regularly review our deferred tax assets to assess their potential realization and establish a valuation allowance for portions of such assets that we believe will not be ultimately realized. In performing this review, we make estimates and assumptions regarding projected future taxable income, the expected timing of reversals of existing temporary differences and the implementation of tax planning strategies. A change in these assumptions may increase or decrease our valuation allowance resulting in an increase or decrease in our effective tax rate, which could materially affect our consolidated financial statements. Refer to Note 13: "Income Taxes" for information on the balances of our deferred tax assets and respective valuation allowances as of December 31, 2021.
We use a prescribed more-likely-than-not recognition threshold for the financial statement recognition and measurement of a tax position taken or expected to be taken in a tax return if there is uncertainty in income taxes recognized in the consolidated financial statements. When determining the amount of tax benefit to be recognized, we assume, among other items, the position will be examined, the examiner will have all relevant information and the evaluation of the position will be based on its technical merits. Further, estimates based on a tax position’s technical merits and amounts we would ultimately accept in a negotiated settlement with the tax authorities are used to measure the largest amount of benefit that is greater than 50 percent likely of being realized upon settlement. Changes to these assumptions and estimates can lead to an additional income tax benefit (expense), which could materially affect our consolidated financial statements.
Legal Contingencies
We are subject to various legal proceedings and claims, the outcomes of which are subject to significant uncertainty. An estimated loss from a loss contingency will be accrued as a charge to income if it is probable and the amount of the loss can be reasonably estimated. Significant judgment is required when we evaluate, among other factors, the degree of probability of an unfavorable outcome and the ability to make a reasonable estimate of the amount of loss in determining whether an accrual of an estimated loss is appropriate. Changes in these factors could materially affect our consolidated financial statements.
Item 7A. Quantitative and Qualitative Disclosures About Market Risk
We are exposed to market risk primarily from changes in interest rates and foreign currency exchange rates. These rate changes may affect future income, cash flows and the fair value of the Company, its assets and its liabilities. In certain situations, we may seek to reduce volatility associated with changes in interest rates and foreign currency exchange rates by entering into derivative financial instruments intended to provide a hedge against a portion of the risks associated with such volatility. We continue to have exposure to such risks to the extent they are not hedged. We enter into derivative financial instruments to the extent they meet the objectives described above, and we do not use derivatives for speculative purposes.
Interest Rate Risk
We are exposed to interest rate risk on our variable-rate debt. Our primary sensitivity is to changes in one-month LIBOR, as the interest rate on the majority of our variable-rate debt is based on this index; however, we intend to adjust our LIBOR-based variable rates, as permitted under the relevant debt agreements, by the effective date of the LIBOR transition, which is in 2023. We use interest rate swaps in order to maintain an appropriate level of exposure to interest rate variability. As of December 31, 2021, we held interest rate swaps for a portion of the Term Loan through which we receive one-month LIBOR and pay a fixed rate. We elected to designate these interest rate swaps as cash flow hedges for accounting purposes.
The following table sets forth the current carrying value of our contractual maturities, total fair values and interest rates as of December 31, 2021 for our financial instruments that are materially affected by interest rate risk, including long-term debt and our active interest rate swap:
| | | | | | | | | | | | | | | | | | | | | | | | | | | | | | | | | | | | | | | | | | | | | | | |
| Maturities by Period | | | | |
| 2022 | | 2023 | | 2024 | | 2025 | | 2026 | | Thereafter | | Carrying Value | | Fair Value |
| (dollars in millions) |
Long-term debt: | | | | | | | | | | | | | | | |
Fixed-rate long-term debt(1)(2) | $ | — | | | $ | — | | | $ | — | | | $ | 495 | | | $ | — | | | $ | 5,435 | | | $ | 5,930 | | | $ | 6,180 | |
Weighted average fixed interest rate(3) | | | | | | | | | | | | | 4.37 | % | | |
Variable-rate long-term debt(2)(4) | $ | — | | | $ | — | | | $ | — | | | $ | — | | | $ | 2,602 | | | $ | — | | | $ | 2,602 | | | $ | 2,599 | |
Weighted average variable interest rate(3) | | | | | | | | | | | | | 1.85 | % | | |
Interest rate swap(5): | | | | | | | | | | | | | | | |
Variable to fixed | $ | 1,600 | | | $ | — | | | $ | — | | | $ | — | | | $ | — | | | $ | — | | | $ | 1,600 | | | $ | 7 | |
Variable interest rate receivable | | | | | | | | | | | | | 0.10 | % | | |
Fixed interest rate payable | | | | | | | | | | | | | 1.98 | % | | |
____________
(1)Excludes finance lease liabilities with carrying values totaling $208 million and other debt of consolidated VIEs with carrying values totaling $22 million as of December 31, 2021.
(2)Carrying value includes unamortized deferred financing costs and discount.
(3)The fixed interest rate is the weighted average of actual rates, and the variable interest rate is the weighted average using the market rate prevailing as of December 31, 2021.
(4)Excludes debt of a consolidated VIE with a carrying value of $4 million as of December 31, 2021.
(5)The carrying value reflects the notional amount, and the variable interest rate receivable is based on the market rate prevailing as of December 31, 2021. We measure our derivative instruments at fair value and, as of December 31, 2021, this interest rate swap was in a liability position. Information excludes an interest rate swap with a notional amount of $1.6 billion, which swaps one-month LIBOR on a portion of the Term Loan to a fixed rate of 1.83 percent, with a term from March 2022 to March 2026, that had a liability fair value of $34 million as of December 31, 2021. These interest rate swaps were included in other long-term liabilities in our consolidated balance sheets.
Refer to Note 11: "Fair Value Measurements" in our consolidated financial statements for additional information on the fair value measurements of our long-term debt and interest rate swaps.
Foreign Currency Exchange Rate Risk
We conduct business in various currencies and are exposed to earnings and cash flow volatility associated with changes in foreign currency exchange rates. Our principal exposure results from management and franchise fees earned in foreign currencies, as well as revenues and expenses from our international owned and leased hotels. The value of these revenues and expenses could change materially in relation to the functional currencies of the exposed entities and to our reporting currency, USD. We also have exposure from our international financial assets and liabilities, including certain intercompany loans not deemed to be permanently invested, the value of which could change materially in relation to the functional currencies of the exposed entities. As of December 31, 2021, our largest net exposures were to AUD and EUR.
We use forward contracts designated as cash flow hedges to offset exposure from foreign currency exchange rate risks associated with certain of our management, franchise and other fees denominated in certain foreign currencies. We use forward contracts not designated as hedging instruments to offset exposure to foreign currency exchange rate fluctuations in certain cash and intercompany loan balances. We do not consider the fair value or earnings effect of these forward contracts to be material to our consolidated financial statements.
Item 8. Financial Statements and Supplementary Data
INDEX TO CONSOLIDATED FINANCIAL STATEMENTS
| | | | | |
| Page No. |
| Management’s Report on Internal Control Over Financial Reporting | |
| Report of Independent Registered Public Accounting Firm – Internal Control Over Financial Reporting | |
Report of Independent Registered Public Accounting Firm – Financial Statements | |
| Consolidated Financial Statements: | |
Consolidated Balance Sheets as of December 31, 2021 and 2020 | |
Consolidated Statements of Operations for the years ended December 31, 2021, 2020 and 2019 | |
Consolidated Statements of Comprehensive Income (Loss) for the years ended December 31, 2021, 2020 and 2019 | |
Consolidated Statements of Cash Flows for the years ended December 31, 2021, 2020 and 2019 | |
Consolidated Statements of Stockholders' Equity (Deficit) for the years ended December 31, 2021, 2020 and 2019 | |
| Notes to Consolidated Financial Statements | |
Management's Report on Internal Control Over Financial Reporting
Management of Hilton Worldwide Holdings Inc. (the "Company") is responsible for establishing and maintaining adequate internal control over financial reporting as such term is defined in Rules 13a-15(f) and 15d-15(f) under the Securities Exchange Act of 1934, as amended. The Company’s internal control over financial reporting is designed to provide reasonable assurance regarding the reliability of financial reporting and the preparation of financial statements for external purposes in accordance with United States generally accepted accounting principles ("GAAP"). The Company's internal control over financial reporting includes those policies and procedures that: (i) pertain to the maintenance of records that, in reasonable detail, accurately and fairly reflect the transactions and dispositions of the assets of the Company; (ii) provide reasonable assurance that transactions are recorded as necessary to permit preparation of financial statements in accordance with GAAP, and that receipts and expenditures of the Company are being made only in accordance with authorizations of the Company’s management and directors; and (iii) provide reasonable assurance regarding prevention or timely detection of unauthorized acquisition, use or disposition of assets of the Company that could have a material effect on the financial statements.
Because of its inherent limitations, internal control over financial reporting may not prevent or detect misstatements. Also, projections of any evaluation of effectiveness to future periods are subject to the risk that controls may become inadequate because of changes in conditions, or that the degree of compliance with the policies or procedures may deteriorate.
Management has assessed the effectiveness of the Company’s internal control over financial reporting as of December 31, 2021. In making this assessment, management used the criteria established in the Internal Control-Integrated Framework issued by the Committee of Sponsoring Organizations of the Treadway Commission (2013 framework). Based on this assessment, management determined that the Company maintained effective internal control over financial reporting as of December 31, 2021.
Ernst & Young LLP (PCAOB ID: 42), the independent registered public accounting firm that has audited the consolidated financial statements included in this Annual Report on Form 10-K, has issued an attestation report on the Company’s internal control over financial reporting as of December 31, 2021. The report is included herein.
Report of Independent Registered Public Accounting Firm
To the Stockholders and the Board of Directors of
Hilton Worldwide Holdings Inc.
Opinion on Internal Control Over Financial Reporting
We have audited Hilton Worldwide Holdings Inc.'s internal control over financial reporting as of December 31, 2021, based on criteria established in Internal Control—Integrated Framework issued by the Committee of Sponsoring Organizations of the Treadway Commission (2013 framework) (the COSO criteria). In our opinion, Hilton Worldwide Holdings Inc. (the Company) maintained, in all material respects, effective internal control over financial reporting as of December 31, 2021, based on the COSO criteria.
We also have audited, in accordance with the standards of the Public Company Accounting Oversight Board (United States) (PCAOB), the consolidated balance sheets of the Company as of December 31, 2021 and 2020, the related consolidated statements of operations, comprehensive income (loss), cash flows and stockholders' equity (deficit), for each of the three years in the period ended December 31, 2021 and the related notes, and our report dated February 16, 2022 expressed an unqualified opinion thereon.
Basis for Opinion
The Company's management is responsible for maintaining effective internal control over financial reporting and for its assessment of the effectiveness of internal control over financial reporting included in the accompanying Management's Report on Internal Control Over Financial Reporting. Our responsibility is to express an opinion on the Company's internal control over financial reporting based on our audit. We are a public accounting firm registered with the PCAOB and are required to be independent with respect to the Company in accordance with the U.S. federal securities laws and the applicable rules and regulations of the Securities and Exchange Commission and the PCAOB.
We conducted our audit in accordance with the standards of the PCAOB. Those standards require that we plan and perform the audit to obtain reasonable assurance about whether effective internal control over financial reporting was maintained in all material respects.
Our audit included obtaining an understanding of internal control over financial reporting, assessing the risk that a material weakness exists, testing and evaluating the design and operating effectiveness of internal control based on the assessed risk, and performing such other procedures as we considered necessary in the circumstances. We believe that our audit provides a reasonable basis for our opinion.
Definition and Limitations of Internal Control Over Financial Reporting
A company's internal control over financial reporting is a process designed to provide reasonable assurance regarding the reliability of financial reporting and the preparation of financial statements for external purposes in accordance with generally accepted accounting principles. A company's internal control over financial reporting includes those policies and procedures that (1) pertain to the maintenance of records that, in reasonable detail, accurately and fairly reflect the transactions and dispositions of the assets of the company; (2) provide reasonable assurance that transactions are recorded as necessary to permit preparation of financial statements in accordance with generally accepted accounting principles, and that receipts and expenditures of the company are being made only in accordance with authorizations of management and directors of the company; and (3) provide reasonable assurance regarding prevention or timely detection of unauthorized acquisition, use, or disposition of the company’s assets that could have a material effect on the financial statements.
Because of its inherent limitations, internal control over financial reporting may not prevent or detect misstatements. Also, projections of any evaluation of effectiveness to future periods are subject to the risk that controls may become inadequate because of changes in conditions, or that the degree of compliance with the policies or procedures may deteriorate.
/s/ Ernst & Young LLP
Tysons, Virginia
February 16, 2022
Report of Independent Registered Public Accounting Firm
To the Stockholders and the Board of Directors of
Hilton Worldwide Holdings Inc.
Opinion on the Financial Statements
We have audited the accompanying consolidated balance sheets of Hilton Worldwide Holdings Inc. (the Company) as of December 31, 2021 and 2020, the related consolidated statements of operations, comprehensive income (loss), cash flows and stockholders’ equity (deficit), for each of the three years in the period ended December 31, 2021, and the related notes (collectively referred to as the "consolidated financial statements"). In our opinion, the consolidated financial statements present fairly, in all material respects, the financial position of the Company at December 31, 2021 and 2020, and the results of its operations and its cash flows for each of the three years in the period ended December 31, 2021, in conformity with U.S. generally accepted accounting principles.
We also have audited, in accordance with the standards of the Public Company Accounting Oversight Board (United States) (PCAOB), the Company’s internal control over financial reporting as of December 31, 2021, based on criteria established in Internal Control-Integrated Framework issued by the Committee of Sponsoring Organizations of the Treadway Commission (2013 framework), and our report dated February 16, 2022 expressed an unqualified opinion thereon.
Basis for Opinion
These financial statements are the responsibility of the Company’s management. Our responsibility is to express an opinion on the Company’s financial statements based on our audits. We are a public accounting firm registered with the PCAOB and are required to be independent with respect to the Company in accordance with the U.S. federal securities laws and the applicable rules and regulations of the Securities and Exchange Commission and the PCAOB.
We conducted our audits in accordance with the standards of the PCAOB. Those standards require that we plan and perform the audit to obtain reasonable assurance about whether the financial statements are free of material misstatement, whether due to error or fraud. Our audits included performing procedures to assess the risks of material misstatement of the financial statements, whether due to error or fraud, and performing procedures that respond to those risks. Such procedures included examining, on a test basis, evidence regarding the amounts and disclosures in the financial statements. Our audits also included evaluating the accounting principles used and significant estimates made by management, as well as evaluating the overall presentation of the financial statements. We believe that our audits provide a reasonable basis for our opinion.
Critical Audit Matters
The critical audit matters communicated below are matters arising from the current period audit of the financial statements that were communicated or required to be communicated to the audit committee and that: (1) relate to accounts or disclosures that are material to the financial statements and (2) involved our especially challenging, subjective or complex judgments. The communication of critical audit matters does not alter in any way our opinion on the consolidated financial statements, taken as a whole, and we are not, by communicating the critical audit matters below, providing separate opinions on the critical audit matters or on the accounts or disclosures to which they relate.
| | | | | | | | |
| | Accounting for the Loyalty Program |
| Description of the Matter | | The Company recognized $346 million of revenues during the year ended December 31, 2021 and had deferred revenues of $535 million and a liability for guest loyalty program of $2,364 million as of December 31, 2021 associated with the Hilton Honors guest loyalty and marketing program (the “Loyalty Program”). As discussed in Note 4 to the consolidated financial statements, the Company has a performance obligation to provide or arrange for the provision of goods or services, for free or at a discount, to Hilton Honors members in exchange for the redemption of points earned through participation in the Loyalty Program. The consideration for the Loyalty Program is received from hotel properties or other program partners at the time points are earned by Hilton Honors members. Such amounts are recognized as revenue when the related point obligation is satisfied based upon the estimated standalone selling price per point in excess of the related cost per point.
Auditing Loyalty Program results is complex due to: (1) the complexity of models and high volume of data used to monitor and account for the Loyalty Program results, and (2) the complexity of estimating the standalone selling price per Loyalty Program point, including the estimated breakage rate of Loyalty Program points. Such estimates are complex given the significant estimation associated with expected future redemption activity.
|
| How We Addressed the Matter in Our Audit | | We obtained an understanding, evaluated the design and tested the operating effectiveness of controls over the Company’s process of accounting for the Loyalty Program during the year. For example, we tested controls over management’s review of the assumptions and data inputs utilized by third-party actuaries to assist the Company in determining the fair value of the future award redemption obligation and breakage rate of Loyalty Program points and management’s review of activity and data inputs to their accounting model.
To test the recognition of revenues and costs associated with the Loyalty Program, we involved specialists on our team and performed audit procedures that included, among others, testing the clerical accuracy and consistency with U.S. GAAP of the accounting model developed by the Company to recognize revenue and costs associated with the Loyalty Program. We tested significant inputs into the accounting model, including the estimated standalone selling price and recognition of points earned and redeemed during the period. We involved our actuarial professionals to assist in our testing procedures with respect to the estimate of the breakage of Loyalty Program points and the ultimate estimated redemption cost. We evaluated management’s methodology for estimating the breakage of Loyalty Program points, as well as tested underlying data and assumptions used in estimating the breakage rate.
|
| | |
| | Accounting for Income Taxes |
| Description of the Matter | | The Company recognized income tax expense of $153 million during the year ended December 31, 2021, and unrecognized tax benefits of $375 million as of December 31, 2021. As discussed in Note 13 to the consolidated financial statements, changes to the Company’s unrecognized tax benefits relate to, among others, uncertainty regarding prior year tax returns in jurisdictions where the Company operates, changes in reserves related to Hilton Honors, and reductions and settlements related to the conclusion of certain audits.
Auditing the accounting for income taxes is complex as a result of: (1) operations in multiple foreign tax jurisdictions and international restructuring transactions, (2) the judgment and estimation associated with both the identification and measurement of the Company's unrecognized tax benefits, including its evaluation of the technical merits related to matters for which no reserves or partial reserves have been recorded, and (3) the significant estimation associated with the measurement of unrecognized tax benefits outstanding as of the balance sheet date.
|
| | | | | | | | |
| How We Addressed the Matter in Our Audit | | We obtained an understanding, evaluated the design and tested the operating effectiveness of controls over the Company’s process of accounting for income taxes, including unrecognized tax benefits, during the year. For example, we tested management’s controls over the review of tax positions taken by the Company to determine whether they met the threshold for recognition within the consolidated financial statements.
To test the recognition of the Company’s unrecognized tax benefits and measurement of unrecognized tax benefits, we involved tax professionals with specialized skills and knowledge to assess the technical merits of the Company’s tax positions and performed audit procedures that included, among others, evaluation of communications with relevant taxing authorities, evaluation of whether management appropriately considered new information that could significantly change the recognition, measurement or disclosure of the unrecognized tax benefits, and testing the assumptions used by management in estimating the valuation of any associated liability.
|
| | |
| | Accounting for Other Expenses from Managed and Franchised Properties and General and Administrative Expenses
|
| Description of the Matter | | The Company recognized Other expenses from managed and franchised properties of $3,454 million and General and administrative expenses of $405 million during the year ended December 31, 2021. As discussed in Note 2 to the consolidated financial statements, the Company incurs certain direct and indirect expenses that are for the benefit of, and contractually reimbursable from, hotel owners. Such amounts (“Cost Reimbursements”) are recorded in the period in which the expense is incurred as Other expenses from managed and franchised properties and the accounting for indirect cost reimbursements includes judgment with respect to the allocation of certain costs between reimbursable and non-reimbursable.
Auditing the classification of indirect reimbursements recognized within Other expenses from managed and franchised properties and General and administrative expenses is complex as a result of: (1) judgment associated with testing management’s conclusions regarding the allocation of costs between reimbursable and non-reimbursable expenses, presented as Other expenses from managed and franchised properties and General and administrative expenses, respectively, (2) the complexity associated with allocating indirect expenses due to the high volume of data utilized by management in establishing and maintaining allocations for indirect expenses, and (3) incentives for management to limit the growth in General and administrative expenses due to the impact on publicly disclosed earnings metrics.
|
| How We Addressed the Matter in Our Audit | | We obtained an understanding, evaluated the design and tested the operating effectiveness of controls over the Company’s process of accounting for Cost Reimbursements, General and administrative expenses, and the process for allocating indirect reimbursement expenses during the year. For example, we tested management’s controls over the review of the allocation of certain indirect costs to determine if they were appropriately classified.
To test the recognition of Cost Reimbursements for appropriate classification, we performed audit procedures that included, among others: testing a sample of transactions that were classified within Other expenses from managed and franchised properties in order to evaluate the appropriate accounting treatment and reasonableness of classification; comparing budgeted amounts and initial allocations to actual activity and evaluating the reasonableness of any resulting material changes to allocations of indirect expenses; performing analytic procedures over Other expenses from managed and franchised properties and General and administrative expenses in order to identify indicators of material errors in the classification of expenses based on established trends and expectations; and testing material manual journal entries made to Other expenses from managed and franchised properties and General and administrative expenses. |
/s/ Ernst & Young LLP
We have served as the Company's auditor since 2002.
Tysons, Virginia
February 16, 2022
HILTON WORLDWIDE HOLDINGS INC.
CONSOLIDATED BALANCE SHEETS
(in millions, except share data)
| | | | | | | | | | | |
| December 31, |
| 2021 | | 2020 |
| ASSETS | | | |
Current Assets: | | | |
Cash and cash equivalents | $ | 1,427 | | | $ | 3,218 | |
Restricted cash and cash equivalents | 85 | | | 45 | |
Accounts receivable, net of allowance for credit losses of $126 and $132 | 1,068 | | | 771 | |
| Prepaid expenses | 89 | | | 70 | |
Other | 202 | | | 98 | |
Total current assets (variable interest entities – $30 and $53) | 2,871 | | | 4,202 | |
Intangibles and Other Assets: | | | |
Goodwill | 5,071 | | | 5,095 | |
Brands | 4,883 | | | 4,904 | |
| Management and franchise contracts, net | 758 | | | 653 | |
| Other intangible assets, net | 194 | | | 266 | |
| Operating lease right-of-use assets | 694 | | | 772 | |
| Property and equipment, net | 305 | | | 346 | |
Deferred income tax assets | 213 | | | 194 | |
Other | 452 | | | 323 | |
Total intangibles and other assets (variable interest entities – $184 and $199) | 12,570 | | | 12,553 | |
| TOTAL ASSETS | $ | 15,441 | | | $ | 16,755 | |
| LIABILITIES AND EQUITY (DEFICIT) | | | |
| Current Liabilities: | | | |
| Accounts payable, accrued expenses and other | $ | 1,568 | | | $ | 1,302 | |
| Current maturities of long-term debt | 54 | | | 56 | |
| Current portion of deferred revenues | 350 | | | 370 | |
Current portion of liability for guest loyalty program | 1,047 | | | 703 | |
Total current liabilities (variable interest entities – $50 and $57) | 3,019 | | | 2,431 | |
| Long-term debt | 8,712 | | | 10,431 | |
| Operating lease liabilities | 870 | | | 971 | |
Deferred revenues | 896 | | | 1,004 | |
Deferred income tax liabilities | 700 | | | 649 | |
| Liability for guest loyalty program | 1,317 | | | 1,766 | |
| Other | 746 | | | 989 | |
Total liabilities (variable interest entities – $212 and $248) | 16,260 | | | 18,241 | |
Commitments and contingencies – see Note 19 | | | |
Equity (Deficit): | | | |
Preferred stock, $0.01 par value; 3,000,000,000 authorized shares, none issued or outstanding as of December 31, 2021 and 2020 | — | | | — | |
Common stock, $0.01 par value; 10,000,000,000 authorized shares, 332,011,359 issued and 279,091,009 outstanding as of December 31, 2021 and 330,511,254 issued and 277,590,904 outstanding as of December 31, 2020 | 3 | | | 3 | |
Treasury stock, at cost; 52,920,350 shares as of December 31, 2021 and December 31, 2020 | (4,443) | | | (4,453) | |
Additional paid-in capital | 10,720 | | | 10,552 | |
| Accumulated deficit | (6,322) | | | (6,732) | |
Accumulated other comprehensive loss | (779) | | | (860) | |
Total Hilton stockholders' deficit | (821) | | | (1,490) | |
Noncontrolling interests | 2 | | | 4 | |
| Total deficit | (819) | | | (1,486) | |
| TOTAL LIABILITIES AND EQUITY (DEFICIT) | $ | 15,441 | | | $ | 16,755 | |
See notes to consolidated financial statements.
HILTON WORLDWIDE HOLDINGS INC.
CONSOLIDATED STATEMENTS OF OPERATIONS
(in millions, except per share data)
| | | | | | | | | | | | | | | | | |
| Year Ended December 31, |
| 2021 | | 2020 | | 2019 |
| Revenues | | | | | |
| Franchise and licensing fees | $ | 1,493 | | | $ | 945 | | | $ | 1,681 | |
| Base and other management fees | 176 | | | 123 | | | 332 | |
| Incentive management fees | 98 | | | 38 | | | 230 | |
| Owned and leased hotels | 598 | | | 421 | | | 1,422 | |
| Other revenues | 79 | | | 73 | | | 101 | |
| 2,444 | | | 1,600 | | | 3,766 | |
| Other revenues from managed and franchised properties | 3,344 | | | 2,707 | | | 5,686 | |
| Total revenues | 5,788 | | | 4,307 | | | 9,452 | |
| | | | | |
| Expenses | | | | | |
Owned and leased hotels | 679 | | | 620 | | | 1,254 | |
| Depreciation and amortization | 188 | | | 331 | | | 346 | |
| General and administrative | 405 | | | 311 | | | 441 | |
| Reorganization costs | — | | | 41 | | | — | |
| Impairment losses | — | | | 258 | | | — | |
| Other expenses | 45 | | | 60 | | | 72 | |
| 1,317 | | | 1,621 | | | 2,113 | |
| Other expenses from managed and franchised properties | 3,454 | | | 3,104 | | | 5,763 | |
| Total expenses | 4,771 | | | 4,725 | | | 7,876 | |
| | | | | |
| Gain (loss) on sales of assets, net | (7) | | | — | | | 81 | |
| | | | | |
| Operating income (loss) | 1,010 | | | (418) | | | 1,657 | |
| | | | | |
| Interest expense | (397) | | | (429) | | | (414) | |
Loss on foreign currency transactions | (7) | | | (27) | | | (2) | |
| Loss on debt extinguishments | (69) | | | (48) | | | — | |
Other non-operating income (loss), net | 23 | | | (2) | | | 3 | |
| | | | | |
| Income (loss) before income taxes | 560 | | | (924) | | | 1,244 | |
| | | | | |
| Income tax benefit (expense) | (153) | | | 204 | | | (358) | |
| | | | | |
| Net income (loss) | 407 | | | (720) | | | 886 | |
| Net loss (income) attributable to noncontrolling interests | 3 | | | 5 | | | (5) | |
| Net income (loss) attributable to Hilton stockholders | $ | 410 | | | $ | (715) | | | $ | 881 | |
| | | | | |
| Earnings (loss) per share: | | | | | |
| Basic | $ | 1.47 | | | $ | (2.58) | | | $ | 3.07 | |
| Diluted | $ | 1.46 | | | $ | (2.58) | | | $ | 3.04 | |
| | | | | |
| Cash dividends declared per share | $ | — | | | $ | 0.15 | | | $ | 0.60 | |
See notes to consolidated financial statements.
HILTON WORLDWIDE HOLDINGS INC.
CONSOLIDATED STATEMENTS OF COMPREHENSIVE INCOME (LOSS)
(in millions)
| | | | | | | | | | | | | | | | | |
| Year Ended December 31, |
| 2021 | | 2020 | | 2019 |
| Net income (loss) | $ | 407 | | | $ | (720) | | | $ | 886 | |
| Other comprehensive income (loss), net of tax benefit (expense): | | | | | |
Currency translation adjustment, net of tax of $6, $(24) and $(8) | (29) | | | 38 | | | (4) | |
Pension liability adjustment, net of tax of $(27), $7 and $3 | 80 | | | (20) | | | (9) | |
Cash flow hedge adjustment, net of tax of $(10), $13 and $15 | 31 | | | (38) | | | (45) | |
| Total other comprehensive income (loss) | 82 | | | (20) | | | (58) | |
| | | | | |
| Comprehensive income (loss) | 489 | | | (740) | | | 828 | |
| Comprehensive loss (income) attributable to noncontrolling interests | 2 | | | 5 | | | (5) | |
| Comprehensive income (loss) attributable to Hilton stockholders | $ | 491 | | | $ | (735) | | | $ | 823 | |
See notes to consolidated financial statements.
HILTON WORLDWIDE HOLDINGS INC.
CONSOLIDATED STATEMENTS OF CASH FLOWS
(in millions)
| | | | | | | | | | | | | | | | | |
| Year Ended December 31, |
| 2021 | | 2020 | | 2019 |
| Operating Activities: | | | | | |
| Net income (loss) | $ | 407 | | | $ | (720) | | | $ | 886 | |
Adjustments to reconcile net income (loss) to net cash provided by operating activities: | | | | | |
| Amortization of contract acquisition costs | 32 | | | 29 | | | 29 | |
| Depreciation and amortization expenses | 188 | | | 331 | | | 346 | |
| Impairment losses | — | | | 258 | | | — | |
| Loss (gain) on sales of assets, net | 7 | | | — | | | (81) | |
| Loss on foreign currency transactions | 7 | | | 27 | | | 2 | |
| Loss on debt extinguishments | 69 | | | 48 | | | — | |
| Share-based compensation expense | 193 | | | 97 | | | 154 | |
| Amortization of deferred financing costs and discount | 16 | | | 17 | | | 16 | |
| Deferred income taxes | (4) | | | (235) | | | (20) | |
| Contract acquisition costs | (200) | | | (50) | | | (90) | |
| Changes in operating assets and liabilities: | | | | | |
| Accounts receivable, net | (301) | | | 488 | | | (105) | |
| Prepaid expenses | (22) | | | 60 | | | 6 | |
| Other current assets | (107) | | | (26) | | | 15 | |
| Accounts payable, accrued expenses and other | 273 | | | (414) | | | 99 | |
| Change in operating lease right-of-use assets | 96 | | | 94 | | | 43 | |
| Change in operating lease liabilities | (123) | | | (142) | | | (80) | |
| Change in deferred revenues | (128) | | | 215 | | | (17) | |
| Change in liability for guest loyalty program | (105) | | | 610 | | | 191 | |
| Change in other liabilities | (111) | | | 8 | | | (14) | |
| Other | (78) | | | 13 | | | 4 | |
| Net cash provided by operating activities | 109 | | | 708 | | | 1,384 | |
| Investing Activities: | | | | | |
Capital expenditures for property and equipment | (35) | | | (46) | | | (81) | |
| Proceeds from asset dispositions | 6 | | | — | | | 120 | |
| Capitalized software costs | (44) | | | (46) | | | (124) | |
| Other | 16 | | | (15) | | | (38) | |
| Net cash used in investing activities | (57) | | | (107) | | | (123) | |
| Financing Activities: | | | | | |
| Borrowings | 1,510 | | | 4,590 | | | 2,200 | |
| Repayment of debt | (3,230) | | | (2,121) | | | (1,547) | |
| Debt issuance costs and redemption premiums | (76) | | | (71) | | | (29) | |
| Dividends paid | — | | | (42) | | | (172) | |
| Repurchases of common stock | — | | | (296) | | | (1,538) | |
Share-based compensation tax withholdings | (49) | | | (58) | | | (44) | |
| Proceeds from share-based compensation | 52 | | | 31 | | | 17 | |
Other | — | | | (1) | | | — | |
| Net cash provided by (used in) financing activities | (1,793) | | | 2,032 | | | (1,113) | |
| | | | | |
| Effect of exchange rate changes on cash, restricted cash and cash equivalents | (10) | | | — | | | (2) | |
| Net increase (decrease) in cash, restricted cash and cash equivalents | (1,751) | | | 2,633 | | | 146 | |
| Cash, restricted cash and cash equivalents, beginning of period | 3,263 | | | 630 | | | 484 | |
| Cash, restricted cash and cash equivalents, end of period | $ | 1,512 | | | $ | 3,263 | | | $ | 630 | |
| | | | | |
| Supplemental Disclosures: | | | | | |
| Cash paid during the period: | | | | | |
| Interest | $ | 359 | | | $ | 433 | | | $ | 360 | |
| Income taxes, net of refunds | 181 | | | 79 | | | 363 | |
See notes to consolidated financial statements.
HILTON WORLDWIDE HOLDINGS INC.
CONSOLIDATED STATEMENTS OF STOCKHOLDERS' EQUITY (DEFICIT)
(in millions)
| | | | | | | | | | | | | | | | | | | | | | | | | | | | | | | | | | | | | | | | | | | | | | | |
| Equity (Deficit) Attributable to Hilton Stockholders | | | | |
| | | | | Additional
Paid-in
Capital | | | | Accumulated
Other
Comprehensive
Loss | | | | |
| Common Stock | | Treasury Stock | | | Accumulated Deficit | | | Noncontrolling
Interests | | Total |
| Shares | | Amount | | | | | | |
Balance as of December 31, 2018 | 295 | | | $ | 3 | | | $ | (2,625) | | | $ | 10,372 | | | $ | (6,417) | | | $ | (782) | | | $ | 7 | | | $ | 558 | |
| Net income | — | | | — | | | — | | | — | | | 881 | | | — | | | 5 | | | 886 | |
Other comprehensive loss, net of taxes: | | | | | | | | | | | | | | | |
Currency translation adjustment | — | | | — | | | — | | | — | | | — | | | (4) | | | — | | | (4) | |
Pension liability adjustment | — | | | — | | | — | | | — | | | — | | | (9) | | | — | | | (9) | |
Cash flow hedge adjustment | — | | | — | | | — | | | — | | | — | | | (45) | | | — | | | (45) | |
Other comprehensive loss | — | | | — | | | — | | | — | | | — | | | (58) | | | — | | | (58) | |
Dividends | — | | | — | | | — | | | — | | | (173) | | | — | | | — | | | (173) | |
Repurchases of common stock | (17) | | | — | | | (1,544) | | | — | | | — | | | — | | | — | | | (1,544) | |
Share-based compensation | 1 | | | — | | | — | | | 117 | | | — | | | — | | | — | | | 117 | |
Cumulative effect of the adoption of ASU 2016-02(1) | — | | | — | | | — | | | — | | | (256) | | | — | | | — | | | (256) | |
Deconsolidation of a variable interest entity | — | | | — | | | — | | | — | | | — | | | — | | | (2) | | | (2) | |
Balance as of December 31, 2019 | 279 | | | 3 | | | (4,169) | | | 10,489 | | | (5,965) | | | (840) | | | 10 | | | (472) | |
| Net loss | — | | | — | | | — | | | — | | | (715) | | | — | | | (5) | | | (720) | |
Other comprehensive income (loss), net of taxes: | | | | | | | | | | | | | | | |
Currency translation adjustment | — | | | — | | | — | | | — | | | — | | | 38 | | | — | | | 38 | |
Pension liability adjustment | — | | | — | | | — | | | — | | | — | | | (20) | | | — | | | (20) | |
Cash flow hedge adjustment | — | | | — | | | — | | | — | | | — | | | (38) | | | — | | | (38) | |
Other comprehensive loss | — | | | — | | | — | | | — | | | — | | | (20) | | | — | | | (20) | |
| Dividends | — | | | — | | | — | | | — | | | (42) | | | — | | | — | | | (42) | |
Repurchases of common stock | (3) | | | — | | | (279) | | | — | | | — | | | — | | | — | | | (279) | |
Share-based compensation | 2 | | | — | | | (5) | | | 63 | | | — | | | — | | | — | | | 58 | |
Distributions | — | | | — | | | — | | | — | | | — | | | — | | | (1) | | | (1) | |
Cumulative effect of the adoption of ASU 2016-13(2) | — | | | — | | | — | | | — | | | (10) | | | — | | | — | | | (10) | |
Balance as of December 31, 2020 | 278 | | | 3 | | | (4,453) | | | 10,552 | | | (6,732) | | | (860) | | | 4 | | | (1,486) | |
| Net income (loss) | — | | | — | | | — | | | — | | | 410 | | | — | | | (3) | | | 407 | |
Other comprehensive income (loss), net of taxes: | | | | | | | | | | | | | | | |
Currency translation adjustment | — | | | — | | | — | | | — | | | — | | | (29) | | | — | | | (29) | |
Pension liability adjustment | — | | | — | | | — | | | — | | | — | | | 79 | | | 1 | | | 80 | |
Cash flow hedge adjustment | — | | | — | | | — | | | — | | | — | | | 31 | | | — | | | 31 | |
Other comprehensive income | — | | | — | | | — | | | — | | | — | | | 81 | | | 1 | | | 82 | |
Share-based compensation | 1 | | | — | | | 10 | | | 168 | | | — | | | — | | | — | | | 178 | |
| | | | | | | | | | | | | | | |
Balance as of December 31, 2021 | 279 | | | $ | 3 | | | $ | (4,443) | | | $ | 10,720 | | | $ | (6,322) | | | $ | (779) | | | $ | 2 | | | $ | (819) | |
____________
(1) Relates to Accounting Standards Update ("ASU") No. 2016-02 ("ASU 2016-02"), Leases (Topic 842), that was adopted on January 1, 2019.
(2) Relates to ASU No. 2016-13 ("ASU 2016-13"), Financial Instruments – Credit Losses (Topic 326): Measurement of Credit Losses on Financial Instruments, that was adopted on January 1, 2020.
See notes to consolidated financial statements.
HILTON WORLDWIDE HOLDINGS INC.
NOTES TO CONSOLIDATED FINANCIAL STATEMENTS
Note 1: Organization
Hilton Worldwide Holdings Inc. (the "Parent," or together with its subsidiaries, "Hilton," "we," "us," "our" or the "Company"), a Delaware corporation, is one of the largest hospitality companies in the world and is engaged in managing, franchising, owning and leasing hotels and resorts and licensing its intellectual property, including brand names, trademarks and service marks ("IP"). As of December 31, 2021, we managed, franchised, owned or leased 6,837 hotels and resorts, including timeshare properties, totaling 1,074,791 rooms in 122 countries and territories.
Note 2: Basis of Presentation and Summary of Significant Accounting Policies
Basis of Presentation
These consolidated financial statements present the consolidated financial position of Hilton as of December 31, 2021 and 2020 and the results of operations for the years ended December 31, 2021, 2020 and 2019.
Principles of Consolidation
Our consolidated financial statements include the accounts of our wholly owned subsidiaries and other non-wholly owned entities in which we have a controlling financial interest, including variable interest entities ("VIEs") for which we are the primary beneficiary. Non-wholly owned entities in which we have a controlling financial interest generally comprise majority owned entities that own or lease real estate.
The determination of a controlling financial interest is based upon the terms of the governing agreements of the respective entities, including the evaluation of rights held by third-party ownership interests. If the entity is considered to be a VIE, we evaluate whether we are the primary beneficiary, and then consolidate those VIEs for which we have determined we are the primary beneficiary. If the entity in which we hold an interest does not meet the definition of a VIE, we evaluate whether we have a controlling financial interest through our voting interests in the entity. We consolidate entities other than VIEs when we own more than 50 percent of the voting shares of a company or otherwise have a controlling financial interest.
We hold interests in VIEs, for which we are not the primary beneficiary, that may provide us with the option to acquire an additional interest in such an entity at a predetermined amount, if certain contingent events occur. In a circumstance that we exercise or have the ability to exercise our option to acquire an additional interest in a VIE, we would reassess whether we are the primary beneficiary of the VIE. If we determine that we are the primary beneficiary of the VIE, we would be required to consolidate the total assets, liabilities and results of operations of the VIE, which may be material upon consolidation.
All material intercompany transactions and balances have been eliminated in consolidation. References in these financial statements to net income (loss) attributable to Hilton stockholders and Hilton stockholders' equity (deficit) do not include noncontrolling interests, which represent the third-party ownership interests of our consolidated, non-wholly owned entities and are reported separately.
Use of Estimates
The preparation of financial statements in conformity with United States ("U.S.") generally accepted accounting principles requires management to make estimates and assumptions that affect the amounts reported and, accordingly, ultimate results could differ from those estimates. In particular, the coronavirus ("COVID-19") pandemic had a material adverse impact on our results for the years ended December 31, 2021 and 2020 when compared to periods prior to the onset of the pandemic, which was in early 2020, and it may continue to have an adverse impact in future periods. As such, the years ended December 31, 2021 and 2020, as well as upcoming periods, are unlikely to be comparable to periods prior to the onset of the pandemic or to other periods affected by the pandemic and are not indicative of future performance. Management has made estimates and judgments in light of these circumstances.
Reorganization
During the year ended December 31, 2020, we recognized expenses related to organizational changes, including reductions in our workforce and the associated costs, as part of our efforts to reduce future costs for our corporate operations in response to
the COVID-19 pandemic. Included in these expenses were $41 million of reorganization costs for our corporate operations and $177 million related to amounts to be reimbursed by our third-party hotel owners, including those related to our managed hotels, which were included in other expenses from managed and franchised properties in our consolidated statement of operations.
Summary of Significant Accounting Policies
Revenue Recognition
Revenues are primarily derived from: (i) management and franchise contracts with third-party hotel and resort owners; (ii) our owned and leased hotels; and (iii) license agreements with Hilton Grand Vacations Inc. ("HGV") and strategic partners, including co-branded credit card providers. The majority of our performance obligations are a series of distinct goods or services, for which we receive variable consideration through our management and franchise fees or fixed consideration through our owned and leased hotels. We allocate the variable fees to the distinct services to which they relate applying the prescribed variable consideration allocation guidance, and we allocate fixed consideration to the related performance obligations based on their estimated standalone selling prices.
We do not adjust the promised amount of consideration for the effects of a significant financing component when we expect, at contract inception, that the period between our transfer of a promised good or service to a customer and when the customer pays for that good or service will be twelve months or less. Additionally, we do not typically include extended payment terms in our contracts with customers. However, in response to cash flow deficiencies experienced by certain property owners, such as those resulting from the COVID-19 pandemic, we may amend certain contracts with customers to provide short-term payment relief, expecting that we will collect most amounts outstanding in twelve months or less.
Management and franchise revenues
We identified the following performance obligations in connection with our management and franchise contracts:
•IP licenses grant the right to access our hotel system IP, including brand IP, reservations systems and property management systems.
•Hotel management services include providing day-to-day management services in the operation of the hotels for the hotel owners.
•Development services include providing consultative services (e.g., design assistance and contractor selection) to the property owner to assist with the construction of the hotel prior to the hotel opening.
•Pre-opening services include providing services (e.g., advertising, budgeting, e-commerce strategies and food and beverage testing) to the property owner to assist in preparing for the hotel opening.
•Hilton Honors rewards provide substantive rights for free or discounted goods or services to Hilton Honors members.
Each of the identified performance obligations is considered to be a series of distinct services transferred over time, except for the performance obligation related to Hilton Honors rewards, which is satisfied at the point in time when the loyalty program point is redeemed by the loyalty program member. While the underlying activities may vary from day to day, the nature of the commitments are the same each day, and the property owner can independently benefit from each day's services. Management and franchise fees are typically based on the sales or usage of the underlying hotel, with the exception of fixed upfront fees, which usually represent an insignificant portion of the transaction price.
Franchise and licensing fees represent fees earned in connection with the licensing of one of our brands, usually under long-term contracts with the property owner, and may also include fees from licensing agreements for the use of our IP, and include the following:
•Royalty fees are generally based on a percentage of the hotel's monthly gross room revenue and, in some cases, may also include a percentage of gross food and beverage revenues and other revenues, as applicable. These fees are typically billed and collected monthly, and revenue is generally recognized as services are provided.
•Application, initiation and other fees are charged when: (i) new hotels enter our system; (ii) there is a change of ownership of a hotel; or (iii) contracts with properties already in our system are extended. These fees are typically fixed and collected upfront and are recognized as revenue over the term of the franchise contract. We do not consider this advance consideration to include a significant financing component, since it is used to protect us from the property owner failing to adequately complete some or all of its obligations under the contract, including establishing and maintaining the hotel in accordance with our standards.
•Licensing fees are earned from: (i) a license agreement with HGV to use our IP in its timeshare business, which are typically billed monthly, and revenue is generally recognized at the same time the fees are billed and (ii) strategic partners, including from co-branded credit card providers, which are recognized as revenue when points for our guest loyalty program, Hilton Honors, are issued, generally as spend with the strategic partner or co-branded credit card occurs; see further discussion below under "Hilton Honors."
Management fees represent fees earned from hotels that we manage, usually under long-term contracts with the hotel owner, and include the following:
•Base management fees are generally based on a percentage of the hotel's monthly gross revenue. Base fees are typically billed and collected monthly, and revenue is generally recognized as services are provided.
•Incentive management fees are generally based on a percentage of the hotel's operating profits, normally over a one-calendar year period (the "incentive period"), and, in some cases, may be subject to a stated return threshold to the hotel owner. Incentive fee revenue is recognized on a monthly basis, but only to the extent the cumulative fee earned does not exceed the probable fee for the incentive period. Incentive fee payment terms vary, but they are generally billed and collected monthly or annually upon completion of the incentive period.
Consideration paid or anticipated to be paid to incentivize hotel owners to enter into management and franchise contracts with us is amortized over the life of the applicable contract as a reduction to base and other management fees and franchise and licensing fees, respectively.
We do not estimate revenues expected to be recognized related to our unsatisfied performance obligations for our:
(i) royalty fees, since they are considered sales-based royalty fees recognized as hotel room sales occur in exchange for licenses of our IP over the terms of the franchise contracts and (ii) other licensing fees and base management fees and incentive management fees since they are allocated entirely to the wholly unsatisfied promise to transfer IP or provide management services, respectively, which form part of a single performance obligation in a series, over the term of the individual contract.
Other revenues from managed and franchised properties represent amounts that are contractually reimbursed to us by property owners, either directly as costs are incurred or indirectly through program fees billed and collected in advance related to certain costs and expenses supporting the operations of the related properties, and include the following:
•Direct reimbursements include payroll and related costs and certain other operating costs of the managed and franchised properties' operations, which are contractually reimbursed to us by the property owners as expenses are incurred. Revenue is recognized based on the amount of expenses incurred by Hilton, which are presented as other expenses from managed and franchised properties in our consolidated statements of operations, that are then reimbursed to us by the property owner typically on a monthly basis, which results in no net effect on operating income (loss) or net income (loss).
•Indirect reimbursements include marketing expenses and other expenses associated with our brand programs and shared services, which are paid from program fees collected by Hilton from the managed and franchised properties. Indirect reimbursements are typically billed and collected monthly, based on the underlying hotel's sales or usage (such as gross room revenue or number of reservations processed), and revenue is generally recognized as services are provided. System implementation fees charged to property owners are deferred and recognized as revenue over the term of the management or franchise contract. The expenses incurred by Hilton to operate the marketing and brand programs and shared services are recognized as incurred and presented as other expenses from managed and franchised properties in our consolidated statements of operations and are expected to equal the revenues earned from indirect reimbursements over time.
The management and franchise fees and reimbursements from third-party hotel owners are allocated to the performance obligations and the distinct services to which they relate using their estimated standalone selling prices. The terms of the fees
earned under the contract relate to a specific outcome of providing the services (e.g., hotel room sales) or to Hilton's efforts (e.g., costs) to satisfy the performance obligations. Using time as the measure of progress, we recognize fee revenue and indirect reimbursements in the period earned per the terms of the contract and revenue related to direct reimbursements in the period in which the cost is incurred.
Owned and leased hotel revenues
We identified the following performance obligations in connection with our owned and leased hotel revenues, for which revenue is recognized as the respective performance obligations are satisfied, which results in recognizing the amount we expect to be entitled to for providing the goods or services:
•Cancellable room reservations or ancillary services are typically satisfied as the good or service is transferred to the hotel guest, which is generally when the room stay occurs.
•Noncancellable room reservations and banquet or conference reservations represent a series of distinct goods or services provided over time and satisfied as each distinct good or service is provided, which is reflected by the duration of the reservation.
•Substantive rights for free or discounted goods or services are satisfied at the earlier of when: (i) the substantive right expires or (ii) the underlying free or discounted good or service is provided to the hotel guest.
•Other ancillary goods and services are purchased independently of the room reservation at standalone selling prices and are considered separate performance obligations, which are satisfied when the related good or service is provided to the hotel guest.
•Components of package reservations for which each component could be sold separately to other hotel guests are considered separate performance obligations and are satisfied as set forth above.
Owned and leased hotel revenues primarily consist of hotel room sales, revenue from accommodations sold in conjunction with other services (e.g., package reservations), food and beverage sales and sales of other ancillary goods and services (e.g., parking) related to consolidated owned and leased hotels. Revenue is recognized when rooms are occupied or goods and services have been delivered or rendered, respectively. Payment terms typically align with when the goods and services are provided. Owned and leased hotel revenues are reduced upon issuance of Hilton Honors points for Hilton Honors members' paid stay transactions and are recognized when Hilton Honors points are redeemed for a free or discounted stay at an owned or leased hotel (see the "Hilton Honors" section below for additional information).
Although the transaction prices of hotel room sales, goods and other services are generally fixed and based on the respective room reservation or other agreement, an estimate to reduce the transaction price is required if a discount is expected to be provided to the customer. For package reservations, the transaction price is allocated to the performance obligations within the package based on the estimated standalone selling prices of each component. On occasion, the hotel may also provide the customer with a substantive right to a free or discounted good or service in conjunction with a room reservation or banquet contract (e.g., free breakfast or free room night for every four room nights reserved). This substantive right is considered a separate performance obligation to which a portion of the transaction price is allocated based on the estimated standalone selling price of the good or service, adjusted for the likelihood the hotel guest will exercise such right, and it is recognized as revenue when the good or service is redeemed.
Other revenues
Other revenues include revenues generated by the incidental support of hotel operations for owned, leased, managed and franchised hotels, including purchasing operations, and other operating income. Purchasing revenues include any amounts received for vendor rebate arrangements that we participate in on behalf of the hotels in our system.
Taxes and fees collected on behalf of governmental agencies
We are required to collect certain taxes and fees from customers on behalf of governmental agencies and remit these back to the applicable governmental agencies on a periodic basis. We have a legal obligation to act as a collection agent. We do not retain these taxes and fees and, therefore, they are not included in our measurement of transaction prices. We have elected to
present revenue net of sales taxes and other similar taxes. We record a liability when the amounts are collected and relieve the liability when payments are made to the applicable taxing authority or other appropriate governmental agency.
Cash and Cash Equivalents
Cash and cash equivalents include all highly liquid investments with original maturities, when purchased, of three months or less.
Restricted Cash and Cash Equivalents
Restricted cash and cash equivalents include cash balances established as collateral for certain guarantees and insurance, including self-insurance, furniture, fixtures and equipment replacement ("FF&E") reserves required under certain lease agreements and advanced deposits collected on behalf of managed and franchised hotels.
Allowance for Credit Losses
An allowance for credit losses is provided on our financial instruments, primarily accounts receivable. Our expected credit losses are based on historical collection activity, the nature of the financial instrument, geographic considerations and current and forecasted business conditions.
Goodwill
Goodwill represents the future economic benefits arising from other assets acquired in a business combination that are not individually identified and separately recognized. In connection with the 2007 transaction whereby we became a wholly owned subsidiary of affiliates of Blackstone Inc. (the "Merger"), we recorded goodwill representing the excess purchase price over the fair value of the other identified assets and liabilities.
We do not amortize goodwill, but rather evaluate goodwill for potential impairment on an annual basis or at other times during the year if indicators of impairment exist. We evaluate goodwill for potential impairment by comparing the carrying values of our reporting units to their fair values. Our reporting units are the same as our operating segments as described in Note 18: "Business Segments." At any time we may elect to perform a qualitative assessment to determine whether it is more likely than not that the fair value of a reporting unit is less than its carrying value. If we determine qualitatively that the fair value is more likely than not less than its carrying value, or if we decide to bypass the qualitative assessment, we perform a quantitative analysis. The quantitative analysis is used to identify both the existence of impairment and the amount of the impairment loss by comparing the estimated fair value of a reporting unit to its carrying value, including goodwill. The estimated fair value is based on internal projections of expected future cash flows and operating plans, as well as market conditions relative to the operations of our reporting units. If the carrying value of the reporting unit exceeds its estimated fair value, an impairment loss would be recognized in our consolidated statement of operations in an amount equal to the excess of the carrying value over the fair value, limited to the total amount of goodwill allocated to that reporting unit.
Brands
We manage, franchise, own and lease hotels under our portfolio of brands. There are no legal, regulatory, contractual, competitive, economic or other factors that limit the useful lives of these brands and, accordingly, the useful lives of these brands are considered to be indefinite. At the time of the Merger, our portfolio consisted of Waldorf Astoria Hotels & Resorts, Conrad Hotels & Resorts, Hilton Hotels & Resorts, DoubleTree by Hilton, Embassy Suites by Hilton, Hilton Garden Inn, Hampton by Hilton, Homewood Suites by Hilton and our timeshare brand, Hilton Grand Vacations. As a result of the Merger, these brands were assigned a fair value using the relief-from-royalty valuation approach or the excess earnings method, depending on the contract type. All brands that were launched subsequent to the Merger, which include LXR Hotels & Resorts, Canopy by Hilton, Signia by Hilton, Curio Collection by Hilton, Tapestry Collection by Hilton, Tempo by Hilton, Motto by Hilton, Tru by Hilton, and Home2 Suites by Hilton, were not assigned fair values, and we do not have any intangible assets for these brands recorded in our consolidated balance sheets. We evaluate our indefinite-lived brands intangible assets for impairment on an annual basis or at other times during the year if indicators of impairment exist. At any time we may elect to perform a qualitative assessment to determine whether it is more likely than not that the fair value of a brand intangible asset is less than its carrying value. If we determine qualitatively that the fair value is more likely than not less than its carrying value, or if we decide to bypass the qualitative assessment, we perform a quantitative analysis. The estimated fair value of the brand is based on internal projections of expected future cash flows. If a brand intangible asset’s estimated fair value is less than its
respective carrying value, the excess of the carrying value over the estimated fair value is recognized in our consolidated statement of operations as an impairment loss.
Intangible Assets with Finite Useful Lives
Certain finite-lived intangible assets were initially recorded at their fair value at the time of the Merger. These intangible assets consisted of management contracts, franchise contracts, leases, certain proprietary technologies and our Hilton Honors guest loyalty program. The intangible assets related to the franchise contracts, U.S. management contracts and certain proprietary technologies were fully amortized as of December 31, 2020. Additionally, we capitalize consideration paid to incentivize hotel owners to enter into management and franchise contracts with us as contract acquisition costs and the incremental costs to obtain the contracts as development commissions and other, both of which are generally fixed. We also capitalize costs incurred to develop internal-use computer software and costs to acquire software licenses, as well as internal and external costs incurred in connection with the development of upgrades or enhancements that result in additional information technology functionality.
Intangible assets with finite useful lives are amortized using the straight-line method over their respective estimated useful lives, which for contract acquisition costs and development commissions and other is the contract term, generally including any extension periods that are at our sole option. These estimated useful lives are generally as follows: international management contracts recorded at the Merger (16 years); management contract acquisition costs and development commissions and other (20 to 30 years); franchise contract acquisition costs and development commissions and other (10 to 20 years); leases (16 to 35 years); Hilton Honors (16 years); and capitalized software costs (3 years). In our consolidated statements of operations, the amortization of these intangible assets, excluding contract acquisition costs, is included in depreciation and amortization expense, and the amortization of contract acquisition costs is recognized as a reduction to franchise and licensing fees or base and other management fees, depending on the contract type. Costs incurred prior to the acquisition of a contract, such as external legal costs, are expensed as incurred and included in general and administrative expenses in our consolidated statements of operations. Cash flows for contract acquisition costs and development commissions and other are included as operating activities in our consolidated statements of cash flows, and cash flows for capitalized software costs are included as investing activities.
We evaluate the carrying value of all finite-lived intangible assets for indicators of impairment, and, if such indicators exist, we perform an analysis to determine the recoverability of the asset group carrying value by comparing the expected undiscounted future cash flows to the net carrying value of the asset group. If the carrying value of the asset group is not recoverable and exceeds the estimated fair value of the asset group, we recognize an impairment loss in our consolidated statement of operations for the amount by which the carrying value exceeds the estimated fair value. We allocate the impairment loss related to the asset group among the various assets within the asset group pro rata based on the relative carrying values of the respective assets.
Property and Equipment
Property and equipment are recorded at cost. Costs of improvements that extend the economic life or improve service potential are also capitalized. Capitalized costs are depreciated over their estimated useful lives. Costs for normal repairs and maintenance are expensed as incurred. Right-of-use ("ROU") assets of finance leases are included in property and equipment, net in our consolidated balance sheets; refer to "Leases" below for additional information.
Depreciation is recorded using the straight-line method over the assets’ estimated useful lives, which are generally as follows: buildings and improvements (8 to 40 years); furniture and equipment (3 to 8 years); and computer equipment (3 to 5 years). Leasehold improvements are depreciated over the shorter of the estimated useful life, based on the estimates above, or the remaining lease term.
We evaluate the carrying value of our property and equipment for indicators of impairment and, if such indicators exist, we review the recoverability of the asset group by comparing the estimated undiscounted future cash flows to the net carrying value of the asset group. If the net carrying value of the asset group is determined to be more than its estimated undiscounted future cash flows and, therefore, is not considered to be recoverable and is in excess of the estimated fair value, we recognize an impairment loss in our consolidated statement of operations for the amount by which the carrying value exceeds the estimated fair value. We allocate the impairment loss related to the asset group among the various assets within the asset group pro rata based on the relative carrying values of the respective assets.
If sufficient information exists to reasonably estimate the fair value of a conditional asset retirement obligation, including environmental remediation liabilities, we recognize the fair value of the obligation when the obligation is incurred, which is generally upon acquisition, construction or development or through the normal operation of the asset.
Leases
We determine if a contract is or contains a lease at the inception of the contract, and we classify that lease as a finance lease if it meets certain criteria or as an operating lease when it does not. We reassess if a contract is or contains a lease upon modification of the contract. We have elected to account for the components in contracts in which we are the lessee, that contain fixed payments for both lease and non-lease components, as a single lease component.
At the commencement date of a lease, we recognize a lease liability for future fixed lease payments and a ROU asset representing our right to use the underlying asset during the lease term. The lease liability is initially measured as the present value of the future fixed lease payments that will be made over the lease term. The lease term includes lessee options to extend the lease and periods occurring after a lessee early termination option, only to the extent it is reasonably certain that we will exercise such extension options and not exercise such early termination options, respectively. The future fixed lease payments are discounted using the rate implicit in the lease, if available, or our incremental borrowing rate. Current and long-term portions of operating lease liabilities are classified as accounts payable, accrued expenses and other and operating lease liabilities, respectively, and current and long-term portions of finance lease liabilities are classified as current maturities of long-term debt and long-term debt, respectively, in our consolidated balance sheets.
The ROU asset is measured as the amount of the lease liability with adjustments, if applicable, for lease prepayments made prior to or at lease commencement, initial direct costs incurred by us, deferred rent and lease incentives. ROU assets of operating leases are included in operating lease right-of-use assets, and ROU assets of finance leases are included in property and equipment, net in our consolidated balance sheets. We evaluate ROU assets for indicators of impairment and, if such indicators exist, we review the recoverability of the related asset group by comparing the estimated undiscounted future cash flows to the net carrying value of the asset group. If the net carrying value of the asset group is determined to be more than its estimated undiscounted future cash flows and, therefore, is not considered to be recoverable and is in excess of the estimated fair value, we record an impairment loss in our consolidated statement of operations for the amount the carrying value exceeds the estimated fair value. We allocate the impairment loss related to an asset group among the various assets within the asset group pro rata based on the relative carrying values of the respective assets.
Depending on the individual agreement, our operating leases may require: (i) fixed lease payments, or minimum payments, as contractually stated in the lease agreement; (ii) variable lease payments, which, for our hotels, are generally based on a percentage of the underlying asset's revenues or profits, or are dependent on changes in an index; and/or (iii) lease payments equal to the greater of the fixed or variable lease payments. In addition, during the term of our hotel leases, we may be required to pay some, or all, of the capital costs for FF&E and leasehold improvements in the hotel property. For operating leases, lease expense relating to fixed payments is recognized on a straight-line basis over the lease term, and lease expense related to variable payments is expensed as incurred, with amounts recognized in owned and leased hotel expenses, general and administrative expenses and other expenses from managed and franchised properties in our consolidated statements of operations. For operating leases for which the ROU asset has been impaired, the lease expense is determined as the sum of the amortization of the ROU asset remaining after impairment, if any, on a straight-line basis over the remaining term of the lease and the accretion of the lease liability based on the discount rate applied to the lease liability. For finance leases, the amortization of the asset is recognized over the shorter of the lease term or useful life of the underlying asset within depreciation and amortization expenses and other expenses from managed and franchised properties in our consolidated statements of operations. The interest expense related to finance leases, including any variable lease payments, is recognized in interest expense in our consolidated statements of operations.
Contract Liabilities
Contract liabilities relate to: (i) advance consideration received from hotel owners at contract inception for services considered to be part of the contract's performance obligations, such as application, initiation and other fees; (ii) advance consideration received for certain indirect reimbursements, such as system implementation fees; (iii) amounts received when points are issued under Hilton Honors, but for which revenue is not yet recognized, since the related points are not yet redeemed; and (iv) a portion of the consideration received for the pre-sale of Hilton Honors points. Contract liabilities related to advance consideration received for fees and certain indirect reimbursements are recognized ratably as revenue over the term of the related contract. Contract liabilities related to amounts received for Hilton Honors, excluding the pre-sale of Hilton Honors points, are recognized as revenue when the points are redeemed for a free or discounted good or service by the Hilton Honors
member. For the contract liabilities related to the pre-sale of Hilton Honors points, a portion is recognized as revenue from licensing fees when the related points are awarded to customers, and the remainder is recognized when customers redeem the Hilton Honors points. Contract liabilities are included in current and long-term deferred revenues in our consolidated balance sheets, with the current portion based on our estimates of the amounts that will be recognized in the next twelve months.
Hilton Honors
Hilton Honors is our guest loyalty program provided to our hotel and resort properties. All of our managed, franchised, owned and leased properties participate in the Hilton Honors program. Hilton Honors members earn points based on their spend at our participating properties and through participation in affiliated strategic partner programs. When points are earned by Hilton Honors members, they are provided with a substantive right to free or discounted goods or services in the future upon accumulation of the required level of Hilton Honors points. Points may be redeemed for the right to stay at participating properties, as well as for other goods and services from third parties, including, but not limited to, airlines, car rentals, cruises, vacation packages, shopping and dining.
As points are issued to a Hilton Honors member, the property or strategic partner pays Hilton Honors based on an estimated cost per point equal to the cost of operating the program, which includes marketing, promotion, communication and administrative expenses, as well as the estimated cost of reward redemptions. When the payments that are related to the issuance of points are received, we record amounts equal to the estimated cost per point of the future redemption obligation within liability for guest loyalty program and any amounts received in excess of the estimated cost per point within deferred revenues in our consolidated balance sheets. For the Hilton Honors fees that are charged to the participating properties, we allocate such fees to the substantive right created by the Hilton Honors points that are issued using the variable consideration allocation guidance, since the fees are directly related to the issuance of Hilton Honors points to the Hilton Honors member and Hilton's efforts to satisfy the future redemption of those Hilton Honors points. We engage third-party actuaries annually to assist in determining the fair value of the future reward redemption obligation using statistical formulas that project future point redemptions based on factors that include historical experience, an estimate of points that will eventually be redeemed, which includes an estimate of breakage (i.e., points that will never be redeemed), and the cost of reimbursing properties and other third parties with respect to other redemption opportunities available to Hilton Honors members. When points are issued as a result of a stay by a Hilton Honors member at an owned or leased hotel, we recognize a reduction in owned and leased hotel revenues, since we are also the program sponsor.
The transaction prices for the Hilton Honors points issued are reduced by the expected payments to the properties and other third parties that will provide the free or discounted good or service using the actuarial projection of the cost per point. The remaining transaction price is then further allocated to the points that are expected to be redeemed, adjusting the points that are issued for estimated breakage, and recognized when those points are redeemed. While the points are outstanding, both the estimate of the expected payments to third parties (i.e., cost per point redeemed) and the estimated breakage are reevaluated. The combined estimate that yields the amount of revenue recognized when our point obligation is satisfied is adjusted so that the final amount allocated to the substantive right of the Hilton Honors member to redeem their points for free or discounted goods and services is reflective of the amount retained by Hilton after the cost of providing the free or discounted goods and services. As a result of the COVID-19 pandemic, we temporarily suspended the expiration of Hilton Honors points, and, as a result, our estimates of breakage for both the determination of our liability for guest loyalty program and the amount of revenue recognized when our point obligation is satisfied include the anticipated point expirations that will occur at the end of the suspension.
We also earn licensing fees from strategic partnerships, including co-branded credit card arrangements (see "Management and franchise revenues" within the "Revenue Recognition" section above). The consideration received is allocated between two performance obligations based on their estimated standalone selling prices: (i) an IP license using the relief-from-royalty valuation method and (ii) substantive rights for free or discounted goods or services to the Hilton Honors members using a cost plus method based on an evaluation of other third-party administrators.
We satisfy our performance obligation related to points issued under Hilton Honors when points are redeemed for a free or discounted good or service by the Hilton Honors member, and we satisfy our performance obligation related to the IP license over time as the strategic partner simultaneously receives and consumes the benefits of the goods or services provided. Hilton reimburses participating properties and applicable third parties when points are redeemed by Hilton Honors members for stays at the participating properties or for other goods or services from the third-party providers, at which time the redemption obligation is reduced and the related deferred revenue is recognized in other revenues from managed and franchised properties in our consolidated statements of operations. Additionally, when Hilton Honors members redeem points for a free or discounted stay at our owned and leased hotels, we recognize room revenue, included in owned and leased hotel revenues in our
consolidated statements of operations. We recognized revenue of $346 million related to Hilton Honors point redemptions and license fees during the year ended December 31, 2021.
Fair Value Measurements – Valuation Hierarchy
Fair value is defined as the price that would be received to sell an asset or paid to transfer a liability in an orderly transaction between market participants on the measurement date (i.e., an exit price). We use the three-level valuation hierarchy for classification of fair value measurements. The valuation hierarchy is based upon the transparency of inputs to the valuation of an asset or liability as of the measurement date. Inputs refer broadly to the assumptions that market participants would use in pricing an asset or liability. Inputs may be observable or unobservable. Observable inputs are inputs that reflect the assumptions market participants would use in pricing the asset or liability developed based on market data obtained from independent sources. Unobservable inputs are inputs that reflect our own assumptions about the data market participants would use in pricing the asset or liability developed based on the best information available in the circumstances. The three-tier hierarchy of inputs is summarized below:
•Level 1 – Valuation is based upon quoted prices (unadjusted) for identical assets or liabilities in active markets.
•Level 2 – Valuation is based upon quoted prices for similar assets and liabilities in active markets, or other inputs that are observable for the asset or liability, either directly or indirectly, for substantially the full term of the instrument.
•Level 3 – Valuation is based upon other unobservable inputs that are significant to the fair value measurement.
The classification of assets and liabilities within the valuation hierarchy is based upon the lowest level of input that is significant to the fair value measurement in its entirety. Proper classification of fair value measurements within the valuation hierarchy is considered each reporting period. The use of different market assumptions or estimation methods may have a material effect on the estimated fair value amounts.
Estimates of the fair values of our financial instruments and nonfinancial assets are determined using available market information and appropriate valuation methods. Considerable judgment is necessary to interpret market data and develop the estimated fair values and the classification within the valuation hierarchy. We have not elected the fair value measurement option for any of our financial assets or liabilities.
Derivative Instruments
We use derivative instruments as part of our overall strategy to manage our exposure to market risks associated with fluctuations in interest rates and foreign currency exchange rates. We regularly monitor the financial stability and credit standing of the counterparties to our derivative instruments. We do not enter into derivative financial instruments for speculative purposes.
We record all derivatives at fair value. On the date the derivative contract is entered into, we may designate the derivative as a hedging instrument and, if so, we formally document all relationships between hedging activities, including the risk management objective and strategy for undertaking various hedge transactions. We generally enter into cash flow hedges (i.e., a hedge of a specific forecasted transaction or the variability of cash flows to be paid), and, in the past, we entered into net investment hedges (i.e., a hedge of an investment in a foreign operation). Changes in the fair value of a derivative that is qualified and designated as a cash flow hedge or net investment hedge are recorded in other comprehensive income (loss) in our consolidated statements of comprehensive income (loss) until they are reclassified into earnings in the same period or periods during which the hedged transaction affects earnings. If we do not specifically designate the derivative as a cash flow hedge or another type of hedging instrument, changes in the fair value of the undesignated derivative instrument are reported in current period earnings. Cash flows from designated derivative financial instruments are classified within the same category as the item being hedged in the consolidated statements of cash flows, while cash flows from undesignated derivative financial instruments are included as an investing activity.
We perform an initial prospective assessment of hedge effectiveness on a quantitative basis between the inception date and the earlier of the first quarterly hedge effectiveness date or the issuance of the financial statements that include the hedged transaction. On a quarterly basis, we assess the effectiveness of our designated hedges in offsetting the variability in the cash flows using the Hypothetical Derivative Method. This method compares the cumulative change in fair value of each hedging instrument to the cumulative change in fair value of a hypothetical hedging instrument, which has terms that identically match the critical terms of the respective hedged transactions. Thus, the hypothetical hedging instrument is presumed to perfectly
offset the hedged cash flows. Ineffectiveness results when the cumulative change in the fair value of the hedging instrument exceeds the cumulative change in the fair value of the hypothetical hedging instrument. We discontinue hedge accounting prospectively when the derivative is no longer highly effective as a hedge, the underlying hedged transaction is no longer probable or the hedging instrument expires, is sold, terminated or exercised.
Currency Translation
The U.S. dollar ("USD") is our reporting currency and is the functional currency of our entities operating in the U.S. The functional currency for our entities operating outside of the U.S. is the currency of the primary economic environment in which the respective entity operates. Assets and liabilities measured in foreign currencies are translated into USD at the prevailing foreign currency exchange rates in effect as of the financial statement date and the related gains and losses, net of applicable deferred income taxes, are reflected in accumulated other comprehensive income (loss) in our consolidated balance sheets. Income and expense accounts are translated at the average foreign currency exchange rate for the period. Gains and losses from foreign currency exchange rate changes related to transactions denominated in a currency other than an entity's functional currency or intercompany receivables and payables denominated in a currency other than an entity’s functional currency that are not of a long-term investment nature are recognized within gain (loss) on foreign currency transactions in our consolidated statements of operations. Where certain specific evidence indicates intercompany receivables and payables will not be settled in the foreseeable future and are of a long-term nature, gains and losses from foreign currency exchange rate changes are recognized as currency translation adjustment within other comprehensive income (loss) in our consolidated statements of comprehensive income (loss).
Insurance
We are self-insured for losses up to our third-party insurance deductibles for domestic general liability, auto liability, workers' compensation, employment practices liability and crime insurance at our owned, leased and managed hotels that participate in our insurance programs, in addition to other corporate related coverages. We are also self-insured for health coverage for the employees of our U.S. corporate operations and some managed hotels. In addition, through our captive insurance subsidiary, we participate in reinsurance arrangements that provide coverage and/or act as a financial intermediary for claim payments on our self-insurance program. These obligations and reinsurance arrangements can cause timing differences in the recognition of assets, liabilities, gains and losses between reporting periods, although we expect these amounts to ultimately offset when the related claims are settled. Our insurance reserves are accrued based on our deductibles related to the estimated ultimate cost of claims that occurred during the covered period, which includes claims incurred but not reported, for which we will be responsible. These estimates are prepared with the assistance of third-party actuaries and consultants. The ultimate cost of claims for a covered period are reviewed at least annually and are adjusted based on the latest information available to us, which may differ from our original estimates.
Share-Based Compensation
Under the Hilton 2017 Omnibus Incentive Plan (the "2017 Plan"), we award time-vesting restricted stock units ("RSUs"), nonqualified stock options ("options") and performance-vesting RSUs ("performance shares") to our eligible employees:
•RSUs vest in equal annual installments over two or three years from the date of grant. Vested RSUs generally will be settled for the Company's common stock, with the exception of certain awards that will be settled in cash. The grant date fair value per share is equal to the closing stock price on the date of grant.
•Options vest over three years from the date of grant in equal annual installments and terminate 10 years from the date of grant or earlier if the individual’s service terminates under certain circumstances. The exercise price is equal to the closing stock price on the date of grant. The grant date fair value per share is estimated using the Black-Scholes-Merton option-pricing model.
•Performance shares vest three years from the date of grant based on a set of specified performance measures over a defined performance period. The grant date fair value is equal to the closing stock price on the date of grant. The total number of performance shares that vest related to each performance measure is based on an achievement factor that ranges from zero percent to 200 percent, with 100 percent being the target.
We recognize these share-based payment transactions when services from the employees are rendered and recognize either a corresponding increase in additional paid-in capital or accounts payable, accrued expenses and other in our consolidated balance sheets, depending on whether the instruments granted satisfy the equity or liability classification criteria, respectively.
The measurement objective for these equity awards is the estimated fair value at the date of grant of the equity instruments that we are obligated to issue when employees have rendered the requisite service and satisfied any other conditions necessary to earn the right to benefit from the instruments. The compensation expense for an award classified as an equity instrument is recognized ratably over the requisite service period, which is the period during which an employee is required to provide service in exchange for an award. Liability awards are measured based on the award’s fair value, and the fair value is remeasured at each reporting date until the date of settlement. Compensation expense for each period until settlement is based on the change (or a portion of the change, depending on the percentage of the requisite service that has been rendered as of the reporting date) in the fair value of the instrument for each reporting period for such liability awards. Compensation expense for awards with performance conditions is recognized over the requisite service period if it is probable that the performance condition will be satisfied. If such performance conditions are not or are no longer considered probable, no compensation expense for these awards is recognized, and any previously recognized expense related to awards that are determined to be improbable of achievement is reversed. Additionally, we have a retirement provision whereby we recognize total compensation expense of the awards for eligible participants through the date their awards are fully vested. We recognize forfeitures of share-based compensation awards as they occur. Share-based compensation expense is recognized in owned and leased hotel expenses, general and administrative expenses and other expenses from managed and franchised properties in our consolidated statements of operations.
Income Taxes
We account for income taxes using the asset and liability method. The objectives of accounting for income taxes are to recognize the amount of taxes payable or refundable for the current year and to recognize the deferred tax assets and liabilities that relate to tax consequences in future years, which result from differences between the respective tax basis of assets and liabilities and their financial reporting amounts and tax attribute carryforwards. Deferred tax assets and liabilities are measured using the enacted tax rates in effect for the year in which the respective temporary differences or operating loss or tax credit carryforwards are expected to be recovered or settled. The realization of deferred tax assets and tax loss and tax credit carryforwards is contingent upon the generation of future taxable income and other restrictions that may exist under the tax laws of the jurisdiction in which a deferred tax asset exists. Valuation allowances are provided to reduce such deferred tax assets to amounts more likely than not to be ultimately realized.
We are taxed on global intangible low-tax income ("GILTI") earned by certain foreign subsidiaries, and our foreign derived intangible income ("FDII") is taxed at a lower effective rate than the statutory rate by allowing a tax deduction against the income. We recognize the current tax on GILTI as an expense in the period the tax is incurred. We include the current tax impact of both GILTI and the FDII deduction in our effective tax rate.
We use a prescribed recognition threshold for the financial statement recognition and measurement of a tax position taken in a tax return. For all income tax positions, we first determine whether it is more likely than not that a tax position will be sustained upon examination, including resolution of any related appeals or litigation processes, based on the technical merits of the position. If it is determined that a position meets the more-likely-than-not recognition threshold, the benefit recognized in the financial statements is measured as the largest amount of benefit that is greater than 50 percent likely of being realized upon settlement.
Loss Contingencies
We are involved in various claims and lawsuits arising in the ordinary course of business, the outcomes of which are subject to significant uncertainty. We also provide various types of guarantees and other assistance in the form of letters of credit and financing to certain owners of hotels that we currently or plan to manage or franchise, with varying degrees of certainty with respect to the ultimate timing and amount of cash flows that might be expended under such agreements. An estimated loss from a loss contingency will be accrued as a charge to income if it is probable a loss has been incurred and the amount of the loss can be reasonably estimated. We evaluate, among other factors, the degree of probability of an unfavorable outcome and the ability to make a reasonable estimate of the amount of loss in determining whether an accrual of an estimated loss is appropriate.
Recently Issued Accounting Pronouncements
In November 2021, the Financial Accounting Standards Board issued ASU No. 2021-10 ("ASU 2021-10"), Government Assistance (Topic 832): Disclosures by Business Entities about Government Assistance, which requires entities to provide annual disclosures about the nature of material existing government assistance agreements and the impact of such agreements on the entity's financial statements. The provisions of ASU 2021-10 are effective for fiscal years beginning after December 15,
2021; early adoption is permitted. We do not expect the adoption of this ASU or its application in future periods to have a material effect on our consolidated financial statements.
Note 3: Disposal
In 2019, we completed the sale of the Hilton Odawara Resort & Spa for a price of 13 billion Japanese yen (equivalent to $122 million as of the closing date) and subsequently entered into a 30-year management contract with the purchaser of the hotel. As a result of the sale, we recognized a pre-tax gain of $81 million included in gain on sale of assets, net in our consolidated statement of operations for the year ended December 31, 2019.
Note 4: Revenues from Contracts with Customers
Contract Liabilities
The following table summarizes the activity of our contract liabilities during the year ended December 31, 2021:
| | | | | |
| (in millions) |
Balance as of December 31, 2020 | $ | 1,312 | |
Cash received in advance and not recognized as revenue | 138 | |
Revenue recognized(1)(2) | (455) | |
Other(3) | 171 | |
Balance as of December 31, 2021 | $ | 1,166 | |
____________
(1)Primarily related to Hilton Honors, including co-branded credit card arrangements.
(2)Revenue recognized during the year ended December 31, 2021 included $25 million for performance obligations that were satisfied in a prior period as a result of a change to the estimated breakage of Hilton Honors points for which point expirations have been temporarily suspended.
(3)Primarily represents changes in estimated transaction prices for our performance obligations related to points issued under Hilton Honors, which had no effect on revenues.
Hilton Honors Points Pre-Sale
In April 2020, we pre-sold Hilton Honors points to American Express for $1.0 billion in cash (the "Honors Points Pre-Sale"). American Express and their respective designees may use the points in connection with Hilton Honors co-branded credit cards and for promotions, rewards and incentive programs or certain other activities that they may establish or engage in from time to time. Upon receipt of the cash, we recognized $636 million in deferred revenues and the remainder in liability for guest loyalty program, which is recognized as revenue as discussed in Note 2: "Basis of Presentation and Summary of Significant Accounting Policies" and for which the remaining deferred revenue as of December 31, 2021 is included in our co-branded credit card arrangement performance obligation below.
Performance Obligations
As of December 31, 2021, we had deferred revenues for unsatisfied performance obligations consisting of: (i) $384 million related to Hilton Honors that will be recognized as revenue over approximately the next two years; (ii) $151 million related to co-branded credit card arrangements, primarily from the Honors Points Pre-Sale; and (iii) $631 million related to application, initiation and other fees.
Note 5: Consolidated Variable Interest Entities
As of December 31, 2021 and 2020, we consolidated two VIEs that each lease a hotel property. We consolidated these VIEs since we are the primary beneficiary, having the power to direct the activities that most significantly affect their economic performance. Additionally, we have the obligation to absorb losses and the right to receive benefits that could be significant to each of the VIEs individually. The assets of our consolidated VIEs are only available to settle the obligations of the respective entities, and the liabilities of the consolidated VIEs are non-recourse to us.
Our consolidated balance sheets include the assets and liabilities of these entities, which primarily comprised the following:
| | | | | | | | | | | |
| December 31, |
| 2021 | | 2020 |
| (in millions) |
| Cash and cash equivalents | $ | 18 | | | $ | 40 | |
| Property and equipment, net | 60 | | | 76 | |
| Deferred income tax assets | 62 | | | 57 | |
| Other non-current assets | 62 | | | 66 | |
| Accounts payable, accrued expenses and other | 15 | | | 27 | |
Long-term debt(1) | 179 | | | 203 | |
| Other long-term liabilities | 16 | | | 17 | |
____________
(1)Includes finance lease liabilities of $153 million and $184 million as of December 31, 2021 and 2020, respectively.
As of December 31, 2021, the VIEs had revolving credit facilities with borrowing capacities totaling 4.5 billion Japanese yen ("JPY") (equivalent to $39 million), with 500 million JPY (equivalent to $4 million) included in long-term debt in our consolidated balance sheet, resulting in available borrowing capacities totaling 4.0 billion JPY (equivalent to $35 million). There were no amounts drawn under these facilities as of December 31, 2020. In December 2021, our consolidated VIEs borrowed an aggregate of 600 million JPY (equivalent to $5 million), which was also included in long-term debt in our consolidated balance sheet as of December 31, 2021. See Note 9: Debt for additional information.
Note 6: Goodwill and Intangible Assets
Goodwill
During the year ended December 31, 2020, we fully impaired the goodwill attributable to our ownership reporting unit, recognizing impairment losses of $104 million in our consolidated statement of operations; see Note 11: "Fair Value Measurements" for additional information. As such, as of December 31, 2021 and 2020, our goodwill balance was only attributable to our management and franchise reporting unit, which had no accumulated impairment losses as of either date, and the change during the year ended December 31, 2021 was due to foreign currency translation.
Intangible Assets
Changes to our brands intangible assets during the year ended December 31, 2021 were due to foreign currency translation.
Finite-lived intangible assets were as follows:
| | | | | | | | | | | | | | | | | |
| December 31, 2021 |
| Gross Carrying Value | | Accumulated Amortization | | Net Carrying Value |
| (in millions) |
| Management and franchise contracts: | | | | | |
Management contracts recorded at Merger(1) | $ | 310 | | | $ | (275) | | | $ | 35 | |
Contract acquisition costs | 780 | | | (170) | | | 610 | |
| Development commissions and other | 140 | | | (27) | | | 113 | |
| $ | 1,230 | | | $ | (472) | | | $ | 758 | |
| Other intangible assets: | | | | | |
| Capitalized software costs | $ | 561 | | | $ | (460) | | | $ | 101 | |
Leases(1) | 138 | | | (83) | | | 55 | |
Hilton Honors(1) | 339 | | | (301) | | | 38 | |
| $ | 1,038 | | | $ | (844) | | | $ | 194 | |
| | | | | | | | | | | | | | | | | |
| December 31, 2020 |
| Gross Carrying Value | | Accumulated Amortization | | Net Carrying Value |
| (in millions) |
| Management and franchise contracts: | | | | | |
Management contracts recorded at Merger(1) | $ | 317 | | | $ | (261) | | | $ | 56 | |
Contract acquisition costs(2) | 632 | | | (144) | | | 488 | |
| Development commissions and other | 132 | | | (23) | | | 109 | |
| $ | 1,081 | | | $ | (428) | | | $ | 653 | |
| Other intangible assets: | | | | | |
| Capitalized software costs | $ | 522 | | | $ | (378) | | | $ | 144 | |
Leases(1)(3) | 157 | | | (95) | | | 62 | |
Hilton Honors(1) | 342 | | | (282) | | | 60 | |
| $ | 1,021 | | | $ | (755) | | | $ | 266 | |
____________
(1)Represents intangible assets that were initially recorded at fair value at the time of the Merger.
(2)During the year ended December 31, 2020, we recognized impairment losses of $15 million included in our consolidated statement of operations.
(3)During the year ended December 31, 2020, we recognized impairment losses of $46 million included in our consolidated statement of operations. See Note 11: "Fair Value Measurements" for additional information.
Amortization of our finite-lived intangible assets was as follows:
| | | | | | | | | | | | | | | | | |
| Year Ended December 31, |
| 2021 | | 2020 | | 2019 |
| (in millions) |
Recognized in depreciation and amortization expenses(1) | $ | 135 | | | $ | 274 | | | $ | 286 | |
Recognized as a reduction of franchise and licensing fees and base and other management fees | 32 | | | 29 | | | 29 | |
____________
(1)Includes amortization expense of $47 million, $164 million and $202 million for the years ended December 31, 2021, 2020 and 2019, respectively, associated with assets that were initially recorded at their fair value at the time of the Merger, some of which fully amortized during 2020.
We estimate future amortization expense of our finite-lived intangible assets that will be recognized in depreciation and amortization expenses as of December 31, 2021 to be as follows:
| | | | | |
| Year | (in millions) |
| 2022 | $ | 110 | |
| 2023 | 74 | |
| 2024 | 24 | |
| 2025 | 10 | |
| 2026 | 9 | |
| Thereafter | 115 | |
| $ | 342 | |
Note 7: Property and Equipment
Property and equipment were as follows:
| | | | | | | | | | | |
| December 31, |
| 2021 | | 2020 |
| (in millions) |
| Land | $ | 9 | | | $ | 11 | |
Buildings and leasehold improvements | 365 | | | 381 | |
| Furniture and equipment | 339 | | | 346 | |
| Construction-in-progress | 14 | | | 7 | |
| Finance lease ROU assets | 83 | | | 87 | |
| 810 | | | 832 | |
Accumulated depreciation and amortization(1) | (505) | | | (486) | |
| $ | 305 | | | $ | 346 | |
____________
(1)During the years ended December 31, 2021, 2020 and 2019, depreciation and amortization expenses on property and equipment was $53 million,$57 million and $60 million, respectively.
During the year ended December 31, 2020, we recognized $28 million of impairment losses in our consolidated statement of operations related to property and equipment, net, of which $4 million related to finance lease ROU assets. See Note 11: "Fair Value Measurements" for additional information.
Note 8: Accounts Payable, Accrued Expenses and Other
Accounts payable, accrued expenses and other were as follows:
| | | | | | | | | | | |
| December 31, |
| 2021 | | 2020 |
| (in millions) |
| Accrued employee compensation and benefits | $ | 514 | | | $ | 404 | |
| Accounts payable | 274 | | | 224 | |
| Operating lease liabilities, current | 140 | | | 170 | |
| Insurance reserves, current | 84 | | | 68 | |
Other current liabilities and accrued expenses(1) | 556 | | | 436 | |
| $ | 1,568 | | | $ | 1,302 | |
____________
(1)Includes deposit liabilities related to hotel operations and application fees, promotional liabilities and income taxes payable, as well as accrued expenses related to taxes, interest and other.
Note 9: Debt
Long-term Debt
Long-term debt balances, including obligations for finance leases, and associated interest rates and maturities as of December 31, 2021, were as follows:
| | | | | | | | | | | |
| December 31, |
| 2021 | | 2020 |
| (in millions) |
| Senior secured revolving credit facility, due 2024 | $ | — | | | $ | 1,690 | |
Senior secured term loan facility with a rate of 1.85%, due 2026 | 2,619 | | | 2,619 | |
Senior notes with a rate of 5.375%, due 2025 | 500 | | | 500 | |
Senior notes with a rate of 5.125%, due 2026 | — | | | 1,500 | |
Senior notes with a rate of 4.875%, due 2027 | 600 | | | 600 | |
Senior notes with a rate of 5.750%, due 2028 | 500 | | | 500 | |
Senior notes with a rate of 3.750%, due 2029 | 800 | | | 800 | |
Senior notes with a rate of 4.875%, due 2030 | 1,000 | | | 1,000 | |
Senior notes with a rate of 4.000%, due 2031 | 1,100 | | | 1,100 | |
Senior notes with a rate of 3.625%, due 2032 | 1,500 | | | — | |
Finance lease liabilities with a weighted average rate of 5.88%, due 2022 to 2030 | 208 | | | 252 | |
Other debt of consolidated VIEs with a weighted average rate of 2.15%, due 2022 to 2028 | 26 | | | 19 | |
| 8,853 | | | 10,580 | |
| Less: unamortized deferred financing costs and discount | (87) | | | (93) | |
Less: current maturities of long-term debt(1) | (54) | | | (56) | |
| $ | 8,712 | | | $ | 10,431 | |
____________
(1)Represents current maturities of finance lease liabilities and, as of December 31, 2021, the outstanding borrowings under the revolving credit facility of a consolidated VIE.
Senior Notes
As part of our response to the COVID-19 pandemic, we completed senior note financing transactions during 2020 and early 2021 in an effort to extend the maturities and reduce the interest rates of our outstanding debt, as well as to bolster liquidity and add to our available cash at that point in time.
In February 2021, we issued $1.5 billion aggregate principal amount of 3.625% Senior Notes due 2032 (the "2032 Senior Notes") and incurred $21 million of debt issuance costs. Interest on the 2032 Senior Notes is payable semi-annually in arrears on February 15 and August 15 of each year, beginning August 15, 2021. We used the net proceeds from the issuance, together with available cash, to redeem all $1.5 billion in aggregate principal amount of our outstanding 5.125% Senior Notes due 2026, plus accrued and unpaid interest. In connection with the redemption, we paid a redemption premium of $55 million and accelerated the recognition of the unamortized deferred financing costs related to the redeemed notes of $14 million, which were both included in loss on debt extinguishment in our consolidated statement of operations for the year ended December 31, 2021.
In December 2020, we issued $800 million aggregate principal amount of 3.750% Senior Notes due 2029 (the "2029 Senior Notes") and $1.1 billion aggregate principal amount of 4.000% Senior Notes due 2031 (the "2031 Senior Notes") and incurred $27 million of debt issuance costs. Interest on the 2029 Senior Notes and the 2031 Senior Notes is payable semi-annually in arrears on May 1 and November 1 of each year, beginning May 1, 2021. We used the net proceeds from the issuances, together with available cash, to redeem all $1.0 billion in aggregate principal amount of our outstanding 4.250% Senior Notes due 2024 and all $900 million in aggregate principal amount of our outstanding 4.625% Senior Notes due 2025, plus accrued and unpaid interest. In connection with these redemptions, we paid redemption premiums totaling $31 million and accelerated the recognition of unamortized deferred financing costs related to the redeemed notes of $17 million, which were both included in loss on debt extinguishments in our consolidated statement of operations for the year ended December 31, 2020.
In April 2020, we issued $500 million aggregate principal amount of 5.375% Senior Notes due 2025 (the "2025 Senior Notes") and $500 million aggregate principal amount of 5.750% Senior Notes due 2028 (the "2028 Senior Notes") and incurred
$14 million of debt issuance costs. Interest on the 2025 Senior Notes and the 2028 Senior Notes is payable semi-annually in arrears on May 1 and November 1 of each year, beginning November 1, 2020.
In June 2019, we issued $1.0 billion aggregate principal amount of 4.875% Senior Notes due 2030 (the "2030 Senior Notes"). We used a portion of the net proceeds from the issuance to repay $500 million outstanding on our senior secured term loan facility (the "Term Loan") and to repay $225 million outstanding on the senior secured revolving credit facility (the "Revolving Credit Facility"). As a result of the repayment and simultaneous amendment of the Term Loan, we accelerated the recognition of $10 million of unamortized deferred financing costs and discount and fees, which were included in other non-operating income, net in our consolidated statement of operations during the year ended December 31, 2019.
The 2025 Senior Notes, the 4.875% Senior Notes due 2027, the 2028 Senior Notes, the 2029 Senior Notes, the 2030 Senior Notes, the 2031 Senior Notes and the 2032 Senior Notes are collectively referred to as the Senior Notes and are jointly and severally guaranteed on a senior unsecured basis by the Parent and substantially all of its direct and indirect wholly owned domestic restricted subsidiaries, other than Hilton Domestic Operating Company Inc. ("HOC"), an indirect wholly owned subsidiary of the Parent and the issuer of all of the series of Senior Notes.
Senior Secured Credit Facilities
Our senior secured credit facilities consist of the $1.75 billion Revolving Credit Facility, of which $250 million is available in the form of letters of credit, and the Term Loan. The obligations of our senior secured credit facilities are unconditionally and irrevocably guaranteed by the Parent and substantially all of its direct and indirect wholly owned domestic restricted subsidiaries. During the year ended December 31, 2021, we fully repaid the $1,690 million outstanding debt balance on the Revolving Credit Facility, which we borrowed in 2020 in response to the COVID-19 pandemic. As of December 31, 2021, we had $60 million of letters of credit outstanding on the Revolving Credit Facility, resulting in an available borrowing capacity of $1,690 million.
Other Debt of Consolidated VIEs
In August 2021, one of our consolidated VIEs borrowed 500 million JPY (equivalent to $4 million as of December 31, 2021) on its revolving credit facility, which has a maturity date of June 2022; refer to Note 5: "Consolidated Variable Interest Entities" for additional information on the revolving credit facilities of our consolidated VIEs. In December 2021, our two consolidated VIEs each borrowed 300 million JPY (totaling to an equivalent of $5 million as of December 31, 2021) with zero percent interest rates and maturity dates in November 2024 and November 2028.
Debt Maturities
The contractual maturities of our long-term debt as of December 31, 2021 were as follows:
| | | | | |
| Year | (in millions) |
| 2022 | $ | 54 | |
| 2023 | 26 | |
| 2024 | 26 | |
| 2025 | 523 | |
| 2026 | 2,660 | |
| Thereafter | 5,564 | |
| $ | 8,853 | |
Note 10: Other Liabilities
Other long-term liabilities were as follows:
| | | | | | | | | | | |
| December 31, |
| 2021 | | 2020 |
| (in millions) |
| Other long-term tax liabilities | $ | 385 | | | $ | 400 | |
Insurance reserves | 151 | | | 189 | |
| Deferred employee compensation and benefits | 111 | | | 116 | |
| Pension obligations | 25 | | | 143 | |
| Other | 74 | | | 141 | |
| $ | 746 | | | $ | 989 | |
Note 11: Fair Value Measurements
The fair values of certain financial instruments and the hierarchy level we used to estimate the fair values are shown below:
| | | | | | | | | | | | | | | | | | | | | | | |
| December 31, 2021 |
| | | Hierarchy Level |
| Carrying Value | | Level 1 | | Level 2 | | Level 3 |
| (in millions) |
| Assets: | | | | | | | |
| Cash equivalents | $ | 622 | | | $ | — | | | $ | 622 | | | $ | — | |
| Liabilities: | | | | | | | |
Long-term debt(1) | 8,532 | | | 6,180 | | | — | | | 2,599 | |
| Interest rate swaps | 41 | | | — | | | 41 | | | — | |
| | | | | | | | | | | | | | | | | | | | | | | |
| December 31, 2020 |
| | | Hierarchy Level |
| Carrying Value | | Level 1 | | Level 2 | | Level 3 |
| (in millions) |
| Assets: | | | | | | | |
| Cash equivalents | $ | 2,270 | | | $ | — | | | $ | 2,270 | | | $ | — | |
| Liabilities: | | | | | | | |
Long-term debt(1) | 10,216 | | | 6,366 | | | — | | | 4,293 | |
| Interest rate swaps | 82 | | | — | | | 82 | | | — | |
____________
(1)The carrying values include unamortized deferred financing costs and discount. The carrying values and fair values exclude finance lease liabilities and other debt of consolidated VIEs.
The fair values of financial instruments not included in these tables are estimated to be equal to their carrying values as of December 31, 2021 and 2020.
We measure our interest rate swaps at fair value, which was determined using a discounted cash flow analysis that reflects the contractual terms of the interest rate swaps, including the period to maturity, and uses observable market-based inputs of similar instruments, including interest rate curves, as applicable. Our interest rate swaps are included in other long-term liabilities in our consolidated balance sheets.
Our nonfinancial assets that were measured at fair value on a non-recurring basis during the year ended December 31, 2020, and for which we recorded impairment losses as a result of the COVID-19 pandemic, were primarily related to certain hotel properties under operating and finance leases and goodwill, all of which were part of our ownership reporting unit. See Note 6: "Goodwill and Intangible Assets", Note 7: "Property and Equipment" and Note 12: "Leases" for additional information on these impairment losses.
For the quantitative analysis of goodwill that was performed during the year ended December 31, 2020, we estimated the fair value of the ownership reporting unit using discounted cash flow analyses and significant level 3 unobservable inputs, which included an estimate of the impact of the COVID-19 pandemic on the reporting unit's expected future cash flows, a stabilized growth rate after recovery and the present value of the reporting unit's terminal value. The expected future cash flows were discounted using a discount rate that reflected the market rate of return. As a result of the non-recurring fair value measurement, we fully impaired the goodwill attributable to our ownership reporting unit, recognizing impairment losses of $104 million in our consolidated statement of operations for the year ended December 31, 2020.
During the year ended December 31, 2020, we estimated the fair value of assets related to certain hotel properties under operating and finance leases, including related lease intangible assets, operating and finance lease ROU assets and property and equipment, using discounted cash flow analyses and significant level 3 unobservable inputs, which included an estimate of the impact of the COVID-19 pandemic on each leased property based on the expected recovery term, stabilized growth rates after recovery and discount rates reflecting the risk profile of the underlying cash flows and the individual markets where the assets are located. As a result of these non-recurring fair value measurements, we recognized impairment losses on these assets of $139 million in our consolidated statement of operations during the year ended December 31, 2020.
Note 12: Leases
We lease hotel properties, land, corporate office space and equipment used at hotels and corporate offices, with our most significant lease liabilities related to hotel properties. As of December 31, 2021, we leased 43 hotels under operating leases and five hotels under finance leases, two of which were the liabilities of consolidated VIEs, which are non-recourse to us. Our hotel leases expire at various dates, with varying renewal and termination options.
During the year ended December 31, 2020, we recognized $65 million and $4 million of impairment losses related to certain operating lease and finance lease ROU assets, respectively; see Note 11: "Fair Value Measurements" for additional information.
Supplemental balance sheet information related to leases was as follows:
| | | | | | | | | | | |
| December 31, |
| 2021 | | 2020 |
| (dollars in millions) |
| Operating leases: | | | |
| Operating lease right-of-use assets | $ | 694 | | | $ | 772 | |
| Accounts payable, accrued expenses and other | 140 | | | 170 | |
| Operating lease liabilities | 870 | | | 971 | |
| | | |
| Finance leases: | | | |
| Property and equipment, net | $ | 33 | | | $ | 40 | |
| Current maturities of long-term debt | 50 | | | 56 | |
| Long-term debt | 158 | | | 196 | |
| | | |
| Weighted average remaining lease term: | | | |
| Operating leases | 11.0 years | | 12.3 years |
| Finance leases | 7.0 years | | 7.8 years |
| | | |
| Weighted average discount rate: | | | |
| Operating leases | 3.87 | % | | 3.82 | % |
| Finance leases | 5.88 | % | | 5.85 | % |
The components of lease expense were as follows:
| | | | | | | | | | | | | | | | | |
| Year Ended December 31, |
| 2021 | | 2020 | | 2019 |
| (in millions) |
| Operating lease expense for fixed payments | $ | 125 | | | $ | 129 | | | $ | 144 | |
| Finance lease expense: | | | | | |
| Amortization of ROU assets | 23 | | | 26 | | | 30 | |
| Fixed interest on lease liabilities | 13 | | | 14 | | | 14 | |
Variable lease expense(1) | 35 | | | 17 | | | 168 | |
____________
(1)Includes amounts related to variable rent expense for operating leases and variable interest expense for finance leases.
Supplemental cash flow information related to leases was as follows:
| | | | | | | | | | | | | | | | | |
| Year Ended December 31, |
| 2021 | | 2020 | | 2019 |
| (in millions) |
| Cash paid for amounts included in the measurement of lease liabilities: | | | | | |
| Operating cash flows from operating leases | $ | 187 | | | $ | 149 | | | $ | 187 | |
| Financing cash flows from finance leases | 40 | | | 26 | | | 42 | |
| ROU assets obtained in exchange for lease liabilities in non-cash transactions: | | | | | |
| Operating leases | 45 | | | 33 | | | 48 | |
| Finance leases | 17 | | | 20 | | | 61 | |
Our future minimum lease payments as of December 31, 2021 were as follows:
| | | | | | | | | | | |
| Operating
Leases | | Finance
Leases |
| Year | (in millions) |
| 2022 | $ | 177 | | | $ | 61 | |
| 2023 | 146 | | | 35 | |
| 2024 | 122 | | | 31 | |
| 2025 | 119 | | | 28 | |
| 2026 | 107 | | | 28 | |
| Thereafter | 587 | | | 72 | |
| Total minimum lease payments | 1,258 | | | 255 | |
| Less: imputed interest | (248) | | | (47) | |
| Total lease liabilities | $ | 1,010 | | | $ | 208 | |
Note 13: Income Taxes
Income Tax Provision (Benefit)
Our income tax provision (benefit) includes federal, state and foreign income taxes payable. The domestic and foreign components of income (loss) before income taxes were as follows:
| | | | | | | | | | | | | | | | | |
| Year Ended December 31, |
| 2021 | | 2020 | | 2019 |
| (in millions) |
| U.S. income (loss) before income taxes | $ | 631 | | | $ | (267) | | | $ | 867 | |
| Foreign income (loss) before income taxes | (71) | | | (657) | | | 377 | |
| Income (loss) before income taxes | $ | 560 | | | $ | (924) | | | $ | 1,244 | |
The components of our provision (benefit) for income taxes were as follows:
| | | | | | | | | | | | | | | | | |
| Year Ended December 31, |
| 2021 | | 2020 | | 2019 |
| (in millions) |
| Current: | | | | | |
| Federal | $ | 89 | | | $ | (6) | | | $ | 190 | |
| State | 45 | | | (32) | | | 60 | |
| Foreign | 23 | | | 69 | | | 128 | |
| Total current | 157 | | | 31 | | | 378 | |
| Deferred: | | | | | |
| Federal | 51 | | | (102) | | | (61) | |
| State | (14) | | | (34) | | | (5) | |
| Foreign | (41) | | | (99) | | | 46 | |
| Total deferred | (4) | | | (235) | | | (20) | |
| Total provision (benefit) for income taxes | $ | 153 | | | $ | (204) | | | $ | 358 | |
Reconciliations of the provision (benefit) for income taxes at the U.S. statutory rate to the provision (benefit) for income taxes were as follows:
| | | | | | | | | | | | | | | | | |
| Year Ended December 31, |
| 2021 | | 2020 | | 2019 |
| (in millions) |
| Statutory U.S. federal income tax provision (benefit) | $ | 118 | | | $ | (194) | | | $ | 261 | |
| State income taxes, net of U.S. federal income tax benefit | 22 | | | (24) | | | 47 | |
| Impact of foreign operations | 8 | | | (106) | | | 31 | |
| Goodwill impairment losses | — | | | 22 | | | — | |
| Tax rate differential on U.S. federal net operating loss carryback | — | | | (14) | | | — | |
| Changes in deferred tax asset valuation allowances | 34 | | | 116 | | | 13 | |
Income tax rate changes(1) | (45) | | | — | | | — | |
| Provision for uncertain tax positions | 15 | | | 7 | | | 16 | |
| Nondeductible compensation | 15 | | | — | | | — | |
| Excess tax benefits related to share-based compensation | (10) | | | — | | | — | |
| Other, net | (4) | | | (11) | | | (10) | |
| Provision (benefit) for income taxes | $ | 153 | | | $ | (204) | | | $ | 358 | |
____________
(1)Income tax rate changes resulted in the remeasurement of our deferred tax assets and liabilities and other tax liabilities to the new tax rates, resulting in a $49 million deferred tax benefit and a $4 million current tax expense, respectively, which were recognized during the year ended December 31, 2021.
Deferred Income Taxes
Deferred income taxes represent the tax effect of the differences between the book and tax bases of assets and liabilities plus carryforward items. The tax effects of the temporary differences and carryforwards that give rise to our net deferred taxes were as follows:
| | | | | | | | | | | |
| December 31, |
| 2021 | | 2020 |
| (in millions) |
| Deferred tax assets: | | | |
| Net tax loss carryforwards and carrybacks | $ | 649 | | | $ | 593 | |
| Compensation | 101 | | | 135 | |
| Reserves | 76 | | | 71 | |
| Operating and finance lease liabilities | 341 | | | 382 | |
| Deferred income | 278 | | | 271 | |
| Foreign tax credit carryforwards | 48 | | | 48 | |
| Other | 144 | | | 153 | |
| Total gross deferred tax assets | 1,637 | | | 1,653 | |
| Less: valuation allowance | (669) | | | (654) | |
| Deferred tax assets | 968 | | | 999 | |
| Deferred tax liabilities: | | | |
| Brands | (1,152) | | | (1,147) | |
| Finite-lived intangible assets | (61) | | | (74) | |
| Investment in foreign subsidiaries | (24) | | | (26) | |
| Operating and finance lease ROU assets | (218) | | | (207) | |
| Deferred tax liabilities | (1,455) | | | (1,454) | |
| Net deferred taxes | $ | (487) | | | $ | (455) | |
As of December 31, 2021, we had: (i) state net operating loss carryforwards of $69 million, which resulted in deferred tax assets of $4 million; (ii) separate return limitation year loss carryforwards of $221 million, which resulted in federal deferred tax assets of $44 million and state deferred tax assets of $11 million; and (iii) foreign net operating loss carryforwards of $2.2 billion and other foreign tax loss carryforwards of $129 million, resulting in deferred tax assets of $556 million and $34 million, respectively. Approximately $44 million of our deferred tax assets as of December 31, 2021 related to net operating loss carryforwards that will expire between 2022 and 2041 with less than $1 million of that amount expiring in 2022. Approximately $516 million of our deferred tax assets as of December 31, 2021 resulted from net operating loss carryforwards that are not subject to expiration. Approximately $90 million of our deferred tax assets as of December 31, 2021 resulted from other tax loss carryforwards that are not subject to expiration. We believe that it is more likely than not that the benefit from certain federal, state and foreign tax loss carryforwards will not be realized. In recognition of this assessment, we provided a valuation allowance of $488 million as of December 31, 2021 on the deferred tax assets relating to these tax loss carryforwards. As of December 31, 2021, we also had deferred tax assets for foreign tax credit carryforwards of $48 million that will expire within eight years, for which we have provided full valuation allowances.
During the year ended December 31, 2021, we generated net operating losses in various jurisdictions and recorded a deferred tax benefit of $49 million for net operating losses, reduced by valuation allowances of $7 million, which resulted in a net deferred tax benefit of $42 million. We have also provided valuation allowances of $27 million on other deferred tax assets generated during the year. Management determined whether we were more likely than not to realize the benefit of these assets by considering all available positive and negative evidence to determine whether sufficient future taxable income will be generated to permit the use of the deferred tax assets. Additionally, revaluations of certain existing deferred tax assets and their associated valuation allowances due to tax rate changes, foreign currency exchange rate changes and other changes resulted in no net income tax expense or benefit in the current year, but decreased total valuation allowances by $19 million. Overall, our total valuation allowance increased by $15 million during the year ended December 31, 2021.
Tax Uncertainties
We file income tax returns, including returns for our subsidiaries, with federal, state, local and foreign tax jurisdictions. We are under regular and recurring audit by the Internal Revenue Service ("IRS") and other taxing authorities on open tax positions. The timing of the resolution of tax audits is highly uncertain, as are the amounts, if any, that may ultimately be paid upon such resolution. Changes may result from the conclusion of ongoing audits, appeals or litigation in federal, state, local and foreign
tax jurisdictions or from the resolution of various proceedings between the U.S. and foreign tax authorities. As of December 31, 2021, we remain subject to federal and state examinations of our income tax returns for tax years from 2005 through 2021 and foreign examinations of our income tax returns for tax years from 1996 through 2021.
Reconciliations of the beginning and ending amounts of unrecognized tax benefits were as follows:
| | | | | | | | | | | | | | | | | |
| Year Ended December 31, |
| 2021 | | 2020 | | 2019 |
| (in millions) |
| Balance at beginning of year | $ | 451 | | | $ | 395 | | | $ | 318 | |
| Additions for tax positions related to prior years | 33 | | | 45 | | | 67 | |
| Additions for tax positions related to the current year | 2 | | | 56 | | | 13 | |
| Reductions for tax positions related to prior years | (39) | | | (13) | | | (3) | |
| Settlements | (66) | | | (37) | | | 1 | |
| Lapse of statute of limitations | (2) | | | (1) | | | (2) | |
| Currency translation adjustment | (4) | | | 6 | | | 1 | |
| Balance at end of year | $ | 375 | | | $ | 451 | | | $ | 395 | |
In prior periods, we received assessments for the tax years from 2006 through 2013 seeking proposed adjustments related to assertions by the IRS that: (i) certain foreign currency denominated intercompany loans from our foreign subsidiaries to certain U.S. subsidiaries should be recharacterized as equity for U.S. federal income tax purposes and constitute deemed dividends from such foreign subsidiaries to our U.S. subsidiaries and (ii) in calculating the amount of U.S. taxable income resulting from Hilton Honors, we should not reduce gross income by the estimated costs of future redemptions, but rather such costs would be deductible at the time the points are redeemed. As of December 31, 2021, we had entered into a tentative agreement to pay $48 million to settle both matters through the 2010 tax year, for which we had previously recorded reserves of $39 million. The settlement is subject to approval by the Joint Committee on Taxation. We continue to be subject to audit by the IRS on the two matters described above for the tax years subsequent to those subject to the settlement and may be assessed tax in the future on these same matters, and the amounts of such future assessments may be material. We have evaluated the amount of benefit more likely than not to be realized for these two matters and, as of December 31, 2021, we had recorded $49 million of unrecognized tax benefits related to these issues for the tax years 2011 through 2021. Subsequent to the aforementioned settlement, $36 million remains unsettled related to the two matters described above for the tax years from 2011 through 2013 and could result in additional U.S. federal income taxes.
The decrease to our unrecognized tax benefits during the year ended December 31, 2021 primarily related to a tentative settlement agreement reached with the IRS for the tax years from 2006 through 2010. Additionally, reserves decreased due to the current year decrease in the liability for Hilton Honors. The increase to our unrecognized tax benefits during the year ended December 31, 2020 primarily related to uncertainty regarding prior year income tax returns in certain foreign jurisdictions where we operate, as well as the addition of reserves related to Hilton Honors. These increases were partially offset by reductions and settlements, primarily relating to the conclusion of certain state audits. The increase to our unrecognized tax benefits during the year ended December 31, 2019 primarily related to uncertainty regarding affirmative refund claims submitted to the IRS during 2019, as well as the addition of reserves related to Hilton Honors.
We recognize interest and penalties accrued related to uncertain tax positions in income tax benefit (expense) in our consolidated statements of operations. During the years ended December 31, 2021, 2020 and 2019, we recognized income tax expense related to interest and penalties of $16 million, $13 million and $12 million, respectively, in our consolidated statements of operations. As of both December 31, 2021 and 2020, we had accrued approximately $65 million for interest and penalties related to our unrecognized tax benefits in our consolidated balance sheets. Included in the balances of unrecognized tax benefits as of December 31, 2021 and 2020 were $343 million and $400 million, respectively, associated with positions that, if favorably resolved, would provide a benefit to our effective income tax rate. As a result of the expected resolution of examination issues with foreign tax authorities, we believe it is reasonably possible that during the next 12 months, the amount of unrecognized tax benefits will decrease by up to $35 million.
Note 14: Employee Benefit Plans
We sponsor multiple domestic and international employee benefit plans (the "pension plans"), and the benefits are based upon years of service and compensation.
The employee benefit plan in the U.S. (the "Domestic Plan") covers certain employees not earning union benefits. This plan was frozen for participant benefit accruals in 1996; therefore, the projected benefit obligation is equal to the accumulated
benefit obligation. The plan assets will be used to pay benefits due to employees for service through December 31, 1996. Since employees have not accrued additional benefits from that time, we do not utilize salary or pension inflation assumptions in calculating our benefit obligation for the Domestic Plan.
The employee benefit plans covering many of our international employees include: (i) a plan that covers employees in the U.K. (the "U.K. Plan"), which was frozen to further service accruals in 2013 and (ii) a number of smaller plans that cover employees in various countries around the world (the "International Plans").
The annual measurement date for all of our plans is December 31. We are required to recognize the funded status of our pension plans, which is the difference between the fair value of plan assets and the projected benefit obligations, in our consolidated balance sheets and make corresponding adjustments for changes in the difference between the fair value of plan assets and the projected benefit obligations through accumulated other comprehensive income (loss), net of taxes.
The following table presents the projected benefit obligation, fair value of plan assets, funded status and accumulated benefit obligation for the Domestic Plan, the U.K. Plan and the International Plans:
| | | | | | | | | | | | | | | | | | | | | | | | | | | | | | | | | | | |
| Domestic Plan | | U.K. Plan | | International Plans |
| 2021 | | 2020 | | 2021 | | 2020 | | 2021 | | 2020 |
| (in millions) |
| Change in projected benefit obligation | | | | | | | | | | | |
| Benefit obligation at beginning of year | $ | 399 | | | $ | 382 | | | $ | 541 | | | $ | 445 | | | $ | 90 | | | $ | 87 | |
| Service cost | — | | | — | | | 2 | | | 3 | | | 1 | | | 1 | |
| Interest cost | 6 | | | 10 | | | 5 | | | 8 | | | 2 | | | 2 | |
| Actuarial loss (gain) | (11) | | | 31 | | | (32) | | | 78 | | | (3) | | | 2 | |
| Settlements | — | | | (1) | | | — | | | — | | | (1) | | | — | |
| Effect of foreign currency exchange rates | — | | | — | | | (4) | | | 22 | | | (4) | | | 3 | |
| Benefits paid | (24) | | | (23) | | | (22) | | | (15) | | | (4) | | | (5) | |
| Benefit obligation at end of year | $ | 370 | | | $ | 399 | | | $ | 490 | | | $ | 541 | | | $ | 81 | | | $ | 90 | |
| | | | | | | | | | | |
| Change in plan assets | | | | | | | | | | | |
| Fair value of plan assets at beginning of year | $ | 343 | | | $ | 318 | | | $ | 485 | | | $ | 404 | | | $ | 70 | | | $ | 68 | |
| Actual return on plan assets, net of expenses | 44 | | | 41 | | | 36 | | | 66 | | | 7 | | | 3 | |
| Employer contributions | 11 | | | 8 | | | 11 | | | 10 | | | 2 | | | 2 | |
| Settlements | — | | | (1) | | | — | | | — | | | (1) | | | — | |
| Effect of foreign currency exchange rates | — | | | — | | | (5) | | | 20 | | | (3) | | | 2 | |
| Benefits paid | (24) | | | (23) | | | (22) | | | (15) | | | (4) | | | (5) | |
| Fair value of plan assets at end of year | 374 | | | 343 | | | 505 | | | 485 | | | 71 | | | 70 | |
Funded status at end of year (underfunded) | 4 | | | (56) | | | 15 | | | (56) | | | (10) | | | (20) | |
| Accumulated benefit obligation | $ | 370 | | | $ | 399 | | | $ | 490 | | | $ | 541 | | | $ | 81 | | | $ | 90 | |
Amounts recognized in our consolidated balance sheets consisted of the following:
| | | | | | | | | | | | | | | | | | | | | | | | | | | | | | | | | | | |
| Domestic Plan | | U.K. Plan | | International Plans |
| 2021 | | 2020 | | 2021 | | 2020 | | 2021 | | 2020 |
| (in millions) |
| Other non-current assets | $ | 4 | | | $ | — | | | $ | 15 | | | $ | — | | | $ | 15 | | | $ | 11 | |
| Other liabilities | — | | | (56) | | | — | | | (56) | | | (25) | | | (31) | |
| Net amount recognized | $ | 4 | | | $ | (56) | | | $ | 15 | | | $ | (56) | | | $ | (10) | | | $ | (20) | |
Amounts recognized in accumulated other comprehensive loss consisted of the following:
| | | | | | | | | | | | | | | | | | | | | | | | | | | | | | | | | | | | | | | | | | | | | | | | | | | | | |
| Domestic Plan | | U.K. Plan | | International Plans |
| 2021 | | 2020 | | 2019 | | 2021 | | 2020 | | 2019 | | 2021 | | 2020 | | 2019 |
| (in millions) |
| Net actuarial loss (gain) | $ | (38) | | | $ | 4 | | | $ | (3) | | | $ | (48) | | | $ | 41 | | | $ | 29 | | | $ | (7) | | | $ | 3 | | | $ | 3 | |
| Prior service cost | (4) | | | (4) | | | (4) | | | — | | | — | | | (3) | | | — | | | — | | | — | |
| Amortization of net loss | (5) | | | (4) | | | (3) | | | (5) | | | (4) | | | (3) | | | (1) | | | (1) | | | (1) | |
| Net amount recognized | $ | (47) | | | $ | (4) | | | $ | (10) | | | $ | (53) | | | $ | 37 | | | $ | 23 | | | $ | (8) | | | $ | 2 | | | $ | 2 | |
The net periodic pension cost (credit) was as follows:
| | | | | | | | | | | | | | | | | | | | | | | | | | | | | | | | | | | | | | | | | | | | | | | | | | | | | |
| Domestic Plan | | U.K. Plan | | International Plans |
| 2021 | | 2020 | | 2019 | | 2021 | | 2020 | | 2019 | | 2021 | | 2020 | | 2019 |
| (in millions) |
Service cost(1) | $ | 3 | | | $ | 3 | | | $ | 6 | | | $ | 2 | | | $ | 3 | | | $ | 2 | | | $ | 1 | | | $ | 1 | | | $ | 2 | |
Interest cost(2) | 6 | | | 10 | | | 14 | | | 5 | | | 8 | | | 10 | | | 2 | | | 2 | | | 2 | |
Expected return on plan assets(2) | (19) | | | (17) | | | (19) | | | (21) | | | (20) | | | (19) | | | (3) | | | (3) | | | (3) | |
Amortization of prior service cost(2) | 4 | | | 4 | | | 4 | | | — | | | — | | | — | | | — | | | — | | | — | |
Amortization of net loss(2) | 5 | | | 4 | | | 3 | | | 5 | | | 4 | | | 3 | | | 1 | | | 1 | | | 1 | |
Net periodic pension cost (credit) | $ | (1) | | | $ | 4 | | | $ | 8 | | | $ | (9) | | | $ | (5) | | | $ | (4) | | | $ | 1 | | | $ | 1 | | | $ | 2 | |
____________
(1)Recognized in owned and leased hotel expenses and general and administrative expenses, as applicable, in our consolidated statements of operations.
(2)Recognized in other non-operating income (loss), net in our consolidated statements of operations.
The weighted average assumptions used to determine benefit obligations were as follows:
| | | | | | | | | | | | | | | | | | | | | | | | | | | | | | | | | | | |
| Domestic Plan | | U.K. Plan | | International Plans |
| 2021 | | 2020 | | 2021 | | 2020 | | 2021 | | 2020 |
| Discount rate | 2.8 | % | | 2.4 | % | | 1.9 | % | | 1.3 | % | | 2.3 | % | | 1.8 | % |
| Salary inflation | N/A | | N/A | | 2.6 | | | 2.1 | | | 2.3 | | | 2.2 | |
| Pension inflation | N/A | | N/A | | 3.1 | | | 2.7 | | | 1.9 | | | 1.8 | |
The weighted average assumptions used to determine net periodic pension cost (credit) were as follows:
| | | | | | | | | | | | | | | | | | | | | | | | | | | | | | | | | | | | | | | | | | | | | | | | | | | | | |
| Domestic Plan | | U.K. Plan | | International Plans |
| 2021 | | 2020 | | 2019 | | 2021 | | 2020 | | 2019 | | 2021 | | 2020 | | 2019 |
| Discount rate | 2.6 | % | | 3.2 | % | | 4.3 | % | | 1.3 | % | | 2.1 | % | | 3.1 | % | | 1.7 | % | | 2.0 | % | | 3.1 | % |
| Expected return on plan assets | 6.3 | | | 6.3 | | | 7.0 | | | 4.5 | | | 5.0 | | | 5.5 | | | 2.4 | | | 2.7 | | | 4.3 | |
| Salary inflation | N/A | | N/A | | N/A | | 2.1 | | | 1.6 | | | 1.8 | | | 2.2 | | | 2.2 | | | 2.2 | |
| Pension inflation | N/A | | N/A | | N/A | | 2.7 | | | 2.8 | | | 3.0 | | | 1.8 | | | 1.9 | | | 1.8 | |
The investment objectives for the various plans are preservation of capital, current income and long-term growth of capital. All plan assets are managed by third-party investment managers and do not include investments in Hilton stock. Asset allocations are reviewed periodically by the investment managers.
Expected long-term returns on plan assets are determined using historical performance for debt and equity securities held by our plans, actual performance of plan assets and current and expected market conditions. Expected returns are formulated based on the target asset allocation. As of December 31, 2021 and 2020, the target asset allocation, as a percentage of total plan assets, for the Domestic Plan was 75 percent and 80 percent, respectively, in funds that invest in equity securities and 25 percent and 20 percent, respectively, in funds that invest in debt securities. As of December 31, 2021 and 2020, the target asset allocation, as a percentage of total plan assets, for the U.K. Plan and International Plans was 75 percent in funds that invest in equity and debt securities and 25 percent in bond funds.
The following tables present the fair value hierarchy of total plan assets measured at fair value by asset category:
| | | | | | | | | | | | | | | | | |
| December 31, 2021 |
| Domestic Plan | | U.K. Plan | | International Plans |
| (in millions) |
| Level 1 | | | | | |
Cash | $ | — | | | $ | 12 | | | $ | 12 | |
Equity funds | — | | | — | | | 3 | |
Bond funds | 3 | | | 42 | | | — | |
| Level 2 | | | | | |
Equity funds | — | | | — | | | 4 | |
Bond funds | — | | | 34 | | | 6 | |
Net asset value(1) | | | | | |
Cash equivalents | — | | | 34 | | | — | |
Equity funds | — | | | 86 | | | |
Bond funds | — | | | 69 | | | — | |
Common collective trusts | 371 | | | — | | | 46 | |
Alternative investments | — | | | 168 | | | — | |
Other | — | | | 60 | | | — | |
| $ | 374 | | | $ | 505 | | | $ | 71 | |
| | | | | | | | | | | | | | | | | |
| December 31, 2020 |
| Domestic Plan | | U.K. Plan | | International Plans |
| (in millions) |
| Level 1 | | | | | |
Cash and cash equivalents | $ | — | | | $ | 45 | | | $ | 12 | |
Equity funds | — | | | 75 | | | 3 | |
Bond funds | 2 | | | 43 | | | — | |
Alternative investments | — | | | 105 | | | — | |
| Level 2 | | | | | |
Equity funds | — | | | — | | | 4 | |
Bond funds | — | | | — | | | 6 | |
Net asset value(1) | | | | | |
Bond funds | — | | | 74 | | | — | |
Common collective trusts | 341 | | | — | | | 45 | |
Alternative investments | — | | | 87 | | | — | |
Other | — | | | 56 | | | — | |
| $ | 343 | | | $ | 485 | | | $ | 70 | |
____________
(1)Certain investments are measured at net asset value per share as a practical expedient and, therefore, have not been classified in the fair value hierarchy.
As of December 31, 2021, the benefits expected to be paid in the next five years and in the aggregate for the five years thereafter were as follows:
| | | | | | | | | | | | | | | | | |
| Domestic Plan | | U.K. Plan | | International Plans |
| Year | (in millions) |
| 2022 | $ | 33 | | | $ | 21 | | | $ | 12 | |
| 2023 | 27 | | | 22 | | | 5 | |
| 2024 | 26 | | | 22 | | | 5 | |
| 2025 | 26 | | | 23 | | | 4 | |
| 2026 | 25 | | | 23 | | | 4 | |
| 2027-2031 | 114 | | | 125 | | | 22 | |
| $ | 251 | | | $ | 236 | | | $ | 52 | |
In 2007, the Domestic Plan and plans maintained for certain domestic hotels currently or formerly managed by us were merged into a multiple employer plan. As of December 31, 2021 and 2020, the multiple employer plan had combined plan assets of $405 million and $372 million, respectively, and a projected benefit obligation of $395 million and $426 million, respectively.
Note 15: Share-Based Compensation
We recognized share-based compensation expense of $193 million, $97 million and $154 million during the years ended December 31, 2021, 2020 and 2019, respectively, which included amounts reimbursed by hotel owners. The total tax benefit recognized related to share-based compensation expense was $54 million, $35 million and $41 million for the years ended December 31, 2021, 2020 and 2019, respectively. Share-based compensation expense recognized during the year ended December 31, 2020 included the reversal of expense recognized in prior years as a result of the determination that the performance conditions of our then-outstanding performance shares were no longer probable of achievement, partially offset by expense recorded in December 2020 as a result of the modification of our then-outstanding performance shares.
As of December 31, 2021, unrecognized compensation costs for unvested awards under the 2017 Plan were approximately $132 million, which are expected to be recognized over a weighted average period of 1.6 years on a straight-line basis. As of December 31, 2021, there were 12.2 million shares of common stock available for future issuance under the 2017 Plan, including any shares subject to awards outstanding under the 2013 Omnibus Incentive Plan that will become available for issuance under the 2017 Plan if such outstanding awards expire or are terminated or are canceled or forfeited.
RSUs
The following table provides information about our RSU grants:
| | | | | | | | | | | | | | | | | |
| Year Ended December 31, |
| 2021 | | 2020 | | 2019 |
| Number of shares granted (in thousands) | 589 | | | 942 | | | 963 | |
| Weighted average grant date fair value per share | $ | 123.13 | | | $ | 93.48 | | | $ | 83.47 | |
| Aggregate intrinsic value of shares vested (in millions) | $ | 94 | | | $ | 97 | | | $ | 92 | |
The following table summarizes the activity of our RSUs during the year ended December 31, 2021:
| | | | | | | | | | | |
| Number of Shares | | Weighted Average Grant Date Fair Value per Share |
| (in thousands) | | |
Outstanding as of December 31, 2020 | 1,493 | | | $ | 88.55 | |
| Granted | 589 | | | 123.13 | |
| Vested | (760) | | | 86.66 | |
| Forfeited | (76) | | | 100.94 | |
Outstanding as of December 31, 2021 | 1,246 | | | 105.28 | |
Options
The following table provides information about our option grants:
| | | | | | | | | | | | | | | | | |
| Year Ended December 31, |
| 2021 | | 2020 | | 2019 |
| Number of options granted (in thousands) | 361 | | | 755 | | | 758 | |
| Weighted average exercise price per share | $ | 123.13 | | | $ | 93.33 | | | $ | 83.11 | |
| Weighted average grant date fair value per share | $ | 41.15 | | | $ | 21.47 | | | $ | 21.08 | |
The weighted average grant date fair value per share of the option grants for each year was determined using the Black-Scholes-Merton option-pricing model with the following assumptions:
| | | | | | | | | | | | | | | | | |
| Year Ended December 31, |
| 2021 | | 2020 | | 2019 |
Expected volatility(1) | 33.13 | % | | 23.69 | % | | 23.51 | % |
Dividend yield(2) | — | % | | 0.55 | % | | 0.81 | % |
Risk-free rate(3) | 0.92 | % | | 0.96 | % | | 2.47 | % |
Expected term (in years)(4) | 6.0 | | 6.0 | | 6.0 |
____________
(1)Estimated using a blended approach of historical and implied volatility. Historical volatility is based on the historical movement of Hilton's stock price for a period that corresponds to the expected life of the option.
(2)For options granted during the years ended December 31, 2020 and 2019, dividend yield was estimated based on our historical quarterly dividends and the three-month average stock price at the date of grant. However, after the 2020 options were granted, we suspended the declaration and payment of dividends and, at the time of grant for the 2021 options, we could not estimate when the payment of dividends would resume.
(3)Based on the yields of U.S. Department of Treasury instruments with similar expected lives.
(4)Estimated using the average of the vesting periods and the contractual terms of the options.
The following table summarizes the activity of our options during the year ended December 31, 2021:
| | | | | | | | | | | |
| Number of Shares | | Weighted Average Exercise Price per Share |
| (in thousands) | | |
Outstanding as of December 31, 2020 | 3,027 | | | $ | 71.88 | |
| Granted | 361 | | | 123.13 | |
| Exercised | (566) | | | 64.25 | |
| Forfeited | (19) | | | 100.84 | |
Outstanding as of December 31, 2021(1) | 2,803 | | | 80.03 | |
Exercisable as of December 31, 2021(2) | 1,799 | | | 67.85 | |
____________
(1)The aggregate intrinsic value was $210 million and the weighted average remaining contractual term was 6.5 years.
(2)The aggregate intrinsic value was $157 million and the weighted average remaining contractual term was 5.5 years.
Performance Shares
In December 2020, we modified our performance shares that were originally awarded in 2018, 2019 and 2020 in response to the COVID-19 pandemic and its negative impact on the hospitality industry and, ultimately, the Company's performance. The modifications were structured to reward for results achieved prior to the COVID-19 pandemic, retain senior business leaders and incentivize for the recovery efforts via metrics most meaningful in assessing our performance during our recovery from the adverse impact of the pandemic. Under the terms of the modified awards, a portion of the outstanding performance shares granted in 2019 were modified to vest based on performance prior to the pandemic and continued service, and the remaining portion of those performance shares, as well as the shares granted in 2020, were converted to performance shares that will vest based on different performance measures from those under the original award agreements. The modified terms did not change the vesting schedules of the original awards, and, as such, the performance shares that were originally awarded in 2018 and 2019 vested in December 2020 and December 2021, respectively.
As a result of the performance share modifications, we recognized incremental share-based compensation expense of $70 million and $44 million during the years ended December 31, 2021 and 2020, respectively, and we expect to recognize the remaining incremental expense of $23 million during 2022. As of December 31, 2021, we determined that all of the performance measures for the outstanding performance shares were probable of achievement, with the applicable achievement factors estimated to be between the target and maximum achievement percentages.
The following table provides information about our performance share grants for the last three years:
| | | | | | | | | | | | | | | | | |
| Year Ended December 31, |
| 2021 | | 2020(1) | | 2019(1) |
| Number of shares granted (in thousands) | 241 | | | 348 | | | 384 | |
| Weighted average grant date fair value per share | $ | 123.13 | | | $ | 93.33 | | | $ | 83.11 | |
| Aggregate intrinsic value of shares vested (in millions) | $ | 36 | | | $ | 58 | | | $ | — | |
____________
(1)In December 2020, 288,000 and 340,000 performance shares from the 2020 grant and 2019 grant, respectively, were modified, as discussed above, with a modification date fair value per share of $102.95.
The following table summarizes the activity of our performance shares for all of our performance measures during the year ended December 31, 2021:
| | | | | | | | | | | |
| Number of Shares | | Weighted Average Grant Date Fair Value per Share |
| (in thousands) | | |
Outstanding as of December 31, 2020 | 1,020 | | | $ | 84.57 | |
| Granted | 241 | | | 123.13 | |
| Vested | (391) | | | 79.42 | |
| Forfeited | (22) | | | 94.55 | |
Outstanding as of December 31, 2021 | 848 | | | 97.63 | |
Note 16: Earnings (Loss) Per Share
The following table presents the calculation of basic and diluted earnings (loss) per share ("EPS"):
| | | | | | | | | | | | | | | | | |
| Year Ended December 31, |
| 2021 | | 2020 | | 2019 |
| (in millions, except per share amounts) |
| Basic EPS: | | | | | |
| Numerator: | | | | | |
Net income (loss) attributable to Hilton stockholders | $ | 410 | | | $ | (715) | | | $ | 881 | |
| Denominator: | | | | | |
| Weighted average shares outstanding | 279 | | | 277 | | | 287 | |
| Basic EPS | $ | 1.47 | | | $ | (2.58) | | | $ | 3.07 | |
| | | | | |
| Diluted EPS: | | | | | |
| Numerator: | | | | | |
Net income (loss) attributable to Hilton stockholders | $ | 410 | | | $ | (715) | | | $ | 881 | |
| Denominator: | | | | | |
Weighted average shares outstanding(1) | 281 | | | 277 | | | 290 | |
Diluted EPS(1) | $ | 1.46 | | | $ | (2.58) | | | $ | 3.04 | |
____________
(1)Certain shares related to share-based compensation were excluded from the calculation of diluted EPS because their effect would have been anti-dilutive under the treasury stock method, including less than 1 million shares, 4 million shares, as revised, and 1 million shares for the years ended December 31, 2021, 2020 and 2019, respectively. The dilutive shares related to share-based compensation included in the previously reported weighted average shares outstanding of 279 million for the year ended December 31, 2020 were revised in the current period presentation, as the previously reported dilutive shares were determined to be anti-dilutive as a result of the net loss attributable to Hilton stockholders reported during the period. The result of the revision is an immaterial decrease in the previously reported diluted EPS for the year ended December 31, 2020 of $0.02.
Note 17: Accumulated Other Comprehensive Loss
The components of accumulated other comprehensive loss, net of taxes, were as follows:
| | | | | | | | | | | | | | | | | | | | | | | |
| Currency Translation Adjustment(1) | | Pension Liability Adjustment(2) | | Cash Flow Hedge Adjustment(3) | | Total |
| (in millions) |
| Balance as of December 31, 2018 | $ | (545) | | | $ | (260) | | | $ | 23 | | | $ | (782) | |
Other comprehensive loss before reclassifications | (5) | | | (17) | | | (35) | | | (57) | |
Amounts reclassified from accumulated other comprehensive loss | 1 | | | 8 | | | (10) | | | (1) | |
Net current period other comprehensive loss | (4) | | | (9) | | | (45) | | | (58) | |
| Balance as of December 31, 2019 | (549) | | | (269) | | | (22) | | | (840) | |
Other comprehensive income (loss) before reclassifications | 33 | | | (30) | | | (46) | | | (43) | |
Amounts reclassified from accumulated other comprehensive loss | 5 | | | 10 | | | 8 | | | 23 | |
Net current period other comprehensive income (loss) | 38 | | | (20) | | | (38) | | | (20) | |
| Balance as of December 31, 2020 | (511) | | | (289) | | | (60) | | | (860) | |
Other comprehensive income (loss) before reclassifications | (36) | | | 68 | | | 11 | | | 43 | |
Amounts reclassified from accumulated other comprehensive loss | 7 | | | 11 | | | 20 | | | 38 | |
Net current period other comprehensive income (loss) | (29) | | | 79 | | | 31 | | | 81 | |
| Balance as of December 31, 2021 | $ | (540) | | | $ | (210) | | | $ | (29) | | | $ | (779) | |
____________
(1)Includes net investment hedge gains and intra-entity foreign currency transactions that are of a long-term investment nature. Amounts reclassified related to the liquidation of investments in foreign entities which were recognized in our consolidated statements of operations in loss on sales of assets, net during the year ended December 31, 2021 and in loss on foreign currency transactions during the years ended December 31, 2020 and 2019.
(2)Amounts reclassified related to the amortization of prior service cost and amortization of net loss and were recognized in other non-operating income (loss), net in our consolidated statements of operations.
(3)Amounts reclassified were the result of hedging instruments, including: (a) interest rate swaps, inclusive of interest rate swaps that were dedesignated and subsequently settled, with related amounts recognized in interest expense in our consolidated statements of operations and (b) forward contracts that hedge our foreign currency denominated fees, with related amounts recognized in various revenue line items, as applicable, in our consolidated statements of operations.
Note 18: Business Segments
We are a hospitality company with operations organized in two distinct operating segments: (i) management and franchise and (ii) ownership, each of which is reported as a segment based on (i) delivering a similar set of products and services and (ii) being managed separately given its distinct economic characteristics.
The management and franchise segment includes all of the hotels we manage for third-party owners, as well as all franchised hotels that license our IP, and where we provide other contracted services to third-party owners, but the day-to-day services of the hotels are operated or managed by someone other than us. This segment generates its revenue from: (i) management and franchise fees charged to third-party owners; (ii) licensing fees from HGV and strategic partnerships, including co-branded credit card arrangements, for the right to use our IP; and (iii) fees for managing hotels in our ownership segment. As of December 31, 2021, this segment included 745 managed hotels and 5,978 franchised hotels consisting of 1,047,262 total rooms. As a result of the COVID-19 pandemic, during the years ended December 31, 2021 and 2020, the operations of certain hotels in our management and franchise segment were suspended for some period of time. As of December 31, 2021, nearly all of these hotels had reopened.
As of December 31, 2021, our ownership segment included 54 properties totaling 18,151 rooms. The segment comprised 46 hotels that we leased, one hotel owned by a consolidated non-wholly owned entity, two hotels that were each leased by a consolidated VIE and five hotels owned or leased by unconsolidated affiliates. On December 31, 2021, five of our leased hotels exited our system or transferred to our management and franchise segment and, therefore, they are not included in the number of leased hotels as of December 31, 2021. Further, as a result of the COVID-19 pandemic, during the years ended December 31, 2021 and 2020, the operations of certain hotels in our ownership segment were suspended for some period of time; however, all of the hotels in our ownership segment that had suspended operations at some point as a result of the pandemic were open as of December 31, 2021.
The performance of our operating segments is evaluated primarily on operating income (loss), without allocating amortization of contract acquisition costs, other revenues, other revenues and other expenses from managed and franchised properties, other expenses or general and administrative expenses.
The following table presents revenues for our reportable segments, reconciled to consolidated amounts:
| | | | | | | | | | | | | | | | | |
| Year Ended December 31, |
| 2021 | | 2020 | | 2019 |
| (in millions) |
| Franchise and licensing fees | $ | 1,508 | | | $ | 956 | | | $ | 1,691 | |
Base and other management fees(1) | 203 | | | 144 | | | 394 | |
| Incentive management fees | 98 | | | 38 | | | 230 | |
| Management and franchise | 1,809 | | | 1,138 | | | 2,315 | |
| Ownership | 598 | | | 421 | | | 1,422 | |
| Segment revenues | 2,407 | | | 1,559 | | | 3,737 | |
| Amortization of contract acquisition costs | (32) | | | (29) | | | (29) | |
| Other revenues | 79 | | | 73 | | | 101 | |
Direct reimbursements from managed and franchised properties(2) | 1,503 | | | 1,375 | | | 3,110 | |
Indirect reimbursements from managed and franchised properties(2) | 1,841 | | | 1,332 | | | 2,576 | |
Intersegment fees elimination(1) | (10) | | | (3) | | | (43) | |
| Total revenues | $ | 5,788 | | | $ | 4,307 | | | $ | 9,452 | |
____________
(1)Includes management, royalty and IP fees charged to our ownership segment by our management and franchise segment, which were eliminated in our consolidated statements of operations.
(2)Included in other revenues from managed and franchised properties in our consolidated statements of operations.
The following table presents operating income (loss) for our reportable segments, reconciled to consolidated income (loss) before income taxes:
| | | | | | | | | | | | | | | | | |
| Year Ended December 31, |
| 2021 | | 2020 | | 2019 |
| (in millions) |
Management and franchise(1) | $ | 1,809 | | | $ | 1,138 | | | $ | 2,315 | |
Ownership(1) | (91) | | | (202) | | | 125 | |
| Segment operating income | 1,718 | | | 936 | | | 2,440 | |
| Amortization of contract acquisition costs | (32) | | | (29) | | | (29) | |
| Other revenues, less other expenses | 34 | | | 13 | | | 29 | |
| Net other expenses from managed and franchised properties | (110) | | | (397) | | | (77) | |
| Depreciation and amortization expenses | (188) | | | (331) | | | (346) | |
| General and administrative expenses | (405) | | | (311) | | | (441) | |
| Reorganization costs | — | | | (41) | | | — | |
| Impairment losses | — | | | (258) | | | — | |
| Gain (loss) on sales of assets, net | (7) | | | — | | | 81 | |
| Operating income (loss) | 1,010 | | | (418) | | | 1,657 | |
| Interest expense | (397) | | | (429) | | | (414) | |
| Loss on foreign currency transactions | (7) | | | (27) | | | (2) | |
| Loss on debt extinguishments | (69) | | | (48) | | | — | |
| Other non-operating income (loss), net | 23 | | | (2) | | | 3 | |
| Income (loss) before income taxes | $ | 560 | | | $ | (924) | | | $ | 1,244 | |
____________
(1)Includes management, royalty and IP fees charged to our ownership segment by our management and franchise segment, which were eliminated in our consolidated statements of operations.
The following table presents total assets of our reportable segments, reconciled to consolidated amounts:
| | | | | | | | | | | |
| December 31, |
| 2021 | | 2020 |
| (in millions) |
| Management and franchise | $ | 11,404 | | | $ | 11,065 | |
| Ownership | 1,061 | | | 1,242 | |
| Corporate and other | 2,976 | | | 4,448 | |
| $ | 15,441 | | | $ | 16,755 | |
Total revenues by country were as follows:
| | | | | | | | | | | | | | | | | |
| Year Ended December 31, |
| 2021 | | 2020 | | 2019 |
| (in millions) |
| U.S. | $ | 4,765 | | | $ | 3,593 | | | $ | 7,423 | |
All other(1) | 1,023 | | | 714 | | | 2,029 | |
| $ | 5,788 | | | $ | 4,307 | | | $ | 9,452 | |
____________
(1)There are no countries included in these amounts that individually represented more than 10 percent of total revenues for the years ended December 31, 2021, 2020 and 2019.
Property and equipment, net by country was as follows:
| | | | | | | | | | | |
| December 31, |
| 2021 | | 2020 |
| (in millions) |
| U.S. | $ | 112 | | | $ | 128 | |
| U.K. | 77 | | | 79 | |
| Japan | 60 | | | 77 | |
All other(1) | 56 | | | 62 | |
| $ | 305 | | | $ | 346 | |
____________
(1)There are no countries included in these amounts that individually represented more than 10 percent of total property and equipment, net as of December 31, 2021 and 2020.
Note 19: Commitments and Contingencies
We provide performance guarantees to certain owners of hotels that we operate under management contracts. Most of these guarantees do not require us to fund shortfalls, but allow for termination of the contract, if specified operating performance levels are not achieved. However, in limited cases, we are obligated to fund performance shortfalls, creating variable interests in the ownership entities of the hotels, of which we are not the primary beneficiary. As of December 31, 2021, we had performance guarantees with expirations ranging from 2025 to 2043 and possible cash outlays totaling approximately $10 million. Our obligations under these guarantees in future periods are dependent on the operating performance level of the related hotel over the remaining term of the performance guarantee. We have included the impact of the COVID-19 pandemic on these hotels in our expectations of their future operating performance, and, as of December 31, 2021 and 2020, we accrued current liabilities of $2 million and $7 million, respectively, for our performance guarantees. We may enter into new contracts containing performance guarantees in the future, which could increase our possible cash outlays.
As of December 31, 2021, we had debt guarantees for hotels that we will or currently manage or franchise totaling $35 million with expirations ranging from 2023 to 2026. Additionally, Hilton had extended two letters of credit totaling $26 million to the owner of a hotel that we will manage to satisfy debt service reserve requirements for their debt with a third party. Each letter of credit will expire at the earlier of the date at which it is fully drawn or 2031.
We receive fees from managed and franchised properties that we are contractually required to use to operate our marketing, sales and brand programs on behalf of hotel owners. As of December 31, 2020, we had collected amounts in excess of amounts
expended, representing an obligation to spend these amounts on the programs. However, as of December 31, 2021, amounts expended and recognized on behalf of these programs exceeded the amounts collected.
We are involved in various claims and lawsuits arising in the ordinary course of business, some of which include claims for substantial sums. While the ultimate results of claims and litigation cannot be predicted with certainty, we expect that the ultimate resolution of all pending or threatened claims and litigation as of December 31, 2021 will not have a material adverse effect on our consolidated financial position, results of operations or cash flows.
Item 9. Changes in and Disagreements with Accountants on Accounting and Financial Disclosure
None.
Item 9A. Controls and Procedures
Disclosure Controls and Procedures
The Company maintains a set of disclosure controls and procedures as that term is defined in Rules 13a-15(e) and 15d-15(e) under the Exchange Act, that are designed to ensure that information required to be disclosed by the Company in reports that it files or submits under the Exchange Act, is recorded, processed, summarized and reported within the time periods specified in SEC rules and forms, and that such information is accumulated and communicated to the Company's management, including its Chief Executive Officer and Chief Financial Officer, as appropriate, to allow timely decisions regarding required disclosures. The design of any disclosure controls and procedures is based in part upon certain assumptions about the likelihood of future events, and there can be no assurance that any design will succeed in achieving its stated goals under all potential future conditions. Any controls and procedures, no matter how well designed and operated, can provide only reasonable, not absolute, assurance of achieving the desired control objectives. In accordance with Rule 13a-15(b) of the Exchange Act, as of the end of the period covered by this annual report, an evaluation was carried out under the supervision and with the participation of the Company’s management, including its Chief Executive Officer and Chief Financial Officer, of the effectiveness of its disclosure controls and procedures. Based on that evaluation, the Company’s Chief Executive Officer and Chief Financial Officer concluded that the Company’s disclosure controls and procedures, as of the end of the period covered by this annual report, were effective to provide reasonable assurance that information required to be disclosed by the Company in reports that it files or submits under the Exchange Act is recorded, processed, summarized and reported within the time periods specified in SEC rules and forms and is accumulated and communicated to the Company’s management, including the Chief Executive Officer and Chief Financial Officer, as appropriate to allow timely decisions regarding required disclosure.
Management’s Annual Report on Internal Control Over Financial Reporting
We have set forth management's report on internal control over financial reporting and the attestation report of our independent registered public accounting firm on the effectiveness of our internal control over financial reporting in Item 8 of this Annual Report on Form 10-K. Management's report on internal control over financial reporting is incorporated in this Item 9A by reference.
Changes in Internal Control Over Financial Reporting
There has been no change in the Company’s internal control over financial reporting during the Company’s most recent fiscal quarter that has materially affected, or is reasonably likely to materially affect, the Company’s internal control over financial reporting.
Item 9B. Other Information
None.
Item 9C. Disclosure Regarding Foreign Jurisdictions that Prevent Inspections
Not applicable.
PART III
Item 10. Directors, Executive Officers and Corporate Governance
The information required by this item is incorporated by reference to our definitive proxy statement for the 2022 Annual Meeting of Stockholders to be filed with the SEC within 120 days of the fiscal year ended December 31, 2021.
Item 11. Executive Compensation
The information required by this item is incorporated by reference to our definitive proxy statement for the 2022 Annual Meeting of Stockholders to be filed with the SEC within 120 days of the fiscal year ended December 31, 2021.
Item 12. Security Ownership of Certain Beneficial Owners and Management and Related Stockholder Matters
Securities Authorized for Issuance Under Equity Compensation Plans
The following table provides certain information about common stock that may be issued under our existing equity compensation plans. The only plan pursuant to which the Company may grant new equity-based awards is the Hilton 2017 Omnibus Incentive Plan, which replaced the Company's 2013 Omnibus Incentive Plan. The number of securities to be issued upon exercise of outstanding options, warrants and rights reflected in the table below includes shares underlying equity-based awards granted, and that remained outstanding as of December 31, 2021 under the equity compensation plans.
| | | | | | | | | | | | | | | | | |
| As of December 31, 2021 |
| Number of securities to be issued upon exercise of outstanding options, warrants and rights(1) | | Weighted average exercise price per share of outstanding options | | Number of securities remaining available for future issuance under equity compensation plans |
| Equity compensation plans approved by stockholders | 5,749,950 | | | $ | 80.03 | | | 12,183,407 | |
____________
(1)Includes shares issuable upon exercise of stock options and 2,947,125 shares that may be issued upon the vesting of certain share-based compensation awards. The number of shares to be issued in respect of performance shares has been calculated based on the assumption that the maximum levels of performance applicable to the performance shares will be achieved. The RSUs and performance shares cannot be exercised for consideration.
The remaining information required by this item is incorporated by reference to our definitive proxy statement for the 2022 Annual Meeting of Stockholders to be filed with the SEC within 120 days of the fiscal year ended December 31, 2021.
Item 13. Certain Relationships and Related Transactions, and Director Independence
The information required by this item is incorporated by reference to our definitive proxy statement for the 2022 Annual Meeting of Stockholders to be filed with the SEC within 120 days of the fiscal year ended December 31, 2021.
Item 14. Principal Accounting Fees and Services
The information required by this item is incorporated by reference to our definitive proxy statement for the 2022 Annual Meeting of Stockholders to be filed with the SEC within 120 days of the fiscal year ended December 31, 2021.
PART IV
Item 15. Exhibits and Financial Statement Schedules
The following documents are filed as part of this report:
(a)Financial Statements
We include this portion of Item 15 under Item 8 of this Annual Report on Form 10-K.
(b)Financial Statement Schedules
All schedules are omitted as the required information is either not present, not present in material amounts or presented within the consolidated financial statements or related notes.
(c)Exhibits:
| | | | | | | | |
| Exhibit Number | | Exhibit Description |
| 2.1 | | |
| 3.1 | | |
| 3.2 | | |
| 3.3 | | |
| 4.1 | | |
| 4.2 | | |
| 4.3 | | |
| 4.4 | | |
| 4.5 | | |
| 4.6 | | |
| 4.7 | | |
| 4.8 | | |
| 4.9 | | |
| 4.10 | | |
| 4.11 | | |
| 4.12 | | |
| 4.13 | | |
| 4.14 | | |
| | | | | | | | |
| Exhibit Number | | Exhibit Description |
| 4.15 | | |
| 4.16 | | |
| 4.17 | | |
| 4.18 | | |
| 4.19 | | |
| 4.20 | | |
| 10.1 | | Credit Agreement, dated as of October 25, 2013, among Hilton Worldwide Holdings Inc., as parent, Hilton Worldwide Finance LLC, as borrower, the other guarantors from time to time party thereto, Deutsche Bank AG New York Branch, as administrative agent, collateral agent, swing line lender and L/C issuer, and the other lenders from time to time party thereto (incorporated by reference to Exhibit 10.1 to the Company’s Registration Statement on Form S-1 filed on November 8, 2013). |
| 10.2 | | Amendment No. 1, dated as of August 18, 2016, to the Credit Agreement, dated as of October 25, 2013, by and among Hilton Worldwide Holdings Inc., Hilton Worldwide Finance LLC, the other guarantors party thereto from time to time, Deutsche Bank AG New York Branch as administrative agent, collateral agent, swing line lender and L/C issuer and the other lenders party thereto from time to time (incorporated by reference to Exhibit 10.2 to the Company's Current Report on Form 8-K filed on August 18, 2016). |
| 10.3 | | Amendment No. 2, dated as of November 21, 2016, to the Credit Agreement, dated as of October 25, 2013 (as amended), by and among Hilton Worldwide Holdings Inc., Hilton Worldwide Finance LLC, the other guarantors party thereto from time to time, Deutsche Bank AG New York Branch as administrative agent, collateral agent, swing line lender and L/C issuer and the other lenders party thereto from time to time (incorporated by reference to Exhibit 10.1 to the Company's Current Report on Form 8-K filed on November 23, 2016). |
| 10.4 | | Amendment No. 3, dated as of March 16, 2017, to the Credit Agreement, dated as of October 25, 2013 (as amended), by and among Hilton Worldwide Holdings Inc., Hilton Worldwide Parent LLC, Hilton Worldwide Finance LLC, the other guarantors party thereto from time to time, Deutsche Bank AG New York Branch as administrative agent, collateral agent, swing line lender and L/C issuer and the other lenders party thereto from time to time (incorporated by reference to Exhibit 10.1 to the Company's Current Report on Form 8-K filed on March 22, 2017). |
| 10.5 | | Amendment No. 4, dated as of April 19, 2018, to the Credit Agreement, dated as of October 25, 2013 (as amended), by and among Hilton Worldwide Holdings Inc., Hilton Worldwide Parent LLC, Hilton Worldwide Finance LLC, the other guarantors party thereto from time to time, Deutsche Bank AG New York Branch as administrative agent, collateral agent, swing line lender and L/C issuer and the other lenders party thereto from time to time (incorporated by reference to Exhibit 10.1 to the Company's Current Report on Form 8-K filed on April 19, 2018). |
| 10.6 | | Amendment No. 5, dated as of June 5, 2019, to the Credit Agreement, dated as of October 25, 2013 (as amended by Amendment No. 1 to the Credit Agreement dated as of August 18, 2016, as further amended by Amendment No. 2 to the Credit Agreement dated as of November 21, 2016, as further amended by Amendment No. 3 to the Credit Agreement dated as of March 16, 2017 and as further amended by Amendment No. 4 to the Credit Agreement dated as of April 19, 2018), by and among Hilton Worldwide Holdings Inc., Hilton Worldwide Parent LLC, Hilton Worldwide Finance LLC, the other guarantors party thereto from time to time, Deutsche Bank AG New York Branch as administrative agent, collateral agent, swing line lender and L/C issuer and the other lenders party thereto from time to time (incorporated by reference to Exhibit 10.1 to the Company's Current Report on Form 8-K filed on June 7, 2019). |
| 10.7 | | Amendment No. 6, dated as of June 21, 2019, to the Credit Agreement, dated as of October 25, 2013 (as amended by Amendment No. 1 to the Credit Agreement dated as of August 18, 2016, as further amended by Amendment No. 2 to the Credit Agreement dated as of November 21, 2016, as further amended by Amendment No. 3 to the Credit Agreement dated as of March 16, 2017, as further amended by Amendment No. 4 to the Credit Agreement dated as of April 19, 2018 and as further amended by Amendment No. 5 to the Credit Agreement dated as of June 5, 2019), by and among Hilton Worldwide Holdings Inc., Hilton Worldwide Parent LLC, Hilton Worldwide Finance LLC, the other guarantors party thereto from time to time, Deutsche Bank AG New York Branch as administrative agent, collateral agent, swing line lender and L/C issuer and the other lenders party thereto from time to time (incorporated by reference to Exhibit 10.1 to the Company’s Current Report on Form 8-K filed on June 24, 2019). |
| | | | | | | | |
| Exhibit Number | | Exhibit Description |
| 10.8 | | |
| 10.9 | | Loan Agreement, dated as of October 25, 2013, among the subsidiaries party thereto, collectively, as borrower and JPMorgan Chase Bank, National Association, German American Capital Corporation, Bank of America, N.A., GS Commercial Real Estate LP and Morgan Stanley Mortgage Capital Holdings LLC, collectively, as lender (incorporated by reference to Exhibit 10.3 to the Company’s Registration Statement on Form S-1 filed on November 8, 2013). |
| 10.10 | | Guaranty Agreement, dated as of October 25, 2013, among the guarantors named therein and JPMorgan Chase Bank, National Association, German American Capital Corporation, Bank of America, N.A., GS Commercial Real Estate LP and Morgan Stanley Mortgage Capital Holdings LLC, collectively, as lender (incorporated by reference to Exhibit 10.4 to the Company’s Registration Statement on Form S-1 filed on November 8, 2013). |
| 10.11 | | |
| 10.12 | | |
| 10.13 | | |
| 10.14 | | |
| 10.15 | | |
| 10.16 | | |
| 10.17 | | |
| 10.18 | | |
| 10.19 | | |
| 10.20 | | |
| 10.21 | | |
| 10.22 | | |
| 10.23 | | |
| 10.24 | | |
| 10.25 | | |
| 10.26 | | |
| 10.27 | | |
| 10.28 | | |
| | | | | | | | |
| Exhibit Number | | Exhibit Description |
| 10.29 | | |
| 10.30 | | |
| 10.31 | | |
| 10.32 | | |
| 10.33 | | |
| 10.34 | | |
| 10.35 | | |
| 10.36 | | |
| 10.37 | | |
| 10.38 | | |
| 10.39 | | |
| 10.40 | | |
| 10.41 | | |
| 10.42 | | |
| 10.43 | | Amendment No. 7, dated as of October 21, 2021, to the Credit Agreement, dated as of October 25, 2013 (as amended by Amendment No. 1 to the Credit Agreement dated as of August 18, 2016, as further amended by Amendment No. 2 to the Credit Agreement dated as of November 21, 2016, as further amended by Amendment No. 3 to the Credit Agreement dated as of March 16, 2017, as further amended by Amendment No. 4 to the Credit Agreement dated as of April 19, 2018, as further amended by Amendment No. 5 to the Credit Agreement dated as of June 5, 2019, and as further amended by Amendment No. 6 to the Credit Agreement dated as of June 21, 2019), between Hilton Domestic Operating Company Inc. and Deutsche Bank AG New York Branch as administrative agent. |
| 21.1 | | |
| 23.1 | | |
| 31.1 | | |
| 31.2 | | |
| 32.1 | | |
| 32.2 | | |
| 101.INS | | Inline XBRL Instance Document - this instance document does not appear in the Interactive Data File because its XBRL tags are embedded within the Inline XBRL document. |
| 101.SCH | | Inline XBRL Taxonomy Extension Schema Document. |
| | | | | | | | |
| Exhibit Number | | Exhibit Description |
| 101.CAL | | Inline XBRL Taxonomy Extension Calculation Linkbase Document. |
| 101.DEF | | Inline XBRL Taxonomy Definition Linkbase Document. |
| 101.LAB | | Inline XBRL Taxonomy Extension Label Linkbase Document. |
| 101.PRE | | Inline XBRL Taxonomy Extension Presentation Linkbase Document. |
| 104 | | Cover Page Interactive Data File (embedded within the Inline XBRL document). |
____________
*This document has been identified as a management contract or compensatory plan or arrangement.
The agreements and other documents filed as exhibits to this report are not intended to provide factual information or other disclosure other than with respect to the terms of the agreements or other documents themselves, and you should not rely on them for that purpose. In particular, any representations and warranties made by us in these agreements or other documents were made solely within the specific context of the relevant agreement or document and may not describe the actual state of affairs as of the date they were made or at any other time.
Item 16. Form 10-K Summary
None.
Signatures
Pursuant to the requirements of Section 13 or 15(d) of the Securities Exchange Act of 1934, the Registrant has duly caused this report to be signed on its behalf by the undersigned, thereunto duly authorized, in McLean, Virginia, on the 16th day of February 2022.
| | | | | | | | |
| HILTON WORLDWIDE HOLDINGS INC. |
| | |
| By: | | /s/ Christopher J. Nassetta |
| Name: | | Christopher J. Nassetta |
| Title: | | President and Chief Executive Officer |
Pursuant to the requirements of the Securities Exchange Act of 1934, this report has been signed by the following persons in the capacities indicated on the 16th day of February 2022. | | | | | | | | |
| Signature | | Title |
| /s/ Christopher J. Nassetta | | President, Chief Executive Officer and Director |
| Christopher J. Nassetta | | (principal executive officer) |
| | |
| /s/ Jonathan D. Gray | | Chairman of the Board of Directors |
| Jonathan D. Gray | | |
| | |
| /s/ Charlene T. Begley | | Director |
| Charlene T. Begley | | |
| | |
| /s/ Chris Carr | | Director |
| Chris Carr | | |
| | |
| /s/ Melanie L. Healey | | Director |
| Melanie L. Healey | | |
| | |
| /s/ Raymond E. Mabus, Jr. | | Director |
| Raymond E. Mabus, Jr. | | |
| | |
| /s/ Judith A. McHale | | Director |
| Judith A. McHale | | |
| | |
| /s/ Elizabeth A. Smith | | Director |
| Elizabeth A. Smith | | |
| | |
| /s/ Douglas M. Steenland | | Director |
| Douglas M. Steenland | | |
| | |
| /s/ Kevin J. Jacobs | | Chief Financial Officer and President, Global Development |
| Kevin J. Jacobs | | (principal financial officer) |
| | |
| /s/ Michael W. Duffy | | Senior Vice President, Chief Accounting and Risk Officer |
| Michael W. Duffy | | (principal accounting officer) |