UNITED STATES
SECURITIES AND EXCHANGE COMMISSION
Washington, D.C. 20549
FORM 10-Q
x | Quarterly Report Pursuant to Section 13 or 15(d) of the Securities Exchange Act of 1934 |
For the Quarter Ended March 31, 2018
OR
¨ | Transition Report Pursuant to Section 13 or 15(d) of the Securities Exchange Act of 1934 |
For the transition period from _____ to ______
Commission File Number: 814-01025

AMERICAN CAPITAL SENIOR FLOATING, LTD.
(Exact name of registrant as specified in its charter)
Maryland | 46-1996220 | |
(State or other jurisdiction of incorporation or organization) | (I.R.S. Employer Identification No.) | |
245 Park Avenue, 42nd Floor, New York, NY 10167 | ||
(Address of principal executive offices) (Zip Code) | ||
(212) 750-7300 | ||
(Registrant’s telephone number, including area code) | ||
N/A
(Former name, former address and former fiscal year, if changed since last report)
Indicate by check mark whether the registrant (1) has filed all reports required to be filed by Section 13 or 15(d) of the Securities Exchange Act of 1934 during the preceding 12 months and (2) has been subject to such filing requirements for the past 90 days. Yes x No ¨
Indicate by check mark whether the registrant has submitted electronically and posted on its corporate Web site, if any, every Interactive Data File required to be submitted and posted pursuant to Rule 405 of Regulation S-T during the preceding 12 months (or for such shorter period that the registrant was required to submit and post such files). Yes ¨ No ¨
Indicate by check mark whether the registrant is a large accelerated filer, an accelerated filer, a non-accelerated filer, smaller reporting company, or an emerging growth company. See definitions of “large accelerated filer,” “accelerated filer,” “smaller reporting company,” and “emerging growth company” in Rule 12b-2 of the Exchange Act. (Check one):
Large accelerated filer | ¨ | Accelerated filer | x | |
Non-accelerated filer | ¨ | (Do not check if a smaller reporting company) | Smaller reporting company | ¨ |
Emerging growth company | x | |||
If an emerging growth company, indicate by check mark if the registrant has elected not to use the extended transition period for complying with any new or revised financial accounting standards provided pursuant to Section 13(a) of the Exchange Act. ¨
Indicate by check mark whether the registrant is a shell company (as defined in Rule 12b-2 of the Exchange Act). Yes ¨ No x
Indicate the number of shares outstanding of each of the issuer’s classes of common stock, as of the latest practicable date.
Class | Outstanding at May 8, 2018 | |
Common stock, $0.01 par value | 10,000,100 | |
AMERICAN CAPITAL SENIOR FLOATING, LTD.
FORM 10-Q FOR THE QUARTER ENDED March 31, 2018
TABLE OF CONTENTS
PAGE | ||
PART I. FINANCIAL INFORMATION | ||
Item 1. | Financial Statements | |
Item 2. | ||
Item 3. | ||
Item 4. | ||
PART II. OTHER INFORMATION | ||
Item 1. | ||
Item 1A. | ||
Item 2. | ||
Item 3. | ||
Item 4. | ||
Item 5. | ||
Item 6. | ||
2
PART I. FINANCIAL INFORMATION
Item 1. Financial Statements
AMERICAN CAPITAL SENIOR FLOATING, LTD.
CONSOLIDATED STATEMENTS OF ASSETS AND LIABILITIES
(in thousands, except per share data)
March 31, 2018 | December 31, 2017 | |||||||
(unaudited) | ||||||||
Assets: | ||||||||
Investments, fair value (cost of $234,034 and $241,228, respectively) | $ | 224,642 | $ | 229,240 | ||||
Cash and cash equivalents | 3,558 | 1,756 | ||||||
Receivable for investments sold | 2,266 | 2,324 | ||||||
Deferred financing costs | 66 | 89 | ||||||
Interest receivable | 450 | 669 | ||||||
Prepaid expenses and other assets | 845 | 579 | ||||||
Total assets | $ | 231,827 | $ | 234,657 | ||||
Liabilities: | ||||||||
Secured revolving credit facility payable (see Note 7) | $ | 93,800 | $ | 87,500 | ||||
Payable for investments purchased | 5,143 | 14,413 | ||||||
Distributions to stockholders payable (see Note 9) | 970 | 970 | ||||||
Management fee payable (see Note 3) | 469 | 494 | ||||||
Interest payable (see Note 7) | 40 | 36 | ||||||
Taxes payable | — | 70 | ||||||
Payable to affiliate (see Note 4) | 9 | 14 | ||||||
Other liabilities and accrued expenses | 325 | 304 | ||||||
Total liabilities | 100,756 | 103,801 | ||||||
Commitments and contingencies (see Note 10) | ||||||||
Net Assets: | ||||||||
Common stock, par value $0.01 per share; 10,000 issued and outstanding; 300,000 authorized | 100 | 100 | ||||||
Paid-in capital in excess of par | 150,879 | 150,879 | ||||||
Accumulated overdistributed net investment income | (831 | ) | (136 | ) | ||||
Accumulated net realized loss from investments | (9,685 | ) | (7,999 | ) | ||||
Net unrealized loss on investments | (9,392 | ) | (11,988 | ) | ||||
Total net assets | 131,071 | 130,856 | ||||||
Total liabilities and net assets | $ | 231,827 | $ | 234,657 | ||||
Net asset value per share outstanding | $ | 13.11 | $ | 13.09 | ||||
See notes to consolidated financial statements.
3
AMERICAN CAPITAL SENIOR FLOATING, LTD.
CONSOLIDATED STATEMENTS OF OPERATIONS
(unaudited)
(in thousands, except per share data)
Three Months Ended March 31, | ||||||||
2018 | 2017 | |||||||
Investment Income: | ||||||||
Interest | $ | 4,078 | $ | 4,612 | ||||
Total investment income | 4,078 | 4,612 | ||||||
Expenses: | ||||||||
Interest and commitment fee (see Note 7) | 876 | 710 | ||||||
Management fee (see Note 3) | 469 | 531 | ||||||
Professional fees | 223 | 343 | ||||||
Insurance | 104 | 148 | ||||||
Amortization of deferred financing costs | 23 | 23 | ||||||
Other general and administrative expenses | 168 | 222 | ||||||
Total expenses | 1,863 | 1,977 | ||||||
Expense reimbursement (see Note 3) | — | (437 | ) | |||||
Net expenses | 1,863 | 1,540 | ||||||
Net investment income before taxes | 2,215 | 3,072 | ||||||
Income tax provision, including excise tax | — | (19 | ) | |||||
Net investment income | 2,215 | 3,053 | ||||||
Net gain (loss) on investments: | ||||||||
Net realized gain (loss) on investments | (1,686 | ) | 462 | |||||
Net unrealized gain (loss) on investments | 2,596 | (763 | ) | |||||
Net gain (loss) on investments | 910 | (301 | ) | |||||
Net increase in net assets resulting from operations (“Net Earnings”) | $ | 3,125 | $ | 2,752 | ||||
Net investment income per share | $ | 0.22 | $ | 0.31 | ||||
Net Earnings per share (see Note 5) | $ | 0.31 | $ | 0.28 | ||||
Distributions to stockholders declared per share | $ | 0.29 | $ | 0.29 | ||||
Weighted average shares outstanding | 10,000 | 10,000 | ||||||
See notes to consolidated financial statements.
4
AMERICAN CAPITAL SENIOR FLOATING, LTD.
CONSOLIDATED STATEMENTS OF CHANGES IN NET ASSETS
(unaudited, in thousands)
Three Months Ended March 31, | ||||||||
2018 | 2017 | |||||||
Operations: | ||||||||
Net investment income | $ | 2,215 | $ | 3,053 | ||||
Net realized gain (loss) on investments | (1,686 | ) | 462 | |||||
Net unrealized gain (loss) on investments | 2,596 | (763 | ) | |||||
Net earnings | 3,125 | 2,752 | ||||||
Distributions to stockholders: | ||||||||
From net investment income | (2,910 | ) | (2,910 | ) | ||||
Net increase (decrease) in net assets | 215 | (158 | ) | |||||
Net assets, beginning of period | 130,856 | 136,789 | ||||||
Net assets, end of period | $ | 131,071 | $ | 136,631 | ||||
Undistributed net investment income included in net assets | $ | (831 | ) | $ | 2,276 | |||
Common shares outstanding | 10,000 | 10,000 | ||||||
5
AMERICAN CAPITAL SENIOR FLOATING, LTD.
CONSOLIDATED STATEMENTS OF CASH FLOWS
(unaudited, in thousands)
Three Months Ended March 31, | ||||||||
2018 | 2017 | |||||||
Cash Flows from Operating Activities: | ||||||||
Net increase in stockholders' equity resulting from operations | $ | 3,125 | $ | 2,752 | ||||
Adjustments to reconcile net increase in net assets resulting from operations: | ||||||||
Net realized (gain) loss on investments | 1,686 | (462 | ) | |||||
Net unrealized (gain) loss on investments | (2,596 | ) | 763 | |||||
Accretion of CLO interest income | (1,361 | ) | (1,835 | ) | ||||
Net amortization of premium/discount on loans | (42 | ) | (81 | ) | ||||
Amortization of deferred financing costs | 23 | 23 | ||||||
Purchase of investments | (24,692 | ) | (63,879 | ) | ||||
Proceeds from disposition of investments | 31,603 | 63,035 | ||||||
Changes in operating assets and liabilities: | ||||||||
Payable for investments purchased | (9,270 | ) | 6,149 | |||||
Receivable for investments sold | 58 | (4,427 | ) | |||||
Interest receivable | 219 | 258 | ||||||
Prepaid expenses and other assets | (266 | ) | (725 | ) | ||||
Receivable from affiliate | — | (139 | ) | |||||
Management fee payable | (25 | ) | 531 | |||||
Interest payable | 4 | (3 | ) | |||||
Taxes payable | (70 | ) | (98 | ) | ||||
Payable to affiliate | (5 | ) | (129 | ) | ||||
Other liabilities and accrued expenses | 21 | 207 | ||||||
Net cash provided by (used in) operating activities | (1,588 | ) | 1,940 | |||||
Cash Flows from Financing Activities: | ||||||||
Distributions to stockholders | (2,910 | ) | (3,880 | ) | ||||
Borrowings (payments) from (on) revolving credit facility | 6,300 | (1,500 | ) | |||||
Net cash provided by (used in) financing activities | 3,390 | (5,380 | ) | |||||
Net increase (decrease) in cash and cash equivalents | 1,802 | (3,440 | ) | |||||
Cash and cash equivalents at beginning of period | 1,756 | 8,795 | ||||||
Cash and cash equivalents at end of period | $ | 3,558 | $ | 5,355 | ||||
Supplemental disclosure of cash flow information: | ||||||||
Cash paid for interest and commitment fees | $ | 872 | $ | 713 | ||||
Cash paid for income taxes | $ | 100 | $ | 130 | ||||
Cash received for income tax benefit | $ | (30 | ) | $ | (126 | ) | ||
Distributions to stockholders declared and payable during the period | $ | 2,910 | $ | 2,910 | ||||
6
AMERICAN CAPITAL SENIOR FLOATING, LTD.
CONSOLIDATED SCHEDULE OF INVESTMENTS
MARCH 31, 2018
(unaudited, in thousands)
Description (5), (12) | Maturity | Interest Rate (1) | Basis Point Spread Above Index (2) | LIBOR Interest Rate Floor | Industry | Par Amount | Cost | Fair Value | ||||||||||||||
Non-Control/Non-Affiliate Investments | ||||||||||||||||||||||
First Lien Floating Rate Loans —129.4% of Net Assets | ||||||||||||||||||||||
1A Smart Start LLC | 02/21/2022 | 6.38% | L+ 4.50 | 1.00% | Electronics/Electric | $ | 752 | $ | 750 | $ | 753 | |||||||||||
24 Hour Fitness Worldwide, Inc. (6) | 05/28/2021 | 6.05% | L+ 3.75 | 1.00% | Leisure Goods/Activities/Movies | 1,927 | 1,924 | 1,946 | ||||||||||||||
Academy, Ltd. | 07/01/2022 | 6.02% | L+ 4.00 | 1.00% | Retailers (except Food and Drug) | 893 | 810 | 715 | ||||||||||||||
Access CIG, LLC | 02/27/2025 | 5.63% | L+ 3.75 | —% | Service & Equipment | 2,068 | 2,058 | 2,094 | ||||||||||||||
Access CIG, LLC (9) | 02/27/2025 | 5.65% | L+ 3.75 | —% | Service & Equipment | 432 | — | 6 | ||||||||||||||
Acosta, Inc. | 09/26/2021 | 5.13% | L+ 3.25 | 1.00% | Business Equipment and Services | 2,419 | 2,397 | 2,035 | ||||||||||||||
Acrisure, LLC | 11/22/2023 | 5.99% | L+ 4.25 | 1.00% | Banking, Finance & Insurance | 329 | 329 | 334 | ||||||||||||||
Advanced Integration Technology LP (6) | 04/03/2023 | 6.73% | L+ 4.75 | 1.00% | Industrial Equipment | 1,980 | 1,980 | 1,995 | ||||||||||||||
Aegis Toxicology Sciences Corporation | 02/24/2021 | 6.79% | L+ 4.50 | 1.00% | Health Care | 1,604 | 1,599 | 1,598 | ||||||||||||||
Air Medical Group Holdings Inc | 04/28/2022 | 4.94% | L+ 3.25 | 1.00% | Health Care | 2,440 | 2,440 | 2,453 | ||||||||||||||
Albertson's LLC | 12/21/2022 | 5.29% | L+ 3.00 | 0.75% | Food/Drug Retailers | 978 | 960 | 969 | ||||||||||||||
American Residential Services, LLC | 06/30/2022 | 5.88% | L+ 4.00 | 1.00% | Ecological Services and Equipment | 1,975 | 1,971 | 1,987 | ||||||||||||||
American Tire Distributors, Inc. | 09/01/2021 | 6.24% | L+ 4.25 | 1.00% | Retailers (except Food and Drug) | 954 | 951 | 967 | ||||||||||||||
AqGen Ascensus, Inc. | 12/05/2022 | 5.80% | L+ 3.50 | 1.00% | Financial Intermediaries | 1,715 | 1,673 | 1,733 | ||||||||||||||
Arctic Glacier U.S.A., Inc. | 03/20/2024 | 5.38% | L+ 3.50 | 1.00% | Food Products | 1,050 | 1,045 | 1,061 | ||||||||||||||
Ardent Legacy Acquisitions, Inc. | 08/04/2021 | 7.38% | L+ 5.50 | 1.00% | Health Care | 318 | 317 | 320 | ||||||||||||||
Argon Medical Devices, Inc. (6) | 01/23/2025 | 6.05% | L+ 3.75 | 1.00% | Health Care | 1,500 | 1,493 | 1,510 | ||||||||||||||
AVSC Holding Corp. | 03/01/2025 | 5.26% | L+ 3.25 | 1.00% | Service & Equipment | 1,811 | 1,807 | 1,819 | ||||||||||||||
BCP Raptor, LLC | 06/24/2024 | 6.04% | L+ 4.25 | 1.00% | Energy | 1,092 | 1,069 | 1,099 | ||||||||||||||
BCPE Eagle Buyer LLC | 03/18/2024 | 6.02% | L+ 4.25 | 1.00% | Health Care | 1,287 | 1,276 | 1,272 | ||||||||||||||
Big Jack Holdings LP (6) | 04/05/2024 | 5.88% | L+ 4.00 | 1.00% | Food/Drug Retailers | 1,858 | 1,850 | 1,876 | ||||||||||||||
BJ's Wholesale Club, Inc. | 02/03/2024 | 5.19% | L+ 3.50 | 1.00% | Food/Drug Retailers | 1,889 | 1,886 | 1,890 | ||||||||||||||
Blackboard, Inc. | 06/30/2021 | 6.73% | L+ 5.00 | 1.00% | Electronics/Electric | 2,381 | 2,381 | 2,228 | ||||||||||||||
Brand Energy & Infrastructure Services, Inc. | 06/21/2024 | 5.99% | L+ 4.25 | 1.00% | Oil and Gas | 2,476 | 2,454 | 2,501 | ||||||||||||||
Calceus Acquisition, Inc. | 01/31/2020 | 5.88% | L+ 4.00 | 1.00% | Clothing/Textiles | 2,280 | 2,283 | 2,249 | ||||||||||||||
Carestream Health, Inc. | 06/07/2019 | 5.88% | L+ 4.00 | 1.00% | Health Care | 771 | 772 | 776 | ||||||||||||||
CB Poly Investments, LLC | 08/16/2023 | 5.63% | L+ 3.75 | 1.00% | Clothing/Textiles | 1,726 | 1,714 | 1,737 | ||||||||||||||
Central Security Group, Inc. | 10/06/2021 | 7.50% | L+ 5.63 | 1.00% | Electronics/Electric | 1,990 | 2,003 | 1,995 | ||||||||||||||
CIBT Global, Inc. | 06/03/2024 | 6.05% | L+ 3.75 | 1.00% | Service & Equipment | 993 | 990 | 999 | ||||||||||||||
CT Technologies Intermediate Holdings, Inc. | 12/01/2021 | 6.13% | L+ 4.25 | 1.00% | Electronics/Electric | 486 | 485 | 485 | ||||||||||||||
Curvature, Inc. | 10/30/2023 | 6.88% | L+ 5.00 | 1.00% | Business Equipment and Services | 1,975 | 1,967 | 1,830 | ||||||||||||||
DJO Finance LLC | 06/08/2020 | 4.94% | L+ 3.25 | 1.00% | Health Care | 990 | 975 | 996 | ||||||||||||||
DTI Holdco, Inc. (7) | 09/29/2023 | 6.71% | L+ 4.75 | 1.00% | Electronics/Electric | 1,239 | 1,238 | 1,243 | ||||||||||||||
Dynacast International LLC | 01/28/2022 | 5.55% | L+ 3.25 | 1.00% | Industrial Equipment | 530 | 530 | 534 | ||||||||||||||
Eastern Power, LLC | 10/02/2023 | 5.63% | L+ 3.75 | 1.00% | Utilities | 1,873 | 1,865 | 1,904 | ||||||||||||||
ECi Software Solutions, Inc. | 09/27/2024 | 6.55% | L+ 4.25 | 1.00% | Technology | 1,493 | 1,479 | 1,508 | ||||||||||||||
The Edelman Financial Center, LLC (6) | 11/11/2024 | 5.97% | L+ 4.25 | 1.00% | Banking, Finance & Insurance | 1,535 | 1,531 | 1,559 | ||||||||||||||
EIG Investors Corp. (3) | 02/09/2023 | 5.96% | L+ 4.00 | 1.00% | Electronics/Electric | 2,208 | 2,203 | 2,227 | ||||||||||||||
7
AMERICAN CAPITAL SENIOR FLOATING, LTD.
CONSOLIDATED SCHEDULE OF INVESTMENTS (Continued)
MARCH 31, 2018
(unaudited, in thousands)
Description (5), (12) | Maturity | Interest Rate (1) | Basis Point Spread Above Index (2) | LIBOR Interest Rate Floor | Industry | Par Amount | Cost | Fair Value | ||||||||||||||
First Lien Floating Rate Loans (continued) —129.4% of Net Assets | ||||||||||||||||||||||
Epicor Software Corporation | 06/01/2022 | 5.13% | L+ 3.25 | 1.00% | Electronics/Electric | 1,944 | 1,932 | 1,955 | ||||||||||||||
ExamWorks Group, Inc. (7) | 07/27/2023 | 5.13% | L+ 3.25 | 1.00% | Business Equipment and Services | 1,235 | 1,238 | 1,246 | ||||||||||||||
Fairmount Santrol Inc. | 11/01/2022 | 8.30% | L+ 6.00 | 1.00% | Nonferrous Metals/Minerals | 1,800 | 1,775 | 1,824 | ||||||||||||||
FHC Health Systems, Inc. (6) | 12/23/2021 | 5.88% | L+ 4.00 | 1.00% | Health Care | 1,473 | 1,458 | 1,470 | ||||||||||||||
Go Wireless Inc. | 12/22/2024 | 8.38% | L+ 6.50 | 1.00% | Telecommunications | 1,450 | 1,436 | 1,448 | ||||||||||||||
Greeneden U.S. Holdings I, LLC | 12/01/2023 | 5.80% | L+ 3.50 | —% | Business Equipment and Services | 495 | 489 | 498 | ||||||||||||||
HGIM Corp. (10) | 06/18/2020 | 8.25% | L+ 3.50 | 1.00% | Surface Transport | 1,444 | 1,449 | 609 | ||||||||||||||
Hummel Station LLC | 10/27/2022 | 7.88% | L+ 6.00 | 1.00% | Energy | 2,000 | 1,889 | 1,948 | ||||||||||||||
Hyland Software, Inc. (7) | 07/01/2022 | 5.13% | L+ 3.25 | 0.75% | Electronics/Electric | 2,434 | 2,420 | 2,457 | ||||||||||||||
IBC Capital Limited (3) | 09/09/2021 | 5.82% | L+ 3.75 | 1.00% | Business Equipment and Services | 985 | 978 | 988 | ||||||||||||||
Immucor, Inc. | 06/15/2021 | 7.30% | L+ 5.00 | 1.00% | Conglomerates | 2,481 | 2,461 | 2,546 | ||||||||||||||
Indra Holdings Corp. | 05/01/2021 | 6.02% | L+ 4.25 | 1.00% | Clothing/Textiles | 1,185 | 1,180 | 710 | ||||||||||||||
Infoblox Inc. | 11/07/2023 | 6.38% | L+ 4.50 | —% | Electronics/Electric | 1,874 | 1,850 | 1,905 | ||||||||||||||
Information Resources, Inc. | 01/18/2024 | 6.19% | L+ 4.25 | 1.00% | Business Equipment and Services | 2,407 | 2,397 | 2,428 | ||||||||||||||
Innovative XCessories & Services LLC (6) | 11/29/2022 | 6.58% | L+ 4.75 | 1.00% | Automotive | 1,990 | 1,980 | 2,010 | ||||||||||||||
IPC Corp. | 08/06/2021 | 6.28% | L+ 4.50 | 1.00% | Telecommunications | 777 | 775 | 764 | ||||||||||||||
Ivanti Software, Inc. | 01/20/2024 | 6.13% | L+ 4.25 | 1.00% | Electronics/Electric | 2,577 | 2,561 | 2,539 | ||||||||||||||
Jazz Acquisition, Inc. | 06/19/2021 | 5.80% | L+ 3.50 | 1.00% | Aerospace and Defense | 1,927 | 1,930 | 1,886 | ||||||||||||||
JC Penney Co Inc (3) | 06/23/2023 | 6.23% | L+ 4.25 | 1.00% | Retailers (except Food and Drug) | 726 | 729 | 713 | ||||||||||||||
KEMET Corporation (3) (6) | 04/26/2024 | 7.88% | L+ 6.00 | 1.00% | Electronics | 2,677 | 2,645 | 2,731 | ||||||||||||||
Kestra Financial, Inc. (6) | 06/24/2022 | 6.80% | L+ 4.50 | 1.00% | Banking, Finance & Insurance | 998 | 988 | 995 | ||||||||||||||
Kingpin Intermediate Holdings LLC (6) (7) | 07/03/2024 | 6.13% | L+ 4.25 | 1.00% | Service & Equipment | 1,001 | 997 | 1,014 | ||||||||||||||
K-Mac Holdings Corp. | 03/14/2025 | 5.04% | L+ 3.25 | —% | Food Service | 1,000 | 998 | 1,006 | ||||||||||||||
Kronos Acquisition Intermediate Inc. | 05/15/2023 | 5.88% | L+ 4.00 | 1.00% | Cosmetics/Toiletries | 711 | 699 | 719 | ||||||||||||||
Learning Care Group (US) No. 2 Inc. (6) | 03/13/2025 | 5.03% | L+ 3.25 | 1.00% | Business Equipment and Services | 1,250 | 1,247 | 1,263 | ||||||||||||||
Legalzoom.com, Inc. (6) | 11/21/2024 | 6.34% | L+ 4.50 | 1.00% | Technology | 1,926 | 1,908 | 1,943 | ||||||||||||||
Liberty Cablevision of Puerto Rico LLC | 01/07/2022 | 5.22% | L+ 3.50 | 1.00% | Cable and Satellite Television | 1,000 | 995 | 973 | ||||||||||||||
LSF9 Atlantis Holdings LLC | 05/01/2023 | 7.69% | L+ 6.00 | 1.00% | Telecommunications/Cellular Communications | 2,082 | 2,080 | 2,077 | ||||||||||||||
MB Aerospace Holdings II Corp. | 01/22/2025 | 5.38% | L+ 3.50 | 1.00% | Aerospace and Defense | 1,995 | 1,985 | 2,016 | ||||||||||||||
McGraw-Hill Global Education Holdings, LLC | 05/04/2022 | 5.88% | L+ 4.00 | 1.00% | Publishing | 1,972 | 1,962 | 1,953 | ||||||||||||||
Mirion Technologies, Inc. | 03/31/2022 | 7.05% | L+ 4.75 | 1.00% | Utilities | 1,980 | 1,982 | 1,978 | ||||||||||||||
MND Holdings III Corp (6) | 06/19/2024 | 6.05% | L+ 3.75 | 1.00% | Consumer Products | 1,787 | 1,778 | 1,807 | ||||||||||||||
Mohegan Tribal Gaming Authority | 10/13/2023 | 5.88% | L+ 4.00 | 1.00% | Lodging and Casinos | 1,447 | 1,465 | 1,446 | ||||||||||||||
Murray Energy Corporation | 04/16/2020 | 9.55% | L+ 7.25 | 1.00% | Nonferrous Metals/Minerals | 984 | 955 | 835 | ||||||||||||||
Navicure, Inc. | 11/01/2024 | 5.63% | L+ 3.75 | 1.00% | Health Care | 1,995 | 1,986 | 2,007 | ||||||||||||||
8
AMERICAN CAPITAL SENIOR FLOATING, LTD.
CONSOLIDATED SCHEDULE OF INVESTMENTS (Continued)
MARCH 31, 2018
(unaudited, in thousands)
Description (5), (12) | Maturity | Interest Rate (1) | Basis Point Spread Above Index (2) | LIBOR Interest Rate Floor | Industry | Par Amount | Cost | Fair Value | ||||||||||||||
First Lien Floating Rate Loans (continued) —129.4% of Net Assets | ||||||||||||||||||||||
Navitas Midstream Midland Basin, LLC | 12/13/2024 | 6.29% | L+ 4.50 | 1.00% | Oil and Gas | 1,995 | 1,985 | 1,999 | ||||||||||||||
NFP Corp | 01/08/2024 | 4.88% | L+ 3.00 | 1.00% | Diversified Insurance | 2,469 | 2,459 | 2,480 | ||||||||||||||
nThrive, Inc. | 10/20/2022 | 6.38% | L+ 4.50 | 1.00% | Health Care | 1,975 | 1,975 | 1,983 | ||||||||||||||
Oak Parent, Inc. (6) | 10/26/2023 | 6.38% | L+ 4.50 | 1.00% | Clothing/Textiles | 1,331 | 1,323 | 1,271 | ||||||||||||||
Optiv Inc. | 02/01/2024 | 5.13% | L+ 3.25 | 1.00% | Business Equipment and Services | 1,031 | 1,029 | 998 | ||||||||||||||
PAE Holding Corporation | 10/20/2022 | 7.49% | L+ 5.50 | 1.00% | Aerospace and Defense | 536 | 528 | 540 | ||||||||||||||
Patterson Medical Supply, Inc. | 08/29/2022 | 6.54% | L+ 4.75 | 1.00% | Health Care | 1,993 | 1,971 | 1,938 | ||||||||||||||
PetSmart, Inc. | 03/11/2022 | 4.68% | L+ 3.00 | 1.00% | Retailers (except Food and Drug) | 481 | 480 | 385 | ||||||||||||||
Pike Corporation (7) | 03/23/2025 | 4.50% | L+ 3.50 | 1.00% | Utilities | 1,500 | 1,496 | 1,516 | ||||||||||||||
Plaskolite, LLC (6) | 11/03/2022 | 6.30% | L+ 4.00 | 1.00% | Chemical/Plastics | 1,397 | 1,393 | 1,401 | ||||||||||||||
Plaze, Inc. | 07/31/2022 | 5.80% | L+ 3.50 | 1.00% | Chemical/Plastics | 815 | 815 | 824 | ||||||||||||||
Pregis Holding I Corporation | 05/20/2021 | 5.80% | L+ 3.50 | 1.00% | Chemical/Plastics | 1,341 | 1,328 | 1,346 | ||||||||||||||
Project Alpha Intermediate Holding, Inc. | 04/26/2024 | 5.04% | L+ 3.50 | 1.00% | Technology | 1,751 | 1,744 | 1,731 | ||||||||||||||
Renaissance Learning, Inc. | 04/09/2021 | 6.05% | L+ 3.75 | 1.00% | Electronics/Electric | 1,906 | 1,906 | 1,918 | ||||||||||||||
SciQuest, Inc. (6) | 12/28/2024 | 5.88% | L+ 4.00 | 1.00% | Technology | 2,500 | 2,488 | 2,513 | ||||||||||||||
Serta Simmons Bedding, LLC | 11/08/2023 | 5.19% | L+ 3.50 | 1.00% | Home Furnishings | 1,980 | 1,972 | 1,797 | ||||||||||||||
St. George's University Scholastic Services LLC | 07/06/2022 | 5.63% | L+ 3.75 | 1.00% | Education | 2,466 | 2,466 | 2,492 | ||||||||||||||
StandardAero Aviation Holdings, Inc. | 07/07/2022 | 5.63% | L+ 3.75 | 1.00% | Aerospace and Defense | 1,151 | 1,146 | 1,163 | ||||||||||||||
Sterigenics-Nordion Topco LLC | 05/15/2022 | 4.88% | L+ 3.00 | 1.00% | Health Care | 884 | 879 | 885 | ||||||||||||||
Strategic Partners Acquisition Corp. (6) | 06/30/2023 | 5.63% | L+ 3.75 | 1.00% | Clothing/Textiles | 1,910 | 1,910 | 1,929 | ||||||||||||||
Summit Midstream Partners Holdings, LLC (3) (6) | 05/13/2022 | 7.88% | L+ 6.00 | 1.00% | Oil and Gas | 539 | 534 | 546 | ||||||||||||||
Syniverse Holdings Inc | 03/09/2023 | 6.72% | L+ 5.00 | 1.00% | Telecommunications | 1,000 | 990 | 1,013 | ||||||||||||||
Thermasys Corp. | 05/03/2019 | 5.70% | L+ 4.00 | 1.25% | Industrial Equipment | 426 | 426 | 415 | ||||||||||||||
TIBCO Software Inc | 12/04/2020 | 5.38% | L+ 3.50 | 1.00% | Business Equipment and Services | 1,482 | 1,492 | 1,490 | ||||||||||||||
TravelCLICK, Inc. (6) | 05/06/2021 | 5.88% | L+ 4.00 | 1.00% | Food Service | 536 | 525 | 539 | ||||||||||||||
Traverse Midstream Partners LLC | 09/27/2024 | 5.85% | L+ 4.00 | 1.00% | Oil and Gas | 1,495 | 1,488 | 1,506 | ||||||||||||||
Tricorbraun Holdings, Inc. | 11/30/2023 | 5.97% | L+ 3.75 | 1.00% | Containers and Glass Products | 90 | 91 | 91 | ||||||||||||||
Tricorbraun Holdings, Inc. | 11/30/2023 | 6.05% | L+ 3.75 | —% | Containers and Glass Products | 898 | 913 | 904 | ||||||||||||||
Truck Hero, Inc. | 04/22/2024 | 6.22% | L+ 4.00 | 1.00% | Automotive | 2,627 | 2,606 | 2,645 | ||||||||||||||
Turbocombustor Technology, Inc. (6) | 12/02/2020 | 6.80% | L+ 4.50 | 1.00% | Aerospace and Defense | 3,351 | 3,338 | 3,284 | ||||||||||||||
TVC Albany, Inc. | 09/18/2024 | 6.30% | L+ 4.00 | 1.00% | Utilities | 1,995 | 1,995 | 2,010 | ||||||||||||||
Vantage Specialty Chemicals, Inc. | 10/28/2024 | 6.30% | L+ 4.00 | 1.00% | Chemical/Plastics | 669 | 666 | 676 | ||||||||||||||
Veritas US Inc. (3) | 01/27/2023 | 6.80% | L+ 4.50 | 1.00% | Electronics/Electric | 1,978 | 1,941 | 1,972 | ||||||||||||||
VF Holding Corp. | 06/30/2023 | 5.13% | L+ 3.25 | 1.00% | Insurance | 1,036 | 1,032 | 1,046 | ||||||||||||||
West Corporation (7) | 10/10/2024 | 4.50% | L+ 3.50 | 1.00% | Conglomerates | 2,462 | 2,458 | 2,468 | ||||||||||||||
Woodford Express, LLC | 01/27/2025 | 6.88% | L+ 5.00 | 1.00% | Energy | 2,000 | 1,980 | 1,975 | ||||||||||||||
WP CPP Holdings, LLC | 12/28/2019 | 5.27% | L+ 3.50 | 1.00% | Aerospace and Defense | 2,378 | 2,376 | 2,380 | ||||||||||||||
YI, LLC (6) | 11/07/2024 | 6.30% | L+ 4.00 | 1.00% | Health Care | 1,420 | 1,413 | 1,427 | ||||||||||||||
YI, LLC (6) (9) | 11/07/2024 | 6.30% | L+ 4.00 | 1.00% | Health Care | 553 | 199 | 204 | ||||||||||||||
9
AMERICAN CAPITAL SENIOR FLOATING, LTD.
CONSOLIDATED SCHEDULE OF INVESTMENTS (Continued)
MARCH 31, 2018
(unaudited, in thousands)
Description (5), (12) | Maturity | Interest Rate (1) | Basis Point Spread Above Index (2) | LIBOR Interest Rate Floor | Industry | Par Amount | Cost | Fair Value | ||||||||||||||
First Lien Floating Rate Loans (continued) —129.4% of Net Assets | ||||||||||||||||||||||
Zest Acquisition Corp. (6) | 03/14/2025 | 5.61% | L+ 3.50 | —% | Health Care | 2,000 | 1,990 | 2,010 | ||||||||||||||
Total First Lien Floating Rate Loans | $ | 172,573 | $ | 170,798 | $ | 169,620 | ||||||||||||||||
Second Lien Floating Rate Loans —9.9% of Net Assets | ||||||||||||||||||||||
Advantage Sales & Marketing Inc. | 07/25/2022 | 8.27% | L+ 6.50 | 1.00% | Business Equipment and Services | $ | 1,000 | $ | 996 | $ | 963 | |||||||||||
Albany Molecular Research, Inc. | 08/30/2025 | 8.88% | L+ 7.00 | 1.00% | Health Care | 3,002 | 3,054 | 3,027 | ||||||||||||||
Almonde Inc (3) | 06/13/2025 | 9.23% | L+ 7.25 | 1.00% | Technology | 609 | 603 | 605 | ||||||||||||||
Anchor Glass Container Corporation (6) | 12/07/2024 | 9.49% | L+ 7.75 | 1.00% | Containers and Glass Products | 500 | 496 | 490 | ||||||||||||||
Applied Systems, Inc. | 09/19/2025 | 9.30% | L+ 7.00 | 1.00% | Technology | 344 | 344 | 357 | ||||||||||||||
Asurion, LLC | 08/04/2025 | 7.88% | L+ 6.00 | —% | Diversified Insurance | 567 | 567 | 583 | ||||||||||||||
AVSC Holding Corp. | 09/01/2025 | 9.26% | L+ 7.25 | 1.00% | Service & Equipment | 576 | 573 | 580 | ||||||||||||||
BJ's Wholesale Club, Inc. | 02/03/2025 | 9.19% | L+ 7.50 | 1.00% | Food/Drug Retailers | 845 | 826 | 850 | ||||||||||||||
CH Hold Corp. (6) | 02/03/2025 | 9.13% | L+ 7.25 | 1.00% | Automotive | 149 | 148 | 151 | ||||||||||||||
Checkout Holding Corp. | 04/11/2022 | 8.63% | L+ 6.75 | 1.00% | Business Equipment and Services | 1,000 | 1,001 | 205 | ||||||||||||||
Hyland Software Inc. | 07/07/2025 | 8.88% | L+ 7.00 | 0.75% | Electronics/Electric | 605 | 604 | 613 | ||||||||||||||
Jazz Acquisition, Inc. | 06/19/2022 | 9.05% | L+ 6.75 | 1.00% | Aerospace and Defense | 1,250 | 1,252 | 1,182 | ||||||||||||||
Navicure, Inc. (6) | 10/31/2025 | 9.38% | L+ 7.50 | 1.00% | Health Care | 500 | 495 | 503 | ||||||||||||||
Optiv Inc. (6) | 01/31/2025 | 9.13% | L+ 7.25 | 1.00% | Business Equipment and Services | 444 | 443 | 431 | ||||||||||||||
ProAmpac PG Borrower LLC | 11/18/2024 | 10.35% | L+ 8.50 | 1.00% | Containers and Glass Products | 500 | 494 | 510 | ||||||||||||||
Ranpak Corp. (6) | 10/03/2022 | 9.07% | L+ 7.25 | 1.00% | Containers and Glass Products | 820 | 819 | 826 | ||||||||||||||
Solenis International, L.P. | 07/31/2022 | 8.73% | L+ 6.75 | 1.00% | Chemical/Plastics | 500 | 499 | 477 | ||||||||||||||
Vantage Specialty Chemicals, Inc. | 10/27/2025 | 10.02% | L+ 8.25 | 1.00% | Chemical/Plastics | 125 | 123 | 126 | ||||||||||||||
WP CPP Holdings, LLC | 04/30/2021 | 9.52% | L+ 7.75 | 1.00% | Aerospace and Defense | 493 | 498 | 491 | ||||||||||||||
Total Second Lien Floating Rate Loans | $ | 13,829 | $ | 13,835 | $ | 12,970 | ||||||||||||||||
CLO Equity —32.0% of Net Assets | ||||||||||||||||||||||
AMMC 2017-21A, Subordinated Notes (3) (4) (6) | 11/02/2030 | 11.70% | $ | 2,750 | $ | 2,616 | $ | 2,498 | ||||||||||||||
Apidos CLO XIV, Income Notes (3) (4) (6) | 04/15/2025 | —% | 5,900 | 1,298 | 193 | |||||||||||||||||
Apidos CLO XVIII, Income Notes (3) (4) (6) | 07/22/2026 | 4.64% | 2,500 | 1,671 | 1,433 | |||||||||||||||||
Apidos CLO XXVII, Income Notes (3) (4) (6) | 07/17/2030 | 8.11% | 5,000 | 4,249 | 4,066 | |||||||||||||||||
Ares XXIX CLO Ltd., Subordinated Notes (3) (4) (6) | 04/17/2026 | 6.39% | 4,750 | 3,179 | 2,180 | |||||||||||||||||
Avery Point II CLO, Income Notes (3) (4) (6) | 07/17/2025 | —% | 3,200 | 1,347 | 48 | |||||||||||||||||
Babson 2015-1, Income Notes (3) (4) (6) | 01/20/2031 | 17.35% | 2,840 | 2,039 | 1,934 | |||||||||||||||||
Carlyle Global Market Strategies CLO 2015-3, LTD., Subordinated Notes (3) (4) (6) | 07/28/2028 | 9.65% | 3,000 | 2,242 | 2,357 | |||||||||||||||||
Carlyle Global Market Strategies CLO 2017-3, LTD., Subordinated Notes (3) (4) (6) | 07/20/2029 | 9.31% | 2,000 | 1,772 | 1,846 | |||||||||||||||||
10
AMERICAN CAPITAL SENIOR FLOATING, LTD.
CONSOLIDATED SCHEDULE OF INVESTMENTS (Continued)
MARCH 31, 2018
(unaudited, in thousands)
Description (5), (12) | Maturity | Interest Rate (1) | Basis Point Spread Above Index (2) | LIBOR Interest Rate Floor | Industry | Par Amount | Cost | Fair Value | ||||||||||||||
CLO Equity (continued) — 32.0% of Net Assets | ||||||||||||||||||||||
Cent CLO 18 Limited, Subordinated Notes (3) (4) (6) | 07/23/2025 | 26.94% | 4,675 | 3,114 | 2,578 | |||||||||||||||||
Cent CLO 19 Limited, Subordinated Notes (3) (4) (6) | 10/29/2025 | 12.42% | 2,750 | 2,056 | 1,591 | |||||||||||||||||
Dryden 30 Senior Loan Fund, Subordinated Notes (3) (4) (6) | 11/15/2028 | 19.54% | 2,500 | 1,390 | 1,423 | |||||||||||||||||
Dryden 30A Senior Loan Fund, Subordinated Notes (3) (4) (6) | 11/15/2028 | 18.54% | 250 | 126 | 142 | |||||||||||||||||
Dryden 38 Senior Loan Fund, Subordinated Notes (3) (4) (6) | 07/15/2027 | 8.12% | 3,000 | 2,297 | 2,166 | |||||||||||||||||
Galaxy XVI CLO, Ltd., Subordinated Notes (3) (4) (6) | 11/16/2025 | 11.00% | 2,750 | 1,718 | 1,174 | |||||||||||||||||
Highbridge Loan Management 2013-2, Ltd., Subordinated Notes (3) (4) (6) | 10/20/2029 | 10.87% | 1,401 | 843 | 840 | |||||||||||||||||
Magnetite VIII, Limited, Subordinated Notes (3) (4) (6) | 04/15/2026 | 7.31% | 3,000 | 2,103 | 1,513 | |||||||||||||||||
Neuberger Berman CLO XV, Ltd., Subordinated Notes (3) (4) (6) | 10/15/2029 | 10.77% | 3,410 | 1,945 | 1,870 | |||||||||||||||||
Octagon Investment Partners XX, Ltd., Subordinated Notes (3) (4) (6) | 08/12/2026 | 6.62% | 2,500 | 1,684 | 1,254 | |||||||||||||||||
OZLM XIX, Subordinated Notes (3) (4) (6) | 11/22/2030 | 8.60% | 1,500 | 1,404 | 1,326 | |||||||||||||||||
OZLM XXI, Subordinated Notes (3) (4) (6) | 01/20/2031 | 8.57% | 1,750 | 1,630 | 1,592 | |||||||||||||||||
Venture XVIII CLO, Subordinated Notes (3) (4) (6) | 10/15/2029 | 12.30% | 1,750 | 1,248 | 1,303 | |||||||||||||||||
Voya 2017-2, Subordinated Notes (3) (4) (6) | 06/07/2030 | 8.31% | 2,000 | 1,785 | 1,806 | |||||||||||||||||
Voya CLO 2017-4, Subordinated Notes, (3) (4) (6) | 10/15/2030 | 8.31% | 2,270 | 2,307 | 2,245 | |||||||||||||||||
Wind River CLO 2014-1, Ltd. (3) (4) (6) | 04/18/2026 | 5.12% | 5,050 | 3,338 | 2,599 | |||||||||||||||||
Total CLO Equity | $ | 72,496 | $ | 49,401 | $ | 41,977 | ||||||||||||||||
Common Equity —0.1% of Net Assets | ||||||||||||||||||||||
Ameriforge Group Inc., Common Equity (1,570 shares) (6) (11) | 2 | — | 75 | |||||||||||||||||||
Total Common Equity | $ | 2 | $ | — | $ | 75 | ||||||||||||||||
Warrants —0.0% of Net Assets | ||||||||||||||||||||||
Ameriforge Group Inc., Warrants (4,984 shares) (6) (11) | 5 | — | — | |||||||||||||||||||
Total Warrants | $ | 5 | $ | — | $ | — | ||||||||||||||||
Total Non-Control/Non-Affiliate Investments (8) —171.4% of Net Assets | $ | 258,905 | $ | 234,034 | $ | 224,642 | ||||||||||||||||
Liabilities in Excess of Other Assets — (71.4%) of Net Assets | (93,571 | ) | ||||||||||||||||||||
Net Assets — 100.0% | $ | 131,071 | ||||||||||||||||||||
(1) | For each debt investment we have provided the weighted-average interest rate in effect as of March 31, 2018. For each CLO investment we have provided the yield as of March 31, 2018 determined using the effective interest method that will be applied to the current amortized cost of the investment in the following quarter. See “Note 2 - Significant Accounting Policies” to the consolidated financial statements regarding the recognition of investment income on CLOs. |
(2) | Floating rate debt investments typically accrue interest at a predetermined spread relative to an index, typically the London Interbank Offered Rate (“LIBOR” or “L”) or the prime index rate (“PRIME” or “P”), and reset monthly, quarterly or semi-annually. These instruments may be subject to a LIBOR or PRIME rate floor. |
(3) | Investments that are not “qualifying assets” under Section 55(a) of the 1940 Act. Under the 1940 Act, we may not acquire any non-qualifying asset unless, at the time such acquisition is made, qualifying assets represent at least 70% of our total assets. As of March 31, 2018, qualifying assets represented 77% of total assets at fair value. |
11
AMERICAN CAPITAL SENIOR FLOATING, LTD.
CONSOLIDATED SCHEDULE OF INVESTMENTS (Continued)
MARCH 31, 2018
(unaudited, in thousands)
(4) | These securities are exempt from registration under Rule 144A of the Securities Act of 1933, as amended. These securities may be resold in transactions that are exempt from registration, normally to qualified institutional buyers. |
(5) | All first lien floating rate loans and second lien floating rate loans are held at ACSF Funding I, LLC (“ACSF Funding”), a wholly owned special purpose financing vehicle, and are pledged as collateral for a secured revolving credit facility (see “Note 7 - Debt”). |
(6) | Fair value was determined using significant unobservable inputs and are classified as Level 3 in the fair value hierarchy. |
(7) | All or a portion of this position has not settled as of March 31, 2018. |
(8) | Net estimated unrealized loss for federal income tax purposes was $12,078 as of March 31, 2018 based on a tax cost of $236,720. Estimated aggregate gross unrealized loss for federal income tax purposes as of March 31, 2018 is $14,247; estimated aggregate gross unrealized gain for federal income tax purposes as of March 31, 2018 was $2,169. |
(9) | As of March 31, 2018, the Company had the following commitments to fund various delayed draw “Senior Floating Rate Loans” or “SFRLs.” Such commitments are subject to the satisfaction of certain conditions set forth in the documents governing these loans and there can be no assurance that such conditions will be satisfied. See Note 10 to the consolidated financial statements for further information on delayed draw loan commitments. |
(in thousands) Portfolio Company | Total revolving and delayed draw loan commitments | Less: drawn commitments | Total undrawn commitments | ||||||
Access CIG, LLC | $ | 432 | $ | — | $ | 432 | |||
YI, LLC | 553 | (201 | ) | 352 | |||||
$ | 985 | $ | (201 | ) | $ | 784 | |||
(10) | Investment was placed on non-accrual status as of March 31, 2018. |
(11) | Non-income producing. |
(12) | All of the Company’s portfolio company investments, which as of March 31, 2018 represented 171.4% of the Company’s net assets or 96.9% of the Company’s total assets, were subject to legal restrictions on sales. |
12
AMERICAN CAPITAL SENIOR FLOATING, LTD.
CONSOLIDATED SCHEDULE OF INVESTMENTS
DECEMBER 31, 2017
(in thousands)
Description (12) | Maturity | Interest Rate (1) | Basis Point Spread Above Index (2) | LIBOR Interest Rate Floor | Industry | Par Amount | Cost | Fair Value | ||||||||||||||||
Non-Control/Non-Affiliate Investments | ||||||||||||||||||||||||
First Lien Floating Rate Loans —130.6% of Net Assets (5) | ||||||||||||||||||||||||
1A Smart Start LLC (6) (7) | 2/21/2022 | 6.19 | % | L+ 4.50 | 1.00 | % | Electronics/Electric | $ | 753 | $ | 751 | $ | 754 | |||||||||||
24 Hour Fitness Worldwide, Inc. | 5/28/2021 | 5.44 | % | L+ 3.75 | 1.00 | % | Leisure Goods/Activities/Movies | 1,932 | 1,928 | 1,937 | ||||||||||||||
Academy, Ltd. | 7/1/2022 | 5.57 | % | L+ 4.00 | 1.00 | % | Retailers (except Food and Drug) | 895 | 807 | 709 | ||||||||||||||
Acosta, Inc. | 9/26/2021 | 4.82 | % | L+ 3.25 | 1.00 | % | Business Equipment and Services | 2,425 | 2,401 | 2,142 | ||||||||||||||
Acrisure, LLC | 11/22/2023 | 5.65 | % | L+ 4.25 | 1.00 | % | Banking, Finance & Insurance | 330 | 329 | 334 | ||||||||||||||
Advanced Integration Technology LP (6) | 4/3/2023 | 6.32 | % | L+ 4.75 | 1.00 | % | Industrial Equipment | 1,985 | 1,985 | 2,000 | ||||||||||||||
Aegis Toxicology Sciences Corporation | 2/24/2021 | 6.17 | % | L+ 4.50 | 1.00 | % | Health Care | 1,608 | 1,603 | 1,558 | ||||||||||||||
Air Medical Group Holdings, Inc. | 4/28/2022 | 4.94 | % | L+ 3.25 | 1.00 | % | Health Care | 1,950 | 1,953 | 1,946 | ||||||||||||||
Air Medical Group Holdings, Inc. | 4/28/2022 | 5.67 | % | L+ 4.00 | 1.00 | % | Health Care | 496 | 494 | 497 | ||||||||||||||
Albertson's LLC | 12/21/2022 | 4.67 | % | L+ 3.00 | 0.75 | % | Food/Drug Retailers | 980 | 961 | 962 | ||||||||||||||
American Residential Services, LLC | 6/30/2022 | 5.57 | % | L+ 4.00 | 1.00 | % | Ecological Services and Equipment | 1,980 | 1,975 | 1,987 | ||||||||||||||
American Tire Distributors, Inc. | 9/1/2021 | 5.82 | % | L+ 4.25 | 1.00 | % | Retailers (except Food and Drug) | 956 | 953 | 964 | ||||||||||||||
AqGen Ascensus, Inc. | 12/5/2022 | 5.69 | % | L+ 4.00 | 1.00 | % | Financial Intermediaries | 1,719 | 1,675 | 1,728 | ||||||||||||||
Arctic Glacier U.S.A., Inc. | 3/20/2024 | 5.82 | % | L+ 4.25 | 1.00 | % | Food Products | 993 | 988 | 1,005 | ||||||||||||||
Ardent Legacy Acquisitions, Inc. | 8/4/2021 | 7.07 | % | L+ 5.50 | 1.00 | % | Health Care | 321 | 319 | 322 | ||||||||||||||
Argon Medical Devices, Inc. (7) | 10/27/2024 | 5.25 | % | L+ 4.25 | 1.00 | % | Health Care | 1,500 | 1,493 | 1,512 | ||||||||||||||
AssuredPartners, Inc. | 10/22/2024 | 5.07 | % | L+ 3.50 | — | % | Insurance | 1,327 | 1,327 | 1,337 | ||||||||||||||
BCP Raptor, LLC | 6/24/2024 | 5.73 | % | L+ 4.25 | 1.00 | % | Energy | 1,095 | 1,071 | 1,101 | ||||||||||||||
BCPE Eagle Buyer LLC (6) | 3/16/2024 | 5.82 | % | L+ 4.25 | 1.00 | % | Health Care | 1,290 | 1,278 | 1,264 | ||||||||||||||
Big Jack Holdings LP (6) | 4/5/2024 | 5.57 | % | L+ 4.00 | 1.00 | % | Food/Drug Retailers | 1,858 | 1,850 | 1,865 | ||||||||||||||
BJ's Wholesale Club, Inc. | 2/3/2024 | 4.95 | % | L+ 3.50 | 1.00 | % | Food/Drug Retailers | 1,894 | 1,891 | 1,866 | ||||||||||||||
Blackboard, Inc. | 6/30/2021 | 6.35 | % | L+ 5.00 | 1.00 | % | Electronics/Electric | 2,387 | 2,387 | 2,369 | ||||||||||||||
Brand Energy & Infrastructure Services, Inc. | 6/21/2024 | 5.61 | % | L+ 4.25 | 1.00 | % | Oil and Gas | 2,483 | 2,459 | 2,495 | ||||||||||||||
Calceus Acquisition, Inc. | 1/31/2020 | 5.57 | % | L+ 4.00 | 1.00 | % | Clothing/Textiles | 2,286 | 2,289 | 2,143 | ||||||||||||||
Catalina Marketing Corporation | 4/9/2021 | 5.07 | % | L+ 3.50 | 1.00 | % | Business Equipment and Services | 2,388 | 2,387 | 1,883 | ||||||||||||||
CB Poly Investments, LLC | 8/16/2023 | 6.32 | % | L+ 4.75 | 1.00 | % | Clothing/Textiles | 1,731 | 1,719 | 1,745 | ||||||||||||||
Central Security Group, Inc. | 10/6/2021 | 7.19 | % | L+ 5.63 | 1.00 | % | Electronics/Electric | 1,995 | 2,009 | 2,005 | ||||||||||||||
Charter NEX US, Inc. | 5/16/2024 | 4.82 | % | L+ 3.25 | 1.00 | % | Manufacturing | 597 | 594 | 599 | ||||||||||||||
CIBT Global, Inc. | 6/1/2024 | 5.44 | % | L+ 3.75 | 1.00 | % | Service & Equipment | 995 | 993 | 1,000 | ||||||||||||||
Comfort Holding, LLC | 2/5/2024 | 6.18 | % | L+ 4.75 | 1.00 | % | Home Furnishings | 2,252 | 2,240 | 2,056 | ||||||||||||||
CT Technologies Intermediate Holdings, Inc. | 12/1/2021 | 5.82 | % | L+ 4.25 | 1.00 | % | Electronics/Electric | 488 | 486 | 487 | ||||||||||||||
DiversiTech Holdings, Inc. | 6/3/2024 | 5.20 | % | L+ 3.50 | 1.00 | % | Industrials | 1,990 | 1,985 | 2,002 | ||||||||||||||
DJO Finance LLC | 6/8/2020 | 4.59 | % | L+ 3.25 | 1.00 | % | Health Care | 992 | 976 | 981 | ||||||||||||||
DTI Holdco, Inc. | 10/2/2023 | 6.63 | % | L+ 5.25 | 1.00 | % | Electronics/Electric | 742 | 741 | 742 | ||||||||||||||
Dynacast International LLC | 1/28/2022 | 4.94 | % | L+ 3.25 | 1.00 | % | Industrial Equipment | 531 | 531 | 535 | ||||||||||||||
Eastern Power, LLC | 10/2/2023 | 5.32 | % | L+ 3.75 | 1.00 | % | Utilities | 1,885 | 1,876 | 1,904 | ||||||||||||||
ECi Software Solutions, Inc. | 9/27/2024 | 5.94 | % | L+ 4.25 | 1.00 | % | Technology | 1,496 | 1,482 | 1,511 | ||||||||||||||
EIG Investors Corp. (3) | 2/9/2023 | 5.46 | % | L+ 4.00 | 1.00 | % | Electronics/Electric | 2,244 | 2,238 | 2,261 | ||||||||||||||
Epicor Software Corporation | 6/1/2022 | 5.32 | % | L+ 3.75 | 1.00 | % | Electronics/Electric | 1,949 | 1,936 | 1,956 | ||||||||||||||
13
AMERICAN CAPITAL SENIOR FLOATING, LTD.
CONSOLIDATED SCHEDULE OF INVESTMENTS (Continued)
DECEMBER 31, 2017
(in thousands)
Description (12) | Maturity | Interest Rate (1) | Basis Point Spread Above Index (2) | LIBOR Interest Rate Floor | Industry | Par Amount | Cost | Fair Value | ||||||||||||||||
First Lien Floating Rate Loans (continued) —130.6% of Net Assets (5) | ||||||||||||||||||||||||
ExamWorks Group, Inc. | 7/27/2023 | 4.82 | % | L+ 3.25 | 1.00 | % | Business Equipment and Services | $ | 988 | $ | 991 | $ | 995 | |||||||||||
Fairmount Santrol Inc. | 11/1/2022 | 7.69 | % | L+ 6.00 | 1.00 | % | Nonferrous Metals/Minerals | 1,811 | 1,785 | 1,837 | ||||||||||||||
FHC Health Systems, Inc. | 12/23/2021 | 5.57 | % | L+ 4.00 | 1.00 | % | Health Care | 1,477 | 1,461 | 1,449 | ||||||||||||||
Flexera Software LLC | 4/2/2020 | 5.07 | % | L+ 3.50 | 1.00 | % | Electronics/Electric | 993 | 993 | 999 | ||||||||||||||
Genesys Telecommunications Laboratories, Inc | 12/1/2023 | 5.44 | % | L+ 3.75 | — | % | Business Equipment and Services | 496 | 490 | 500 | ||||||||||||||
Go Wireless Inc. (7) | 12/24/2024 | 7.50 | % | L+ 6.50 | 1.00 | % | Telecommunications | 1,469 | 1,454 | 1,458 | ||||||||||||||
HGIM Corp. (6) (10) | 6/18/2020 | 7.75 | % | L+ 3.50 | 1.00 | % | Surface Transport | 1,444 | 1,449 | 570 | ||||||||||||||
Hummel Station LLC (6) | 10/27/2022 | 7.57 | % | L+ 6.00 | 1.00 | % | Energy | 2,000 | 1,883 | 1,900 | ||||||||||||||
Hyland Software, Inc. | 7/1/2022 | 4.82 | % | L+ 3.25 | 0.75 | % | Electronics/Electric | 2,440 | 2,425 | 2,460 | ||||||||||||||
IBC Capital Limited (3) | 9/9/2021 | 5.29 | % | L+ 3.75 | 1.00 | % | Business Equipment and Services | 987 | 980 | 989 | ||||||||||||||
Immucor, Inc. | 6/15/2021 | 6.57 | % | L+ 5.00 | 1.00 | % | Conglomerates | 2,488 | 2,465 | 2,533 | ||||||||||||||
Indra Holdings Corp. | 5/1/2021 | 5.63 | % | L+ 4.25 | 1.00 | % | Clothing/Textiles | 1,185 | 1,180 | 701 | ||||||||||||||
Infoblox Inc. | 11/7/2023 | 6.57 | % | L+ 5.00 | 1.00 | % | Electronics/Electric | 1,920 | 1,894 | 1,935 | ||||||||||||||
Informatica Corporation | 8/5/2022 | 5.19 | % | L+ 3.50 | 1.00 | % | Electronics/Electric | 1,928 | 1,925 | 1,937 | ||||||||||||||
Information Resources, Inc. | 1/18/2024 | 5.62 | % | L+ 4.25 | 1.00 | % | Business Equipment and Services | 2,413 | 2,403 | 2,429 | ||||||||||||||
Innovative XCessories & Services LLC (6) (7) | 11/29/2022 | 6.21 | % | L+ 4.75 | 1.00 | % | Automotive | 1,997 | 1,987 | 2,022 | ||||||||||||||
IPC Corp. (6) | 8/6/2021 | 5.88 | % | L+ 4.50 | 1.00 | % | Telecommunications | 1,459 | 1,455 | 1,433 | ||||||||||||||
JAGGAER, Inc. (6) (7) | 12/21/2024 | 5.00 | % | L+ 4.00 | 1.00 | % | Technology | 2,500 | 2,487 | 2,494 | ||||||||||||||
Jazz Acquisition, Inc. | 6/19/2021 | 5.19 | % | L+ 3.50 | 1.00 | % | Aerospace and Defense | 1,932 | 1,935 | 1,891 | ||||||||||||||
JC Penney Co Inc (3) | 6/23/2023 | 5.73 | % | L+ 4.25 | 1.00 | % | Retailers (except Food and Drug) | 731 | 734 | 686 | ||||||||||||||
Jo-Ann Stores, Inc. | 10/20/2023 | 6.55 | % | L+ 5.00 | 1.00 | % | Retailers (except Food and Drug) | 564 | 555 | 545 | ||||||||||||||
KEMET Corporation (3), (6) | 4/26/2024 | 7.57 | % | L+ 6.00 | 1.00 | % | Electronics | 2,712 | 2,678 | 2,742 | ||||||||||||||
Kingpin Intermediate Holdings LLC (6) | 7/3/2024 | 5.73 | % | L+ 4.25 | 1.00 | % | Service & Equipment | 871 | 867 | 881 | ||||||||||||||
Kronos Acquisition Intermediate Inc. | 8/26/2022 | 6.17 | % | L+ 4.50 | 1.00 | % | Cosmetics/Toiletries | 711 | 699 | 717 | ||||||||||||||
Kronos Incorporated (3) | 11/1/2023 | 4.90 | % | L+ 3.50 | 1.00 | % | Electronics/Electric | 2,277 | 2,270 | 2,295 | ||||||||||||||
LANDesk Software Group, Inc. | 1/20/2024 | 5.82 | % | L+ 4.25 | 1.00 | % | Electronics/Electric | 2,583 | 2,567 | 2,463 | ||||||||||||||
Learning Care Group (US) No. 2 Inc. (6) | 5/5/2021 | 5.33 | % | L+ 4.00 | 1.00 | % | Business Equipment and Services | 987 | 987 | 994 | ||||||||||||||
Legalzoom.com, Inc. (6) | 11/21/2024 | 5.94 | % | L+ 4.50 | 1.00 | % | Technology | 1,931 | 1,912 | 1,936 | ||||||||||||||
Liberty Cablevision of Puerto Rico LLC | 1/7/2022 | 4.86 | % | L+ 3.50 | 1.00 | % | Cable and Satellite Television | 1,000 | 995 | 973 | ||||||||||||||
LSF9 Atlantis Holdings LLC | 5/1/2023 | 7.36 | % | L+ 6.00 | 1.00 | % | Telecommunications/Cellular Communications | 2,095 | 2,094 | 2,106 | ||||||||||||||
MB Aerospace Holdings II Corp. (7) | 12/28/2024 | 5.00 | % | L+ 4.00 | 1.00 | % | Aerospace and Defense | 2,000 | 1,990 | 2,005 | ||||||||||||||
McGraw-Hill Global Education Holdings, LLC | 5/4/2022 | 5.57 | % | L+ 4.00 | 1.00 | % | Publishing | 1,976 | 1,966 | 1,977 | ||||||||||||||
Meter Readings Holdings, LLC (6) | 8/29/2023 | 7.23 | % | L+ 5.75 | 1.00 | % | Electronics/Electric | 658 | 650 | 662 | ||||||||||||||
Mirion Technologies, Inc. | 3/31/2022 | 6.44 | % | L+ 4.75 | 1.00 | % | Utilities | 1,985 | 1,987 | 1,985 | ||||||||||||||
MND Holdings III Corp (6) | 6/19/2024 | 5.44 | % | L+ 3.75 | 1.00 | % | Consumer Products | 1,791 | 1,783 | 1,804 | ||||||||||||||
Mohegan Tribal Gaming Authority | 10/13/2023 | 5.57 | % | L+ 4.00 | 1.00 | % | Lodging and Casinos | 1,489 | 1,508 | 1,504 | ||||||||||||||
Murray Energy Corporation | 4/16/2020 | 8.94 | % | L+ 7.25 | 1.00 | % | Nonferrous Metals/Minerals | 986 | 954 | 872 | ||||||||||||||
14
AMERICAN CAPITAL SENIOR FLOATING, LTD.
CONSOLIDATED SCHEDULE OF INVESTMENTS (Continued)
DECEMBER 31, 2017
(in thousands)
Description (12) | Maturity | Interest Rate (1) | Basis Point Spread Above Index (2) | LIBOR Interest Rate Floor | Industry | Par Amount | Cost | Fair Value | ||||||||||||||||
First Lien Floating Rate Loans (continued) —130.6% of Net Assets (5) | ||||||||||||||||||||||||
Navicure, Inc. (6) | 11/1/2024 | 5.11 | % | L+ 3.75 | 1.00 | % | Health Care | $ | 2,000 | $ | 1,990 | $ | 2,000 | |||||||||||
Navitas Midstream Midland Basin, LLC (6) | 12/13/2024 | 5.98 | % | L+ 4.50 | 1.00 | % | Oil and Gas | 2,000 | 1,990 | 2,008 | ||||||||||||||
NFP Corp | 1/8/2024 | 4.85 | % | L+ 3.50 | 1.00 | % | Diversified Insurance | 2,475 | 2,464 | 2,491 | ||||||||||||||
nThrive, Inc. | 10/20/2022 | 6.07 | % | L+ 4.50 | 1.00 | % | Health Care | 1,980 | 1,980 | 1,987 | ||||||||||||||
Oak Parent, Inc. (6) | 10/26/2023 | 6.07 | % | L+ 4.50 | 1.00 | % | Clothing/Textiles | 1,335 | 1,326 | 1,274 | ||||||||||||||
Omnitracs, LLC | 11/25/2020 | 5.45 | % | L+ 3.75 | 1.00 | % | Electronics/Electric | 982 | 971 | 992 | ||||||||||||||
Onex Carestream Finance LP | 6/7/2019 | 5.69 | % | L+ 4.00 | 1.00 | % | Health Care | 771 | 772 | 773 | ||||||||||||||
Optiv Inc. | 2/1/2024 | 4.63 | % | L+ 3.25 | 1.00 | % | Business Equipment and Services | 1,034 | 1,032 | 968 | ||||||||||||||
PAE Holding Corporation | 10/20/2022 | 7.12 | % | L+ 5.50 | 1.00 | % | Aerospace and Defense | 543 | 534 | 547 | ||||||||||||||
Patterson Medical Supply, Inc. (6) | 8/29/2022 | 6.23 | % | L+ 4.75 | 1.00 | % | Health Care | 1,997 | 1,975 | 1,918 | ||||||||||||||
PetSmart, Inc. | 3/11/2022 | 4.57 | % | L+ 3.00 | 1.00 | % | Retailers (except Food and Drug) | 483 | 481 | 385 | ||||||||||||||
Plaskolite, LLC (6) | 11/3/2022 | 5.69 | % | L+ 4.00 | 1.00 | % | Chemical/Plastics | 1,397 | 1,392 | 1,408 | ||||||||||||||
Plaze, Inc. | 7/31/2022 | 5.19 | % | L+ 3.50 | 1.00 | % | Chemical/Plastics | 818 | 817 | 826 | ||||||||||||||
Pregis Holding I Corporation | 5/20/2021 | 5.19 | % | L+ 3.50 | 1.00 | % | Chemical/Plastics | 1,344 | 1,330 | 1,350 | ||||||||||||||
Presidio, Inc. | 2/2/2022 | 4.59 | % | L+ 3.25 | 1.00 | % | Electronics/Electric | 1,050 | 1,050 | 1,055 | ||||||||||||||
PrimeLine Utility Services LLC | 11/14/2022 | 6.88 | % | L+ 5.50 | 1.00 | % | Utilities | 1,095 | 1,088 | 1,102 | ||||||||||||||
Project Alpha Intermediate Holding, Inc. | 4/26/2024 | 5.04 | % | L+ 3.50 | 1.00 | % | Technology | 1,756 | 1,748 | 1,721 | ||||||||||||||
Renaissance Learning, Inc. | 4/9/2021 | 5.44 | % | L+ 3.75 | 1.00 | % | Electronics/Electric | 1,911 | 1,911 | 1,926 | ||||||||||||||
Serta Simmons Bedding, LLC | 11/8/2023 | 4.84 | % | L+ 3.50 | 1.00 | % | Home Furnishings | 1,985 | 1,977 | 1,827 | ||||||||||||||
SMS System Maintenance Services, Inc. | 10/30/2023 | 6.57 | % | L+ 5.00 | 1.00 | % | Business Equipment and Services | 1,980 | 1,971 | 1,703 | ||||||||||||||
Solera, LLC (3) | 3/3/2023 | 4.82 | % | L+ 3.25 | 1.00 | % | Electronics/Electric | 939 | 928 | 946 | ||||||||||||||
StandardAero Aviation Holdings, Inc. | 7/7/2022 | 5.32 | % | L+ 3.75 | 1.00 | % | Aerospace and Defense | 1,154 | 1,149 | 1,165 | ||||||||||||||
Sterigenics-Nordion Holdings, LLC | 5/15/2022 | 4.57 | % | L+ 3.00 | 1.00 | % | Health Care | 887 | 881 | 887 | ||||||||||||||
Strategic Partners Acquisition Corp. (6) | 6/30/2023 | 6.07 | % | L+ 4.50 | 1.00 | % | Clothing/Textiles | 1,910 | 1,910 | 1,922 | ||||||||||||||
Summit Midstream Partners Holdings, LLC (3) | 5/13/2022 | 7.57 | % | L+ 6.00 | 1.00 | % | Oil and Gas | 563 | 558 | 574 | ||||||||||||||
Syniverse Holdings, Inc | 4/23/2019 | 4.57 | % | L+ 3.00 | 1.00 | % | Telecommunications | 1,464 | 1,451 | 1,442 | ||||||||||||||
TCH-2 Holdings, LLC | 5/6/2021 | 5.57 | % | L+ 4.00 | 1.00 | % | Electronics/Electric | 538 | 525 | 542 | ||||||||||||||
The Edelman Financial Center, LLC | 11/11/2024 | 5.65 | % | L+ 4.25 | 1.00 | % | Banking, Finance & Insurance | 1,538 | 1,535 | 1,559 | ||||||||||||||
Thermasys Corp. | 5/3/2019 | 5.35 | % | L+ 4.00 | 1.25 | % | Industrial Equipment | 429 | 429 | 405 | ||||||||||||||
TIBCO Software Inc | 12/4/2020 | 5.07 | % | L+ 3.50 | 1.00 | % | Business Equipment and Services | 1,486 | 1,497 | 1,492 | ||||||||||||||
Traverse Midstream Partners LLC | 9/21/2024 | 5.85 | % | L+ 4.00 | 1.00 | % | Oil and Gas | 1,495 | 1,488 | 1,517 | ||||||||||||||
Tricorbraun Holdings, Inc. | 11/30/2023 | 5.39 | % | L+ 3.75 | 1.00 | % | Containers and Glass Products | 900 | 916 | 899 | ||||||||||||||
Tricorbraun Holdings, Inc. | 11/30/2023 | 5.44 | % | L+ 3.75 | — | % | Containers and Glass Products | 91 | 91 | 91 | ||||||||||||||
Truck Hero, Inc. | 4/22/2024 | 5.64 | % | L+ 4.00 | 1.00 | % | Automotive | 2,633 | 2,612 | 2,637 | ||||||||||||||
Turbocombustor Technology, Inc. (6) | 12/2/2020 | 5.83 | % | L+ 4.50 | 1.00 | % | Aerospace and Defense | 3,360 | 3,346 | 3,310 | ||||||||||||||
U.S. Renal Care, Inc. | 12/30/2022 | 5.94 | % | L+ 4.25 | 1.00 | % | Health Care | 490 | 486 | 484 | ||||||||||||||
University Support Services LLC | 7/6/2022 | 5.82 | % | L+ 4.25 | 1.00 | % | Health Care | 1,133 | 1,133 | 1,148 | ||||||||||||||
Vantage Specialty Chemicals, Inc. | 10/28/2024 | 5.37 | % | L+ 4.00 | 1.00 | % | Chemical/Plastics | 671 | 668 | 677 | ||||||||||||||
Veritas US Inc. (3) | 1/27/2023 | 6.19 | % | L+ 4.50 | 1.00 | % | Electronics/Electric | 1,983 | 1,944 | 1,990 | ||||||||||||||
15
AMERICAN CAPITAL SENIOR FLOATING, LTD.
CONSOLIDATED SCHEDULE OF INVESTMENTS (Continued)
DECEMBER 31, 2017
(in thousands)
Description (12) | Maturity | Interest Rate (1) | Basis Point Spread Above Index (2) | LIBOR Interest Rate Floor | Industry | Par Amount | Cost | Fair Value | ||||||||||||||||
First Lien Floating Rate Loans (continued) —130.6% of Net Assets (5) | ||||||||||||||||||||||||
VF Holding Corp. | 6/30/2023 | 4.82 | % | L+ 3.25 | 1.00 | % | Insurance | $ | 1,039 | $ | 1,035 | $ | 1,048 | |||||||||||
WP CPP Holdings, LLC | 12/28/2019 | 4.88 | % | L+ 3.50 | 1.00 | % | Aerospace and Defense | 2,383 | 2,382 | 2,388 | ||||||||||||||
YI, LLC (6) | 11/7/2024 | 5.69 | % | L+ 4.00 | 1.00 | % | Health Care | 1,423 | 1,416 | 1,421 | ||||||||||||||
YI, LLC (6) (9) | 11/7/2024 | 5.00 | % | L+ 4.00 | 1.00 | % | Health Care | 553 | (3 | ) | (1 | ) | ||||||||||||
Total First Lien Floating Rate Loans | $ | 174,990 | $ | 173,374 | $ | 170,947 | ||||||||||||||||||
Second Lien Floating Rate Loans —11% of Net Assets (5) | ||||||||||||||||||||||||
Advantage Sales & Marketing Inc. | 7/25/2022 | 7.88 | % | L+ 6.50 | 1.00 | % | Business Equipment and Services | $ | 1,000 | $ | 995 | $ | 940 | |||||||||||
Albany Molecular Research, Inc. (7) | 8/30/2025 | 8.57 | % | L+ 7.00 | 1.00 | % | Health Care | 3,002 | 3,055 | 2,961 | ||||||||||||||
Almonde Inc (3) | 6/13/2025 | 8.73 | % | L+ 7.25 | 1.00 | % | Technology | 609 | 603 | 612 | ||||||||||||||
Anchor Glass Container Corporation | 12/7/2024 | 9.18 | % | L+ 7.75 | 1.00 | % | Containers and Glass Products | 500 | 496 | 507 | ||||||||||||||
Applied Systems, Inc. | 9/19/2025 | 8.69 | % | L+ 7.00 | 1.00 | % | Technology | 344 | 344 | 357 | ||||||||||||||
Asurion, LLC | 8/4/2025 | 7.57 | % | L+ 6.00 | — | % | Diversified Insurance | 567 | 567 | 583 | ||||||||||||||
BJ's Wholesale Club, Inc. | 2/3/2025 | 8.95 | % | L+ 7.50 | 1.00 | % | Food/Drug Retailers | 845 | 825 | 827 | ||||||||||||||
CH Hold Corp. (6) | 2/3/2025 | 8.82 | % | L+ 7.25 | 1.00 | % | Automotive | 149 | 148 | 152 | ||||||||||||||
Checkout Holding Corp. | 4/11/2022 | 8.32 | % | L+ 6.75 | 1.00 | % | Business Equipment and Services | 1,000 | 1,001 | 415 | ||||||||||||||
Del Monte Foods, Inc. (3) | 8/18/2021 | 9.06 | % | L+ 7.25 | 1.00 | % | Food Products | 1,500 | 1,499 | 703 | ||||||||||||||
Hyland Software Inc. | 7/7/2025 | 8.57 | % | L+ 7.00 | 0.75 | % | Electronics/Electric | 298 | 297 | 306 | ||||||||||||||
Jazz Acquisition, Inc. | 6/19/2022 | 8.44 | % | L+ 6.75 | 1.00 | % | Aerospace and Defense | 1,250 | 1,254 | 1,182 | ||||||||||||||
Navicure, Inc. (6) | 10/31/2025 | 8.86 | % | L+ 7.50 | 1.00 | % | Health Care | 500 | 495 | 504 | ||||||||||||||
NVA Holdings, Inc. | 8/14/2022 | 8.69 | % | L+ 7.00 | 1.00 | % | Health Care | 1,500 | 1,506 | 1,512 | ||||||||||||||
Optiv Inc. | 1/31/2025 | 8.63 | % | L+ 7.25 | 1.00 | % | Business Equipment and Services | 444 | 442 | 401 | ||||||||||||||
ProAmpac PG Borrower LLC | 11/18/2024 | 9.94 | % | L+ 8.50 | 1.00 | % | Containers and Glass Products | 500 | 494 | 510 | ||||||||||||||
Ranpak Corp. (6) | 10/3/2022 | 8.75 | % | L+ 7.25 | 1.00 | % | Containers and Glass Products | 840 | 840 | 836 | ||||||||||||||
Solenis International, L.P. | 7/31/2022 | 8.23 | % | L+ 6.75 | 1.00 | % | Chemical/Plastics | 500 | 499 | 480 | ||||||||||||||
Vantage Specialty Chemicals, Inc. (6) | 10/27/2025 | 9.62 | % | L+ 8.25 | 1.00 | % | Chemical/Plastics | 125 | 123 | 123 | ||||||||||||||
WP CPP Holdings, LLC | 4/30/2021 | 9.13 | % | L+ 7.75 | 1.00 | % | Aerospace and Defense | 493 | 498 | 490 | ||||||||||||||
Total Second Lien Floating Rate Loans | $ | 15,966 | $ | 15,981 | $ | 14,401 | ||||||||||||||||||
CLO Equity —33.5% of Net Assets | ||||||||||||||||||||||||
AMMC CLO 21, Subordinated Notes (3) (4) (6) | 11/2/2030 | 12.22 | % | $ | 2,750 | $ | 2,548 | $ | 2,527 | |||||||||||||||
Apidos CLO XIV, Income Notes (3) (4) (6) | 4/15/2025 | — | % | 5,900 | 1,342 | 295 | ||||||||||||||||||
Apidos CLO XVIII, Income Notes (3) (4) (6) | 7/22/2026 | 6.71 | % | 2,500 | 1,696 | 1,439 | ||||||||||||||||||
Apidos CLO XXVII, Income Notes (3) (4) (6) | 7/17/2030 | 10.23 | % | 5,000 | 4,630 | 4,446 | ||||||||||||||||||
Ares XXIX CLO Ltd., Subordinated Notes (3) (4) (6) | 4/17/2026 | 6.68 | % | 4,750 | 3,237 | 2,305 | ||||||||||||||||||
Avery Point II CLO, Income Notes (3) (4) (6) | 7/17/2025 | 7.53 | % | 3,200 | 1,669 | 373 | ||||||||||||||||||
Babson 2015-1, Income Notes (3) (4) (6) | 4/20/2027 | 14.58 | % | 2,500 | 1,844 | 1,359 | ||||||||||||||||||
Betony CLO, Ltd., Subordinated Notes (3) (4) (6) | 4/15/2027 | 5.69 | % | 2,500 | 1,785 | 972 | ||||||||||||||||||
Carlyle Global Market Strategies CLO 2015-3, LTD., Subordinated Notes (3) (4) (6) | 7/28/2028 | 10.54 | % | 3,000 | 2,253 | 2,308 | ||||||||||||||||||
16
AMERICAN CAPITAL SENIOR FLOATING, LTD.
CONSOLIDATED SCHEDULE OF INVESTMENTS (Continued)
DECEMBER 31, 2017
(in thousands)
Description (12) | Maturity | Interest Rate (1) | Basis Point Spread Above Index (2) | LIBOR Interest Rate Floor | Industry | Par Amount | Cost | Fair Value | ||||||||||||||||
CLO Equity (continued) —33.5% of Net Assets | ||||||||||||||||||||||||
Carlyle Global Market Strategies CLO 2017-3, LTD., Subordinated Notes (3) (4) (6) | 7/20/2029 | 9.76 | % | $ | 2,000 | $ | 1,889 | $ | 1,860 | |||||||||||||||
Cent CLO 18 Limited, Subordinated Notes (3) (4) (6) | 7/23/2025 | 15.53 | % | 4,675 | 3,133 | 2,478 | ||||||||||||||||||
Cent CLO 19 Limited, Subordinated Notes (3) (4) (6) | 10/29/2025 | 14.40 | % | 2,750 | 2,042 | 1,622 | ||||||||||||||||||
Dryden 30 Senior Loan Fund, Subordinated Notes (3) (4) (6) | 11/15/2028 | 20.74 | % | 2,500 | 1,379 | 1,729 | ||||||||||||||||||
Dryden 30A Senior Loan Fund, Subordinated Notes (3) (4) (6) | 11/15/2028 | 19.86 | % | 250 | 126 | 173 | ||||||||||||||||||
Dryden 38 Senior Loan Fund, Subordinated Notes (3) (4) (6) | 7/15/2027 | 9.14 | % | 3,000 | 2,318 | 2,219 | ||||||||||||||||||
Galaxy XVI CLO, Ltd., Subordinated Notes (3) (4) (6) | 11/16/2025 | 9.08 | % | 2,750 | 1,717 | 1,238 | ||||||||||||||||||
Highbridge Loan Management 2013-2, Ltd., Subordinated Notes (3) (4) (6) | 10/20/2029 | 14.93 | % | 1,401 | 813 | 799 | ||||||||||||||||||
Magnetite VIII, Limited, Subordinated Notes (3) (4) (6) | 4/15/2026 | 7.90 | % | 3,000 | 2,140 | 1,710 | ||||||||||||||||||
Neuberger Berman CLO XV, Ltd., Subordinated Notes (3) (4) (6) | 10/15/2029 | 16.20 | % | 3,410 | 1,898 | 1,794 | ||||||||||||||||||
Octagon Investment Partners XX, Ltd., Subordinated Notes (3) (4) (6) | 8/12/2026 | 7.73 | % | 2,500 | 1,711 | 1,213 | ||||||||||||||||||
OZLM XIX, Subordinated Notes (3) (4) (6) | 11/22/2030 | 11.68 | % | 1,500 | 1,364 | 1,351 | ||||||||||||||||||
OZLM XXI, Subordinated Notes (3) (4) (6) (7) | 1/20/2031 | 11.47 | % | 1,750 | 1,584 | 1,584 | ||||||||||||||||||
Venture XVIII CLO, Subordinated Notes (3) (4) (6) | 10/15/2029 | 15.31 | % | 1,750 | 1,223 | 1,205 | ||||||||||||||||||
Voya 2017-2A, Subordinated Notes (3) (4) (6) | 6/7/2030 | 9.91 | % | 2,000 | 1,877 | 1,847 | ||||||||||||||||||
Voya CLO 2017-4, Subordinated Notes (3) (4) (6) | 10/15/2030 | 10.95 | % | 2,270 | 2,245 | 2,175 | ||||||||||||||||||
Wind River CLO 2014-1, Ltd. (3) (4) (6) | 4/18/2026 | 9.03 | % | 5,050 | 3,410 | 2,807 | ||||||||||||||||||
Total CLO Equity | $ | 74,656 | $ | 51,873 | $ | 43,828 | ||||||||||||||||||
Common Equity —0% of Net Assets | ||||||||||||||||||||||||
Ameriforge Group Inc., Common Equity (1,570 shares) (6), (11), | $ | 2 | $ | — | $ | 64 | ||||||||||||||||||
Total Common Equity | $ | 2 | $ | — | $ | 64 | ||||||||||||||||||
Warrants —0.0% of Net Assets | ||||||||||||||||||||||||
Ameriforge Group Inc., Warrants (4,984 shares) (6), (11) | $ | 5 | $ | — | $ | — | ||||||||||||||||||
Total Warrants | $ | 5 | $ | — | $ | — | ||||||||||||||||||
Total Non-Control/Non-Affiliate Investments —175.2% of Net Assets (8) | $ | 265,619 | $ | 241,228 | $ | 229,240 | ||||||||||||||||||
Liabilities in Excess of Other Assets — (75.2%) of Net Assets | (98,384 | ) | ||||||||||||||||||||||
Net Assets — 100.0% | $ | 130,856 | ||||||||||||||||||||||
(1) | For each debt investment we have provided the weighted-average interest rate in effect as of December 31, 2017. For each CLO investment we have provided the yield as of December 31, 2017 determined using the effective interest method that will be applied to the current amortized cost of the investment in the following quarter. See “Note 2 - Significant Accounting Policies” to the consolidated financial statements regarding the recognition of investment income on CLOs. |
(2) | Floating rate debt investments typically accrue interest at a predetermined spread relative to an index, typically the London Interbank Offered Rate (“LIBOR” or “L”) or the prime index rate (“PRIME” or “P”), and reset monthly, quarterly or semi-annually. These instruments may be subject to a LIBOR or PRIME rate floor. |
(3) | Investments that are not “qualifying assets” under Section 55(a) of the 1940 Act. Under the 1940 Act, we may not acquire any non-qualifying asset unless, at the time such acquisition is made, qualifying assets represent at least 70% of our total assets. As of December 31, 2017, qualifying assets represented 75% of total assets at fair value. |
17
AMERICAN CAPITAL SENIOR FLOATING, LTD.
CONSOLIDATED SCHEDULE OF INVESTMENTS (Continued)
DECEMBER 31, 2017
(in thousands)
(4) | These securities are exempt from registration under Rule 144A of the Securities Act of 1933, as amended. These securities may be resold in transactions that are exempt from registration, normally to qualified institutional buyers. |
(5) | All first lien floating rate loans and second lien floating rate loans are held at ACSF Funding I, LLC (“ACSF Funding”), a wholly owned special purpose financing vehicle, and are pledged as collateral for a secured revolving credit facility (see “Note 7 - Debt”). |
(6) | Fair value was determined using significant unobservable inputs and are classified as Level 3 in the fair value hierarchy. |
(7) | All or a portion of this position has not settled as of December 31, 2017. |
(8) | Net estimated unrealized loss for federal income tax purposes was $14,148 as of December 31, 2017 based on a tax cost of $243,388. Estimated aggregate gross unrealized loss for federal income tax purposes as of December 31, 2017 is $16,155; estimated aggregate gross unrealized gain for federal income tax purposes as of December 31, 2017 was $2,007. |
(9) | As of December 31, 2017, the Company had the following commitments to fund various delayed draw SFRLs. Such commitments are subject to the satisfaction of certain conditions set forth in the documents governing these loans and there can be no assurance that such conditions will be satisfied. See Note 10 to the consolidated financial statements for further information on delayed draw loan commitments. |
(in thousands) Portfolio Company | Total revolving and delayed draw loan commitments | Less: drawn commitments | Total undrawn commitments | ||||||
YI, LLC | $ | 553 | $ | — | $ | 553 | |||
$ | 553 | $ | — | $ | 553 | ||||
(10) | Investment was placed on non-accrual status as of December 31, 2017. |
(11) | Non-income producing. |
(12) | All of the Company’s portfolio company investments, which as of December 31, 2017 represented 175.2% of the Company’s net assets or 97.7% of the Company’s total assets, were subject to legal restrictions on sales. |
18
AMERICAN CAPITAL SENIOR FLOATING, LTD.
NOTES TO CONSOLIDATED FINANCIAL STATEMENTS
(unaudited)
(in thousands, except per share data, percentages and as otherwise indicated; for example with the word “million” or otherwise)
Note 1. Organization
American Capital Senior Floating, Ltd. (which is referred to as “ACSF”, “we”, “us” and “our”) was organized in February 2013 as a Maryland corporation and commenced operations on October 15, 2013. We are structured as an externally managed, diversified closed-end investment management company that has elected to be regulated as a business development company (“BDC”) under the Investment Company Act of 1940, as amended and the rules and regulations promulgated thereunder (the “1940 Act”) and to be taxed as a regulated investment company (“RIC”), as defined in Subchapter M of the Internal Revenue Code of 1986, as amended (the “Code”).
In November 2013, we formed a wholly owned special purpose financing vehicle, ACSF Funding I, LLC, a Delaware limited liability company (“ACSF Funding”).
On January 3, 2017, Ivy Hill Asset Management, L.P. (“IHAM” or our “Manager”), a wholly owned portfolio company of Ares Capital Corporation (NASDAQ: ARCC) (“Ares Capital”) was appointed as our new investment adviser pursuant to the Interim Management Agreement (as defined below), and on such date, we entered into the Interim Management Agreement. On May 19, 2017, a new management agreement with IHAM was approved by our stockholders (the “Management Agreement”). Ares Capital is externally managed by Ares Capital Management LLC, a subsidiary of Ares Management, L.P. (NYSE: ARES) (“Ares Management”), a publicly traded, leading global alternative asset manager, pursuant to an investment advisory and management agreement. Our common stock is listed on the NASDAQ Global Select Market, where it trades under the symbol “ACSF.” IHAM is a U.S. Securities and Exchange Commission (the “SEC”) -registered investment adviser that was registered under the Investment Advisers Act of 1940 on March 30, 2012.
See Note 11 for a subsequent event regarding the approval of a Plan of Complete Liquidation and Dissolution of ACSF by ACSF’s board of directors.
Investment Objective
Our investment objective is to provide attractive, risk-adjusted returns over the long term primarily through current income while seeking to preserve our capital. Our Manager actively manages our leveraged portfolio composed primarily of diversified investments in first lien and second lien floating rate loans principally to large-market U.S.-based companies (collectively, “Senior Floating Rate Loans” or “SFRLs”), which are commonly referred to as leveraged loans. We also invest in debt and equity tranches of collateralized loan obligations (“CLOs”), which are securitized vehicles collateralized primarily by SFRLs. In addition, we may selectively invest in loans issued by middle market companies, mezzanine and unitranche loans and high yield bonds. Additionally, we may from time to time hold or invest in other equity investments and other debt or equity securities generally arising from a restructuring of SFRL positions previously held by us.
Note 2. Significant Accounting Policies
Basis of Presentation
The accompanying consolidated financial statements have been prepared in accordance with generally accepted accounting principles in the United States of America (“GAAP”) for interim financial information and pursuant to the requirements for reporting on Form 10-Q and Article 10 of Regulation S-X. We are an investment company following accounting and reporting guidance in Accounting Standards Codification (“ASC”) 946. Accordingly, certain disclosures accompanying annual financial statements prepared in accordance with GAAP are omitted. The Company has reclassified certain prior period amounts to conform to the current year presentation. In the opinion of management, all adjustments and reclassifications which are of a normal recurring nature and considered necessary for the fair presentation of the financial statements for the interim period have been included. The current period’s results of operations are not necessarily indicative of results that ultimately may be achieved for the fiscal year ending December 31, 2018. The unaudited interim consolidated financial statements and notes thereto should be read in conjunction with the consolidated financial statements and notes thereto included in our Annual Report on Form 10-K for the year ended December 31, 2017.
The consolidated financial statements include our accounts and those of our wholly owned subsidiary, ACSF Funding. Intercompany accounts and transactions have been eliminated in consolidation. The accounts of ACSF Funding are prepared for
19
AMERICAN CAPITAL SENIOR FLOATING, LTD.
NOTES TO CONSOLIDATED FINANCIAL STATEMENTS (continued)
(unaudited)
(in thousands, except per share data, percentages and as otherwise indicated; for example, with the word “million” or otherwise)
the same reporting period as ours using consistent accounting policies. Subsequent events are evaluated and disclosed as appropriate for events occurring through the date the consolidated financial statements are issued.
Use of Estimates
The preparation of our financial statements in conformity with GAAP requires management to make estimates and assumptions that affect the reported amounts of assets and liabilities at the date of the financial statements and the reported amount of income and expenses during the reported period. Changes in the economic environment, financial markets, and any other parameters used in determining such estimates could cause actual results to differ.
Investment Classification
As required by the 1940 Act, investments are classified by level of control. “Control Investments” are defined as investments in portfolio companies that we are deemed to control, as defined in the 1940 Act. “Affiliate Investments” are investments in those companies that are affiliated companies, as defined in the 1940 Act, other than Control Investments. “Non-Control/Non-Affiliate Investments” are those that are neither Control Investments nor Affiliate Investments.
Generally, under the 1940 Act, we are deemed to control a company in which we have invested if we own more than 25% of the voting securities of such company. We are deemed to be an affiliate of a company if we own 5% or more of the voting securities of such company.
As of March 31, 2018 and December 31, 2017, all of our investments were non-control/non-affiliate investments.
Securities Transactions
Securities transactions are recorded on the trade date. The trade date for loans purchased in the “primary market” is considered the date on which the loan allocations are determined. The trade date for loans and other investments purchased in the “secondary market” is the date on which the transaction is entered into. The trade date for primary CLO equity transactions and any other security transaction entered outside conventional channels is the date on which (a) we have determined all material terms have been defined for the transaction and (b) we have obtained a right to (i) demand the securities purchased and incur an obligation to pay the price of the securities purchased or (ii) collect the proceeds of a sale and incurred an obligation to deliver the securities sold. Cost is determined based on consideration given, adjusted for amortization of original issuance discounts (“OID”), market discounts and premiums.
Realized Gain or Loss and Unrealized Gain or Loss
Realized gain or loss from an investment is recorded at the time of disposition and calculated using the weighted average cost method. Unrealized gain or loss reflects the changes in fair value of investments as determined in compliance with the valuation policy as discussed in Note 6.
Income Taxes
As a RIC under Subchapter M of the Code, we are not subject to U.S. federal income tax on the portion of our taxable income distributed to our stockholders as a dividend. We intend to distribute 100% of our taxable income and therefore do not anticipate incurring corporate-level U.S. federal or state income tax. As a RIC, we are also subject to a nondeductible federal excise tax if we do not distribute at least 98% of net ordinary income, 98.2% of any capital gain net income and any recognized and undistributed taxable income from prior years.
Income determined under GAAP differs from income determined under tax because of both temporary and permanent differences in income and expense recognition, including (i) unrealized gains and losses associated with debt investments marked to fair value for GAAP but excluded from taxable income until realized or settled, (ii) timing differences on income recognition for our CLO equity, (iii) premium amortization and gain adjustments attributable to net built-in gains recognized upon our initial public offering (“IPO”) and (iv) capital losses in excess of capital gains earned in a tax year do not reduce current year taxable income, and generally can be carried forward to offset capital gains.
20
AMERICAN CAPITAL SENIOR FLOATING, LTD.
NOTES TO CONSOLIDATED FINANCIAL STATEMENTS (continued)
(unaudited)
(in thousands, except per share data, percentages and as otherwise indicated; for example, with the word “million” or otherwise)
ASC Topic 740, Accounting for Uncertainty in Income Taxes (“ASC 740”), provides guidance for how uncertain tax positions should be recognized, measured, presented and disclosed. ASC 740 requires the evaluation of tax positions taken or expected to be taken in the course of preparing the tax returns to determine whether the tax positions are “more-likely-than-not” of being sustained by the applicable tax authority. Tax positions not deemed to meet the “more-likely-than-not” threshold are recorded as a tax benefit or provision in the current year. Determinations regarding ASC 740 may be subject to review and adjustment at a later date based upon factors, including, but not limited to, an ongoing analysis of tax laws, regulations and interpretations thereof. We are not aware of any tax positions for which it is reasonably possible that the total amount of unrecognized tax benefits will change materially in the next 12 months.
If we incur interest and/or penalties in connection with our tax obligations, such amounts shall be classified as income tax expense on our consolidated statements of operations.
Investment Income
For debt investments, we record interest income on the accrual basis to the extent that such amounts are expected to be collected. OID and purchased discounts and premiums are accreted into interest income using the effective interest method, where applicable. Loan origination fees are deferred and accreted into interest income using the effective interest method. We record prepayment premiums on loans and other investments as interest income when such amounts are received. We stop accruing interest on investments when it is determined that interest is no longer collectible. As of March 31, 2018 and December 31, 2017, we had one loan on non-accrual status, which represented 0.6% of the total investments at cost and 0.3% of the total investments at fair value.
Interest income on CLO equity investments is recognized using the effective interest method as required by ASC Subtopic 325-40, Investments-Other, Beneficial Interests in Securitized Financial Assets (“ASC 325-40”). Under ASC 325-40, at the time of purchase, we estimate the future expected cash flows and determine the effective yield of an investment based on these estimated cash flows and our cost basis. Subsequent to the purchase, these estimated cash flows are updated quarterly and a revised yield is calculated prospectively in accordance with ASC 320-10-35, Investment-Debt and Equity Securities. In the event that the fair value of an investment decreases below its current amortized cost basis, we may be required to write down the current amortized cost basis for a credit loss or to fair value depending on our hold expectations for the investment. Current amortized cost basis less the amount of any write down (“Reference Amount”) is used to calculate the effective yield used for interest income recognition purposes over the remaining life of the investment. We are precluded from reversing write downs for any subsequent increase in the expected cash flows of an investment with the effect of increasing total interest income over the life of the investment and increasing the realized loss recorded on the sale or redemption of the investment by the amount of the credit loss write down. In estimating these cash flows, there are a number of assumptions that are subject to uncertainties and contingencies. These include the amount and timing of principal payments (including prepayments, repurchases, defaults and liquidations), the pass through or coupon rate, and interest rate fluctuations. In addition, interest payment shortfalls due to delinquencies on the underlying loans and the timing and magnitude of projected credit losses on the loans underlying the securities have to be estimated. These uncertainties and contingencies are difficult to predict and are subject to future events that may impact our estimates and interest income. As a result, actual results may differ significantly from these estimates.
During the three months ended March 31, 2018, we recorded $0.5 million in reductions to the Reference Amount on three of our CLO equity investments. During the three months ended March 31, 2017, we recorded $3.0 million in reductions to the Reference Amount on seven of our CLO equity investments.
Cash and Cash Equivalents
Cash and cash equivalents consist of demand deposits and highly liquid financial instruments with original maturities of 90 days or less, including those held in overnight sweep bank deposit accounts. Cash and cash equivalents are carried at cost, which approximates fair value. We place our cash and cash equivalents with financial institutions and, at times, cash held in bank accounts may exceed the Federal Deposit Insurance Corporation insured limit.
21
AMERICAN CAPITAL SENIOR FLOATING, LTD.
NOTES TO CONSOLIDATED FINANCIAL STATEMENTS (continued)
(unaudited)
(in thousands, except per share data, percentages and as otherwise indicated; for example, with the word “million” or otherwise)
Consolidation
As permitted under Article 6 of Regulation S-X and as explained by ASC 946-810-45, Financial Services - Investment Companies - Consolidation, we will generally not consolidate an investment in a company other than an investment company subsidiary or a controlled operating company whose business consists primarily of providing services to us. Accordingly, we have consolidated the results of ACSF Funding in our consolidated financial statements.
Deferred Financing Costs
Deferred financing costs represent fees and other direct expenses incurred in connection with the issuance of debt. These costs are currently amortized over the life of ACSF Funding’s secured revolving credit facility using the straight line method.
Distributions to Stockholders
Distributions to stockholders are recorded on the ex-dividend date.
Other General and Administrative Expenses
Other general and administrative expenses include audit and tax fees, legal fees, board of directors’ fees, rent, insurance, IT system costs, custody, transfer agent and other operating expenses, some of which are overhead expenses allocated to us by our Manager as discussed in Note 3. These expenses are recognized as incurred on an accrual basis.
Note 3. Management Agreement
Prior to January 3, 2017, we were managed by American Capital ACSF Management, LLC (our “Prior Manager”), an indirect wholly owned subsidiary of American Capital, Ltd. (“American Capital”), pursuant to a management agreement dated January 15, 2014 between us and our Prior Manager (the “Prior Management Agreement”). On January 3, 2017, IHAM was appointed as our new investment adviser. Additionally, on January 3, 2017, we entered into an interim management agreement with our Manager pursuant to Rule 15a-4 adopted under the 1940 Act (the “Interim Management Agreement”). The Prior Management Agreement was automatically terminated in accordance with its terms as a result of its deemed “assignment” under the 1940 Act, following the acquisition of American Capital by Ares Capital on January 3, 2017. On May 19, 2017, the Management Agreement was approved by our stockholders, and on such date, we entered into the Management Agreement.
The Management Agreement provides that our Manager will be compensated for serving as ACSF’s investment adviser at the same rate as in the Interim Management Agreement and the Prior Management Agreement: an annual rate of 0.80% of our total assets, excluding cash and cash equivalents and net unrealized appreciation or depreciation, each as determined under GAAP at the end of the most recently completed fiscal quarter with no incentive fee. For the three months ended March 31, 2018 and 2017, we recognized a management fee of $469 and $531, respectively. The portion of the management fee accrued for the first quarter of 2018 remains unpaid and is recorded as a liability on our Consolidated Statement of Assets and Liabilities.
Pursuant to the Prior Management Agreement, our Prior Manager agreed to be responsible for certain of our operating expenses in excess of 0.75% of our consolidated net assets, less net unrealized appreciation or depreciation, each as determined under GAAP at the end of the most recently completed fiscal quarter for the first 24 months following the date of our IPO in January 2014 (the “Prior Expense Cap”). The Prior Expense Cap was voluntarily extended by our Prior Manager until the termination of the Prior Management Agreement, and thus the Prior Expense Cap expired on January 3, 2017.
Pursuant to the Management Agreement, the services of all investment professionals and staff of our investment adviser, when and to the extent engaged in providing investment advisory and management services to us, are provided and paid for by our investment adviser. We are responsible for all other expenses of our operations and transactions, including, but not limited to, costs incurred in connection with formation and capital raising activities; transaction costs incident to the acquisition, disposition, financing, hedging and ownership of our and our subsidiaries' investments; diligence costs incurred for prospective investments; expenses incurred in contracting with third parties; external legal, auditing, accounting, consulting, investor relations, portfolio valuation, brokerage and administrative fees and expenses; the compensation and expenses of our
22
AMERICAN CAPITAL SENIOR FLOATING, LTD.
NOTES TO CONSOLIDATED FINANCIAL STATEMENTS (continued)
(unaudited)
(in thousands, except per share data, percentages and as otherwise indicated; for example, with the word “million” or otherwise)
directors who are not employees of our Manager or any of its affiliates and the cost of liability insurance to indemnify our directors and officers and the officers and employees of our Manager and its affiliates who provide services to us; the costs associated with our indebtedness; expenses related to the payment of dividends; costs incurred by the Board and personnel of our Manager or its affiliates for travel on our behalf; expenses relating to communications to holders of our securities, including our website, and in complying with the continuous reporting and other requirements of the SEC and other governmental bodies; tax and license fees applicable to us and our subsidiaries; insurance costs incurred by us and our subsidiaries; transfer agent, custodial, trustee, third party loan administration and exchange listing fees; the costs of printing and mailing proxies and reports to our stockholders; the costs of establishing and maintaining our websites; all cost of organizing, modifying or dissolving our company or any subsidiary and costs in preparation of entering into or exiting any business activity; our pro rata portion of costs associated with any computer software, hardware or information technology services that are used by us or our subsidiaries; our pro rata portion of the costs and expenses incurred with respect to market information systems and publications, research publications and materials used by us or our Manager on our behalf; settlement, clearing, trustee, prime brokerage and custodial fees and expenses relating to us and our subsidiaries; the costs of maintaining compliance with all federal, state and local rules and regulations or any other regulatory agency (as such costs relate to us), all taxes and license fees and all insurance costs incurred on behalf of us; the costs of administering our equity incentive plans, if any; and our pro rata portion of rent and overhead expenses of our Manager and its affiliates required for our operations and our subsidiaries. Pursuant to the Management Agreement and the Interim Management Agreement (as applicable), for the three months ended March 31, 2018 and 2017, we recognized $19 and $27, respectively, of rent and overhead expenses that were reimbursable to our Manager.
Beginning in the first quarter of 2017, our Manager voluntarily agreed to be responsible for certain of our 2017 quarterly other operating expenses in excess of a certain percentage of our consolidated net assets, less net unrealized gain or loss, each as determined under GAAP (individually, for each such quarter, a “Voluntary Expense Cap” and collectively, the “Voluntary Expense Caps”). The first quarter 2017 Voluntary Expense Cap was calculated based on an annual rate of 0.75% of our consolidated net assets less net unrealized gain or loss as of March 31, 2017. The second quarter 2017 Voluntary Expense Cap and third quarter 2017 Voluntary Expense Cap were calculated based on an annual rate of 1.00% of our consolidated net assets less net unrealized gain or loss as of June 30, 2017 and September 30, 2017, respectively. The fourth quarter 2017 Voluntary Expense Cap was calculated based on an annual rate of 1.25% of our consolidated net assets less net unrealized gain or loss as of December 31, 2017. Our Manager has not agreed to be responsible for any of our operating expenses beyond December 31, 2017.
For the three months ended March 31, 2017, our Manager was responsible for $437 of other operating expenses as a result of the first quarter 2017 Voluntary Expense Cap.
Note 4. Related Party Transactions
Administrative Services Agreement
We are externally managed by our Manager and do not have any employees. Our Manager is responsible for administering our business activities and day-to-day operations pursuant to the Management Agreement as discussed in Note 3 above. Further, pursuant to the Management Agreement, our Manager has agreed to provide us with certain administrative services. Our Manager provides such services to us via its administrative services agreement (the “Administrative Agreement”) with Ares Operations LLC (“Ares Operations”), a subsidiary of Ares Management, pursuant to which Ares Operations provides IHAM with, among other things, office facilities, equipment, clerical, bookkeeping and record keeping services, services relating to the marketing and sale of interests in vehicles managed by IHAM, managing the services and oversight of custodians, depositories, accountants, attorneys, underwriters and such other persons in any other capacity deemed to be necessary, which allows IHAM to fulfill all of its responsibilities under the Management Agreement. Payments made to Ares Operations by our Manager under the Administrative Agreement are equal to an amount based upon the allocable portion of Ares Operations’ overhead and other expenses (including travel expenses) incurred by Ares Operations in performing its obligations under the Administrative Agreement, including the allocable portion of the compensation, rent and overhead expenses of certain of IHAM’s officers and their respective staffs incurred on our behalf.
23
AMERICAN CAPITAL SENIOR FLOATING, LTD.
NOTES TO CONSOLIDATED FINANCIAL STATEMENTS (continued)
(unaudited)
(in thousands, except per share data, percentages and as otherwise indicated; for example, with the word “million” or otherwise)
Securities Transactions
We may, from time to time, purchase securities from, or sell securities to affiliates of our Manager at fair value on the trade date. During the three months ended March 31, 2018 and 2017, there were no purchases of securities from or sale of securities to affiliates of our Manager.
Note 5. Earnings Per Share
The following table sets forth the computation of basic and diluted earnings per share for the three months ended March 31, 2018 and 2017:
Three Months Ended March, 31 | |||||||
2018 | 2017 | ||||||
Numerator — Net Earnings | $ | 3,125 | $ | 2,752 | |||
Denominator — weighted average shares | 10,000 | 10,000 | |||||
Net Earnings per share | $ | 0.31 | $ | 0.28 | |||
Note 6. Investments
We value our investments at fair value in accordance with the 1940 Act and ASC Topic 820, Fair Value Measurements and Disclosures (“ASC 820”), which defines fair value as the price that would be received upon the sale of an asset or paid to transfer a liability in an orderly transaction between market participants at the measurement date under current market conditions. Due to the uncertainty inherent in the valuation process, estimates of fair value may differ significantly from the values that would have been used had a ready market for our investments existed, and the differences could be material. Additionally, changes in the market environment and other events that may occur over the life of the investments may cause the gains or losses ultimately realized on the investments to be different than the valuations currently assigned.
ASC 820 provides a framework for measuring the fair value of assets and liabilities and provides guidance regarding a fair value hierarchy, which prioritizes information used to measure fair value and the effect of fair value measurements on earnings. When available, we determine the fair value of our investments using unadjusted quoted prices from active markets. Where inputs for an asset or liability fall into more than one level in the fair value hierarchy, the investment is classified in its entirety based on the lowest level input that is significant to that investment’s fair value measurement. We use judgment and consider factors specific to the investment when determining the significance of an input to a fair value measurement. Our policy is to recognize transfers in and out of levels as of the beginning of each reporting period. The three levels of the fair value hierarchy and investments that fall into each of the levels are described below:
Level 1: Inputs are unadjusted quoted prices in active markets that are accessible at the measurement date for identical, unrestricted assets or liabilities.
Level 2: Inputs other than quoted prices included within Level 1 that are observable for the asset or liability, either directly or indirectly. This may include valuations based on executed trades, broker quotations that constitute an executable price, and alternative pricing sources supported by observable inputs which, in each case, are either directly or indirectly observable for the asset in connection with market data at the measurement date.
Level 3: Inputs are unobservable and cannot be corroborated by observable market data. In certain cases, investments classified within Level 3 may include securities for which we have obtained indicative quotes from broker-dealers that do not necessarily represent prices the broker may be willing to trade on.
The valuation techniques used maximize the use of observable inputs and minimize the use of unobservable inputs. Our SFRLs are predominately valued based on evaluated prices from a nationally recognized independent pricing service or from third-party brokers who make markets in such debt investments. When possible, we make inquiries of third-party pricing sources to understand their use of significant inputs and assumptions. We review the third-party fair value estimates and perform procedures to validate their reasonableness, including an analysis of the range and dispersion of third-party estimates,
24
AMERICAN CAPITAL SENIOR FLOATING, LTD.
NOTES TO CONSOLIDATED FINANCIAL STATEMENTS (continued)
(unaudited)
(in thousands, except per share data, percentages and as otherwise indicated; for example, with the word “million” or otherwise)
frequency of pricing updates, comparison of recent trade activity for similar securities, and review for consistency with market conditions observed as of the measurement date.
There may be instances when independent or third-party pricing sources are not available, or cases where we believe that the third-party pricing sources do not provide sufficient evidence to support a market participant’s view of the fair value of the debt investment being valued. These instances may result from an investment in a less liquid loan such as a middle market loan, a mezzanine loan or unitranche loan, or a loan to a company that has become financially distressed. In these instances, we may estimate the fair value based on a combination of a market yield valuation methodology and evaluated pricing discussed above, or solely based on a market yield valuation methodology. Under the market yield valuation methodology, we estimate the fair value based on a discounted cash flow technique. For these loans, the unobservable inputs used in the market yield valuation methodology to measure fair value reflect management’s best estimate of assumptions that would be used by market participants when pricing the investment in a hypothetical transaction, including estimated remaining life, current market yield and interest rate spreads of similar loans and securities as of the measurement date. We will estimate the remaining life based on market data for the average life of similar loans. However, if we have information that the loan is expected to be repaid in the near term, we would use an estimated remaining life based on the expected repayment date. The average life to be used to estimate the fair value of our loans may be shorter than the legal maturity of the loans since many loans are prepaid prior to the maturity date. The interest rate spreads used to estimate the fair value of our loans is based on current interest rate spreads of similar loans. If there is a significant deterioration of the credit quality of a loan, we may consider other factors that a hypothetical market participant would use to estimate fair value, including the proceeds that would be received in a liquidation analysis.
We estimate the fair value of our CLO equity investments based on various valuation models from third-party pricing services as well as internal models. The valuation models generally utilize discounted cash flows and take into consideration prepayment and loss assumptions, based on historical experience and projected performance, economic factors, the characteristics and condition of the underlying collateral, comparable yields for similar securities and recent trading activity. These securities are classified as Level 3.
The following fair value hierarchy tables set forth our investments measured at fair value on a recurring basis by level as of March 31, 2018 and December 31, 2017:
March 31, 2018 | ||||||||||||||||
Total | Level 1 | Level 2 | Level 3 | |||||||||||||
First lien floating rate loans | $ | 169,620 | $ | — | $ | 132,382 | $ | 37,238 | ||||||||
Second lien floating rate loans | 12,970 | — | 10,570 | 2,400 | ||||||||||||
CLO equity | 41,977 | — | — | 41,977 | ||||||||||||
Common equity | 75 | — | — | 75 | ||||||||||||
Warrants | — | — | — | — | ||||||||||||
Total Investments | $ | 224,642 | $ | — | $ | 142,952 | $ | 81,690 | ||||||||
December 31, 2017 | ||||||||||||||||
Total | Level 1 | Level 2 | Level 3 | |||||||||||||
First lien floating rate loans | $ | 170,947 | $ | — | $ | 132,364 | $ | 38,583 | ||||||||
Second lien floating rate loans | 14,401 | — | 12,786 | 1,615 | ||||||||||||
CLO equity | 43,828 | — | — | 43,828 | ||||||||||||
Common equity | 64 | — | — | 64 | ||||||||||||
Warrants | — | — | — | — | ||||||||||||
Total Investments | $ | 229,240 | $ | — | $ | 145,150 | $ | 84,090 | ||||||||
The following table provides a summary of the changes in fair value of Level 3 assets for the three months ended March 31, 2018, as well as the portion of net unrealized gain (loss) for the three months ended March 31, 2018 related to those assets still held as of March 31, 2018:
25
AMERICAN CAPITAL SENIOR FLOATING, LTD.
NOTES TO CONSOLIDATED FINANCIAL STATEMENTS (continued)
(unaudited)
(in thousands, except per share data, percentages and as otherwise indicated; for example, with the word “million” or otherwise)
First Lien Floating Rate Loans | Second Lien Floating Rate Loans | CLO Equity | Common Equity | Warrants | Total | |||||||||||||||||||
Beginning Balance – December 31, 2017 | $ | 38,583 | $ | 1,615 | $ | 43,828 | $ | 64 | $ | — | $ | 84,090 | ||||||||||||
Purchases | 4,157 | — | 181 | — | — | 4,338 | ||||||||||||||||||
Sales | — | — | (963 | ) | — | — | (963 | ) | ||||||||||||||||
Repayments (1) | (1,357 | ) | (20 | ) | (2,266 | ) | — | — | (3,643 | ) | ||||||||||||||
Amortization/accretion and CLO income accrual (2) | 10 | — | 1,361 | — | — | 1,371 | ||||||||||||||||||
Transfers out (3) | (11,848 | ) | (123 | ) | — | — | — | (11,971 | ) | |||||||||||||||
Transfers in (3) | 7,572 | 907 | — | — | — | 8,479 | ||||||||||||||||||
Net realized gain (loss) | 9 | — | (784 | ) | — | — | (775 | ) | ||||||||||||||||
Net unrealized gain | 112 | 21 | 620 | 11 | — | 764 | ||||||||||||||||||
Ending Balance – March 31, 2018 | $ | 37,238 | $ | 2,400 | $ | 41,977 | $ | 75 | $ | — | $ | 81,690 | ||||||||||||
Net change in unrealized gain (loss) attributable to our Level 3 assets still held as of March 31, 2018 | $ | 131 | $ | 21 | $ | (193 | ) | $ | 10 | $ | — | $ | (31 | ) | ||||||||||
(1) | Includes total cash distributions from CLO equity investments. |
(2) | Includes amortization/accretion of discount/premium on the loan portfolio and income accrued on the CLOs using the effective interest method during the three months ended March 31, 2018. |
(3) | Investments were transferred into and out of Level 3 and Level 2 due to changes in the quantity and quality of inputs obtained to support the fair value of each investment. Transfers into and out of the levels are recognized at the beginning of the period. Transfers into Level 3 for SFRLs were due to an accounting policy change to classify vendor priced securities with only one broker quote supporting the price as a Level 3 investment beginning in the first quarter of 2018. |
The following table provides a summary of the changes in fair value of Level 3 assets for the three months ended March 31, 2017, as well as the portion of net unrealized gain (loss) for the three months ended March 31, 2017 related to those assets still held as of March 31, 2017:
First Lien Floating Rate Loans | Second Lien Floating Rate Loans | CLO Equity | Common Equity | Total | ||||||||||||||||
December 31, 2016 (1) | $ | — | $ | 554 | $ | 41,329 | $ | 16 | $ | 41,899 | ||||||||||
Purchases | 10,546 | 1,010 | 1,540 | — | 13,096 | |||||||||||||||
Sales | — | — | — | (9 | ) | (9 | ) | |||||||||||||
Repayments (1) | 882 | — | (2,646 | ) | — | (1,764 | ) | |||||||||||||
Amortization/accretion and CLO income accrual(3) | 2 | — | 1,835 | — | 1,837 | |||||||||||||||
Transfers out (4) | — | (554 | ) | — | — | (554 | ) | |||||||||||||
Transfers in (4) | 17,509 | 1,357 | — | — | 18,866 | |||||||||||||||
Net realized gain (loss) | (11 | ) | — | — | 9 | (2 | ) | |||||||||||||
Net unrealized gain (loss) | 185 | 15 | (27 | ) | (16 | ) | 157 | |||||||||||||
Ending Balance – March 31, 2017 | $ | 29,113 | $ | 2,382 | $ | 42,031 | $ | — | $ | 73,526 | ||||||||||
Net change in unrealized gain (loss) attributable to our Level 3 assets still held as of March 31, 2017 | $ | 165 | $ | 15 | $ | (163 | ) | $ | (16 | ) | $ | 1 | ||||||||
(1) | Beginning balances as of December 31, 2016 are presented as stated in our December 31, 2016 Annual Report on Form 10-K and were not updated to reflect the differences resulting from exercising judgment on observability of inputs to leveling as discussed in note (4) below. The financial effects of these differences appear as transfer between Level 2 and Level 3 during the current fiscal quarter. |
(2) | Includes total cash distributions from CLO equity investments. |
(3) | Includes amortization/accretion of discount/premium on the loan portfolio and income accrued on the CLOs using the effective interest method during the three months ended March 31, 2017. |
26
AMERICAN CAPITAL SENIOR FLOATING, LTD.
NOTES TO CONSOLIDATED FINANCIAL STATEMENTS (continued)
(unaudited)
(in thousands, except per share data, percentages and as otherwise indicated; for example, with the word “million” or otherwise)
(4) | Investments were transferred into and out of Level 3 and Level 2 due to changes in the quantity and quality of inputs obtained to support the fair value of each investment. Transfers into and out of the levels are recognized at the beginning of the period. Transfers into Level 3 for SFRLs were due to an accounting policy change to classify vendor priced securities with only one broker quote supporting the price as a Level 3 investment beginning in the first quarter of 2017. |
The following table summarizes the significant unobservable inputs used in the determination of fair value for our Level 3 investments by category of investment and valuation technique as of March 31, 2018:
Range | ||||||||||||
Fair Value | Valuation Techniques/ Methodology | Significant Unobservable Inputs | Minimum | Maximum | Weighted Average | |||||||
First lien floating rate loans | $ | 37,238 | Third-party vendor pricing service | N/A | N/A | N/A | N/A | |||||
Second lien floating rate loans | 2,400 | Third-party vendor pricing service and/or broker quote | N/A | N/A | N/A | N/A | ||||||
CLO equity | 41,977 | Third-party vendor pricing service | N/A | N/A | N/A | N/A | ||||||
Common equity | 75 | Third-party vendor pricing service | N/A | N/A | N/A | N/A | ||||||
Warrants | — | EV Market Multiple Analysis | EBITDA Multiple | 2.0x | 2.0x | 2.0x | ||||||
Total | $ | 81,690 | ||||||||||
The following table summarizes the significant unobservable inputs used in the determination of fair value for our Level 3 investments by category of investment and valuation technique as of December 31, 2017:
Range | ||||||||||||
Fair Value | Valuation Techniques/ Methodology | Significant Unobservable Inputs | Minimum | Maximum | Weighted Average | |||||||
First lien floating rate loans | $ | 38,583 | Third-party vendor pricing service | N/A | N/A | N/A | N/A | |||||
Second lien floating rate loans | 1,615 | Third-party vendor pricing service | N/A | N/A | N/A | N/A | ||||||
CLO equity | 41,949 | Third-party vendor pricing service | N/A | N/A | N/A | N/A | ||||||
1,584 | Recent Transaction Price | N/A | 90.5% | 90.5% | 90.5% | |||||||
295 | Estimated Distributions | Future Distribution | $295 | $295 | $295 | |||||||
Total CLO equity | 43,828 | |||||||||||
Common equity | 64 | Third-party vendor pricing service | N/A | N/A | N/A | N/A | ||||||
Warrants | — | EV Market Multiple Analysis | EBITDA Multiple | 2.0x | 2.0x | 2.0x | ||||||
Total | $ | 84,090 | ||||||||||
The significant unobservable inputs used in the fair value measurement of CLO equity include the default and prepayment rates used to establish projected cash flows and the discount rate applied in the valuation models to those projected cash flows. An increase in any one of these individual inputs in isolation would likely result in a decrease to fair value. However, given the interrelationship between these inputs, overall market conditions would likely have a more significant impact on our Level 3 fair values than changes in any one unobservable input. Our maximum exposure to loss due to credit risk is their fair value.
27
AMERICAN CAPITAL SENIOR FLOATING, LTD.
NOTES TO CONSOLIDATED FINANCIAL STATEMENTS (continued)
(unaudited)
(in thousands, except per share data, percentages and as otherwise indicated; for example, with the word “million” or otherwise)
We use Standard & Poor's, an independent international financial data and investment services company and provider of global equity indexes, for classifying the industry groupings of our SFRL investments. The following table shows the SFRL portfolio composition by industry grouping at fair value as a percentage of total SFRLs as of March 31, 2018 and December 31, 2017. Our investments in CLOs are excluded from the table.
March 31, 2018 | December 31, 2017 | |||
Health Care | 13.4% | 13.6% | ||
Electronics/Electric | 12.2% | 16.7% | ||
Business Equipment and Services | 7.9% | 8.6% | ||
Aerospace and Defense | 7.1% | 7.0% | ||
Technology | 4.7% | 4.7% | ||
Clothing/Textiles | 4.3% | 4.2% | ||
Utilities | 4.1% | 2.7% | ||
Oil and Gas | 3.6% | 3.6% | ||
Service & Equipment | 3.6% | 1.0% | ||
Food/Drug Retailers | 3.1% | 3.0% | ||
Energy | 2.8% | 1.6% | ||
Conglomerates | 2.7% | 1.4% | ||
Chemical/Plastics | 2.7% | 2.6% | ||
Automotive | 2.6% | 2.6% | ||
Telecommunications | 1.8% | 2.3% | ||
Diversified Insurance | 1.7% | 1.7% | ||
Industrial Equipment | 1.6% | 1.6% | ||
Banking, Finance & Insurance | 1.6% | 1.0% | ||
Containers and Glass Products | 1.5% | 1.5% | ||
Retailers (except Food and Drug) | 1.5% | 1.8% | ||
Electronics | 1.5% | 1.5% | ||
Nonferrous Metals/Minerals | 1.5% | 1.5% | ||
Education | 1.4% | —% | ||
Telecommunications/Cellular Communications | 1.1% | 1.1% | ||
Ecological services and equipment | 1.1% | 1.1% | ||
Publishing | 1.1% | 1.1% | ||
Leisure Goods/Activities/Movies | 1.1% | 1.0% | ||
Consumer Products | 1.0% | 1.0% | ||
Home Furnishings | 1.0% | 2.1% | ||
Financial Intermediaries | 0.9% | 0.9% | ||
Food Service | 0.8% | —% | ||
Lodging and Casinos | 0.8% | 0.8% | ||
Food Products | 0.6% | 0.9% | ||
Insurance | 0.6% | 1.3% | ||
Cable and Satellite Television | 0.5% | 0.5% | ||
Cosmetics/Toiletries | 0.4% | 0.4% | ||
Other | 0.1% | 1.6% | ||
Total | 100.0% | 100.0% | ||
28
AMERICAN CAPITAL SENIOR FLOATING, LTD.
NOTES TO CONSOLIDATED FINANCIAL STATEMENTS (continued)
(unaudited)
(in thousands, except per share data, percentages and as otherwise indicated; for example, with the word “million” or otherwise)
Note 7. Debt
Secured Revolving Credit Facility
ACSF Funding is a party to a secured revolving credit facility with Bank of America, N.A. (as amended and restated, the “Credit Facility”), which allows ACSF Funding to borrow up to $135,000. The Credit Facility matures on December 18, 2018. ACSF Funding may make draws under the Credit Facility from time to time to purchase or acquire certain eligible assets. The Credit Facility is secured by ACSF Funding’s assets pursuant to a security agreement and contains customary financial and negative covenants and events of default. On January 3, 2017, ACSF Funding entered into an amendment to the documents governing the Credit Facility that amended the relevant provisions of the Credit Facility to reflect the appointment of IHAM as ACSF’s new investment adviser. As of March 31, 2018 and December 31, 2017, the fair value of the assets pledged as collateral in ACSF Funding was $182,591 and $185,348, respectively. The Credit Facility is non-recourse to ACSF. Amounts drawn under the Credit Facility bear interest at a rate per annum equal to either (a) LIBOR plus 1.80%, or (b) 0.80% plus the highest of (i) the Federal funds rate plus 0.50%, (ii) Bank of America, N.A.’s prime rate or (iii) one-month LIBOR plus 1%. ACSF Funding may borrow, prepay and reborrow loans under the Credit Facility at any time prior to November 18, 2018, the commitment termination date, subject to certain terms and conditions, including maintaining a sufficient borrowing base. Any outstanding balance on the Credit Facility as of the commitment termination date must be repaid by the maturity date unless otherwise extended. See Note 11 for a subsequent event regarding a downsize of the Credit Facility.
ACSF Funding is required to pay a commitment fee in an amount equal to 0.75% on the actual daily unused amount of the current lender commitments under the Credit Facility to the extent the outstanding amount of committed loans is less than an amount equal to 90% of the aggregate commitments through the commitment termination date, payable quarterly in arrears.
As of March 31, 2018, there was $93,800 outstanding under the Credit Facility, which had a fair value of $93,800 and a stated interest rate of 3.68%. As of December 31, 2017, there was $87,500 outstanding under the Credit Facility, which had a fair value of $87,500 and a stated interest rate of 3.32%. The fair value of the Credit Facility is determined in accordance with ASC 820, which defines fair value in terms of the price that would be paid to transfer a liability in an orderly transaction between market participants at the measurement date under current market conditions and is measured with Level 3 inputs. As of March 31, 2018, ACSF and ACSF Funding were in compliance in all material respects with all covenants of the Credit Facility, including compliance with a borrowing base that applies various advance rates of up to 80% on the assets pledged as collateral by ACSF Funding.
For the three months ended March 31, 2018, we incurred interest and commitment fees on the Credit Facility of $801 and $75, respectively. For the three months ended March 31, 2017, we incurred interest and commitment fees on the Credit Facility of $643 and $67, respectively.
29
AMERICAN CAPITAL SENIOR FLOATING, LTD.
NOTES TO CONSOLIDATED FINANCIAL STATEMENTS (continued)
(unaudited)
(in thousands, except per share data, percentages and as otherwise indicated; for example, with the word “million” or otherwise)
Note 8. Consolidated Financial Highlights
Three Months Ended March 31, | ||||||||
2018 | 2017 | |||||||
Per Share Data: | ||||||||
Net asset value, beginning of period | $ | 13.09 | $ | 13.68 | ||||
Net investment income | 0.22 | 0.31 | ||||||
Net realized and unrealized gain (loss) on investments | 0.09 | (0.04 | ) | |||||
Net Earnings | 0.31 | 0.27 | ||||||
Distributions to stockholders | (0.29 | ) | (0.29 | ) | ||||
Net asset value, end of period | $ | 13.11 | $ | 13.66 | ||||
Per share market value, end of period | $ | 11.15 | $ | 13.75 | ||||
Total return based on market value (1), (5) | 8.76 | % | 18.18 | % | ||||
Total return based on net asset value (1), (5) | 2.38 | % | 2.01 | % | ||||
Ratios to Average Net Assets: | ||||||||
Net investment income (2) | 7.08 | % | 9.35 | % | ||||
Operating expenses (2), (3) | 2.61 | % | 2.06 | % | ||||
Interest and related expenses (2) | 2.76 | % | 2.18 | % | ||||
Total expenses (2), (3) | 5.37 | % | 4.24 | % | ||||
Supplemental Data: | ||||||||
Net assets, end of period | $ | 131,071 | $ | 136,631 | ||||
Shares outstanding, end of period | 10,000 | 10,000 | ||||||
Average debt outstanding | $ | 95,434 | $ | 99,244 | ||||
Asset coverage per unit, end of period (4) | $ | 2,397 | $ | 2,317 | ||||
Portfolio turnover ratio (5) | 10.79 | % | 25.86 | % | ||||
(1) | Total return is based on the change in market price or net asset value per share, as applicable, during the period and takes into account distributions reinvested in accordance with the dividend reinvestment and stock purchase plan. |
(2) | Annualized for periods less than one year. |
(3) | For the three months ended March 31, 2017, the ratio of operating expenses to average net assets and the ratio of total expenses to average net assets are shown net of the reimbursement for the first quarter 2017 Voluntary Expense Cap. The ratio of operating expenses to average net assets and the ratio of total expenses to average net assets would be 3.36% and 5.54%, respectively, without the first quarter 2017 Voluntary Expense Cap for the three months ended March 31, 2017. |
(4) | The asset coverage ratio for a class of senior securities representing indebtedness is calculated on our consolidated total assets, less all liabilities and indebtedness not represented by senior securities, divided by the senior securities representing indebtedness. This asset coverage ratio is multiplied by $1,000 to determine the asset coverage per unit. |
(5) | Not annualized for periods less than one year. |
Note 9. Capital Transactions
There were no common share transactions that occurred during the three months ended March 31, 2018.
On January 18, 2018, we declared a monthly cash distribution to stockholders of $0.097 per share for each of February, March and April 2018. See also Note 11.
Note 10. Commitments and Contingencies
In the ordinary course of business, we may be a party to certain legal proceedings, including actions brought against us and others with respect to investment transactions. The outcomes of any such legal proceedings are uncertain and, as a result of these proceedings, the values of the investments to which they relate could decrease. We were not subject to any material litigation against us as of March 31, 2018 or December 31, 2017.
Commitments to extend credit include loan proceeds we are obligated to advance, such as delayed draws or revolving credit arrangements. Commitments generally have fixed expiration dates or other termination clauses. Unrealized gains or
30
AMERICAN CAPITAL SENIOR FLOATING, LTD.
NOTES TO CONSOLIDATED FINANCIAL STATEMENTS (continued)
(unaudited)
(in thousands, except per share data, percentages and as otherwise indicated; for example, with the word “million” or otherwise)
losses associated with unfunded commitments are recorded in the consolidated financial statements and reflected as an adjustment to the fair value of the related security in the Consolidated Schedule of Investments. The par amount of the unfunded commitments is not recognized by the Company until the commitment becomes funded. As of March 31, 2018 and December 31, 2017, we had $784 and $553, respectively, of outstanding unfunded loan commitments.
Note 11. Subsequent Events
We declared a monthly cash distribution to stockholders of $0.097 per share for each of May, June and July 2018. The monthly cash distributions will be paid to common stockholders of record as set forth in the table below:
Distribution Per Share | Record Date | Ex-Dividend Date | Payment Date | |||||
May 2018 | $0.097 | May 21, 2018 | May 18, 2018 | June 4, 2018 | ||||
June 2018 | $0.097 | June 20, 2018 | June 19, 2018 | July 5, 2018 | ||||
July 2018 | $0.097 | July 20, 2018 | July 19, 2018 | August 2, 2018 | ||||
In May 2018, ACSF Funding exercised its option under its Credit Facility to reduce its total commitment thereunder by $20.0 million, resulting in aggregate commitments of $115.0 million under the Credit Facility.
Plan of Complete Liquidation and Dissolution
On May 4, 2018, ACSF’s board of directors approved a Plan of Complete Liquidation and Dissolution (the “Plan”) of ACSF that includes the sale of all or substantially all of ACSF’s assets and distribution of the net proceeds to ACSF’s stockholders, after which ACSF will be dissolved. The Plan is subject to the approval of the stockholders, which ACSF’s board of directors plans to seek at a special meeting called for the purpose of approving the Plan, as detailed in the preliminary proxy statement filed with the SEC on the date hereof. If ACSF’s stockholders approve the Plan, we intend to, among other things, convert all or substantially all of our assets into cash, pay all of our other known liabilities and make provisions for contingent liabilities, and make one or more distributions to our stockholders of cash available for distribution.
31
Item 2. Management’s Discussion and Analysis of Financial Condition and Results of Operations
The information contained in this section should be read in conjunction with our financial statements and notes thereto appearing elsewhere in this report.
Forward-Looking Statements
Some of the statements in this report constitute forward-looking statements, which relate to future events or our future performance or financial condition. We generally use words such as “anticipates,” “believes,” “expects,” “intends” and similar expressions to identify forward-looking statements. Our actual results could differ materially from those projected in the forward-looking statements for any reason, including any factors set forth in “Risk Factors” included in our Annual Report on Form 10-K for the year ended December 31, 2017 and elsewhere in this report. The forward-looking statements contained herein involve risks and uncertainties, including statements as to: (i) our ability to implement and proceed with the plan of complete liquidation and dissolution; (ii) our future operating results; (iii) our business prospects and the prospects of our portfolio companies; (iv) the impact of investments that we expect to make; (v) our contractual arrangements and relationships with third-parties; (vi) the dependence of our future success on the general economy and market conditions and their respective impact on the portfolio companies and industries in which we invest; (vii) the impact of changes in laws or regulations (including the interpretation thereof) governing our operations, including the Small Business Credit Availability Act (the “SBCAA”), or the operations of our portfolio companies or the operations of our competitors; (viii) the ability of our portfolio companies to achieve their objectives; (ix) our expected financings and investments; (x) the adequacy of our cash resources and working capital; and (xi) the timing of cash flows, if any, from the operations of our portfolio companies.
We have based the forward-looking statements included in this report on information available to us on the date of this report, and we assume no obligation to update any such forward-looking statements. Although we undertake no obligation to revise or update any forward-looking statements, whether as a result of new information, future events or otherwise, you are advised to consult any additional disclosures that we may make directly to you or through reports that we may file with the SEC in the future, including any annual reports on Form 10-K, quarterly reports on Form 10-Q and current reports on Form 8-K.
Overview
American Capital Senior Floating, Ltd. (“ACSF”, “we”, “our” and “us”), a Maryland corporation organized in February 2013 that commenced operations on October 15, 2013, is an externally managed, diversified closed-end investment management company. We have elected to be treated as a business development company (“BDC”) under the Investment Company Act of 1940, as amended, and the rules and regulations promulgated thereunder (the “1940 Act”). In addition, for U.S. federal income tax purposes we have elected to be treated as a regulated investment company (“RIC”) under Subchapter M of the Internal Revenue Code of 1986, as amended (the “Code”). We are an “emerging growth company,” as defined in the Jumpstart Our Business Startups Act of 2012 (“JOBS Act”), and intend to take advantage of the exemption for emerging growth companies allowing us to temporarily forgo the auditor attestation requirements of Section 404(b) of the Sarbanes-Oxley Act of 2002. We do not intend to take advantage of other disclosure or reporting exemptions for emerging growth companies under the JOBS Act.
Prior to January 3, 2017, we were managed by American Capital ACSF Management, LLC (our “Prior Manager”), an indirect wholly owned subsidiary of American Capital, Ltd (“American Capital”), pursuant to a management agreement dated January 15, 2014 between us and our Prior Manager (the “Prior Management Agreement”). On January 3, 2017, Ivy Hill Asset Management, L.P. (“IHAM” or our “Manager”) was appointed as our new investment adviser. Additionally, on January 3, 2017, we entered into an interim management agreement with our Manager pursuant to Rule 15a-4 adopted under the 1940 Act (the “Interim Management Agreement”). The Prior Management Agreement was automatically terminated in accordance with its terms as a result of its deemed “assignment” under the 1940 Act, following the acquisition of American Capital by Ares Capital Corporation (NASDAQ: ARCC) (“Ares Capital”) on January 3, 2017. On May 19, 2017, a new management agreement with our Manager was approved by our stockholders (the “Management Agreement” ), and on such date, we entered into the Management Agreement. The Management Agreement provides that our Manager will be compensated for serving as ACSF’s investment adviser at the same rate as in the Prior Management Agreement: an annual rate of 0.80% of our total assets, excluding cash and cash equivalents and net unrealized appreciation or depreciation, each as determined under GAAP at the end of the most recently completed fiscal quarter with no incentive fee.
In January 2014, pursuant to the Prior Management Agreement, our Prior Manager agreed to be responsible for certain of our operating expenses in excess of 0.75% of our consolidated net assets, less net unrealized appreciation or depreciation, each as determined under GAAP at the end of the most recently completed fiscal quarter for the first 24 months following the date of our initial public offering (“IPO”) in January 2014 (the “Prior Expense Cap”). The Prior Expense Cap was voluntarily
32
extended by our Prior Manager until the termination of the Prior Management Agreement, and thus the Prior Expense Cap expired on January 3, 2017.
Beginning in the first quarter of 2017, our Manager voluntarily agreed to be responsible for certain of our 2017 quarterly other operating expenses in excess of a certain percentage of our consolidated net assets, less net unrealized gain or loss, each as determined under GAAP (individually, for each such quarter, a “Voluntary Expense Cap” and collectively, the “Voluntary Expense Caps”). The first quarter 2017 Voluntary Expense Cap was calculated based on an annual rate of 0.75% of our consolidated net assets less net unrealized gain or loss as of March 31, 2017. The second quarter 2017 Voluntary Expense Cap and third quarter 2017 Voluntary Expense Cap were calculated based on an annual rate of 1.00% of our consolidated net assets less net unrealized gain or loss as of June 30, 2017 and September 30, 2017, respectively. The fourth quarter 2017 Voluntary Expense Cap was calculated based on an annual rate of 1.25% of our consolidated net assets less net unrealized gain or loss as of December 31, 2017. Our Manager has not agreed to be responsible for any of our operating expenses beyond December 31, 2017.
Investments
Our investment objective is to provide attractive, risk-adjusted returns over the long term primarily through current income while seeking to preserve our capital. Our Manager actively manages our leveraged portfolio composed primarily of diversified investments in first lien and second lien floating rate loans principally to large-market U.S.-based companies (collectively, “SFRLs” or “Loan Portfolio”) which are commonly referred to as leveraged loans. Standard and Poor's (“S&P”) defines large-market loans as loans to issuers with earnings before interest, taxes, depreciation and amortization (“EBITDA”) of greater than $50 million. SFRLs are typically collateralized by a company's assets and structured with first lien or second lien priority on collateral, providing for greater security and potential recovery in the event of default compared to other subordinated fixed-income products. We also invest in debt and equity tranches of collateralized loan obligations (“CLOs”) which are securitized vehicles collateralized primarily by SFRLs. In addition, we may selectively invest in loans issued by middle market companies, mezzanine and unitranche loans and high yield bonds. Additionally, we may from time to time hold or invest in other equity investments and other debt or equity securities generally arising from a restructuring of SFRL positions previously held by us. Under normal market conditions, we will invest at least 80% of our assets in SFRLs.
Our level of investment activity can vary substantially from period to period depending on many factors, including the amount of debt and equity capital available to U.S. based large-market private companies, the level of merger and acquisition activity for such companies, the general economic environment, market conditions and the competitive environment for the types of investments we make. As a BDC, we must not acquire any assets other than “qualifying assets” as defined by Section 55(a) of the 1940 Act unless, at the time the acquisition is made, at least 70% of our total assets are qualifying assets (with certain limited exceptions). Qualifying assets include investments in “eligible portfolio companies.” The definition of “eligible portfolio company” includes private operating companies and certain public companies whose securities are listed on a national securities exchange but whose market capitalization is less than $250 million, in each case organized under the laws of and with their principal place of business located in the United States. Investments in debt and equity tranches of CLOs are generally deemed non-qualified assets for BDC compliance purposes; therefore, under normal market conditions, we intend to limit our CLO investments to 20% of our portfolio.
Portfolio and Investment Activity
As of March 31, 2018, our portfolio was comprised of 75.5% first lien loans, 5.8% second lien loans (collectively, the “Loan Portfolio) and 18.7% CLO equity (the “CLO Portfolio” and together with the Loan Portfolio, the “Investment Portfolio”), measured at fair value. The Loan Portfolio consisted of 121 portfolio companies in 37 industries, and the CLO Portfolio included 24 CLOs managed by 17 different collateral managers with vintages ranging from 2012 to 2017. Our Loan Portfolio consisted of all floating rate investments with 94.7% having LIBOR floors ranging between 0.75% and 1.25%. The weighted average LIBOR floor in our Loan Portfolio was 0.94% as of March 31, 2018. The following table depicts a summary of the portfolio as of March 31, 2018:
33
($ in thousands) | Cost | Fair Value | Cumulative Net Unrealized Gain (Loss) | Weighted Average Yield at Cost (1) | ||||||||||
Investment Portfolio: | ||||||||||||||
First lien floating rate loans | $ | 170,798 | $ | 169,620 | $ | (1,178 | ) | 6.26 | % | |||||
Second lien floating rate loans | 13,835 | 12,970 | (865 | ) | 8.98 | % | ||||||||
Total Loan Portfolio | 184,633 | 182,590 | (2,043 | ) | 6.46 | % | ||||||||
CLO Portfolio | 49,401 | 41,977 | (7,424 | ) | 9.96 | % | ||||||||
Common equity | — | 75 | 75 | — | % | |||||||||
Warrants | — | — | — | — | % | |||||||||
Total Investment Portfolio | $ | 234,034 | $ | 224,642 | $ | (9,392 | ) | 7.20 | % | |||||
(1) | Weighted average yield at cost is computed as (a) the annual stated interest rate or yield earned on accruing debt and other income producing securities, divided by (b) the total investments in such asset type at amortized cost. The weighted average yield of our portfolio does not represent the total return to our stockholders. |
The weighted average yield at cost during the three months ended March 31, 2018 on the Loan Portfolio, the CLO Portfolio and the total investment portfolio was 6.23%, 10.64% and 7.15%, respectively.
The Investment Portfolio was actively managed, with a turnover ratio of 10.79% for the three months ended March 31, 2018. The following tables depict the portfolio activity for the three months ended March 31, 2018:
Three Months Ended March 31, 2018 | ||||||||||||||||||||
($ in thousands) | First Lien | Second Lien | CLO Equity | Equity | Total | |||||||||||||||
December 31, 2017, at Fair Value | $ | 170,947 | $ | 14,401 | $ | 43,828 | $ | 64 | $ | 229,240 | ||||||||||
Purchases | 23,631 | 879 | 182 | — | 24,692 | |||||||||||||||
Sales | (16,053 | ) | (1,050 | ) | (963 | ) | — | (18,066 | ) | |||||||||||
Repayments (1) | (9,750 | ) | (1,520 | ) | (2,267 | ) | — | (13,537 | ) | |||||||||||
Amortization/accretion and CLO income accrual (2) | 43 | (1 | ) | 1,361 | — | 1,403 | ||||||||||||||
Net realized loss | (447 | ) | (455 | ) | (784 | ) | — | (1,686 | ) | |||||||||||
Net unrealized gain | 1,249 | 716 | 620 | 11 | 2,596 | |||||||||||||||
March 31, 2018, at Fair Value | $ | 169,620 | $ | 12,970 | $ | 41,977 | $ | 75 | $ | 224,642 | ||||||||||
(1) | Repayments for CLO equity reflect the amount of cash distributions from CLO investments received during the three months ended March 31, 2018. |
(2) | Includes amortization/accretion of discount/premium on the Loan Portfolio and income accrued on the CLOs using the effective interest method during the three months ended March 31, 2018. |
Three Months Ended March 31, 2018 | ||||||||
Loan Portfolio | CLO Equity | Common Equity/Warrants | Total Portfolio | |||||
Portfolio companies - December 31, 2017 | 129 | 25 | 1 | 155 | ||||
Purchases | 13 | — | — | 13 | ||||
Complete exit | (21) | (1) | — | (22) | ||||
Portfolio companies - March 31, 2018 | 121 | 24 | 1 | 146 | ||||
As of December 31, 2017, our portfolio was comprised of 74.6% first lien loans, 6.3% second lien loans and 19.1% CLO equity, measured at fair value. The Loan Portfolio consisted of 129 portfolio companies in 37 industries, and the CLO Portfolio included 25 CLOs managed by 18 different collateral managers with vintages ranging from 2012 to 2017. Our Loan Portfolio consisted of all floating rate investments with 97.1% having LIBOR floors ranging between 0.75% and 1.25%. As of December 31, 2017, the weighted average LIBOR floor in our Loan Portfolio was 0.978% and one-and three-month LIBOR was 1.56% and 1.69%, respectively. The following table depicts a summary of the portfolio as of December 31, 2017:
34
($ in thousands) | Cost | Fair Value | Cumulative Net Unrealized Gain (Loss) | Weighted Average Yield at Cost (1) | ||||||||||
Investment Portfolio: | ||||||||||||||
First lien floating rate loans | $ | 173,374 | $ | 170,947 | $ | (2,427 | ) | 5.84 | % | |||||
Second lien floating rate loans | 15,981 | 14,401 | (1,580 | ) | 8.65 | % | ||||||||
Total Loan Portfolio | 189,355 | 185,348 | (4,007 | ) | 6.08 | % | ||||||||
CLO Portfolio | 51,873 | 43,828 | (8,045 | ) | 10.59 | % | ||||||||
Common equity | — | 64 | 64 | — | % | |||||||||
Warrants | $ | — | $ | — | $ | — | — | % | ||||||
Total Investment Portfolio | $ | 241,228 | $ | 229,240 | $ | (11,988 | ) | 7.05 | % | |||||
(1) | Weighted average yield at cost is computed as (a) the annual stated interest rate or yield earned on accruing debt and other income producing securities, divided by (b) the total investments in such asset type at amortized cost. The weighted average yield of our portfolio does not represent the total return to our stockholders. |
The weighted average yield at cost during the three months ended March 31, 2017 on the Loan Portfolio, the CLO Portfolio and the Investment Portfolio (including common equity) was 5.36%, 14.14% and 7.17%, respectively.
The Investment Portfolio was actively managed, with a turnover ratio of 25.86% for the three months ended March 31, 2017. The following tables depict the portfolio activity for the three months ended March 31, 2017:
Three Months Ended March 31, 2017 | |||||||||||||||||||
($ in thousands) | First Lien | Second Lien | CLO Equity | Equity | Total | ||||||||||||||
December 31, 2016, at Fair Value | $ | 188,098 | $ | 15,429 | $ | 41,329 | $ | 16 | $ | 244,872 | |||||||||
Purchases | 60,291 | 1,941 | 1,540 | — | 63,772 | ||||||||||||||
Sales | (33,726 | ) | (2,509 | ) | — | (9 | ) | (36,244 | ) | ||||||||||
Repayments (1) | (23,570 | ) | (464 | ) | (2,646 | ) | — | (26,680 | ) | ||||||||||
Amortization/accretion and CLO income accrual (2) | 72 | 8 | 1,835 | — | 1,915 | ||||||||||||||
Net realized gain | 366 | 87 | — | 9 | 462 | ||||||||||||||
Net unrealized loss | (634 | ) | (93 | ) | (27 | ) | (16 | ) | (770 | ) | |||||||||
March 31, 2017, at Fair Value | $ | 190,897 | $ | 14,399 | $ | 42,031 | $ | — | $ | 247,327 | |||||||||
(1) | Repayments for CLO equity reflect the amount of cash distributions from CLO investments received during the three months ended March 31, 2017. |
(2) | Includes amortization/accretion of discount/premium on the Loan Portfolio and income accrued on the CLOs using the effective interest method during the three months ended March 31, 2017. |
Three Months Ended March 31, 2017 | ||||||
Loan Portfolio | CLO Equity | Total Portfolio | ||||
Portfolio companies - December 31, 2016 | 149 | 21 | 170 | |||
Purchases | 44 | 1 | 45 | |||
Complete exit | (36) | — | (36) | |||
Portfolio companies - March 31, 2017 | 157 | 22 | 179 | |||
35
As of March 31, 2018, approximately 64.6% of our Loan Portfolio, at fair value, was comprised of loans with a facility rating by S&P of at least “B” or higher. The following chart shows the S&P facility credit rating of our rated Loan Portfolio at fair value as of March 31, 2018:
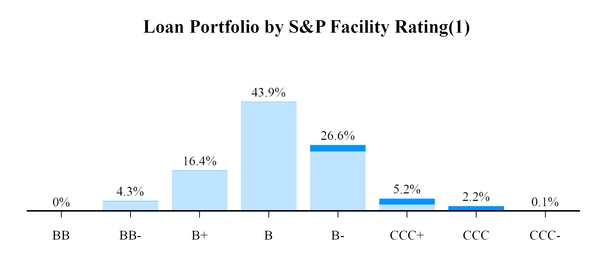
First Lien | Second Lien | ||
(1) As a percentage of the total Loan Portfolio, excluding non-rated loans which represent 1.3% of the total Loan Portfolio.
Results of Operations
Operating results for the three months ended March 31, 2018 and 2017 were as follows:
Three Months Ended March 31, | |||||||
($ in thousands) | 2018 | 2017 | |||||
Investment income: | |||||||
Senior floating rate loans | $ | 2,860 | $ | 2,777 | |||
CLO equity | 1,218 | 1,835 | |||||
Total investment income | 4,078 | 4,612 | |||||
Expenses: | |||||||
Interest and other debt related costs | 899 | 733 | |||||
Management fee | 469 | 531 | |||||
Other operating expenses | 495 | 713 | |||||
Total expenses | 1,863 | 1,977 | |||||
Expense reimbursement | — | (437 | ) | ||||
Net expenses | 1,863 | 1,540 | |||||
Net investment income before taxes | 2,215 | 3,072 | |||||
Income tax provision, including excise tax | — | (19 | ) | ||||
Net investment income | 2,215 | 3,053 | |||||
Net realized and unrealized gain (loss) on investments: | |||||||
Net realized gain (loss) on investments | (1,686 | ) | 462 | ||||
Net unrealized gain (loss) on investments | 2,596 | (763 | ) | ||||
Net gain (loss) on investments | 910 | (301 | ) | ||||
Net increase in net assets resulting from operations (“Net Earnings”) | $ | 3,125 | $ | 2,752 | |||
36
Investment Income
Investment income decreased $0.5 million, or 12%, to $4.1 million for the three months ended March 31, 2018 compared to the comparable period in 2017. The decrease was a result of a smaller Investment Portfolio, on average, during the first quarter of 2018 compared to the comparable period in 2017. The weighted average yield at cost on our Loan Portfolio, CLO Portfolio and Investment Portfolio was 6.23%, 10.64% and 7.15%, respectively, during the three months ended March 31, 2018, as compared to 5.36%, 14.14% and 7.17%, respectively, during the three months ended March 31, 2017.
Net Expenses
For the three months ended March 31, 2018, net expenses increased $0.3 million, or 21.0%, to $1.9 million as compared to the comparable period in 2017. The increase in net expenses was primarily driven by the expiration, by its terms, of the Voluntary Expense Cap and an increase in interest expense mainly due to increasing LIBOR rates.
The following table outlines the costs associated with our Credit Facility (as defined below) during the three months ended March 31, 2018 and 2017:
For the Three Months Ended March 31, | |||||||
($ in thousands) | 2018 | 2017 | |||||
Interest expense | $ | 801 | $ | 643 | |||
Commitment fees | 75 | 67 | |||||
Amortization of deferred financing costs | 23 | 23 | |||||
Total interest and other debt related costs | $ | 899 | $ | 733 | |||
Weighted average debt outstanding | $ | 95,434 | $ | 99,244 | |||
Weighted average cost of funds (1) | 3.77 | % | 2.90 | % | |||
Weighted average stated interest rate | 3.34 | % | 2.59 | % | |||
(1) Includes interest, unfunded commitment fees and amortization of debt financing costs.
Net Realized Gain (Loss) on Investments
Sales and repayments of investments during the three months ended March 31, 2018 totaled $31.6 million resulting in a net realized loss on investments of $1.7 million. Sales and repayments of investments during the three months ended March 31, 2017 totaled $62.9 million resulting in a net realized gain on investments of $0.5 million.
Net Unrealized Gain (Loss) on Investments
During the three months ended March 31, 2018, we recognized a net unrealized gain on investments of $2.6 million composed of the reversal of net unrealized depreciation related to a net realized loss of $2.0 million and a net unrealized appreciation on investments of $0.6 million. During the three months ended March 31, 2017, we recognized a net unrealized loss on investments of $0.8 million primarily composed of the reversal of net unrealized appreciation related to net realized gains of $0.5 million and net unrealized depreciation on investments of $0.3 million.
Income Taxes
We have elected to be treated as a RIC for U.S. federal income tax purposes. In order to qualify as a RIC, among other things, we are required to timely distribute to our shareholders at least 90% of our investment company taxable income, as defined by the Code, including net short term gains in excess of net long term losses. So long as we qualify as a RIC, we are not subject to the entity level taxes on earnings timely distributed to our stockholders. In order to maintain our RIC status, we have made and intend to continue to make the requisite distributions to our stockholders which will generally relieve us from U.S. federal corporate-level income taxes.
At our discretion, we may delay distributions of a portion of our current year taxable income to the subsequent year and pay 4% excise taxes on such deferred distributions, as required, as calculated under the Code. If we anticipate paying
37
excise taxes, we accrue excise taxes on a quarterly basis based on our estimates. For the three months ended March 31, 2018 and 2017, we recorded an expense of $0 and $19, respectively, for U.S. federal excise tax.
Financial Condition, Liquidity and Capital Resources
Liquidity and capital resources arise primarily from our cash flows from operations, borrowings from the Credit Facility (as defined below) and any follow-on equity offerings of common stock and other supplementary financing mechanisms.
In order to qualify as a RIC, we must annually distribute in a timely manner to our stockholders at least 90% of our taxable ordinary income. In addition, we must also distribute in a timely manner to our stockholders all of our taxable ordinary and capital income in order to not be subject to income taxes. Accordingly, our ability to retain earnings is limited.
We regularly engage in discussions with respect to exploring and evaluating a broad range of transactions to enhance
long-term shareholder value. Consummation of any such transaction would be subject to completion of due diligence, finalization of key business and financial terms and negotiation of final definitive documentation as well as a number of other factors and conditions including, without limitation, the approval of our Board and required regulatory or third party consents and, in certain cases, the approval of our stockholders.
Equity Capital
As a BDC, we are generally not able to issue or sell our common stock at a price below our net asset value per share, exclusive of any underwriting discount, except (i) with the prior approval of a majority of our stockholders, (ii) in connection with a rights offering to our existing stockholders or (iii) under such other circumstances as the SEC may permit. As of March 31, 2018, our net asset value was $13.11 per share and our closing market price was $11.15 per share.
Debt Capital
Our wholly owned special purpose financing vehicle, ACSF Funding I, LLC, a Delaware limited liability company, (“ACSF Funding”) is party to a secured revolving credit facility with Bank of America, N.A. (as amended and restated, the “Credit Facility”). Under the Credit Facility, ACSF Funding can borrow up to $135 million with a maturity date of December 18, 2018. The Credit Facility generally bears interest at the London Interbank Offered Rate (“LIBOR”) plus 1.80% and also has a commitment fee equal to 0.75% on the unused amount of the commitments to the extent the outstanding amount of loans is less than 90% of the aggregate commitments. The Credit Facility is secured by ACSF Funding’s assets pursuant to a security agreement and contains customary financial and negative covenants and events of default. Advance rates vary on the type of collateral owned by ACSF Funding and can range up to 80%. See "Recent Developments," as well as Note 11 to our consolidated financial statements for the three months ended March 31, 2018 for a subsequent event regarding a downsize of the Credit Facility.
As of March 31, 2018, we had $93.8 million in borrowings outstanding on our Credit Facility. The fair value of the assets owned by ACSF Funding as of March 31, 2018 was $182.6 million and the borrowing base was $137.6 million. On a consolidated basis, as of March 31, 2018, ACSF’s ratio of our principal debt outstanding to stockholders’ equity was 0.72 to 1. As of March 31, 2018, we had approximately $41.2 million of available capacity on our Credit Facility.
As a BDC, we are currently permitted to issue “senior securities,” as defined in the 1940 Act, in any amount as long as immediately after such issuance our asset coverage is at least 200%, or equal to or greater than our asset coverage prior to such issuance, after taking into account the payment of debt with proceeds from such issuance. Asset coverage is defined in the 1940 Act as the ratio of the value of the total assets, less all liabilities and indebtedness not represented by senior securities, to the aggregate amount of senior securities representing indebtedness. However, if our asset coverage is below 200%, we may also borrow amounts up to 5% of our total assets for temporary purposes even if that would cause our asset coverage ratio to further decline. On March 23, 2018 the SBCAA was signed into law. The SBCAA, among other things, modifies the applicable provisions of the Investment Company Act to reduce the required asset coverage ratio applicable to BDCs from 200% to 150% subject to certain approval, time and disclosure requirements (including either stockholder approval or approval of a majority of the directors who are not interested persons of the BDC and who have no financial interest in the proposal). As of March 31, 2018 and December 31, 2017, our asset coverage was 240% and 250%, respectively.
38
Off-Balance Sheet Arrangements
Commitments to extend credit include loans we are obligated to advance, such as delayed draws or revolving credit arrangements. Commitments generally have fixed expiration dates or other termination clauses. We do not report the unused portion of these commitments on our Consolidated Statements of Assets and Liabilities. As of March 31, 2018 and December 31, 2017, we had $0.8 million and $0.6 million, respectively, of outstanding unused loan commitments.
Distributions to Stockholders
The timing and amount of our distributions, if any, will be determined by our Board. When determining distributions to stockholders, our Board considers estimated taxable income, GAAP income and economic performance. Actual taxable income may differ from GAAP income due to temporary and permanent differences in income and expense recognition and changes in unrealized appreciation and depreciation on investments. All distributions to our stockholders are declared out of assets legally available for distribution. We expect that our distributions to stockholders will generally be from accumulated net investment income and from net realized capital gains, if any, as applicable. To the extent our taxable earnings fall below the total amount of our distributions for any given fiscal year, a portion of those distributions may be deemed to be a tax return of capital to our stockholders. Thus, the source of a distribution to our stockholders may be the original capital invested by the stockholder rather than our taxable ordinary income or capital gains. Stockholders should read any written disclosure accompanying a distribution payment carefully and should not assume that the source of any distribution is our taxable ordinary income or capital gain. The specific tax characteristics are reported to stockholders on Form 1099 after the end of each calendar year.
We have elected to be taxed as a RIC under Subchapter M of the Code. To maintain our RIC status, we must distribute at least 90% of our ordinary taxable income and the excess of net short term gains over net long term losses, if any, out of the assets legally available for distribution. During the three months ended March 31, 2018 and 2017, 100% of our distributions were made from net investment income. A written statement identifying the nature of these distributions for tax reporting purposes for the year was posted on our website. We may not be able to achieve operating results that will allow us to make distributions at a specific level or to increase the amounts of these distributions from time to time. In addition, we may be limited in our ability to make distributions due to the asset coverage requirements applicable to us as a BDC under the 1940 Act. If we do not distribute a certain percentage of our income annually, we will suffer adverse tax consequences, including possible loss of favorable RIC tax treatment. We cannot assure stockholders that they will receive any distributions.
The table below details the distributions to stockholders declared on our shares of common stock during the three months ended March 31, 2018 and March 31, 2017 ($ in thousands except for per share data):
($ in thousands, except per share data) | ||||||||||
Monthly Declaration Date | Ex-Dividend Date | Record Date | Payment Date | Per Share Amount | Total Amount | |||||
January 18, 2018 | February 20, 2018 | February 22, 2018 | March 5, 2018 | $ | 0.097 | $ | 970 | |||
January 18, 2018 | March 16, 2018 | March 20, 2018 | April 4, 2018 | 0.097 | $ | 970 | ||||
January 18, 2018 | April 17, 2018 | April 19, 2018 | May 2, 2018 | 0.097 | $ | 970 | ||||
Total declared during the three months ended March 31, 2018 | $ | 0.291 | $ | 2,910 | ||||||
February 3, 2017 | February 15, 2017 | February 17, 2017 | March 2, 2017 | $ | 0.097 | $ | 970 | |||
February 3, 2017 | March 21, 2017 | March 23, 2017 | April 4, 2017 | 0.097 | 970 | |||||
February 3, 2017 | April 18, 2017 | April 20, 2017 | May 2, 2017 | 0.097 | 970 | |||||
Total declared during the three months ended March 31, 2017 | $ | 0.291 | $ | 2,910 | ||||||
We maintain an “opt out” dividend reinvestment and stock purchase plan for our common stockholders. As a result, if we declare a distribution, then stockholders' cash distributions will be automatically reinvested in additional shares of our common stock, unless they, or their nominees on their behalf, specifically “opt out” of the dividend reinvestment and stock purchase plan so as to receive cash distributions. Stockholders that opt out of our dividend reinvestment and stock purchase plan may experience dilution over time.
39
Recent Developments
In May 2018, ACSF Funding exercised its option under its Credit Facility to reduce its total commitment thereunder by $20.0 million, resulting in aggregate commitments of $115.0 million under the Credit Facility.
Plan of Complete Liquidation and Dissolution
On May 4, 2018, our board of directors approved a Plan of Complete Liquidation and Dissolution (the “Plan”) of ACSF that includes the sale of all or substantially all of our assets and distribution of the net proceeds to our stockholders, after which ACSF will be dissolved. The Plan is subject to the approval of the stockholders, which our board of directors plans to seek at a special meeting called for the purpose of approving the Plan, as detailed in the preliminary proxy statement filed with the SEC on the date hereof. If ACSF’s stockholders approve the Plan, we intend to, among other things, convert all or substantially all of our assets into cash, pay all of our other known liabilities and make provisions for contingent liabilities, and make one or more distributions to our stockholders of cash available for distribution.
Critical Accounting Policies
See “Note 2 - Significant Accounting Policies” and “Note 6 - Investments” to our consolidated financial statements for the three months ended March 31, 2018, which describes our critical accounting policies. The recently issued accounting pronouncements not yet required to be adopted by us are as follows.
New Accounting Pronouncements
In June 2016, the FASB issued ASU No. 2016-13, Financial Instruments-Credit Losses (Topic 326): Measurement of Credit Losses on Financial Instruments (“ASU 2016-13”), which amends the financial instruments impairment guidance so that an entity is required to measure expected credit losses for financial assets based on historical experience, current conditions, and reasonable and supportable forecasts. As such, an entity will use forward-looking information to estimate credit losses. ASU 2016-13 also amends the guidance in FASB ASC Subtopic No. 325-40, Investments-Other, Beneficial Interests in Securitized Financial Assets related to the subsequent measurement of accretable yield recognized as interest income over the life of a beneficial interest in securitized financial assets under the effective yield method. ASU 2016-13 is effective for public business entities that meet the U.S. GAAP definition of an SEC filer, for fiscal years beginning after December 15, 2019, including interim periods within those fiscal years. Early adoption is permitted as of the fiscal years beginning after December 15, 2018, including interim periods within those fiscal years. We are currently evaluating the impact of ASU 2016-13 on the recognition of interest income on our investments in CLO equity.
Item 3. Quantitative and Qualitative Disclosures about Market Risk
We are subject to financial market risks, including changes in interest rates. As of March 31, 2018, all of our Loan Portfolio bore interest at floating rates, and we expect that our Investment Portfolio will, in the future, primarily include floating rate debt investments. The interest rates on our Loan Portfolio are usually based on a floating LIBOR and typically contain interest rate reset provisions that adjust applicable interest rates to current rates on a periodic basis. As of March 31, 2018, the Loan Portfolio consisted of all floating rate investments with 94.7% having LIBOR floors ranging between 0.75% and 1.25%. As of March 31, 2018, the benchmark LIBOR used to set borrowing rates on our Loan Portfolio was generally above the interest rate floors and therefore our Loan Portfolio will generally fluctuate with changes in short term interest rates, subject to the interest rate floors in place. The Credit Facility has a floating interest rate provision with no LIBOR floor and therefore our cost of funds will fluctuate with changes in short-term interest rates.
Assuming no changes to our consolidated statement of assets and liabilities as of March 31, 2018, (including no change to borrowing spreads), the following table shows the approximate annualized impact to the components of our results of operations from hypothetical base rate changes in interest rates to our Loan Portfolio and the Credit Facility.
40
($ in thousands except per share data) Basis Point Increase (Decrease) | Interest income | Interest expense | Net Increase (Decrease) | Net Increase (Decrease) per share | ||||||||||||
300 | $ | 5,579 | $ | 2,754 | $ | 2,825 | $ | 0.28 | ||||||||
200 | $ | 3,719 | $ | 1,836 | $ | 1,883 | $ | 0.19 | ||||||||
100 | $ | 1,860 | $ | 918 | $ | 942 | $ | 0.09 | ||||||||
(100) | $ | (1,860 | ) | $ | (918 | ) | $ | (942 | ) | $ | (0.09 | ) | ||||
(200) | $ | (2,510 | ) | $ | (1,729 | ) | $ | (781 | ) | $ | (0.08 | ) | ||||
(300) | $ | (2,537 | ) | $ | (1,729 | ) | $ | (808 | ) | $ | (0.08 | ) | ||||
Based on our consolidated statement of assets and liabilities as of December 31, 2017, (including no change to borrowing spreads), the following table shows the approximate annualized impact to the components of our results of operations from hypothetical base rate changes in interest rates to our Loan Portfolio and the Credit Facility.
($ in thousands except per share data) Basis Point Increase (Decrease) | Interest income | Interest expense | Net Increase (Decrease) | Net Increase (Decrease) per share | ||||||||||||
300 | $ | 5,712 | $ | 2,625 | $ | 3,087 | $ | 0.31 | ||||||||
200 | $ | 3,808 | $ | 1,750 | $ | 2,058 | $ | 0.21 | ||||||||
100 | $ | 1,904 | $ | 875 | $ | 1,029 | $ | 0.10 | ||||||||
(100) | $ | (1,340 | ) | $ | (875 | ) | $ | (465 | ) | $ | (0.05 | ) | ||||
(200) | $ | (1,363 | ) | $ | (1,369 | ) | $ | 6 | $ | — | ||||||
(300) | $ | (1,363 | ) | $ | (1,369 | ) | $ | 6 | $ | — | ||||||
Although management believes that this measure is indicative of our sensitivity to interest rates, it does not reflect any potential impact to the fair value of our investments as a result of changes to interest rates, nor does it adjust for potential changes in the credit market, credit quality, size and composition of assets in our consolidated statements of assets and liabilities and other business developments that could affect the net increase/(decrease) in net assets resulting from operations or net investment income. Accordingly, no assurances can be given that actual results would not differ materially from those shown above.
The above sensitivity analysis does not include our CLO Portfolio. Our CLO Portfolio comprises levered structures that are collateralized primarily with first lien floating rate loans that may have LIBOR floors and are levered primarily with floating rate debt that does not have a LIBOR floor. The residual cash flows available to the equity holders of the CLOs will decline as interest rates increase until interest rates surpass the LIBOR floors on the floating rate loans. However, the revenue recognized on our CLO Portfolio is calculated using the effective interest method which incorporates a forward LIBOR curve in the projected cash flows. Any change to interest rates that is not in-line with the forward LIBOR curve used in the projections, in either the timing or magnitude of the change, will cause actual distributions to differ from the current projections and will impact the related revenue recognized from these investments.
41
The below graph illustrates the forward LIBOR curve utilized in the projected cash flows from our CLO Portfolio as of March 31, 2018(1).
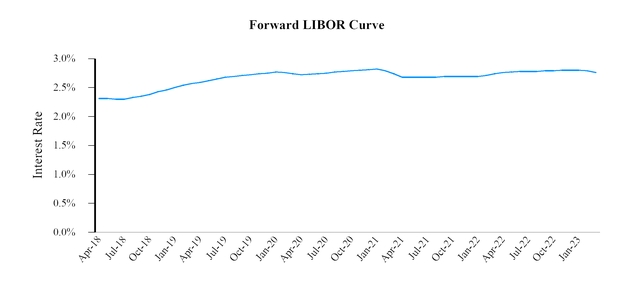
(1) | Forward LIBOR curve used to develop the cash flows incorporated in the March 31, 2018 valuations and the cash flows used to calculate the effective yield at cost as of March 31, 2018. Source: Bloomberg as of April 16, 2018. |
42
Item 4. Controls and Procedures
Evaluation of Disclosure Controls and Procedures
We maintain disclosure controls and procedures (as that term is defined in Rules 13a‑15(e) and 15d‑15(e) under the Exchange Act) that are designed to ensure that information required to be disclosed in our reports under the Exchange Act is recorded, processed, summarized and reported within the time periods specified in the SEC’s rules and forms, and that such information is accumulated and communicated to our management, including our principal executive officer and principal financial officer, as appropriate, to allow timely decisions regarding required disclosures. Any controls and procedures, no matter how well designed and operated, can provide only reasonable assurance of achieving the desired control objectives. Our management, with the participation of our principal executive officer and principal financial officer, has evaluated the effectiveness of the design and operation of our disclosure controls and procedures as of March 31, 2018. Based upon that evaluation and subject to the foregoing, our principal executive officer and principal financial officer concluded that, as of March 31, 2018, the design and operation of our disclosure controls and procedures were effective to accomplish their objectives at the reasonable assurance level.
Changes in Internal Control over Financial Reporting
There have been no changes in our internal control over financial reporting (as defined in Rule 13a‑15(f) and 15d‑15(f) under the Exchange Act) during the quarter ended March 31, 2018 that have materially affected, or that are reasonably likely to materially affect, our internal control over financial reporting.
43
PART II. OTHER INFORMATION
Item 1. Legal Proceedings
From time to time, we may be a party to certain ordinary routine litigation incidental to our business, including the enforcement of our rights under contracts with our portfolio companies. We are not currently subject to any material litigation nor, to our knowledge, is any material litigation threatened against us.
Item 1A. Risk Factors
In addition to the other information set forth in this report, you should carefully consider the risk factor discussed below and the risk factors described in Part I, “Item 1A. Risk Factors” in our Annual Report on Form 10-K for the fiscal year ended December 31, 2017, which could materially affect our business, financial condition and/or operating results. The risks described in our Annual Report on Form 10-K and discussed below are not the only risks facing us. Additional risks and uncertainties not currently known to us or that we currently deem to be immaterial also may materially and adversely affect our business, financial condition and/or operating results.
The Small Business Credit Availability Act may allow us to incur additional leverage, which may increase the risk of investing with us.
On March 23, 2018, the SBCAA was signed into law. The SBCAA, among other things, modifies the applicable provisions of the Investment Company Act to reduce the required asset coverage ratio applicable to BDCs from 200% to 150% subject to certain approval, time and disclosure requirements (including either stockholder approval or approval of a majority of the directors who are not interested persons of the BDC and who have no financial interest in the proposal). If we were to seek and obtain the requisite approval to reduce the required asset coverage ratio applicable to us, we would be able to incur additional leverage in the future, and the risks associated with an investment in us may increase.
Item 2. Unregistered Sales of Equity Securities and Use of Proceeds
None.
Item 3. Defaults Upon Senior Securities
None.
Item 4. Mine Safety Disclosures
Not applicable.
Item 5. Other Information
None.
Item 6. Exhibits, Financial Statement Schedules
The following exhibits are filed as part of this report or hereby incorporated by reference to exhibits previously filed with the SEC:
44
Exhibit Number | Description | |
American Capital Senior Floating, Ltd. Articles of Amendment and Restatement, incorporated herein by reference to Exhibit 3.1 of Form 10-Q for the quarter ended March 31, 2014 (File No. 814-01025), filed May 15, 2014. | ||
American Capital Senior Floating, Ltd. Amended and Restated Bylaws, incorporated herein by reference to Exhibit 3.2 of Form 10-Q for the quarter ended March 31, 2014 (File No. 814-01025), filed May 15, 2014. | ||
Certification of CEO Pursuant to Section 302 of the Sarbanes-Oxley Act of 2002. | ||
Certification of CFO Pursuant to Section 302 of the Sarbanes-Oxley Act of 2002. | ||
Certification of CEO and CFO Pursuant to 18 U.S.C. Section 1350, as adopted pursuant to Section 906 of the Sarbanes-Oxley Act of 2002. | ||
* Previously filed | ||
45
SIGNATURES
Pursuant to the requirements of the Securities Exchange Act of 1934, the registrant has duly caused this report to be signed on its behalf by the undersigned thereunto duly authorized.
AMERICAN CAPITAL SENIOR FLOATING, LTD. | ||||
Date: | May 10, 2018 | By: | /s/ KEVIN BRADDISH | |
Kevin Braddish President and Chief Executive Officer (Principal Executive Officer) | ||||
Date: | May 10, 2018 | By: | /s/ PENNI F. ROLL | |
Penni F. Roll Chief Financial Officer (Principal Financial Officer) | ||||
Date: | May 10, 2018 | By: | /s/ SCOTT C. LEM | |
Scott C. Lem Chief Accounting Officer (Principal Accounting Officer) | ||||
46