Exhibit 99.1
Table of Contents
|
|
|
|
|
|
|
|
|
|
|
|
|
|
|
|
|
|
|
|
|
|
|
|
|
|
|
|
|
|
|
|
|
|
|
|
|
|
|
|
|
|
|
|
|
|
|
|
|
|
|
|
|
|
|
|
|
|
|
Section I: Section II: Section III: Section IV: Section V: Appendix:
|
|
Earnings Release Consolidated Financials Selected Additional Information Same Home Information Earnings Guidance Definitions and Reconciliations
|
|
2 8 13 18 29 31
|
|
|
|
|
||||
|
|
|
||||
|
|
|
||||
|
|
|
||||
|
|
|
||||
|
|
|
||||
|
|
|


|
|
|
1 |

 I. Earnings Release
|
|
|
2 |
Earnings Release
|
|
COLONY STARWOOD HOMES ANNOUNCES
FIRST QUARTER 2017 FINANCIAL AND OPERATING RESULTS
Scottsdale, Arizona (May 8, 2017) – Colony Starwood Homes (NYSE: SFR) (the “Company”), a leading single-family rental real estate investment trust (“REIT”), today announced operating and financial results for the three months ended March 31, 2017. Capitalized terms used herein have the meanings set forth in the Appendix to the Supplemental Report of financial and operating information posted on the Company’s website.
First Quarter 2017 Highlights
|
• |
Total revenues increased to $151.0 million in Q1 2017, driven by Same Home revenue growth of 6.9% |
|
• |
Occupancy was 96.1% for the Same Home cohort of 28,732 homes |
|
• |
Net loss of $11.3 million or ($0.11) per share; Core FFO of $52.8 million or $0.48 per share |
|
• |
Same Home NOI increased 6.5% over Q1 2016; Same Home Core NOI margin was 65.4% |
|
• |
Completed a $345.0 million convertible note offering with five-year term at a 3.5% coupon rate |
|
• |
Completed a $750.0 million follow-on equity offering ($350.0 million primary and $400.0 million secondary) |
|
• |
Subsequently to March 31, 2017 paid down $300.0 million of principal on SWAY 2014-1 resulting in fixed rate debt of over 90% |
“Our Same Home revenue growth of 6.9% reflects the continued robust demand and muted supply within Colony Starwood Homes’ high growth markets in the first quarter of 2017. Quarter ending occupancy of 96.1% positions us well as we enter the 2017 peak leasing season while Same Home Core NOI Margin of 65.4% indicates continued gains in operating efficiencies,” stated Fred Tuomi, the Company’s CEO. “We were very pleased with the execution of the Company’s first primary equity offering of $350.0 million, which demonstrated strong investor demand, further strengthened our balance sheet and provided substantial growth capital. Looking forward, we see 2017 as another year of strong fundamentals and superior results.”
First Quarter 2017 Operating Results
Total revenues were $151.0 million for the three months ended March 31, 2017, and net loss attributable to common shareholders was $11.3 million, or ($0.11) per share, driven by depreciation and amortization expense.
NAREIT FFO was $33.9 million for the three months ended March 31, 2017, or $0.31 per share, and Core FFO was $52.8 million, or $0.48 per share. NAREIT FFO and Core FFO are common supplemental measures of operating performance for a REIT, and the Company believes both are useful to investors as a complement to GAAP measures because they facilitate an understanding of the operating performance of the Company’s properties.
Please see the Appendix for certain definitions, explanations and reconciliations of non-GAAP financial measures. All information is as of March 31, 2017 unless otherwise indicated.
|
|
|
3 |
Earnings Release (Continued)
|
|
For the Company’s Same Home portfolio of 28,732 homes, revenue, operating expenses and NOI were $137.4 million, $50.7 million and $86.7 million, respectively, for the three months ended March 31, 2017. Year-over-year Same Home revenue and expense growth were affected by the implementation of a third-party utility billing service provider during the third quarter 2016, whereby water, sewer and trash services are now held in the Company’s name during resident occupancy and subsequently billed-back to the resident; this had the effect of increasing both revenue growth and expense growth. Core Rental Revenue and Core Property Operating Expense measures reflect the net effect of these utility reimbursements, as well as other chargebacks. Core Revenue growth for the quarter was 5.6% with Core Expense growth of 4.0%. Same Home Core NOI margin for the three months ended March 31, 2017 and March 31, 2016 was 65.4% and 64.9%, respectively. The table below summarizes Same Home operating results.
|
Same Home |
Q1 Results |
|
Homes as of March 31, 2017 |
28,732 |
|
Occupancy as of March 31, 2017 |
96.1% |
|
Revenue/Core Revenue Growth (March 31, 2017 as compared to March 31, 2016) |
6.9%/5.6% |
|
Operating Expense/Core Expense Growth (March 31, 2017 as compared to March 31, 2016) |
7.6%/4.0% |
|
NOI Growth (March 31, 2017 as compared to March 31, 2016) |
6.5% |
|
NOI/Core NOI Margin |
63.1%/65.4% |
Investments
During the three months ended March 31, 2017, the Company acquired 397 homes for an aggregate total investment of approximately $92.4 million, or approximately $233,000 per home, including estimated investment costs for renovation. The Company sold 136 single-family rental homes for gross sales proceeds of $27.8 million, resulting in a gain of approximately $0.7 million.
Balance Sheet and Capital Markets Activities
As of March 31, 2017, the Company had $3.8 billion of debt outstanding and approximately $250.0 million of undrawn commitments on its credit facilities.
In January, the Company sold $345.0 million of 3.50% convertible senior notes due 2022. The Company used the net proceeds from the new convertible offering to repurchase, in privately negotiated transactions, substantially all of its 4.50% convertible senior notes due in 2017. Remaining proceeds from the note issuance were used to repay amounts drawn on the Company’s credit facilities, to fund ongoing asset acquisitions and for general corporate purposes. During January, the Company also entered into a five-year $550.0 million swap contract, effectively fixing its floating securitization debt at an average rate of 3.59% over the term bringing the Company’s fixed rate debt to over 90% of total debt.
Please see the Appendix for certain definitions, explanations and reconciliations of non-GAAP financial measures. All information is as of March 31, 2017 unless otherwise indicated.
|
|
|
4 |
Earnings Release (Continued)
|
|
In March, the Company completed a follow on equity offering of approximately $750.0, consisting of approximately $350.0 million primary shares sold by the Company and approximately $400.0 million in secondary shares sold by original sponsors. In March the Company also entered into an $800.0 million forward swap contract effective from 2019 through 2022 to extend existing swap contracts expiring in 2019.
Subsequent to March 31, 2017, the Company finalized a $675.0 million revolving credit facility, replacing two secured facilities originated prior to the merger between Colony American Homes and Starwood Waypoint. The Company entered into an at-the-market (ATM) sales agreement under which it may sell up to $300.0 million of its common shares in amounts and times to be determined by the Company. The Company paid down the principal balance of its SWAY 2014-1 securitization by $300 million from cash on hand.
On May 2, 2017, the Board declared a dividend of $0.22 per common share for the second quarter of 2017, which will be paid on July 14, 2017 to shareholders of record on June 30, 2017.
Full Year 2017 Financial Guidance
The Company is reaffirming it’s full-year 2017 guidance and the assumptions outlined below:
|
2017 Guidance |
|
|
Core FFO/Share |
$1.85 - $1.95 |
|
Same Home Revenue Growth (1) |
4 – 5% |
|
Same Home Expense Growth (1) |
2 – 3% |
|
Same Home Core NOI Margin |
63 – 65% |
|
Same Home Occupancy |
95 – 96% |
|
Same Home Turnover |
34 – 36% |
The Company does not provide forward-looking guidance for certain financial measures on a GAAP basis because it is unable to reasonably predict certain items contained in the GAAP measures, including one-time and infrequent items that are not indicative of the Company’s ongoing operations. Such items include, but are not limited to, discontinued operations, share-based compensation and other items not reflective of the Company's ongoing operations.
This outlook is based on a number of assumptions, many of which are outside the Company’s control and all of which are subject to change. This outlook reflects the Company’s expectations on (1) existing investments and (2) yield on incremental investments inclusive of the Company’s existing pipeline. All guidance is based on current expectations of future economic conditions and the judgment of the Company’s management team. Please refer to the Forward Looking Statements disclosure.
Please see the Appendix for certain definitions, explanations and reconciliations of non-GAAP financial measures. All information is as of March 31, 2017 unless otherwise indicated.
|
|
(1) Growth rates presented exclude the impact of resident utility billing revenue and associated utility chargeback expenses as a result of the CSH utility chargeback transition beginning in Q3 2016, whereby water, sewer and trash services are held in the Company’s name during resident occupancy and subsequently billed back to the resident.
|
5 |
Earnings Release (Continued)
|
|
First Quarter 2017 Conference Call
A conference call is scheduled on Tuesday, May 9, 2017, at 11:00 a.m. Eastern Time to discuss the Company’s financial results for the three months ended March 31, 2017. The domestic dial-in number is 1-877-407-9039 (for U.S. and Canada) and the international dial-in number is 1-201-689-8470 (passcode not required). An audio webcast may be accessed at www.colonystarwood.com in the investor relations section. A replay of the call will be available through June 9, 2017 and can be accessed by calling 1-844-512-2921 (U.S. and Canada) or 1-412-317-6671 (international), replay pin number 13658913, or by using the link at www.colonystarwood.com, in the investor relations section.
About Colony Starwood Homes
Colony Starwood Homes (NYSE: SFR) is one of the largest publicly traded owners and operators of single-family rental homes in the United States. Colony Starwood Homes acquires, renovates, leases, maintains and manages single-family homes in markets that exhibit favorable demographics and long-term economic trends, as well as strengthening demand for rental properties. Colony Starwood Homes is building its business upon a foundation of respect for its residents and the communities in which it operates. Additional information can be found at www.colonystarwood.com.
Additional information
A copy of the First Quarter 2017 Supplemental Information Package (“Q1 2017 Supplement”) and this press release are available on the Company’s website at www.colonystarwood.com.
Notice Regarding Non-GAAP Financial Measures
This press release and the Q1 2017 Supplement contain and may refer to certain non-GAAP financial measures and terms that management believes are helpful in understanding our business, as further set forth in the definitions, explanations and reconciliations of each non-GAAP financial measure to its most comparable GAAP financial measures included in the Appendix. These measures and terms are in addition to, not a substitute for or superior to, measures of financial performance prepared in accordance with GAAP and should be read together with the most comparable GAAP measures.
Please see the Appendix for certain definitions, explanations and reconciliations of non-GAAP financial measures. All information is as of March 31, 2017 unless otherwise indicated.
|
|
|
6 |
Earnings Release (Continued)
|
|
Certain statements in this press release and the quarterly supplement/presentation are forward-looking statements within the meaning of the Private Securities Litigation Reform Act of 1995 and other federal securities laws and are based on certain assumptions and discuss future expectations, describe future plans and strategies and contain financial and operating projections or state other forward-looking information. The Company’s ability to predict results or the actual effect of future events, actions, plans or strategies is inherently uncertain. Although the Company believes that the expectations reflected in such forward-looking statements are based on reasonable assumptions, the Company’s actual results and performance could differ materially from those set forth in, or implied by, the forward-looking statements. Factors that could materially and adversely affect the Company’s business, financial condition, liquidity, results of operations and prospects, as well as the Company’s ability to make distributions to its shareholders, include, but are not limited to: the factors referenced in the Company’s Annual Report on Form 10-K; unanticipated increases in financing and other costs, including a rise in interest rates; the availability, terms and the Company’s ability to effectively deploy short-term and long-term capital; the possibility that unexpected liabilities may arise from the Company’s merger (the “Merger”) with Colony American Homes (“CAH”), including the outcome of any legal proceedings that have been or may be instituted against the Company, CAH or others in connection with the Merger and the associated transactions; changes in the Company’s business and growth strategies; the Company’s ability to hire and retain highly skilled managerial, investment, financial and operational personnel; volatility in the real estate industry, interest rates and spreads, the debt or equity markets, the economy generally or the rental home market specifically, whether the result of market events or otherwise; events or circumstances that undermine confidence in the financial markets or otherwise have a broad impact on financial markets, such as the sudden instability or collapse of large financial institutions or other significant corporations, terrorist attacks, natural or man-made disasters, or threatened or actual armed conflicts; declines in the value of single-family residential homes, and macroeconomic shifts in demand for, and competition in the supply of, rental homes; the availability of attractive investment opportunities in homes that satisfy the Company’s investment objective and business and growth strategies; the Company’s ability to convert the properties it acquires into rental homes generating attractive returns and to effectively control the timing and costs relating to the renovation and operation of the properties; the Company’s ability to complete its exit from the non-performing loan (“NPL”) (and related real estate owned) business in the anticipated time period on acceptable terms and to re-deploy net cash proceeds therefrom; the Company’s ability to lease or re-lease its rental homes to qualified residents on attractive terms or at all; the failure of residents to pay rent when due or otherwise perform their lease obligations; the Company’s ability to effectively manage its portfolio of rental homes; the concentration of credit risks to which the Company is exposed; the rates of default or decreased recovery rates on the Company’s target assets; the adequacy of the Company’s cash reserves and working capital; potential conflicts of interest with Starwood Capital Group, Colony Capital, LLC (“Colony Capital”), Colony NorthStar, Inc. (“Colony NorthStar”) and their affiliates and managed investment activities; the timing of cash flows, if any, from the Company’s investments; the Company’s expected leverage; financial and operating covenants contained in the Company’s credit facilities and securitizations that could restrict its business and investment activities; effects of derivative and hedging transactions; the Company’s ability to maintain effective internal controls as required by the Sarbanes-Oxley Act of 2002 and to comply with other public company regulatory requirements; the Company’s ability to maintain its exemption from registration as an investment company under the Investment Company Act of 1940, as amended; actions and initiatives of the U.S., state and municipal governments and changes to governments’ policies that impact the economy generally and, more specifically, the housing and rental markets; changes in governmental regulations, tax laws (including changes to laws governing the taxation of real estate investment trusts (“REITs”)) and rates, and similar matters; limitations imposed on the Company’s business and its ability to satisfy complex rules in order for the Company and, if applicable, certain of its subsidiaries to qualify as a REIT for U.S. federal income tax purposes and the ability of certain of the Company’s subsidiaries to qualify as taxable REIT subsidiaries for U.S. federal income tax purposes, and the Company’s ability and the ability of its subsidiaries to operate effectively within the limitations imposed by these rules; and estimates relating to the Company’s ability to make distributions to its shareholders in the future.
You should not place undue reliance on any forward-looking statement and should consider all of the uncertainties and risks described above, as well as those more fully discussed in the reports and other documents filed by the Company with the Securities and Exchange Commission from time to time. Except as required by law, the Company is under no duty to, and the Company does not intend to, update any of the forward-looking statements appearing herein, whether as a result of new information, future events or otherwise.
|
Contacts: |
|
|
|
|
|
Investor Relations |
Media Relations |
|
Phone: 480-800-3490 Email: IR@colonystarwood.com |
Jason Chudoba Phone: 646-277-1249 Email: Jason.chudoba@icrinc.com |
Please see the Appendix for certain definitions, explanations and reconciliations of non-GAAP financial measures. All information is as of March 31, 2017 unless otherwise indicated.
|
|
|
7 |
 II. Consolidated Financials
|
|
|
8 |
Balance Sheet (Unaudited)
|
|
Dollars in thousands
|
Assets |
|
|
Liabilities |
|
|
Investments in real estate properties: |
|
|
Accounts payable and accrued expenses |
$ 90,617 |
|
Land and land improvements |
$ 1,595,371 |
|
Resident prepaid rent and security deposits |
60,403 |
|
Buildings and building improvements |
4,469,092 |
|
Mortgage loans, net |
3,327,374 |
|
Furniture, fixtures and equipment |
140,333 |
|
Convertible senior notes, net |
516,493 |
|
Total investments in real estate properties |
6,204,796 |
|
Liabilities related to assets held for sale |
6,005 |
|
Accumulated depreciation |
(411,968) |
|
Other liabilities |
87 |
|
Investments in real estate properties, net |
5,792,828 |
|
Total liabilities |
4,000,979 |
|
Real estate held for sale, net |
23,759 |
|
Equity |
|
|
Cash and cash equivalents |
430,926 |
|
Common shares, at par |
1,127 |
|
Restricted cash |
159,131 |
|
Additional paid-in capital |
3,100,597 |
|
Investments in unconsolidated joint ventures |
34,114 |
|
Accumulated deficit |
(357,540) |
|
Asset-backed securitization certificates |
141,103 |
|
Accumulated other comprehensive income |
28,681 |
|
Assets held for sale |
50,478 |
|
Total shareholders' equity |
2,772,865 |
|
Goodwill |
260,230 |
|
Non-controlling interests |
190,029 |
|
Other assets, net |
71,304 |
|
Total equity |
2,962,894 |
|
Total assets |
$ 6,963,873 |
|
Total liabilities and equity |
$ 6,963,873 |
|
|
|
|
|
|
Please see the Appendix for certain definitions, explanations and reconciliations of non-GAAP financial measures. All information is as of March 31, 2017 unless otherwise indicated.
|
|
|
9 |
Statements of Operations (Unaudited)
|
|
|
|
|
Three Months Ended March 31, |
|
|
|||||
|
|
|
2017 |
|
|
2016 |
|
|
||
|
Revenues |
|
|
|
|
|
|
|
|
|
|
Rental income |
|
$ |
141,095 |
|
|
$ |
130,452 |
|
|
|
Other property income |
|
|
7,171 |
|
|
|
4,924 |
|
|
|
Other Income |
|
|
2,774 |
|
|
|
2,890 |
|
|
|
Total revenues |
|
|
151,040 |
|
|
|
138,266 |
|
|
|
Expenses |
|
|
|
|
|
|
|
|
|
|
Property operating and maintenance |
|
|
18,946 |
|
|
|
16,738 |
|
|
|
Real estate taxes, insurance and HOA costs |
|
|
28,299 |
|
|
|
27,319 |
|
|
|
Property management |
|
|
9,650 |
|
|
|
10,016 |
|
|
|
Interest expense |
|
|
38,999 |
|
|
|
37,457 |
|
|
|
Depreciation and amortization |
|
|
46,185 |
|
|
|
43,630 |
|
|
|
Impairment of real estate assets |
|
|
443 |
|
|
|
30 |
|
|
|
Share-based compensation |
|
|
1,561 |
|
|
|
387 |
|
|
|
General and administrative |
|
|
10,840 |
|
|
|
16,366 |
|
|
|
Merger and transaction-related expenses |
|
|
- |
|
|
|
23,482 |
|
|
|
Total expenses |
|
|
154,923 |
|
|
|
175,425 |
|
|
|
Net gain on sales of real estate |
|
|
678 |
|
|
|
1,384 |
|
|
|
Equity in income from unconsolidated joint ventures |
|
|
180 |
|
|
|
197 |
|
|
|
Loss on extinguishment of debt |
|
|
(7,153 |
) |
|
|
- |
|
|
|
Other expense, net |
|
|
(1,639 |
) |
|
|
(725 |
) |
|
|
Loss before income taxes |
|
|
(11,817 |
) |
|
|
(36,303 |
) |
|
|
Income tax expense |
|
|
157 |
|
|
|
245 |
|
|
|
Net loss from continuing operations |
|
|
(11,974 |
) |
|
|
(36,548 |
) |
|
|
Loss from discontinued operations, net |
|
|
(46 |
) |
|
|
(10,501 |
) |
|
|
Net loss |
|
|
(12,020 |
) |
|
|
(47,049 |
) |
|
|
Net loss attributable to non-controlling interests |
|
|
678 |
|
|
|
2,850 |
|
|
|
Net loss attributable to common shareholders |
|
$ |
(11,342 |
) |
|
$ |
(44,199 |
) |
|
|
|
|
|
|
|
|
|
|
|
|
|
Earnings per share - basic |
|
|
|
|
|
|
|
|
|
|
Net income available to common shareholders |
|
$ |
(0.11 |
) |
|
$ |
(0.43 |
) |
|
|
Weighted average common shares outstanding |
|
|
104,593,904 |
|
|
|
102,066,754 |
|
|
|
|
|
|
|
|
|
|
|
|
|
Please see the Appendix for certain definitions, explanations and reconciliations of non-GAAP financial measures. All information is as of March 31, 2017 unless otherwise indicated.
|
|
|
10 |
Reconciliation to FFO, Core FFO and Core AFFO
|
|
Dollars in thousands, except share and per share data
|
|
|
Three Months Ended March 31, 2017 |
|
|
|
|
|
|
|
|
|
|
|
Reconciliation of net loss to NAREIT FFO |
|
|
|
|
|
|
Net loss attributable to common shareholders |
|
$ |
(11,342 |
) |
|
|
Adjustments: |
|
|
|
|
|
|
Depreciation and amortization on real estate assets |
|
|
46,116 |
|
|
|
Impairment of real estate assets |
|
|
443 |
|
|
|
Net gain on sale of real estate |
|
|
(678 |
) |
|
|
Non-controlling interests |
|
|
(678 |
) |
|
|
Discontinued operations, net (NPL/REO) |
|
|
46 |
|
|
|
NAREIT FFO |
|
$ |
33,907 |
|
|
|
NAREIT FFO per share (1) |
|
$ |
0.31 |
|
|
|
|
|
|
|
|
|
|
Adjustments for Core FFO |
|
|
|
|
|
|
NAREIT FFO |
|
$ |
33,907 |
|
|
|
Amortization of deferred financing costs, debt premium discounts, non-cash interest expense from interest rate caps and loss on extinguishment of debt |
|
|
17,330 |
|
|
|
Share-based compensation |
|
|
1,561 |
|
|
|
Core FFO |
|
$ |
52,798 |
|
|
|
|
|
|
|
|
|
|
Core FFO per share (1) |
|
$ |
0.48 |
|
|
|
|
|
|
|
|
|
|
Adjustments for Core AFFO |
|
|
|
|
|
|
Core FFO |
|
$ |
52,798 |
|
|
|
Recurring capital expenditures (2) |
|
|
(10,274 |
) |
|
|
Capitalized leasing |
|
|
(2,153 |
) |
|
|
Core AFFO |
|
$ |
40,371 |
|
|
|
|
|
|
|
|
|
|
Core AFFO per share (1) |
|
$ |
0.36 |
|
|
|
|
|
|
|
|
|
Please see the Appendix for certain definitions, explanations and reconciliations of non-GAAP financial measures. All information is as of March 31, 2017 unless otherwise indicated.
|
|
(1) Weighted-average common shares total 111,021,947 for the three-month period ended March 31, 2017. These share counts are comprised of 104,593,904 weighted-average common shares outstanding and 155,214 unvested RSUs for the three-month period ended, and outstanding OP units exchangeable for 6,272,829 common shares. (2) Comprised of $1.9 million of certain personnel costs and $0.3 million of third-party commissions. |
11 |
NOI by Segment
|
|
Dollars in thousands
|
|
Three months ended March 31, 2017 |
|
|
Three months ended March 31, 2016 (1) |
|
|
|
|
|
||||||||||||||||||||||||||
|
|
Same Homes |
|
|
Stabilized Homes |
|
|
Other Homes |
|
|
Total |
|
|
Same Homes |
|
|
Stabilized Homes |
|
|
Other Homes |
|
|
Total |
|
|
Total Change % |
|
|||||||||
|
Revenues |
|
|
|
|
|
|
|
|
|
|
|
|
|
|
|
|
|
|
|
|
|
|
|
|
|
|
|
|
|
|
|
|
|
|
|
|
Rental income |
$ |
130,926 |
|
|
$ |
9,760 |
|
|
$ |
409 |
|
|
$ |
141,095 |
|
|
$ |
123,949 |
|
|
$ |
3,568 |
|
|
$ |
2,935 |
|
|
$ |
130,452 |
|
|
|
8.2 |
% |
|
Fee income |
|
3,437 |
|
|
|
358 |
|
|
|
47 |
|
|
|
3,842 |
|
|
|
2,528 |
|
|
|
139 |
|
|
|
89 |
|
|
|
2,756 |
|
|
|
39.4 |
% |
|
Resident utility reimbursements |
|
1,375 |
|
|
|
125 |
|
|
|
7 |
|
|
|
1,507 |
|
|
|
604 |
|
|
|
21 |
|
|
|
16 |
|
|
|
641 |
|
|
|
135.1 |
% |
|
Resident chargebacks |
|
1,673 |
|
|
|
103 |
|
|
|
46 |
|
|
|
1,822 |
|
|
|
1,440 |
|
|
|
(5 |
) |
|
|
92 |
|
|
|
1,527 |
|
|
|
19.3 |
% |
|
Asset Management Fee (2) |
|
- |
|
|
|
- |
|
|
|
2,774 |
|
|
|
2,774 |
|
|
|
- |
|
|
|
- |
|
|
|
2,890 |
|
|
|
2,890 |
|
|
|
-4.0 |
% |
|
Total revenues |
$ |
137,411 |
|
|
$ |
10,346 |
|
|
$ |
3,283 |
|
|
$ |
151,040 |
|
|
$ |
128,521 |
|
|
$ |
3,723 |
|
|
$ |
6,022 |
|
|
$ |
138,266 |
|
|
|
9.2 |
% |
|
|
|
|
|
|
|
|
|
|
|
|
|
|
|
|
|
|
|
|
|
|
|
|
|
|
|
|
|
|
|
|
|
|
|
|
|
|
Operating expenses |
|
|
|
|
|
|
|
|
|
|
|
|
|
|
|
|
|
|
|
|
|
|
|
|
|
|
|
|
|
|
|
|
|
|
|
|
Repairs & maintenance and turn costs |
$ |
10,946 |
|
|
$ |
717 |
|
|
$ |
398 |
|
|
$ |
12,061 |
|
|
$ |
11,223 |
|
|
$ |
445 |
|
|
$ |
700 |
|
|
$ |
12,368 |
|
|
|
-2.5 |
% |
|
Utilities (3)(4) |
|
2,637 |
|
|
|
362 |
|
|
|
198 |
|
|
|
3,197 |
|
|
|
1,481 |
|
|
|
228 |
|
|
|
244 |
|
|
|
1,953 |
|
|
|
63.7 |
% |
|
Real estate taxes |
|
21,999 |
|
|
|
1,560 |
|
|
|
361 |
|
|
|
23,920 |
|
|
|
21,153 |
|
|
|
621 |
|
|
|
1,056 |
|
|
|
22,830 |
|
|
|
4.8 |
% |
|
Insurance and HOA costs |
|
4,075 |
|
|
|
233 |
|
|
|
71 |
|
|
|
4,379 |
|
|
|
4,222 |
|
|
|
119 |
|
|
|
148 |
|
|
|
4,489 |
|
|
|
-2.5 |
% |
|
Property management costs |
|
7,752 |
|
|
|
410 |
|
|
|
1,488 |
|
|
|
9,650 |
|
|
|
6,826 |
|
|
|
136 |
|
|
|
1,753 |
|
|
|
8,715 |
|
|
|
10.7 |
% |
|
Bad debt |
|
1,862 |
|
|
|
110 |
|
|
|
96 |
|
|
|
2,068 |
|
|
|
1,021 |
|
|
|
26 |
|
|
|
27 |
|
|
|
1,074 |
|
|
|
92.5 |
% |
|
Other expenses |
|
1,420 |
|
|
|
156 |
|
|
|
44 |
|
|
|
1,620 |
|
|
|
1,173 |
|
|
|
63 |
|
|
|
106 |
|
|
|
1,342 |
|
|
|
20.7 |
% |
|
Total operating expenses |
$ |
50,691 |
|
|
$ |
3,548 |
|
|
$ |
2,656 |
|
|
$ |
56,895 |
|
|
$ |
47,099 |
|
|
$ |
1,638 |
|
|
$ |
4,034 |
|
|
$ |
52,771 |
|
|
|
7.8 |
% |
|
|
|
|
|
|
|
|
|
|
|
|
|
|
|
|
|
|
|
|
|
|
|
|
|
|
|
|
|
|
|
|
|
|
|
|
|
|
Net Operating Income |
|
86,720 |
|
|
|
6,798 |
|
|
|
627 |
|
|
|
94,145 |
|
|
|
81,422 |
|
|
|
2,085 |
|
|
|
1,988 |
|
|
|
85,495 |
|
|
|
10.1 |
% |
|
Core Net Operating Income Margin |
|
65.4 |
% |
|
|
67.9 |
% |
|
|
174.3 |
% |
|
|
65.9 |
% |
|
|
64.9 |
% |
|
|
56.7 |
% |
|
|
66.3 |
% |
|
|
64.7 |
% |
|
|
|
|
|
|
|
|
|
|
|
|
|
|
|
|
|
|
|
|
|
|
|
|
|
|
|
|
|
|
|
|
|
|
|
|
|
|
|
|
|
|
Home Count |
|
28,732 |
|
|
|
2,268 |
|
|
|
592 |
|
|
|
31,592 |
|
|
|
28,732 |
|
|
|
2,268 |
|
|
|
592 |
|
|
|
31,592 |
|
|
|
|
|
Please see the Appendix for certain definitions, explanations and reconciliations of non-GAAP financial measures. All information is as of March 31, 2017 unless otherwise indicated.
|
|
(1) Certain revenues and expenses have been recast to be consistent with 2017 presentation. (2) Asset management fees are comprised of property management services related to our Fannie Mae JV and Waypoint Real Estate Group (WREG) contracts. During the first quarter of 2017 the fee revenue from Fannie Mae was $0.7 million and fee revenue from WREG was $2.0 million. (3) Utility expense increase is largely a result of the transition to a third-party billing platform which maintains water, sewer, and trash services in the Company's name, during tenancy, with offsetting resident reimbursements/revenue. (4) Includes approximately $0.8 million year-over-year increase of resident occupied utility expenses paid for by the Company and subsequently billed back to the resident and approximately a $0.3 million year-over-year increase for third-party service fees. |
12 |
 III. Selected Additional Information
|
|
|
13 |
Home Count by Portfolio
|
|
|
Market: |
|
Same Home |
|
|
Stabilized Homes |
|
Total Stable Homes (1) |
|
Owned Homes Occupied % (1) |
|
Other Homes (2) |
|
Non-owned, Managed Homes |
|
Total Homes |
|
Atlanta |
|
5,456 |
|
|
74 |
|
5,530 |
|
96.5% |
|
36 |
|
312 |
|
5,878 |
|
Tampa |
|
3,565 |
|
|
141 |
|
3,706 |
|
95.6% |
|
11 |
|
220 |
|
3,937 |
|
Miami |
|
3,389 |
|
|
259 |
|
3,648 |
|
95.6% |
|
48 |
|
143 |
|
3,839 |
|
Southern California |
|
2,718 |
|
|
38 |
|
2,756 |
|
97.2% |
|
33 |
|
1,402 |
|
4,191 |
|
Houston |
|
2,619 |
|
|
58 |
|
2,677 |
|
96.3% |
|
45 |
|
1 |
|
2,723 |
|
Dallas |
|
1,901 |
|
|
212 |
|
2,113 |
|
95.4% |
|
73 |
|
- |
|
2,186 |
|
Orlando |
|
1,841 |
|
|
97 |
|
1,938 |
|
97.1% |
|
1 |
|
10 |
|
1,949 |
|
Denver |
|
1,767 |
|
|
276 |
|
2,043 |
|
94.7% |
|
36 |
|
- |
|
2,079 |
|
Las Vegas |
|
1,708 |
|
|
9 |
|
1,717 |
|
96.8% |
|
7 |
|
186 |
|
1,910 |
|
Phoenix (3) |
|
1,416 |
|
|
202 |
|
1,618 |
|
96.3% |
|
55 |
|
450 |
|
2,123 |
|
Northern California |
|
771 |
|
|
196 |
|
967 |
|
97.0% |
|
6 |
|
825 |
|
1,798 |
|
Charlotte-Raleigh |
|
712 |
|
|
378 |
|
1,090 |
|
94.9% |
|
130 |
|
- |
|
1,220 |
|
Chicago |
|
679 |
|
|
85 |
|
764 |
|
95.2% |
|
7 |
|
395 |
|
1,166 |
|
Nashville |
|
109 |
|
|
243 |
|
352 |
|
95.7% |
|
88 |
|
- |
|
440 |
|
Other |
|
81 |
|
|
- |
|
81 |
|
91.4% |
|
16 |
|
- |
|
97 |
|
Total |
|
28,732 |
|
|
2,268 |
|
31,000 |
|
96.1% |
|
592 |
|
3,944 |
|
35,536 |
|
|
|
|
|
|
|
|
|
|
|
|
|
|
|
|
|
Please see the Appendix for certain definitions, explanations and reconciliations of non-GAAP financial measures. All information is as of March 31, 2017 unless otherwise indicated.
|
|
(1) Excludes Other Homes and REO properties associated with the NPL business. (2) Includes 318 not yet stabilized homes and 274 homes not intended to be held for the long term. (3) The Phoenix market includes Tucson homes which were included with Other Homes in the 2016 presentation. |
14 |
Asset Rollforward
|
|
Three months ended March 31, 2017
|
|
|
Homes as of |
|
|
|
|
|
Homes as of |
|
Market: |
|
December 31, 2016 (1) |
|
Acquisitions |
|
Dispositions |
|
March 31, 2017 (1) |
|
Atlanta |
|
5,587 |
|
3 |
|
24 |
|
5,566 |
|
Tampa |
|
3,726 |
|
- |
|
9 |
|
3,717 |
|
Miami |
|
3,721 |
|
- |
|
25 |
|
3,696 |
|
Southern California |
|
2,807 |
|
- |
|
18 |
|
2,789 |
|
Houston |
|
2,748 |
|
- |
|
26 |
|
2,722 |
|
Dallas |
|
2,168 |
|
27 |
|
9 |
|
2,186 |
|
Denver |
|
2,043 |
|
36 |
|
- |
|
2,079 |
|
Orlando |
|
1,943 |
|
- |
|
4 |
|
1,939 |
|
Las Vegas |
|
1,722 |
|
6 |
|
4 |
|
1,724 |
|
Phoenix (2) |
|
1,596 |
|
85 |
|
8 |
|
1,673 |
|
Charlotte-Raleigh |
|
1,080 |
|
140 |
|
- |
|
1,220 |
|
Northern California |
|
974 |
|
- |
|
1 |
|
973 |
|
Chicago |
|
772 |
|
- |
|
1 |
|
771 |
|
Nashville |
|
340 |
|
100 |
|
- |
|
440 |
|
Other |
|
104 |
|
- |
|
7 |
|
97 |
|
Total Owned Homes |
|
31,331 |
|
397 |
|
136 |
|
31,592 |
|
|
|
|
|
|
|
|
|
|
Please see the Appendix for certain definitions, explanations and reconciliations of non-GAAP financial measures. All information is as of March 31, 2017 unless otherwise indicated.
|
|
(1) Excludes REO properties associated with the NPL business. (2) The Phoenix market includes Tucson homes which were included with Other Homes in the 2016 presentation. |
15 |
Debt Summary
|
|
Dollars in millions
|
|
Amount outstanding |
|
Interest rate (1) |
|
Initial maturity |
|
Extensions |
|
Full maturity |
|
Securitizations |
|
|
|
|
|
|
|
|
|
|
CAH 2014-1 |
$489 |
|
1mL+171bps |
|
May-17 |
|
Two, one-year |
|
May-19 |
|
CAH 2014-2 |
$546 |
|
1mL+175bps |
|
Jul-16 |
|
Three, one-year |
|
Jul-19 |
|
SWAY 2014-1 (2) |
$496 |
|
1mL+250bps |
|
Jan-17 |
|
Three, one-year |
|
Jan-20 |
|
CAH 2015-1 (2) |
$636 |
|
1mL+197bps |
|
Jul-17 |
|
Three, one-year |
|
Jul-20 |
|
CSH 2016-1 (2) |
$485 |
|
1mL+230bps |
|
Jul-18 |
|
Three, one-year |
|
Jul-21 |
|
CSH 2016-2 (2) |
$580 |
|
1mL+194bps |
|
Dec-18 |
|
Three, one-year |
|
Dec-21 |
|
Total securitizations |
$3,232 |
|
|
|
|
|
|
|
|
|
|
|
|
|
|
|
|
|
|
|
|
Secured credit facilities |
|
|
|
|
|
|
|
|
|
|
CAH credit facility |
$0 |
|
3mL+300bps |
|
Jul-17 |
|
None |
|
Jul-17 |
|
SWAY credit facility (3) |
$0 |
|
1mL+295bps |
|
Jun-17 |
|
Eight months |
|
Feb-18 |
|
Total secured credit facilities |
$0 |
|
|
|
|
|
|
|
|
|
|
|
|
|
|
|
|
|
|
|
|
Convertible debt |
|
|
|
|
|
|
|
|
|
|
Convertible notes (due 2017) |
$4 |
|
4.5% |
|
Oct-17 |
|
None |
|
Oct-17 |
|
Convertible notes (due 2019) |
$230 |
|
3.0% |
|
Jul-19 |
|
None |
|
Jul-19 |
|
Convertible notes (due 2022) |
$345 |
|
3.5% |
|
Jan-22 |
|
None |
|
Jan-22 |
|
Total convertible debt |
$579 |
|
|
|
|
|
|
|
|
|
|
|
|
|
|
|
|
|
|
|
|
Total debt outstanding |
$3,811 |
|
|
|
|
|
|
|
|
Please see the Appendix for certain definitions, explanations and reconciliations of non-GAAP financial measures. All information is as of March 31, 2017 unless otherwise indicated.
|
|
(1) Colony Starwood Homes has entered into three interest rate swap contracts including a February 2016 contract with a notional of $1.6B at 2.75%, a June 2016 contract with a notional of $450M at 3.32%, and a January 2017 agreement with a notional of $550M at 3.59%. The stated interest rates on this page do not include the impact of the Colony Starwood interest rate swaps. (2) Securitizations SWAY 2014-1, CAH 2015-1 and CSH 2016-2 are stated net of retained class G certificates in the amounts of $26.6M, $33.7M, and $30.6M respectively; CSH 2016-1 is net of retained class F and G certificates totaling $50.3M. (3) Colony Starwood Homes amended the initial term of the SWAY credit facility from February 2017 to June 2017 without extending the full maturity date. |
16 |
Capitalization Update
|
|
Inclusive of events subsequent to March 31, 2017
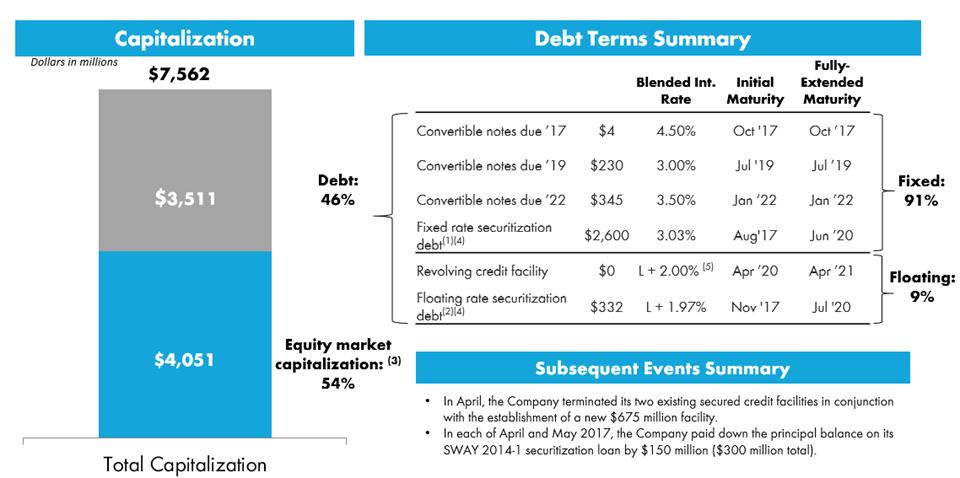
Total Capitalization$3,511$4,051CapitalizationDollars in millions$7,562Debt:46%Debt Terms SummaryBlended Int. RateInitialMaturityFully-Extended MaturityConvertible notes due ’17$4 4.50%Oct '17Oct ’17Convertible notes due ’19$230 3.00%Jul '19Jul ’19Convertible notes due ’22$345 3.50%Jan ‘22Jan ’22Fixed rate securitization debt(1)(4)$2,600 3.03%Aug'17Jun ’20Revolving credit facility$0 L + 2.00% (5)Apr ’20Apr ’21Floating rate securitization debt(2)(4)$332 L+ 1.97%Nov '17Jul '20Floating:9%Fixed:91%Equity market capitalization: (3)54%•In April, the Company terminated its two existing secured credit facilities in conjunction with the establishment of a new $675 million facility.•In each of April and May 2017, the Company paid down the principal balance on its SWAY 2014-1 securitization loan by $150 million ($300 million total).Subsequent Events Summary
Capitalization Update Inclusive of events subsequent to December 31, 2016 Capitalization Debt Terms Summary Dollars in millions $7,368 $3,845 $3,523 Debt: 52% Equity market capitalization: (3) 48% Blended Int. Rate Initial Maturity Fully-Extended Maturity Convertible notes due ’17 $5 4.50% Oct '17 Oct '17 Convertible notes due ’19 $230 3.00% Jul '19 Jul '19 Convertible notes due ’22 $345 3.50% Jan ‘22 Jan ‘22 Fixed rate securitization debt(1)(4) $2,600 3.03% Aug'17 Jun ’20 Secured credit facilities $24 L + 3.00% Jun ’17 Feb ’18 Floating rate securitization debt(2)(4) $641 L + 1.99% Nov '17 Jul '20 Subsequent Events Summary In January the Company sold $345 million of 3.50% convertible senior notes due 2022 A portion of the sale proceeds were used to repurchase outstanding 4.50% convertible senior notes, reducing the 2017 notes outstanding from $173 to $5 million due 2022 Additional proceeds were used to pay down secured credit facilities by approximately $84 million and pay off $19 million of debt related to discontinued operations Remaining proceeds will fund ongoing asset acquisitions or be utilized for general corporate purposes
Please see the Appendix for certain definitions, explanations and reconciliations of non-GAAP financial measures. All information is as of March 31, 2017 unless otherwise indicated.
|
|
(1) Effectively fixed via swap contract. Rate based on weighted average for swap contracts, including $1.6Bn contract with 2.75% average rate, $450MM with average rate of 3.32%, and $550MM with average rate of 3.59%. (2) Based on weighted average for CSH’s securitizations; weighted by outstanding balances. (3) Equity market capitalization based on May 5, 2017 closing price of $33.87 and 119.6 million shares and units outstanding. (4) Securitizations SWAY 2014-1, CAH 2015-1 and CSH 2016-2 are stated net of retained class G certificates in the amounts of $26.6M, $33.7M, $30.6M respectively; CSH 2016-1 is net of retained class F and G certificates totaling $50.3M. (5) Represents interest rate margin at time of credit facility closing. Applicable margin varies based on leverage ratio as described in the credit agreement, ranging from L+1.75% to L+2.30%. |
17 |
 IV. Same Store Information
|
|
|
18 |
Portfolio Overview – Same Home
|
|
|
Market: |
|
Same Home |
|
|
Occupancy % |
|
Average Acquisition Cost per Home |
|
Average Investment |
|
Average Home Size (sq. ft.) |
|
Average Monthly Rent per Occupied Home |
|
Atlanta |
|
5,456 |
|
|
96.5% |
|
$ 128,009 |
|
$ 146,567 |
|
2,004 |
|
$ 1,320 |
|
Tampa |
|
3,565 |
|
|
95.6% |
|
156,203 |
|
180,679 |
|
1,719 |
|
1,491 |
|
Miami |
|
3,389 |
|
|
95.6% |
|
207,994 |
|
226,377 |
|
1,729 |
|
1,833 |
|
Southern California |
|
2,718 |
|
|
97.2% |
|
273,646 |
|
309,870 |
|
1,715 |
|
2,082 |
|
Houston |
|
2,619 |
|
|
96.3% |
|
152,148 |
|
156,714 |
|
1,943 |
|
1,509 |
|
Dallas |
|
1,901 |
|
|
95.4% |
|
179,669 |
|
187,988 |
|
2,105 |
|
1,661 |
|
Orlando |
|
1,841 |
|
|
97.1% |
|
140,324 |
|
167,954 |
|
1,729 |
|
1,418 |
|
Denver |
|
1,767 |
|
|
94.7% |
|
200,691 |
|
220,959 |
|
1,729 |
|
1,774 |
|
Las Vegas |
|
1,708 |
|
|
96.8% |
|
187,644 |
|
204,526 |
|
2,032 |
|
1,432 |
|
Phoenix |
|
1,416 |
|
|
96.3% |
|
138,314 |
|
154,623 |
|
1,715 |
|
1,201 |
|
Northern California |
|
771 |
|
|
97.0% |
|
229,611 |
|
253,443 |
|
1,434 |
|
1,834 |
|
Charlotte-Raleigh |
|
712 |
|
|
94.9% |
|
186,391 |
|
210,588 |
|
2,359 |
|
1,662 |
|
Chicago |
|
679 |
|
|
95.2% |
|
159,031 |
|
161,869 |
|
1,567 |
|
1,733 |
|
Nashville |
|
109 |
|
|
95.7% |
|
285,068 |
|
306,392 |
|
2,806 |
|
2,192 |
|
Other |
|
81 |
|
|
91.4% |
|
143,811 |
|
168,255 |
|
1,515 |
|
1,400 |
|
Total |
|
28,732 |
|
|
96.1% |
|
$ 175,124 |
|
$ 194,514 |
|
1,848 |
|
$ 1,584 |
|
|
|
|
|
|
|
|
|
|
|
|
|
|
|
Please see the Appendix for certain definitions, explanations and reconciliations of non-GAAP financial measures. All information is as of March 31, 2017 unless otherwise indicated.
|
|
|
19 |
Same Home Year-Over-Year Results
|
|
|
|
Three Months Ended March 31, (1) |
|
|||||||||
|
|
2017 |
|
|
2016 (2) |
|
|
% of Change |
|
|||
|
Revenues |
|
|
|
|
|
|
|
|
|
|
|
|
Rental income |
$ |
130,926 |
|
|
$ |
123,949 |
|
|
|
5.6 |
% |
|
Fee income |
|
3,437 |
|
|
|
2,528 |
|
|
|
36.0 |
% |
|
Resident utility reimbursements |
|
1,375 |
|
|
|
604 |
|
|
|
127.6 |
% |
|
Resident chargebacks |
|
1,673 |
|
|
|
1,440 |
|
|
|
16.2 |
% |
|
Total revenues |
$ |
137,411 |
|
|
$ |
128,521 |
|
|
|
6.9 |
% |
|
|
|
|
|
|
|
|
|
|
|
|
|
|
Operating expenses |
|
|
|
|
|
|
|
|
|
|
|
|
Repairs & maintenance and turn costs |
$ |
10,946 |
|
|
$ |
11,223 |
|
|
|
-2.5 |
% |
|
Utilities (3)(4) |
|
2,637 |
|
|
|
1,481 |
|
|
|
78.1 |
% |
|
Real estate taxes |
|
21,999 |
|
|
|
21,153 |
|
|
|
4.0 |
% |
|
Insurance and HOA costs |
|
4,075 |
|
|
|
4,222 |
|
|
|
-3.5 |
% |
|
Property management costs |
|
7,752 |
|
|
|
6,826 |
|
|
|
13.6 |
% |
|
Bad debt |
|
1,862 |
|
|
|
1,021 |
|
|
|
82.4 |
% |
|
Other expenses |
|
1,420 |
|
|
|
1,173 |
|
|
|
21.1 |
% |
|
Total operating expenses |
$ |
50,691 |
|
|
$ |
47,099 |
|
|
|
7.6 |
% |
|
|
|
|
|
|
|
|
|
|
|
|
|
|
Net Operating Income |
$ |
86,720 |
|
|
$ |
81,422 |
|
|
|
6.5 |
% |
|
Net Operating Income margin |
|
63.1 |
% |
|
|
63.4 |
% |
|
|
|
|
|
Core Net Operating Income margin |
|
65.4 |
% |
|
|
64.9 |
% |
|
|
|
|
Please see the Appendix for certain definitions, explanations and reconciliations of non-GAAP financial measures. All information is as of March 31, 2017 unless otherwise indicated.
|
|
(1) Colony Starwood Homes’ Same Home property count is 28,732 as of March 31, 2017. (2) Certain revenues and expenses have been recast to be consistent with 2017 presentation. (3) Utility expense increase is largely a result of the transition to a third-party billing platform which maintains water, sewer, and trash services in the Company's name, during tenancy, with offsetting resident reimbursements/revenue. (4) Includes $0.8 million year-over-year increase of resident occupied utility expenses paid for by the Company and subsequently billed back to the resident and approximately a $0.3 million year-over-year increase for third-party service fees. |
20 |
Same Home Core Year-Over-Year Results
|
|
|
|
Three Months Ended March 31, (1) |
||||
|
|
2017 |
|
2016 (2) |
|
% of Change |
|
Core Revenues |
|
|
|
|
|
|
Rental Income |
$ 130,926 |
|
$ 123,949 |
|
5.6% |
|
Fee Income |
3,437 |
|
2,528 |
|
36.0% |
|
(-) Bad debt |
(1,862) |
|
(1,021) |
|
82.4% |
|
Total Core Revenues |
$ 132,501 |
|
$ 125,456 |
|
5.6% |
|
|
|
|
|
|
|
|
Core Expenses |
|
|
|
|
|
|
Total Operating Costs |
$ 50,691 |
|
$ 47,099 |
|
7.6% |
|
(-) Resident utility reimbursements |
(1,375) |
|
(604) |
|
127.6% |
|
(-) Resident chargebacks |
(1,673) |
|
(1,440) |
|
16.2% |
|
(-) Bad debt |
(1,862) |
|
(1,021) |
|
82.4% |
|
Total Core Expenses |
$ 45,781 |
|
$ 44,034 |
|
4.0% |
|
|
|
|
|
|
|
|
Same Home Core Net Operating Income |
$ 86,720 |
|
$ 81,422 |
|
6.5% |
|
Core Net Operating Income margin |
65.4% |
|
64.9% |
|
|
Please see the Appendix for certain definitions, explanations and reconciliations of non-GAAP financial measures. All information is as of March 31, 2017 unless otherwise indicated.
|
|
(1) Colony Starwood Homes’ Same Home property count is 28,732 as of March 31, 2017. (2) Certain revenues and expenses have been recast to be consistent with 2017 presentation. |
21 |
Same Home Quarterly Trending Results
|
|
|
|
|
1Q16 (1) |
|
|
2Q16 (1) |
|
|
3Q16 (1) |
|
|
4Q16 (1) |
|
|
1Q17 |
|
|||||
|
Revenues |
|
|
|
|
|
|
|
|
|
|
|
|
|
|
|
|
|
|
|
|
|
Rental income |
|
$ |
123,949 |
|
|
$ |
126,492 |
|
|
$ |
127,738 |
|
|
$ |
129,076 |
|
|
$ |
130,926 |
|
|
Fee income |
|
|
2,528 |
|
|
|
3,483 |
|
|
|
3,598 |
|
|
|
3,365 |
|
|
|
3,437 |
|
|
Resident utility reimbursements |
|
|
604 |
|
|
|
544 |
|
|
|
944 |
|
|
|
936 |
|
|
|
1,375 |
|
|
Resident chargebacks |
|
|
1,440 |
|
|
|
1,940 |
|
|
|
2,171 |
|
|
|
1,193 |
|
|
|
1,673 |
|
|
Total rental and other property revenue |
|
$ |
128,521 |
|
|
$ |
132,459 |
|
|
$ |
134,451 |
|
|
$ |
134,570 |
|
|
$ |
137,411 |
|
|
|
|
|
|
|
|
|
|
|
|
|
|
|
|
|
|
|
|
|
|
|
|
Expenses |
|
|
|
|
|
|
|
|
|
|
|
|
|
|
|
|
|
|
|
|
|
Repairs & maintenance and turn costs |
|
$ |
11,223 |
|
|
$ |
14,636 |
|
|
$ |
15,776 |
|
|
$ |
11,337 |
|
|
$ |
10,946 |
|
|
Utilities (2)(3) |
|
|
1,481 |
|
|
|
1,481 |
|
|
|
2,274 |
|
|
|
2,336 |
|
|
|
2,637 |
|
|
Real estate taxes |
|
|
21,153 |
|
|
|
21,511 |
|
|
|
21,584 |
|
|
|
20,333 |
|
|
|
21,999 |
|
|
Insurance and HOA costs |
|
|
4,222 |
|
|
|
4,284 |
|
|
|
4,570 |
|
|
|
4,306 |
|
|
|
4,075 |
|
|
Property management costs |
|
|
6,826 |
|
|
|
7,248 |
|
|
|
7,035 |
|
|
|
6,978 |
|
|
|
7,752 |
|
|
Bad debt |
|
|
1,021 |
|
|
|
1,765 |
|
|
|
2,215 |
|
|
|
2,283 |
|
|
|
1,862 |
|
|
Other operating expenses |
|
|
1,173 |
|
|
|
2,053 |
|
|
|
1,421 |
|
|
|
1,380 |
|
|
|
1,420 |
|
|
Total Core Expenses |
|
$ |
47,099 |
|
|
$ |
52,978 |
|
|
$ |
54,875 |
|
|
$ |
48,953 |
|
|
$ |
50,691 |
|
|
|
|
|
|
|
|
|
|
|
|
|
|
|
|
|
|
|
|
|
|
|
|
Net Operating Income |
|
$ |
81,422 |
|
|
$ |
79,481 |
|
|
$ |
79,576 |
|
|
$ |
85,617 |
|
|
$ |
86,720 |
|
|
|
|
|
|
|
|
|
|
|
|
|
|
|
|
|
|
|
|
|
|
|
|
Same Home Metrics |
|
|
|
|
|
|
|
|
|
|
|
|
|
|
|
|
|
|
|
|
|
Home count |
|
|
28,732 |
|
|
|
28,732 |
|
|
|
28,732 |
|
|
|
28,732 |
|
|
|
28,732 |
|
|
NOI margin |
|
|
63.4 |
% |
|
|
60.0 |
% |
|
|
59.2 |
% |
|
|
63.6 |
% |
|
|
63.1 |
% |
|
Core NOI margin |
|
|
64.9 |
% |
|
|
62.0 |
% |
|
|
61.6 |
% |
|
|
65.8 |
% |
|
|
65.4 |
% |
Please see the Appendix for certain definitions, explanations and reconciliations of non-GAAP financial measures. All information is as of March 31, 2017 unless otherwise indicated.
|
|
(1) Certain revenues and expenses have been recast to be consistent with 2017 presentation. (2) Utility expense increase is largely a result of the transition to a third-party billing platform which maintains water, sewer, and trash services in the Company's name, during tenancy, with offsetting resident reimbursements/revenue. (3) Includes $0.8 million year-over-year increase of resident occupied utility expenses paid for by the Company and subsequently billed back to the resident and approximately a $0.3 million year-over-year increase of third-party service fees. |
22 |
Same Home Core Quarterly Trending Results
|
|
|
|
|
1Q16 (1) |
|
2Q16 (1) |
|
3Q16 (1) |
|
4Q16 (1) |
|
1Q17 |
|
Core Revenues |
|
|
|
|
|
|
|
|
|
|
|
Rental income |
|
$ 123,949 |
|
$ 126,492 |
|
$ 127,738 |
|
$ 129,076 |
|
$ 130,926 |
|
Fee income |
|
2,528 |
|
3,483 |
|
3,598 |
|
3,365 |
|
3,437 |
|
(-) Bad debt |
|
(1,021) |
|
(1,765) |
|
(2,215) |
|
(2,283) |
|
(1,862) |
|
Total Core Revenues |
|
$ 125,456 |
|
$ 128,210 |
|
$ 129,121 |
|
$ 130,158 |
|
$ 132,501 |
|
|
|
|
|
|
|
|
|
|
|
|
|
Core Expenses |
|
|
|
|
|
|
|
|
|
|
|
Total Operating Costs |
|
$ 47,099 |
|
$ 52,978 |
|
$ 54,875 |
|
$ 48,953 |
|
$ 50,691 |
|
(-) Resident utility reimbursements |
|
(604) |
|
(544) |
|
(944) |
|
(936) |
|
(1,375) |
|
(-) Resident chargebacks |
|
(1,440) |
|
(1,940) |
|
(2,171) |
|
(1,193) |
|
(1,673) |
|
(-) Bad debt |
|
(1,021) |
|
(1,765) |
|
(2,215) |
|
(2,283) |
|
(1,862) |
|
Total Core Expenses |
|
$ 44,034 |
|
$ 48,729 |
|
$ 49,545 |
|
$ 44,541 |
|
$ 45,781 |
|
|
|
|
|
|
|
|
|
|
|
|
|
Same Home Core Net Operating Income |
|
$ 81,422 |
|
$ 79,481 |
|
$ 79,576 |
|
$ 85,617 |
|
$ 86,720 |
|
|
|
|
|
|
|
|
|
|
|
|
|
Core Net Operating Income margin |
|
64.9% |
|
62.0% |
|
61.6% |
|
65.8% |
|
65.4% |
|
|
|
|
|
|
|
|
|
|
|
|
Please see the Appendix for certain definitions, explanations and reconciliations of non-GAAP financial measures. All information is as of March 31, 2017 unless otherwise indicated.
|
|
(1) Certain revenues and expenses have been recast to be consistent with 2017 presentation.
|
23 |
Results by Market – Same Home
|
|
Three months ended March 31, 2017
Dollars in thousands
|
Market: |
|
Same Home |
|
% of Total Same Home |
|
Revenues |
|
Expenses |
|
Net Operating Income |
|
% of Net Operating Income |
|
Net Operating Margin |
|
Core Operating Margin |
|
|
Atlanta |
|
5,456 |
|
19.0% |
|
$ 21,760 |
|
$ 7,462 |
|
$ 14,298 |
|
16.5% |
|
65.7% |
|
68.3% |
|
|
Tampa |
|
3,565 |
|
12.4% |
|
16,046 |
|
6,503 |
|
9,543 |
|
11.0% |
|
59.5% |
|
61.6% |
|
|
Miami |
|
3,389 |
|
11.8% |
|
18,763 |
|
7,826 |
|
10,937 |
|
12.6% |
|
58.3% |
|
60.7% |
|
|
Southern California |
|
2,718 |
|
9.5% |
|
17,077 |
|
5,709 |
|
11,368 |
|
13.1% |
|
66.6% |
|
68.8% |
|
|
Houston |
|
2,619 |
|
9.1% |
|
11,860 |
|
5,564 |
|
6,296 |
|
7.3% |
|
53.1% |
|
54.7% |
|
|
Dallas |
|
1,901 |
|
6.6% |
|
9,326 |
|
3,735 |
|
5,591 |
|
6.4% |
|
60.0% |
|
61.3% |
|
|
Orlando |
|
1,841 |
|
6.4% |
|
7,824 |
|
3,130 |
|
4,694 |
|
5.4% |
|
60.0% |
|
62.3% |
|
|
Denver |
|
1,767 |
|
6.1% |
|
9,533 |
|
2,420 |
|
7,113 |
|
8.2% |
|
74.6% |
|
78.3% |
|
|
Las Vegas |
|
1,708 |
|
5.9% |
|
7,649 |
|
2,296 |
|
5,353 |
|
6.2% |
|
70.0% |
|
72.6% |
|
|
Phoenix |
|
1,416 |
|
4.9% |
|
5,161 |
|
1,541 |
|
3,620 |
|
4.2% |
|
70.1% |
|
72.0% |
|
|
Northern California |
|
771 |
|
2.7% |
|
4,352 |
|
1,421 |
|
2,931 |
|
3.4% |
|
67.4% |
|
70.3% |
|
|
Charlotte-Raleigh |
|
712 |
|
2.5% |
|
3,484 |
|
1,076 |
|
2,408 |
|
2.8% |
|
69.1% |
|
70.3% |
|
|
Chicago |
|
679 |
|
2.4% |
|
3,523 |
|
1,755 |
|
1,768 |
|
2.0% |
|
50.2% |
|
54.3% |
|
|
Nashville |
|
109 |
|
0.4% |
|
710 |
|
151 |
|
559 |
|
0.6% |
|
78.7% |
|
80.0% |
|
|
Other |
|
81 |
|
0.3% |
|
343 |
|
102 |
|
241 |
|
0.3% |
|
70.3% |
|
74.3% |
|
|
Total |
|
28,732 |
|
100% |
|
137,411 |
|
50,691 |
|
86,720 |
|
100% |
|
63.1% |
|
65.4% |
|
|
|
|
|
|
|
|
|
|
|
|
|
|
|
|
|
|
|
|
Please see the Appendix for certain definitions, explanations and reconciliations of non-GAAP financial measures. All information is as of March 31, 2017 unless otherwise indicated.
|
|
|
24 |
Lease Outcomes – Same Home
|
|
Quarter-to-Date as of March 31, 2017
|
|
|
Expiration Outcome |
|
Turnover (4) |
||||||||||||
|
Market: |
|
Expiration Count (1) |
|
Renewed (2) |
|
Retained (3) |
|
Renewal Rate |
|
Retention Rate |
|
QTD Turnover Rate (5) |
|
YTD Turnover Rate |
|
YTD Annualized Turnover Rate (6) |
|
Atlanta |
|
915 |
|
602 |
|
653 |
|
65.8% |
|
71.4% |
|
8.4% |
|
8.4% |
|
33.8% |
|
Tampa |
|
725 |
|
480 |
|
523 |
|
66.2% |
|
72.1% |
|
8.6% |
|
8.6% |
|
34.6% |
|
Miami |
|
683 |
|
518 |
|
547 |
|
75.8% |
|
80.1% |
|
7.6% |
|
7.6% |
|
30.2% |
|
Southern California |
|
560 |
|
399 |
|
459 |
|
71.3% |
|
82.0% |
|
6.2% |
|
6.2% |
|
24.9% |
|
Houston |
|
419 |
|
275 |
|
302 |
|
65.6% |
|
72.1% |
|
7.3% |
|
7.3% |
|
29.2% |
|
Dallas |
|
348 |
|
214 |
|
249 |
|
61.5% |
|
71.6% |
|
8.5% |
|
8.5% |
|
34.1% |
|
Denver |
|
360 |
|
217 |
|
252 |
|
60.3% |
|
70.0% |
|
8.9% |
|
8.9% |
|
35.8% |
|
Orlando |
|
435 |
|
299 |
|
315 |
|
68.7% |
|
72.4% |
|
8.5% |
|
8.5% |
|
33.9% |
|
Las Vegas |
|
336 |
|
234 |
|
256 |
|
69.6% |
|
76.2% |
|
7.4% |
|
7.4% |
|
29.7% |
|
Phoenix |
|
320 |
|
200 |
|
227 |
|
62.5% |
|
70.9% |
|
8.2% |
|
7.8% |
|
32.8% |
|
Charlotte-Raleigh |
|
129 |
|
75 |
|
89 |
|
58.1% |
|
69.0% |
|
9.6% |
|
9.6% |
|
38.2% |
|
Northern California |
|
136 |
|
107 |
|
115 |
|
78.7% |
|
84.6% |
|
5.1% |
|
5.1% |
|
20.2% |
|
Chicago |
|
125 |
|
82 |
|
93 |
|
65.6% |
|
74.4% |
|
7.8% |
|
7.8% |
|
31.2% |
|
Nashville |
|
19 |
|
11 |
|
11 |
|
57.9% |
|
57.9% |
|
7.3% |
|
7.3% |
|
29.4% |
|
Other Markets |
|
27 |
|
12 |
|
24 |
|
44.4% |
|
88.9% |
|
2.5% |
|
2.5% |
|
9.9% |
|
Total |
|
5,537 |
|
3,725 |
|
4,115 |
|
67.3% |
|
74.3% |
|
7.9% |
|
7.9% |
|
31.7% |
Please see the Appendix for certain definitions, explanations and reconciliations of non-GAAP financial measures. All information is as of March 31, 2017 unless otherwise indicated.
|
|
(1) Represents the number of leases that expired within the quarter, less early terminations. (2) Includes lease expirations where the lease was renewed (excludes month-to-month leases). (3) Includes lease expirations where the resident did not "move out". (4) Population limited to homes that realized resident turnover within the subject period, including out of period lease expirations where the lease was terminated early and month-to-month leases. (5) The number of homes that become vacant during the subject period as a percentage of homes with an initial move-in ready status. (6) The number of homes that become vacant during the subject period as an annualized percentage of homes with an initial move-in ready status. |
25 |
Rent Growth – Same Home
|
|
Quarter-to-Date as of March 31, 2017
|
|
|
Renewals |
|
Replacement Rent |
|
|
|
|
Escalations on Multi-Year Leases |
|
Total Rent Growth |
||||||||
|
Market: |
|
Total Leases |
|
Renewal Rent Growth |
|
Total Leases |
|
Replacement Rent Growth |
|
Blended Rent Growth |
|
|
Total Leases |
|
Average Rent Change (1) |
|
Total Leases |
|
Average Rent Change (2) |
|
Atlanta |
|
716 |
|
5.1% |
|
447 |
|
3.9% |
|
4.6% |
|
|
42 |
|
3.0% |
|
1,205 |
|
4.6% |
|
Tampa |
|
525 |
|
3.0% |
|
333 |
|
1.7% |
|
2.5% |
|
|
18 |
|
3.0% |
|
876 |
|
2.5% |
|
Miami |
|
607 |
|
3.5% |
|
227 |
|
2.4% |
|
3.2% |
|
|
50 |
|
3.0% |
|
884 |
|
3.2% |
|
Southern California |
|
431 |
|
5.5% |
|
180 |
|
6.6% |
|
5.8% |
|
|
11 |
|
3.0% |
|
622 |
|
5.8% |
|
Houston |
|
332 |
|
4.0% |
|
229 |
|
-4.4% |
|
0.5% |
|
|
20 |
|
3.0% |
|
581 |
|
0.7% |
|
Dallas |
|
229 |
|
5.2% |
|
158 |
|
1.2% |
|
3.5% |
|
|
20 |
|
3.0% |
|
407 |
|
3.5% |
|
Denver |
|
216 |
|
7.1% |
|
160 |
|
3.8% |
|
5.7% |
|
|
9 |
|
3.0% |
|
385 |
|
5.6% |
|
Orlando |
|
302 |
|
4.2% |
|
188 |
|
3.0% |
|
3.7% |
|
|
10 |
|
3.0% |
|
500 |
|
3.7% |
|
Las Vegas |
|
254 |
|
4.8% |
|
140 |
|
4.2% |
|
4.6% |
|
|
1 |
|
3.0% |
|
395 |
|
4.6% |
|
Phoenix |
|
220 |
|
7.1% |
|
112 |
|
9.7% |
|
7.9% |
|
|
10 |
|
3.0% |
|
342 |
|
7.8% |
|
Charlotte-Raleigh |
|
79 |
|
3.9% |
|
58 |
|
1.2% |
|
2.7% |
|
|
- |
|
- |
|
137 |
|
2.7% |
|
Northern California |
|
119 |
|
8.4% |
|
31 |
|
13.3% |
|
9.4% |
|
|
4 |
|
3.0% |
|
154 |
|
9.2% |
|
Chicago |
|
66 |
|
4.2% |
|
51 |
|
1.3% |
|
2.9% |
|
|
6 |
|
3.0% |
|
123 |
|
2.9% |
|
Nashville |
|
9 |
|
4.4% |
|
6 |
|
-5.4% |
|
0.0% |
|
|
- |
|
- |
|
15 |
|
0.5% |
|
Other Markets |
|
9 |
|
4.0% |
|
- |
|
- |
|
4.0% |
|
|
- |
|
- |
|
9 |
|
4.0% |
|
Total |
|
4,114 |
|
4.7% |
|
2,320 |
|
2.8% |
|
4.0% |
|
|
201 |
|
3.0% |
|
6,635 |
|
4.0% |
|
|
|
|
|
|
|
|
|
|
|
|
|
|
|
|
|
|
|
|
|
Please see the Appendix for certain definitions, explanations and reconciliations of non-GAAP financial measures. All information is as of March 31, 2017 unless otherwise indicated.
|
|
(1) Represents average rent growth on the population of escalating multi-year leases taking effect for the three months ended March 31, 2017, defined as average of the percentage change in rental rate for all multi-year leases in the period. (2) Represents weighted average rent growth on all replacement, renewal and escalating multi-year leases for the three months ended March 31, 2017. |
26 |
Same Home Quarterly Trending Operational Results
|
|
|
|
1Q16 |
|
|
2Q16 |
|
|
3Q16 |
|
|
4Q16 |
|
|
1Q17 |
|
|||||
|
Occupancy |
|
95.5 |
% |
|
|
95.6 |
% |
|
|
95.5 |
% |
|
|
95.7 |
% |
|
|
96.1 |
% |
|
Turnover Rate |
|
7.2 |
% |
|
|
9.7 |
% |
|
|
10.2 |
% |
|
|
7.4 |
% |
|
|
7.9 |
% |
|
Year-to-Date Annualized Turnover Rate |
|
29.0 |
% |
|
|
33.9 |
% |
|
|
36.2 |
% |
|
|
34.6 |
% |
|
|
31.7 |
% |
|
Renewal Rate |
|
54.7 |
% |
|
|
59.6 |
% |
|
|
62.0 |
% |
|
|
64.9 |
% |
|
|
67.3 |
% |
|
Retention Rate |
|
71.5 |
% |
|
|
69.7 |
% |
|
|
69.1 |
% |
|
|
72.6 |
% |
|
|
74.3 |
% |
|
Renewal Rent Growth |
|
4.8 |
% |
|
|
5.1 |
% |
|
|
5.4 |
% |
|
|
4.8 |
% |
|
|
4.7 |
% |
|
Replacement Rent Growth |
|
2.2 |
% |
|
|
5.5 |
% |
|
|
4.6 |
% |
|
|
1.7 |
% |
|
|
2.8 |
% |
|
Blended Rent Growth |
|
3.7 |
% |
|
|
5.3 |
% |
|
|
5.0 |
% |
|
|
3.5 |
% |
|
|
4.0 |
% |
Please see the Appendix for certain definitions, explanations and reconciliations of non-GAAP financial measures. All information is as of March 31, 2017 unless otherwise indicated.
|
|
|
27 |
Cost to Maintain a Home
|
|
Dollars in thousands, except per home amounts
|
|
|
Three Months Ended March 31, |
||
|
|
|
2017 |
||
|
|
|
Total Cost |
|
Cost per Home |
|
R&M and turnover expenses (1) |
|
|
|
|
|
Repairs and maintenance |
|
$ 4,631 |
|
$ 161 |
|
Turnover-related costs |
|
2,925 |
|
102 |
|
Landscaping and pool services |
|
205 |
|
7 |
|
Total R&M and turnover expenses |
|
$ 7,761 |
|
$ 270 |
|
|
|
|
|
|
|
Recurring capital expenditures (2)(3) |
|
|
|
|
|
Capital replacements |
|
$ 6,485 |
|
$ 226 |
|
Turnover-related capital costs |
|
3,185 |
|
111 |
|
Total recurring capital expenditures |
|
$ 9,670 |
|
$ 337 |
|
|
|
|
|
|
|
Total R&M and recurring capital expenditures |
|
$ 17,431 |
|
$ 607 |
|
|
|
|
|
|
|
Revenue enhancing capital expenditures (4) |
|
|
|
|
|
Total Revenue Enhancing Capital Expenditures |
|
$ 630 |
|
$ 22 |
|
|
|
|
|
|
|
Same Home Count |
|
|
|
28,732 |
Please see the Appendix for certain definitions, explanations and reconciliations of non-GAAP financial measures. All information is as of March 31, 2017 unless otherwise indicated.
|
|
(1) Amounts shown are net of gross tenant chargebacks. Some tenant chargebacks may present collection risk if tenant security deposits are insufficient. (2) Excludes initial renovation and redevelopment expenditures. (3) Replacements and expenditures necessary to preserve and maintain the value and functionality of the home and its systems. (4) Includes capital improvements and additions intended to increase the revenue potential for a given property, which we track separately from recurring capital expenditures. |
28 |
 V. Earnings Guidance
|
|
|
29 |
2017 Guidance
|
|
|
|
Full-Year Guidance (1) (2) |
|
Core FFO/Share |
$1.85 - $1.95 |
|
Same Home Revenue Growth (3) |
4 – 5% |
|
Same Home Expense Growth (3) |
2 – 3% |
|
Same Home Core NOI Margin |
63 – 65% |
|
Same Home Occupancy |
95 – 96% |
|
Same Home Turnover |
34 – 36% |
The Company does not provide forward-looking guidance for certain financial measures on a GAAP basis because it is unable to reasonably predict certain items contained in the GAAP measures, including one-time and infrequent items that are not indicative of the Company’s ongoing operations. Such items include, but are not limited to, discontinued operations, share-based compensation and other items not reflective of the Company's ongoing operations.
|
|
(1) Please refer to the Forward Looking Statement disclosure. (2) This outlook is based on a number of assumptions, many of which are outside of the Colony Starwood Homes’ control, and all of which are subject to change. This outlook reflects Colony Starwood Homes’ expectations on (a) existing investments and (b) yield on incremental investments inclusive of Colony Starwood Homes’ existing pipeline. All guidance is based on current expectations of future economic conditions and the judgment of the Colony Starwood Homes’ management team. (3) Growth rates presented exclude the impact of resident utility billing revenue and associated utility chargeback expenses as a result of the CSH utility chargeback transition beginning in Q3 2016, whereby water, sewer and trash services are held in the Company’s name during resident occupancy and subsequently billed back to the resident. |
30 |
 Appendix
|
|
|
31 |
Appendix A: Definitions
|
|
Annualized Turnover Rate. Calculated by dividing a) the number of homes that become unoccupied during a period of time by b) the number of homes that had completed initial renovation/rehabilitation and were leasable during the specified period, expressed as an annualized percentage by multiplying the period of measurement to reach a 12-month period (e.g., multiplying a three-month turnover measurement by four). Management believes this operational measure is useful in understanding resident satisfaction, pricing effectiveness and assessing associated property repairs and maintenance expenses.
Asset Management Fee. Represents contractual revenue earned related to the property management of the Fannie Mae JV and Waypoint Real Estate Group properties.
Average Acquisition Cost per Home. Calculated by dividing a) the total acquisition cost for each home in an identified population (such acquisition costs including purchase price and closing costs, but excluding renovation/rehabilitation costs incurred prior to leasing) by b) the number of homes in the respective population. Total acquisition cost for assets owned by SWAY prior to the Merger includes the purchase accounting fair market value step-up applied to those assets as of the close of Merger on January 5, 2016.
Average Investment. Calculated by dividing the sum of a) the total acquisition cost for each home in an identified population b) all property related capitalized expenditures incurred in the renovation/rehabilitation of a property prior to leasing by c) the number of homes in the respective population. Total acquisition cost for assets owned by SWAY prior to the Merger includes the purchase accounting fair market value step-up applied to those assets as of the close of Merger on January 5, 2016.
Average Monthly Rent per Occupied Home. Calculated by dividing a) the aggregate monthly contractual cash rent (excluding rent concessions and incentives) for an identified population of occupied rental units by b) the number of rental units in the identified population. To date, rent concessions and incentives have been utilized on a limited basis and have not had a significant impact on the CSH portfolio’s average monthly rent.
Blended Rent Growth. Represents the weighted average rent growth on all new leases (replacement leases) and renewals during a measured period, and is calculated by dividing a) the aggregate contractual first month rent on all new leases and lease renewals executed during the applicable period for an identified population of occupied rental units by b) the aggregate contractual last month rent for such identified population of rental units before renewal or new lease. This calculation does not include lease escalations / step-ups for multi-year leases.
Core AFFO. Core AFFO, or core adjusted funds from operations, is a non-GAAP financial measure that we believe assists investors in assessing the results of CSH’s single-family rental business as it allows investors to compare our operating performance to prior reporting periods without the effect of certain items that, by nature, are not comparable from period to period. Core AFFO adjusts Core FFO (defined below) to eliminate the impact of Recurring Capital Expenditures and capitalized leasing costs incurred during the period. Core AFFO and Core AFFO per share are not a substitute for net income (loss) per share or net cash flow provided by operating activities, as determined in accordance with GAAP, as a measure of our operating performance, liquidity or ability to pay dividends as they exclude certain items that require cash settlements in the periods presented. These metrics also are not necessarily indicative of cash available to fund future cash needs. Because other REITs may not compute these measures in the same manner, they may not be comparable among REITs.
|
|
|
32 |
Appendix A: Definitions
|
|
Core FFO. Core FFO is a non-GAAP financial measure of operating performance that we believe assists investors in assessing the results of CSH’s single-family rental business, which is our core operating business as it allows investors to compare our operating performance to prior reporting periods without the effect of certain items that, by nature, are not comparable from period to period. Core FFO adjusts NAREIT FFO (defined below) to eliminate the impact of certain items that CSH believes are not indicative of our core operating performance. Our Core FFO begins with NAREIT FFO and is adjusted for amortization of deferred financing costs, debt premium discounts, share-based compensation, loss on derivative financial instruments, amortization of derivative financial instruments, non-cash interest expense and loss on extinguishment of debt. Core FFO and Core FFO per share does not represent cash generated from operating activities determined in accordance with GAAP, and is not necessarily indicative of cash available to fund cash needs and should not be considered as an alternative to net income (determined in accordance with GAAP) as a performance measure. Because other REITs may not compute these measures in the same manner, they may not be comparable among REITs.
Core Net Operating Income or Core NOI. CSH calculates Core NOI by subtracting Core Property Operating Expenses from Core Rental Revenue, as defined, which eliminates (a) revenues and expenses that CSH believes are not directly related to the operating performance of the homes themselves and (b) GAAP presentations of resident chargeback fees and bad debt expense to provide a clearer presentation of rental and fee income streams as well as associated expenses. Please refer to the definition of NOI below for an explanation of how that measure is calculated separate from Core NOI. Core NOI is a non-GAAP measure of operating performance that CSH believes assists investors in assessing the performance of our portfolio of single-family homes, which is our core operating business. Please see Appendix B for a reconciliation of net income (loss) to Core NOI.
The Core NOI measures included in this presentation should not be considered alternatives to net loss or net cash flows from operating activities, as determined in accordance with GAAP, as indications of CSH’s performance or as measures of liquidity. Although CSH uses these non-GAAP measures for comparability in assessing their performance against other REITs, not all REITs compute the same non-GAAP measures. Accordingly, there can be no assurance that our basis for computing these non-GAAP measures are comparable with that of other REITs.
Core Property Operating Expenses. Calculated by adjusting operating costs for the properties in the relevant sample by eliminating the impact of resident chargebacks/resident utility reimbursements and bad debt expense.
Core Rental Revenue. Calculated by rental and fee income for the properties in the relevant sample adjusted to eliminate the impact of bad debt expense.
Development Homes. Homes that a) are awaiting initial rehabilitation, b) are currently undergoing initial rehabilitation, or c) have completed initial rehabilitation but have not yet experienced initial occupancy.
Integration Costs. Costs and charges incurred during the integration of the Starwood Waypoint Residential Trust and Colony American Homes operations during the fiscal year 2016 that are not reflective of our core operating performance and that we do not expect to incur subsequent to the completion of the Merger integration, but which do not qualify for Merger and transaction-related expenses under GAAP. The majority of Integration Costs consist of base salaries, benefits, and payroll taxes of employees separated or scheduled for separation as a result of the Merger.
Merger and Transaction-Related Expenses. Direct costs incurred as a result of the Merger closing or costs required to ensure the Merger was completed successfully. These costs include legal fees, advisory services (accounting, tax, and entity filings), success fees, employee retention plans and severance costs, and property tax / transfer costs.
|
|
|
33 |
Appendix A: Definitions
|
|
NAREIT FFO. Funds from operations is defined by the National Association of Real Estate Investment Trusts (“NAREIT”) as net income or loss (in accordance with GAAP) excluding gains or losses from sale of previously depreciated real estate assets, plus depreciation and amortization of real estate assets, impairment of real estate assets, discontinued operations and adjustments for unconsolidated partnerships and joint ventures. Consistent with real estate industry and investment community preferences, we use NAREIT FFO as a supplemental measure of operating performance for a REIT. We consider NAREIT FFO useful to investors as a complement to GAAP measures because it facilitates an understanding of the operating performance of the Company’s properties. NAREIT FFO does not give effect to real estate depreciation and amortization since these amounts are computed to allocate the cost of a property over its useful life. Since values for well-maintained real estate assets have historically increased or decreased based upon prevailing market conditions, the Company believes that NAREIT FFO provides investors with a clearer view of the Company’s operating performance.
Net Operating Income or NOI. CSH defines NOI as rental and other property revenues less property operating expenses. CSH has presented NOI for Same Home Homes as CSH believes this NOI measure to be an appropriate supplemental measure of operating performance to net income attributable to common shareholders because it reflects the operating performance of our homes without allocation of corporate level overhead or general and administrative costs and reflects the operations of our business. Refer to the table below for a reconciliation of net loss attributable to common shareholders to NOI. Please refer to the definition of Core NOI above for an explanation of how that measure is calculated separate from NOI, and see Appendix B for a reconciliation of net income (loss) to NOI.
These NOI measures included in this presentation should not be considered alternatives to net loss or net cash flows from operating activities, as determined in accordance with GAAP, as indications of CSH’s performance or as measures of liquidity. Although CSH uses these non-GAAP measures for comparability in assessing their performance against other REITs, not all REITs compute the same non-GAAP measures. Accordingly, there can be no assurance that CSH’s basis for computing these non-GAAP measures is comparable with that of other REITs.
Non-Owned, Managed Homes. Colony Starwood Homes currently provides its property and asset management services to third parties and/or joint venture partners as a fee service. The non-owned properties are all managed within the same platform from which Colony Starwood Homes services its Owned Homes.
Occupancy %. Represents the percentage of an identified rental unit population that is occupied as of the measurement period and is calculated by dividing a) the number of occupied units as of the last day of the measurement period by b) the number of rental units in the identified population of rental units (Same Home, Owned Homes, etc.).
Other Homes. Includes 274 Owned Homes as of March 31, 2017 that were not intended to be held for the long-term and not in service and 318 non-stabilized homes. The 592 Other Homes excludes the 204 REO homes held as of March 31, 2017.
Owned Homes. Represents wholly-owned single-family rental properties, and is measured by the number of total rental units. This takes into account investments in multi-unit properties which Management believes provides a more meaningful measure to investors. Owned Homes excludes the 204 REO homes held as of March 31, 2017.
|
|
|
34 |
Appendix A: Definitions
|
|
Recurring Capital Expenditures or Recurring Capex. General replacements and expenditures required to preserve and maintain the value and functionality of a home and its systems as a single-family rental.
Renewal Rate. Calculated by dividing a) the number of renewed residents with current period lease expirations by b) the total lease expirations during the period.
Renewal Rent Growth. Represents the percentage change in monthly contractual rent resulting from all lease renewals that became effective during a measurement period for an identified population of rental units, and is calculated by dividing a) the aggregate contractual first month rent (excluding rent concessions and incentives) on lease renewals executed during the applicable measurement period for an identified population of rental units by b) the aggregate contractual last month rent for such identified population of rental units before renewal. To date, rent concessions and incentives have been used on a limited basis and have not had a significant impact on contractual rent.
Replacement Rent Growth. Represents the percentage change in monthly contractual rent resulting from new leases on properties previously leased to different residents during a measurement period for an identified population of rental units and is calculated by dividing a) the aggregate contractual first month rent (excluding rent concessions and incentives) on new leases signed during the applicable measurement period for an identified population of occupied rental units by b) the aggregate contractual last month rent for such identified population of rental units under the prior lease on such properties. To date, rent concessions and incentives have been used on a limited basis and have not had a significant impact on contractual rent.
Retention Rate. Calculated by dividing a) the number of retained residents with current period lease expirations by b) the total lease expirations during the period.
Revenue Enhancing Capital Expenditures or Revenue Enhancing Capex. Capital improvements and additions intended to increase the revenue potential for a given property.
Same Homes. Homes which have been stabilized for at least fifteen (15) months prior to the start of the current measurement period, excluding any homes that have been disposed of, removed from service or returned to the development period for significant renovation.
Stabilized Homes. Homes that are currently occupied or have been previously leased and occupied that do not meet the criteria to be a Same Store Home. For the three months ended March 31, 2017 the Stabilized Home count excludes 274 homes not intended to be held for the long term.
Total Homes. Represents all homes Colony Starwood Homes manages. Includes both Owned Homes and Non-Owned, Managed Homes.
Total Rent Growth. Represents the weighted average rent growth on replacement rents, renewals, and escalating multi-year leases for the period.
Weighted Average Home Age (years). Rounded number of years between when a home was built and the last day of the current measurement period with each market being weighted by its area asset count.
|
|
|
35 |
Appendix B: Reconciliations
|
|
|
(Dollars in thousands) |
|
|
|
|
|
|
|
|
Three months ended March 31, 2017 |
|
||
|
Reconciliation of net loss to NOI |
|
Same Store Homes |
|
Stabilized Homes (2) |
|
|
|
|
|
|
|
|
|
Net loss attributable to Starwood Waypoint Residential Trust shareholders |
|
$ (11,342) |
|
$ (11,342) |
|
|
|
|
|
|
|
|
|
Add (deduct) adjustments to get to total NOI |
|
|
|
|
|
|
Gain (Loss) from discontinued operations (NPL/REO) |
|
46 |
|
46 |
|
|
General and administrative |
|
10,840 |
|
10,840 |
|
|
Share-based compensation |
|
1,561 |
|
1,561 |
|
|
Interest expense |
|
38,999 |
|
38,999 |
|
|
Depreciation and amortization |
|
46,185 |
|
46,185 |
|
|
Impairment of real estate |
|
443 |
|
443 |
|
|
Realized (gain) loss on sales of investments in real estate, net |
|
(678) |
|
(678) |
|
|
Equity in income from unconsolidated joint ventures |
|
(180) |
|
(180) |
|
|
Other (expense) income, net |
|
8,792 |
|
8,792 |
|
|
Income tax expense |
|
157 |
|
157 |
|
|
Net income attributable to non-controlling interests |
|
(678) |
|
(678) |
|
|
Total NOI |
|
$ 94,145 |
|
$ 94,145 |
|
|
Add (deduct) adjustments to get to total portfolio NOI |
|
|
|
|
|
|
Non-portfolio NOI components: |
|
|
|
|
|
|
Property operating revenues on non-portfolio homes (1) |
|
(13,629) |
|
(3,283) |
|
|
Property operating expenses on non-portfolio homes (1) |
|
6,204 |
|
2,656 |
|
|
Total Non-portfolio NOI |
|
$ (7,425) |
|
$ (627) |
|
|
|
|
|
|
|
|
|
Total NOI |
|
$ 86,720 |
|
$ 93,518 |
|
|
|
|
|
|
|
|
|
Calculation portfolio Core NOI margin: |
|
|
|
|
|
|
Rental income |
|
$ 130,926 |
|
$ 140,686 |
|
|
Fee income |
|
3,437 |
|
3,795 |
|
|
Less bad debt expense |
|
(1,862) |
|
(1,972) |
|
|
Total rental revenues |
|
$ 132,501 |
|
$ 142,509 |
|
|
Core NOI margin |
|
65.4% |
|
65.6% |
|
|
|
|
|
|
|
|
|
(1) See NOI Segment page |
|
|
|
|
|
|
(2) Stabilized is the summation of Same Store Homes plus Stabilized Homes as defined in Appendix A. |
|
||||
|
|
|
36 |
Appendix B: Reconciliations
|
|
|
in (000)s |
Three Months Ended March 31, |
|
|
|||||
|
|
2017 |
|
|
2016 |
|
|
||
|
Net income/(loss) from continuing operations |
$ |
(11,974 |
) |
|
$ |
(36,548 |
) |
|
|
(+) Interest expense |
|
38,999 |
|
|
|
37,457 |
|
|
|
(+) Depreciation and amortization |
|
46,185 |
|
|
|
43,630 |
|
|
|
(+) Income tax expense |
|
157 |
|
|
|
245 |
|
|
|
EBITDA |
$ |
73,367 |
|
|
$ |
44,784 |
|
|
|
(+) Non cash compensation |
|
1,561 |
|
|
|
387 |
|
|
|
(-) Gain on sale of real estate |
|
(678 |
) |
|
|
(1,384 |
) |
|
|
(+) Impairment of real estate assets |
|
443 |
|
|
|
30 |
|
|
|
(+) Integration costs |
|
- |
|
|
|
5,630 |
|
|
|
(+) Merger and transaction-related |
|
- |
|
|
|
23,482 |
|
|
|
(+) Loss on extinguishment of debt |
|
7,153 |
|
|
|
- |
|
|
|
Adjusted EBITDA |
$ |
81,846 |
|
|
$ |
72,929 |
|
|
Other Assets:
|
in (000)s |
|
|
|
|
Description |
March 31, 2017 |
|
|
|
Hedge contract |
$ |
30,298 |
|
|
Prepaids |
|
17,611 |
|
|
Accounts receivable, net of allowance |
|
7,638 |
|
|
Deferred leasing costs and lease intangibles, net |
|
4,274 |
|
|
Furniture, fixture, and equipment |
|
3,368 |
|
|
Deferred finance costs, net |
|
3,308 |
|
|
Deposits |
|
1,641 |
|
|
Other |
|
3,166 |
|
|
Total |
$ |
71,304 |
|
|
|
|
|
|
|
|
|
37 |
Appendix B: Reconciliations
|
|
|
|
Three Months Ended |
|
|
|
Description |
March 31, 2017 |
|
|
|
Weighted-average shares - basic |
|
104,593,904 |
|
|
Incremental shares from RSUs |
|
155,214 |
|
|
OP units |
|
6,272,829 |
|
|
Total |
|
111,021,947 |
|
|
|
|
38 |