UNITED STATES SECURITIES AND EXCHANGE COMMISSION
Washington, D.C. 20549
FORM 10-K
(Mark one)
[X] ANNUAL REPORT PURSUANT TO SECTION 13 OR 15(d)
OF THE SECURITIES EXCHANGE ACT OF 1934
For the fiscal year ended December 31, 2015
OR
[ ] TRANSITION REPORT PURSUANT TO SECTION 13 OR
15(d) OF THE SECURITIES EXCHANGE ACT OF 1934
For the transition period from _______________ to _______________
Commission File Number 001-35914
MURPHY USA INC.
(Exact name of registrant as specified in its charter)
Delaware | 46-2279221 |
(State or other jurisdiction of | (I.R.S. Employer |
incorporation or organization) | Identification No.) |
200 Peach Street | |
El Dorado, Arkansas | 71730-5836 |
(Address of principal executive offices) | (Zip Code) |
(870) 875-7600
(Registrant's telephone number, including area code)
Securities registered pursuant to Section 12(b) of the Act:
Title of each class | Name of each exchange on which registered |
Common Stock, $0.01 Par Value | New York Stock Exchange |
Securities registered pursuant to Section 12(g) of the Act:
None
Indicate by check mark if the registrant is a well-known seasoned issuer, as defined in Rule 405 of the Securities Act. þ Yes __ No
Indicate by check mark if the registrant is not required to file reports pursuant to Section 13 or Section 15(d) of the Act. __Yes þ No
Indicate by check mark whether the registrant (1) has filed all reports required to be filed by Section 13 or 15(d) of the Securities Exchange Act of 1934 during the preceding 12 months (or for such shorter period that the registrant was required to file such reports), and (2) has been subject to such filing requirements for the past 90 days. þ Yes __ No
Indicate by check mark whether the registrant has submitted electronically and posted on its corporate Web site, if any, every Interactive Data File required to be submitted and posted pursuant to Rule 405 of Regulation S-T (§232.405 of this chapter) during the preceding 12 months (or for such shorter period that the registrant was required to submit and post such files). þ Yes __ No
Indicate by check mark if disclosure of delinquent filers pursuant to Item 405 of Regulation S-K (229.405 of this chapter) is not contained herein, and will not be contained, to the best of registrant’s knowledge, in definitive proxy or information statements incorporated by reference in Part III of this Form 10-K or any amendment to this Form 10-K ______
Indicate by check mark whether the registrant is a large accelerated filer, an accelerated filer, a non-accelerated filer, or a smaller reporting company. See the definitions of “large accelerated filer,” “accelerated filer” and “smaller reporting company” in Rule 12b-2 of the Exchange act.
Large accelerated filer þ Accelerated filer _ Non-accelerated filer ___ Smaller reporting company ___
Indicate by check mark whether the registrant is a shell company (as defined in Rule 12b-2 of the Exchange Act).
__ Yes þ No
The aggregate market value of the voting and non-voting common equity held by non-affiliates computed by reference to the price at which the common equity was last sold, or the average bid and asked price of such common equity, as of the last business day of the registrant’s most recently completed second fiscal quarter (as of June 30, 2015), based on the closing price on that date of $55.82 was $2,391,694,000.
Number of shares of Common Stock, $0.01 par value, outstanding at January 31, 2016 was 41,678,873.
Documents incorporated by reference:
Portions of the Registrant’s definitive Proxy Statement relating to the Annual Meeting of Stockholders on May 5, 2016 will be incorporated by reference in Part III herein.
MURPHY USA INC. |
TABLE OF CONTENTS – 2015 Form 10-K |
Page | |
2 | ||
11 | ||
23 | ||
23 | ||
23 | ||
23 | ||
24 | ||
25 | ||
27 | ||
28 | ||
42 | ||
43 | ||
43 | ||
43 | ||
43 | ||
44 | ||
44 | ||
44 | ||
44 | ||
44 | ||
45 | ||
48 | ||
1
Part I
Item 1. BUSINESS
Our business consists primarily of the marketing of retail motor fuel products and convenience merchandise through a large chain of 1,335 (as of December 31, 2015) retail stores operated by us, almost all of which are in close proximity to Walmart stores. Our retail stores are located in 24 states, primarily in the Southwest, Southeast and Midwest United States. Of these stores, 1,111 are branded Murphy USA and 224 are standalone Murphy Express locations (as of December 31, 2015). Our retail stores under the brand name Murphy USA® participate in the Walmart discount program that we offer at most locations. The Walmart discount program offers a cents-off per gallon purchased for fuel when using specific payment methods as decided by Walmart and us. The amount of the discount offered can vary based on many factors, including state laws. Our Murphy Express branded stores are not connected to the Walmart discount program but are otherwise similar to the Murphy USA sites, including the types of fuel and merchandise offerings available to our customers.
Our business also includes certain product supply and wholesale assets, including product distribution terminals and pipeline positions. As an independent publicly traded company, we are a low-price, high volume fuel retailer selling convenience merchandise through low cost kiosks and small store formats with key strategic relationships and experienced management.
Murphy USA Inc. (Murphy USA) was incorporated in Delaware on March 1, 2013 and holds, through its subsidiaries, the U.S. retail marketing business that was separated (the “Separation”) from its former parent company, Murphy Oil Corporation (“Murphy Oil”), plus other assets and liabilities of Murphy Oil that supported the activities of the U.S. retail marketing operations. The Separation was approved by the Murphy Oil board of directors on August 7, 2013, and was completed on August 30, 2013 through the distribution of 100% of the outstanding capital stock of Murphy USA to holders of Murphy Oil common stock on the record date of August 21, 2013. The Separation was completed in accordance with a separation and distribution agreement (the “Separation and Distribution Agreement”) entered into between Murphy Oil and Murphy USA. Murphy Oil retains no ownership interest in Murphy USA.
Our business is subject to various risks. For a description of these risks, see “Risk Factors” and “Management’s Discussion and Analysis of Financial Condition and Results of Operations” included elsewhere in this Form 10-K.
Information about our operations, properties and business segments, including revenues by class of products and financial information by geographic area, are provided on pages 28 through 41, F-15, and F-30 to F-31 of this Annual Report on Form 10-K.
Our Competitive Strengths
Our business foundation is built around five reinforcing strengths which we believe provide us a competitive advantage over our peers. These strengths support our Company vision which is to “Deliver every day the quickest, most friendly service and a low price value proposition to our growing customer base for the products and markets we serve.”
Strategic and complementary relationship with Walmart
Of our network of 1,335 retail gasoline stores (as of December 31, 2015), more than 1,100 are situated on prime locations located near Walmart stores. We believe our proximity to Walmart stores generates significant traffic to our existing retail stores while our competitively priced gasoline and convenience offerings appeal to our shared customers. We continue to collaborate with Walmart on a fuel discount program which we believe enhances the customer value proposition as well as the competitive position of both Murphy USA and Walmart. In addition, we have a real estate development team that purchases and leases land from third parties near Walmart Supercenters when Walmart development is not feasible. If land near a Walmart Supercenter is not a viable option, other nearby locations are considered if it is thought that traffic counts support our low-cost, high-volume model.
2
Winning proposition with value-conscious consumers
Our competitively priced fuel is a compelling offering for value-conscious consumers. Despite a flat long-term outlook in overall gasoline demand (vehicle miles traveled in a normal economy essentially offsetting increased fuel efficiency), we believe value-conscious consumers represent a growing demand segment. In combination with our high traffic locations, our competitive gasoline prices drive high fuel volumes and gross profit. In addition, we are an industry leader in per-site tobacco sales with our low-priced tobacco products and in total store sales per square foot as we also sell a growing assortment of single-serve/immediate consumption items that complement Walmart’s larger take home product offering. We continue to provide value opportunities to our customers such as our popular cross promotions with soft drink, candy/snack and tobacco partners that offer a fuel discount if certain quantities of products are purchased.
Low cost retail operating model
We operate our retail gasoline stores with a strong emphasis on fuel sales complemented by a focused convenience offering that allows for a smaller store footprint than most of our competitors. A substantial majority of our new stores are standardized 1,200 square foot small store formats, which we believe have very low capital expenditure, maintenance and utility requirements relative to our competitors; we also develop standardized 208 square feet kiosks with external supercoolers when the available land or economics do not support the small store format. In addition, many of our stores require only one or two attendants to be present during business hours and the majority of our stores are located on Company-owned property and do not incur any rent expense. The combination of a focused convenience offering and standardized smaller footprint stores allows us to achieve lower overhead costs and on-site costs compared to competitors with a larger store format. According to the 2014 National Association of Convenience Stores’ State of the Industry Survey, we operate at approximately 59% of the average monthly operating costs for top quartile performing stores in the industry. In addition, we operate among the highest industry safety standards and had a Total Recordable Incident Rate (TRIR) and Days Away from Work (DAW) rate that was substantially lower than the industry averages in 2014 using the most current published data by the Bureau of Labor Statistics. Our low cost operating model translates into a low cash fuel breakeven requirement that allows us to weather extended periods of low fuel margins.
Distinctive fuel supply chain capabilities
We source fuel at very competitive industry benchmark prices due to the diversity of fuel options available to us in the bulk and rack product markets, our shipper’s status on major pipeline systems, and our access to numerous terminal locations. In addition, we have a strong distribution system in which we analyze intra-day supply options and dispatch third-party tanker trucks to the most favorably priced terminal to load products for each Murphy site, further reducing our fuel product costs. By participating in the broader fuel supply chain, we believe our business model provides additional upside exposure to opportunities to enhance margins and volume. For example, incremental revenue is generated by capturing and selling Renewable Identification Numbers (RINs) via our capability to source bulk fuel and subsequently blend ethanol and bio-diesel at the terminal level. We can also optimize the supply chain by shifting non-contractual wholesale volumes to protect retail fuel supply. These activities demonstrate our belief that participating in the broader fuel supply chain provides us with added flexibility to ensure reliable low-cost fuel supply in various market conditions especially during periods of significant price volatility. It would take substantial time and investment, both in expertise and assets, for a competitor to try and replicate our existing position and we believe this continues to be a significant barrier to any attempt to emulate our business model.
Resilient financial profile and engaged team
Our predominantly fee-simple asset base, ability to generate attractive gross margins through our low-price, high volume strategy, and our low overhead costs should help us endure prolonged periods of unfavorable commodity price movements and compressed fuel margins. We also believe our conservative financial structure further protects us from the inherently volatile fuel environment. In connection with the Separation, we entered into a new credit facility and issued $500 million aggregate principal amount of 6% senior unsecured notes due 2023. We expect that our strong cash position and availability under our credit facility will continue to provide us with a significant level of liquidity to help maintain a disciplined capital expenditure program focused on growing ratably through periods of both high and low fuel margins. In addition, we have already completed $300 million of share repurchases in a little more than two years of operation. We also have approximately 9,800 hardworking employees that are actively engaged to serve the customer, whether it is the external retail consumer or their
3
internal co-workers. We believe our sustainable business model and stable organic growth opportunities support an employee value proposition that makes Murphy USA an attractive place to work.
Our Business Strategy
Our business strategy reflects a set of coherent choices that leverage our differentiated strengths and capabilities.
Grow organically
We intend for our independent growth plan to be a key driver of our organic growth over the next several years. We expect to build at a pace of 60 to 80 sites per year on or near Walmart locations over the next two years, followed by a more moderate rate of unit growth targeting high-return locations in our core market areas complemented by our supply chain capabilities. Nearly 1,100 of our locations currently participate in our fuel discount program with Walmart which reinforces Walmart’s low-price philosophy. Our real estate development team maintains a landbank that supports longer-term, ratable expansion of our network.
Diversify merchandise mix
We plan to continuously evaluate our kiosk strategy in an effort to maximize our site economics and return on investment, such as the installation of super coolers to help drive outside beverage sales. Complementary to that strategy, we are continually refining, and increasingly constructing, our new 1,200 square foot small store format design to create a foundation for increasing higher-margin non-tobacco sales and diversifying our merchandise offerings. For example, we continue to tailor our product offerings to complement the retail selection within Walmart stores, such as offering products in a variety of quantities and sizes, or stock keeping units (SKUs), which are more convenience-oriented. We expect to further expand merchandise revenue and margins through our new supplier relationship with Core-Mark, in addition to optimizing our promotional analytics and workforce planning capabilities, in order to help boost overall site returns.
Sustain cost leadership position
We believe that sustaining our low cost position is a strategic advantage as a retailer of commodity products. We are undertaking several initiatives that have a purpose of increasing efficiency which will ultimately lead to lower costs per retail site. One of our goals is to beat inflation on per-site operating costs to help sustain low site level costs. We also believe that through our planned growth and efficiency initiatives, we can achieve reductions in overhead costs to support an overall improvement in site returns and keep costs properly scaled as we grow organically. In order to do this successfully, we will focus on the continued development of our employees and foster an operating culture aligned with business performance, including cost leadership.
Create advantage from market volatility
We plan to continue to focus our product supply and wholesale efforts on activities that enhance our ability to be a low-price retail fuel leader and our ability to take advantage of fuel price volatility. We will continue to invest in capabilities and asset positions that support our supply chain strategy. We have sold our non-core assets to maximize value to our shareholders and provide funds, both for continued growth as well as to enhance shareholder returns.
Invest for the long term
We maintain a portfolio of predominantly fee-simple assets and utilize what we believe to be an appropriate debt structure that will allow us to be resilient during times of fuel price and margin volatility. We believe our strong financial position should allow us to profitably execute on our low-cost, high volume retail strategy through periods of both high and low fuel margins while preserving the ability to re-invest in and grow our existing sites, brand image and supporting capabilities. Furthermore, in addition to our site development capital and capability building investments we will continue to consider all alternatives for returning excess earnings or capital with a focus on maximizing shareholder value.
Industry Trends
We operate within the large, growing, competitive and highly fragmented U.S. retail fuel and convenience store industry. We believe we will continue to benefit on a relative basis to competitors from several key industry trends and characteristics, including:
4
• | Sensitivity to gas prices among cost conscious consumers, and increasing customer demand for low-priced fuel; |
• | Highly fragmented nature of the industry providing larger chain operators like Murphy USA with significant scale advantage; and |
• | Increasing consumer traffic around supermarkets and large format hypermarkets, supporting complementary demand at nearby and cross-promoted retail fuel stores. |
Corporate Information
Murphy USA was incorporated in Delaware on March 1, 2013 and our business consists of U.S. retail marketing operations. Our headquarters are located at 200 Peach Street, El Dorado, Arkansas 71730 and our general telephone number is (870) 875-7600. Our Internet website is www.murphyusa.com. Our website and the information contained on that site, or connected to that site, are not incorporated by reference into this Annual Report on Form 10-K. Shares of Murphy USA common stock are traded on the NYSE under the ticker symbol “MUSA”.
Description of Our Business
We market fueling products through a network of Company retail stores and unbranded wholesale customers. During 2015, the Company sold approximately 4.1 billion gallons of motor fuel through our retail outlets. Below is a table that lists the states where we operate Company-owned stores at December 31, 2015 and the number of stores in each state.
State | No. of stores | State | No. of stores | State | No. of stores | |||||
Alabama | 75 | Kansas | 4 | New Mexico | 12 | |||||
Arkansas | 66 | Kentucky | 45 | North Carolina | 85 | |||||
Colorado | 9 | Louisiana | 72 | Ohio | 44 | |||||
Florida | 119 | Michigan | 25 | Oklahoma | 53 | |||||
Georgia | 89 | Minnesota | 8 | South Carolina | 54 | |||||
Iowa | 21 | Missouri | 48 | Tennessee | 91 | |||||
Illinois | 35 | Mississippi | 55 | Texas | 273 | |||||
Indiana | 36 | Nebraska | 2 | Virginia | 14 | |||||
Total | 1,335 | |||||||||
The following table provides a history of our Company-owned station count during the three-year period ended December 31, 2015:
Years Ended December 31, | |||||||||
2015 | 2014 | 2013 | |||||||
Start of period | 1,263 | 1,203 | 1,165 | ||||||
New construction | 73 | 60 | 39 | ||||||
Closed | (1 | ) | — | (1 | ) | ||||
End of period | 1,335 | 1,263 | 1,203 | ||||||
In recent years, we have purchased from Walmart the properties underlying 1,003 of our Company stores. In 2012, we signed an agreement with Walmart which provided for the potential purchase of additional sites. In January 2013, we paid approximately $42 million as a first installment on these land purchases. Our agreement requires us to obtain Walmart’s approval of our development plans and to indemnify Walmart for certain environmental liabilities. In addition, Walmart has the right to terminate the agreement with respect to certain properties located adjacent to Walmart stores if the sale of any such property to us would result in certain claims or liabilities against Walmart or, in Walmart’s sole discretion, would impair the operation of the related Walmart store. To date, the agreement with respect to some of the 2012 sites has been terminated due to various local conditions which would affect development including zoning and permitting restrictions. Some of these terminated sites were replaced with other sites.
5
Each of our owned properties that were purchased from Walmart are also subject to Easements and Covenants with Restrictions Affecting Land (“ECRs”), which impose customary restrictions on the use of such properties, which Walmart has the right to enforce. In addition, pursuant to the ECRs, certain transfers involving these properties are subject to Walmart’s right of first refusal or right of first offer. Also pursuant to the ECRs, we are prohibited from transferring such properties to a competitor of Walmart.
For risks related to our 2012 agreement with Walmart, including the ECRs, see “Risk Factors—Risks Relating to Our Business—Walmart retains certain rights in its agreements with us, which may adversely impact our ability to conduct our business.”
For the remaining fueling stores located on or adjacent to Walmart property that are not owned, we have a master lease agreement that allows us to rent land from Walmart. The master lease agreement contains general terms applicable to all rental sites on Walmart property in the United States. The term of the leases is ten years at each station, with us holding four successive five-year extension options at each site. A majority of the leased sites have over 20 years of term remaining including renewals. The agreement permits Walmart to terminate it in its entirety, or only as to affected sites, at its option under customary circumstances (including in certain events of bankruptcy or insolvency), or if we improperly transfer the rights under the agreements to another party. In addition, the master lease agreement prohibits us from selling all or any portion of a station without first offering to sell all or such portion of the station to Walmart and provides that if Murphy Oil USA, Inc., our wholly-owned and primary operating subsidiary is acquired or becomes a party to any merger or consolidation that results in a material change in management of the stores, Walmart will have the option to purchase the stores at fair market value. As of December 31, 2015 we are currently leasing 103 sites from Walmart.
We also have five Murphy USA sites located near Walmart locations where we pay rent to other landowners.
As of December 31, 2015, we have 174 Murphy Express sites where we own the land and 50 locations where we rent the underlying land.
We have numerous sources for our retail fuel supply, including nearly all of the major and large oil companies operating in the U.S. We purchase fuel from oil companies, independent refiners, and other marketers at rates that fluctuate with market prices and generally are reset daily, and we sell fuel to our customers at prices that we establish daily. All fuel is delivered by the truckload as needed to replenish supply at our Company stores. Our inventories of fuel on site turn approximately once daily. By establishing motor fuel supply relationships with several alternate suppliers for most locations, we believe we are able to effectively create competition for our purchases among various fuel suppliers. We also believe that purchasing arrangements with multiple fuel suppliers may help us avoid product outages during times of motor fuel supply disruptions. At some locations, however, there are limited suppliers for fuel in that market and we may have only one supplier. Our refined products are distributed through a few product distribution terminals that are wholly-owned and operated by us and from numerous terminals owned by others. About half of our wholly-owned terminals are supplied by marine transportation and the rest are supplied by pipeline. We also receive products at terminals owned by others either in exchange for deliveries from our terminals or by outright purchase.
In addition to the motor fuel sold at our Company stores, our stores carry a broad selection of snacks, beverages, tobacco products and non-food merchandise. The merchandise we offer includes our private label products, such as an isotonic drink offered in several flavors and a private label energy drink. In 2015, we purchased more than 85% of our merchandise from a single vendor, McLane Company, Inc., a wholly-owned subsidiary of Berkshire Hathaway, Inc. In late 2015, we signed a new supply agreement with Core-Mark Holding Company, Inc. for five years beginning in late January 2016 and they will deliver over 75% of our store merchandise during the term of this agreement.
A statistical summary of key operating and financial indicators for each of the five years ended December 31, 2015 are reported below.
6
As of December 31, | ||||||||||||||||
2015 | 2014 | 2013 | 2012 | 2011 | ||||||||||||
Branded retail outlets: | ||||||||||||||||
Murphy USA® | 1,111 | 1,056 | 1,021 | 1,015 | 1,003 | |||||||||||
Murphy Express | 224 | 207 | 182 | 150 | 125 | |||||||||||
Total | 1,335 | 1,263 | 1,203 | 1,165 | 1,128 | |||||||||||
Retail marketing: | ||||||||||||||||
Fuel margin per gallon (cpg) (1) | 12.5 | 15.8 | 13.0 | 12.9 | 15.6 | |||||||||||
Gallons sold per store month | 267,910 | 270,415 | 268,458 | 277,001 | 277,715 | |||||||||||
Merchandise sales revenue per store month | $ | 147,726 | 146,823 | 152,549 | 156,429 | 158,144 | ||||||||||
Merchandise margin as a percentage of merchandise sales | 14.4 | % | 14.0 | % | 13.1 | % | 13.5 | % | 12.8 | % | ||||||
(1)Represents net sales prices for fuel less purchased cost of fuel.
Our business is organized into one reporting segment (Marketing). The Marketing segment includes our retail marketing sites and product supply and wholesale assets. Prior to December 2013, we also had an Ethanol segment which consisted of our ethanol production facilities located in Hankinson, North Dakota and in Hereford, Texas. After the Hankinson facility was sold in December 2013, we reassessed our segments and due to not meeting the aggregation criteria, we have included the remainder of the former Ethanol segment in the prior “Corporate” section which has been renamed “Corporate and other assets”. The Hereford ethanol plant was sold in November 2015 and it was removed from the "Corporate and other assets" category and reclassified into Discontinued Operations.
For operating segment information, see Note 21 “Business Segments” in the accompanying audited consolidated and combined financial statements for the three-year period ended December 31, 2015.
Competition
The U.S. petroleum business is highly competitive, particularly with regard to accessing and marketing petroleum and other refined products. We compete with other chains of retail fuel stores for fuel supply and in the retail sale of refined products to end consumers, primarily on the basis of price, but also on the basis of convenience and consumer appeal. In addition, we may also face competition from other retail fueling stores that adopt marketing strategies similar to ours by associating with non-traditional retailers, such as supermarkets, discount club stores and hypermarkets, particularly in the geographic areas in which we operate. We expect that our industry will continue to trend toward this model, resulting in increased competition to us over time. Moreover, because we do not produce or refine any of the petroleum or other refined products that we market, we compete with retail gasoline companies that have ongoing supply relationships with affiliates or former affiliates that manufacture refined products. We also compete with integrated companies that have their own production and/or refining operations that are at times able to offset losses from marketing operations with profits from producing or refining operations, and may be better positioned to withstand periods of depressed retail margins or supply shortages. In addition, we compete with other retail and wholesale gasoline marketing companies that have more extensive retail outlets and greater brand name recognition. Some of our competitors have been in existence longer than we have and have greater financial, marketing and other resources than we do. As a result, these competitors may have a greater ability to bear the economic risks inherent in all phases of our business and may be able to respond better to changes in the economy and new opportunities within the industry.
In addition, the retail gasoline industry in the United States is highly competitive due to ease of entry and constant change in the number and type of retailers offering similar products and services. With respect to merchandise, our retail sites compete with other convenience store chains, independently owned convenience stores, supermarkets, drugstores, discount clubs, gasoline service stations, mass merchants, fast food operations and other similar retail outlets. In recent years, several non-traditional retailers, including supermarkets, discount club stores and mass merchants, have begun to compete directly with retail gasoline sites. These non-traditional gasoline retailers have obtained a significant share of the gasoline market, and their market share is expected to grow, and these retailers may use promotional pricing or discounts, both at the fuel pump and in the convenience store, to encourage in-store merchandise sales and gasoline sales. In addition, some large retailers and
7
supermarkets are adjusting their store layouts and product prices in an attempt to appeal to convenience store customers. Major competitive factors include: location, ease of access, product and service selection, gasoline brands, pricing, customer service, store appearance, cleanliness and safety.
Market Conditions and Seasonality
Market conditions in the oil and gas industry are cyclical and subject to global economic and political events and new and changing governmental regulations. Our operating results are affected by price changes in crude oil, natural gas and refined products, as well as changes in competitive conditions in the markets we serve.
Oil prices, wholesale motor fuel costs, motor fuel sales volumes, motor fuel gross margins and merchandise sales can be subject to seasonal fluctuations. For example, consumer demand for motor fuel typically increases during the summer driving season, and typically falls during the winter months. Therefore, our revenues and/or sales volumes are typically higher in the second and third quarters of our fiscal year. Travel, recreation and construction are typically higher in these months in the geographic areas in which we operate, increasing the demand for motor fuel and merchandise that we sell. A significant change in any of these factors, including a significant decrease in consumer demand (other than typical seasonal variations), could materially affect our motor fuel and merchandise volumes, motor fuel gross profit and overall customer traffic, which in turn could have a material adverse effect on our business, financial condition, results of operations and cash flows.
Trademarks
We sell gasoline primarily under the Murphy USA® and Murphy Express brands, which are trademarks of Murphy Oil. The Trademark License Agreement that we entered into with Murphy Oil in connection with the Separation contained a trademark license granting us the right to continue to use such Murphy Oil-owned trademarks throughout the term of that agreement subject to the terms and conditions therein.
In the highly competitive business in which we operate, our trade names, service marks and trademarks are important to distinguish our products and services from those of our competitors. We are not aware of any facts which would negatively impact our continuing use of any of the above trade names, service marks or trademarks.
IT Systems and Store Automation
All of our Company stores use a standard hardware and software platform for point-of-sale (“POS”) that facilitates item level scanning of merchandise for sales and inventory, and the secure acceptance of all major payment methods – cash, check, credit, debit, fleet and mobile. Our standard approach to large scale and geographically dispersed deployments reduces total IT cost of ownership for the POS and inherently makes the system easier to use, support, and replace. This POS technology strategy reflects close alignment with our growth plan.
The store back office systems run on the same platform as the POS which further leverages economies of scale to keep system costs down. The back office systems are primarily “Intranet” based web applications which are rendered through a standard web browser. These applications are a combination of software as a service (“SaaS”), commercial off the shelf software (“COTS”), and custom software applications developed using modern industry standard tools and methodologies.
Our Company stores use PDI accounting systems to manage fuel and merchandise inventory, place orders, record deposits and transmit sales to the home office. Our Company stores also use COTS workforce management and task management systems for managing store associate labor, schedules, and duties. Sophisticated systems are used to minimize store labor by automating most redundant tasks such as merchandise and fuel pricing on the POS, fuel dispensers, and price signs.
All Company stores are networked to our central servers in the corporate office. Detailed fuel sales transactions and inventory levels are processed and recorded locally, then transmitted to the corporate office each 15 to 30 minutes. The data is then fed into a centralized data warehouse, where it is combined with other sources and used to optimize fuel pricing, streamline fuel inventory management, facilitate loss prevention and optimize supply chain and distribution.
Our corporate services utilize JD Edwards, PDI Enterprise, Hyperion, RightAngle and other enterprise systems for financial reporting, accounts payable, accounts receivable, asset management, credit and risk
8
management and other support functions. These enterprise class systems provide significant flexibility in managing corporate and store operations, as well as scalability for growth.
The on-boarding process for the entire enterprise is performed through a SaaS provider. All paperwork and associated workflow is handled electronically which reduces both store and corporate administrative costs.
We invest in disaster recovery, system backups, redundancy, firewall, remote access security and virus and spam protection to ensure a high level of system security and availability. We have systems, business policies and processes around access controls, password expirations and file retention to ensure a high level of control within our IT network.
Environmental
We are subject to numerous federal, state and local environmental laws, regulations and permit requirements. Such environmental requirements have historically been subject to frequent change and tended to become more stringent over time. While we strive to comply with these environmental requirements, any violation of such requirements can result in litigation, increased costs or the imposition of significant civil and criminal penalties, injunctions or other sanctions. Compliance with these environmental requirements affects our overall cost of business, including capital costs to construct, maintain and upgrade equipment and facilities, and ongoing operating expenditures. We maintain sophisticated leak detection and remote monitoring systems for underground storage tanks at the vast majority of our retail fueling stores and install up-to-date tank, piping, and monitoring systems at our new stores. We operate above ground bulk petroleum tanks at our terminal locations and have upgraded product lines and conduct annual monitoring to help mitigate the risk of potential soil and groundwater contamination. We allocate a portion of our capital expenditure program to comply with environmental laws and regulations, and such capital expenditures are projected to be $2.1 million in 2016.
We could be subject to joint and several as well as strict liability for environmental contamination. Some of our current and former properties have been operated by third-parties whose handling and management of hazardous materials were not under our control, and substantially all of them have or previously had motor fuel or petroleum product storage tanks. Pursuant to certain environmental laws, we could be responsible for remediating contamination relating to such sites, including impacts attributable to prior site occupants or other third parties, and for implementing remedial measures to mitigate the risk of future contamination. We may also have liability for contamination and violations of environmental laws under contractual arrangements with third parties, such as landlords and former owners of our sites, including at our sites in close proximity to Walmart stores. Contamination has been identified at certain of our current and former terminals and retail fueling stores, and we are continuing to conduct investigation and remediation activities in relation to such properties. The discovery of additional contamination or the imposition of further remediation obligations at these or other properties could result in significant costs. In some cases, we may be eligible to receive money from state “leaking petroleum storage tank” trust funds to help fund remediation at certain sites. However, receipt of such payments is subject to stringent eligibility requirements and other limitations that can significantly reduce the availability of such trust fund payments and may delay or increase the duration of associated cleanups. We could also be held responsible for contamination relating to third-party sites to which we or our predecessors have sent hazardous materials for recycling or disposal. We are currently identified as a potentially responsible party in connection with one such disposal site. Any such contamination, leaks from storage tanks or other releases of regulated materials could result in claims against us by governmental authorities and other third parties for fines or penalties, natural resource damages, personal injury and property damage. From time to time, we are subject to legal and administrative proceedings governing the remediation of contamination or spills from current and past operations, including from our terminal operations and leaking petroleum storage tanks.
Consumer demand for our products may be adversely impacted by fuel economy standards as well as greenhouse gas (“GHG”) vehicle emission reduction measures. In 2010, the U.S. Environmental Protection Agency (“EPA”) and the U.S. Department of Transportation’s National Highway Traffic Safety Administration (“NHTSA”) finalized standards raising the required Corporate Average Fuel Economy of the nation’s passenger fleet to approximately 35 miles per gallon by the 2016 model year and imposing the first-ever federal GHG emissions standards on cars and light trucks. In September 2011, the EPA and the NHTSA published first-time standards to reduce GHG emissions and improve fuel efficiency of medium and heavy duty trucks. In October 2012, the EPA and NHTSA published final rules effective December 2012, mandating decreases in passenger vehicle and light-duty truck GHG emissions and increases in fuel economy beginning with the 2017 through 2021 model year vehicles. NHTSA also published at this time non-binding inaugural standards for model year 2022 through 2025 cars and trucks increasing fuel economy to the equivalent of 54.5 miles per gallon by 2025. NHTSA's final standards are
9
forthcoming. The EPA and NHTSA are also required to issue more stringent standards for medium and heavy-duty trucks in 2016. These and any future increases in fuel economy standards or GHG emission reduction requirements could decrease demand for our products.
Air emissions from our facilities are also subject to regulation. For example, certain of our fueling stores may be required to install and maintain vapor recovery systems to control emissions of volatile organic compounds to the air during the vehicle fueling process. Recently proposed changes to requirements concerning ambient air quality standards for ground-level ozone may require additional equipment upgrades and operating controls that could increase our capital and operating expenses. Any future environmental regulatory changes may result in increased compliance costs.
Our business is also subject to increasingly stringent laws and regulations governing the content and characteristics of fuel. For example, the gasoline we sell generally must meet increasingly rigorous sulfur and benzene standards. In addition, renewable fuel standards generally require refiners and gasoline blenders to meet certain volume quotas or obtain representative trading credits for renewable fuels that are established as a percentage of their finished product production. Such fuel requirements and renewable fuel standards may adversely affect our wholesale fuel purchase costs.
Sale of Regulated Products
In certain areas where our retail sites are located, state or local laws limit the hours of operation for the sale of alcoholic beverages and restrict the sale of alcoholic beverages and tobacco products to persons younger than a certain age. State and local regulatory agencies have the authority to approve, revoke, suspend or deny applications for and renewals of permits and licenses relating to the sale of alcoholic beverages, as well as to issue fines to convenience stores for the improper sale of alcoholic beverages and tobacco products. Failure to comply with these laws may result in the loss of necessary licenses and the imposition of fines and penalties on us. Such a loss or imposition could have a material adverse effect on our business, liquidity and results of operations. In many states, retailers of alcoholic beverages have been held responsible for damages caused by intoxicated individuals who purchased alcoholic beverages from them. While the potential exposure for damage claims as a seller of alcoholic beverages and tobacco products is substantial, we have adopted procedures intended to minimize such exposure.
Federally mandated anti-money laundering regulations, specifically the USA PATRIOT Act, which amends the Bank Secrecy Act, dictate the rules and documentation requirements we follow for the sales of certain financial products. In addition, we are subject to random anti-money laundering compliance audits. We have an anti-money laundering compliance program.
We also adhere to the rules governing lottery sales as determined by state lottery commissions in each state in which we make such sales.
Safety
We are subject to the requirements of the federal Occupational Safety and Health Act (“OSHA”) and comparable state statutes that regulate the protection of the health and safety of workers. In addition, the OSHA hazard communication standard requires that certain information be maintained about hazardous materials used or produced in our operations and that this information be provided to employees, state and local government authorities and citizens.
Other Regulatory Matters
Our retail sites are also subject to regulation by federal agencies and to licensing and regulations by state and local health, sanitation, fire and other departments relating to the development and operation of retail sites, including regulations relating to zoning and building requirements and the preparation and sale of food. Difficulties in obtaining or failures to obtain the required licenses or approvals could delay or prevent the development of a new retail site in a particular area.
Our operations are also subject to federal and state laws governing such matters as wage rates, overtime and citizenship requirements. At the federal level, there are proposals under consideration from time to time to increase minimum wage rates and periods of protected leaves. In compliance with U.S. health care reform legislation, we have implemented a “bronze level” offering to our eligible non-exempt field employees. The offering increased labor costs by an immaterial amount in 2015. To date, initial enrollment is lower than projected. We
10
expect that as awareness of the taxpayer non-compliance penalty and related increases in this penalty takes effect, enrollment will increase.
Employees
At December 31, 2015, we had approximately 9,800 employees, including approximately 4,400 full-time employees and 5,400 part-time employees.
Properties
Our headquarters of approximately 120,000 square feet is located at 200 Peach Street, El Dorado, Arkansas. We also own and operate two other office buildings in El Dorado, Arkansas that house a portion of our operations and technology services personnel. We have numerous owned and leased properties for our retail fueling stores as described under “—Description of Our Business,” as well as wholly-owned product distribution terminals.
Website access to SEC Reports
Interested parties may obtain the Company’s public disclosures filed with the Securities and Exchange Commission (SEC), including Form 10-K, Form 10-Q, Form 8-K and other documents, by accessing the Investor Relations section of Murphy USA Inc.’s website at ir.corporate.murphyusa.com.
Our Annual Reports on Form 10-K, Quarterly Reports on Form 10-Q, Current Reports on Form 8-K and any amendments to these reports filed or furnished pursuant to Section 13(a) or 15(d) of the Securities and Exchange Act of 1934 are available on our website, free of charge, as soon as reasonably practicable after such reports are filed with, or furnished to, the SEC. Alternatively, you may access these reports at the SEC’s website at http://www.sec.gov.
Item 1A. RISK FACTORS
You should carefully consider each of the following risks and all of the other information contained in this Annual Report on Form 10-K.
Our business, prospects, financial condition, results of operations or cash flows could be materially and adversely affected by any of these risks, and, as a result, the trading price of our common stock could decline.
Risks Relating to our Company
In connection with our Separation from Murphy Oil, Murphy Oil has agreed to indemnify us for certain liabilities and we have agreed to indemnify Murphy Oil for certain liabilities. If we are required to act under these indemnities to Murphy Oil, we may need to divert cash to meet those obligations and our financial results could be negatively impacted. The Murphy Oil indemnity may not be sufficient to insure us against the full amount of liabilities for which it will be allocated responsibility, and Murphy Oil may not be able to satisfy its indemnification obligations to us in the future.
Pursuant to the Separation and Distribution Agreement and certain other agreements with Murphy Oil, Murphy Oil has agreed to indemnify us for certain liabilities, and we have agreed to indemnify Murphy Oil for certain liabilities. Indemnities that we may be required to provide Murphy Oil are not subject to any cap, may be significant and could negatively impact our business, particularly indemnities relating to our actions that could impact the tax-free nature of the distribution. Third parties could also seek to hold us responsible for any of the liabilities that Murphy Oil has agreed to retain, and under certain circumstances, we may be subject to continuing contingent liabilities of Murphy Oil following the Separation. Further, Murphy Oil may not be able to fully satisfy its indemnification obligations. Moreover, even if we ultimately succeed in recovering from Murphy Oil any amounts for which we are held liable, we may be temporarily required to bear these losses ourselves. Each of these risks could negatively affect our business, results of operations and financial condition.
Our operations present hazards and risks, which may not be fully covered by insurance, if insured. If a significant accident or event occurs for which we are not adequately insured, our operations and financial results could be adversely affected.
11
The scope and nature of our operations present a variety of operational hazards and risks, including explosions, fires, toxic emissions, and natural catastrophes that must be managed through continual oversight and control. These and other risks are present throughout our operations. As protection against these hazards and risks, we maintain insurance against many, but not all, potential losses or liabilities arising from such risks. Uninsured losses and liabilities arising from operating risks could reduce the funds available to us for capital and investment spending and could have a material adverse effect on our financial condition, results of operations and cash flows.
We have debt obligations that could restrict our business and adversely impact our financial condition, results of operations or cash flows; our leverage could increase the overall cost of debt funding and decrease the overall debt capacity and commercial credit available to us in the future.
In connection with the Separation, we borrowed $650 million of new debt, used in part to fund a cash dividend to Murphy Oil immediately prior to the Separation. We have already repaid $150 million of this debt which was represented by a term loan. The remaining level of debt could have significant consequences to our future operations, including:
• | making it more difficult for us to meet our payment and other obligations under our outstanding debt; |
• | resulting in an event of default if we fail to comply with the financial and other restrictive covenants contained in our debt agreements, which event of default could result in all of our debt becoming immediately due and payable; |
• | reducing the availability of our cash flow to fund working capital, capital expenditures, acquisitions and other general corporate purposes, and limiting our ability to obtain additional financing for these purposes; |
• | limiting our flexibility in planning for, or reacting to, and increasing our vulnerability to, changes in our business, the industry in which we operate and the general economy; and |
• | placing us at a competitive disadvantage compared to our competitors that have less debt or are less leveraged. |
Any of the above-listed factors could have an adverse effect on our business, financial condition and results of operations.
In addition, our credit facilities and the indenture that governs the notes include restrictive covenants that, subject to certain exceptions and qualifications, restrict or limit our ability and the ability of our restricted subsidiaries to, among other things, incur additional indebtedness, pay dividends, make certain investments, sell certain assets and enter into certain strategic transactions, including mergers and acquisitions. These covenants and restrictions could affect our ability to operate our business, and may limit our ability to react to market conditions or take advantage of potential business opportunities as they arise.
Our leverage may increase the overall cost of debt funding and decrease the overall debt capacity and commercial credit available to us. We have below investment-grade ratings from Moody’s and S&P based on our current capital structure. Our credit ratings could be lowered or withdrawn entirely by a ratings agency if, in its judgment, the circumstances warrant. If our existing ratings are lowered, or otherwise we do not obtain an investment grade rating in the future, or if we do and a rating agency were to downgrade us again to below investment grade, our borrowing costs would increase and our funding sources could decrease. Actual or anticipated changes or downgrades in our ratings, including any announcement that our ratings are under review for a downgrade, could adversely affect our business, cash flows, financial condition and operating results.
If the distribution from Murphy Oil, together with certain related transactions, does not qualify as a transaction that is generally tax-free for U.S. federal income tax purposes, shareholders and Murphy Oil could be subject to significant tax liability and, in certain circumstances, we could be required to indemnify Murphy Oil for material taxes pursuant to indemnification obligations under the Tax Matters Agreement entered into in connection with the Separation.
Murphy Oil has received a private letter ruling from the IRS substantially to the effect that, among other things, the distribution, together with certain related transactions, will qualify as a transaction that is generally tax-free to Murphy Oil and its stockholders for U.S. federal income tax purposes, and has also received a tax opinion from Davis Polk & Wardwell LLP, counsel to Murphy Oil, to substantially the same effect. The private letter ruling
12
and the tax opinion does rely on certain representations, assumptions and undertakings, including those relating to the past and future conduct of our business, and neither the private letter ruling nor the opinion would be valid if such representations, assumptions and undertakings were incorrect. Moreover, the private letter ruling does not address all the issues that are relevant to determining whether the distribution will qualify for tax-free treatment. Notwithstanding the private letter ruling and the tax opinion, the IRS could determine the distribution should be treated as a taxable transaction for U.S. federal income tax purposes if it determines any of the representations, assumptions or undertakings that were included in the request for the private letter ruling are false or have been violated or if it disagrees with the conclusions in the opinion that are not covered by the IRS ruling.
If the distribution fails to qualify for tax-free treatment, in general, Murphy Oil would be subject to tax as if it had sold the Murphy USA common stock in a taxable sale for its fair market value, and Murphy Oil stockholders who received shares of Murphy USA common stock in the distribution would be subject to tax as if they had received a taxable distribution equal to the fair market value of such shares. In connection with the distribution, we and Murphy Oil entered into a Tax Matters Agreement that governs our rights and obligations with respect to our respective tax liabilities. Generally, we and Murphy Oil will indemnify each other for taxes attributable to our respective operations, and we will indemnify Murphy Oil from the failure of the distribution to qualify as a distribution under Section 355 of the Code as a result of a breach of certain representations or covenants by us. If we are required to indemnify Murphy Oil under the circumstances set forth in the Tax Matters Agreement, we may be subject to substantial liabilities.
Risks Relating to Our Business
Volatility in the global prices of oil and petroleum products and general economic conditions that are largely out of our control, as well as seasonal variations in fuel pricing, can significantly affect our operating results.
Our net income is significantly affected by changes in the margins on retail and wholesale gasoline marketing operations. Oil and domestic wholesale gasoline markets are volatile. General political conditions, acts of war or terrorism, instability in oil producing regions, particularly in the Middle East and South America, and the value of U.S. dollars relative to other foreign currencies, particularly those of oil producing nations, could significantly affect oil supplies and wholesale gasoline costs. In addition, the supply of gasoline and our wholesale purchase costs could be adversely affected in the event of a shortage, which could result from, among other things, lack of capacity at oil refineries, sustained increase in global demand or the fact that our gasoline contracts do not guarantee an uninterrupted, unlimited supply of gasoline. Our wholesale purchase costs could also be adversely affected by increasingly stringent regulations regarding the content and characteristics of fuel products. Significant increases and volatility in wholesale gasoline costs could result in lower gasoline gross margins per gallon. This volatility makes it extremely difficult to predict the effect that future wholesale cost fluctuations will have on our operating results and financial condition in future periods.
Except in limited cases, we typically do not seek to hedge any significant portion of our exposure to the effects of changing prices of commodities. Dramatic increases in oil prices reduce retail gasoline gross margins, because wholesale gasoline costs typically increase faster than retailers are able to pass them along to customers. We purchase refined products, particularly gasoline, needed to supply our U.S. retail marketing stores. Therefore, our most significant costs are subject to volatility of prices for these commodities. Our ability to successfully manage operating costs is important because we have little or no influence on the sales prices or regional and worldwide consumer demand for oil and gasoline. Furthermore, oil prices, wholesale motor fuel costs, motor fuel sales volumes, motor fuel gross margins and merchandise sales can be subject to seasonal fluctuations. For example, consumer demand for motor fuel typically increases during the summer driving season, and typically falls during the winter months. Travel, recreation and construction are typically higher in these months in the geographic areas in which we operate, increasing the demand for motor fuel and merchandise that we sell. Therefore, our revenues and/or sales volumes are typically higher in the second and third quarters of our fiscal year. A significant change in any of these factors, including a significant decrease in consumer demand (other than typical seasonal variations), could materially affect our motor fuel and merchandise volumes, motor fuel gross profit and overall customer traffic, which in turn could have a material adverse effect on our business, financial condition, results of operations and cash flows.
Further, recessionary economic conditions, higher interest rates, higher gasoline and other energy costs, inflation, increases in commodity prices, higher levels of unemployment, higher consumer debt levels, higher tax rates and other changes in tax laws or other economic factors may affect consumer spending or buying habits, and could adversely affect the demand for products we sell at our retail sites. Unfavorable economic conditions, higher gasoline prices and unemployment levels can affect consumer confidence, spending patterns and miles driven.
13
These factors can lead to sales declines in both gasoline and general merchandise, and in turn have an adverse impact on our business, financial condition, results of operations and cash flows.
Walmart continues to be a key relationship with regard to our Murphy USA network.
At December 31, 2015, our 1,335 Company stores were almost all located near Walmart Supercenter stores. Therefore, our relationship with Walmart, the continued goodwill of Walmart and the integrity of Walmart’s brand name in the retail marketplace are all important drivers for our business. Any deterioration in our relationship with Walmart could have a material adverse effect on us, including operations of the existing 1,100 stores that are branded Murphy USA and participate in a discount. In addition, our competitive posture could be weakened by negative changes at Walmart. Many of our Company stores benefit from customer traffic generated by Walmart retail stores, and if the customer traffic through these host stores decreases due to the economy or for any other reason, our sales could be materially and adversely affected.
In addition, on December 21, 2012, we entered into an agreement with Walmart to purchase properties for the development of additional retail fueling stores, which we expect to complete in 2017. As a result, the foregoing risks impact our ability to achieve growth from these additional retail sites. We also rely upon Walmart’s cooperation with us in order to complete the purchases of these additional sites, and our agreement with Walmart requires us to obtain their approval of our development plans before we may close on the purchase of these properties from them. See “ – Walmart retains certain rights in its agreements with us, which may adversely impact our ability to conduct our business” below. If our relationship with Walmart deteriorates or Walmart experiences a slowdown in customer traffic or reputational harm, we may not be successful in developing these additional retail sites, and as a result, our financial condition, results of operations and cash flows could be materially and adversely affected.
The current level of additional incremental revenue that is generated from RINs may not be sustainable.
Our revenues are impacted by our ability to generate revenues from activities such as blending bulk fuel with ethanol and bio-diesel to capture and subsequently sell Renewable Identification Numbers ("RINs"). The market price for RINs fluctuates based on a variety of factors, including but not limited to governmental and regulatory action and market dynamics. In recent years, we have benefited by our ability to attain RINs and sell them at favorable prices in the market; these prices have remained relatively steady in 2015 due to significant uncertainty about how government standards could be modified as they impact RINs. In fact, once the new standard was announced late in 2015, RIN prices jumped in response and have held steady since that time frame. A significant decline in revenues from RINs in future periods could adversely affect our results of operations, and the impact could be material.
In recent months, independent refiners have filed litigation to change the way the Renewable Fuel Standard (RFS) is administered in an attempt to shift the burden for compliance from the refiners to blenders. Under the RFS, which requires an annually increasing amount of biofuels to be blended into the fuels used by U.S. drivers, refiners are obligated to obtain RINs either by blending biofuels into gasoline or through purchase on the open market. This litigation is attempting to shift that burden of having the RINs to the blender rather than the refiner. If this burden were to be shifted, the Company would potentially have to utilize the RINs it obtains through its blending activities to satisfy a new obligation and would be unable to sell the RINs to other obligated parties. This could have a significant impact on the profitability of our current business model should this change ever be implemented unless we were able to pass these costs along to consumers or other parties.
We are exposed to risks associated with the interruption of supply and increased costs as a result of our reliance on third-party supply and transportation of refined products.
We utilize key product supply and wholesale assets, including our pipeline positions and product distribution terminals, to supply our retail fueling stores. Much of our competitive advantage arises out of these proprietary arrangements which, if disrupted, could materially and adversely affect us. In addition to our own operational risks discussed above, we could experience interruptions of supply or increases in costs to deliver refined products to market if the ability of the pipelines or vessels to transport petroleum or refined products is disrupted because of weather events, accidents, governmental regulations or third-party actions. Furthermore, at some of our locations there are very few suppliers for fuel in that market.
14
Changes in credit card expenses could reduce our gross margin, especially on gasoline.
A significant portion of our retail sales involve payment using credit cards. We are assessed credit card fees as a percentage of transaction amounts and not as a fixed dollar amount or percentage of our gross margins. Higher gasoline prices result in higher credit card expenses, and an increase in credit card use or an increase in credit card fees would have a similar effect. Therefore, credit card fees charged on gasoline purchases that are more expensive as a result of higher gasoline prices are not necessarily accompanied by higher gross margins. In fact, such fees may cause lower gross margins. Lower gross margins on gasoline sales caused by higher credit card fees may decrease our overall gross margin and could have a material adverse effect on our business, financial condition, results of operations and cash flows.
Walmart retains certain rights in its agreements with us, which may adversely impact our ability to conduct our business.
In recent years, we have purchased from Walmart the properties underlying over 1,000 of our Company stores. Our December 21, 2012 agreement with Walmart provides for the potential purchase of additional sites. Our agreement requires us to obtain Walmart’s approval of our development plans and to indemnify Walmart for certain environmental liabilities. In addition, Walmart has the right to terminate the agreement with respect to certain properties located adjacent to Walmart stores if the sale of any such property to us would result in certain claims or liabilities against Walmart or, in Walmart’s sole discretion, would impair the operation of the related Walmart store. To date, the agreement has been terminated with respect to some sites due to various local conditions which would affect development including zoning and permitting restrictions. A portion of the terminated sites were replaced with other sites in 2015 and those are currently in process of finalizing the purchase. If we are unable to obtain Walmart’s approval or Walmart terminates the agreement with respect to additional properties, or we are unable to obtain site development permits, we may develop fewer sites than we currently anticipate, and the development of these sites may take longer than we anticipate or may not occur at all. As a result, we can provide no assurance as to the number of sites contemplated by the agreement that we will develop. The failure to develop these sites as currently contemplated for any reason could materially impact our forecasted growth.
In addition, our owned properties that were purchased from Walmart are subject to Easements with Covenants and Restrictions Affecting Land (the “ECRs”) between us and Walmart. The ECRs impose customary restrictions on the use of our properties, which Walmart has the right to enforce. The ECRs also provide that if we propose to sell a fueling station property or any portion thereof (other than in connection with the sale of all or substantially all of our properties that were purchased from Walmart or in connection with a bona fide financing), Walmart has a right of first refusal to purchase such property or portion thereof on similar terms. Subject to certain exceptions (including a merger in which we participate, the transfer of any of our securities or a change in control of us), if we market for sale to a third party all or substantially all of our properties that were purchased from Walmart, or if we receive an unsolicited offer to purchase such properties that we intend to accept, we are required to notify Walmart. Walmart then has the right, within 90 days of receipt of such notice, to make an offer to purchase such properties. If Walmart makes such an offer, for a period of one year we will generally only be permitted to accept third-party offers where the net consideration to us would be greater than that offered by Walmart.
The ECRs also prohibit us from transferring all or substantially all of our fueling station properties that were purchased from Walmart to a “competitor” of Walmart, as reasonably determined by Walmart. The term “competitor” is generally defined in the ECRs as an entity that owns, operates or controls grocery stores or supermarkets, wholesale club operations similar to that of a Sam’s Club, discount department stores or other discount retailers similar to any of the various Walmart store prototypes or pharmacy or drug stores.
Similarly, some of our leased properties are subject to certain rights retained by Walmart. Our master lease agreement states that if Murphy Oil USA, Inc. is acquired or becomes party to any merger or consolidation that results in a material change in the management of the stores, Walmart will have the option to purchase the stores at fair market value. The master lease also prohibits us from selling all or any portion of a station without first offering to sell all or such portion to Walmart on the same terms and conditions. These provisions may restrict our ability to conduct our business on the terms and in the manner we consider most favorable and may adversely affect our future growth.
15
An inability to source land for our independent growth plan with Murphy Express may cause our Company's growth to slow in 2018 and beyond.
As we announced in January 2016, we have shifted direction in our Walmart relationship and have undertaken an independent growth plan with respect to future sites for Company stores. While we have a high confidence level that our growth of 60-80 stores for 2016 and 2017 is secure due to our existing pipeline of land closures, the future development relies on the continued build out of our land bank portfolio. We have an extremely active Asset Development group that works to focus on our key target areas to locate suitable traffic count locations for this future growth. If the Asset Development group is unable to locate suitable locations or is unable to close the purchase of those locations in a timely fashion, the Company could find that it does not have its stated pipeline of 30-40 sites per year beginning in 2018.
We currently are in the process of changing our primary supplier for over 85% of our merchandise. A disruption in supply could have a material effect on our business.
Over 85% of our general merchandise, including most tobacco products and grocery items, was historically purchased from a single wholesale grocer, McLane Company, Inc. (“McLane”). We had a contract with McLane through September 2015 (which was extended one year during negotiations) but in late 2015 we selected a different supplier for our sites. The new supplier is Core-Mark Holdings and we entered into a five year contract with them. The transition from McLane to Core-Mark is being carefully planned and executed during the first quarter of 2016; however, alternative suppliers that we could use in the event of a disruption may not be immediately available. A disruption in supply could have a material effect on our business, cost of goods sold, financial condition, results of operations and cash flows.
We may be unable to protect or maintain our rights in the trademarks we use in our business.
We expect to use the Murphy USA® and Murphy Express trademarks under the Trademark License Agreement that we entered into with Murphy Oil, which will continue to own those trademarks. Murphy Oil’s actions and our actions to protect our rights in those trademarks may not be adequate to prevent others from using similar marks or otherwise violating our rights in those trademarks. Furthermore, our right to use those trademarks is limited to the marketing business and can be terminated by Murphy Oil upon the occurrence of certain events, such as our uncured material breach, insolvency or change of control.
Capital financing may not always be available to fund our activities.
We usually must spend and risk a significant amount of capital to fund our activities. Although most capital needs are funded from operating cash flow, the timing of cash flows from operations and capital funding needs may not always coincide, and the levels of cash flow may not fully cover capital funding requirements.
From time to time, we may need to supplement our cash generated from operations with proceeds from financing activities. In connection with the Separation, we entered into a credit facility to provide us with available financing for working capital and other general corporate purposes. This credit facility is intended to meet any ongoing cash needs in excess of internally generated cash flows. Uncertainty and illiquidity in financial markets may materially impact the ability of the participating financial institutions to fund their commitments to us under our credit facility. Accordingly, we may not be able to obtain the full amount of the funds available under our credit facility to satisfy our cash requirements, and our failure to do so could have a material adverse effect on our operations and financial position. Further, since the credit facility is secured by receivables and inventories, low commodity prices can limit the borrowing base to an amount substantially less than its ceiling as the resulting collateral for the loan is valued low and this leads to a low borrowing base on a monthly basis.
We could be adversely affected if we are not able to attract and retain highly qualified senior personnel.
We are dependent on our ability to attract and retain highly qualified senior personnel. If, for any reason, we are not able to attract and retain qualified senior personnel, our business, financial condition, results of operations and cash flows could be adversely affected.
16
Risks Relating to Our Industry
We operate in a highly competitive industry, which could adversely affect us in many ways, including our profitability, our ability to grow, and our ability to manage our businesses.
We operate in the oil and gas industry and experience intense competition from other independent retail and wholesale gasoline marketing companies. The U.S. marketing petroleum business is highly competitive, particularly with regard to accessing and marketing petroleum and other refined products. We compete with other chains of retail fuel stores for fuel supply and in the retail sale of refined products to end consumers, primarily on the basis of price, but also on the basis of convenience and consumer appeal. In addition, we may also face competition from other retail fueling stores that adopt marketing strategies similar to ours by associating with non-traditional retailers, such as supermarkets, discount club stores and hypermarkets, particularly in the geographic areas in which we operate. We expect that our industry will continue to trend toward this model, resulting in increased competition to us over time. Moreover, because we do not produce or refine any of the petroleum or other refined products that we market, we compete with retail gasoline companies that have ongoing supply relationships with affiliates or former affiliates that manufacture refined products. We also compete with integrated companies that have their own production and/or refining operations that are at times able to offset losses from marketing operations with profits from producing or refining operations, and may be better positioned to withstand periods of depressed retail margins or supply shortages. In addition, we compete with other retail and wholesale gasoline marketing companies that have more extensive retail outlets and greater brand name recognition. Some of our competitors have been in existence longer than we have and have greater financial, marketing and other resources than we do. As a result, these competitors may have a greater ability to bear the economic risks inherent in all phases of our business and may be able to respond better to changes in the economy and new opportunities within the industry. Such competition could adversely affect us, including our profitability, our ability to grow and our ability to manage our business.
In addition, the retail gasoline industry in the United States is highly competitive due to ease of entry and constant change in the number and type of retailers offering similar products and services. With respect to merchandise, our retail sites compete with other convenience store chains, independently owned convenience stores, supermarkets, drugstores, discount clubs, gasoline service stations, mass merchants, fast food operations and other similar retail outlets. In recent years, several non-traditional retailers, including supermarkets, discount club stores and mass merchants, have begun to compete directly with retail gasoline sites. These non-traditional gasoline retailers have obtained a significant share of the gasoline market, and their market share is expected to grow, and these retailers may use promotional pricing or discounts, both at the fuel pump and in the convenience store, to encourage in-store merchandise sales and gasoline sales. In addition, some large retailers and supermarkets are adjusting their store layouts and product prices in an attempt to appeal to convenience store customers. Major competitive factors include: location, ease of access, product and service selection, gasoline brands, pricing, customer service, store appearance, cleanliness and safety. Competition from these retailers may reduce our market share and our revenues, and the resulting impact on our business and results of operations could be materially adverse.
Changes in consumer behavior and travel as a result of changing economic conditions, the development of alternative energy technologies or otherwise could affect our business.
In the retail gasoline industry, customer traffic is generally driven by consumer preferences and spending trends, growth rates for commercial truck traffic and trends in travel and weather. Changes in economic conditions generally, or in the regions in which we operate, could adversely affect consumer spending patterns and travel in our markets. In particular, weakening economic conditions may result in decreases in miles driven and discretionary consumer spending and travel, which affect spending on gasoline and convenience items. In addition, changes in the types of products and services demanded by consumers may adversely affect our merchandise sales and gross margin. Additionally, negative publicity or perception surrounding gasoline suppliers could adversely affect their reputation and brand image, which may negatively affect our gasoline sales and gross margin. Our success depends on our ability to anticipate and respond in a timely manner to changing consumer demands and preferences while continuing to sell products and services that remain relevant to the consumer and thus will positively impact overall retail gross margin.
Similarly, advanced technology, improved fuel efficiency and increased use of “green” automobiles (e.g., those automobiles that do not use gasoline or that are powered by hybrid engines) would reduce demand for gasoline. Developments regarding climate change and the effects of greenhouse gas emissions on climate change and the environment may lead to increased use of “green” automobiles. Consequently, attitudes toward gasoline and its relationship to the environment may significantly affect our sales and ability to market our products. Reduced
17
consumer demand for gasoline could have a material adverse effect on our business, financial condition, results of operations and cash flows.
Our operations and earnings have been and will continue to be affected by worldwide political developments.
Many governments, including those that are members of the Organization of Petroleum Exporting Countries (“OPEC”), unilaterally intervene at times in the orderly market of petroleum and natural gas produced in their countries through such actions as setting prices, determining rates of production, and controlling who may buy and sell the production. In addition, prices and availability of petroleum, natural gas and refined products could be influenced by political unrest and by various governmental policies to restrict or increase petroleum usage and supply. Other governmental actions that could affect our operations and earnings include tax changes, royalty increases and regulations concerning: currency fluctuations, protection and remediation of the environment, concerns over the possibility of global warming being affected by human activity including the production and use of hydrocarbon energy, restraints and controls on imports and exports, safety, and relationships between employers and employees. As a retail gasoline marketing company, we are significantly affected by these factors. Because these and other factors are subject to changes caused by governmental and political considerations and are often made in response to changing internal and worldwide economic conditions and to actions of other governments or specific events, it is not practical to attempt to predict the effects of such factors on our future operations and earnings.
Our business is subject to operational hazards and risks normally associated with the marketing of petroleum products.
We operate in many different locations around the United States. The occurrence of an event, including but not limited to acts of nature such as hurricanes, floods, earthquakes and other forms of severe weather, and mechanical equipment failures, industrial accidents, fires, explosions, acts of war and intentional terrorist attacks could result in damage to our facilities, and the resulting interruption and loss of associated revenues; environmental pollution or contamination; and personal injury, including death, for which we could be deemed to be liable, and which could subject us to substantial fines and/or claims for punitive damages.
We store gasoline in storage tanks at our retail sites. Our operations are subject to significant hazards and risks inherent in storing gasoline. These hazards and risks include, but are not limited to, fires, explosions, spills, discharges and other releases, any of which could result in distribution difficulties and disruptions, environmental pollution, governmentally imposed fines or cleanup obligations, personal injury or wrongful death claims and other damage to our properties and the properties of others. Any such event could have a material adverse effect on our business, financial condition, results of operations and cash flows.
Certain of our assets such as gasoline terminals and certain retail fueling stores lie near the U.S. coastline and are vulnerable to hurricane and tropical storm damages, which may result in shutdowns. The U.S. hurricane season runs from June through November, but the most severe storm activities usually occur in late summer, such as with Hurricanes Katrina and Rita in 2005. Although we maintain insurance for certain of these risks as described below, due to policy deductibles and possible coverage limits, weather-related risks are not fully insured.
We are subject to various environmental laws, regulations and permit requirements, which could expose us to significant expenditures, liabilities or obligations and reduce product demand.
We are subject to stringent federal, state and local environmental laws and regulations governing, among other things, the generation, storage, handling, use and transportation of petroleum products and hazardous materials; the emission and discharge of such substances into the environment; the content and characteristics of fuel products; the process safety of our facilities; and human health and safety. Pursuant to such environmental laws and regulations, we are also required to obtain permits from governmental authorities for certain of our operations. While we strive to abide by these requirements, we cannot assure you that we have been or will be at all times in compliance with such laws, regulations and permits. If we violate or fail to comply with these requirements, we could be subject to litigation, costs, fines or other sanctions. Environmental requirements, and the enforcement and interpretation thereof, change frequently and have generally become more stringent over time. Compliance with existing and future environmental laws, regulations and permits may require significant expenditures. In addition, to the extent fuel content and characteristic standards increase our wholesale purchase costs, we may be adversely affected if we are unable to recover such costs in our pricing.
18
We could be subject to joint and several as well as strict liability for environmental contamination, without regard to fault or the legality of our conduct. In particular, we could be liable for contamination relating to properties that we own, lease or operate or that we or our predecessors previously owned, leased or operated. Substantially all of these properties have or in the past had storage tanks to store motor fuel or petroleum products. Leaks from such tanks may impact soil or groundwater and could result in substantial costs. We could also be held responsible for contamination relating to third-party sites to which we or our predecessors have sent regulated materials. In addition to potentially significant investigation and remediation costs, any such contamination, leaks from storage tanks or other releases of regulated materials can give rise to claims from governmental authorities and other third parties for fines or penalties, natural resource damages, personal injury and property damage.
Our business is also affected by fuel economy standards and greenhouse gas (“GHG”) vehicle emission reduction measures. As such fuel economy and GHG reduction requirements become more stringent over time, demand for our products may be adversely affected. In addition, some of our facilities are subject to GHG regulation. We are currently required to report annual GHG emissions from certain of our operations, and additional GHG emission-related requirements that may affect our business have been finalized or are in various phases of discussion or implementation. Any existing or future GHG emission requirements could result in increased operating costs and additional compliance expenses.
Our expenditures, liabilities and obligations relating to environmental matters could have a material adverse effect on our business, product demand, reputation, results of operations and financial condition.
Future tobacco legislation, campaigns to discourage smoking, increases in tobacco taxes and wholesale cost increases of tobacco products could have a material adverse impact on our retail operating revenues and gross margin.
Sales of tobacco products have historically accounted for an important portion of our total sales of convenience store merchandise. Significant increases in wholesale cigarette costs and tax increases on tobacco products, as well as future legislation and national and local campaigns to discourage smoking in the United States, may have an adverse effect on the demand for tobacco products, and therefore reduce our revenues and profits. Also, increasing regulations for e-cigarettes and vapor products could offset some of the recent gains we have experienced from selling these products. Competitive pressures in our markets can make it difficult to pass price increases on to our customers. These factors could materially and adversely affect our retail price of cigarettes, cigarette unit volume and sales, merchandise gross margin and overall customer traffic. Reduced sales of tobacco products or smaller gross margins on the sales we make could have a material adverse effect on our business, financial condition, results of operations and cash flows.
Currently, major cigarette manufacturers offer substantial rebates to retailers. We include these rebates as a component of our gross margin. In the event these rebates are no longer offered, or decreased, our profit from cigarette sales will decrease accordingly. In addition, reduced retail display allowances on cigarettes offered by cigarette manufacturers would negatively affect gross margins. These factors could materially affect our retail price of cigarettes, cigarette unit volume and revenues, merchandise gross margin and overall customer traffic, which could in turn have a material adverse effect on our business, financial condition, results of operations and cash flows.
Our retail operations are subject to extensive government laws and regulations, and the cost of compliance with such laws and regulations can be material.
Our retail operations are subject to extensive local, state and federal governmental laws and regulations relating to, among other things, the sale of alcohol, tobacco and money orders, employment conditions, including minimum wage requirements, and public accessibility requirements. The cost of compliance with these laws and regulations can have a material adverse effect on our business, financial condition, results of operations and cash flows. In addition, failure to comply with local, state and federal laws and regulations to which our operations are subject may result in penalties and costs that could adversely affect our business, financial condition, results of operations and cash flows.
In certain areas where our retail sites are located, state or local laws limit the retail sites’ hours of operation or their sale of alcoholic beverages, tobacco products, possible inhalants and lottery tickets, in particular to minors. Failure to comply with these laws could adversely affect our revenues and results of operations because these state and local regulatory agencies have the power to revoke, suspend or deny applications for and renewals of permits
19
and licenses relating to the sale of these products or to seek other remedies, such as the imposition of fines or other penalties.
Regulations related to wages also affect our business. Any appreciable increase in the statutory minimum wage would result in an increase in our labor costs and such cost increase, or the penalties for failing to comply with such statutory minimums, could adversely affect our business, financial condition, results of operations and cash flows.
In compliance with U.S. health care reform legislation, we have implemented a “bronze level” health care offering to our eligible non-exempt field employees. The offering increased labor costs by an immaterial amount in 2015. To date, initial enrollment is lower than projected. We expect that as awareness of the taxpayer non-compliance penalty and related increases in this penalty takes effect, enrollment will increase and such increases could be significant enough to materially affect our business, financial condition, results of operations and cash flows.
Any changes in the laws or regulations described above that are adverse to us and our properties could affect our operating and financial performance. In addition, new regulations are proposed from time to time which, if adopted, could have a material adverse effect on our business, financial condition, results of operations and cash flows.
Future consumer or other litigation could adversely affect our business, financial condition, results of operations and cash flows.
Our retail operations are characterized by a high volume of customer traffic and by transactions involving a wide array of product selections. These operations carry a higher exposure to consumer litigation risk when compared to the operations of companies operating in many other industries. Consequently, we have been, and may in the future be from time to time, involved in lawsuits seeking cash settlements for alleged personal injuries, property damages and other business-related matters, as well as energy content, off-specification gasoline, products liability and other legal actions in the ordinary course of our business. While these actions are generally routine in nature and incidental to the operation of our business, if our assessment of any action or actions should prove inaccurate, our business, financial condition, results of operations and cash flows could be adversely affected. For more information about our legal matters, see Note 19 “Contingencies” to the consolidated and combined historical financial statements for the three years ended December 31, 2015 included in this Form 10-K. Further, adverse publicity about consumer or other litigation may negatively affect us, regardless of whether the allegations are true, by discouraging customers from purchasing gasoline or merchandise at our retail sites.
We rely on our IT systems and network infrastructure to manage numerous aspects of our business, and a disruption of these systems could adversely affect our business.
We depend on our IT systems and network infrastructure to manage numerous aspects of our business and provide analytical information to management. These systems are an essential component of our business and growth strategies, and a serious disruption to them could significantly limit our ability to manage and operate our business efficiently. These systems are vulnerable to, among other things, damage and interruption from power loss or natural disasters, computer system and network failures, loss of telecommunications services, physical and electronic loss of data, security breaches and computer viruses, which could result in a loss of sensitive business information, systems interruption or the disruption of our business operations. To protect against unauthorized access or attacks, we have implemented infrastructure protection technologies and disaster recovery plans, but there can be no assurance that a technology systems breach or systems failure, which may occur and go undetected, will not have a material adverse effect on our financial condition or results of operations.
Our business and our reputation could be adversely affected by the failure to protect sensitive customer, employee or vendor data or to comply with applicable regulations relating to data security and privacy.
In the normal course of our business as a gasoline and merchandise retailer, we obtain large amounts of personal data, including credit and debit card information from our customers. While we have invested significant amounts in the protection of our IT systems and maintain what we believe are adequate security controls over individually identifiable customer, employee and vendor data provided to us, a breakdown or a breach in our systems that results in the unauthorized release of individually identifiable customer or other sensitive data could nonetheless occur and have a material adverse effect on our reputation, operating results and financial condition. Such a breakdown or breach could also materially increase the costs we incur to protect against such risks. Also, a
20
material failure on our part to comply with regulations relating to our obligation to protect such sensitive data or to the privacy rights of our customers, employees and others could subject us to fines or other regulatory sanctions and potentially to lawsuits.
Compliance with and changes in tax laws could adversely affect our performance.
We are subject to extensive tax liabilities imposed by multiple jurisdictions, including income taxes, indirect taxes (excise/duty, sales/use and gross receipts taxes), payroll taxes, franchise taxes, withholding taxes and ad valorem taxes. New tax laws and regulations and changes in existing tax laws and regulations are continuously being enacted or proposed that could result in increased expenditures for tax liabilities in the future. Many of these liabilities are subject to periodic audits by the respective taxing authority. Subsequent changes to our tax liabilities as a result of these audits may subject us to interest and penalties.
Risks Relating to Our Common Stock
The price of our common stock may fluctuate significantly and if securities or industry analysts publish unfavorable research reports about our business or if they downgrade their rating on our common stock, the price of our common stock could decline.
The price at which our common stock trades may fluctuate significantly. The trading price of our common stock could be subject to wide fluctuations in response to a number of factors, including, but not limited to:
• | fluctuations in quarterly or annual results of operations, especially if they differ from our previously announced guidance or forecasts made by analysts; |
• | announcements by us of anticipated future revenues or operating results, or by others concerning us, our competitors, our customers, or our industry; |
• | our ability to execute our business plan; |
• | competitive environment; |
• | regulatory developments; |
• | limited analyst coverage; and |
• | changes in overall stock market conditions, including the stock prices of our competitors. |
Provisions in our Certificate of Incorporation and Bylaws and certain provisions of Delaware law could delay or prevent a change in control of us.
The existence of some provisions of our Certificate of Incorporation and Bylaws and Delaware law could discourage, delay or prevent a change in control of us that a stockholder may consider favorable. These include provisions:
• | providing for a classified board of directors; |
• | providing that our directors may be removed by our stockholders only for cause; |
• | establishing supermajority vote requirements for our shareholders to amend certain provisions of our Certificate of Incorporation and our Bylaws; |
• | authorizing a large number of shares of stock that are not yet issued, which would allow our board of directors to issue shares to persons friendly to current management, thereby protecting the continuity of our management, or which could be used to dilute the stock ownership of persons seeking to obtain control of us; |
• | prohibiting stockholders from calling special meetings of stockholders or taking action by written consent; and |
21
• | establishing advance notice requirements for nominations of candidates for election to our board of directors or for proposing matters that can be acted on by stockholders at the annual stockholder meetings. |
In addition, we are subject to Section 203 of the Delaware General Corporation Law, which may have an anti-takeover effect with respect to transactions not approved in advance by our board of directors, including discouraging takeover attempts that could have resulted in a premium over the market price for shares of our common stock.
These provisions apply even if a takeover offer may be considered beneficial by some stockholders and could delay or prevent an acquisition that our board of directors determines is not in our and our stockholders’ best interests.
We may issue preferred stock with terms that could dilute the voting power or reduce the value of our common stock.
Our Certificate of Incorporation authorizes us to issue, without the approval of our stockholders, one or more classes or series of preferred stock having such designations, powers, preferences and relative, participating, optional and other rights, and such qualifications, limitations or restrictions as our board of directors generally may determine. The terms of one or more classes or series of preferred stock could dilute the voting power or reduce the value of our common stock. For example, we could grant holders of preferred stock the right to elect some number of our directors in all events or on the happening of specified events or the right to veto specified transactions. Similarly, the repurchase or redemption rights or dividend, distribution or liquidation preferences we could assign to holders of preferred stock could affect the residual value of the common stock.
Our Bylaws designate a state or federal court located within the State of Delaware as the sole and exclusive forum for certain types of actions and proceedings that may be initiated by our stockholders, which could limit our stockholders’ ability to obtain a preferred judicial forum for disputes with us or our directors, officers or other employees.
Our Bylaws provide that, unless we consent in writing to the selection of an alternative forum, the sole and exclusive forum for (i) any derivative action or proceeding brought on our behalf, (ii) any action asserting a claim of breach of a fiduciary duty owed by any director, officer or other employee to us or our stockholders, (iii) any action asserting a claim arising pursuant to any provision of Delaware General Corporation Law, our Certificate of Incorporation (including any certificate of designations for any class or series of our preferred stock) or our Bylaws, in each case, as amended from time to time, or (iv) any action asserting a claim governed by the internal affairs doctrine shall be a state or federal court located within the State of Delaware, in all cases subject to the court’s having personal jurisdiction over the indispensable parties named as defendants. Any person or entity purchasing or otherwise acquiring any interest in shares of our capital stock is deemed to have received notice of and consented to the foregoing provision. This forum selection provision may limit a stockholder’s ability to bring a claim in a judicial forum that it finds favorable or cost-effective for disputes with us or our directors, officers or other employees, which may discourage such lawsuits against us and our directors, officers and employees.
We may not achieve the intended benefits of having an exclusive forum provision if it is found to be unenforceable.
We have included an exclusive forum provision in our Bylaws as described above. However, the enforceability of similar exclusive jurisdiction provisions in other companies’ bylaws or certificates of incorporation has been challenged in legal proceedings, and it is possible that, in connection with any action, a court could find the exclusive jurisdiction provision contained in our Bylaws to be inapplicable or unenforceable in such action. Although in June 2013 the Delaware Court of Chancery upheld the statutory and contractual validity of exclusive forum-selection bylaw provisions, the validity of such provisions is not yet settled law under the laws of Delaware. Furthermore, the Delaware Court of Chancery emphasized that such provisions may not be enforceable under circumstances where they are found to operate in an unreasonable or unlawful manner or in a manner inconsistent with a board’s fiduciary duties. Also, it is uncertain whether non-Delaware courts consistently will enforce such exclusive forum-selection bylaw provisions. If a court were to find our choice of forum provision inapplicable to, or unenforceable in respect of, one or more of the specified types of actions or proceedings, we may incur additional costs associated with resolving such matters in other jurisdictions and we may not obtain the benefits of limiting jurisdiction to the courts selected.
22
Item 1B. UNRESOLVED STAFF COMMENTS
The Company had no unresolved comments from the staff of the U.S. Securities and Exchange Commission as of December 31, 2015.
Item 2. PROPERTIES
Descriptions of the Company’s properties are included in Item 1 of this Annual Report on Form 10-K report beginning on page 2.
Item 3. LEGAL PROCEEDINGS
Murphy USA and its subsidiaries are engaged in a number of legal proceedings, all of which Murphy USA considers incidental to its business. See Note 19 “Contingencies” in the accompanying consolidated and combined financial statements for the three years ended December 31, 2015. Based on information currently available to the Company, the ultimate resolution of matters referred to in this item is not expected to have a material adverse effect on the Company’s net income, financial condition, or liquidity in a future period.
In the case Freeny v. Murphy Oil Corporation and Murphy Oil USA, Inc., the plaintiffs alleged that the Company had infringed on their electronic pricing system patents. The Company claimed that its pricing system can be differentiated from the plaintiff's patents and that the plaintiff's patents were invallid. Murphy Oil USA, Inc. agreed to defend and indemnify Murphy Oil Corporation in this matter as required by the terms of the Separation Agreement. Trial was held in June 2015. At trial, and before any judgment was entered for any party, a settlement was reached between the parties and the case was dismissed. The settlement agreement resulted in the Company paying an immaterial amount to the plaintiffs for a license to use their patents for past and future periods. As a result, a portion of the settlement amount was capitalized as a patent asset and will be amortized over the remaining life of the patents.
SUPPLEMENTAL INFORMATION; Executive Officers of the Registrant
The age at January 1, 2016, present corporate office and length of service in office of each of the Company’s executive officers are reported in the following listing. Executive officers are elected annually but may be removed from office at any time by the Board of Directors.
R. Andrew Clyde – Age 52; President and Chief Executive Officer, Director and Member of the Executive Committee since August 2013. Mr. Clyde led the Company’s Separation from Murphy Oil Corporation beginning in January 2013. Previously, Mr. Clyde served at Booz & Company (and prior to August 2008, Booz Allen Hamilton), from 1993 to 2013 where he was a partner in the Firm and led the North American Energy Practice. He served energy and retail clients, including Murphy USA, bringing expertise in strategy development, organization effectiveness and performance improvement. Mr. Clyde received a Masters in Management with Distinction from the Kellogg Graduate School of Management at Northwestern University. He received a BBA in Accounting from Southern Methodist University.
Mindy K. West – Age 46; Executive Vice President, Chief Financial Officer and Treasurer since August 2013. Ms. West joined Murphy Oil in 1996 and has held positions in Accounting, Employee Benefits, Planning and Investor Relations. In 2007, she was promoted to Vice President & Treasurer for Murphy Oil. She holds a bachelor’s degree in Finance from the University of Arkansas and a bachelor’s degree in Accounting from Southern Arkansas University. She is a Certified Public Accountant and a Certified Treasury Professional.
Marn K. Cheng – Age 50; Senior Vice President, Retail Operations & Support since February 2015; Senior Vice President, Retail Operations Support August 2013 to February 2015. Mr. Cheng joined Murphy Oil in 2000 as District Manager in Oklahoma City, Oklahoma. He held several positions within Murphy Oil before being promoted to General Manager, Retail Marketing in 2006. In 2008, he was named Regional Vice President for Murphy USA Marketing Company, a division of Murphy Oil USA, Inc. before serving as Vice President, Retail Operations. He was promoted to Vice President, Renewable Energy for Murphy Oil USA, Inc. in 2009. He returned to the retail marketing division in 2011 as Vice President, Fuels for Murphy USA Marketing Company and was promoted to Senior Vice President of Retail Operations in 2012. Mr. Cheng graduated from Texas Tech University with a bachelor’s degree in Marketing and also holds an MBA from Texas Tech University.
23
John A. Moore – Age 48; Senior Vice President and General Counsel since August 2013. Mr. Moore joined Murphy Oil in 1995 as Associate Attorney in the Law Department. He was promoted to Attorney in 1998 and Senior Attorney in 2005. He was promoted to Manager, Law and assumed the role of Corporate Secretary for Murphy Oil in 2011. Mr. Moore holds a bachelor’s degree in Philosophy from Ouachita Baptist University and a Law degree from the University of Arkansas.
Joseph Henderson, III – Age 41; Vice President, Fuels Marketing from August 2013 to December 2015. Mr. Henderson joined Murphy Oil Corporation in 2002 as District Manager in Houston, Texas. In 2003, he moved to El Dorado where he has since served in numerous fuel supply and marketing roles. Mr. Henderson graduated from Texas Christian University with a bachelor’s degree in Speech Communications and also holds an MBA from Harding University. Mr. Henderson resigned from the Company effective December 31, 2015.
Item 4. MINE SAFETY DISCLOSURES
Not applicable
24
Part II
Item 5. MARKET FOR REGISTRANT’S COMMON EQUITY, RELATED STOCKHOLDER MATTERS AND ISSUER PURCHASES OF EQUITY SECURITIES
The Company’s common stock is traded on the New York Stock Exchange using “MUSA” as the trading symbol. There were 2,435 stockholders of record as of December 31, 2015. The following table reflects the high and low sales prices of our common stock for the period starting January 1, 2014 and ending on December 31, 2015.
Stock Price | |||||
High | Low | ||||
2014 | |||||
January 1, 2014 to March 31, 2014 | 43.25 | 37.55 | |||
April 1, 2014 to June 30, 2014 | 52.34 | 39.96 | |||
July 1, 2014 to September 30, 2014 | 55.64 | 47.26 | |||
October 1, 2014 to December 31, 2014 | 69.37 | 49.63 | |||
2015 | |||||
January 1, 2015 to March 31, 2015 | 73.48 | 66.82 | |||
April 1, 2015 to June 30, 2015 | 73.47 | 55.82 | |||
July 1, 2015 to September 30, 2015 | 57.40 | 48.70 | |||
October 1, 2015 to December 31, 2015 | 65.09 | 54.17 | |||
The declaration and amount of any dividends to holders of our common stock will be at the discretion of our board of directors and will depend upon many factors, including our financial condition, earnings, cash flows, capital requirements of our business, covenants associated with our debt obligations, legal requirements, regulatory constraints, industry practice and other factors the board of directors deems relevant.
We are a holding company and have no direct operations. As a result, we will be able to pay dividends on our common stock only from available cash on hand and distributions received from our subsidiaries. There can be no assurance we will continue to pay any dividend even if we commence the payment of dividends. We did not declare any cash dividends on our common stock for the two years ended December 31, 2015 and 2014.
The indenture governing the Senior Notes and the credit agreement governing our credit facilities contain restrictive covenants that limit, among other things, the ability of Murphy USA and the restricted subsidiaries to make certain restricted payments, which as defined under both agreements, include the declaration or payment of any dividends of any sort in respect of its capital stock and repurchase of shares of our common stock. See “Management's Discussion and Analysis of Financial Condition and Operating Results—Capital Resources and Liquidity—Debt” and Note 9 “Long-Term Debt” to the accompanying audited consolidated and combined financial statements for the three years ended December 31, 2015.
In May 2014, the Company’s Board of Directors authorized a stock repurchase plan of up to $50 million of the Company’s common stock. This plan was completed in May 2014. In October 2014, the Company’s Board of Directors authorized a second stock repurchase plan of up to $250 million of the Company’s common stock which was completed by September 30, 2015. There was no share repurchase activity in the fourth quarter of 2015.
Subsequent to year end, the Board of Directors approved a strategic allocation of capital for the Company to pursue its independent growth plan and to undertake a share repurchase program of up to $500 million for the two capital programs through December 31, 2017. See Note 22 "Subsequent Events" for more information.
25
Equity Compensation Plan Information
The table below contains information about securities authorized for issuance under equity compensation plans. The features of these plans are discussed further in Note 12 “Incentive Plans” to our audited consolidated and combined financial statements.
Plan category | Number of securities to be issued upon exercise of outstanding options, warrants and rights (1) | Weighted-average exercise price of outstanding options, warrants and rights | Number of securities remaining available for future issuance under equity compensation plans (excluding securities reflected in column (a)) (2) | |||
(a) | (b) | (c) | ||||
Equity compensation plans approved by security holders | 988,224 | $42.22 | 4,510,514 | |||
Equity compensation plans not approved by security holders | — | — | — | |||
Total | 988,224 | $42.22 | 4,510,514 | |||
(1) | Amounts in this column do not take into account outstanding restricted stock units. |
(2) | Number of shares available for issuance includes 4,074,288 available shares under the 2013 Long-Term Incentive Plan as of December 31, 2015 plus 436,226 available shares under the 2013 Stock Plan for Non-Employee Directors as of December 31, 2015. Assumes each restricted stock unit is equivalent to one share and each performance unit is equal to two shares. |
SHAREHOLDER RETURN PERFORMANCE PRESENTATION
The following graph presents a comparison of cumulative total shareholder returns (including the reinvestment of dividends) as if a $100 investment was made on August 21, 2013 (the first date at which MUSA common equity was traded on the NYSE) for the Company, the Standard and Poor’s 500 Stock Index Fund (S&P 500 Index) and the S&P 400 Midcap Index. This performance information is “furnished” by the Company and is not considered as “filed” with this Annual Report on Form 10-K and is not incorporated into any document that incorporates this Annual Report on Form 10-K by reference.
Murphy USA Inc.
Comparison of Cumulative Shareholder Returns
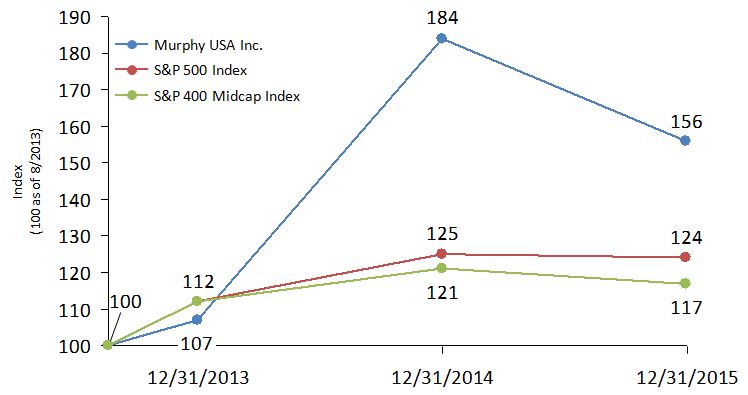
26
Item 6. SELECTED FINANCIAL DATA
(Thousands of dollars, except per share data) | 2015 | 2014 | 2013 | 2012 | 2011 | |||||||||||||||
Results of Operations for the Year | ||||||||||||||||||||
Net sales and other operating revenues | $ | 12,699,411 | $ | 16,986,015 | $ | 17,814,081 | $ | 19,011,040 | $ | 18,702,720 | ||||||||||
Net cash provided by operating activities | $ | 215,838 | $ | 305,582 | $ | 356,698 | $ | 237,427 | $ | 188,373 | ||||||||||
Income from continuing operations | $ | 137,591 | $ | 222,961 | $ | 154,135 | $ | 138,416 | $ | 187,814 | ||||||||||
Net income (loss) | $ | 176,340 | $ | 243,863 | $ | 235,033 | $ | 83,568 | $ | 324,020 | ||||||||||
Per Common Share - diluted (1) | ||||||||||||||||||||
Income (loss) from continuing operations | $ | 3.14 | $ | 4.81 | $ | 3.29 | $ | 2.96 | $ | 4.02 | ||||||||||
Income (loss) from discontinued operations | $ | 0.88 | $ | 0.45 | $ | 1.73 | $ | (1.17 | ) | $ | 2.91 | |||||||||
Net income (loss) | $ | 4.02 | $ | 5.26 | $ | 5.02 | $ | 1.79 | $ | 6.93 | ||||||||||
Capital Expenditures for the Year | ||||||||||||||||||||
Marketing | $ | 202,370 | $ | 131,139 | $ | 162,051 | $ | 103,152 | $ | 77,481 | ||||||||||
Corporate and other | 9,477 | 4,200 | 8,169 | — | — | |||||||||||||||
Subtotal | $ | 211,847 | $ | 135,339 | $ | 170,220 | $ | 103,152 | $ | 77,481 | ||||||||||
Discontinued operations | 3,720 | 3,549 | 1,752 | 8,441 | 22,699 | |||||||||||||||
Total capital expenditures | $ | 215,567 | $ | 138,888 | $ | 171,972 | $ | 111,593 | $ | 100,180 | ||||||||||
Financial condition at December 31 | ||||||||||||||||||||
Current ratio | 1.11 | 1.67 | 1.30 | 1.12 | 1.19 | |||||||||||||||
Working capital | $ | 43,375 | $ | 277,633 | $ | 155,899 | $ | 88,053 | $ | 95,801 | ||||||||||
Net property, plant and equipment | $ | 1,369,318 | $ | 1,248,081 | $ | 1,189,082 | $ | 1,169,476 | $ | 1,132,754 | ||||||||||
Total assets (at period end) | $ | 1,886,241 | $ | 1,949,337 | $ | 1,888,564 | $ | 2,010,403 | $ | 1,784,983 | ||||||||||
Long term debt (at period end) | $ | 490,160 | $ | 488,250 | $ | 541,381 | $ | 1,124 | $ | 1,170 | ||||||||||
Stockholders' equity/net parent investment | $ | 792,290 | $ | 858,705 | $ | 656,336 | $ | 1,104,451 | $ | 1,118,947 | ||||||||||
Long term debt - percent of capital employed | 38.2 | % | 36.2 | % | 45.2 | % | 0.1 | % | 0.1 | % | ||||||||||
Notes: | ||||||||||||||||||||
(1) For the years ended December 31, 2011 through December 31, 2012, the number of diluted shares used at period end for the calculation is based on the number of shares issued at the date of the Separation from Murphy Oil on August 30, 2013. | ||||||||||||||||||||
27
Item 7. MANAGEMENT’S DISCUSSION AND ANALYSIS OF FINANCIAL CONDITION AND RESULTS OF OPERATIONS
Overview
Management’s Discussion and Analysis of Results of Operations and Financial Condition (“Management’s Discussion and Analysis”) is the Company’s analysis of its financial performance and of significant trends that may affect future performance. It should be read in conjunction with the consolidated and combined financial statements and notes included in this Annual Report on Form 10-K. It contains forward-looking statements including, without limitation, statements relating to the Company’s plans, strategies, objectives, expectations and intentions. The words “anticipate,” “estimate,” “believe,” “budget,” “continue,” “could,” “intend,” “may,” “plan,” “potential,” “predict,” “seek,” “should,” “will,” “would,” “expect,” “objective,” “projection,” “forecast,” “goal,” “guidance,” “outlook,” “effort,” “target” and similar expressions identify forward-looking statements. The Company does not undertake to update, revise or correct any of the forward-looking information unless required to do so under the federal securities laws. Readers are cautioned that such forward-looking statements should be read in conjunction with the Company’s disclosures under “Forward-Looking Statements” and “Risk Factors” included elsewhere in this Annual Report on Form 10-K.
For purposes of this Management’s Discussion and Analysis, references to “Murphy USA”, the “Company”, “we”, “us” and “our” refer to Murphy USA Inc. and its subsidiaries on a consolidated basis. For periods prior to completion of the Separation from Murphy Oil Corporation (“Murphy Oil” ), these terms refer to Murphy Oil’s U.S. retail marketing business and other assets and liabilities that were contributed to Murphy USA in connection with the Separation, including an allocable portion of Murphy Oil’s corporate costs, on a combined basis.
Management’s Discussion and Analysis is organized as follows:
• | Executive Overview—This section provides an overview of our business and the results of operations and financial condition for the periods presented. It includes information on the basis of presentation with respect to the amounts presented in the Management’s Discussion and Analysis and a discussion of the trends affecting our business. |
• | Results of Operations—This section provides an analysis of our results of operations, including the results of our business segments for the three years ended December 31, 2015. |
• | Capital Resources and Liquidity—This section provides a discussion of our financial condition and cash flows as of and for the three years ended December 31, 2015. It also includes a discussion of our capital structure and available sources of liquidity. |
• | Critical Accounting Policies—This section describes the accounting policies and estimates that we consider most important for our business and that require significant judgment. |
Executive Overview
Our Business and Separation from Murphy Oil
Our business consists primarily of the U.S. retail marketing business that was separated from Murphy Oil, our former parent company, plus other assets, liabilities and operating expenses of Murphy Oil that are associated with supporting the activities of the U.S. retail marketing operations. The Separation was completed on August 30, 2013 through the distribution of 100% of the outstanding capital stock of Murphy USA to holders of Murphy Oil common stock on the record date of August 21, 2013. Murphy Oil stockholders of record received one share of Murphy USA common stock for every four shares of Murphy Oil common stock. The Separation was completed in accordance with a separation and distribution agreement entered into between Murphy Oil and Murphy USA. Following the Separation, Murphy Oil retained no ownership interest in Murphy USA.
We market refined products through a network of retail gasoline stores and unbranded wholesale customers. Our owned retail stores are almost all located near Walmart stores and use the brand name Murphy USA®. We also market gasoline and other products at standalone stores under the Murphy Express brand. At December 31, 2015, we had a total of 1,335 Company stores in 24 states, principally in the Southwest, Southeast and Midwest United States.
28
In conjunction with the Separation, Murphy Oil received a private letter ruling from the Internal Revenue Service to the effect that the distribution will not result in any taxable income, gain or loss to Murphy Oil, except for taxable income or gain arising as a result of certain intercompany transactions, and no gain or loss will be recognized by (and no amount will be included in the income of) U.S holders of Murphy Oil common stock upon their receipt of shares of Murphy USA common stock in the distribution, except with respect to cash received in lieu of fractional shares of Murphy USA common stock.
Basis of Presentation
Murphy USA was incorporated in March 2013 in contemplation of the Separation, and until the Separation was completed on August 30, 2013, it had not commenced operations and had no material assets, liabilities or commitments. Accordingly, the financial information presented in this Management’s Discussion and Analysis and the accompanying consolidated and combined financial statements reflect the combined historical results of operations, financial position and cash flows of the Murphy Oil subsidiaries and certain assets, liabilities, and operating expenses of Murphy Oil that comprise Murphy USA, as described above, as if such companies and accounts had been combined for all periods presented prior to August 30, 2013.
For the period prior to Separation, the consolidated and combined income statements also include expense allocations for certain corporate functions historically performed by Murphy Oil, including allocations of general corporate expenses related to executive oversight, accounting, treasury, tax, legal, procurement and information technology. These allocations are based primarily on specific identification, headcount or computer utilization. Murphy USA’s management believes the assumptions underlying the consolidated and combined financial statements, including the assumptions regarding allocating general corporate expenses from Murphy Oil, are reasonable. However, these consolidated and combined financial statements may not include all of the actual expenses that would have been incurred had the Company been a stand-alone company during the period prior to Separation and may not reflect the combined results of operations, financial position and cash flows had the Company been a stand-alone company during the entirety of the periods presented.
Actual costs that would have been incurred if Murphy USA had been a stand-alone company would depend upon multiple factors, including organizational structure and strategic decisions made in operational areas, including information technology and infrastructure.
The consolidated financial statements reflect our financial results for all periods subsequent to the Separation while the combined financial statements reflect our financial results for all periods prior to the Separation. Accordingly:
• | Our consolidated and combined statement of income and comprehensive income for the year ended December 31, 2013, consists of the consolidated results of Murphy USA for the four months ended December 31, 2013 and the combined results of Murphy Oil’s U.S. retail marketing business for the eight months ended August 31, 2013. |
• | Our consolidated and combined statement of cash flows for the year ended December 31, 2013, consists of the consolidated results of Murphy USA for the four months ended December 31, 2013 and the combined results of Murphy Oil’s U.S. retail marketing business for the eight months ended August 31, 2013. |
• | Our consolidated and combined statement of changes in equity for the year ended December 31, 2013, consists of both the combined activity for Murphy Oil’s U.S. retail marketing business prior to August 30, 2013, and the consolidated activity of Murphy USA subsequent to the Separation. |
Trends Affecting Our Business
Our operations are significantly impacted by the gross margins we receive on our fuel sales. These gross margins are commodity-based, change daily and are volatile. While we expect our total fuel sales volumes to grow and the gross margins we realize on those sales to remain strong, these gross margins can change rapidly due to many factors. These factors include, but are not limited to, the price of refined products, interruptions in supply caused by severe weather, severe refinery mechanical failures for an extended period of time, and competition in the local markets in which we operate.
The cost of our main sales products, gasoline and diesel, is greatly impacted by the cost of crude oil in the United States. Generally, rising prices for crude oil increase the Company’s cost for wholesale fuel products purchased. When wholesale fuel costs rise, the Company is not always able to immediately pass these price
29
increases on to its retail customers at the pump, which in turn squeezes the Company’s sales margin. Also, rising prices tend to cause our customers to reduce discretionary fuel consumption, which tends to reduce our fuel sales volumes. Crude oil prices in 2015 started the year around $50 per barrel and rose 20% by mid-year before beginning a nearly 40% fall to the upper $30 per barrel range by December 2015. Margins in 2015 averaged the mid-point of our recent historical average of 12.5 cents per gallon due to this volatility.
In addition, our revenues are impacted by our ability to leverage our diverse supply infrastructure in pursuit of obtaining the lowest cost of fuel supply available; for example, activities such as blending bulk fuel with ethanol and bio-diesel to capture and subsequently sell Renewable Identification Numbers (“RINs”). Under the Energy Policy Act of 2005, the U.S.Environmental Protection Agency (“EPA”) is authorized to set annual quotas establishing the percentage of motor fuels consumed in the United States that must be attributable to renewable fuels. Companies that blend fuels are required to demonstrate that they have met any applicable quotas by submitting a certain amount of RINs to the EPA. RINs in excess of the set quota (as well as RINs captured by companies such as ours that are not subject to quotas) can then be sold in a market for RINs at then-prevailing prices. The market price for RINs fluctuates based on a variety of factors, including but not limited to governmental and regulatory action. In recent historical periods, we have benefited by our ability to attain RINs and sell them at favorable prices in the market. RIN prices jumped late in 2015 as a result of governmental action related to standards for 2014-2016. Our business model does not depend on our ability to generate revenues from RINs. Revenue from the sales of RINs is included in “Other operating revenues” in the Consolidated and Combined Income Statements.
In August 2013, in connection with the Separation, we incurred $650 million of new debt from the issuance of senior secured notes and borrowings under the credit facilities, which we used to finance a cash dividend to Murphy Oil immediately prior to the Separation. We have already repaid $150 million of this debt, which was represented by a term loan. We believe that we will generate sufficient cash from operations to fund our ongoing operating requirements. We expect to use the credit facilities to provide us with available financing intended to meet any ongoing cash needs in excess of internally generated cash flows. To the extent necessary, we will borrow under these facilities to fund our ongoing operating requirements. At December 31, 2015, we have additional available capacity under the committed $450 million credit facilities (subject to the borrowing base), together with capacity under a $200 million incremental uncommitted facility. There can be no assurances, however, that we will generate sufficient cash from operations or be able to draw on the credit facilities, obtain commitments for our incremental facility and/or obtain and draw upon other credit facilities.
On December 21, 2012, we signed an agreement with Walmart providing for the potential purchase of land to develop new Company stores located adjacent to existing Walmart stores in Walmart’s core market area covering the Southwest, Southeast, and Midwest United States. The construction program is expected to be completed in 2017 relative to these 2012 sites. In connection with this agreement, we expect to incur additional station operating and depreciation expenses due to the addition of new stores. However, we can provide no assurance that we will develop all or any of the sites as contemplated under the agreement. See “Risk Factors – Risk Relating to Our Business – Our ability to continue to generate revenue and operating income depends on our continued relationship with Walmart” in this Annual Report on Form 10-K. The Company currently anticipates total capital expenditures (including purchases of Walmart properties and other land for future development) for the full year 2016 to range from approximately $250 million to $300 million depending on how many new sites are completed. We intend to fund our capital program in 2016 primarily using operating cash flow, but will supplement funding where necessary using borrowings under available credit facilities.
We believe that our business will continue to grow in the future as we expect to build additional locations in close proximity to Walmart stores and other locations chosen by our real estate development team that have the characteristics we look for in a strong site. The pace of this growth is continually monitored by our management, and these plans can be altered based on operating cash flows generated and the availability of debt facilities.
Seasonality
Our business has inherent seasonality due to the concentration of our retail sites in certain geographic areas, as well as customer behaviors during different seasons. In general, sales volumes and operating incomes are highest in the second and third quarters during the summer activity months and lowest during the winter months.
Business Segments
Our business is organized into one reporting segment (Marketing). The Marketing segment includes our retail marketing sites and product supply and wholesale assets. Prior to December 2013, we also had an Ethanol
30
segment which consisted of our ethanol production facilities located in Hankinson, North Dakota and in Hereford, Texas. After the Hankinson facility was sold in December 2013, we reassessed our segments and due to its small size, we included the remainder of the former Ethanol segment in prior “Corporate” section which has been renamed “Corporate and other assets”. Therefore, we have restated our segments for 2013 and all prior periods to reflect one remaining reporting segment, Marketing. The Hereford ethanol plant was sold in November 2015 and it was removed from the "Corporate and other assets" category and reclassified as Discontinued Operations for all periods presented.
For operating segment information, see Note 21 “Business Segments” in the accompanying audited consolidated and combined financial statements for the three-year period ended December 31, 2015.
Results of Operations
Consolidated and Combined Results
For the year ended December 31, 2015, the Company reported net income of $176.3 million or $4.02 per diluted share on revenue of $12.70 billion. Net income was $243.9 million for 2014 or $5.26 per diluted share on $16.99 billion in revenue.
A summary of the Company’s earnings by business segment follows:
Year ended December 31, | |||||||||||
(thousands of dollars) | 2015 | 2014 | 2013 | ||||||||
Marketing | $ | 159,796 | $ | 242,434 | $ | 164,013 | |||||
Corporate and other assets | (22,205 | ) | (19,473 | ) | (9,878 | ) | |||||
Subtotal | 137,591 | 222,961 | 154,135 | ||||||||
Discontinued operations | 38,749 | 20,902 | 80,898 | ||||||||
Net income | $ | 176,340 | $ | 243,863 | $ | 235,033 | |||||
Net income for 2015 decreased compared to 2014 primarily due to:
• | Lower retail fuel margins and per site volumes in the 2015 period; |
• | Lower contribution from Product Supply & Wholesale business (excluding RINs) in 2015 compared to 2014; and |
• | Higher SG&A expenses in the current year. |
Net income for 2014 increased compared to 2013 primarily due to:
• | Higher retail fuel margins in the 2014 period; |
• | Increased sales volumes in in total and on a per site basis in 2014. |
• | Higher contribution from the Hereford ethanol facility recorded in Discontinued operations in 2014; and |
• | Improved merchandise margin dollars in 2014. |
2015 versus 2014
Revenues for the year ended December 31, 2015 declined $4.29 billion, or 25.2%, compared to 2014. Leading the decline was a decrease in retail fuel prices of 98 cents per gallon (cpg) for the full year combined with lower wholesale prices. Lower wholesale volumes for the year also played a part in the decline but were partially offset by increases in retail fuel volumes of 3.6% in total, partially due to increased store count.
Cost of sales on a combined basis declined $4.19 billion, or 26.3%, compared to 2014. This decline was due to significantly lower wholesale prices of motor fuel for both retail and wholesale as a result of the large decline in crude oil prices in the latter half of the year.
Station and other operating expenses were higher in 2015 than in 2014 due primarily to the addition of 73 new stores in 2015 compared to 60 stores added in 2014. On an average per store month (APSM) basis, the expenses applicable to the retail marketing business decreased 4.1% in 2015. The largest area of decrease was in
31
credit card expenses which were down significantly due to lower retail prices. This decrease was partially offset by higher maintenance expense as we invested more in site upgrades.
Selling, general and administrative expenses for 2015 were higher by $10.0 million. The 2015 amount contained higher professional fees and other costs associated with the Company's business improvement initiatives.
Interest expense in 2015 decreased by $3.1 million compared to 2014 due to 2014 containing a partial year of interest expense on the term loan that was paid off in May 2014. The 2015 period also benefited by not having a a charge of $1.9 million related to a write-off of deferred debt costs for the repaid term loan in 2014.
Other nonoperating income (expense) is down $10.6 million in the current year due primarily to settlement of an outstanding legal case in 2014 that did not recur.
Income tax expense is lower in 2015 by $35.7 million due to lower pre-tax earnings in 2015. The effective rate in 2015 is 37.0% compared to an effective rate of 34.3% for 2014. The 2014 rate benefited from a state income tax benefit of $6.8 million and $9.8 million in tax benefits related to settlement of tax contingencies and other matters that did not exist in 2015 results.
Income from discontinued operations is higher in the 2015 period by $17.8 million as the 2014 amount contained income from operations of Hereford only while the 2015 amount includes the earnings from operations and the gain on sale of the Hereford facility.
2014 versus 2013
Revenues for the year ended December 31, 2014 decreased $828 million, or 4.6%, compared to 2013. Leading the decline was a decrease in retail fuel prices of 16.5 cpg for the full year combined with lower wholesale prices. Lower wholesale volumes for the year also played a part in the decline but were partially offset by increases in retail fuel volumes of 4.8% in total, partially due to increased store count.
Cost of sales on a combined basis decreased $953 million, or 5.6%, compared to 2013. This decline was due to significantly lower wholesale prices of motor fuel for both retail and wholesale as a result of the large decline in crude oil prices in the latter half of the year.
Station and other operating expenses were higher in 2014 than in 2013 due primarily to the addition of 60 new stores in 2014 compared to 39 stores in 2013. On an average per store month (APSM) basis, the expenses applicable to the retail marketing business increased 1.7% in 2014. The largest area of increase was in maintenance expense as we invested more in site upgrades and repairs to reinvest in our brand image.
Selling, general and administrative expenses for 2013 were lower by $10.2 million. The 2013 amount contained $15.4 million of spin related and other one-time, non-recurring charges. After adjusting for those items, selling, general and administrative expense in 2014 is slightly higher by $5.2 million which was primarily related to higher employee benefit costs.
Interest expense in 2014 increased by $22.1 million compared to 2013 due to 2014 containing a full year of interest expense on the debt issued by the Company at the separation date from Murphy Oil. The 2014 interest expense benefited by the May 2014 payoff of the remainder of the term loan of $150 million that was paid off over 2 years early. The 2014 period also includes a charge of $1.9 million related to a write-off of deferred debt costs for the recently repaid term loan.
Other nonoperating income is up $10.0 million in the current year due primarily to settlement of an outstanding legal case in 2014.
Income tax expense is higher in 2014 by $16.3 million due to higher pre-tax earnings in 2014. The effective rate in 2014 is 34.3% compared to an effective rate of 39.4% for 2013. The 2014 rate benefited from a state income tax benefit of $6.8 million and $9.8 million in tax benefits related to tax contingencies and other matters that did not exist in 2013 results.
Income from discontinued operations is lower in the 2014 period by $60.0 million as the 2013 amount contained income from operations of Hankinson for the majority of the year combined with the gain on sale. The amounts in 2014 represent the settlement of final working capital balances which resulted in a small gain on an after-tax basis for Hankinson plus the income from the operations of Hereford.
32
Segment Results
Marketing
Net income in the Marketing segment for 2015 decreased $82.6 million, or 34.1%, over 2014. The primary reason for this decrease was a significant decrease in results from retail marketing due to the higher retail margins experienced in 2014. These improved results were partially offset by lower performance from the product supply and wholesale operations of the Company.
The table below shows the results for the Marketing segment for the three years ended December 31, 2015 along with certain key metrics for the segment.
(Thousands of dollars, except volume per store month and margins) | Years Ended December 31, | ||||||||||
Marketing Segment | 2015 | 2014 | 2013 | ||||||||
Revenues | |||||||||||
Petroleum product sales | $ | 10,304,689 | $ | 14,728,527 | $ | 15,560,317 | |||||
Merchandise sales | 2,273,888 | 2,161,378 | 2,159,466 | ||||||||
Other | 120,547 | 95,998 | 94,298 | ||||||||
Total revenues | $ | 12,699,124 | $ | 16,985,903 | $ | 17,814,081 | |||||
Costs and operating expenses | |||||||||||
Petroleum product cost of goods sold | 9,794,475 | 14,074,579 | 15,009,955 | ||||||||
Merchandise cost of goods sold | 1,946,423 | 1,859,732 | 1,877,630 | ||||||||
Station and other operating expenses | 486,383 | 486,761 | 460,475 | ||||||||
Depreciation and amortization | 81,348 | 74,906 | 71,253 | ||||||||
Selling, general and administrative | 129,277 | 119,266 | 129,600 | ||||||||
Accretion of asset retirement obligations | 1,521 | 1,200 | 1,096 | ||||||||
Total costs and operating expenses | $ | 12,439,427 | $ | 16,616,444 | $ | 17,550,009 | |||||
Income from operations | 259,697 | 369,459 | 264,072 | ||||||||
Other income (expense) | |||||||||||
Interest expense | (20 | ) | — | — | |||||||
Gain (loss) on sale of assets | (4,658 | ) | 194 | 5,995 | |||||||
Other nonoperating income | 434 | 438 | 169 | ||||||||
Total other income (expense) | $ | (4,244 | ) | $ | 632 | $ | 6,164 | ||||
Income from continuing operations | |||||||||||
before income taxes | 255,453 | 370,091 | 270,236 | ||||||||
Income tax expense | 95,657 | 127,657 | 106,223 | ||||||||
Income from continuing operations | $ | 159,796 | $ | 242,434 | $ | 164,013 | |||||
Twelve Months Ended December 31, | |||||||||||
Key Operating Metrics | 2015 | 2014 | 2013 | ||||||||
Retail fuel volume - chain (Million gal per year) | 4,123.8 | 3,980.8 | 3,800.3 | ||||||||
Retail fuel volume - per site (K gal APSM) | 267.9 | 270.4 | 268.5 | ||||||||
Retail fuel margin (cpg excl credit card fees) | 12.5 | 15.8 | 13.0 | ||||||||
Retail fuel contribution ($K APSM) | $ | 33.5 | $ | 42.8 | $ | 35.0 | |||||
PS&W contribution ($ Millions excl RINs) | $ | (16.8 | ) | $ | 13.4 | $ | 36.3 | ||||
RIN sales ($ Millions) | $ | 117.5 | $ | 92.9 | $ | 91.4 | |||||
33
Twelve Months Ended December 31, | |||||||||||
Key Operating Metrics | 2015 | 2014 | 2013 | ||||||||
Total merchandise sales ($ Millions) | $ | 2,273.9 | $ | 2,161.4 | $ | 2,159.5 | |||||
Total merchandise contribution ($ Millions) | $ | 327.5 | $ | 301.6 | $ | 281.8 | |||||
Total merchandise sales ($K APSM) | $ | 147.7 | $ | 146.8 | $ | 152.5 | |||||
Merchandise unit margin (%) | 14.4 | % | 14.0 | % | 13.1 | % | |||||
Tobacco contribution ($K APSM) | $ | 12.53 | $ | 12.45 | $ | 12.38 | |||||
Non-tobacco contribution ($K APSM) | $ | 8.74 | $ | 8.04 | $ | 7.53 | |||||
Total merchandise contribution ($K APSM) | $ | 21.27 | $ | 20.49 | $ | 19.91 | |||||
2015 versus 2014
Total fuel volumes for the years ended December 31, 2015 were up 3.6%. Retail fuel volumes in 2015 on an APSM basis were lower by 0.9% compared to 2014. The decline in retail volumes on an APSM basis was due to no repeat of the enhanced Walmart discount that ran during parts of 2014.
The Marketing segment had total revenues of $12.7 billion in 2015 compared to approximately $17.0 billion in 2014, a decrease of $4.3 billion. Revenue amounts included excise taxes collected and remitted to government authorities of $1.9 billion in 2015 and 2014. Total fuel sales volumes per station averaged 267,910 gallons per month in 2015, down 0.9% from 270,416 gallons per month in the prior year. Fuel margin decreased in 2015 to 12.5 cpg, compared to 15.8 cpg in the prior year. The lower fuel margins in the period were attributed to less volatility in 2015 compared to the record setting margins in late 2014. Total product supply and wholesale margin dollars excluding RINs declined substantially in the current year. These product supply and wholesale margin dollars do not include $19.1 million and $20.0 million of combined operating expense and SG&A costs for the years ended December 31, 2015 and 2014, respectively. Also impacting operating income positively in the year ended December 31, 2015 was sale of RINs of $117.5 million compared to $92.9 million in the prior year. During 2015, 218 million RINs were sold at an average selling price of $0.54 per RIN compared to 2014 when 196 million RINs sold at an average price of $0.48 each.
Merchandise sales were up 5.2% in 2015 to $2.3 billion. Merchandise margins increased 0.4%, from 14.0% in the 2014 period to 14.4% in 2015. This improvement in margin was caused by increased sales of higher margin non-tobacco items that combined with higher margins on tobacco items other than cigarettes. Total non-tobacco sales revenues increased 13.3% and related margin dollars increased 13.6% year over year. Categories showing the most improvement in 2015 include dispensed beverages, beer, wine and liquor, and general merchandise. On an APSM basis, total merchandise sales were down 0.6% with tobacco products down 1.5%, partially offset by a 8.3% increase in non-tobacco sales. Total margins on an APSM basis for 2015 were up 3.8% with tobacco margins up 0.7%, combined with a 8.7% increase in non-tobacco margins.
Station and other operating expenses decreased $0.4 million in 2015 compared to 2014 levels, a decrease of 0.1%. This decrease was due mainly to lower credit card expense in 2015 caused by lower retail prices. This decline was partially offset by higher store counts in the 2015 period. The largest area of increase within station and other operating expenses was related to maintenance expense in the 2015 period compared to the prior year. The 2015 contained higher charges for maintenance related to site upgrades and repairs. Excluding credit card fees on an APSM basis, station and other operating expenses at the retail level were essentially flat compared to 2014 levels.
Depreciation and amortization increased $6.4 million in 2015, an increase of 8.6%. This increase was caused by more stores operating in the 2015 period compared to the prior year.
Selling, general and administrative expenses increased $10.0 million in 2015 compared to 2014. The higher SG&A costs in 2015 reflect professional fees and other costs associated with the Company's business improvement initiatives.
34
2014 versus 2013
Total fuel volumes for the years ended December 31, 2014 and 2013 were 3.98 billion gallons and 3.80 billion gallons, respectively. Retail fuel volumes in 2014 on an APSM basis were higher by 0.7% compared to 2013. The improvement in retail volumes on an APSM was due to decreasing retail prices in the last six months of 2014 combined with an increase of a partial month in the duration of the Walmart discount program year over year.
The Marketing segment had total revenues of $17.0 billion in 2014 compared to approximately $17.8 billion in 2013, a decrease of $0.8 billion. Revenue amounts included excise taxes collected and remitted to government authorities of $1.9 billion in 2014 and 2013. Total fuel sales volumes per station averaged 270,416 gallons per month in 2014, up 0.7% from 268,458 gallons per month in the prior year. Fuel margin increased in 2014 to 15.8 cpg, compared to 13.0 cpg in the prior year. The higher fuel margins in the period were attributed to decreasing wholesale prices in the latter half of 2014, which caused margins to expand from prior year levels. Total product supply and wholesale margin dollars excluding RINs were $13.4 million in the year ended December 31, 2014 period compared to $36.3 million in 2013. These product supply and wholesale margin dollars do not include $19.1 million and $20.0 million of combined operating expense and SG&A costs for the years ended December 31, 2014 and 2013, respectively. Also impacting operating income positively in the year ended December 31, 2014 was sale of RINs of $92.9 million compared to $91.4 million in the prior year. During 2014, 195 million RINs were sold at an average selling price of $0.48 per RIN.
Merchandise sales were essentially flat in 2014 at $2.2 billion, up $1.9 million from 2013 levels. Merchandise margins increased 0.9%, from 13.1% in the 2013 period to 14.0% in 2014. This improvement in margin was caused by increased sales of higher margin non-tobacco items that combined with higher margins on tobacco items other than cigarettes. Total non-tobacco sales revenues increased 9.6% and related margin dollars increased 11.1% year over year. Categories showing the most improvement in 2014 include dispensed beverages, beer, wine and liquor, and general merchandise. On an APSM basis, total merchandise sales were down 3.8% with tobacco products down 6.0%, partially offset by a 5.4% increase in non-tobacco sales. Total margins on an APSM basis for 2014 were up 2.9% with tobacco margins up 0.5%, combined with a 6.9% increase in non-tobacco margins.
Station and other operating expenses increased $26.3 million in 2014 compared to 2013 levels, an increase of 5.7%. This increase was due mainly to higher store counts in the 2014 period. The largest area of increase within station and other operating expenses was related to maintenance expense in the 2014 period compared to the prior year. The 2014 period contained higher charges for maintenance related to site upgrades and repairs to reinvest in our brand image. Excluding credit card fees on an APSM basis, station and other operating expenses at the retail level only increased 0.9% over 2013 levels.
Depreciation and amortization increased $3.7 million in 2014, an increase of 5.1%. This increase was caused by more stores operating in the 2014 period compared to the prior year.
Selling, general and administrative expenses decreased $10.3 million in 2014 compared to 2013. The 2013 period contained $15.4 million of spin-related and other one-time, non-recurring costs. After considering the $15.4 million of costs in the prior year, the 2014 period had higher costs of $5.1 million which was primarily caused by higher employee benefit costs in 2014.
Corporate and other assets
2015 versus 2014
After-tax net income for Corporate and other assets declined in 2015 to a loss of $22.2 million compared to a loss of $19.5 million in 2014. The 2015 year included interest expense of $33.5 million compared to interest expense in 2014 of $36.6 million. The reduction in interest expense in 2015 was due to the term loan that was repaid in May 2014 and no repeat of a write-off of deferred debt cost of $1.9 million related to the term loan. The 2014 amounts included settlement of a legal case which did not recur in 2015.
2014 versus 2013
After-tax net income for Corporate and other assets improved in 2014 to a loss of $19.5 million compared to a loss of $9.9 million in 2013. The 2014 year included income from settlement of a legal case which was nearly offset by the increased interest expense in the Corporate and other assets area due to a full year of outstanding debt. Also included in 2014 was a charge of $1.9 million related to write-off of deferred debt costs for the term loan
35
that was repaid in 2014. Interest expense in 2014 was $36.6 million, an increase of $22.1 million due to a full year of debt outstanding in the current year.
Discontinued Operations
2015 versus 2014
For 2015, discontinued operations contains the results of operations of Hereford for the 11 months of operation prior to the sale and the gain on sale of the plant, net of tax of $38.7 million. The operations of the plant generated income before tax of $3.2 million in 2015 compared to income from operations of $20.1 million in 2014. On a pre-tax basis, the gain on the sale of Hereford was $60.8 million.
2014 versus 2013
Discontinued operations in 2014 related to the final adjustments to working capital from the sale of the Hankinson plant, resulting in a gain of $0.8 million, net of tax, for 2014. The 2014 year included income from the Hereford plant of $20.1 million. Hereford improved its contribution by $17.2 million in 2014 due to improved operations with 3% higher yields for the year and higher crush spreads. See Note 4 “Discontinued Operations” in the accompanying audited consolidated and combined financial statements for more information on the disposed assets.
Non-GAAP Measures
The following table sets forth the Company’s Adjusted EBITDA for the three years ended December 31, 2015. EBITDA means net income (loss) plus net interest expense, income tax expense, and depreciation and amortization, and Adjusted EBITDA adds back (i) other non-cash items (e.g., impairment of properties and accretion of asset retirement obligations) and (ii) other items that management does not consider to be meaningful in assessing our operating performance (e.g., (income) from discontinued operations, gain (loss) on sale of assets and other non-operating expense (income)). EBITDA and Adjusted EBITDA are not measures that are prepared in accordance with U.S. generally accepted accounting principles (GAAP).
We use EBITDA and Adjusted EBITDA in our operational and financial decision-making, believing that such measures are useful to eliminate certain items in order to focus on what we deem to be a more reliable indicator of ongoing operating performance and our ability to generate cash flow from operations. Adjusted EBITDA is also used by many of our investors, research analysts, investment bankers, and lenders to assess our operating performance. However, non-GAAP financial measures are not a substitute for GAAP disclosures, and Adjusted EBITDA may be prepared differently by us than by other companies using similarly titled non-GAAP measures.
The reconciliation of net income to EBITDA and Adjusted EBITDA follows:
Years Ended December 31, | |||||||||||
(Thousands of dollars) | 2015 | 2014 | 2013 | ||||||||
Net income | $ | 176,340 | $ | 243,863 | $ | 235,033 | |||||
Income taxes | 80,698 | 116,386 | 100,059 | ||||||||
Interest expense, net of interest income | 31,354 | 36,402 | 13,410 | ||||||||
Depreciation and amortization | 86,568 | 79,087 | 74,053 | ||||||||
EBITDA | 374,960 | 475,738 | 422,555 | ||||||||
(Income) loss from discontinued operations, net of taxes | (38,749 | ) | (20,903 | ) | (80,898 | ) | |||||
Impairment of properties | — | — | — | ||||||||
Accretion of asset retirement obligations | 1,521 | 1,200 | 1,096 | ||||||||
(Gain) loss on sale of assets | 4,658 | (194 | ) | (5,995 | ) | ||||||
Other nonoperating income (loss) | 463 | (10,166 | ) | (169 | ) | ||||||
Adjusted EBITDA | $ | 342,853 | $ | 445,675 | $ | 336,589 | |||||
36
The Company also considers Free Cash Flow in the operation of its business. Free cash flow is defined as net cash provided by operating activities in a period minus payments for property and equipment made in that period. Free cash flow is also considered a non-GAAP financial measure. Management believes, however, that free cash flow, which measures our ability to generate additional cash from our business operations, is an important financial measure for us in evaluating the Company’s performance. Free cash flow should be considered in addition to, rather than as a substitute for consolidated net income as a measure of our performance and net cash provided by operating activities as a measure of our liquidity.
Numerous methods may exist to calculate a company’s free cash flow. As a result, the method used by our management to calculate our free cash flow may differ from the methods other companies use to calculate their free cash flow. The following table provides a reconciliation of free cash flow, a non-GAAP financial measure, to net cash provided by operating activities, which we believe to be the GAAP financial measure most directly comparable to free cash flow:
Years Ended December 31, | |||||||||||
(Thousands of dollars) | 2015 | 2014 | 2013 | ||||||||
Net cash provided by continuing operations | $ | 233,725 | $ | 276,706 | $ | 276,140 | |||||
Payments for property and equipment | (205,225 | ) | (135,339 | ) | (163,303 | ) | |||||
Free cash flow | $ | 28,500 | $ | 141,367 | $ | 112,837 | |||||
Capital Resources and Liquidity
Significant sources of capital
As of December 31, 2015, we had $102.3 million of cash and cash equivalents. Our cash management policy provides that cash balances in excess of a certain threshold are reinvested in certain types of low-risk investments.
Not included in the 2015 year-end cash balance is restricted cash of $68.6 million related to unspent sales proceeds from the Hereford ethanol plant sale that are currently being held by a third party trustee in order for the Company to participate in like-kind exchange transactions to defer tax gain on the sale of the plant. This restricted cash is included in non-current assets on the balance sheet at December 31, 2015.
We obtained borrowing capacity under a committed $450 million asset based loan facility (the “ABL facility”) (subject to the borrowing base) and a $150 million term facility, as well as a $200 million incremental uncommitted facility. As described below, concurrent with the Separation, we borrowed $150 million under the term facility, the proceeds of which were used, together with the net proceeds of the issuance of senior unsecured notes, to finance a $650 million cash dividend to Murphy Oil. The $150 million term facility has been fully repaid as of May 2014. At December 31, 2015 we had $450 million of borrowing capacity that we could utilize for working capital and other general corporate purposes, including to the support of our operating model as described herein. Our borrowing base is approximately $134.5 million based on December 31, 2015 balance sheet information. See “Debt – Credit Facilities” for the calculation of our borrowing base.
We believe our short-term and long-term liquidity is adequate to fund not only our operations, but also our anticipated near-term and long-term funding requirements, including capital spending programs, execution of announced share repurchase programs, potential dividend payments, repayment of debt maturities and other amounts that may ultimately be paid in connection with contingencies.
Cash presented on our combined balance sheets prior to the Separation represented cash on hand at our retail locations, cash that had not yet been transferred to Murphy Oil and cash held by us at our ethanol manufacturing operations at that time. We reflected transfers of cash to and from Murphy Oil’s cash management system as a component of net parent investment on our consolidated balance sheets, and these net transfers of cash were reflected as a financing activity in our combined statements of cash flows.
Operating Activities
Net cash provided by operating activities was $215.8 million for the year ended December 31, 2015 and $305.6 million for the comparable period in 2014, a decrease of 29.4%, primarily because of lower net income and higher increase in noncash working capital. Net income declined $67.5 million in 2015 compared to 2014 and the amount of cash generated from drawdown of working capital in the 2015 period declined by $10.1 million. Net cash provided by operating activities was $356.7 million in 2013. The primary reason for changes in the amounts
37
between 2014 and 2013 related to improved operating performance and decrease of accounts payable in 2014 and timing of month end compared to our receivables positions. Included in net cash provided by operating activities were cash flows required by discontinued operations of $17.9 million in 2015 and cash flows provided by discontinued operations of $28.9 million in 2014, and $80.6 million in 2013. These cash flows provided by discontinued operations were generated from the recently disposed Hankinson and Hereford ethanol operations in each year.
Investing Activities
For the year ended December 31, 2015, cash required by investing activities was $189.6 million compared to cash required by investing activities of $149.4 million in 2014. The investing cash required increase of $40.2 million in 2015 was primarily due to higher capital expenditures in 2015. Capital expenditures in 2015 required cash of $205.2 million compared to $135.3 million in 2014. More landbank locations were acquired in 2015 along with a higher number of stores constructed which resulted in the higher capital expenditures.
In 2014, cash required by investing activities was $149.4 million while 2013 provided cash from investing activities of $12.9 million due primarily to the sale of the Hankinson ethanol plant in 2013. For 2013, virtually all of the cash used for investing activities related to capital expenditures to build 37 retail marketing locations and ethanol plant improvements.
Financing activities
Financing activities in the year ended December 31, 2015 used cash of $252.0 million compared to use of $122.8 million in the year ended December 31, 2014. This increased use of cash was due to increased share repurchases in 2015 of $248.7 million. Net cash required by financing activities in 2013 was $132.2 million. In 2013, virtually all of the change was due to movements in accounts related to the repayment of debt and Net Parent Investment between Murphy USA and Murphy Oil.
Debt
In connection with the Separation, we incurred an aggregate of $650 million in long-term debt, the proceeds of which we used to finance a cash dividend to Murphy Oil that was paid on the separation date. Our long-term debt at December 31, 2015 and 2014 was as set forth below:
December 31, | ||||||||
(Thousands of dollars) | 2015 | 2014 | ||||||
6% senior notes due 2023 (net of unamortized discount of $6,692 at 2015 and $7,557 at 2014) | $ | 493,308 | $ | 492,443 | ||||
Less unamortized debt issuance costs | (3,526 | ) | (4,193 | ) | ||||
Total notes payable, net | 489,782 | 488,250 | ||||||
Capitalized lease obligations, vehicles, due through 2018 | 600 | — | ||||||
Less current maturities | (222 | ) | — | |||||
Total long-term debt | $ | 490,160 | $ | 488,250 | ||||
Senior Notes
On August 14, 2013, Murphy Oil USA, Inc., our primary operating subsidiary, issued 6.00% Senior Notes due 2023 (the “Senior Notes”) in an aggregate principal amount of $500 million. The Senior Notes are fully and unconditionally guaranteed by Murphy USA, and are guaranteed by certain 100% owned subsidiaries that guarantee our credit facilities. The indenture governing the Senior Notes contains restrictive covenants that limit, among other things, the ability of Murphy USA, Murphy Oil USA, Inc. and the restricted subsidiaries to incur additional indebtedness or liens, dispose of assets, make certain restricted payments or investments, enter into transactions with affiliates or merge with or into other entities.
The Senior Notes and the guarantees rank equally with all of our and the guarantors’ existing and future senior unsecured indebtedness and effectively junior to our and the guarantors’ existing and future secured indebtedness (including indebtedness with respect to the credit facilities) to the extent of the value of the assets securing such indebtedness. The Senior Notes are structurally subordinated to all of the existing and future third-party liabilities, including trade payables, of our existing and future subsidiaries that do not guarantee the notes.
38
We used the net proceeds of the Senior Notes, together with borrowings under the credit facilities, to finance a cash dividend of $650 million from Murphy Oil USA, Inc. to Murphy Oil paid in connection with the Separation.
On June 17, 2014, we closed an exchange offer for our Senior Notes to make them eligible for public resale, as required by a registration rights agreement entered into in connection with the issuance of the Senior Notes. All of the Senior Notes were tendered for exchange.
Credit Facilities
On August 30, 2013, we entered into a credit agreement, which provides for a committed $450 million asset-based loan (ABL) facility (with availability subject to the borrowing base described below) and a $150 million term facility. It also provides for a $200 million uncommitted incremental facility. On August 30, 2013, Murphy Oil USA, Inc. borrowed $150 million under the term facility, the proceeds of which were used, together with the net proceeds of the offering of the Senior Notes, to finance the $650 million cash dividend to Murphy Oil. The term facility was repaid in full in May 2014. On September 2, 2014, we amended the credit agreement to extend the maturity date to September 2, 2019 and amend the terms of the various covenants.
The borrowing base is expected, at any time of determination, to be an amount (net of reserves) equal to the sum of:
• | 100% of eligible cash at such time, plus |
• | 90% of eligible credit card receivables at such time, plus |
• | 90% of eligible investment grade accounts, plus |
• | 85% of eligible other accounts, plus |
• | 80% of eligible product supply/wholesale refined products inventory at such time, plus |
• | 75% of eligible retail refined products inventory at such time, plus |
the lesser of (i) 70% of the average cost of eligible retail merchandise inventory at such time and (ii) 85% of the net orderly liquidation value of eligible retail merchandise inventory at such time.
The ABL facility includes a $75 million sublimit on swingline loans and a $200 million sublimit for the issuance of letters of credit. Swingline loans and letters of credit issued under the ABL facility reduce availability under the ABL facility.
Interest payable on the credit facilities is based on either:
• | the London interbank offered rate, adjusted for statutory reserve requirements (the “Adjusted LIBO Rate”); or |
• | the Alternate Base Rate, which is defined as the highest of (a) the prime rate, (b) the federal funds effective rate from time to time plus 0.50% per annum and (c) the one-month Adjusted LIBO Rate plus 1.00% per annum, |
•
plus, (A) in the case Adjusted LIBO Rate borrowings, (i) with respect to the ABL facility, spreads ranging from 1.50% to 2.00% per annum depending on the average availability under the ABL facility or (ii) with respect to the term facility, spreads ranging from 2.75% to 3.00% per annum depending on a secured debt to EBITDA ratio and (B) in the case of Alternate Base Rate borrowings, (i) with respect to the ABL facility, spreads ranging from 0.50% to 1.00% per annum depending on the average availability under the ABL facility or (ii) with respect to the term facility, spreads ranging from 1.75% to 2.00% per annum depending on a secured debt to EBITDA ratio.
The interest rate period with respect to the Adjusted LIBO Rate interest rate option can be set at one-, two-, three-, or six-months as selected by us in accordance with the terms of the credit agreement.
The credit agreement contains certain covenants that limit, among other things, the ability of us and our subsidiaries to incur additional indebtedness or liens, to make certain investments, to enter into sale-leaseback transactions, to make certain restricted payments, to enter into consolidations, mergers or sales of material assets and other fundamental changes, to transact with affiliates, to enter into agreements restricting the ability of subsidiaries to incur liens or pay dividends, or to make certain accounting changes. In addition, the credit agreement requires us to maintain a fixed charge coverage ratio of a minimum of 1.0 to 1.0 when availability for at least three consecutive business days is less than the greater of (a) 17.5% of the lesser of the aggregate ABL facility commitments and the borrowing base and (b) $70,000,000 (including as of the most recent fiscal quarter end
39
on the first date when availability is less than such amount). As of December 31, 2015, our fixed charge coverage ratio was 0.59; however, we had no debt outstanding under the facility at that date so the fixed charge coverage ratio currently has no impact on our operations or liquidity. Prior to the repayment of the term loan, we were also subject to a maximum secured debt to EBITDA ratio of 4.5 to 1.0 at any time when term facility commitments or term loans thereunder were outstanding.
After giving effect to the applicable restrictions on certain payments, which could include dividends under the credit agreement (which restrictions are only applicable when availability under the credit agreement does not exceed the greater of 25% of the lesser of the revolving commitments and the borrowing base and $100 million (and if availability under the credit agreement does not exceed the greater of 40% of the lesser of the revolving commitments and the borrowing base and $150 million, then our fixed charge coverage ratio must be at least 1.0 to 1.0) and the indenture, and subject to compliance with applicable law. As of December 31, 2015, the Company's ability to make restricted payments was limited as our availability under the borrowing base was less than $150 million and our fixed charge coverage ratio was less than 1.0 to 1.0. At December 31, 2015, the Company had a shortfall of approximately $245.7 million of its net income and retained earnings subject to such restrictions before the fixed charge coverage ratio would exceed 1.0 to 1.0.
All obligations under the credit agreement are guaranteed by Murphy USA and the subsidiary guarantors party thereto, and all obligations under the credit agreement, including the guarantees of those obligations, are secured by certain assets of Murphy USA, Murphy Oil USA, Inc. and the guarantors party thereto.
Contractual Obligations
The following table summarizes our aggregate contractual fixed and variable obligations as of December 31, 2015.
(Thousands of dollars) | Total | Less than 1 year | 1-3 years | 4-5 years | More than 5 years | |||||||||||||||
Debt obligations (a) | $ | 490,382 | $ | 222 | $ | 368 | $ | 10 | $ | 489,782 | ||||||||||
Operating lease obligations | 136,942 | 23,642 | 19,737 | 19,223 | 74,340 | |||||||||||||||
Purchase obligations (b) | 220,630 | 183,056 | 37,574 | — | — | |||||||||||||||
Asset retirement obligations | 121,160 | — | — | — | 121,160 | |||||||||||||||
Other long-term obligations, including interest on long-term debt | 252,756 | 49,540 | 63,438 | 61,149 | 78,629 | |||||||||||||||
Total | $ | 1,221,870 | $ | 256,460 | $ | 121,117 | $ | 80,382 | $ | 763,911 | ||||||||||
(a) | For additional information, see Note 9 “Long-Term Debt” in the accompanying audited consolidated and combined financial statements. |
(b) | Primarily includes ongoing new retail station construction in progress at December 31, 2015 and commitments to purchase land from Walmart and other landowners. See Note 18 “Commitments” in the audited consolidated and combined financial statements for the year ended December 31, 2015. |
Capital Spending
Capital spending and investments in our Marketing segment relate primarily to the acquisition of land and the construction of new Company stores. Our Marketing capital is also deployed to improve our existing sites, which we refer to as sustaining capital. We also use sustaining capital in this business as needed to ensure reliability and continued performance of our sites. We also invest in our Corporate and other assets segment which is primarily technology related. The following table outlines our capital spending and investments by segment for the three years ended December 31, 2015:
40
(Thousands of dollars) | 2015 | 2014 | 2013 | |||||||||
Marketing: | ||||||||||||
Company stores | $ | 169,144 | $ | 111,174 | $ | 141,221 | ||||||
Terminals | 5,426 | 1,696 | 2,251 | |||||||||
Sustaining capital | 27,801 | 18,269 | 18,579 | |||||||||
Corporate and other assets | 9,477 | 4,200 | 8,169 | |||||||||
Discontinued operations | 3,720 | 3,549 | 1,752 | |||||||||
Total | $ | 215,568 | $ | 138,888 | $ | 171,972 | ||||||
We currently expect capital expenditures for the full year 2016 to range from approximately $250 million to $300 million, including $175 million to $225 million for the retail marketing business, $5 million for product supply and wholesale operations and $30 million for Corporate and other assets needs including our ASaP program initiatives and a remodel of our Corporate headquarters. Also included in this total is approximately $40 million of maintenance capital for a continuation of our refresh program at 300 sites, along with doubling our supercooler installations to 120 locations this year. See Note 18 “Commitments” in the audited consolidated and combined financial statements for the three years ended December 31, 2015 included in this Annual Report on Form 10-K.
Critical Accounting Policies
Impairment of Long-Lived Assets
Individual retail sites are reviewed for impairment periodically or whenever events or circumstances indicate that the carrying amount of an asset may not be recoverable. Our primary indicator that operating store assets may not be recoverable is consistent negative cash flow for a twelve-month period for those retail sites that have been open in the same location for a sufficient period to allow for meaningful analysis of ongoing results. We also monitor other factors when evaluating retail sites for impairment, including individual site execution of operating plans and local market conditions.
When an evaluation is required, the projected future undiscounted cash flows to be generated from each retail site over its remaining economic life are compared to the carrying value of the long-lived assets of that site to determine if a write-down of the carrying value to fair value is required. When determining future cash flows associated with an individual retail site, we make assumptions about key variables such as sales volume, gross margins and expenses. Cash flows vary for each retail site year to year. Changes in market demographics, traffic patterns, competition and other factors impact the overall operations of certain of our individual retail site locations. Similar changes may occur in the future that will require us to record impairment charges. We have not made any material change in the methodology used to estimate future cash flows of retail site locations during the past three years.
Our impairment evaluations are based on assumptions we deem to be reasonable. If the actual results of our retail sites are not consistent with the estimates and judgments we have made in estimating future cash flows and determining fair values, our actual impairment losses could vary positively or negatively from our estimated impairment losses. Providing sensitivity analysis if other assumptions were used in performing the impairment evaluations is not practical due to the significant number of assumptions involved in the estimates.
Tax Matters
We are subject to extensive tax liabilities imposed by multiple jurisdictions, including income taxes, indirect taxes (excise/duty, sales/use, and gross receipts taxes), payroll taxes, franchise taxes, withholding taxes and ad valorem taxes. New tax laws and regulations and changes in existing tax laws and regulations are continuously being enacted or proposed that could result in increased expenditures for tax liabilities that cannot be predicted at this time. In addition, we have received claims from various jurisdictions related to certain tax matters. Tax liabilities include potential assessments of penalty and interest amounts.
We record tax liabilities based on our assessment of existing tax laws and regulations. A contingent loss related to a transactional tax claim is recorded if the loss is both probable and estimable. The recording of our tax liabilities requires significant judgments and estimates. Actual tax liabilities can vary from our estimates for a variety of reasons, including different interpretations of tax laws and regulations and different assessments of the amount of tax due. In addition, in determining our income tax provision, we must assess the likelihood that our deferred tax assets will be recovered through future taxable income. Significant judgment is required in estimating the amount of
41
valuation allowance, if any, that should be recorded against those deferred income tax assets. If our actual results of operations differ from such estimates or our estimates of future taxable income change, the valuation allowance may need to be revised. However, an estimate of the sensitivity to earnings that would result from changes in the assumptions and estimates used in determining our tax liabilities is not practicable due to the number of assumptions and tax laws involved, the various potential interpretations of the tax laws, and the wide range of possible outcomes. The Company is occasionally challenged by taxing authorities over the amount and/or timing of recognition of revenues and deductions in its various income tax returns. Although the Company believes it has adequate accruals for matters not resolved with various taxing authorities, gains or losses could occur in future years from changes in estimates or resolution of outstanding matters. See Note 12 “Income Taxes” in the accompanying audited consolidated and combined financial statements for the three-year period ended December 31, 2015 for a further discussion of our tax liabilities.
Asset Retirement Obligations
We operate above ground and underground storage tanks at our facilities. We recognize the estimated future cost to remove these underground storage tanks (“USTs”) over their estimated useful lives. We record a discounted liability for the fair value of an asset retirement obligation with a corresponding increase to the carrying value of the related long-lived asset at the time a UST is installed. We depreciate the amount added to cost of the property and recognize accretion expense in connection with the discounted liability over the remaining life of the UST.
We have not made any material changes in the methodology used to estimate future costs for removal of a UST during the past three years. We base our estimates of such future costs on our prior experience with removal and normal and customary costs we expect to incur associated with UST removal. We compare our cost estimates with our actual removal cost experience, if any, on an annual basis, and if the actual costs we experience exceed our original estimates, we will recognize an additional liability for estimated future costs to remove the USTs. Because these estimates are subjective and are currently based on historical costs with adjustments for estimated future changes in the associated costs, the dollar amount of these obligations could change as more information is obtained. There were no material changes in our asset retirement obligation estimates during 2015, 2014 or 2013. See also Note 10 “Asset Retirement Obligation” in the accompanying audited consolidated and combined financial statements for the three-year period ended December 31, 2015.
FORWARD-LOOKING STATEMENTS
This Annual Report on Form 10-K contains “forward-looking statements” within the meaning of the Private Securities Litigation Reform Act of 1995. These statements express management’s current views concerning future events or results, including without limitation our anticipated growth strategy, particularly with respect to our Walmart relationship and plans to build additional sites, and our ability to generate revenues, including through the sale of RINs, which are subject to inherent risks and uncertainties. Factors that could cause one or more of these forecasted events not to occur include, but are not limited to, a deterioration in the business or prospects of the U.S. retail marketing business, adverse developments in the U.S. retail marketing business’s markets or adverse developments in the U.S. or global capital markets, credit markets or economies generally the volatility and level of crude oil, corn and other commodity prices, the volatility and level of gasoline prices, customer demand for our products, disruptions in our relationship with Walmart, political and regulatory developments that may be adverse to us, and uncontrollable natural hazards or any of the other factors set forth under the caption “Risk Factors” in this Annual Report on Form 10-K. As a result you should not place undue reliance on forward-looking statements. If any of the forecasted events does not occur for any reason, our business, results of operation, cash flows and/or financial condition may be materially adversely affected.
Item 7A. QUANTITATIVE AND QUALITATIVE DISCLOSURES ABOUT MARKET RISK
Commodity Price Risk
We are exposed to market risks related to the volatility in the price of crude oil, refined products (primarily gasoline and diesel) used in our operations. These fluctuations can affect our revenues and purchases, as well as the cost of operating, investing and financing activities. We make limited use of derivative instruments to manage certain risks related to commodity prices. The use of derivative instruments for risk management is
42
covered by operating policies and is closely monitored by our middle-office function and the Company’s senior management.
As described in Note 14 “Financial Instruments and Risk Management” in the accompanying audited consolidated and combined financial statements, there were short-term commodity derivative contracts in place at December 31, 2015 to hedge the purchase price of refined products. A 10% increase or decrease in the respective benchmark price of the commodities underlying these derivative contracts would have been immaterial to the Company. Changes in the fair value of these derivative contracts generally offset the changes in the value for an equivalent volume of these products.
For additional information about our use of derivative instruments, see Note 14 “Financial Instruments and Risk Management” in our audited consolidated and combined financial statements for the three year period ended December 31, 2015 included in this Annual Report on Form 10-K.
Item 8. FINANCIAL STATEMENTS AND SUPPLEMENTARY DATA
Information required by this item appears on pages F-1 through F-42, which follow the exhibit index of this Annual Report on Form 10-K.
Item 9. CHANGES IN AND DISAGREEMENTS WITH ACCOUNTANTS ON ACCOUNTING AND FINANCIAL DISCLOSURE
None
Item 9A. CONTROLS AND PROCEDURES
Evaluation of Disclosure Controls and Procedures.
Our management has evaluated, with the participation of our principal executive and financial officers, the effectiveness of our disclosure controls and procedures (as defined in Rule 13a-15 under the Securities Exchange Act of 1934) as of the end of the period covered by this report, and has concluded that our disclosure controls and procedures were effective as of December 31, 2015.
Internal Control over Financial Reporting
The SEC, as required by Section 404 of the Sarbanes-Oxley Act of 2002, adopted rules that generally require every company that files reports with the SEC to evaluate its effectiveness of internal controls over financial reporting.
Management has conducted an evaluation of the effectiveness of the Company; internal control over financial reporting based on the criteria set forth in Internal Control-Integrated Framework (2013) issued by the Committee of Sponsoring Organizations of the Treadway Commission. Based on the results of this evaluation, management concluded that the Company’s internal control over financial reporting was effective as of December 31, 2015. Management’s report is included on page F-1 of this Form 10-K report. KPMG, LLP, an independent registered public accounting firm, has made an independent assessment of the effectiveness of the Company’s internal control over financial reporting as of December 31, 2015 and their report is included on page F-3 of this Form 10-K report.
There were no changes in the Company’s internal controls over financial reporting that occurred during the fourth quarter of 2015 that have affected, or are reasonably likely to materially affect, the Company’s internal control over financial reporting.
Item 9B. OTHER INFORMATION
None
43
Part III
Item 10. DIRECTORS, EXECUTIVE OFFICERS AND CORPORATE GOVERNANCE
Certain information regarding executive officers of the Company is included under the caption “Executive Officers of the Registrant” in Part I of this Annual Report on Form 10-K. Other information required by this item is incorporated by reference to the Registrant’s definitive Proxy Statement for the Annual Meeting of Stockholders on May 5, 2016 under the captions “Election of Directors” and “Committees”.
Murphy USA has adopted a Code of Business Conduct and Ethics, which can be found under the Corporate Governance tab at http://ir.corporate.murphyusa.com. Stockholders may also obtain free of charge a copy of the Code of Business Conduct and Ethics by writing to the Company’s Secretary at P.O. Box 7300, El Dorado, AR 71730-5836. Any future amendments to or waivers of the Company’s Code of Business Conduct and Ethics will be posted on the Company’s Internet Web site.
Item 11. EXECUTIVE COMPENSATION
Information required by this item is incorporated by reference to Murphy USA’s definitive Proxy Statement for the Annual Meeting of Stockholders on May 5, 2016 under the captions “Compensation Discussion and Analysis” and “Compensation of Directors” and in various compensation schedules.
Item 12. SECURITY OWNERSHIP OF CERTAIN BENEFICIAL OWNERS AND MANAGEMENT AND RELATED STOCKHOLDER MATTERS
Information required by this item is incorporated by reference to Murphy USA’s definitive Proxy Statement for the Annual Meeting of Stockholders on May 5, 2016 under the captions “Security Ownership of Certain Beneficial Owners,” “Security Ownership of Management,” and “Equity Compensation Plan Information.”
Item 13. CERTAIN RELATIONSHIPS AND RELATED TRANSACTIONS, AND DIRECTOR INDEPENDENCE
Information required by this item is incorporated by reference to Murphy USA’s definitive Proxy Statement for the Annual Meeting of Stockholders on May 5, 2016 under the caption “Review, Approval or Ratification of Transactions with Related Persons.”
Item 14. PRINCIPAL ACCOUNTING FEES AND SERVICES
Information required by this item is incorporated by reference to Murphy USA’s definitive Proxy Statement for the Annual Meeting of Stockholders on May 5, 2016 under the caption “Audit Committee Report.”
44
Part IV
Item 15. EXHIBITS, FINANCIAL STATEMENT SCHEDULES
(a) 1. Financial Statements – The consolidated financial statements of Murphy USA Inc. and consolidated subsidiaries are located or begin on the pages of this Annual Report on Form 10-K as indicated below.
Page No. | |
Report of Management - Financial Statements | F-1 |
Report of Management - Internal Controls | F-1 |
Report of Independent Registered Public Accounting Firm | F-2 |
Report of Independent Registered Public Accounting Firm | F-3 |
Consolidated Balance Sheets | F-4 |
Consolidated and Combined Income Statements | F-5 |
Consolidated and Combined Statements of Cash Flows | F-6 |
Consolidated and Combined Statements of Changes in Equity | F-7 |
Notes to Consolidated and Combined Financial Statements | F-8 |
Supplemental Quarterly Information (Unaudited) | F-43 |
2. Financial Statement Schedules
Schedule II – Valuation Accounts and Reserves | F-44 |
All other financial statement schedules are omitted because they are either not applicable or the required information is included in the consolidated financial statements or notes thereto.
3. Exhibits – The following is an index of exhibits that are hereby filed as indicated by asterisk (*), that are considered furnished rather than filed, or that are incorporated by reference. Exhibits other than those listed have been omitted since they either are not required or are not applicable.
45
Exhibit Number | Description |
2.1 | Separation and Distribution Agreement, dated August 30, 2013, between Murphy Oil Corporation and Murphy USA Inc. (incorporated by reference to Murphy USA’s Current Report on Form 8-K filed September 5, 2013) |
3.1 | Murphy USA Inc. Amended and Restated Certificate of Incorporation (incorporated by reference to Murphy USA’s Quarterly Report on Form 10-Q filed November 8, 2013) |
3.2 | Murphy USA Inc. Amended and Restated Bylaws (incorporated by reference to Murphy USA’s Quarterly Report on Form 10-Q filed November 8, 2013) |
4.1 | Indenture (including form of notes), dated August 14, 2013, among Murphy Oil USA, Inc., as the Issuer, Murphy USA Inc., as a guarantor, the other guarantors party thereto and U.S. Bank National Association, as trustee (incorporated by reference to Murphy USA’s Current Report on Form 8-K filed August 16, 2013) |
4.2 | Registration Rights Agreement, dated August 14, 2013, among Murphy Oil USA, Inc., Murphy USA Inc., certain subsidiaries of Murphy USA Inc. and J.P. Morgan Securities LLC, as representative of the initial purchasers named therein (incorporated by reference to Murphy USA’s Current Report on Form 8-K filed August 16, 2013) |
10.1 | Tax Matters Agreement, dated August 30, 2013, between Murphy Oil Corporation and Murphy USA Inc. (incorporated by reference to Murphy USA’s Current Report on Form 8-K filed September 5, 2013) |
10.2 | Trademark License Agreement, dated August 30, 2013, between Murphy Oil Corporation and Murphy USA Inc. (incorporated by reference to Murphy USA’s Current Report on Form 8-K filed September 5, 2013) |
10.3 | Hangar Rental Agreement, dated August 30, 2013, between Murphy Oil Corporation and Murphy USA Inc. (incorporated by reference to Murphy USA’s current report on Form 8-K filed September 5, 2013) |
10.4 | Aircraft Maintenance Labor Pooling Agreement, dated August 30, 2013, between Murphy Oil Corporation and Murphy USA Inc. (incorporated by reference to Murphy USA’s Current Report on Form 8-K filed September 5, 2013) |
10.5 | Airplane Interchange Agreement, dated August 30, 2013, between Murphy Oil Corporation and Murphy USA Inc. (incorporated by reference to Murphy USA’s Current Report on Form 8-K filed September 5, 2013) |
10.6 | Credit Agreement, dated August 30, 2013, among Murphy USA Inc., Murphy Oil USA, Inc., the Borrowing Subsidiaries, the Lenders party thereto and JPMorgan Chase Bank, N.A.(incorporated by reference to Murphy USA’s Current Report on Form 8-K filed September 5, 2013) |
10.7 | Severance Protection Agreement dated as of August 20, 2013 between Murphy USA and R. Andrew Clyde, (incorporated by reference to Murphy USA’s Current Report on Form 8-K filed August 22, 2013)† |
46
10.8 | Murphy USA Inc. 2013 Long-Term Incentive Plan, as amended and restated effective as of February12, 2014)† |
10.9 | Form of Murphy USA Inc. 2013 Annual Incentive Plan, as amended and restated effective as of February12, 2014)† |
10.10 | Murphy USA Inc. 2013 Stock Plan for Non-Employee Directors (incorporated by reference to Murphy USA’s Registration Statement on Form S-8 (File No. 333-191131) filed September 12, 2013)† |
10.11 | Murphy USA Inc. Supplemental Executive Retirement Plan (incorporated by reference to Murphy USA’s Quarterly Report on Form 10-Q filed November 8, 2013)† |
10.12 | Form of Murphy USA 2013 Long-Term Incentive Plan Option Grant Agreement (incorporated by reference to Murphy USA’s Quarterly Report on Form 10-Q filed November 8, 2013) † |
10.13 | Form of Murphy USA 2013 Long-Term Incentive Plan RSU Agreement (incorporated by reference to Murphy USA’s Quarterly Report on Form 10-Q filed November 8, 2013)† |
10.14 | Form of Murphy USA 2013 Long-Term Incentive Plan Performance Share Agreement (incorporated by reference to Murphy USA’s Quarterly Report on Form 10-Q filed November 8, 2013)† |
10.15 | Form of Murphy USA 2013 Non-Employee Director Award (incorporated by reference to Murphy USA’s Quarterly Report on Form 10-Q filed November 8, 2013) † |
10.16 | Separation Agreement for former Executive Vice President John Rudolfs (incorporated by reference to Murphy USA’s Quarterly Report on Form 10-Q filed August 7, 2014) |
10.17 | Third Amendment, dated as of September 2, 2014, to the Credit Agreement, dated as of August 30, 2013, among Murphy Oil USA, Inc. as borrower, Murphy USA Inc. and certain subsidiaries, and JP Morgan Chase Bank, N.A. as administrative agent and the other lenders party thereto (incorporated by reference to Murphy USA’s Quarterly Report on Form 10-Q filed November 6, 2014) |
10.18 | Retirement Agreement for Senior Vice President, Jeffrey A. Goodwin (incorporated by reference to Exhibit 10.1 to the Registrant’s Quarterly Report on Form 10-Q filed on May 5, 2015) |
10.19 | Term Credit Agreement, dated as of February 5, 2016 among the Company, JPMorgan Chase Bank, N.A., as administrative agent, and the lenders party thereto (incorporated by reference to Murphy USA Inc.'s Current Report on Form 8-K filed on February 9, 2016) |
12.1* | Ratio of Earnings to Fixed Charges |
21* | List of Subsidiaries of Murphy USA |
23.1* | Consent of KPMG LLP, Independent Registered Public Accounting Firm |
31.1* | Certification required by Rule 13a-14(a) pursuant to Section 302 of the Sarbanes-Oxley Act of 2002 of Principal Executive Officer |
31.2* | Certification required by Rule 13a-14(a) pursuant to Section 302 of the Sarbanes-Oxley Act of 2002 of Principal Financial Officer |
32.1* | Certification pursuant to 18 U.S.C. Section 1350, as adopted pursuant to Section 906 of the Sarbanes-Oxley Act of 2002 of Principal Executive Officer |
32.2* | Certification pursuant to 18 U.S.C. Section 1350, as adopted pursuant to Section 906 of the Sarbanes-Oxley Act of 2002 of Principal Financial Officer |
101. INS* | XBRL Instance Document |
101. SCH* | XBRL Taxonomy Extension Schema Document |
101. CAL* | XBRL Taxonomy Extension Calculation Linkbase Document |
101. DEF* | XBRL Taxonomy Extension Definition Linkbase Document |
101. LAB* | XBRL Taxonomy Extension Labels Linkbase Document |
101. PRE* | XBRL Taxonomy Extension Presentation Linkbase |
* Filed herewith
† Management contract or compensatory plan or arrangement
47
SIGNATURES
Pursuant to the requirements of Section 13 or 15(d) of the Securities Exchange Act of 1934, the registrant has duly caused this report to be signed on its behalf by the undersigned, thereunto duly authorized.
MURPHY USA INC.
By: | /s/ R. Andrew Clyde | Date: | February 26, 2016 |
R. Andrew Clyde, President | |||
Pursuant to the requirements of the Securities Exchange Act of 1934, this report has been signed below on
February 26, 2016 by the following persons on behalf of the registrant and in the capacities indicated.
/s/ R. Madison Murphy | /s/ James W. Keyes | ||
R. Madison Murphy, Chairman and Director | James W. Keyes, Director | ||
/s/ R. Andrew Clyde | /s/ Diane N. Landen | ||
R. Andrew Clyde, President and Chief | Diane N. Landen, Director | ||
Executive Officer and Director | |||
(Principal Executive Officer) | |||
/s/ Claiborne P. Deming | /s/ David B. Miller | ||
Claiborne P. Deming, Director | David B. Miller, Director | ||
/s/ Thomas M. Gattle, Jr. | /s/ Jack T. Taylor | ||
Thomas M. Gattle, Jr, Director | Jack T. Taylor, Director | ||
/s/ Robert A. Hermes | /s/ Mindy K. West | ||
Robert A. Hermes, Director | Mindy K. West, Executive Vice President, | ||
Treasurer, and Chief Financial Officer | |||
(Principal Financial Officer) | |||
/s/ Fred L. Holliger | /s/ Donald R. Smith, Jr. | ||
Fred L. Holliger, Director | Donald R. Smith, Jr. | ||
Vice President and Controller | |||
(Principal Accounting Officer) | |||
/s/ Christoph Keller, III | |||
Christoph Keller, III, Director | |||
48
REPORT OF MANAGEMENT- CONSOLIDATED FINANCIAL STATEMENTS
The management of Murphy USA Inc. is responsible for the preparation and integrity of the accompanying consolidated and combined financial statements and other financial data. The statements were prepared in conformity with U.S. generally accepted accounting principles appropriate in the circumstances and include some amounts based on informed estimates and judgments, with consideration given to materiality.
An independent, registered public accounting firm, KPMG LLP, has audited the Company’s consolidated and combined financial statements in accordance with the standards of the Public Company Accounting Oversight Board and provides an objective, independent opinion about the Company’s consolidated and combined financial statements. The Audit Committee of the Board of Directors appoints the independent registered public accounting firm; ratification of the appointment is solicited annually from the shareholders. KPMG LLP’s opinion covering the Company’s consolidated and combined financial statements can be found on page F-2.
The Board of Directors appoints an Audit Committee annually to implement and to support the Board’s oversight function of the Company’s financial reporting, accounting policies, internal controls and independent registered public accounting firm. This Committee is composed solely of directors who are not employees of the Company. The Committee meets routinely with representatives of management, the Company’s audit staff and the independent registered public accounting firm to review and discuss the adequacy and effectiveness of the Company’s internal controls, the quality and clarity of its financial reporting, the scope and results of independent and internal audits, and to fulfill other responsibilities included in the Committee’s Charter. The independent registered public accounting firm and the Company’s audit staff have unrestricted access to the Committee, without management presence, to discuss audit findings and other financial matters.
REPORT OF MANAGEMENT – INTERNAL CONTROL OVER FINANCIAL REPORTING
Management is responsible for establishing and maintaining adequate internal control over financial reporting, as such term is defined in Exchange Act Rules 13a-15(f). The Company’s internal controls have been designed to provide reasonable assurance regarding the reliability of financial reporting and the preparation of consolidated and combined financial statements in accordance with U.S. generally accepted accounting principles. All internal control systems have inherent limitations, and therefore, can provide only reasonable assurance with respect to the reliability of financial reporting and preparation of consolidated and combined financial statements.
Management has conducted an evaluation of the effectiveness of the Company’s internal control over financial reporting based on the criteria set forth in Internal Control – Integrated Framework issued by the Committee of Sponsoring Organizations of the Treadway Commission in 2013. Based on the results of this evaluation, management concluded that the Company’s internal control over financial reporting was effective as of December 31, 2015.
KPMG LLP has performed an audit of the Company’s internal control over financial reporting and their opinion thereon can be found on page F-3.
F-1
REPORT OF INDEPENDENT REGISTERED PUBLIC ACCOUNTING FIRM
The Board of Directors and Stockholders of Murphy USA Inc.:
We have audited the accompanying consolidated balance sheets of Murphy USA Inc. and subsidiaries as of December 31, 2015 and 2014, and the related consolidated and combined income statements, statements of cash flows, and statements of changes in equity for each of the years in the three-year period ended December 31, 2015. In connection with our audits of the consolidated and combined financial statements, we also have audited financial statement Schedule II. These consolidated and combined financial statements and financial statement schedule are the responsibility of the Company’s management. Our responsibility is to express an opinion on these consolidated and combined financial statements and financial statement schedule based on our audits.
We conducted our audits in accordance with the standards of the Public Company Accounting Oversight Board (United States). Those standards require that we plan and perform the audit to obtain reasonable assurance about whether the financial statements are free of material misstatement. An audit includes examining, on a test basis, evidence supporting the amounts and disclosures in the financial statements. An audit also includes assessing the accounting principles used and significant estimates made by management, as well as evaluating the overall financial statement presentation. We believe that our audits provide a reasonable basis for our opinion.
In our opinion, the consolidated and combined financial statements referred to above present fairly, in all material respects, the financial position of Murphy USA Inc. and subsidiaries as of December 31, 2015 and 2014, and the results of their operations and their cash flows for each of the years in the three-year period ended December 31, 2015, in conformity with U.S. generally accepted accounting principles. Also, in our opinion, the related financial statement schedule, when considered in relation to the basic consolidated and combined financial statements taken as a whole, presents fairly, in all material respects, the information set forth therein.
We also have audited, in accordance with the standards of the Public Company Accounting Oversight Board (United States), Murphy USA Inc.’s internal control over financial reporting as of December 31, 2015, based on criteria established in Internal Control – Integrated Framework (2013) issued by the Committee of Sponsoring Organizations of the Treadway Commission, and our report dated February 26, 2016 expressed an unqualified opinion on the effectiveness of the Company’s internal control over financial reporting.
/s/ KPMG LLP
Houston, Texas
February 26, 2016
F-2
REPORT OF INDEPENDENT REGISTERED PUBLIC ACCOUNTING FIRM
The Board of Directors and Stockholders of Murphy USA Inc.:
We have audited Murphy USA Inc.’s internal control over financial reporting as of December 31, 2015, based on criteria established in Internal Control – Integrated Framework (2013) issued by the Committee of Sponsoring Organizations of the Treadway Commission (COSO). Murphy USA Inc.’s management is responsible for maintaining effective internal control over financial reporting and for its assessment of the effectiveness of internal control over financial reporting, included in the accompanying Report of Management - Internal Control Over Financial Reporting. Our responsibility is to express an opinion on the Company’s internal control over financial reporting based on our audit.
We conducted our audit in accordance with the standards of the Public Company Accounting Oversight Board (United States). Those standards require that we plan and perform the audit to obtain reasonable assurance about whether effective internal control over financial reporting was maintained in all material respects. Our audit included obtaining an understanding of internal control over financial reporting, assessing the risk that a material weakness exists, and testing and evaluating the design and operating effectiveness of internal control based on the assessed risk. Our audit also included performing such other procedures as we considered necessary in the circumstances. We believe that our audit provides a reasonable basis for our opinion.
A company’s internal control over financial reporting is a process designed to provide reasonable assurance regarding the reliability of financial reporting and the preparation of financial statements for external purposes in accordance with generally accepted accounting principles. A company’s internal control over financial reporting includes those policies and procedures that (1) pertain to the maintenance of records that, in reasonable detail, accurately and fairly reflect the transactions and dispositions of the assets of the company; (2) provide reasonable assurance that transactions are recorded as necessary to permit preparation of financial statements in accordance with generally accepted accounting principles, and that receipts and expenditures of the company are being made only in accordance with authorizations of management and directors of the company; and (3) provide reasonable assurance regarding prevention or timely detection of unauthorized acquisition, use, or disposition of the company’s assets that could have a material effect on the financial statements.
Because of its inherent limitations, internal control over financial reporting may not prevent or detect misstatements. Also, projections of any evaluation of effectiveness to future periods are subject to the risk that controls may become inadequate because of changes in conditions, or that the degree of compliance with the policies or procedures may deteriorate.
In our opinion, Murphy USA Inc. maintained, in all material respects, effective internal control over financial reporting as of December 31, 2015, based on criteria established in Internal Control – Integrated Framework (2013) issued by the Committee of Sponsoring Organizations of the Treadway Commission (COSO).
We also have audited, in accordance with the standards of the Public Company Accounting Oversight Board (United States), the consolidated balance sheets of Murphy USA Inc. and subsidiaries as of December 31, 2015 and 2014, and the related consolidated and combined income statements, statements of cash flows, and statements of changes in equity for each of the years in the three-year period ended December 31, 2015, and our report dated February 26, 2016 expressed an unqualified opinion on those consolidated and combined financial statements.
/s/ KPMG LLP
Houston, Texas
February 26, 2016
F-3
Murphy USA Inc.
Consolidated Balance Sheets
December 31, | |||||||
(Thousands of dollars) | 2015 | 2014 | |||||
Assets | |||||||
Current assets | |||||||
Cash and cash equivalents | $ | 102,335 | $ | 327,163 | |||
Accounts receivable—trade, less allowance for doubtful accounts of $1,963 in 2015 and $4,456 in 2014 | 136,253 | 138,466 | |||||
Inventories, at lower of cost or market | 155,906 | 157,046 | |||||
Prepaid expenses and other current assets | 41,173 | 11,710 | |||||
Current assets held for sale | — | 56,328 | |||||
Total current assets | 435,667 | 690,713 | |||||
Property, plant and equipment, at cost less accumulated depreciation and amortization of $724,486 in 2015 and $663,067 in 2014 | 1,369,318 | 1,248,081 | |||||
Restricted cash | 68,571 | — | |||||
Other assets | 12,685 | 10,543 | |||||
Total assets | $ | 1,886,241 | $ | 1,949,337 | |||
Liabilities and Stockholders' Equity | |||||||
Current liabilities | |||||||
Current maturities of long-term debt | $ | 222 | $ | — | |||
Trade accounts payable and accrued liabilities | 390,341 | 381,271 | |||||
Income taxes payable | — | 18,362 | |||||
Deferred income taxes | 1,729 | 522 | |||||
Current liabilities held for sale | — | 12,925 | |||||
Total current liabilities | 392,292 | 413,080 | |||||
Long-term debt, including capitalized lease obligations | 490,160 | 488,250 | |||||
Deferred income taxes | 161,236 | 137,882 | |||||
Asset retirement obligations | 24,345 | 22,245 | |||||
Deferred credits and other liabilities | 25,918 | 29,175 | |||||
Total liabilities | 1,093,951 | 1,090,632 | |||||
Stockholders' Equity | |||||||
Preferred Stock, par $0.01, (authorized 20,000,000 shares, | |||||||
none outstanding) | — | — | |||||
Common Stock, par $0.01 (authorized 200,000,000 shares, | |||||||
46,767,164 and 46,767,164 shares issued at | |||||||
2015 and 2014, respectively) | 468 | 468 | |||||
Treasury stock (5,088,434 and 1,056,689 shares held at | |||||||
December 31, 2015 and December 31, 2014, respectively) | (294,139 | ) | (51,073 | ) | |||
Additional paid in capital (APIC) | 558,182 | 557,871 | |||||
Retained earnings | 527,779 | 351,439 | |||||
Total stockholders' equity | 792,290 | 858,705 | |||||
Total liabilities and stockholders' equity | $ | 1,886,241 | $ | 1,949,337 | |||
See accompanying notes to consolidated and combined financial statements.
F-4
Murphy USA Inc.
Consolidated and Combined Income Statements
Years Ended December 31, | |||||||||||
(Thousands of dollars except per share amounts) | 2015 | 2014 | 2013 | ||||||||
Revenues | |||||||||||
Petroleum product sales (a) | $ | 10,304,689 | $ | 14,728,527 | $ | 15,560,317 | |||||
Merchandise sales | 2,273,888 | 2,161,378 | 2,159,466 | ||||||||
Other operating revenues | 120,834 | 96,109 | 94,298 | ||||||||
Total revenues | 12,699,411 | 16,986,014 | 17,814,081 | ||||||||
Costs and operating expenses | |||||||||||
Petroleum product cost of goods sold (a) | 9,794,475 | 14,074,579 | 15,009,955 | ||||||||
Merchandise cost of goods sold | 1,946,423 | 1,859,732 | 1,877,630 | ||||||||
Station and other operating expenses | 486,383 | 486,762 | 460,476 | ||||||||
Depreciation and amortization | 86,568 | 79,087 | 74,053 | ||||||||
Selling, general and administrative | 129,277 | 119,266 | 129,431 | ||||||||
Accretion of asset retirement obligations | 1,521 | 1,200 | 1,096 | ||||||||
Total costs and operating expenses | 12,444,647 | 16,620,626 | 17,552,641 | ||||||||
Income from operations | 254,764 | 365,388 | 261,440 | ||||||||
Other income (expense) | |||||||||||
Interest income | 2,177 | 244 | 1,099 | ||||||||
Interest expense | (33,531 | ) | (36,646 | ) | (14,509 | ) | |||||
Gain (loss) on sale of assets | (4,658 | ) | 194 | 5,995 | |||||||
Other nonoperating income (expense) | (463 | ) | 10,166 | 169 | |||||||
Total other income (expense) | (36,475 | ) | (26,042 | ) | (7,246 | ) | |||||
Income from continuing operations before income taxes | 218,289 | 339,346 | 254,194 | ||||||||
Income tax expense | 80,698 | 116,386 | 100,059 | ||||||||
Income from continuing operations | 137,591 | 222,960 | 154,135 | ||||||||
Income (loss) from discontinued operations, net of income taxes | 38,749 | 20,903 | 80,898 | ||||||||
Net Income | $ | 176,340 | $ | 243,863 | $ | 235,033 | |||||
Earnings per share - basic: | |||||||||||
Income from continuing operations | $ | 3.17 | $ | 4.84 | $ | 3.30 | |||||
Income (loss) from discontinued operations | 0.89 | 0.45 | 1.73 | ||||||||
Net Income - basic | $ | 4.06 | $ | 5.29 | $ | 5.03 | |||||
Earnings per share - diluted: | |||||||||||
Income from continuing operations | $ | 3.14 | $ | 4.81 | $ | 3.29 | |||||
Income (loss) from discontinued operations | 0.88 | 0.45 | 1.73 | ||||||||
Net Income - diluted | $ | 4.02 | $ | 5.26 | $ | 5.02 | |||||
Weighted-average shares outstanding (in thousands): | |||||||||||
Basic | 43,434 | 46,104 | 46,743 | ||||||||
Diluted | 43,794 | 46,417 | 46,858 | ||||||||
Supplemental information: | |||||||||||
(a) Includes excise taxes of: | $ | 1,968,629 | $ | 1,930,608 | $ | 1,884,035 | |||||
See accompanying notes to consolidated and combined financial statements.
F-5
Murphy USA Inc.
Consolidated and Combined Statements of Cash Flows
Years Ended December 31, | |||||||||||
(Thousands of dollars) | 2015 | 2014 | 2013 | ||||||||
Operating Activities | |||||||||||
Net income | $ | 176,340 | $ | 243,863 | $ | 235,033 | |||||
Adjustments to reconcile net income to net cash provided by operating activities | |||||||||||
(Income) loss from discontinued operations, net of taxes | (38,749 | ) | (20,903 | ) | (80,898 | ) | |||||
Depreciation and amortization | 86,568 | 79,087 | 74,053 | ||||||||
Deferred and noncurrent income tax charges (credits) | 40,556 | (4,403 | ) | (11,568 | ) | ||||||
Accretion on discounted liabilities | 1,521 | 1,200 | 1,096 | ||||||||
Pretax (gains) losses from sale of assets | 4,658 | (194 | ) | (5,995 | ) | ||||||
Net decrease (increase) in noncash operating working capital | (46,586 | ) | (36,475 | ) | 51,204 | ||||||
Other operating activities - net | 9,417 | 14,531 | 13,215 | ||||||||
Net cash provided by continuing operations | 233,725 | 276,706 | 276,140 | ||||||||
Net cash provided by (used in) discontinued operations | (17,887 | ) | 28,876 | 80,558 | |||||||
Net cash provided by operating activities | 215,838 | 305,582 | 356,698 | ||||||||
Investing Activities | |||||||||||
Property additions | (205,225 | ) | (135,339 | ) | (163,303 | ) | |||||
Proceeds from sale of assets | 729 | 376 | 6,113 | ||||||||
Changes in restricted cash | (68,571 | ) | — | — | |||||||
Other investing activities - net | (2,889 | ) | (10,631 | ) | 52 | ||||||
Investing activities of discontinued operations | |||||||||||
Sales proceeds | 93,765 | 1,097 | 173,118 | ||||||||
Other | (7,443 | ) | (4,918 | ) | (3,088 | ) | |||||
Net cash provided by (required by) investing activities | (189,634 | ) | (149,415 | ) | 12,892 | ||||||
Financing Activities | |||||||||||
Purchase of treasury stock | (248,695 | ) | (51,348 | ) | — | ||||||
Repayments of long-term debt | (146 | ) | (70,000 | ) | (81,170 | ) | |||||
Additions to long-term debt | — | — | 641,250 | ||||||||
Cash dividend to former parent | — | — | (650,000 | ) | |||||||
Debt issuance costs | (58 | ) | (875 | ) | (6,693 | ) | |||||
Amounts related to share-based compensation | (3,075 | ) | (580 | ) | — | ||||||
Net distributions to former parent | — | — | (35,609 | ) | |||||||
Net cash required by financing activities | (251,974 | ) | (122,803 | ) | (132,222 | ) | |||||
Net increase in cash and cash equivalents | (225,770 | ) | 33,364 | 237,368 | |||||||
Cash and cash equivalents at January 1 | 328,105 | 294,741 | 57,373 | ||||||||
Cash and cash equivalents at December 31 | 102,335 | 328,105 | 294,741 | ||||||||
Less: Cash and cash equivalents held for sale | — | 942 | — | ||||||||
Cash and cash equivalents of continuing operations at December 31 | $ | 102,335 | $ | 327,163 | $ | 294,741 | |||||
See accompanying notes to consolidated and combined financial statements.
F-6
Murphy USA Inc.
Consolidated and Combined Statements of Changes in Equity
Common Stock | |||||||||||||
(Thousands of dollars, except share amounts) | Shares | Par | Treasury Stock | APIC | Net Parent Investment | Retained Earnings | Total | ||||||
Balance as of December 31, 2012 | — | $— | $— | $— | $1,104,451 | $— | $1,104,451 | ||||||
Net income | — | — | — | — | 127,457 | 107,576 | 235,033 | ||||||
Dividend paid to former parent | — | — | — | — | (650,000) | — | (650,000) | ||||||
Net transfers to/between former parent | — | — | — | — | (36,062) | — | (36,062) | ||||||
Issuance of stock at the separation and distribution | 46,743,316 | 467 | — | (467) | — | — | — | ||||||
Reclassification of net parent investment to APIC | — | — | — | 545,846 | (545,846) | — | — | ||||||
Issuance of common stock | 317 | — | — | — | — | — | — | ||||||
Share-based compensation expense | — | — | — | 2,914 | — | — | 2,914 | ||||||
Balance as of December 31, 2013 | 46,743,633 | 467 | — | 548,293 | — | 107,576 | 656,336 | ||||||
Net income | — | — | — | — | — | 243,863 | 243,863 | ||||||
Purchase of treasury stock | — | — | (51,348) | — | — | — | (51,348) | ||||||
Issuance of common stock | 23,531 | 1 | — | — | — | — | 1 | ||||||
Issuance of treasury stock | — | — | 275 | (275) | — | — | — | ||||||
Amounts related to share-based compensation | — | — | — | (582) | — | — | (582) | ||||||
Share-based compensation expense | — | — | — | 10,435 | — | — | 10,435 | ||||||
Balance as of December 31, 2014 | 46,767,164 | 468 | (51,073) | 557,871 | — | 351,439 | 858,705 | ||||||
Net income | — | — | — | — | — | 176,340 | 176,340 | ||||||
Purchase of treasury stock | — | — | (248,695) | — | — | — | (248,695) | ||||||
Issuance of common stock | — | — | — | — | — | — | — | ||||||
Issuance of treasury stock | — | — | 5,629 | (5,629) | — | — | — | ||||||
Amounts related to share-based compensation | — | — | — | (3,075) | — | — | (3,075) | ||||||
Share-based compensation expense | — | — | — | 9,015 | — | — | 9,015 | ||||||
Balance as of December 31, 2015 | 46,767,164 | $468 | $(294,139) | $558,182 | $— | $527,779 | $792,290 | ||||||
See accompanying notes to consolidated and combined financial statements.
F-7
Murphy USA Inc.
NOTES TO CONSOLIDATED AND COMBINED FINANCIAL STATEMENTS
Note 1 — Description of Business and Basis of Presentation
Description of business — The business of Murphy USA Inc. and its subsidiaries (“Murphy USA” or the “Company”) primarily consists of the U.S. retail marketing business that was separated from its former parent company, Murphy Oil Corporation (“Murphy Oil” ), plus other assets, liabilities and operating expenses of Murphy Oil that were associated with supporting the activities of the U.S. retail marketing operations. The separation was approved by the Murphy Oil board of directors on August 7, 2013, and was completed on August 30, 2013 through the distribution of 100% of the outstanding capital stock of Murphy USA to holders of Murphy Oil common stock on the record date of August 21, 2013. Murphy Oil stockholders of record received one share of Murphy USA common stock for every four shares of Murphy Oil common stock. The spin-off was completed in accordance with a separation and distribution agreement entered into between Murphy Oil and Murphy USA. Following the separation, Murphy USA is an independent, publicly traded company, and Murphy Oil retains no ownership interest in Murphy USA.
Murphy USA markets refined products through a network of retail gasoline stores and unbranded wholesale customers. Murphy USA’s owned retail stores are almost all located in close proximity to Walmart stores in 24 states and use the brand name Murphy USA®. Murphy USA also markets gasoline and other products at standalone stores under the Murphy Express brand. At December 31, 2015, Murphy USA had a total of 1,335 Company stores. In October 2009, Murphy USA acquired an ethanol production facility located in Hankinson, North Dakota. The facility was originally designed to produce 110 million gallons of corn-based ethanol per year. Expansion of the plant occurred during 2012, bringing the overall ethanol production capacity to 135 million gallons per year and the plant was sold in December 2013 with all its financial results now being presented as discontinued operations. The Company acquired a partially constructed ethanol production facility in Hereford, Texas, in late 2010. The Hereford facility is designed to produce 105 million gallons of corn-based ethanol per year, and it began operations near the end of the first quarter of 2011. The Hereford ethanol plant was sold in November 2015 with all its financial results also being presented as discontinued operations.
The contributed assets of Murphy Oil included in the Company’s financial statements also include buildings, real estate, an airplane and computer equipment and software that are used to support the operating activities of Murphy USA.
Basis of Presentation — Murphy USA was incorporated in March 2013 and, in connection with its incorporation, Murphy USA issued 100 shares of common stock, par value $0.01 per share, to Murphy Oil for $1.00. Murphy USA was formed solely in contemplation of the separation and until the separation was completed on August 30, 2013, it had not commenced operations and had no material assets, liabilities, or commitments. Accordingly the accompanying consolidated and combined financial statements reflect the combined historical results of operations, financial position and cash flows of the Murphy Oil subsidiaries and certain assets, liabilities and operating expenses of Murphy Oil that comprise Murphy USA, as described above, as if such companies and accounts had been combined for all periods presented prior to August 30, 2013. All significant intercompany transactions and accounts within the combined financial statements have been eliminated.
For the period prior to separation, the consolidated and combined statements of income include expense allocations for certain corporate functions historically performed by Murphy Oil, including allocations of general corporate expenses related to executive oversight, accounting, treasury, tax, legal, procurement and information technology. These allocations are based primarily on specific identification, headcount or computer utilization. Murphy USA’s management believes the assumptions underlying the consolidated and combined financial statements, including the assumptions regarding the allocation of general corporate expenses from Murphy Oil, are reasonable. However, these consolidated and combined financial statements may not include all of the actual expenses that would have been incurred had the Company been a stand-alone company during the period prior to separation and may not reflect the combined results of operations, financial position and cash flows had the Company been a stand-alone company during the entirety of the periods presented.
Actual costs that would have been incurred if Murphy USA had been a stand-alone company for the period prior to separation would depend upon multiple factors, including organizational structure and strategic decisions made in various areas, including information technology and infrastructure. As a result, the consolidated and combined results of operations for the three years ended December 31, 2015, are not necessarily indicative of the results that may be experienced in the future.
F-8
Murphy USA Inc.
NOTES TO CONSOLIDATED AND COMBINED FINANCIAL STATEMENTS
Note 2 – Significant Accounting Policies
PRINCIPLES OF COMBINATION – These consolidated and combined financial statements were prepared in accordance with U.S. generally accepted accounting principles (“GAAP”) and include the accounts of Murphy USA Inc. and selected subsidiaries, and certain assets, liabilities, and expenses of Murphy Oil Corporation for all periods prior to August 30, 2013. All significant intercompany accounts and transactions within the consolidated and combined entity have been eliminated.
REVENUE RECOGNITION – Revenues from sales of refined petroleum products are recorded when deliveries have occurred and legal ownership of the commodity transfers to the customer, which may include related party sales to other subsidiaries of Murphy USA. Title transfer for bulk refined products generally occur at pipeline custody points or upon truck loading at product terminals. Refined products sold at retail stores are recorded when the customer takes delivery at the pump. Merchandise revenues are recorded at the point of sale. Rebates from vendors are recognized as a reduction of cost of goods sold when the related inventory item is sold. Incentives that are derived from contractual provisions are accrued based on past experience, when estimable, and are recognized in cost of goods sold.
The Company enters into buy/sell and similar arrangements when petroleum products are held at one location but are needed at a different location. The Company often pays or receives funds related to the buy/sell arrangement based on location or quality differences. The Company accounts for such transactions on a net basis in its Consolidated and Combined Income Statements.
SHIPPING AND HANDLING COSTS – Costs incurred for the shipping and handling of motor fuel are included in Petroleum product cost of goods sold in the Consolidated and Combined Income Statements. Costs incurred for the shipping and handling of convenience store merchandise are included in Merchandise cost of goods sold in the Consolidated and Combined Income Statements.
TAXES COLLECTED FROM CUSTOMERS AND REMITTED TO GOVERNMENT AUTHORITIES – Excise and other taxes collected on sales of refined products and remitted to governmental agencies are included in revenues and costs and operating expenses in the Consolidated and Combined Income Statements. Excise taxes on petroleum products collected and remitted were $1,968,629,000 in 2015, $1,930,608,000 in 2014, and $1,884,035,000 in 2013.
CASH EQUIVALENTS – Short-term investments, which include government securities, money market funds and other instruments with government securities as collateral, that have an original maturity of three months or less from the date of purchase are classified as cash equivalents.
ACCOUNTS RECEIVABLE – The Company’s accounts receivable are recorded at the invoiced amount and do not bear interest. The accounts receivable primarily consists of amounts owed to the Company from credit card companies and by customers for wholesale sales of refined petroleum products. The allowance for doubtful accounts is the Company’s best estimate of the amount of probable credit losses on these receivables. The Company reviews this allowance for adequacy at least quarterly and bases its assessment on a combination of current information about its customers and historical write-off experience. Any trade accounts receivable balances written off are charged against the allowance for doubtful accounts. The Company has not experienced any significant credit-related losses in the past three years.
INVENTORIES – Inventories of most finished products are valued at the lower of cost, generally applied on a last-in, first-out (“LIFO”) basis, or market. Any increments to LIFO inventory volumes are valued based on the first purchase price for these volumes during the year. Merchandise inventories held for resale are carried at average cost. Materials and supplies are valued at the lower of average cost or estimated value.
VENDOR ALLOWANCES AND REBATES – Murphy USA receives payments for vendor allowances, volume rebates and other related payments from various suppliers of its convenience store merchandise. Vendor allowances for price markdowns are credited to merchandise cost of goods sold during the period the related markdown is recognized. Volume rebates of merchandise are recorded as reductions to merchandise cost of goods sold when the merchandise qualifying for the rebate is sold. Slotting and stocking allowances received from a vendor are recorded as a reduction to cost of sales over the period covered by the agreement.
F-9
Murphy USA Inc.
NOTES TO CONSOLIDATED AND COMBINED FINANCIAL STATEMENTS
PROPERTY, PLANT AND EQUIPMENT – Additions to property, plant and equipment, including renewals and betterments, are capitalized and recorded at cost. Certain marketing facilities are primarily depreciated using the composite straight-line method with depreciable lives ranging from 16 to 25 years. Gasoline stations, improvements to gasoline stations and other assets are depreciated over 3 to 50 years by individual unit on the straight-line method. Gains and losses on asset disposals or retirements are included in income as a separate component of other non operating income.
The Company has undertaken like-kind exchange ("LKE") transactions under the Federal tax code in an effort to acquire and sell real and personal property in a tax efficient manner. The Company generally enters into forward transactions, in which property is sold and the proceeds are reinvested by acquiring similar property; and reverse transactions, in which property is acquired and similar property is subsequently sold. A qualified LKE intermediary is used to facilitate these LKE transactions. Proceeds from forward LKE transactions are held by the intermediary and are classified as restricted cash on the Company's balance sheet because the funds must be reinvested in similar properties. If the acquisition of suitable LKE properties is not completed within 180 days of the sale of the Company-owned property, the proceeds are distributed to the Company by the intermediary and are reclassified as available cash and applicable income taxes are determined. At December 31, 2015, the Company had $68,571,000 of proceeds from the sale of the Hereford ethanol plant deposited with an LKE intermediary. An exchange accommodation titleholder, a type of variable interest entity, is used to facilitate reverse like-kind exchanges. The acquired assets are held by the exchange accommodation titleholder until the exchange transactions are complete. If the Company determines that it is the primary beneficiary of the exchange accommodation titleholder, the replacements assets held by the exchange accommodation titleholder are consolidated and recorded in Property, Plant & Equipment on the consolidated balance sheets. The unspent proceeds that are held in trust with the intermediary are recorded as noncurrent assets in the Consolidated Balance Sheet as the cash was restricted for the acquisition of property, plant and equipment.
IMPAIRMENT OF ASSETS – Long-lived assets, which include property and equipment and finite-lived intangible assets, are tested for recoverability whenever events or changes in circumstances indicate that the carrying amount of the asset may not be recoverable. A long-lived asset is not recoverable if its carrying amount exceeds the sum of the undiscounted cash flows expected to result from its use and eventual disposition. If a long-lived asset is not recoverable, an impairment loss is recognized for the amount by which the carrying amount of the long-lived asset exceeds its fair value, with fair value determined based on discounted estimated net cash flows or other appropriate methods.
ASSET RETIREMENT OBLIGATIONS – The Company records a liability for asset retirement obligations (“ARO”) equal to the fair value of the estimated cost to retire an asset. The ARO liability is initially recorded in the period in which the obligation meets the definition of a liability, which is generally when the asset is placed in service. The ARO liability is estimated using existing regulatory requirements and anticipated future inflation rates. When the liability is initially recorded, the Company increases the carrying amount of the related long-lived asset by an amount equal to the original liability. The liability is increased over time to reflect the change in its present value, and the capitalized cost is depreciated over the useful life of the related long-lived asset. The Company reevaluates the adequacy of its recorded ARO liability at least annually. Actual costs of asset retirements such as dismantling service stations and site restoration are charged against the related liability. Any difference between costs incurred upon settlement of an asset retirement obligation and the recorded liability is recognized as a gain or loss in the Company’s earnings.
ENVIRONMENTAL LIABILITIES – A liability for environmental matters is established when it is probable that an environmental obligation exists and the cost can be reasonably estimated. If there is a range of reasonably estimated costs, the most likely amount will be recorded, or if no amount is most likely, the minimum of the range is used. Related expenditures are charged against the liability. Environmental remediation liabilities have not been discounted for the time value of future expected payments. Environmental expenditures that have future economic benefit are capitalized.
INCOME TAXES – The Company accounts for income taxes using the asset and liability method. Under this method, income taxes are provided for amounts currently payable and for amounts deferred as tax assets and liabilities based on differences between the financial statement carrying amounts and the tax bases of existing assets and liabilities. Deferred income taxes are measured using the enacted tax rates that are assumed will be in effect when the differences reverse. The Company routinely assesses the realizability of deferred tax assets based on available positive and negative evidence including assumptions of future taxable income, tax planning strategies and other pertinent factors. A deferred tax asset valuation allowance is recorded when evidence indicates that it is
F-10
Murphy USA Inc.
NOTES TO CONSOLIDATED AND COMBINED FINANCIAL STATEMENTS
more likely than not that all or a portion of these deferred tax assets will not be realized in a future period. The accounting rules for income tax uncertainties permit recognition of income tax benefits only when they are more likely than not to be realized. The Company includes potential penalties and interest for uncertain income tax positions in income tax expense.
The Company’s results of operations were included in the consolidated federal income tax return of Murphy Oil prior to the separation, while in most cases, these results have been included in the various state tax returns of Murphy USA historically. For these financial statements, federal and state income taxes have been computed and recorded as if the Company filed separate federal and state income tax returns. Federal and state income tax benefits of operating losses generated are recognized to the extent that they could be expected to reduce federal income tax expense for the Company via a carryback to a previous year or carried forward for use in a subsequent year. The calculations of current and deferred income taxes, therefore, require use of certain assumptions, allocations and estimates that management believes are reasonable to reflect the Company’s income taxes as a stand-alone taxpayer. The Company has elected to classify any interest expense and penalties related to the underpayment of income taxes in Income tax expense in the Consolidated and Combined Income Statements.
DERIVATIVE INSTRUMENTS AND HEDGING ACTIVITIES – The fair value of a derivative instrument is recognized as an asset or liability in the Company’s Consolidated Balance Sheets. Upon entering into a derivative contract, the Company may designate the derivative as either a fair value hedge or a cash flow hedge, or decide that the contract is not a hedge, and therefore, recognize changes in the fair value of the contract in earnings. The Company documents the relationship between the derivative instrument designated as a hedge and the hedged items as well as its objective for risk management and strategy for use of the hedging instrument to manage the risk. See Note 14 and Note 17 for further information about the Company’s derivatives.
STOCK-BASED COMPENSATION – The fair value of awarded stock options, restricted stock, restricted stock units and performance stock units is determined based on a combination of management assumptions for awards issued. The Company uses the Black-Scholes option pricing model for computing the fair value of stock options. The primary assumptions made by management included the expected life of the stock option award and the expected volatility of the Company’s common stock prices. The Company uses both historical data and current information to support its assumptions. Stock option expense is recognized on a straight-line basis over the respective vesting period of three years. The Company uses a Monte Carlo valuation model to determine the fair value of performance-based stock units that are based on performance compared against a peer group and the related expense is recognized over the three-year vesting period. Management estimates the number of all awards that will not vest and adjusts its compensation expense accordingly. Differences between estimated and actual vested amounts are accounted for as an adjustment to expense when known. See Note 12 for a discussion of the basis of allocation of such costs.
NET INVESTMENT BY FORMER PARENT– The Net investment by former parent represented a net balance reflecting Murphy Oil’s initial investment in the Company and subsequent adjustments resulting from the operations of the Company and various transactions between the Company and Murphy Oil. The balance is the result of the Company’s participation in Murphy Oil’s centralized cash management program under which all the Company’s cash receipts were remitted to Murphy Oil and all cash disbursements are funded by Murphy Oil. The net balance included amounts due from or owed to Murphy Oil. Other transactions affecting the Net investment by Murphy Oil included general and administrative expenses incurred by Murphy Oil and allocated to the Company. There were no terms of settlement or interest charges associated with the Net investment by Murphy Oil balance. Changes in amounts owed to or due from Murphy Oil were included in financing activities in the Statements of Cash Flows. All transactions affecting the balance of this account ceased at the separation.
USE OF ESTIMATES – In preparing the financial statements of the Company in conformity with U.S. GAAP, management has made a number of estimates and assumptions related to the reporting of assets, liabilities, revenues, and expenses and the disclosure of contingent assets and liabilities. Actual results may differ from the estimates. On an ongoing basis, we review our estimates based on currently available information. Changes in facts and circumstances may result in revised estimates.
Note 3 — Related-Party Transactions
Related-party transactions of the Company include the allocation of certain general and administrative costs from Murphy Oil to the Company and payment of interest expense to or receipt of interest income from Murphy Oil for intercompany payables balances for periods prior to the separation.
F-11
Murphy USA Inc.
NOTES TO CONSOLIDATED AND COMBINED FINANCIAL STATEMENTS
General and administrative costs were charged by Murphy Oil to the Company based on management’s determination of such costs attributable to the operations of the Company. However, such related-party transactions cannot be presumed to be carried out on an arm’s length basis as the requisite conditions of competitive, free-market dealings may not exist.
Prior to the separation, Murphy Oil provided cash management services to the Company. As a result, the Company generally remitted funds received to Murphy Oil, and Murphy Oil paid all operating and capital expenditures on behalf of the Company. Such cash transactions were reflected in the change in the Net Investment by Parent.
The Consolidated and Combined Income Statements include expense allocations for certain functions provided to the Company by Murphy Oil prior to the separation. If possible, these allocations were made on a specific identification basis. Otherwise, the expenses related to services provided to the Company by Murphy Oil were allocated to Murphy USA based on relative percentages of headcount or other appropriate methods depending on the nature of each type of cost to be allocated.
Charges for functions historically provided to the Company by Murphy Oil were primarily attributable to Murphy Oil’s performance of many shared services that the Company benefited from, such as treasury, tax, accounting, risk management, legal, internal audit, procurement, human resources, investor relations and information technology. Murphy USA also participated in certain Murphy Oil insurance, benefit and incentive plans. The Consolidated and Combined Income Statements reflect charges from Murphy Oil and its other subsidiaries for these services of $0, $0 and $50,975,000 for the three years ended December 31, 2015, 2014 and 2013, respectively. Included in the charges above are amounts recognized for stock-based compensation expense (Note 12).
Included in Interest income in the Consolidated and Combined Income Statements for the three years ended December 31, 2015, 2014 and 2013 was interest income from affiliates of $0, $0 and $1,080,000, respectively. These amounts were paid on balances that were previously intercompany prior to the separation from Murphy Oil and were settled in full at the separation date.
Note 4 – Discontinued Operations
In November 2013, the Company announced that it had entered into negotiations to sell its Hankinson, North Dakota ethanol production facility as part of management’s strategic plan to exit non-core businesses. On December 19, 2013, the Company sold its wholly-owned subsidiary Hankinson Renewable Energy, LLC which owned and operated an ethanol manufacturing facility in Hankinson, North Dakota, and its related assets for $170,000,000 plus working capital adjustments of approximately $3,118,000. During January 2014, the final adjustments to working capital were made and the Company received an additional $1.1 million in sales proceeds which has been included in discontinued operations for the period. The Company has accounted for all operations related to Hankinson Renewable, LLC as discontinued operations for all periods presented. The after-tax gain from disposal of the subsidiary (including associated inventories) was $52,542,000 in 2013 with an additional $781,000 in 2014 related to the final working capital adjustment.
The results of operations associated with the Hankinson discontinued operations are presented in the following table.
(Thousands of dollars) | 2014 | 2013 | ||||||
Revenues | $ | — | $ | 366,707 | ||||
Income (loss) from operations before income taxes | — | 40,130 | ||||||
Gain on sale before income taxes | 1,202 | 80,834 | ||||||
Total income (loss) from discontinued operations before taxes | 1,202 | 120,964 | ||||||
Provision for income taxes | 421 | 42,257 | ||||||
Income (loss) from discontinued operations | $ | 781 | $ | 78,707 | ||||
F-12
Murphy USA Inc.
NOTES TO CONSOLIDATED AND COMBINED FINANCIAL STATEMENTS
In September 2015, the Company determined that it had met held for sale criteria for its Hereford, Texas ethanol production facility. On September 25, 2015, the Company signed a letter of intent to sell this subsidiary for a gain and the transaction closed on November 12, 2015. We have classified the results of the Hereford plant as discontinued operations in our Consolidated and Combined Income Statement for all periods presented. Additionally, the related assets and liabilities associated with discontinued operations are classified as held for sale in our Consolidated Balance Sheet at December 31, 2014. The assets and liabilities as of December 31, 2014 are classified as current in our Consolidated Balance Sheet as we expected to close the transaction discussed above within one year. The Company believes that selling the ethanol plant represents a strategic shift for the Company and that the financial results of the plant meet the quantitative and qualitative thresholds discussed in ASU 2014-08, Reporting Discontinued Operations and Disclosures of Components of an Entity.
The financial results of our Hereford plant through December 31, 2015 are presented as income from discontinued operations, net of income taxes on our Consolidated and Combined Income Statement. The results of the Hereford ethanol plant have been included along with "Corporate" as a reconciling item within our segment footnote. The following table presents financial results of the Hereford business:
Twelve months ended December 31, | |||||||||||
(Thousands of dollars) | 2015 | 2014 | 2013 | ||||||||
Revenues | |||||||||||
Ethanol sales | $ | 154,502 | $ | 223,904 | $ | 269,254 | |||||
Total revenues | 154,502 | 223,904 | 269,254 | ||||||||
Costs and operating expenses | |||||||||||
Ethanol cost of goods sold | 121,753 | 158,276 | 228,899 | ||||||||
Station and other operating expenses | 27,881 | 34,763 | 33,227 | ||||||||
Depreciation and amortization | 333 | 147 | 77 | ||||||||
Selling, general and administrative expenses | 1,382 | 1,635 | 3,568 | ||||||||
Total costs and operating expenses | 151,349 | 194,821 | 265,771 | ||||||||
Income from operations | 3,153 | 29,083 | 3,483 | ||||||||
Other income (expense) | |||||||||||
Gain (loss) on sale of assets | 60,782 | — | — | ||||||||
Other nonoperating income (expense) | — | 994 | — | ||||||||
Total other income (expense) | 60,782 | 994 | — | ||||||||
Income before income taxes | 63,935 | 30,077 | 3,483 | ||||||||
Income taxes | 25,186 | 9,955 | 1,292 | ||||||||
Net income | $ | 38,749 | $ | 20,122 | $ | 2,191 | |||||
F-13
Murphy USA Inc.
NOTES TO CONSOLIDATED AND COMBINED FINANCIAL STATEMENTS
The following tables present the aggregate carrying amounts of the classes of held for sale assets and liabilities:
(Thousands of dollars) | 2014 | |||
Carrying amount of assets included as part of discontinued operations: | ||||
Cash and cash equivalents | $ | 942 | ||
Accounts receivable - trade | 1,625 | |||
Inventories, at lower of cost or market | 25,868 | |||
Prepaid expenses and other current assets | 3,062 | |||
Property, plant and equipment, net | 5,043 | |||
Other assets | 515 | |||
Deferred tax assets | 19,273 | |||
Total assets classified as held for sale in the condensed consolidated balance sheet | $ | 56,328 | ||
2014 | ||||
(Thousands of dollars) | ||||
Carrying amount of liabilities included as part of discontinued operations: | ||||
Trade accounts payable and accrued liabilities | $ | 5,728 | ||
Income taxes payable | 7,238 | |||
Deferred income taxes, net | (41 | ) | ||
Total liabilities classified as held for sale in the condensed consolidated balance sheet | $ | 12,925 | ||
The following table presents cash flow of the Hereford ethanol plant:
Twelve months ended December 31, | |||||||||||
(Thousands of dollars) | 2015 | 2014 | 2013 | ||||||||
Net cash provided by (used in) discontinued operating activities | $ | (17,887 | ) | $ | 28,741 | $ | 30,810 | ||||
Net cash provided by (used in) discontinued investing activities | $ | 86,322 | $ | (4,918 | ) | $ | (1,959 | ) | |||
Note 5 – Change in Accounting Principle
During the first quarter of 2015, the Company elected to early adopt the provisions of ASU 2015-03 “Simplifying the Presentation of Debt Issuance Costs”. In accordance with provisions of the FASB ASU topic on “Accounting Changes and Error Corrections” all prior periods presented have been retrospectively adjusted to apply the change in accounting principle. For a summary of the adjustments, see below:
Previous Accounting Method | Effect of Change In | As Reported | ||||||||||
(thousands of dollars) | December 31, 2015 | Accounting Principle | December 31, 2015 | |||||||||
Other assets | $ | 16,211 | $ | (3,526 | ) | $ | 12,685 | |||||
Long-term debt | $ | 493,686 | $ | (3,526 | ) | $ | 490,160 | |||||
F-14
Murphy USA Inc.
NOTES TO CONSOLIDATED AND COMBINED FINANCIAL STATEMENTS
As Originally Reported | Effect of Change In | As Currently Reported | ||||||||||
December 31, 2014 | Accounting Principle | December 31, 2014 | ||||||||||
Other assets | $ | 14,736 | $ | (4,193 | ) | $ | 10,543 | |||||
Long-term debt | $ | 492,443 | $ | (4,193 | ) | $ | 488,250 | |||||
Note 6 — Inventories
Inventories consisted of the following:
December 31, | ||||||||
(Thousands of dollars) | 2015 | 2014 | ||||||
Finished products - FIFO basis | $ | 159,774 | $ | 200,272 | ||||
Less LIFO - finished products | (102,849 | ) | (144,283 | ) | ||||
Finished products - LIFO basis | 56,925 | 55,989 | ||||||
Store merchandise for resale | 94,925 | 98,712 | ||||||
Materials and supplies | 4,056 | 2,345 | ||||||
Total inventories | $ | 155,906 | $ | 157,046 | ||||
At December 31, 2015 and 2014, the replacement cost (market value) of last-in, first-out (LIFO) inventories exceeded the LIFO carrying value by $102,849,000 and $144,283,000, respectively.
In 2014, inventories valued at LIFO incurred a decrement that resulted in a benefit of $19,512,000 on income from continuing operations before income tax. Inventories valued at LIFO incurred a decrement that resulted in a charge to earnings of $13,472,000 at December 31, 2013.
Note 7 – Property, Plant and Equipment
December 31, 2015 | December 31, 2014 | |||||||||||||||||
(Thousands of dollars) | Estimated Useful Life | Cost | Net | Cost | Net | |||||||||||||
Land | $ | 555,198 | $ | 555,198 | $ | 527,158 | $ | 527,158 | ||||||||||
Pipeline and terminal facilities | 16 to 25 years | 95,244 | 40,846 | 88,447 | 36,384 | |||||||||||||
Retail gasoline stations | 3 to 50 years | 1,367,176 | 746,747 | 1,229,582 | 662,954 | |||||||||||||
Buildings | 20 to 45 years | 19,441 | 8,985 | 18,160 | 8,328 | |||||||||||||
Other | 3 to 20 years | 56,745 | 17,542 | 47,801 | 13,257 | |||||||||||||
$ | 2,093,804 | $ | 1,369,318 | $ | 1,911,148 | $ | 1,248,081 | |||||||||||
F-15
Murphy USA Inc.
NOTES TO CONSOLIDATED AND COMBINED FINANCIAL STATEMENTS
Note 8 – Accounts Payable and Accrued Liabilities
Trade accounts payable and accrued liabilities consisted of the following:
December 31, | |||||||
(Thousands of dollars) | 2015 | 2014 | |||||
Trade accounts payable | $ | 226,769 | $ | 227,113 | |||
Excise taxes/withholdings payable | 75,704 | 71,273 | |||||
Accrued insurance obligations | 23,347 | 19,280 | |||||
Other | 64,521 | 63,605 | |||||
Accounts payable and accrued liabilities | $ | 390,341 | $ | 381,271 | |||
Note 9 — Long-Term Debt
Long-term debt consisted of the following:
December 31, | ||||||||
(Thousands of dollars) | 2015 | 2014 | ||||||
6% senior notes due 2023 (net of unamortized discount of $6,692 at 2015 and $7,557 at 2014) | $ | 493,308 | $ | 492,443 | ||||
Less unamortized debt issuance costs | (3,526 | ) | (4,193 | ) | ||||
Total notes payable, net | 489,782 | 488,250 | ||||||
Capitalized lease obligations, vehicles, due through 2018 | 600 | — | ||||||
Less current maturities | (222 | ) | — | |||||
Total long-term debt | $ | 490,160 | $ | 488,250 | ||||
Senior Notes
On August 14, 2013, Murphy Oil USA, Inc., our primary operating subsidiary, issued 6.00% Senior Notes due 2023 (the “Senior Notes”) in an aggregate principal amount of $500 million. The Senior Notes are fully and unconditionally guaranteed by Murphy USA, and are guaranteed by certain 100% owned subsidiaries that guarantee our credit facilities. The indenture governing the Senior Notes contains restrictive covenants that limit, among other things, the ability of Murphy USA, Murphy Oil USA, Inc. and the restricted subsidiaries to incur additional indebtedness or liens, dispose of assets, make certain restricted payments or investments, enter into transactions with affiliates or merge with or into other entities.
The Senior Notes and the guarantees rank equally with all of our and the guarantors’ existing and future senior unsecured indebtedness and effectively junior to our and the guarantors’ existing and future secured indebtedness (including indebtedness with respect to the credit facilities) to the extent of the value of the assets securing such indebtedness. The Senior Notes are structurally subordinated to all of the existing and future third-party liabilities, including trade payables, of our existing and future subsidiaries that do not guarantee the notes.
We used the net proceeds of the Senior Notes, together with borrowings under the credit facilities, to finance a cash dividend of $650 million from Murphy Oil USA, Inc. to Murphy Oil paid in connection with the Separation.
On June 17, 2014, we closed an exchange offer for our Senior Notes to make them eligible for public resale, as required by a registration rights agreement entered into in connection with the issuance of the Senior Notes. All of the Senior Notes were tendered for exchange.
Credit Facilities
On August 30, 2013, we entered into a credit agreement, which provides for a committed $450 million asset-based loan (ABL) facility (with availability subject to the borrowing base described below) and a $150 million term facility. It also provides for a $200 million uncommitted incremental facility. On August 30, 2013, Murphy Oil USA, Inc. borrowed $150 million under the term facility, the proceeds of which were used, together with the net proceeds of the offering of the Senior Notes, to finance the $650 million cash dividend from Murphy USA Inc. to Murphy
F-16
Murphy USA Inc.
NOTES TO CONSOLIDATED AND COMBINED FINANCIAL STATEMENTS
Oil. The term facility was repaid in full in May 2014. On September 2, 2014, we amended the credit agreement to extend the maturity date to September 2, 2019 and amend the terms of the various covenants.
The borrowing base is expected, at any time of determination, to be an amount (net of reserves) equal to the sum of:
• | 100% of eligible cash at such time, plus |
• | 90% of eligible credit card receivables at such time, plus |
• | 90% of eligible investment grade accounts, plus |
• | 85% of eligible other accounts, plus |
• | 80% of eligible product supply/wholesale refined products inventory at such time, plus |
• | 75% of eligible retail refined products inventory at such time, plus |
the lesser of (i) 70% of the average cost of eligible retail merchandise inventory at such time and (ii) 85% of the net orderly liquidation value of eligible retail merchandise inventory at such time.
The ABL facility includes a $75 million sublimit on swingline loans and a $200 million sublimit for the issuance of letters of credit. Swingline loans and letters of credit issued under the ABL facility reduce availability under the ABL facility.
Interest payable on the credit facilities is based on either:
• | the London interbank offered rate, adjusted for statutory reserve requirements (the “Adjusted LIBO Rate”); or |
• | the Alternate Base Rate, which is defined as the highest of (a) the prime rate, (b) the federal funds effective rate from time to time plus 0.50% per annum and (c) the one-month Adjusted LIBO Rate plus 1.00% per annum, |
plus, (A) in the case Adjusted LIBO Rate borrowings, (i) with respect to the ABL facility, spreads ranging from 1.50% to 2.00% per annum depending on the average availability under the ABL facility or (ii) with respect to the term facility, spreads ranging from 2.75% to 3.00% per annum depending on a secured debt to EBITDA ratio and (B) in the case of Alternate Base Rate borrowings, (i) with respect to the ABL facility, spreads ranging from 0.50% to 1.00% per annum depending on the average availability under the ABL facility or (ii) with respect to the term facility, spreads ranging from 1.75% to 2.00% per annum depending on a secured debt to EBITDA ratio.
The interest rate period with respect to the Adjusted LIBO Rate interest rate option can be set at one-, two-, three-, or six-months as selected by us in accordance with the terms of the credit agreement.
The credit agreement contains certain covenants that limit, among other things, the ability of us and our subsidiaries to incur additional indebtedness or liens, to make certain investments, to enter into sale-leaseback transactions, to make certain restricted payments, to enter into consolidations, mergers or sales of material assets and other fundamental changes, to transact with affiliates, to enter into agreements restricting the ability of subsidiaries to incur liens or pay dividends, or to make certain accounting changes. In addition, the credit agreement requires us to maintain a fixed charge coverage ratio of a minimum of 1.0 to 1.0 when availability for at least three consecutive business days is less than the greater of (a) 17.5% of the lesser of the aggregate ABL facility commitments and the borrowing base and (b) $70,000,000 (including as of the most recent fiscal quarter end on the first date when availability is less than such amount). As of December 31, 2015, our fixed charge coverage ratio was 0.59; however, we had no debt outstanding under the facility at that date so the fixed charge coverage ratio currently has no impact on our operations or liquidity. Prior to the repayment of the term loan, we were also subject to a maximum secured debt to EBITDA ratio of 4.5 to 1.0 at any time when term facility commitments or term loans thereunder were outstanding.
After giving effect to the applicable restrictions on certain payments, which could include dividends under the credit agreement (which restrictions are only applicable when availability under the credit agreement does not exceed the greater of 25% of the lesser of the revolving commitments and the borrowing base and $100 million (and if availability under the credit agreement does not exceed the greater of 40% of the lesser of the revolving commitments and the borrowing base and $150 million, then our fixed charge coverage ratio must be at least 1.0 to 1.0)) and the indenture, and subject to compliance with applicable law. As of December 31, 2015, the Company's ability to make restricted payments was limited as our availability under the borrowing base was less than $150.0
F-17
Murphy USA Inc.
NOTES TO CONSOLIDATED AND COMBINED FINANCIAL STATEMENTS
million and our fixed charge coverage ratio was less than 1.0 to 1.0. At December 31, 2015, the Company had a shortfall of approximately $245.7 million of its net income and retained earnings subject to such restrictions before the fixed charge coverage ratio would exceed 1.0 to 1.0.
.
All obligations under the credit agreement are guaranteed by Murphy USA and the subsidiary guarantors party thereto, and all obligations under the credit agreement, including the guarantees of those obligations, are secured by certain assets of Murphy USA, Murphy Oil USA, Inc. and the guarantors party thereto.
Note 10 — Asset Retirement Obligations (ARO)
The majority of the ARO recognized by the Company at December 31, 2015 and 2014 related to the estimated costs to dismantle and abandon certain of its retail gasoline stations. The Company has not recorded an ARO for certain of its marketing assets because sufficient information is presently not available to estimate a range of potential settlement dates for the obligation. These assets are consistently being upgraded and are expected to be operational into the foreseeable future. In these cases, the obligation will be initially recognized in the period in which sufficient information exists to estimate the obligation.
A reconciliation of the beginning and ending aggregate carrying amount of the ARO is shown in the following table.
December 31, | ||||||||
(Thousands of dollars) | 2015 | 2014 | ||||||
Balance at beginning of period | $ | 22,245 | $ | 17,130 | ||||
Accretion expense | 1,521 | 1,200 | ||||||
Liabilities incurred | 579 | 3,915 | ||||||
Balance at end of period | $ | 24,345 | $ | 22,245 | ||||
The estimation of future ARO is based on a number of assumptions requiring professional judgment. The Company cannot predict the type of revisions to these assumptions that may be required in future periods due to the lack of availability of additional information.
Note 11 — Income Taxes
The components of income from continuing operations before income taxes for each of the three years ended December 31, 2015 and income tax expense (benefit) attributable thereto were as follows:
Years Ended December 31, | |||||||||||
(Thousands of dollars) | 2015 | 2014 | 2013 | ||||||||
Income (loss) from continuing operations before income taxes | $ | 218,289 | $ | 339,346 | $ | 254,194 | |||||
Income tax expense (benefit) | |||||||||||
Federal - Current | $ | 58,039 | 119,338 | 92,828 | |||||||
Federal - Deferred | 15,853 | (382 | ) | (9,067 | ) | ||||||
State - Current and deferred | 6,806 | (2,570 | ) | 16,298 | |||||||
Total | $ | 80,698 | $ | 116,386 | $ | 100,059 | |||||
The following table reconciles income taxes based on the U.S. statutory tax rate to the Company’s income tax expense.
Years Ended December 31, | |||||||||||
(Thousands of dollars) | 2015 | 2014 | 2013 | ||||||||
Income tax expense based on the U.S. statutory tax rate | $ | 76,401 | $ | 118,771 | $ | 88,968 | |||||
State income taxes, net of federal benefit | 4,424 | (1,671 | ) | 10,594 | |||||||
Other, net | (127 | ) | (714 | ) | 497 | ||||||
Total | $ | 80,698 | $ | 116,386 | $ | 100,059 | |||||
F-18
Murphy USA Inc.
NOTES TO CONSOLIDATED AND COMBINED FINANCIAL STATEMENTS
An analysis of the Company’s deferred tax assets and deferred tax liabilities at December 31, 2015 and 2014 showing the tax effects of significant temporary differences follows:
December 31, | |||||||
(Thousands of dollars) | 2015 | 2014 | |||||
Deferred tax assets | |||||||
Property costs and asset retirement obligations | $ | 2,666 | $ | 2,157 | |||
Employee benefits | 9,647 | 9,712 | |||||
Other deferred tax assets | 7,297 | 8,995 | |||||
Total gross deferred tax assets | 19,610 | 20,864 | |||||
Less valuation allowance | — | — | |||||
Net deferred tax assets | 19,610 | 20,864 | |||||
Deferred tax liabilities | |||||||
Accumulated depreciation and amortization | (157,322 | ) | (133,535 | ) | |||
State deferred taxes | (17,042 | ) | (16,855 | ) | |||
Other deferred tax liabilities | (8,211 | ) | (8,837 | ) | |||
Total gross deferred tax liabilities | (182,575 | ) | (159,227 | ) | |||
Net deferred tax liabilities | $ | (162,965 | ) | $ | (138,363 | ) | |
In management’s judgment, the net deferred tax assets in the preceding table will more likely than not be realized as reductions of future taxable income or by utilizing available tax planning strategies.
Murphy Oil’s tax returns in multiple jurisdictions that include the Company are subject to audit by taxing authorities. These audits often take years to complete and settle. As of December 31, 2015, the earliest year remaining open for Federal audit and/or settlement is 2012 and for the states it ranges from 2008-2011. Although the Company believes that recorded liabilities for unsettled issues are adequate, additional gains or losses could occur in future periods from resolution of outstanding unsettled matters.
The FASB’s rules for accounting for income tax uncertainties clarify the criteria for recognizing uncertain income tax benefits and require additional disclosures about uncertain tax positions. Under U.S. GAAP the financial statement recognition of the benefit for a tax position is dependent upon the benefit being more likely than not to be sustainable upon audit by the applicable taxing authority. If this threshold is met, the tax benefit is then measured and recognized at the largest amount that is greater than 50 percent likely of being realized upon ultimate settlement. Liabilities associated with uncertain income tax positions are included in Deferred Credits and Other Liabilities in the Consolidated Balance Sheet. A reconciliation of the beginning and ending amount of the consolidated liability for unrecognized income tax benefits during the year ended December 31, 2015 and 2014 is shown in the following table. No uncertain tax position liabilities were recognized for the year ending December 31, 2013.
Year Ended December 31, | ||||||
(Thousands of dollars) | 2015 | 2014 | ||||
Balance at January 1 | $ | 6,101 | $ | — | ||
Additions for tax positions related to prior year | 222 | 10,086 | ||||
Additions for tax positions related to current year | — | 77 | ||||
Settlements with taxing authorities | — | (1,563 | ) | |||
Expiration of statutes of limitation | (873 | ) | (2,499 | ) | ||
Balance at December 31 | $ | 5,450 | $ | 6,101 | ||
All additions or reductions to the above liability affect the Company’s effective tax rate in the respective period of change. The Company accounts for any applicable interest and penalties on uncertain tax positions as a component of income tax expense. Income tax expense for the years ended December 31, 2015, 2014 and 2013 included net benefits for interest and penalties of $651,000, $1,143,000 and $0, respectively, associated with uncertain tax positions.
F-19
Murphy USA Inc.
NOTES TO CONSOLIDATED AND COMBINED FINANCIAL STATEMENTS
During the next twelve months, the Company currently expects to add immaterial amounts to the liability for uncertain taxes for 2016 events. Although existing liabilities could be reduced by settlement with taxing authorities or lapse due to statute of limitations, the Company believes that the changes in its unrecognized tax benefits due to these events will not have a material impact on the Consolidated Income Statement during 2016.
Note 12 — Incentive Plans
Prior to the separation, our employees participated in the Murphy Oil 2007 Long-Term Incentive Plan (the “2007 Plan”) and the Murphy Oil 2012 Long-Term Incentive Plan (the “2012 Plan”) and received Murphy Oil restricted stock awards and options to purchase shares of Murphy Oil common stock. While participating in these two plans, costs resulting from share-based payment transactions were allocated and recognized as an expense in the financial statements using a fair value-based measurement method over the periods that the awards vested. Certain employees of the Company have received annual grants in the form of Murphy Oil stock options, restricted stock units and other forms of share-based payments prior to the separation. Accordingly, the Company has accounted for expense for these plans in accordance with SAB Topic 1-B for periods prior to the separation.
2013 Long-Term Incentive Plan
Effective August 30, 2013, certain of our employees began to participate in the Murphy USA 2013 Long-Term Incentive Plan, which was subsequently amended and restated effective as of February 12, 2014 (the “MUSA 2013 Plan”). The MUSA 2013 Plan authorizes the Executive Compensation Committee of our Board of Directors (“the Committee”) to grant non-qualified or incentive stock options, stock appreciation rights, stock awards (including restricted stock and restricted stock unit awards), cash awards, and performance awards to our employees. Prior to the amendment and restatement of the MUSA 2013 Plan on February 12, 2014, 10 million shares of MUSA common stock were authorized to be delivered under the MUSA 2013 Plan over the life of the plan. Pursuant to the amendment and restatement of the plan effective as of February 12, 2014, this was reduced to 5.5 million shares of common stock. No more than 1 million shares of common stock may be awarded to any one employee, subject to adjustment for changes in capitalization. The maximum cash amount payable pursuant to any “performance-based” award to any participant in any calendar year is $5 million.
In connection with the separation, stock compensation awards granted under the 2007 Plan and the 2012 Plan by Murphy Oil (pre-separation awards) were adjusted or substituted as follows:
• | Vested stock options were equitably adjusted so that the grantee holds more options to purchase Murphy Oil common stock at a lower strike price. |
• | Unvested stock options and stock appreciation rights held by MUSA employees were replaced with substitute awards of options to purchase shares of MUSA common stock. |
• | Unvested restricted stock units will be replaced with adjusted, substitute awards for restricted stock units of MUSA common stock. The new awards of restricted stock are intended to generally preserve the intrinsic value of the original award determined as of the separation and distribution date. |
• | Vesting periods of awards were unaffected by the adjustment and substitution, except that for vested Murphy Oil stock options the MUSA employees have until the earlier of two years from the date of the separation or the stated expiration date of the option to exercise the award. |
Awards granted in connection with the adjustment and substitution of awards originally issued under the 2007 Plan and the 2012 Plan are a part of the MUSA 2013 Plan and reduce the maximum number of shares of common stock available for delivery under the MUSA 2013 Plan. During the period from August 30, 2013 to December 31, 2015, the Company granted a total of 1,563,828 awards from the MUSA 2013 Plan which leaves 4,074,288 remaining shares to be granted in future years (after consideration of the amendments made to the MUSA 2013 Plan in February 2014 by the Board of Directors). At present, the Company expects to issue all shares that vest out of existing treasury shares rather than issuing new common shares.
2013 Stock Plan for Non-employee Directors
Effective August 8, 2013, Murphy USA adopted the 2013 Murphy USA Stock Plan for Non-employee Directors (the “Directors Plan”). The directors for Murphy USA are compensated with a mixture of cash payments and equity-
F-20
Murphy USA Inc.
NOTES TO CONSOLIDATED AND COMBINED FINANCIAL STATEMENTS
based awards. Awards under the Directors Plan may be in the form of restricted stock, restricted stock units, stock options, or a combination thereof. An aggregate of 500,000 shares of common stock shall be available for issuance of grants under the Directors Plan. Since 2013, 63,774 time-based restricted stock units have been granted under the terms of the Directors Plan which leaves 436,226 shares available to be granted in the future.
Amounts recognized in the financial statements by the Company with respect to all share-based plans are shown in the following table. All expense prior to August 30, 2013 was incurred under the 2007 Plan and the 2012 Plan while all amounts after August 30, 2013 were incurred in the MUSA 2013 Plan and the Directors Plan.
December 31, | ||||||||||||
(Thousands of dollars) | 2015 | 2014 | 2013 | |||||||||
Compensation charged against income before income tax benefit | $ | 9,015 | $ | 10,435 | $ | 9,391 | ||||||
Related income tax benefit recognized in income | $ | 3,155 | $ | 3,652 | $ | 3,287 | ||||||
As of December 31, 2015, there was $12,934,000 in compensation costs to be expensed over approximately the next 2.3 years related to unvested share-based compensation arrangements granted by the Company or its predecessor. Total income tax benefits realized by Murphy Oil from tax deductions related to stock option exercises under share-based payment arrangements previously issued by Murphy Oil Corporation were $0, $0, and $625,000 for the years ended December 31, 2015, 2014 and 2013, respectively. Employees who have stock options are required to net settle their options in shares, after applicable statutory withholding taxes are considered, upon each stock option exercise. Therefore, no cash is received upon exercise. Total income tax benefits realized from tax deductions related to stock option exercises under share-based payment arrangements were $3,109,000 and $470,000 for the year ended December 31, 2015 and 2014, respectively.
STOCK OPTIONS – The Committee fixes the option price of each option granted at no less than fair market value (FMV) on the date of the grant and fixes the option term at no more than 7 years from such date. Each option granted through December 31, 2013 under the MUSA 2013 Plan was nonqualified and was issued to replace awards of Murphy Oil that were previously granted to employees of the Company prior to the separation from Murphy Oil. The remaining term of each option granted mirrored the remaining term of the original award that it replaced and the exercise price was adjusted based on the terms of the Employee Matters Agreement entered into between the Company and Murphy Oil in connection with the separation. Post separation in 2013, the only awards issued were to replace the unvested awards of Murphy Oil that were forfeited in conjunction with the separation. Therefore, the accounting for those awards was a continuation of the Murphy Oil fair value that was previously calculated using the Black-Scholes pricing model and used the following original assumptions to calculate the fair value used for expense purposes. Following are the assumptions used originally by Murphy Oil to value the original awards.
Years Ended December 31, | |
2012 and 2011 | |
Fair value per option grant | 12.37 - 20.34 |
Assumptions | |
Dividend yield | 1.80% - 2.27% |
Expected volatility | 37.00% - 39.62% |
Risk-free interest rate | 0.55% - 2.10% |
Expected life | 4.00 yrs. - 5.20 yrs. |
As a result of the separation from Murphy Oil, the unvested Murphy Oil options were replaced with an appropriate number of Company options bearing an exercise price that was adjusted to preserve the intrinsic value near the date of the separation in connection with the terms of the Employee Matters Agreement. The grant date fair values of the options replaced with MUSA 2013 Plan awards range from $32.53 to $40.25. Because of these adjustments, no further Black-Scholes fair values were required to be calculated for the post separation period. The adjustment and substitution of the stock compensation awards occurred in conjunction with the distribution of MUSA common stock to Murphy Oil stockholders. As a result, no grant, exercise, or cancellation activity occurred on MUSA stock
F-21
Murphy USA Inc.
NOTES TO CONSOLIDATED AND COMBINED FINANCIAL STATEMENTS
compensation awards during the year ended December 31, 2013. In February 2015, the Committee granted nonqualified stock options to certain employees of the Company. Following are the assumptions used by the Company to value the original awards:
Year Ended December 31, | ||||||
2015 | 2014 | |||||
Fair value per option grant | $ | 20.18 | $ | 11.44 | ||
Assumptions | ||||||
Dividend yield | — | — | ||||
Expected volatility | 29.3 | % | 31.7 | % | ||
Risk-free interest rate | 1.52 | % | 1.37 | % | ||
Expected life | 5.0 years | 4.6 years | ||||
Changes in options outstanding for Company employees during the period from August 30, 2013 to December 31, 2015 are presented in the following table:
Number of Shares | Average Exercise Price | |||||
Outstanding at December 31, 2013 | 621,149 | $ | 35.13 | |||
Granted at FMV | 127,400 | 39.46 | ||||
Exercised | (74,766 | ) | 34.21 | |||
Forfeited | (13,148 | ) | 38.36 | |||
Outstanding at December 31, 2014 | 660,635 | 36.00 | ||||
Granted at FMV | 72,350 | 70.57 | ||||
Exercised | (236,620 | ) | 33.80 | |||
Forfeited | (30,609 | ) | 40.21 | |||
Outstanding at December 31, 2015 | 465,756 | $ | 42.22 | |||
Exercisable at December 31, 2014 | 88,445 | $ | 34.54 | |||
Exercisable at December 31, 2015 | 127,077 | $ | 36.71 | |||
Additional information about stock options outstanding at December 31, 2015 is shown below:
Options Outstanding | Options Exercisable | |||||||||||||||||
Range of Exercise Prices per Option | No. of Options | Avg. Life Remaining in Years | Aggregate Intrinsic Value | No. of Options | Avg. Life Remaining in Years | Aggregate Intrinsic Value | ||||||||||||
$32.53 to $37.06 | 171,592 | 3.9 | $ | 4,614,797 | 62,213 | 3.5 | $ | 1,707,361 | ||||||||||
$37.07 to $39.45 | 5,615 | 2.0 | 132,891 | 5,615 | 2.0 | 132,891 | ||||||||||||
$39.46 to $40.25 | 218,899 | 4.6 | 4,564,023 | 59,249 | 4.1 | 1,213,745 | ||||||||||||
$40.26 to $70.57 | 69,650 | 6.1 | — | — | 0.0 | — | ||||||||||||
465,756 | 4.5 | $ | 9,311,711 | 127,077 | 3.7 | $ | 3,053,997 | |||||||||||
RESTRICTED STOCK UNITS (MUSA 2013 Plan) – The Committee has granted time based restricted stock units (RSUs) as part of the replacement of previously unvested performance based RSUs, performance units, and time based RSU’s previously issued to employees of Murphy Oil prior to August 30, 2013. In addition, certain other employees have also received grants of time based RSUs that will vest over various periods of time in the year ended December 31, 2015. In February and March 2015, the Committee granted time based restricted stock to certain employees. These awards were granted under the MUSA 2013 Plan and vest in 3 years.
F-22
Murphy USA Inc.
NOTES TO CONSOLIDATED AND COMBINED FINANCIAL STATEMENTS
(Number of units) | Employee RSU's | |
Outstanding at December 31, 2012 | — | |
Granted | 352,522 | |
Vested and issued | (509 | ) |
Forfeited | (4,915 | ) |
Outstanding at December 31, 2013 | 347,098 | |
Granted | 93,025 | |
Vested and issued | (20,680 | ) |
Forfeited | (22,428 | ) |
Outstanding at December 31, 2014 | 397,015 | |
Granted | 55,450 | |
Vested and issued | (66,116 | ) |
Forfeited | (30,049 | ) |
Outstanding at December 31, 2015 | 356,300 | |
PERFORMANCE-BASED RESTRICTED STOCK UNITS (MUSA 2013 Plan) – In February 2015, the Committee awarded performance-based restricted stock units (performance units) to certain employees. Half of the performance units vest based on a 3-year return on average capital employed (ROACE) calculation and the other half vest based on a 3-year total shareholder return (TSR) calculation that compares MUSA to a group of 16 peer companies. The portion of the awards that vest based on TSR qualify as a market condition and must be valued using a Monte Carlo valuation model. For the TSR portion of the awards, the fair value was determined to be $100.33 per unit. For the ROACE portion of the awards, the valuation was based on the grant date fair value of $70.57 per unit and the number of awards will be periodically assessed to determine the probability of vesting.
(Number of units) | Employee PSU's | |
Outstanding at December 31, 2013 | — | |
Granted | 78,500 | |
Vested and issued | — | |
Forfeited | (6,500 | ) |
Outstanding at December 31, 2014 | 72,000 | |
Granted | 40,400 | |
Vested and issued | — | |
Forfeited | (10,006 | ) |
Outstanding at December 31, 2015 | 102,394 | |
RESTRICTED STOCK UNITS (Directors Plan) – The Committee has also granted time based RSUs to the non-employee directors of the Company as part of their overall compensation package for being a member of the Board of Directors. These awards typically vest at the end of three years.
F-23
Murphy USA Inc.
NOTES TO CONSOLIDATED AND COMBINED FINANCIAL STATEMENTS
(Number of units) | Director RSU's | |
Outstanding at December 31, 2012 | — | |
Granted | 28,413 | |
Vested and issued | — | |
Forfeited | — | |
Outstanding at December 31, 2013 | 28,413 | |
Granted | 22,437 | |
Vested and issued | — | |
Forfeited | — | |
Outstanding at December 31, 2014 | 50,850 | |
Granted | 12,924 | |
Vested and issued | — | |
Forfeited | — | |
Outstanding at December 31, 2015 | 63,774 | |
Note 13 — Employee and Retiree Benefit Plans
PENSION AND POSTRETIREMENT PLANS — After separating from Murphy Oil, the Company no longer sponsors or participates in any defined benefit pension plan or post retirement benefit plan for its employees. Prior to the separation, Murphy Oil had defined benefit pension plans that were principally noncontributory and covered most full-time employees. Upon separation from Murphy Oil, all amounts for these plans that involved Murphy USA employees were frozen and retained by Murphy Oil.
U.S. Health Care Reform — In March 2010, the United States Congress enacted a health care reform law. Along with other provisions, the law (a) imposes a 40% excise tax on high-cost health plans as defined in the law beginning in 2018; (b) eliminated lifetime or annual coverage limits and required coverage for preventative health services beginning in September 2010; and (c) imposed a fee of $2 (subsequently adjusted for inflation) for each person covered by a health insurance policy beginning in September 2010. The new law did not significantly affect the Company’s consolidated and combined financial statements as of December 31, 2015 and 2014 and for the three years ended December 31, 2015. The Company continues to evaluate the various components of the law as guidance is issued and cannot predict with certainty all the ways it may impact the Company. However, based on the evaluation performed to date, the Company currently believes that the health care reform law will not have a material effect on its financial condition, results of operations, or cash flows in future periods.
THRIFT PLAN – At the time of the spin-off, Murphy USA set up a new qualified defined contribution plan for full-time employees with an asset transfer from the Murphy Oil defined contribution plan. Most full-time employees of the Company may participate in savings plans by contributing up to a specified percentage of their base pay. The Company matches contributions at 100% of each employee’s contribution with a maximum match of 6%. In addition, the Company makes profit sharing contributions on an annual basis. Eligible employees receive a stated percentage of their base and incentive pay of 5%, 7%, or 9% determined on a formula that is based on a combination of age and years of service. The Company’s expenses related to this plan were $9,216,000 in 2015, $8,879,000 in 2014 and $4,567,000 in 2013.
PROFIT SHARING PLAN – Eligible part-time employees may participate in the Company’s noncontributory profit sharing plan. Each year, the Company may make a discretionary employer contribution in an amount determined and authorized at the discretion of the Board of Directors. Eligible employees receive an allocation based on their compensation earned for the year the contribution is allocated. The Company’s expenses related to this plan were $1,848,000 in 2015, $1,848,000 in 2014 and $1,861,000 in 2013.
F-24
Murphy USA Inc.
NOTES TO CONSOLIDATED AND COMBINED FINANCIAL STATEMENTS
Note 14 — Financial Instruments and Risk Management
DERIVATIVE INSTRUMENTS — The Company makes limited use of derivative instruments to manage certain risks related to commodity prices. The use of derivative instruments for risk management is covered by operating policies and is closely monitored by the Company’s senior management. The Company does not hold any derivatives for speculative purposes and it does not use derivatives with leveraged or complex features. Derivative instruments are traded primarily with creditworthy major financial institutions or over national exchanges such as the New York Mercantile Exchange (“NYMEX”). As of December 31, 2015, all current derivative activity is immaterial.
At December 31, 2015 and 2014 cash deposits of $1.6 million and $2.8 million, respectively, related to commodity derivative contracts were reported in Prepaid expenses and other current assets in the Consolidated Balance Sheets. These cash deposits have not been used to reduce the reported net liabilities on the derivative contracts at December 31, 2015 and 2014.
Note 15 – Earnings Per Share
Basic earnings per common share is computed by dividing net income available to common stockholders by the weighted average of common shares outstanding during the period. Diluted earnings per common share adjusts basic earnings per common share for the effects of stock options and restricted stock in the periods where such items are dilutive.
On August 30, 2013, 46,743,316 shares of our common stock were distributed to the shareholders of Murphy Oil in connection with the separation. For comparative purposes, we have assumed this amount to be outstanding as of the beginning of each prior period prior to the separation presented in the calculation of weighted average shares outstanding.
During May 2014, the Company executed a share repurchase program that was approved by the Board of Directors for approximately $50 million worth of common stock of the Company. At the completion of this plan, the Company had acquired 1,040,636 shares of common stock for an average price of $48.07 per share including brokerage fees. In October 2014, the Company announced a $250 million share repurchase program that was completed prior to the end of 2015. In this repurchase, 4,196,349 shares were repurchased for an average price of $59.58 per share.
The following table provides a reconciliation of basic and diluted earnings per share computations for the years ended December 31, 2015, 2014 and 2013 (in thousands, except per share amounts):
F-25
Murphy USA Inc.
NOTES TO CONSOLIDATED AND COMBINED FINANCIAL STATEMENTS
Years ended December 31, | |||||||||||
(Thousands of dollars except per share amounts) | 2015 | 2014 | 2013 | ||||||||
Earnings per common share: | |||||||||||
Net income (loss) per share - basic | |||||||||||
Income from continuing operations | $ | 137,591 | $ | 222,960 | $ | 154,135 | |||||
Income from discontinued operations | $ | 38,749 | $ | 20,903 | $ | 80,898 | |||||
Net income attributable to common stockholders | $ | 176,340 | $ | 243,863 | $ | 235,033 | |||||
Weighted average common shares outstanding (in thousands) | 43,434 | 46,104 | 46,743 | ||||||||
Earnings per share: | |||||||||||
Continuing operations | $ | 3.17 | $ | 4.84 | $ | 3.30 | |||||
Discontinued operations | $ | 0.89 | $ | 0.45 | $ | 1.73 | |||||
Total earnings per share | $ | 4.06 | $ | 5.29 | $ | 5.03 | |||||
Earnings per common share - assuming dilution: | Years ended December 31, | ||||||||||
2015 | 2014 | 2013 | |||||||||
Net income (loss) per share - diluted | |||||||||||
Income from continuing operations | $ | 137,591 | $ | 222,960 | $ | 154,135 | |||||
Income from discontinued operations | $ | 38,749 | $ | 20,903 | $ | 80,898 | |||||
Net income attributable to common stockholders | $ | 176,340 | $ | 243,863 | $ | 235,033 | |||||
Weighted average common shares outstanding (in thousands) | 43,434 | 46,104 | 46,743 | ||||||||
Common equivalent shares: | |||||||||||
Dilutive options | 360 | 313 | 115 | ||||||||
Weighted average common shares outstanding - assuming dilution (in thousands) | 43,794 | 46,417 | 46,858 | ||||||||
Earnings per share: | |||||||||||
Continuing operations | $ | 3.14 | $ | 4.81 | $ | 3.29 | |||||
Discontinued operations | $ | 0.88 | $ | 0.45 | $ | 1.73 | |||||
Earnings per share - assuming dilution | $ | 4.02 | $ | 5.26 | $ | 5.02 | |||||
Note 16 — Other Financial Information
OTHER OPERATING REVENUES – Other operating revenues in the Consolidated and Combined Income Statements includes the following items:
(Thousands of dollars) | 2015 | 2014 | 2013 | ||||||||
Renewable Identification Numbers (RINs) sales | $ | 117,513 | $ | 92,916 | $ | 91,391 | |||||
Other | 3,321 | 3,193 | 2,907 | ||||||||
Total other operating revenue | $ | 120,834 | $ | 96,109 | $ | 94,298 | |||||
CASH FLOW DISCLOSURES — Cash income taxes paid (collected), net of refunds, were $113,520,000, $158,063,000 and $47,757,000 for the three years ended December 31, 2015, 2014 and 2013, respectively. Interest paid was $31,798,000, $34,019,000 and $1,647,000 for the years ended December 31, 2015, 2014 and 2013, respectively. Noncash reductions (additions) to net parent investment related primarily to settlement of income taxes were $453,000 for the year ended December 31, 2013.
F-26
Murphy USA Inc.
NOTES TO CONSOLIDATED AND COMBINED FINANCIAL STATEMENTS
(Thousands of dollars) | 2015 | 2014 | 2013 | ||||||||
Accounts receivable | $ | 2,857 | $ | 59,519 | $ | 325,063 | |||||
Inventories | 1,121 | 750 | 4,011 | ||||||||
Prepaid expenses and other current assets | (27,107 | ) | 477 | (7,755 | ) | ||||||
Accounts payable and accrued liabilities | 1,043 | (53,234 | ) | (271,379 | ) | ||||||
Income taxes payable | (25,599 | ) | (37,325 | ) | 6,892 | ||||||
Current deferred income tax liabilities | 1,099 | (6,662 | ) | (5,628 | ) | ||||||
Net decrease (increase) in noncash operating working capital | $ | (46,586 | ) | $ | (36,475 | ) | $ | 51,204 | |||
Note 17 — Assets and Liabilities Measured at Fair Value
The Company carries certain assets and liabilities at fair value in its Consolidated Balance Sheets. The fair value hierarchy is based on the quality of inputs used to measure fair value, with Level 1 being the highest quality and Level 3 being the lowest quality. Level 1 inputs are quoted prices in active markets for identical assets or liabilities. Level 2 inputs are observable inputs other than quoted prices included within Level 1. Level 3 inputs are unobservable inputs which reflect assumptions about pricing by market participants.
At the balance sheet date the fair value of derivatives contracts were determined using NYMEX quoted values but were immaterial. The carrying value of the Company’s Cash and cash equivalents, Accounts receivable-trade and Trade accounts payable approximates fair value.
The following table presents the carrying amounts and estimated fair values of financial instruments held by the Company at December 31, 2015 and 2014. The fair value of a financial instrument is the amount at which the instrument could be exchanged in a current transaction between willing parties. The table excludes Cash and cash equivalents, Accounts receivable-trade, and Trade accounts payable and accrued liabilities, all of which had fair values approximating carrying amounts. The fair value of Current and Long-term debt was estimated based on rates offered to the Company at that time for debt of the same maturities. The Company has off-balance sheet exposures relating to certain financial guarantees and letters of credit. The fair value of these, which represents fees associated with obtaining the instruments, was nominal.
December 31, 2015 | December 31, 2014 | |||||||||||||||
Carrying | Carrying | |||||||||||||||
(Thousands of dollars) | Amount | Fair Value | Amount | Fair Value | ||||||||||||
Financial liabilities | ||||||||||||||||
Current and long-term debt | $ | (490,382 | ) | $ | (511,916 | ) | $ | (488,250 | ) | $ | (510,344 | ) | ||||
Note 18 – Commitments
The Company leases land, gasoline stations, and other facilities under operating leases. During the next five years, expected future rental payments under all operating leases are approximately $23,642,000 in 2016, $10,079,000 in 2017, $9,658,000 in 2018, $9,704,000 in 2019, and $9,519,000 in 2020. Rental expense for noncancelable operating leases, including contingent payments when applicable, was $22,418,000 in 2015, $8,528,000 in 2014 and $7,139,000 in 2013. Operating lease expense related to discontinued operations was $2,660,000, $2,905,000, and $9,641,000 in 2015, 2014, and 2013, respectively.
Commitments for capital expenditures were approximately $220,630,000 at December 31, 2015, including $179,900,000 for construction of future Murphy USA and Murphy Express gasoline stations (including land) in process at year-end, along with $6,052,000 for improvements of existing stations, to be financed with our operating cash flow and/or incurrence of indebtedness.
F-27
Murphy USA Inc.
NOTES TO CONSOLIDATED AND COMBINED FINANCIAL STATEMENTS
Note 19 — Contingencies
The Company’s operations and earnings have been and may be affected by various forms of governmental action. Examples of such governmental action include, but are by no means limited to: tax increases and retroactive tax claims; import and export controls; price controls; allocation of supplies of crude oil and petroleum products and other goods; laws and regulations intended for the promotion of safety and the protection and/or remediation of the environment; governmental support for other forms of energy; and laws and regulations affecting the Company’s relationships with employees, suppliers, customers, stockholders and others. Because governmental actions are often motivated by political considerations, may be taken without full consideration of their consequences, and may be taken in response to actions of other governments, it is not practical to attempt to predict the likelihood of such actions, the form the actions may take or the effect such actions may have on the Company.
ENVIRONMENTAL MATTERS AND LEGAL MATTERS — Murphy USA is subject to numerous federal, state and local laws and regulations dealing with the environment. Violation of such environmental laws, regulations and permits can result in the imposition of significant civil and criminal penalties, injunctions and other sanctions. A discharge of hazardous substances into the environment could, to the extent such event is not insured, subject the Company to substantial expense, including both the cost to comply with applicable regulations and claims by neighboring landowners and other third parties for any personal injury, property damage and other losses that might result.
The Company currently owns or leases, and has in the past owned or leased, properties at which hazardous substances have been or are being handled. Although the Company believes it has used operating and disposal practices that were standard in the industry at the time, hazardous substances may have been disposed of or released on or under the properties owned or leased by the Company or on or under other locations where they have been taken for disposal. In addition, many of these properties have been operated by third parties whose management of hazardous substances was not under the Company’s control. Under existing laws the Company could be required to remediate contaminated property (including contaminated groundwater) or to perform remedial actions to prevent future contamination. Certain of these contaminated properties are in various stages of negotiation, investigation, and/or cleanup, and the Company is investigating the extent of any related liability and the availability of applicable defenses. With the sale of the U.S. refineries in 2011, Murphy Oil retained certain liabilities related to environmental matters. Murphy Oil also obtained insurance covering certain levels of environmental exposures. With respect to the previously owned refinery properties, Murphy Oil retained those liabilities in the Separation and Distribution agreement that was entered into related to the separation on August 30, 2013. With respect to any remaining potential liabilities, the Company believes costs related to these sites will not have a material adverse effect on Murphy USA’s net income, financial condition or liquidity in a future period.
Certain environmental expenditures are likely to be recovered by the Company from other sources, primarily environmental funds maintained by certain states. Since no assurance can be given that future recoveries from other sources will occur, the Company has not recorded a benefit for likely recoveries at December 31, 2015, however certain jurisdictions provide reimbursement for these expenses which have been considered in recording the net exposure. The U.S. Environmental Protection Agency (EPA) currently considers the Company a Potentially Responsible Party (PRP) at one Superfund site. As to the site, the potential total cost to all parties to perform necessary remedial work at this site may be substantial. However, based on current negotiations and available information, the Company believes that it is a de minimis party as to ultimate responsibility at the Superfund site. Accordingly, the Company has not recorded a liability for remedial costs at the Superfund site at December 31, 2015. The Company could be required to bear a pro rata share of costs attributable to nonparticipating PRPs or could be assigned additional responsibility for remediation at this site or other Superfund sites. The Company believes that its share of the ultimate costs to clean-up this site will be immaterial and will not have a material adverse effect on its net income, financial condition or liquidity in a future period.
Based on information currently available to the Company, the amount of future remediation costs to be incurred to address known contamination sites is not expected to have a material adverse effect on the Company’s future net income, cash flows or liquidity. However, there is the possibility that additional environmental expenditures could be required to address contamination, including as a result of discovering additional contamination or the imposition of new or revised requirements applicable to known contamination.
In the case Freeny v. Murphy Oil Corporation and Murphy Oil USA, Inc., the plaintiffs alleged that the Company had infringed on their electronic pricing system patents. The Company claimed that its pricing system can be differentiated from the plaintiff's patents and that the plaintiff's patents were invallid. Murphy Oil USA, Inc. agreed to
F-28
Murphy USA Inc.
NOTES TO CONSOLIDATED AND COMBINED FINANCIAL STATEMENTS
defend and indemnify Murphy Oil Corporation in this matter as required by the terms of the Separation Agreement. Trial was held in June 2015. At trial, and before any judgment was entered for any party, a settlement was reached between the parties and the case was dismissed. The settlement agreement resulted in the Company paying an immaterial amount to the plaintiffs for a license to use their patents for past and future periods. As a result, a portion of the settlement amount was capitalized as a patent asset and will be amortized over the remaining life of the patents.
Murphy USA is engaged in a number of other legal proceedings, all of which the Company considers routine and incidental to its business. Based on information currently available to the Company, the ultimate resolution of those other legal matters is not expected to have a material adverse effect on the Company’s net income, financial condition or liquidity in a future period.
INSURANCE — The Company maintains insurance coverage at levels that are customary and consistent with industry standards for companies of similar size. Murphy USA maintains statutory workers compensation insurance with a deductible of $1.0 million per occurrence. As of December 31, 2015, there were a number of outstanding claims that are of a routine nature. The estimated incurred but unpaid liabilities relating to these claims are included in Trade account payables and accrued liabilities on the Consolidated Balance Sheets. While the ultimate outcome of these claims cannot presently be determined, management believes that the accrued liability of $18.0 million will be sufficient to cover the related liability and that the ultimate disposition of these claims will have no material effect on the Company’s financial position and results of operations.
The Company has obtained insurance coverage as appropriate for the business in which it is engaged, but may incur losses that are not covered by insurance or reserves, in whole or in part, and such losses could adversely affect our results of operations and financial position.
TAX MATTERS — Murphy USA is subject to extensive tax liabilities imposed by multiple jurisdictions, including income taxes, indirect taxes (excise/duty, sales/use and gross receipts taxes), payroll taxes, franchise taxes, withholding taxes and ad valorem taxes. New tax laws and regulations and changes in existing tax laws and regulations are continuously being enacted or proposed that could result in increased expenditures for tax liabilities in the future. Many of these liabilities are subject to periodic audits by the respective taxing authority. Subsequent changes to our tax liabilities because of these audits may subject us to interest and penalties.
OTHER MATTERS — In the normal course of its business, the Company is required under certain contracts with various governmental authorities and others to provide financial guarantees or letters of credit that may be drawn upon if the Company fails to perform under those contracts. At December 31, 2015, the Company had contingent liabilities of $17.8 million on outstanding letters of credit. The Company has not accrued a liability in its balance sheet related to these financial guarantees and letters of credit because it is believed that the likelihood of having these drawn is remote.
F-29
Murphy USA Inc.
NOTES TO CONSOLIDATED AND COMBINED FINANCIAL STATEMENTS
Note 20 — Recent Accounting and Reporting Rules
In May 2014, the FASB issued ASU No. 2014-09 “Revenue from Contracts with Customers,” which supersedes the revenue recognition requirements in the Accounting Standards Codification (“Codification”) Topic 605, Revenue Recognition, and most industry-specific guidance throughout the Industry Topics of the Codification. The core principle of the new ASU No. 2014-09 is for companies to recognize revenue from the transfer of goods or services to customers in amounts that reflect the consideration to which the company expects to be entitled in exchange for those goods or services. The new standard also will result in enhanced disclosures about revenue, provide guidance for transactions that were not previously addressed comprehensively (for example, service revenue and contract modifications) and improve guidance for multiple-element arrangements. The guidance is effective for annual and interim periods beginning after December 15, 2017, with early adoption prohibited. The Company expects to adopt ASU No. 2014-09 beginning January 1, 2018 and is in the process of assessing the impact that the new guidance will have on the Company's results of operations, financial condition and disclosures.
In August 2014, the FASB issued ASU No. 2014-15, “Disclosure of Uncertainties about an Entity's Ability to Continue as a Going Concern,” which requires management to assess, at each interim and annual reporting period, whether substantial doubt exists about the Company's ability to continue as a going concern. The new standard substantially aligns the accounting requirements with current auditing requirements (except that the auditing standards require a one-year assessment from the balance sheet date rather than the financial statement issuance date). The new standard is effective for all entities for the first annual period ending after December 15, 2016, and interim periods thereafter, with early adoption permitted.
In April 2015, the FASB issued ASU No. 2015-05, “Customer's Accounting for Fees Paid in a Cloud Computing Arrangement,” which states if a cloud computing arrangement includes a software license, the customer should account for the license consistent with its accounting for other software licenses. If the arrangement does not include a software license, the customer should account for the arrangement as a service contract. The new guidance is effective for fiscal years, including interim periods within those years, beginning after December 15, 2015. Companies may adopt the new guidance either prospectively for all arrangements entered into (or materially modified) after the effective date, or retrospectively. The Company is still evaluating the impact this standard will have on its cloud computing arrangements but no material changes are expected as a result of adoption of this standard.
In November 2015, the FASB issued ASU No. 2015-17, "Balance Sheet Classification of Deferred Taxes," which requires entities with a classified balance sheet to present all deferred tax assets and liabilities as noncurrent. All deferred tax assets and liabilities will still be offset by each tax-paying jurisdiction, but the resulting net item must be shown as a single, noncurrent amount. The ASU allows for either prospective or retrospective transition methods. The new standard is effective for annual and interim periods in fiscal years beginning after December 15, 2016. Early adoption at the beginning of an interim or annual period is allowed for all entities. The Company is evaluating its adoption options and is currently planning to adopt the new standard for the first quarter of 2016. No significant financial impact is anticipated with the adoption of this ASU.
Note 21 — Business Segments
Our operations include the sale of retail motor fuel products and convenience merchandise along with the wholesale and bulk sale capabilities of our product supply and wholesale group. As the primary purpose of the product supply and wholesale group is to support our retail operations and provide fuel for their daily operation, the bulk and wholesale fuel sales are secondary to the support functions played by these groups. As such, they are all treated as one segment for reporting purposes as they sell the same products. This Marketing segment contains essentially all of the revenue generating activities of the Company. Results not included in the reportable segment include Corporate and Other Assets and Discontinued Operations. The reportable segment was determined based on information reviewed by the Chief Operating Decision Maker (CODM).
F-30
Murphy USA Inc.
NOTES TO CONSOLIDATED AND COMBINED FINANCIAL STATEMENTS
Segment Information | Corporate and | Discontinued | ||||||||||||
(Thousands of dollars) | Marketing | Other Assets | Operations | Consolidated | ||||||||||
Year ended December 31, 2015 | ||||||||||||||
Segment income (loss) | $ | 159,796 | (22,205 | ) | 38,749 | $ | 176,340 | |||||||
Revenues from external customers | 12,699,125 | 286 | — | 12,699,411 | ||||||||||
Interest income | — | 2,177 | — | 2,177 | ||||||||||
Interest expense | (20 | ) | (33,511 | ) | — | (33,531 | ) | |||||||
Income tax expense (benefit) | 95,657 | (14,959 | ) | — | 80,698 | |||||||||
Significant noncash charges (credits) | ||||||||||||||
Depreciation and amortization | 81,349 | 5,219 | — | 86,568 | ||||||||||
Accretion of asset retirement obligations | 1,521 | — | — | 1,521 | ||||||||||
Deferred and noncurrent income taxes (benefits) | 42,593 | (2,037 | ) | — | 40,556 | |||||||||
Additions to property, plant and equipment | 202,371 | 9,477 | 3,720 | 215,568 | ||||||||||
Total assets at year-end | $ | 1,727,131 | 159,110 | — | $ | 1,886,241 | ||||||||
Segment Information | Corporate and | Discontinued | |||||||||||
(Thousands of dollars) | Marketing | Other Assets | Operations | Consolidated | |||||||||
Year ended December 31, 2014 | |||||||||||||
Segment income (loss) | $ | 242,434 | (19,474 | ) | 20,903 | $ | 243,863 | ||||||
Revenues from external customers | 16,985,903 | 111 | — | 16,986,014 | |||||||||
Interest income | — | 244 | — | 244 | |||||||||
Interest expense | — | (36,646 | ) | — | (36,646 | ) | |||||||
Income tax expense (benefit) | 127,657 | (11,271 | ) | — | 116,386 | ||||||||
Significant noncash charges (credits) | |||||||||||||
Depreciation and amortization | 74,906 | 4,181 | — | 79,087 | |||||||||
Accretion of asset retirement obligations | 1,200 | — | — | 1,200 | |||||||||
Deferred and noncurrent income taxes (benefits) | 368 | (4,771 | ) | — | (4,403 | ) | |||||||
Additions to property, plant and equipment | 131,139 | 4,200 | 3,549 | 138,888 | |||||||||
Total assets at year-end | $ | 1,544,018 | 348,991 | 56,328 | $ | 1,949,337 | |||||||
Year ended December 31, 2013 | |||||||||||||
Segment income (loss) | $ | 164,013 | (9,878 | ) | 80,898 | $ | 235,033 | ||||||
Revenues from external customers | 17,814,081 | — | — | 17,814,081 | |||||||||
Interest income | — | 1,099 | — | 1,099 | |||||||||
Interest expense | — | (14,509 | ) | — | (14,509 | ) | |||||||
Income tax expense (benefit) | 106,223 | (6,164 | ) | — | 100,059 | ||||||||
Significant noncash charges (credits) | |||||||||||||
Depreciation and amortization | 71,253 | 2,800 | — | 74,053 | |||||||||
Accretion of asset retirement obligations | 1,096 | — | — | 1,096 | |||||||||
Deferred and noncurrent income taxes (benefits) | (9,796 | ) | (1,772 | ) | — | (11,568 | ) | ||||||
Additions to property, plant and equipment | 162,051 | 8,169 | 1,752 | 171,972 | |||||||||
Total assets at year-end | $ | 1,527,125 | 320,281 | 41,158 | $ | 1,888,564 | |||||||
F-31
Murphy USA Inc.
NOTES TO CONSOLIDATED AND COMBINED FINANCIAL STATEMENTS
Note 22 — Subsequent Events (unaudited)
On January 25, 2016, the Company announced that it would proceed with an independent growth plan apart from Walmart rather than continue to acquire land from Walmart. In conjunction with this announcement, the Board of Directors approved a strategic allocation of capital for the Company to pursue new additional growth opportunities and to undertake a share repurchase program of the Company's common stock. The Board authorized up to $500 million in total for the two capital programs through December 31, 2017.
On February 3, 2016, the Company announced that it had recently entered into an agreement with an undisclosed investment-grade buyer for the sale of the Company's interest in the CAM pipeline system for approximately $85 million, less customary closing costs. The CAM pipeline transports crude oil from the Louisiana Offshore Oil Port (LOOP) to 3 Gulf Coast refineries. This transaction is expected to close sometime in the first half of 2016, subject to customary closing conditions and regulatory approvals.
On February 5, 2016, the Company entered into a Term Credit Agreement to secure a term loan in the aggregate principal amount of $100 million. The term loan has 2 options to calculate interest due and the Company has elected to utilize the LIBOR option which bears interest at a rate per annum equal to LIBOR plus 3.00%. The loan will amortize in quarterly installments starting with June 30, 2016 at a rate of 5.0% per quarter. Other terms and covenants can be found in the Current Report on Form 8-K filed with the SEC on February 9, 2016.
Note 23 – Guarantor Subsidiaries
Certain of the Company’s 100% owned, domestic subsidiaries (the “Guarantor Subsidiaries”) fully and unconditionally guarantee, on a joint and several basis, certain of the outstanding indebtedness of the Company, including the 6.00% senior notes due 2023. The following consolidating and/or combining schedules present financial information on a consolidated and combined basis in conformity with the SEC’s Regulation S-X Rule 3-10(d):
F-32
Murphy USA Inc.
NOTES TO CONSOLIDATED AND COMBINED FINANCIAL STATEMENTS
CONSOLIDATING BALANCE SHEET
(Thousands of dollars) | December 31, 2015 | ||||||||||||||||||||||
Assets | Parent Company | Issuer | Guarantor Subsidiaries | Non-Guarantor Subsidiaries | Eliminations | Consolidated | |||||||||||||||||
Current assets | |||||||||||||||||||||||
Cash and cash equivalents | $ | — | $ | 102,335 | $ | — | $ | — | $ | — | $ | 102,335 | |||||||||||
Accounts receivable—trade, less allowance for doubtful accounts of $1,963 in 2015 | — | 136,253 | — | — | — | 136,253 | |||||||||||||||||
Inventories, at lower of cost or market | — | 155,906 | — | — | — | 155,906 | |||||||||||||||||
Prepaid expenses and other current assets | — | 41,173 | — | — | — | 41,173 | |||||||||||||||||
Current assets held for sale | — | — | — | — | — | — | |||||||||||||||||
Total current assets | — | 435,667 | — | — | — | 435,667 | |||||||||||||||||
Property, plant and equipment, at cost less accumulated depreciation and amortization of $724,486 in 2015 | — | 1,369,318 | — | — | — | 1,369,318 | |||||||||||||||||
Restricted cash | — | 68,571 | — | — | — | 68,571 | |||||||||||||||||
Investments in subsidiaries | 1,756,617 | 144,921 | — | — | (1,901,538 | ) | — | ||||||||||||||||
Other assets | — | 12,685 | — | — | — | 12,685 | |||||||||||||||||
Deferred tax assets | — | — | — | — | — | — | |||||||||||||||||
Noncurrent assets held for sale | — | — | — | — | — | — | |||||||||||||||||
Total assets | $ | 1,756,617 | $ | 2,031,162 | $ | — | $ | — | $ | (1,901,538 | ) | $ | 1,886,241 | ||||||||||
Liabilities and Stockholders' Equity | |||||||||||||||||||||||
Current liabilities | |||||||||||||||||||||||
Current maturities of long-term debt | $ | — | $ | 222 | $ | — | $ | — | $ | — | $ | 222 | |||||||||||
Inter-company accounts payable | 300,044 | (93,644 | ) | (52,062 | ) | (154,338 | ) | — | — | ||||||||||||||
Trade accounts payable and accrued liabilities | — | 390,341 | — | — | — | 390,341 | |||||||||||||||||
Income taxes payable | — | — | — | — | — | — | |||||||||||||||||
Deferred income taxes | — | 1,729 | — | — | — | 1,729 | |||||||||||||||||
Current liabilities held for sale | — | — | — | — | — | — | |||||||||||||||||
Total current liabilities | 300,044 | 298,648 | (52,062 | ) | (154,338 | ) | — | 392,292 | |||||||||||||||
Long-term debt, including capitalized lease obligations | — | 490,160 | — | — | — | 490,160 | |||||||||||||||||
Deferred income taxes | — | 161,236 | — | — | — | 161,236 | |||||||||||||||||
Asset retirement obligations | — | 24,345 | — | — | — | 24,345 | |||||||||||||||||
Deferred credits and other liabilities | — | 25,918 | — | — | — | 25,918 | |||||||||||||||||
Total liabilities | 300,044 | 1,000,307 | (52,062 | ) | (154,338 | ) | — | 1,093,951 | |||||||||||||||
Stockholders' Equity | |||||||||||||||||||||||
Preferred Stock, par $0.01 (authorized 20,000,000 shares, none outstanding) | — | — | — | — | — | — | |||||||||||||||||
Common Stock, par $0.01 (authorized 200,000,000 shares, 46,767,164 shares issued at December 31, 2015) | 468 | 1 | 60 | — | (61 | ) | 468 | ||||||||||||||||
Treasury stock (5,088,434 shares held at December 31, 2015) | (294,139 | ) | — | — | — | — | (294,139 | ) | |||||||||||||||
Additional paid in capital (APIC) | 1,222,465 | 564,554 | 52,004 | 87,543 | (1,368,384 | ) | 558,182 | ||||||||||||||||
Retained earnings | 527,779 | 466,300 | (2 | ) | 66,795 | (533,093 | ) | 527,779 | |||||||||||||||
Total stockholders' equity | 1,456,573 | 1,030,855 | 52,062 | 154,338 | (1,901,538 | ) | 792,290 | ||||||||||||||||
Total liabilities and stockholders' equity | $ | 1,756,617 | $ | 2,031,162 | $ | — | $ | — | $ | (1,901,538 | ) | $ | 1,886,241 | ||||||||||
F-33
Murphy USA Inc.
NOTES TO CONSOLIDATED AND COMBINED FINANCIAL STATEMENTS
CONSOLIDATING BALANCE SHEET
(Thousands of dollars) | December 31, 2014 | ||||||||||||||||||||||
Assets | Parent Company | Issuer | Guarantor Subsidiaries | Non-Guarantor Subsidiaries | Eliminations | Consolidated | |||||||||||||||||
Current assets | |||||||||||||||||||||||
Cash and cash equivalents | $ | — | $ | 327,163 | $ | — | $ | — | $ | — | $ | 327,163 | |||||||||||
Accounts receivable—trade, less allowance for doubtful accounts of $4,456 in 2013 | — | 138,466 | — | — | — | 138,466 | |||||||||||||||||
Inventories, at lower of cost or market | — | 157,046 | — | — | — | 157,046 | |||||||||||||||||
Prepaid expenses and other current assets | — | 11,710 | — | — | — | 11,710 | |||||||||||||||||
Current assets held for sale | — | — | — | 56,328 | — | 56,328 | |||||||||||||||||
Total current assets | — | 634,385 | — | 56,328 | — | 690,713 | |||||||||||||||||
Property, plant and equipment, at cost less accumulated depreciation and amortization of $663,067 in 2014 | — | 1,248,081 | — | — | — | 1,248,081 | |||||||||||||||||
Investments in subsidiaries | 1,580,277 | 177,263 | — | — | (1,757,540 | ) | — | ||||||||||||||||
Other assets | — | 10,543 | — | — | — | 10,543 | |||||||||||||||||
Deferred tax assets | — | — | — | — | — | — | |||||||||||||||||
Noncurrent assets held for sale | — | — | — | — | — | — | |||||||||||||||||
Total assets | $ | 1,580,277 | $ | 2,070,272 | $ | — | $ | 56,328 | $ | (1,757,540 | ) | $ | 1,949,337 | ||||||||||
Liabilities and Stockholders' Equity | |||||||||||||||||||||||
Current liabilities | |||||||||||||||||||||||
Current maturities of long-term debt | $ | — | $ | — | $ | — | $ | — | $ | — | $ | — | |||||||||||
Inter-company accounts payable | 51,348 | 82,528 | (52,077 | ) | (81,799 | ) | — | — | |||||||||||||||
Trade accounts payable and accrued liabilities | — | 381,271 | — | — | — | 381,271 | |||||||||||||||||
Income taxes payable | — | 18,348 | 14 | — | — | 18,362 | |||||||||||||||||
Deferred income taxes | — | 522 | — | — | — | 522 | |||||||||||||||||
Current liabilities held for sale | — | — | — | 12,925 | — | 12,925 | |||||||||||||||||
Total current liabilities | 51,348 | 482,669 | (52,063 | ) | (68,874 | ) | — | 413,080 | |||||||||||||||
Long-term debt, including capitalized lease obligations | — | 488,250 | — | — | — | 488,250 | |||||||||||||||||
Deferred income taxes | — | 137,882 | — | — | — | 137,882 | |||||||||||||||||
Asset retirement obligations | — | 22,245 | — | — | — | 22,245 | |||||||||||||||||
Deferred credits and other liabilities | — | 29,175 | — | — | — | 29,175 | |||||||||||||||||
Total liabilities | 51,348 | 1,160,221 | (52,063 | ) | (68,874 | ) | — | 1,090,632 | |||||||||||||||
Stockholders' Equity | |||||||||||||||||||||||
Preferred Stock, par $0.01 (authorized 20,000,000 shares, none outstanding) | — | — | — | — | — | — | |||||||||||||||||
Common Stock, par $0.01 (authorized 200,000,000 shares, 46,767,164 shares issued at December 31, 2014) | 468 | 1 | 60 | — | (61 | ) | 468 | ||||||||||||||||
Treasury stock (1,056,689 shares held at December 31, 2014) | (51,073 | ) | — | — | — | — | (51,073 | ) | |||||||||||||||
Additional paid in capital (APIC) | 1,228,095 | 558,611 | 52,004 | 35,677 | (1,316,516 | ) | 557,871 | ||||||||||||||||
Retained earnings | 351,439 | 351,439 | (1 | ) | 89,525 | (440,963 | ) | 351,439 | |||||||||||||||
Total stockholders' equity | 1,528,929 | 910,051 | 52,063 | 125,202 | (1,757,540 | ) | 858,705 | ||||||||||||||||
Total liabilities and stockholders' equity | $ | 1,580,277 | $ | 2,070,272 | $ | — | $ | 56,328 | $ | (1,757,540 | ) | $ | 1,949,337 | ||||||||||
F-34
Murphy USA Inc.
NOTES TO CONSOLIDATED AND COMBINED FINANCIAL STATEMENTS
CONSOLIDATING INCOME STATEMENT
(Thousands of dollars) | Year ended December 31, 2015 | ||||||||||||||||||||||
Revenues | Parent Company | Issuer | Guarantor Subsidiaries | Non-Guarantor Subsidiaries | Eliminations | Consolidated and Combined | |||||||||||||||||
Petroleum product sales | $ | — | $ | 10,424,855 | $ | — | $ | — | $ | (120,166 | ) | $ | 10,304,689 | ||||||||||
Merchandise sales | — | 2,273,888 | — | — | — | 2,273,888 | |||||||||||||||||
Other operating revenues | — | 120,834 | — | — | — | 120,834 | |||||||||||||||||
Total revenues | — | 12,819,577 | — | — | (120,166 | ) | 12,699,411 | ||||||||||||||||
Costs and operating expenses | |||||||||||||||||||||||
Petroleum product cost of goods sold | — | 9,914,641 | — | — | (120,166 | ) | 9,794,475 | ||||||||||||||||
Merchandise cost of goods sold | — | 1,946,423 | — | — | — | 1,946,423 | |||||||||||||||||
Station and other operating expenses | — | 486,383 | — | — | — | 486,383 | |||||||||||||||||
Depreciation and amortization | — | 86,568 | — | — | — | 86,568 | |||||||||||||||||
Selling, general and administrative | — | 129,276 | 1 | — | — | 129,277 | |||||||||||||||||
Accretion of asset retirement obligations | — | 1,521 | — | — | — | 1,521 | |||||||||||||||||
Total costs and operating expenses | — | 12,564,812 | 1 | — | (120,166 | ) | 12,444,647 | ||||||||||||||||
Income (loss) from operations | — | 254,765 | (1 | ) | — | — | 254,764 | ||||||||||||||||
Other income (expense) | |||||||||||||||||||||||
Interest income | — | 2,177 | — | — | — | 2,177 | |||||||||||||||||
Interest expense | — | (33,531 | ) | — | — | — | (33,531 | ) | |||||||||||||||
Loss on sale of assets | — | (4,658 | ) | — | — | — | (4,658 | ) | |||||||||||||||
Other nonoperating expense | — | (463 | ) | — | — | — | (463 | ) | |||||||||||||||
Total other income (expense) | — | (36,475 | ) | — | — | — | (36,475 | ) | |||||||||||||||
Income (loss) from continuing operations before income taxes | — | 218,290 | (1 | ) | — | — | 218,289 | ||||||||||||||||
Income tax expense | — | 80,698 | — | — | — | 80,698 | |||||||||||||||||
Income (loss) from continuing operations | — | 137,592 | (1 | ) | — | — | 137,591 | ||||||||||||||||
Income from discontinued operations, net of income taxes | — | — | — | 38,749 | — | 38,749 | |||||||||||||||||
Equity earnings in affiliates, net of tax | 176,340 | (22,731 | ) | — | (61,479 | ) | (92,130 | ) | — | ||||||||||||||
Net Income (Loss) | $ | 176,340 | $ | 114,861 | $ | (1 | ) | $ | (22,730 | ) | $ | (92,130 | ) | $ | 176,340 | ||||||||
F-35
Murphy USA Inc.
NOTES TO CONSOLIDATED AND COMBINED FINANCIAL STATEMENTS
CONSOLIDATING INCOME STATEMENT
(Thousands of dollars) | Year ended December 31, 2014 | ||||||||||||||||||||||
Revenues | Parent Company | Issuer | Guarantor Subsidiaries | Non-Guarantor Subsidiaries | Eliminations | Consolidated and Combined | |||||||||||||||||
Petroleum product sales | $ | — | $ | 14,911,658 | $ | — | $ | — | $ | (183,131 | ) | $ | 14,728,527 | ||||||||||
Merchandise sales | — | 2,161,378 | — | — | — | 2,161,378 | |||||||||||||||||
Other operating revenues | — | 96,109 | — | — | — | 96,109 | |||||||||||||||||
Total revenues | — | 17,169,145 | — | — | (183,131 | ) | 16,986,014 | ||||||||||||||||
Costs and operating expenses | |||||||||||||||||||||||
Petroleum product cost of goods sold | — | 14,257,710 | — | — | (183,131 | ) | 14,074,579 | ||||||||||||||||
Merchandise cost of goods sold | — | 1,859,732 | — | — | — | 1,859,732 | |||||||||||||||||
Station and other operating expenses | — | 486,762 | — | — | — | 486,762 | |||||||||||||||||
Depreciation and amortization | — | 79,087 | — | — | — | 79,087 | |||||||||||||||||
Selling, general and administrative | — | 119,265 | 1 | — | — | 119,266 | |||||||||||||||||
Accretion of asset retirement obligations | — | 1,200 | — | — | — | 1,200 | |||||||||||||||||
Total costs and operating expenses | — | 16,803,756 | 1 | — | (183,131 | ) | 16,620,626 | ||||||||||||||||
Income (loss) from operations | — | 365,389 | (1 | ) | — | — | 365,388 | ||||||||||||||||
Other income (expense) | |||||||||||||||||||||||
Interest income | — | 244 | — | — | — | 244 | |||||||||||||||||
Interest expense | — | (36,646 | ) | — | — | — | (36,646 | ) | |||||||||||||||
Gain on sale of assets | — | 194 | — | — | — | 194 | |||||||||||||||||
Other nonoperating income | — | 10,166 | — | — | — | 10,166 | |||||||||||||||||
Total other income (expense) | — | (26,042 | ) | — | — | — | (26,042 | ) | |||||||||||||||
Income (loss) from continuing operations before income taxes | — | 339,347 | (1 | ) | — | — | 339,346 | ||||||||||||||||
Income tax expense | — | 116,386 | — | — | — | 116,386 | |||||||||||||||||
Income (loss) from continuing operations | — | 222,961 | (1 | ) | — | — | 222,960 | ||||||||||||||||
Income from discontinued operations, net of income taxes | — | — | — | 20,903 | — | 20,903 | |||||||||||||||||
Equity earnings in affiliates, net of tax | 351,439 | 89,524 | — | — | (440,963 | ) | — | ||||||||||||||||
Net Income (Loss) | $ | 351,439 | $ | 312,485 | $ | (1 | ) | $ | 20,903 | $ | (440,963 | ) | $ | 243,863 | |||||||||
F-36
Murphy USA Inc.
NOTES TO CONSOLIDATED AND COMBINED FINANCIAL STATEMENTS
CONSOLIDATED AND COMBINING INCOME STATEMENT
(Thousands of dollars) | Year ended December 31, 2013 | ||||||||||||||||||
Revenues | Issuer | Guarantor Subsidiaries | Non-Guarantor Subsidiaries | Eliminations | Combined | ||||||||||||||
Petroleum product sales | $ | 15,766,752 | $ | — | $ | — | $ | (206,435 | ) | $ | 15,560,317 | ||||||||
Merchandise sales | 2,159,466 | — | — | — | 2,159,466 | ||||||||||||||
Other operating revenues | 94,298 | — | — | — | 94,298 | ||||||||||||||
Total revenues | 18,020,516 | — | — | (206,435 | ) | 17,814,081 | |||||||||||||
Costs and operating expenses | |||||||||||||||||||
Petroleum product cost of goods sold | 15,216,390 | — | — | (206,435 | ) | 15,009,955 | |||||||||||||
Merchandise cost of goods sold | 1,877,630 | — | — | — | 1,877,630 | ||||||||||||||
Station and other operating expenses | 460,476 | — | — | — | 460,476 | ||||||||||||||
Depreciation and amortization | 74,053 | — | — | — | 74,053 | ||||||||||||||
Selling, general and administrative | 129,430 | 1 | — | — | 129,431 | ||||||||||||||
Accretion of asset retirement obligations | 1,096 | — | — | — | 1,096 | ||||||||||||||
Total costs and operating expenses | 17,759,075 | 1 | — | (206,435 | ) | 17,552,641 | |||||||||||||
Income (loss) from operations | 261,441 | (1 | ) | — | — | 261,440 | |||||||||||||
Other income (expense) | |||||||||||||||||||
Interest income | 1,099 | — | — | — | 1,099 | ||||||||||||||
Interest expense | (14,509 | ) | — | — | — | (14,509 | ) | ||||||||||||
Gain on sale of assets | 5,995 | — | — | — | 5,995 | ||||||||||||||
Other nonoperating income | 169 | — | — | — | 169 | ||||||||||||||
Total other income (expense) | (7,246 | ) | — | — | — | (7,246 | ) | ||||||||||||
Income (loss) from continuing operations before income taxes | 254,195 | (1 | ) | — | — | 254,194 | |||||||||||||
Income tax expense | 100,059 | — | — | — | 100,059 | ||||||||||||||
Income (loss) from continuing operations | 154,136 | (1 | ) | — | — | 154,135 | |||||||||||||
Income from discontinued operations, net of income taxes | — | — | 80,898 | — | 80,898 | ||||||||||||||
Equity earnings in affiliates, net of tax | — | — | — | — | — | ||||||||||||||
Net Income (Loss) | $ | 154,136 | $ | (1 | ) | $ | 80,898 | $ | — | $ | 235,033 | ||||||||
F-37
Murphy USA Inc.
NOTES TO CONSOLIDATED AND COMBINED FINANCIAL STATEMENTS
CONSOLIDATING STATEMENT OF CASH FLOW
(Thousands of dollars) | Year ended December 31, 2015 | ||||||||||||||||||||||
Operating Activities | Parent Company | Issuer | Guarantor Subsidiaries | Non-Guarantor Subsidiaries | Eliminations | Consolidated and Combined | |||||||||||||||||
Net income (loss) | $ | 176,340 | $ | 114,861 | $ | (1 | ) | $ | (22,730 | ) | $ | (92,130 | ) | $ | 176,340 | ||||||||
Adjustments to reconcile net income (loss) to net cash provided by operating activities | |||||||||||||||||||||||
Income from discontinued operations, net of tax | — | — | — | (38,749 | ) | — | (38,749 | ) | |||||||||||||||
Depreciation and amortization | — | 86,568 | — | — | — | 86,568 | |||||||||||||||||
Deferred and noncurrent income tax charges (credits) | — | 40,556 | — | — | — | 40,556 | |||||||||||||||||
Accretion on discounted liabilities | — | 1,521 | — | — | — | 1,521 | |||||||||||||||||
Pretax losses from sale of assets | — | 4,658 | — | — | — | 4,658 | |||||||||||||||||
Net decrease (increase) in noncash operating working capital | — | (46,586 | ) | — | — | — | (46,586 | ) | |||||||||||||||
Equity in earnings | (176,340 | ) | 22,731 | — | 61,479 | 92,130 | — | ||||||||||||||||
Other operating activities - net | — | 9,417 | — | — | — | 9,417 | |||||||||||||||||
Net cash provided by (used in) continuing operations | — | 233,726 | (1 | ) | — | — | 233,725 | ||||||||||||||||
Net cash used in discontinued operations | — | — | — | (17,887 | ) | — | (17,887 | ) | |||||||||||||||
Net cash provided by (used in) operating activities | — | 233,726 | (1 | ) | (17,887 | ) | — | 215,838 | |||||||||||||||
Investing Activities | |||||||||||||||||||||||
Property additions | — | (205,225 | ) | — | — | — | (205,225 | ) | |||||||||||||||
Proceeds from sale of assets | — | 729 | — | — | — | 729 | |||||||||||||||||
Changes in restricted cash | — | (68,571 | ) | — | — | — | (68,571 | ) | |||||||||||||||
Other investing activities - net | — | (2,889 | ) | — | — | — | (2,889 | ) | |||||||||||||||
Sales proceeds | — | — | — | 93,765 | — | 93,765 | |||||||||||||||||
Other | — | — | — | (7,443 | ) | — | (7,443 | ) | |||||||||||||||
Net cash provided by (required by) investing activities | — | (275,956 | ) | — | 86,322 | — | (189,634 | ) | |||||||||||||||
Financing Activities | |||||||||||||||||||||||
Purchase of treasury stock | (248,695 | ) | — | — | — | — | (248,695 | ) | |||||||||||||||
Repayments of long-term debt | — | (146 | ) | — | — | — | (146 | ) | |||||||||||||||
Additions to long-term debt | — | — | — | — | — | — | |||||||||||||||||
Debt issuance costs | — | (58 | ) | — | — | — | (58 | ) | |||||||||||||||
Amounts related to share-based compensation | — | (3,075 | ) | — | — | — | (3,075 | ) | |||||||||||||||
Net distributions to parent | 248,695 | (179,319 | ) | 1 | (69,377 | ) | — | — | |||||||||||||||
Net cash provided by (required by) financing activities | — | (182,598 | ) | 1 | (69,377 | ) | — | (251,974 | ) | ||||||||||||||
Net increase (decrease) in cash and cash equivalents | — | (224,828 | ) | — | (942 | ) | — | (225,770 | ) | ||||||||||||||
Cash and cash equivalents at January 1 | — | 327,163 | — | 942 | — | 328,105 | |||||||||||||||||
Cash and cash equivalents at December 31 | $ | — | $ | 102,335 | $ | — | $ | — | $ | — | $ | 102,335 | |||||||||||
Less: Cash and cash equivalents held for sale | — | — | — | — | — | — | |||||||||||||||||
Cash and cash equivalents of continuing operations at December 31 | $ | — | $ | 102,335 | $ | — | $ | — | $ | — | $ | 102,335 | |||||||||||
F-38
Murphy USA Inc.
NOTES TO CONSOLIDATED AND COMBINED FINANCIAL STATEMENTS
CONSOLIDATING STATEMENT OF CASH FLOWS
(Thousands of dollars) | Year ended December 31, 2014 | ||||||||||||||||||||||
Operating Activities | Parent Company | Issuer | Guarantor Subsidiaries | Non-Guarantor Subsidiaries | Eliminations | Consolidated and Combined | |||||||||||||||||
Net income (loss) | $ | 351,439 | $ | 312,485 | $ | (1 | ) | $ | 20,903 | $ | (440,963 | ) | $ | 243,863 | |||||||||
Adjustments to reconcile net income (loss) to net cash provided by operating activities | |||||||||||||||||||||||
Income from discontinued operations, net of tax | — | — | — | (20,903 | ) | — | (20,903 | ) | |||||||||||||||
Depreciation and amortization | — | 79,087 | — | — | — | 79,087 | |||||||||||||||||
Deferred and noncurrent income tax charges (credits) | — | (4,403 | ) | — | — | — | (4,403 | ) | |||||||||||||||
Accretion on discounted liabilities | — | 1,200 | — | — | — | 1,200 | |||||||||||||||||
Pretax gains from sale of assets | — | (194 | ) | — | — | — | (194 | ) | |||||||||||||||
Net decrease (increase) in noncash operating working capital | — | (36,475 | ) | — | — | — | (36,475 | ) | |||||||||||||||
Equity in earnings | (351,439 | ) | (89,524 | ) | — | — | 440,963 | — | |||||||||||||||
Other operating activities - net | — | 14,531 | — | — | — | 14,531 | |||||||||||||||||
Net cash provided by (used in) continuing operations | — | 276,707 | (1 | ) | — | — | 276,706 | ||||||||||||||||
Net cash provided by discontinued operations | — | — | — | 28,876 | — | 28,876 | |||||||||||||||||
Net cash provided by (used in) operating activities | — | 276,707 | (1 | ) | 28,876 | — | 305,582 | ||||||||||||||||
Investing Activities | |||||||||||||||||||||||
Property additions | — | (135,339 | ) | — | — | — | (135,339 | ) | |||||||||||||||
Proceeds from sale of assets | — | 376 | — | — | — | 376 | |||||||||||||||||
Other investing activities - net | — | (10,631 | ) | — | — | — | (10,631 | ) | |||||||||||||||
Sales proceeds | — | — | — | 1,097 | — | 1,097 | |||||||||||||||||
Other | — | — | — | (4,918 | ) | — | (4,918 | ) | |||||||||||||||
Net cash required by investing activities | — | (145,594 | ) | — | (3,821 | ) | — | (149,415 | ) | ||||||||||||||
Financing Activities | |||||||||||||||||||||||
Purchase of treasury stock | (51,348 | ) | — | — | — | — | (51,348 | ) | |||||||||||||||
Repayments of long-term debt | — | (70,000 | ) | — | — | — | (70,000 | ) | |||||||||||||||
Additions to long-term debt | — | — | — | — | — | — | |||||||||||||||||
Debt issuance costs | — | (875 | ) | — | — | — | (875 | ) | |||||||||||||||
Amounts related to share-based compensation | — | (580 | ) | — | — | — | (580 | ) | |||||||||||||||
Net distributions to parent | 51,348 | (27,236 | ) | 1 | (24,113 | ) | — | — | |||||||||||||||
Net cash provided by (required by) financing activities | — | (98,691 | ) | 1 | (24,113 | ) | — | (122,803 | ) | ||||||||||||||
Net increase in cash and cash equivalents | — | 32,422 | — | 942 | — | 33,364 | |||||||||||||||||
Cash and cash equivalents at January 1 | — | 294,741 | — | — | — | 294,741 | |||||||||||||||||
Cash and cash equivalents at December 31 | $ | — | $ | 327,163 | $ | — | $ | 942 | $ | — | $ | 328,105 | |||||||||||
Less: Cash and cash equivalents held for sale | — | — | — | 942 | — | 942 | |||||||||||||||||
Cash and cash equivalents of continuing operations at December 31 | $ | — | $ | 327,163 | $ | — | $ | — | $ | — | $ | 327,163 | |||||||||||
F-39
Murphy USA Inc.
NOTES TO CONSOLIDATED AND COMBINED FINANCIAL STATEMENTS
CONSOLIDATED AND COMBINING STATEMENT OF CASH FLOW
(Thousands of dollars) | Year ended December 31, 2013 | ||||||||||||||||||||||
Operating Activities | Parent Company | Issuer | Guarantor Subsidiaries | Non-Guarantor Subsidiaries | Eliminations | Combined | |||||||||||||||||
Net income (loss) | $ | — | $ | 154,136 | $ | (1 | ) | $ | 80,898 | $ | — | $ | 235,033 | ||||||||||
Adjustments to reconcile net income to net cash provided by operating activities | |||||||||||||||||||||||
Income from discontinued operations, net of tax | — | — | — | (80,898 | ) | — | (80,898 | ) | |||||||||||||||
Depreciation and amortization | — | 74,053 | — | — | — | 74,053 | |||||||||||||||||
Deferred and noncurrent income tax charges (credits) | — | (11,568 | ) | — | — | — | (11,568 | ) | |||||||||||||||
Accretion on discounted liabilities | — | 1,096 | — | — | — | 1,096 | |||||||||||||||||
Pretax gains from sale of assets | — | (5,995 | ) | — | — | — | (5,995 | ) | |||||||||||||||
Net decrease (increase) in noncash operating working capital | — | 51,204 | — | — | — | 51,204 | |||||||||||||||||
Equity in earnings | — | — | — | — | — | — | |||||||||||||||||
Other operating activities - net | — | 13,215 | — | — | — | 13,215 | |||||||||||||||||
Net cash provided by (used in) continuing operations | — | 276,141 | (1 | ) | — | — | 276,140 | ||||||||||||||||
Net cash provided by discontinued operations | — | — | — | 80,558 | — | 80,558 | |||||||||||||||||
Net cash provided by (used in) operating activities | — | 276,141 | (1 | ) | 80,558 | — | 356,698 | ||||||||||||||||
Investing Activities | |||||||||||||||||||||||
Property additions | — | (163,303 | ) | — | — | — | (163,303 | ) | |||||||||||||||
Proceeds from sale of assets | — | 6,113 | — | — | — | 6,113 | |||||||||||||||||
Other investing activities - net | — | 52 | — | — | — | 52 | |||||||||||||||||
Sales proceeds | — | — | — | 173,118 | — | 173,118 | |||||||||||||||||
Other | — | — | — | (3,088 | ) | — | (3,088 | ) | |||||||||||||||
Net cash provided by (required by) investing activities | — | (157,138 | ) | — | 170,030 | — | 12,892 | ||||||||||||||||
Financing Activities | |||||||||||||||||||||||
Purchase of treasury stock | — | — | — | — | — | — | |||||||||||||||||
Repayments of long-term debt | — | (80,000 | ) | — | (1,170 | ) | — | (81,170 | ) | ||||||||||||||
Additions to long-term debt | — | 641,250 | — | — | — | 641,250 | |||||||||||||||||
Cash dividend to former parent | — | (650,000 | ) | — | — | — | (650,000 | ) | |||||||||||||||
Debt issuance costs | — | (6,693 | ) | — | — | — | (6,693 | ) | |||||||||||||||
Amounts related to share-based compensation | — | — | — | — | — | — | |||||||||||||||||
Net distributions to former parent | — | 213,808 | 1 | (249,418 | ) | — | (35,609 | ) | |||||||||||||||
Net cash provided by (required by) financing activities | — | 118,365 | 1 | (250,588 | ) | — | (132,222 | ) | |||||||||||||||
Net increase in cash and cash equivalents | — | 237,368 | — | — | — | 237,368 | |||||||||||||||||
Cash and cash equivalents at January 1 | — | 57,373 | — | — | — | 57,373 | |||||||||||||||||
Cash and cash equivalents at December 31 | $ | — | $ | 294,741 | $ | — | $ | — | $ | — | $ | 294,741 | |||||||||||
Less: Cash and cash equivalents held for sale | — | — | — | — | — | — | |||||||||||||||||
Cash and cash equivalents of continuing operations at December 31 | $ | — | $ | 294,741 | $ | — | $ | — | $ | — | $ | 294,741 | |||||||||||
F-40
Murphy USA Inc.
NOTES TO CONSOLIDATED AND COMBINED FINANCIAL STATEMENTS
CONSOLIDATING STATEMENT OF CHANGES IN EQUITY
(Thousands of dollars) | Year ended December 31, 2015 | ||||||||||||||||||||||
Statement of Stockholders' Equity | Parent Company | Issuer | Guarantor Subsidiaries | Non-Guarantor Subsidiaries | Eliminations | Combined | |||||||||||||||||
Common Stock | |||||||||||||||||||||||
Balance as of December 31, 2014 | $ | 468 | $ | 1 | $ | 60 | $ | — | $ | (61 | ) | $ | 468 | ||||||||||
Issuance of common stock | — | — | — | — | — | — | |||||||||||||||||
Balance as of December 31, 2015 | $ | 468 | $ | 1 | $ | 60 | $ | — | $ | (61 | ) | $ | 468 | ||||||||||
Treasury Stock | |||||||||||||||||||||||
Balance as of December 31, 2014 | $ | (51,073 | ) | $ | — | $ | — | $ | — | $ | — | $ | (51,073 | ) | |||||||||
Issuance of common stock | 5,629 | — | — | — | — | 5,629 | |||||||||||||||||
Repurchase of common stock | (248,695 | ) | — | — | — | — | (248,695 | ) | |||||||||||||||
Balance as of December 31, 2015 | $ | (294,139 | ) | $ | — | $ | — | $ | — | $ | — | $ | (294,139 | ) | |||||||||
APIC | |||||||||||||||||||||||
Balance as of December 31, 2014 | $ | 1,228,095 | $ | 558,611 | $ | 52,004 | $ | 35,677 | $ | (1,316,516 | ) | $ | 557,871 | ||||||||||
Issuance of common stock | (5,629 | ) | — | — | — | — | (5,629 | ) | |||||||||||||||
Amounts related to share-based compensation | — | (3,075 | ) | — | — | — | (3,075 | ) | |||||||||||||||
Reclassification of equity | — | — | — | 51,866 | (51,866 | ) | — | ||||||||||||||||
Share-based compensation expense | — | 9,015 | — | — | — | 9,015 | |||||||||||||||||
Balance as of December 31, 2015 | $ | 1,222,466 | $ | 564,551 | $ | 52,004 | $ | 87,543 | $ | (1,368,382 | ) | $ | 558,182 | ||||||||||
Retained Earnings | |||||||||||||||||||||||
Balance as of December 31, 2014 | $ | 351,439 | $ | 351,439 | $ | (1 | ) | $ | 89,525 | $ | (440,963 | ) | $ | 351,439 | |||||||||
Net income | 176,340 | 114,861 | (1 | ) | (22,730 | ) | (92,130 | ) | 176,340 | ||||||||||||||
Balance as of December 31, 2015 | $ | 527,779 | $ | 466,300 | $ | (2 | ) | $ | 66,795 | $ | (533,093 | ) | $ | 527,779 | |||||||||
CONSOLIDATING STATEMENTS OF CHANGES IN EQUITY
(Thousands of dollars) | Year ended December 31, 2014 | ||||||||||||||||||||||
Statement of Stockholders' Equity | Parent Company | Issuer | Guarantor Subsidiaries | Non-Guarantor Subsidiaries | Eliminations | Combined | |||||||||||||||||
Common Stock | |||||||||||||||||||||||
Balance as of December 31, 2013 | $ | 467 | $ | 1 | $ | 60 | $ | — | $ | (61 | ) | $ | 467 | ||||||||||
Issuance of common stock | 1 | — | — | — | — | 1 | |||||||||||||||||
Balance as of December 31, 2014 | $ | 468 | $ | 1 | $ | 60 | $ | — | $ | (61 | ) | $ | 468 | ||||||||||
Treasury Stock | |||||||||||||||||||||||
Balance as of December 31, 2013 | $ | — | $ | — | $ | — | $ | — | $ | — | $ | — | |||||||||||
Issuance of common stock | 275 | — | — | — | — | 275 | |||||||||||||||||
Repurchase of common stock | (51,348 | ) | — | — | — | — | (51,348 | ) | |||||||||||||||
Balance as of December 31, 2014 | $ | (51,073 | ) | $ | — | $ | — | $ | — | $ | — | $ | (51,073 | ) | |||||||||
APIC | |||||||||||||||||||||||
Balance as of December 31, 2013 | $ | 1,228,370 | $ | 548,758 | $ | 52,004 | $ | 35,677 | $ | (1,316,516 | ) | $ | 548,293 | ||||||||||
Issuance of common stock | (275 | ) | — | — | — | — | (275 | ) | |||||||||||||||
Amounts related to share-based compensation | — | (582 | ) | — | — | — | (582 | ) | |||||||||||||||
Share-based compensation expense | — | 10,435 | — | — | — | 10,435 | |||||||||||||||||
Balance as of December 31, 2014 | $ | 1,228,095 | $ | 558,611 | $ | 52,004 | $ | 35,677 | $ | (1,316,516 | ) | $ | 557,871 | ||||||||||
Retained Earnings | |||||||||||||||||||||||
Balance as of December 31, 2013 | $ | — | $ | 38,954 | $ | — | $ | 68,622 | $ | — | $ | 107,576 | |||||||||||
Net income | 351,439 | 312,485 | (1 | ) | 20,903 | (440,963 | ) | 243,863 | |||||||||||||||
Balance as of December 31, 2014 | $ | 351,439 | $ | 351,439 | $ | (1 | ) | $ | 89,525 | $ | (440,963 | ) | $ | 351,439 | |||||||||
F-41
Murphy USA Inc.
NOTES TO CONSOLIDATED AND COMBINED FINANCIAL STATEMENTS
CONSOLIDATED AND COMBINING STATEMENTS OF CHANGES IN EQUITY
(Thousands of dollars) | Year ended December 31, 2013 | ||||||||||||||||||||||
Statement of Stockholders' Equity/Net Parent Investment | Parent Company | Issuer | Guarantor Subsidiaries | Non-Guarantor Subsidiaries | Eliminations | Combined | |||||||||||||||||
Common Stock | |||||||||||||||||||||||
Balance as of December 31, 2012 | $ | — | $ | — | $ | — | $ | — | $ | — | $ | — | |||||||||||
Issuance of stock at the separation and distribution | 467 | 1 | 60 | — | (61 | ) | 467 | ||||||||||||||||
Balance as of December 31, 2013 | $ | 467 | $ | 1 | $ | 60 | $ | — | $ | (61 | ) | $ | 467 | ||||||||||
Treasury Stock | |||||||||||||||||||||||
Balance as of December 31, 2012 | $ | — | $ | — | $ | — | $ | — | $ | — | $ | — | |||||||||||
Issuance of common stock | — | — | — | — | — | — | |||||||||||||||||
Repurchase of common stock | — | — | — | — | — | — | |||||||||||||||||
Balance as of December 31, 2013 | $ | — | $ | — | $ | — | $ | — | $ | — | $ | — | |||||||||||
APIC | |||||||||||||||||||||||
Balance as of December 31, 2012 | $ | — | $ | — | $ | — | $ | — | $ | — | $ | — | |||||||||||
Issuance of stock at the separation and distribution | — | (467 | ) | — | — | — | (467 | ) | |||||||||||||||
Amounts related to share-based compensation | — | — | — | — | — | — | |||||||||||||||||
Reclassification of net parent investment to APIC | 1,228,370 | 546,311 | 52,004 | 35,677 | (1,316,516 | ) | 545,846 | ||||||||||||||||
Share-based compensation expense | — | 2,914 | — | — | — | 2,914 | |||||||||||||||||
Balance as of December 31, 2013 | $ | 1,228,370 | $ | 548,758 | $ | 52,004 | $ | 35,677 | $ | (1,316,516 | ) | $ | 548,293 | ||||||||||
Net Parent Investment | |||||||||||||||||||||||
Balance as of December 31, 2012 | $ | — | $ | 1,123,467 | $ | 53,895 | $ | 117,550 | $ | (190,461 | ) | $ | 1,104,451 | ||||||||||
Net income | — | 114,668 | — | 12,789 | — | 127,457 | |||||||||||||||||
Dividend paid to former parent | — | (650,000 | ) | — | — | — | (650,000 | ) | |||||||||||||||
Net transfers to/between former parent | — | (36,062 | ) | — | — | — | (36,062 | ) | |||||||||||||||
Reclassification of net parent investment to APIC | — | (552,073 | ) | (53,895 | ) | (130,339 | ) | 190,461 | (545,846 | ) | |||||||||||||
Balance as of December 31, 2013 | $ | — | $ | — | $ | — | $ | — | $ | — | $ | — | |||||||||||
Retained Earnings | |||||||||||||||||||||||
Balance as of December 31, 2012 | $ | — | $ | — | $ | — | $ | — | $ | — | $ | — | |||||||||||
Net income | — | 38,954 | — | 68,622 | — | 107,576 | |||||||||||||||||
Balance as of December 31, 2013 | $ | — | $ | 38,954 | $ | — | $ | 68,622 | $ | — | $ | 107,576 | |||||||||||
F-42
Murphy USA Inc.
Supplemental Quarterly Information (Unaudited)
First | Second | Third | Fourth | |||||||||||||||||
(Millions of dollars except per share amounts) | Quarter | Quarter | Quarter | Quarter | Year | |||||||||||||||
Year Ended December 31, 2015 | ||||||||||||||||||||
Sales and other operating revenues | $ | 2,920.7 | $ | 3,468.0 | $ | 3,382.5 | $ | 2,928.2 | $ | 12,699.4 | ||||||||||
Income from continuing operations before income taxes | $ | 40.9 | $ | 38.8 | $ | 94.1 | $ | 44.5 | $ | 218.3 | ||||||||||
Income from continuing operations | $ | 23.6 | $ | 24.8 | $ | 60.0 | $ | 29.2 | $ | 137.6 | ||||||||||
Net income | $ | 22.9 | $ | 26.2 | $ | 60.5 | $ | 66.7 | $ | 176.3 | ||||||||||
Income from continuing operations (per Common share) | ||||||||||||||||||||
Basic | $ | 0.52 | $ | 0.56 | $ | 1.41 | $ | 0.70 | $ | 3.17 | ||||||||||
Diluted | $ | 0.51 | $ | 0.56 | $ | 1.40 | $ | 0.69 | $ | 3.14 | ||||||||||
Net income (per Common share) | ||||||||||||||||||||
Basic | $ | 0.50 | $ | 0.59 | $ | 1.42 | $ | 1.60 | $ | 4.06 | ||||||||||
Diluted | $ | 0.50 | $ | 0.59 | $ | 1.41 | $ | 1.58 | $ | 4.02 | ||||||||||
Market price of Common stock 1 | ||||||||||||||||||||
High | $ | 73.48 | $ | 73.47 | $ | 57.40 | $ | 65.09 | $ | 73.48 | ||||||||||
Low | $ | 66.82 | $ | 55.82 | $ | 48.70 | $ | 54.17 | $ | 48.70 | ||||||||||
Year Ended December 31, 2014 | ||||||||||||||||||||
Sales and other operating revenues | $ | 4,115.5 | $ | 4,693.9 | $ | 4,622.6 | $ | 3,554.0 | $ | 16,986.0 | ||||||||||
Income from continuing operations before income taxes | $ | 12.6 | $ | 93.9 | $ | 91.0 | $ | 141.8 | $ | 339.3 | ||||||||||
Income from continuing operations | $ | 7.6 | $ | 64.4 | $ | 56.6 | $ | 94.4 | $ | 223.0 | ||||||||||
Net income | $ | 9.6 | $ | 73.2 | $ | 62.7 | $ | 98.4 | $ | 243.9 | ||||||||||
Income from continuing operations (per Common share) | ||||||||||||||||||||
Basic | $ | 0.16 | $ | 1.39 | $ | 1.24 | $ | 2.06 | $ | 4.84 | ||||||||||
Diluted | $ | 0.16 | $ | 1.38 | $ | 1.23 | $ | 2.04 | $ | 4.81 | ||||||||||
Net income (per Common share) | ||||||||||||||||||||
Basic | $ | 0.21 | $ | 1.58 | $ | 1.35 | $ | 2.15 | $ | 5.29 | ||||||||||
Diluted | $ | 0.21 | $ | 1.57 | $ | 1.35 | $ | 2.13 | $ | 5.26 | ||||||||||
Market price of Common stock 1 | ||||||||||||||||||||
High | $ | 43.25 | $ | 52.34 | $ | 55.64 | $ | 69.37 | $ | 69.37 | ||||||||||
Low | $ | 37.55 | $ | 39.96 | $ | 47.26 | $ | 49.63 | $ | 37.55 | ||||||||||
1 Prices as quoted on the New York Stock Exchange. Stock first traded September 3, 2013. | ||||||||||||||||||||
F-43
SCHEDULE II – VALUATION AND QUALIFYING ACCOUNTS (CONSOLIDATED AND COMBINED)
Murphy USA Inc.
Valuation Accounts and Reserves
(Thousands of dollars) | Balance at January 1, | Charged (Credited) to Expense | Deductions | Balance at December 31, | |||||
2015 | |||||||||
Deducted from assets accounts | |||||||||
Allowance for doubtful accounts | $ | 4,456 | — | (2,493 | ) | 1,963 | |||
2014 | |||||||||
Deducted from assets accounts | |||||||||
Allowance for doubtful accounts | $ | 4,576 | — | (120 | ) | 4,456 | |||
2013 | |||||||||
Deducted from assets accounts | |||||||||
Allowance for doubtful accounts | $ | 5,835 | — | (1,259 | ) | 4,576 | |||
F-44