Exhibit 99.1
![]()
Investor Contact:
William Stengel
HD Supply Investor Relations
770-852-9100
InvestorRelations@hdsupply.com
Media Contact:
Quiana Pinckney
HD Supply Public Relations
770-852-9057
Quiana.Pinckney@hdsupply.com
HD Supply Holdings, Inc. Announces Fiscal 2013 Third-Quarter Results and
the Promotion of Evan Levitt to Chief Financial Officer
· Net Sales increased 7 percent to $2.3 billion; 14th consecutive quarter of year-over-year growth
· Operating Income improved 40 percent to $160 million
· Adjusted EBITDA increased 11 percent to $226 million
· Adjusted Net Income per diluted share of $0.38 (Net Income per diluted share of $0.26)
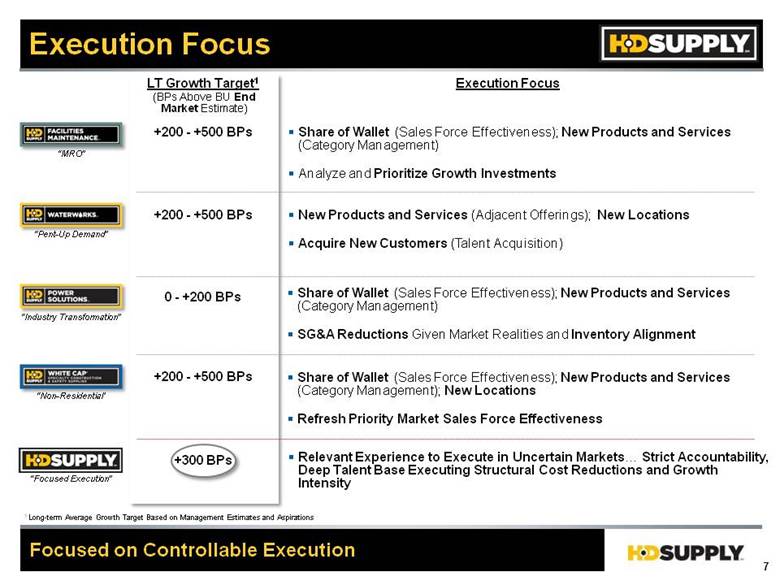
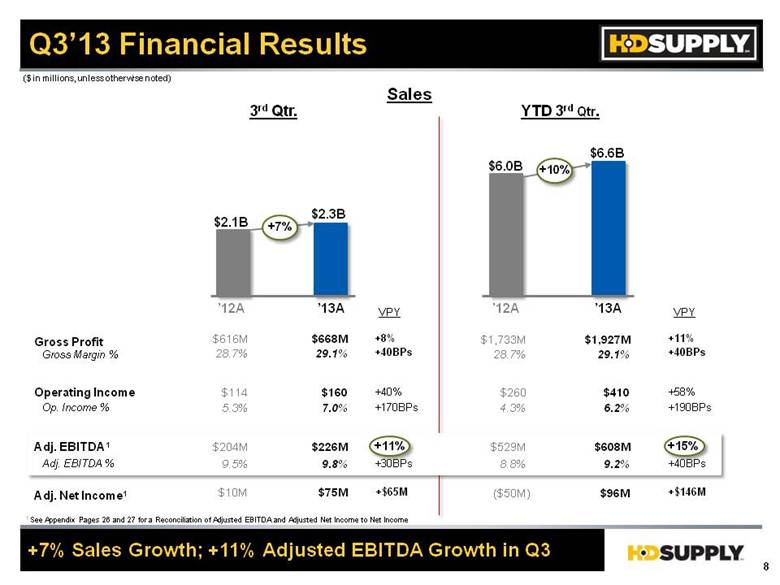
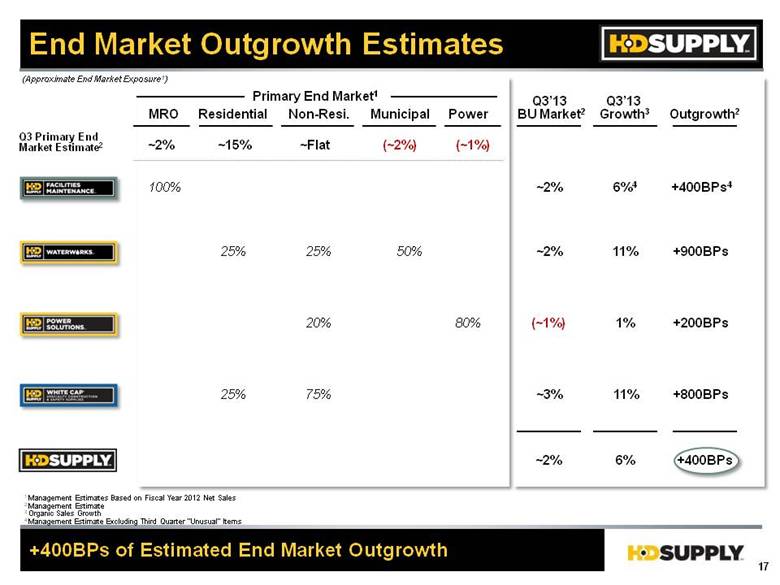
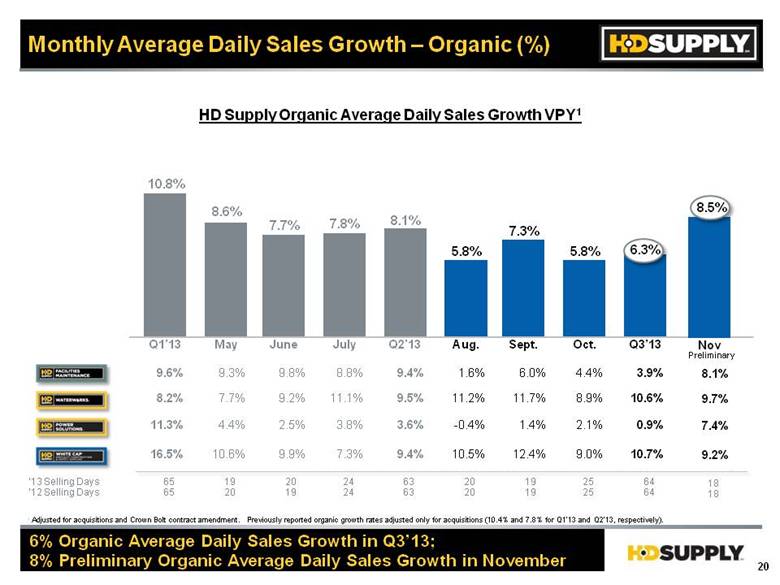
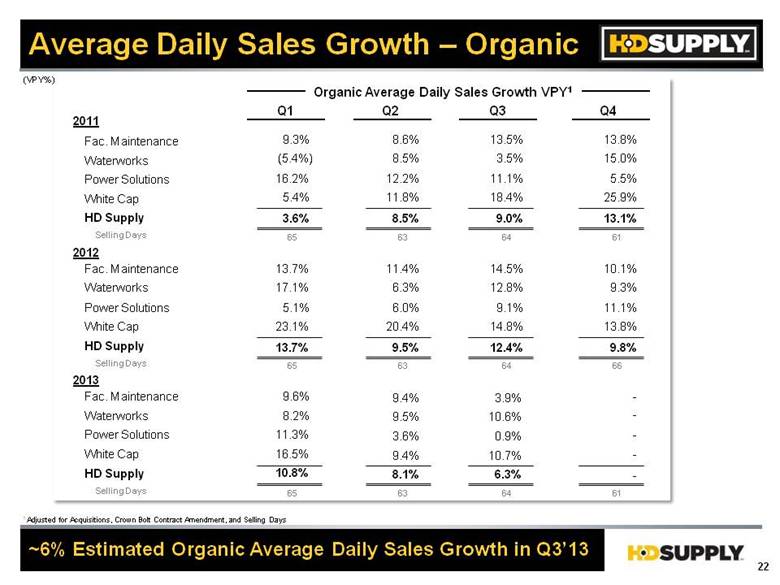
ATLANTA, GA — December 10, 2013 — HD Supply Holdings, Inc. (NASDAQ: HDS), one of the largest industrial distributors in North America, today reported net sales for the third quarter of fiscal 2013 ended November 3, 2013 of $2.3 billion, an increase of $151 million, or 7 percent, as compared to the third quarter of fiscal 2012. Organic sales growth was 6 percent versus prior year. The third quarter performance represents the fourteenth consecutive quarter of year-over-year sales growth with continued growth in Facilities Maintenance, Waterworks, Power Solutions and White Cap. The company believes its sales performance represents growth of approximately 400 basis points in excess of its estimate of market growth.
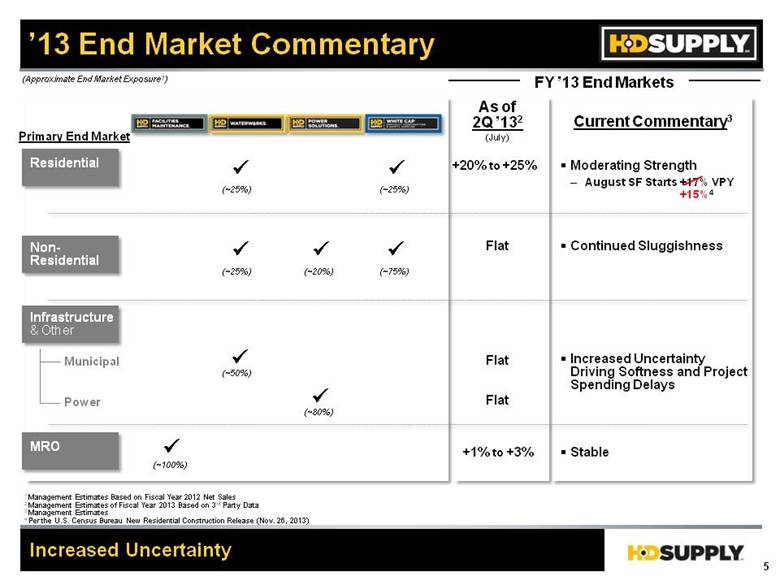
“I was very pleased with our solid performance this quarter driven by the execution of our growth initiatives,” stated Joe DeAngelo, CEO of HD Supply. “We delivered this performance despite continued sluggishness in non-residential, moderated growth in residential and increased uncertainty in our infrastructure markets. We continue our strategy of investing for growth while, at the same time, ensuring that our cost structure is appropriately aligned for uncertain markets.”
Gross profit for the third quarter of fiscal 2013 increased by $52 million, or 8 percent, to $668 million compared to $616 million for the third quarter of fiscal 2012. Gross profit for the third quarter of fiscal 2013 was 29.1 percent of net sales, up 40 basis points, from 28.7 percent of net sales for the third quarter of fiscal 2012. Gross profit improvement was driven by execution of our category management initiatives offset by the mix impact of lower gross margin businesses growing faster as well as the Crown Bolt year-over-year headwind which is estimated at approximately 20 basis points.
Operating income for the third quarter of fiscal 2013 increased by $46 million, or 40 percent, to $160 million compared to $114 million for the third quarter of fiscal 2012. The improvement was due to higher net sales and gross profit and a reduction in depreciation and amortization expense. Operating income as a percentage of net sales increased approximately 170 basis points during the third quarter of fiscal 2013 as compared to the third quarter of fiscal 2012. The improvement was driven by the reduction in depreciation and amortization expense and improvements in gross margins.
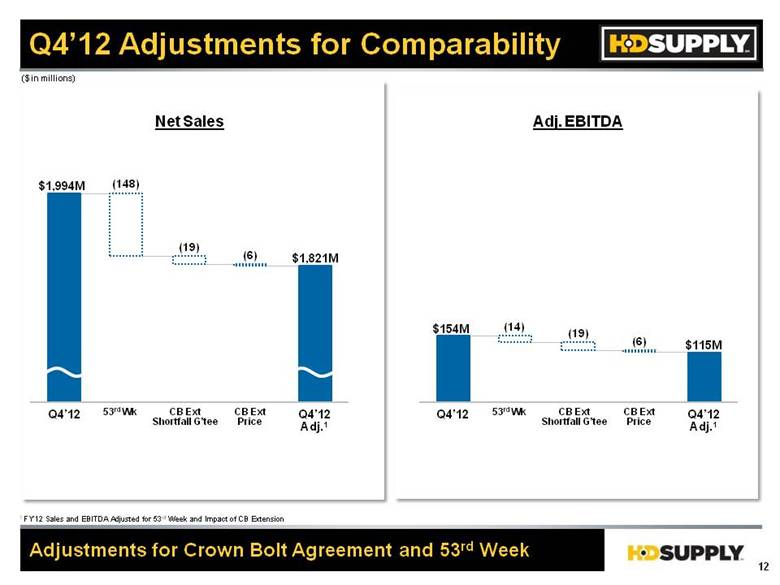
Adjusted EBITDA increased $22 million, or 11 percent, during the third quarter of fiscal 2013 as compared to the third quarter of fiscal 2012. The increase in Adjusted EBITDA was driven by Facilities Maintenance, Waterworks, and White Cap, and reflects our continued focus to deliver on our execution and growth initiatives to drive growth in excess of the market. This increase was partially offset by a $6 million reduction in Adjusted EBITDA as a result of the 2012 amendment and extension of the strategic purchase agreement between our Crown Bolt business and The Home Depot. Adjusted EBITDA as a percentage of net sales increased approximately 30 basis points to 9.8 percent in the third quarter of fiscal 2013 as compared to the third quarter of fiscal 2012, primarily due to gross margin improvements.
Net income for the third quarter of fiscal 2013 improved $101 million to $51 million compared to a Net loss of $50 million for the third quarter of fiscal 2012.
Adjusted net income increased $65 million in the third quarter of fiscal 2013 to $75 million as compared to $10 million in the third quarter of fiscal 2012. The increase in Adjusted net income is attributable to sales growth, improving gross margins, and a reduction in interest expense. Adjusted net income per diluted share in the third quarter of fiscal 2013 was $0.38 per share, as compared to $0.07 in the third quarter of fiscal 2012.
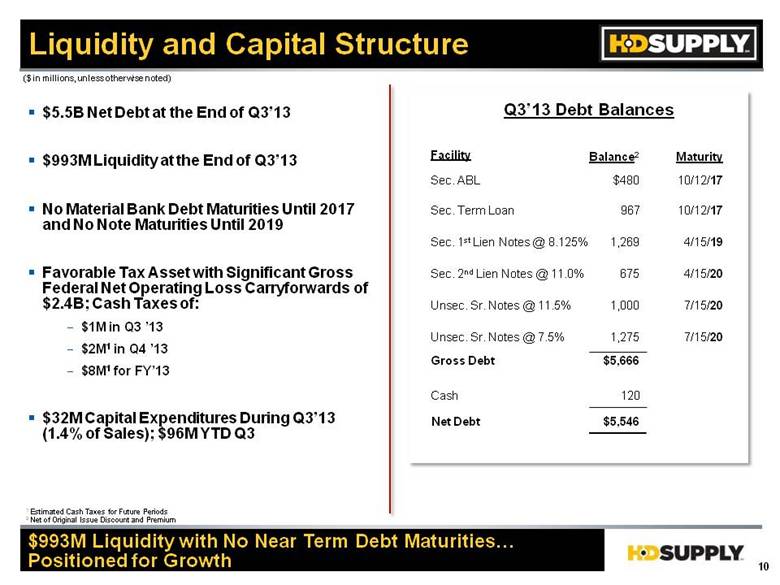
As of November 3, 2013, our combined liquidity of approximately $993 million was comprised of $120 million in cash and cash equivalents and $873 million of additional available borrowings under HD Supply, Inc.’s senior asset-backed lending facility, based on qualifying inventory and receivables.
Business Unit Performance
Facilities Maintenance
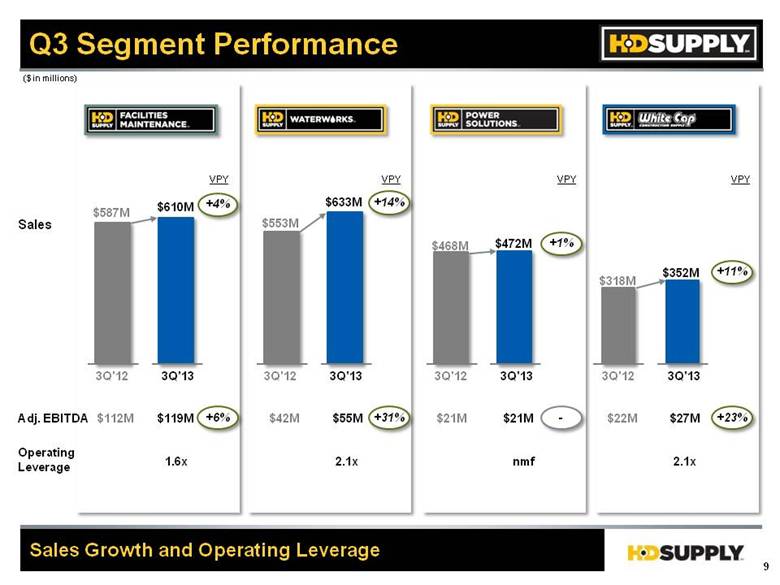
Net sales increased $23 million, or 4 percent, to $610 million in the third quarter of fiscal 2013 as compared to $587 million in the third quarter of fiscal 2012. Adjusted EBITDA increased $7 million, or 6 percent, to $119 million during the third quarter of fiscal 2013 as compared to $112 million in the third quarter of fiscal 2012. Adjusted EBITDA as a percentage of net sales increased approximately 40 basis points in the third quarter of fiscal 2013 as compared to third quarter of fiscal 2012.
Waterworks
Net sales increased $80 million, or 14 percent, to $633 million in the third quarter of fiscal 2013 as compared to $553 million in the third quarter of fiscal 2012. Organic sales growth was almost 11 percent in the third quarter of fiscal 2013 as compared to the third quarter of fiscal 2012. Adjusted EBITDA increased $13 million, or 31 percent, to $55 million during the third quarter of fiscal 2013 as compared to $42 million in the third quarter of fiscal 2012. Adjusted EBITDA as a percentage of net sales increased approximately 110 basis points in the third quarter of fiscal 2013 as compared to the third quarter of fiscal 2012.
Power Solutions
Net sales increased $4 million, or 1 percent, to $472 million in the third quarter of fiscal 2013 as compared to $468 million in the third quarter of fiscal 2012. Adjusted EBITDA was flat at $21 million during the third quarter of fiscal 2013 and the third quarter of fiscal 2012. Adjusted EBITDA as a percentage of net sales decreased approximately 10 basis points in the third quarter of fiscal 2013 as compared to the third quarter of fiscal 2012.
White Cap
Net sales increased $34 million, or 11 percent, to $352 million in the third quarter of fiscal 2013 as compared to $318 million in the third quarter of fiscal 2013. Adjusted EBITDA increased $5 million, or 23 percent, to $27 million during the third quarter of fiscal 2013 as compared to $22 million in the third quarter of fiscal 2012. Adjusted EBITDA as a percentage of net sales increased approximately 80 basis points during the third quarter of fiscal 2013 as compared to the third quarter of fiscal 2012.
Year-to-Date Results
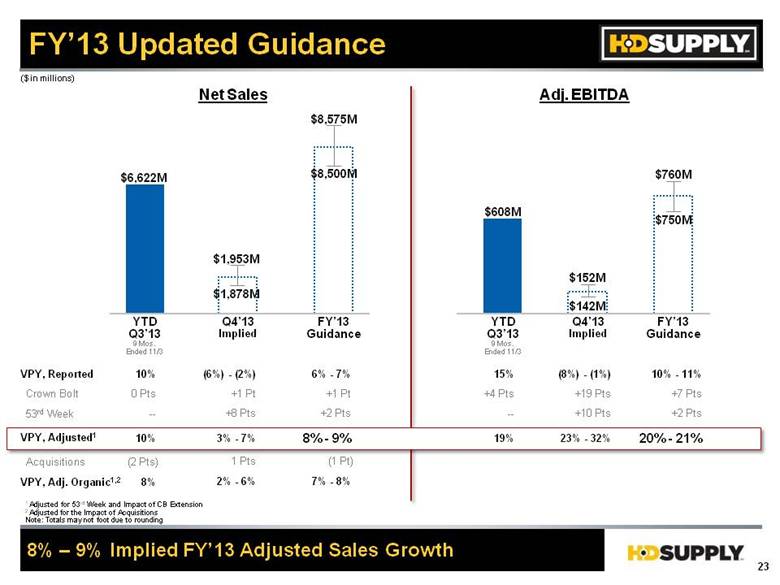
Net sales for the first nine months of fiscal 2013 increased $581 million, or 10 percent to $6.6 billion, as compared to $6.0 billion the first nine months of fiscal 2012. Gross profit for the first nine months of fiscal 2013 increased by $194 million, or 11 percent, to $1.9 billion compared to $1.7 billion for the first nine months of fiscal 2012. Gross profit for the first nine months of fiscal 2013 was 29.1 percent of net sales versus 28.7 percent of net sales for the first nine months of fiscal 2012.
Operating income for the first nine months of fiscal 2013 was $410 million, an improvement of $150 million compared to operating income of $260 million for the first nine months of fiscal 2012. The improvement in operating income reflects sales growth of 10 percent and an approximately 150 basis point decline in operating expenses as a percent of net sales.
Net loss for the first nine months of fiscal 2013 was $152 million, which included an $87 million loss on extinguishment and modification of debt. Net loss for the first nine months of fiscal 2012 was $466 million, which included a $220 million loss on extinguishment and modification of debt. Excluding the loss on extinguishment and modification of debt in both years and the $19 million of income from discontinued operations in the first nine months of fiscal 2012, the net loss in the first nine months of fiscal 2013 improved $200 million as compared to the prior period.
Adjusted EBITDA for the first nine months of fiscal 2013 increased 15 percent to $608 million from $529 million in the first nine months of fiscal 2012. This increase includes an unfavorable impact of $18 million resulting from the 2012 amendment and extension of the strategic purchase agreement between our Crown Bolt business and The Home Depot. Adjusted EBITDA for the first nine months of fiscal 2013 increased to 9.2 percent of net sales versus 8.8 percent of net sales for the first nine months of fiscal 2012.
Cash flow from operating activities in the first nine months of fiscal 2013 was a use of $510 million compared with cash used by operating activities of $327 million in the first nine months of fiscal 2012. The use of cash in the first nine months of fiscal 2013 was driven by the payment of $364 million of original issue discounts and PIK interest related to the extinguishment of HD Supply Inc.’s 13.50 percent Senior Subordinated Notes and a portion of the term loans under HD Supply Inc.’s senior term facility.
Third-Quarter Monthly Sales Performance
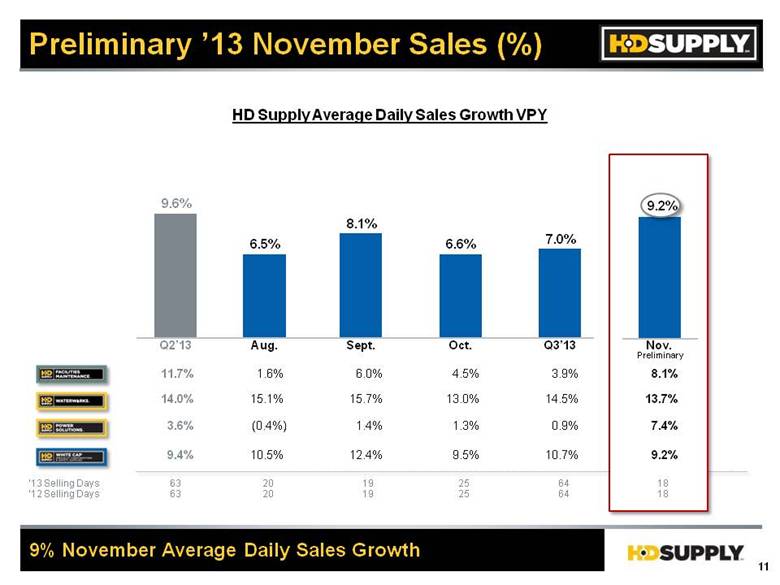
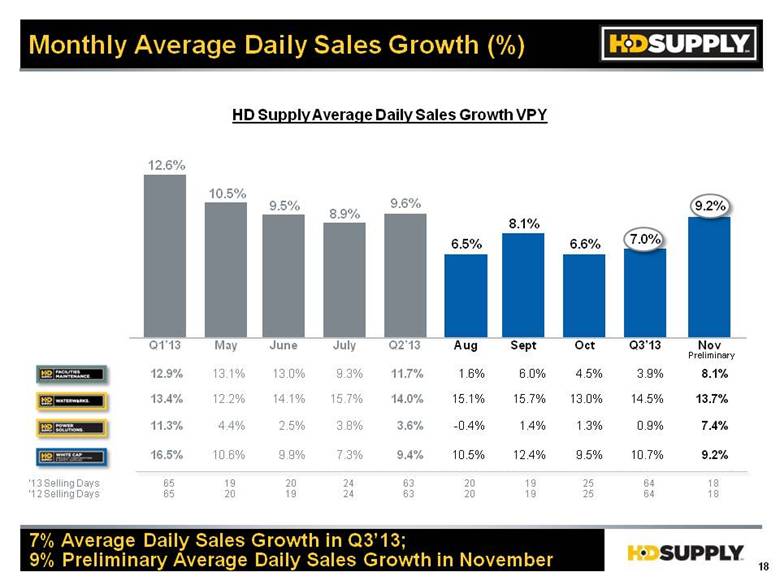
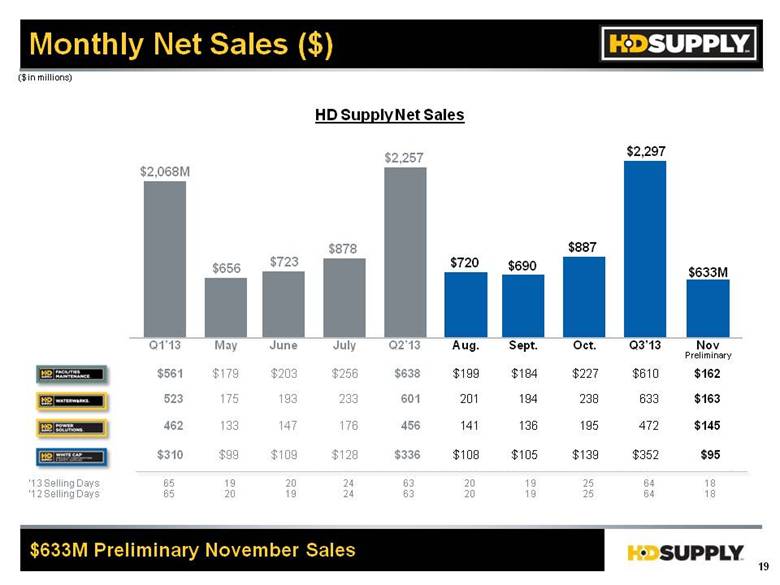
Net sales for August, September and October were $720 million, $690 million, and $887 million, respectively. There were 20 selling days in August, 19 selling days in September, and 25 selling days in October. Average daily sales growth for August, September and October were 6.5 percent, 8.1 percent and 6.6 percent, respectively.
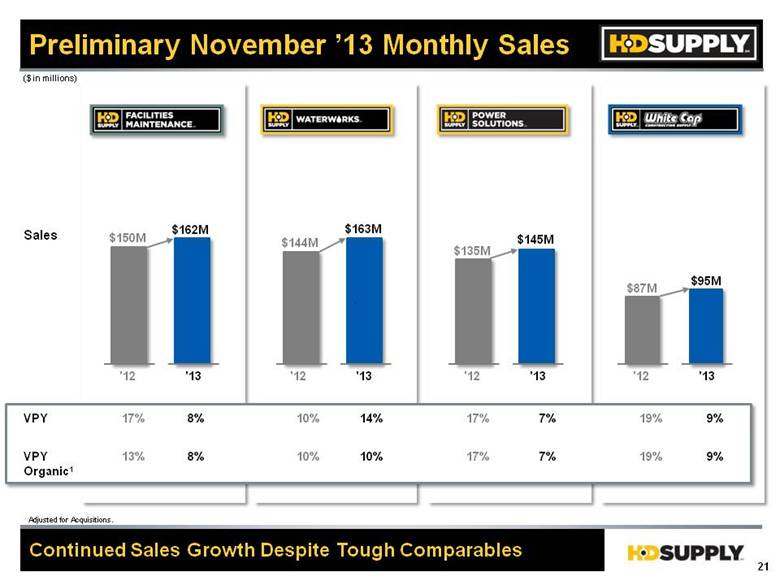
Preliminary November Sales
Preliminary net sales in November were $633 million which represents 9.2 percent growth versus prior year (8.5 percent on an organic basis). There were 18 selling days in November and average daily sales were up 9.2 percent versus prior year. Preliminary November year-over-year average daily sales growth by business is Facilities Maintenance 8.1 percent, Waterworks 13.7 percent (9.7 percent on an organic basis), White Cap 9.2 percent and Power Solutions 7.4 percent.
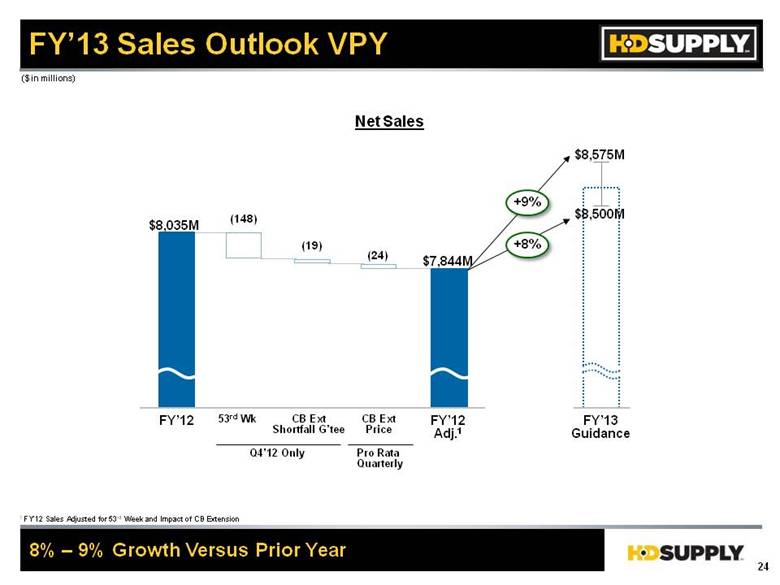
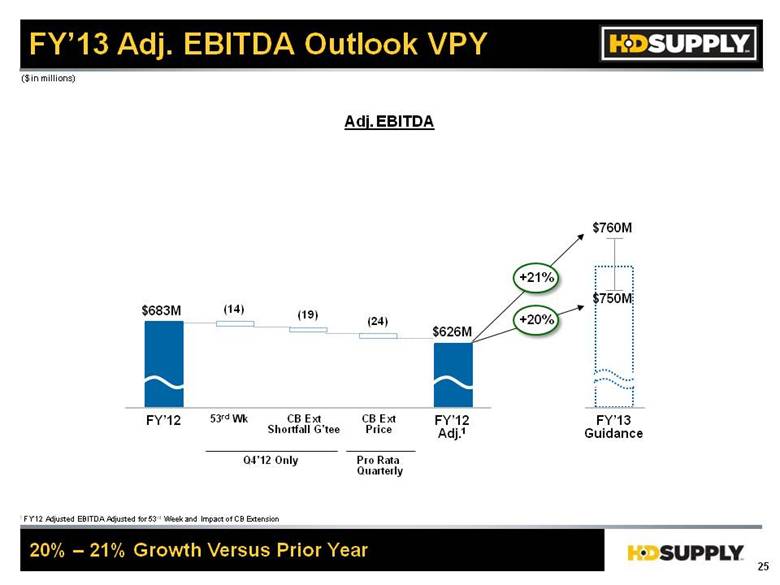
2013 Outlook
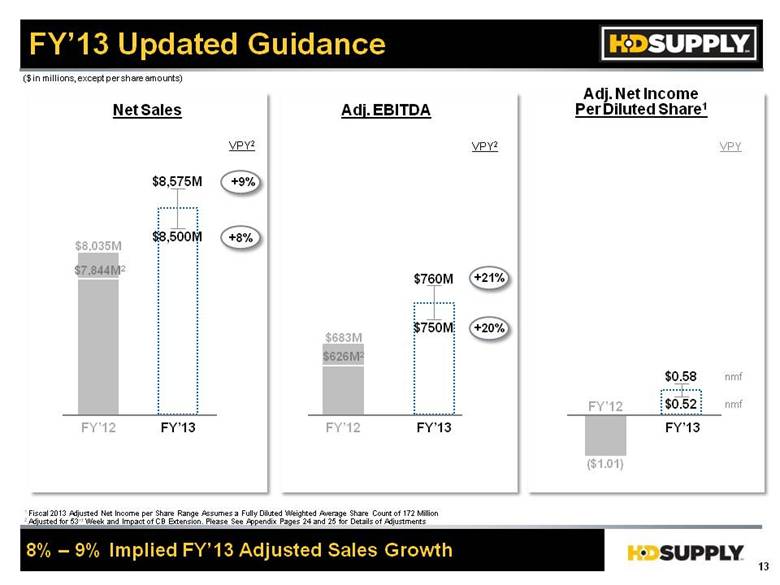
The Company anticipates fiscal 2013 revenue to be in the range of $8,500 million to $8,575 million, Adjusted EBITDA in the range of $750 million and $760 million, and Adjusted net income per diluted share in the range of $0.52 and $0.58. Our fiscal 2013 Adjusted net income per share range assumes a fully diluted weighted average share count of 172 million.
Fiscal 2013 Third-Quarter Conference Call
As previously announced, HD Supply will hold a conference call on Tuesday, December 10, 2013 at 8:00 a.m. (Eastern Time) to discuss its third quarter fiscal 2013 results. The conference call and presentation materials can be accessed via webcast by logging on from the Investor Relations section of the Company’s Web site at hdsupply.com. The online replay will remain available for a limited time following the call.
Non-GAAP Financial Measures
HD Supply supplements its reporting net income (loss) with non-GAAP measurements, including Adjusted EBITDA, Adjusted net income (loss) and Adjusted net income (loss) per share. This supplemental information should not be considered in isolation or as a substitute for the GAAP measurements. Additional information regarding Adjusted EBITDA, Adjusted net income (loss) and Adjusted net income (loss) per share referred to in this press release is included below under “——Reconciliation of Non-GAAP Measures.”
Promotion of Evan Levitt to Chief Financial Officer
HD Supply further announces the promotion of Evan Levitt to Chief Financial Officer, effective December 11, 2013, assuming the role from Ron Domanico who will be retiring, effective April 17, 2014. Mr. Levitt has served as the company’s Vice President and Corporate Controller since 2007. Prior to joining HD Supply in 2007, Mr. Levitt served as the assistant controller and director of financial reporting at The Home Depot from 2004 to 2007. “Evan has been an integral part of the management team that brought HD Supply through its debt restructurings and subsequent IPO. His extensive knowledge of our company and industry, together with his strong rapport with the field teams will continue to be a tremendous asset for our management team moving forward,” said Joe DeAngelo, CEO of HD Supply. “Everyone at HD Supply thanks Ron for his outstanding contributions to the company.”
About HD Supply
HD Supply (www.hdsupply.com) is one of the largest industrial distributors in North America. The company provides a broad range of products and value-add services to approximately 500,000 customers with leadership positions in maintenance, repair and operations, infrastructure and power and specialty construction sectors. With more than 600 locations across 46 states and nine Canadian provinces, the company’s approximately 15,000 associates provide localized, customer-driven services including jobsite delivery, will call or direct-ship options, diversified logistics and innovative solutions that contribute to its customers’ success.
Forward-Looking Statements
This press release includes “forward-looking statements” within the meaning of Section 27A of the Securities Act and Section 21E of the Exchange Act. Forward-looking statements are subject to known and unknown risks and uncertainties, many of which may be beyond our control. We caution you that the forward-looking information presented in this press release is not a guarantee of future events, and that actual events may differ materially from those made in or suggested by the forward-looking information contained in this press release. In addition, forward-looking statements generally can be identified by the use of forward-looking terminology such as “may,” “plan,” “seek,” “comfortable with,” “will,” “expect,” “intend,” “estimate,” “anticipate,” “believe” or “continue” or the negative thereof or variations thereon or
similar terminology. A number of important factors could cause actual events to differ materially from those contained in or implied by the forward-looking statements, including those factors discussed in our filings with the U.S. Securities & Exchange Commission’s (the “SEC”), including our Registration Statement on Form S-1, as amended (File No. 333-187872), which can be found at the SEC’s website www.sec.gov. Any forward-looking information presented herein is made only as of the date of this press release, and we do not undertake any obligation to update or revise any forward-looking information to reflect changes in assumptions, the occurrence of unanticipated events, or otherwise.
HD SUPPLY HOLDINGS, INC.
CONSOLIDATED STATEMENTS OF OPERATIONS
Amounts in millions, except share and per share data, unaudited
|
|
|
Three Months Ended |
|
Nine Months Ended |
| ||||||||
|
|
|
Nov. 3, |
|
Oct. 28, |
|
Nov. 3, |
|
Oct. 28, |
| ||||
|
|
|
|
|
|
|
|
|
|
| ||||
|
Net Sales |
|
$ |
2,297 |
|
$ |
2,146 |
|
$ |
6,622 |
|
$ |
6,041 |
|
|
Cost of sales |
|
1,629 |
|
1,530 |
|
4,695 |
|
4,308 |
| ||||
|
Gross Profit |
|
668 |
|
616 |
|
1,927 |
|
1,733 |
| ||||
|
Operating expenses: |
|
|
|
|
|
|
|
|
| ||||
|
Selling, general and administrative |
|
447 |
|
418 |
|
1,336 |
|
1,223 |
| ||||
|
Depreciation and amortization |
|
61 |
|
84 |
|
181 |
|
250 |
| ||||
|
Total operating expenses |
|
508 |
|
502 |
|
1,517 |
|
1,473 |
| ||||
|
Operating Income |
|
160 |
|
114 |
|
410 |
|
260 |
| ||||
|
Interest expense |
|
118 |
|
165 |
|
409 |
|
489 |
| ||||
|
Loss on extinguishment & modification of debt |
|
— |
|
— |
|
87 |
|
220 |
| ||||
|
Other (income) expense, net |
|
— |
|
— |
|
20 |
|
— |
| ||||
|
Income (Loss) from Continuing Operations Before Provision (Benefit) for Income Taxes |
|
42 |
|
(51 |
) |
(106 |
) |
(449 |
) | ||||
|
Provision (benefit) for income taxes |
|
(9 |
) |
2 |
|
46 |
|
36 |
| ||||
|
Income (Loss) from Continuing Operations |
|
51 |
|
(53 |
) |
(152 |
) |
(485 |
) | ||||
|
Income from discontinued operations, net of tax |
|
— |
|
3 |
|
— |
|
19 |
| ||||
|
Net Income (Loss) |
|
$ |
51 |
|
$ |
(50 |
) |
$ |
(152 |
) |
$ |
(466 |
) |
|
|
|
|
|
|
|
|
|
|
| ||||
|
Weighted Average Common Shares Outstanding (in thousands) |
|
|
|
|
|
|
|
|
| ||||
|
Basic |
|
191,750 |
|
130,555 |
|
158,587 |
|
130,555 |
| ||||
|
Diluted |
|
197,392 |
|
130,555 |
|
158,587 |
|
130,555 |
| ||||
|
Basic Earnings Per Share(1): |
|
|
|
|
|
|
|
|
| ||||
|
Income (Loss) from Continuing Operations |
|
$ |
0.27 |
|
$ |
(0.41 |
) |
$ |
(0.96 |
) |
$ |
(3.71 |
) |
|
Income (Loss) from Discontinued Operations |
|
$ |
— |
|
$ |
0.02 |
|
$ |
— |
|
$ |
0.15 |
|
|
Net Income (Loss) |
|
$ |
0.27 |
|
$ |
(0.38 |
) |
$ |
(0.96 |
) |
$ |
(3.57 |
) |
|
Diluted Earnings Per Share(1): |
|
|
|
|
|
|
|
|
| ||||
|
Income (Loss) from Continuing Operations |
|
$ |
0.26 |
|
$ |
(0.41 |
) |
$ |
(0.96 |
) |
$ |
(3.71 |
) |
|
Income (Loss) from Discontinued Operations |
|
$ |
— |
|
$ |
0.02 |
|
$ |
— |
|
$ |
0.15 |
|
|
Net Income (Loss) |
|
$ |
0.26 |
|
$ |
(0.38 |
) |
$ |
(0.96 |
) |
$ |
(3.57 |
) |
|
|
|
|
|
|
|
|
|
|
| ||||
|
Non-GAAP financial data: |
|
|
|
|
|
|
|
|
| ||||
|
Adjusted EBITDA |
|
$ |
226 |
|
$ |
204 |
|
$ |
608 |
|
$ |
529 |
|
|
Adjusted Net Income (Loss) |
|
$ |
75 |
|
$ |
10 |
|
$ |
96 |
|
$ |
(50 |
) |
|
Weighted average common shares outstanding (in thousands) |
|
|
|
|
|
|
|
|
| ||||
|
Basic |
|
191,750 |
|
130,555 |
|
158,587 |
|
130,555 |
| ||||
|
Diluted(2) |
|
197,392 |
|
134,238 |
|
163,325 |
|
130,555 |
| ||||
|
Adjusted Net Income (Loss) Per Share - Basic |
|
$ |
0.39 |
|
$ |
0.08 |
|
$ |
0.61 |
|
$ |
(0.38 |
) |
|
Adjusted Net Income (Loss) Per Share - Diluted |
|
$ |
0.38 |
|
$ |
0.07 |
|
$ |
0.59 |
|
$ |
(0.38 |
) |
(1) May not foot due to rounding.
(2) The dilution calculation uses a share price of $18.00 for all days prior to the initial public offering on June 27, 2013.
HD SUPPLY HOLDINGS, INC.
CONSOLIDATED BALANCE SHEETS
Amounts in millions, except per share data, unaudited
|
|
|
November 3, |
|
February 3, |
| ||
|
ASSETS |
|
|
|
|
| ||
|
Current assets: |
|
|
|
|
| ||
|
Cash and cash equivalents |
|
$ |
120 |
|
$ |
141 |
|
|
Cash restricted for debt redemption |
|
— |
|
936 |
| ||
|
Receivables, less allowance for doubtful accounts of $21 and $23 |
|
1,224 |
|
1,008 |
| ||
|
Inventories |
|
1,070 |
|
987 |
| ||
|
Deferred tax asset |
|
2 |
|
42 |
| ||
|
Other current assets |
|
41 |
|
49 |
| ||
|
Total current assets |
|
2,457 |
|
3,163 |
| ||
|
Property and equipment, net |
|
404 |
|
395 |
| ||
|
Goodwill |
|
3,139 |
|
3,138 |
| ||
|
Intangible assets, net |
|
372 |
|
473 |
| ||
|
Other assets |
|
146 |
|
165 |
| ||
|
Total assets |
|
$ |
6,518 |
|
$ |
7,334 |
|
|
|
|
|
|
|
| ||
|
LIABILITIES AND STOCKHOLDERS’ EQUITY (DEFICIT) |
|
|
|
|
| ||
|
Current liabilities: |
|
|
|
|
| ||
|
Accounts payable |
|
$ |
809 |
|
$ |
693 |
|
|
Accrued compensation and benefits |
|
119 |
|
160 |
| ||
|
Current installments of long-term debt |
|
10 |
|
899 |
| ||
|
Other current liabilities |
|
173 |
|
291 |
| ||
|
Total current liabilities |
|
1,111 |
|
2,043 |
| ||
|
|
|
|
|
|
| ||
|
Long-term debt, excluding current installments |
|
5,656 |
|
6,430 |
| ||
|
Deferred tax liabilities |
|
97 |
|
104 |
| ||
|
Other liabilities |
|
352 |
|
348 |
| ||
|
Total liabilities |
|
7,216 |
|
8,925 |
| ||
|
|
|
|
|
|
| ||
|
Stockholders’ equity (deficit): |
|
|
|
|
| ||
|
Common stock, par value $0.01; 1 billion shares authorized; 192 million shares and 131 million shares issued and outstanding at November 3, 2013 and February 3, 2013, respectively |
|
2 |
|
1 |
| ||
|
Paid-in capital |
|
3,744 |
|
2,695 |
| ||
|
Accumulated deficit |
|
(4,438 |
) |
(4,285 |
) | ||
|
Accumulated other comprehensive income (loss) — cumulative foreign currency translation adjustment |
|
(6 |
) |
(2 |
) | ||
|
Total stockholders’ equity (deficit) |
|
(698 |
) |
(1,591 |
) | ||
|
Total liabilities and stockholders’ equity (deficit) |
|
$ |
6,518 |
|
$ |
7,334 |
|
HD SUPPLY HOLDINGS, INC.
CONSOLIDATED STATEMENTS OF CASH FLOWS
Amounts in millions, unaudited
|
|
|
Nine Months Ended |
| ||||
|
|
|
November 3, |
|
October 28, |
| ||
|
CASH FLOWS FROM OPERATING ACTIVITIES: |
|
|
|
|
| ||
|
Net income (loss) |
|
$ |
(152 |
) |
$ |
(466 |
) |
|
Reconciliation of net income (loss) to net cash provided by (used in) operating activities: |
|
|
|
|
| ||
|
Depreciation and amortization |
|
184 |
|
255 |
| ||
|
Provision for uncollectibles |
|
4 |
|
3 |
| ||
|
Non-cash interest expense |
|
23 |
|
86 |
| ||
|
Payment of PIK interest & discounts upon extinguishment of debt |
|
(364 |
) |
— |
| ||
|
Loss on extinguishment & modification of debt |
|
87 |
|
220 |
| ||
|
Stock-based compensation expense |
|
12 |
|
13 |
| ||
|
Deferred income taxes |
|
35 |
|
27 |
| ||
|
Gain on sale of a business |
|
— |
|
(12 |
) | ||
|
Other |
|
(2 |
) |
1 |
| ||
|
Changes in assets and liabilities: |
|
|
|
|
| ||
|
(Increase) decrease in receivables |
|
(226 |
) |
(215 |
) | ||
|
(Increase) decrease in inventories |
|
(87 |
) |
(197 |
) | ||
|
(Increase) decrease in other current assets |
|
4 |
|
(4 |
) | ||
|
(Increase) decrease in other assets |
|
— |
|
2 |
| ||
|
Increase (decrease) in accounts payable and accrued liabilities |
|
(42 |
) |
(46 |
) | ||
|
Increase (decrease) in other long-term liabilities |
|
14 |
|
6 |
| ||
|
Net cash provided by (used in) operating activities |
|
(510 |
) |
(327 |
) | ||
|
CASH FLOWS FROM INVESTING ACTIVITIES: |
|
|
|
|
| ||
|
Capital expenditures |
|
(96 |
) |
(80 |
) | ||
|
Proceeds from sales of property and equipment |
|
6 |
|
5 |
| ||
|
Proceeds from sale of investments |
|
936 |
|
— |
| ||
|
Purchase of investments |
|
— |
|
(985 |
) | ||
|
Proceeds from sale of a business |
|
— |
|
481 |
| ||
|
(Payment) settlement for acquisition of a business, net of cash acquired |
|
2 |
|
(196 |
) | ||
|
Other investing activities |
|
— |
|
(2 |
) | ||
|
Net cash provided by (used in) investing activities |
|
848 |
|
(777 |
) | ||
|
CASH FLOWS FROM FINANCING ACTIVITIES: |
|
|
|
|
| ||
|
Proceeds from sale of common stock, net of transaction fees |
|
1,039 |
|
— |
| ||
|
Borrowings of long-term debt |
|
79 |
|
4,140 |
| ||
|
Repayments of long-term debt |
|
(1,621 |
) |
(3,290 |
) | ||
|
Borrowings on long-term revolver debt |
|
736 |
|
1,192 |
| ||
|
Repayments on long-term revolver debt |
|
(556 |
) |
(797 |
) | ||
|
Debt issuance and modification fees |
|
(34 |
) |
(95 |
) | ||
|
Other financing activities |
|
— |
|
1 |
| ||
|
Net cash provided by (used in) financing activities |
|
(357 |
) |
1,151 |
| ||
|
Effect of exchange rates on cash and cash equivalents |
|
(2 |
) |
— |
| ||
|
Increase (decrease) in cash and cash equivalents |
|
$ |
(21 |
) |
$ |
47 |
|
|
Cash and cash equivalents at beginning of period |
|
141 |
|
111 |
| ||
|
Cash and cash equivalents at end of period |
|
$ |
120 |
|
$ |
158 |
|
HD SUPPLY HOLDINGS, INC.
SEGMENT REPORTING
Amounts in millions, unaudited
|
|
|
Facilities |
|
Waterworks |
|
Power |
|
White Cap |
| ||||
|
Three Months Ended Nov. 3, 2013 |
|
|
|
|
|
|
|
|
| ||||
|
Net Sales |
|
$ |
610 |
|
$ |
633 |
|
$ |
472 |
|
$ |
352 |
|
|
Adjusted EBITDA |
|
119 |
|
55 |
|
21 |
|
27 |
| ||||
|
Depreciation(1) & Software Amortization |
|
12 |
|
2 |
|
1 |
|
4 |
| ||||
|
Other Intangible Amortization |
|
20 |
|
1 |
|
5 |
|
5 |
| ||||
|
|
|
|
|
|
|
|
|
|
| ||||
|
Three Months Ended Oct. 28, 2012 |
|
|
|
|
|
|
|
|
| ||||
|
Net Sales |
|
$ |
587 |
|
$ |
553 |
|
$ |
468 |
|
$ |
318 |
|
|
Adjusted EBITDA |
|
112 |
|
42 |
|
21 |
|
22 |
| ||||
|
Depreciation(1) & Software Amortization |
|
9 |
|
3 |
|
2 |
|
3 |
| ||||
|
Other Intangible Amortization |
|
21 |
|
24 |
|
5 |
|
5 |
| ||||
|
|
|
|
|
|
|
|
|
|
| ||||
|
|
|
Facilities |
|
Waterworks |
|
Power |
|
White Cap |
| ||||
|
Nine Months Ended Nov. 3, 2013 |
|
|
|
|
|
|
|
|
| ||||
|
Net Sales |
|
$ |
1,809 |
|
$ |
1,757 |
|
$ |
1,390 |
|
$ |
998 |
|
|
Adjusted EBITDA |
|
344 |
|
143 |
|
57 |
|
65 |
| ||||
|
Depreciation(1) & Software Amortization |
|
34 |
|
7 |
|
4 |
|
12 |
| ||||
|
Other Intangible Amortization |
|
60 |
|
3 |
|
14 |
|
15 |
| ||||
|
|
|
|
|
|
|
|
|
|
| ||||
|
Nine Months Ended Oct. 28, 2012 |
|
|
|
|
|
|
|
|
| ||||
|
Net Sales |
|
$ |
1,655 |
|
$ |
1,541 |
|
$ |
1,323 |
|
$ |
891 |
|
|
Adjusted EBITDA |
|
306 |
|
109 |
|
55 |
|
48 |
| ||||
|
Depreciation(1) & Software Amortization |
|
28 |
|
7 |
|
5 |
|
9 |
| ||||
|
Other Intangible Amortization |
|
59 |
|
72 |
|
14 |
|
15 |
| ||||
(1) Depreciation includes amounts recorded within Cost of sales in the Consolidated Statements of Operations.
Reconciliation of Non-GAAP Measures
We present Adjusted EBITDA because it is a primary measure used by management to evaluate operating performance. We believe the presentation of Adjusted EBITDA enhances investors’ overall understanding of the financial performance of our business. Adjusted EBITDA is not a recognized term under GAAP and does not purport to be an alternative to Net income (loss) as a measure of operating performance. In addition, we present Adjusted net income (loss) to measure our overall profitability as we believe it is an important measure of our performance. Adjusted net income (loss) is not a recognized term under GAAP and does not purport to be an alternative to Net income (loss) as a measure of operating performance. Adjusted net income (loss) is defined as Net income (loss) less Income (loss) from discontinued operations, net of tax, further adjusted for certain non-cash items, net of tax. We compensate for the limitations of using non-GAAP financial measures by using them to supplement GAAP results to provide a more complete understanding of the factors and trends affecting the business than GAAP results alone. Because not all companies use identical calculations, our presentation of Adjusted EBITDA and Adjusted net income (loss) may not be comparable to other similarly titled measures of other companies.
Adjusted EBITDA is based on “Consolidated EBITDA,” a measure which is defined in our senior credit facilities and used in calculating financial ratios in several material debt covenants. Adjusted EBITDA is defined as Net income (loss) less Income (loss) from discontinued operations, net of tax, plus (i) Interest expense and Interest income, net, (ii) Provision (benefit) for income taxes, (iii) depreciation and amortization and further adjusted to exclude non-cash items and certain other adjustments to Consolidated Net Income permitted in calculating Consolidated EBITDA under our senior credit facilities.
Adjusted net income per share represents income per share calculated using Adjusted net income as opposed to Net income. No reconciliation of the forecasted range for Adjusted net income per share to Net income per share for fiscal 2013 is included in this release because we are unable to quantify certain amounts that would be required to be included in the GAAP measure without unreasonable efforts and we believe such reconciliations would imply a degree of precision that would be confusing or misleading to investors.
Adjusted EBITDA and Adjusted net income (loss) have limitations as analytical tools and should not be considered in isolation or as substitutes for analyzing our results as reported under GAAP. Some of these limitations are:
· Adjusted EBITDA and Adjusted net income (loss) do not reflect changes in, or cash requirements for, our working capital needs;
· Adjusted EBITDA does not reflect our interest expense, or the requirements necessary to service interest or principal payments on our debt;
· Adjusted EBITDA does not reflect our income tax expenses or the cash requirements to pay our taxes;
· Adjusted EBITDA and Adjusted net income (loss) do not reflect historical cash expenditures or future requirements for capital expenditures or contractual commitments; and
· although depreciation and amortization charges are non-cash charges, the assets being depreciated and amortized will often have to be replaced in the future, and Adjusted EBITDA does not reflect any cash requirements for such replacements.
Adjusted EBITDA
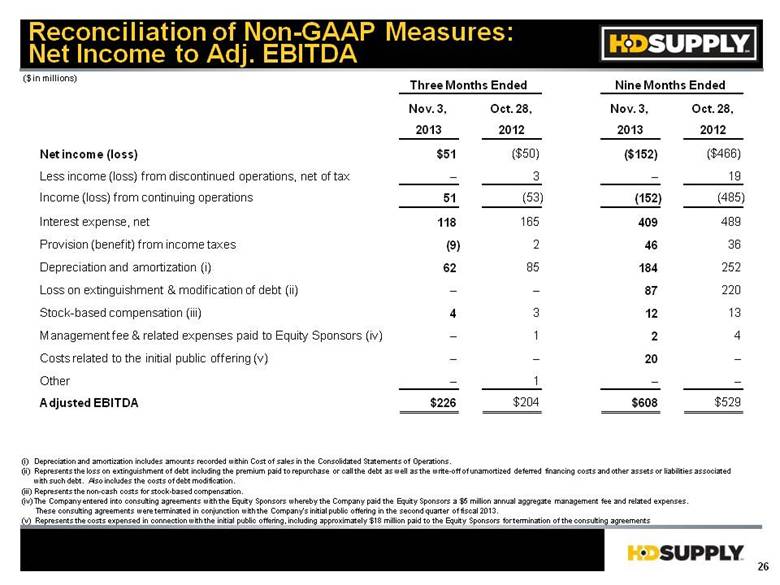
The following table presents a reconciliation of net income (loss), the most directly comparable financial measure under U.S. GAAP, to adjusted EBITDA for the periods presented (amounts in millions):
|
|
|
Three Months Ended |
|
Nine Months Ended |
| ||||||||
|
|
|
Nov. 3, |
|
Oct. 28, |
|
Nov. 3, |
|
Oct. 28, |
| ||||
|
Net income (loss) |
|
$ |
51 |
|
$ |
(50 |
) |
$ |
(152 |
) |
$ |
(466 |
) |
|
Less income (loss) from discontinued operations, net of tax |
|
— |
|
3 |
|
— |
|
19 |
| ||||
|
Income (loss) from continuing operations |
|
51 |
|
(53 |
) |
(152 |
) |
(485 |
) | ||||
|
Interest expense, net |
|
118 |
|
165 |
|
409 |
|
489 |
| ||||
|
Provision (benefit) from income taxes |
|
(9 |
) |
2 |
|
46 |
|
36 |
| ||||
|
Depreciation and amortization (i) |
|
62 |
|
85 |
|
184 |
|
252 |
| ||||
|
Loss on extinguishment & modification of debt (ii) |
|
— |
|
— |
|
87 |
|
220 |
| ||||
|
Stock-based compensation (iii) |
|
4 |
|
3 |
|
12 |
|
13 |
| ||||
|
Management fee & related expenses paid to Equity Sponsors (iv) |
|
— |
|
1 |
|
2 |
|
4 |
| ||||
|
Costs related to the initial public offering (v) |
|
— |
|
— |
|
20 |
|
— |
| ||||
|
Other |
|
— |
|
1 |
|
— |
|
— |
| ||||
|
Adjusted EBITDA |
|
$ |
226 |
|
$ |
204 |
|
$ |
608 |
|
$ |
529 |
|
(i) Depreciation and amortization includes amounts recorded within Cost of sales in the Consolidated Statements of Operations.
(ii) Represents the loss on extinguishment of debt including the premium paid to repurchase or call the debt as well as the write-off of unamortized deferred financing costs and other assets or liabilities associated with such debt. Also includes the costs of debt modification.
(iii) Represents the non-cash costs for stock-based compensation.
(iv) The Company entered into consulting agreements with the Equity Sponsors whereby the Company paid the Equity Sponsors a $5 million annual aggregate management fee and related expenses. These consulting agreements were terminated in conjunction with the Company’s initial public offering in the second quarter of fiscal 2013.
(v) Represents the costs expensed in connection with the initial public offering, including approximately $18 million paid to the Equity Sponsors for termination of the consulting agreements.
Adjusted Net Income (Loss)
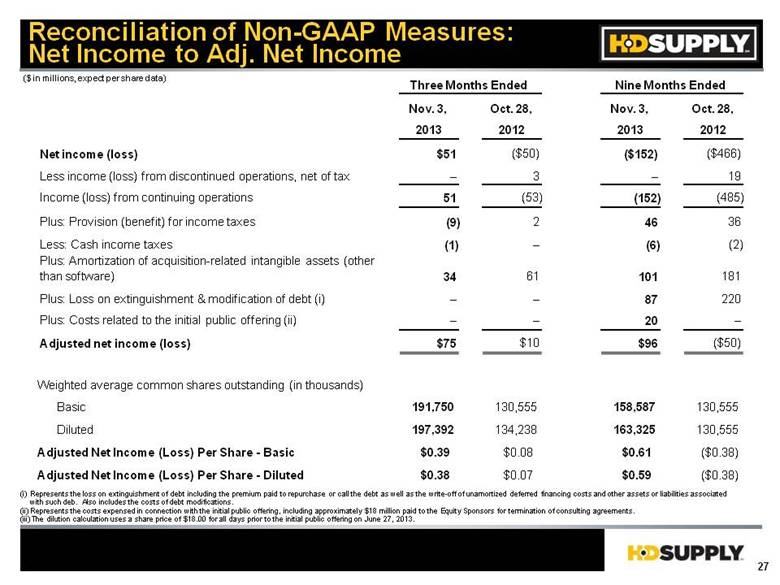
The following table presents a reconciliation of net income (loss), the most directly comparable financial measure under U.S. GAAP, to adjusted net income (loss) for the periods presented (amounts in millions):
|
|
|
Three Months Ended |
|
Nine Months Ended |
| ||||||||
|
|
|
Nov. 3, |
|
Oct. 28, |
|
Nov. 3, |
|
Oct. 28, |
| ||||
|
Net income (loss) |
|
$ |
51 |
|
$ |
(50 |
) |
$ |
(152 |
) |
$ |
(466 |
) |
|
Less income (loss) from discontinued operations, net of tax |
|
— |
|
3 |
|
— |
|
19 |
| ||||
|
Income (loss) from continuing operations |
|
51 |
|
(53 |
) |
(152 |
) |
(485 |
) | ||||
|
Plus: Provision (benefit) for income taxes |
|
(9 |
) |
2 |
|
46 |
|
36 |
| ||||
|
Less: Cash income taxes |
|
(1 |
) |
— |
|
(6 |
) |
(2 |
) | ||||
|
Plus: Amortization of acquisition-related intangible assets (other than software) |
|
34 |
|
61 |
|
101 |
|
181 |
| ||||
|
Plus: Loss on extinguishment & modification of debt (i) |
— |
|
— |
|
87 |
|
220 |
| |||||
|
Plus: Costs related to the initial public offering (ii) |
|
— |
|
— |
|
20 |
|
— |
| ||||
|
Adjusted net income (loss) |
|
$ |
75 |
|
$ |
10 |
|
$ |
96 |
|
$ |
(50 |
) |
(i) Represents the loss on extinguishment of debt including the premium paid to repurchase or call the debt as well as the write-off of unamortized deferred financing costs and other assets or liabilities associated with such debt. Also includes the costs of debt modifications.
(ii) Represents the costs expensed in connection with the initial public offering, including approximately $18 million paid to the Equity Sponsors for termination of consulting agreements.